Attached files
| file | filename |
|---|---|
| 8-K - 8-K - CONTANGO OIL & GAS CO | mcf-20170403x8k.htm |
Exhibit 99.1
|
|
23rd annual OGIS conference April 3, 2017 |
|
|
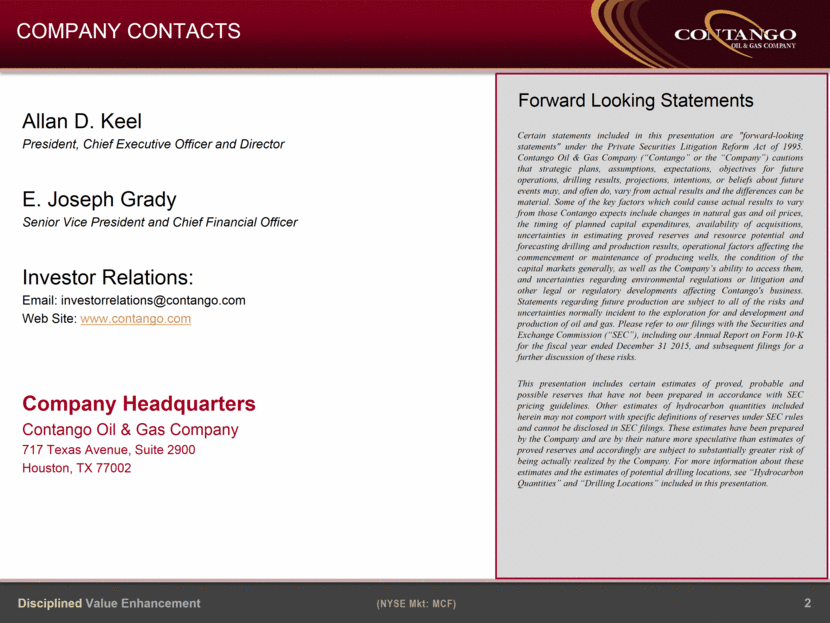
2 Forward Looking Statements COMPANY CONTACTS Allan D. Keel President, Chief Executive Officer and Director E. Joseph Grady Senior Vice President and Chief Financial Officer Investor Relations: Email: investorrelations@contango.com Web Site: www.contango.com Company Headquarters Contango Oil & Gas Company 717 Texas Avenue, Suite 2900 Houston, TX 77002 Certain statements included in this presentation are "forward-looking statements" under the Private Securities Litigation Reform Act of 1995. Contango Oil & Gas Company (“Contango” or the “Company”) cautions that strategic plans, assumptions, expectations, objectives for future operations, drilling results, projections, intentions, or beliefs about future events may, and often do, vary from actual results and the differences can be material. Some of the key factors which could cause actual results to vary from those Contango expects include changes in natural gas and oil prices, the timing of planned capital expenditures, availability of acquisitions, uncertainties in estimating proved reserves and resource potential and forecasting drilling and production results, operational factors affecting the commencement or maintenance of producing wells, the condition of the capital markets generally, as well as the Company’s ability to access them, and uncertainties regarding environmental regulations or litigation and other legal or regulatory developments affecting Contango's business. Statements regarding future production are subject to all of the risks and uncertainties normally incident to the exploration for and development and production of oil and gas. Please refer to our filings with the Securities and Exchange Commission (“SEC”), including our Annual Report on Form 10-K for the fiscal year ended December 31 2015, and subsequent filings for a further discussion of these risks. This presentation includes certain estimates of proved, probable and possible reserves that have not been prepared in accordance with SEC pricing guidelines. Other estimates of hydrocarbon quantities included herein may not comport with specific definitions of reserves under SEC rules and cannot be disclosed in SEC filings. These estimates have been prepared by the Company and are by their nature more speculative than estimates of proved reserves and accordingly are subject to substantially greater risk of being actually realized by the Company. For more information about these estimates and the estimates of potential drilling locations, see “Hydrocarbon Quantities” and “Drilling Locations” included in this presentation. |
|
|
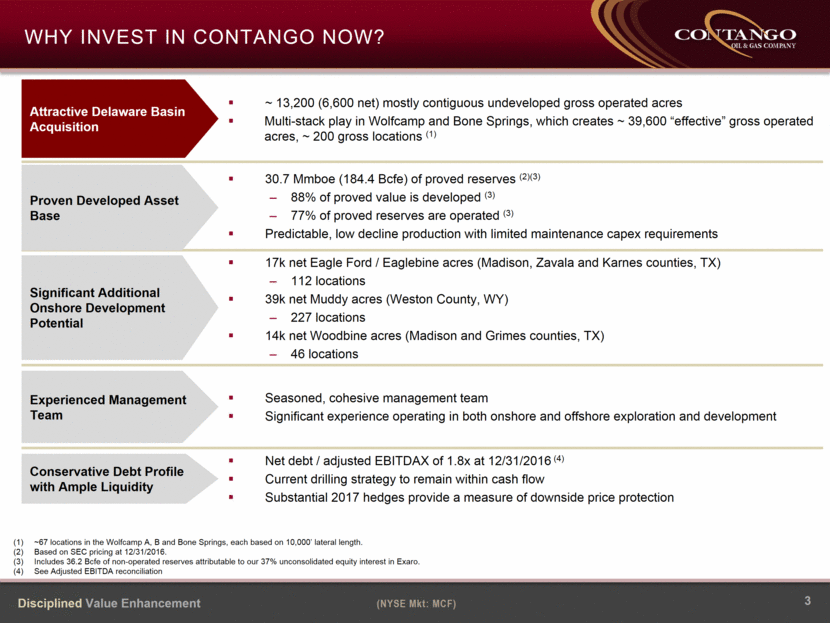
3 Why Invest in Contango NOW? ~67 locations in the Wolfcamp A, B and Bone Springs, each based on 10,000’ lateral length. Based on SEC pricing at 12/31/2016. Includes 36.2 Bcfe of non-operated reserves attributable to our 37% unconsolidated equity interest in Exaro. See Adjusted EBITDA reconciliation ~ 13,200 (6,600 net) mostly contiguous undeveloped gross operated acres Multi-stack play in Wolfcamp and Bone Springs, which creates ~ 39,600 “effective” gross operated acres, ~ 200 gross locations (1) 30.7 Mmboe (184.4 Bcfe) of proved reserves (2)(3) 88% of proved value is developed (3) 77% of proved reserves are operated (3) Predictable, low decline production with limited maintenance capex requirements 17k net Eagle Ford / Eaglebine acres (Madison, Zavala and Karnes counties, TX) 112 locations 39k net Muddy acres (Weston County, WY) 227 locations 14k net Woodbine acres (Madison and Grimes counties, TX) 46 locations Seasoned, cohesive management team Significant experience operating in both onshore and offshore exploration and development Net debt / adjusted EBITDAX of 1.8x at 12/31/2016 (4) Current drilling strategy to remain within cash flow Substantial 2017 hedges provide a measure of downside price protection Proven Developed Asset Base Experienced Management Team Significant Additional Onshore Development Potential Conservative Debt Profile with Ample Liquidity Attractive Delaware Basin Acquisition |
|
|
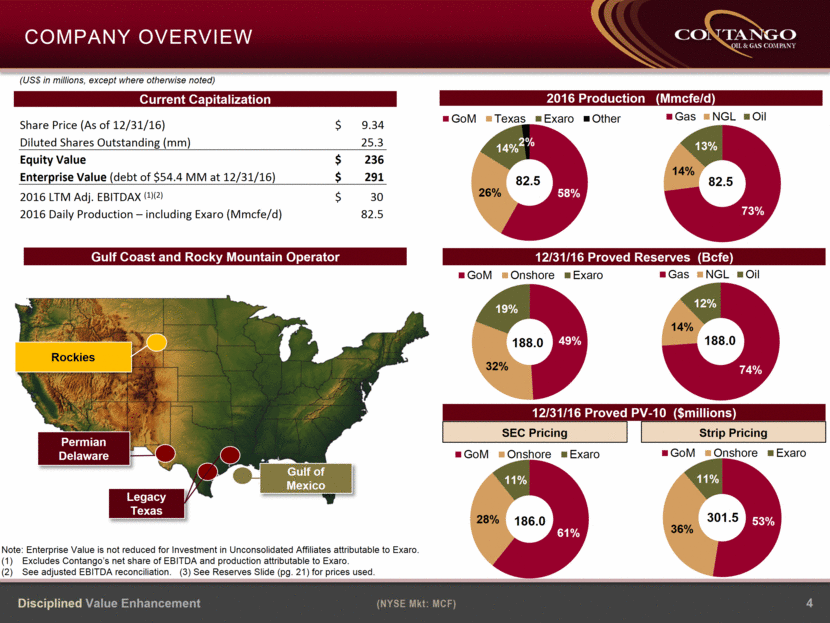
4 Legacy Texas Rockies Gulf Coast and Rocky Mountain Operator Gulf of Mexico Company Overview 2016 Production (Mmcfe/d) Note: Enterprise Value is not reduced for Investment in Unconsolidated Affiliates attributable to Exaro. Excludes Contango’s net share of EBITDA and production attributable to Exaro. See adjusted EBITDA reconciliation. (3) See Reserves Slide (pg. 21) for prices used. Current Capitalization (US$ in millions, except where otherwise noted) Permian Delaware Share Price (As of 12/31/16) $ 9.34 Diluted Shares Outstanding (mm) 25.3 Equity Value $ 236 Enterprise Value (debt of $54.4 MM at 12/31/16) $ 291 2016 LTM Adj. EBITDAX (1)(2) $ 30 2016 Daily Production – including Exaro (Mmcfe/d) 82.5 12/31/16 Proved Reserves (Bcfe) 12/31/16 Proved PV-10 ($millions) Strip Pricing SEC Pricing 301.5 58% 26% 14% 2% GoM Texas Exaro Other 82.5 73% 14% 13% Gas NGL Oil 82.5 61% 28% 11% GoM Onshore Exaro 186.0 53% 36% 11% GoM Onshore Exaro 49% 32% 19% GoM Onshore Exaro 188.0 74% 14% 12% Gas NGL Oil 188.0 |
|
|
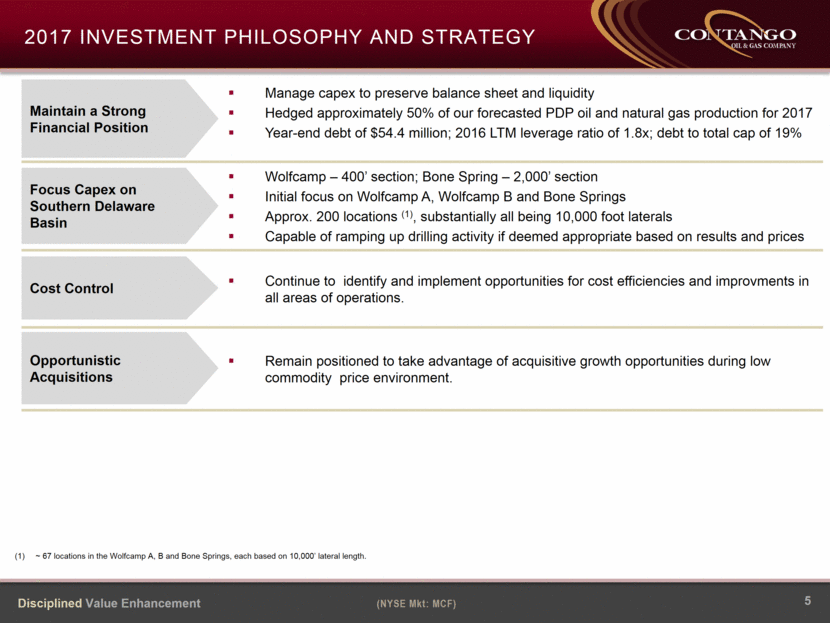
5 2017 Investment philosophy and strategy ~ 67 locations in the Wolfcamp A, B and Bone Springs, each based on 10,000’ lateral length. Manage capex to preserve balance sheet and liquidity Hedged approximately 50% of our forecasted PDP oil and natural gas production for 2017 Year-end debt of $54.4 million; 2016 LTM leverage ratio of 1.8x; debt to total cap of 19% Wolfcamp – 400’ section; Bone Spring – 2,000’ section Initial focus on Wolfcamp A, Wolfcamp B and Bone Springs Approx. 200 locations (1), substantially all being 10,000 foot laterals Capable of ramping up drilling activity if deemed appropriate based on results and prices Continue to identify and implement opportunities for cost efficiencies and improvments in all areas of operations. Remain positioned to take advantage of acquisitive growth opportunities during low commodity price environment. Focus Capex on Southern Delaware Basin Opportunistic Acquisitions Cost Control Maintain a Strong Financial Position |
|
|
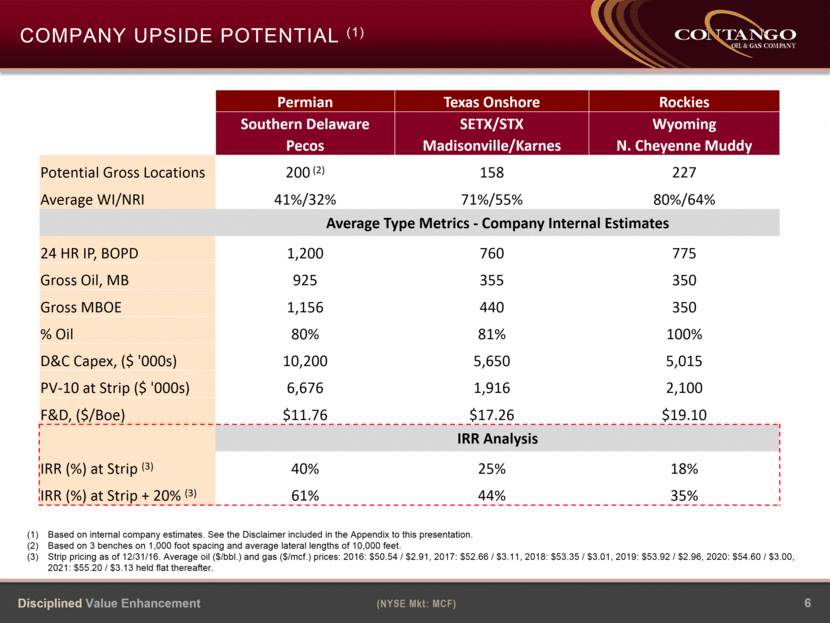
6 Company Upside Potential (1) Based on internal company estimates. See the Disclaimer included in the Appendix to this presentation. Based on 3 benches on 1,000 foot spacing and average lateral lengths of 10,000 feet. Strip pricing as of 12/31/16. Average oil ($/bbl.) and gas ($/mcf.) prices: 2016: $50.54 / $2.91, 2017: $52.66 / $3.11, 2018: $53.35 / $3.01, 2019: $53.92 / $2.96, 2020: $54.60 / $3.00, 2021: $55.20 / $3.13 held flat thereafter. Permian Texas Onshore Rockies Southern Delaware SETX/STX Wyoming Pecos Madisonville/Karnes N. Cheyenne Muddy Potential Gross Locations 200 (2) 158 227 Average WI/NRI 41%/32% 71%/55% 80%/64% Average Type Metrics - Company Internal Estimates 24 HR IP, BOPD 1,200 760 775 Gross Oil, MB 925 355 350 Gross MBOE 1,156 440 350 % Oil 80% 81% 100% D&C Capex, ($ '000s) 10,200 5,650 5,015 PV-10 at Strip ($ '000s) 6,676 1,916 2,100 F&D, ($/Boe) $11.76 $17.26 $19.10 IRR Analysis IRR (%) at Strip (3) 40% 25% 18% IRR (%) at Strip + 20% (3) 61% 44% 35% |
|
|
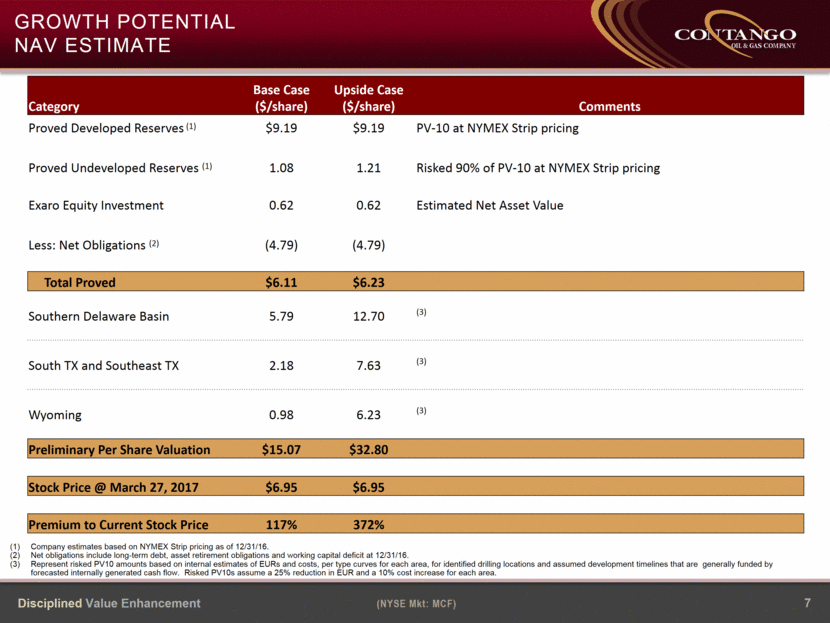
Growth Potential NAV Estimate Company estimates based on NYMEX Strip pricing as of 12/31/16. Net obligations include long-term debt, asset retirement obligations and working capital deficit at 12/31/16. Represent risked PV10 amounts based on internal estimates of EURs and costs, per type curves for each area, for identified drilling locations and assumed development timelines that are generally funded by forecasted internally generated cash flow. Risked PV10s assume a 25% reduction in EUR and a 10% cost increase for each area. $987 $3,370 GOM $301 7 Category Base Case ($/share) Upside Case ($/share) Comments Proved Developed Reserves (1) $9.19 $9.19 PV-10 at NYMEX Strip pricing Proved Undeveloped Reserves (1) 1.08 1.21 Risked 90% of PV-10 at NYMEX Strip pricing Exaro Equity Investment 0.62 0.62 Estimated Net Asset Value Less: Net Obligations (2) (4.79) (4.79) Total Proved $6.11 $6.23 Southern Delaware Basin 5.79 12.70 (3) South TX and Southeast TX 2.18 7.63 (3) Wyoming 0.98 6.23 (3) Preliminary Per Share Valuation $15.07 $32.80 Stock Price @ March 27, 2017 $6.95 $6.95 Premium to Current Stock Price 117% 372% |
|
|
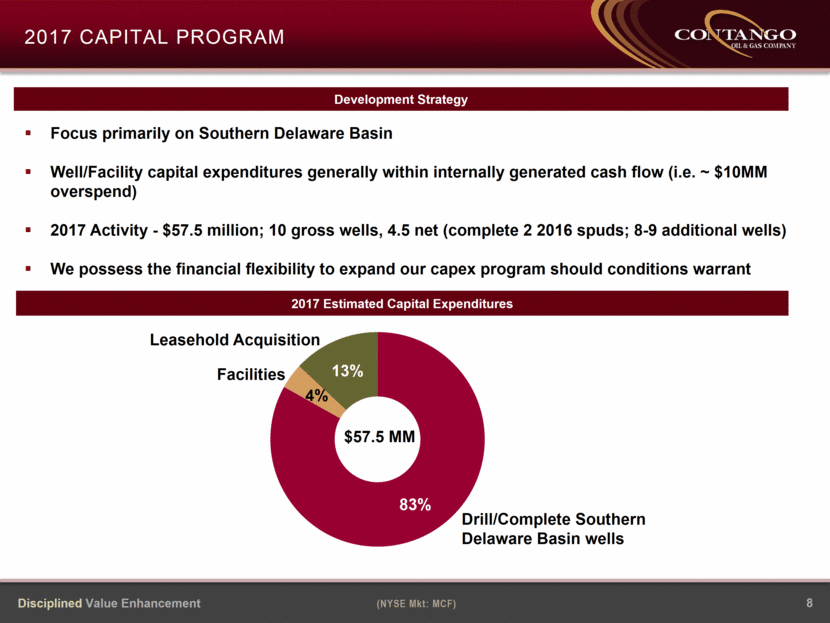
8 2017 Capital program Development Strategy 2017 Estimated Capital Expenditures Focus primarily on Southern Delaware Basin Well/Facility capital expenditures generally within internally generated cash flow (i.e. ~ $10MM overspend) 2017 Activity - $57.5 million; 10 gross wells, 4.5 net (complete 2 2016 spuds; 8-9 additional wells) We possess the financial flexibility to expand our capex program should conditions warrant Drill/Complete Southern Delaware Basin wells Facilities Leasehold Acquisition $57.5 MM 83% 4% 13% |
|
|
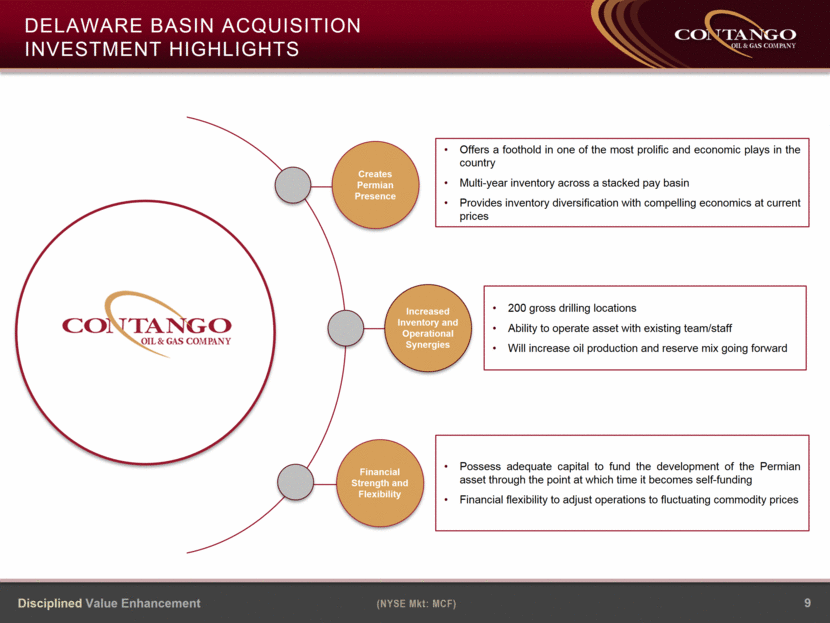
9 DELAWARE basin Acquisition Investment Highlights Financial Strength and Flexibility Creates Permian Presence Offers a foothold in one of the most prolific and economic plays in the country Multi-year inventory across a stacked pay basin Provides inventory diversification with compelling economics at current prices 200 gross drilling locations Ability to operate asset with existing team/staff Will increase oil production and reserve mix going forward Possess adequate capital to fund the development of the Permian asset through the point at which time it becomes self-funding Financial flexibility to adjust operations to fluctuating commodity prices Increased Inventory and Operational Synergies |
|
|
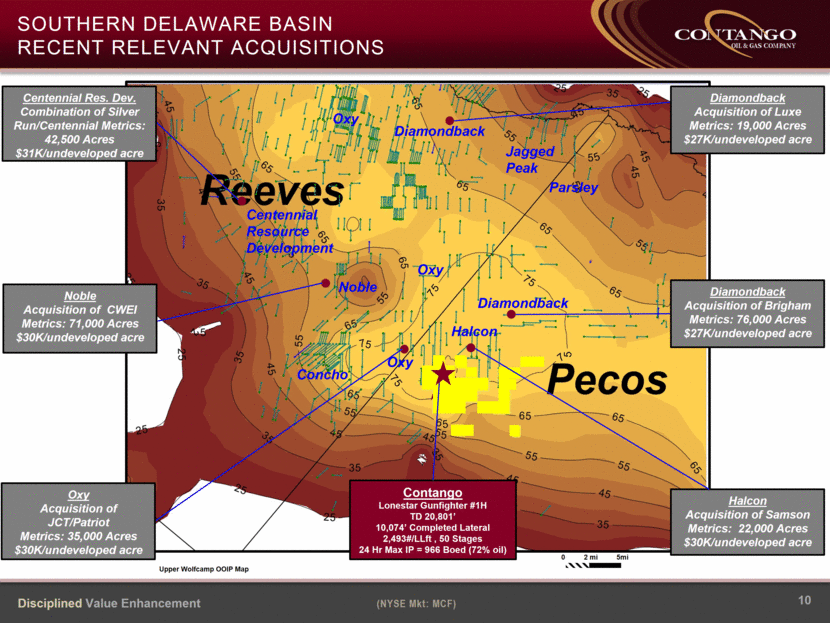
Parsley Concho Diamondback Halcon Oxy Noble Jagged Peak Centennial Resource Development Oxy Oxy Diamondback southern delaware basin Recent relevant acquisitions Upper Wolfcamp OOIP Map Diamondback Acquisition of Luxe Metrics: 19,000 Acres $27K/undeveloped acre Centennial Res. Dev. Combination of Silver Run/Centennial Metrics: 42,500 Acres $31K/undeveloped acre Contango Lonestar Gunfighter #1H TD 20,801’ 10,074’ Completed Lateral 2,493#/LLft , 50 Stages 24 Hr Max IP = 966 Boed (72% oil) Diamondback Acquisition of Brigham Metrics: 76,000 Acres $27K/undeveloped acre Halcon Acquisition of Samson Metrics: 22,000 Acres $30K/undeveloped acre Oxy Acquisition of JCT/Patriot Metrics: 35,000 Acres $30K/undeveloped acre Noble Acquisition of CWEI Metrics: 71,000 Acres $30K/undeveloped acre 10 0 2 mi 5mi |
|
|
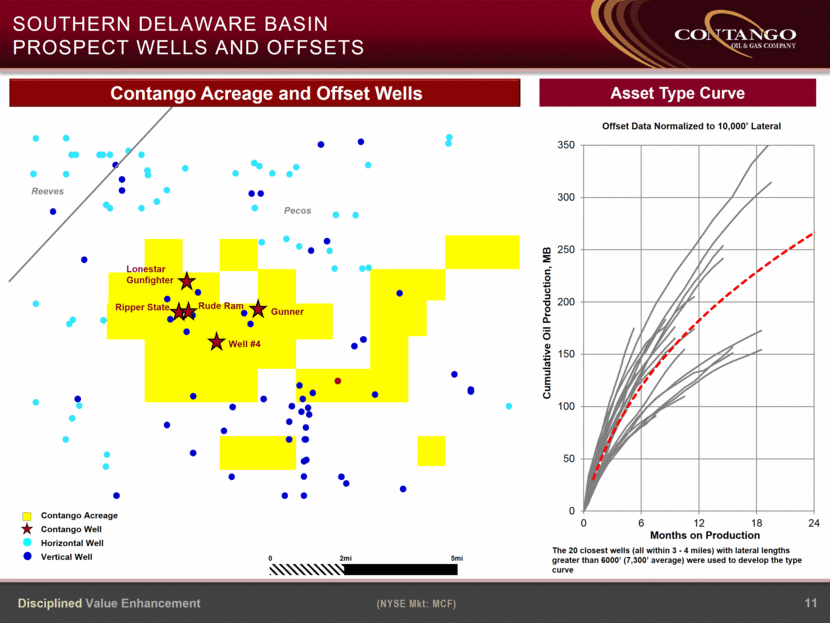
11 Asset Type Curve The 20 closest wells (all within 3 - 4 miles) with lateral lengths greater than 6000’ (7,300’ average) were used to develop the type curve Reeves Pecos Contango Acreage and Offset Wells Contango Acreage Contango Well Horizontal Well Vertical Well Lonestar Gunfighter Ripper State Well #4 Gunner Rude Ram southern delaware basin prospect wells and offsets 0 2mi 5mi 0 50 100 150 200 250 300 350 0 6 12 18 24 Cumulative Oil Production, MB Months on Production Offset Data Normalized to 10,000’ Lateral |
|
|
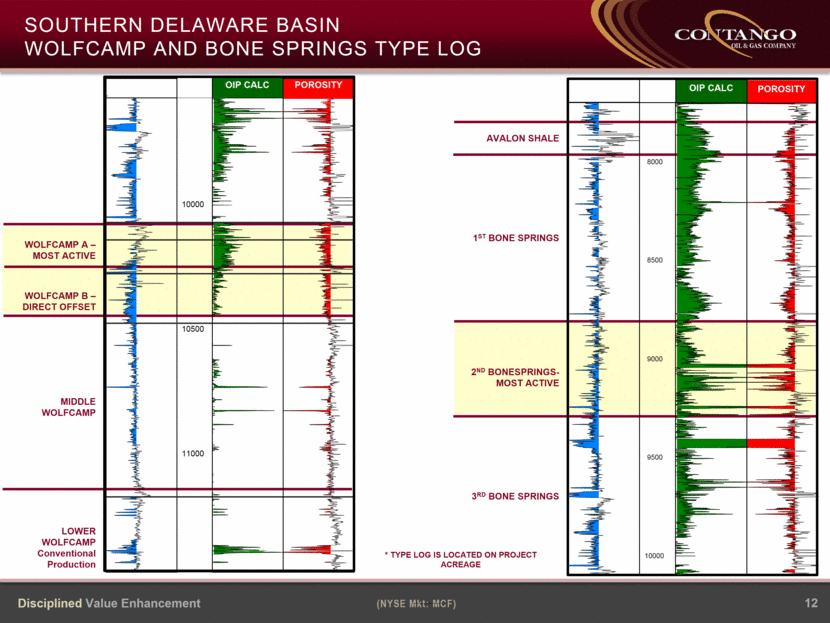
AVALON SHALE 1ST BONE SPRINGS 2ND BONESPRINGS- MOST ACTIVE 3RD BONE SPRINGS SOUTHERN delaware basin WOLFCAMP and Bone Springs TYPE LOG * TYPE LOG IS LOCATED ON PROJECT ACREAGE WOLFCAMP A – MOST ACTIVE WOLFCAMP B – DIRECT OFFSET MIDDLE WOLFCAMP LOWER WOLFCAMP Conventional Production 0 0.2 2000 LLD 0 1 OIP 0 1 BLUEBONNET_OIP 0.3 0 PHIDEDIT 10000 10500 11000 OIP CALC POROSITY DELAWARE BASIN OIP CALC POROSITY 8000 8500 9000 9500 10000 SOUTHERN delaware basin WOLFCAMP and Bone Springs TYPE LOG 12 |
|
|
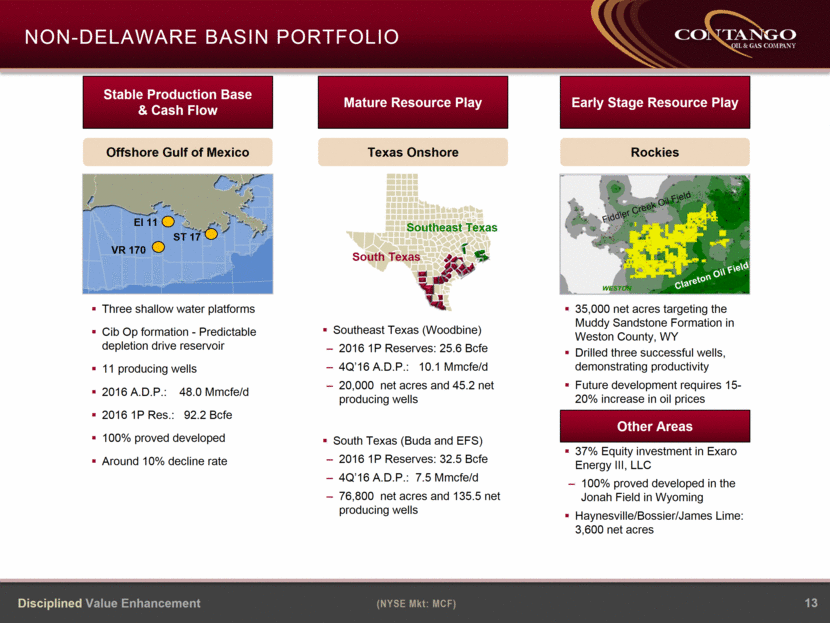
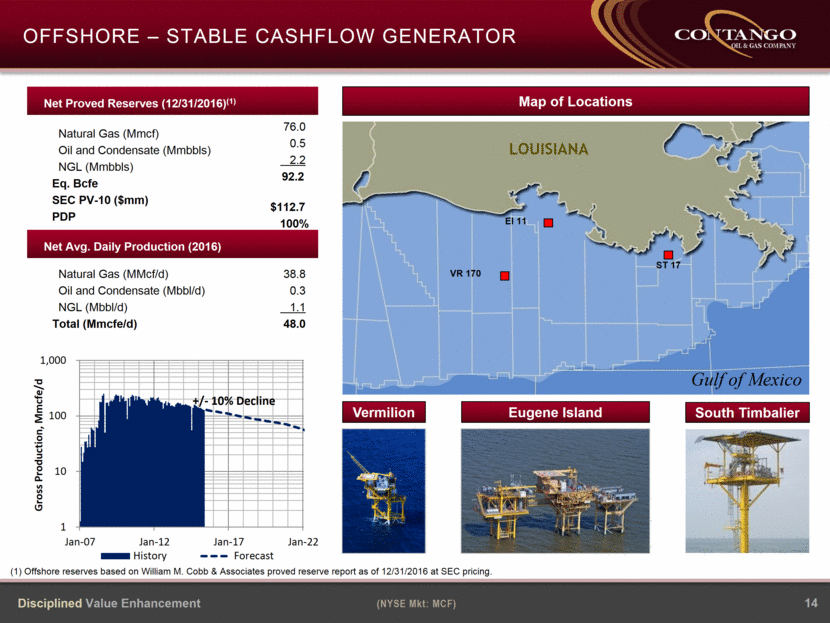
13 Stable Production Base & Cash Flow Mature Resource Play Early Stage Resource Play Offshore Gulf of Mexico Texas Onshore Rockies Three shallow water platforms Cib Op formation - Predictable depletion drive reservoir 11 producing wells 2016 A.D.P.: 48.0 Mmcfe/d 2016 1P Res.: 92.2 Bcfe 100% proved developed Around 10% decline rate 35,000 net acres targeting the Muddy Sandstone Formation in Weston County, WY Drilled three successful wells, demonstrating productivity Future development requires 15-20% increase in oil prices Non-Delaware Basin Portfolio EI 11 VR 170 ST 17 Dimmit Fiddler Creek Oil Field 37% Equity investment in Exaro Energy III, LLC 100% proved developed in the Jonah Field in Wyoming Haynesville/Bossier/James Lime: 3,600 net acres Southeast Texas (Woodbine) 2016 1P Reserves: 25.6 Bcfe 4Q’16 A.D.P.: 10.1 Mmcfe/d 20,000 net acres and 45.2 net producing wells South Texas (Buda and EFS) 2016 1P Reserves: 32.5 Bcfe 4Q’16 A.D.P.: 7.5 Mmcfe/d 76,800 net acres and 135.5 net producing wells Clareton Oil Field Other Areas TX Southeast Texas South Texas |
|
|
Offshore – Stable cashflow generator 14 (1) Offshore reserves based on William M. Cobb & Associates proved reserve report as of 12/31/2016 at SEC pricing.. Producing Platforms and Prospects Other Assets Net Proved Reserves (12/31/2016)(1) Natural Gas (Mmcf) Oil and Condensate (Mmbbls) NGL (Mmbbls) Eq. Bcfe SEC PV-10 ($mm) PDP 76.0 0.5 2.2 92.2 $112.7 100% Net Avg. Daily Production (2016) Natural Gas (MMcf/d) Oil and Condensate (Mbbl/d) NGL (Mbbl/d) Total (Mmcfe/d) 38.8 0.3 1.1 48.0 Producing Platforms and Prospects LOUISIANA VR 170 EI 11 ST 17 Gulf of Mexico Map of Locations Vermilion Eugene Island South Timbalier 1 10 100 1,000 Jan-07 Jan-12 Jan-17 Jan-22 Gross Production, Mmcfe /d History Forecast +/ - 10% Decline |
|
|
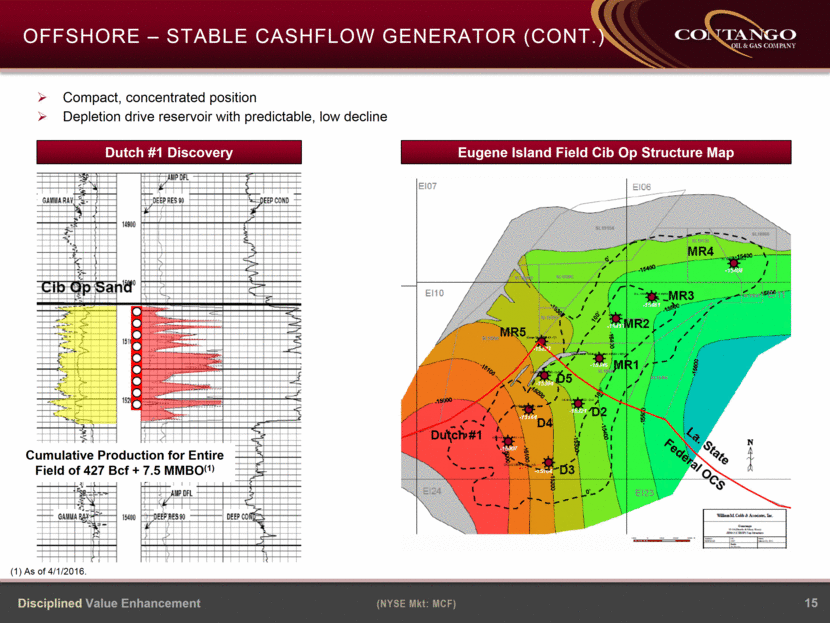
15 Offshore – Stable cashflow generator (Cont.) Dutch #1 Discovery Eugene Island Field Cib Op Structure Map Compact, concentrated position Depletion drive reservoir with predictable, low decline Cumulative Production for Entire Field of 427 Bcf + 7.5 MMBO(1) (1) As of 4/1/2016. |
|
|
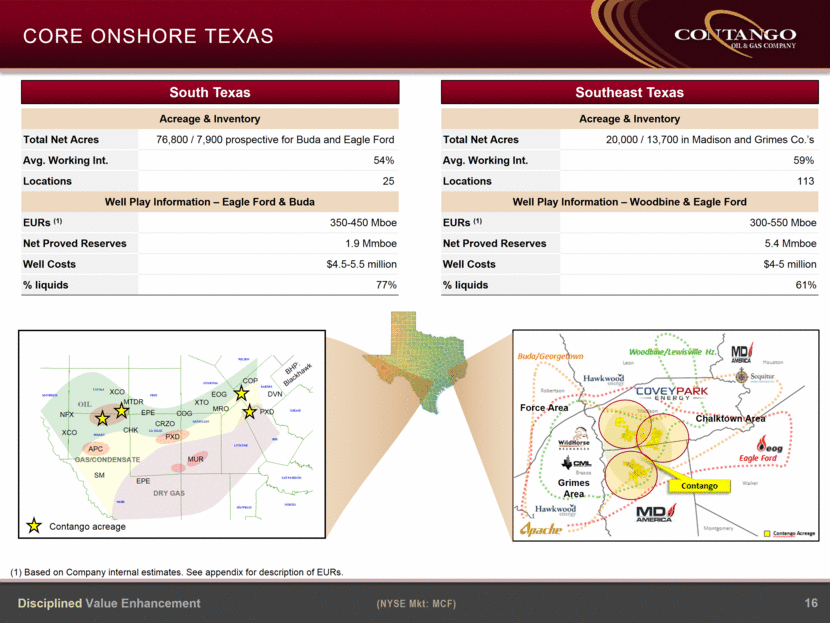
16 Core Onshore Texas South Texas Acreage & Inventory Total Net Acres 76,800 / 7,900 prospective for Buda and Eagle Ford Avg. Working Int. 54% Locations 25 Well Play Information – Eagle Ford & Buda EURs (1) 350-450 Mboe Net Proved Reserves 1.9 Mmboe Well Costs $4.5-5.5 million % liquids 77% Southeast Texas Acreage & Inventory Total Net Acres 20,000 / 13,700 in Madison and Grimes Co.’s Avg. Working Int. 59% Locations 113 Well Play Information – Woodbine & Eagle Ford EURs (1) 300-550 Mboe Net Proved Reserves 5.4 Mmboe Well Costs $4-5 million % liquids 61% Force Area Chalktown Area Grimes Area DRY GAS OIL GAS/CONDENSATE EPE PXD MUR EOG PXD COP XCO BHP: Blackhawk APC SM NFX XCO CHK Contango acreage DVN XTO MRO COG CRZO EPE MTDR (1) Based on Company internal estimates. See appendix for description of EURs. |
|
|
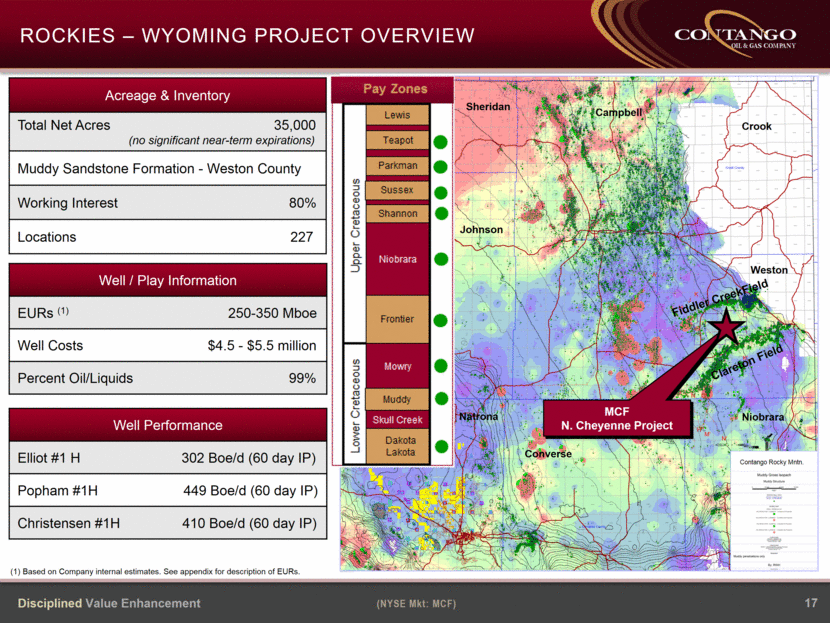
Wyoming – north cheyenne project Overview 17 Weston Crook Niobrara Converse Campbell MCF N. Cheyenne Project Clareton Field Crook Weston Campbell Sheridan Johnson Natrona Converse Niobrara Fiddler CreekField Acreage & Inventory Total Net Acres 35,000 (no significant near-term expirations) Muddy Sandstone Formation - Weston County Working Interest 80% Locations 227 Well / Play Information EURs (1) 250-350 Mboe Well Costs $4.5 - $5.5 million Percent Oil/Liquids 99% Rockies – Wyoming project Overview Contango Rocky Mntn. (1) Based on Company internal estimates. See appendix for description of EURs. Well Performance Elliot #1 H 302 Boe/d (60 day IP) Popham #1H 449 Boe/d (60 day IP) Christensen #1H 410 Boe/d (60 day IP) |
|
|
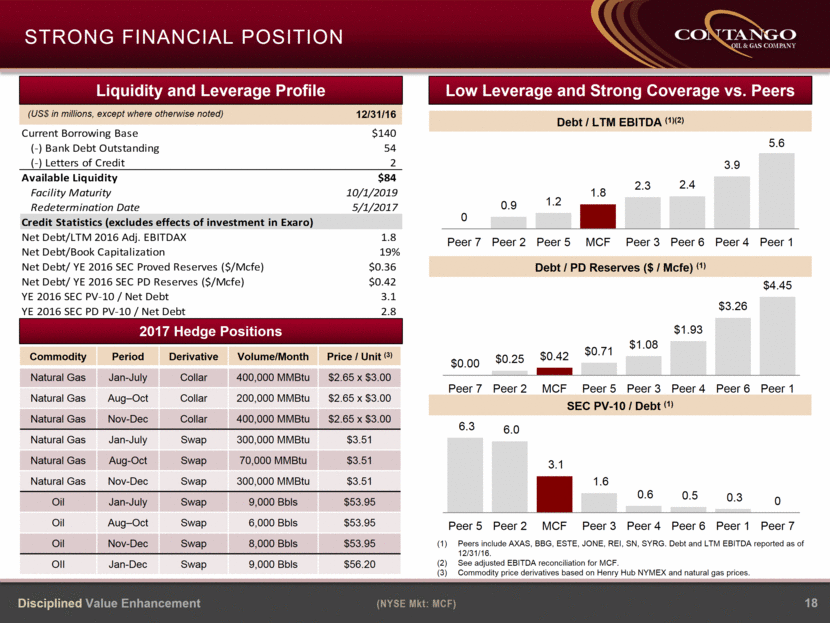
Peers include AXAS, BBG, ESTE, JONE, REI, SN, SYRG. Debt and LTM EBITDA reported as of 12/31/16. See adjusted EBITDA reconciliation for MCF. Commodity price derivatives based on Henry Hub NYMEX and natural gas prices. 18 Strong Financial Position Low Leverage and Strong Coverage vs. Peers 2017 Hedge Positions 12/31/16 Commodity Period Derivative Volume/Month Price / Unit (3) Natural Gas Jan-July Collar 400,000 MMBtu $2.65 x $3.00 Natural Gas Aug–Oct Collar 200,000 MMBtu $2.65 x $3.00 Natural Gas Nov-Dec Collar 400,000 MMBtu $2.65 x $3.00 Natural Gas Jan-July Swap 300,000 MMBtu $3.51 Natural Gas Aug-Oct Swap 70,000 MMBtu $3.51 Natural Gas Nov-Dec Swap 300,000 MMBtu $3.51 Oil Jan-July Swap 9,000 Bbls $53.95 Oil Aug–Oct Swap 6,000 Bbls $53.95 Oil Nov-Dec Swap 8,000 Bbls $53.95 OIl Jan-Dec Swap 9,000 Bbls $56.20 Debt / LTM EBITDA (1)(2) Debt / PD Reserves ($ / Mcfe) (1) SEC PV-10 / Debt (1) (US$ in millions, except where otherwise noted) Liquidity and Leverage Profile Net Debt/LTM 2016 Adj. EBITDAX 1.8 MCF $0.47 0 0.9 1.2 1.8 2.3 2.4 3.9 5.6 Peer 7 Peer 2 Peer 5 MCF Peer 3 Peer 6 Peer 4 Peer 1 $0.00 $0.25 $0.42 $0.71 $1.08 $1.93 $3.26 $4.45 Peer 7 Peer 2 MCF Peer 5 Peer 3 Peer 4 Peer 6 Peer 1 0 0.3 0.5 0.6 1.6 3.1 6.0 6.3 Peer 7 Peer 1 Peer 6 Peer 4 Peer 3 MCF Peer 2 Peer 5 |
|
|
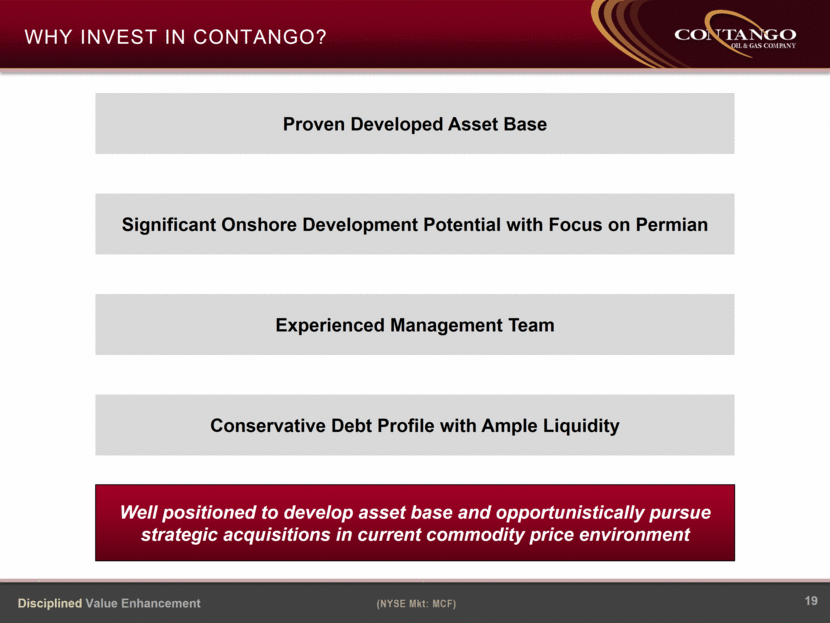
19 Why Invest in Contango? Proven Developed Asset Base Experienced Management Team Significant Onshore Development Potential with Focus on Permian Conservative Debt Profile with Ample Liquidity Well positioned to develop asset base and opportunistically pursue strategic acquisitions in current commodity price environment |
|
|
APPENDIX |
|
|
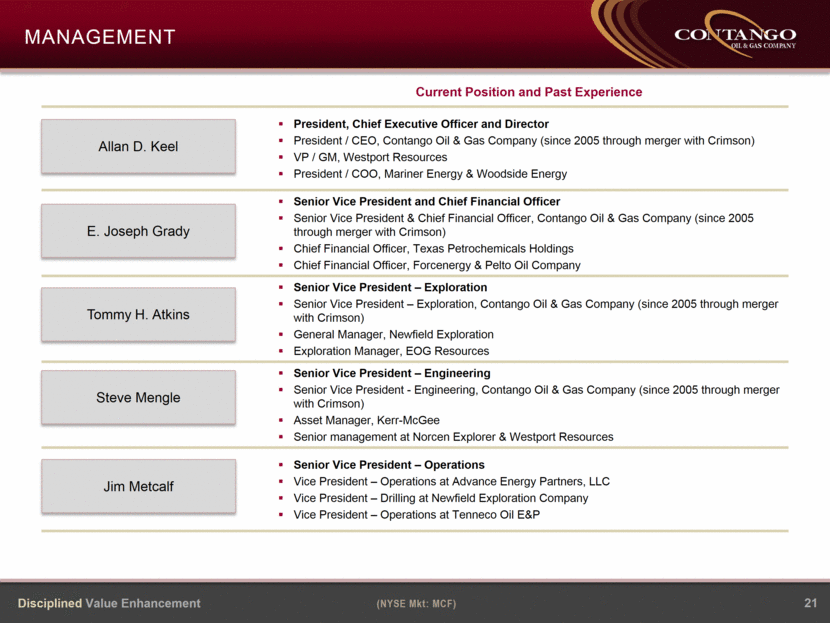
21 Management Current Position and Past Experience President, Chief Executive Officer and Director President / CEO, Contango Oil & Gas Company (since 2005 through merger with Crimson) VP / GM, Westport Resources President / COO, Mariner Energy & Woodside Energy Senior Vice President and Chief Financial Officer Senior Vice President & Chief Financial Officer, Contango Oil & Gas Company (since 2005 through merger with Crimson) Chief Financial Officer, Texas Petrochemicals Holdings Chief Financial Officer, Forcenergy & Pelto Oil Company Senior Vice President – Exploration Senior Vice President – Exploration, Contango Oil & Gas Company (since 2005 through merger with Crimson) General Manager, Newfield Exploration Exploration Manager, EOG Resources Senior Vice President – Engineering Senior Vice President - Engineering, Contango Oil & Gas Company (since 2005 through merger with Crimson) Asset Manager, Kerr-McGee Senior management at Norcen Explorer & Westport Resources Senior Vice President – Operations Vice President – Operations at Advance Energy Partners, LLC Vice President – Drilling at Newfield Exploration Company Vice President – Operations at Tenneco Oil E&P Allan D. Keel E. Joseph Grady Tommy H. Atkins Steve Mengle Jim Metcalf |
|
|
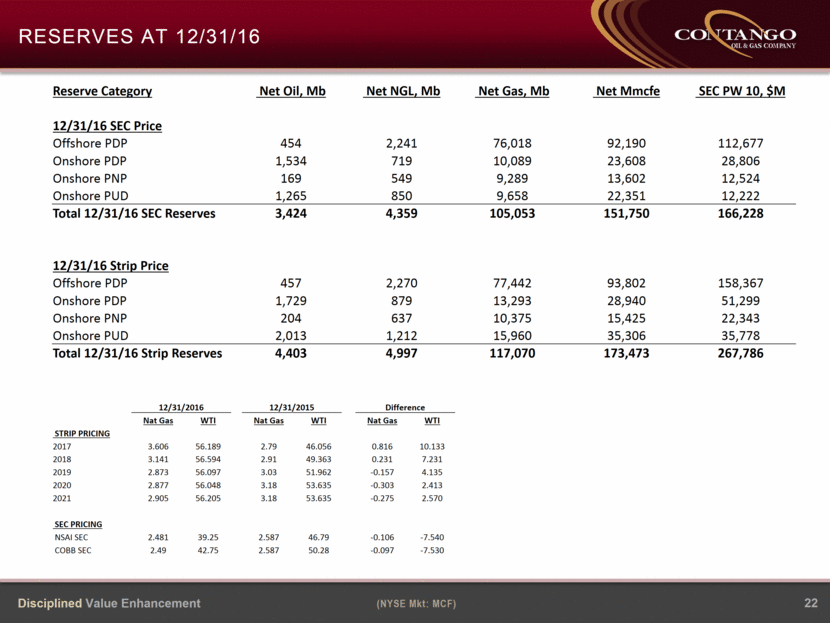
RESERVES AT 12/31/16 22 Reserve Category Net Oil, Mb Net NGL, Mb Net Gas, Mb Net Mmcfe SEC PW 10, $M 12/31/16 SEC Price Offshore PDP 454 2,241 76,018 92,190 112,677 Onshore PDP 1,534 719 10,089 23,608 28,806 Onshore PNP 169 549 9,289 13,602 12,524 Onshore PUD 1,265 850 9,658 22,351 12,222 Total 12/31/16 SEC Reserves 3,424 4,359 105,053 151,750 166,228 12/31/16 Strip Price Offshore PDP 457 2,270 77,442 93,802 158,367 Onshore PDP 1,729 879 13,293 28,940 51,299 Onshore PNP 204 637 10,375 15,425 22,343 Onshore PUD 2,013 1,212 15,960 35,306 35,778 Total 12/31/16 Strip Reserves 4,403 4,997 117,070 173,473 267,786 12/31/2016 12/31/2015 Difference Nat Gas WTI Nat Gas WTI Nat Gas WTI STRIP PRICING 2017 3.606 56.189 2.79 46.056 0.816 10.133 2018 3.141 56.594 2.91 49.363 0.231 7.231 2019 2.873 56.097 3.03 51.962 -0.157 4.135 2020 2.877 56.048 3.18 53.635 -0.303 2.413 2021 2.905 56.205 3.18 53.635 -0.275 2.570 SEC PRICING NSAI SEC 2.481 39.25 2.587 46.79 -0.106 -7.540 COBB SEC 2.49 42.75 2.587 50.28 -0.097 -7.530 |
|
|
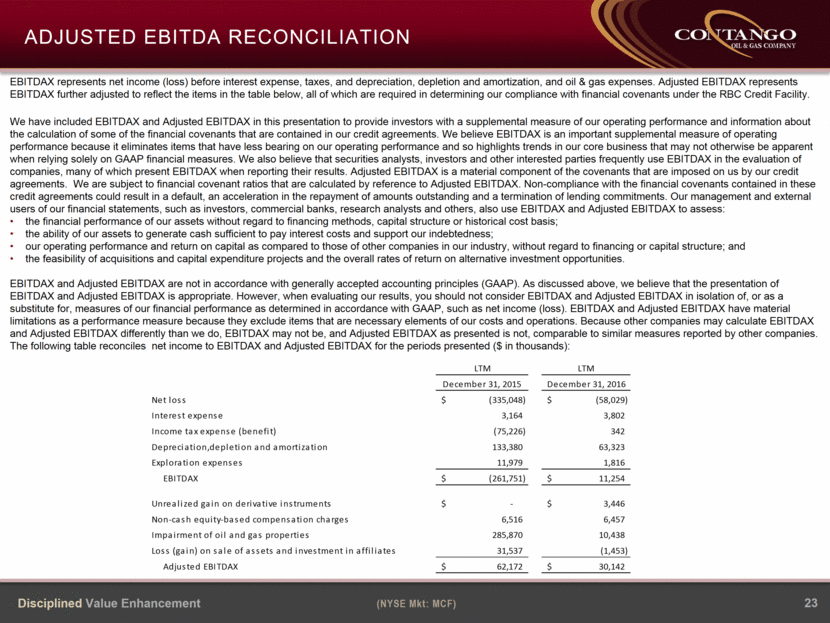
23 EBITDAX represents net income (loss) before interest expense, taxes, and depreciation, depletion and amortization, and oil & gas expenses. Adjusted EBITDAX represents EBITDAX further adjusted to reflect the items in the table below, all of which are required in determining our compliance with financial covenants under the RBC Credit Facility. We have included EBITDAX and Adjusted EBITDAX in this presentation to provide investors with a supplemental measure of our operating performance and information about the calculation of some of the financial covenants that are contained in our credit agreements. We believe EBITDAX is an important supplemental measure of operating performance because it eliminates items that have less bearing on our operating performance and so highlights trends in our core business that may not otherwise be apparent when relying solely on GAAP financial measures. We also believe that securities analysts, investors and other interested parties frequently use EBITDAX in the evaluation of companies, many of which present EBITDAX when reporting their results. Adjusted EBITDAX is a material component of the covenants that are imposed on us by our credit agreements. We are subject to financial covenant ratios that are calculated by reference to Adjusted EBITDAX. Non-compliance with the financial covenants contained in these credit agreements could result in a default, an acceleration in the repayment of amounts outstanding and a termination of lending commitments. Our management and external users of our financial statements, such as investors, commercial banks, research analysts and others, also use EBITDAX and Adjusted EBITDAX to assess: the financial performance of our assets without regard to financing methods, capital structure or historical cost basis; the ability of our assets to generate cash sufficient to pay interest costs and support our indebtedness; our operating performance and return on capital as compared to those of other companies in our industry, without regard to financing or capital structure; and the feasibility of acquisitions and capital expenditure projects and the overall rates of return on alternative investment opportunities. EBITDAX and Adjusted EBITDAX are not in accordance with generally accepted accounting principles (GAAP). As discussed above, we believe that the presentation of EBITDAX and Adjusted EBITDAX is appropriate. However, when evaluating our results, you should not consider EBITDAX and Adjusted EBITDAX in isolation of, or as a substitute for, measures of our financial performance as determined in accordance with GAAP, such as net income (loss). EBITDAX and Adjusted EBITDAX have material limitations as a performance measure because they exclude items that are necessary elements of our costs and operations. Because other companies may calculate EBITDAX and Adjusted EBITDAX differently than we do, EBITDAX may not be, and Adjusted EBITDAX as presented is not, comparable to similar measures reported by other companies. The following table reconciles net income to EBITDAX and Adjusted EBITDAX for the periods presented ($ in thousands): Adjusted EBITDA Reconciliation LTM LTM 9 mo December 31, 2015 December 31, 2016 Crimson Net loss $ (335,048) $ (58,029) 41,362 Interest expense 3,164 3,802 1,171 Income tax expense (benefit) (75,226) 342 23,139 Depreciation,depletion and amortization 133,380 63,323 65,529 Exploration expenses 11,979 1,816 1,811 EBITDAX $ (261,751) $ 11,254 $ 133,012 Unrealized gain on derivative instruments $ - $ 3,446 1,132 Non-cash equity-based compensation charges 6,516 6,457 3,180 Impairment of oil and gas properties 285,870 10,438 767 Loss (gain) on sale of assets and investment in affiliates 31,537 (1,453) (24,598) Adjusted EBITDAX $ 62,172 $ 30,142 $ 113,493 |
|
|
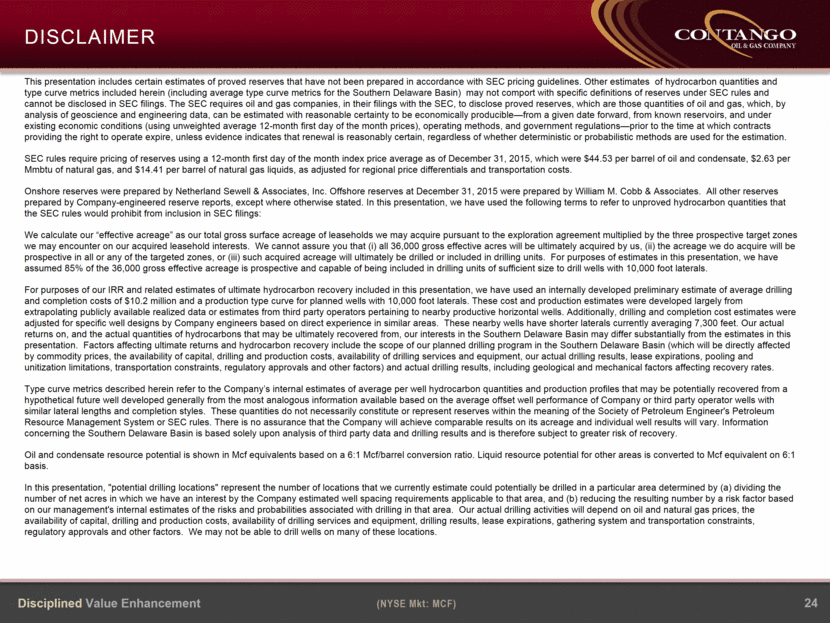
Hydrocarbon quantities & drilling locations 24 This presentation includes certain estimates of proved reserves that have not been prepared in accordance with SEC pricing guidelines. Other estimates of hydrocarbon quantities and type curve metrics included herein (including average type curve metrics for the Southern Delaware Basin) may not comport with specific definitions of reserves under SEC rules and cannot be disclosed in SEC filings. The SEC requires oil and gas companies, in their filings with the SEC, to disclose proved reserves, which are those quantities of oil and gas, which, by analysis of geoscience and engineering data, can be estimated with reasonable certainty to be economically producible—from a given date forward, from known reservoirs, and under existing economic conditions (using unweighted average 12-month first day of the month prices), operating methods, and government regulations—prior to the time at which contracts providing the right to operate expire, unless evidence indicates that renewal is reasonably certain, regardless of whether deterministic or probabilistic methods are used for the estimation. SEC rules require pricing of reserves using a 12-month first day of the month index price average as of December 31, 2015, which were $44.53 per barrel of oil and condensate, $2.63 per Mmbtu of natural gas, and $14.41 per barrel of natural gas liquids, as adjusted for regional price differentials and transportation costs. Onshore reserves were prepared by Netherland Sewell & Associates, Inc. Offshore reserves at December 31, 2015 were prepared by William M. Cobb & Associates. All other reserves prepared by Company-engineered reserve reports, except where otherwise stated. In this presentation, we have used the following terms to refer to unproved hydrocarbon quantities that the SEC rules would prohibit from inclusion in SEC filings: We calculate our “effective acreage” as our total gross surface acreage of leaseholds we may acquire pursuant to the exploration agreement multiplied by the three prospective target zones we may encounter on our acquired leasehold interests. We cannot assure you that (i) all 36,000 gross effective acres will be ultimately acquired by us, (ii) the acreage we do acquire will be prospective in all or any of the targeted zones, or (iii) such acquired acreage will ultimately be drilled or included in drilling units. For purposes of estimates in this presentation, we have assumed 85% of the 36,000 gross effective acreage is prospective and capable of being included in drilling units of sufficient size to drill wells with 10,000 foot laterals. For purposes of our IRR and related estimates of ultimate hydrocarbon recovery included in this presentation, we have used an internally developed preliminary estimate of average drilling and completion costs of $10.2 million and a production type curve for planned wells with 10,000 foot laterals. These cost and production estimates were developed largely from extrapolating publicly available realized data or estimates from third party operators pertaining to nearby productive horizontal wells. Additionally, drilling and completion cost estimates were adjusted for specific well designs by Company engineers based on direct experience in similar areas. These nearby wells have shorter laterals currently averaging 7,300 feet. Our actual returns on, and the actual quantities of hydrocarbons that may be ultimately recovered from, our interests in the Southern Delaware Basin may differ substantially from the estimates in this presentation. Factors affecting ultimate returns and hydrocarbon recovery include the scope of our planned drilling program in the Southern Delaware Basin (which will be directly affected by commodity prices, the availability of capital, drilling and production costs, availability of drilling services and equipment, our actual drilling results, lease expirations, pooling and unitization limitations, transportation constraints, regulatory approvals and other factors) and actual drilling results, including geological and mechanical factors affecting recovery rates. Type curve metrics described herein refer to the Company’s internal estimates of average per well hydrocarbon quantities and production profiles that may be potentially recovered from a hypothetical future well developed generally from the most analogous information available based on the average offset well performance of Company or third party operator wells with similar lateral lengths and completion styles. These quantities do not necessarily constitute or represent reserves within the meaning of the Society of Petroleum Engineer's Petroleum Resource Management System or SEC rules. There is no assurance that the Company will achieve comparable results on its acreage and individual well results will vary. Information concerning the Southern Delaware Basin is based solely upon analysis of third party data and drilling results and is therefore subject to greater risk of recovery. Oil and condensate resource potential is shown in Mcf equivalents based on a 6:1 Mcf/barrel conversion ratio. Liquid resource potential for other areas is converted to Mcf equivalent on 6:1 basis. In this presentation, "potential drilling locations" represent the number of locations that we currently estimate could potentially be drilled in a particular area determined by (a) dividing the number of net acres in which we have an interest by the Company estimated well spacing requirements applicable to that area, and (b) reducing the resulting number by a risk factor based on our management's internal estimates of the risks and probabilities associated with drilling in that area. Our actual drilling activities will depend on oil and natural gas prices, the availability of capital, drilling and production costs, availability of drilling services and equipment, drilling results, lease expirations, gathering system and transportation constraints, regulatory approvals and other factors. We may not be able to drill wells on many of these locations. Disclaimer |

