Attached files
| file | filename |
|---|---|
| EX-23.2 - CONSENT OF INDEPENDENT REGISTERED PUBLIC ACCOUNTING FIRM - UNICO AMERICAN CORP | exhibit23-2.htm |
| EX-32.2 - CERTIFICATION UNDER SECTION 906 - UNICO AMERICAN CORP | exhibit32-2.htm |
| EX-32.1 - CERTIFICATION UNDER SECTION 906 - UNICO AMERICAN CORP | exhibit32-1.htm |
| EX-31.2 - CERTIFICATION - UNICO AMERICAN CORP | exhibit31-2.htm |
| EX-31.1 - CERTIFICATION - UNICO AMERICAN CORP | exhibit31-1.htm |
| EX-23.1 - CONSENT OF INDEPENDENT REGISTERED PUBLIC ACCOUNTING FIRM - UNICO AMERICAN CORP | exhibit23-1.htm |
| EX-10.21 - AMENDMENT TO EMPLOYMENT AGREEMENT WITH CARY L. CHELDIN - UNICO AMERICAN CORP | exhibit10-21.htm |
SECURITIES AND EXCHANGE COMMISSION
Washington, D.C. 20549
FORM 10-K
Annual report pursuant to Section 13 or 15 (d) of the Securities Exchange Act of 1934
| For the fiscal year ended December 31, 2016 | Commission File No. 0-3978 |
UNICO AMERICAN CORPORATION
(Exact name of registrant as specified in its charter)
| Nevada | 95-2583928 |
| (State or other jurisdiction of incorporation or organization) | (IRS Employer Identification No.) |
| 26050 Mureau Road, Calabasas, California | 91302 |
| (Address of Principal Executive Offices) | (Zip Code) |
Registrant's telephone number, including area code: (818) 591-9800
Securities registered pursuant to Section 12(b) of the Act:
| Common Stock, No Par Value | NASDAQ Stock Market LLC |
| (Title of each class) | Name Of Each Exchange On Which Registered |
Securities registered pursuant to section 12(g) of the Act:
None
(Title of Class)
Indicate by check mark if the registrant is a well-known seasoned issuer, as defined in Rule 405 of the Securities Act. Yes No X
Indicate by check mark if the registrant is not required to file reports pursuant to Section 13 or Section 15(d) of the Exchange Act. Yes No X
Indicate by check mark whether the registrant (1) has filed all reports required to be filed by Section 13 or 15 (d) of the Securities Exchange Act of 1934 during the preceding 12 months (or for such shorter period that the Registrant was required to file such reports), and (2) has been subject to such filing requirements for the past 90 days. Yes X No __
Indicate by check mark whether the registrant has submitted electronically and posted on its corporate website, if any, every Interactive Data File required to be submitted and posted pursuant to Rule 405 of Regulation S-T (§ 232.405 of this chapter) during the preceding 12 months (or for such shorter period that the registrant was required to submit and post such files). Yes _X_ No___
Indicate by check mark if disclosure of delinquent filers pursuant to Item 405 of Regulation S-K is not contained herein, and will not be contained, to the best of Registrant’s knowledge, in definitive proxy of information statements incorporated by reference as Part III of this Form 10-K or any amendment to this Form 10-K. X
Indicate by check mark whether the registrant is a large accelerated filer, an accelerated filer, a non-accelerated filer or a smaller reporting company. See the definitions of “large accelerator filer,” “accelerator filer” and “smaller reporting company” in Rule 12b-2 of the Exchange Act. (Check one):
Large accelerated filer __ Accelerated filer __
Non-accelerated filer __ Smaller reporting company X
(Do not check if a smaller reporting company)
Indicate by check mark whether the registrant is a shell company (as defined in Rule 12b-2 of the Exchange Act).
Yes No X
The aggregate market value of registrant’s voting and non-voting common equity held by non-affiliates as of June 30, 2016, the last business day of Registrant’s most recently completed second fiscal quarter, was $26,988,402.
Indicate the number of shares outstanding of each of the issuer’s classes of common stock, as of the latest practicable date.
| Class | Outstanding at March 30, 2017 |
| Common Stock, $0 Par value per share | 5,307,133 |
Portions of the definitive proxy statement that Registrant intends to file pursuant to Regulation 14(a) by a date no later than 120 days after December 31, 2015, to be used in connection with the annual meeting of shareholders, are incorporated herein by reference into Part III hereof. If such definitive proxy statement is not filed in the 120-day period, the information called for by Part III will be filed as an amendment to this Form 10-K not later than the end of the 120-day period.
1 of 89
PART I
Item 1. Business.
Unico American Corporation is an insurance holding company that underwrites property and casualty insurance through its insurance company subsidiary; provides property, casualty, and health insurance through its agency subsidiaries; and provides insurance premium financing and membership association services through its other subsidiaries. Unico American Corporation is referred to herein as the "Company" or "Unico" and such references include both the corporation and its subsidiaries, all of which are wholly owned unless otherwise indicated. Unico was incorporated under the laws of Nevada in 1969.
Descriptions of the Company’s operations in the following paragraphs are categorized between the Company’s major segment, the insurance company operation, and other insurance operations. The insurance company operation is conducted through Crusader Insurance Company (“Crusader”), Unico’s property and casualty insurance company. Revenues from insurance company operation and other insurance operations for the years ended December 31, 2016, 2015, and 2014, are as follows:
| Year ended December 31 | ||||||||||||||||||||||||
| 2016 | 2015 | 2014 | ||||||||||||||||||||||
| Total Revenues | Percent of Total Company Revenues | Total Revenues | Percent of Total Company Revenues | Total Revenues | Percent of Total Company Revenues | |||||||||||||||||||
| Insurance company operation | $ | 32,453,601 | 92.0 | % | $ | 30,420,988 | 91.4 | % | $ | 27,466,597 | 90.1 | % | ||||||||||||
| Other insurance operations | ||||||||||||||||||||||||
| Gross commissions and fees: | ||||||||||||||||||||||||
| Health insurance program commission income | 959,810 | 2.7 | % | 960,670 | 2.9 | % | 1,082,412 | 3.6 | % | |||||||||||||||
| Policy fee income | 1,691,655 | 4.9 | % | 1,706,134 | 5.1 | % | 1,619,060 | 5.3 | % | |||||||||||||||
| Daily automobile rental insurance program commission | 8,819 | — | 18,408 | 0.1 | % | 116,160 | 0.4 | % | ||||||||||||||||
| Association operations membership and fee income | 78,019 | 0.2 | % | 88,530 | 0.3 | % | 100,332 | 0.3 | % | |||||||||||||||
| Total gross commission and fee income | 2,738,303 | 7.8 | % | 2,773,742 | 8.4 | % | 2,917,964 | 9.6 | % | |||||||||||||||
| Investment income | 359 | — | 414 | — | 555 | — | ||||||||||||||||||
| Finance fees earned | 68,900 | 0.2 | % | 65,730 | 0.2 | % | 67,012 | 0.2 | % | |||||||||||||||
| Other income | 6,561 | — | 3,765 | — | 18,112 | 0.1 | % | |||||||||||||||||
| Total other insurance operations | 2,814,123 | 8.0 | % | 2,843,651 | 8.6 | % | 3,003,643 | 9.9 | % | |||||||||||||||
| Total revenues | $ | 35,267,724 | 100.0 | % | $ | 33,264,639 | 100.0 | % | $ | 30,470,240 | 100.0 | % | ||||||||||||
INSURANCE COMPANY OPERATION
General
The insurance company operation is conducted through Crusader. Crusader is a multiple line property and casualty insurance company that began transacting business on January 1, 1985. From 2004 until June 2014, all of Crusader’s business was written in the state of California. In June 2014, Crusader began writing business in the state of Arizona. During the years ended December 31, 2016, 2015, and 2014, approximately 98% of Crusader’s business was commercial multiple peril policies. Commercial multiple peril policies provide a combination of property and liability coverages for businesses. Commercial property coverage insures against loss or damage to buildings, inventory and equipment from natural disasters, including hurricanes, windstorms, hail, water, explosions, severe winter weather, and other events such as theft and vandalism, fires, storms, and financial loss due to business interruption resulting from covered property damage. However, Crusader does not write earthquake coverage. Commercial liability coverage insures against third party liability from accidents occurring on the insured’s premises or arising out of its operation. In addition to commercial multiple peril policies, Crusader also writes separate policies to insure commercial property and commercial liability risks on a mono-line basis. Crusader is domiciled in California; and, as of December 31, 2016, Crusader is licensed as an admitted insurance carrier in the states of Arizona, California, Nevada, Oregon, and Washington.
2 of 89
Production and Servicing of Policies
Crusader sells its insurance policies through Unifax Insurance Systems, Inc. (“Unifax”), a subsidiary of the Company and Crusader’s sister corporation and exclusive general agent. All policies are produced by a network of independent brokers and agents.
The property casualty insurance marketplace continues to be intensely competitive. While Crusader attempts to meet such competition with competitive prices, its emphasis is on service, promotion, and distribution. Crusader believes that rate adequacy is more important than premium growth and that underwriting profit (net earned premium less losses and loss adjustment expenses and policy acquisition costs) is its primary goal. Nonetheless, Crusader believes that it can grow its sales and profitability by focusing upon five areas of its operations: (1) product development, (2) improved service to highly-specialized retail brokers, (3) appointment of highly-specialized independent retail agents, (4) geographical expansion, and (5) use of alternative marketing channels.
The Company continues working to improve its use of technology, particularly in areas of internet commerce and in its policy administration system (“PAS”). In 2015, the Company recognized that its attempt to replace its existing PAS with a certain vendor’s software was significantly off of schedule and budget, so it discontinued relations with that vendor. The 2015 decision to impair the capitalized software costs related to that vendor was based on the Company’s belief that the software had not achieved and would not be able to achieve the Company’s expected implementation targets and that the Company was unable to renegotiate the terms of its agreement with that vendor. The Company believes that it will need to make future cash expenditures to replace or upgrade its existing PAS but it is unable to estimate the amount at this time. While the Company’s existing PAS continues to support the Company’s current operations, the Company believes it would realize more competitive parity with respect to product and service by supplementing instead of replacing its existing PAS, on a short-term basis, as quickly as possible, while also working on a longer-term basis to ultimately replace its existing PAS with a more contemporary platform. To help make that determination, during 2016, the Company engaged outside IT advisors to evaluate the Company’s current IT environment and its alternatives.
Adjusting of Claims
Crusader manages all of its claims with a staff of in-house claim adjusters. This staff adjusts claims and oversees all outside claim services such as attorneys, independent or outside claim adjusters, investigators, and experts as necessary.
Reinsurance
A reinsurance transaction occurs when an insurance company transfers (cedes) a portion of its exposure on policies written to a reinsurer that assumes that risk for a premium (ceded premium). Reinsurance does not legally discharge Crusader from primary liability under its policies. If the reinsurer fails to meet its obligations, Crusader must nonetheless pay its policy obligations. Crusader’s primary excess of loss reinsurance agreements during the years ended December 31, 2016, 2015 and 2014 are as follows:
| Loss Years | Reinsurers | A.M. Best Rating | Retention | Annual Aggregate Deductible | ||||||||
| 2014 – 2016 | Renaissance Reinsurance U.S. Inc. & Hannover Ruckversicherungs AG & TOA Reinsurance of America | A A+ A+ | $ | 500,000 | $ | — | ||||||
In calendar years 2016, 2015, and 2014, Crusader retained a participation in its excess of loss reinsurance treaties of 10% in its 1st layer ($500,000 in excess of $500,000), 0% in its 2nd layer ($2,000,000 in excess of $1,000,000), and 0% in its property and casualty clash treaty.
Crusader’s excess of loss reinsurance treaties provided for a contingent commission for accident years 2006, 2004, and 2003. Crusader’s 2006 1st layer primary excess of loss reinsurance treaty provided for a contingent commission equal to 20% of the net profit, if any, accruing to the reinsurer. Crusader’s 2004 and 2003 1st layer primary excess of loss reinsurance treaties provided for a contingent commission to the Company equal to 45% of the net profit, if any, accruing to the reinsurer. Any contingent commission received was subject to return based on future development of ceded losses and loss adjustment expenses. The contingent commission income (loss) recognized was $0, $91,686, and $(17,092) for the years ended December 31, 2016, 2015, and 2014, respectively. As of December 31, 2016 and 2015, the unearned contingent commission balance included in “Accrued expenses and other liabilities” in the Consolidated Balance Sheets was $0.
3 of 89
Crusader also has catastrophe reinsurance treaties from various highly rated California authorized and California unauthorized reinsurance companies. These reinsurance treaties help protect Crusader against losses in excess of certain retentions from catastrophic events that may occur on property risks which Crusader insures. In calendar year 2016, Crusader retained a participation in its catastrophe excess of loss reinsurance treaties of 5% in its 1st layer ($9,000,000 in excess of $1,000,000) and 0% in its 2nd layer ($36,000,000 in excess of $10,000,000). In calendar years 2015 and 2014, Crusader retained a participation in its catastrophe excess of loss reinsurance treaties of 5% in its 1st layer ($9,000,000 in excess of $1,000,000) and 0% in its 2nd layer ($31,000,000 in excess of $10,000,000).
Crusader has no reinsurance recoverable balances in dispute.
Crusader evaluates each of its ceded reinsurance treaties at its inception to determine if there is sufficient risk transfer to allow the contract to be accounted for as reinsurance under current accounting literature. As of December 31, 2016, all such ceded contracts are accounted for as risk transfer reinsurance.
The aggregate amount of ceded earned premium to the reinsurers was $6,097,248, $5,328,639, and $5,090,268 for the years ended December 31, 2016, 2015, and 2014, respectively.
On most of the premium that Crusader cedes to the reinsurer, the reinsurer pays a commission to Crusader that includes a reimbursement of the cost of acquiring the portion of the premium that is ceded. Crusader does not currently assume any reinsurance. Crusader intends to continue obtaining reinsurance although the availability and cost may vary from time to time. The unpaid losses ceded to the reinsurer are recorded as an asset on the balance sheet.
Unpaid Losses and Loss Adjustment Expenses
Crusader maintains reserves for losses and loss adjustment expenses with respect to both reported and unreported losses. When a claim for loss is reported to Crusader, a reserve is established for the expected cost to settle the claim, including estimates of any related legal expense and other costs associated with resolving the claim. These reserves are called “case based” reserves. In addition, Crusader also sets up reserves at the end of each reporting period for losses that have occurred but have not yet been reported to Crusader. These incurred but not reported losses are referred to as “IBNR” reserves.
Crusader establishes reserves for reported losses based on historical experience, upon case-by-case evaluation of facts surrounding each known loss, and the related policy provisions. The amount of reserves for unreported losses is estimated by analysis of historical and statistical information. The ultimate liability of Crusader may be greater or less than estimated reserves. Reserves are monitored and adjusted when appropriate and are reflected in the statement of operations in the period of adjustment. Reserves for losses and loss adjustment expenses are estimated to cover the future amounts needed to pay claims and related expenses with respect to insured events that have occurred.
Crusader does not discount to a present value the portion of loss and loss adjustment expense reserves expected to be paid in future periods. Federal tax law, however, requires Crusader to discount loss and loss adjustment expense reserves for federal income tax purposes.
The process of establishing loss and loss adjustment expense reserves involves significant judgment. The following table shows the development of the unpaid losses and loss adjustment expenses for fiscal years 2006 through 2015. The top line of the table shows the estimated liability for unpaid losses and loss adjustment expenses, net of reinsurance, recorded at the balance sheet date for each of the indicated years. This liability represents the estimated amount of losses and loss adjustment expenses for losses arising in the current and prior years that are unpaid at the balance sheet date. The table shows the re-estimated amount of the previously recorded liability based on experience as of the end of each succeeding year. The estimate may change as more information becomes known. The Company believes that Crusader’s loss and loss adjustment expense reserves are properly stated. When subsequent loss and loss adjustment expense development justifies changes in reserving practices, the Company responds accordingly.
The following table reflects cumulative net redundancies in Crusader’s net loss and loss adjustment expense reserves for each of the 2006 through 2015 periods. The gross loss and loss adjustment expense reserves reflect a cumulative gross redundancy for the 2006 through 2012 periods and for the 2015 period and a cumulative gross deficiency for the 2013 and 2014 periods. See discussion of losses and loss adjustment expenses in Item 7 - “Management’s Discussion and Analysis of Financial Condition and Results of Operations - Results of Operations - Insurance Company Operation.”
4 of 89
When evaluating the information in the following table, it should be noted that each amount includes the effects of all changes in amounts of prior periods; therefore, the cumulative gross or net redundancy or deficiency represents the aggregate change in the estimates over all prior years. Conditions and trends that have affected development of the liability in the past may not necessarily occur in the future. Accordingly, it would not be appropriate to extrapolate future deficiencies or redundancies based on this table.
5 of 89
| CRUSADER INSURANCE COMPANY | ||||||||||||||||||||||||||||||||||||||||||||
| ANALYSIS OF LOSS AND LOSS ADJUSTMENT EXPENSE DEVELOPMENT | ||||||||||||||||||||||||||||||||||||||||||||
| Year Ended December 31 | ||||||||||||||||||||||||||||||||||||||||||||
| 2006 | 2007 | 2008 | 2009 | 2010 | 2011 | 2012 | 2013 | 2014 | 2015 | 2016 | ||||||||||||||||||||||||||||||||||
| Reserve for Unpaid Losses and Loss Adjustment Expenses, Net | $ | 70,076,430 | $ | 66,305,287 | $ | 58,839,017 | $ | 55,409,545 | $ | 49,743,381 | $ | 46,512,179 | $ | 43,200,582 | $ | 39,448,546 | $ | 39,233,783 | $ | 39,456,610 | $ | 37,534,817 | ||||||||||||||||||||||
| Paid Cumulative as of | ||||||||||||||||||||||||||||||||||||||||||||
| 1 Year Later | 18,136,957 | 20,255,356 | 17,123,126 | 15,809,062 | 12,431,401 | 11,351,147 | 11,745,141 | 10,545,020 | 12,128,214 | 16,764,109 | ||||||||||||||||||||||||||||||||||
| 2 Years Later | 32,708,859 | 34,175,791 | 27,981,461 | 24,809,437 | 19,595,440 | 17,779,156 | 18,831,399 | 19,853,649 | 23,526,473 | |||||||||||||||||||||||||||||||||||
| 3 Years Later | 40,477,741 | 40,878,873 | 33,327,793 | 29,641,757 | 23,297,603 | 22,916,160 | 24,258,387 | 28,111,248 | ||||||||||||||||||||||||||||||||||||
| 4 Years Later | 43,803,412 | 44,243,160 | 35,105,657 | 31,495,691 | 25,222,399 | 26,284,075 | 27,805,899 | |||||||||||||||||||||||||||||||||||||
| 5 Years Later | 45,453,118 | 45,060,447 | 36,003,375 | 32,704,049 | 26,692,418 | 28,516,163 | ||||||||||||||||||||||||||||||||||||||
| 6 Years Later | 46,048,205 | 45,811,654 | 36,865,292 | 33,205,930 | 27,713,270 | |||||||||||||||||||||||||||||||||||||||
| 7 Years Later | 46,577,491 | 46,529,380 | 37,320,640 | 33,846,655 | ||||||||||||||||||||||||||||||||||||||||
| 8 Years Later | 47,030,806 | 46,844,635 | 37,907,437 | |||||||||||||||||||||||||||||||||||||||||
| 9 Years Later | 47,344,849 | 47,115,405 | ||||||||||||||||||||||||||||||||||||||||||
| 10 Years Later | 47,615,618 | |||||||||||||||||||||||||||||||||||||||||||
| Reserves Re-estimated as of | ||||||||||||||||||||||||||||||||||||||||||||
| 1 Year Later | 65,958,329 | 62,748,486 | 54,883,464 | 50,841,366 | 44,900,923 | 42,149,270 | 38,641,123 | 36,139,782 | 36,789,471 | 39,433,080 | ||||||||||||||||||||||||||||||||||
| 2 Years Later | 61,135,905 | 59,520,345 | 51,044,229 | 47,332,499 | 40,856,252 | 36,568,583 | 34,754,945 | 35,009,728 | 36,317,648 | |||||||||||||||||||||||||||||||||||
| 3 Years Later | 56,989,424 | 56,548,186 | 47,343,297 | 43,887,081 | 35,561,980 | 33,200,620 | 33,318,184 | 35,042,542 | ||||||||||||||||||||||||||||||||||||
| 4 Years Later | 54,055,748 | 54,131,673 | 44,479,597 | 39,135,538 | 32,678,862 | 32,286,316 | 32,016,421 | |||||||||||||||||||||||||||||||||||||
| 5 Years Later | 52,443,534 | 51,927,804 | 40,337,061 | 36,817,185 | 30,888,052 | 31,377,789 | ||||||||||||||||||||||||||||||||||||||
| 6 Years Later | 50,931,469 | 48,468,874 | 38,638,138 | 35,588,729 | 29,752,608 | |||||||||||||||||||||||||||||||||||||||
| 7 Years Later | 48,219,250 | 47,449,344 | 38,027,276 | 35,015,456 | ||||||||||||||||||||||||||||||||||||||||
| 8 Years Later | 47,748,694 | 47,263,548 | 38,067,800 | |||||||||||||||||||||||||||||||||||||||||
| 9 Years Later | 47,690,494 | 47,243,847 | ||||||||||||||||||||||||||||||||||||||||||
| 10 Years Later | 47,743,214 | |||||||||||||||||||||||||||||||||||||||||||
| Cumulative Net Redundancy | $ | 22,333,216 | $ | 19,061,440 | $ | 20,771,217 | $ | 20,394,089 | $ | 19,990,773 | $ | 15,134,390 | $ | 11,184,161 | $ | 4,406,004 | $ | 2,916,135 | $ | 23,530 | ||||||||||||||||||||||||
| Gross Liability for Unpaid Losses and Loss Adjustment Expenses | $ | 93,596,117 | $ | 94,730,711 | $ | 78,654,590 | $ | 71,585,408 | $ | 61,559,695 | $ | 54,486,843 | $ | 49,784,725 | $ | 43,876,829 | $ | 44,396,558 | $ | 49,093,571 | $ | 47,055,787 | ||||||||||||||||||||||
| Ceded Liability for Unpaid Losses and Loss Adjustment Expenses | (23,519,687 | ) | (28,425,424 | ) | (19,815,573 | ) | (16,175,863 | ) | (11,816,314 | ) | (7,974,664 | ) | (6,584,143 | ) | (4,428,283 | ) | (5,162,775 | ) | (9,636,961 | ) | (9,520,970 | ) | ||||||||||||||||||||||
| Net Liability for Unpaid Losses and Loss Adjustment Expenses | $ | 70,076,430 | $ | 66,305,287 | $ | 58,839,017 | $ | 55,409,545 | $ | 49,743,381 | $ | 46,512,179 | $ | 43,200,582 | $ | 39,448,546 | $ | 39,233,783 | $ | 39,456,610 | $ | 37,534,817 | ||||||||||||||||||||||
| Gross Liability Re-estimated | $ | 59,000,851 | $ | 58,841,794 | $ | 47,094,523 | $ | 41,018,017 | $ | 34,907,962 | $ | 39,697,629 | $ | 43,252,250 | $ | 47,412,782 | $ | 47,129,312 | $ | 47,980,345 | ||||||||||||||||||||||||
| Ceded Liability Re-estimated | (11,257,637 | ) | (11,597,947 | ) | (9,026,723 | ) | (6,002,561 | ) | (5,155,354 | ) | (8,319,840 | ) | (11,235,829 | ) | (12,370,240 | ) | (10,811,664 | ) | (8,547,265 | ) | ||||||||||||||||||||||||
| Net Liability Re-estimated | $ | 47,743,214 | $ | 47,243,847 | $ | 38,067,800 | $ | 35,015,456 | $ | 29,752,608 | $ | 31,377,789 | $ | 32,016,421 | $ | 35,042,542 | $ | 36,317,648 | $ | 39,433,080 | ||||||||||||||||||||||||
| Cumulative Gross Redundancy (Deficiency) | $ | 34,595,266 | $ | 35,888,917 | $ | 31,560,067 | $ | 30,567,391 | $ | 26,651,733 | $ | 14,789,214 | $ | 6,532,475 | $ | (3,535,953 | ) | $ | (2,732,754 | ) | $ | 1,113,226 | ||||||||||||||||||||||
6 of 89
Net Written Premium to Statutory Surplus Ratio
The following table shows, for the periods indicated, Crusader's statutory ratio of net written premium (after reinsurance ceded) to statutory surplus. Since each property and casualty insurance company has different capital needs, an "acceptable" ratio of net written premium to statutory surplus for one company may be inapplicable to another. While there is no statutory requirement applicable to Crusader that establishes a permissible net premium to surplus ratio, guidelines established by the National Association of Insurance Commissioners (“NAIC”) provide that such ratio should generally be no greater than 3 to 1.
| Year ended December 31 | ||||||||||||||||||||
| Statutory Accounting Basis: | 2016 | 2015 | 2014 | 2013 | 2012 | |||||||||||||||
| Net written premium | $ | 32,624,522 | $ | 31,029,111 | $ | 27,784,290 | $ | 26,093,283 | $ | 27,391,289 | ||||||||||
| Statutory surplus | $ | 59,120,443 | $ | 61,367,728 | $ | 63,492,369 | $ | 61,411,166 | $ | 59,062,170 | ||||||||||
| Ratio | 0.6 to 1 | 0.5 to 1 | 0.4 to 1 | 0.4 to 1 | 0.5 to 1 | |||||||||||||||
Crusader’s results herein are reported in accordance with U.S. generally accepted accounting principles (“GAAP”). These results differ from Crusader’s financial results reported in accordance with Statutory Accounting Principles (“SAP”) as prescribed or permitted by insurance regulatory authorities. Crusader is required to file financial statements with insurance regulatory authorities prepared on a SAP basis.
SAP differs in certain respects from GAAP. The more significant of these differences that apply to Crusader are:
| · | Under GAAP, policy acquisition costs such as commissions, premium taxes and other costs incurred in connection with the successful acquisition of new and renewal business are capitalized and amortized on a pro rata basis over the period in which the related premium is earned, rather than expensed as incurred as required by SAP. |
| · | Certain assets included in balance sheets under GAAP are designated as “non-admitted assets” and are charged directly against statutory surplus under SAP. Non-admitted assets primarily include premium receivables that are outstanding over 90 days, federal deferred tax assets in excess of statutory limitations, furniture, equipment, leasehold improvements, and prepaid expenses. |
| · | Under GAAP, amounts related to ceded reinsurance are shown gross as prepaid reinsurance premium and reinsurance recoverable, rather than netted against unearned premium reserves and loss and loss adjustment expense reserves, respectively, as required by SAP. |
| · | Under GAAP, fixed maturity securities that are classified as available-for-sale are reported at estimated fair values, rather than at amortized cost or the lower of amortized cost or market, depending on the specific type of security, as required by SAP. |
| · | The differing treatment of income and expense items results in a corresponding difference in federal income tax expense. Under GAAP reporting, changes in deferred income taxes are reflected as an item of income tax benefit or expense. As required by SAP, federal income taxes are recorded as income tax benefit or expense when payable and deferred taxes, subject to limitations, are recognized but only to the extent that they do not exceed a specified percentage of statutory surplus. Changes in deferred taxes are recorded directly to statutory surplus. |
Regulation
The insurance company operation is subject to regulation by the California Department of Insurance (“CA DOI”) and by the insurance departments of other states in which Crusader is licensed. The insurance departments have broad regulatory, supervisory, and administrative powers. These powers relate primarily to the standards of solvency which must be met and maintained; the licensing of insurers and their agents; the nature and limitation of insurers' investments; the prior approval of rates, rules, and forms; the issuance of securities by insurers; periodic financial and market conduct examinations of the affairs of insurers; the annual and other reports required to be filed on the financial condition and results of operations of such insurers or for other purposes; and the establishment of reserves required to be maintained for unearned premium, losses, and other purposes. The regulations and supervision by the insurance departments are designed principally for the benefit of policyholders and not for the insurance company shareholders. The insurance departments may perform market conduct examinations of Crusader to ensure compliance with applicable laws and regulations with respect to rating, underwriting and claims handling practices. The most recent market conduct examination of Crusader was conducted by the CA DOI and covered the rating and underwriting practices in California during the period June 1, 2015, through August 31, 2015. The examination report was adopted by the CA DOI on January 9, 2017. All issues identified during the examination were resolved to the satisfaction of the CA DOI and Crusader. None of the issues identified during the examination had any material effect on Crusader. The CA DOI conducts periodic financial examinations of Crusader. During 2012, the CA DOI conducted a financial examination of Crusader’s December 31, 2011, statutory financial statements. On June 6, 2013, Crusader was notified that the report of examination was officially filed and became part of the records of the CA DOI. No comments or recommendations were identified in the report of examination dated June 6, 2013. In the fourth quarter of 2016, the CA DOI commenced a periodic financial examination of Crusader’s December 31, 2015, statutory financial statements. The Company does not have an expected date or cost for completion of that examination.
7 of 89
In December 1993, the NAIC adopted a Risk-Based Capital (“RBC”) Model Law for property and casualty companies. The RBC Model Law is intended to provide standards for calculating a variable regulatory capital requirement related to a company's current operations and its risk exposures (asset risk, underwriting risk, credit risk and off-balance sheet risk). These standards are intended to serve as a diagnostic solvency tool for regulators that establish uniform capital levels and specific authority levels for regulatory intervention when an insurer falls below minimum capital levels. The RBC Model Law specifies four distinct action levels at which a regulator can intervene with increasing degrees of authority over a domestic insurer if its RBC is equal to or less than 200% of its computed authorized control level RBC. A company's RBC is required to be disclosed in its statutory annual statement. The RBC is not intended to be used as a rating or ranking tool nor is it to be used in premium rate making or approval. Crusader’s adjusted capital at December 31, 2016, was 964% of the authorized control level RBC.
The following table sets forth the different levels of risk-based capital that may trigger regulatory involvement and the corresponding actions that may result.
| LEVEL | TRIGGER | CORRECTIVE ACTION | ||
| Company action level | Adjusted capital less than 200% of authorized control level | The insurer must submit a comprehensive plan to the insurance commissioner. | ||
| Regulatory action level | Adjusted capital less than 150% of authorized control level | In addition to above, insurer is subject to examination, analysis and specific corrective action. | ||
| Authorized control level | Adjusted capital less than 100% of authorized control level | In addition to both of the above, insurance commissioner may place insurer under regulatory control. | ||
| Mandatory control level | Adjusted capital less than 70% of authorized control level | Insurer must be placed under regulatory control. |
Insurance Regulatory Information System (“IRIS”) was developed by a committee of state insurance regulators primarily to assist state insurance departments in executing their statutory mandate to oversee the financial condition of insurance companies. IRIS helps those companies that merit highest priority in the allocation of the regulators’ resources on the basis of 13 financial ratios that are calculated annually. The analytical phase is a review of statutory annual statements and the financial ratios. The ratios and trends are valuable in pointing to companies likely to experience financial difficulties but are not themselves indicative of adverse financial condition. The ratio and benchmark comparisons are mechanically produced and are not intended to replace the state insurance departments’ own in-depth financial analysis or on-site examinations.
An unusual range of ratio results has been established from studies of the ratios of companies that have become insolvent or have experienced financial difficulties. In the analytical phase, companies that receive four or more financial ratio values outside the usual range are analyzed in order to identify those companies that appear to require immediate regulatory action. Subsequently, a more comprehensive review of the ratio results and an insurer’s statutory annual statement is performed to confirm that an insurer’s situation calls for increased or close regulatory attention.
In 2016, Crusader was outside the usual range on one of the 13 IRIS ratio tests. IRIS ratio test number 6 considers Crusader’s 2016 investment yield. An unusual value for that ratio is an investment yield equal to or greater than 6.5% or equal to or less than 3.0%. Primarily due to Crusader’s conservative investments, its 2016 investment yield, as computed for IRIS purposes, was 1.1%.
California Insurance Guarantee Association
The California Insurance Guarantee Association (“CIGA”) was created to provide for payment of claims for which insolvent insurers of most casualty lines are liable but which cannot be paid out of such insurers’ assets. The Company is subject to assessment by CIGA for its pro-rata share of such claims based on written premium in the particular line in the year preceding the assessment by insurers writing that line of insurance in California. Such assessments are based upon estimates of losses to be incurred in liquidating an insolvent insurer. Assessments are recouped through a mandated surcharge to policyholders the year after the assessment. No assessment was made by CIGA for the 2016, 2015, or 2014 calendar years.
8 of 89
Holding Company Act
Crusader is subject to regulation by the CA DOI pursuant to the provisions of the California Insurance Holding Company System Regulatory Act (the "Holding Company Act"). Pursuant to the Holding Company Act, the CA DOI may examine the affairs of Crusader at any time. Certain transactions defined to be of an extraordinary type may not be effected without the prior approval of the CA DOI. Such transactions include, but are not limited to, sales, purchases, exchanges, loans and extensions of credit, and investments made within the immediately preceding 12 months involving the lesser of 3% of admitted assets or 25% of statutory surplus as of the preceding December 31. An extraordinary transaction also includes a dividend which, together with other dividends or distributions made within the preceding 12 months, exceeds the greater of 10% of the insurance company's statutory surplus as of the preceding December 31 or the insurance company's net income for the preceding calendar year. An insurance company is also required to notify the CA DOI of any dividend after declaration, but prior to payment.
The Holding Company Act also provides that the acquisition or change of control of a California domiciled insurance company or of any person who controls such an insurance company cannot be consummated without the prior approval of the insurance commissioner. In general, a presumption of control arises from the ownership of voting securities and securities that are convertible into voting securities, which in the aggregate constitute 10% or more of the voting securities of a California insurance company or a person who controls a California insurance company, such as Crusader. A person seeking to acquire control, directly or indirectly, of the Company must generally file with the insurance commissioner an application for change of control containing certain information required by statute and published regulations and provide a copy of the application to the Company. The Holding Company Act also effectively restricts the Company from consummating certain reorganizations or mergers without prior regulatory approval. The Company is in compliance with the Holding Company Act.
Rating
Insurance companies are rated to provide both industry participants and insurance consumers with meaningful information on specific insurance companies. Higher ratings generally indicate financial stability and a strong ability to pay claims. These ratings are based upon factors relevant to policyholders and are not directed toward protection of investors. Such ratings are neither a rating of securities nor a recommendation to buy, hold or sell any security and may be revised or withdrawn at any time. Ratings focus primarily on the following factors: capital resources, financial strength, demonstrated management expertise in the insurance business, credit analysis, systems development, market segment position and growth opportunities, marketing, sales conduct practices, investment operations, minimum statutory surplus requirements and capital sufficiency to meet projected growth, as well as access to such traditional capital as may be necessary to continue to meet standards for capital adequacy.
The claims-paying abilities of insurers are rated to provide both insurance consumers and industry participants with comparative information on specific insurance companies. Claims-paying ratings are important for the marketing of certain insurance products.
On October 28, 2016, A.M. Best Company reaffirmed Crusader’s financial strength rating of A- (Excellent) and a rating outlook of “stable.” In addition, A.M. Best Company assigned Crusader an Issuer Credit Rating of a- (Excellent).
Terrorism Risk Insurance Act of 2002
On November 26, 2002, the Terrorism Risk Insurance Act of 2002 (the “Act”) was signed into law and set to expire on December 31, 2020. The Act establishes a program within the Department of the Treasury in which the federal government will share the risk of loss from acts of terrorism with the insurance industry. Federal participation will be triggered when the Secretary of the Treasury, in concurrence with the Secretary of State and the Attorney General of the United States, certifies an act to be an act of terrorism. No act shall be certified as an act of terrorism unless the terrorist act results in aggregate losses in excess of $5 million.
9 of 89
Under the Act, the federal government will pay 85% of covered terrorism losses exceeding the statutorily established deductible. All property and casualty insurance companies are required to participate in the program to the extent that they must make available property and casualty insurance coverage for terrorism that does not differ materially from the terms, amounts and other coverage limitations applicable to losses arising from events other than acts of terrorism.
The Company does not write policies on properties considered a target of terrorist activities such as airports, large hotels, large office structures, amusement parks, landmark defined structures, or other large scale public facilities. In addition, there is not a high concentration of policies in any one area where increased exposure to terrorist threats exist. Consequently, the Company believes its exposure relating to acts of terrorism is low. Crusader received $105,302, $93,839, and $86,532 in terrorism coverage premium from approximately 5% of its policyholders during the years ended December 31, 2016, 2015, and 2014, respectively. Crusader’s terrorism deductible was $6,980,486, $6,292,738, and $6,396,709 during the years ended December 31, 2016, 2015, and 2014, respectively. Crusader’s 2017 terrorism deductible is $7,490,724.
OTHER INSURANCE OPERATIONS
General Agency Operations
Unifax primarily sells and services commercial multiple peril business insurance policies for Crusader in California.
Bedford Insurance Services, Inc. (“Bedford”), a subsidiary of the Company, sold and serviced daily automobile rental policies. Bedford stopped selling and servicing the daily automobile rental polices in 2015.
As general agents, these subsidiaries market, rate, underwrite, inspect and issue policies, bill and collect insurance premiums, and maintain accounting and statistical data. Unifax is the exclusive general agent for Crusader. Bedford was a non-exclusive general agent for non-affiliated insurance companies. The Company's marketing is conducted through advertising to independent insurance agents and brokers. For its services, the general agent receives a commission (based on the written premium) from the insurance company and, in some cases, a policy fee from the customer. These subsidiaries hold licenses issued by the CA DOI and other states where applicable.
Insurance Premium Finance Operation
American Acceptance Corporation (“AAC”), a subsidiary of the Company, is a licensed insurance premium finance company that provides insurance purchasers with the ability to pay their insurance premium on an installment basis. The premium finance company pays the insurance premium to the insurance company in return for a premium finance note from the insured. These notes are paid off by the insured in nine monthly installments and are secured by the unearned premium held by the insurance company. AAC provides premium financing solely for Crusader policies that are produced by Unifax in California.
Association Operation
Insurance Club, Inc., dba AAQHC, An Administrator (“AAQHC”) (formally American Association for Quality Health Care), a subsidiary of the Company, is a membership association and a third party administrator. AAQHC provides various consumer benefits to its members, including participation in group dental, vision, and life insurance policies that it negotiates. AAQHC also provides services as a third party administrator and is licensed by the CA DOI. For these services, AAQHC receives membership and fee income from its members.
Health Insurance Operation
American Insurance Brokers, Inc. (“AIB”), a subsidiary of the Company, markets health insurance in California as a general agency and an independent broker through non-affiliated insurance companies for individuals and groups. The services provided consist of marketing, sales and customer service. For these services AIB receives commissions from insurance companies. AIB holds licenses issued by the CA DOI.
INVESTMENTS
The Company’s investment guidelines on equity securities limited investments in equity securities to an aggregate maximum of $2,000,000. The Company’s investment guidelines on fixed maturities limited those investments to high-grade obligations with a maximum term of eight years. The maximum investment authorized in any one issuer was $2,000,000. This dollar limitation excluded bond premium paid in excess of par value and U.S. government or U.S. government guaranteed issues. Investments in municipal securities were primarily pre-refunded and secured by U.S. treasury securities. The short-term investments were either U.S. government obligations, Federal Deposit Insurance Corporation (“FDIC”) insured, or were in an institution with a Moody's rating of at least P2 and/or a Standard & Poor's rating of A1. All of the Company's fixed maturity investment securities were rated, readily marketable and could be liquidated without any materially adverse financial impact.
10 of 89
On March 24, 2017, the Company’s Board of Directors approved new investment guidelines. Those guidelines are similar to what the Company believes are general investment guidelines used by Crusader’s peers.
Under the new investment guidelines, investments may only include U.S. treasury Notes, U.S. government agency notes, mortgage-backed securities (including pass through securities and collateralized mortgage obligations) that are backed by agency and non-agency collateral, commercial mortgage-backed securities, U. S. corporate obligations, asset backed securities, (including but not limited to credit card, automobile and home equity backed securities), tax-exempt bonds, preferred stocks, common stocks, commercial paper, repurchase agreements (treasuries only), mutual funds, exchange traded funds, bank certificates of deposits and time deposits. The new investment guidelines provide for certain investment limitations in each investment category.
Unless agreed to in advance in writing by Crusader, investments in the following types of securities are prohibited:
| • | Mortgage loans, except for mortgage backed securities issued by an agency of the U.S. government. | ||
| • | Derivative mortgage-backed securities including interest only, principal only and inverse floating rate securities. | ||
| • | All fixed maturity real estate securities, except mortgage-backed securities (including pass through securities and collateralized mortgage obligations) that are backed by agency and non-agency collateral and commercial mortgage-backed securities. | ||
| • | Options and futures contracts. | ||
| • | All non-US dollar denominated securities. | ||
| • | Any security that would not be in compliance with the regulations of Crusader’s state of domicile. |
Historically, the Company managed Crusader’s investments in-house. Effective April 1, 2017, an outside investment advisor will start managing Crusader’s investments. The advisor’s role will be limited to maintaining Crusader’s portfolio within the new investment guidelines and providing investment accounting services to the Company. The investments will continue to be held by Crusader’s current custodian, Union Bank Global Custody Services.
COMPETITION
Insurance Company and General Agency Operations (Property and Casualty)
The property and casualty markets in which the Company operates are highly competitive. Property and casualty insurers generally compete on many factors, including price, commission rates, consumer recognition, coverages offered, financial stability, customer service and geographic coverage. Competition is also affected by the pace of technological developments. An insurer’s ability to innovate, develop and implement new applications and other technology can affect its competitive position. The Company continues to invest in technology in order to compete more effectively in the insurance marketplace. The marketplace is highly cyclical, characterized by periods of high premium rates and shortages of underwriting capacity followed by periods of severe price competition and excess underwriting capacity.
The profitability of insurers is affected by many factors including premium adequacy, the frequency and severity of claims, state regulations, interest rates, general business conditions, and court decisions redefining and expanding the extent of coverage. One of the challenging and unique features of the property and casualty business is the fact that since premiums are collected before losses are paid, its products are normally priced before its costs are known.
Additional information regarding competition in the insurance marketplace is discussed in Item 7 - “Management’s Discussion and Analysis of Financial Condition and Results of Operations - Results of Operations.”
11 of 89
Insurance Premium Financing Operation
The insurance premium financing operation currently finances policies produced only through its sister company, Unifax. Consequently, AAC’s growth is primarily dependent on the growth of Crusader and Unifax business. Since July 2010, AAC has continued to offer 0% financing on policies produced by Unifax for Crusader. The Company monitors the cost of providing this incentive; and, depending on the cost/benefit determination, the Company can continue to offer 0% financing or withdraw it at any time.
Health Insurance Operation
The health insurance market is uncertain due to changes in healthcare insurance mandated by recent federal legislation. AIB provides a variety of health and life insurance products to individuals and groups. These same products are offered by most of our competitors; thus service, reliability and stability are important to obtain and retain customers.
EMPLOYEES
As of March 30, 2017, the Company employed 80 persons of which 79 are full time employees at its facility located in Calabasas, California. The Company has no collective bargaining agreements and believes its relations with its employees are excellent.
On March 27, 2019, the Company entered into amendment of amended and restatement employment agreement effective March 17, 2015, between the Company and Cary L. Cheldin. A complete copy of the amendment is attached to this Form 10-K as Exhibit 10.21.
Item 1A. Risk Factors.
The Company is subject to numerous risks and uncertainties, the outcome of which may impact future results of operations and financial condition.
Management divides these risks into three broad categories in assessing how they may affect our financial condition and operating results, as well as our ability to achieve our business objectives:
| • | Risks related to the Company’s business – the risks associated with day-to-day events that directly or indirectly may affect our insurance operations. |
| • | Risks related to the Company’s industry – the risks stemming from the insurance industry business and regulatory environment that directly or indirectly may affect our insurance operations. |
| • | Risks related to the Company’s stock – the risks resulting from financial results or regulatory actions or ownership and control that may have an adverse effect on the Company’s stock price and the Company’s shareholders. |
This information is not all encompassing and should be considered carefully together with the other information contained in this report and in the other reports and materials filed by us with the Securities and Exchange Commission (SEC), as well as news releases and other information the Company publicly disseminates from time to time.
RISKS RELATED TO THE COMPANY’S BUSINESS
Crusader is subject to minimum capital and surplus requirements, and any failure to meet these requirements could subject Crusader to regulatory action.
Crusader is subject to RBC standards and other minimum capital and surplus requirements imposed under applicable laws of its state of domicile. The RBC standards, based upon the Risk-Based Capital Model Act adopted by the NAIC, require Crusader to report the results of RBC calculations to state departments of insurance and the NAIC. If Crusader fails to meet these standards and requirements, the CA DOI may require specified actions to be taken.
The Company’s business is vulnerable to significant catastrophic property loss, which could have an adverse effect on its financial condition and results of operations.
The Company faces a significant risk of loss in the ordinary course of its business for property damage resulting from natural disasters, man-made catastrophes and other catastrophic events, particularly hurricanes, earthquakes, hail storms, explosions, tropical storms, fires, sinkholes, war, acts of terrorism, severe winter weather and other natural and man-made disasters. Such events typically increase the frequency and severity of commercial property claims. Because catastrophic loss events are by their nature unpredictable, historical results of operations may not be indicative of future results of operations, and the occurrence of claims from catastrophic events may result in substantial volatility in the Company’s financial condition and results of operations from period to period. Although the Company attempts to manage its exposure to such events, the occurrence of one or more major catastrophes in any given period could have a material and adverse impact on the Company’s financial condition and results of operations and could result in substantial outflows of cash as losses are paid.
12 of 89
Changes in accounting standards issued by the Financial Accounting Standards Board (“FASB”) or other standard-setting bodies may adversely affect the Company’s consolidated financial statements.
The Company’s consolidated financial statements are subject to the application of GAAP, which is periodically revised and/or expanded. Accordingly, the Company is required to adopt new or revised accounting standards from time to time issued by recognized authoritative bodies, including the FASB. It is possible that future changes the Company is required to adopt could change the current accounting treatment that the Company applies to its consolidated financial statements and that such changes could have a material effect on the Company’s financial condition and results of operations.
The Company may be required to adopt International Financial Reporting Standards (“IFRS”). The ultimate adoption of such standards could negatively impact its financial condition or results of operations.
Although not yet required, the Company could be required to adopt IFRS, which differs from GAAP, for the Company’s accounting and reporting standards. The ultimate implementation and adoption of new standards could materially impact the Company’s financial condition or results of operations.
The Company’s success may depend on its ability to adjust claims accurately.
Many factors can affect the Company’s ability to pay claims accurately, including the training, experience, and skill of the Company’s claims representatives, continued access to independent or outside adjusters, the extent of and ability to recognize and respond to fraudulent or inflated claims, the claims organization’s culture and the effectiveness of its management, the ability to develop or select and implement appropriate procedures, technologies, and systems to support claims functions. The Company’s failure to pay claims fairly, accurately, and in a timely manner, or to deploy claims resources appropriately, could result in unanticipated costs, lead to material litigation, undermine customer goodwill and the Company’s reputation in the marketplace, impair its brand image and, as a result, materially adversely affect its competitiveness, financial results, prospects, and liquidity.
Loss and loss adjustment expense reserves are based on estimates and may not be sufficient to cover future losses.
Loss and loss adjustment expense reserves represent an estimate of amounts needed to pay and administer claims with respect to insured events that have occurred, including events that have occurred but have not yet been reported to Crusader. There is a high level of uncertainty inherent in the evaluation of the required loss and loss adjustment expense reserves for Crusader. The long-tailed nature of liability claims and the volatility of jury awards exacerbate that uncertainty. Crusader sets loss and loss adjustment expense reserves at each balance sheet date based upon management’s best estimate of the ultimate payments that it anticipates will be made to settle all losses incurred and related loss adjustment expenses incurred as of that date for both reported and unreported losses. The ultimate cost of claims is dependent upon future events, the outcomes of which are affected by many factors. Crusader claim reserving procedures and settlement philosophy, current and perceived social and economic inflation, current and future court rulings and jury attitudes, improvements in medical technology, and many other economic, scientific, legal, political, and social factors all can have significant effects on the ultimate costs of claims. Changes in Crusader operations and management philosophy also may cause actual developments to vary from the past. Since the emergence and disposition of claims are subject to uncertainties, the net amounts that will ultimately be paid to settle claims may vary significantly from the estimated amounts provided for in the accompanying consolidated financial statements. Any adjustments to reserves are reflected in the operating results of the periods in which they are made.
Any inability of the Company to realize its deferred tax assets may have a materially adverse effect on the Company’s financial condition and results of operations.
The Company recognizes deferred tax assets and liabilities for the future tax consequences related to differences between the financial statement carrying amounts of existing assets and liabilities and the respective tax bases, and for tax credits. The Company evaluates its deferred tax assets for recoverability based on available evidence, including assumptions about future profitability, reversal patterns of recorded deferred tax assets and deferred tax liabilities, and capital gain generation. Although management believes that it is more-likely-than-not that the net deferred tax assets will be realized, some or all of the Company’s deferred tax assets could expire unused if the Company is unable to generate taxable income of a sufficient nature in the future to utilize them.
13 of 89
If the Company determines it is more-likely-than-not that it would not be able to realize all or a portion of its deferred tax assets in the future, the Company would reduce the deferred tax asset through a charge to earnings in the period in which the determination is made. This charge could have a materially adverse effect on the Company’s results of operations and financial condition. In addition, the assumptions used to make this determination are subject to change from period to period based on changes in tax laws or variances between the Company’s projected operating performance and actual results. As a result, management’s judgment is required in assessing the possible need for a deferred tax asset valuation allowance.
The Company’s success depends on its ability to accurately underwrite risks and to charge adequate premium to policyholders.
The Company’s financial condition, liquidity and results of operations largely depend on the Company’s ability to underwrite and set premium accurately for the risks it faces. Premium rate adequacy is necessary to generate sufficient premium to offset losses, loss adjustment expenses, underwriting expenses, and to earn a profit. In order to price its products accurately, the Company must collect and properly analyze a substantial volume of data; develop, test and apply appropriate rating formulas; closely monitor and timely recognize changes in trends; and project both severity and frequency of losses with reasonable accuracy. The Company’s ability to undertake these efforts successfully is subject to a number of risks and uncertainties, including, without limitation:
| • | Availability of sufficient reliable data. | ||
| • | Incorrect or incomplete analysis of available data. | ||
| • | Uncertainties inherent in estimates and assumptions. | ||
| • | Selection and application of appropriate rating formulae or other pricing methodologies. | ||
| • | Adoption of successful pricing strategies. | ||
| • | Prediction of policyholder retention (e.g., policy life expectancy). | ||
| • | Unanticipated court decisions, legislation or regulatory action. | ||
| • | Ongoing changes in the Company’s claim settlement practices. | ||
| • | Unexpected inflation. | ||
| • | Social changes, particularly those affecting litigation inclinations. |
Such risks may result in the Company’s pricing being based on outdated, inadequate, or inaccurate data, or inappropriate analyses, assumptions, or methodologies, and may cause the Company to estimate incorrectly future changes in the frequency or severity of claims. As a result, the Company could underprice risks, which would negatively affect the Company’s margins, or it could overprice risks, which could reduce the Company’s volume and competitiveness. In either event, the Company’s operating results, financial condition, and cash flow could be materially adversely affected.
Inability to obtain reinsurance or to collect ceded losses and loss adjustment expenses could adversely affect Crusader’s ability to write new policies.
The availability, amount and cost of reinsurance depend on market conditions and may vary significantly. Any decrease in the amount of Crusader’s reinsurance will increase the risk of loss and could materially adversely affect its business and financial condition. Ceded reinsurance does not discharge Crusader’s direct obligations under the policies it writes. Crusader remains liable to its policyholders even if it is unable to make recoveries that it believes it is entitled to under the reinsurance contracts. Losses may not be recovered from the reinsurers until claims are paid.
The insurance business is subject to extensive regulation and legislative changes, which may impact the manner in which the Company operates its business.
The insurance business is subject to extensive regulation by the insurance departments which have broad regulatory powers implemented to protect policyholders, not stockholders or other investors. These powers include, among other things, the ability to:
| • | Place limitations on Crusader’s investments and dividends. | ||
| • | Place limitations on Crusader’s ability to transact business with its affiliates. | ||
| • | Establish standards of solvency including minimum reserves and capital surplus requirements. | ||
| • | Prescribe the form and content of and to examine Crusader’s financial statements. |
14 of 89
Federal legislation currently does not directly impact the property and casualty business, but the business can be indirectly affected by changes in federal regulations. In addition, the U.S. Congress and other federal agencies from time to time consider whether federal regulation of U.S. insurers is necessary. The Company is unable to predict whether such laws will be enacted and how and to what extent this could affect the Company.
The extensive regulation may affect the cost of or demand for the Company’s products and may limit the ability to obtain rate increases or to take other actions that the Company might desire to do in order to increase its profitability.
Unico is a holding company that relies on its subsidiaries to satisfy its obligations.
As a holding company, Unico does not generate revenue sufficient to pay operating expenses or stockholders’ dividends. Consequently, Unico relies on the ability of its subsidiaries to meet its obligations. The ability of Crusader to pay dividends to Unico is regulated by state insurance laws, which limit the amount of, and in certain circumstances may prohibit the payment of, cash dividends. The inability of Crusader to pay dividends in an amount sufficient to enable Unico to meet its cash requirements could have a materially adverse effect on the Company’s results of operations, financial condition, and its ability to pay dividends to its shareholders.
A downgrade in the financial strength rating of the insurance company could reduce the amount of business it may be able to write.
Rating agencies rate insurance companies based on financial strength as an indication of an ability to pay claims. The financial strength rating of A.M. Best is subject to periodic review using, among other things, proprietary capital adequacy models and is subject to revision or withdrawal at any time. Insurance financial strength ratings are directed toward the concerns of policyholders and insurance agents and are not intended for the protection of investors. Any downgrade in Crusader’s A.M. Best rating could cause a reduction in the number of policies it writes and could have a materially adverse effect on the Company’s results of operations and financial position.
Intense competition could adversely affect the ability to sell policies at premium rates the Company deems adequate.
The Company faces significant competition which, at times, is intense. If the Company is unable to compete effectively, its business and financial condition could be materially adversely affected. Competition in the property and casualty marketplace is based on many factors including premiums charged, services provided, financial strength ratings assigned by independent rating agencies, speed of claims payments, reputation, perceived financial strength, technology, and general experience. The Company competes with regional and national insurance companies. Some competitors have greater financial, marketing, and management resources than the Company. Intense competitive pressure on prices can result from the actions of even a single large competitor. The Company uses its own proprietary premium rates to determine the price it charges for its property and casualty policies.
The Company’s earnings may be affected by changes in interest rates.
Investment income is an important component of the Company’s revenues and net income. The ability to achieve investment objectives is affected by factors that are beyond the Company’s control. Interest rates are highly sensitive to many factors, including governmental monetary policies and domestic and international economic and political conditions. Any significant decline in investment income as a result of falling interest rates or general market conditions may have an adverse effect on net income and, as a result, on the Company’s stockholders' equity and statutory surplus.
The outlook for the Company’s investment income is dependent on the future direction of interest rates and the amount of cash flows from operations that are available for investment. The fair values of fixed maturity investments that are "available-for-sale" fluctuate with changes in interest rates and cause fluctuations in stockholders' equity.
The Company’s investments may be subject to credit, prepayment and other risks.
The Company’s new investment guidelines allow investing in new classes of securities which are subject to additional risks. Rating errors by agencies, such as Moody’s, Standard & Poor’s, and Fitch, and/or economic downturn may create credit risk, a decline in interest rates may create prepayment risk, and a decrease in tax rates may reduce attractiveness of state and municipal bonds and may impact their market valuation. Any significant loss on investments or general market downturn may have an adverse effect on the Company’s stockholders' equity and statutory surplus and its business.
15 of 89
The Company’s geographic concentration ties its performance to the business, economic, and regulatory conditions in California.
The Company’s insurance business is concentrated in California (99.5%, 99.5% and 99.8% of direct written premium (before reinsurance ceded) in 2016, 2015 and 2014, respectively). Accordingly, unfavorable business, economic or regulatory conditions in the state of California could negatively impact the Company’s performance. In addition, California is exposed to severe natural perils, such as earthquakes and fires along with the possibility of terrorist acts. Accordingly, the Company could suffer losses as a result of catastrophic events.
The Company relies on independent insurance agents and brokers.
The failure or inability of independent insurance agents and brokers to market the Company’s insurance programs successfully could have a materially adverse effect on its business, financial condition and results of operations. Independent brokers are not obligated to promote the Company’s insurance programs and may sell competitors' insurance programs. The Company’s business largely depends on the marketing efforts of independent brokers and on the Company’s ability to offer insurance programs and services that meet the requirements of the customers of those brokers.
The Company’s reserve for doubtful accounts is based on estimates.
The Company may not be able to collect the premiums it estimates is collectible from its agents and brokers and, therefore, the Company’s reserve for doubtful accounts may not be sufficient.
Litigation may have an adverse effect on the Company’s business.
The insurance industry is the target of class action lawsuits and other types of litigation, some of which involve claims for substantial and/or indeterminate amounts and the outcomes of which are unpredictable. This litigation can be based on a variety of issues including insurance and claim settlement practices. Although the Company has not been the target of any specific class action lawsuits, it is possible that a lawsuit of this type could have a negative impact on the Company’s business.
The exclusions and limitations in the Company’s policies may not be enforceable.
Many of the Company’s policies include exclusions or other conditions that define and limit coverage; these exclusions and conditions are designed to manage the Company’s exposure to certain types of risks and expanding theories of legal liability. In addition, many of the Company’s policies limit the period during which a policyholder may bring a claim under the policy; this period in many cases is shorter than the statutory period under which these claims can be brought by the policyholders. While these exclusions and limitations help the Company assess and control its loss exposure, it is possible that a court or regulatory authority could nullify or void an exclusion or limitation, or legislation could be enacted modifying or barring the use of these exclusions and limitations. This could result in higher than anticipated losses and loss adjustment expenses by extending coverage beyond the Company’s underwriting intent or increasing the number or size of claims, which could have a materially adverse effect on the Company’s operating results. In some instances, these changes may not become apparent until sometime after the Company has issued the insurance policies that are affected by the changes. As a result, the full extent of liability under the Company’s insurance policies may not be known for many years after a policy is issued.
The Company relies on its information technology systems to manage many aspects of its business; and any failure of these systems to function properly or any interruption in their operation could result in a materially adverse effect on the Company’s business, financial condition and results of operations.
The Company depends on the security, accuracy, reliability, and proper functioning of its information technology systems. The Company relies on these information technology systems to effectively manage many aspects of its business, including underwriting, policy acquisition, claims processing and handling, accounting, reserving and actuarial processes and policies, and maintaining its policyholder data. The failure of hardware or software that supports the Company’s information technology systems or the loss of data contained in the systems could disrupt its business and could result in decreased premiums, increased overhead costs, and inaccurate reporting, all of which could have a materially adverse effect on the Company’s business, financial condition, and results of operations. In addition, despite system redundancy, the implementation of security measures and the existence of a disaster recovery plan for the Company’s information technology systems, these systems are vulnerable to damage or interruption from events such as:
16 of 89
| • | Earthquake, fire, flood, and other natural disasters. | ||
| • | Terrorism acts and attacks by computer viruses or hackers. | ||
| • | Power loss. | ||
| • | Unauthorized access. | ||
| • | Computer systems or data network failure. |
It is possible that a system failure, accident, security breach, or unauthorized internal or external knowledge, or misuse of confidential Company data could result in a material disruption to the Company’s business and reputation. In addition, substantial costs may be incurred to remedy the damages caused by these disruptions. To the extent that a critical system fails or is not properly implemented and the failure cannot be corrected in a timely manner, the Company may experience disruptions to the business that could have a materially adverse effect on the Company’s results of operations.
The Company’s disclosure controls and procedures may not prevent or detect all acts of fraud.
The Company’s disclosure controls and procedures are designed to reasonably ensure that information required to be disclosed in reports filed or submitted under the Securities Exchange Act is accumulated and communicated to management and is recorded, processed, summarized, and reported within the time periods specified in the SEC’s rules and forms. The Company’s management believes that any disclosure controls and procedures or internal controls and procedures, no matter how well conceived and operated, can provide only reasonable, not absolute, assurance that the objectives of the control system are met. Because of the inherent limitations in all control systems, they cannot provide absolute assurance that all control issues and instances of fraud, if any, within the Company have been prevented or detected. These inherent limitations include the realities that judgments in decision making can be faulty and that breakdowns can occur because of a simple error or mistake. Additionally, controls can be circumvented by the individual acts of some persons, by collusion of two or more people, or by an unauthorized override of the controls. The design of any system of controls also is based in part upon certain assumptions about the likelihood of future events, and the Company cannot ensure that any design will succeed in achieving its stated goals under all potential future conditions. Accordingly, because of the inherent limitations in a cost effective control system, misstatements due to error or fraud may occur and may not be detected.
Changes in general economic conditions may have an adverse effect on the Company’s revenues and profitability.
The Company’s financial condition and results of operations may be negatively impacted by national and local economic conditions, such as recessions, increased levels of unemployment, inflation and the disruption in the financial markets. The Company is not able to predict the effect of these factors or their duration and severity.
The Company depends on key personnel, the loss of which could negatively impact it business.
The Company’s current and future success is dependent to a large extent on the retention and continued service of its key personnel, which includes its executive officers. The loss or unavailability of any key personnel, which includes executive officers, could have an adverse effect on the Company’s financial condition and results of operations.
The ability of the Company to attract, develop and retain employees and to maintain appropriate staffing levels is critical to the Company’s success.
The Company must hire and train new employees and retain current employees to handle its operations. The failure of the Company to successfully hire and retain a sufficient number of skilled employees could have an adverse effect on the Company’s business.
The Company’s financial condition may be adversely affected if one or more parties that have significant contracts or relationships with the Company become insolvent, experience other financial difficulties, or default in the performance of obligations.
The Company’s business is dependent on the performance by third parties of their responsibilities under various contractual or services arrangements. These include, for example, contracts for the acquisition of goods and services (such as telecommunications and information technology facilities, equipment and support, and other systems and services that are integral to its operations), agreements with independent or outside claim adjusters, agreements with other insurance carriers to sell products that the Company does not offer, and arrangements for transferring certain risks (including reinsurance used in connection with certain insurance products and corporate insurance policies). The Company is also dependent on its dealings with banks and other financial institutions. If one or more of these parties were to default in the performance of their obligations or determine to abandon or terminate support for a system, product, or service that is significant to the Company’s business, it could suffer significant financial losses and operational interruptions or other problems, which could in turn adversely affect its financial performance, cash flows, or results of operations and cause damage to its brand and reputation.
17 of 89
Development or acquisition of new computer software may not be successfully completed or implemented.
The costs associated with the development or acquisition of new computer software may be impaired if not successfully completed or implemented. Such impairment could adversely impact the Company’s results of operations.
RISKS RELATED TO THE COMPANY’S INDUSTRY
The property casualty insurance industry is highly competitive, and the Company may not be able to compete effectively against larger and/or better capitalized companies.
The Company competes with many property and casualty insurance companies. Many of these competitors are better capitalized than the Company and have higher A.M. Best ratings. The superior capitalization of the competitors may enable them to offer lower rates, to withstand larger losses, and to more effectively take advantage of new marketing opportunities. The Company’s competition may also become increasingly better capitalized in the future as the traditional barriers between insurance companies and banks and other financial institutions erode and as the property and casualty industry continues to consolidate.
The Company may undertake strategic marketing and operating initiatives to improve its competitive position and drive growth. If the Company is unable to successfully implement new strategic initiatives or if the Company’s marketing campaigns do not attract new customers, the Company’s competitive position may be harmed, which could adversely affect the Company’s business and results of operations.
Regulation may become more extensive in the future, which may adversely affect the Company’s business, financial condition, and results of operations.
From time to time, the U.S. Congress and certain federal agencies investigate the current condition of the insurance industry to determine whether federal regulation is necessary. The Company cannot predict whether, and to what extent, new laws and regulations that would affect its business will be adopted, the timing of any such adoption and what effects, if any, they may have on the Company’s business, financial condition, and results of operations.
Crusader is subject to extensive regulations and supervision in the states in which it operates or is licensed to conduct business. These regulations are generally designed to protect the interests of policyholders and not necessarily the interests of insurers, their stockholders or other investors. The regulations relate to authorization for lines of business, capital and surplus requirements, investment limitations, underwriting limitations, transactions with affiliates, dividend limitations, changes in control, premium rates and a variety of other financial and nonfinancial components of an insurance company’s business.
Crusader, along with other licensed insurers, is required to bear a portion of the losses suffered by some insureds as the result of impaired or insolvent insurance companies. In addition, Crusader must participate in mandatory arrangements to provide various types of insurance coverage to individuals or other entities that otherwise are unable to purchase that coverage from private insurers. The effect of these and similar arrangements could reduce its profitability in any given period or limit its ability to grow the business.
The NAIC and state insurance regulators are continually reexamining existing laws and regulations, specifically focusing on modifications to statutory accounting principles, interpretations of existing laws and the development of new laws and regulations. The NAIC recently has undertaken a Solvency Modernization Initiative focused on updating the U.S. insurance solvency regulation framework, including capital requirements, governance and risk management, group supervision, accounting and financial reporting and reinsurance. On the federal level, the Dodd-Frank Act, enacted in July 2010, mandated significant changes to the regulation of U.S. insurance effective as of July 21, 2011. Currently, the impact of these regulations has not materially affected the Company’s business. Any proposed or future state or federal legislation or NAIC initiatives, if adopted, may be more restrictive on the ability of Crusader to conduct business and/or may result in higher costs.
18 of 89
RISKS RELATED TO THE COMPANY’S STOCK
The Company’s goal is to maximize the long-term value of the enterprise and thus does not focus on short-term earnings expectations.
The Company does not manage its business to maximize short-term stock performance. It also does not provide earnings estimates to the market and does not comment on earnings estimates by analysts. As a result, its reported results for a particular period may vary, perhaps significantly, from investors’ expectations, which could result in significant volatility in the price of its common shares.
In addition, due to the Company’s focus on the long-term value of an enterprise, it may undertake business strategies and establish related financial goals for a specific year that are designed to enhance its longer-term performance, while understanding that such strategies may not always similarly benefit short-term results, such as its annual underwriting profit or earnings per share.
The Company is controlled by a small number of shareholders who will be able to exert significant influence over matters requiring shareholder approval.
Messrs. Erwin Cheldin, Cary L. Cheldin, Lester A. Aaron and George C. Gilpatrick, who hold approximately 53.00% of the voting power of the Company, have agreed to vote the shares of common stock held by each of them so as to elect each of them to the Board of Directors and to vote on all other matters as they may agree. As a result of this agreement, the Company is a “Controlled Company” as defined in the NASDAQ Stock Market (NASDAQ) Listing Rules. A Controlled Company is exempt from the requirements of the NASDAQ Listing Rules requiring that (i) the Company have a majority of independent directors on the Board of Directors, (ii) the Compensation Committee be composed solely of independent directors, (iii) the compensation of the executive officers be determined by a majority of the independent directors or a compensation committee comprised solely of independent directors and (iv) director nominees be elected or recommended either by a majority of the independent directors or a nominating committee comprised solely of independent directors.
Accordingly, Messrs. Erwin Cheldin, Cary L. Cheldin, Lester A. Aaron, and George C. Gilpatrick have the ability to exert significant influence on the actions the Company may take in the future, including change of control transactions. This concentration of ownership may conflict with the interests of the Company’s other shareholders.
Failure to maintain an effective system of internal control over financial reporting may have an adverse effect on the Company’s stock price.
Section 404 of the Sarbanes-Oxley Act of 2002 and the related rules and regulations promulgated by the SEC require the Company to include in its Form 10-K a report by its management regarding the effectiveness of the Company’s internal control over financial reporting. The report includes, among other things, an assessment of the effectiveness of the Company’s internal control over financial reporting as of the end of its fiscal year, including a statement as to whether or not the Company’s internal control over financial reporting is effective. This assessment must include disclosure of any material weaknesses in the Company’s internal control over financial reporting identified by management. Areas of the Company’s internal control over financial reporting may require improvement from time to time. If management is unable to assert that the Company’s internal control over financial reporting is effective now or in any future period, investors may lose confidence in the accuracy and completeness of the Company’s financial reports, which could have an adverse effect on its stock price.
Insurance laws make it difficult to effect a change of control of the Company or the sale of any subsidiaries.
To acquire control of a U.S. insurance company or any holding company of a U.S. insurance company, prior written approval must be obtained from the Department of Insurance in the state where the insurer is domiciled. The Department of Insurance of the state will consider a number of factors relating to the acquirer and the transaction prior to granting approval of the application to acquire control of the insurer or the holding company. These laws and regulations may discourage potential acquisition proposals and may delay, deter or prevent a change of control of the Company or the sale by the Company of any of its insurance subsidiaries, including transactions that some or all of the Company’s shareholders might consider to be desirable.
19 of 89
Item 1B. Unresolved Staff Comments.
None.
Item 2. Properties.
On September 26, 2013, Crusader purchased land and a two-story building in Calabasas, California. The Company moved its home office to this location on October 9, 2015, and has been occupying the building through present time.
The office building has approximately 46,884 rentable square feet of office space. As of December 31, 2016, the Company utilized 32,403 square feet of space, while 10,292 square feet of the Calabasas building was leased to non-affiliated entities, and 4,189 square feet was vacant and available to be leased to non-affiliated entities.
Prior to October 9, 2015, the Company leased approximately 23,000 square feet of an office building located at 23251 Mulholland Drive, Woodland Hills, California. Erwin Cheldin, the Company's former president and a current director and principal stockholder, was the owner of the Woodland Hills building during the lease. The lease provided for an annual gross rent of $486,000 and was effective from April 1, 2012, through March 31, 2013. The lease provided for extension options at the same terms and conditions. The Company exercised its right to extend the lease through June 30, 2014, and the lease continued thereafter on a month-to-month basis. The Company believed that at the inception of the lease agreement, and at each subsequent extension, the terms of the lease were at least as favorable to the Company as could have been obtained from non-affiliated third parties. The Company utilized for its own operations 100% of the space it leased at the Woodland Hills building. The Company also leased storage space from Erwin Cheldin. Depending on usage, storage space rental was estimated to be approximately $15,000 annually. The total rent for the Woodland Hills building was $0, $406,796, and $501,258 for the years ended December 31, 2016, 2015, and 2014, respectively. The Company’s month-to-month lease of the home office in Woodland Hills, California, ended on October 15, 2015.
Item 3. Legal Proceedings.
The Company, by virtue of the nature of the business conducted by it, becomes involved in numerous legal proceedings in which it may be named as either plaintiff or defendant. Incidental actions are sometimes brought by customers or others that relate to disputes concerning the issuance or non-issuance of individual insurance policies or other matters. In addition, the Company resorts to legal proceedings from time to time in order to enforce collection of premiums, commissions, or fees for the services rendered to customers or to their agents. These routine items of litigation do not materially affect the Company’s operations and are handled on a routine basis through independent counsel.
On October 9, 2015, the Company filed a lawsuit in the United States District Court for the Central District of California against a software vendor, Insurance Systems, Inc. (ISI). Causes of action stated in the lawsuit included fraudulent inducement and intentional misrepresentation, negligent misrepresentation, negligence, violation of business and professional code, breach of implied warranty of merchantability, breach of implied warranty of fitness, breach of contract, and breach of implied covenant of good faith and fair dealings. The lawsuit sought an unspecified amount in monetary damages plus punitive damages against ISI. On May 16, 2016, ISI filed a countersuit against the Company for $1,792,398 for unpaid invoices plus damages for alleged breach of the contract related to implementation of the ISI computer software by the Company. On December 21, 2016, the Company reached an out of court settlement agreement with ISI on the lawsuit it filed against ISI on October 9, 2015, and the countersuit ISI filed against the Company on May 16, 2016, was dropped. The settlement agreement, net of related legal expenses, did not materially impact the Company’s financial condition or results of operations. The terms of the settlement agreement are confidential.
Item 4. Mine Safety Disclosures.
None.
20 of 89
PART II
Item 5. Market for Registrant's Common Equity, Related Stockholder Matters and
Issuer Purchases of Equity Securities.
The Company's common stock is traded on the NASDAQ Global Market under the symbol "UNAM." The high and low sales prices for each quarterly period in the two most recent fiscal years are as follows:
| Quarter Ended | High Price | Low Price | ||||||||
| March 31, 2015 | $ | 12.08 | $ | 8.23 | ||||||
| June 30, 2015 | $ | 12.04 | $ | 10.15 | ||||||
| September 30, 2015 | $ | 13.76 | $ | 8.35 | ||||||
| December 31, 2015 | $ | 10.82 | $ | 8.15 | ||||||
| March 31, 2016 | $ | 10.92 | $ | 9.15 | ||||||
| June 30, 2016 | $ | 12.39 | $ | 8.64 | ||||||
| September 30, 2016 | $ | 11.93 | $ | 10.17 | ||||||
| December 31, 2016 | $ | 11.50 | $ | 9.65 |
As of March 30, 2017, the number of shareholders of record of the Company's common stock was 223. That number does not include beneficial owners of the Company’s common stock held in the name of nominees.
There were no cash dividends declared or paid by the Company in the years ending December 31, 2016, 2015, and 2014. The Company considers its profitability, cash requirements and other factors prior to the declaration of cash dividends. Because the Company is a holding company and operates through its subsidiaries, its cash flow and, consequently, its ability to pay dividends are dependent upon the earnings and cash requirements of its subsidiaries and the distribution of those earnings to the Company. Also, the ability of Crusader to pay dividends to the Company is subject to certain regulatory restrictions under the Holding Company Act (see Item 1 – “Business - Insurance Company Operation - Holding Company Act”). Presently, without prior regulatory approval, Crusader may pay a dividend in any 12-month period to Unico up to the greater of (a) 10% of its statutory surplus or (b) its statutory net income for the preceding calendar year. Based on Crusader’s statutory surplus for the year ended December 31, 2016, the maximum dividend that could be made by Crusader to Unico without prior regulatory approval in 2017 is $5,912,044.
On December 19, 2008, the Board of Directors authorized a stock repurchase program to acquire, from time to time, up to an aggregate of 500,000 shares of the Company’s common stock. This program has no expiration date and may be terminated by the Board of Directors at any time. As of December 31, 2016, and December 31, 2015, the Company had remaining authority under the 2008 program to repurchase up to an aggregate of 188,655 and 197,467 shares of its common stock, respectively. The 2008 program is the only program under which there is authority to repurchase shares of the Company’s common stock. The Company repurchased 8,812 shares of stock during the year ended December 31, 2016, in unsolicited transactions at a cost of $89,582 of which $4,331 was allocated to capital and $85,251 was allocated to retained earnings. The Company repurchased 25,202 shares of stock during the year ended December 31, 2015, in unsolicited transactions at a cost of $242,314 of which $12,385 was allocated to capital and $229,929 was allocated to retained earnings. The Company did not repurchase any stock during the year ended December 31, 2014. The Company has or will retire all stock repurchased.
Performance Graph.
The following graph compares the cumulative total shareholder return on the Company's Common Stock with the cumulative total return of equity securities traded on the National Association of Securities Dealers Automated Quotation System (NASDAQ) and peer groups consisting of all NASDAQ property and casualty companies and all fire, marine and casualty companies (Standard Industrial Classification Code 6331). The comparison assumes $100.00 was invested on December 31, 2011, in the Company's Common Stock and in each of the comparison groups, and assumes reinvestment of dividends. It should be noted that this graph represents historical stock price performance and is not necessarily indicative of any future stock price performance.
21 of 89
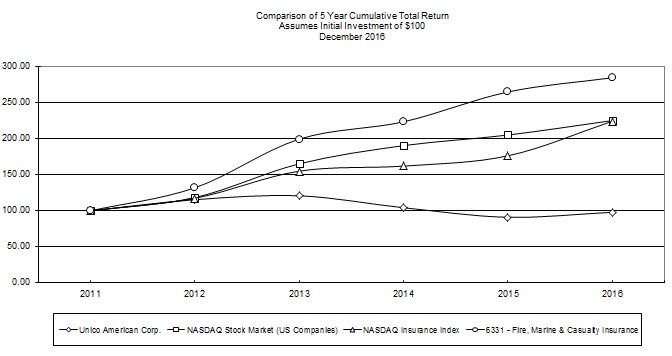
| 12/31/11 | 12/31/12 | 12/31/13 | 12/31/14 | 12/31/15 | 12/31/16 | |||||||||||||||||||
| Unico American Corp. | 100.00 | 115.23 | 120.69 | 104.20 | 91.00 | 97.92 | ||||||||||||||||||
| NASDAQ Stock Market (US) | 100.00 | 118.26 | 164.83 | 190.07 | 204.70 | 224.75 | ||||||||||||||||||
| NASDAQ Insurance Index | 100.00 | 117.27 | 154.78 | 161.79 | 176.01 | 223.79 | ||||||||||||||||||
| 6331 - Fire, Marine & Casualty Insurance | 100.00 | 131.79 | 199.03 | 223.07 | 264.30 | 283.95 |
Item 6. Selected Financial Data.
| Year ended December 31 | ||||||||||||||||||||
| 2016 | 2015 | 2014 | 2013 | 2012 | ||||||||||||||||
| Total revenues | $ | 35,267,724 | $ | 33,264,639 | $ | 30,470,240 | $ | 31,130,892 | $ | 32,756,570 | ||||||||||
| Total expenses | $ | 37,381,962 | $ | 34,999,597 | $ | 29,173,735 | $ | 29,890,117 | $ | 29,901,534 | ||||||||||
| Income (loss) before taxes | $ | (2,114,238 | ) | $ | (1,734,958 | ) | $ | 1,296,505 | $ | 1,240,775 | $ | 2,855,036 | ||||||||
| Net income (loss) | $ | (1,404,277 | ) | $ | (1,182,870 | ) | $ | 846,361 | $ | 603,668 | $ | 1,953,728 | ||||||||
| Basic earnings (loss) per share | $ | (0.26 | ) | $ | (0.22 | ) | $ | 0.16 | $ | 0.11 | $ | 0.37 | ||||||||
| Diluted earnings (loss) per share | $ | (0.26 | ) | $ | (0.22 | ) | $ | 0.16 | $ | 0.11 | $ | 0.36 | ||||||||
| Cash dividends per share | — | — | — | — | $ | 1.20 | ||||||||||||||
| Total assets | $ | 138,222,205 | $ | 140,170,435 | $ | 136,015,569 | $ | 132,853,188 | $ | 140,008,026 | ||||||||||
| Stockholders’ equity | $ | 68,906,640 | $ | 70,342,072 | $ | 71,775,094 | $ | 70,896,255 | $ | 70,396,565 | ||||||||||
Item 7. Management's Discussion and Analysis of Financial Condition and Results of Operations.
Forward Looking Statements
Certain statements contained herein, including the sections entitled “Business,” “Legal Proceedings” and “Management’s Discussion and Analysis of Financial Condition and Results of Operations” that are not historical facts are forward looking. These statements, which may be identified by forward looking words or phrases such as “anticipate,” “appear,” “believe,” “estimate,” “expect,” “intend,” “may,” “plan,” “should,” and “would” involve risks and uncertainties, many of which are beyond the control of the Company. Such risks and uncertainties could cause actual results to differ materially from these forward looking statements. Factors which could cause actual results to differ materially include: underwriting or marketing actions not being effective; rate increases for coverages not being sufficient; premium rate adequacy relating to competition or regulation; actual versus estimated claim experience; the outcome of rate change filings with regulatory authorities; acceptance by insureds of rate changes; adequacy of rate changes; changes in Crusader’s A.M. Best rating; regulatory changes or developments; the outcome of regulatory proceedings; unforeseen calamities; general market conditions; and the Company’s ability to introduce new profitable products.
22 of 89
Overview
General
Unico American Corporation is an insurance holding company that underwrites property and casualty insurance through its insurance company subsidiary; provides property, casualty, health and life insurance through its agency subsidiaries; provides insurance premium financing; and provides membership association services.
The Company’s net income (loss) was $(1,404,277), $(1,182,870), and $846,361 for the years ended December 31, 2016, 2015, and 2014, respectively.
This overview discusses some of the relevant factors that management considers in evaluating the Company's performance, prospects and risks. It is not all inclusive and is meant to be read in conjunction with the entirety of the management discussion and analysis, the Company's consolidated financial statements and notes thereto, and all other items contained within this Annual Report on Form 10-K.
Revenue and Income Generation
The Company receives its revenue primarily from earned premium derived from the insurance company operation, commission and fee income generated from the insurance agency operations, finance fee income from the premium finance operations, and investment income from cash generated primarily from the insurance company operation. The insurance company operation generated approximately 92%, 91%, and 90% of the Company’s total revenue for the years ended December 31, 2016, 2015, and 2014, respectively. The Company’s remaining operations constitute a variety of specialty insurance services, each with unique characteristics and individually not material to consolidated revenues.
Insurance Company Operation
As of December 31, 2016, Crusader was licensed as an admitted insurance carrier in the states of Arizona, California, Nevada, Oregon, and Washington. From 2004 until June 2014, all of Crusader’s business was written in the state of California. In June 2014, Crusader began writing business in the state of Arizona. During the years ended December 31, 2016, 2015, and 2014, 98% of Crusader’s business was commercial multi-peril policies. On October 28, 2016, A.M. Best Company reaffirmed Crusader’s financial strength rating of A- (Excellent) and a rating outlook of “stable.” In addition, A.M. Best Company assigned Crusader an Issuer Credit Rating of a- (Excellent).
The property and casualty insurance business is cyclical in nature, and the previous years have been characterized as a “soft market.” The conditions of a soft market include premium rates that are stable or falling and insurance is readily available. Contrarily, “hard market” conditions occur during periods in which premium rates rise and coverage may be more difficult to find. The Company believes that the California property and casualty insurance market is intensely competitive but relatively stable.
Written premium is a financial measure that is defined, under SAP, as the contractually determined amount charged by the insurance company to the policyholder for the effective period of the contract based on the expectation of risk, policy benefits, and expenses associated with the coverage provided by the terms of the policies. Written premium is a required statutory measure. Written premium is defined under GAAP in Accounting Standards Codification Topic 405, “Liabilities,” as “premiums on all policies an entity has issued in a period.” Earned premium, the most directly comparable GAAP measure, represents the portion of written premium that is recognized as income in the financial statements for the period presented and earned on a pro-rata basis over the terms of the policies.
The following is a reconciliation of net written premium to net earned premium:
| Year ended December 31 | ||||||||||||
| 2016 | 2015 | 2014 | ||||||||||
| Net written premium | $ | 32,624,522 | $ | 31,029,111 | $ | 27,784,290 | ||||||
| Change in net unearned premium | (1,268,151 | ) | (1,455,315 | ) | (1,140,867 | ) | ||||||
| Net earned premium | $ | 31,356,371 | $ | 29,573,796 | $ | 26,373,423 | ||||||
23 of 89
For the year ended December 31, 2016, direct written premium as reported on Crusader’s statutory financial statement was $38,749,097 compared to $36,374,509, for the year ended December 31, 2015, an increase of $2,374,588 (6.5%). For the year ended December 31, 2015, direct written premium as reported on Crusader’s statutory financial statement was $36,374,509 compared to $32,810,088, for the year ended December 31, 2014, an increase of $3,564,421 (11%). The property casualty insurance marketplace continues to be intensely competitive. While Crusader attempts to meet such competition with competitive prices, its emphasis is on service, promotion, and distribution. Crusader believes that rate adequacy is more important than premium growth and that underwriting profit (net earned premium less losses and loss adjustment expenses and policy acquisition costs) is its primary goal. Nonetheless, Crusader believes that it can grow its sales and profitability by focusing upon five areas of its operations: (1) product development, (2) improved service to highly-specialized retail brokers, (3) appointment of highly-specialized independent retail agents, (4) geographical expansion, and (5) use of alternative marketing channels. While the Company’s PAS continues to support the Company’s current operations, the Company believes it would realize more competitive parity with respect to product and service by supplementing instead of replacing its existing PAS, on a short-term basis, as quickly as possible, while also working on a longer-term basis to ultimately replace its existing PAS with a more contemporary platform. To help make that determination, during 2016, the Company engaged outside IT advisors to evaluate the Company’s current IT environment and its alternatives.
The following table shows the direct written premium production by state:
| Year ended December 31 | ||||||||||||||
| 2016 | 2015 | 2014 | ||||||||||||
| California | 99.5 | % | 99.5 | % | 99.8 | % | ||||||||
| Arizona | 0.5 | % | 0.5 | % | 0.2 | % | ||||||||
| Total | 100.0 | % | 100.0 | % | 100.0 | % | ||||||||
The insurance company operation underwriting profitability is defined by pre-tax underwriting profit which is calculated as net earned premium less losses and loss adjustment expenses and policy acquisition costs. Crusader’s underwriting profit (before income taxes) is as follows:
| Year ended December 31 | ||||||||||||
| 2016 | 2015 | 2014 | ||||||||||
| Net written premium | $ | 32,624,522 | $ | 31,029,111 | $ | 27,784,290 | ||||||
| Change in net unearned premium | (1,268,151 | ) | (1,455,315 | ) | (1,410,867 | ) | ||||||
| Net earned premium | 31,356,371 | 29,573,796 | 26,373,423 | |||||||||
| Less: | ||||||||||||
| Losses and loss adjustment expenses | 22,826,878 | 19,163,316 | 14,617,118 | |||||||||
| Policy acquisition costs | 6,895,149 | 6,465,232 | 5,986,108 | |||||||||
| Total | 29,722,027 | 25,628,548 | 20,603,226 | |||||||||
| Underwriting profit (before income taxes) | $ | 1,634,344 | $ | 3,945,248 | $ | 5,770,197 | ||||||
The insurance company operation combined ratio is the sum of (1) the ratio of net losses and loss adjustment expenses incurred (including a provision for IBNR) to net earned premium (loss ratio) and (2) the ratio of policy acquisition costs to net earned premium (expense ratio). If the combined ratio is below 100%, an insurance company has an underwriting profit; if it is above 100%, the company has an underwriting loss.
The following table shows the loss ratios, expense ratios, and combined ratios of Crusader as derived from data prepared in accordance with GAAP:
| Year ended December 31 | ||||||||||||
| 2016 | 2015 | 2014 | ||||||||||
| Loss ratio | 73 | % | 65 | % | 55 | % | ||||||
| Expense ratio | 22 | % | 22 | % | 23 | % | ||||||
| Combined ratio | 95 | % | 87 | % | 78 | % | ||||||
24 of 89
The following table provides an analysis of the losses and loss adjustment expenses:
| Year ended December 31 | ||||||||||||
| 2016 | 2015 | 2014 | ||||||||||
| Losses and loss adjustment expenses | ||||||||||||
| Provision for insured events of current year | $ | 22,850,408 | $ | 21,607,628 | $ | 17,925,882 | ||||||
| Development of insured events of prior years | (23,530 | ) | (2,444,312 | ) | (3,308,764 | ) | ||||||
| Total losses and loss adjustment expenses | $ | 22,826,878 | $ | 19,163,316 | $ | 14,617,118 | ||||||
Other Insurance Operations
The Company’s other insurance operations generate commissions and fees from various insurance products. The events that have the most significant economic impact are as follows:
Unifax sells and services insurance policies for Crusader. The commissions paid by Crusader to Unifax are eliminated as intercompany transactions and are not reflected as income in the Company’s consolidated financial statements. Policy fee income for the year ended December 31, 2016, decreased $14,479 (1%) as compared to the year ended December 31, 2015. Policy fee income for the year ended December 31, 2015, increased $87,074 (5%) as compared to the year ended December 31, 2014. The policy fee income is earned ratably over the life of related insurance policies.
The health insurance market is uncertain due to changes in healthcare insurance mandated by recent federal legislation. AIB is contracted with non-affiliated insurance carriers to provide a variety of health and life insurance products to individuals and groups. These same products are offered by most of our competitors; thus, service, reliability and stability are important to obtain and retain customers. AAQHC, as a membership association and third party administrator, has negotiated group dental, vision, and life insurance premiums for its members with several carriers and receives fees and dues from its members for access to these benefits. AIB underwrites these risks and receives a commission from the insurance carriers.
AIB’s commissions decreased $860 (less than 1%) for the year ended December 31, 2016, as compared to the year ended December 31, 2015. AIB’s commissions decreased $121,742 (11%) for the year ended December 31, 2015, as compared to the year ended December 31, 2014, as a result of decreases in the number of group accounts it underwrites and decreases in commission rates on individual and group policies.
AAQHC’s fee income decreased $10,511 (12%) for the year ended December 31, 2016, as compared to the year ended December 31, 2015, as a result of a decrease in the number of association members enrolled in AAQHC. AAQHC’s fee income decreased $11,802 (12%) for the year ended December 31, 2015, as compared to the year ended December 31, 2014, as a result of a decrease in the number of association members enrolled in AAQHC. AAQHC membership is primarily comprised of individuals included in group accounts.
The insurance premium financing operation currently finances policies written only through its sister company, Unifax. Since July 2010, AAC has offered 0% financing on policies written by Unifax for Crusader as a promotion to increase the sale of Crusader policies. The Company monitors the cost of providing this incentive, and, depending on the cost/benefit determination, the Company can continue to offer 0% financing or withdraw it at any time. AAC issued 3,087, 3,314, and 3,278 loans in 2016, 2015, and 2014, respectively. Revenue earned in 2016, 2015, and 2014 consisted entirely of late fees and other miscellaneous fees charged. The average policy premium financed by AAC was $4,334, $3,733, and $3,492 in 2016, 2015, and 2014, respectively.
The daily automobile rental insurance program was produced by Bedford. Bedford received commission income from non-affiliated insurance companies based on written premium and continues to receive contingent commission on previous business written. The Company no longer actively markets this program. As a result, the daily automobile rental insurance program commission income and contingent commission for the year ended December 31, 2016, decreased $9,589 (52%) compared to the year ended December 31, 2015. For the year ended December 31, 2015, rental insurance program commission income and contingent commission decreased $97,752 (84%) compared to the year ended December 31, 2014.
25 of 89
Investments and Liquidity
The Company generates investment income from its total invested assets of $90,576,445 and $97,843,530 (at amortized cost) as of December 31, 2016 and 2015, respectively, and from two cash deposits placed with the Los Angeles Superior Court by Crusader in lieu of appeal bonds. These deposits, totaling $13,373,793, were made on December 28, 2015, for $7,924,178 and on March 21, 2016, for $5,449,615, and their respective balances were included in “Cash and restricted cash” on the Consolidated Balance Sheet and were not a part of the total invested assets as of December 31, 2016, and December 31, 2015, respectively.
Investment income included in insurance company operation and other insurance operations, excluding realized investment losses, for the year ended December 31, 2016, increased $401,782 (84%) as compared to the year ended December 31, 2015. The increase in the investment income was due partially to $113,394 interest earned on the cash deposits in lieu of appeal bonds during the year ended December 31, 2016, and no such interest earned for the years ended December 31, 2015 and 2014. The increase in the investment income was also due to an increase in the Company’s annualized yield on average invested assets to 0.81% in 2016 from 0.47% in 2015 (the interest on the two cash deposits in lieu of appeal bonds is excluded from the yield computation). The increase in the annualized yield on average invested assets is primarily a result of a decrease in short-term investments and an increase in fixed maturity investments that provide a higher yield. Investment income, excluding realized investment losses, for the year ended December 31, 2015, increased $317,626 (196%) as compared to the year ended December 31, 2014. The increase in investment income was due primarily to an increase in the Company’s annualized yield on average invested assets to 0.47% in 2015 from 0.15% in 2014. The increase in the annualized yield on average invested assets is primarily a result of a decrease in short-term investments and an increase in fixed maturity investments that provide a higher yield. Due to the current interest rate and financial market environment, management believes it is prudent to purchase fixed maturity investments with maturities of 5 years or less and with minimal credit risk.
The weighted average maturity of the Company’s fixed maturity investments was 1.0 year, 1.5 years, and 1.8 years as of December 31, 2016, 2015, and 2014, respectively.
Liquidity and Capital Resources
The Company reported net cash used by operating activities for each of the years ended December 31, 2016 and 2015, and net cash provided by operating activities for the year ended December 31, 2014. Cash used by operating activities in 2016 was $1,409,242 compared to $49,533 in 2015. Cash used by operating activities in 2015 was $49,533 compared to cash provided by operating activities in 2014 of $2,468,186.
Fluctuations in cash flows from operating activities relate to the timing of the collection and the payment of insurance-related receivables and payables. The variability of the Company’s losses and loss adjustment expenses is primarily due to its small population of claims which may result in greater fluctuations in claim frequency and/or severity. Although the Consolidated Statements of Cash Flows reflect net cash used by operating activities for the years ended December 31, 2016 and 2015, the Company does not anticipate future liquidity problems and continues to be well capitalized and adequately reserved.
The most significant liquidity risk faced by the Company is adverse development of the insurance company’s loss and loss adjustment expense reserves. Based on the Company’s current loss and loss expense reserves and expected current and future payments, the Company believes that there are no current liquidity issues. However, no assurance can be given that the Company’s estimate of ultimate loss and loss adjustment expense reserves will be sufficient.
Crusader generates a significant amount of cash as a result of its holdings of unearned premium reserves, its reserves for loss and loss adjustment expense payments and its capital and surplus. Crusader's loss and loss adjustment expense payments are the most significant cash flow requirement of the Company. These payments are continually monitored and projected to ensure that the Company has the liquidity to cover these payments without the need to liquidate its investments. Cash, restricted cash, and investments (at amortized cost) of the Company at December 31, 2016, were $104,072,824 compared to $106,102,203 at December 31, 2015. Crusader's cash, restricted cash, and investments were 99% of the total cash and investments held by the Company as of December 31, 2016 and 2015.
26 of 89
As of December 31, 2016, all of the Company’s investments are in U.S. treasury securities, FDIC insured certificates of deposit and money market funds. The Company’s investments in U.S treasury securities and money market funds are readily marketable. The weighted average maturity of the Company’s investments is approximately 1.0 year.
The Company's investments are as follows:
| December 31, 2016 | December 31, 2015 | |||||||||||||||
| Amount | % | Amount | % | |||||||||||||
| Fixed maturities (at amortized cost) | ||||||||||||||||
| U.S. treasury securities | $ | 19,091,842 | 24 | $ | 24,075,727 | 29 | ||||||||||
| Certificates of deposit | 61,280,000 | 76 | 58,127,000 | 71 | ||||||||||||
| Total fixed maturity investments | 80,371,842 | 100 | 82,202,727 | 100 | ||||||||||||
| Short-term cash investments (at cost) | ||||||||||||||||
| U.S. treasury bills | — | — | 9,987,803 | 64 | ||||||||||||
| U.S. government money market fund | 8,542,292 | 84 | 3,357,842 | 21 | ||||||||||||
| Certificates of deposit | 1,098,000 | 11 | 1,346,000 | 9 | ||||||||||||
| Bank money market accounts | 562,548 | 5 | 947,395 | 6 | ||||||||||||
| Bank savings accounts | 1,763 | — | 1,763 | — | ||||||||||||
| Total short-term cash investments | 10,204,603 | 100 | 15,640,803 | 100 | ||||||||||||
| Total investments | $ | 90,576,445 | $ | 97,843,530 | ||||||||||||
The Company is required to classify its investment securities into one of three categories: held-to-maturity, available-for-sale, or trading securities. Although all of the Company's investments in fixed maturity securities are classified as available-for-sale and, while the Company may sell investment securities from time to time in response to economic and market conditions, its investment guidelines place primary emphasis on buying and holding high-quality investments to maturity.
The Company’s investment guidelines on equity securities limited investments in equity securities to an aggregate maximum of $2,000,000. The Company’s investment guidelines on fixed maturities limited those investments to high-grade obligations with a maximum term of eight years. The maximum investment authorized in any one issuer was $2,000,000. This dollar limitation excluded bond premium paid in excess of par value and U.S. government or U.S. government guaranteed issues. Investments in municipal securities were primarily pre-refunded and secured by U.S. treasury securities. The short-term investments were either U.S. government obligations, Federal Deposit Insurance Corporation (“FDIC”) insured, or were in an institution with a Moody's rating of at least P2 and/or a Standard & Poor's rating of A1. All of the Company's fixed maturity investment securities were rated, readily marketable, and could be liquidated without any materially adverse financial impact.
On March 24, 2017, the Company’s Board of Directors approved new investment guidelines. Those guidelines are similar to what the Company believes are general investment guidelines used by Crusader’s peers.
Under the new investment guidelines, investments may only include U.S. treasury Notes, U.S. government agency notes, mortgage-backed securities (including pass through securities and collateralized mortgage obligations) that are backed by agency and non-agency collateral, commercial mortgage-backed securities, U. S. corporate obligations, asset backed securities, (including but not limited to credit card, automobile and home equity backed securities), tax-exempt bonds, preferred stocks, common stocks, commercial paper, repurchase agreements (treasuries only), mutual funds, exchange traded funds, bank certificates of deposits and time deposits. The new investment guidelines provide for certain investment limitations in each investment category.
Unless agreed to in advance in writing by Crusader, investments in the following types of securities are prohibited:
| • | Mortgage loans, except for mortgage backed securities issued by an agency of the U.S. government. | ||
| • | Derivative mortgage-backed securities including interest only, principal only and inverse floating rate securities. | ||
| • | All fixed maturity real estate securities, except mortgage-backed securities (including pass through securities and collateralized mortgage obligations) that are backed by agency and non-agency collateral and commercial mortgage-backed securities. | ||
| • | Options and futures contracts. | ||
| • | All non-US dollar denominated securities. | ||
| • | Any security that would not be in compliance with the regulations of Crusader’s state of domicile. |
27 of 89
Historically, the Company managed Crusader’s investments in-house. Effective April 1, 2017, an outside investment advisor will start managing Crusader’s investments. The advisor’s role will be limited to maintaining Crusader’s portfolio within the new investment guidelines and providing investment accounting services to the Company. The investments will continue to be held by Crusader’s current custodian, Union Bank Global Custody Services.
The investment marketplace in general, and in certain asset classes specifically, have been impacted by volatility as a result of uncertainty in the credit markets that began in 2007 and continued throughout 2016. The Company’s fixed maturity (amortized cost) investment portfolio as of December 31, 2016, consisted of 24% U.S. treasury securities and 76% FDIC insured certificates of deposit.
Crusader's statutory capital and surplus as of December 31, 2016, was $59,120,443, a decrease of $2,247,285 (4%) from December 31, 2015. Crusader's statutory capital and surplus as of December 31, 2015, was $61,367,728, a decrease of $2,124,641 (3%) from December 31, 2014. In the years ending December 31, 2016, 2015, and 2014, Crusader issued cash dividends of $2,000,000, $3,000,000, and $0 to Unico, its parent and sole shareholder, respectively. These dividends were used primarily for general corporate purposes. Based on Crusader’s statutory surplus for the year ended December 31, 2016, the maximum dividend that could be made by Crusader to Unico without prior regulatory approval in 2017 is $5,912,044.
During the years ended December 31, 2016, 2015, and 2014, no cash dividends were declared or issued by the Company to its shareholders. Declaration of future cash dividends will be subject to the Company’s profitability and its cash requirements.
On December 19, 2008, the Board of Directors authorized a stock repurchase program to acquire, from time to time, up to an aggregate of 500,000 shares of the Company’s common stock. This program has no expiration date and may be terminated by the Board of Directors at any time. As of December 31, 2016, and December 31, 2015, the Company had remaining authority under the 2008 program to repurchase up to an aggregate of 188,655 and 197,467 shares of its common stock, respectively. The 2008 program is the only program under which there is authority to repurchase shares of the Company’s common stock. The Company repurchased 8,812 shares of stock during the year ended December 31, 2016, in unsolicited transactions at a cost of $89,582 of which $4,331 was allocated to capital and $85,251 was allocated to retained earnings. The Company repurchased 25,202 shares of stock during the year ended December 31, 2015, in unsolicited transactions at a cost of $242,314 of which $12,385 was allocated to capital and $229,929 was allocated to retained earnings. The Company did not repurchase any stock during the year ended December 31, 2014. The Company has or will retire all stock repurchased.
One of the Company’s agents, which was appointed in 2008 to assist the Company in implementing its Trucking Program, failed to pay the net premium and policy fees due Unifax, the exclusive general agent for Crusader. The agent was initially late in paying its February 2009 production that was due to Unifax on April 15, 2009. In May 2009, as a result of the agent’s failure to timely pay its balance due to Unifax, the Company terminated its agency agreement and assumed ownership and control of that agent’s policy expirations written with the Company. The Company subsequently commenced legal proceedings against the agent corporation, its three principals (who personally guaranteed the agent’s obligations) and another individual for the recovery of the balance due and any related recovery costs incurred. All related recovery costs have been expensed as incurred. The agent corporation and two of its principals filed bankruptcy. The corporation was adjudicated bankrupt. The Company obtained judgments, non-dischargeable in bankruptcy, for the full amount due from the two principals who filed bankruptcy. The other principal stipulated to a judgment of $1,200,000. The claim against the fourth individual was resolved. The Company collected $0, $0, and $75,000 during the years ended December 31, 2016, 2015, and 2014. As of December 31, 2016 and 2015, the agent’s balance due to Unifax was $1,181,272. As of December 31, 2016 and 2015, the Company’s bad debt reserve associated with this matter was $1,181,272 which represents approximately 100% of the balance due to Unifax. Although the receivable is fully reserved for financial reporting purposes at December 31, 2016, the Company continues to pursue collection of the judgments from the three principals. Bad debt expense was $5,833, $(1,460), and $255,299 for the years ended December 31, 2016, 2015, and 2014, respectively.
28 of 89
Although material capital expenditures may also be funded through borrowings, the Company believes that its cash and short-term investments at December 31, 2016, net of statutory deposits of $700,000, restricted cash of $13,373,793, and California insurance company statutory dividend restrictions applicable to Crusader plus the cash to be generated from operations, should be sufficient to meet its operating requirements during the next 12 months without the necessity of borrowing funds. Trust restrictions on cash and short-term investments were $0 at December 31, 2016 and December 31, 2015.
As a California insurance company, Crusader is obligated to pay a premium tax on direct written premium in all states that Crusader is admitted. Premium taxes are deferred and amortized as the related premium is earned. The premium tax is in lieu of state franchise taxes and is not included in the provision for state taxes.
The Company had certain contractual obligations at December 31, 2016, as follows:
| Contractual Obligations | Total | Within 1 Year | 1-3 Years | 3-5 Years | After 5 years | |||||||||||||||
| Loss and loss adjustment expense reserves* | $ | 47,055,787 | $ | 19,264,248 | $ | 21,479,211 | $ | 4,854,025 | $ | 1,458,303 | ||||||||||
| Total | $ | 47,055,787 | $ | 19,264,248 | $ | 21,479,211 | $ | 4,854,025 | $ | 1,458,303 | ||||||||||
*Unlike many other forms of contractual obligations, loss and loss adjustment expense reserves do not have definitive payment due dates, and the ultimate payment dates are subject to a number of variables and uncertainties. As a result, the total loss and loss adjustment expense reserve payments to be made by period, as shown above, are estimates.
Results of Operations
General
Total revenue was $35,267,724, $33,264,639, and $30,470,240 for the years ended December 31, 2016, 2015, and 2014, respectively. This represents an increase of $2,003,085 (6%) for the 2016 year compared to the 2015 year and an increase of $2,794,399 (9%) for the 2015 year compared to the 2014 year. The Company had net loss of $1,404,277 and $1,182,870 for the years ended December 31, 2016 and 2015, respectively, and net income of $846,361 for the year ended December 31, 2014. This represents an increase in net loss of $221,407 (19%) for the 2016 year compared to the 2015 year and a decrease in net income of $2,029,231 (240%) for the 2015 year compared to the 2014 year.
During the year ended December 31, 2015, the Company concluded that a charge for impairment of the Company’s capitalized computer software costs, related to a PAS contract entered into on November 1, 2012, was required under GAAP. The decision to impair the asset was based on the Company’s beliefs that the software had not achieved and would not be able to achieve the Company’s expected implementation targets and that the Company was unable to renegotiate the terms of its agreement with the software vendor. This impairment amounted to $1,287,460. There were no comparable charges in 2016 or 2014.
For the year ended December 31, 2016, the Company had a loss before taxes of $2,114,238 compared to a loss before taxes of $1,734,958 for the year ended December 31, 2015, an increase in the loss before taxes of $379,280 (22%). This increase in the loss before taxes was due primarily to increased losses and loss adjustment expenses partially offset by an increase in total revenues and a reduction in other operating expenses.
For the year ended December 31, 2015, the Company had a loss before taxes of $1,734,958 compared to an income before taxes of $1,296,505 for the year ended December 31, 2014, a decrease in the income before taxes of $3,031,463 (234%). This decrease in income before taxes was due primarily to increased losses and loss adjustment expenses and the impairment of the Company’s capitalized computer software costs, partially offset by an increase in total revenues.
The effect of inflation on the Company’s net income during the years ended December 31, 2016, 2015, and 2014 was not significant.
The Company derives revenue from various sources as discussed below.
29 of 89
Insurance Company Operation
Premium and loss information of Crusader are as follows:
| Year ended December 31 | ||||||||||||
| 2016 | 2015 | 2014 | ||||||||||
| Direct written premium (before reinsurance ceded) | $ | 38,749,097 | $ | 36,374,509 | $ | 32,810,088 | ||||||
| Net written premium (net of reinsurance ceded) | $ | 32,624,522 | $ | 31,029,111 | $ | 27,784,290 | ||||||
| Direct earned premium (before reinsurance ceded) | $ | 37,453,619 | $ | 34,902,435 | $ | 31,463,691 | ||||||
| Net earned premium (net of reinsurance ceded) | $ | 31,356,371 | $ | 29,573,796 | $ | 26,373,423 | ||||||
| Losses and loss adjustment expenses | $ | 22,826,878 | $ | 19,163,316 | $ | 14,617,118 | ||||||
| Gross unpaid losses and loss adjustment expenses | $ | 47,055,787 | $ | 49,093,571 | $ | 44,396,558 | ||||||
| Net unpaid losses and loss adjustment expenses | $ | 37,534,817 | $ | 39,456,610 | $ | 39,233,783 | ||||||
Crusader’s primary line of business is commercial multi-peril policies. This line of business represented approximately 98% of Crusader’s total written premium for the years ended December 31, 2016, 2015, and 2014.
From 2004 until June 2014, all of Crusader’s business was written in the state of California. In June 2014, Crusader began writing business in the state of Arizona. As of December 31, 2016, Crusader was licensed as an admitted insurance company in the states of Arizona, California, Nevada, Oregon, and Washington and is approved as a non-admitted surplus lines writer in other states.
Crusader Premium
For the year ended December 31, 2016, direct written premium, as reported on Crusader’s statutory financial statement, was $38,749,097 compared to $36,374,509 for the year ended December 31, 2015, an increase of $2,374,588 (7%). The rise in direct written premium in 2016 of 7% compared to 2015 is not attributable to any material single event.
For the year ended December 31, 2015, direct written premium, as reported on Crusader’s statutory financial statement, was $36,374,509 compared to $32,810,088 for the year ended December 31, 2014, an increase of $3,564,421 (11%). The rise in direct written premium in 2015 of 11% compared to 2014 is not attributable to any material single event.
Crusader writes annual policies and, therefore, earns written premium daily over the one-year policy term.
Crusader’s direct, ceded and net earned premium are as follows:
| Year ended December 31 | ||||||||||||
| 2016 | 2015 | 2014 | ||||||||||
| Direct earned premium | $ | 37,453,619 | $ | 34,902,435 | $ | 31,463,691 | ||||||
| Ceded earned premium | (6,097,248 | ) | (5,328,639 | ) | (5,090,268 | ) | ||||||
| Net earned premium | $ | 31,356,371 | $ | 29,573,796 | $ | 26,373,423 | ||||||
| Ratio of ceded earned premium to direct earned premium | 16 | % | 15 | % | 16 | % | ||||||
In the year ended December 31, 2016, direct earned premium increased $2,551,184 (7%) to $37,453,619 compared to $34,902,435 for the year ended December 31, 2015. In the year ended December 31, 2015, direct earned premium increased $3,438,744 (11%) to $34,902,435 compared to $31,463,691 for the year ended December 31, 2014. The fluctuation in direct earned premium is directly related to the fluctuation in direct written premium.
Ceded earned premium for the year ended December 31, 2016, increased $768,609 (14%) to $6,097,248 compared to $5,328,639 for the year ended December 31, 2015. Ceded earned premium for the year ended December 31, 2015, increased $238,371 (5%) to $5,328,639 compared to $5,090,268 for the year ended December 31, 2014.
Ceded earned premium as a percentage of direct earned premium was 16% in 2016, 15% in 2015, and 16% in 2014. The ceded earned premium as a percentage of direct earned premium is relatively unchanged as there were no major modifications to Crusader’s excess of loss treaties.
30 of 89
In calendar years 2016, 2015, and 2014, Crusader retained a participation in its excess of loss reinsurance treaties of 10% in its 1st layer ($500,000 in excess of $500,000), 0% in its 2nd layer ($2,000,000 in excess of $1,000,000), and 0% in its property and casualty clash treaty.
Crusader’s excess of loss reinsurance treaties provided for a contingent commission for accident years 2006, 2004, and 2003. Crusader’s 2006 1st layer primary excess of loss reinsurance treaty provided for a contingent commission equal to 20% of the net profit, if any, accruing to the reinsurer. Crusader’s 2004 and 2003 1st layer primary excess of loss reinsurance treaties provided for a contingent commission to the Company equal to 45% of the net profit, if any, accruing to the reinsurer. Any contingent commission received was subject to return based on future development of ceded losses and loss adjustment expenses. The contingent commission income (loss) recognized was $0, $91,686, and $(17,092) for the years ended December 31, 2016, 2015, and 2014, respectively. As of December 31, 2016, the contingent commission agreements had expired, and all contingent commission income due on these agreements had been recognized. As of December 31, 2016 and 2015, the unearned contingent commission balance included in “Accrued expenses and other liabilities” in the Consolidated Balance Sheets was $0.
The Company evaluates each of its ceded reinsurance contracts at its inception to determine if there is a sufficient risk transfer to allow the contract to be accounted for as reinsurance under current accounting literature. As of December 31, 2016, all such ceded contracts are accounted for as risk transfer reinsurance.
Losses and Loss Adjustment Expenses
Crusader’s emerging loss ratios for each accident year are reviewed in detail at the end of each quarter as part of the reserve review process. Losses and loss adjustment expenses for the calendar years ended December 31, 2016, 2015, and 2014 were $22,826,878, $19,163,316, and $14,617,118, respectively.
Losses and loss adjustment expenses and loss ratios are as follows:
| Year ended December 31 | ||||||||||||||||||||||||
| 2016 | 2016 Loss Ratio | 2015 | 2015 Loss Ratio | 2014 | 2014 Loss Ratio | |||||||||||||||||||
| Net earned premium | $ | 31,356,371 | $ | 29,573,796 | $ | 26,373,423 | ||||||||||||||||||
| Losses and loss adjustment expenses: | ||||||||||||||||||||||||
| Provision for insured events of current year | 22,850,408 | 73 | % | 21,607,628 | 73 | % | 17,925,882 | 68 | % | |||||||||||||||
| Development of insured events of prior years | (23,530 | ) | 0 | % | (2,444,312 | ) | (8 | %) | (3,308,764 | ) | (13 | %) | ||||||||||||
| Total losses and loss adjustment expenses | $ | 22,826,878 | 73 | % | $ | 19,163,316 | 65 | % | $ | 14,617,118 | 55 | % | ||||||||||||
Some lines of insurance are commonly referred to as "long-tail" lines because of the extended time required before claims are ultimately settled. Lines of insurance in which claims are settled relatively quickly are called "short-tail" lines. It is generally more difficult to estimate loss reserves for long-tail lines because of the long period of time that elapses between the occurrence of a claim and its final disposition and the difficulty of estimating the settlement value of the claim. Crusader’s short-tail lines consist of its property coverages, and its long-tail lines consist of its liability coverages. However, Crusader’s long-tail liability claims tend to be settled relatively quicker than other long-tail lines not underwritten by Crusader, such as workers’ compensation, professional liability, umbrella liability, and medical malpractice. Since trends develop over longer periods of time on long-tail lines of business, the Company generally gives credibility to those trends more slowly than for short-tail or less volatile lines of business.
The amount of favorable development recognized during the year ended December 31, 2016, decreased $2,420,782 (99%) to $23,530 from $2,444,312 during the year ended December 31, 2015, due primarily to higher than expected incurred losses and loss adjustment expenses on long-tail claims in accident years 2015, 2013, and 2011. The amount of favorable development recognized during the year ended December 31, 2015, decreased $864,452 (26%) to $2,444,312 from $3,308,764 during the year ended December 31, 2014, due primarily to higher than expected incurred losses and loss adjustment expenses on long-tail claims in accident years 2013 and 2011. The favorable development in the above table is not necessarily indicative of the results that may be expected in future periods.
31 of 89
The variability of Crusader’s losses and loss adjustment expenses for the periods presented is due primarily to the small size and diverse nature of populations that represent Crusader’s policyholders and claims, which may result in greater fluctuations in claim frequency and/or severity. Also, Crusader’s reinsurance retention, which is relatively high in relationship to its net earned premium, can result in increased loss ratio volatility when large losses are incurred in a relatively short period of time. Nevertheless, management believes that its reinsurance retention is reasonable given the amount of Crusader’s surplus, its targeted ultimate loss ratios, and its goal to minimize ceded premium. The favorable (adverse) development by accident year is as follows:
| Year ended | ||||||||||||||||||||||||||
| December 31, 2016 | December 31, 2015 | December 31, 2014 | ||||||||||||||||||||||||
Accident Year | Favorable (Adverse) Development |
% of Total | Favorable (Adverse) Development |
% of Total | Favorable (Adverse) Development |
% of Total | ||||||||||||||||||||
| Prior to 2007 | $ | (52,722 | ) | (224 | %) | $ | 58,202 | 3 | % | $ | 470,557 | 14 | % | |||||||||||||
| 2007 | 72,423 | 308 | % | 127,596 | 5 | % | 548,974 | 17 | % | |||||||||||||||||
| 2008 | (60,220 | ) | (256 | %) | 425,067 | 17 | % | 679,388 | 21 | % | ||||||||||||||||
| 2009 | 613,793 | 2,609 | % | 617,597 | 25 | % | 619,432 | 19 | % | |||||||||||||||||
| 2010 | 562,171 | 2,389 | % | 562,358 | 23 | % | 564,765 | 17 | % | |||||||||||||||||
| 2011 | (226,918 | ) | (965 | %) | (876,504 | ) | (36 | %) | 484,846 | 14 | % | |||||||||||||||
| 2012 | 393,236 | 1,671 | % | 522,453 | 21 | % | 518,217 | 15 | % | |||||||||||||||||
| 2013 | (1,334,578 | ) | (5,672 | %) | (306,707 | ) | (12 | %) | (577,415 | ) | (17 | %) | ||||||||||||||
| 2014 | 501,836 | 2,133 | % | 1,314,250 | 54 | % | — | — | ||||||||||||||||||
| 2015 | (445,491 | ) | (1,893 | %) | — | — | — | — | ||||||||||||||||||
| Total prior accident years | $ | 23,530 | 100 | % | $ | 2,444,312 | 100 | % | $ | 3,308,764 | 100 | % | ||||||||||||||
Crusader sets reserves based on its expected loss ratio and its expected loss and loss adjustment expense development patterns. Crusader’s initial expected loss ratio is based on its historical average loss ratio, and its expected loss and loss adjustment expense development patterns are based on its historical loss and loss adjustment expense development patterns. Actuarial methods utilizing expected loss ratios tend to be relied on more heavily earlier in the life of an accident year, while actuarial methods that apply development patterns to emerged losses and loss adjustment expenses tend to be relied on more heavily as an accident year develops. For prior accident years, emerging differences between actual and expected losses and loss adjustment expenses are recognized quarterly in the Consolidated Statements of Operations.
Based on the loss and loss adjustment expense reserve estimates as of December 31, 2016, the estimated ultimate loss ratio is within five percentage points of the initial expected loss ratio in 9 of Crusader’s 32 years. Since Crusader’s net earned premium in 2016 was $31,356,371, a difference between the accident year 2016 actual and initial expected loss ratios of only five percentage points will or may ultimately impact losses and loss adjustment expenses by $1,567,819. The estimated ultimate loss ratio is within ten percentage points of the initial expected loss ratio in 14 of Crusader’s 32 years. A ten percentage point difference between the accident year 2016 actual and the initial expected loss ratios will or may ultimately impact losses and loss adjustment expenses by $3,135,637. The estimated ultimate loss ratio is within twenty percentage points of the initial expected loss ratio in 25 of Crusader’s 32 years. A twenty percentage point difference between the accident year 2016 actual and the initial expected loss ratios will or may ultimately impact losses and loss adjustment expenses by $6,271,274.
Loss and Loss Adjustment Expense Reserves
Crusader's liability for unpaid loss and loss adjustment expense reserves consists of case reserves and reserves for IBNR claims. Case reserves are established by claims personnel based on a review of the facts known at the time the claim is reported and are subsequently revised as more information about a claim becomes known. IBNR is estimated using various actuarial methods and techniques and includes (1) reserves for losses and loss adjustment expenses on claims that have occurred but for which claims have not yet been reported to Crusader, and (2) a provision for expected future development on case reserves for information not currently known.
32 of 89
Crusader’s loss and loss adjustment expense reserves are as follows:
| Year ended December 31 | ||||||||||||
| 2016 | 2015 | 2014 | ||||||||||
| Direct reserves: | ||||||||||||
| Case reserves | $ | 16,384,081 | $ | 17,991,121 | $ | 14,983,886 | ||||||
| IBNR reserves | 30,671,706 | 31,102,450 | 29,412,672 | |||||||||
| Total direct reserves | $ | 47,055,787 | $ | 49,093,571 | $ | 44,396,558 | ||||||
| Reserves net of reinsurance: | ||||||||||||
| Case reserves | $ | 12,458,646 | $ | 14,696,913 | $ | 13,045,290 | ||||||
| IBNR reserves | 25,076,171 | 24,759,697 | 26,188,493 | |||||||||
| Total net reserves | $ | 37,534,817 | $ | 39,456,610 | $ | 39,233,783 | ||||||
Reserves for losses and loss adjustment expenses before reinsurance for each of Crusader’s lines of business are as follows:
| Year ended December 31 | ||||||||||||||||||||||||
| Line of Business | 2016 | 2015 | 2014 | |||||||||||||||||||||
| Commercial multiple peril | $ | 46,100,751 | 98.0 | % | $ | 48,167,640 | 98.1 | % | $ | 43,457,425 | 97.9 | % | ||||||||||||
| Other liability | 912,014 | 1.9 | % | 889,867 | 1.8 | % | 911,633 | 2.0 | % | |||||||||||||||
| Other | 43,022 | 0.1 | % | 36,064 | 0.1 | % | 27,500 | 0.1 | % | |||||||||||||||
| Total | $ | 47,055,787 | 100.0 | % | $ | 49,093,571 | 100.0 | % | $ | 44,396,558 | 100.0 | % | ||||||||||||
The Company‘s consolidated financial statements include estimated reserves for both reported and unreported claims. The Company sets these reserves at each quarterly balance sheet date based upon management’s best estimate of the ultimate loss and loss adjustment expense payments that it anticipates will be made to settle all reported and unreported claims.
The following table is a roll forward of Crusader’s loss and loss adjustment expense reserves, including a reconciliation of the beginning and ending balance sheet liability for the periods indicated:
| Year ended December 31 | ||||||||||||
| 2016 | 2015 | 2014 | ||||||||||
| Reserve for unpaid losses and loss adjustment expenses at beginning of year – net of reinsurance | $ | 39,456,610 | $ | 39,233,783 | $ | 39,448,546 | ||||||
| Incurred losses and loss adjustment expenses: | ||||||||||||
| Provision for insured events of current year | 22,850,408 | 21,607,628 | 17,925,882 | |||||||||
| Development of insured events of prior years | (23,530 | ) | (2,444,312 | ) | (3,308,764 | ) | ||||||
| Total incurred losses and loss adjustment expenses | 22,826,878 | 19,163,316 | 14,617,118 | |||||||||
| Payments: | ||||||||||||
| Losses and loss adjustment expenses attributable to insured events of the current year | 7,984,562 | 6,812,275 | 4,286,861 | |||||||||
| Losses and loss adjustment expenses attributable to insured events of prior years | 16,764,109 | 12,128,214 | 10,545,020 | |||||||||
| Total payments | 24,748,671 | 18,940,489 | 14,831,881 | |||||||||
| Reserve for unpaid losses and loss adjustment expenses at end of year – net of reinsurance | 37,534,817 | 39,456,610 | 39,233,783 | |||||||||
| Reinsurance recoverable on unpaid losses and loss adjustment expenses at end of year | 9,520,970 | 9,636,961 | 5,162,775 | |||||||||
| Reserve for unpaid losses and loss adjustment expenses at end of year per balance sheet, gross of reinsurance | $ | 47,055,787 | $ | 49,093,571 | $ | 44,396,558 | ||||||
Crusader’s net loss and loss adjustment expense reserve was $37,534,817 as of December 31, 2016. Since underwriting profit is a significant part of income, a small percentage change in reserve estimates may result in a substantial effect on future reported earnings. Such changes might result from a variety of factors, including claims costs emerging in a different pattern than the average historical development patterns.
33 of 89
If future development ultimately results in being five percent different than Crusader’s 2016 net reserve, $1,876,741 would be reflected in future periods as an increase or decrease in the development of insured events of prior years and would be recognized in the Company’s Consolidated Statements of Operations in future periods. If future development ultimately results in being ten percent different than Crusader’s 2016 net reserve, $3,753,482 would be reflected in future periods as an increase or decrease in the development of insured events of prior years and would be recognized in the Company’s Consolidated Statements of Operations in future periods.
Other Insurance Operations
Health Insurance Program
Commission income from health insurance sales is as follows:
| Year ended December 31 | ||||||||||||
| 2016 | 2015 | 2014 | ||||||||||
| Commission income | $ | 959,810 | $ | 960,670 | $ | 1,082,412 | ||||||
AIB markets health insurance in California through non-affiliated insurance companies for individuals and groups. For these services, AIB receives commission based on the premium that it writes. Commission income for the year ended December 31, 2016, decreased $860 (less than 1%) compared to the year ended December 31, 2015.
Commission income for the year ended December 31, 2015, decreased $121,742 (11%) compared to the year ended December 31, 2014. The decrease in commission income is a result of decreases in the number of group accounts AIB underwrites and commission income on individual and group policies due primarily to the Patient Protection and Affordable Care Act.
In 2016, approximately 40% and 41% of the $959,810 commission income from the Company’s health insurance program was from Guardian Life Insurance Company of America dental and group life plan programs and the Blue Shield Care Trust health and life insurance programs, respectively. In 2015, approximately 39% and 40% of the $960,670 commission income from the Company’s health insurance program was from Guardian Life Insurance Company of America dental and group life plan programs and the Blue Shield Care Trust health and life insurance programs, respectively. In 2014, approximately 38% and 39% of the $1,082,412 commission income from the Company’s health insurance program was from Guardian Life Insurance Company of America dental and group life plan programs and the Blue Shield Care Trust health and life insurance programs, respectively.
Association Operation
Membership and fee income from the association program of AAQHC is as follows:
| Year ended December 31 | ||||||||||||
| 2016 | 2015 | 2014 | ||||||||||
| Membership and fee income | $ | 78,019 | $ | 88,530 | $ | 100,332 | ||||||
Membership and fee income for the year ended December 31, 2016, decreased $10,511 (12%) compared to the year ended December 31, 2015. Membership and fee income for the year ended December 31, 2015, decreased $11,802 (12%) compared to the year ended December 31, 2014. The decrease for each of the years presented is a result of a decrease in the number of association members primarily due to increased competition.
Policy Fee Income
Unifax sells and services insurance policies for Crusader. The commissions paid by Crusader to Unifax are eliminated as intercompany transactions and are not reflected as income in the Company’s consolidated financial statements. Unifax also receives non-refundable policy fee income that is directly related to the Crusader policies it sells. For financial statement reporting purposes, policy fees are earned ratably over the life of the related insurance policy and are proportionate to premium earned. The unearned portion of the policy fee is recorded as a liability on the Consolidated Balance Sheet under “Accrued expenses and other liabilities.” The earned portion of the policy fee charged to the policyholder by Unifax is recognized as income in the Company’s consolidated financial statements. Unifax’s policy fee income is as follows:
34 of 89
| Year ended December 31 | ||||||||||||
| 2016 | 2015 | 2014 | ||||||||||
| Policy fee income | $ | 1,691,655 | $ | 1,706,134 | $ | 1,619,060 | ||||||
| Policies issued | 9,607 | 9,938 | 9,501 | |||||||||
Policy fee income for the year ended December 31, 2016, decreased $14,479 (1%) as compared to the year ended December 31, 2015. This decrease in policy fee income in 2016 compared to 2015 was primarily the result of a 331 (3%) decrease in the number of policies issued during 2016 compared to 2015. Policy fee income for the year ended December 31, 2015, increased $87,074 (5%) as compared to the year ended December 31, 2014. The increase in policy fee income in 2015 compared to 2014 is primarily the result of a 437 (5%) increase in the number of policies issued during 2015 as compared to 2014.
Daily Automobile Rental Insurance Program
The daily automobile rental insurance program was produced by Bedford. Bedford received commission income from non-affiliated insurance companies based on written premium and continues to receive contingent commission on previous business written.
Commission income from the daily automobile rental insurance program is as follows:
| Year ended December 31 | ||||||||||||
| 2016 | 2015 | 2014 | ||||||||||
| Rental program commission | $ | — | $ | 1,821 | $ | 83,423 | ||||||
| Contingent commission | 8,819 | 16,587 | 32,737 | |||||||||
| Total commission income | $ | 8,819 | $ | 18,408 | $ | 116,160 | ||||||
Bedford stopped selling and servicing the daily automobile rental polices in 2015. As a result of this decision, the daily automobile rental insurance program commission income and contingent commission for the year ended December 31, 2016, decreased $9,589 (52%) compared to the year ended December 31, 2015. For the year ended December 31, 2015, rental insurance program commission income and contingent commission decreased $97,752 (84%) compared to the year ended December 31, 2014.
The contingent commission Bedford received in 2016 is based on the profitability of premiums written in prior years for one of the non-affiliated insurance companies it represented.
Premium Finance Program
The insurance premium financing operation currently finances policies produced only through its sister company, Unifax. Consequently, AAC’s growth is dependent primarily on the growth of Crusader and Unifax business. Since July 2010, AAC has offered 0% financing on policies written by Unifax for Crusader as a promotion to increase the sale of Crusader policies. Due to the low interest rate environment, the cost of money to provide this incentive is not material. The Company monitors the cost of providing this incentive and, depending on the cost/benefit determination, can continue to offer it or withdraw it at any time. Income generated by AAC consists of late fees, returned check fees and payment processing fees.
Finance fees earned from financing policies are as follows:
| Year ended December 31 | ||||||||||||
| 2016 | 2015 | 2014 | ||||||||||
| Finance fees earned | $ | 68,900 | $ | 65,730 | $ | 67,012 | ||||||
| Loans issued | 3,087 | 3,314 | 3,278 | |||||||||
The finance fees earned for the year ended December 31, 2016, increased $3,170 (5%) to $68,900 compared to the year ended December 31, 2015. For the year ended December 31, 2015, decreased $1,282 (2%) to $65,730 compared to the year ended December 31, 2014. The decrease in fees earned during the years presented compared to the prior year period is primarily a result of fewer late fees earned during the periods.
35 of 89
The number of loans issued decreased by 227 (7%) during 2016 when compared to 2015 and increased by 36 (1%) during 2015 when compared to 2014. The average premium financed by AAC was $4,334, $3,733, and $3,492 in 2016, 2015, and 2014, respectively. During 2016, 39% of all Unifax policies were financed and 82% of those policies were financed by AAC. During 2015, 41% of all Unifax policies were financed and 82% of those policies were financed by AAC. During 2014, 42% of all Unifax policies were financed and 83% of those policies were financed by AAC.
Investment Income and Net Realized Losses
Investment income, excluding net realized investment losses, is as follows:
| Year ended December 31 | ||||||||||||
| 2016 | 2015 | 2014 | ||||||||||
| Average invested assets (1) – at amortized cost | $ | 94,209,988 | $ | 102,628,025 | $ | 106,582,200 | ||||||
| Investment income: | ||||||||||||
| Insurance company operation (2) | $ | 880,787 | $ | 478,950 | $ | 161,183 | ||||||
| Other insurance operations | 359 | 414 | 555 | |||||||||
| Total investment income | $ | 881,146 | $ | 479,364 | $ | 161,738 | ||||||
| Yield on average invested assets (3) | 0.81 | % | 0.47 | % | 0.15 | % | ||||||
(1) The average is based on the beginning and ending balances of the amortized cost of the invested assets for each respective year.
(2) Investment income from insurance company operation included $113,394, $0, and $0 of interest on the cash deposits in lieu of appeal bonds for the years ended December 31, 2016, 2015, and 2014, respectively.
(3) Yield on average invested assets did not include the interest on the cash deposits in lieu of appeal bonds.
In the year ended December 31, 2016, the Company’s average invested assets (at amortized cost) decreased $8,418,037 (8%) compared to the year ended December 31, 2015. In the year ended December 31, 2015, the Company’s average invested assets (at amortized cost) decreased $3,954,175 (4%) compared to the year ended December 31, 2014.
The decrease in average invested assets is attributable primarily to the two cash deposits placed by Crusader with the Los Angeles Superior Court in lieu of appeal bonds to appeal judgments on a Crusader liability claim.
In the year ended December 31, 2016, investment income earned, excluding realized losses and investment income earned on cash deposits in lieu of appeal bonds, increased $288,388 (60%) compared to the year ended December 31, 2015. The yield on average invested assets excluding interest earned on the cash deposits in lieu of appeal bonds, increased to 0.81% in 2016 from 0.47% in 2015. The increase in the annualized yield on average invested assets is primarily a result of a decrease in short-term investments and an increase in fixed maturity investments that provide a higher yield. Due to the current interest rate environment, management believes it is prudent to purchase fixed maturity investments with maturities of 5 years or less. Thus, the weighted average maturity of the Company’s fixed maturity investments as of December 31, 2016, was 1.0 year compared to 1.5 years as of December 31, 2015. The Company’s invested assets (at amortized cost) as of December 31, 2016, were $90,576,445 as compared to $97,843,530 as of December 31, 2015.
In the year ended December 31, 2015, the Company’s average invested assets (at amortized cost) decreased $3,954,175 (4%) compared to the year ended December 31, 2014. In the year ended December 31, 2015, investment income earned, excluding realized losses, increased $317,626 (196%) compared to the year ended December 31, 2014. The yield on average invested assets increased to 0.47% in 2015 from 0.15% in 2014. The increase in the annualized yield on average invested assets is primarily a result of a decrease in short-term investments and an increase in fixed maturity investments that provide a higher yield. Due to the current interest rate environment, management believes it is prudent to purchase fixed maturity investments with maturities of 5 years or less and with minimal credit risk. Thus, the weighted average maturity of the Company’s fixed maturity investments as of December 31, 2015, was 1.5 years compared to 1.8 years as of December 31, 2014. The Company’s invested assets (at amortized cost) as of December 31, 2015, were $97,843,530 as compared to $107,412,519 as of December 31, 2014.
36 of 89
The par value, amortized cost, fair value and weighted average yield of fixed maturity investments at December 31, 2016, by contractual maturity are as follows:
Maturities by Calendar Year |
Par Value |
Amortized Cost |
Fair Value | Weighted Average Yield | ||||||||||||
| December 31, 2017 | $ | 52,282,000 | $ | 52,273,745 | $ | 52,286,222 | 0.82 | % | ||||||||
| December 31, 2018 | 21,520,000 | 21,520,097 | 21,519,703 | 1.12 | % | |||||||||||
| December 31, 2019 | 5,980,000 | 5,980,000 | 5,980,000 | 1.14 | % | |||||||||||
| December 31, 2020 | 598,000 | 598,000 | 598,000 | 1.67 | % | |||||||||||
| Total | $ | 80,380,000 | $ | 80,371,842 | $ | 80,383,925 | 0.93 | % | ||||||||
Expected maturities will differ from contractual maturities because borrowers may have the right to call or prepay obligations with or without penalties.
The following table sets forth the composition of the investment portfolio of the Company at the dates indicated:
| December 31, 2016 | December 31, 2015 | |||||||||||||||
| Type of Security | Amortized Cost | Fair Value | Amortized Cost | Fair Value | ||||||||||||
| U.S. treasury securities | $ | 19,091,842 | $ | 19,103,925 | $ | 24,075,727 | $ | 24,034,291 | ||||||||
| Certificates of deposit | 61,280,000 | 61,280,000 | 58,127,000 | 58,127,000 | ||||||||||||
| Total fixed maturity investments | 80,371,842 | 80,383,925 | 82,202,727 | 82,161,291 | ||||||||||||
| Short-term cash investments | 10,204,603 | 10,204,603 | 15,640,803 | 15,640,803 | ||||||||||||
| Total investments | $ | 90,576,445 | $ | 90,588,528 | $ | 97,843,530 | $ | 107,417,964 | ||||||||
The Company had no fixed maturity investments with gross unrealized losses for a continuous period of less than 12 months and three U.S. treasury securities with gross unrealized losses for a continuous period of more than 12 months as of December 31, 2016. The Company had three U.S. treasury securities with gross unrealized losses for a continuous period of less than 12 months and two U.S. treasury securities with gross unrealized losses for a continuous period of more than 12 months as of December 31, 2015.
The Company monitors its investments closely. If an unrealized loss is determined to be other-than-temporary, it is written off as a realized loss through the Consolidated Statements of Operations. The Company’s methodology of assessing other-than-temporary impairments is based on security-specific analysis as of the balance sheet date and considers various factors including the length of time to maturity and the extent to which the fair value has been less than the cost, the financial condition and the near-term prospects of the issuer, and whether the debtor is current on its contractually obligated interest and principal payments. The unrealized losses on the U.S. treasury securities in unrealized loss positions as of December 31, 2016, and December 31, 2015, were determined to be temporary. The unrealized gains or losses from fixed maturities are reported as “Accumulated other comprehensive income (loss),” which is a separate component of stockholders’ equity, net of any deferred tax effect.
Although the Company does not intend to sell its fixed maturity investments prior to maturity, the Company may sell investment securities from time to time in response to cash flow requirements, economic and/or market conditions. During the year ended December 31, 2016, the Company sold three certificates of deposit prior to their maturity. These securities had an amortized cost of $746,000. The Company realized an investment loss of $1,278 on the sale. Proceeds of the sales of these securities were used for general corporate purposes.
During the year ended December 31, 2015, the Company sold 22 certificates of deposit with an amortized cost of $5,478,000. The Company realized an investment loss of $7,251 on the sale. Proceeds of the sale of these securities were used to fund the $7,924,178 cash deposit placed by Crusader with the Los Angeles Superior Court in lieu of an appeal bond on December 28, 2015. This cash deposit was required to appeal a judgment which was finalized in December 2015 on a Crusader policy liability claim. In March 2016, an additional judgment for plaintiff’s attorney fees and costs on this Crusader policy liability claim was finalized. The Company is also appealing this additional judgment. That additional appeal required an additional cash deposit of $5,449,615 in lieu of an appeal bond. The additional cash deposit was made on March 21, 2016. These cash deposits for the appeals represent 150% of the judgments. Management believes the ultimate outcome of this litigation will be covered by Crusader’s reinsurance.
37 of 89
The Company did not sell any fixed maturity investments in the years ended December 31, 2014. There were no realized investment gains or losses in the years ended December 31, 2014.
Other Income
Other income from insurance company operation and other insurance operations is comprised primarily of miscellaneous items not relevant to the primary income statement captions.
| Year ended December 31 | ||||||||||||
| 2016 | 2015 | 2014 | ||||||||||
| Other income from insurance company operation and other insurance operations | $ | 224,282 | $ | 379,258 | $ | 950,103 | ||||||
Other income from insurance company operation and other insurance operations decreased of $154,976 (41%) in the year ended December 31, 2016, when compared to the year ended December 31, 2015. The decrease in the year ended December 31, 2016 from the year ended December 31, 2015, is due primarily to $0 contingent commission recognized on Crusader’s excess of loss reinsurance treaties for accident years 2006, 2004, and 2003 in 2016, compared to $91,686 contingent commission recognized in the year ended December 31, 2015.
Other income from insurance company operation and other insurance operations decreased $570,845 (60%) in the year ended December 31, 2015, when compared to the year ended December 31, 2014. The decrease was primarily the result of a decrease of $620,357 (76%) in rental income received from the Crusader owned office building located in Calabasas, California, due to a major tenant vacating the building on September 7, 2014; the tenant occupied approximately 32,403 square feet. This vacated space was subsequently occupied by the Company on October 9, 2015. This decrease was partially offset by $108,778 (636%) increase in the contingent commission the Company recognized on the Company’s 2003, 2004, and 2006 excess of loss reinsurance treaties.
Operating Expenses
Policy Acquisition Costs are as follows:
| Year ended December 31 | ||||||||||||
| 2016 | 2015 | 2014 | ||||||||||
| Policy acquisition costs | $ | 6,895,149 | $ | 6,465,232 | $ | 5,986,108 | ||||||
| Ratio to net earned premium (GAAP ratio) | 22 | % | 22 | % | 23 | % | ||||||
Policy acquisition costs consist of commissions, premium taxes, inspection fees, and certain other underwriting costs that are directly related to and vary with the production of Crusader insurance policies. These costs include both Crusader expenses and the allocated expenses of other Unico subsidiaries. Crusader's reinsurers pay Crusader a ceding commission, which is primarily a reimbursement of the acquisition cost related to the ceded premium. No ceding commission is received on facultative or catastrophe ceded premium. Policy acquisition costs, net of ceding commission, are deferred and amortized as the related premium is earned. Policy acquisition costs increased $429,917 (7%) in the year ended December 31, 2016, compared to the year ended December 31, 2015, due primarily to an increase in premium volume. Policy acquisition costs increased $479,124 (8%) in the year ended December 31, 2015, compared to the year ended December 31, 2014, due primarily to an increase in premium volume.
Salaries and Employee Benefits are as follows:
| Year ended December 31 | ||||||||||||
| 2016 | 2015 | 2014 | ||||||||||
| Total salaries and employee benefits incurred | $ | 7,680,315 | $ | 7,469,342 | $ | 7,293,879 | ||||||
| Less: Charged to losses and loss adjustment expenses | (1,178,001 | ) | (1,120,602 | ) | (955,003 | ) | ||||||
| Capitalized to policy acquisition costs | (1,575,662 | ) | (1,495,579 | ) | (1,346,745 | ) | ||||||
| Net amount charged to operating expenses | $ | 4,926,652 | $ | 4,853,161 | $ | 4,992,131 | ||||||
Total salaries and employee benefits incurred for the year ended December 31, 2016, increased $210,973 (3%) compared to the year ended December 31, 2015. Total salaries and employee benefits incurred for the year ended December 31, 2015, increased $175,463 (2%) compared to the year ended December 31, 2014.
38 of 89
Commissions to Agents/Brokers are as follows:
| Year ended December 31 | ||||||||||||
| 2016 | 2015 | 2014 | ||||||||||
| Commission to agents/brokers | $ | 161,545 | $ | 166,641 | $ | 192,684 | ||||||
Commissions to agents/brokers (not including commissions on Crusader policies that are reflected in policy acquisition costs) are generally related to gross commission income from the health insurance program and the daily automobile rental insurance program. Commissions to agents and brokers decreased $5,096 (3%) for the year ended December 31, 2016, as compared to the year ended December 31, 2015. Commissions to agents and brokers decreased $26,043 (14%) for the year ended December 31, 2015, as compared to the year ended December 31, 2014. The fluctuations in commissions to agents/brokers when compared to prior periods are due primarily to the fluctuations in written premium in the health insurance program and daily automobile rental insurance program and the related commission income from those programs.
Other Operating Expenses are as follows:
| Year ended December 31 | ||||||||||||
| 2016 | 2015 | 2014 | ||||||||||
| Other operating expenses | $ | 2,571,738 | $ | 4,351,247 | $ | 3,385,694 | ||||||
Other operating expenses generally do not change significantly with changes in production. This is true for both increases and decreases in production.
Other operating expenses decreased $1,779,509 (41%) for the year ended December 31, 2016, compared to the year ended December 31, 2015. The decrease in operating expenses for the year ended December 31, 2016, is due primarily to $1,287,460 charge made in 2015 to recognize the impairment of the Company’s capitalized computer software costs. There was no comparable charge in 2016. Another contribution to the decrease in operating expenses was a decrease in rent expense of $405,578 in the year ended December 31, 2016, compared to the year ended December 31, 2015, as the Company’s month-to-month lease of the home office in Woodland Hills, California, ended effective October 15, 2015. Other operating expenses include costs incurred to review strategic alternatives and potential opportunities. These costs amounted to $382,391 and $144,076 for the years ended December 31, 2016 and 2015, respectively.
Other operating expenses increased $965,553 (29%) for the year ended December 31, 2015, compared to the year ended December 31, 2014, due primarily to impairment of the Company’s capitalized computer software costs of $1,287,460. The increase was partially offset by a decrease of $256,760 in bad debt expense.
Income Taxes
Income Tax Expenses are as follows:
| Year ended December 31 | ||||||||||||
| 2016 | 2015 | 2014 | ||||||||||
| Income tax expense (benefit) | $ | (709,961 | ) | $ | (552,088 | ) | $ | 450,144 | ||||
| Effective income tax rate | 34 | % | 32 | % | 35 | % | ||||||
Income tax was a benefit for the year ended December 31, 2016, of $709,961 compared to a benefit of $552,088 for the year ended December 31, 2015, an increase in the income tax benefit of $157,873. The effective income tax rates for the years ended December 31, 2016 and 2015, were 34% and 32%, respectively. The increase in the income tax benefit is related primarily to the $2,114,238 loss before taxes for the year ended December 31, 2016, compared to the $1,734,958 loss before taxes for the year ended December 31, 2015.
Income tax was a benefit for the year ended December 31, 2015, of $552,088 compared to income tax expense of $450,144 for the year ended December 31, 2014, a change of $1,002,232. The effective income tax rates for the years ended December 31, 2015 and 2014 were 32% and 35%, respectively. The decrease in income tax expense is related primarily to the $1,734,958 loss before taxes for the year ended December 31, 2015, compared to the $1,296,505 income before taxes for the year ended December 31, 2014.
39 of 89
Significant Accounting Policies
The preparation of financial statements in conformity with GAAP requires management to make estimates and assumptions that affect the reported amounts of certain assets and liabilities and disclosure of contingent assets and liabilities at the date of the financial statements and the reported amounts of revenues and expenses during the reporting period. While every effort is made to ensure the integrity of such estimates, actual results could differ.
Management believes the Company’s current critical accounting policies comprise the following:
Losses and Loss Adjustment Expenses
The preparation of the Company’s consolidated financial statements requires estimation of certain liabilities, most significantly the liability for unpaid losses and loss adjustment expenses. Management makes its best estimate of the liability for these unpaid claims costs as of the end of each fiscal quarter. Due to the inherent uncertainties in estimating the Company’s unpaid claims costs, actual loss and loss adjustment expense payments are expected to vary, perhaps significantly, from any estimate made prior to the settling of all claims. Variability is inherent in establishing loss and loss adjustment expense reserves, especially for a small insurer like Crusader. For any given line of insurance, accident year, or other group of claims, there is a continuum of possible loss and loss adjustment expense reserve estimates, each having its own unique degree of propriety or reasonableness. Due to the complexity and the nature of the insurance claims process, there are potentially an infinite number of reasonably likely scenarios. Management draws on its collective experience to judgmentally determine its best estimate. In addition to applying a variety of standard actuarial methods to the data, extensive series of diagnostic tests are applied to the resultant loss and loss adjustment expense reserve estimates to determine management’s best estimate of the unpaid claims liability. Among the statistics reviewed for each accident year are: loss and loss adjustment expense development patterns; frequencies; severities; and ratios of loss to premium, loss adjustment expense to premium, and loss adjustment expense to loss.
When there is clear evidence that the actual emerged claims costs are different than the claims costs that were expected for any prior accident year, the claims cost estimates for that year are revised accordingly. If the claims costs that emerge are less favorable than initially anticipated, generally, the Company increases its loss and loss adjustment expense reserves immediately. However, if the claims costs that emerge are more favorable than initially anticipated, generally, the Company reduces its loss and loss adjustment expense reserves over time while it continues to assess the validity of the observed trends based on the subsequent emerged claims costs.
Some lines of insurance are commonly referred to as "long-tail" lines because of the extended time required before claims are ultimately settled. Lines of insurance in which claims are settled relatively quicker are called "short-tail" lines. It is generally more difficult to estimate loss reserves for long-tail lines because of the long period of time that elapses between the occurrence of a claim and its final disposition and the difficulty of estimating the settlement value of the claim. Crusader’s short-tail lines consist of its property coverages, and its long-tail lines consist of its liability coverages. However, compared to other long-tail liability lines that are not underwritten by Crusader, such as workers’ compensation, professional liability, umbrella liability, and medical malpractice, Crusader’s liability claims tend to be settled relatively quicker. Since trends develop over longer periods of time on long-tail lines of business, the Company generally gives credibility to those trends more slowly than for short-tail or less volatile lines of business.
Crusader underwrites four statutory annual statement lines of business: (1) commercial multi-peril, (2) liability other than automobile and products, (3) fire, and (4) allied lines. Commercial multi-peril policies comprised 98% of Crusader’s 2016, 2015, and 2014 premium. Commercial multi-peril policies include both property and liability coverages. For all of Crusader’s coverages and lines of business, Crusader’s actuarial loss and loss adjustment expense reserving methods require assumptions that can be grouped into two key categories: (1) expected loss and loss adjustment expense development patterns and (2) expected loss and loss adjustment expense per premium dollar.
The Company also segregates most of its business into smaller homogeneous categories primarily for management’s internal detailed reserve review and analysis. These homogeneous categories used by the Company include various combinations and special groupings of its lines of business, programs types, states and coverages. Some categories exclude certain items and/or others include certain items. Not all categories are defined in the same way. This analysis includes the tracking of historical claims costs and development patterns separately for each of these uniquely defined categories. Generally, neither the liability development patterns nor the property development patterns vary significantly by category.
40 of 89
The establishment of loss and loss adjustment expense reserves is a detailed process as there are many factors that can ultimately affect the final settlement of a claim and, therefore, the reserve that is needed. Estimates are based on a variety of industry data and on Crusader’s current and historical accident year claims data, including but not limited to reported claim counts, open claim counts, closed claim counts, closed claim counts with payments, paid losses, paid loss adjustment expenses, case loss reserves, case loss adjustment expense reserves, earned premium and policy exposures, salvage and subrogation, and unallocated loss adjustment expenses paid. Many other factors, including changes in reinsurance, changes in pricing, changes in policy forms and coverage, changes in underwriting and risk selection, legislative changes, results of litigation and inflation are also taken into account.
At the end of each fiscal quarter, Crusader’s reserves for each accident year (i.e., for all claims occurring within each year) are re-evaluated independently by the Company’s president, the Company’s chief financial officer and by an independent consulting actuary. Generally accepted actuarial methods, including the widely used Bornhuetter-Ferguson and loss development methods, are employed to estimate ultimate claims costs. An actuarial central estimate of the ultimate claims costs and IBNR reserves is ultimately determined by management and tested for reasonableness by the independent consulting actuary.
Each year, management compares the actual claims costs that emerge to the claims costs that were expected to emerge and evaluates whether any observed significant differences are due to normal variances in the development process that occur from time to time, particularly in an insurer the size of Crusader, or if they are an indication that changes in the key reserve assumptions or methodologies are appropriate. Management concluded that no changes in Crusader’s key reserve assumptions or methodologies are appropriate.
Crusader’s actuarially based loss and loss adjustment expense reserve methodology does not include an implicit or explicit provision for uncertainty. Insurance claims costs are inherently uncertain. There is not a precise means of quantifying in advance a provision for uncertainty when determining an appropriate liability for unpaid claims costs. Rather, the potential for claims costs being less than estimated and the potential for claims costs being more than estimated are considered when selecting the parameters to be used in the application of the actuarial methods and when testing the estimates for reasonableness. Management believes that its recorded loss and loss adjustment expense reserves make reasonable provision for its liability for unpaid claims costs.
The differences between actual and expected claims costs are typically not due to one specific factor but to a combination of many factors such as the period of time between the initial occurrence and the final settlement of the claim, current and perceived social and economic inflation, and many other economic, legal, political, and social factors. The information that management uses to arrive at its booked reserve estimate comes from many sources within the Company, including its accounting, legal, claims, and underwriting departments. Informed managerial judgment is applied throughout the reserving process. In addition, time can be a critical part of reserving determinations since the longer the span between the incidence of a loss and the payment or settlement of the claim, the more variable the ultimate settlement amount will tend to be. Accordingly, short-tail claims, such as the emergence of property damage claims costs, tend to be subject to less variability than the emergence of long-tail liability claims costs. The liability for unpaid losses and loss adjustment expenses is based upon the accumulation of individual case estimates for losses reported prior to the close of the accounting period plus estimates based on experience and industry data for development of case estimates and for unreported losses and loss adjustment expenses. Since the emergence and disposition of claims are subject to uncertainties, the net amounts that will ultimately be paid to settle claims should be expected to vary, perhaps significantly, from the estimated amounts provided for in the accompanying consolidated financial statements. Any adjustments to reserves are reflected in the operating results of the periods in which they are made. Management believes that the aggregate reserves for losses and loss adjustment expenses are reasonable and adequate to cover the cost of claims, both reported and unreported.
The Company must estimate its ultimate losses and loss adjustment expenses using a very small claim population size. At the beginning of 2016, Crusader had 619 open claim files. During 2016, 747 new claim files were opened and 779 claim files were closed, leaving 587 open claim files at the end of 2016. Due to the small size of Crusader and the related small population of claims, Crusader’s losses and loss adjustment expenses for any accident year can vary significantly from the initial expectations. Due to the small number of claims, changes in claim frequency and/or severity can materially affect Crusader’s reserve estimate. The potential variability from management’s best estimate cannot be measured from any meaningful statistical basis due to the numerous uncertainties in the claims reserving process and the small population of claims.
41 of 89
At each quarterly review, actual claims costs that emerge are compared with the claims costs that were expected to emerge during that development period. Sometimes the previous claims costs estimates prove to have been too high; sometimes they prove to have been too low. The favorable development in the 2014 through 2016 calendar years underscores the inherent uncertainty in insurance claims costs, especially for a very small insurer. While additional redundancies on losses and loss adjustment expenses may emerge, the Company believes that this trend may not be indicative of future results.
| Calendar year ended December 31 | ||||||||||||
| 2016 | 2015 | 2014 | ||||||||||
| Net reserves for unpaid losses and loss adjustment expenses at beginning of year | $ | 39,456,610 | $ | 39,233,783 | $ | 39,448,546 | ||||||
| Favorable development of insured events of prior years | $ | 23,530 | $ | 2,444,312 | $ | 3,308,764 | ||||||
| Percentage of favorable development to beginning reserves | 0.1 | % | 6.2 | % | 8.4 | % | ||||||
Any adjustments to reserves are reflected in the operating results of the periods in which they are made. Management believes that the aggregate reserves for losses and loss adjustment expenses make reasonable provision for all unpaid losses and loss adjustment expenses of the Company.
There have been no changes in key assumptions of estimating future loss and loss adjustment expense payments. The changes in estimates of prior accident year incurred losses and loss adjustment expenses are attributed to the passage of time and the greater amount of actual loss data available for each accident year.
Reinsurance
Crusader’s recoverable from reinsurers represents an estimate of the amount of future loss and loss adjustment expense payments that will be recoverable from Crusader’s reinsurers. These estimates are based upon estimates of the ultimate losses and loss adjustment expenses that Crusader expects to incur and the portion of those losses that are expected to be allocable to reinsurers based upon the terms of the reinsurance agreements. Given the uncertainty of the ultimate amounts of losses and loss adjustment expenses, the estimates may vary significantly from the eventual outcome. Crusader’s estimate of the amounts recoverable from reinsurers is regularly reviewed and updated by management as new data becomes available. Crusader’s assessment of the collectability of the recorded amounts recoverable from reinsurers is based primarily upon public financial statements and rating agency data. Any adjustments necessary are reflected in the current operations. Crusader evaluates each of its ceded reinsurance contracts at its inception to determine if there is sufficient risk transfer to allow the contract to be accounted for as reinsurance under current accounting literature. At December 31, 2016, all such ceded contracts are accounted for as risk transfer reinsurance.
The following tables provide the effect of reinsurance on the Company’s consolidated financial statements:
The effect of reinsurance on financial position is as follows:
| Year ended December 31 | ||||||||||||
| 2016 | 2015 | 2014 | ||||||||||
| Ceded losses and loss adjustment expenses recoverable on excess of loss treaties: | ||||||||||||
| Ceded case loss and loss adjustment expense reserves recoverable | $ | 3,925,435 | $ | 3,294,208 | $ | 1,938,596 | ||||||
| Ceded IBNR loss and loss adjustment expense reserves recoverable | 5,595,535 | 6,342,753 | 3,224,179 | |||||||||
| Total ceded loss and loss adjustment expense reserves recoverable | $ | 9,520,970 | $ | 9,636,961 | $ | 5,162,775 | ||||||
42 of 89
The effect of reinsurance on the results of operations is as follows:
The effect of reinsurance on earned premium is as follows:
| Year ended December 31 | ||||||||||||
| 2016 | 2015 | 2014 | ||||||||||
| Direct earned premium | $ | 37,453,619 | $ | 34,902,435 | $ | 31,463,691 | ||||||
| Ceded earned premium | (6,097,248 | ) | (5,328,639 | ) | (5,090,268 | ) | ||||||
| Net premium earned | $ | 31,356,371 | $ | 29,573,796 | $ | 26,373,423 | ||||||
| Ratio of ceded earned premium to direct earned premium | 16 | % | 15 | % | 16 | % | ||||||
The effect of reinsurance on losses and loss adjustment expenses is as follows:
| Year ended December 31 | ||||||||||||
| 2016 | 2015 | 2014 | ||||||||||
| Direct losses and loss adjustment expenses incurred | $ | 27,383,996 | $ | 26,495,410 | $ | 16,795,536 | ||||||
| Ceded losses and loss adjustment expenses incurred on excess of loss treaties: | ||||||||||||
| Ceded paid losses and loss adjustment expenses | (4,673,109 | ) | (2,857,908 | ) | (1,443,926 | ) | ||||||
| Change in ceded case reserves | (631,227 | ) | (1,355,612 | ) | (871,965 | ) | ||||||
| Change in ceded IBNR reserves | 747,218 | (3,118,574 | ) | 137,473 | ||||||||
| Total ceded losses and loss adjustment expenses incurred | (4,557,118 | ) | (7,332,094 | ) | (2,178,418 | ) | ||||||
| Net losses and loss adjustment expenses incurred | $ | 22,826,878 | $ | 19,163,316 | $ | 14,617,118 | ||||||
Ceded premium and ceded losses and loss adjustment expenses are as follows:
| Year ended December 31 | ||||||||||||
| 2016 | 2015 | 2014 | ||||||||||
| Ceded earned premium | $ | 6,097,248 | $ | 5,328,639 | $ | 5,090,268 | ||||||
| Ceded losses and loss adjustment expenses incurred | (4,557,118 | ) | (7,332,094 | ) | (2,178,418 | ) | ||||||
| Ceded earned premium less ceded losses and loss adjustment expenses incurred | $ | 1,540,130 | $ | (2,003,455 | ) | $ | 2,911,850 | |||||
The effect of reinsurance on cash flow is the sum of the effect of reinsurance on the results of operations reflected above and the following changes in reinsurance recoverable:
| Year ended December 31 | ||||||||||||
| 2016 | 2015 | 2014 | ||||||||||
| Change in reinsurance recoverable on ceded paid and unpaid losses and loss adjustment expenses | $ | 606,570 | $ | (5,024,502 | ) | $ | (751,713 | ) | ||||
There were no catastrophe losses incurred during the years ended December 31, 2016, 2015, and 2014.
There have been no changes in key assumptions of estimating future ceded losses and loss adjustment expenses. The changes in estimates of prior accident year ceded incurred losses and loss adjustment expenses are attributed to the passage of time and a greater amount of actual loss data available for each accident year.
Crusader’s reinsurance strategy is to protect Crusader against liabilities in excess of certain retentions, including major or catastrophic losses that may occur from any one or more of the property and/or casualty risks which it insures. On an annual basis, or sooner if warranted, Crusader evaluates whether any changes to its retention, participation, or retained limits are necessary. Loss and loss adjustment expense reserves are determined separately on both a direct basis and a net of reinsurance basis, and the ceded reserves are determined by subtraction. Therefore, reinsurance recoverable is determined in a manner consistent with the associated loss reserves. There have been no recent changes in key assumptions underlying the estimation of loss and loss adjustment expense reserves, and no changes are anticipated. Ceded paid losses and loss adjustment expenses are determined by the terms of the individual treaties. The Company continually monitors and evaluates the collectability of reinsurance recoverable to determine if any allowance is necessary.
43 of 89
For years ended December 31, 2016, 2015, and 2014, Crusader wrote 99.5%, 99.5%, and 99.8% of its business in the state of California, respectively. The types of businesses and the coverage limits written by Crusader are not considered difficult lines for obtaining reinsurance. In addition, because the major catastrophe exposure is primarily from riots and from fire following earthquakes, Crusader does not anticipate significant limitations on its ability to cede future losses on a basis consistent with its historical results.
Investments
The Company’s fixed maturity investments are classified as available-for-sale and are stated at fair value. Although all of the Company's investments are classified as available-for-sale and the Company may sell investment securities from time to time in response to economic and market conditions, its investment guidelines place primary emphasis on buying and holding high-quality investments to maturity. Short-term investments are carried at cost, which approximates fair value. The unrealized gains or losses from fixed maturities are reported as “Accumulated other comprehensive income (loss),” which is a separate component of stockholders’ equity, net of any deferred tax effect. When a decline in the value of a fixed maturity is considered other-than-temporary, a loss is recognized in the Consolidated Statements of Operations. Realized gains and losses are included in the Consolidated Statements of Operations based on the specific identification method.
Related Party Transactions
Prior to October 9, 2015, the Company leased approximately 23,000 square feet of an office building located at 23251 Mulholland Drive, Woodland Hills, California. Erwin Cheldin, the Company's former president and a current director and principal stockholder, was the owner of the Woodland Hills building during the lease. The lease provided for an annual gross rent of $486,000 and was effective from April 1, 2012, through March 31, 2013. The lease provided for extension options at the same terms and conditions. The Company exercised its right to extend the lease through June 30, 2014, and the lease continued thereafter on a month-to-month basis. The Company believed that at the inception of the lease agreement, and at each subsequent extension, the terms of the lease were at least as favorable to the Company as could have been obtained from non-affiliated third parties. The Company utilized for its own operations 100% of the space it leased at the Woodland Hills building. The Company also leased storage space from Erwin Cheldin. Depending on usage, storage space rental was estimated to be approximately $15,000 annually. The total rent for the Woodland Hills building was $0, $406,796, and $501,258 for the years ended December 31, 2016, 2015, and 2014, respectively. The Company’s month-to-month lease of the home office in Woodland Hills, California, ended on October 15, 2015.
Item 7A. Quantitative and Qualitative Disclosures About Market Risk.
The Company’s consolidated balance sheet includes a substantial amount of invested assets whose fair values are subject to various market risk exposures including interest rate risk and equity price risk.
The Company’s invested assets at December 31, 2016 and 2015 consisted of the following:
| 2016 | 2015 | |||||||
| Short-term cash investments (at cost) | $ | 10,204,603 | $ | 15,640,803 | ||||
| Fixed maturity bonds (at amortized cost) | 19,091,842 | 24,075,727 | ||||||
| Certificates of deposit – over 1 year (at cost) | 61,280,000 | 58,127,000 | ||||||
| Total invested assets | $ | 90,576,445 | $ | 97,843,530 | ||||
The Company’s interest rate risk is primarily in its fixed maturity bond portfolio. As market interest rates decrease, the value of the portfolio increases with the opposite holding true in rising interest rate environments. In addition, the longer the maturity, the more sensitive the asset is to market interest rate fluctuations. The Company believes that it has limited this risk by investing in securities with shorter term maturities. In addition, although fixed maturity bonds are classified as available-for-sale, the Company’s investment guidelines place primary emphasis on buying and holding high-quality bonds to maturity. Because fixed maturity bonds are primarily held to maturity, the change in the market value of these bonds resulting from market interest rate movements is not recognized as realized gains or losses in the Consolidated Statements of Operations. Interest rate movements on the Company’s investments are not due to credit rating related issues. As of December 31, 2016, the Company’s unrealized gains (net of unrealized losses) before income taxes on its fixed maturity bond portfolio were $12,083 compared to unrealized losses (net of unrealized gains) before income taxes of $41,436 as of December 31, 2015. Given a hypothetical parallel increase of 100 basis points in interest rates, the fair value of the fixed maturity bond portfolio as of December 31, 2016, would decrease by approximately $96,682. This decrease would not be reflected in the Consolidated Statements of Operations except to the extent that the securities were sold or the decrease was deemed to be other-than-temporary.
44 of 89
The Company’s short-term investments and certificates of deposit have only minimal interest rate risk.
The credit risk is minimized by maintaining a high credit quality fixed maturity bond portfolio, which consisted of U.S. treasury securities and FDIC insured certificates of deposit at various banking institutions, and holding short duration fixed maturity investments with maturities of five years or less.
The Company did not have any equity price risk since the Company did not hold any equity securities as of December 31, 2016 and 2015.
45 of 89
Item 8. Financial Statements and Supplementary Data.
INDEX TO
CONSOLIDATED FINANCIAL STATEMENTS
| Page | |
| Number | |
| Reports of Independent Registered Public Accounting Firms | 47-48 |
| Consolidated Balance Sheets as of December 31, 2016 and 2015 | 49 |
| Consolidated Statements of Operations for the years ended December 31, 2016, 2015, and 2014 | 50 |
|
Consolidated Statements of Comprehensive Income (Loss) for the years ended December 31, 2016, 2015, and 2014 |
51 |
|
Consolidated Statements of Changes in Stockholders' Equity for the years ended December 31, 2016, 2015, and 2014 |
52 |
| Consolidated Statements of Cash Flows for the years ended December 31, 2016, 2015, and 2014 | 53 |
| Notes to Consolidated Financial Statements | 54 |
46 of 89
REPORT OF INDEPENDENT REGISTERED PUBLIC ACCOUNTING FIRM
To the Board of Directors and Stockholders of
Unico American Corporation and subsidiaries:
We have audited the accompanying consolidated balance sheets of Unico American Corporation and subsidiaries as of December 31, 2016 and 2015, and the related consolidated statements of operations, comprehensive income (loss), changes in stockholders’ equity, and cash flows for the years then ended. Unico American Corporation’s management is responsible for these consolidated financial statements. Our responsibility is to express an opinion on these consolidated financial statements based on our audits.
We conducted our audits in accordance with the standards of the Public Company Accounting Oversight Board (United States). Those standards require that we plan and perform the audit to obtain reasonable assurance about whether the financial statements are free of material misstatement. The company is not required to have, nor were we engaged to perform, an audit of its internal control over financial reporting. Our audit included consideration of internal control over financial reporting as a basis for designing audit procedures that are appropriate in the circumstances, but not for the purpose of expressing an opinion on the effectiveness of the company’s internal control over financial reporting. Accordingly, we express no such opinion. An audit also includes examining, on a test basis, evidence supporting the amounts and disclosures in the financial statements, assessing the accounting principles used and significant estimates made by management, as well as evaluating the overall financial statement presentation. We believe that our audits provide a reasonable basis for our opinion.
In our opinion, the consolidated financial statements referred to above present fairly, in all material respects, the financial position of Unico American Corporation and subsidiaries as of December 31, 2016 and 2015, and the results of their operations and their cash flows for the years then ended, in conformity with accounting principles generally accepted in the United States of America.
/s/ JLK Rosenberger LLP
Glendale, California
March 30, 2017
47 of 89
REPORT OF INDEPENDENT REGISTERED PUBLIC ACCOUNTING FIRM
The Board of Directors and Stockholders
Unico American Corporation and subsidiaries:
We have audited the accompanying consolidated statements of operations, comprehensive income, changes in stockholders’ equity, and cash flows for the year ended December 31, 2014. These consolidated financial statements are the responsibility of the Company’s management. Our responsibility is to express an opinion on these consolidated financial statements based on our audit.
We conducted our audits in accordance with the standards of the Public Company Accounting Oversight Board (United States). Those standards require that we plan and perform the audit to obtain reasonable assurance about whether the financial statements are free of material misstatement. An audit includes examining, on a test basis, evidence supporting the amounts and disclosures in the financial statements. An audit also includes assessing the accounting principles used and significant estimates made by management, as well as evaluating the overall financial statement presentation. We believe that our audit provides a reasonable basis for our opinion.
In our opinion, the consolidated financial statements referred to above present fairly, in all material respects, the results of operations of Unico American Corporation and subsidiaries and their cash flows for the year ended December 31, 2014, in conformity with U.S. generally accepted accounting principles.
/s/ KPMG LLP
Los Angeles, California
March 30, 2015
48 of 89
UNICO AMERICAN CORPORATION
AND SUBSIDIARIES
CONSOLIDATED BALANCE SHEETS
| December 31 | December 31 | |||||||
| 2016 | 2015 | |||||||
| ASSETS | ||||||||
| Investments | ||||||||
| Available-for-sale: | ||||||||
| Fixed maturities, at fair value (amortized cost: $80,371,842 at December 31, 2016, and $82,202,727 at December 31, 2015) | $ | 80,383,925 | $ | 82,161,291 | ||||
| Short-term investments, at fair value | 10,204,603 | 15,640,803 | ||||||
| Total Investments | 90,588,528 | 97,802,094 | ||||||
| Cash and restricted cash | 13,496,379 | 8,258,673 | ||||||
| Accrued investment income | 185,916 | 85,915 | ||||||
| Receivables, net | 6,008,083 | 5,505,361 | ||||||
| Reinsurance recoverable: | ||||||||
| Paid losses and loss adjustment expenses | 260,744 | 751,323 | ||||||
| Unpaid losses and loss adjustment expenses | 9,520,970 | 9,636,961 | ||||||
| Deferred policy acquisition costs | 4,432,299 | 4,233,396 | ||||||
| Property and equipment, net | 10,282,532 | 10,220,720 | ||||||
| Deferred income taxes | 1,177,346 | 1,334,087 | ||||||
| Other assets | 2,269,408 | 2,341,905 | ||||||
| Total Assets | $ | 138,222,205 | $ | 140,170,435 | ||||
| LIABILITIES AND STOCKHOLDERS' EQUITY | ||||||||
| LIABILITIES | ||||||||
| Unpaid losses and loss adjustment expenses | $ | 47,055,787 | $ | 49,093,571 | ||||
| Unearned premium | 19,374,740 | 18,079,253 | ||||||
| Advance premium and premium deposits | 224,055 | 212,255 | ||||||
| Accrued expenses and other liabilities | 2,660,983 | 2,443,284 | ||||||
| Total Liabilities | $ | 69,315,565 | $ | 69,828,363 | ||||
| Commitments and contingencies | ||||||||
| STOCKHOLDERS' EQUITY | ||||||||
| Common stock, no par – authorized 10,000,000 shares, issued and outstanding shares 5,307,133 at December 31, 2016, and 5,315,945 at December 31, 2015 | $ | 3,761,320 | $ | 3,742,547 | ||||
| Accumulated other comprehensive income (loss) | 7,975 | (27,348 | ) | |||||
| Retained earnings | 65,137,345 | 66,626,873 | ||||||
| Total Stockholders’ Equity | $ | 68,906,640 | $ | 70,342,072 | ||||
| Total Liabilities and Stockholders' Equity | $ | 138,222,205 | $ | 140,170,435 | ||||
See accompanying notes to consolidated financial statements.
49 of 89
UNICO AMERICAN CORPORATION
AND SUBSIDIARIES
CONSOLIDATED STATEMENTS OF OPERATIONS
FOR THE YEARS ENDED DECEMBER 31
| 2016 | 2015 | 2014 | ||||||||||
| REVENUES | ||||||||||||
| Insurance company operation: | ||||||||||||
| Net earned premium | $ | 31,356,371 | $ | 29,573,796 | $ | 26,373,423 | ||||||
| Investment income | 880,787 | 478,950 | 161,183 | |||||||||
| Net realized investment losses | (1,278 | ) | (7,251 | ) | — | |||||||
| Other income | 217,721 | 375,493 | 931,991 | |||||||||
| Total Insurance Company Operation | 32,453,601 | 30,420,988 | 27,466,597 | |||||||||
| Other insurance operations: | ||||||||||||
| Gross commissions and fees | 2,738,303 | 2,773,742 | 2,917,964 | |||||||||
| Investment income | 359 | 414 | 555 | |||||||||
| Finance fees earned | 68,900 | 65,730 | 67,012 | |||||||||
| Other income | 6,561 | 3,765 | 18,112 | |||||||||
| Total Revenues | 35,267,724 | 33,264,639 | 30,470,240 | |||||||||
| EXPENSES | ||||||||||||
| Losses and loss adjustment expenses | 22,826,878 | 19,163,316 | 14,617,118 | |||||||||
| Policy acquisition costs | 6,895,149 | 6,465,232 | 5,986,108 | |||||||||
| Salaries and employee benefits | 4,926,652 | 4,853,161 | 4,992,131 | |||||||||
| Commissions to agents/brokers | 161,545 | 166,641 | 192,684 | |||||||||
| Other operating expenses | 2,571,738 | 4,351,247 | 3,385,694 | |||||||||
| Total Expenses | 37,381,962 | 34,999,597 | 29,173,735 | |||||||||
| Income (loss) before taxes | (2,114,238 | ) | (1,734,958 | ) | 1,296,505 | |||||||
| Income tax expense (benefit) | (709,961 | ) | (552,088 | ) | 450,144 | |||||||
| Net Income (Loss) | $ | (1,404,277 | ) | $ | (1,182,870 | ) | $ | 846,361 | ||||
| PER SHARE DATA: | ||||||||||||
| Basic | ||||||||||||
| Earnings (loss) per share | $ | (0.26 | ) | $ | (0.22 | ) | $ | 0.16 | ||||
| Weighted average shares | 5,307,694 | 5,335,540 | 5,341,147 | |||||||||
| Diluted | ||||||||||||
| Earnings (loss) per share | $ | (0.26 | ) | $ | (0.22 | ) | $ | 0.16 | ||||
| Weighted average shares | 5,307,694 | 5,335,540 | 5,346,552 | |||||||||
See accompanying notes to consolidated financial statements.
50 of 89
UNICO AMERICAN CORPORATION
AND SUBSIDIARIES
CONSOLIDATED STATEMENTS OF COMPREHENSIVE INCOME (LOSS)
FOR THE YEARS ENDED DECEMBER 31
| 2016 | 2015 | 2014 | ||||||||||
| Net income (loss) | $ | (1,404,277 | ) | $ | (1,182,870 | ) | $ | 846,361 | ||||
| Other changes in comprehensive income (loss): | ||||||||||||
| Changes in unrealized gains (losses) on securities classified as available-for-sale arising during the period | 53,519 | (46,881 | ) | 14,202 | ||||||||
| Income tax (expense) benefit related to changes in unrealized gains (losses) on securities classified as available-for-sale arising during the period | (18,196 | ) | 15,939 | (4,828 | ) | |||||||
| Comprehensive Income (Loss) | $ | (1,368,954 | ) | $ | (1,213,812 | ) | $ | 855,735 | ||||
See accompanying notes to consolidated financial statements.
51 of 89
UNICO AMERICAN CORPORATION
AND SUBSIDIARIES
CONSOLIDATED STATEMENTS OF CHANGES IN STOCKHOLDERS’ EQUITY
FOR THE YEARS ENDED DECEMBER 31, 2016, 2015, AND 2014
| Accumulated | ||||||||||||||||||||
| Other | ||||||||||||||||||||
| Common Shares | Comprehensive | |||||||||||||||||||
| Issued and | Income | Retained | ||||||||||||||||||
| Outstanding | Amount | (Loss) | Earnings | Total | ||||||||||||||||
| Balance – December 31, 2013 | 5,341,147 | $ | 3,708,724 | $ | (5,780 | ) | $ | 67,193,311 | $ | 70,896,255 | ||||||||||
| Non-cash stock based compensation | — | 23,104 | — | — | 23,104 | |||||||||||||||
| Change in comprehensive income, net of deferred income tax | — | — | 9,374 | — | 9,374 | |||||||||||||||
| Net income | — | — | — | 846,361 | 846,361 | |||||||||||||||
| Balance – December 31, 2014 | 5,341,147 | $ | 3,731,828 | $ | 3,594 | $ | 68,039,672 | $ | 71,775,094 | |||||||||||
| Shares repurchased | (25,202 | ) | (12,385 | ) | — | (229,929 | ) | (242,314 | ) | |||||||||||
| Non-cash stock based compensation | — | 23,104 | — | — | 23,104 | |||||||||||||||
| Change in comprehensive income, net of deferred income tax | — | — | (30,942 | ) | — | (30,942 | ) | |||||||||||||
| Net loss | — | — | — | (1,182,870 | ) | (1,182,870 | ) | |||||||||||||
| Balance – December 31, 2015 | 5,315,945 | $ | 3,742,547 | $ | (27,348 | ) | $ | 66,626,873 | $ | 70,342,072 | ||||||||||
| Shares repurchased | (8,812 | ) | (4,331 | ) | — | (85,251 | ) | (89,582 | ) | |||||||||||
| Non-cash stock based compensation | — | 23,104 | — | — | 23,104 | |||||||||||||||
| Change in comprehensive income, net of deferred income tax | — | — | 35,323 | — | 35,323 | |||||||||||||||
| Net loss | — | — | — | (1,404,277 | ) | (1,404,277 | ) | |||||||||||||
| Balance – December 31, 2016 | 5,307,133 | $ | 3,761,320 | $ | 7,975 | $ | 65,137,345 | $ | 68,906,640 | |||||||||||
See accompanying notes to consolidated financial statements.
52 of 89
UNICO AMERICAN CORPORATION
AND SUBSIDIARIES
CONSOLIDATED STATEMENTS OF CASH FLOWS
FOR THE YEARS ENDED DECEMBER 31
| 2016 | 2015 | 2014 | ||||||||||
| Cash flows from operating activities: | ||||||||||||
| Net income (loss) | $ | (1,404,277 | ) | $ | (1,182,870 | ) | $ | 846,361 | ||||
| Adjustments to reconcile net income (loss) to net cash from operations: | ||||||||||||
| Depreciation and amortization | 483,580 | 341,264 | 539,608 | |||||||||
| Bond amortization, net | (16,115 | ) | (18,758 | ) | (5,200 | ) | ||||||
| Non-cash stock based compensation | 23,104 | 23,104 | 23,104 | |||||||||
| Loss on asset impairment | — | 1,287,460 | — | |||||||||
| Net realized investment losses | 1,278 | 7,251 | — | |||||||||
| Bad debt expense | 5,833 | (1,460 | ) | 255,299 | ||||||||
| Changes in assets and liabilities: | ||||||||||||
| Net receivables and accrued investment income | (608,556 | ) | (376,608 | ) | (306,541 | ) | ||||||
| Reinsurance recoverable | 606,570 | (5,024,502 | ) | (751,713 | ) | |||||||
| Deferred policy acquisition costs | (198,903 | ) | (350,571 | ) | (246,822 | ) | ||||||
| Other assets | 296,515 | 219,230 | 64,257 | |||||||||
| Unpaid losses and loss adjustment expenses | (2,037,784 | ) | 4,697,013 | 519,729 | ||||||||
| Unearned premium | 1,295,487 | 1,472,074 | 1,346,397 | |||||||||
| Advance premium and premium deposits | 11,800 | (38,166 | ) | (214,407 | ) | |||||||
| Accrued expenses and other liabilities | 217,699 | (543,033 | ) | 631,823 | ||||||||
| Income taxes current/deferred | (85,473 | ) | (560,961 | ) | (233,709 | ) | ||||||
| Net Cash Provided (Used) by Operating Activities | (1,409,242 | ) | (49,533 | ) | 2,468,186 | |||||||
| Cash flows from investing activities: | ||||||||||||
| Purchase of fixed maturity investments | (16,772,000 | ) | (57,929,858 | ) | (25,303,347 | ) | ||||||
| Proceeds from maturity of fixed maturity investments | 18,617,722 | 10,891,749 | 2,100,000 | |||||||||
| Net decrease (increase) in short-term investments | 5,436,200 | 56,618,605 | 21,547,909 | |||||||||
| Additions to property and equipment | (545,392 | ) | (1,339,138 | ) | (879,974 | ) | ||||||
| Net Cash Provided (Used) by Investing Activities | 6,736,530 | 8,241,358 | (2,535,412 | ) | ||||||||
| Cash flows from financing activities: | ||||||||||||
| Repurchase of common stock | (89,582 | ) | (242,314 | ) | — | |||||||
| Net Cash Used by Financing Activities | (89,582 | ) | (242,314 | ) | — | |||||||
| Net (decrease) increase in cash and restricted cash | 5,237,706 | 7,949,511 | (67,226 | ) | ||||||||
| Cash and restricted cash at beginning of year | 8,258,673 | 309,162 | 376,388 | |||||||||
| Cash and Restricted Cash at End of Year | $ | 13,496,379 | $ | 8,258,673 | $ | 309,162 | ||||||
| Supplemental cash flow information | ||||||||||||
| Cash paid during the period for income taxes | $ | 8,774 | $ | 8,960 | $ | 683,800 | ||||||
See accompanying notes to consolidated financial statements.
53 of 89
UNICO AMERICAN CORPORATION
AND SUBSIDIARIES
NOTES TO CONSOLIDATED FINANCIAL STATEMENTS
DECEMBER 31, 2016
NOTE 1 - SUMMARY OF SIGNIFICANT ACCOUNTING POLICIES
Nature of Business
Unico American Corporation (the “Company” or “Unico”) is an insurance holding company that underwrites property and casualty insurance through its insurance company subsidiary; provides property, casualty, and health insurance through its agency subsidiaries; and provides insurance premium financing and membership association services through its other subsidiaries. References to Unico or the Company include both the corporation and its subsidiaries, all of which are wholly owned. Unico was incorporated under the laws of Nevada in 1969.
Principles of Consolidation
The accompanying consolidated financial statements include the accounts of Unico American Corporation and its subsidiaries. All significant intercompany accounts and transactions have been eliminated in consolidation.
Basis of Presentation
The consolidated financial statements have been prepared in conformity with U.S. generally accepted accounting principles (“GAAP”). As described in Note 15, the Company's insurance subsidiary also files financial statements with regulatory agencies prepared on a statutory basis of accounting that differs from GAAP. Certain reclassifications have been made to prior period amounts to conform to the current year’s presentation.
Use of Estimates in the Preparation of the Financial Statements
The preparation of financial statements in conformity with GAAP requires the Company to make estimates and assumptions that affect its reported amounts of assets and liabilities and its disclosure of any contingent assets and liabilities at the date of its financial statements, as well as its reported amounts of revenues and expenses during the reporting period. The most significant assumptions in the preparation of these consolidated financial statements relate to losses and loss adjustment expenses. While every effort is made to ensure the integrity of such estimates, actual results may differ.
Investments
All of the Company’s fixed maturity investments are classified as available-for-sale and are stated at fair value, with unrealized gains or losses, net of applicable deferred income taxes, excluded from earnings and credited or charged to a separate component of equity. Although all of the Company's investments are classified as available-for-sale and the Company may sell investment securities from time to time in response to economic and market conditions, its investment guidelines place primary emphasis on buying and holding high-quality investments to maturity. Interest income on fixed maturity investments and short-term investments is recognized on an accrual basis at each measurement date and is included in net investment income in the Company’s Consolidated Statements of Operations.
The Company has a comprehensive portfolio monitoring process to identify and evaluate each fixed income security whose carrying value may be other-than-temporarily impaired. For each fixed income security in an unrealized loss position, the Company assesses whether it is more likely than not that the Company will be required to sell the security before recovery of the amortized cost basis for reasons such as liquidity, contractual or regulatory purposes, or the credit quality of the underlying security. If a security meets this criteria, the security's decline in fair value is considered other than temporary and is recorded as a net realized investment loss in the Consolidated Statements of Operations and in the Consolidated Statements of Comprehensive Income (Loss) based on the specific identification method. There were no realized investments gains (losses) from other than temporary impairments for any of the periods presented in the accompanying Consolidated Statements of Operations. For each fixed income security that the Company does not intend to sell or for which it is more likely than not that the Company would not be required to sell before an anticipated recovery in value, the Company separates the credit loss component of the impairment, if any, from the amount related to all other factors and reports the credit loss component in net realized investment gains (losses). There was no credit loss component for any of the periods presented in the accompanying Consolidated Statements of Operations. The unrealized gains from fixed maturities are reported as “Accumulated other comprehensive income (loss),” which is a separate component of stockholders’ equity, net of any deferred tax effect.
54 of 89
Short-term investments include U.S. treasury bills, a U.S. treasury money market fund, certificates of deposit and bank money market and savings accounts that are all highly rated and redeemable within one year.
Fair Value of Financial Instruments
The Company employs a fair value hierarchy that prioritizes the inputs for valuation techniques used to measure fair value. The fair value of a financial instrument is the amount that would be received to sell an asset or paid to transfer a liability in an orderly transaction between market participants at the measurement date (the exit price). Financial assets and financial liabilities recorded on the Consolidated Balance Sheets at fair value are categorized based on the reliability of inputs to the valuation techniques. (See Note 5.)
The Company has used the following methods and assumptions in estimating its fair value disclosures:
- Fixed maturities:
| 1. | Investment securities, excluding long-term certificates of deposit – Fair values are obtained from a national quotation service. |
| 2. | Long-term certificates of deposit – The carrying amounts reported at cost in the Consolidated Balance Sheets for these instruments approximate their fair values. |
- Cash, restricted cash, and short-term investments – The carrying amounts reported at cost in the Consolidated Balance Sheets approximate their fair values given the short-term nature of these instruments.
- Receivables, net – The carrying amounts reported at cost in the Consolidated Balance Sheets approximate their fair values given the short-term nature of these instruments.
- Accrued expenses and other liabilities – The carrying amounts reported at cost in the Consolidated Balance Sheets approximate the fair values given the short-term nature of these instruments.
Property and Equipment
All property and equipment is stated at cost less accumulated depreciation and amortization on the Consolidated Balance Sheets.
Depreciation on a Crusader Insurance Company (“Crusader”), the Company’s subsidiary, owned building, located at 26050 Mureau Road, Calabasas, California, is computed using the straight line method over 39 years. Improvements to the building structure are amortized over the useful life of the improvements. Depreciation on furniture, fixtures and equipment in the Calabasas building is computed using the straight line method over 3 to 15 years. Amortization of tenant improvements in the Calabasas building is being computed using the shorter of the useful life of the tenant improvements or the remaining years of the lease.
Depreciation on property and equipment located in Woodland Hills, California, was computed using straight line methods over 3 to 7 years. Amortization of leasehold improvements on property located in Woodland Hills, California, was computed using the shorter of the useful life of the leasehold improvements or the remaining years of the lease.
Income Taxes
The Company and its subsidiaries file consolidated federal and state income tax returns. Pursuant to the tax allocation agreement, Crusader and American Acceptance Corporation (“AAC”), a subsidiary of Unico, are allocated taxes or tax credits in the case of losses, at current corporate rates based on their own taxable income or loss. The Company files income tax returns under U.S. federal and various state jurisdictions. The Company is subject to examination by U.S. federal income tax authorities for tax returns filed starting at taxable year 2013 and California state income tax authorities for tax returns filed starting at taxable year 2012. There are no ongoing examinations of income tax returns by federal or state tax authorities.
As of December 31, 2016, the Company had no unrecognized tax benefits or liabilities. In addition, the Company had not accrued interest and penalties related to unrecognized tax benefits or liabilities. However, if interest and penalties would need to be accrued related to unrecognized tax benefits or liabilities, such amounts would be recognized as a component of federal income tax expense.
55 of 89
As a California insurance company, Crusader is obligated to pay a premium tax on direct written premium in all states that Crusader is admitted. Premium taxes are deferred and amortized as the related premium is earned. The premium tax is in lieu of state franchise taxes and is not included in the provision for state taxes.
The provision for federal income taxes is computed on the basis of income as reported for financial reporting purposes. Deferred income taxes reflect the net tax effects of temporary differences between the carrying amounts of assets and liabilities for financial reporting purposes and the amounts used for income tax purposes, and are measured using the enacted tax rates and laws expected to apply to taxable income in the years in which those temporary differences are expected to be recovered or settled. Income tax expense provisions increase or decrease in the same period in which a change in tax rates is enacted.
At each balance sheet date, management assesses the need to establish a valuation allowance that reduces deferred tax assets when it is more-likely-than-not that any portion of the deferred tax asset will not be realized. The ultimate realization of deferred tax assets is dependent upon generating sufficient taxable income of the appropriate character within the carryback and carryforward periods available under the tax law. Management considers the reversal of deferred tax liabilities, projected future taxable income of an appropriate nature and tax-planning strategies when making this assessment. Although realization is not assured, management believes that it is more likely-than-not that the Company’s deferred tax assets net of the valuation allowance will be realized.
Earnings Per Share
Basic earnings per share exclude the impact of common share equivalents and are based upon the weighted average common shares outstanding. Diluted earnings per share utilize the average market price per share when applying the treasury stock method in determining common share dilution. When outstanding stock options are dilutive, they are treated as common share equivalents for purposes of computing diluted earnings per share and represent the difference between basic and diluted weighted average shares outstanding. In loss periods, the options are excluded from the calculation of diluted earnings per share, as the inclusion of such options would have an anti-dilutive effect.
Revenue Recognition
a. General Agency Operations
Commissions due the Company are recognized as income on the effective date of the insurance policies. Policy fee income is recognized on a pro-rata basis over the terms of the policies.
b. Insurance Company Operation
Premium is earned on a pro-rata basis over the terms of the policies. Premium applicable to the unexpired terms of policies in force are recorded as unearned premium. The Company receives a commission on policies that are ceded to its reinsurers. This commission is considered earned on a pro-rata basis over the terms of the policies.
c. Insurance Premium Financing Operations
Premium finance interest may be charged to policyholders who choose to finance insurance premium. Interest may be charged at rates that vary with the amount of premium financed. Premium finance interest, if any, is recognized using a method that approximates the interest (actuarial) method. Other charges and fees earned include late fees, returned check fees and payment processing fees that are earned when recorded.
Losses and Loss Adjustment Expenses
The liability for unpaid losses and loss adjustment expenses is based upon the accumulation of individual case estimates for losses reported prior to the close of the accounting period plus estimates based on experience and industry data for development of case estimates and for incurred but unreported losses and loss adjustment expenses.
There is a high level of uncertainty inherent in the evaluation of the required loss and loss adjustment expense reserves for Crusader. The long-tailed nature of liability claims and the volatility of jury awards exacerbate that uncertainty. Crusader records loss and loss adjustment expense reserves at each balance sheet date based upon management’s best estimate of the ultimate payments that it anticipates will be made to settle all losses incurred and related expenses incurred as of that date for both reported and unreported losses. The ultimate cost of claims is dependent upon future events, the outcomes of which are affected by many factors. Crusader’s claim reserving procedures and settlement philosophy, current and perceived social and economic inflation, current and future court rulings and jury attitudes, improvements in medical technology, and many other economic, scientific, legal, political, and social factors all can have significant effects on the ultimate costs of claims. Changes in Company operations and management philosophy also may cause actual developments to vary from the past. Since the emergence and disposition of claims are subject to uncertainties, the net amounts that will ultimately be paid to settle claims may vary significantly from the estimated amounts provided for in the accompanying consolidated financial statements. Any adjustments to reserves are reflected in the operating results of the periods in which they are made. Management believes that the aggregate reserves for losses and loss adjustment expenses are reasonable and adequate to cover the cost of claims, both reported and unreported.
56 of 89
Restricted Funds
Restricted funds are as follows:
| Year ended December 31 | ||||||||
| 2016 | 2015 | |||||||
| Premium trust funds (1) | $ | — | $ | 44,181 | ||||
| Assigned to state agencies (2) | 700,000 | 700,000 | ||||||
| Total restricted funds | $ | 700,000 | $ | 744,181 | ||||
| (1) | As required by law, the Company segregates from its operating accounts the premium collected from insured’s that are payable to insurance companies into separate trust accounts. These amounts are included in cash and short-term investments. Trust restrictions on cash and short-term investments were $0 and $44,181 at December 31, 2016 and 2015, respectively. |
| (2) | $600,000 and $700,000 included in fixed maturity investments as of December 31, 2016 and 2015, respectively, and $100,000 and $0 included in short-term investments as of December 31, 2016 and 2015, respectively, are statutory deposits assigned to and held by the California State Treasurer and the Insurance Commissioner of the State of Nevada. These deposits are required for writing certain lines of business in California and for admission in states other than California. |
Deferred Policy Acquisition Costs
Accounting Standards Codification (“ASC”) Topic 944, “Financial Services – Insurance,” establishes uniformity in the practice of determining costs related to the acquisition of new or renewal insurance contracts that qualify for deferral. Policy acquisition costs consist of commissions, premium taxes, inspection fees, and certain other underwriting costs, which are related to the successful production of Crusader insurance policies. Policy acquisition costs that are eligible for deferral are deferred and amortized as the related premium is earned and are limited to their estimated realizable value based on the related unearned premium plus investment income less anticipated losses and loss adjustment expenses. Ceding commission applicable to the unexpired terms of policies in force is recorded as unearned ceding commission, which is included in deferred policy acquisition costs.
Reinsurance
Crusader employs reinsurance to provide greater diversification of business allowing management to control exposure to potential losses arising from large risks by reinsuring certain levels of risk in various areas of exposure, to reduce the loss that may arise from catastrophes, and to provide additional capacity for growth. Prepaid reinsurance premium and reinsurance receivables are reported as assets and represent ceded unearned premium and reinsurance recoverable on both paid and unpaid losses and loss adjustment expenses, respectively. Amounts recoverable from reinsurers are estimated in a manner consistent with the claim liability associated with the reinsured policies. Crusader evaluates each of its ceded reinsurance contracts at its inception to determine if there is sufficient risk transfer to allow the contract to be accounted for as reinsurance under current accounting literature. As of December 31, 2016, all such ceded contracts are accounted for as risk transfer reinsurance.
Crusader evaluates and monitors the financial condition of its reinsurers and factors such as collection periods, disputes, applicable coverage defenses and other factors to assess the need for any allowance against anticipated reinsurance recoveries. No such allowance was considered necessary at December 31, 2016 or 2015.
57 of 89
Segment Reporting
ASC Topic 280, “Segment Reporting,” establishes standards for the way information about operating segments are reported in financial statements. The Company has identified its insurance company operation as its primary reporting segment. Revenues from this segment comprised 92% of consolidated revenues for the year ended December 31, 2016, 91% of consolidated revenues for the year ended December 31, 2015, and 90% of consolidated revenues for the year ended December 31, 2014. The Company’s remaining operations constitute a variety of specialty insurance services, each with unique characteristics and individually insignificant to consolidated revenues.
The insurance company operation is conducted through Crusader, which as of December 31, 2016, was licensed as an admitted insurance carrier in the states of Arizona, California, Nevada, Oregon, and Washington. Crusader is a multi-line property and casualty insurance company, which began transacting business on January 1, 1985. For the years ended December 31, 2016, 2015, and 2014, 98% of Crusader’s business was commercial multi-peril (CMP) insurance policies. CMP policies provide a combination of property and liability coverage for businesses. Commercial property coverage insures against loss or damage to buildings, inventory and equipment from natural disasters, including hurricanes, windstorms, hail, water, explosions, severe winter weather, and other events such as theft and vandalism, fires and storms and financial loss due to business interruption resulting from covered property damage. However, Crusader does not write earthquake coverage. Commercial liability coverage insures against third party liability from accidents occurring on the insured’s premises or arising out of its operations, such as injuries sustained from products sold or the operation of the insured’s premises. In addition to CMP policies, Crusader also writes separate policies to insure commercial property and commercial liability risks on a mono-line basis.
Revenues, income before income taxes and assets by segment are as follows:
| Year ended December 31 | ||||||||||||
| 2016 | 2015 | 2014 | ||||||||||
| Revenues | ||||||||||||
| Insurance company operation | $ | 32,453,601 | $ | 30,420,988 | $ | 27,466,597 | ||||||
| Other insurance operations | 13,431,802 | 12,811,385 | 11,991,554 | |||||||||
| Intersegment eliminations (1) | (10,617,679 | ) | (9,967,734 | ) | (8,987,911 | ) | ||||||
| Total other insurance operations | 2,814,123 | 2,843,651 | 3,003,643 | |||||||||
| Total revenues | $ | 35,267,724 | $ | 33,264,639 | $ | 30,470,240 | ||||||
| Income (loss) before income taxes | ||||||||||||
| Insurance company operation | $ | (1,043,318 | ) | $ | 1,161,930 | $ | 3,552,323 | |||||
| Other insurance operations | (1,070,920 | ) | (2,896,888 | ) | (2,255,818 | ) | ||||||
| Total income (loss) before income taxes | $ | (2,114,238 | ) | $ | (1,734,958 | ) | $ | 1,296,505 | ||||
| Assets | ||||||||||||
| Insurance company operation | $ | 124,325,620 | $ | 118,482,261 | $ | 123,048,404 | ||||||
| Intersegment eliminations (2) | (1,579,820 | ) | (1,409,797 | ) | (1,657,750 | ) | ||||||
| Total insurance company operation | 122,745,800 | 117,072,464 | 121,390,654 | |||||||||
| Other insurance operations | 15,476,405 | 23,097,971 | 14,624,915 | |||||||||
| Total assets | $ | 138,222,205 | $ | 140,170,435 | $ | 136,015,569 | ||||||
(1) Intersegment revenue eliminations reflect rents paid by Unico to Crusader for space leased in the Calabasas building and commissions paid by Crusader to Unifax Insurance Systems, Inc. (“Unifax”), a subsidiary of Unico.
(2) Intersegment asset eliminations reflect the elimination of Crusader receivables from Unifax and Unifax payables to Crusader.
Concentration of Risks
99.5%, 99.5%, and 99.8% of Crusader’s direct written premium was derived from California during the years ended December 31, 2016, 2015, and 2014, respectively. In 2016, approximately 40% and 41% of the $959,810 commission income from the Company’s health insurance program was from Guardian Life Insurance Company of America dental and group life plan programs and the Blue Shield Care Trust health and life insurance programs, respectively. In 2015, approximately 39% and 40% of the $960,670 commission income from the Company’s health insurance program was from Guardian Life Insurance Company of America dental and group life plan programs and the Blue Shield Care Trust health and life insurance programs, respectively. In 2014, approximately 38% and 39% of the $1,082,412 commission income from the Company’s health insurance program was from Guardian Life Insurance Company of America dental and group life plan programs and the Blue Shield Care Trust health and life insurance programs, respectively.
58 of 89
Crusader’s reinsurance recoverable on paid and unpaid losses and loss adjustment expenses is as follows:
Name of Reinsurer |
A.M. Best Rating | Amount Recoverable as of December 31, 2016 | Amount Recoverable as of December 31, 2015 | |||||||
| Renaissance Reinsurance U.S.,Inc. | A | $ | 5,392,811 | $ | 5,835,678 | |||||
| Hannover Ruckversicherungs AG | A+ | 2,720,850 | 2,813,283 | |||||||
| TOA Reinsurance of America | A+ | 1,667,336 | 1,739,410 | |||||||
| Other | A | 717 | (87 | ) | ||||||
| Total | $ | 9,781,714 | $ | 10,388,284 |
Stock-Based Compensation
Share-based compensation expense for all share-based payment awards granted or modified on or after January 1, 2006, is based on the grant-date fair value estimated in accordance with the provisions of ASC Topic 718, “Compensation - Stock Compensation” using the modified prospective transition method.
Recently Issued Accounting Standards
In June 2016, the Financial Accounting Standards Board (“FASB”) issued Accounting Standards Update (“ASU”) 2016-13 “Measurement of Credit Losses on Financial Instruments.” ASU 2016-13 replaces the current incurred loss methodology for recognizing credit losses with a current expected credit loss model, which requires the measurement of all expected credit losses for financial assets held at the reporting date based on historical experience, current conditions, and reasonable and supportable forecasts. ASU 2016-13 also requires enhanced disclosures for better understanding of significant estimates and judgments used in estimating credit losses. The Company is currently evaluating the effect ASU 2016-13 will have on the Company's consolidated financial statements, but expects the primary changes to be (i) the use of the expected credit loss model for its premium receivables and reinsurance recoverables and (ii) the presentation of credit losses within the available-for-sale fixed maturities portfolio through an allowance method rather than as a direct write-down. ASU 2016-13 will become effective for fiscal years beginning after December 31, 2019, but provides for an early adoption for fiscal years beginning after December 31, 2018. The Company has not determined when it will adopt ASU 2016-13.
In February 2016, the FASB issued ASU 2016-02 “Leases.” This ASU requires lessees to recognize on the balance sheet the assets and liabilities for the rights and obligations created by all leases, including those historically accounted for as operating leases. The Company is currently evaluating the effect ASU 2016-02 will have on the Company's consolidated financial statements. The guidance is effective for interim and annual periods beginning after December 31, 2018, and will be applied under a modified retrospective approach for leases that exist or are entered into after the beginning of the earliest comparative period in the consolidated financial statements.
In November 2016, the FASB issued ASU 2016-18 “Statement of Cash Flows: Restricted Cash.” The ASU requires that a statement of cash flows explain the change during the period of cash, cash equivalents, and amounts generally described as restricted cash or restricted cash equivalents. Amounts generally described as restricted cash and restricted cash equivalents should be included with cash and cash equivalents when reconciling the beginning-of-period and end-of-period total amounts shown on the statements of cash flows. The Company early adopted this ASU as of December 31, 2016, and the ASU was applied using a retrospective approach for each period presented. Upon adoption of this ASU, the Company's consolidated statements of cash flows included restricted cash in the beginning-of-period and end-of-period total amounts for cash and restricted cash. The ASU did not have a material impact on the Company’s consolidated financial statements, but the ASU required additional disclosures in “Note 2 – Cash and Restricted Cash” to these consolidated financial statements and will require additional disclosure to interim reporting periods in 2017.
59 of 89
In May 2015, the FASB issued ASU 2015-09 “Disclosures About Short-Duration Contracts.” The objective of this ASU is to increase transparency about significant estimates in unpaid losses and loss adjustment expenses and provide additional information about amount, timing and uncertainty of cash flows related to unpaid losses and loss adjustment expenses. ASU 2015-09 also requires entities to disclose information about significant changes in methodologies and assumptions used to calculate the liability for loss and loss expense reserves, including reasons for the change and the effects on the financial statements. ASU 2015-09 also requires entities to disclose a roll forward of the liability of loss and loss expense reserves for annual and interim reporting periods. The effective date of ASU 2015-09 is for annual reporting periods beginning after December 15, 2015, and interim reporting periods beginning after December 15, 2016. The Company adopted this ASU as of December 31, 2016. The ASU did not have a material impact on the Company’s consolidated financial statements, but the ASU required additional disclosures in “Note 8 – Unpaid Losses and Loss Adjustment Expenses” and in “Note 21 – Supplementary Information on Loss and ALAE Development (Unaudited),” to these consolidated financial statements and will require additional disclosure to interim reporting periods in 2017.
NOTE 2 – CASH AND RESTRICTED CASH
The following table provides a reconciliation of cash and restricted cash reported within the consolidated balance sheets to the amounts shown in the consolidated statements of cash flows:
| Year ended December 31 | ||||||||
| 2016 | 2015 | |||||||
| Cash | $ | 122,586 | $ | 334,495 | ||||
| Restricted cash | 13,373,793 | 7,924,178 | ||||||
| Cash and restricted cash | $ | 13,496,379 | $ | 8,258,673 | ||||
The restricted cash is represented by two cash deposits placed by Crusader with the Los Angeles Superior Court in lieu of appeal bonds. In December 2015, a judgment was finalized on a Crusader policy liability claim. Crusader is appealing the judgment. As a part of the appeal, Crusader deposited $7,924,178 in cash with the Los Angeles Superior Court on December 28, 2015, in lieu of an appeal bond. This cash deposit was required to appeal the judgment. In March 2016, an additional judgment for plaintiff’s attorney fees and costs on this Crusader policy liability claim was finalized. The Company is also appealing this additional judgment. That additional appeal required an additional $5,449,615 cash deposit which was made on March 21, 2016, in lieu of an appeal bond.
NOTE 3 – ADVANCE PREMIUM AND PREMIUM DEPOSITS
The insurance company operation records an advance premium liability that represents the deposits on written premium on policies that have been submitted to the Company and are bound, billed, and recorded prior to their effective date of coverage. The advance premium is not included in written premium or in the liability for unearned premium.
Some of the Company’s health and life programs require payments of premium prior to the effective date of coverage; and, accordingly, invoices are sent out as early as two months prior to the coverage effective date. Insurance premium received for coverage months effective after the balance sheet date are recorded as advance premium.
NOTE 4 – INVESTMENTS
A summary of total investment income and net realized losses is as follows:
| Year ended December 31 | ||||||||||||
| 2016 | 2015 | 2014 | ||||||||||
| Fixed maturities (1) | $ | 862,783 | $ | 430,828 | $ | 102,471 | ||||||
| Short-term investments | 18,363 | 48,536 | 59,267 | |||||||||
| Total investment income on invested assets | 881,146 | 479,364 | 161,738 | |||||||||
| Net realized losses | (1,278 | ) | (7,251 | ) | — | |||||||
| Total investment income and net realized losses | $ | 879,868 | $ | 472,113 | $ | 161,738 | ||||||
(1) Investment income from fixed maturities included $113,394, $0, and $0 of interest on the restricted cash for the years ended December 31, 2016, 2015, and 2014.
60 of 89
The amortized cost and estimated fair value of fixed maturity investments at December 31, 2016, by contractual maturity are as follows:
Amortized Cost | Estimated Fair Value | |||||||
| Due in one year or less | $ | 52,273,745 | $ | 52,286,222 | ||||
| Due after one year through five years | 28,098,097 | 28,097,703 | ||||||
| Total fixed maturities | $ | 80,371,842 | $ | 80,383,925 |
Expected maturities will differ from contractual maturities because borrowers may have the right to call or prepay obligations with or without penalties.
The amortized cost and estimated fair values of investments in fixed maturities by category are as follows:
Amortized Cost | Gross Unrealized Gains | Gross Unrealized Losses | Estimated Fair Value | |||||||||||||
| December 31, 2016 | ||||||||||||||||
| Available-for-sale: | ||||||||||||||||
| Fixed maturities | ||||||||||||||||
| Certificates of deposit | $ | 61,280,000 | $ | — | $ | — | $ | 61,280,000 | ||||||||
| U.S. treasury securities | 19,091,842 | 14,205 | (2,122 | ) | 19,103,925 | |||||||||||
| Total fixed maturities | $ | 80,371,842 | $ | 14,205 | $ | (2,122 | ) | $ | 80,383,925 | |||||||
| December 31, 2015 | ||||||||||||||||
| Available-for-sale: | ||||||||||||||||
| Fixed maturities | ||||||||||||||||
| Certificates of deposit | $ | 58,127,000 | $ | — | $ | — | $ | 58,127,000 | ||||||||
| U.S. treasury securities | 24,075,727 | 3,188 | (44,624 | ) | 24,034,291 | |||||||||||
| Total fixed maturities | $ | 82,202,727 | $ | 3,188 | $ | (44,624 | ) | $ | 82,161,291 |
A summary of the unrealized gains (losses) on investments carried at fair value and the applicable deferred federal income taxes is shown below:
| Year ended December 31 | ||||||||
| 2016 | 2015 | |||||||
| Gross unrealized gains of fixed maturities | $ | 14,205 | $ | 3,188 | ||||
| Gross unrealized (losses) of fixed maturities | (2,122 | ) | (44,624 | ) | ||||
| Net unrealized gains (losses) on investments | 12,083 | (41,436 | ) | |||||
| Deferred federal tax (expense) benefit | (4,108 | ) | 14,088 | |||||
| Net unrealized gains (losses), net of deferred income taxes | $ | 7,975 | $ | (27,348 | ) | |||
The Company had no fixed maturity investments with gross unrealized losses for a continuous period of less than 12 months and three U.S. treasury securities with gross unrealized losses for a continuous period of more than 12 months as of December 31, 2016. The Company had three U.S. treasury securities with gross unrealized losses for a continuous period of less than 12 months and two U.S. treasury securities with gross unrealized losses for a continuous period of more than 12 months as of December 31, 2015.
The Company monitors its investments closely. If an unrealized loss is determined to be other-than-temporary, it is written off as a realized loss through the Consolidated Statements of Operations. The Company’s methodology of assessing other-than-temporary impairments is based on security-specific analysis as of the balance sheet date and considers various factors including the length of time to maturity and the extent to which the fair value has been less than the cost, the financial condition and the near-term prospects of the issuer, and whether the debtor is current on its contractually obligated interest and principal payments. The unrealized losses on the U.S. treasury securities in unrealized loss positions as of December 31, 2016, and December 31, 2015, were determined to be temporary.
61 of 89
Although the Company does not intend to sell its fixed maturity investments prior to maturity, the Company may sell investment securities from time to time in response to cash flow requirements, economic and/or market conditions. The Company sold three certificates of deposit prior to their maturity during the year ended December 31, 2016. These securities had amortized cost of $746,000. The Company realized an investment loss of $1,278 on the sale. Proceeds of the sales of these securities were used for general corporate purposes. The Company sold 22 certificates of deposit prior to their maturity during the year ended December 31, 2015. These securities had amortized cost of $5,478,000. The Company realized an investment loss of $7,251 on the sale. Proceeds of the sale of these securities were used to fund the $7,924,178 cash deposit placed by Crusader with the Los Angeles Superior Court on December 28, 2015, in lieu of an appeal bond. The Company did not sell any fixed maturity investments, and there were no realized investment gains or losses during the year ended December 31, 2014.
The Company’s investment in certificates of deposit included $60,780,000 and $57,527,000 of brokered certificates of deposit as of December 31, 2016, and December 31, 2015, respectively. Brokered certificates of deposit provide the safety and security of a certificate of deposit combined with the convenience gained by one-stop shopping for rates at various institutions. This allows the Company to spread its investments across multiple institutions so that all of its certificates of deposit are insured by the Federal Deposit Insurance Corporation (“FDIC”). Brokered certificates of deposit are purchased through UnionBanc Investment Services, LLC, a registered broker-dealer, investment advisor, member of FINRA/SIPC, and a subsidiary of MUFG Union Bank, N.A. Brokered certificates of deposit are a direct obligation of the issuing depository institution, are bank products of the issuing depository institution, are held by Union Bank Global Custody Services for the benefit of the Company, and are FDIC insured within permissible limits.
The following securities from four different banks represent statutory deposits that are assigned to and held by the California State Treasurer and the Insurance Commissioner of the State of Nevada. These deposits are required for writing certain lines of business in California and for admission in the state of Nevada.
| Year ended December 31 | ||||||||
| 2016 | 2015 | |||||||
| Certificates of deposit | $ | 500,000 | $ | 600,000 | ||||
| Short-term investments | 100,000 | _- | ||||||
| Total state held deposits | $ | 600,000 | $ | 600,000 | ||||
All the Company’s brokered and non-brokered certificates of deposit are within the FDIC insured permissible limits. Due to nature of the Company’s business, certain bank accounts may exceed FDIC insured permissible limits.
Short-term investments have an initial maturity of one year or less and consist of the following:
| Year ended December 31 | ||||||||
| 2016 | 2015 | |||||||
| U.S. treasury bills | $ | — | $ | 9,987,804 | ||||
| U.S. treasury money market fund | 8,542,292 | 3,357,841 | ||||||
| Certificates of deposit | 1,098,000 | 1,346,000 | ||||||
| Bank money market accounts | 562,548 | 947,395 | ||||||
| Bank savings accounts | 1,763 | 1,763 | ||||||
| Total short-term investments | $ | 10,204,603 | $ | 15,640,803 | ||||
NOTE 5 – FAIR VALUE OF FINANCIAL INSTRUMENTS
In determining the fair value of its financial instruments, the Company employs a fair value hierarchy that prioritizes the inputs for the valuation techniques used to measure fair value. The fair value of a financial instrument is the amount that would be received to sell an asset or paid to transfer a liability in an orderly transaction between market participants at the measurement date (the exit price). Financial assets and financial liabilities recorded on the Consolidated Balance Sheets at fair value are categorized based on the reliability of inputs for the valuation techniques as follows:
62 of 89
Level 1 – Financial assets and financial liabilities whose values are based on unadjusted quoted prices in active markets for identical assets or liabilities as of the reporting date.
Level 2 – Financial assets and financial liabilities whose values are based on quoted prices for similar assets or liabilities in active markets; quoted prices for identical or similar assets or liabilities in non-active markets; or valuation models whose inputs are observable, directly or indirectly, for substantially the full term of the asset or liability as of the reporting date.
Level 3 – Financial assets and financial liabilities whose values are based on prices or valuation techniques that require inputs that are both unobservable and significant to the overall fair value measurement. These inputs reflect the Company’s estimates of the assumptions that market participants would use in valuing the financial assets and financial liabilities as of the reporting date.
The hierarchy gives the highest priority to Level 1 inputs and the lowest priority to Level 3 inputs. In certain cases, the inputs used to measure fair value may fall into different levels of the fair value hierarchy. In such cases, the fair value hierarchy level within which the fair value measurement in its entirety falls has been determined based on the lowest level input that is significant to the fair value measurement in its entirety. Thus, a Level 3 fair value measurement may include inputs that are observable (Level 1 or Level 2) or unobservable (Level 3). The Company’s assessment of the significance of a particular input to the fair value measurement in its entirety requires judgment and considers factors specific to the asset or liability.
The following table presents information about the Company’s financial instruments and their estimated fair values, which are measured on a recurring basis, allocated among the three levels within the fair value hierarchy as of December 31, 2016 and 2015:
| Level 1 | Level 2 | Level 3 | Total | |||||||||||||
| December 31, 2016 | ||||||||||||||||
| Financial instruments: | ||||||||||||||||
| Fixed maturities securities: | ||||||||||||||||
| U.S. treasury securities | $ | 19,103,925 | $ | — | $ | — | $ | 19,103,925 | ||||||||
| Certificates of deposit | — | 61,280,000 | — | 61,280,000 | ||||||||||||
| Total fixed maturity securities | 19,103,925 | 61,280,000 | — | 80,383,925 | ||||||||||||
| Cash and restricted cash | 13,496,379 | — | — | 13,496,379 | ||||||||||||
| Short-term investments | 10,204,603 | — | — | 10,204,603 | ||||||||||||
| Total financial instruments at fair value | $ | 42,804,907 | $ | 61,280,000 | $ | — | $ | 104,084,907 | ||||||||
| December 31, 2015 | ||||||||||||||||
| Financial instruments: | ||||||||||||||||
| Fixed maturities securities: | ||||||||||||||||
| U.S. treasury securities | $ | 24,034,291 | $ | — | $ | — | $ | 24,034,291 | ||||||||
| Certificates of deposit | — | 58,127,000 | — | 58,127,000 | ||||||||||||
| Total fixed maturity securities | 24,034,291 | 58,127,000 | — | 82,161,291 | ||||||||||||
| Cash and restricted cash | 8,258,673 | — | — | 8,258,673 | ||||||||||||
| Short-term investments | 15,640,803 | — | — | 15,640,803 | ||||||||||||
| Total financial instruments at fair value | $ | 47,933,767 | $ | 58,127,000 | $ | — | $ | 106,060,767 |
Fair value measurements are not adjusted for transaction costs. The Company recognizes transfers between levels at either the actual date of the event or a change in circumstances that caused the transfer. The Company did not have any transfers between Levels 1, 2 and 3 of the fair value hierarchy during the years ended December 31, 2016 and 2015.
63 of 89
NOTE 6 – PROPERTY AND EQUIPMENT, NET
Property and equipment consist of the following:
| Year ended December 31 | ||||||||
| 2016 | 2015 | |||||||
| Building and tenant improvements, located in Calabasas, California | $ | 8,339,807 | $ | 8,217,477 | ||||
| Furniture, fixtures, equipment | 2,673,670 | 2,251,623 | ||||||
| Accumulated depreciation and amortization | (2,687,607 | ) | (2,204,027 | ) | ||||
| Land located in Calabasas, California | 1,787,485 | 1,787,485 | ||||||
| Computer software under development | 169,177 | 168,162 | ||||||
| Property and equipment, net | $ | 10,282,532 | $ | 10,220,720 | ||||
Depreciation on the Calabasas building is computed using the straight line method over 39 years. Improvements to the building structure are amortized over the useful life of the improvements. Depreciation on furniture, fixtures and equipment in the Calabasas building is computed using the straight line method over 3 to 15 years. Amortization of tenant improvements in the Calabasas building is being computed using the shorter of the useful life of the tenant improvements or the remaining years of the lease.
Depreciation on furniture, fixtures and equipment located in Woodland Hills office building previously leased by the Company was computed using the straight line method over 3 to 7 years. Amortization of leasehold improvements on property located in Woodland Hills was computed using the shorter of the useful life of the leasehold improvements or the remaining years of the lease.
Depreciation and amortization expense on all property and equipment for the years ended December 31, 2016, 2015, and 2014, were $483,580, $341,264, and $539,608, respectively.
For the years ended December 31, 2016, 2015, and 2014, the Calabasas building has generated rental revenue in the amount of $990,013, $364,674, and $815,601, and incurred operating expenses in the amount of $722,442, $644,250, and $781,988 which included depreciation, respectively. These amounts are included in “Other income” from insurance company operation and other operating expenses, respectively, in the Company’s Consolidated Statements of Operations.
On October 9, 2015, the Company moved its home office into the Calabasas building. The Company’s month-to-month lease of its home office in Woodland Hills, California, ended effective October 15, 2015. At the time the Company relocated to its Calabasas building, certain furniture, fixtures, equipment and all leasehold improvements located in Woodland Hills were abandoned. These assets had a cost of $775,204 and were fully amortized or depreciated, and therefore, had a zero basis. Fixed assets with a cost basis of $1,846,608 and accumulated depreciation of $1,553,110 were relocated from Woodland Hills to Calabasas.
The total square footage of the Calabasas building is 46,884, including common areas. As of December 31, 2016, 10,292 square feet of the Calabasas building was leased to non-affiliated entities, and 4,189 square feet was vacant and available to be leased to non-affiliated entities.
The Company capitalizes certain computer software costs purchased from outside vendors for internal use. These costs also include configuration and customization activities, coding, testing and installation. Training costs and maintenance are expensed as incurred, while upgrade and enhancements are capitalized if it is probable that such expenditure will result in additional functionality. The capitalized costs are not depreciated until the software is placed into production.
On October 9, 2015, the Company concluded that a charge for impairment of the Company’s capitalized computer software costs, related to a contract entered into on November 1, 2012, was required under GAAP. The capitalized costs included $1,287,460 of paid and $223,442 of accrued unpaid invoices from the software vendor, Insurance Systems, Inc. (“ISI”). The impact of this impairment to the Company’s Consolidated Statements of Operations was a charge of $1,287,460 before income taxes. The charge is included in “Other operating expenses” in the Consolidated Statements of Operations for year ended December 31, 2015. The decision to impair the asset was based on the Company’s beliefs that the ISI software had not achieved and would not be able to achieve the Company’s expected implementation targets and that the Company was unable to renegotiate the terms of its agreement with ISI. The Company believes that it will need to make future cash expenditures to replace or upgrade its policy administration system but it is unable to estimate the amount at this time. While the Company’s policy administration system continues to support the Company’s existing operations, the Company believes it would realize more competitive parity with respect to product and service by switching or upgrading to a more contemporary platform. The Company engaged outside IT advisors to assist it in evaluating its alternatives.
64 of 89
NOTE 7 – RECEIVABLES, NET
Receivables, net, include premium, commissions and notes receivable and are as follows:
| Year ended December 31 | ||||||||
| 2016 | 2015 | |||||||
| Premium and commission receivable | $ | 1,826,934 | $ | 2,001,609 | ||||
| Premium finance notes receivable | 5,365,667 | 4,689,040 | ||||||
| Total premium and notes receivable | 7,192,601 | 6,690,649 | ||||||
| Allowance for doubtful accounts | (1,184,518 | ) | (1,185,288 | ) | ||||
| Receivables, net | $ | 6,008,083 | $ | 5,505,361 | ||||
Premium receivable and premium finance notes receivables are substantially secured by unearned premium and funds held as security for performance. Premium finance notes receivable represents the balance due to AAC, the Company's premium finance subsidiary, from policyholders who elected to finance their premium over a nine-month term. These notes are net of unearned finance charges and credit loss reserves.
One of the Company’s agents, which was appointed in 2008 to assist the Company in implementing its Trucking Program, failed to pay the net premium and policy fees due Unifax, the exclusive general agent for Crusader. The agent was initially late in paying its February 2009 production that was due to Unifax on April 15, 2009. In May 2009, as a result of the agent’s failure to timely pay its balance due to Unifax, the Company terminated its agency agreement and assumed ownership and control of that agent’s policy expirations written with the Company. The Company subsequently commenced legal proceedings against the agent corporation, its three principals (who personally guaranteed the agent’s obligations) and another individual for the recovery of the balance due and any related recovery costs incurred. All related recovery costs have been expensed as incurred. The agent corporation and two of its principals filed bankruptcy. The corporation was adjudicated bankrupt. The Company obtained judgments, non-dischargeable in bankruptcy, for the full amount due from the two principals who filed bankruptcy. The other principal stipulated to a judgment of $1,200,000. The claim against the fourth individual was resolved. The Company collected $0, $0, and $75,000 during the years ended December 31, 2016, 2015, and 2014. As of December 31, 2016 and 2015, the agent’s balance due to Unifax was $1,181,272. As of December 31, 2016 and 2015, the Company’s bad debt reserve associated with this matter was $1,181,272, which represents 100% of the balance due to Unifax. Although the receivable is fully reserved for financial reporting purposes at December 31, 2016, the Company continues to pursue collection of the judgments from the three principals. Bad debt expense was $5,833, $(1,460), and $255,299 for the years ended December 31, 2016, 2015, and 2014, respectively.
NOTE 8 – UNPAID LOSSES AND LOSS ADJUSTMENT EXPENSES
Crusader’s loss and loss adjustment expense case and incurred but not reported (“IBNR”) reserves are as follows:
| Year ended December 31 | ||||||||
| 2016 | 2015 | |||||||
| Direct reserves: | ||||||||
| Case reserves | $ | 16,384,081 | $ | 17,991,121 | ||||
| IBNR reserves | 30,671,706 | 31,102,450 | ||||||
| Total direct reserves | $ | 47,055,787 | $ | 49,093,571 | ||||
| Reserves net of reinsurance: | ||||||||
| Case reserves | $ | 12,458,646 | $ | 14,696,913 | ||||
| IBNR reserves | 25,076,171 | 24,759,697 | ||||||
| Total net reserves | $ | 37,534,817 | $ | 39,456,610 | ||||
65 of 89
Reserves for losses and loss adjustment expenses before reinsurance for each of Crusader’s lines of business are as follows:
| Year ended December 31 | ||||||||||||||||
| Line of Business | 2016 | 2015 | ||||||||||||||
| Commercial multi-peril | $ | 46,100,751 | 98.0 | % | $ | 48,167,640 | 98.1 | % | ||||||||
| Other liability | 912,014 | 1.9 | % | 889,867 | 1.8 | % | ||||||||||
| Other | 43,022 | 0.1 | % | 36,064 | 0.1 | % | ||||||||||
| Total | $ | 47,055,787 | 100.0 | % | $ | 49,093,571 | 100.0 | % | ||||||||
The Company‘s consolidated financial statements include estimated reserves for unpaid losses and related loss adjustment expenses of the insurance company operation. Crusader sets loss and loss adjustment expense reserves at each balance sheet date based upon management’s best estimate of the ultimate payments that it anticipates will be made to settle all losses incurred and all related loss adjustment expenses incurred as of that date for both reported and unreported claims.
The following table provides an analysis of the roll forward of Crusader’s loss and loss adjustment expense reserves, including a reconciliation of the ending balance sheet liability for the periods indicated:
| Year ended December 31 | ||||||||||||
| 2016 | 2015 | 2014 | ||||||||||
| Reserve for unpaid losses and loss adjustment expenses at beginning of year – net of reinsurance | $ | 39,456,610 | $ | 39,233,783 | $ | 39,448,546 | ||||||
| Incurred losses and loss adjustment expenses: | ||||||||||||
| Provision for insured events of current year | 22,850,408 | 21,607,628 | 17,925,882 | |||||||||
| Decrease in provision for incurred events of prior years | (23,530 | ) | (2,444,312 | ) | (3,308,764 | ) | ||||||
| Total incurred losses and loss adjustment expenses | 22,826,878 | 19,163,316 | 14,617,118 | |||||||||
| Payments: | ||||||||||||
| Losses and loss adjustment expenses attributable to insured events of the current year | 7,984,562 | 6,812,275 | 4,286,861 | |||||||||
| Losses and loss adjustment expenses attributable to insured events of prior years | 16,764,109 | 12,128,214 | 10,545,020 | |||||||||
| Total payments | 24,748,671 | 18,940,489 | 14,831,881 | |||||||||
| Reserve for unpaid losses and loss adjustment expenses at end of year – net of reinsurance | 37,534,817 | 39,456,610 | 39,233,783 | |||||||||
| Reinsurance recoverable on unpaid losses and loss adjustment expenses at end of year | 9,520,970 | 9,636,961 | 5,162,775 | |||||||||
| Reserve for unpaid losses and loss adjustment expenses at end of year per balance sheet, gross of reinsurance | $ | 47,055,787 | $ | 49,093,571 | $ | 44,396,558 | ||||||
At each review period, actual claims costs that emerge are compared with the claims costs that were expected to emerge during that development period. Sometimes the previous claims costs estimates prove to have been too high; sometimes they prove to have been too low. In the case of Crusader, the estimates proved to be too high in each of the years reflected in the table. The favorable development in the 2014 through 2016 calendar years underscores the inherent uncertainty in insurance claims costs, especially for a very small insurer. Management reviews claims costs that appear to be different from the historical claims costs to determine whether those differences are a normal part of the process or an indication that a change in reserve assumptions is appropriate. Management concluded that the differences noted above are differences between actual and expected claims costs that emerge from time to time, particularly in an insurer the size of Crusader.
66 of 89
The following table presents loss development information by accident year, including cumulative incurred and paid losses and allocated loss adjustment expenses (“ALAE”), net of reinsurance, as well as cumulative claim frequency and the total of incurred but not reported liabilities plus expected development on reported claims as of December 31, 2016:
Accident Year |
Cumulative Incurred |
Cumulative Paid | Total of Incurred But Not Reported Liabilities Plus Expected Development on Reported Claims |
Cumulative Number of Reported Claims | ||||||||||||||
| 2007 | $ | 24,023,109 | $ | 24,023,106 | $ | — | 1,013 | |||||||||||
| 2008 | 17,617,589 | 17,593,260 | — | 921 | ||||||||||||||
| 2009 | 18,554,526 | 17,550,304 | 842,316 | 1,013 | ||||||||||||||
| 2010 | 17,641,161 | 16,778,214 | 682,675 | 974 | ||||||||||||||
| 2011 | 18,224,634 | 17,422,583 | 642,817 | 1,020 | ||||||||||||||
| 2012 | 18,050,131 | 16,734,967 | 794,910 | 961 | ||||||||||||||
| 2013 | 21,742,580 | 19,067,334 | 1,430,773 | 839 | ||||||||||||||
| 2014 | 14,930,960 | 9,173,947 | 3,433,848 | 732 | ||||||||||||||
| 2015 | 20,840,034 | 11,151,955 | 6,440,742 | 686 | ||||||||||||||
| 2016 | 21,646,663 | 7,435,120 | 10,808,090 | 696 | ||||||||||||||
| Total | $ | 193,271,387 | $ | 156,930,790 | $ | 25,076,171 |
The following table reconciles the above cumulative incurred and paid data to Crusader’s loss and loss adjustment expense reserves as of December 31, 2016:
| December 31 | ||||
| 2016 | ||||
| Cumulative incurred losses and ALAE | $ | 193,271,387 | ||
| Less: cumulative paid losses and ALAE | (156,930,790 | ) | ||
| Reserve for unpaid losses and ALAE (accident years 2007 to 2016) | 36,340,597 | |||
| Reserves for unpaid losses and ALAE (accident years prior to 2007) | 109,898 | |||
| Reserves for unpaid unallocated loss adjustment expenses | 1,084,322 | |||
| Reserve for unpaid losses and loss adjustment expenses, net of reinsurance | 37,534,817 | |||
| Reinsurance recoverable on unpaid losses and loss adjustment expenses | 9,520,970 | |||
| Reserve for unpaid losses and loss adjustment expenses, gross of reinsurance | $ | 47,055,787 | ||
Crusader's liability for unpaid loss and loss adjustment expense reserves consists of case reserves and reserves for IBNR claims. Case reserves are established by claims personnel based on a review of the facts known at the time the claim is reported and are subsequently revised as more information about a claim becomes known. IBNR is estimated using various actuarial methods and techniques and includes (1) reserves for losses and loss adjustment expenses on claims that have occurred but for which claims have not yet been reported to Crusader, and (2) a provision for expected future development on case reserves for information not currently known.
At the end of each fiscal quarter, Crusader’s reserves for each accident year (i.e., for all claims occurring within each year) are re-evaluated independently by the Company’s president, the Company’s chief financial officer, and an independent consulting actuary. Generally accepted actuarial methods, including the widely used Bornhuetter-Ferguson and loss development methods, are employed to estimate ultimate claims costs. An actuarial central estimate of the ultimate claims costs and IBNR reserves is ultimately determined by management and tested for reasonableness by the independent consulting actuary.
67 of 89
The Company determines the number of reported claims based on the number of loss events. A claim is considered a single loss event, per policy, and it may include multiple claimants and multiple coverages on a single policy. The cumulative number of reported claims is a sum of open claims, closed claims, and claims closed without payment.
NOTE 9 – DEFERRED POLICY ACQUISITION COSTS
The following table provides an analysis of the roll forward of the Company’s deferred policy acquisition costs:
| Year ended December 31 | ||||||||||||
| 2016 | 2015 | 2014 | ||||||||||
| Deferred policy acquisition costs at beginning of year | $ | 4,233,396 | $ | 3,882,825 | $ | 3,636,003 | ||||||
| Policy acquisition costs deferred during year | 7,094,052 | 6,815,803 | 6,232,930 | |||||||||
| Policy acquisition costs amortized during year | (6,895,149 | ) | (6,465,232 | ) | (5,986,108 | ) | ||||||
| Deferred policy acquisition costs at end of year | $ | 4,432,299 | $ | 4,233,396 | $ | 3,882,825 | ||||||
Deferred policy acquisition costs consist of commissions (net of ceding commission), premium taxes, inspection fees, and certain other underwriting costs, which are related to and vary with the production of Crusader policies. Policy acquisition costs are deferred and amortized as the related premium is earned. Deferred acquisition costs are reviewed to determine if they are recoverable from future income on insurance policies generated from these costs, including investment income.
NOTE 10 – LEASE COMMITMENT TO RELATED PARTY
Prior to October 9, 2015, the Company leased approximately 23,000 square feet of an office building located at 23251 Mulholland Drive, Woodland Hills, California. Erwin Cheldin, the Company's former president and a current director and principal stockholder, was the owner of the Woodland Hills building during the lease. The lease provided for an annual gross rent of $486,000 and was effective from April 1, 2012, through March 31, 2013. The lease provided for extension options at the same terms and conditions. The Company exercised its right to extend the lease through June 30, 2014, and the lease continued thereafter on a month-to-month basis. The Company believed that at the inception of the lease agreement, and at each subsequent extension, the terms of the lease were at least as favorable to the Company as could have been obtained from non-affiliated third parties. The Company utilized for its own operations 100% of the space it leased at the Woodland Hills building. The Company also leased storage space from Erwin Cheldin. Depending on usage, storage space rental was estimated to be approximately $15,000 annually. The total rent for the Woodland Hills building was $0, $406,796, and $501,258 for the years ended December 31, 2016, 2015, and 2014, respectively. The Company’s month-to-month lease of the home office in Woodland Hills, California, ended on October 15, 2015.
NOTE 11 – ACCRUED EXPENSES AND OTHER LIABILITIES
Accrued expenses and other liabilities consist of the following:
| Year ended December 31 | ||||||||
| 2016 | 2015 | |||||||
| Premium payable | $ | 614,926 | $ | 532,928 | ||||
| Unearned policy fee income | 811,838 | 839,810 | ||||||
| Retirement plans | 184,600 | 238,900 | ||||||
| Accrued salaries and employee benefits | 338,029 | 312,986 | ||||||
| Commission payable | 180,693 | 134,172 | ||||||
| Other | 530,897 | 384,488 | ||||||
| Total accrued expenses and other liabilities | $ | 2,660,983 | $ | 2,443,284 | ||||
NOTE 12 – COMMITMENTS AND CONTINGENCIES
The Company, by virtue of the nature of the business conducted by it, becomes involved in numerous legal proceedings as either plaintiff or defendant. The Company is also required to resort to legal proceedings from time to time in order to enforce collection of premium, commissions, or fees for the services rendered to customers or to their agents. These routine items of litigation do not materially affect the Company and are handled on a routine basis by the Company through its counsel.
68 of 89
The Company establishes reserves for lawsuits, regulatory actions and other contingencies for which the Company is able to estimate its potential exposure and believes a loss is probable. For loss contingencies believed to be reasonably possible, the Company discloses the nature of the loss contingency, an estimate of the possible loss, a range of loss, or a statement that such an estimate cannot be made.
Likewise, the Company is sometimes named as a cross-defendant in litigation, which is principally directed against an insured who was issued a policy of insurance directly or indirectly through the Company. Incidental actions related to disputes concerning the issuance or non-issuance of individual policies are sometimes brought by customers or others. These items are also handled on a routine basis by counsel, and they do not generally affect the operations of the Company. Management is confident that the ultimate outcome of pending litigation should not have an adverse effect on the Company's consolidated results of operations or financial position. The Company vigorously defends itself unless a reasonable settlement appears appropriate.
In December 2015, a judgment was finalized on a Crusader policy liability claim. Crusader is appealing the judgment. As a part of the appeal, Crusader deposited $7,924,178 in cash with the Los Angeles Superior Court on December 28, 2015, in lieu of an appeal bond. This cash deposit was required to appeal the judgment. In March 2016, an additional judgment for plaintiff’s attorney fees and costs on this Crusader policy liability claim was finalized. The Company is also appealing this additional judgment. That additional appeal required an additional cash deposit in lieu of an appeal bond of $5,449,615. The additional cash deposit was made on March 21, 2016. These cash deposits for the appeals represent 150% of the judgments. Management believes the ultimate outcome of this litigation will be covered by Crusader’s reinsurance. Since this litigation was related to a Crusader claim in its normal course of business, management’s best estimate for ultimate liability related to this litigation was included in Crusader’s loss and loss adjustment expense reserves as of December 31, 2016 and 2015.
NOTE 13 – REINSURANCE
A reinsurance transaction occurs when an insurance company transfers (cedes) a portion of its exposure on policies written to a reinsurer that assumes that risk for a premium (ceded premium). Reinsurance does not legally discharge the Company from primary liability under its policies. If the reinsurer fails to meet its obligations, the Company must nonetheless pay its policy obligations.
Crusader’s primary excess of loss reinsurance agreements during years ended December 31, 2016, 2015, and 2014 are as follows:
| Loss Years | Reinsurers | A.M. Best Rating | Retention | Annual Aggregate Deductible | ||||||||
| 2014 – 2016 | Renaissance Reinsurance U.S. Inc. & Hannover Ruckversicherungs AG & TOA Reinsurance of America | A A+ A+ | $ | 500,000 | $ | — | ||||||
In calendar years 2016, 2015, and 2014, Crusader retained a participation in its excess of loss reinsurance treaties of 10% in its 1st layer ($500,000 in excess of $500,000), 0% in its 2nd layer ($2,000,000 in excess of $1,000,000), and 0% in its property and casualty clash treaty.
Crusader’s excess of loss reinsurance treaties provided for a contingent commission for accident years 2006, 2004, and 2003. Crusader’s 2006 1st layer primary excess of loss reinsurance treaty provided for a contingent commission equal to 20% of the net profit, if any, accruing to the reinsurer. Crusader’s 2004 and 2003 1st layer primary excess of loss reinsurance treaties provided for a contingent commission to the Company equal to 45% of the net profit, if any, accruing to the reinsurer. Any contingent commission received was subject to return based on future development of ceded losses and loss adjustment expenses. The contingent commission income (loss) recognized was $0, $91,686, and $(17,092) for the years ended December 31, 2016, 2015, and 2014, respectively. As of December 31, 2016, the contingent commission agreements had expired, and all contingent commission income due on these agreements had been recognized. As of December 31, 2016 and 2015, the unearned contingent commission balance included in “Accrued expenses and other liabilities” in the Consolidated Balance Sheets was $0.
Crusader also has catastrophe reinsurance treaties from various highly rated California authorized and California unauthorized reinsurance companies. These reinsurance treaties help protect Crusader against losses in excess of certain retentions from catastrophic events that may occur on property risks which Crusader insures. In calendar year 2016, Crusader retained a participation in its catastrophe excess of loss reinsurance treaties of 5% in its 1st layer ($9,000,000 in excess of $1,000,000) and 0% in its 2nd layer ($36,000,000 in excess of $10,000,000). In calendar years 2015 and 2014, Crusader retained a participation in its catastrophe excess of loss reinsurance treaties of 5% in its 1st layer ($9,000,000 in excess of $1,000,000) and 0% in its 2nd layer ($31,000,000 in excess of $10,000,000).
69 of 89
Crusader has no reinsurance recoverable balances in dispute.
On most of the premium that Crusader cedes to the reinsurer, the reinsurer pays a commission to Crusader that includes a reimbursement of the cost of acquiring the portion of the premium that is ceded. Crusader does not currently assume any reinsurance. Crusader intends to continue obtaining reinsurance although the availability and cost may vary from time to time. The unpaid losses and loss adjustment expenses ceded to the reinsurer are recorded as an asset on the Consolidate Balance Sheets.
The effect of reinsurance on written premium, earned premium, and incurred losses and loss adjustment expenses is as follows:
| Year ended December 31 | ||||||||||||
| 2016 | 2015 | 2014 | ||||||||||
| Written premium: | ||||||||||||
| Direct business | $ | 38,749,097 | $ | 36,374,509 | $ | 32,810,088 | ||||||
| Reinsurance ceded | (6,124,575 | ) | (5,345,398 | ) | (5,025,798 | ) | ||||||
| Net written premium | $ | 32,624,522 | $ | 31,029,111 | $ | 27,784,290 | ||||||
| Earned premium: | ||||||||||||
| Direct business | $ | 37,453,619 | $ | 34,902,435 | $ | 31,463,691 | ||||||
| Reinsurance ceded | (6,097,248 | ) | (5,328,639 | ) | (5,090,268 | ) | ||||||
| Net earned premium | $ | 31,356,371 | $ | 29,573,796 | $ | 26,373,423 | ||||||
| Incurred losses and loss adjustment expenses: | ||||||||||||
| Direct | $ | 27,383,996 | $ | 26,495,410 | $ | 16,795,536 | ||||||
| Ceded | (4,557,118 | ) | (7,332,094 | ) | (2,178,418 | ) | ||||||
| Net incurred losses and loss adjustment expenses | $ | 22,826,878 | $ | 19,163,316 | $ | 14,617,118 | ||||||
Ceded earned premium as a percentage of direct earned premium was 16% in 2016, 15% in 2015, and 16% in 2014, respectively. Crusader did not assume any premium or losses during the years ended December 31, 2016, 2015, and 2014.
NOTE 14 – RETIREMENT PLANS
Profit Sharing Plan
The Unico American Corporation Profit Sharing Plan (“Plan”) covers Company’s employees who are at least 21 years of age and have met certain service and eligibility requirements. Unico American Corporation is the Plan sponsor and the Plan administrator. Fidelity Management Trust Company is the Plan trustee. The Plan is intended to be a qualified retirement plan under the Internal Revenue Code. As required by the Plan, on an annual basis, the Company must contribute 3% of participants’ eligible compensation to the account of each participant. In addition, pursuant to the terms of the Plan, the Company may contribute to participants an amount determined by the Board of Directors. Under the Plan, participants have the option to elect to make 401(k) and Roth 401(k) deferral contributions which are not matched by the Company. Participants must be employed by the Company on the last day of the Plan year to be eligible for a contribution. Participants are eligible to request a distribution of their vested account balance upon death, retirement, minimum required distributions and termination of employment. Effective November 1, 2015, the Company’s Money Purchase Plan was merged into the Plan.
Money Purchase Plan
The Unico American Corporation Money Purchase Plan covered executive officers of the Company and an officer of a subsidiary of the Company. Pursuant to the terms of this plan, the Company annually contributed to the account of each participant an amount equal to a percentage of the participant's eligible compensation as determined by the Board of Directors. However, amounts contributed to the Plan were considered first in determining the actual amount available under the Internal Revenue Service maximum contribution limits. Participants were required to be employed by the Company on the last day of the plan year to be eligible for contribution. Participants were entitled to receive distribution of benefits under this plan upon retirement, termination of employment, death, or disability. Effective November 1, 2015, the Company’s Money Purchase Plan was merged into the Plan.
70 of 89
Contributions to the Plan and Money Purchase Plan are as follows:
| Year ended December 31, 2016 | $ | 230,485 | ||||
| Year ended December 31, 2015 | $ | 288,692 | ||||
| Year ended December 31, 2014 | $ | 331,736 |
NOTE 15 – STATUTORY CAPITAL AND SURPLUS
Crusader is required to file statutory financial statements with insurance regulatory authorities prepared on an accounting basis prescribed or permitted by such authorities. Statutory accounting practices differ in certain respects from GAAP. The more significant of the differences for statutory accounting practices are (a) policy acquisition and commission costs are expensed when incurred rather than over the periods covered by the policies; (b) fixed maturity securities are reported at amortized cost, or the lower of amortized cost or fair value, depending on the quality of the security as specified by the National Association of Insurance Commissioners (NAIC); (c) non-admitted assets are charged directly against surplus; (d) loss and loss adjustment expense reserves and unearned premium reserves are stated net of reinsurance; (e) federal income taxes are recorded when payable and deferred taxes, subject to limitations, are recognized but only to the extent that they do not exceed a specified percentage of statutory surplus; and (f) changes in deferred taxes are recorded directly to surplus as regards policyholders. Additionally, the cash flow presentation is not consistent with GAAP and reconciliation from net income to cash provided by operations is not presented. Comprehensive income is not presented under statutory accounting practices.
Crusader’s statutory capital and surplus are as follows:
| As of December 31, 2016 | $ | 59,120,443 | ||||
| As of December 31, 2015 | $ | 61,367,728 |
Crusader’s statutory net income (loss) is as follows:
| Year ended December 31, 2016 | $ | (207,503 | ) | |||
| Year ended December 31, 2015 | $ | 911,727 | ||||
| Year ended December 31, 2014 | $ | 2,106,295 |
The California Department of Insurance (CA DOI) conducts periodic financial examinations of Crusader. During 2012, the CA DOI conducted a financial examination of Crusader’s December 31, 2011, statutory financial statements. On June 6, 2013, Crusader was notified that the report of examination was officially filed and became part of the records of the CA DOI. No comments or recommendations were identified in the report of examination dated June 6, 2013. The CA DOI has commenced a periodic financial examination of Crusader’s December 31, 2015, statutory financial statements in the fourth quarter of 2016; the Company does not have an expected date for completion of this examination.
The Company believes that Crusader's statutory capital and surplus are sufficient to support the written premium guidelines established by the NAIC.
Crusader is restricted in the amount of dividends it may pay to its parent in any 12-month period without prior approval of the CA DOI. Presently, without prior regulatory approval, Crusader may pay a dividend in any 12-month period to Unico up to the greater of (a) 10% of its statutory surplus or (b) its statutory net income for the preceding calendar year. Based on Crusader’s statutory surplus for the year ended December 31, 2016, the maximum dividend that could be made by Crusader to Unico without prior regulatory approval in 2017 is $5,912,044. In the years ended December 31, 2016, 2015, and 2014, Crusader paid to Unico cash dividends in the amount of $2,000,000, $3,000,000, and $0, respectively.
In December 1993, the NAIC adopted a Risk-Based Capital (RBC) Model Law for property and casualty companies. The RBC Model Law is intended to provide standards for calculating a variable regulatory capital requirement related to a company's current operations and its risk exposures (asset risk, underwriting risk, credit risk and off-balance sheet risk). These standards are intended to serve as a diagnostic solvency tool for regulators that establishes uniform capital levels and specific authority levels for regulatory intervention when an insurer falls below minimum capital levels. The RBC Model Law specifies four distinct action levels at which a regulator can intervene with increasing degrees of authority over a domestic insurer if its RBC is equal to or less than 200% of its computed authorized control level RBC. A company's RBC is required to be disclosed in its statutory annual statement. The RBC is not intended to be used as a rating or ranking tool nor is it to be used in premium rate making or approval. Crusader’s adjusted capital at December 31, 2016, was 964% of authorized control level RBC.
71 of 89
Insurance Regulatory Information System (IRIS) was developed by a committee of state insurance regulators primarily to assist state insurance departments in executing their statutory mandate to oversee the financial condition of insurance companies. IRIS helps those companies that merit highest priority in the allocation of the regulators’ resources on the basis of 13 financial ratios that are calculated annually. The analytical phase is a review of annual statements and the financial ratios. The ratios and trends are valuable in pointing to companies likely to experience financial difficulties but the ratios are not themselves indicative of adverse financial condition. The ratio and benchmark comparisons are mechanically produced and are not intended to replace the state insurance department’s own in-depth financial analysis or on-site examinations.
An unusual range of ratio results has been established from studies of the ratios of companies that have become insolvent or have experienced financial difficulties. In the analytical phase, companies that receive four or more financial ratio values outside the usual range are analyzed in order to identify those companies that appear to require immediate regulatory action. Subsequently, a more comprehensive review of the ratio results and an insurer’s annual statement is performed to confirm that an insurer’s situation calls for increased or close regulatory attention.
In 2016, Crusader was outside the usual range on one of the 13 IRIS ratio tests. IRIS Ratio Test Number 6 considers Crusader’s 2016 investment yield. An unusual value for that ratio is an investment yield equal to or greater than 6.5% or equal to or less than 3.0%. Crusader’s 2016 investment yield, as computed for IRIS purposes, was 1.1%.
NOTE 16 – STOCK PLANS
The Unico American Corporation 2011 Incentive Stock Plan covers 200,000 shares of the Company’s common stock (subject to adjustment in the case of stock splits, reverse stock splits, stock dividends, etc.) and was approved by shareholders on May 26, 2011. Options to purchase 8,760 and 91,240 shares of common stock were granted under the 2011 Plan to one non-executive employee during the years ended December 31, 2012 and 2011, respectively. As of December 31, 2016, 54,744 of these shares are currently vested and exercisable.
No options were granted to employees or non-employees during the years ended December 31, 2016, 2015, and 2014.
The exercise price, term and other conditions applicable to each stock option granted under the 2011 Plan are determined by the Company’s Stock Option Committee of the Board of Directors. The exercise price of the stock options is set on the grant date and may not be less than the fair market value per share of the Company’s stock on that date (at market close). Options granted under the 2011 Plan in 2011 vest 10% as of the grant date and 10% annually thereafter on the anniversary date, and expire ten years after the date of the grant. Options granted under the 2011 Plan in 2012 vest 100% on March 1, 2021 and expire ten years after the date of the grant.
The Company recognized stock-based compensation expense in the amount of $23,104 for all awards issued under the Company’s 2011 Stock Option plan in the “Salaries and employee benefits” line item in the Consolidated Statements of Operations in each year ended December 31, 2016, 2015, and 2014. As of December 31, 2016, there was $112,914 of total unrecognized compensation cost, adjusted for estimated forfeitures, related to unvested stock-based payments which are expected to be recognized over a weighted average remaining period of 4.72 years.
The fair value of each option award is estimated on the date of the grant using the Black-Scholes Option-Pricing Model using a number of complex and subjective variables. These variables include expected stock price volatility over the term of the awards, actual and projected employee stock option exercise behaviors, a risk-free interest rate and expected dividends.
72 of 89
Expected dividend yield is based on the historical dividend behavior as well as the expected dividend behavior of the Company. Expected volatility is based on the historical volatility of the Company’s stock. The risk-free rate for periods within the contractual life of the option is based on the U.S. treasury yield curve for a ten-year treasury in effect at the time of grant. The expected term represents an estimate of time the options are expected to remain outstanding. In accordance with ASC Topic 718, “Compensation – Stock Compensation”, the Company estimates forfeitures at the time of the grant and revises those estimates in subsequent periods if the actual forfeitures differ from those estimates.
The average assumptions used to value each option award granted during the years ended December 31, 2012 and 2011 are as follows:
| Years ended December 31 | ||||||||
| 2012 | 2011 | |||||||
| Weighted-average grant date fair value | $ | 3.21 | $ | 2.53 | ||||
| Expected dividend yield | 1.91 | % | 3.12 | % | ||||
| Expected volatility | 28.01 | % | 28.74 | % | ||||
| Risk-free interest rate | 1.94 | % | 2.02 | % | ||||
| Expected term (years) | 10.00 | 10.00 | ||||||
| Expected forfeiture | 0.00 | % | 0.00 | % | ||||
The following table summarizes stock option activity for year ended December 31, 2016:
Number of Shares | Weighted Average Exercise Price | Weighted Average Remaining Contractual Terms | Aggregate Intrinsic Value | |||||||||||||
| Outstanding at December 31, 2015 | 100,000 | $ | 10.99 | 5.72 | — | |||||||||||
| Granted | — | — | — | — | ||||||||||||
| Forfeited or expired | — | — | — | — | ||||||||||||
| Exercised | — | — | — | — | ||||||||||||
| Outstanding at December 31, 2016 | 100,000 | $ | 10.99 | 4.72 | $ | — | ||||||||||
| Exercisable at December 31, 2016 | 54,744 | $ | 10.96 | 4.67 | $ | — | ||||||||||
The aggregate intrinsic value in the table above represents the total pre-tax intrinsic value (the difference between the Company’s closing stock price and the exercise price, multiplied by the number of in the money options) that would have been received by the option holders had all options been exercised on December 31, 2016. The aggregate intrinsic value of options exercised during the years ended December 31, 2016, 2015, and 2014 was $0. During the years ended December 31, 2016, 2015, and 2014, the amount of cash received from the exercise of stock options was $0.
NOTE 17 - TAXES ON INCOME
The provision for taxes on income consists of the following:
| Year ended December 31 | ||||||||||||
| 2016 | 2015 | 2014 | ||||||||||
| Federal: | ||||||||||||
| Current | $ | (857,279 | ) | $ | (761,435 | ) | $ | 591,434 | ||||
| Deferred | 148,808 | 180,235 | (150,200 | ) | ||||||||
| Total tax expense (benefit) | $ | (708,471 | ) | $ | (581,200 | ) | $ | 441,234 | ||||
| State: | ||||||||||||
| Current | $ | 8,774 | $ | 8,960 | $ | 8,910 | ||||||
| Deferred | (10,264 | ) | 20,152 | — | ||||||||
| Total tax expense (benefit) | $ | (1,490 | ) | $ | 29,112 | $ | 8,910 | |||||
| Total: | ||||||||||||
| Current | $ | (848,505 | ) | $ | (752,475 | ) | $ | 600,344 | ||||
| Deferred | 138,544 | 200,387 | (150,200 | ) | ||||||||
| Total tax expense (benefit) | $ | (709,961 | ) | $ | (552,088 | ) | $ | 450,144 | ||||
73 of 89
The income tax provision reflected in the Consolidated Statements of Operations is different than the expected federal income tax rate of 34% on income as shown in the following table:
| Year ended December 31 | ||||||||||||
| 2016 | 2015 | 2014 | ||||||||||
| Computed income tax expense (benefit) at 34% | $ | (718,841 | ) | $ | (589,886 | ) | $ | 440,812 | ||||
| Tax effect of: | ||||||||||||
| State tax expense (benefit), net of federal tax benefit | (990 | ) | 18,900 | 6,018 | ||||||||
| Other | 9,870 | 18,898 | 3,314 | |||||||||
| Income tax expense (benefit) | $ | (709,961 | ) | $ | (552,088 | ) | $ | 450,144 | ||||
The Company recognizes deferred income tax assets and liabilities for the expected future tax effects attributable to temporary differences between the financial statement and tax return bases of assets and liabilities, and expected benefits of utilizing net operating loss carryforwards, based on enacted tax rates and other provisions of the tax law. The effect of a change in tax laws or rates on deferred tax assets and liabilities is recognized in income in the period in which such change is enacted. Deferred tax assets are reduced by a valuation allowance if it is more-likely-than-not that any portion of the deferred tax assets may not be realized. The ultimate realization of deferred tax assets is dependent upon generating sufficient taxable income of the appropriate character within the carryback and carryforward periods available under the tax law. Management considers the reversal of deferred tax liabilities, projected future taxable income of an appropriate nature, and tax planning strategies in making this assessment. The Company increased its valuation allowance related to deferred tax assets on state net operating losses. Although realization is not assured, management believes that it is more likely-than-not that the Company’s remaining net deferred tax assets will be realized.
Significant components of the Company’s net deferred tax assets and liabilities are as follows:
| Year ended December 31 | ||||||||
| 2016 | 2015 | |||||||
| Deferred tax assets: | ||||||||
| Discount on loss reserves | $ | 546,195 | $ | 660,930 | ||||
| Unearned premium | 1,340,027 | 1,248,509 | ||||||
| Unearned commission income | 469,730 | 438,337 | ||||||
| Unearned policy fee income | 347,792 | 359,775 | ||||||
| State net operating loss carryforwards | 1,463,188 | 1,384,171 | ||||||
| Bad debt reserve | 507,448 | 507,778 | ||||||
| Other | 301,416 | 307,406 | ||||||
| Total gross deferred tax assets | 4,975,796 | 4,906,906 | ||||||
| Less valuation allowance | 1,264,627 | 1,159,090 | ||||||
| Total deferred tax assets | $ | 3,711,169 | $ | 3,747,816 | ||||
| Deferred tax liabilities: | ||||||||
| Policy acquisition costs | $ | 1,859,491 | $ | 1,774,284 | ||||
| Unrealized gains (losses) on investments | 4,108 | (14,088 | ) | |||||
| State tax on undistributed insurance company earnings | 337,622 | 357,975 | ||||||
| Federal tax liability on state deferred tax assets | 167,585 | 174,514 | ||||||
| Depreciation and amortization | 165,017 | 121,044 | ||||||
| Total deferred tax liabilities | $ | 2,533,823 | $ | 2,413,729 | ||||
| Net deferred tax assets | $ | 1,177,346 | $ | 1,334,087 | ||||
The Company recognizes tax benefits related to positions taken, or expected to be taken, on a tax return only if it is more-likely-than-not that the positions are sustainable. Once this threshold has been met, the Company's measurement of its expected tax benefits is recognized in its consolidated financial statements. If the Company determines after a review of its anticipated future taxable income and all other available evidence, both positive and negative, that it is more-likely-than-not that any of its deferred tax assets will not result in future tax benefits, a valuation allowance is established for the portion of these assets that are not expected to be realized.
74 of 89
As of December 31, 2016, the Company has deferred tax assets of $1,463,188 generated from state net operating loss carryforwards. The increase in the current year in the deferred tax assets from net operating loss carry forwards of $79,017 is the result of current year net operating losses of $149,919, reduced by the expiration of 2006 tax year net operating loss carry forward of $70,902. The expiring net operating loss carry forward was applied to the valuation allowance. Of $1,463,188 state tax carryforwards current balance, $274,066 expire between 2017 and 2018 and the remaining $1,189,122 expire between 2028 and 2036. The current state tax rate is 8.84%. As of December 31, 2016, the Company has a deferred tax asset valuation allowance related to state net operating losses in the amount of $1,264,627.
The current valuation allowance is related to expected utilization of state tax net operating loss carryforwards to be realized prior to their expiration dates. The net increase to the valuation allowance during the year ended December 31, 2016, was $105,537 and included an increase of $176,440 to the reserve allowance offset by a decrease in the allowance of $70,902 due to expiration of the 2006 net operating loss carryforward that was applied to the valuation allowance. This compares to an increase in the valuation allowance of $305,756 during the year ended December 31, 2015.
The Company and its subsidiaries file consolidated federal and state income tax returns. Pursuant to the tax allocation agreement, Crusader and AAC are allocated taxes, or tax credits in the case of losses, at current corporate rates based on their own taxable income or loss. The Company files income tax returns under U.S. federal and various state jurisdictions. The Company is subject to examination by U.S. federal income tax authorities for tax returns filed starting at taxable year 2013 and California state income tax authorities for tax returns filed starting at taxable year 2012. There are no ongoing examinations of income tax returns by federal or state tax authorities.
As a California insurance company, Crusader is obligated to pay a premium tax on direct written premium in all states where Crusader is admitted. Premium taxes are deferred and amortized as the related premium is earned. The premium tax is in lieu of state franchise taxes and is not included in the provision for state taxes.
As of December 31, 2016, the Company had no unrecognized tax benefits, no unrecognized additional liabilities or reduction in deferred tax asset, and no uncertain tax positions. In addition, the Company had not accrued interest and penalties related to unrecognized tax benefits. However, if interest and penalties would need to be accrued related to unrecognized tax benefits, such amounts would be recognized as a component of federal income tax expense.
NOTE 18 – REPURCHASE OF COMMON STOCK - EFFECT ON STOCKHOLDERS’ EQUITY
On December 19, 2008, the Board of Directors authorized a stock repurchase program to acquire, from time to time, up to an aggregate of 500,000 shares of the Company’s common stock. This program has no expiration date and may be terminated by the Board of Directors at any time. As of December 31, 2016, and December 31, 2015, the Company had remaining authority under the 2008 program to repurchase up to an aggregate of 188,655 and 197,467 shares of its common stock, respectively. The 2008 program is the only program under which there is authority to repurchase shares of the Company’s common stock. The Company repurchased 8,812 shares of stock during the year ended December 31, 2016, in unsolicited transactions at a cost of $89,582 of which $4,331 was allocated to capital and $85,251 was allocated to retained earnings. The Company repurchased 25,202 shares of stock during the year ended December 31, 2015, in unsolicited transactions at a cost of $242,314 of which $12,385 was allocated to capital and $229,929 was allocated to retained earnings. The Company did not repurchase any stock during the year ended December 31, 2014. The Company has or will retire all stock repurchased.
75 of 89
NOTE 19 - EARNINGS (LOSS) PER SHARE
A reconciliation of the numerator and denominator used in the basic and diluted earnings (loss) per share calculation is presented below:
| Year ended December 31 | ||||||||||||
| 2016 | 2015 | 2014 | ||||||||||
| Basic Earnings (Loss) Per Share | ||||||||||||
| Net income (loss) numerator | $ | (1,404,277 | ) | $ | (1,182,870 | ) | $ | 846,361 | ||||
| Weighted average shares outstanding denominator | 5,307,694 | 5,335,540 | 5,341,147 | |||||||||
| Per share amount | $ | (0.26 | ) | $ | (0.22 | ) | $ | 0.16 | ||||
| Diluted Earnings (Loss) Per Share | ||||||||||||
| Net income (loss) numerator | $ | (1,404,277 | ) | $ | (1,182,870 | ) | $ | 846,361 | ||||
| Weighted average shares outstanding | 5,307,694 | 5,335,540 | 5,341,147 | |||||||||
| Effect of diluted securities | — | — | 5,405 | |||||||||
| Diluted shares outstanding denominator | 5,307,694 | 5,335,540 | 5,346,552 | |||||||||
| Per share amount | $ | (0.26 | ) | $ | (0.22 | ) | $ | 0.16 | ||||
As of December 31, 2016 and 2015, the Company had 574 and 2,761 common share equivalents that were excluded in the diluted (loss) per share calculation for years ended December 31, 2016 and 2015, respectively.
NOTE 20 – SELECTED QUARTERLY FINANCIAL DATA (UNAUDITED)
Summarized unaudited quarterly financial data for each of the calendar years 2016 and 2015 is as follows:
| Comparable Period by Quarter Ended | ||||||||||||||||
| March 31 | June 30 | September 30 | December 31 | |||||||||||||
| Calendar Year 2016 | ||||||||||||||||
| Total revenues | $ | 8,529,678 | $ | 8,722,632 | $ | 8,998,342 | $ | 9,017,072 | ||||||||
| Income (loss) before taxes | $ | (270,026 | ) | $ | 208,594 | $ | (2,966,721 | ) | $ | 913,915 | ||||||
| Net income (loss) | $ | (198,987 | ) | $ | 151,030 | $ | (1,953,497 | ) | $ | 597,177 | ||||||
| Earnings (loss) per share: Basic | $ | (0.04 | ) | $ | 0.03 | $ | (0.37 | ) | $ | 0.11 | ||||||
| Diluted | $ | (0.04 | ) | $ | 0.03 | $ | (0.37 | ) | $ | 0.11 | ||||||
| Calendar Year 2015 | ||||||||||||||||
| Total revenues | $ | 7,832,199 | $ | 8,313,691 | $ | 8,451,503 | $ | 8,667,246 | ||||||||
| Income (loss) before taxes | $ | (591,037 | ) | $ | 182,673 | $ | (967,640 | ) | $ | (358,954 | ) | |||||
| Net income (loss) | $ | (396,785 | ) | $ | 112,381 | $ | (649,510 | ) | $ | (248,956 | ) | |||||
| Earnings (loss) per share: Basic | $ | (0.07 | ) | $ | 0.02 | $ | (0.12 | ) | $ | (0.05 | ) | |||||
| Diluted | $ | (0.07 | ) | $ | 0.02 | $ | (0.12 | ) | $ | (0.05 | ) | |||||
NOTE 21 – SUPPLEMENTARY INFORMATION ON LOSS AND ALAE DEVELOPMENT (UNAUDITED)
The following table presents cumulative incurred losses and ALAE, net of reinsurance, for years ended December 31:
| Accident Year | 2007 | 2008 | 2009 | 2010 | 2011 | 2012 | 2013 | 2014 | 2015 | |||||||||||||||||||||||||||||
| 2007 | $ | 24,747,856 | $ | 26,117,669 | $ | 27,061,323 | $ | 27,029,577 | $ | 26,203,117 | $ | 25,511,988 | $ | 24,770,214 | $ | 24,107,044 | $ | 23,979,026 | ||||||||||||||||||||
| 2008 | 22,580,220 | 22,106,937 | 21,290,931 | 20,004,073 | 19,347,265 | 18,668,518 | 17,889,384 | 17,456,810 | ||||||||||||||||||||||||||||||
| 2009 | 21,751,337 | 21,412,289 | 21,571,780 | 21,012,811 | 20,398,961 | 19,667,376 | 19,050,348 | |||||||||||||||||||||||||||||||
| 2010 | 21,418,368 | 20,437,443 | 19,883,812 | 19,326,007 | 18,639,537 | 18,075,737 | ||||||||||||||||||||||||||||||||
| 2011 | 18,120,563 | 17,900,250 | 17,605,460 | 17,014,895 | 17,879,595 | |||||||||||||||||||||||||||||||||
| 2012 | 18,511,598 | 19,532,022 | 18,895,666 | 18,344,175 | ||||||||||||||||||||||||||||||||||
| 2013 | 19,570,946 | 20,118,343 | 20,323,841 | |||||||||||||||||||||||||||||||||||
| 2014 | 16,884,731 | 15,394,995 | ||||||||||||||||||||||||||||||||||||
| 2015 | 20,452,199 |
76 of 89
The following table presents cumulative paid losses and ALAE, net of reinsurance, for years ended December 31:
| Accident Year | 2007 | 2008 | 2009 | 2010 | 2011 | 2012 | 2013 | 2014 | 2015 | |||||||||||||||||||||||||||||
| 2007 | $ | 6,980,915 | $ | 12,283,217 | $ | 18,309,573 | $ | 21,637,121 | $ | 23,333,861 | $ | 23,548,201 | $ | 23,762,758 | $ | 23,906,841 | $ | 23,907,436 | ||||||||||||||||||||
| 2008 | 6,962,996 | 9,869,827 | 13,950,969 | 15,902,618 | 16,856,762 | 17,001,061 | 17,041,185 | 17,178,322 | ||||||||||||||||||||||||||||||
| 2009 | 4,919,359 | 9,592,059 | 13,160,200 | 16,180,346 | 17,121,818 | 17,336,454 | 17,380,065 | |||||||||||||||||||||||||||||||
| 2010 | 7,535,122 | 10,695,223 | 12,955,467 | 14,756,510 | 15,330,864 | 16,283,050 | ||||||||||||||||||||||||||||||||
| 2011 | 4,719,943 | 8,608,287 | 11,212,490 | 14,251,525 | 16,115,802 | |||||||||||||||||||||||||||||||||
| 2012 | 6,719,982 | 11,673,621 | 13,411,125 | 15,369,629 | ||||||||||||||||||||||||||||||||||
| 2013 | 7,594,731 | 10,656,777 | 14,319,057 | |||||||||||||||||||||||||||||||||||
| 2014 | 3,826,263 | 6,082,893 | ||||||||||||||||||||||||||||||||||||
| 2015 | 6,263,796 |
The following table presents average annual percentage payout of incurred claims by age, net of reinsurance, as of December 31, 2016:
| Years | 1 | 2 | 3 | 4 | 5 | 6 | 7 | 8 | 9 | 10 | ||||||||||||||||||||||||||||||||
| 25.3 | % | 20.7 | % | 24.4 | % | 15.6 | % | 7.8 | % | 2.5 | % | 1.1 | % | 0.8 | % | 0.2 | % | 0.6 | % |
Item 9. Changes in and Disagreements with Accountants on Accounting and Financial Disclosure.
None
Item 9A. Controls and Procedures.
Evaluation of Disclosure Controls and Procedures
The Company maintains disclosure controls and procedures designed to ensure that information required to be disclosed in the Company’s reports filed under the Securities Exchange Act of 1934, as amended, is recorded, processed, summarized, and reported within the time periods specified in the Securities and Exchange Commission rules and forms, and that such information is accumulated and communicated to the Company’s management, including its Chief Executive Officer and Chief Financial Officer, as appropriate, to allow for timely decisions regarding required disclosure. In designing and evaluating the disclosure controls and procedures, management recognizes that any controls and procedures, no matter how well designed and operated, can provide only reasonable assurance of achieving the desired control objectives; and, therefore, management was required to apply its judgment in evaluating the cost benefit relationship of possible controls and procedures.
As required by Securities and Exchange Commission rules, the Company carried out an evaluation, under the supervision and with the participation of the Company’s management, including the Company’s Chief Executive Officer and the Company’s Chief Financial Officer, of the effectiveness of the design and operation of the Company’s disclosure controls and procedures as of the end of the period covered by this report. Based on the foregoing, the Company’s Chief Executive Officer and Chief Financial Officer concluded that the Company’s disclosure controls and procedures were effective at the reasonable assurance level.
Changes in Internal Control Over Financial Reporting
There has been no change in the Company’s internal control over financial reporting during the Company’s most recent fiscal quarter that has materially affected, or is reasonably likely to materially affect, the Company’s internal control over financial reporting. The Company’s process for evaluating controls and procedures is continuous and encompasses constant improvement of the design and effectiveness of established controls and procedures and the remediation of any deficiencies that may be identified during this process.
Management’s Report on Internal Control Over Financial Reporting
The management of the Company is responsible for establishing and maintaining adequate internal control over financial reporting. The Company’s internal control system was designed to provide reasonable assurance to the Company’s management and Board of Directors regarding the preparation and fair presentation of published financial statements.
77 of 89
All internal control systems, no matter how well designed, have inherent limitations. Therefore, even those systems determined to be effective can provide only reasonable assurance with respect to financial statement preparation and presentation.
The Company’s management assessed the effectiveness of the Company’s internal control over financial reporting as of December 31, 2016. In making this assessment, it used the criteria set forth by the Committee of Sponsoring Organizations of the Treadway Commission (COSO) in “Internal Control - Integrated Framework (2013).” Based upon its assessment, the Company’s management believes that as of December 31, 2016, the Company’s internal control over financial reporting is effective based on these criteria.
Item 9B. Other Information.
None
PART III
Item 10. Directors, Executive Officers and Corporate Governance.
Information in response to Item 10 is incorporated by reference from the Company's definitive proxy statement to be used in connection with the Company's Annual Meeting of Shareholders pursuant to Instruction G(3) of Form 10-K.
Item 11. Executive Compensation.
Information in response to Item 11 is incorporated by reference from the Company's definitive proxy statement to be used in connection with the Company's Annual Meeting of Shareholders pursuant to Instruction G(3) of Form 10-K.
Item 12. Security Ownership of Certain Beneficial Owners and Management and
Related Stockholder Matters.
Information in response to Item 12 is incorporated by reference from the Company's definitive proxy statement to be used in connection with the Company's Annual Meeting of Shareholders pursuant to Instruction G(3) of Form 10-K.
Item 13. Certain Relationships and Related Transactions, and Director Independence.
Information in response to Item 13 is incorporated by reference from the Company's definitive proxy statement to be used in connection with the Company's Annual Meeting of Shareholders pursuant to Instruction G(3) of Form 10-K.
Item 14. Principal Accountant Fees and Services.
Information in response to Item 14 is incorporated by reference from the Company's definitive proxy statement to be used in connection with the Company's Annual Meeting of Shareholders pursuant to Instruction G(3) of Form 10-K.
PART IV
Item 15. Exhibits and Financial Statement Schedules.
(a) Financial Statements, Schedules and Exhibits:
1. Financial statements:
The consolidated financial statements for the fiscal year ended December 31, 2016, are contained herein as listed in the Index to Consolidated Financial Statements on Page 46.
78 of 89
2. Financial schedules:
Independent Registered Public Accounting Firm’s Reports on Financial Statement Schedules
Schedule II - Condensed Financial Information of Registrant
Schedule III - Supplemental Insurance Information
Schedules other than those listed above are omitted, since they are not applicable, not required, or the information required being set forth is included in the consolidated financial statements or notes.
3. Exhibits:
| 3.1 | Articles of Incorporation of Registrant, as amended. (Incorporated herein by reference to Exhibit 3.1 to the Registrant's Annual Report on Form 10-K for the fiscal year ended March 31, 1984.) |
| 3.2 | Bylaws of Registrant, as amended. (Incorporated herein by reference to Exhibit 3.2 to Registrant's Annual Report on Form 10-K for the fiscal year ended December 31, 2008.) |
| 3.3 | Amended Section 1 of Article V of the Company’s Bylaws effective April 1, 2009. (Incorporated herein by reference to Exhibit 3.1 to Registrants Current Report on Form 8-K filed on March 26, 2009.) |
| 10.1 | Unico American Corporation Profit Sharing Plan & Trust. (Incorporated herein by reference to Exhibit 10.1 to the Registrant's Annual Report on Form 10-K for the fiscal year ended March 31, 1985.)* |
| 10.2 | The Lease dated July 31, 1986, between Unico American Corporation and Cheldin Management Company. (Incorporated herein by reference to Exhibit 10.5 to Registrant's Annual Report on Form 10-K for the fiscal year ended March 31, 1987.) |
| 10.3 | The Lease Amendment #1 dated February 22, 1995, between Unico American Corporation and Cheldin Management Company amending the lease dated July 31, 1986. (Incorporated herein by reference to Exhibit 10.5 to Registrant's Annual Report on Form 10-K for the fiscal year ended March 31, 1995.) |
| 10.4 | The Lease Amendment #2 dated March 23, 2007, between Unico American Corporation and Cheldin Management Company amending the lease dated July 31, 1986. (Incorporated herein by reference to Exhibit 10.4 to Registrant’s Annual Report on Form 10-K filed on March 31, 2008.) |
| 10.5 | Real Estate Lease dated April 1, 2012, between Unico American Corporation and Cheldin Management Company. (Incorporated herein by reference to Exhibit 10.1 of Registrant’s Quarterly Report on Form 10-Q for the quarter ended March 31, 2012.) |
| 10.6 | Standard Offer, Agreement and Escrow Instructions for Purchase of Real Estate at 26050 Mureau Road, Calabasas, CA, as amended. (Incorporated herein by reference to Exhibit 10.1 of Registrant's Quarterly Report on Form 10-Q for the quarter ended June 30, 2013.) |
| 10.7 | 1999 Omnibus Stock Plan of Unico American Corporation. (Incorporated herein by reference to Exhibit A to Registrant’s Proxy Statement for its Annual Meeting of Shareholders held June 4, 2000.)* |
| 10.8 | Employment Agreement effective December 15, 2007, by and between the Registrant and Cary L. Cheldin. (Incorporated herein by reference to Exhibit 10.1 to Registrant's Current Report on Form 8-K filed on March 21, 2008.)* |
| 10.9 | Amendment to Employment Agreement effective April 1, 2009, by and between Registrant and Cary L. Cheldin. (Incorporated herein by reference to Exhibit 10.1 to Amendment to Registrant’s Quarterly Report on Form 10-Q/A for the quarter ended June 30, 2009, filed on November 30, 2009.)* |
| 10.10 | Amendment to Employment Agreement effective January 1, 2010, by and between Registrant and Cary L. Cheldin. (Incorporated herein by reference to Exhibit 10.1 of Registrant’s Quarterly Report on Form 10-Q for the quarter ended March 31, 2010.)* |
| 10.11 | Amendment to Employment Agreement dated September 21, 2012, by and between Registrant and Cary L. Cheldin. (Incorporated herein by reference to Exhibit 10.1 of Registrant’s Quarterly Report on Form 10-Q for the quarter ended September 30, 2012.)* |
| 10.12 | Employment Agreement effective December 15, 2007, by and between the Registrant and Lester A. Aaron. (Incorporated herein by reference to Exhibit 10.2 to Registrant's Current Report on Form 8-K filed on March 21, 2008.)* |
| 10.13 | Amendment to Employment Agreement effective April 1, 2009 by and between Registrant and Lester A. Aaron. (Incorporated herein by reference to Exhibit 10.2 to Amendment to Registrant’s Quarterly Report on Form 10-Q/A for the quarter ended June 30, 2009, filed on November 30, 2009.)* |
| 10.14 | Amendment to Employment Agreement effective January 1, 2010, by and between Registrant and Lester A. Aaron. (Incorporated herein by reference to Exhibit 10.2 of Registrant’s Quarterly Report on Form 10-Q for the quarter ended March 31, 2010.)* |
| 10.15 | Employment Agreement effective April 1, 2009, by and between Registrant and Terry L. Kinigstein. (Incorporated herein by reference to Exhibit 10.3 to Amendment to Registrant’s Quarterly Report on Form 10-Q/A for the quarter ended June 30, 2009, filed on November 30, 2009.)* |
79 of 89
| 10.16 | Amendment to Employment Agreement effective January 1, 2010, by and between Registrant and Terry L. Kinigstein. (Incorporated herein by reference to Exhibit 10.3 of Registrant’s Quarterly Report on Form 10-Q for the quarter ended March 31, 2010.)* |
| 10.17 | Unico American Corporation Money Purchase Plan & Trust. (Incorporated herein by reference to Exhibit 10.11 to the Registrant's Amendment No. 1 on Form 10-K/A to its Annual Report on Form 10-K for the fiscal year ended December, 31, 2009, filed on March 9, 2011.)* |
| 10.18 | The 2011 Incentive Stock Option Plan of Unico American Corporation. (Incorporated by reference to Annex A to Registrant’s Proxy Statement for the Annual Meeting of Shareholders held on May 26, 2011.)* |
| 10.19 | Amended and Restated Employment Agreement effective March 17, 2015, by and between Registrant and Cary L. Cheldin. (Incorporated herein by reference to Exhibit 10.1 of Registrant’s Form 8-K filed on March 20, 2015)* |
| 10.20 | Job offer to Michael Budnitsky dated August 12, 2014. (Incorporated herein by reference to Exhibit 10.1 of Registrant’s Quarterly Report on Form 10-Q for the quarter ended September 30, 2016.)* |
| 10.21 | Amendment, dated March 27, 2017, to Amended and Restated Employment Agreement effective March 17, 2015, by and between Registrant and Cary L. Cheldin.*ⱡ |
| 21 | Subsidiaries of Registrant. (Incorporated herein by reference to Exhibit 22 to Registrant's Annual Report on Form 10-K for the fiscal year ended March 31, 1984.) |
| 23.1 | Consent of Independent Registered Public Accounting Firm – JLK Rosenberger LLP. |
| 23.2 | Consent of Independent Registered Public Accounting Firm – KPMG LLP. |
| 31.1 | Certificate of Chief Executive Officer pursuant to Rule 13a-14(a) or Rule 15d-14(a), as adopted pursuant to Section 302 of the Sarbanes-Oxley Act of 2002. |
| 31.2 | Certificate of Chief Financial Officer pursuant to Rule 13a-14(a) or Rule 15d-14(a), as adopted pursuant to Section 302 of the Sarbanes-Oxley Act of 2002. |
| 32.1 | Certification of Chief Executive Officer pursuant to 18 U.S.C. Section 1350, as adopted pursuant to Section 906 of the Sarbanes-Oxley Act of 2002. |
| 32.2 | Certification of Chief Financial Officer pursuant to 18 U.S.C. Section 1350, as adopted pursuant to Section 906 of the Sarbanes-Oxley Act of 2002. |
| 101 | The following information from the Annual Report on Form 10-K for the fiscal year ended December 31, 2016, formatted in XBRL (Extensible Business Reporting Language) and furnished electronically herewith: (i) the Consolidated Balance Sheets; (ii) the Consolidated Statements of Operations; (iii) the Consolidated Statements of Comprehensive Income (Loss); (iv) the Consolidated Statements of Cash Flows; and (v) the Condensed Notes to Unaudited Consolidated Financial Statements.** |
| * Indicates management contract or compensatory plan or arrangement. |
** XBRL information is furnished and deemed not filed as part of a registration statement or prospectus for purposes of Sections 11 or 12 of the Securities Act of 1933, is deemed not filed for purposes of Section 18 of the Securities Exchange Act and otherwise is not subject to liability under these sections.
ⱡ Filed electronically herewith.
Item 16. Form 10-K Summary
Not applicable
80 of 89
SIGNATURES
Pursuant to the requirements of Section 13 or 15(d) of the Securities Exchange Act of 1934, the Registrant has duly caused this report to be signed on its behalf by the undersigned, thereunto duly authorized.
Date: March 30, 2017
UNICO AMERICAN CORPORATION
By: /s/ Cary L. Cheldin
Cary L. Cheldin
Chairman of the Board
Pursuant to the requirements of the Securities Exchange Act of 1934, this report has been signed below by the following persons on behalf of the Registrant and in the capacities and on the dates indicated.
| Signature | Title | Date |
|
/s/ Cary L. Cheldin Cary L. Cheldin |
Chairman of the Board, President and Chief Executive Officer, and Director (Principal Executive Officer) |
March 30, 2017 |
|
/s/ Michael Budnitsky Michael Budnitsky |
Treasurer, Chief Financial Officer, and Secretary (Principal Accounting and Principal Financial Officer) |
March 30, 2017 |
|
/s/ Lester A. Aaron Lester A. Aaron |
Executive Vice President and Director | March 30, 2017 |
|
/s/ Erwin Cheldin Erwin Cheldin |
Director | March 30, 2017 |
| /s/ George C. Gilpatrick | Director | March 30, 2017 |
| George C. Gilpatrick | ||
|
/s/ Terry L. Kinigstein Terry L. Kinigstein |
Director | March 30, 2017 |
| /s/ David T. Russell | Director | March 30, 2017 |
| David T. Russell | ||
| /s/ Samuel J. Sorich | Director | March 30, 2017 |
| Samuel J. Sorich | ||
| /s/ Donald B. Urfrig | Director | March 30, 2017 |
| Donald B. Urfrig |
81 of 89
REPORT OF INDEPENDENT REGISTERED PUBLIC ACCOUNTING FIRM
To the Board of Directors and Stockholders of
Unico American Corporation and subsidiaries:
Under date of March 30, 2017 we reported on the consolidated balance sheets of Unico American Corporation and subsidiaries as of December 31, 2016 and 2015, and the related consolidated statements of operations, comprehensive income (loss), changes in stockholders’ equity, and cash flows for the years then ended, as contained in the Annual Report on Form 10K for the year 2016. In connection with our audits of the aforementioned consolidated financial statements, we also audited the related financial statement schedules as listed under Item 15(a)2. These financial statement schedules are the responsibility of the Company’s management. Our responsibility is to express an opinion on these financial statements based on our audits.
In our opinion, the financial statement schedules, when considered in relation to the basic consolidated financial statements taken as a whole, present fairly, in all material respects, the information set forth therein.
/s/ JLK Rosenberger LLP
Glendale, California
March 30, 2017
82 of 89
REPORT OF INDEPENDENT REGISTERED PUBLIC ACCOUNTING FIRM
The Board of Directors and Stockholders of
Unico American Corporation and subsidiaries:
Under date of March 30, 2015, we reported on the consolidated statements of operations, comprehensive income, changes in stockholders’ equity, and cash flows of Unico American Corporation and subsidiaries (the Company) for the year ended December 31, 2014, as contained in the annual report on Form 10-K for the year 2016. In connection with our audit of the aforementioned consolidated financial statements, we also audited the related consolidated financial statement schedules as listed under 15 (a) 2. These consolidated financial statement schedules are the responsibility of the Company’s management. Our responsibility is to express an opinion on these financial statement schedules based on our audits.
In our opinion, such financial statement schedules, when considered in relation to the basic consolidated financial statements taken as a whole, present fairly, in all material respects, the information set forth therein.
/s/ KPMG LLP
Los Angeles, California
March 30, 2015
83 of 89
SCHEDULE II
UNICO AMERICAN CORPORATION
AND SUBSIDIARIES
CONDENSED FINANCIAL INFORMATION OF REGISTRANT
BALANCE SHEETS – PARENT COMPANY ONLY
| December 31 | December 31 | |||||||
| 2016 | 2015 | |||||||
| ASSETS | ||||||||
| Investments | ||||||||
| Short-term investments | $ | 1,763 | $ | 1,763 | ||||
| Total investments | 1,763 | 1,763 | ||||||
| Cash | 14,484 | 17,855 | ||||||
| Receivables due from subsidiaries | 2,363,344 | 2,905,244 | ||||||
| Investments in subsidiaries | 65,272,059 | 66,644,224 | ||||||
| Property and equipment, net | 1,012,103 | 815,536 | ||||||
| Other assets | 530,532 | 136,388 | ||||||
| Total Assets | $ | 69,194,285 | $ | 70,521,010 | ||||
| LIABILITIES AND STOCKHOLDERS’ EQUITY | ||||||||
| LIABILITIES | ||||||||
| Accrued expenses and other liabilities | $ | 287,645 | $ | 178,938 | ||||
| Total Liabilities | $ | 287,645 | $ | 178,938 | ||||
| Commitments and contingencies | ||||||||
| STOCKHOLDERS’ EQUITY | ||||||||
| Common stock | $ | 3,761,320 | $ | 3,742,547 | ||||
| Accumulated other comprehensive income (loss) | 7,975 | (27,348 | ) | |||||
| Retained earnings | 65,137,345 | 66,626,873 | ||||||
| Total Stockholders’ Equity | $ | 68,906,640 | $ | 70,342,072 | ||||
| Total Liabilities and Stockholders’ Equity | $ | 69,194,285 | $ | 70,521,010 | ||||
See accompanying notes to condensed financial information.
See accompanying report of independent registered accounting firms.
84 of 89
SCHEDULE II (continued)
UNICO AMERICAN CORPORATION
AND SUBSIDIARIES
CONDENSED FINANCIAL INFORMATION OF REGISTRANT
STATEMENTS OF OPERATIONS – PARENT COMPANY ONLY
FOR THE YEARS ENDED DECEMBER 31
| 2016 | 2015 | 2014 | ||||||||||
| REVENUES | ||||||||||||
| Net investment income | $ | 106,517 | $ | 91,127 | $ | 78,810 | ||||||
| Other income (loss) | 6,559 | (1,652 | ) | 8,000 | ||||||||
| Total Revenues | 113,076 | 89,475 | 86,810 | |||||||||
| EXPENSES | ||||||||||||
| General and administrative expenses | 109,865 | 74,775 | 77,205 | |||||||||
| Income before equity in net income of subsidiaries | 3,211 | 14,700 | 9,605 | |||||||||
| Equity in net income (loss) of subsidiaries | (1,407,488 | ) | (1,197,570 | ) | 836,756 | |||||||
| Net Income (Loss) | $ | (1,404,277 | ) | $ | (1,182,870 | ) | $ | 846,361 |
See accompanying notes to condensed financial information.
See accompanying report of independent registered accounting firms.
85 of 89
SCHEDULE II (continued)
UNICO AMERICAN CORPORATION
AND SUBSIDIARIES
CONDENSED FINANCIAL INFORMATION OF REGISTRANT
STATEMENTS OF COMPREHENSIVE INCOME (LOSS) – PARENT COMPANY ONLY
FOR THE YEARS ENDED DECEMBER 31
| 2016 | 2015 | 2014 | ||||||||||
| Net income (loss) | $ | (1,404,277 | ) | $ | (1,182,870 | ) | $ | 846,361 | ||||
| Other changes in comprehensive income (loss): | ||||||||||||
| Changes in unrealized gains (losses) on securities classified as available-for-sale arising during the period | 53,519 | (46,881 | ) | 14,202 | ||||||||
| Income tax (expense) benefit related to changes in unrealized gains and losses on securities classified as available-for-sale arising during the period | (18,196 | ) | 15,939 | (4,828 | ) | |||||||
| Comprehensive Income (Loss) | $ | (1,368,954 | ) | $ | (1,213,812 | ) | $ | 855,735 | ||||
See accompanying notes to condensed financial information.
See accompanying report of independent registered accounting firms.
86 of 89
SCHEDULE II (continued)
UNICO AMERICAN CORPORATION
AND SUBSIDIARIES
CONDENSED FINANCIAL INFORMATION OF REGISTRANT
STATEMENTS OF CASH FLOWS - PARENT COMPANY ONLY
FOR THE YEARS ENDED DECEMBER 31
| 2016 | 2015 | 2014 | ||||||||||
| Cash flows from operating activities: | ||||||||||||
| Net income (loss) | $ | (1,404,277 | ) | $ | (1,182,870 | ) | $ | 846,361 | ||||
| Adjustments to reconcile net income (loss) to net cash from operations: | ||||||||||||
| Undistributed equity in net (income) loss of subsidiaries | 1,407,488 | 1,197,570 | (836,756 | ) | ||||||||
| Depreciation and amortization | 226,496 | 144,243 | 219,676 | |||||||||
| Non-cash stock based compensation | 23,104 | 23,104 | 23,104 | |||||||||
| Accrued expenses and other liabilities | 108,707 | (411,638 | ) | 490,582 | ||||||||
| Other assets | (394,144 | ) | 281,958 | (233,188 | ) | |||||||
| Net Cash Provided (Used) by Operating Activities | (32,626 | ) | 52,367 | 509,779 | ||||||||
| Cash flows from investing activities: | ||||||||||||
| Increase in short-term investments | — | (1 | ) | — | ||||||||
| Additions (disposition) to property and equipment | (423,063 | ) | 896,350 | (813,041 | ) | |||||||
| Dividends received from subsidiaries | 2,000,000 | 3,000,000 | — | |||||||||
| Net change in payables and receivables from subsidiaries | (1,458,100 | ) | (3,734,374 | ) | 44,111 | |||||||
| Net Cash Provided (Used) by Investing Activities | 118,837 | 161,975 | (768,930 | ) | ||||||||
| Cash flows from financing activities: | ||||||||||||
| Repurchase of common stock | (89,582 | ) | (242,318 | ) | — | |||||||
| Net Cash Used by Financing Activities | (89,582 | ) | (242,318 | ) | — | |||||||
| Net decrease in cash | (3,371 | ) | (27,976 | ) | (259,151 | ) | ||||||
| Cash at beginning of year | 17,855 | 45,831 | 304,982 | |||||||||
| Cash at End of Year | $ | 14,484 | $ | 17,855 | $ | 45,831 |
See accompanying notes to condensed financial information.
See accompanying report of independent registered accounting firms.
87 of 89
UNICO AMERICAN CORPORATION
AND SUBSIDIARIES
CONDENSED FINANCIAL INFORMATION OF REGISTRANT
NOTES TO CONDENSED FINANCIAL INFORMATION
The accompanying condensed financial information should be read in conjunction with the Consolidated Financial Statements and Notes to Consolidated Financial Statements included in this report.
Dividends
Unico received cash dividends from Crusader of $2,000,000, $3,000,000, and $0 in the years ended December 31, 2016, 2015, and 2014, respectively.
Federal Income Taxes
The Company and its wholly owned subsidiaries file consolidated federal and combined California income tax returns. Pursuant to a tax allocation agreement, Crusader and AAC are allocated taxes, or tax credits in the case of losses, at current corporate rates based on their own taxable income or loss. The payable to subsidiaries includes their income tax receivable or liability included in the consolidated return.
Reimbursement of Expenses
Unico was reimbursed certain expenses by its subsidiaries. These expenses included depreciation and amortization of $226,496, $144,243, and $219,676 for the years ended December 31, 2016, 2015, and 2014, respectively.
Retirement Plans
Profit Sharing Plan
The Unico American Corporation Profit Sharing Plan (“Plan”) covers Company’s employees who are at least 21 years of age and have met certain service and eligibility requirements. Unico American Corporation is the Plan sponsor and the Plan administrator. Fidelity Management Trust Company is the Plan trustee. The Plan is intended to be a qualified retirement plan under the Internal Revenue Code. As required by the Plan, on an annual basis, the Company must contribute 3% of participants’ eligible compensation to the account of each participant. In addition, pursuant to the terms of the Plan, the Company may contribute to participants an amount determined by the Board of Directors. Under the Plan, participants have the option to elect to make 401(k) and Roth 401(k) deferral contributions which are not matched by the Company. Participants must be employed by the Company on the last day of the Plan year to be eligible for a contribution. Participants are eligible to request a distribution of their vested account balance upon death, retirement, minimum required distributions and termination of employment. Effective November 1, 2015, the Company’s Money Purchase Plan was merged into the Plan.
Money Purchase Plan
The Unico American Corporation Money Purchase Plan covered executive officers of the Company and an officer of a subsidiary of the Company. Pursuant to the terms of this plan, the Company annually contributed to the account of each participant an amount equal to a percentage of the participant's eligible compensation as determined by the Board of Directors. However, amounts contributed to the Plan were considered first in determining the actual amount available under the Internal Revenue Service maximum contribution limits. Participants were required to be employed by the Company on the last day of the plan year to be eligible for contribution. Participants were entitled to receive distribution of benefits under this plan upon retirement, termination of employment, death, or disability. Effective November 1, 2015, the Company’s Money Purchase Plan was merged into the Plan.
Commitments and Contingencies
The Company establishes reserves for lawsuits, regulatory actions, and other contingencies for which the Company is able to estimate its potential exposure and believes a loss is probable. For loss contingencies believed to be reasonably possible, the Company discloses the nature of the loss contingency and an estimate of the possible loss, range of loss, or a statement that such an estimate cannot be made.
See accompanying report of independent registered accounting firms.
88 of 89
| SCHEDULE III | ||||||||||||||||||||||||||||||||||||
| UNICO AMERICAN CORPORATION | ||||||||||||||||||||||||||||||||||||
| AND SUBSIDIARIES | ||||||||||||||||||||||||||||||||||||
| SUPPLEMENTARY INSURANCE INFORMATION | ||||||||||||||||||||||||||||||||||||
| Future | ||||||||||||||||||||||||||||||||||||
| Benefits, | Benefits, | Amortization | ||||||||||||||||||||||||||||||||||
| Deferred | Losses, | Claims, | of Deferred | |||||||||||||||||||||||||||||||||
| Policy | and Loss | Net | Losses and | Policy | Other | Net | ||||||||||||||||||||||||||||||
| Acquisition | Adjustment | Unearned | Premium | Investment | Settlement | Acquisition | Operating | Written | ||||||||||||||||||||||||||||
| Cost | Expenses | Premium | Revenue | Income | Expenses | Costs | Costs | Premium | ||||||||||||||||||||||||||||
| Year ended December 31, 2016 | $ | 4,432,299 | $ | 47,055,787 | $ | 19,374,740 | $ | 31,356,371 | $ | 879,868 | $ | 22,826,878 | $ | 6,895,149 | $ | 7,659,935 | $ | 32,624,522 | ||||||||||||||||||
| Year ended December 31, 2015 | $ | 4,233,396 | $ | 49,093,571 | $ | 18,079,253 | $ | 29,573,796 | $ | 472,113 | $ | 19,163,316 | $ | 6,465,232 | $ | 9,371,049 | $ | 31,029,111 | ||||||||||||||||||
| Year ended December 31, 2014 | $ | 3,882,825 | $ | 44,396,558 | $ | 16,607,179 | $ | 26,373,423 | $ | 161,738 | $ | 14,617,118 | $ | 5,986,108 | $ | 8,320,507 | $ | 27,784,289 | ||||||||||||||||||
89 of 89