Attached files
| file | filename |
|---|---|
| EX-32.2 - EXHIBIT 32.2 - Rice Energy Operating LLC | copy3of322reigl.htm |
| EX-32.1 - EXHIBIT 32.1 - Rice Energy Operating LLC | copy3of321reidjr.htm |
| EX-31.2 - EXHIBIT 31.2 - Rice Energy Operating LLC | copy3of312reigl.htm |
| EX-31.1 - EXHIBIT 31.1 - Rice Energy Operating LLC | copy3of311reidjr.htm |
| EX-23.3 - EXHIBIT 23.3 - Rice Energy Operating LLC | copyof233nsaibarnett.htm |
| EX-23.2 - EXHIBIT 23.2 - Rice Energy Operating LLC | copyof232nsaimarcellus.htm |
| EX-23.1 - EXHIBIT 23.1 - Rice Energy Operating LLC | copy3of231rei.htm |
| EX-21.1 - EXHIBIT 21.1 - Rice Energy Operating LLC | copy3of211subsidiaries.htm |
UNITED STATES
SECURITIES AND EXCHANGE COMMISSION
Washington, D.C. 20549
FORM 10-K
(Mark One)
þ ANNUAL REPORT PURSUANT TO SECTION 13 OR 15(d) OF THE SECURITIES EXCHANGE ACT OF 1934
For the Fiscal Year Ended December 31, 2016
or
¨ TRANSITION REPORT PURSUANT TO SECTION 13 OR 15(d) OF THE SECURITIES EXCHANGE ACT OF 1934
For the transition period from_______ to_______
Commission File Number: 333-200693-06
Rice Energy Operating LLC
(Exact name of registrant as specified in its charter)
Delaware | 61-1671607 | |
(State or other jurisdiction of incorporation or organization) | (I.R.S. Employer Identification No.) | |
2200 Rice Drive Canonsburg, Pennsylvania | 15317 | |
(Address of principal executive offices) | (Zip code) | |
Registrant’s telephone number, including area code: (724) 271-7200 | ||
Securities registered pursuant to Section 12(b) of the Act: | ||
Title of each class | Name of each exchange on which registered | |
Common Unit | ||
Securities registered pursuant to Section 12(g) of the Act: None | ||
Indicate by check mark if the registrant is a well-known seasoned issuer, as defined in Rule 405 of the Securities Act. ¨Yes þNo | ||
Indicate by check mark if the registrant is not required to file reports pursuant to Section 13 or Section 15(d) of the Act. ¨Yes þNo | ||
Indicate by check mark whether the registrant (1) has filed all reports required to be filed by Section 13 or 15(d) of the Securities Exchange Act of 1934 during the preceding 12 months (or for such shorter period that the registrant was required to file such reports), and (2) has been subject to such filing requirements for the past 90 days. þYes ¨No | ||
Indicate by check mark whether the registrant has submitted electronically and posted on its corporate Web site, if any, every Interactive Data File required to be submitted and posted pursuant to Rule 405 of Regulation S-T during the preceding 12 months (or for such shorter period that the registrant was required to submit and post such files). þYes ¨No | ||
Indicate by check mark if disclosure of delinquent filers pursuant to Item 405 of Regulation S-K is not contained herein, and will not be contained, to the best of registrant’s knowledge, in definitive proxy or information statements incorporated by reference in Part III of this Form 10-K or any amendment to this Form 10-K. þ | ||
Indicate by check mark whether the registrant is a large accelerated filer, an accelerated filer, a non-accelerated filer, or a small reporting company. See the definitions of “large accelerated filer”, “accelerated filer” and “smaller reporting company” in Rule 12b-2 of the Exchange Act. (Check one): | ||
Large accelerated filer ¨ | Accelerated filer ¨ | |
Non-accelerated filer þ | Smaller reporting company ¨ | |
(Do not check if a smaller reporting company) | ||
Indicate by check mark whether the registrant is a shell company (as defined in Rule 12b-2 of the Exchange Act). ¨Yes þNo | ||
There is no public trading market for the common units. As a result, the aggregate market value cannot be determined.
The number of common units outstanding as of March 30, 2017: 243,069,274 common units, none of which were publicly traded.
Documents Incorporated by Reference
Rice Energy Inc., the parent company of Rice Energy Operating LLC, will file a definitive proxy statement relating to its annual meeting of shareholders (to be held May 31, 2017) with the Commission within 120 days after the close of Rice Energy Inc’s fiscal year ended December 31, 2016 and such proxy statement is incorporated by reference in Part III to the extent described herein.
RICE ENERGY OPERATING LLC
ANNUAL REPORT ON FORM 10-K
TABLE OF CONTENTS
Page | |
PART I | |
PART II | |
PART III | |
PART IV | |
2
Cautionary Statement Regarding Forward-Looking Statements
This Annual Report on Form 10-K (the “Annual Report”) contains “forward-looking statements” within the meaning of Section 27A of the Securities Act of 1933, as amended (the “Securities Act”), and Section 21E of the Securities Exchange Act of 1934, as amended (the “Exchange Act”). All statements, other than statements of historical fact included in this Annual Report, regarding our strategy, future operations, financial position, estimated revenues and income/losses, projected costs, prospects, plans and objectives of management are forward-looking statements. When used in this Annual Report, the words “could,” “believe,” “anticipate,” “may,” “assume,” “forecast,” “position,” “predict,” “strategy,” “expect,” “intend,” “plan,” “estimate,” “project,” “budget,” “potential,” or “continue,” and similar expressions are intended to identify forward-looking statements, although not all forward-looking statements contain such identifying words. These forward-looking statements are based on our current expectations and assumptions about future events and are based on currently available information as to the outcome and timing of future events. You are cautioned not to place undue reliance on any forward-looking statements. You should also understand that it is not possible to predict or identify all such factors and should not consider the following list to be a complete statement of all potential risks and uncertainties. When considering forward-looking statements, you should keep in mind the risk factors and other cautionary statements described under the heading “Item 1A. Risk Factors” included in this Annual Report.
Forward-looking statements may include statements about:
• | our business strategy; |
• | our reserves; |
• | our financial strategy, liquidity and capital required for our development program; |
• | realized natural gas, natural gas liquid (“NGL”) and oil prices; |
• | timing and amount of future production of natural gas, NGLs and oil; |
• | our hedging strategy and results; |
• | our future drilling plans; |
• | competition and government regulations; |
• | pending legal or environmental matters; |
• | our marketing of natural gas, NGLs and oil; |
• | our leasehold or business acquisitions; |
• | costs of developing our properties and conducting our gathering and other midstream operations; |
• | operations of Rice Midstream Partners LP; |
• | monetization transactions, including asset sales to Rice Midstream Partners LP; |
• | general economic conditions; |
• | credit and capital markets; |
• | uncertainty regarding our future operating results; and |
• | plans, objectives, expectations and intentions contained in this Annual Report that are not historical. |
We caution you that these forward-looking statements are subject to all of the risks and uncertainties, most of which are difficult to predict and many of which are beyond our control, incident to the exploration for and development, production, gathering and sale of natural gas, NGLs and oil. These risks include, but are not limited to: commodity price volatility; inflation; lack of availability of drilling and production equipment and services; environmental risks; drilling and other operating risks; regulatory changes; the uncertainty inherent in estimating natural gas reserves and in projecting future rates of production, cash flow and access to capital; the timing of development expenditures; risks relating to joint venture operations; and the other risks described under the heading “Item 1A. Risk Factors” in this Annual Report.
Reserve engineering is a process of estimating underground accumulations of natural gas, NGLs and oil that cannot be measured in an exact way. The accuracy of any reserve estimate depends on the quality of available data, the interpretation of such data and price and cost assumptions made by reserve engineers. In addition, the results of drilling, testing and production activities may justify revisions of estimates that were made previously. If significant, such revisions could change the schedule of any further production and development drilling. Accordingly, reserve estimates may differ significantly from the quantities of natural gas, NGLs and oil that are ultimately recovered.
Should one or more of the risks or uncertainties described in this Annual Report occur, or should underlying assumptions prove incorrect, our actual results and plans could differ materially from those expressed in any forward-looking statements.
All forward-looking statements, expressed or implied, included in this Annual Report are expressly qualified in their entirety by this cautionary statement. This cautionary statement should also be considered in connection with any subsequent written or oral forward-looking statements that we or persons acting on our behalf may issue.
Except as otherwise required by applicable law, we disclaim any duty to update any forward-looking statements, all of which are expressly qualified by the statements in this section, to reflect events or circumstances after the date of this Annual Report.
3
Commonly Used Defined Terms
As used in the Annual Report, unless the context indicates or otherwise requires, the following terms have the following meanings:
• | “Rice Energy Operating,” the “Company,” “REO,” “we”, “our,” “us” or like terms when discussing periods: |
• | prior to October 19, 2016, refer to Rice Energy Appalachia, LLC and its consolidated subsidiaries; and |
• | subsequent to October 19, 2016, refer to Rice Energy Operating LLC, formerly known as Rice Energy Appalachia LLC, and its consolidated subsidiaries; |
• | “Rice Energy” refers to Rice Energy Inc. (NYSE: RICE), the parent company of REO; |
• | “Rice Drilling B” refers to Rice Drilling B LLC, a subsidiary of Rice Energy Operating; |
• | “RMP” or the “Partnership” refer to Rice Midstream Partners LP (NYSE: RMP); |
• | “Rice Midstream OpCo” refers to Rice Midstream OpCo LLC, a wholly-owned subsidiary of RMP; |
• | “Midstream Holdings” refers to Rice Midstream Holdings LLC, a subsidiary of Rice Energy Operating; |
• | “Marcellus joint venture” refers collectively to Alpha Shale Resources, LP and its general partner, Alpha Shale Holdings, LLC; |
• | “PA Water” refers to Rice Water Services (PA) LLC, a subsidiary of RMP; |
• | “OH Water” refers to Rice Water Services (OH) LLC, a subsidiary of RMP; |
• | “GP Holdings” refers to Rice Midstream GP Holdings LP, a subsidiary of Rice Energy Operating; |
• | “Vantage” refers collectively to Vantage Energy, LLC and Vantage Energy II, LLC; |
• | “Vantage Midstream Entities” refers collectively to Vantage Energy II Access, LLC and Vista Gathering, LLC; and |
• | “Vantage Acquisition” refers to Rice Energy’s acquisition of Vantage and its subsidiaries. |
4
Explanatory Note
This Annual Report on Form 10-K is filed by Rice Energy Operating, which is a holding company that owns the subsidiaries that directly and indirectly own and operate the business. Prior to the Vantage Acquisition, which was completed on October 19, 2016, REO was a wholly-owned subsidiary of Rice Energy, formerly known as Rice Energy Appalachia, LLC. Following the Vantage Acquisition, as of December 31, 2016, Rice Energy owned an 83.51% membership interest in REO and the Vantage Sellers (defined herein) owned a 16.49% membership interest in REO. Because REO was the co-obligor of registered debt securities and was no longer wholly-owned by Rice Energy as of December 31, 2016, REO is required to file this Annual Report on Form 10-K.
In addition, in connection with the closing of the Vantage Acquisition, we entered into a Debt Assumption Agreement (defined herein) dated as of October 19, 2016 with Rice Energy, pursuant to which Rice Energy Operating agreed to be the primary obligor of the Notes (defined herein) and certain entities acquired in the Vantage Acquisition became wholly-owned subsidiaries of Rice Energy Operating and guarantors of the Notes. For purposes of the Rice Energy Operating financial statements, certain items have been pushed down from Rice Energy, which are described in further detail within this Annual Report. In addition, under current federal and state income tax laws and regulations, because Rice Energy Operating is a multi-member limited liability company, it is treated as a partnership for income tax reporting purposes and is generally not subject to income taxes subsequent to October 19, 2016. As such, no provision has been made for federal, state or local income taxes associated with the results of operations generated by Rice Energy Operating subsequent to October 19, 2016 because such taxes are the responsibility of its unitholders.
PART I
Item 1. Business
General
Rice Energy Operating, a Delaware limited liability company, is an independent natural gas and oil company focused on the acquisition, exploration and development of natural gas, oil and NGL properties in the Appalachian Basin. We operate in three business segments, which are managed separately due to their distinct operational differences. Our three reporting segments are as follows:
Exploration and Production - This segment is engaged in the acquisition, exploration and development of natural gas, oil and NGLs.
Rice Midstream Holdings - This segment is engaged in the gathering and compression of natural gas production in Belmont and Monroe Counties, Ohio.
Rice Midstream Partners - This segment is engaged in the gathering and compression of natural gas production in Washington and Greene Counties, Pennsylvania, and in the provision of water services to support the well completion services of us and third parties in Washington and Greene Counties, Pennsylvania and in Belmont County, Ohio.
Our corporate offices are located at 2200 Rice Drive, Canonsburg, Pennsylvania 15317 (telephone: (724) 271-7200). Our common units are not listed and are not traded on an exchange. At December 31, 2016, we had 242,606,908 common units outstanding, inclusive of 40,000,000 common units owned by certain affiliates of Quantum Energy Partners, Riverstone Holdings LLC and Lime Rock Partners (such affiliates, the “Vantage Sellers”). The common units owned by the Vantage Sellers are immediately convertible into a proportionate number of shares of Rice Energy common stock. Additional information regarding the Vantage Acquisition is set forth in Part II—Item 8—Note 3 to the Consolidated Financial Statements included herein, which is incorporated by reference to this Item 1.
Rice Energy Operating Significant Accomplishments in 2016
• | Increased 2016 net production to 831 MMcfe/d, a 51% increase from 2015 |
• | Achieved significant Rice Midstream Holdings segment throughput of 708 MDth/d, a 187% increase over the prior year |
• | Achieved significant Rice Midstream Partners segment throughput of 983 MDth/d, a 52% increase over the prior year |
• | Completed the Vantage Acquisition for a purchase price of $2.7 billion in October 2016 |
5
• | Concurrent with the Vantage Acquisition, completed the drop-down of the Vantage Midstream Entities to RMP for proceeds of $600.0 million (“Vantage Midstream Asset Acquisition”) |
• | Increased 2016 proved reserves to 4.0 Tcfe, a 136% increase from 2015 |
• | Increased 2017 fixed price hedge position to 1,246 BBtu/d, with 970 BBtu/d of HHUB hedges at a weighted average floor price of $3.24 per MMBtu |
• | Completed $375 million strategic equity investment by EIG Global Energy Partners in Rice Midstream Holdings (the “Midstream Holdings Investment”) |
• | Increased the borrowing base of the Senior Secured Revolving Credit Facility (defined herein) from $750.0 million to $1.45 billion |
• | Maintained a strong liquidity position of $1.9 billion for the year ended December 31, 2016, excluding RMP |
Background on Our Financial Information and Results of Operations
As a result of certain reorganizations and transactions that occurred during 2014, 2015 and 2016, our historical financial condition and results of operations for the periods presented in this Annual Report may not be comparable, either from period to period or going forward. For example, information for the period from January 1, 2014 until January 29, 2014, as contained within the year ended December 31, 2014 pertains to the historical financial statements and results of operations of Rice Drilling B, the accounting predecessor to Rice Energy. Such periods reflect only our 50% equity investment in our Marcellus joint venture. From and after our acquisition of the remaining 50% interest from Alpha Natural Resources (“Alpha Holdings”) on January 29, 2014, the results of operations of our Marcellus joint venture are consolidated into our results of operations.
In connection with RMP’s initial public offering (the “RMP IPO”) in December 2014, we contributed all of our gas gathering and compression assets in Washington and Greene Counties, Pennsylvania in exchange for, among other things, common and subordinated units representing a 50% limited partner interest and all of the incentive distribution rights in RMP. Indirectly through Midstream Holdings, we own and control the general partner of RMP, and as such the results of operations of RMP are consolidated into our results of operations. However, while our results of operations consolidate the results of operations of RMP, for periods subsequent to December 22, 2014, they give effect to the noncontrolling interest in RMP held by its public unitholders.
Also in connection with the RMP IPO, we entered into various gas gathering and compression agreements and water services agreements, both intercompany and, in the case of certain gas gathering and compression services in Pennsylvania, with RMP. Prior to December 22, 2014, with certain limited exceptions, the Rice Midstream Holdings segment and the Rice Midstream Partners segment did not charge fees for providing such services to our Exploration and Production segment. From December 22, 2014 through October 31, 2015, the Rice Midstream Holdings segment charged the Exploration and Production segment water services fees according to the water services agreements entered into in connection with the RMP IPO. Beginning on November 1, 2015, as a result of the closing of the acquisition of Rice Water Services (PA) LLC (“PA Water”) and Rice Water Services (OH) LLC (“OH Water”) by RMP, the Rice Midstream Partners segment charges the Exploration and Production segment water services fees according to certain water services agreements entered in connection with the acquisition. These gathering and water services fees are eliminated through consolidation.
As part of the consideration for the Vantage Acquisition, the Vantage Sellers were issued 1/1000th of a share of Rice Energy preferred stock for each unit held in us. In connection with the issuance of such membership interests to the Vantage Sellers, Rice Energy and the Vantage Sellers entered into our Third Amended and Restated Limited Liability Company Agreement (the “Third A&R LLC Agreement”). Under the Third A&R LLC Agreement, as the sole manager, Rice Energy controls all of our day-to-day business affairs and decision making without approval of any other member, unless otherwise stated in the Third A&R LLC Agreement. As such, Rice Energy, through its officers and directors, is responsible for all operational and administrative decisions and the day-to-day management of our business. Pursuant to the terms of the Third A&R LLC Agreement, Rice Energy cannot, under any circumstances, be removed or replaced as our sole manager, except by its own election, so long as it remains a member. Provisions regarding our operations and the rights and obligations of the holders of our common units are set forth in the Third A&R LLC Agreement. As of December 31, 2016, Rice Energy owned an 83.51% membership interest in us. The remaining 16.49% membership interest in us was owned by the Vantage Sellers as of December 31, 2016.
Exploration and Production Business Segment
Our Exploration and Production segment operates in the core of the Marcellus and Utica Shales. As of December 31, 2016, we held approximately 185,000 net acres in the southwestern core of the Marcellus Shale, substantially all of which are
6
in Washington and Greene Counties, Pennsylvania, and approximately 63,000 net acres in the southeastern core of the Utica Shale, primarily in Belmont County, Ohio. We operate a majority of our acreage in the Marcellus Shale and Utica Shale. In addition, following the completion of the Vantage Acquisition, we held approximately 36,000 net non-core acres in the Barnett Shale as of December 31, 2016.
The following table provides a summary of our approximate net acreage, net drilling locations and net producing wells as of December 31, 2016, average net daily production for the three months ended December 31, 2016, projected 2017 net wells online and projected 2017 drilling and completion (“D&C”) capital budget as of February 22, 2017:
As of December 31, 2016 | Q4 2016 Average Net Daily Production (MMcfe/d) | 2017 Projected Net Wells Online | 2017 Projected D&C Capex Budget ($mm) | ||||||||||||||||
Approximate Net Acreage(1) | Net Drilling Locations (2) | Net Producing Wells | |||||||||||||||||
Appalachian Basin | |||||||||||||||||||
Marcellus Shale | 185,000 | 861 | 229 | 699 | 55 | $ | 585 | ||||||||||||
Utica Shale - Ohio (3) | 63,000 | 241 | 44 | 369 | 25 | 450 | |||||||||||||
Utica Shale - Pennsylvania | 105,000 | 228 | 1 | 1 | — | — | |||||||||||||
Upper Devonian Shale | 108,000 | 464 | 8 | 3 | — | — | |||||||||||||
Total Appalachian Basin (4) | 248,000 | 1,794 | 282 | 1,073 | 80 | $ | 1,035 | ||||||||||||
Other (5) | |||||||||||||||||||
Barnett Shale | 36,000 | 171 | 140 | 72 | — | — | |||||||||||||
Total | 284,000 | 1,965 | 422 | 1,145 | 80 | $ | 1,035 | ||||||||||||
(1) | In connection with the Vantage Acquisition, we acquired approximately 85,000 and 52,000 net Marcellus Shale and net Pennsylvania Utica Shale acres, respectively, located in Greene County, Pennsylvania and approximately 36,000 net Barnett Shale acres located in the Fort Worth Basin in Texas. |
(2) | Based on our reserve report as of December 31, 2016, we had 109 and 34 net drilling locations associated with proved undeveloped reserves in the Marcellus and Utica Shale, respectively, and 18 and 11 net drilling Marcellus and Utica Shale locations, respectively, associated with proved developed not producing reserves. Please see “Item 2. Properties—Exploration and Production Segment Properties Reserve Data—Determination of Drilling Locations” for more information regarding the process and criteria through which these drilling locations were identified. The drilling locations on which we actually drill will depend on the availability of capital, regulatory approval, commodity prices, costs, actual drilling results and other factors. Please see “Item 1A. Risk Factors—Risks Related to Our Business—Our drilling locations are scheduled out over many years, making them susceptible to uncertainties that could materially alter the occurrence or timing of their drilling. In addition, we may not be able to raise the substantial amount of capital that would be necessary to drill our drilling locations.” |
(3) | Ohio Utica Shale net drilling locations gives effect to our working interest in the Ohio Utica Shale after applying unitization and participating interest assumptions described under “Item 2. Properties—Exploration and Production Properties Reserve Data—Determination of Drilling Locations.” |
(4) | Net acres in the Pennsylvania Utica Shale and Upper Devonian Shale are not included in the total acreage as the Pennsylvania Utica Shale, Upper Devonian Shale and Marcellus Shale are stacked formations within the same geographic footprint. |
(5) | Excludes approximately 8,500 and 1,000 net acres in the Uinta Basin located in eastern Utah and the Piceance Basin located in northwestern Colorado, respectively, which we acquired in connection with the Vantage Acquisition. |
During 2016, we turned 70 gross (63 net) Appalachian wells into sales, of which 14 gross (14 net) wells were acquired in the Vantage Acquisition, and achieved record sales volumes of 304.4 Bcfe, representing a 51% increase in production over the prior year. As of December 31, 2016, we had 4,005 Bcfe of proved reserves (54% proved developed and 99% natural gas), representing a 136% increase over the prior year-end.
In 2017, we plan to invest $1,260.0 million in our Exploration and Production segment as follows:
• | $585.0 million for drilling and completion in the Marcellus Shale; |
• | $450.0 million for drilling and completion in the Utica Shale; and |
• | $225.0 million for leasehold acquisitions. |
7
Our capital budget excludes acquisitions, other than leasehold acquisitions. Please see “Item 7. Management’s Discussion and Analysis of Financial Condition and Results of Operations.”
As of February 1, 2017, our average annual firm transportation contracts and firm sales arrangements cover production volumes of approximately 1,035 BBtu/d in 2017, 1,268 BBtu/d in 2018, 1,240 BBtu/d in 2019, 1,193 BBtu/d in 2020 and 1,188 BBtu/d in 2021. Under firm transportation contracts, we are obligated to pay demand charges for the contracted capacity regardless of whether it is utilized. We continue to actively manage our firm transportation portfolio to facilitate production growth in our Appalachian Basin position.
For the year ended December 31, 2016, our Exploration and Production segment represented 87% of our operating revenues.
Midstream Business Segments
Our Rice Midstream Holdings and Rice Midstream Partners segments invest in infrastructure to complement our Exploration and Production activities and provide midstream services to third-parties. Through ownership and operation of this infrastructure, we are able to improve our ability to manage costs, control the timing of bringing new production online, enhance the value received for the gathering and compression of our natural gas production and improve water services activities to advance our well completions operations. Unlike many producing basins in the United States, certain portions of the Appalachian Basin currently do not have sufficient midstream infrastructure to support the existing and expected future levels of production. The Rice Midstream Holdings and Rice Midstream Partners segments allow us to obtain the necessary gathering and compression capacity for our production.
Rice Midstream Holdings Segment
Our Rice Midstream Holdings segment is engaged in gathering and compression of natural gas production for us and third parties in Belmont and Monroe Counties, Ohio. For the three months ended December 31, 2016, average daily throughput for the Rice Midstream Holdings segment was 904 MDth/d, including 261 MDth/d attributable to Strike Force Midstream (defined below). As of December 31, 2016, the Rice Midstream Holdings segment consisted of 92 miles of pipeline with gathering capacity of 4,751 MDth/d and compression capacity of 18,960 horsepower.
On February 1, 2016, Strike Force Midstream Holdings LLC (“Strike Force Holdings”), our wholly-owned subsidiary and Gulfport Midstream Holdings, LLC (“Gulfport Midstream”), a wholly-owned subsidiary of Gulfport Energy Corporation (“Gulfport”), entered into an Amended and Restated Limited Liability Company Agreement (the “Strike Force LLC Agreement”) of Strike Force Midstream LLC (“Strike Force Midstream”) to engage in the natural gas midstream business in approximately 319,000 acres of Belmont and Monroe Counties, Ohio (the “Strike Force Midstream AMI”). Under the terms of the Strike Force LLC Agreement, Strike Force Holdings made an initial contribution to Strike Force Midstream of certain pipelines, facilities and rights of way and cash in the amount of $41.0 million in exchange for a 75% membership interest in Strike Force Midstream. Gulfport Midstream made an initial contribution of a gathering system and related assets in exchange for a 25% membership interest in Strike Force Midstream. Strike Force Midstream has the first right to elect to gather natural gas from wells located within the Strike Force Midstream AMI (including through the development of natural gas gathering infrastructure) and will develop gas gathering assets to support Gulfport’s dry gas Utica Shale production within the Strike Force Midstream AMI that is dedicated to Strike Force Midstream.
Rice Midstream Partners Segment
RMP owns, operates, develops and acquires midstream assets in the Appalachian Basin. RMP’s natural gas gathering and compression assets consist of natural gas gathering and compression systems that service high quality producers in the dry gas core of the Marcellus Shale in southwestern Pennsylvania. RMP’s water services assets consist of water pipelines, impoundment facilities, pumping stations, take point facilities and measurement facilities, which are used to support well completion activities and to collect and recycle or dispose of flowback and produced water for us and third parties in Washington and Greene Counties, Pennsylvania and Belmont County, Ohio. RMP provides its services under long-term, fee-based contracts.
As of December 31, 2016, GP Holdings, our indirect subsidiary, owned approximately 28% of the limited partner interest in RMP, consisting of 3,623 common units, 28,753,623 subordinated units and all of the incentive distribution rights. Rice Energy Operating owned 91.75% of the limited partnership interest in GP Holdings as of December 31, 2016. We record the noncontrolling interest of the limited partners of RMP and GP Holdings in our consolidated financial statements.
For the three months ended December 31, 2016, average daily throughput for the Rice Midstream Partners segment was 1,203 MDth/d. As of December 31, 2016, the Rice Midstream Partners segment consisted of 159 miles of pipeline with
8
gathering capacity of 4,137 MDth/d and compression capacity of 59,500 horsepower. As of December 31, 2016, our Pennsylvania and Ohio water services system capacity was 22.5 MMgal/d and 14.0 MMgal/d, respectively.
2017 Midstream Capital Budget.
In 2017, we plan to invest $630.0 million in our midstream operations, consisting of (i) $315.0 million for our Rice Midstream Partners segment and (ii) $315.0 million for our Rice Midstream Holdings segment.
Please see “Item 7. Management’s Discussion and Analysis of Financial Condition and Results of Operations.”
Segment Information
For additional information on operations by segment, please see “Note 8—Financial Information by Business Segment” in the notes to the consolidated financial statements under Item 8 of this Annual Report.
Markets and Customers
Exploration and Production Segment
Our Exploration and Production segment sells produced natural gas principally to natural gas marketers. Natural gas is a commodity, and, therefore, we receive market-based pricing. The market price for natural gas can be volatile, as demonstrated by significant declines in late 2014 and 2015, and continued volatility in much of 2016. In addition, in 2014, 2015 and 2016, the market price for natural gas in the Appalachian Basin sold at a discount relative to the price at Henry Hub, which is the location for pricing NYMEX and natural gas futures, as a result of the increased supply of natural gas in the Northeast region. While additional takeaway capacity has been, and continues to be, added to alleviate this supply/demand imbalance, the cost of new firm transportation projects has risen significantly in recent years. Changes in the market price for natural gas, including basis differentials, impact our revenues, earnings and liquidity. We are unable to predict potential future movements in the market price for natural gas, including Appalachian basis differentials, and thus cannot predict the ultimate impact of prices on our operations; however, we monitor the market for natural gas and adjust strategy and operations as deemed to be appropriate. In order to protect cash flow from undue exposure to the risk of changing commodity prices, we and Rice Energy hedge a significant portion of our forecasted natural gas production, most of which is hedged at NYMEX natural gas prices.
Our hedging strategy and information regarding our derivative instruments is set forth in “Commodity Hedging Activities” in Item 7, “Management’s Discussion and Analysis of Financial Condition and Results of Operations”, Item 7A, “Quantitative and Qualitative Disclosures About Market Risk,” and in “Note 5—Derivative Instruments” to the consolidated financial statements in Item 8 of this Annual Report.
For the year ended December 31, 2016, sales to Sequent Energy Management, LP (“Sequent”) and BP Energy Company (“BP”) represented 25% and 24% of our total Exploration and Production segment revenues, respectively. Although a substantial portion of production is purchased by these customers, we do not believe the loss of these customers would have a material adverse effect on our business, as other customers or markets would be accessible to us. However, if we lose these customers, there is no guarantee that we will be able to enter into an agreement with a new customer which is as favorable as our current agreements.
Rice Midstream Holdings Segment
Our Rice Midstream Holdings segment derives gathering and compression revenues from charges to customers for use of its gathering systems and compression assets in Ohio. The gathering systems currently have interconnects into three major interstate pipelines: Dominion East Ohio, Texas Eastern Transmission and Rockies Express Pipeline.
Rice Midstream Holdings segment gathering system throughput volumes for 2016 totaled 708 MDth/d, of which approximately 45% related to gathering for our Exploration and Production segment and 55% related to third-party volumes. For 2016 and 2015, services provided to our Exploration and Production segment accounted for 52% and 65% of our natural gas gathering and compression revenues in the Rice Midstream Holdings segment, respectively.
9
Rice Midstream Partners Segment
Our Rice Midstream Partners segment derives gathering, compression and water services revenues from charges to customers for use of its gathering systems and compression assets in Pennsylvania and its water assets in Pennsylvania and Ohio. The gathering systems currently have interconnects into five major interstate pipelines: Dominion Transmission, Columbia Gas Transmission, Texas Eastern Transmission, Equitrans Transmission and National Fuel Gas Supply.
Rice Midstream Partners segment gathering system throughput volumes for 2016 totaled 983 MDth/d, of which approximately 73% related to gathering for our Exploration and Production segment and 27% related to third-party volumes. For 2016 and 2015, services provided to our Exploration and Production segment accounted for 76% and 79% of our natural gas gathering, compression and water services revenues in the Rice Midstream Partners segment, respectively.
Seasonality
Demand for natural gas generally decreases during the spring and fall months and increases during the summer and winter months. However, seasonal anomalies such as mild winters or mild summers sometimes lessen this fluctuation. In addition, certain natural gas users utilize natural gas storage facilities and purchase some of their anticipated winter requirements during the summer. This can also lessen seasonal demand fluctuations. These seasonal anomalies can increase competition for equipment, supplies and personnel during the spring and summer months, which could lead to shortages and increase costs or delay our operations.
Seasonal anomalies of the nature described above can increase demand for midstream services during the summer and winter months and decrease demand for such services during the spring and fall months.
Competition
The oil and natural gas industry is intensely competitive, and we compete with other companies in our industry that have greater resources than we do. Many of these companies not only explore for and produce natural gas, but also carry on refining operations and market petroleum and other products on a regional, national or worldwide basis. These companies may be able to pay more for productive natural gas properties and exploratory prospects or define, evaluate, bid for and purchase a greater number of properties and prospects than our financial or human resources permit and may be able to expend greater resources to attract and maintain industry personnel. In addition, these companies may have a greater ability to continue exploration activities during periods of low natural gas market prices. Our larger competitors may be able to absorb the burden of existing, and any changes to, federal, state and local laws and regulations more easily than we can, which would adversely affect our competitive position. Our ability to acquire additional properties and to discover reserves in the future will be dependent upon our ability to evaluate and select suitable properties and to consummate transactions in a highly competitive environment.
Our Rice Midstream Holdings and Rice Midstream Partners operating segments face competition in attracting third-party volumes to our gathering and compression systems and third-party customers for our water services business. In addition, these third parties may develop their own gathering and compression systems or water distribution systems in lieu of employing our assets. Our ability to attract such third-party volumes to our gathering and compression systems and third-party customers for our water services business depends on our ability to evaluate and select suitable projects and to consummate transactions in a highly competitive environment. We may not be able to compete successfully in the future in attracting third-party volumes to our gathering and compression systems, attracting and retaining quality personnel, and raising additional capital, which could have a material adverse effect on these segments.
Regulation of the Oil and Natural Gas Industry
Our operations are substantially affected by federal, state and local laws and regulations. In particular, oil and natural gas production and related operations are, or have been, subject to price controls, taxes, environmental controls and numerous other laws and regulations. All of the jurisdictions in which we own or operate producing natural gas and oil properties have statutory provisions regulating the exploration for and production of natural gas and oil, including provisions related to permits for the drilling of wells, bonding requirements to drill or operate wells, the location of wells, the method of drilling and casing wells, the surface use and restoration of properties upon which wells are drilled, sourcing, storing, treating, transporting, and disposing of water and other materials used in the drilling and completion process, the disposal of waste generated through the drilling, operation and development of wells and the abandonment of wells. Our operations are also subject to various conservation laws and regulations. These include the regulation of the size of drilling and spacing units or proration units, the number of wells which may be drilled in an area, and the unitization or pooling of crude oil or natural gas wells, as well as regulations that address venting, flaring, and leaks of natural gas and the release of other air emissions, and impose certain requirements regarding the ratability or fair apportionment of production from fields and individual wells.
10
Failure to comply with applicable laws and regulations can result in substantial penalties. The regulatory burden on the industry increases the cost of doing business and affects profitability. Although we believe we are in substantial compliance with all applicable laws and regulations, such laws and regulations are frequently amended or reinterpreted. Therefore, we are unable to predict the future costs or impact of compliance. Additional proposals and proceedings that affect the natural gas industry are regularly considered by Congress, the states, the Federal Energy Regulatory Commission (“FERC”), and the courts. We cannot predict when or whether any such proposals may become effective.
We do not believe that compliance with currently applicable laws and regulations will have a material adverse effect on our financial position, cash flows or results of operations. However, current regulatory requirements may change, unforeseen environmental incidents may occur or past non-compliance with environmental laws or regulations may be discovered.
Regulation of Production of Natural Gas and Oil
The production of natural gas and oil is subject to regulation under a wide range of local, state and federal statutes, rules, orders and regulations. Federal, state and local statutes and regulations require permits for drilling operations, drilling bonds and reports concerning operations. All of the states in which we own and operate properties have regulations governing conservation matters, including provisions for the unitization or pooling of natural gas and oil properties, the establishment of maximum allowable rates of production from natural gas and oil wells, the regulation of well spacing or density, and plugging and abandonment of wells. The effect of these regulations is to limit the amount of natural gas and oil that we can produce from our wells and to limit the number of wells or the locations at which we can drill, although we can apply for exceptions to such regulations or to have reductions in well spacing or density. Moreover, each state generally imposes a production or severance tax with respect to the production and sale of oil, natural gas and NGLs within its jurisdiction. Ohio has introduced legislation seeking to increase the current severance tax rate. Although Pennsylvania has imposed an impact fee on energy companies for all new unconventional oil and gas wells drilled in Pennsylvania, the Pennsylvania legislature continues to discuss the imposition of an additional state severance tax on the production of oil and natural gas in Pennsylvania and would collect such tax for as long as the well is producing.
We own interests in properties of significance located onshore in three U.S. states. These states regulate drilling and operating activities by requiring, among other things, permits for the drilling of wells, maintaining bonding requirements in order to drill or operate wells, and regulating the location of wells, the method of drilling and casing wells, the surface use and restoration of properties upon which wells are drilled and the plugging and abandonment of wells. The laws of these states also govern a number of environmental and conservation matters, including the handling and disposing or discharge of waste materials, the size of drilling and spacing units or proration units and the density of wells that may be drilled, unitization and pooling of oil and gas properties and establishment of maximum rates of production from oil and gas wells. Some states have the power to prorate production to the market demand for oil and gas.
The failure to comply with these rules and regulations can result in substantial penalties. Our competitors in the oil and natural gas industry are subject to the same regulatory requirements and restrictions that affect our operations.
Regulation of Transportation and Sales of Natural Gas
Historically, the transportation and sale for resale of natural gas in interstate commerce have been regulated by agencies of the U.S. federal government, primarily FERC. FERC regulates interstate natural gas transportation rates and service conditions, which affects the marketing of natural gas that we produce, as well as the revenues we receive for sales of our natural gas. Since 1985, FERC has endeavored to make natural gas transportation more accessible to natural gas buyers and sellers on an open and non-discriminatory basis. FERC has stated that open access policies are necessary to improve the competitive structure of the interstate natural gas pipeline industry and to create a regulatory framework that will put natural gas sellers into more direct contractual relations with natural gas buyers by, among other things, unbundling the sale of natural gas from the sale of transportation and storage services.
In the past, the federal government has regulated the prices at which natural gas could be sold. While sales by producers of natural gas can currently be made at uncontrolled market prices, Congress could reenact price controls in the future. Deregulation of wellhead natural gas sales began with the enactment of the Natural Gas Policy Act, or NGPA, and culminated in adoption of the Natural Gas Wellhead Decontrol Act which removed controls affecting wellhead sales of natural gas effective January 1, 1993. The transportation and sale for resale of natural gas in interstate commerce is regulated primarily under the Natural Gas Act, or NGA, and by regulations and orders promulgated under the NGA by FERC. In certain limited circumstances, intrastate transportation and wholesale sales of natural gas may also be affected directly or indirectly by laws enacted by Congress and by FERC regulations.
Beginning in 1992, FERC issued a series of orders to implement its open access policies. As a result, the interstate pipelines’ traditional role as wholesalers of natural gas has been greatly reduced and replaced by a structure under which
11
pipelines provide transportation and storage service on an open access basis to others who buy and sell natural gas. Although FERC’s orders do not directly regulate natural gas producers, they are intended to foster increased competition within all phases of the natural gas industry.
The Energy Policy Act of 2005, or EPAct 2005, is a comprehensive compilation of tax incentives, authorized appropriations for grants and guaranteed loans and significant changes to the statutory policy that affects all segments of the energy industry. Among other matters, the EPAct 2005 amends the NGA to add an anti-market manipulation provision which makes it unlawful for any entity to engage in prohibited behavior to be prescribed by FERC, and furthermore provides FERC with additional civil penalty authority. The EPAct 2005 provides FERC with the power to assess civil penalties of up to $1,000,000 per day for violations of the NGA and increases FERC’s civil penalty authority under the NGPA from $5,000 per violation per day to $1,000,000 per violation per day. The civil penalty provisions are applicable to entities that engage in the sale of natural gas for resale in interstate commerce. On January 19, 2006, FERC issued Order No. 670, a rule implementing the anti-market manipulation provision of the EPAct 2005. The rules make it unlawful: (1) in connection with the purchase or sale of natural gas subject to the jurisdiction of FERC, or the purchase or sale of transportation services subject to the jurisdiction of FERC, for any entity, directly or indirectly, to use or employ any device, scheme or artifice to defraud; (2) to make any untrue statement of material fact or omit to make any such statement necessary to make the statements made not misleading; or (3) to engage in any act or practice that operates as a fraud or deceit upon any person. The anti-market manipulation rule does not apply to activities that relate only to intrastate or other non-jurisdictional sales or gathering, but does apply to activities of gas pipelines and storage companies that provide interstate services, as well as otherwise non-jurisdictional entities to the extent the activities are conducted “in connection with” gas sales, purchases or transportation subject to FERC jurisdiction, which now includes the annual reporting requirements under Order 704.
On December 26, 2007, FERC issued Order 704, a final rule on the annual natural gas transaction reporting requirements, as amended by subsequent orders on rehearing. Under Order 704, wholesale buyers and sellers of more than 2.2 million MMBtus of physical natural gas in the previous calendar year, including natural gas gatherers and marketers, are now required to report, on May 1 of each year, aggregate volumes of natural gas purchased or sold at wholesale in the prior calendar year to the extent such transactions utilize, contribute to, or may contribute to the formation of price indices. It is the responsibility of the reporting entity to determine which individual transactions should be reported based on the guidance of Order 704. Order 704 also requires market participants to indicate whether they report prices to any index publishers, and if so, whether their reporting complies with FERC’s policy statement on price reporting.
We cannot accurately predict whether FERC’s actions will achieve the goal of increasing competition in markets in which our natural gas is sold. Additional proposals and proceedings that might affect the natural gas industry are pending before FERC and the courts. The natural gas industry historically has been very heavily regulated. Therefore, we cannot provide any assurance that the less stringent regulatory approach recently established by FERC will continue. However, we do not believe that any action taken will affect us in a way that materially differs from the way it affects other natural gas producers.
Gathering service, which occurs upstream of jurisdictional transmission services, is regulated by the states onshore and in state waters. Although its policy is still in flux, FERC has reclassified certain jurisdictional transmission facilities as non-jurisdictional gathering facilities, which has the tendency to increase our costs of getting gas to point of sale locations. State regulation of natural gas gathering facilities generally include various safety, environmental and, in some circumstances, nondiscriminatory-take requirements. Although such regulation has not generally been affirmatively applied by state agencies, natural gas gathering may receive greater regulatory scrutiny in the future.
Section 1(b) of the NGA exempts natural gas gathering facilities from regulation by FERC as a natural gas company under the NGA. We believe that the natural gas pipelines in our gathering systems meet the traditional tests FERC has used to establish a pipeline’s status as a gatherer not subject to regulation as a natural gas company. However, the distinction between FERC-regulated transmission services and federally unregulated gathering services is the subject of ongoing litigation, so the classification and regulation of our gathering facilities are subject to change based on future determinations by FERC, the courts or Congress.
Our sales of natural gas are also subject to requirements under the Commodity Exchange Act, or CEA, and regulations promulgated thereunder by the Commodity Futures Trading Commission, or CFTC. The CEA prohibits any person from manipulating or attempting to manipulate the price of any commodity in interstate commerce or futures on such commodity. The CEA also prohibits knowingly delivering or causing to be delivered false or misleading or knowingly inaccurate reports concerning market information or conditions that affect or tend to affect the price of a commodity.
Intrastate natural gas transportation is also subject to regulation by state regulatory agencies. The basis for intrastate regulation of natural gas transportation and the degree of regulatory oversight and scrutiny given to intrastate natural gas
12
pipeline rates and services varies from state to state. Insofar as such regulation within a particular state will generally affect all intrastate natural gas shippers within the state on a comparable basis, we believe that the regulation of similarly situated intrastate natural gas transportation in any states in which we operate and ship natural gas on an intrastate basis will not affect our operations in any way that is of material difference from those of our competitors. Like the regulation of interstate transportation rates, the regulation of intrastate transportation rates affects the marketing of natural gas that we produce, as well as the revenues we receive for sales of our natural gas.
Changes in law and to FERC policies and regulations may adversely affect the availability and reliability of firm and/or interruptible transportation service on interstate pipelines, and we cannot predict what future action FERC will take. We do not believe, however, that any regulatory changes will affect us in a way that materially differs from the way they will affect other natural gas producers, gatherers and marketers with which we compete.
Regulation of Pipeline Safety and Maintenance
The Natural Gas Pipeline Safety Act of 1968, as amended (“NGPSA”), and Hazardous Liquids Pipeline Safety Act of 1979, as amended (“HLPSA”), govern the design, installation, testing, construction, operation, replacement and management of natural gas, crude oil, NGL and condensate pipeline facilities. Pursuant to these acts, the Pipeline and Hazardous Materials Safety Administration (“PHMSA”) of the Department of Transportation (“DOT”) has promulgated regulations governing, among other things, pipeline wall thickness, design pressures, maximum operating pressures, pipeline patrols and leak surveys, minimum depth requirements, and emergency procedures, as well as other matters intended to ensure adequate protection for the public and to prevent accidents and failures. Additionally, PHMSA has established promulgated regulations requiring pipeline operators to develop and implement integrity management programs for certain gas and hazardous liquid pipelines that, in the event of a pipeline leak or rupture, could affect “high consequence areas,” (“HCAs”), which are areas where a release could have the most significant adverse consequences, including high-population areas, certain drinking water sources and unusually sensitive ecological areas. New or amended laws and regulations or reinterpretation of existing laws and regulations could result in increased costs.
These pipeline safety laws were amended on January 3, 2012, when former President Barack Obama signed the Pipeline Safety, Regulatory Certainty, and Job Creation Act of 2011 (“2011 Pipeline Safety Act”), which requires increased safety measures for gas and hazardous liquids pipelines. Among other things, the 2011 Pipeline Safety Act directs the Secretary of Transportation to promulgate regulations relating to expanded integrity management requirements, automatic or remote-controlled valve use, excess flow valve use, leak detection system installation, testing to confirm the material strength of certain pipelines, and operator verification of records confirming the maximum allowable pressure of certain intrastate gas transmission pipelines. In March of 2015, PHMSA finalized new rules applicable to gas and hazardous liquid pipelines that, among other changes, impose new post-construction inspections, welding, gas component pressure testing requirements, as well as requirements for calculating pressure reductions for immediate repairs on liquid pipelines. Additionally, in May 2016, PHMSA proposed rules that would, if adopted, impose more stringent requirements for certain gas lines. Among other things, the proposed rulemaking would extend certain of PHMSA’s current regulatory safety programs for gas pipelines beyond HCAs to cover gas pipelines found in newly defined “moderate consequence areas” that contain as few as five dwellings within the potential impact area and would also require gas pipelines installed before 1970 that are currently exempted from certain pressure testing obligations to be tested to determine their maximum allowable operating pressures (“MAOP”). Other new requirements proposed by PHMSA under the rulemaking would require pipeline operators to: report to PHMSA in the event of certain MAOP exceedances; strengthen PHMSA integrity management requirements; consider seismicity in evaluating threats to a pipeline; conduct hydrostatic testing for all pipeline segments manufactured using longitudinal seam welds; and use more detailed guidance from PHMSA in the selection of assessment methods to inspect pipelines. The proposed rulemaking also seeks to impose a number of requirements on gathering lines. More recently in January 2017, PHMSA finalized new regulations for hazardous liquid pipelines that significantly extend and expand the reach of certain PHMSA integrity management requirements (i.e., periodic assessments, repairs and leak detection), regardless of the pipeline’s proximity to an HCA. The final rule also requires all pipelines in or affecting an HCA to be capable of accommodating in-line inspection tools within the next 20 years. In addition, the final rule extends annual and accident reporting requirements to gravity lines and all gathering lines and also imposes inspection requirements on pipelines in areas affected by extreme weather events and natural disasters, such as hurricanes, landslides, floods, earthquakes, or other similar events that are likely to damage infrastructure. The timing for implementation of this rule is uncertain at this time due to the recent change in Presidential Administrations.
Additional future regulatory action expanding PHMSA jurisdiction and imposing stricter integrity management requirements is likely. In June 2016, the President signed into law new legislation entitled Protecting our Infrastructure of Pipelines and Enhancing Safety Act of 2016 (“2016 PIPES Act”). The PIPES Act reauthorizes PHMSA through 2019, and facilitates greater pipeline safety by providing PHMSA with emergency order authority, including authority to issue prohibitions and safety measures on owners and operators of gas or hazardous liquid pipeline facilities to address imminent hazards, without prior notice or an opportunity for a hearing, as well as enhanced release reporting requirements, requiring a review of both natural gas and hazardous liquid
13
integrity management programs, and mandating the creation of a working group to consider the development of an information-sharing system related to integrity risk analyses. The PIPES Act also requires that PHMSA publish periodic updates on the status of those mandates outstanding from 2011 Pipeline Safety Act, of which approximately half remain to be completed. The mandates yet to be acted upon include requiring certain shut-off valves on transmission lines, mapping all HCAs, and shortening the deadline for accident and incident notifications.
Moreover, the 2011 Pipeline Safety Act also increases the maximum penalty for violation of pipeline safety regulations from $100,000 to $200,000 per violation per day of violation and also from $1 million to $2 million for a related series of violations. The safety enhancement requirements and other provisions of the 2011 Pipeline Safety Act as well as any implementation of PHMSA regulations thereunder or any issuance or reinterpretation of PHMSA guidance with respect thereto could require us to install new or modified safety controls, pursue additional capital projects or conduct maintenance programs on an accelerated basis, any of which could result in our incurring increased operating costs that could have a material adverse effect on our results of operations or financial position.
States are largely preempted by federal law from regulating pipeline safety for interstate lines but most are certified by the DOT to assume responsibility for enforcing federal intrastate pipeline regulations and inspection of intrastate pipelines. In practice, because states can adopt stricter standards for intrastate pipelines than those imposed by the federal government for interstate lines, states vary considerably in their authority and capacity to address pipeline safety. However, we do not expect that any such costs would be material to our financial condition or results of operations. The adoption of new or amended regulations by PHMSA or the states that result in more stringent or costly pipeline integrity management or safety standards could have a significant adverse effect on us and similarly situated midstream operators. We cannot predict what future action the DOT will take, but we do not believe that any regulatory changes will affect us in a way that materially differs from the way they will affect other natural gas gatherers with which we compete.
Regulation of Environmental and Occupational Safety and Health Matters
General
Our operations are subject to numerous federal, regional, state, local, and other laws and regulations governing the discharge of materials into the environment or otherwise relating to environmental protection. Applicable U.S. federal environmental laws include, but are not limited to, the Comprehensive Environmental Response, Compensation, and Liability Act (“CERCLA”), the Clean Water Act (“CWA”) and the federal Clean Air Act (“CAA”). These laws and regulations govern environmental cleanup standards, require permits for air emissions, water discharges, underground injection, solid and hazardous waste disposal and set environmental compliance criteria. These laws, as well as state environmental laws, also impose liability for failure to comply with their requirements and for impacts to, and loss of use of, natural resources. In addition, state and local laws and regulations set forth specific standards for drilling wells, the maintenance of bonding requirements in order to drill or operate wells, the spacing and location of wells, the method of drilling and casing wells, the surface use and restoration of properties upon which wells are drilled, the plugging and abandoning of wells, and the prevention and cleanup of pollutants and other matters. We maintain insurance against costs of clean-up operations, but we are not fully insured against all such risks. Additionally, Congress and federal and state agencies frequently revise environmental laws and regulations, and any changes that result in delay or more stringent and costly permitting, waste handling, disposal and clean-up requirements for the oil and gas industry could have a significant impact on our operating costs. Although future environmental obligations are not expected to have a material impact on the results of our operations or financial condition, there can be no assurance that future developments, such as increasingly stringent environmental laws or enforcement thereof, will not cause us to incur material environmental liabilities or costs.
Public and regulatory scrutiny of the energy industry has resulted in increased environmental regulation and enforcement being either proposed or implemented. For example, the U.S. Environmental Protection Agency’s (the “EPA”) 2017 – 2019 National Enforcement Initiatives include “Assuring Energy Extraction Activities Comply with Environmental Laws.” The EPA’s goal is to “address incidences of noncompliance from natural gas extraction and production activities that may cause or contribute to significant harm to public health and/or the environment.” The EPA has emphasized that this initiative will be focused on those areas of the country where energy extraction activities are concentrated, and the focus and nature of the enforcement activities will vary with the type of activity and the related pollution problem presented. This initiative could involve a large scale investigation of our facilities and processes, and could lead to potential enforcement actions, penalties or injunctive relief against us.
Failure to comply with these laws and regulations may result in the assessment of administrative, civil and criminal fines and penalties and the imposition of injunctive relief that limit or prohibit certain of our operations. Accidental releases or spills may occur in the course of our operations. Such releases or spills, including any third-party claims for damage to property, natural resources or persons, could result in us incurring significant costs and liabilities. Although we believe compliance with
14
existing requirements will not have a material adverse impact on us, there can be no assurance that this will continue in the future.
Hazardous Substances and Wastes
CERCLA, also known as the “Superfund law,” imposes cleanup obligations, without regard to fault or the legality of the original conduct, on certain classes of persons that are considered to be potentially responsible for the release of a “hazardous substance” into the environment. These persons include the owner or operator of the disposal site or sites where the release occurred and companies that transported or disposed or arranged for the transport or disposal of the hazardous substances found at the site. Persons who are or were responsible for releases of hazardous substances under CERCLA and any state analogs, such as Pennsylvania’s Hazardous Sites Cleanup Act, may be subject to joint and several liability for the costs of cleaning up the hazardous substances that have been released into the environment and for damages to natural resources. In addition, it is not uncommon for neighboring landowners and other third parties to file corresponding common law claims for personal injury and property damage allegedly caused by the hazardous substances released into the environment. While petroleum and crude oil fractions are not considered hazardous substances under CERCLA and its state analog because of the so-called “petroleum exclusion,” petroleum products containing other hazardous substances have been treated as hazardous substances and non-petroleum products used at our well sites may be considered hazardous substances under CERCLA and its state analog.
The Resource Conservation and Recovery Act (“RCRA”) regulates the generation and disposal of wastes. RCRA specifically excludes from the definition of hazardous waste “drilling fluids, produced waters and other wastes associated with the exploration, development or production of crude oil, natural gas or geothermal energy.” Instead, these wastes are regulated under RCRA’s less stringent nonhazardous solid waste provisions, state laws or other federal laws. However, legislation has been proposed from time to time and environmental citizen groups have advocated for legal or regulatory changes that could reclassify certain natural gas and oil exploration and production wastes as “hazardous wastes,” which would make the reclassified wastes subject to much more stringent handling, disposal and clean-up requirements. For example, in December 2016, the EPA and environmental groups entered into a consent decree to address EPA’s alleged failure to timely assess its RCRA Subtitle D criteria regulations exempting certain exploration and production related oil and gas wastes from regulation as hazardous wastes under RCRA. The consent decree requires EPA to propose a rulemaking no later than March 15, 2019 for revision of certain Subtitle D criteria regulations pertaining to oil and gas wastes or to sign a determination that revision of the regulations is not necessary. If such changes were to occur, they could have a significant impact on our operating costs, as well as the natural gas and oil industry in general. Moreover, some ordinary industrial wastes which we generate, such as paint wastes, waste solvents, laboratory wastes and waste oils, may be regulated as hazardous wastes if they have hazardous characteristics.
In addition, current and future regulations governing the handling and disposal of Naturally Occurring Radioactive Materials (“NORM”) may affect our operations. For example, the Pennsylvania Department of Environmental Protection (“PADEP”) has asked operators to identify technologically enhanced NORM (“TENORM”) in their processes, such as hydraulic fracturing. Local landfills only accept such waste when it meets their TENORM permit standards. As a result, we may have to locate out-of-state landfills to accept TENORM waste from time to time, potentially increasing our disposal costs.
Some of our leases may have had prior owners who commenced exploration and production of natural gas and oil operations on these sites. Although we have utilized operating and disposal practices that were standard in the industry at the time, hydrocarbons or other wastes may have been disposed of or released on or under the properties owned or leased by us on or under other locations where such wastes have been taken for disposal. In addition, a portion of these properties may have been operated by third parties whose treatment and disposal or release of wastes were not under our control. These properties and the wastes disposed thereon may be subject to CERCLA, RCRA, and/or analogous state laws. Under such laws, we could be required to remove or remediate previously disposed wastes (including waste disposed of or released by prior owners or operators) or property contamination (including groundwater contamination by prior owners or operators), or to perform remedial plugging or closure operations to prevent future contamination.
Waste Discharges
The CWA and its state analog impose restrictions and strict controls with respect to the discharge of pollutants, including spills and leaks of oil and other substances, into waters of the United States. The discharge of pollutants into regulated waters is prohibited, except in accordance with the terms of a permit issued by the EPA or an analogous state agency. The CWA and regulations implemented thereunder also prohibit the discharge of dredge and fill material into regulated waters, including jurisdictional wetlands, unless authorized by an appropriately issued permit. In September 2015, new EPA and U.S. Army Corps of Engineers rules defining the scope of the EPA’s and the Corps’ jurisdiction became effective. To the extent the rule expands the scope of the CWA’s jurisdiction, we could face increased costs and delays with respect to obtaining permits for activities in wetland areas. The rule has been challenged in court on the grounds that it unlawfully expands the reach of
15
CWA programs, and implementation of the rule has been stayed pending resolution of the court challenge. The process for obtaining permits has the potential to delay the development of natural gas and oil projects. In addition, federal spill prevention, control and countermeasure requirements require appropriate containment berms and similar structures to help prevent the contamination of navigable waters by a petroleum hydrocarbon tank spill, rupture or leak. In addition, the CWA and analogous state laws require individual permits or coverage under general permits for discharges of storm water runoff from certain types of facilities. Federal and state regulatory agencies can impose administrative, civil and criminal penalties as well as other enforcement mechanisms for non-compliance with discharge permits or other requirements of the CWA and analogous state laws and regulations.
Air Emissions
The CAA and state analogs and regulations restrict the emission of air pollutants from many sources, including oil and gas facilities. New facilities may be required to obtain permits before construction can begin, and existing facilities may be required to obtain additional permits and incur capital costs to remain in compliance. Over time more stringent regulations governing emissions of toxic air pollutants and greenhouse gases (“GHGs”) have been developed by the EPA and may increase the costs of compliance for some facilities. For example, in October 2015, the EPA lowered the National Ambient Air Quality Standard, (“NAAQS”) for ozone from 75 to 70 parts per billion for both the 8-hour primary and secondary standards. State implementation of the revised NAAQS could result in stricter permitting requirements, delay or prohibit our ability to obtain such permits, and result in increased expenditures for pollution control equipment, the costs of which could be significant. In addition, in June 2016, the EPA finalized rules under the CAA regarding criteria for aggregating multiple sites into a single source for air-quality permitting purposes applicable to the oil and gas industry. This rule could cause small facilities (such as tank batteries and compressor stations), on an aggregate basis, to be deemed a major source, thereby triggering more stringent air permitting requirements, which in turn could result in operational delays or require us to install costly pollution control equipment. Also, in February 2017, PADEP proposed two new general permits for oil and gas exploration, development, and production facilities and liquids loading activities. The proposed general permit for unconventional wells and pigging stations generally requires the use of best available technology for equipment and processes, enhanced record-keeping, and quarterly monitoring inspections for the control of methane emissions. The PADEP also intends to issue similar methane rules for existing sources. The other proposed new general permit applies to compressor stations, transmission stations and processing plants, and imposes similar methane emission control and leak detection and repair requirements, as well as noise minimization requirements. These rules have the potential to increase our compliance costs. Compliance with these and other air pollution control and permitting requirements has the potential to delay the development of natural gas and oil projects and increase our costs of development and production, which costs could be significant. However, we do not believe that compliance with such requirements will have a material adverse effect on our operations.
Hydraulic Fracturing
Hydraulic fracturing is an important and common practice that is used to stimulate production of natural gas and/or oil from dense subsurface rock formations. Hydraulic fracturing involves the injection of water, sand or alternative proppant and chemicals under pressure into target geological formations to fracture the surrounding rock and stimulate production. We regularly use hydraulic fracturing as part of our operations. Hydraulic fracturing is typically regulated by state oil and natural gas commissions, but, in response to increased public concern regarding the alleged potential impacts of hydraulic fracturing, the EPA has asserted federal regulatory authority pursuant to the federal Safe Drinking Water Act (“SDWA”) over certain hydraulic fracturing activities involving the use of diesel fuels and published permitting guidance in February 2014 addressing the performance of such activities using diesel fuels. The EPA has also issued final regulations under the federal Clean Air Act establishing performance standards, including standards for the capture of air emissions released during hydraulic fracturing, and advanced notice of proposed rulemaking under the Toxic Substances Control Act to require companies to disclose information regarding the chemicals used in hydraulic fracturing and also finalized rules in June 2016 that prohibit the discharge of wastewater from hydraulic fracturing operations to publicly owned wastewater treatment plants. In addition, the Bureau of Land Management (“BLM”) finalized rules in March 2015 that impose new or more stringent standards for performing hydraulic fracturing on federal and American Indian lands. The U.S. District Court of Wyoming has temporarily stayed implementation of this rule. A final decision has not yet been issued.
Various state and federal agencies are studying the potential environmental impacts of hydraulic fracturing. In December 2016, the EPA released its final report on the potential impacts of hydraulic fracturing on drinking water resources. The final report concluded that “water cycle” activities associated with hydraulic fracturing may impact drinking water resources “under some circumstances,” noting that the following hydraulic fracturing water cycle activities and local- or regional-scale factors are more likely than others to result in more frequent or more severe impacts: water withdrawals for fracturing in times or areas of low water availability; surface spills during the management of fracturing fluids, chemicals or produced water; injection of fracturing fluids into wells with inadequate mechanical integrity; injection of fracturing fluids directly into groundwater resources; discharge of inadequately treated fracturing wastewater to surface waters; and disposal or storage of
16
fracturing wastewater in unlined pits. Since the report did not find a direct link between hydraulic fracturing itself and contamination of groundwater resources, this years-long study report does not appear to provide any basis for further regulation of hydraulic fracturing at the federal level.
Presently, hydraulic fracturing is regulated primarily at the state level, typically by state oil and natural gas commissions and similar agencies. In July 2015, the Ohio Department of Natural Resources issued final rules for horizontal drilling well-pad construction. Ohio, Pennsylvania (where we conduct a majority of our operations), and Texas have all adopted laws and proposed regulations that require oil and natural gas operators to disclose chemical ingredients and water volumes used to hydraulically fracture wells, in addition to more stringent well construction and monitoring requirements. In addition, in January 2016, the PADEP issued new rules establishing stricter disposal requirements for wastes associated with hydraulic fracturing activities, which include, among other things, a prohibition on the use of centralized impoundments for the storage of drill cuttings and waste fluids. Further, these rules include new requirements relating to storage tank vandalism, secondary containment for storage vessels, construction rules for gathering lines and horizontal drilling under streams, and temporary transport lines for freshwater and wastewater. Moreover, local governments may also adopt ordinances within their jurisdictions regulating the time, place and manner of drilling activities in general or hydraulic fracturing activities in particular or prohibit the performance of well drilling in general or hydraulic fracturing in particular. If new or more stringent federal, state, or local legal restrictions relating to the hydraulic fracturing process are adopted in areas where we operate, we could incur potentially significant added costs to comply with such requirements, experience delays or curtailment in the pursuit of exploration, development, or production activities, and perhaps even be precluded from drilling wells.
If new federal, state or local laws or regulations that significantly restrict hydraulic fracturing are adopted, such legal requirements could result in delays, eliminate certain drilling and injection activities and make it more difficult or costly for our customers to perform fracturing. Any such regulations limiting or prohibiting hydraulic fracturing could reduce oil and natural gas exploration and production activities by our customers and, therefore, adversely affect our business. Such laws or regulations could also materially increase our costs of compliance and doing business by more strictly regulating how hydraulic fracturing wastes are handled or disposed.
Climate Change
In response to findings that emissions of carbon dioxide, methane and other greenhouse gases (“GHGs”), present an endangerment to public health and the environment, the EPA has adopted regulations under existing provisions of the CAA that, among other things, establish Prevention of Significant Deterioration (“PSD”), construction and Title V operating permit reviews for certain large stationary sources. Facilities required to obtain PSD permits for their GHG emissions also will be required to meet “best available control technology” standards that will be established by the states or, in some cases, by the EPA on a case‑by‑case basis. These EPA rules could adversely affect our operations and restrict or delay our ability to obtain air permits for new or modified sources. In addition, the EPA has adopted rules requiring the monitoring and reporting of GHG emissions from specified onshore and offshore oil and gas production sources in the United States on an annual basis, which include gathering and boosting facilities as well as completions and workovers from hydraulically fractured oil wells. Also, in June 2016, the EPA finalized new regulations that set emissions standards and leak detection and repair requirements for methane and volatile organic compounds from new and modified oil and natural gas production and natural gas processing and transmission facilities. The EPA has also announced that it intends to pursue, but has not yet proposed, methane emission standards for existing sources in addition to new sources and issued information collection requests to oil and gas operators. Additional regulations could impose new compliance costs and permitting burdens on our operations. The BLM also finalized similar rules in November 2016 that limit methane emissions from new and existing oil and gas operations on federal lands through limitations on the venting and flaring of gas, as well as enhanced leak detection and repair requirements. Compliance with rules to control methane emissions will likely require enhanced record-keeping practices, the purchase of new equipment such as optical gas imaging instruments to detect leaks, and the increased frequency of maintenance and repair activities to address emissions leakage. The rules will also likely require hiring additional personnel to support these activities or the engagement of third party contractors to assist with and verify compliance. These new and proposed rules could result in increased compliance costs on our operations.
While Congress has from time to time considered legislation to reduce emissions of GHGs, there has not been significant activity in the form of adopted legislation to reduce GHG emissions at the federal level in recent years. In the absence of such federal climate legislation, a number of state and regional cap and trade programs have emerged that typically require major sources of GHG emissions, such as electric power plants, to acquire and surrender emission allowances in return for emitting those GHGs. Although it is not possible at this time to predict how legislation or new regulations that may be adopted to address GHG emissions would impact our business, any such future laws and regulations imposing reporting obligations on, or limiting emissions of GHGs from, our equipment and operations could require us to incur costs to reduce emissions of GHGs associated with our operations. Severe limitations on GHG emissions could also adversely affect demand for the oil and natural gas we produce and lower the value of our reserves. Finally, it should be noted that some scientists have concluded that increasing concentrations of GHGs in
17
the Earth’s atmosphere may produce climate changes that have significant physical effects, such as increased frequency and severity of storms, floods, droughts and other climatic events; if any such effects were to occur, they could have an adverse effect on our exploration and production operations.
National Environmental Policy Act
Oil and natural gas exploration and production activities on federal lands are subject to the National Environmental Policy Act (“NEPA”). NEPA requires federal agencies, including the Department of Interior, to evaluate major agency actions having the potential to significantly impact the environment. The process involves the preparation of either an environmental assessment or environmental impact statement depending on whether the specific circumstances surrounding the proposed federal action will have a significant impact on the human environment. The NEPA process involves public input through comments which can alter the nature of a proposed project either by limiting the scope of the project or requiring resource-specific mitigation. NEPA decisions can be appealed through the court system by process participants. This process may result in delaying the permitting and development of projects, increase the costs of permitting and developing some facilities and could result in certain instances in the cancellation of existing leases.
Endangered Species Act and Migratory Bird Treaty Act
The Endangered Species Act (“ESA”) and state analogs restrict activities that may affect endangered or threatened species or their habitats. Similar protections are offered to migratory birds under the Migratory Bird Treaty Act. The designation of previously unidentified endangered or threatened species could cause us to incur additional costs or become subject to operating restrictions or bans in the affected states. For example, in April 2015, the U.S. Fish and Wildlife Service listed the northern long-eared bat, whose habitat includes the areas in which we operate, as a threatened species under the ESA. A critical habitat or suitable habitat designation could result in further material restrictions to federal land use and may materially delay or prohibit access to protected areas that lay within our areas of operation.
Worker Safety
The Occupational Safety and Health Act (“OSHA”) and any analogous state law regulate the protection of the safety and health of workers. The OSHA hazard communication standard requires maintenance of information about hazardous materials used or produced in operations and provision of such information to employees. Other OSHA standards regulate specific worker safety aspects of our operations, such as setting occupational exposure standards for silica from proppant used in hydraulic fracturing. Failure to comply with OSHA requirements can lead to the imposition of penalties.
Safe Drinking Water Act
The SDWA and comparable state provisions restrict the disposal of water produced or used during oil and gas development. Subsurface emplacement of fluids (including disposal wells or enhanced oil recovery) is governed by federal or state regulatory authorities that, in some cases, includes the state oil and gas regulatory authority or the state’s environmental authority. These regulations, and any amendments to these regulations, may increase the costs of compliance for some facilities. Furthermore, in response to alleged seismic events near underground injection wells used for the disposal of oil and gas-related wastewaters, some agencies have imposed moratoria on the use of such injection wells. If new regulatory initiatives are implemented that restrict or prohibit the use of underground injection wells in areas where we rely upon the use of such wells in our operations, our costs to operate may significantly increase.
Employees
We do not have any employees. The officers of Rice Energy manage our operations and activities. As of December 31, 2016, Rice Energy employed approximately 467 people who provide direct support to our operations.
Available Information
The public may read and copy any materials that we file with the SEC at the SEC’s Public Reference Room at 100 F Street, NE, Washington, DC 20549. The public may obtain information on the operation of the Public Reference Room by calling the SEC at 1-800-SEC-0330. Also, the SEC maintains an internet website that contains reports, proxy and information statements, and other information regarding companies, including Rice Energy Operating, that file electronically with the SEC. The public can obtain any document we file with the SEC at http://www.sec.gov.
18
Item 1A. Risk Factors
Our business has many risks. Factors that could materially adversely affect our business, financial condition, operating results or liquidity are discussed below. You should carefully consider the information in this Annual Report, including the matters addressed under “Cautionary Statement Regarding Forward-Looking Statements,” and the following risks.
Risks Related to Our Business
Natural gas prices are volatile. A substantial or extended decline in commodity prices may adversely affect our business, financial condition or results of operations and our ability to meet our capital expenditure obligations and financial commitments.
The prices we receive for our natural gas production heavily influence our revenue, operating results, profitability, access to capital, future rate of growth and carrying value of our properties. Natural gas is a commodity and, therefore, its price is subject to wide fluctuations in response to relatively minor changes in supply and demand. Historically, the commodities market has been volatile and will likely continue to be volatile in the future. The prices we receive for our production, and the levels of our production, depend on numerous factors beyond our control. These factors include the following:
• | worldwide and regional economic conditions affecting the global supply of and demand for natural gas, NGLs and oil; |
• | the price and quantity of imports of foreign natural gas, including liquefied natural gas; |
• | increased associated gas production resulting from higher oil prices and the related increase in oil production; |
• | political conditions in or affecting other producing countries, including conflicts in the Middle East, Africa, South America and Russia; |
• | the level of global exploration and production; |
• | the level of global inventories; |
• | prevailing prices on local price indexes in the areas in which we operate and expectations about future commodity prices; |
• | the proximity, capacity, cost and availability of gathering and transportation facilities, and other factors that result in differentials to benchmark prices; |
• | localized and global supply and demand fundamentals and transportation availability; |
• | the actions of the Organization of the Petroleum Exporting Countries; |
• | weather conditions and natural disasters; |
• | technological advances affecting energy consumption; |
• | the cost of exploring for, developing, producing and transporting reserves; |
• | speculative trading in natural gas derivative contracts; |
• | risks associated with operating drilling rigs; |
• | increased end-user conservation or conversion of alternative fuels; |
• | the price and availability of competitors’ supplies of natural gas and oil and alternative fuels; and |
• | domestic, local and foreign governmental regulation and taxes. |
In addition, substantially all of our natural gas production is sold to purchasers under contracts with market-based prices. The actual prices realized from the sale of natural gas differ from the quoted NYMEX Henry Hub price as a result of location differentials. Location differentials to NYMEX Henry Hub prices, also known as basis differentials, result from variances in regional natural gas prices compared to NYMEX Henry Hub prices as a result of regional supply and demand factors. Historically, we have entered into long-term firm transportation arrangements pursuant to which a portion of our production is shipped to alternative markets. In recent years, the cost of new firm transportation projects has risen significantly. There can be no assurance that the net impact of entering into such arrangements, after giving effect to their costs, will result in more
19
favorable sales prices for our production in the future than local pricing. As such, our net sales prices may be materially less than NYMEX Henry Hub prices as a result of basis differentials and/or firm transportation costs.
Lower commodity prices and negative increases in our differentials will reduce our cash flows and borrowing ability. We may be unable to obtain needed capital or financing on satisfactory terms, which could lead to a decline in our reserves as existing reserves are depleted. Lower commodity prices may also reduce the amount of natural gas that we can produce economically.
If commodity prices further decrease or our negative differentials further increase, a significant portion of our development and exploration projects could become uneconomic. This may result in our having to make significant downward adjustments to our estimated proved reserves. As a result, a substantial or extended decline in commodity prices or an increase in our negative differentials may materially and adversely affect our future business, financial condition, results of operations, liquidity or ability to finance planned capital expenditures.
Our development and exploration projects require substantial capital expenditures. We may be unable to obtain required capital or financing on satisfactory terms, which could lead to a decline in our natural gas reserves.
The natural gas industry is capital intensive. We make and expect to continue to make substantial capital expenditures for the development and acquisition of natural gas reserves. In 2017, we plan to invest $1,260.0 million in our Exploration and Production segment, including $585.0 million for drilling and completion in the Marcellus Shale, $450.0 million for drilling and completion in the Utica Shale and $225.0 million for leasehold acquisitions. Our capital budget excludes acquisitions, other than leasehold acquisitions. We expect to fund our 2017 capital expenditures with existing cash and cash generated by operations, proceeds contributed from Rice Energy and borrowings under our revolving credit facilities. If we do not have sufficient borrowing availability under our revolving credit facilities, including our $1.45 billion Senior Secured Revolving Credit Facility (“Senior Secured Revolving Credit Facility”), due to the current commodity price environment or otherwise, we or Rice Energy may seek alternate debt or equity financing, sell our assets or reduce our capital expenditures. The issuance of additional indebtedness would require that a portion of our cash flow from operations be used for the payment of interest and principal on our indebtedness, thereby reducing our ability to use cash flow from operations to fund working capital, capital expenditures and acquisitions. The actual amount and timing of our future capital expenditures may differ materially from our estimates as a result of, among other things, natural gas prices, actual drilling results, the availability of drilling rigs and other services and equipment, and regulatory, technological and competitive developments. A further reduction or sustained depression in natural gas prices from current levels may result in a decrease in our actual capital expenditures, which would negatively impact our ability to grow production.
Our cash flow from operations and access to capital are subject to a number of variables, including:
• | our proved reserves; |
• | the level of hydrocarbons we are able to produce from existing wells; |
• | our access to, and the cost of accessing, end markets for our production; |
• | the prices at which our production is sold; |
• | our ability to acquire, locate and produce new reserves; |
• | the levels of our operating expenses; and |
• | Rice Energy’s ability to access the public or private capital markets or our ability to borrow under our revolving credit facilities. |
If our cash flows from operations or the borrowing base under our Senior Secured Revolving Credit Facility decrease as a result of lower natural gas prices, operating difficulties, declines in reserves or for any other reason, we may have limited ability to obtain the capital necessary to sustain our planned capital budget or our operations at current levels. If additional capital is needed, we may not be able to obtain debt or equity financing on terms acceptable to us, if at all. If cash flow generated by our operations or available borrowings under our revolving credit facilities are not sufficient to meet our capital requirements, the failure to obtain additional financing could result in a curtailment of our operations relating to development of our properties, which in turn could lead to a decline in our reserves and production, and could adversely affect our business, financial condition and results of operations.
20
Drilling for and producing natural gas are high-risk activities with many uncertainties that could result in a total loss of investment or otherwise adversely affect our business, financial condition or results of operations.
Our future financial condition and results of operations will depend on the success of our development and acquisition activities, which are subject to numerous risks beyond our control, including the risk that drilling will not result in commercially viable natural gas production or that we will not recover all or any portion of our investment in such wells.
Our decisions to purchase, explore or develop prospects or properties will depend in part on the evaluation of data obtained through geophysical and geological analyses, production data and engineering studies, the results of which are often inconclusive or subject to varying interpretations. For a discussion of the uncertainty involved in these processes, see “—Reserve estimates depend on many assumptions that may turn out to be inaccurate. Any material inaccuracies in reserve estimates or underlying assumptions will materially affect the quantities and present value of our reserves.” In addition, our cost of drilling, completing and operating wells is often uncertain before drilling commences.
Further, many factors may curtail, delay or cancel our scheduled drilling projects, including the following:
• | delays imposed by or resulting from compliance with regulatory requirements, including limitations resulting from wastewater disposal, discharge of greenhouse gases, and limitations on hydraulic fracturing; |
• | shortages of or delays in obtaining equipment and qualified personnel or in obtaining water for hydraulic fracturing activities; |
• | equipment failures, accidents or other unexpected operational events; |
• | lack of available gathering facilities or delays in construction of gathering facilities; |
• | lack of available capacity on interconnecting transmission pipelines; |
• | adverse weather conditions, such as blizzards and ice storms; |
• | issues related to compliance with environmental regulations; |
• | environmental hazards, such as natural gas leaks, oil spills, pipeline and tank ruptures, encountering naturally occurring radioactive materials, and unauthorized discharges of brine, well stimulation and completion fluids, toxic gases or other pollutants into the surface and subsurface environment; |
• | declines in natural gas prices; |
• | limited availability of financing at acceptable terms; |
• | title problems; and |
• | limitations in the market for natural gas. |
Any of these risks can cause substantial losses, including personal injury or loss of life, damage to or destruction of property, natural resources and equipment, pollution, environmental contamination or loss of wells and other regulatory penalties.
The substantial majority of our producing properties are concentrated in the Appalachian Basin, making us vulnerable to risks associated with operating primarily in one major geographic area.
The substantial majority of our producing properties are geographically concentrated in the Appalachian Basin, with a particular concentration in Washington and Greene Counties, Pennsylvania and Belmont County, Ohio. As of December 31, 2016 and 2015, 93% and 100%, respectively, of our total estimated proved reserves were attributable to properties located in these areas. As a result of this concentration, we may be disproportionately exposed to the impact of regional supply and demand factors, delays or interruptions of production from wells in these areas caused by and costs associated with governmental regulation, processing or transportation capacity constraints, market limitations, water shortages or other weather related conditions or interruption of the processing or transportation of oil, natural gas or NGLs and changes in regional and local political regimes and regulations. Such conditions could have a material adverse effect on our financial condition and results of operations.
In addition, a number of areas within the Appalachian Basin have historically been subject to mining operations. For example, third parties may engage in subsurface mining operations near or under our properties, which could cause subsidence
21
or other damage to our properties, adversely impact our drilling or adversely impact our midstream activities or those on which we rely. In such event, our operations may be impaired or interrupted, and we may not be able to recover the costs incurred as a result of temporary shut-ins, the plugging and abandonment of any of our wells or the repair of our midstream facilities. Furthermore, the existence of mining operations near our properties could require coordination to avoid adverse impacts as a result of drilling and mining in close proximity. These restrictions on our operations, and any similar restrictions, can cause delays or interruptions or can prevent us from executing our business strategy, which could have a material adverse effect on our financial condition and results of operations.
Further, insufficient takeaway capacity in the Appalachian Basin could cause significant fluctuations in our realized natural gas prices. The Appalachian Basin natural gas business environment has recently experienced periods in which production has surpassed local takeaway capacity, resulting in substantial discounts in the price received by producers such as us. Although additional Appalachian Basin takeaway capacity has been added in recent years, the existing and expected capacity may not be sufficient to keep pace with the increased production caused by accelerated drilling in the area in the short term.
We have various gas transportation service agreements in place to facilitate our growth in the Appalachian Basin, each with minimum volume delivery commitments. We are obligated to pay fees on minimum volumes to our service providers regardless of actual volume throughput, which could be significant. If these fees on minimum volumes are substantial, we may not be able to generate sufficient cash to cover these obligations, which may require us to reduce or delay our planned investments and capital expenditures or seek alternative means of financing.
Due to the concentrated nature of our portfolio of natural gas properties, a number of our properties could experience any of the same conditions at the same time, resulting in a relatively greater impact on our results of operations than they might have on other companies that have a more diversified portfolio of properties.
Restrictions in our existing and future debt agreements could limit our growth and our ability to engage in certain activities.
The revolving credit facilities and the indentures governing the $900.0 million aggregate principal amount of 6.25% senior notes due 2022 (the “2022 Notes”) Rice Energy issued in a private placement on April 25, 2014 and the $400.0 million aggregate principal amount of 7.25% senior notes due 2023 (the “2023 Notes”) Rice Energy issued on March 26, 2015, (collectively, the “Notes”) contain a number of significant covenants (in addition to covenants restricting the incurrence of additional indebtedness). During 2016, we became the borrower under the Senior Secured Revolving Credit Facility and the primary obligor of the Notes. The revolving credit facilities and the indentures governing the Notes include restrictive covenants that may limit our ability to, among other things:
• | sell assets; |
• | make loans to others; |
• | make investments; |
• | enter into mergers; |
• | make certain payments; |
• | hedge future production or interest rates; |
• | incur liens; |
• | engage in certain other transactions without the prior consent of the lenders; and |
• | pay dividends. |
In addition, our revolving credit facilities require us to maintain certain financial ratios or to reduce our indebtedness if we are unable to comply with such ratios. These restrictions may limit our ability to obtain future financings to withstand a future downturn in our business or the economy in general, or to otherwise conduct necessary corporate activities. We may also be prevented from taking advantage of business opportunities that arise because of the limitations that the restrictive covenants under our revolving credit facilities and under the indentures governing the Notes impose on us.
Any significant reduction in our borrowing base under our Senior Secured Revolving Credit Facility as a result of the periodic borrowing base redeterminations or otherwise may negatively impact our ability to fund our operations.
22
Our Senior Secured Revolving Credit Facility limits the amounts we can borrow up to a borrowing base amount, which the lenders, in their sole discretion, determine on a semi-annual basis based upon projected revenues from the oil and gas properties securing our loan. The lenders can unilaterally adjust the borrowing base and the borrowings permitted to be outstanding under the facility. Any increase in the borrowing base requires the consent of the lenders holding 100% of the commitments. If the requisite number of lenders do not agree to an increase, then the borrowing base will be the lowest borrowing base acceptable to such lenders. Outstanding borrowings in excess of the borrowing base must be repaid (in one lump sum or, if we elect, in six equal monthly installments), or we must pledge other oil and gas properties as additional collateral after applicable grace periods. As of December 31, 2016, the borrowing base under our Senior Secured Revolving Credit Facility was $1.45 billion, none of which was outstanding at year-end. Our next scheduled borrowing base redetermination is expected to occur in April 2017.
A breach of any covenant in our Senior Secured Revolving Credit Facility would result in a default under the facility after any applicable grace periods. A default, if not waived, could result in acceleration of the indebtedness outstanding under the relevant facility and in a default with respect to, and an acceleration of, the indebtedness outstanding under other debt agreements that include cross default provisions. The accelerated indebtedness would become immediately due and payable. If that occurs, we may not be able to make all of the required payments or borrow sufficient funds to refinance such indebtedness. Even if new financing were available at that time, it may not be on terms that are acceptable to us.
Reserve estimates depend on many assumptions that may turn out to be inaccurate. Any material inaccuracies in reserve estimates or underlying assumptions will materially affect the quantities and present value of our reserves.
The process of estimating natural gas reserves is complex. It requires interpretations of available technical data and many assumptions, including assumptions relating to current and future economic conditions and commodity prices. Any significant inaccuracies in these interpretations or assumptions could materially affect the estimated quantities and present value of our reserves.
In order to prepare reserve estimates, we must project production rates and timing of development expenditures. We must also analyze available geological, geophysical, production and engineering data. The extent, quality and reliability of this data can vary. The process also requires economic assumptions about matters such as natural gas prices, drilling and operating expenses, capital expenditures, taxes and availability of funds.
Actual future production, natural gas prices, revenues, taxes, development expenditures, operating expenses and quantities of recoverable natural gas reserves will vary from our estimates. As a substantial portion of our reserve estimates are made without the benefit of a lengthy production history, any significant variance from the above assumption could materially affect the estimated quantities and present value of our reserves. In addition, we may adjust reserve estimates to reflect production history, results of exploration and development, existing commodity prices and other factors, many of which are beyond our control.
You should not assume that the present value of future net revenues from our reserves is the current market value of our estimated natural gas reserves. We generally base the estimated discounted future net cash flows from reserves on prices and costs on the date of the estimate in accordance with SEC requirements. Actual future prices and costs may differ materially from those used in the present value estimate. Please see “—The standardized measure of discounted future net cash flows from our proved reserves will not be the same as the current market value of our estimated oil and natural gas reserves.”
Reserve estimates for fields that do not have a lengthy production history are less reliable than estimates for fields with lengthy production histories. Less production history may contribute to less accurate estimates of reserves, future production rates and the timing of development expenditures. A substantial number of our producing wells have been operational for less than three years, and estimated reserves vary substantially from well to well. Furthermore, the lack of extensive operational history for horizontal wells in the Utica Shale may also contribute to the inaccuracy of future estimates of reserves and could result in our failing to achieve expected results in the play. A material and adverse variance of actual production, revenues and expenditures from those underlying reserve estimates would have a material adverse effect on our business, financial condition, results of operations and cash flows.
Our drilling locations are scheduled out over many years, making them susceptible to uncertainties that could materially alter the occurrence or timing of their drilling. In addition, we may not be able to raise the substantial amount of capital that would be necessary to drill our drilling locations.
Our management team has specifically identified and scheduled certain well locations as an estimation of our future multi-year drilling activities on our existing acreage. These well locations represent a significant part of our growth strategy. Our ability to drill and develop these locations depends on a number of uncertainties, including natural gas and oil prices, the availability and cost of capital, drilling and production costs, the availability of drilling services and equipment, drilling results,
23
lease expirations, gathering system and pipeline transportation constraints, gathering system and pipeline transportation costs, access to and availability of water sourcing and distribution systems, coordination with coal mining, regulatory approvals and other factors. Because of these uncertain factors, we do not know if the numerous drilling locations we have identified will ever be drilled or if we will be able to produce natural gas or oil from these or any other drilling locations. In addition, unless production is established within the spacing units covering the undeveloped acres on which some of the potential locations are obtained, the leases for such acreage will expire. Further, certain of the horizontal wells we intend to drill in the future may require unitization with adjacent leaseholds controlled by third parties. If these third parties are unwilling to unitize such leaseholds with ours, this may limit the total locations we can drill. As such, our actual drilling activities may materially differ from those presently identified.
As of December 31, 2016, we had 1,965 net Appalachian and Fort Worth Basin drilling locations. As a result of the limitations described above, we may be unable to drill many of these locations. In addition, we will require significant additional capital over a prolonged period in order to pursue the development of these locations, and we may not be able to raise or generate the capital required to do so. Any drilling activities we are able to conduct on these potential locations may not be successful, may not increase our overall proved reserves or may result in a downward revision of our estimated proved reserves, which could have a material adverse effect on our future business and results of operations. For more information on our drilling locations, see “Item 2. Properties—Exploration and Production Segment Properties—Reserve Data—Determination of Drilling Locations.”
Our acreage must be drilled before lease expiration, generally within three to five years, in order to hold the acreage by production. In a highly competitive market for acreage, failure to drill sufficient wells to hold acreage may result in a substantial lease renewal cost, or if renewal is not feasible, loss of our lease and prospective drilling opportunities.
Leases on our oil and natural gas properties typically have a term of three to five years, after which they expire unless, prior to expiration, production is established within the spacing units covering the undeveloped acres. As of December 31, 2016, we had leases in the Appalachian and Fort Worth Basins representing 26,659 undeveloped acres scheduled to expire in 2017, 34,959 undeveloped acres scheduled to expire in 2018, 30,673 undeveloped acres scheduled to expire in 2019, 13,127 undeveloped acres scheduled to expire in 2020 and 24,671 undeveloped acres set to expire in 2021 and thereafter. The cost to renew such leases may increase significantly, and we may not be able to renew such leases on commercially reasonable terms or at all. Moreover, many of our leases require lessor consent to unitize, which may make it more difficult to hold our leases by production. Any reduction in our current drilling program, either through a reduction in capital expenditures or the unavailability of drilling rigs, could result in the loss of acreage through lease expirations. Our reserves and future production and, therefore, our future cash flow and income are highly dependent on successfully developing our undeveloped leasehold acreage and the loss of any leases could materially and adversely affect our ability to so develop such acreage.
The standardized measure of discounted future net cash flows from our proved reserves will not be the same as the current market value of our estimated oil and natural gas reserves.
You should not assume that the standardized measure of discounted future net cash flows from our proved reserves is the current market value of our estimated oil and natural gas reserves. In accordance with SEC requirements in effect at December 31, 2016, 2015 and 2014, we based the discounted future net cash flows from our proved reserves on the 12-month first-day-of-the-month oil and natural gas average prices without giving effect to derivative transactions. Accordingly, the natural gas prices used in our reserve report as of December 31, 2016 was $2.48 per MMBtu and $2.34 per MMBtu for the Appalachian Basin and Fort Worth Basin, respectively. Actual future net cash flows from our oil and natural gas properties will be affected by factors such as:
• | actual prices we receive for oil and natural gas; |
• | actual cost of development and production expenditures; |
• | the amount and timing of actual production; and |
• | changes in governmental regulations. |
The timing of both our production and our incurrence of expenses in connection with the development and production of oil and natural gas properties will affect the timing and amount of actual future net revenues from proved reserves, and thus their actual present value. In addition, the 10% discount factor we use when calculating standardized measure may not be the most appropriate discount factor based on interest rates in effect from time to time and risks associated with us or the oil and natural gas industry in general. Actual future prices and costs may differ materially from those used in the present value estimates included in this Annual Report which could have a material effect on the value of our reserves.
24
The development of our estimated proved undeveloped reserves may take longer and may require higher levels of capital expenditures than we anticipate. Therefore, our estimated proved undeveloped reserves may not be ultimately developed or produced.
As of December 31, 2016, approximately 49% and 0% of our total estimated proved reserves within the Appalachian Basin and Fort Worth Basin, respectively, were classified as proved undeveloped. Our approximately 1,827 Bcfe of estimated proved undeveloped reserves will require an estimated $1.1 billion of development capital over the next five years. Development of these undeveloped reserves may take longer and require higher levels of capital expenditures than we anticipate. Delays in the development of our reserves, increases in costs to drill and develop such reserves, or decreases in commodity prices will reduce the PV-10 value of our estimated proved undeveloped reserves and future net revenues estimated for such reserves and may result in some projects becoming uneconomic. In addition, delays in the development of reserves could cause us to have to reclassify our proved undeveloped reserves as unproved reserves.
If commodity prices decrease to a level such that our future undiscounted cash flows from our properties are less than their carrying value, we will likely be required to take write-downs of the carrying values of our properties.
Accounting rules require that we periodically review the carrying value of our properties for possible impairment. Based on prevailing commodity prices and specific market factors and circumstances at the time of prospective impairment reviews, and the continuing evaluation of development plans, production data, economics and other factors, we may be required to write-down the carrying value of our properties. A write-down constitutes a non-cash charge to earnings. The volatility in oil and natural gas prices may result in impairments of our properties, which could have a material adverse effect on our results of operations for the periods in which such charges are taken.
Unless we replace our reserves with new reserves and develop those reserves, our reserves and production will decline, which would adversely affect our future cash flows and results of operations.
Producing natural gas reservoirs generally are characterized by declining production rates that vary depending upon reservoir characteristics and other factors. Unless we conduct successful ongoing development and exploration activities or continually acquire properties containing proved reserves, our proved reserves will decline as those reserves are produced. Our future reserves and production, and therefore our future cash flow and results of operations, are highly dependent on our success in efficiently developing and exploiting our current reserves and economically finding or acquiring additional recoverable reserves. We may not be able to develop, find or acquire sufficient additional reserves to replace our current and future production. If we are unable to replace our current and future production, the value of our reserves will decrease, and our business, financial condition and results of operations would be adversely affected.
Our derivative activities could result in financial losses or could reduce our earnings.
To achieve more predictable cash flows and reduce our exposure to adverse fluctuations in the prices of natural gas, we and Rice Energy enter into derivative instrument contracts for a significant portion of our natural gas production, including fixed-price swaps. Rice Energy has entered certain hedging agreements for our benefit and as such, the corresponding costs and benefits have been pushed down from Rice Energy to us. As of December 31, 2016, we and Rice Energy had entered into NYMEX hedging contracts through December 31, 2020 covering a total of approximately 941 Bcf of our projected natural gas production at a weighted average price of $3.09 per MMBtu. We and Rice Energy have also entered into fixed price and basis hedging contracts through December 31, 2021 at other various hubs covering a total of approximately 784 Bcf. Accordingly, our earnings may fluctuate significantly as a result of changes in fair value of our derivative instruments.
Derivative instruments also expose us to the risk of financial loss in some circumstances, including when:
• | production is less than the volume covered by the derivative instruments; |
• | the counterparty to the derivative instrument defaults on its contractual obligations; |
• | there is an increase in the differential between the underlying price in the derivative instrument and actual prices received; or |
• | there are issues with regard to legal enforceability of such instruments. |
The use of derivatives may, in some cases, require the posting of cash collateral with counterparties. If we enter into derivative instruments that require cash collateral and commodity prices or interest rates change in a manner adverse to us, our cash otherwise available for use in our operations would be reduced which could limit our ability to make future capital expenditures and make payments on our indebtedness, and which could also limit the size of our borrowing base. Future
25
collateral requirements will depend on arrangements with our counterparties, highly volatile oil and natural gas prices and interest rates.
Our hedging transactions expose us to risk of financial loss if a counterparty fails to perform under a derivative contract. Disruptions in the financial markets could lead to sudden decreases in a counterparty’s liquidity, which could make them unable to perform under the terms of the derivative contract, and we may not be able to realize the benefit of the derivative contract. Any default by the counterparties to our derivative contracts when they become due would have a material adverse effect on our financial condition and results of operations.
Further, if our production is less than the volume commitments under our hedging arrangements, or if natural gas or oil prices exceed the price at which we have hedged our commodities, we may be obligated to make cash payments to our hedge counterparties or purchase the volume difference at market prices, which could, in certain circumstances, be significant. If we have to purchase additional commodities on the open market or post cash collateral to meet our obligations under such arrangements, our cash otherwise available for use in our operations could be reduced. In addition, derivative arrangements could limit the benefit we would receive from increases in the prices for natural gas, which could also have an adverse effect on our financial condition.
Our operations are subject to governmental laws and regulations relating to the protection of the environment, which may expose us to significant costs and liabilities that could exceed current expectations.
Substantial costs, liabilities, delays and other significant issues could arise from environmental laws and regulations inherent in drilling and well completion, gathering, transportation, and storage, and we may incur substantial costs and liabilities in the performance of these types of operations. Our operations are subject to extensive federal, regional, state and local laws and regulations governing environmental protection, the discharge of materials into the environment and the security of chemical and industrial facilities. These laws include:
• | CAA, and analogous state law, which impose obligations related to air emissions; |
• | CWA, and analogous state law, which regulate discharge of wastewaters and storm water from some of our facilities into state and federal waters, including wetlands; |
• | CERCLA, and analogous state law, which regulate the cleanup of hazardous substances that may have been released at properties currently or previously owned or operated by us or locations to which we have sent wastes for disposal; |
• | RCRA, and analogous state law, which impose requirements for the handling and discharge of any solid and hazardous waste from our facilities; |
• | NEPA, which requires federal agencies to study likely environmental impacts of a proposed federal action before it is approved, such as drilling on federal lands; |
• | SDWA, and analogous state law, which restrict the disposal, treatment or release of water produced or used during oil and gas development; |
• | ESA, and analogous state law, which seek to ensure that activities do not jeopardize endangered or threatened animals, fish and plant species, nor destroy or modify the critical habitat of such species; and |
• | OPA, which requires oil storage facilities and vessels to submit to the federal government plans detailing how they will respond to large discharges, requires updates to technology and equipment, regulates above ground storage tanks and sets forth liability for spills by responsible parties. |
Various governmental authorities, including, for example, the EPA, the U.S. Department of the Interior, the BLM and analogous state agencies and tribal governments, have the power to enforce compliance with these laws and regulations and the permits issued under them, oftentimes requiring difficult and costly actions. Failure to comply with these laws, regulations and permits may result in the assessment of administrative, civil and/or criminal fines and penalties and liability for non-compliance, the imposition of investigatory or remedial obligations, costs of corrective action, cleanup or restoration, compensation for personal injury, property damage or other losses, the imposition of stricter conditions on or the revocation of permits, the issuance of injunctions or declaratory relief limiting or preventing some or all of our operations, delays in granting permits and cancellation of leases.
There is inherent risk of the incurrence of environmental costs and liabilities in our business, some of which may be material, due to the handling of our products as they are gathered, transported, processed and stored. Air emissions related to our operations, historical industry operations, and water and waste disposal practices also pose risks of adverse impacts to the
26
environment. Joint and several, strict liability may be incurred without regard to fault under certain environmental laws and regulations, including CERCLA, RCRA and analogous state laws, for the remediation of contaminated areas and in connection with spills or releases of natural gas, oil and wastes on, under, or from our properties and facilities. Private parties may have the right to pursue legal actions to enforce compliance as well as to seek damages for non-compliance with environmental laws and regulations or for personal injury or property damage arising from our operations. Some sites at which we operate may be located near current or former third-party oil and natural gas operations or facilities, and there is a risk that contamination has migrated from those sites to ours. In addition, increasingly strict laws, regulations and enforcement policies could materially increase our compliance costs and the cost of any remediation that may become necessary. Our insurance may not cover all environmental risks and costs or may not provide sufficient coverage if an environmental claim is made against us.
We are generally responsible for all liabilities associated with the environmental condition of our facilities and assets, whether acquired or developed, regardless of when the liabilities arose and whether they are known or unknown. In connection with certain acquisitions and divestitures, we could acquire, or be required to provide indemnification against, environmental liabilities that could expose us to material losses, which may not be covered by insurance. In addition, the steps we could be required to take to bring certain facilities into compliance could be prohibitively expensive, and we might be required to shut down, divest or alter the operation of those facilities, which might cause us to incur losses.
We make assumptions and develop expectations about possible expenditures related to environmental conditions based on current laws and regulations and current interpretations of those laws and regulations. If the interpretation of laws or regulations, or the laws and regulations themselves, change, our assumptions may change, and any new capital costs may be incurred to comply with such changes. In addition, new environmental laws and regulations might adversely affect our products and activities, including drilling, processing, storage and transportation, as well as waste management and air emissions. For instance, federal and state agencies could impose additional safety requirements, any of which could affect our profitability. Further, new environmental laws and regulations might adversely affect our customers, which in turn could affect our profitability.
We may incur significant costs and liabilities resulting from performance of pipeline integrity programs and related repairs.
Pursuant to the authority under the NGPSA and HLPSA, as amended by the Pipeline Safety Improvement Act, the Pipeline Inspection, Protection, Enforcement and Safety Act of 2006 and the 2011 Pipeline Safety Act, PHMSA has promulgated regulations requiring pipeline operators to develop and implement integrity management programs for certain gas and hazardous liquid pipelines that, in the event of a pipeline leak or rupture could affect HCAs, which are areas where a release could have the most significant adverse consequences, including high-population areas, certain drinking water sources and unusually sensitive ecological areas. These regulations require operators of covered pipelines to:
• | perform ongoing assessments of pipeline integrity; |
• | identify and characterize applicable threats to pipeline segments that could impact an HCA; |
• | improve data collection, integration and analysis; |
• | repair and remediate the pipeline as necessary; and |
• | implement preventive and mitigating actions. |
In addition, states have adopted regulations similar to existing PHMSA regulations for certain intrastate gas and hazardous liquid pipelines. At this time, we cannot predict the ultimate cost of compliance with applicable pipeline integrity management regulations, as the cost will vary significantly depending on the number and extent of any repairs found to be necessary as a result of pipeline integrity testing, but the results of these tests could cause us to incur significant and unanticipated capital and operating expenditures for repairs or upgrades deemed necessary to ensure the safe and reliable operation of our pipelines.
The 2011 Pipeline Safety Act is the most recent federal legislation to amend the NGPSA and HLPSA pipeline safety laws, requiring increased safety measures for gas and hazardous liquids pipelines. Among other things, the 2011 Pipeline Safety Act directs the Secretary of Transportation to promulgate regulations relating to expanded integrity management requirements, automatic or remote-controlled valve use, excess flow valve use, leak detection system installation, testing to confirm the material strength of certain pipelines, and operator verification of records confirming the maximum allowable pressure of certain intrastate gas transmission pipelines. Moreover, changes to pipeline safety laws by Congress and regulations by PHMSA or states that result in more stringent or costly safety standards could have a significant adverse effect on us and similarly situated midstream operators. Additionally, in May 2016, PHMSA proposed rules that would, if adopted, impose more stringent requirements for certain gas lines. Among other things, the proposed rulemaking would extend certain of PHMSA’s current regulatory safety programs for gas pipelines beyond HCAs to cover gas pipelines found in newly defined “moderate
27
consequence areas” that contain as few as five dwellings within the potential impact area and would also require gas pipelines installed before 1970 that are currently exempted from certain pressure testing obligations to be tested to determine their MAOP. Other new requirements proposed by PHMSA under the rulemaking would require pipeline operators to: report to PHMSA in the event of certain MAOP exceedances; strengthen PHMSA integrity management requirements; consider seismicity in evaluating threats to a pipeline; conduct hydrostatic testing for all pipeline segments manufactured using longitudinal seam welds; and use more detailed guidance from PHMSA in the selection of assessment methods to inspect pipelines. The proposed rulemaking also seeks to impose a number of requirements on gathering lines. More recently in January 2017, PHMSA finalized new regulations for hazardous liquid pipelines that significantly extend and expand the reach of certain PHMSA integrity management requirements (i.e., periodic assessments, repairs and leak detection), regardless of the pipeline’s proximity to an HCA. The final rule also requires all pipelines in or affecting an HCA to be capable of accommodating in-line inspection tools within the next 20 years. In addition, the final rule extends annual and accident reporting requirements to gravity lines and all gathering lines and also imposes inspection requirements on pipelines in areas affected by extreme weather events and natural disasters, such as hurricanes, landslides, floods, earthquakes, or other similar events that are likely to damage infrastructure. The timing for implementation of this rule is uncertain at this time due to the recent change in presidential administrations.
Additional future regulatory action expanding PHMSA jurisdiction and imposing stricter integrity management requirements is likely. For example, in June 2016, the President signed the 2016 PIPES Act into law. The 2016 PIPES Act reauthorizes PHMSA through 2019, and facilitates greater pipeline safety by providing PHMSA with emergency order authority, including authority to issue prohibitions and safety measures on owners and operators of gas or hazardous liquid pipeline facilities to address imminent hazards, without prior notice or an opportunity for a hearing, as well as enhanced release reporting requirements, requiring a review of both natural gas and hazardous liquid integrity management programs, and mandating the creation of a working group to consider the development of an information-sharing system related to integrity risk analyses. The 2016 PIPES Act also requires that PHMSA publish periodic updates on the status of those mandates outstanding from 2011 Pipeline Safety Act, of which approximately half remain to be completed. The mandates yet to be acted upon include requiring certain shut-off valves on transmission lines, mapping all HCAs, and shortening the deadline for accident and incident notifications.
At this time, we cannot predict the cost of such requirements, but they could be significant. Moreover, Federal and state legislative and regulatory initiatives relating to pipeline safety that require the use of new or more stringent safety controls or result in more stringent enforcement of applicable legal requirements could subject us to increased capital costs, operational delays and costs of operation.
Moreover, the 2011 Pipeline Safety Act also increases the maximum penalty for violation of pipeline safety regulations from $100,000 to $200,000 per violation per day and also from $1 million to $2 million for a related series of violations. The safety enhancement requirements and other provisions of the 2011 Pipeline Safety Act as well as any implementation of PHMSA regulations thereunder or any issuance or reinterpretation of guidance by PHMSA or any state agencies with respect thereto could require us to install new or modified safety controls, pursue additional capital projects or conduct maintenance programs on an accelerated basis, any or all of which tasks could result in our incurring increased operating costs that could have a material adverse effect on our results of operations or financial position. States also are pursuing regulatory programs intended to safely build pipeline infrastructure. The adoption of new or amended regulations by PHMSA or the states that result in more stringent or costly pipeline integrity management or safety standards could have a significant adverse effect on us and similarly situated midstream operators.
Changes in laws or government regulations regarding hydraulic fracturing could increase our costs of doing business, limit the areas in which we can operate and reduce our oil and natural gas production, which could adversely impact our business.
Hydraulic fracturing is an important and common practice that is used to stimulate production of natural gas and/or oil from dense subsurface rock formations. Hydraulic fracturing involves the injection of water, sand or alternative proppant and chemicals under pressure into target geological formations to fracture the surrounding rock and stimulate production. We regularly use hydraulic fracturing as part of our operations. Hydraulic fracturing is typically regulated by state oil and natural gas commissions, but, in response to increased public concern regarding the alleged potential impacts of hydraulic fracturing, the EPA has asserted federal regulatory authority pursuant to the SDWA over certain hydraulic fracturing activities involving the use of diesel fuels and published permitting guidance in February 2014 addressing the performance of such activities using diesel fuels. The EPA has also issued final regulations under the CAA establishing performance standards, including standards for the capture of air emissions released during hydraulic fracturing, and advanced notice of proposed rulemaking under the Toxic Substances Control Act to require companies to disclose information regarding the chemicals used in hydraulic fracturing and also finalized rules in June 2016 that prohibit the discharge of wastewater from hydraulic fracturing operations to publicly
28
owned wastewater treatment plants. In addition, the BLM finalized rules in March 2015 that impose new or more stringent standards for performing hydraulic fracturing on federal and American Indian lands. The U.S. District Court of Wyoming has temporarily stayed implementation of this rule. A final decision has not yet been issued.
Various state and federal agencies are studying the potential environmental impacts of hydraulic fracturing. In December 2016, the EPA released its final report on the potential impacts of hydraulic fracturing on drinking water resources. The final report concluded that “water cycle” activities associated with hydraulic fracturing may impact drinking water resources “under some circumstances,” noting that the following hydraulic fracturing water cycle activities and local- or regional-scale factors are more likely than others to result in more frequent or more severe impacts: water withdrawals for fracturing in times or areas of low water availability; surface spills during the management of fracturing fluids, chemicals or produced water; injection of fracturing fluids into wells with inadequate mechanical integrity; injection of fracturing fluids directly into groundwater resources; discharge of inadequately treated fracturing wastewater to surface waters; and disposal or storage of fracturing wastewater in unlined pits. Since the report did not find a direct link between hydraulic fracturing itself and contamination of groundwater resources, this years-long study report does not appear to provide any basis for further regulation of hydraulic fracturing at the federal level.
Presently, hydraulic fracturing is regulated primarily at the state level, typically by state oil and natural gas commissions and similar agencies. In July 2015, the Ohio Department of Natural Resources issued final rules for horizontal drilling well-pad construction. Ohio, Pennsylvania (where we conduct a majority of our operations), and Texas have all adopted laws and proposed regulations that require oil and natural gas operators to disclose chemical ingredients and water volumes used to hydraulically fracture wells, in addition to more stringent well construction and monitoring requirements. In addition, in January 2016, the PADEP issued new rules establishing stricter disposal requirements for wastes associated with hydraulic fracturing activities, which include, among other things, a prohibition on the use of centralized impoundments for the storage of drill cuttings and waste fluids. Further, these rules include new requirements relating to storage tank vandalism, secondary containment for storage vessels, construction rules for gathering lines and horizontal drilling under streams, and temporary transport lines for freshwater and wastewater. Moreover, local governments may also adopt ordinances within their jurisdictions regulating the time, place and manner of drilling activities in general or hydraulic fracturing activities in particular or prohibit the performance of well drilling in general or hydraulic fracturing in particular. If new or more stringent federal, state, or local legal restrictions relating to the hydraulic fracturing process are adopted in areas where we operate, we could incur potentially significant added costs to comply with such requirements, experience delays or curtailment in the pursuit of exploration, development, or production activities, and perhaps even be precluded from drilling wells.
If new federal, state or local laws or regulations that significantly restrict hydraulic fracturing are adopted, such legal requirements could result in delays, eliminate certain drilling and injection activities and make it more difficult or costly for our customers to perform fracturing. Any such regulations limiting or prohibiting hydraulic fracturing could reduce oil and natural gas exploration and production activities by our customers and, therefore, adversely affect our business. Such laws or regulations could also materially increase our costs of compliance and doing business by more strictly regulating how hydraulic fracturing wastes are handled or disposed.
Oil and natural gas producers’ operations, especially those using hydraulic fracturing, are substantially dependent on the availability of water, and our operations can generate a substantial amount of waste water. Restrictions on the ability to obtain water or dispose of waste water generated may impact our operations.
Water is an essential component of oil and natural gas production during the drilling, and in particular, hydraulic fracturing, process. Our inability to locate sufficient amounts of water, or dispose of or recycle water used in our exploration and production operations, could adversely impact our operations. In some of the areas where we operate, such as Texas, drought conditions have persisted in past several years. These drought conditions have led governmental authorities to restrict the use of water subject to their jurisdiction for hydraulic fracturing to protect local water supplies. If we are unable to obtain water to use in our operations, our production could be impacted, which could have a material and adverse effect on our financial condition, results of operations and cash flows.
Moreover, the imposition of new environmental initiatives and regulations could include restrictions on our ability to conduct certain operations such as hydraulic fracturing or disposal of waste, including, but not limited to, produced water, drilling fluids, other materials used in the drilling and completion process and other wastes associated with the exploration, development or production of natural gas. The CWA imposes restrictions and strict controls regarding the discharge of produced waters and other natural gas and oil waste into navigable waters. Permits must be obtained to discharge pollutants to waters and to conduct construction activities in waters and wetlands. In September 2015, new EPA and U.S. Army Corps of Engineers rules defining the scope of the EPA’s and the Corps’ jurisdiction became effective. To the extent the rule expands the scope of the CWA’s jurisdiction, we could face increased costs and delays with respect to obtaining permits for activities in wetland areas. The rule has been challenged in court on the grounds that it unlawfully expands the reach of CWA programs, and
29
implementation of the rule has been stayed pending resolution of the court challenge. The process for obtaining permits has the potential to delay the development of natural gas and oil projects. The CWA and similar state laws provide for civil, criminal and administrative penalties for any unauthorized discharges of pollutants and unauthorized discharges of reportable quantities of oil and other hazardous substances. State and federal discharge regulations prohibit the discharge of produced water and sand, drilling fluids, drill cuttings and certain other substances related to the natural gas and oil industry into coastal waters. Specific to Pennsylvania, sending wastewater to publicly owned treatment works requires certain levels of pretreatment that may effectively prohibit such disposal as a disposal option and our continued ability to use injection wells as a disposal option not only will depend on federal or state regulations but also on whether available injection wells have sufficient storage capacities. The EPA has also adopted regulations requiring certain natural gas and oil exploration and production facilities to obtain permits for storm water discharges. Compliance with current and future environmental regulations and permit requirements governing the withdrawal, storage and use of surface water or groundwater necessary for hydraulic fracturing of wells may increase our operating costs and cause delays, interruptions or termination of our operations, the extent of which cannot be predicted.
Recent decisions by the Ohio Supreme Court interpreting the Ohio Dormant Mineral Act relating to preservation of mineral rights by surface owners could require certain curative efforts to vest title in a portion of our leasehold acreage, increase our leasehold expenses, subject us to payment of additional royalties and/or result in the loss of some of our leasehold acreage in Ohio.
On September 15, 2016, the Ohio Supreme Court issued a series of decisions relating to the Ohio Dormant Mineral Act (the “ODMA”). In the lead case, Corban v. Chesapeake Exploration L.L.C., the court concluded that the 1989 version of the ODMA did not transfer ownership of dormant mineral rights automatically, by operation of law. Instead, prior to 2006, surface owners were required to bring a quiet title action in order to establish abandonment of mineral rights. After June 30, 2006 (the effective date of the 2006 version of the ODMA), surface owners are required to follow the statutory notice and recording procedures enacted in 2006. We are assessing the impact of these recent decisions on our operations in Ohio where a portion of our acreage and our producing properties are located. However, the Ohio Supreme Court decisions could require certain curative efforts to vest title in a portion of our leasehold acreage, increase our leasehold expenses, subject to payment of additional royalties and/or result in the loss of some of our leasehold acreage in Ohio, any of which could have an adverse effect on our results of operations and financial condition.
We are subject to risks associated with climate change.
In response to findings that emissions of carbon dioxide, methane and other GHGs present an endangerment to public health and the environment, the EPA has adopted regulations under existing provisions of the CAA that, among other things, establish PSD construction and Title V operating permit reviews for certain large stationary sources. Facilities required to obtain PSD permits for their GHG emissions also will be required to meet “best available control technology” standards that will be established by the states or, in some cases, by the EPA on a case‑by‑case basis. These EPA rules could adversely affect our operations and restrict or delay our ability to obtain air permits for new or modified sources. In addition, the EPA has adopted rules requiring the monitoring and reporting of GHG emissions from specified onshore and offshore oil and gas production sources in the United States on an annual basis, which include gathering and boosting facilities as well as completions and workovers from hydraulically fractured oil wells. Also, June 2016, the EPA finalized new regulations that set emissions standards and leak detection and repair requirements for methane and volatile organic compounds from new and modified oil and natural gas production and natural gas processing and transmission facilities. The EPA has also announced that it intends to pursue, but has not yet proposed, methane emission standards for existing sources in addition to new sources and issued information collection requests to oil and gas operators. Additional regulations could impose new compliance costs and permitting burdens on our operations. The BLM also finalized proposed new rules in November 2016 that limit methane emissions from new and existing oil and gas operations on federal lands through limitations on the venting and flaring of gas, as well as enhanced leak detection and repair requirements. Compliance with rule to control methane emissions will likely require enhanced record-keeping practices, the purchase of new equipment such as optical gas imaging instruments to detect leaks, and the increased frequency of maintenance and repair activities to address emissions leakage. The rules will also likely require hiring additional personnel to support these activities or the engagement of third party contractors to assist with and verify compliance. These new and proposed rules could result in increased compliance costs on our operations. PADEP also recently announced an initiative to restrict methane emissions from natural gas development activities through revisions to its general permits. Under the proposed changes, operators in Pennsylvania would need to (i) obtain an air quality general permit in advance of operations, (ii) control releases, (iii) report emissions, and (iv) inspect covered equipment and processes and repair leaks within a specified period of time.
While Congress has from time to time considered legislation to reduce emissions of GHGs, there has not been significant activity in the form of adopted legislation to reduce GHG emissions at the federal level in recent years. In the absence of such federal climate legislation, a number of state and regional efforts cap and trade programs have emerged that typically require major sources of GHG emissions, such as electric power plants, to acquire and surrender emission allowances in return for emitting those
30
GHGs. Although it is not possible at this time to predict how legislation or new regulations that may be adopted to address GHG emissions would impact our business, any such future laws and regulations imposing reporting obligations on, or limiting emissions of GHGs from, our equipment and operations could require us to incur costs to reduce emissions of GHGs associated with our operations. Severe limitations on GHG emissions could also adversely affect demand for the oil and natural gas we produce and lower the value of our reserves. Finally, it should be noted that some scientists have concluded that increasing concentrations of GHGs in the Earth’s atmosphere may produce climate changes that have significant physical effects, such as increased frequency and severity of storms, floods, droughts and other climatic events; if any such effects were to occur, they could have an adverse effect on our exploration and production operations.
We may incur substantial losses and be subject to substantial liability claims as a result of our operations. Additionally, we may not be insured for, or our insurance may be inadequate to protect us against, these risks.
Our natural gas exploration and production activities are subject to all of the operating risks associated with drilling for and producing natural gas, including the possibility of:
• | environmental hazards, such as uncontrollable releases of oil, natural gas, brine, well fluids, toxic gas or other pollution into the environment, including groundwater, air and shoreline contamination; |
• | abnormally pressured formations; |
• | mechanical difficulties, such as stuck oilfield drilling and service tools and casing collapse; |
• | fires, explosions and ruptures of pipelines; |
• | personal injuries and death; |
• | natural disasters; and |
• | terrorist attacks targeting natural gas and oil related facilities and infrastructure. |
Any of these risks could adversely affect our ability to conduct operations or result in substantial loss to us as a result of claims for:
• | injury or loss of life; |
• | damage to and destruction of property, natural resources and equipment; |
• | pollution and other environmental damage; |
• | regulatory investigations and penalties; |
• | suspension of our operations; and |
• | repair and remediation costs. |
In accordance with what we believe to be customary industry practice, we maintain insurance against some, but not all, of our business risks. Our insurance may not be adequate to cover any losses or liabilities we may suffer. Also, insurance may no longer be available to us or, if it is, its availability may be at premium levels that do not justify its purchase. The occurrence of a significant uninsured claim, a claim in excess of the insurance coverage limits maintained by us or a claim at a time when we are not able to obtain liability insurance could have a material adverse effect on our ability to conduct normal business operations and on our financial condition, results of operations or cash flows. In addition, we may not be able to secure additional insurance or bonding that might be required by new governmental regulations. This may cause us to restrict our operations, which might severely impact our financial condition. We may also be liable for environmental damage caused by previous owners of properties purchased by us, which liabilities may not be covered by insurance.
Since hydraulic fracturing activities are a large part of our operations, they are covered by our insurance against claims made for bodily injury, property damage and clean-up costs stemming from a sudden and accidental pollution event. However, we may not have coverage if we are unaware of the pollution event and unable to report the “occurrence” to our insurance company within the time frame required under our insurance policy. We have no coverage for gradual, long-term pollution events. In addition, these policies do not provide coverage for all liabilities, and we cannot assure you that the insurance coverage will be adequate to cover claims that may arise, or that we will be able to maintain adequate insurance at rates we consider reasonable. A loss not fully covered by insurance could have a material adverse effect on our financial condition, results of operations and cash flows.
31
We may elect not to obtain insurance for any or all of these risks if we believe that the cost of available insurance is excessive relative to the risks presented. In addition, pollution and environmental risks generally are not fully insurable. The occurrence of an event that is not fully covered by insurance could have a material adverse effect on our business, financial condition and results of operations.
Properties that we decide to drill may not yield natural gas in commercially viable quantities.
Properties that we decide to drill that do not yield natural gas in commercially viable quantities will adversely affect our results of operations and financial condition. Our project areas are in various stages of development, ranging from project areas with current drilling or production activity to project areas that consist of recently acquired leasehold acreage or that have limited drilling or production history. If the wells in the process of being completed do not produce sufficient revenues to return a profit or if we drill dry holes in the future, our business may be materially affected. In addition, there is no way to predict in advance of drilling and testing whether any particular prospect will yield natural gas in sufficient quantities to recover drilling or completion costs or to be economically viable. The use of micro-seismic data and other technologies and the study of producing fields in the same area will not enable us to know conclusively prior to drilling whether natural gas will be present or, if present, whether natural gas will be present in commercial quantities. We cannot assure you that the analogies we draw from available data from other wells, more fully explored prospects or producing fields will be applicable to our drilling prospects. Further, our drilling operations may be curtailed, delayed or canceled as a result of numerous factors, including:
• | unexpected drilling conditions; |
• | title problems; |
• | pressure or lost circulation in formations; |
• | equipment failure or accidents; |
• | adverse weather conditions; |
• | compliance with environmental and other governmental or contractual requirements; and |
• | increase in the cost of, shortages or delays in the availability of, electricity, supplies, materials, drilling or workover rigs, equipment and services. |
We may be unable to make attractive acquisitions or successfully integrate acquired businesses, and any inability to do so may disrupt our business and hinder our ability to grow.
In the future we may make acquisitions of businesses that complement or expand our current business. However, we may not be able to identify attractive acquisition opportunities. Even if we do identify attractive acquisition opportunities, we may not be able to complete the acquisition or do so on commercially acceptable terms.
The success of any completed acquisition, including the Vantage Acquisition, will depend on our ability to integrate effectively the acquired business into our existing operations. The process of integrating acquired businesses may involve unforeseen difficulties and may require a disproportionate amount of our managerial and financial resources. In addition, possible future acquisitions may be larger and for purchase prices significantly higher than those paid for earlier acquisitions. No assurance can be given that we will be able to identify additional suitable acquisition opportunities, negotiate acceptable terms, obtain financing for acquisitions on acceptable terms or successfully acquire identified targets. Our failure to achieve consolidation savings, to integrate the acquired businesses and assets into our existing operations successfully or to minimize any unforeseen operational difficulties could have a material adverse effect on our financial condition and results of operations.
In addition, our credit facilities impose certain limitations on our ability to enter into mergers or combination transactions. Our credit facilities also limit our ability to incur certain indebtedness, which could indirectly limit our ability to engage in acquisitions of businesses.
32
We may be subject to risks in connection with acquisitions of properties.
The successful acquisition of natural gas and oil properties requires an assessment of several factors, including:
• | recoverable reserves; |
• | future natural gas, NGL or oil prices and their applicable differentials; |
• | operating costs; and |
• | potential environmental and other liabilities. |
The accuracy of these assessments is inherently uncertain. In connection with these assessments, we perform a review of the subject properties that we believe to be generally consistent with industry practices. Our review will not reveal all existing or potential problems nor will it permit us to become sufficiently familiar with the properties to fully assess their deficiencies and capabilities. Inspections may not always be performed on every well, and environmental problems, such as groundwater contamination, are not necessarily observable even when an inspection is undertaken. Even when problems are identified, the seller may be unwilling or unable to provide effective contractual protection against all or part of the problems. We often are not entitled to contractual indemnification for environmental liabilities and acquire properties on an “as is” basis.
A change in the jurisdictional characterization of some of our assets by federal, state or local regulatory agencies or a change in policy by those agencies may result in increased regulation of our assets, which may cause our revenues to decline and operating expenses to increase.
Section 1(b) of the NGA, exempts natural gas gathering facilities from regulation by the FERC, as a natural gas company under the NGA. We believe that the natural gas pipelines in our gathering systems meet the traditional tests FERC has used to establish a pipeline’s status as a gatherer not subject to regulation as a natural gas company. However, the distinction between FERC-regulated transmission services and federally unregulated gathering services is the subject of ongoing litigation, so the classification and regulation of our gathering facilities are subject to change based on future determinations by FERC, the courts or Congress. If the FERC were to consider the status of an individual facility and determine that the facility and/or services provided by it are not exempt from FERC regulation, the rates for, and terms and conditions of services provided by such facility would be subject to regulation by the FERC. Such regulation could decrease revenues, increase operating costs, and depending upon the facility in question, could adversely affect our results of operations and cash flows. In addition, if any of our facilities were found to have provided services or otherwise operated in violation of the NGA, this could result in the imposition of civil penalties as well as a requirement to disgorge charges collected for such service in excess of the cost-based rate established by the FERC.
State regulation of gathering facilities generally includes various safety, environmental and, in some circumstances, nondiscriminatory take requirements and complaint-based rate regulation. We cannot predict what new or different regulations federal and state regulatory agencies may adopt, or what effect subsequent regulation may have on our activities. Such regulations may have a material adverse effect on our financial condition, result of operations and cash flows.
Should we fail to comply with all applicable FERC administered statutes, rules, regulations and orders, we could be subject to substantial penalties and fines.
Under the EPAct 2005, FERC has civil penalty authority under the NGA to impose penalties for current violations of up to $1 million per day for each violation and disgorgement of profits associated with any violation. While our systems have not been regulated by FERC as a natural gas company under the NGA, we are required to report aggregate volumes of natural gas purchased or sold at wholesale to the extent such transactions utilize, contribute to, or may contribute to the formation of price indices. In addition, Congress may enact legislation or FERC may adopt regulations that may subject certain of our otherwise non-FERC jurisdictional facilities to further regulation. Failure to comply with those regulations in the future could subject us to civil penalty liability.
The loss of Rice Energy’s senior management or technical personnel could adversely affect operations.
We depend on the services of Rice Energy’s senior management and technical personnel. We do not maintain, nor do we plan to obtain, any insurance against the loss of any of these individuals. The loss of the services of Rice Energy’s senior management or technical personnel could have a material adverse effect on our business, financial condition and results of operations.
Derivatives reform legislation which has been adopted by the U.S. Congress, or additions to or changes in such legislation, could negatively impact our ability to use derivative instruments as part of our risk management activities.
33
In July 2010, the Dodd-Frank Wall Street Reform and Consumer Protection Act (Dodd-Frank Act) was signed into law. Title VII of the Dodd-Frank Act establishes federal oversight and regulation of the over-the-counter derivatives markets and participants in such markets. The Commodities Futures Trading Commission (“CFTC”) and the SEC have adopted, or are in the process of adopting, rules and regulations covering, among other derivative transactions, transactions linked to natural gas prices. We believe our derivative transactions qualify for the end-user exception which exempts them from certain Dodd-Frank Act swap clearing and exchange-trading requirements pursuant to final regulations adopted by the CFTC and SEC.
The CFTC has designated certain interest rate swaps and credit default swaps for mandatory clearing and the associated rules also will require us, in connection with covered derivative activities, to comply with clearing and trade-execution requirements or take steps to qualify for an exemption to such requirements. Although we believe we qualify for the end-user exception from the mandatory clearing requirements for swaps entered to mitigate our commercial risks, the application of the mandatory clearing and trade execution requirements to other market participants, such as dealers, may change the cost and availability of our future derivative arrangements. The changes in the regulation of swaps may result in certain market participants deciding to curtail or stop engaging in derivative activities. If we reduce our use of derivatives as a result of the Dodd Frank Act and regulations, our results of operations may become more volatile and our cash flows may be less predictable, which could adversely affect our ability to plan for and fund capital expenditures and our results of operations.
Future state legislation may impose new or increased taxes or fees on oil and natural gas extraction.
Pennsylvania imposes an annual natural gas impact fee on natural gas and oil operators in Pennsylvania for each well drilled for a period of fifteen years. The fee is on a sliding scale set by the Public Utility Commission and is based on two factors: changes in the Consumer Price Index and the average NYMEX natural gas prices from the last day of each month. There can be no assurance that the impact fee will remain as currently structured or that new or additional taxes will not be imposed.
Ohio has previously considered, and its legislature continues to consider, proposals to increase the current severance tax imposed on natural gas or oil in Ohio. There is currently no severance tax imposed on natural gas or oil in Pennsylvania, but the governor has proposed that the legislature consider instituting such a severance tax. It is possible that each of these states (or other states in which we operate) could propose and implement a new or increased severance tax in the coming years, which would negatively affect our future cash flows and financial condition.
Item 1B. Unresolved Staff Comments
None.
34
Item 2. Properties
Property Overview
Our Appalachian Basin properties are primarily located in Washington and Greene Counties, Pennsylvania, and Belmont County, Ohio. The following illustrations depict our acreage position in the Appalachian Basin of our Exploration and Production segment and the midstream assets of our Rice Midstream Holdings and the Rice Midstream Partners segments, each as of December 31, 2016. In addition to our acreage position in the Appalachian Basin, we own acreage in the Fort Worth Basin located in Northern Texas, the Uinta Basin located in eastern Utah and the Piceance Basin located in northwestern Colorado.
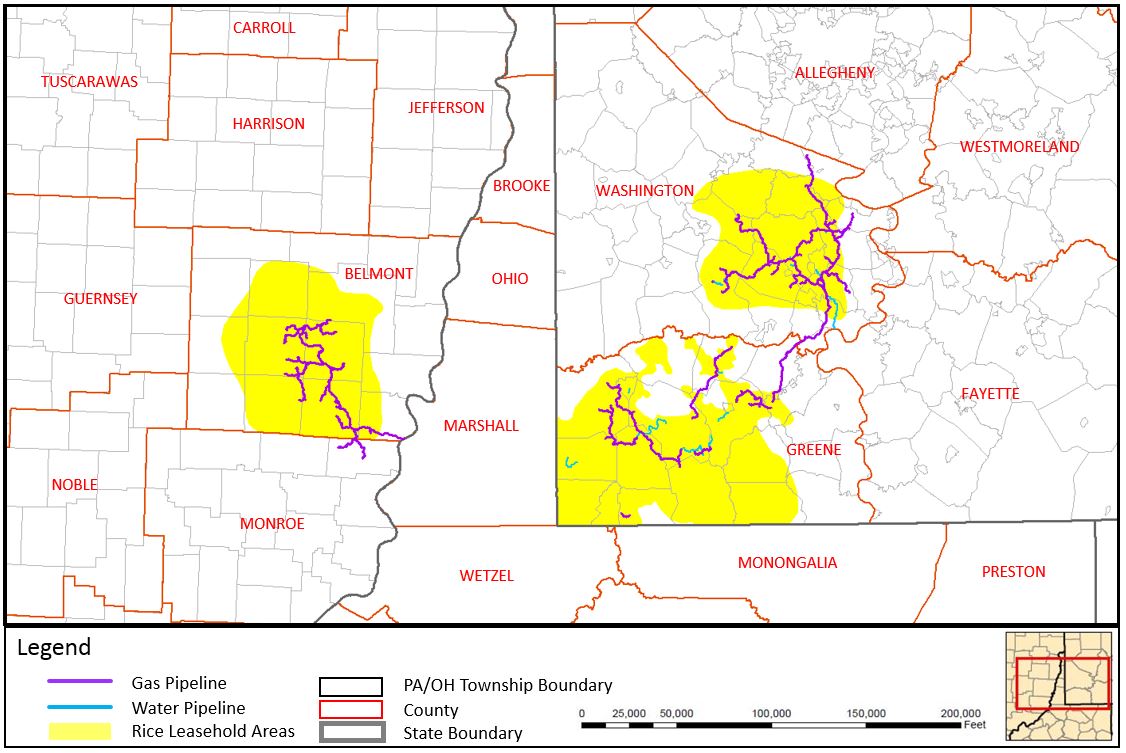
The majority of our properties are located on or under private properties owned in fee, held by lease or occupied under perpetual easements or other rights acquired without warranty of underlying land titles.
Exploration and Production Segment Properties
The vast majority of the current and planned operations of our Exploration and Production segment are located in the cores of the Marcellus Shale in southwestern Pennsylvania and the Utica Shale in eastern Ohio, each of which are located in the Appalachian Basin. In addition, we have operations in the Upper Devonian Shale and Utica Shale on our Pennsylvania acreage as well as the Barnett Shale on our Texas acreage. The properties of our Exploration and Production segment consist of interests in developed and undeveloped leases that entitle us to drill for and produce natural gas, NGLs and crude oil. Our interests are mostly in the form of working interests and, to a lesser extent, royalty and overriding royalty interests.
35
The table below summarizes data for our Exploration and Production segment for the year ended December 31, 2016.
Region | Average Daily Net Production (MMcfe/d) | Production (Bcfe) | Percentage of Production | Proved Reserves (Bcfe) | Percentage of Proved Reserves | ||||||||||
Appalachian Basin | |||||||||||||||
Marcellus Shale(1) | 543 | 198.7 | 65 | % | 2,790.7 | 70 | % | ||||||||
Utica Shale - Ohio(2) | 263 | 96.2 | 32 | % | 929.1 | 23 | % | ||||||||
Utica Shale - Pennsylvania | 3 | 1.2 | — | % | 5.1 | — | % | ||||||||
Upper Devonian Shale | 4 | 1.6 | 1 | % | 18.4 | — | % | ||||||||
Other(3) | |||||||||||||||
Barnett Shale(4) | 18 | 6.7 | 2 | % | 262.0 | 7 | % | ||||||||
831 | 304.4 | 100 | % | 4,005.3 | 100 | % | |||||||||
(1) | Marcellus Shale production for the years ended December 31, 2015 and 2014 was 148.7 Bcfe and 89.6 Bcfe, respectively. |
(2) | Ohio Utica Shale production for the years ended December 31, 2015 and 2014 was 50.2 Bcfe and 6.9 Bcfe, respectively. |
(3) | As of December 31, 2016, we did not have any production in the Uinta and Piceance Basins located in eastern Utah and northwestern Colorado, respectively, which we acquired in connection with the Vantage Acquisition. |
(4) | Our acreage position in the Barnett Shale was acquired in 2016; therefore, we did not record any production for the years ended December 31, 2015 and 2014. |
Reserve Data
The information with respect to our estimated reserves presented below has been prepared in accordance with the rules and regulations of the SEC.
Reserves Presentation
Our estimated proved reserves and PV-10 as of December 31, 2016, 2015 and 2014 are based on evaluations prepared by our independent reserve engineers, Netherland, Sewell & Associates, Inc. (“NSAI”). A copy of the summary reports of NSAI with respect to our reserves as of December 31, 2016 are incorporated by reference as exhibits to this Annual Report. See “—Preparation of Reserve Estimates” for definitions of proved reserves and the technologies and economic data used in their estimation.
The following table summarizes our historical estimated proved reserves and related PV-10 at December 31, 2016, 2015 and 2014.
Estimated Net Reserves (Bcfe) (1)(2) | ||||||||||||||||||||
As of December 31, | ||||||||||||||||||||
2016(3) | 2015(5) | 2014(5) | ||||||||||||||||||
Estimated Proved Reserves: | Appalachian | Fort Worth | Total | |||||||||||||||||
Total proved reserves | 3,743 | 262 | 4,005 | 1,700 | 1,307 | |||||||||||||||
Total proved developed reserves | 1,916 | 262 | 2,178 | 1,015 | 645 | |||||||||||||||
Total proved developed producing reserves | 1,651 | 249 | 1,900 | 894 | 569 | |||||||||||||||
Total proved developed non-producing reserves | 265 | 13 | 278 | 121 | 76 | |||||||||||||||
Total proved undeveloped reserves | 1,827 | — | 1,827 | 685 | 662 | |||||||||||||||
Percent proved developed | 51 | % | 100 | % | 54 | % | 60 | % | 49 | % | ||||||||||
PV-10 of proved reserves (in millions)(4) | $ | 1,418 | $ | 150 | $ | 1,568 | $ | 886 | $ | 1,744 | ||||||||||
(1) | As our oil and NGLs reserves are immaterial and constitute approximately one percent of our proved reserves at December 31, 2016, we present our reserves on an Mcfe basis calculated at the rate of one barrel per six Mcf based upon the relative energy content of oil to natural gas, which may not be indicative of the relationship of oil and natural gas prices. |
36
(2) | Our historical estimated proved reserves, PV-10 and standardized measure were determined using a historical 12-month average price for natural gas from each respective date (determined as the unweighted arithmetic acreage of prices on the first day of each month within the 12-month period). The prices used in our reserve report yield weighted average wellhead prices, which are based on index prices and adjusted for energy content, transportation fees and regional basis differentials. The index prices and the equivalent wellhead prices are shown in the table below. |
As of December 31, | ||||||||||||||||
2016 | 2015 | 2014 | ||||||||||||||
Index Prices | Appalachian | Fort Worth | ||||||||||||||
Natural Gas (per MMBtu) | $ | 2.48 | $ | 2.34 | $ | 2.59 | $ | 4.35 | ||||||||
Oil (per Bbl) | 39.25 | 42.75 | 46.79 | 91.48 | ||||||||||||
NGL (per Bbl) | 39.25 | 42.75 | 46.79 | — | ||||||||||||
Weighted Average Wellhead Prices | Appalachian | Fort Worth | ||||||||||||||
Natural Gas (per Mcfe) | $ | 1.80 | $ | 1.66 | $ | 2.65 | $ | 4.52 | ||||||||
Oil (per Bbl) | 32.70 | 37.65 | 41.72 | 85.70 | ||||||||||||
NGL (per Bbl) | 14.76 | 9.74 | 9.91 | — | ||||||||||||
(3) | In connection with the Vantage Acquisition, we acquired acreage located in the Fort Worth Basin in northern Texas and in the Uinta and Piceance Basins located in eastern Utah and northwestern Colorado, respectively. As of December 31, 2016, we did not have any proved reserves in the Uinta and Piceance Basins. |
(4) | PV-10 is a non-GAAP financial measure and generally differs from standardized measure, the most directly comparable GAAP financial measure, because it does not include the effects of income taxes on future net revenues. Our pre-tax PV-10 at December 31, 2016, 2015 and 2014 was $1.6 billion, $0.9 billion and $1.7 billion, respectively. We estimate that our historical standardized measure as of December 31, 2016, 2015 and 2014, is approximately $1.6 billion, $0.9 billion, $1.3 billion respectively, as adjusted to give effect to the present value of approximately zero, zero and $436 million, respectively, of future income taxes. Neither PV-10 nor standardized measure represents an estimate of the fair market value of our natural gas properties. We and others in the industry use PV-10 as a measure to compare the relative size and value of proved reserves held by companies without regard to the specific tax characteristics of such entities. |
(5) | Information presented for 2015 and 2014 relates to our estimated proved reserves in the Appalachian Basin. |
Proved Undeveloped Reserves
The following table summarizes the changes in our estimated historical proved undeveloped reserves during 2016, 2015 and 2014 (in Bcfe):
Proved undeveloped reserves, December 31, 2013 | 238.4 | ||
Acquisitions | 122.5 | ||
Conversions into proved developed reserves | (97.9 | ) | |
Extensions | 417.6 | ||
Revisions | (18.1 | ) | |
Proved undeveloped reserves, December 31, 2014 | 662.5 | ||
Conversions into proved developed reserves | (158.2 | ) | |
Extensions | 514.9 | ||
Revisions | (334.0 | ) | |
Proved undeveloped reserves, December 31, 2015 | 685.2 | ||
Acquisitions | 237.2 | ||
Conversions into proved developed reserves | (170.5 | ) | |
Extensions | 1,118.0 | ||
Revisions | (43.4 | ) | |
Proved undeveloped reserves, December 31, 2016 (1) | 1,826.5 | ||
37
(1) | As of December 31, 2016, management is evaluating our long-term approach in the Barnett, Uinta and Piceance Shales, and development in these areas is not included in our 5-year development plan. As a result, the table above does not include proved undeveloped reserves associated with the Barnett, Uinta and Piceance Shales. |
During 2016, extensions of 1,118.0 Bcfe of proved undeveloped reserves were added through the drillbit in the Marcellus and Utica Shales. Extensions of approximately 549.8 Bcfe within the December 31, 2016 proved developed producing and proved developed non-producing reserves relate to the conversion of probable and possible wells in the current year that were not included within our 2015 proved undeveloped reserves as of December 31, 2015. We acquired proved undeveloped reserves of 237.2 Bcfe within the Marcellus Shale. Net negative revisions of 43.4 Bcfe were primarily related to 118.7 Bcfe of negative revisions attributable to reclassifications of previously booked locations that were no longer expected to be drilled within the upcoming five-year period, which were partially offset primarily by extended lateral lengths. We incurred cumulative costs of approximately $119.0 million, of which $91.0 million was incurred in 2016, to convert 170.5 Bcfe of proved undeveloped reserves to proved developed reserves in 2016. Estimated future development costs relating to the development of our proved undeveloped reserves as of December 31, 2016 are approximately $1.1 billion over the next five years, which we expect to finance through cash flow from operations, borrowings under our Senior Secured Revolving Credit Facility and other sources of capital financing. Our drilling programs are focused on proving our undeveloped leasehold acreage through delineation drilling. While we will continue to drill leasehold delineation wells and build on our current leasehold position, we will also focus on drilling our proved undeveloped reserves. Based on our reserve report as of December 31, 2016, we had 109 and 34 net drilling locations associated with proved undeveloped reserves in the Marcellus and Utica Shale, respectively, and 18 and 11 net drilling locations associated with proved developed not producing reserves in the Marcellus and Utica Shale, respectively. All of our proved undeveloped reserves are expected to be developed within five years of their initial booking date. See “Item 1A. Risk Factors—Risks Related to Our Business—The development of our estimated proved undeveloped reserves may take longer and may require higher levels of capital expenditures than we anticipate. Therefore, our estimated proved undeveloped reserves may not be ultimately developed or produced.”
Preparation of Reserve Estimates
Our reserve estimates as of December 31, 2016, 2015 and 2014 included in this Annual Report were based on evaluations prepared by the independent petroleum engineering firm of NSAI in accordance with Standards Pertaining to the Estimating and Auditing of Oil and Gas Reserves Information promulgated by the Society of Petroleum Evaluation Engineers and definitions and guidelines established by the SEC. Our independent reserve engineers were selected for their historical experience and geographic expertise in engineering unconventional resources.
Proved reserves are reserves which, by analysis of geoscience and engineering data, can be estimated with reasonable certainty to be economically producible from a given date forward from known reservoirs under existing economic conditions, operating methods and government regulations prior to the time at which contracts providing the right to operate expires, unless evidence indicates that renewal is reasonably certain. The term “reasonable certainty” implies a high degree of confidence that the quantities of oil or natural gas actually recovered will equal or exceed the estimate. The technical and economic data used in the estimation of our proved reserves include, but are not limited to, well logs, geologic maps, well-test data, production data (including flow rates), well data (including lateral lengths), historical price and cost information, and property ownership interests. Our independent reserve engineers use this technical data, together with standard engineering and geoscience methods, or a combination of methods, including performance analysis, volumetric analysis and analogy. The proved developed reserves and EURs per well are estimated using performance analysis and volumetric analysis. The estimates of the proved developed reserves and EURs for each developed well are used to estimate the proved undeveloped reserves for each proved undeveloped location (utilizing type curves, statistical analysis, and analogy). Proved undeveloped locations that are more than one offset from a proved developed well utilized reliable technologies to confirm reasonable certainty. The reliable technologies that were utilized in estimating these reserves include log data, performance data, log cross sections, seismic data, core data, and statistical analysis.
38
Internal Controls
Rice Energy maintains an internal staff of petroleum engineers and geoscience professionals who work closely with our independent reserve engineers to ensure the integrity, accuracy and timeliness of data furnished to NSAI in their reserves estimation process. Ryan I. Kanto, Rice Energy’s Vice President of Asset Performance, is the technical person primarily responsible for overseeing the preparation of our reserve estimates. He has substantial industry experience with positions of increasing responsibility in engineering and evaluations. Throughout each fiscal year, Rice Energy’s technical team meets with representatives of our independent reserve engineers to review properties and discuss methods and assumptions used in preparation of the proved reserves estimates. While we have no formal committee specifically designated to review reserves reporting and the reserves estimation process, a preliminary copy of the reserve report is reviewed by Rice Energy’s senior management with representatives of our independent reserve engineers and internal technical staff.
Qualifications of Responsible Technical Persons
Ryan I. Kanto joined Rice Energy in June 2011 and serves as Rice Energy’s Vice President of Asset Performance. Prior to Rice Energy, Mr. Kanto worked at EnCana Oil & Gas (USA) Inc. from June 2007 to May 2011. During this time, he served as a facilities engineer in the Deep Bossier from June 2007 to January 2008, a reservoir engineer in the Barnett Shale until February 2009, and completion engineer in the Haynesville Shale until his departure. Mr. Kanto has bachelor’s degrees in Chemical Engineering and Engineering Management from the University of Arizona and has significant experience in unconventional shale gas plays.
Our proved reserves estimates shown herein at December 31, 2016, 2015 and 2014 have been independently prepared by NSAI, a worldwide leader of petroleum property analysis for industry and financial organizations and government agencies. NSAI was founded in 1961 and performs consulting petroleum engineering services under the Texas Board of Professional Engineers Registration No. F-2699. Within NSAI, the technical persons primarily responsible for preparing the estimates set forth in the NSAI letters, each of which is incorporated by reference as an exhibit to this Annual Report, were Steven W. Jansen, Edward C. Roy III, Randolph K. Green and William J. Knights. Mr. Jansen, a Licensed Professional Engineer in the State of Texas, has been practicing consulting petroleum engineering at NSAI since 2011 and has over four years of prior industry experience. Mr. Roy III, a Licensed Professional Geoscientist in the State of Texas, has been practicing consulting petroleum engineering at NSAI since 2008 and has over 11 years of prior industry experience. Mr. Green, a Licensed Professional Engineer in the State of Texas, has been practicing consulting petroleum geoscience at NSAI since 1983 and has over 34 years of experience in estimation and evaluation of reserves. Mr. Knights, a Licensed Professional Geoscientist in the State of Texas, has been practicing consulting petroleum geoscience at NSAI since 1991 and has over 36 years of practical experience in petroleum geosciences, with over 36 years of experience in the estimation and evaluation of reserves. Messrs. Jansen, Roy III, Green and Knights meet or exceed the education, training and experience requirements set forth in the Standards Pertaining to the Estimating and Auditing of Oil and Gas Reserves Information promulgated by the Society of Petroleum Engineers; they are proficient in judiciously applying industry standard practices to engineering and geoscience evaluations as well as applying SEC and other industry reserve definitions and guidelines.
Determination of Drilling Locations
Net undeveloped locations are calculated by taking our total net acreage, subtracting producing acreage, and multiplying such amount by a risking factor. Remaining risked acreage is then divided by our expected well spacing. Producing acreage is calculated with the same methodology based on actual lateral lengths and inter-well spacing.
• | Undeveloped Net Marcellus Locations - We assume these locations have 8,000 foot laterals and 750 foot spacing between wells which yields approximately 138 acre spacing. In the Marcellus, we apply a 20% risking factor to our net acreage to account for inefficient unitization and the risk associated with our inability to force pool in Pennsylvania. As of December 31, 2016, we had approximately 185,000 net acres in the Marcellus which results in 861 undeveloped net locations. |
• | Undeveloped Net Ohio Utica Locations - We assume these locations have 9,000 foot laterals and 1,000 foot spacing between wells which yields approximately 207 acre spacing. In the Ohio Utica, we apply a 10% risking factor to our net acreage to account for inefficient unitization. As of December 31, 2016, we had approximately 63,000 net acres prospective for the Utica in Ohio which results in 241 undeveloped net locations. |
• | Undeveloped Net Upper Devonian Locations - We assume these locations have 8,000 foot laterals and 1,000 foot spacing between wells which yields approximately 184 acre spacing. In the Upper Devonian, we apply a 20% risking factor to our net acreage to account for inefficient unitization and the risk associated with our inability to force pool in Pennsylvania. As of December 31, 2016, we had approximately 108,000 net acres prospective for the Upper Devonian which results in 464 undeveloped net locations. |
39
• | Undeveloped Net Pennsylvania Utica Locations - We assume these locations have 8,000 foot laterals and 2,000 foot spacing between wells which yields approximately 367 acre spacing. In the Pennsylvania Utica, we apply a 20% risking factor to our net acreage to account for inefficient unitization. As of December 31, 2016, we had approximately 105,000 net acres prospective for the Utica in Pennsylvania which results in 228 undeveloped net locations. |
• | Undeveloped Barnett Locations - These are mapped locations that we have deemed to have a high likelihood of producing economic quantities of hydrocarbons. As of December 31, 2016, we had approximately 36,000 net acres in the Barnett Shale, which results in 171 undeveloped net locations. |
The drilling locations on which we actually drill will depend on the availability of capital, regulatory approval, commodity prices, costs, actual drilling results and other factors. Please see “Item 1A. Risk Factors—Risks Related to Our Business—Our drilling locations are scheduled out over many years, making them susceptible to uncertainties that could materially alter the occurrence or timing of their drilling. In addition, we may not be able to raise the substantial amount of capital that would be necessary to drill our drilling locations.”
Production, Revenues and Price History
Natural gas, NGLs, and oil are commodities; therefore, the price that we receive for our production is largely a function of market supply and demand. While demand for natural gas in the United States has increased dramatically since 2000, natural gas and NGL supplies have also increased significantly as a result of horizontal drilling and fracture stimulation technologies which have been used to find and recover large amounts of oil and natural gas from various shale formations throughout the United States. Demand is impacted by general economic conditions, weather and other seasonal conditions. Over or under supply of natural gas can result in substantial price volatility. Historically, commodity prices have been volatile, and we expect that volatility to continue in the future. A substantial or extended decline in natural gas prices or poor drilling results could have a material adverse effect on our financial position, results of operations, cash flows, quantities of natural gas reserves that may be economically produced and Rice Energy’s ability to access capital markets. See “Item 1A. Risk Factors—Risks Related to Our Business—Natural gas prices are volatile. A substantial or extended decline in commodity prices may adversely affect our business, financial condition or results of operations and our ability to meet our capital expenditure obligations and financial commitments.”
The following table sets forth information regarding our natural gas, oil and NGL production in the Marcellus Shale and Utica Shale for the years ended December 31, 2016, 2015 and 2014 and in the Barnett Shale for the period from October 19, 2016 through December 31, 2016.
For the Year Ended December 31, | |||||||||
2016 | 2015 | 2014 | |||||||
Marcellus Shale | |||||||||
Natural gas (Mcf) | 198,687,827 | 148,699,519 | 89,601,612 | ||||||
Oil (Mbls) | 4 | 32 | 41 | ||||||
NGL (Mbls) | 57 | 232 | 930 | ||||||
Utica Shale | |||||||||
Natural gas (Mcf) | 96,309,459 | 49,988,275 | 6,366,248 | ||||||
Oil (Mbls) | 64,162 | 55,290 | 30,872 | ||||||
NGL (Mbls) | 123,187 | 193,771 | 62,384 | ||||||
Barnett Shale | |||||||||
Natural gas (Mcf) | 5,709,259 | — | — | ||||||
Oil (Mbls) | 8,262 | — | — | ||||||
NGL (Mbls) | 157,830 | — | — | ||||||
Other (Mcf)(1) | 1,614,970 | 1,143,408 | 1,203,652 | ||||||
Total production (Mcfe)(2) | 304,442,523 | 201,327,152 | 97,736,871 | ||||||
40
(1) | Includes natural gas production in the Upper Devonian Shale. |
(2) | As our oil and NGLs production is immaterial and constitutes approximately one percent of our total production for the periods presented, we present our total production on an Mcfe basis calculated at the rate of one barrel per six Mcf based upon the relative energy content of oil to natural gas, which may not be indicative of the relationship of oil and natural gas prices. |
The following table sets forth information regarding revenues, realized prices and production costs in the Appalachian Basin for the years ended December 31, 2016, 2015 and 2014 and in the Fort Worth Basin for the period from October 19, 2016 through December 31, 2016.
For the Year Ended December 31, | ||||||||||||
2016 | 2015 | 2014 | ||||||||||
Natural gas, oil and NGL sales (in thousands) | ||||||||||||
Appalachian Basin | ||||||||||||
Natural gas | $ | 632,816 | $ | 441,082 | $ | 354,860 | ||||||
Oil | 2,080 | 2,346 | 1,868 | |||||||||
NGL | 2,230 | 3,087 | 2,473 | |||||||||
Total Appalachian Basin | $ | 637,126 | $ | 446,515 | $ | 359,201 | ||||||
Fort Worth Basin | ||||||||||||
Natural gas | $ | 13,715 | $ | — | $ | — | ||||||
Oil | 372 | — | — | |||||||||
NGL | 2,228 | — | — | |||||||||
Total Fort Worth Basin | $ | 16,315 | $ | — | $ | — | ||||||
Total | $ | 653,441 | $ | 446,515 | $ | 359,201 | ||||||
Average natural gas prices before effects of hedges per Mcf | ||||||||||||
Appalachian Basin | $ | 2.13 | $ | 2.21 | $ | 3.65 | ||||||
Fort Worth Basin | $ | 2.40 | $ | — | $ | — | ||||||
Total | $ | 2.14 | $ | 2.21 | $ | 3.65 | ||||||
Average realized prices after effects of hedges per Mcf (1) | $ | 2.83 | $ | 3.18 | $ | 3.46 | ||||||
Average realized oil prices per Bbl | ||||||||||||
Appalachian Basin | $ | 32.41 | $ | 42.40 | $ | 60.43 | ||||||
Fort Worth Basin | $ | 45.08 | $ | — | $ | — | ||||||
Total | $ | 33.86 | $ | 42.40 | $ | 60.43 | ||||||
Average realized NGL prices per Bbl | ||||||||||||
Appalachian Basin | $ | 18.09 | $ | 15.91 | $ | 39.06 | ||||||
Fort Worth Basin | $ | 14.11 | $ | — | $ | — | ||||||
Total | $ | 15.86 | $ | 15.91 | $ | 39.06 | ||||||
Average costs per Mcfe (2) | ||||||||||||
Appalachian Basin | ||||||||||||
Lease operating | $ | 0.16 | $ | 0.22 | $ | 0.26 | ||||||
Gathering, compression and transportation | $ | 0.41 | $ | 0.75 | $ | 0.38 | ||||||
Production taxes and impact fees | $ | 0.04 | $ | 0.04 | $ | 0.05 | ||||||
41
General and administrative | $ | 0.39 | $ | 0.39 | $ | 0.47 | ||||||
Depletion, depreciation and amortization | $ | 1.21 | $ | 1.53 | $ | 1.55 | ||||||
Fort Worth Basin | ||||||||||||
Lease operating | $ | 0.42 | $ | — | $ | — | ||||||
Gathering, compression and transportation | $ | 0.36 | $ | — | $ | — | ||||||
Production taxes and impact fees | $ | 0.23 | $ | — | $ | — | ||||||
General and administrative | $ | 0.22 | $ | — | $ | — | ||||||
Depletion, depreciation and amortization | $ | 1.07 | $ | — | $ | — | ||||||
(1) | The effect of hedges includes realized gains and losses on commodity derivative transactions |
(2) | As our oil and NGL revenues are immaterial and constitute approximately one percent of our total revenues for the periods presented, we present these results on an Mcfe basis calculated at the rate of one barrel per six Mcf based upon the approximate relative energy content of oil to natural gas, which may not be indicative of the relationship of oil and natural gas prices. |
Productive Wells
As of December 31, 2016, we had a total of 370 gross (282 net) producing wells in the Appalachian Basin, consisting of (i) 248 gross (229 net) producing wells in the Marcellus Shale, (ii) 114 gross (45 net) producing wells in the Utica Shale, which includes one gross and net Utica Shale producing well and (iii) 8 gross and net producing wells in the Upper Devonian Shale. In addition, we had 176 gross (140 net) producing wells in the Barnett Shale. This well count excludes approximately 100 gross (100 net) shallow vertical wells located in the Appalachian Basin.
Acreage
The following table sets forth certain information regarding the total developed and undeveloped acreage in which we own an interest as of December 31, 2016. Approximately 57% of our Marcellus acreage, 24% of our Utica acreage and 95% of our Barnett acreage was held by production at December 31, 2016. Acreage related to royalty, overriding royalty and other similar interests is excluded from this table.
Developed Acres | Undeveloped Acres | Total Acres | ||||||||||||||||
Region | Gross | Net | Gross | Net | Gross | Net | ||||||||||||
Appalachian Basin | ||||||||||||||||||
Marcellus(1) | 42,721 | 40,847 | 144,170 | 144,170 | 186,891 | 185,017 | ||||||||||||
Utica - Ohio | 21,139 | 11,147 | 52,125 | 52,049 | 73,264 | 63,196 | ||||||||||||
Other(2) | ||||||||||||||||||
Barnett | 12,774 | 10,595 | 31,061 | 25,762 | 43,835 | 36,357 | ||||||||||||
Total | 76,634 | 62,589 | 227,356 | 221,981 | 303,990 | 284,570 | ||||||||||||
(1) | Marcellus acreage associated with the Vantage Acquisition included 23,217 gross (23,217 net) developed acres and 62,014 gross (62,014 net) undeveloped acres. |
(2) | Excludes approximately 11,000 gross (8,500 net) developed acres and 17,000 gross (1,000 net) undeveloped acres in the Uinta and Piceance Basins located in eastern Utah and northwestern Colorado, which we acquired in connection with the Vantage Acquisition. |
Undeveloped Acreage Expirations
The following table sets forth the number of total undeveloped acres as of December 31, 2016 that will expire in 2017, 2018, 2019, 2020 and 2021 and thereafter unless production is established within the spacing units covering the acreage prior to the expiration dates or unless such leasehold rights are extended or renewed. We have not attributed any PUD reserves to acreage for which the expiration date precedes the scheduled date for PUD drilling. In addition, we do not anticipate material delay rental or lease extension payments in connection with such acreage.
42
Region | 2017 | 2018 | 2019 | 2020 | 2021+ | ||||||||||
Appalachian Basin | |||||||||||||||
Marcellus | 9,023 | 19,451 | 24,937 | 11,573 | 15,040 | ||||||||||
Utica - Ohio | 16,895 | 15,001 | 5,562 | 1,283 | 9,405 | ||||||||||
Other(1) | |||||||||||||||
Barnett | 741 | 507 | 174 | 271 | 226 | ||||||||||
Total | 26,659 | 34,959 | 30,673 | 13,127 | 24,671 | ||||||||||
(1) | As of December 31, 2016, management is evaluating our long-term approach in the Barnett, Uinta and Piceance Shales, and development in these areas is not included in our 5-year development plan. As a result, the table above does not include acreage expirations associated with our Uinta and Piceance Shale acreage. |
Operated Drilling Activity
The following table describes our drilling activity on our acreage during the years ended December 31, 2016, 2015 and 2014:
Productive Wells | Dry Wells | Total | ||||||||||||||||
Gross | Net | Gross | Net | Gross | Net | |||||||||||||
2016 (1) | 56 | 49 | — | — | 56 | 49 | ||||||||||||
2015 | 57 | 48 | — | — | 57 | 48 | ||||||||||||
2014 | 44 | 39 | — | — | 44 | 39 | ||||||||||||
(1) | Excludes 14 gross (14 net) producing wells acquired in the Vantage Acquisition. |
We drilled no developmental dry wells or exploratory wells during 2016, no developmental dry wells and no exploratory wells during 2015 and no developmental dry wells and four exploratory wells in 2014.
Title to Properties
In the course of acquiring the rights to develop oil and natural gas, it is standard procedure for us and the lessor to execute a lease agreement with payment subject to title verification. In most cases, we incur the expense of retaining lawyers to verify the rightful owners of the oil and gas interests prior to payment of such lease bonus to the lessor. There is no certainty, however, that a lessor has valid title to its lease’s oil and gas interests. In those cases, such leases are generally voided and payment is not remitted to the lessor. As such, title failures may result in fewer net acres to us. As is customary in the industry, in the case of undeveloped properties, often cursory investigation of record title is made at the time of lease acquisition. Investigations are made before the consummation of an acquisition of producing properties and before commencement of drilling operations on undeveloped properties. Individual properties may be subject to burdens that we believe do not materially interfere with the use or affect the value of the properties. Burdens on properties may include:
• | customary royalty interests; |
• | liens incident to operating agreements and for current taxes; |
• | obligations or duties under applicable laws; |
• | development obligations under natural gas leases; or |
• | net profits interests. |
Midstream Segments Properties
The gathering, compression and fresh water distribution systems of our Rice Midstream Holdings segment and Rice Midstream Partners segment are located in the core of the Marcellus Shale in southwestern Pennsylvania and of the Utica Shale in eastern Ohio, each of which are located in the Appalachian Basin. As of December 31, 2016, our Rice Midstream Partners segment owned gas gathering systems and compression assets in Washington and Greene Counties, Pennsylvania and fresh water distribution systems in Washington and Greene Counties, Pennsylvania, and Belmont County, Ohio, and our Rice Midstream Holdings segment owned gathering systems and compression assets in Belmont and Monroe Counties, Ohio.
43
Rice Midstream Holdings Segment
As of December 31, 2016, our Ohio gathering system consists of a network of 92 miles of gathering pipelines and 18,960 horsepower of compression used to compress natural gas for our Exploration and Production segment and third-party customers. In addition, as of December 31, 2016, our Ohio gathering system had approximately 4.8 MMDth/d of gathering capacity in the core of the Utica Shale in Belmont County, Ohio. Average daily throughput on our Ohio gathering system for the year ended December 31, 2016 was 708 MDth/d, which consisted of 700 MDth/d related to the operations of Rice Olympus Midstream LLC (“Rice Olympus Midstream”) and 260 MDth/d related to the operations of Strike Force Midstream, slightly offset by an elimination of 252 Mdth/d that is related to operations of both Rice Olympus Midstream and Strike Force Midstream. The Rice Olympus Midstream system services approximately 45,000 and 20,000 net acres of our and Gulfport’s current positions respectively, in Belmont County, Ohio.
On February 1, 2016, Strike Force Holdings, our indirect subsidiary, and Gulfport Midstream, a wholly-owned subsidiary of Gulfport, entered into the Strike Force LLC Agreement of Strike Force Midstream to engage in the natural gas midstream business in the Strike Force Midstream AMI. As of December 31, 2016, Strike Force Midstream accounted for 260 MDth/d of our average daily throughput on our Ohio gathering system. The Strike Force Midstream system currently services an aggregate of approximately 98,000 acres of Gulfport’s and Consol Energy Inc.’s positions.
Rice Midstream Partners Segment
As of December 31, 2016, RMP’s gathering systems consist of a network of 159 miles of gathering pipelines and 59,500 horsepower of compression used to compress natural gas for our Exploration and Production segment and third-party producers. As of December 31, 2016, RMP’s systems had approximately 4.1 MMDth/d of gathering capacity with connections to Dominion Transmission, Columbia Gas Transmission, Texas Eastern Transmission, Equitrans Transmission and National Fuel Gas Supply interstate pipelines, and were connected to 242 producing Appalachian wells located in Washington and Greene Counties, Pennsylvania. The Vantage Midstream Asset Acquisition enhanced RMP’s Greene County gathering system with the acquisition of approximately 30 miles of dry gas gathering and compression assets.
RMP has secured dedications from us under a 15 year, fixed-fee contract for gathering and compression services covering (i) approximately 186,000 gross acres of our acreage position as of December 31, 2016 in Washington and Greene Counties, Pennsylvania, and (ii) any future acreage we acquire within these counties, excluding certain production subject to a pre-existing third-party dedication. We have also granted RMP the exclusive right to provide certain fluid handling services to us until December 22, 2029 and from month to month thereafter. The fluid handling services include the exclusive right to provide fresh water for well completions operations in the Marcellus and Utica Shales and to collect and recycle or dispose of flowback and produced water for us within areas of dedication in defined service areas in Pennsylvania and Ohio. In addition, RMP has secured dedications from third-party customers under fixed-fee contracts for gathering and compression services in Washington County, Pennsylvania with respect to approximately 29,000 of their existing gross acres, and any future acreage they may acquire within areas of mutual interest of approximately 66,000 acres.
Water Services
RMP’s water services assets in Washington and Greene Counties, Pennsylvania, and Belmont County, Ohio are engaged in the provision of water services to support well completion activities and to collect and recycle or dispose of flowback and produced water for us and third parties in the Appalachian Basin. As of December 31, 2016, RMP’s Pennsylvania assets provided access to 22.5 MMgal/d of fresh water from the Monongahela River and several other regional water sources, and RMP’s Ohio assets provided access to 14.0 MMgal/d of fresh water from the Ohio River and several other regional sources, both for distribution to our Exploration and Production segment and third parties.
Title to Properties
The real property tied to our midstream operations is classified into two categories: (1) parcels that we own in fee and (2) parcels in which our interest derives from leases, easements, rights-of-way, permits or licenses from landowners or governmental authorities, permitting the use of such land for our operations. Portions of the land on which our pipelines and major facilities are located are owned by us in fee title, and we believe that we have satisfactory title to these lands. The remainder of the land on which our pipelines and major facilities are located are held by us pursuant to surface leases between us, as lessee, and the fee owner of the lands, as lessors. We have leased or owned these lands without any material challenge known to us relating to the title to the land upon which the assets are located, and we believe that we have satisfactory leasehold estates or fee ownership of such lands. We have no knowledge of any challenge to the underlying fee title of any material lease, easement, right-of-way, permit or license held by us or to our title to any material lease, easement, right-of-way, permit or lease, and we believe that we have satisfactory title to all of its material leases, easements, rights-of-way, permits and licenses.
44
Item 3. Legal Proceedings
We are party to various legal and/or regulatory proceedings from time to time arising in the ordinary course of business. While the ultimate outcome and impact to us cannot be predicted with certainty, we believe that all such matters are without merit and involve amounts which, if resolved unfavorably, either individually or in the aggregate, will not have a material adverse effect on its financial condition, results of operations or cash flows. When we determine that a loss is probable of occurring and is reasonably estimable, we accrue an undiscounted liability for such contingencies based on its best estimate using information available at the time. We disclose contingencies where an adverse outcome may be material, or in the judgment of management, the matter should otherwise be disclosed.
In 2016, we reached a settlement with the PADEP related to civil penalties for certain Notices of Violations (“NOVs”) received from December 2011 through April 2016 under the Clean Streams Law, the 2012 Oil and Gas Act, the Solid Waste Management Act, and the Dam Safety and Encroachments Act and have paid fines to settle such NOVs with the DEP for $3.6 million.
Item 4. Mine Safety Disclosures
Not applicable.
45
PART II
Item 5. Market for Registrant’s Common Equity, Related Stockholder Matters and Issuer Purchases of Equity Securities
There is no established public trading market for our common units, and we do not anticipate there being one for the foreseeable future. At December 31, 2016, we had 242,606,908 common units outstanding, inclusive of 40,000,000 common units owned by the Vantage Sellers, which were issued on October 19, 2016 as partial consideration for the Vantage Acquisition. The common units were issued in reliance upon the exemption from the registration requirements of the Securities Act provided by Section 4(a)(2) of the Securities Act. The Vantage Sellers are entitled to redeem, from time to time, all or a portion of their common units. Each common unit will be redeemed for, at our option, a newly-issued share of common stock of Rice Energy or a cash payment equal to the volume-weighted average closing price of a share of Rice Energy’s common stock for the five trading days prior to and including the last full trading day immediately prior to the date that the member delivers a notice of redemption (subject to customary adjustments, including for stock splits, stock dividends and reclassifications). Upon the exercise of the redemption right, the redeeming member surrenders the redeemed common units and the corresponding number of 1/1000ths of shares of Rice Energy preferred stock in respect of each redeemed common unit to us for cancellation.
46
Item 6. Selected Financial Data
Set forth below is our selected historical consolidated financial data as of and for the years ended December 31, 2016, 2015, 2014, 2013 and 2012. The selected historical consolidated financial data set forth below is not intended to replace our historical consolidated financial statements. You should read the following data along with “Item 7. Management’s Discussion and Analysis of Financial Condition and Results of Operations” and the consolidated financial statements and related notes, each of which is included in this report. We believe that the assumptions underlying the preparation of our historical consolidated financial statements are reasonable.
Year Ended December 31, | ||||||||||||||||||||
(in thousands, except share data) | 2016 | 2015 | 2014 | 2013 | 2012 | |||||||||||||||
Statement of operations data: | ||||||||||||||||||||
Total operating revenues | $ | 778,906 | $ | 502,141 | $ | 390,942 | $ | 88,687 | $ | 27,200 | ||||||||||
Total operating expenses | 843,936 | 940,308 | 401,364 | 116,567 | 36,100 | |||||||||||||||
Operating loss | (65,030 | ) | (438,167 | ) | (10,422 | ) | (27,880 | ) | (8,900 | ) | ||||||||||
Net (loss) income | (150,218 | ) | (267,999 | ) | 219,035 | (35,776 | ) | (19,344 | ) | |||||||||||
Net (loss) income attributable to Rice Energy Operating | (225,633 | ) | (291,336 | ) | 218,454 | (35,776 | ) | (19,344 | ) | |||||||||||
Net (loss) income attributable to Rice Energy Operating common stockholders | $ | (254,083 | ) | $ | (291,336 | ) | $ | 218,454 | $ | (35,776 | ) | $ | (19,344 | ) | ||||||
Balance sheet data (at period end): | ||||||||||||||||||||
Cash | $ | 467,287 | $ | 73,428 | $ | 74,295 | $ | 31,612 | $ | 8,547 | ||||||||||
Total property, plant and equipment, net | $ | 6,092,289 | $ | 3,225,660 | $ | 2,450,983 | $ | 734,331 | $ | 273,640 | ||||||||||
Total assets | $ | 7,776,582 | $ | 3,769,921 | $ | 3,294,387 | $ | 879,810 | $ | 344,971 | ||||||||||
Total debt(1) | $ | 1,522,481 | $ | 160,000 | $ | 680 | $ | 426,942 | $ | 149,321 | ||||||||||
Total unitholders’ equity before noncontrolling interest | $ | 3,957,707 | $ | 1,178,350 | $ | 1,367,288 | $ | 298,647 | $ | 138,191 | ||||||||||
Net cash provided by (used in): | ||||||||||||||||||||
Operating activities | $ | 551,525 | $ | 535,494 | $ | 74,257 | $ | 33,672 | $ | (3,014 | ) | |||||||||
Investing activities | $ | (1,902,029 | ) | $ | (1,206,024 | ) | $ | (1,473,998 | ) | $ | (458,595 | ) | $ | (119,973 | ) | |||||
Financing activities | $ | 1,744,363 | $ | 669,663 | $ | 1,442,424 | $ | 444,988 | $ | 127,145 | ||||||||||
(1) | For the year ended December 31, 2015, approximately $1.3 billion of debt related to the 2022 and 2023 Notes was pushed down from Rice Energy and recorded as a long-term payable to parent within the consolidated balance sheet. In addition, for the year ended December 31, 2014, $900.0 million of debt associated with the 2022 Notes was pushed down from Rice Energy and recorded as a long-term payable to parent within the consolidated balance sheet. |
47
Item 7. Management’s Discussion and Analysis of Financial Condition and Results of Operations
The following discussion and analysis of our financial condition and results of operations should be read in conjunction with our consolidated financial statements and related notes appearing elsewhere in this Annual Report. The following discussion contains “forward-looking statements” that reflect our future plans, estimates, beliefs and expected performance. We caution that assumptions, expectations, projections, intentions, or beliefs about future events may, and often do, vary from actual results and the differences can be material. In light of these risks, uncertainties and assumptions, the forward-looking events discussed may not occur. See “Cautionary Statement Regarding Forward-Looking Statements.” Also, see the risk factors and other cautionary statements described in “Item 1A. Risk Factors” included elsewhere in this Annual Report. We do not undertake any obligation to publicly update any forward-looking statements except as otherwise required by applicable law.
Overview of Our Business
Rice Energy Operating is an independent natural gas and oil company focused on the acquisition, exploration and development of natural gas, oil and NGL properties in the Appalachian Basin. We manage our business in three operating segments - the Exploration and Production segment, the Rice Midstream Holdings segment and the Rice Midstream Partners segment. These segments are managed separately due to their distinct operational differences. The Exploration and Production segment is responsible for the acquisition, exploration and development of natural gas, oil and NGLs. The Rice Midstream Holdings segment is engaged in the gathering and compression of natural gas, oil and NGL production for us and third parties in Belmont and Monroe Counties, Ohio. The Rice Midstream Partners segment is engaged in the gathering and compression of natural gas, oil and NGL production in Washington and Greene Counties, Pennsylvania, and in the provision of water services to support the well completion services of us and third parties in Washington and Greene Counties, Pennsylvania and Belmont County, Ohio.
As a result of certain reorganizations and transactions that occurred during 2014, 2015 and 2016, our historical financial condition and results of operations for the periods presented in this Annual Report may not be comparable, either from period to period or going forward. For example, information for the period from January 1, 2014 until January 29, 2014, as contained within the year ended December 31, 2014 pertains to the historical financial statements and results of operations of Rice Drilling B, Rice Energy’s accounting predecessor. Such periods reflect only our 50% equity investment in our Marcellus joint venture. From and after our acquisition of the remaining 50% interest from Alpha Holdings on January 29, 2014, the results of operations of our Marcellus joint venture are consolidated into our results of operations.
In connection with the RMP IPO in December 2014, we contributed to RMP all of our gas gathering and compression assets in Washington and Greene Counties, Pennsylvania in exchange for, among other things, common and subordinated units representing a 50% limited partner interest and all of the incentive distribution rights in RMP. Indirectly, through Midstream Holdings, we own and control the general partner of RMP, and, as such, the results of operations of RMP are consolidated into our results of operations. However, while our results of operations consolidate the results of operations of RMP for periods subsequent to December 22, 2014, they give effect to the noncontrolling interest in RMP held by its public unitholders.
Also in connection with the RMP IPO, we entered into various gas gathering and compression agreements and water distribution services agreements, both intercompany and, in the case of certain gas gathering and compression services in Pennsylvania, with RMP. Prior to December 22, 2014, with certain limited exceptions, the Rice Midstream Holdings segment and the Rice Midstream Partners segment did not charge fees for providing such services to our Exploration and Production segment. From December 22, 2014 through October 31, 2015, the Rice Midstream Holdings segment charged the Exploration and Production segment water services fees according to the water services agreements entered into in connection with the RMP IPO. Beginning on November 1, 2015, as a result of the closing of the acquisition of PA Water and OH Water by RMP, the Rice Midstream Partners segment charges the Exploration and Production segment water services fees according to certain water services agreements entered in connection with the acquisition. These gathering and water services fees are eliminated through consolidation.
As part of the consideration for the Vantage Acquisition, the Vantage Sellers were issued common units in us. In connection with the issuance of such membership interests to the Vantage Sellers, we and the Vantage Sellers entered into the Third A&R LLC Agreement. Under the Third A&R LLC Agreement, Rice Energy controls all of our day-to-day business affairs and decision making without approval of any other member, unless otherwise stated in the Third A&R LLC Agreement. As such, Rice Energy, through its officers and directors, is responsible for all operational and administrative decisions and the day-to-day management of our business. Pursuant to the terms of the Third A&R LLC Agreement, Rice Energy cannot, under any circumstances, be removed or replaced as our sole manager, except by its election so long as it remains a member.
48
Sources of Revenues
The substantial majority of our revenues are derived from the sale of natural gas and do not include the effects of derivatives. Our revenues may vary significantly from period to period as a result of changes in volumes of production sold or changes in realized prices. Our gathering, compression and water services revenues are primarily derived from our gathering and compression contracts in addition to fees charged to outside working interest owners.
The following table provides detail of our operating revenues from the consolidated statements of operations for the years ended December 31, 2016, 2015 and 2014.
Years Ended December 31, | |||||||||||
(in thousands) | 2016 | 2015 | 2014 | ||||||||
Natural gas sales | $ | 646,531 | $ | 441,082 | $ | 354,860 | |||||
Oil and NGL sales | 6,910 | 5,433 | 4,341 | ||||||||
Gathering, compression and water services | 101,057 | 49,179 | 5,504 | ||||||||
Other revenue | 24,408 | 6,447 | 26,237 | ||||||||
Total operating revenues | $ | 778,906 | $ | 502,141 | $ | 390,942 | |||||
NYMEX Henry Hub prompt month contract prices are widely-used benchmarks in the pricing of natural gas. The following table provides the high and low prices for NYMEX Henry Hub prompt month contract prices and our differential to the average of those benchmark prices for the periods indicated.
Years Ended December 31, | |||||||||||
2016 | 2015 | 2014 | |||||||||
NYMEX Henry Hub High ($/MMBtu) | $ | 3.77 | $ | 3.30 | $ | 7.94 | |||||
NYMEX Henry Hub Low ($/MMBtu) | $ | 1.64 | $ | 1.76 | $ | 2.75 | |||||
NYMEX Henry Hub Price ($/MMBtu) | $ | 2.46 | $ | 2.64 | $ | 4.32 | |||||
Less: Average Basis Impact ($/MMBtu) (1) | (0.42 | ) | (0.54 | ) | (0.84 | ) | |||||
Plus: Btu Uplift (MMBtu/Mcf) | 0.10 | 0.11 | 0.17 | ||||||||
Pre-Hedge Realized Price ($/Mcf) | $ | 2.14 | $ | 2.21 | $ | 3.65 | |||||
(1) | Differential is calculated by comparing the average NYMEX Henry Hub price to our volume weighted average realized price per MMBtu before hedges, including 50% of the volumes sold by our Marcellus joint venture for the period from January 1, 2014 through January 28, 2014, contained within the year ended December 31, 2014. The remainder of the year ended December 31, 2014 reflects 100% of the volumes sold by our Marcellus joint venture. |
We sell a substantial majority of our production to two natural gas marketers, Sequent and BP. For the year ended December 31, 2016, sales to Sequent and BP represented 25% and 24% of our total sales, respectively. If our natural gas marketers decided to stop purchasing natural gas from us, our revenues could decline and our operating results and financial condition could be harmed. Although a substantial portion of production is purchased by these customers, we do not believe the loss of these customers would have a material adverse effect on our business, as other customers or markets would be accessible to us.
For the year ended December 31, 2016, our Exploration and Production segment accounted for 87% of our operating revenues. While we anticipate that the Rice Midstream Holdings segment and the Rice Midstream Partners segment will continue to represent a meaningful portion of our operating revenues in future periods, we expect that a substantial majority of our operating revenues will remain attributable to our Exploration and Production segment.
49
Principal Components of Our Cost Structure
• | Lease operating expense. These are the day to day operating costs incurred to maintain production of our natural gas producing wells. Such costs include field personnel costs, produced water disposal, maintenance and repairs. Cost levels for these expenses can vary based on supply and demand for oilfield services. |
• | Gathering, compression and transportation. These are costs incurred to bring natural gas to the market. Such costs include fees paid to third parties who operate low- and high-pressure gathering systems that transport our natural gas. We often enter into firm transportation contracts that secure takeaway capacity that includes minimum volume commitments, the cost for which is included in these expenses. |
• | Midstream operation and maintenance. These are costs incurred to operate and maintain our low- and high-pressure natural gas gathering and compression systems and our water services assets used to support well completion activities and to collect and recycle or dispose of flowback and produced water. |
• | Incentive unit expense. These costs represent non-cash compensation expense that have been pushed down from Rice Energy for incentive units awarded to certain of its employees by NGP Rice Holdings LLC (“NGP Holdings”) and Rice Holdings. In connection with Rice Energy’s initial public offering (“IPO”) and related corporate reorganization, the holders of our incentive units contributed a portion of their incentive units to Rice Holdings and NGP Holdings in return for substantially similar incentive units in such entities. This resulted in the incentive units being deemed to have been modified, and the performance conditions were considered to be probable of occurring. Therefore, their fair values were measured and compensation expense from the date of initial grant through December 31, 2016 has been recognized in the year ended December 31, 2016. The payment obligation as it relates to the incentive units resides with NGP Holdings and Rice Holdings and has not been, and will not be borne by us. In April 2016, NGP Holdings settled its remaining incentive unit obligation in connection with Rice Energy’s equity offering of an aggregate of 34,337,725 shares of common stock in April 2016 (the “April 2016 Equity Offering”), which included 20,000,000 shares of common stock sold by Rice Energy and 14,337,725 shares sold by NGP Holdings. No future expense will be recognized related to the NGP Holdings incentive units. |
• | General and administrative expense. These costs include Rice Energy’s overhead costs, which have been allocated and/or pushed down to us, including payroll and benefits for Rice Energy’s corporate staff, costs of maintaining our headquarters, costs of managing our exploration and production operations, midstream operations, franchise taxes, audit and other professional fees and legal compliance expenses. General and administrative expense also includes stock-based compensation expense related to awards granted under our long-term incentive plan. Please see “Note 16— Stock-Based Compensation” in the notes of the consolidated financial statements under Item 8 of this Annual Report. |
• | Depreciation, depletion and amortization. Depreciation, depletion and amortization (“DD&A”) includes the systematic expensing of the capitalized costs incurred to acquire, explore and develop natural gas. As a “successful efforts” company, we capitalize all costs associated with our acquisition and development efforts and all successful exploration efforts and allocate these costs to each unit of production using the units of production method. |
• | Interest expense. We have financed a portion of our working capital requirements and property acquisitions with borrowings under our revolving credit facilities and our Notes. As a result, we incur interest expense that is affected by the level of drilling, completion and acquisition activities, as well as fluctuations in interest rates and our financing decisions. We will likely continue to incur significant interest expense as we continue to grow. To date, we have not entered into any interest rate hedging arrangements to mitigate the effects of interest rate changes. For the years ended December 31, 2015 and 2014, Rice Energy maintained the debt and related interest charges. These amounts have been pushed down to us for periods in which we were not a co-obligor of the debt. |
• | Gain on derivative instruments. We and Rice Energy utilize commodity derivative contracts to reduce exposure to fluctuations in the price of natural gas. We recognize gains and losses associated with our open commodity derivative contracts as commodity prices and the associated fair value of our commodity derivative contracts change. The commodity derivative contracts in place are not designated as hedges for accounting purposes. Consequently, these commodity derivative contracts are recorded at fair value at each balance sheet date with changes in fair value recognized as a gain or loss in the results of operations. Cash flow is only impacted to the extent the actual settlements under the contracts result in making a payment to or receiving a payment from the counterparty. |
• | Income tax expense. Prior to our change in tax status to a partnership on October 19, 2016, our income was included as part of Rice Energy’s consolidated federal tax return, and we are taxed as a corporation under the Internal Revenue Code subject to federal income tax at a statutory rate of 35%. We did not report any income tax benefit or expense for periods subsequent to the change in tax status because, as a partnership, we are not subject to federal income tax. |
50
In addition, we did not report any income tax benefit or expense for periods prior to the consummation of Rice Energy’s IPO in January 2014 because Rice Drilling B, Rice Energy’s accounting predecessor, is a limited liability company that was not and currently is not subject to federal income tax. The reorganization of our business into a corporation in connection with the closing of Rice Energy’s IPO required the recognition of a deferred tax asset or liability for the initial temporary differences at the time of the IPO. The resulting deferred tax liability of approximately $162.3 million was recorded in equity at the date of the completion of Rice Energy’s IPO because it represented a transaction among shareholders.
How We Evaluate Our Operations
In evaluating our financial results, we focus on production, revenues, per unit cash production costs and general and administrative (“G&A”) expenses. We also evaluate our rates of return on invested capital in our wells, and we measure the expected return of our wells based on EUR and the related costs of acquisition, development and production.
We believe the quality of our assets combined with our technical and managerial expertise can generate attractive rates of return as we develop our core acreage position in the Marcellus and Utica Shales. Additionally, by focusing on concentrated acreage positions, we can build and own centralized midstream infrastructure, including low- and high-pressure gathering lines, compression facilities and water pipeline systems, which enable us to reduce reliance on third-party operators, minimize costs and increase our returns.
Consolidated Results of Operations
Below are some highlights of our consolidated financial and operating results for the years ended December 31, 2016, 2015 and 2014:
• | Our natural gas, oil and NGL sales were $653.4 million, $446.5 million and $359.2 million in the years ended December 31, 2016, 2015 and 2014, respectively. |
• | Our production volumes were 304.4 Bcfe, 201.3 Bcfe and 97.7 Bcfe in the years ended December 31, 2016, 2015 and 2014, respectively. |
• | Our gathering, compression and water services revenues were $101.1 million, $49.2 million and $5.5 million for the years ended December 31, 2016, 2015 and 2014, respectively. |
• | Our per unit cash production costs were $0.63 per Mcfe, $0.68 per Mcfe and $0.67 per Mcfe in the years ended December 31, 2016, 2015 and 2014, respectively. |
51
The following tables set forth selected operating and financial data for the year ended December 31, 2016 compared to the year ended December 31, 2015 and the year ended December 31, 2015 compared to the year ended December 31, 2014:
Year Ended December 31, | Year Ended December 31, | ||||||||||||||||||||||
2016 | 2015 | Change | 2015 | 2014 | Change | ||||||||||||||||||
Natural gas sales (in thousands) | $ | 646,531 | $ | 441,082 | $ | 205,449 | $ | 441,082 | $ | 354,860 | $ | 86,222 | |||||||||||
Oil and NGL sales (in thousands) | 6,910 | 5,433 | 1,477 | 5,433 | $ | 4,341 | 1,092 | ||||||||||||||||
Natural gas, oil and NGL sales (in thousands) | $ | 653,441 | $ | 446,515 | $ | 206,926 | $ | 446,515 | $ | 359,201 | $ | 87,314 | |||||||||||
Natural gas production (MMcf) | 302,322 | 199,831 | 102,491 | 199,831 | 97,172 | 102,659 | |||||||||||||||||
Oil and NGL production (MBbls) | 354 | 249 | 105 | 249 | 94 | 155 | |||||||||||||||||
Total production (MMcfe) | 304,443 | 201,328 | 103,115 | 201,328 | 97,737 | 103,591 | |||||||||||||||||
Average natural gas prices before effects of hedges per Mcf | $ | 2.14 | $ | 2.21 | $ | (0.07 | ) | $ | 2.21 | $ | 3.65 | $ | (1.44 | ) | |||||||||
Average realized natural gas prices after effects of hedges per Mcf (1) | 2.83 | 3.18 | (0.35 | ) | 3.18 | 3.46 | (0.28 | ) | |||||||||||||||
Average oil and NGL prices per Bbl | 19.55 | 21.79 | (2.24 | ) | 21.79 | 46.07 | (24.28 | ) | |||||||||||||||
Average costs per Mcfe | |||||||||||||||||||||||
Lease operating | $ | 0.17 | $ | 0.22 | $ | (0.05 | ) | $ | 0.22 | $ | 0.26 | $ | (0.04 | ) | |||||||||
Gathering, compression and transportation | 0.41 | 0.42 | (0.01 | ) | 0.42 | 0.36 | 0.06 | ||||||||||||||||
Production taxes and impact fees | 0.05 | 0.04 | 0.01 | 0.04 | 0.05 | (0.01 | ) | ||||||||||||||||
General and administrative | 0.39 | 0.51 | (0.12 | ) | 0.51 | 0.63 | (0.12 | ) | |||||||||||||||
Depreciation, depletion and amortization | 1.21 | 1.60 | (0.39 | ) | 1.60 | 1.60 | — | ||||||||||||||||
Total gathering, compression and water service revenues (in thousands): | $ | 101,057 | $ | 49,179 | $ | 51,878 | $ | 49,179 | $ | 5,504 | $ | 43,675 | |||||||||||
Gathering volumes (MDth/d): | 1,691 | 894 | 797 | 894 | 402 | 492 | |||||||||||||||||
Compression volumes (MDth/d): | 1,007 | 115 | 892 | 115 | — | 115 | |||||||||||||||||
Water services volumes (MMgal): | 1,253 | 777 | 476 | 777 | — | 777 | |||||||||||||||||
(1) | The effect of hedges includes realized gains and losses on commodity derivative transactions. |
52
Year Ended December 31, | Year Ended December 31, | ||||||||||||||||||||||
(in thousands, except per share data) | 2016 | 2015 | Change | 2015 | 2014 | Change | |||||||||||||||||
Operating revenues: | |||||||||||||||||||||||
Natural gas, oil and NGL sales | $ | 653,441 | $ | 446,515 | $ | 206,926 | $ | 446,515 | $ | 359,201 | $ | 87,314 | |||||||||||
Gathering, compression and water services | 101,057 | 49,179 | 51,878 | 49,179 | 5,504 | 43,675 | |||||||||||||||||
Other revenue | 24,408 | 6,447 | 17,961 | 6,447 | 26,237 | (19,790 | ) | ||||||||||||||||
Total operating revenues | 778,906 | 502,141 | 276,765 | 502,141 | 390,942 | 111,199 | |||||||||||||||||
Operating expenses: | |||||||||||||||||||||||
Lease operating | 50,574 | 44,356 | 6,218 | 44,356 | 24,971 | 19,385 | |||||||||||||||||
Gathering, compression and transportation | 123,852 | 84,707 | 39,145 | 84,707 | 35,618 | 49,089 | |||||||||||||||||
Production taxes and impact fees | 13,866 | 7,609 | 6,257 | 7,609 | 4,647 | 2,962 | |||||||||||||||||
Exploration | 15,159 | 3,137 | 12,022 | 3,137 | 4,018 | (881 | ) | ||||||||||||||||
Midstream operation and maintenance | 23,215 | 16,988 | 6,227 | 16,988 | 4,607 | 12,381 | |||||||||||||||||
Incentive unit expense | 51,761 | 36,097 | 15,664 | 36,097 | 105,961 | (69,864 | ) | ||||||||||||||||
Impairment of gas properties | 20,853 | 18,250 | 2,603 | 18,250 | — | 18,250 | |||||||||||||||||
Impairment of goodwill | — | 294,908 | (294,908 | ) | 294,908 | — | 294,908 | ||||||||||||||||
Impairment of fixed assets | 23,057 | — | 23,057 | — | — | — | |||||||||||||||||
General and administrative | 118,093 | 103,038 | 15,055 | 103,038 | 61,570 | 41,468 | |||||||||||||||||
Depreciation, depletion and amortization | 368,455 | 322,784 | 45,671 | 322,784 | 156,270 | 166,514 | |||||||||||||||||
Acquisition expense | 6,109 | 1,235 | 4,874 | 1,235 | 2,339 | (1,104 | ) | ||||||||||||||||
Amortization of intangible assets | 1,634 | 1,632 | 2 | 1,632 | 1,156 | 476 | |||||||||||||||||
Other expense | 27,308 | 5,567 | 21,741 | 5,567 | 207 | 5,360 | |||||||||||||||||
Total operating expenses | 843,936 | 940,308 | (96,372 | ) | 940,308 | 401,364 | 538,944 | ||||||||||||||||
Operating loss | (65,030 | ) | (438,167 | ) | 373,137 | (438,167 | ) | (10,422 | ) | (427,745 | ) | ||||||||||||
Interest expense | (99,627 | ) | (87,446 | ) | (12,181 | ) | (87,446 | ) | (50,191 | ) | (37,255 | ) | |||||||||||
Gain on purchase of Marcellus joint venture | — | — | — | — | 203,579 | (203,579 | ) | ||||||||||||||||
Other income | 1,406 | 1,108 | 298 | 1,108 | 893 | 215 | |||||||||||||||||
(Loss) gain on derivative instruments | (220,236 | ) | 273,748 | (493,984 | ) | 273,748 | 186,477 | 87,271 | |||||||||||||||
Amortization of deferred financing costs | (7,545 | ) | (5,124 | ) | (2,421 | ) | (5,124 | ) | (2,495 | ) | (2,629 | ) | |||||||||||
Loss on extinguishment of debt | — | — | — | — | (7,654 | ) | 7,654 | ||||||||||||||||
Write-off of deferred financing costs | — | — | — | — | (6,896 | ) | 6,896 | ||||||||||||||||
Equity in loss of joint ventures | — | — | — | — | (2,656 | ) | 2,656 | ||||||||||||||||
Income (loss) before income taxes | (391,032 | ) | (255,881 | ) | (135,151 | ) | (255,881 | ) | 310,635 | (566,516 | ) | ||||||||||||
Income tax benefit (expense) | 240,814 | (12,118 | ) | 252,932 | (12,118 | ) | (91,600 | ) | 79,482 | ||||||||||||||
Net (loss) income | (150,218 | ) | (267,999 | ) | 117,781 | (267,999 | ) | 219,035 | (487,034 | ) | |||||||||||||
Less: Net income attributable to noncontrolling interests | (75,415 | ) | (23,337 | ) | (52,078 | ) | (23,337 | ) | (581 | ) | (22,756 | ) | |||||||||||
Net (loss) income attributable to Rice Energy Operating | (225,633 | ) | (291,336 | ) | 65,703 | (291,336 | ) | 218,454 | (509,790 | ) | |||||||||||||
Less: Preferred dividends and accretion of redeemable noncontrolling interests | (28,450 | ) | — | (28,450 | ) | — | — | — | |||||||||||||||
Net (loss) income attributable to Rice Energy Operating common unitholders | $ | (254,083 | ) | $ | (291,336 | ) | $ | 37,253 | $ | (291,336 | ) | $ | 218,454 | $ | (509,790 | ) | |||||||
53
Year Ended December 31, 2016 Compared to Year Ended December 31, 2015
Total operating revenues. The $276.8 million increase in total operating revenues was mainly a result of a 51% increase in natural gas, oil and NGL production from 201.3 Bcfe in 2015 to 304.4 Bcfe in 2016. During 2016, we turned 70 gross (63 net) wells into sales, of which 14 gross (14 net) wells were acquired in the Vantage Acquisition. The increase in operating revenues was slightly offset by a decrease in realized prices. Our realized price in 2016 was $2.14 per Mcf compared to $2.21 per Mcf in 2015, in each case before the effect of hedges. Operating revenues were also positively impacted by a $51.9 million, or 105%, increase in gathering, compression and water service revenues year-over-year. This increase primarily relates to an increase in third-party volumes and revenues on our gathering contracts. In addition, post-acquisition revenue associated with the Vantage Acquisition was $51.6 million for the period from October 19, 2016 through December 31, 2016.
Lease operating expenses. The $6.2 million increase in lease operating expenses was attributable to an increase in our production base in 2016 as compared to the prior year. However, on a per unit basis, lease operating expenses decreased from $0.22 for the year ended December 31, 2015 to $0.17 for the year ended December 31, 2016. The decrease on a per unit basis was attributable to improved efficiencies, primarily relating to production water recycling and reduced flowback periods.
Gathering, compression and transportation. Gathering, compression and transportation expense for 2016 of $123.9 million was mainly comprised of $105.1 million of transportation contracts with third parties and $19.3 million of gathering charges from third parties. The $39.1 million, or 46%, increase in expense was primarily attributable to a 51% increase in production volumes, as well as increased firm transportation expense for the year ended December 31, 2016.
Exploration. The increase in exploration expense year over year of $12.0 million was primarily due to leasehold write-offs, mainly associated with expired leaseholds.
Midstream operation and maintenance. The $6.2 million increase in midstream operation and maintenance expense in 2016 compared to the prior year was primarily due to on and off pad water transfer costs and water procurement, in addition to increased expenses following the Vantage Midstream Asset Acquisition primarily associated with water transfer and pipeline maintenance costs. On a per unit basis, midstream operation and maintenance expense was $0.08 for the years ended December 31, 2016 and 2015.
Incentive unit expense. Incentive unit expense increased $15.7 million in 2016 compared to 2015. In 2016, the $51.8 million expense consisted of $24.5 million of non-cash compensation expense related to the Rice Holdings incentive units and $27.3 million of compensation expense related to a cumulative adjustment to equal the cumulative cash payment made by NGP Holdings to NGP Holdings incentive unitholders. In 2015, the $36.1 million expense consisted of $33.7 million of non-cash compensation expense related to the Rice Holdings incentive units and $26.7 million related to payments made to certain holders of NGP Holdings incentive units, offset by $24.3 million of non-cash income related to the fair market value adjustment for the NGP Holdings incentive units which was largely driven by the decline in Rice Energy’s stock price as of December 31, 2015. No future expense will be recognized related to the NGP Holdings incentive units as a result of the April 2016 settlement of the remaining NGP Holdings incentive unit obligation. See “Item 1. Financial Statements—Notes to Consolidated Financial Statements—14. Incentive Units” for additional information.
Impairment of gas properties. For the years ended December 31, 2016 and 2015, we recorded $20.9 million and $18.2 million, respectively, in impairment expense related to our gas properties. In 2016, we recognized $20.9 million of impairment expense in the consolidated statement of operations related to lease expirations on non-core assets. In 2015, we determined that the carrying value of our Upper Devonian proved property was not fully recoverable and as a result, we recognized a $10.9 million impairment expense to write-down such proved properties to fair value. In addition, we recognized $7.3 million of impairment expense in 2015 due to changes in our development plans and lease expirations.
Impairment of goodwill. The $294.9 million impairment of goodwill in 2015 related to a full impairment of goodwill associated with our Exploration and Production segment. In performing the annual goodwill impairment analysis, management considered the negative industry and market trends, including the decline in commodity prices and overall market performance of our peers and ourselves, to be the primary reasons of impairment.
Impairment of fixed assets. The $23.1 million impairment expense in 2016 was primarily related to a $20.3 million impairment for pipeline assets that were decommissioned.
General and administrative expense. For the year ended December 31, 2016, general and administrative expense (before stock compensation expense) increased $10.3 million, or 12%, primarily due to the additions of personnel to support growth activities and related salary and employee benefits. At December 31, 2016, Rice Energy had 467 employees, a 26% increase compared to December 31, 2015. Additionally, general and administrative expenses increased year-over-year due to an increase in rent expense primarily related to office leases. On a per unit basis, general and administrative expense (before stock compensation
54
expense) decreased by 26%, from $0.43 per Mcfe during the year ended December 31, 2015 to $0.32 per Mcfe during the year ended December 31, 2016, primarily due to a 51% increase in production. Slightly offsetting the increase in general and administrative expenses was an increase in allocated employee time to capital projects due to increased production.
Included in general and administrative expense is stock compensation expense of $21.3 million and $16.5 million for the years ended December 31, 2016 and December 31, 2015, respectively. The increase is primarily attributable to increased compensation expense associated with Rice Energy’s restricted stock unit and performance stock unit awards. Please see “Note 16—Stock-Based Compensation” in the notes to the consolidated financial statements in Item 8 of this Annual Report for further information on these awards.
DD&A. The $45.7 million increase in DD&A expense was a result of an increase in production driven by a greater number of producing wells in 2016 compared to 2015. As of December 31, 2016, we had 282 net producing Appalachian wells, an 97% increase when compared to the number of producing wells as of December 31, 2015. In addition, the increase in DD&A was the result of an increase in midstream assets placed in service in 2016 as compared to the prior year and the related depreciation of those assets. As of December 31, 2016, we had 251 miles and 129 miles of gas gathering and water pipeline, respectively, an increase of 50% and 15%, respectively, when compared to the prior year. On a per unit basis, DD&A expense decreased $0.39, or 24%, from $1.60 for the year ended December 31, 2015 to $1.21 for the year ended December 31, 2016.
Acquisition expense. The $4.9 million increase in acquisition expense was primarily attributable to costs associated with the Vantage Acquisition.
Interest expense. The $12.2 million increase in interest expense was primarily attributable to a full year recognition of expense associated with the prior year issuance of $400.0 million of the 2023 Notes. In addition, interest expense increased due to higher average borrowings on revolving credit facilities during 2016 as compared to 2015 in order to fund our capital expenditures.
(Loss) gain on derivative instruments. The $220.2 million loss on derivative contracts in 2016 was due to net cash receipts of $210.5 million on the settlement of maturing contracts and offset by a $430.8 million unrealized loss. The $273.7 million gain on derivative contracts in 2015 was due to net cash receipts of $193.9 million and a $79.8 million unrealized gain.
Income tax (benefit) expense. The $252.9 million decrease in income tax expense year-over-year was primarily driven by a write-off of all deferred income tax accounts associated with our change in tax status to a partnership as of October 19, 2016. In addition, the decrease in income tax expense was related to our net pre-tax loss, creating an income tax benefit for the year ended December 31, 2016.
Noncontrolling interest. The $52.1 million increase in net income attributable to noncontrolling interest was primarily related to an increase in RMP’s net income year-over-year from $52.5 million in 2015 to $121.6 million in 2016. In addition, noncontrolling interest increased due to a decrease in our indirect ownership in RMP from 41% as of December 31, 2015 to 26% as of December 31, 2016. The decrease in ownership percentage year-over-year was primarily attributable to RMP’s June 2016 and October 2016 equity offerings.
Year Ended December 31, 2015 Compared to Year Ended December 31, 2014
Total operating revenues. The $111.2 million increase in total operating revenues was mainly a result of an increase in natural gas, oil and NGL production in 2015 compared to 2014. The increase in production was a result of increased drilling and completion activity in 2015, mainly in Washington County, Pennsylvania and Belmont County, Ohio. The impact of increased production volumes on operating revenues was offset by a decrease in realized prices. Our realized price in 2015 was $2.21 per Mcf compared to $3.65 per Mcf in 2014, in each case before the effect of hedges. Additionally, operating revenues were positively impacted by a $43.7 million increase in gathering, compression and water service revenues year-over-year. This increase primarily relates to increased third-party volumes and revenues on new gathering contracts. The increase in operating revenues for 2015 were offset by a $22.8 million decrease year-over-year in firm transportation sales, net, from the sale of unutilized capacity as we further utilize our existing contracts for our own operated production.
Lease operating expenses. The $19.4 million increase in lease operating expenses is attributable to an increase in the number of producing wells in 2015 as compared to 2014. However, lease operating expenses per unit of production decreased year-over-year due to improved efficiencies, primarily relating to production water recycling.
Gathering, compression and transportation. Gathering, compression and transportation expense for 2015 of $84.7 million is mainly comprised of $68.2 million of transportation contracts with third parties, $8.3 million of gathering charges from third parties and $4.2 million of charges from our working interest partners on our non-operated wells. The $49.1 million increase in
55
expense was primarily attributable to increased firm transportation contracts in 2015 compared to 2014, which is consistent with increased production.
Midstream operation and maintenance. The $12.4 million increase in midstream operation and maintenance expense in 2015 compared to 2014 was primarily due to additional contract labor costs, additional leases and on compression equipment and utility costs incurred as a result of our continued midstream build-out.
Incentive unit expense. Incentive unit expense decreased $69.9 million in 2015 compared to 2014. In 2014, the $106.0 million expense primarily consisted of $44.5 million and $41.7 million of non-cash compensation expense related to the Rice Holdings and NGP Holdings incentive units, respectively, $3.4 million of non-cash compensation expense related to extinguishment of the legacy incentive unit burden of Mr. Daniel J. Rice III and $16.4 million related to payments made to certain holders of NGP Holdings incentive units. In 2015, the $36.1 million expense consisted of $33.7 million of non-cash compensation expense related to the Rice Holdings incentive units and $26.7 million related to payments made to certain holders of NGP Holdings incentive units, offset by $24.3 million of non-cash income related to the fair market value adjustment for the NGP Holdings incentive units which was largely driven by the decline in Rice Energy’s stock price at December 31, 2015. See “Item 8. Financial Statements and Supplementary Data—Notes to Consolidated Financial Statements—14. Incentive Units” for additional information.
Impairment of goodwill. The $294.9 million impairment of goodwill in 2015 related to a full impairment of goodwill associated with our Exploration and Production segment. In performing the annual goodwill impairment analysis, management considered the negative industry and market trends, including the decline in commodity prices and overall market performance of our peers and ourselves, to be the primary reasons of impairment.
General and administrative expense. The $41.5 million increase in general and administrative expense was primarily attributable to the addition of personnel to support Rice Energy’s growth activities and related salary and employee benefits. At December 31, 2015, Rice Energy had 371 employees as compared to 290 employees at December 31, 2014. Additionally, general and administrative expenses increased year-over-year as a result of the costs associated with Rice Energy’s accounting system implementation and information technology projects to support Rice Energy’s growth activities. Included in general and administrative expense is stock compensation expense of $16.5 million and $5.6 million for the years ended December 31, 2015 and December 31, 2014, respectively.
DD&A. The $166.5 million increase in DD&A expense was a result of an increase in production driven by a greater number of producing wells in 2015 compared to 2014, which is consistent with our expanded drilling program and increased production during the year. In addition, the increase was the result of an increase in midstream assets placed in service in 2015 as compared to 2014 and the related depreciation of those assets.
Interest expense. The $37.3 million increase in interest expense was a result of Rice Energy’s issuance of $400.0 million of the 2023 Notes and borrowings under our revolving credit facilities to fund midstream capital expenditures in 2015.
Gain on purchase of Marcellus joint venture. The $203.6 million gain on acquisition in the first quarter of 2014 was attributable to our acquisition of Alpha Holdings’ 50% interest in our Marcellus joint venture in connection with the closing of Rice Energy’s IPO. As a result of our acquisition of the remaining 50% ownership in our Marcellus joint venture, we were required to remeasure our equity investment at fair value, which resulted in the non-recurring gain.
Gain on derivative instruments. The $273.7 million gain on derivative contracts in 2015 was due to net cash receipts of $193.9 million on the settlement of maturing contracts and a $79.8 million unrealized gain. The $186.5 million gain on derivative contracts in 2014 was due to net cash payments of $18.8 million and a $205.3 million unrealized gain.
Equity in income (loss) of joint ventures. The $2.7 million decrease in equity income of joint ventures is the result of our acquisition of the remaining 50% interest in our Marcellus joint venture in January 2014, as we consolidate the operations of our Marcellus joint venture subsequent to the acquisition.
Income tax expense. The $79.5 million decrease in income tax expense year-over-year was attributable to a decrease in taxable income and a lower estimated annual effective tax rate.
Noncontrolling interest. The $22.8 million increase in net income attributable to noncontrolling interest was primarily attributable to us recognizing a full year of noncontrolling interest related to our investment in RMP as compared to the 10-day period in 2014.
56
Business Segment Results of Operations
As a result of changes to our operations and organizational structure in the first quarter of 2016, we now manage our business in three business segments: Exploration and Production, Rice Midstream Holdings and Rice Midstream Partners. We evaluate our business segments based on their contribution to our consolidated results based on operating income. Please see “Note 8—Financial Results by Business Segment” in the notes to the consolidated financial statements in Item 8 of this Annual Report for a break-down of the operating results and assets of our business segments for the years ended December 31, 2016, 2015 and 2014. All prior period results have been revised to reflect the new reporting segment structure.
The following tables set forth selected operating and financial data for each business segment for the year ended December 31, 2016 compared to the year ended December 31, 2015 and the year ended December 31, 2015 compared to the year ended December 31, 2014:
Exploration and Production Segment
Year ended December 31, | Year ended December 31, | ||||||||||||||||||||||
(in thousands, except volumes) | 2016 | 2015 | Change | 2015 | 2014 | Change | |||||||||||||||||
Operating revenues: | |||||||||||||||||||||||
Natural gas, oil and NGL sales | $ | 653,441 | $ | 446,515 | $ | 206,926 | $ | 446,515 | $ | 359,201 | $ | 87,314 | |||||||||||
Other revenue | 24,408 | 6,447 | 17,961 | 6,447 | 26,237 | (19,790 | ) | ||||||||||||||||
Total operating revenues | 677,849 | 452,962 | 224,887 | 452,962 | 385,438 | 67,524 | |||||||||||||||||
Operating expenses: | |||||||||||||||||||||||
Lease operating | 50,708 | 44,356 | 6,352 | 44,356 | 24,971 | 19,385 | |||||||||||||||||
Gathering, compression and transportation | 232,478 | 150,015 | 82,463 | 150,015 | 37,414 | 112,601 | |||||||||||||||||
Production taxes and impact fees | 13,866 | 7,609 | 6,257 | 7,609 | 4,647 | 2,962 | |||||||||||||||||
Exploration | 15,159 | 3,137 | 12,022 | 3,137 | 4,018 | (881 | ) | ||||||||||||||||
Incentive unit expense | 49,426 | 33,873 | 15,553 | 33,873 | 86,020 | (52,147 | ) | ||||||||||||||||
Impairment of gas properties | 20,853 | 18,250 | 2,603 | 18,250 | — | 18,250 | |||||||||||||||||
Impairment of goodwill | — | 294,908 | (294,908 | ) | 294,908 | — | 294,908 | ||||||||||||||||
Impairment of fixed assets | 2,765 | — | 2,765 | — | — | — | |||||||||||||||||
General and administrative | 78,161 | 78,592 | (431 | ) | 78,592 | 46,229 | 32,363 | ||||||||||||||||
Depreciation, depletion and amortization | 350,187 | 308,194 | 41,993 | 308,194 | 151,900 | 156,294 | |||||||||||||||||
Other expense | 25,653 | 5,075 | 20,578 | 5,075 | — | 5,075 | |||||||||||||||||
Acquisition expense | 5,500 | 108 | 5,392 | 108 | 820 | (712 | ) | ||||||||||||||||
Total operating expenses | 844,756 | 944,117 | (99,361 | ) | 944,117 | 356,019 | 588,098 | ||||||||||||||||
Operating (loss) income | $ | (166,907 | ) | $ | (491,155 | ) | $ | 324,248 | $ | (491,155 | ) | $ | 29,419 | $ | (520,574 | ) | |||||||
Operating volumes: | |||||||||||||||||||||||
Natural gas production (MMcf): | 302,322 | 199,831 | 102,491 | 199,831 | 97,172 | 102,659 | |||||||||||||||||
Oil and NGL production (MBbls): | 354 | 249 | 105 | 249 | 94 | 155 | |||||||||||||||||
Total production (MMcfe) | 304,443 | 201,328 | 103,115 | 201,328 | 97,737 | 103,591 | |||||||||||||||||
Average costs per Mcfe: | |||||||||||||||||||||||
Lease operating | $ | 0.17 | $ | 0.22 | $ | (0.05 | ) | $ | 0.22 | $ | 0.26 | $ | (0.04 | ) | |||||||||
Gathering, compression and transportation | 0.76 | 0.75 | 0.01 | 0.75 | 0.38 | 0.37 | |||||||||||||||||
Production taxes and impact fees | 0.05 | 0.04 | 0.01 | 0.04 | 0.02 | 0.02 | |||||||||||||||||
General and administrative | 0.26 | 0.39 | (0.13 | ) | 0.39 | 0.47 | (0.08 | ) | |||||||||||||||
Depreciation, depletion and amortization | 1.15 | 1.53 | (0.38 | ) | 1.53 | 1.55 | (0.02 | ) | |||||||||||||||
57
Year Ended December 31, 2016 Compared to Year Ended December 31, 2015
Total operating revenues. The $206.9 million increase in natural gas, oil and NGL sales was mainly a result of an increase in production in 2016 compared to 2015, as discussed above. In addition, post-acquisition revenue associated with the Vantage Acquisition was $51.6 million for the period from October 19, 2016 through December 31, 2016. The increase in operating revenues was slightly offset by a decrease in realized prices. Our realized price in 2016 was $2.14 per Mcf compared to $2.21 per Mcf in 2015, in each case before the effect of hedges. Additionally, the increase in other revenue of approximately $18.0 million was primarily driven by our natural gas marketing activities.
Lease operating expenses. The $6.4 million increase in lease operating expenses was attributable to an increase in our production base in 2016 as compared to the prior year. However, on a per unit basis, lease operating expenses decreased from $0.22 for the year ended December 31, 2015 to $0.17 for the year ended December 31, 2016 due to improved efficiencies, primarily relating to production water recycling.
Gathering, compression and transportation. Gathering, compression and transportation expense for 2016 of $232.5 million includes $127.9 million of affiliate and third party gathering fees and $105.1 million of transportation contracts with third parties. The $82.5 million increase in gathering, compression and transportation expenses was mainly due to increased volumes under the gathering agreements with the Rice Midstream Partners segment and the Rice Midstream Holdings segment, as well as increased firm transportation expense for the year ended December 31, 2016.
Production taxes and impact fees. Production taxes are directly related to natural gas, oil and NGLs sales. The $6.3 million, or 82%, increase in production taxes for 2016 compared to 2015 is primarily related to the 49% increase in natural gas, oil and NGLs sales.
Exploration. The increase in exploration expense year over year of $12.0 million was primarily due to leasehold write-offs, mainly associated with expired leaseholds.
Impairment of gas properties. For the years ended December 31, 2016 and 2015, we recorded $20.9 million and $18.2 million, respectively, in impairment expense related to our gas properties. In 2016, we recognized $20.9 million of impairment expense in the consolidated statement of operations related to lease expirations on non-core assets. In 2015, we determined that the carrying value of our Upper Devonian proved property was not fully recoverable and as a result, we recognized a $10.9 million impairment expense to write-down such proved properties to fair value. In addition, we recognized $7.3 million of impairment expense in 2015 due to changes in our development plans and lease expirations.
Impairment of goodwill. The $294.9 million impairment of goodwill in 2015 related to a full impairment of goodwill associated with our Exploration and Production segment. In performing the annual goodwill impairment analysis, management considered the negative industry and market trends, including the decline in commodity prices and overall market performance of our peers and ourselves, to be the primary reasons of impairment.
General and administrative expense. For the year ended December 31, 2016, general and administrative expense (before stock compensation expense) decreased $2.8 million, or 4%, primarily due to a decrease in allocated costs associated with personnel and administrative expenses as the Rice Midstream Holdings segment and the Rice Midstream Partners segment continue to grow. On a per unit basis, general and administrative expense (before stock compensation expense) decreased by 35%, from $0.34 per Mcfe during the year ended December 31, 2015 to $0.22 per Mcfe during the year ended December 31, 2016, primarily due to a 51% increase in production. Included in general and administrative expense is stock compensation expense of $13.4 million and $11.0 million for the years ended December 31, 2016 and December 31, 2015, respectively.
DD&A. The $42.0 million increase was a result of an increase in production and greater number of producing wells in 2016 compared to 2015. As of December 31, 2016, we had 282 net producing Appalachian wells, an 97% increase when compared to the number of producing wells as of December 31, 2015. On a per unit basis, DD&A expense decreased $0.38 per Mcfe, or 25%, from $1.53 for the year ended December 31, 2015 to $1.15 per Mcfe for the year ended December 31, 2016.
58
Year Ended December 31, 2015 Compared to Year Ended December 31, 2014
Total operating revenues. The $87.3 million increase in natural gas, oil and NGL sales was mainly a result of an increase in production in 2015 compared to 2014 as discussed above. The impact of increased production volumes on operating revenues was offset by a decrease in realized prices. Our realized price in 2015 was $2.21 per Mcf compared to $3.65 per Mcf in 2014, in each case before the effect of hedges. The increase in operating revenues for 2015 were offset by a $22.8 million decrease year-over-year in firm transportation sales, net, from the sale of unutilized capacity as we further utilize our existing contracts for our own operated production.
Lease operating expenses. The $19.4 million increase in lease operating expenses year-over-year was attributable to an increase in the number of producing wells in 2015 as compared to the prior year. However, lease operating expenses per unit of production decreased year-over-year due to improved efficiencies, primarily relating to production water recycling.
Gathering, compression and transportation. Gathering, compression and transportation expense for 2015 of $150.0 million includes $73.6 million of affiliate and third party gathering fees, $68.2 million of transportation contracts with third parties and $4.2 million of charges from our working interest partners on our non-operated wells. The $112.6 million increase in gathering, compression and transportation expenses was mainly due to the gathering agreements with the Rice Midstream Partners segment and the Rice Midstream Holdings segment as well as increased firm transportation expense in 2015 compared to 2014, which is consistent with increased production.
Impairment of goodwill. The $294.9 million impairment of goodwill in 2015 related to a full impairment of goodwill associated with our Exploration and Production segment. In performing the annual goodwill impairment analysis, management considered the negative industry and market trends, including the decline in commodity prices and overall market performance of our peers and ourselves, to be the primary reasons of impairment.
General and administrative expense. The $32.4 million increase in segment general and administrative expense year-over-year was primarily attributable to the addition of personnel to support growth activities and related salary and employee benefits. Included in general and administrative expense is stock compensation expense of $11.0 million and $4.5 million for the years ended December 31, 2015 and December 31, 2014, respectively.
DD&A. The $156.3 million increase was a result of an increase in production and greater number of producing wells in 2015 compared to 2014.
59
Rice Midstream Holdings Segment
Year Ended December 31, | Year Ended December 31, | ||||||||||||||||||||||
(in thousands, except volumes) | 2016 | 2015 | Change | 2015 | 2014 | Change | |||||||||||||||||
Operating revenues: | |||||||||||||||||||||||
Gathering revenues | $ | 53,836 | $ | 26,108 | $ | 27,728 | $ | 26,108 | $ | 852 | $ | 25,256 | |||||||||||
Compression revenues | 10,098 | 1,256 | 8,842 | 1,256 | — | 1,256 | |||||||||||||||||
Total operating revenues | 63,934 | 27,364 | 36,570 | 27,364 | 852 | 26,512 | |||||||||||||||||
Operating expenses: | |||||||||||||||||||||||
Midstream operation and maintenance | 3,010 | 2,078 | 932 | 2,078 | 41 | 2,037 | |||||||||||||||||
Incentive unit expense | 2,335 | 1,180 | 1,155 | 1,180 | 6,461 | (5,281 | ) | ||||||||||||||||
Impairment of fixed assets | 20,292 | — | 20,292 | — | — | — | |||||||||||||||||
General and administrative | 18,319 | 6,551 | 11,768 | 6,551 | 3,419 | 3,132 | |||||||||||||||||
Depreciation, depletion and amortization | 5,760 | 2,786 | 2,974 | 2,786 | 205 | 2,581 | |||||||||||||||||
Acquisition costs | 484 | 1,127 | (643 | ) | 1,127 | — | 1,127 | ||||||||||||||||
Other expense | 125 | (51 | ) | 176 | (51 | ) | — | (51 | ) | ||||||||||||||
Total operating expenses | 50,325 | 13,671 | 36,654 | 13,671 | 10,126 | 3,545 | |||||||||||||||||
Operating income (loss) | $ | 13,609 | $ | 13,693 | $ | (84 | ) | $ | 13,693 | $ | (9,274 | ) | $ | 22,967 | |||||||||
Operating volumes: | |||||||||||||||||||||||
Gathering volumes (MDth/d): | 708 | 247 | 461 | 247 | 24 | 223 | |||||||||||||||||
Compression volumes (MDth/d): | 435 | 51 | 384 | 51 | — | 51 | |||||||||||||||||
Year Ended December 31, 2016 Compared to Year Ended December 31, 2015
Total operating revenues. The $36.6 million increase in total operating revenues was mainly the result of a 187% period over period increase in affiliate gathering volumes between the Exploration and Production segment and the Rice Midstream Holdings segment, as well as an increase in third-party gathering volumes, which include revenues associated with the contracts for Strike Force Midstream.
Midstream operation and maintenance. Midstream operation and maintenance expense increased $0.9 million primarily due to pipeline maintenance expenses associated with Strike Force Midstream, which began operations in February 2016.
Impairment of fixed assets. The $20.3 million impairment expense in 2016 was primarily related to pipeline assets that were decommissioned.
General and administrative expense. The $7.7 million increase in segment general and administrative expense year-over-year (before equity compensation expense) was primarily attributable to allocated costs associated with personnel to support the Rice Midstream Holdings segment. Included in general and administrative expense is stock compensation expense of $5.0 million and $1.0 million for the years ended December 31, 2016 and December 31, 2015, respectively. The increase was due to an increase in the allocation of our equity-based compensation expense to the Rice Midstream Holdings segment related to awards made under Rice Energy’s equity-based compensation plans in 2016.
DD&A. The $3.0 million increase in DD&A year-over-year was primarily the result of an increase in midstream assets placed in service in 2016 as compared to 2015 and the related depreciation on those assets. As of December 31, 2016, the Rice Midstream Holdings segment had 92 miles of gathering system pipelines, a 71% increase from December 31, 2015 primarily due to the addition of gathering system pipeline assets associated with Strike Force Midstream.
Year Ended December 31, 2015 Compared to Year Ended December 31, 2014
Total operating revenues. The $26.5 million increase in total operating revenues year-over-year was mainly the result of an increase in volumes associated with the gathering contracts between the Exploration and Production segment and Rice Midstream Holdings segment (that were not in place for substantially all of 2014).
60
Midstream operation and maintenance. Midstream operation and maintenance expense increased $2.0 million year-over-year which primarily related to contract labor and maintenance costs.
Incentive unit expense. Incentive unit expense is allocated to the Rice Midstream Holdings segment based on our estimate of the expense attributable to the Rice Midstream Holdings segment’s operations. The $5.3 million decrease in incentive unit expense year-over-year is consistent with the decrease in incentive unit expense to us.
General and administrative expense. The $3.1 million increase in segment general and administrative expense year-over-year was primarily attributable to costs associated with the addition of personnel to support growth activities and related salary and employee benefits. Included in general and administrative expense is stock compensation expense of $1.0 million and $0.2 million for the years ended December 31, 2015 and December 31, 2014, respectively.
DD&A. The $2.6 million increase in DD&A year-over-year was primarily the result of an increase in midstream assets placed in service in 2015 as compared to 2014 and the related depreciation on those assets.
Rice Midstream Partners Segment
Year Ended December 31, | Year Ended December 31, | ||||||||||||||||||||||
(in thousands, except volumes) | 2016 | 2015 | Change | 2015 | 2014 | Change | |||||||||||||||||
Operating revenues: | |||||||||||||||||||||||
Gathering revenues | $ | 116,294 | $ | 75,714 | $ | 40,580 | $ | 75,714 | $ | 6,448 | $ | 69,266 | |||||||||||
Compression revenues | 15,805 | 1,497 | 14,308 | 1,497 | — | 1,497 | |||||||||||||||||
Water services revenues | 69,524 | 37,248 | 32,276 | 37,248 | — | 37,248 | |||||||||||||||||
Total operating revenues | 201,623 | 114,459 | 87,164 | 114,459 | 6,448 | 108,011 | |||||||||||||||||
Operating expenses: | |||||||||||||||||||||||
Midstream operation and maintenance | 24,608 | 14,910 | 9,698 | 14,910 | 4,566 | 10,344 | |||||||||||||||||
Incentive unit expense | — | 1,044 | (1,044 | ) | 1,044 | 13,480 | (12,436 | ) | |||||||||||||||
General and administrative | 21,613 | 17,895 | 3,718 | 17,895 | 11,922 | 5,973 | |||||||||||||||||
Depreciation, depletion and amortization | 25,170 | 16,399 | 8,771 | 16,399 | 4,165 | 12,234 | |||||||||||||||||
Amortization of intangible assets | 1,634 | 1,632 | 2 | 1,632 | 1,156 | 476 | |||||||||||||||||
Acquisition costs | 125 | — | 125 | — | 1,519 | (1,519 | ) | ||||||||||||||||
Other expense | 1,531 | 543 | 988 | 543 | 207 | 336 | |||||||||||||||||
Total operating expenses | 74,681 | 52,423 | 22,258 | 52,423 | 37,015 | 15,408 | |||||||||||||||||
Operating income (loss) | $ | 126,942 | $ | 62,036 | $ | 64,906 | $ | 62,036 | $ | (30,567 | ) | $ | 92,603 | ||||||||||
Operating volumes: | |||||||||||||||||||||||
Gathering volumes (MDth/d): | 983 | 647 | 336 | 647 | 378 | 269 | |||||||||||||||||
Compression volumes (MDth/d): | 572 | 64 | 508 | 64 | — | 64 | |||||||||||||||||
Water services volumes (MMgal): | 1,253 | 777 | 476 | 777 | — | 777 | |||||||||||||||||
Year Ended December 31, 2016 Compared to Year Ended December 31, 2015
Total operating revenues. Operating revenues increased from $114.5 million for the year ended December 31, 2015 to $201.6 million for the year ended December 31, 2016, an increase of $87.2 million. The increase in operating revenues primarily relates to increased gathering and compression revenues associated with a 52% and 794% increase in period over period gathering and compression throughput, respectively. In addition, the increase relates to a $32.3 million increase in water services revenues due to a 61% increase in fresh water distribution volumes from 777 MMgal in 2015 to 1,253 MMgal in 2016.
Midstream operation and maintenance. Total operation and maintenance expense increased from $14.9 million for the year ended December 31, 2015 to $24.6 million for the year ended December 31, 2016, an increase of $9.7 million. The increase was primarily due to on and off pad water transfer costs and water procurement, in addition to increased expenses following the Vantage Midstream Asset Acquisition, primarily associated with water transfer costs and pipeline maintenance costs.
61
Incentive unit expense. Incentive unit expense for the year ended December 31, 2015 of $1.0 million was allocated to the Water Assets by Rice Energy prior to their acquisition. No incentive unit expense was recorded for the year ended December 31, 2016.
General and administrative expense. General and administrative expense (before equity compensation expense) increased from $13.4 million for the year ended December 31, 2015 to $18.8 million for the year ended December 31, 2016, an increase of $5.4 million, or 40%. The increase year-over-year was primarily due to an increase in allocated costs associated with personnel and administrative expenses as the Rice Midstream Partners segment continues to grow. Included in general and administrative expense is equity compensation expense of $2.9 million and $4.5 million for the years ended December 31, 2016 and December 31, 2015, respectively.
Depreciation expense. Depreciation expense increased from $16.4 million for the year ended December 31, 2015 to $25.2 million for the year ended December 31, 2016, an increase of $8.8 million. The increase year-over-year was primarily due to additional assets placed into service in 2016, including assets related to gathering, compression and water handling and treatment services. For the year ended December 31, 2016, our gathering and water pipeline miles increased 40% and 15%, respectively.
Year Ended December 31, 2015 Compared to Year Ended December 31, 2014
Total operating revenues. The $108.0 million increase in total operating revenues year-over-year was mainly the result of the gathering and water service contracts between the Exploration and Production segment and the Rice Midstream Partners segment (that were not in place for substantially all of 2014) as well as an increase in volumes associated with existing third-party gathering contracts.
Midstream operation and maintenance. Midstream operation and maintenance expense for 2015 includes $9.0 million of expense relative to our fresh water services assets and $6.0 million of expense relative to our gathering assets. The $10.4 million increase in expense year-over-year was primarily due to contract labor and maintenance costs as well additional leases and utilities on compression equipment.
Incentive unit expense. Incentive unit expense of $1.0 million for the year ended December 31, 2015 was allocated to the Water Assets prior to their acquisition by RMP. Incentive unit expense of $13.5 million for the year ended December 31, 2014 was allocated to RMP’s gathering and compression assets prior to the RMP IPO and to the Water Assets.
General and administrative expense. The $6.0 million increase in segment general and administrative expense year-over-year was primarily attributable to the addition of personnel to support growth activities and related salary and employee benefits. Included in general and administrative expense is equity compensation expense of $4.5 million and $0.8 million for the years ended December 31, 2015 and December 31, 2014, respectively.
DD&A. The $12.2 million increase in DD&A year-over-year was primarily the result of an increase in midstream assets placed in service in 2015 as compared to 2014 and the related depreciation on those assets.
Outlook
During recent years, the oil and natural gas industry experienced a significant decrease in commodity prices driven by a global supply/demand imbalance for oil and an oversupply of natural gas in the United States as a result of increased productivity and warm winters. Our revenues, operating results, cash flows from operations, capital spending and future growth rates are highly dependent on the global commodity-price markets, which affect the value we receive from sales of our natural gas. While commodity price volatility has continued into 2017, we believe the long-term outlook for our business is favorable due to our low cost structure, technological advances, financial strengths, risk management, responsible capital allocation and development strategic capital.
Natural gas prices have historically been volatile and may fluctuate widely in the future due to a variety of factors, including, but not limited to, prevailing economic conditions, supply and demand of hydrocarbons in the marketplace and geopolitical events such as wars or natural disasters. For example, the Henry Hub spot market price had rose from a low of $1.49 per MMBtu on March 4, 2016 to a high of $3.80 per MMBtu on December 7, 2016. In the future, we expect to be increasingly subject to fluctuations in oil and NGL prices. Sustained periods of low commodity prices could materially and adversely affect our financial condition, our results of operations, the quantities of natural gas that we can economically produce and our ability to access capital.
We and Rice Energy use commodity derivative instruments, such as swaps, puts and collars, to manage and reduce price volatility and other market risks associated with our natural gas production. These arrangements are structured to reduce our exposure to commodity price decreases, but they can also limit the benefit we might otherwise receive from commodity price increases. Please see “—Commodity Hedging Activities.” In addition, we have entered into long-term firm transportation
62
arrangements pursuant to which our production is shipped to markets that we expect to be less impacted by basis differentials. In recent years, the cost of new firm transportation projects has risen significantly concurrent with the increasing basis differentials experienced in the Appalachian Basin. While entering into these firm transportation arrangements provides flow assurance for our natural gas production, there can be no assurance that the net impact of entering into such arrangements, after giving effect to their costs, will result in more favorable sales prices for our production in the future than local pricing. As such, our net sales prices may be materially less than NYMEX Henry Hub prices as a result of basis differentials and/or firm transportation costs.
Our future success in growing proved reserves and production will be highly dependent on the capital resources available to us. In 2017, we plan to invest $1,890.0 million in our operations, including $585.0 million for drilling and completion in the Marcellus Shale, $450.0 million for drilling and completion in the Utica Shale, $225.0 million for leasehold acquisitions and $630.0 million for midstream infrastructure development, including $315.0 million expected to be invested by each RMP and Midstream Holdings, respectively. We expect to fund our 2017 capital expenditures with cash on hand, cash generated by operations, proceeds contributed from Rice Energy, and borrowings under our revolving credit facilities. Our 2017 capital budget may be further adjusted as business conditions warrant. The amount, timing and allocation of capital expenditures is largely discretionary and within our control. If natural gas prices decline to levels below our acceptable levels, or costs increase to levels above our acceptable levels, we could choose to defer a significant portion of our budgeted capital expenditures until later periods to achieve the desired balance between sources and uses of liquidity and prioritize capital projects that we believe will have the highest expected rates of return and potential to generate near-term cash flow. We routinely monitor and adjust our capital expenditures in response to changes in commodity prices, availability of financing, drilling and acquisition costs, industry conditions, the timing of regulatory approvals, the availability of rigs, success or lack of success in drilling activities, contractual obligations, internally generated cash flow and other factors both within and outside our control.
Our 2017 capital budget reflects a continuation of the strategy we employed in 2016. We believe that we will be able to fully fund the capital expenditures of our Exploration and Production segment with cash on hand, cash flows from operations, proceeds contributed from Rice Energy and borrowings under our Senior Secured Revolving Credit Facility. Furthermore, we believe that we will be able to fully fund the capital expenditures of our Rice Midstream Holdings and Rice Midstream Partners segments with borrowings under our revolving credit facilities, cash flows from operations and cash on hand.
We will continue to evaluate the natural gas price environments and may adjust our capital spending plans to maintain appropriate levels of liquidity and financial flexibility.
Our revenues, cash flow from operations and future growth depend substantially on factors beyond our control, such as economic, political and regulatory developments and competition from other sources of energy.
We believe that cash on hand, operating cash flows, and available borrowings under our revolving credit facilities will be sufficient to meet our current cash requirements, including normal operating needs, debt service obligations, capital expenditures, and commitments and contingencies. However, to the extent that Rice Energy considers market conditions favorable, it may access the capital markets to raise capital from time to time and may contribute such proceeds to us to fund acquisitions or future capital expenditures, pay down our Senior Secured Revolving Credit Facility and for general working capital purposes. See “—Debt Agreements” below for additional details on our outstanding borrowings and available liquidity under our various financing arrangements.
Capital Resources and Liquidity
Our primary sources of liquidity have been the proceeds from Rice Energy’s equity and debt financings and borrowings under our credit facilities. Our primary use of capital has been the acquisition and development of natural gas properties and associated midstream infrastructure. As we pursue reserve and production growth, we monitor which capital resources are available to us to meet our future financial obligations, planned capital expenditure activities and liquidity requirements. We also expect to fund a portion of these requirements with cash flow from operations as we continue to bring additional upstream and midstream production online.
Rice Energy’s and RMP’s credit ratings are subject to revision or withdrawal at any time. Rice Energy and RMP cannot ensure that a rating will remain in effect for or will not be lowered for any given period of time. If their credit ratings are downgraded, Rice Energy and RMP may be required to provide additional credit assurances in support of certain commercial agreements, such as pipeline capacity and construction contracts, the amount of which may be significant, and the potential pool of investors and funding sources may decrease. A downgrade in Rice Energy’s credit rating could impact its access to capital markets and increase the cost of borrowings, which could have an impact on our liquidity.
The table below reflects Rice Energy’s credit rating for debt instruments as of December 31, 2016.
63
Rating Service | Senior Unsecured Notes | Outlook | ||
Moody’s Investors Service (“Moody’s) | B3 | Stable | ||
Standard & Poor’s Rating Service (“S&P) | BB- | Stable | ||
Cash Flow Provided by Operating Activities
Net cash provided by operating activities was $551.5 million for the year ended December 31, 2016, compared to $535.5 million of net cash provided by operating activities for the year ended December 31, 2015. The increase in operating cash flow was primarily due to an increase in production in 2016, offset by an increase in cash operating expenses, interest expense and changes in working capital.
Net cash provided by operating activities was $535.5 million for the year ended December 31, 2015 compared to $74.3 million of net cash provided by operating activities for the year ended December 31, 2014. The increase in operating cash flow was primarily due to an increase in production in 2015 and cash receipts on settled derivatives, offset by an increase in cash operating expenses and interest expense.
Cash Flow Used in Investing Activities
During the year ended December 31, 2016 cash flows used in investing activities was $1,902.0 million, which was primarily associated with the Vantage Acquisition and the acquisition and development of our natural gas properties compared to $1,206.0 million for the year ended December 31, 2015, which primarily included capital expenditures for property and equipment.
Capital expenditures for exploration and production were $674.7 million and $858.1 million for the years ended December 31, 2016 and 2015, respectively. The decrease of $183.4 million was primarily attributable to a decrease in the acquisition and development of our natural gas properties.
Capital expenditures for the Rice Midstream Holdings segment totaled $110.9 million and $156.0 million for the years ended December 31, 2016 and 2015, respectively. The decrease of $45.1 million was due to a decrease in capital expenditures for Rice Olympus Midstream LLC’s midstream infrastructure, offset by an increase in capital expenditures for Strike Force Midstream infrastructure.
Capital expenditures for the Rice Midstream Partners segment totaled $118.1 million and $248.5 million for the years ended December 31, 2016 and 2015, respectively. The decrease of $130.4 million was attributable to a greater focus on capital expenditures for compression stations and well pad connects rather than the build out of our trunk lines.
During the year ended December 31, 2015 cash flows used in investing activities was $1,206.0 million, which primarily included capital expenditures for property and equipment compared to $1,474.0 million for the year ended December 31, 2014, which primarily related to $962.8 million of capital expenditures for property and equipment and $524.1 million related to acquisition activity.
Capital expenditures for the Exploration and Production segment were $858.1 million and $685.7 million for the years ended December 31, 2015 and 2014, respectively. The increase of $172.4 million was primarily attributable to the acquisition and development of our natural gas properties.
Capital expenditures for the Rice Midstream Holdings segment totaled $156.0 million and $107.3 million for the years ended December 31, 2015 and 2014, respectively. The increase of $48.7 million was due to the expansion of our midstream infrastructure year-over-year.
Capital expenditures for the Rice Midstream Partners segment totaled $248.5 million and $169.8 million for the years ended December 31, 2015 and 2014, respectively. The decrease of $78.7 million was due to a midstream acquisition in 2014 with no comparable acquisition in 2015.
Cash Flow Provided by Financing Activities
Net cash provided by financing activities of $1,744.4 million during the year ended December 31, 2016 was primarily associated with contributions from Rice Energy related to its September 2016 and the April 2016 equity offering, proceeds from the Midstream Holdings Investment (defined below), proceeds from the Partnership’s June 2016 offering and proceeds from the Partnership’s at-the-market common unit offering program (the “ATM program”), offset by net repayments on our revolving credit facilities, and distributions to the Partnership’s public unitholders. Net cash provided by financing activities of $669.7 million during the year ended December 31, 2015 was primarily the result of the proceeds from Rice Energy’s 2023 Notes offering, borrowings on the Midstream Holdings Revolving Credit Facility (defined below) and the RMP Revolving Credit
64
Facility (defined below), as well as proceeds from the Private Placement (defined below) offset by distributions to the RMP’s public unitholders. Net cash provided by financing activities of $1,442.4 million during the year ended December 31, 2014 was primarily the result of the proceeds from Rice Energy’s IPO, the 2022 Notes offering, the RMP IPO and the August 2014 equity offering, which was partially offset by repayments of debt.
Debt Agreements
Senior Notes
On October 19, 2016, we became co-obligor under Rice Energy’s supplemental indentures governing the 2022 Notes and 2023 Notes. In addition, on October 19, 2016, we and Rice Energy entered into a debt assumption agreement (the “Debt Assumption Agreement”) dated as of October 19, 2016, pursuant to which we agreed to be the primary obligor for purposes of any payments under the indentures governing the Notes.
As of December 31, 2016, we, as primary obligor, have $900.0 million in aggregate principal amount of 2022 Notes outstanding. The 2022 Notes will mature on May 1, 2022, and interest is payable on the 2022 Notes on each May 1 and November 1. At any time prior to May 1, 2017, we may redeem up to 35% of the 2022 Notes at a redemption price of 106.25% of the principal amount, plus accrued and unpaid interest, with the proceeds of certain equity offerings so long as the redemption occurs within 180 days of completing such equity offering and at least 65% of the aggregate principal amount of the 2022 Notes remains outstanding after such redemption. Prior to May 1, 2017, we may redeem some or all of the 2022 Notes for cash at a redemption price equal to 100% of their principal amount plus an applicable make-whole premium and accrued and unpaid interest. Upon the occurrence of a change of control, unless given notice to redeem the 2022 Notes, the holders of the 2022 Notes will have the right to require us to repurchase all or a portion of the 2022 Notes at a price equal to 101% of the aggregate principal amount of the 2022 Notes, plus any accrued and unpaid interest. On and after May 1, 2017, we may redeem some or all of the 2022 Notes at redemption prices (expressed as percentages of principal amount) equal to 104.688% for the twelve-month period beginning on May 1, 2017, 103.125% for the twelve-month period beginning May 1, 2018, 101.563% for the twelve-month period beginning on May 1, 2019 and 100.000% beginning on May 1, 2020, plus accrued and unpaid interest.
As of December 31, 2016, we, as primary obligor, have $400.0 million in aggregate principal amount of the 2023 Notes outstanding. The 2023 Notes will mature on May 1, 2023, and interest is payable on the 2023 Notes on each May 1 and November 1. At any time prior to May 1, 2018, we may redeem up to 35% of the 2023 Notes at a redemption price of 107.250% of the principal amount, plus accrued and unpaid interest, with the proceeds of certain equity offerings so long as the redemption occurs within 180 days of completing such equity offering and at least 65% of the aggregate principal amount of the 2023 Notes remains outstanding after such redemption. Prior to May 1, 2018, we may redeem some or all of the notes for cash at a redemption price equal to 100% of their principal amount plus an applicable make-whole premium and accrued and unpaid interest. Upon the occurrence of a change of control (as defined in the indenture governing the 2023 Notes), unless given notice to redeem the 2023 Notes, the holders of the 2023 Notes will have the right to require us to repurchase all or a portion of the 2023 Notes at a price equal to 101% of the aggregate principal amount of the 2023 Notes, plus any accrued and unpaid interest. On or after May 1, 2018, we may redeem some or all of the 2023 Notes at redemption prices (expressed as percentages of principal amount) equal to 105.438% for the twelve-month period beginning on May 1, 2018, 103.625% for the twelve-month period beginning May 1, 2019, 101.813% for the twelve-month period beginning on May 1, 2020 and 100.000% beginning on May 1, 2021, plus accrued and unpaid interest.
The indentures governing the Notes restrict our ability and the ability of certain of our subsidiaries to: (i) incur or guarantee additional debt or issue certain types of preferred stock; (ii) pay dividends on capital stock or redeem, repurchase or retire our capital stock or subordinated debt; (iii) make certain investments; (iv) incur liens; (v) enter into transactions with affiliates; (vi) merge or consolidate with another company; (vii) transfer and sell assets; and (viii) create unrestricted subsidiaries. These covenants are subject to a number of important exceptions and qualifications. If at any time when the Notes are rated investment grade and no default has occurred and is continuing, many of such covenants will terminate and we and our subsidiaries will cease to be subject to such covenants.
Senior Secured Revolving Credit Facility
In April 2013, Rice Energy entered into a Senior Secured Revolving Credit Facility. In April 2014, Rice Energy, as borrower, and Rice Drilling B, as predecessor borrower, amended and restated the credit agreement governing the Senior Secured Revolving Credit Facility to, among other things, assign all of the rights and obligations of Rice Drilling B LLC as borrower under the Senior Secured Revolving Credit Facility to Rice Energy.
In connection with the closing of the Vantage Acquisition on October 19, 2016, Rice Energy entered into the Fourth Amended and Restated Credit Agreement (the “A&R Credit Agreement”), effective upon the closing of the Vantage Acquisition to, among other things, (i) permit the completion of the Vantage Acquisition, (ii) extend the maturity date of the credit facility
65
from January 29, 2019 to October 19, 2021, (iii) increase the borrowing base from $875.0 million to $1.0 billion without giving effect to the oil and gas properties acquired pursuant to the Vantage Acquisition, (iv) provide for the assignment of Rice Energy’s rights and obligations as borrower under the Senior Secured Revolving Credit Facility to us, and the addition of Rice Energy as a guarantor of those obligations, (v) increase the minimum required mortgage percentage (as it applies to proved reserves) to be 85% of proved reserves, (vi) amend the restricted payments covenant to permit certain distributions by us to our members, (vii) replace the interest coverage ratio with a consolidated total leverage ratio or consolidated net leverage ratio, as applicable, to commence with the last day of the fiscal quarter ended December 31, 2016, and (viii) adjust the interest rate payable on amounts borrowed thereunder (as described below).
On December 19, 2016, we, as borrower, and Rice Energy, as predecessor borrower, entered into the First Amendment to the A&R Credit Agreement (the “First Amendment”). The lenders under the First Amendment completed an Interim Redetermination (as defined in the A&R Credit Agreement) of the borrowing base to give effect to the Pennsylvania oil and gas properties acquired in the Vantage Acquisition, and, upon the effectiveness of the First Amendment and such Interim Redetermination, our borrowing base and the elected commitment amounts of the lenders under the Senior Secured Revolving Credit Facility increased from $1.0 billion to $1.45 billion.
As of December 31, 2016, the borrowing base under the A&R Credit Agreement was $1.45 billion and the sublimit for letters of credit was $400.0 million. We had no borrowings outstanding and $240.9 million in letters of credit outstanding under the A&R Credit Agreement as of December 31, 2016, resulting in availability of $1.21 billion. The next redetermination of the borrowing base is scheduled for April 2017.
Following the effectiveness of the A&R Credit Agreement, Eurodollar loans under the Senior Secured Revolving Credit Facility bear interest at a rate per annum equal to LIBOR plus an applicable margin ranging from 225 to 325 basis points, depending on the percentage of borrowing base utilized, and base rate loans bear interest at a rate per annum equal to the greatest of (i) the agent bank’s reference rate, (ii) the federal funds effective rate plus 50 basis points and (iii) the rate for one month Eurodollar loans plus 100 basis points, plus an applicable margin ranging from 125 to 225 basis points, depending on the percentage of borrowing base utilized.
As of December 31, 2016, the Senior Secured Revolving Credit Facility was secured by liens on at least 85% of the proved oil and gas reserves of us and our subsidiaries (other than any subsidiary that is designated as an unrestricted subsidiary, including Midstream Holdings and its subsidiaries), as well as significant unproved acreage and substantially all of the personal property of us and such restricted subsidiaries, and the Senior Secured Revolving Credit Facility is guaranteed by such restricted subsidiaries.
The A&R Credit Agreement requires us to maintain certain financial ratios, which are measured at the end of each calendar quarter:
• | a consolidated current ratio, which is the ratio of consolidated current assets (including unused commitments under the A&R Credit Agreement and excluding non-cash derivative assets) to consolidated current liabilities (excluding current maturities under the A&R Agreement), of not less than 1.0 to 1.0; or (b) if no borrowings are then outstanding; and |
• | a consolidated leverage ratio, which is (a) if borrowings are outstanding under the A&R Credit Agreement on the last day of such calendar quarter, the ratio of consolidated total funded debt to EBITDAX (as such term is defined in the A&R Credit Agreement) of not more than 4.0 to 1.0; and |
• | the ratio of consolidated net funded debt to EBITDAX (as such term is defined in the A&R Credit Agreement) of not more than 4.0 to 1.0. |
We were in compliance with such covenants and ratios as of December 31, 2016.
66
Midstream Holdings Revolving Credit Facility
On December 22, 2014, Midstream Holdings entered into a revolving credit facility (the “Midstream Holdings Revolving Credit Facility”) with Wells Fargo Bank, N.A. (“Wells Fargo”), as administrative agent, and a syndicate of lenders with a maximum credit amount of $300.0 million and a sublimit for letters of credit of $25.0 million. As of December 31, 2016, Midstream Holdings had $53.0 million of borrowings outstanding and no letters of credit outstanding, resulting in availability of $247.0 million. The average daily outstanding balance of the Midstream Holdings Revolving Credit Facility was approximately $27.1 million, and interest was incurred on the facility at a weighted average annual interest rate of 5.6% during 2016. The Midstream Holdings Revolving Credit Facility is available to fund working capital requirements and capital expenditures and to purchase assets and matures on December 22, 2019.
Principal amounts borrowed are payable on the maturity date, and interest is payable quarterly for base rate loans and at the end of the applicable interest period for Eurodollar loans. Under the Midstream Holdings Revolving Credit Facility, Midstream Holdings may elect to borrow in Eurodollars or at the base rate. Eurodollar loans bear interest at a rate per annum equal to the applicable LIBOR Rate plus an applicable margin ranging from 225 to 300 basis points, depending on the leverage ratio then in effect. Base rate loans bear interest at a rate per annum equal to the greatest of (i) the agent bank’s reference rate, (ii) the federal funds effective rate plus 50 basis points and (iii) the rate for one month Eurodollar loans plus 100 basis points, plus an applicable margin ranging from 125 to 200 basis points, depending on the leverage ratio then in effect. Midstream Holdings also pays a commitment fee based on the undrawn commitment amount ranging from 37.5 to 50 basis points.
The Midstream Holdings Revolving Credit Facility is secured by mortgages and other security interests on substantially all of the properties of, and guarantees from, Midstream Holdings and its restricted subsidiaries (which do not include RMP or Rice Midstream Management LLC, a Delaware limited liability company and the general partner of RMP or Rice Energy and its subsidiaries other than Midstream Holdings).
The Midstream Holdings Revolving Credit Facility limits Midstream Holdings’ and its restricted subsidiaries’ ability to, among other things: incur or guarantee additional debt; redeem or repurchase units or make distributions under certain circumstances; make certain investments and acquisitions; incur certain liens or permit them to exist; enter into certain types of transactions with affiliates; merge or consolidate with another company; and transfer, sell or otherwise dispose of assets.
The Midstream Holdings Revolving Credit Facility will also require Midstream Holdings to maintain the following financial ratios:
• | an interest coverage ratio, which is the ratio of Midstream Holdings’ consolidated EBITDA (as defined within the Midstream Holdings Revolving Credit Facility) to our consolidated current interest expense of at least 2.50 to 1.0 at each end of each fiscal quarter; and |
• | a consolidated total leverage ratio, which is the ratio of consolidated debt to consolidated EBITDA, of not more than 4.25 to 1.0. |
The Midstream Holdings Revolving Credit Facility also contains certain financial covenants and customary events of default. If an event of default occurs and is continuing, the lenders may declare all amounts outstanding under the Midstream Holdings Revolving Credit Facility to be immediately due and payable. Midstream Holdings was in compliance with its covenants and ratios effective as of December 31, 2016.
RMP Revolving Credit Facility
On December 22, 2014, Rice Midstream OpCo entered into a revolving credit facility (the “RMP Revolving Credit Facility”) with Wells Fargo, as administrative agent, and a syndicate of lenders. The RMP Revolving Credit Facility provides for lender commitments of $450.0 million with an additional $200.0 million of commitments available under an accordion feature, subject to lender approval. The RMP Revolving Credit Facility provides for a letter of credit sublimit of $50.0 million. In connection with RMP’s completion of the Vantage Midstream Asset Acquisition, on October 19, 2016, Rice Midstream OpCo entered into a second amendment (the “Second Amendment”) to its credit agreement to, among other things, (i) permit the completion of the Vantage Midstream Asset Acquisition, (ii) increase RMP’s ability to borrow under the facility from $450.0 million to $850.0 million, without exercise of any portion of the $200.0 million accordion feature and (iii) adjust the interest rate payable on amounts borrowed thereunder (as described below).
As of December 31, 2016, Rice Midstream OpCo had $190.0 million of borrowings outstanding and no letters of credit under this facility, resulting in availability of $660.0 million. The average daily outstanding balance of the RMP Revolving Credit Facility was approximately $110.0 million and interest was incurred on the facility at a weighted average annual interest rate of 4.7% during 2016. The RMP Revolving Credit Facility is available to fund working capital requirements and capital
67
expenditures, to purchase assets, to pay distributions and repurchase units and for general partnership purposes. The RMP Revolving Credit Facility matures on December 22, 2019. RMP and its restricted subsidiaries are the guarantors of the obligations under the credit facility.
Principal amounts borrowed are payable on the maturity date, and interest is payable quarterly for base rate loans and at the end of the applicable interest period for Eurodollar loans. Under the RMP Revolving Credit Facility, Rice Midstream OpCo may elect to borrow in Eurodollars or at the base rate. Following the effectiveness of the Second Amendment, Eurodollar loans bear interest at a rate per annum equal to the applicable LIBOR Rate plus an applicable margin ranging from 200 to 300 basis points, depending on the leverage ratio then in effect, and base rate loans bear interest at a rate per annum equal to the greatest of (i) the agent bank’s reference rate, (ii) the federal funds effective rate plus 50 basis points and (iii) the rate for one month Eurodollar loans plus 100 basis points, plus an applicable margin ranging from 100 to 200 basis points, depending on the leverage ratio then in effect. Following the effectiveness of the Second Amendment, Rice Midstream OpCo also pays a commitment fee based on the undrawn commitment amount ranging from 37.5 to 50 basis points.
The RMP Revolving Credit Facility is secured by mortgages and other security interests on substantially all of RMP’s properties and guarantees from RMP and its restricted subsidiaries.
The RMP Revolving Credit Facility limits the ability of RMP and its restricted subsidiaries to, among other things: incur or guarantee additional debt; redeem or repurchase units or make distributions under certain circumstances; make certain investments and acquisitions; incur certain liens or permit them to exist; enter into certain types of transactions with affiliates; merge or consolidate with another company; and transfer, sell or otherwise dispose of assets.
The RMP Revolving Credit Facility also requires RMP to maintain the following financial ratios:
• | an interest coverage ratio, which is the ratio of RMP’s consolidated EBITDA (as defined within the revolving credit facility) to its consolidated current interest expense of at least 2.50 to 1.0 at the end of each fiscal quarter; |
• | a consolidated total leverage ratio, which is the ratio of consolidated debt to consolidated EBITDA, of not more than 4.75 to 1.0, and after electing to issue senior unsecured notes, a consolidated total leverage ratio of not more than 5.25 to 1.0, and, in each case, with certain increases in the permitted total leverage ratio following the completion of a material acquisition; and |
• | if RMP elects to issue senior unsecured notes, a consolidated senior secured leverage ratio, which is the ratio of consolidated senior secured debt to consolidated EBITDA, of not more than 3.50 to 1.0. |
The RMP Revolving Credit Facility also contains certain financial covenants and customary events of default. If an event of default occurs and is continuing, the lenders may declare all amounts outstanding under the RMP Revolving Credit Facility to be immediately due and payable. RMP was in compliance with its covenants and ratios effective as of December 31, 2016.
Midstream Holdings Investment
On February 17, 2016, Rice Energy, Midstream Holdings and GP Holdings entered into a securities purchase agreement (the “Securities Purchase Agreement”) with EIG Energy Fund XVI, L.P., EIG Energy Fund XVI-E, L.P., and EIG Holdings (RICE) Partners, LP (collectively, the “Purchasers”) pursuant to which (i) Midstream Holdings agreed to issue and sell 375,000 Series B Units (“Series B Units”) with an aggregate liquidation preference of $375.0 million and (ii) GP Holdings agreed to issue and sell common units representing an 8.25% limited partner interest in GP Holdings (“GP Common Units”) for aggregate consideration of $375.0 million in a private placement (the “Midstream Holdings Investment”) exempt from the registration requirements under the Securities Act. In conjunction with the Securities Purchase Agreement, Midstream Holdings issued 1,000 Series A Units to us. The Midstream Holdings Investment closed on February 22, 2016 (the “Closing Date”).
After September 30, 2016 and prior to the eighteen-month anniversary of the Closing Date, upon the satisfaction of certain financial and operational metrics, Midstream Holdings has the right to require the Purchasers to purchase additional Series B Units and GP Holdings common units (“GP Common Units”) on the terms set forth above. Midstream Holdings may require the Purchasers to purchase at least $25.0 million of additional units on up to three occasions, up to a total aggregate amount of $125.0 million. Pursuant to the Securities Purchase Agreement, Midstream Holdings is required to pay the Purchasers a quarterly cash commitment fee of 2.0% per annum on any undrawn amounts of the additional $125.0 million commitment. Midstream Holdings used approximately $75.0 million of the proceeds to reduce outstanding borrowings under its credit facility and to pay transaction fees and expenses, and the remaining $300.0 million was distributed to us.
Contribution from Parent
68
For the year ended December 31, 2016, we received a cash contribution from our parent of $1,457.4 million primarily associated with Rice Energy’s 2016 equity offerings. In April 2016, Rice Energy completed an equity offering of an aggregate 34,337,725 shares of common stock (the “April 2016 Equity Offering”), which included 20,000,000 shares of common stock sold by Rice Energy and 14,337,725 shares sold by NGP Holdings. After deducting underwriting discounts and commissions of $15.0 million and transaction costs, Rice Energy received net proceeds of $311.8 million. Rice Energy did not receive any proceeds from the sale of shares by NGP Holdings. In addition, Rice Energy completed an equity offering of 40,000,000 shares of common stock in September 2016 (“September 2016 Equity Offering”), and in October 2016, sold 6,000,000 shares of common stock pursuant to the exercise of the underwriters’ option providing aggregate net proceeds of approximately $1.2 billion.
June 2016 RMP Common Unit Offering
On June 13, 2016, RMP completed an underwritten public offering of an aggregate of 9,200,000 common units representing limited partner interests in RMP at a price to the public of $18.50 per unit, which included 1,200,000 common units sold pursuant to the exercise of the underwriters’ option to purchase additional units. After deducting underwriting discounts and commissions of approximately $6.0 million and transaction costs, RMP received net proceeds of approximately $164.1 million. RMP used a portion of the net proceeds to repay outstanding debt and intends to use the remainder for general partnership purposes, including the repayment of debt, acquisitions and capital expenditures.
Private Placement
On October 7, 2016, RMP issued 20,930,233 common units representing limited partner interests in RMP in a private placement for gross proceeds of approximately $450.0 million, or $21.50 per unit (the “Private Placement”). After deducting underwriting discounts and commissions of $9.4 million, RMP received net proceeds of $440.6 million. RMP primarily used the proceeds of the Private Placement to fund a portion of the Vantage Midstream Asset Acquisition. The Private Placement closed on October 7, 2016. As a result of the Private Placement, as of December 31, 2016, GP Holdings owned approximately 28% of RMP, consisting of 3,623 common units, 28,753,623 subordinated units and all of the incentive distribution rights.
Commodity Hedging Activities
Our primary market risk exposure is in the prices we receive for our natural gas production. Realized pricing is primarily driven by the spot regional market prices applicable to our U.S. natural gas production. Pricing for natural gas production has been volatile and unpredictable for several years, and we expect this volatility to continue in the future. The prices we receive for production depend on many factors outside of our control, including volatility in the differences between product prices at sales points and the applicable index price.
To mitigate the potential negative impact on our cash flow caused by changes in oil and natural gas prices, we and Rice Energy have entered into financial commodity derivative contracts in the form of swaps, zero cost collars, calls, puts and basis swaps to ensure that we receive minimum prices for a portion of our future oil and natural gas production when management believes that favorable future prices can be secured. We and Rice Energy typically hedge the NYMEX Henry Hub price for natural gas. Pursuant to our Amended Credit Agreement, we are now permitted to hedge the greater of (i) the percentage of proved reserve volumes (Column A) or (ii) the percentage of internally forecasted production (Column B).
Months next succeeding the time as of which compliance is measured | Column A | Column B | ||||
Months 1 through 18 | 85 | % | 90 | % | ||
Months 19 through 36 | 85 | % | 75 | % | ||
Months 37 through 60 | 85 | % | 50 | % | ||
Our hedging activities and those of Rice Energy are intended to support natural gas prices at targeted levels and to manage our exposure to natural gas price fluctuations. The counterparty is required to make a payment to us or Rice Energy for the difference between the floor price specified in the contract and the settlement price, which is based on market prices on the settlement date, if the settlement price is below the floor price. We or Rice Energy are required to make a payment to the counterparty for the difference between the ceiling price and the settlement price if the ceiling price is below the settlement price. These contracts may include price swaps whereby we and Rice Energy will receive a fixed price for our production and pay a variable market price to the contract counterparty and zero cost collars that set a floor and ceiling price for the hedged production. For a description of our and Rice Energy’s commodity derivative contracts, please see Notes 5 and 6 under Item 8 in the notes to the consolidated financial statements. We and Rice Energy do not designate our current portfolio of commodity derivative contracts as hedges for accounting purposes. Therefore, changes in fair value of these derivative instruments are recognized in
69
earnings. Please read “Item 7A. Quantitative and Qualitative Disclosures About Market Risk” for additional discussion of our and Rice Energy’s commodity derivative contracts.
By using derivative instruments to hedge exposures to changes in commodity prices, we and Rice Energy expose ourselves to the credit risk of our counterparties. Credit risk is the potential failure of the counterparty to perform under the terms of the derivative contract. When the fair value of a derivative contract is positive, the counterparty is expected to owe us or Rice Energy, which creates credit risk. To minimize the credit risk in derivative instruments, it is our and Rice Energy’s policy to enter into derivative contracts only with counterparties that are creditworthy financial institutions deemed by management as competent and competitive market makers. The creditworthiness of our and Rice Energy’s counterparties is subject to periodic review. We and Rice Energy have derivative instruments in place with 14 different counterparties. As of December 31, 2016, the contracts are with JP Morgan Chase Bank, N.A. (“JP Morgan”), Wells Fargo Bank, N.A. (“Wells Fargo”) and Bank of Montreal accounted for 24%, 19% and 19% of the net fair market value of our and Rice Energy’s derivative assets, respectively. Neither we, nor Rice Energy, are required to provide credit support or collateral to Wells Fargo under current contracts, nor are they required to provide credit support or collateral to us or Rice Energy. As of December 31, 2016, we did not have any past due receivables from counterparties. Certain hedge contracts entered into by Rice Energy have been pushed down to us and have been recorded as receivable or payable transactions with Rice Energy, as these contracts were entered into on our behalf.
Contractual Obligations. A summary of our contractual obligations as of December 31, 2016 is provided in the following table.
Payments due by period For the Year Ended December 31, | |||||||||||||||||||||||||||
(in thousands) | 2017 | 2018 | 2019 | 2020 | 2021 | Thereafter | Total | ||||||||||||||||||||
Senior Notes Due 2022 | $ | 56,250 | $ | 56,250 | $ | 56,250 | $ | 56,250 | $ | 56,250 | $ | 918,750 | $ | 1,200,000 | |||||||||||||
Senior Notes Due 2023 | 29,000 | 29,000 | 29,000 | 29,000 | 29,000 | 438,667 | 583,667 | ||||||||||||||||||||
Midstream Holdings Revolving Credit Facility | — | — | 53,000 | — | — | — | 53,000 | ||||||||||||||||||||
RMP Revolving Credit Facility | — | — | 190,000 | — | — | — | 190,000 | ||||||||||||||||||||
Drilling rig commitments (1) | 27,694 | 8,969 | — | — | — | — | 36,663 | ||||||||||||||||||||
Frac sand commitments | 15,150 | 15,150 | 15,432 | — | — | — | 45,732 | ||||||||||||||||||||
Gathering and firm transportation | 165,638 | 240,719 | 233,990 | 233,741 | 233,369 | 3,809,811 | 4,917,268 | ||||||||||||||||||||
Lease obligations | 22,782 | 8,549 | 617 | 71 | — | — | 32,019 | ||||||||||||||||||||
Water infrastructure | — | — | — | — | — | 29,215 | 29,215 | ||||||||||||||||||||
Asset retirement obligations (2) | 2,341 | 324 | 77 | — | 29 | 798,744 | 801,515 | ||||||||||||||||||||
Other | 6,376 | 6,126 | 5,370 | 4,009 | 3,747 | 36,252 | 61,880 | ||||||||||||||||||||
Total | $ | 325,231 | $ | 365,087 | $ | 583,736 | $ | 323,071 | $ | 322,395 | $ | 6,031,439 | $ | 7,950,959 | |||||||||||||
(1) | As of December 31, 2016, we had three horizontal drilling rigs under contract, two of which expire in 2017 and one of which expires in 2018. We also have one tophole drilling rig under contract, which expires in 2018. Any other rig performing work for us is done on a well-by-well basis and therefore can be released without penalty at the conclusion of drilling on the current well. These types of drilling obligations have not been included in the table above. The values in the table represent the gross amounts that we are committed to pay as operator. However, we will record in our consolidated financial statements our proportionate share of the amounts shown based on our working interest. |
(2) | Represents gross retirement costs with no discounting impact. |
Critical Accounting Policies and Estimates
The discussion and analysis of our financial condition and results of operations are based upon our consolidated financial statements, which have been prepared in accordance with accounting principles generally accepted in the United States. The preparation of our financial statements requires us to make estimates and assumptions that affect the reported amounts of assets, liabilities, revenues and expenses and related disclosure of contingent assets and liabilities. Certain accounting policies involve judgments and uncertainties to such an extent that there is reasonable likelihood that materially different amounts could have been reported under different conditions, or if different assumptions had been used. We evaluate our estimates and assumptions on a regular basis. We base our estimates on historical experience and various other assumptions that are believed to be reasonable under the circumstances, the results of which form the basis for making judgments about the carrying values of assets and liabilities that are not readily apparent from other sources. Actual results may differ from these estimates and assumptions used in preparation of our consolidated financial statements. See Note 1 of the notes to the
70
consolidated financial statements for an expanded discussion of our significant accounting policies and estimates made by management.
Revenue Recognition
Sales of natural gas, NGLs and oil are recognized when the products have been delivered to a custody transfer point, persuasive evidence of a sales arrangement exists, the rights and responsibility of ownership pass to the purchaser upon delivery, collection of revenue from the sale is reasonably assured, and the sales price is fixed or determinable. Natural gas is sold by us under contracts with our natural gas marketers. Pricing provisions are generally tied to the Platts Gas Daily market prices. Revenue from the gathering and compression of natural gas and water services is recognized in the month in which the service is provided.
Natural Gas Properties
We use the successful efforts method of accounting for natural gas-producing activities. Costs to acquire mineral interests in natural gas properties are capitalized as unproved properties whereas costs to drill and equip exploratory wells that result in proved reserves are capitalized as proved properties. Costs to drill exploratory wells that do not identify proved reserves as well as geological and geophysical costs and costs of carrying and retaining unproved properties are expensed. The sale of a partial interest in our proved properties is accounted as a recovery of cost, and we do not recognize gain or loss as long as the units of production amortization rate is not significantly affected. A gain or loss is recognized for the sale of all other producing properties.
Capitalized costs of unproved properties are evaluated at least annually for recoverability on a prospective basis. This evaluation includes consideration of current economic conditions, changes in development plans or business strategy, expected lease expirations and historical experience. If it is determined that it is unlikely for an unproved property to yield proved reserves prior to lease expiration, an impairment of the respective unproved property is recognized in the period in which that determination is made. For the year ended December 31, 2016, we recognized $20.9 million of impairment expense in the consolidated statement of operations related to lease expirations on non-core assets. In addition, for the year ended December 31, 2016, we recognized $13.5 million of leasehold write-offs included in exploration expense in the consolidated statement of operations. For the year ended December 31, 2015, we recognized $7.3 million of impairment expense in the consolidated statement of operations, primarily the result of changes in our development plans and lease expirations. Upon the sale of an entire interest in an unproved property for cash, a gain or loss on the sale is recognized, taking into consideration the amount of any recorded impairment if the property had been assessed individually. If a partial interest in an unproved property is sold, the amount received is treated as a reduction of the cost of the interest retained unless the proceeds received are in excess of the cost basis which would result in gain on sale.
Management’s estimates of proved reserves are based on quantities of natural gas that engineering and geological analysis demonstrates, with reasonable certainty, to be recoverable from established reservoirs in the future under current operating and economic conditions. External engineers prepare the annual reserve and economic evaluation of all properties on a well-by-well basis. Additionally, we adjust natural gas reserves for major well rework or abandonment during the year as needed. The process of estimating and evaluating natural gas reserves is complex, requiring significant decisions in the evaluation of available geological, geophysical, engineering, and economic data. The data for a given property may also change substantially over time as a result of numerous factors, including additional development activity, evolving production history and a continual reassessment of the viability of production under changing economic conditions. As a result, revisions in existing reserve estimates occur from time to time. Although every reasonable effort is made to ensure that reserve estimates represent our most accurate assessments possible, the subjective decisions and variances in available data for various properties increase the likelihood of significant changes in these estimates over time. Because estimates of reserves significantly affect our DD&A expense, a change in our estimated reserves could have a material effect on our net income or loss.
The carrying values of our proved properties are reviewed periodically when events or circumstances indicate that the remaining carrying amount may not be recoverable. This evaluation is performed at the lowest levels for which there are identifiable cash flows that are largely independent of other groups of assets by comparing estimated undiscounted cash flows to the carrying value and including risk-adjusted probable and possible reserves, if deemed reasonable. Key assumptions utilized in determining the estimated undiscounted future cash flows include future development plans, estimated production from reserves, future natural gas market prices adjusted for firm transportation and basis differentials, and future operating and capital costs. If the carrying value of proved properties exceeds the estimated undiscounted future cash flows, they are written down to fair value. Fair value of proved properties is estimated by discounting the estimated future cash flows using discount rates and consideration of expected assumptions that would be used by a market participant. During 2016, we performed a recoverability test on its proved properties. No impairment was recorded as a result of the recoverability test. Due to the significant decline in commodity prices in 2015, there were indications that the carrying values of certain proved properties
71
may not be fully recoverable when compared to their fair value. We determined that the carrying value of Upper Devonian proved properties was not fully recoverable utilizing a discount rate of 12%. As a result, we recognized $10.9 million of impairment expense in the consolidated statement of operations to write-down such proved properties to fair value of $7.3 million. The estimated undiscounted future cash flows of Marcellus and Utica proved properties, which significantly exceeded their carrying values and were not sensitive to significant assumptions. However, actual future results could differ from our current estimates and assumptions as future natural gas market prices are often volatile and other significant assumptions are highly judgmental and difficult to predict. Due to this uncertainty, we are unable to predict if impairment charges will be recognized in any future period.
Subsequent to December 31, 2016, we identified negative trends in WAHA basis differentials which will likely trigger a recoverability assessment in the first quarter of 2017, as such negative trends are expected to have a material impact on future revenues related to our Barnett Shale production in Texas. The results of a subsequent recoverability assessment could result in a material write-down of the carrying value of the Barnett Shale proved properties, which had a carrying value of approximately $298.1 million at December 31, 2016.
Depletion
Capitalized amounts attributable to proved oil and gas properties are depleted by the unit-of-production method over proved reserves. Depletion of the costs of wells and related equipment and facilities, including capitalized asset retirement costs, is computed using proved developed reserves. The reserve base used to calculate DD&A for leasehold acquisition costs and the cost to acquire proved properties is the sum of proved developed reserves and proved undeveloped reserves.
Midstream Properties
Our other properties primarily consist of gathering and water pipelines and impoundment facilities and is stated at the lower of historical cost less accumulated depreciation, or fair value, if impaired. We capitalize construction-related direct labor and material costs. Maintenance and repair costs are expensed as incurred.
Depreciation is computed over the asset’s estimated useful life using the straight-line method, based on estimated useful lives and salvage values of assets. Gathering pipelines and compressor stations are depreciated over a useful life of 60 years and water assets are depreciated over a useful life of 10 to 15 years. Uncertainties that may impact these estimates include, among others, changes in laws and regulations relating to environmental matters, including air and water quality, restoration and abandonment requirements, economic conditions and supply and demand in the area. When assets are placed into service, management makes estimates with respect to useful lives and salvage values that management believes are reasonable. However, subsequent events could cause a change in estimates, thereby impacting future depreciation amounts.
The carrying value of long-lived assets other than proved and unproved oil and gas properties are reviewed by us whenever events or changes in circumstances indicate that a potential impairment has occurred if projected future undiscounted cash flows are less than the carrying value of the assets. The estimate of cash flows includes management’s assumptions of cash inflows and outflows directly resulting from the use of those assets in operations. When a potential impairment has occurred, an impairment write-down is recorded if the carrying value of the long-lived asset exceeds its fair value. Such valuations include estimations of fair values and incremental direct costs to transact a sale. If we commit to a plan to dispose of a long-lived asset before the end of its previously estimated useful life, estimated cash flows are revised accordingly and we may be required to record an asset impairment write-down. During 2016, the Rice Midstream Holdings segment decommissioned and recorded impairment related to pipeline assets of $20.3 million.
Derivative Financial Instruments
We and Rice Energy enter into derivative transactions in order to manage our exposure to gas price volatility, including commodity swap agreements, basis swap agreements, collar agreements and other similar agreements relating to the price risk associated with a portion of our production. To the extent legal right of offset with a counterparty exists, we report derivative assets and liabilities on a net basis. We have exposure to credit risk to the extent the counterparty is unable to satisfy its settlement obligation, however, we actively monitor the creditworthiness of counterparties and assess the impact, if any, on our derivative position. We record derivative instruments on the consolidated balance sheets as either an asset or a liability measured at fair value and records changes in the fair value of derivatives in the consolidated statements of operations as they occur.
72
Asset Retirement Obligations
We record the fair value of a legal liability for an asset retirement obligation in the period in which it is incurred. For gas properties, this is the period in which a gas well is acquired or drilled. Our retirement obligations relate to the abandonment of gas-producing facilities and include costs to reclaim drilling sites and dismantle and relocate or dispose of water services assets, wells, and related structures. Estimates are based on historical experience in plugging and abandoning wells and estimated remaining lives of those wells based on reserve estimates.
When a new liability is recorded, we capitalize the costs of the liability by increasing the carrying amount of the related long-lived asset. To the extent future revisions to assumptions impact the present value of the existing asset retirement obligation a corresponding adjustment is made to the natural gas and oil property balance. For example, as we analyze actual plugging and abandonment information, we may revise our estimate of current costs, the assumed annual inflation of the costs and/or the assumed productive lives of our wells. The liability is accreted to its present value each period and the capitalized cost is depreciated over the units of production basis.
Goodwill
Goodwill is the cost of an acquisition less the fair value of the identifiable net assets of the acquired business. We evaluate goodwill for impairment at least annually during the fourth quarter, or whenever events or changes in circumstances indicate it is more likely than not that the fair value of a reporting unit is less than its carrying amount. A reporting unit is an operating segment or a component of an operating segment for which discrete financial information is available and reviewed by management on a regular basis. In 2014, $39.1 million of goodwill was allocated to the Rice Midstream Partners segment as a result of the acquisition of the remaining 50% interest in Alpha Natural Resources, Inc. in its Marcellus joint venture. In 2016, as a result of the Vantage Acquisition, $384.5 million and $455.4 million of goodwill was allocated to the Exploration and Production segment and the Rice Midstream Partners segment, respectively.
We may first consider qualitative factors to assess whether there are indicators that it is more likely than not that the fair value of a reporting unit may not exceed its carrying amount. To the extent that such indicators exist, we would complete the two-step goodwill impairment test. We may also perform the two-step goodwill impairment test at our discretion without performing the qualitative assessment. The first step compares the fair value of a reporting unit to its carrying value. If the carrying amount of a reporting unit exceeds its fair value, the second step is required which compares the implied fair value of the goodwill of a reporting unit to its carrying value. If the carrying value of the goodwill of a reporting unit exceeds its implied fair value, the difference is recognized as an impairment charge. We use a combination of an income and market approach to estimate the fair value of a reporting unit. The fair value estimation process requires considerable judgment and determining the fair value is sensitive to changes in assumptions impacting management’s estimates of future financial results. Although we believe the estimates and assumptions used in estimating the fair value are reasonable and appropriate, different assumptions and estimates could materially impact the calculated fair value. Additionally, future results could differ from our current estimates and assumptions.
Our fourth quarter 2016 annual test included the assessment of factors to determine whether it was more likely than not that the fair value of each reporting unit is less than its carrying value. The qualitative assessment encompassed a review of events and circumstances specific to the reporting units with goodwill as well as circumstances specific to the entity as a whole. Our qualitative assessment considered, among other things, factors such as macroeconomic conditions, industry and market considerations, including changes in Rice Energy’s stock price and market multiples, projected financial performance, cost factors, changes in carrying values and other relevant factors. In considering the totality of the qualitative factors assessed, based on the weight of evidence, circumstances did not exist that would indicate it was more likely than not that goodwill was impaired. Accordingly, we did not perform a two-step quantitative analysis and, accordingly, no impairment was recorded.
For the year ended December 31, 2015, we elected the option to default immediately to the first step of the annual goodwill impairment test. The results of the first step indicated that the carrying value of the Exploration and Production reporting unit exceeded its fair value. Due to the result of step one of the annual goodwill impairment test for the Exploration and Production reporting unit, we performed the second step of the goodwill impairment analysis comparing the implied fair value of the reporting unit’s goodwill to its carrying amount and determined that such goodwill was fully impaired. As a result, we recorded an impairment charge of $294.9 million to eliminate the carrying value of goodwill of the Exploration and Production reporting unit at December 31, 2015. Management considered the negative industry and market trends, including the decline in commodity prices and overall market performance of our peers and us, to be the primary reasons of impairment.
No impairment was recorded for the year ended December 31, 2014.
Income Taxes
73
Prior to our change in tax status to a partnership on October 19, 2016, our income was included as part of Rice Energy’s consolidated federal tax return and we were taxed as a corporation under the Internal Revenue Code, subject to federal income tax at a statutory rate of 35% of pretax earnings. During the period of time we were taxed as a corporation we accumulated approximately $272.0 million in net deferred tax liabilities. We did not report any income tax benefit or expense for periods subsequent to October 19, 2016 because, as a partnership, we are not subject to federal income tax. In addition, we wrote off our entire net deferred tax liabilities balance, including those designated as payables to parent, by recording a deferred tax benefit of approximately $272.0 million.
In addition, we have not reported any income tax benefit or expense for periods prior to the consummation of Rice Energy’s IPO in January 2014 because Rice Drilling B, Rice Energy’s accounting predecessor, is a limited liability company that was not and currently is not subject to federal income tax. The reorganization of our business into a corporation in connection with the closing of Rice Energy’s IPO required the recognition of a deferred tax asset or liability for the initial temporary differences at the time of Rice Energy’s IPO. The resulting deferred tax liability of approximately $162.3 million was recorded in capital at the date of the completion of Rice Energy’s IPO, as it represents a transaction among shareholders.
During the period from January 29, 2014 through October 19, 2016, the following tax accounting policies and estimates were applied:
We followed ASC 740-10-25, which requires the use of a two-step approach for recognizing and measuring tax benefits taken or expected to be taken in a tax return and disclosures regarding uncertainties in income tax positions. Only tax positions that meet the more likely than not recognition threshold are recognized. We did not have any uncertain tax positions as of December 31, 2016.
Income taxes were accounted for under the asset and liability method, which requires recognition of deferred tax assets and liabilities for the expected future tax consequences of events that have been included in the financial statements. Under this method, deferred tax assets and liabilities are determined based on the differences between the financial statements and tax basis of assets and liabilities using enacted tax rates in effect for the year in which differences are expected to be recovered or settled pursuant to the provisions of ASC 740-Income Taxes. The effect of a change in tax rates on deferred tax assets and liabilities is recognized in income in the period that includes the enactment date.
We will record a valuation allowance if it is deemed more likely than not that all or a portion of its deferred income tax assets will not be realized. In addition, income tax rules and regulations are subject to interpretation and the application of those rules and regulations require judgment by us and may be challenged by the taxation authorities.
Business Combinations
Accounting for the acquisition of a business requires the identifiable assets and liabilities to be recorded at fair value. The purchase price is allocated to assets acquired and liabilities assumed based on their estimated fair values at the time of acquisition. Fair value is the price that would be received to sell an asset or would be paid to transfer a liability in an orderly transaction between market participants at the measurement date. The fair value measurement is based on the assumptions of market participants and not those of the reporting entity. Therefore, entity-specific intentions do not impact the measurement of fair value.
The most significant assumptions involve the estimated fair values of the oil and gas properties acquired. The fair value of proved natural gas properties is determined using a risk-adjusted after-tax discounted cash flow analysis based upon significant inputs from our engineers and outside consultants. Critical assumptions and estimates include gas prices; projections of estimated quantities of natural gas reserves; projections of future rates of production; timing and amount of future development and operating costs; projected reserve recovery factors; and weighted average cost of capital. We estimate future prices to apply to the estimated reserve quantities acquired, and estimate future operating and development costs, to arrive at estimates of future net revenues. For estimated proved reserves, the future net revenues are then discounted using a rate determined appropriate at the time of the business combination based upon our cost of capital.
Unproved properties generally represent the value of probable and possible reserves related to undeveloped acreage. We utilize the guideline transaction method to estimate the fair value of unproved properties acquired in a business combination.
The current year Vantage Acquisition included substantial midstream activities. We allocate purchase prices to tangible long-lived midstream assets based upon the calculated fair value of midstream facilities and equipment, generally consisting of pipeline systems and compression stations. We estimate the fair value of these assets using the replacement cost approach which include certain assumptions including the replacement costs for similar assets.
74
The excess purchase price over the fair values of the net identifiable assets acquired is recorded as goodwill. Please see “Note 3—Acquisitions” in the notes of the consolidated financial statements under Item 8 of this Annual Report for further information regarding our current year acquisition of Vantage and certain assets from Murray Energy.
New Accounting Pronouncements
Please see “Item 8. Financial Statements—Notes to Consolidated Financial Statements—20. New Accounting Pronouncements” for further detail regarding new accounting pronouncements.
Off-Balance Sheet Arrangements
As of December 31, 2016, we did not have any off-balance sheet arrangements as defined by the SEC. In the ordinary course of business, we enter into various commitment agreements and other contractual obligations, some of which are not recognized in our consolidated financial statements in accordance with GAAP. See “Note 9—Commitments and Contingencies” in the notes of the consolidated financial statements under Item 8 of this Annual Report for a description of our commitments and contingencies.
75
Item 7A. Quantitative and Qualitative Disclosures about Market Risk
The primary objective of the following information is to provide forward-looking quantitative and qualitative information about our potential exposure to market risk. The term “market risk” refers to the risk of loss arising from adverse changes in oil and natural gas prices and interest rates. The disclosures are not meant to be precise indicators of expected future losses, but rather indicators of reasonably possible losses. This forward-looking information provides indicators of how we view and manage our ongoing market risk exposures. All of our market risk sensitive instruments were entered into for hedging purposes, rather than for speculative trading.
Commodity price risk and hedges
Our primary market risk exposure is in the price we receive for our natural gas production. Realized pricing is primarily driven by market prices applicable to our U.S. natural gas production. Pricing for natural gas production has been volatile and unpredictable for several years, and we expect this volatility to continue in the future. The prices we receive for production depend on many factors outside of our control, including volatility in the differences between product prices at sales points and the applicable index price.
To mitigate some of the potential negative impact on our cash flow caused by changes in commodity prices, we and Rice Energy enter into financial commodity swap contracts to receive fixed prices for a portion of our natural gas production to mitigate the potential negative impact on our cash flow.
Rice Energy and our financial hedging activities are intended to support natural gas prices at targeted levels and to manage our exposure to natural gas price fluctuations. The counterparty is required to make a payment to either us or Rice Energy for the difference between the fixed price and the settlement price if the settlement price is below the fixed price. We or Rice Energy are required to make a payment to the counterparty for the difference between the fixed price and the settlement price if the fixed price is below the settlement price. These contracts may include financial price swaps whereby we will receive a fixed price for our production and pay a variable market price to the contract counterparty, cashless price collars that set a floor and ceiling price for the hedged production, or basis differential swaps. If the applicable monthly price indices are outside of the ranges set by the floor and ceiling prices in the various collars, we and the counterparty to the collars would be required to settle the difference. Certain hedge contracts entered into by Rice Energy on our behalf have been pushed down and are included as receivable or payable transactions with Rice Energy.
As of December 31, 2016, we and Rice Energy have entered into derivative instruments with various financial institutions, fixing the price we receive for a portion of our natural gas through December 31, 2021. Our commodity hedge position as of December 31, 2016 is summarized in Note 5 to our consolidated financial statements included elsewhere in the Annual Report. Our financial hedging activities are intended to support natural gas prices at targeted levels and to manage our exposure to price fluctuations.
By removing price volatility from a portion of our expected natural gas production through December 2017, we have mitigated, but not eliminated, the potential effects of changing prices on our operating cash flow for those periods. While mitigating negative effects of falling commodity prices, these derivative contracts also limit the benefits we would receive from increases in commodity prices above the hedge prices.
Interest rate risks
Our primary interest rate risk exposure results from our credit facilities.
As of December 31, 2016, we had no borrowings and approximately $240.9 million in letters of credit outstanding under our Senior Secured Revolving Credit Facility. As of December 31, 2016, we had availability under the borrowing base of our Senior Secured Revolving Credit Facility of approximately $1.21 billion and the borrowing base was $1.45 billion. We have a choice of borrowing in Eurodollars or at the base rate. Under the A&R Credit Agreement, Eurodollar loans bear interest at a rate per annum equal to LIBOR plus an applicable margin ranging from 225 to 325 basis points, depending on the percentage of our borrowing base utilized. Base rate loans bear interest at a rate per annum equal to the greatest of (i) the agent bank’s reference rate, (ii) the federal funds effective rate plus 50 basis points and (iii) the rate for one month Eurodollar loans plus 100 basis points, plus an applicable margin ranging from 125 to 225 basis points, depending on the percentage of our borrowing base utilized.
As of December 31, 2016, Midstream Holdings had $53.0 million in borrowings outstanding and no letters of credit under the Midstream Holdings Revolving Credit Facility. Midstream Holdings may elect to borrow in Eurodollars or at the base rate. Eurodollar loans bear interest at a rate per annum equal to the applicable LIBOR Rate plus an applicable margin ranging from 225 to 300 basis points, depending on the leverage ratio then in effect. Base rate loans bear interest at a rate per annum equal to the greatest of (i) the agent bank’s reference rate, (ii) the federal funds effective rate plus 50 basis points and (iii) the rate for one
76
month Eurodollar loans plus 100 basis points, plus an applicable margin ranging from 125 to 200 basis points, depending on the leverage ratio then in effect.
The average annual weighted interest rate incurred on the Midstream Holdings Revolving Credit Facility during 2016 was approximately 5.6%. A 1.0% increase in the applicable average interest rates for 2016 would have resulted in an estimated $0.3 million increase in interest expense.
As of December 31, 2016, Rice Midstream OpCo had $190.0 million borrowings outstanding and no letters of credit under the RMP Revolving Credit Facility. Rice Midstream OpCo has a choice of borrowing in Eurodollars or at the base rate. Following the effectiveness of the Second Amendment, Eurodollar loans will bear interest at a rate per annum equal to the applicable LIBOR Rate plus an applicable margin ranging from 200 to 300 basis points, depending on the leverage ratio then in effect. Base rate loans bear interest at a rate per annum equal to the greatest of (i) the agent bank’s reference rate, (ii) the federal funds effective rate plus 50 basis points and (iii) the rate for one month Eurodollar loans plus 100 basis points, plus an applicable margin ranging from 100 to 200 basis points, depending on the leverage ratio then in effect.
The average annual weighted interest rate incurred on the RMP Revolving Credit Facility during 2016 was approximately 4.7%. A 1.0% increase in the applicable average interest rates for 2016 would have resulted in an estimated $1.1 million increase in interest expense.
As of December 31, 2016, we did not have any derivatives in place to mitigate the effects of interest rate risk. We may implement an interest rate hedging strategy in the future.
Counterparty and customer credit risk
Our principal exposures to credit risk are through joint interest receivables ($53.6 million in receivables as of December 31, 2016) and the sale of our natural gas production ($145.9 million in receivables as of December 31, 2016), which we market to multiple natural gas marketing companies. Joint interest receivables arise from billing entities who own partial interest in the wells we operate. These entities participate in our wells primarily based on their ownership in leases on which we wish to drill. We have minimal ability to choose who participates in our wells. We are also subject to credit risk with two natural gas marketing companies that hold a significant portion of our natural gas receivables. We do not require our customers to post collateral. The inability or failure of our significant customers to meet their obligations to us or their insolvency or liquidation may adversely affect our financial results.
By using derivative instruments to hedge exposures to changes in commodity prices, we and Rice Energy expose ourselves to the credit risk of our counterparties. Credit risk is the potential failure of the counterparty to perform under the terms of the derivative contract. When the fair value of a derivative contract is positive, the counterparty is expected to owe us or Rice Energy, which creates credit risk. To minimize the credit risk in derivative instruments, it is our and Rice Energy’s policy to enter into derivative contracts only with counterparties that are creditworthy financial institutions deemed by management as competent and competitive market makers. The creditworthiness of our and Rice Energy’s counterparties is subject to review annually, or on an as-needed basis. We and Rice Energy have derivative instruments in place with 14 different counterparties. As of December 31, 2016, contracts with JP Morgan, Wells Fargo and Bank of Montreal accounted for 24%, 19% and 19% of the net fair market value of our and Rice Energy’s derivative assets, respectively. We and Rice Energy believe these counterparties are acceptable credit risks. We and Rice Energy are not required to post letters of credit as collateral to JP Morgan, Wells Fargo and Bank of Montreal under current contracts, nor are they required to provide credit support or collateral to us and Rice Energy. As of December 31, 2016 we did not have any past due receivables from counterparties.
77
Item 8. Financial Statements and Supplementary Data
Page | |
Rice Energy Operating LLC | |
78
Report of Independent Registered Public Accounting Firm
The Sole Manager and Unitholders of
Rice Energy Operating LLC
We have audited the accompanying consolidated balance sheets of Rice Energy Operating LLC as of December 31, 2016 and 2015, and the related consolidated statements of operations, cash flows and unitholders’ capital for each of the three years in the period ended December 31, 2016. These financial statements are the responsibility of the Company’s management. Our responsibility is to express an opinion on these financial statements based on our audits.
We conducted our audits in accordance with the standards of the Public Company Accounting Oversight Board (United States). Those standards require that we plan and perform the audit to obtain reasonable assurance about whether the financial statements are free of material misstatement. We were not engaged to perform an audit of the Company’s internal control over financial reporting. Our audits included consideration of internal control over financial reporting as a basis for designing audit procedures that are appropriate in the circumstances, but not for the purpose of expressing an opinion on the effectiveness of the Company’s internal control over financial reporting. Accordingly, we express no such opinion. An audit also includes examining, on a test basis, evidence supporting the amounts and disclosures in the financial statements, assessing the accounting principles used and significant estimates made by management, and evaluating the overall financial statement presentation. We believe that our audits provide a reasonable basis for our opinion.
In our opinion, the financial statements referred to above present fairly, in all material respects, the consolidated financial position of Rice Energy Operating LLC at December 31, 2016 and 2015, and the consolidated results of its operations and its cash flows for each of the three years in the period ended December 31, 2016, in conformity with U.S. generally accepted accounting principles.
/s/ Ernst & Young LLP
Pittsburgh, Pennsylvania
March 31, 2017
79
Rice Energy Operating LLC
Consolidated Balance Sheets
December 31, | |||||||
(in thousands) | 2016 | 2015 | |||||
Assets | |||||||
Current assets: | |||||||
Cash | $ | 467,287 | $ | 73,428 | |||
Accounts receivable | 218,590 | 154,667 | |||||
Current receivable from parent | — | 5,040 | |||||
Prepaid expenses, deposits and other | 2,407 | 1,112 | |||||
Derivative instruments | — | 139,698 | |||||
Total current assets | 688,284 | 373,945 | |||||
Gas collateral account | 5,332 | 4,077 | |||||
Property, plant and equipment, net | 6,092,289 | 3,225,660 | |||||
Deferred financing costs, net | 36,384 | 4,915 | |||||
Goodwill | 879,011 | 39,142 | |||||
Intangible assets, net | 44,525 | 46,159 | |||||
Other non-current assets | 475 | 49 | |||||
Derivative instruments | 11,435 | 75,974 | |||||
Long-term receivable from parent | 18,847 | — | |||||
Total assets | $ | 7,776,582 | $ | 3,769,921 | |||
Liabilities and stockholders’ equity | |||||||
Current liabilities: | |||||||
Accounts payable | $ | 17,319 | $ | 79,375 | |||
Royalties payable | 87,098 | 40,572 | |||||
Current payable to parent | 94,546 | — | |||||
Accrued capital expenditures | 124,700 | 79,747 | |||||
Leasehold payable | 22,869 | 17,338 | |||||
Derivative instruments | 67,345 | 367 | |||||
Other accrued liabilities | 86,382 | 42,268 | |||||
Total current liabilities | 500,259 | 259,667 | |||||
Long-term liabilities: | |||||||
Long-term debt | 1,522,481 | 160,000 | |||||
Leasehold payable | 9,237 | 6,289 | |||||
Deferred tax liabilities | — | 247,921 | |||||
Long-term payable to parent | — | 1,282,333 | |||||
Derivative instruments | 17,430 | — | |||||
Other long-term liabilities | 72,489 | 10,790 | |||||
Total liabilities | 2,121,896 | 1,967,000 | |||||
Mezzanine equity: | |||||||
Redeemable noncontrolling interest, net (Note 10) | 382,525 | — | |||||
Unitholders’ capital: | |||||||
Rice Energy Inc. unitholders’ capital | 2,615,017 | 1,178,350 | |||||
Vantage Sellers unitholders’ capital | 1,342,690 | — | |||||
Unitholders’ capital before noncontrolling interest | 3,957,707 | 1,178,350 | |||||
Noncontrolling interests in consolidated subsidiaries | 1,314,454 | 624,571 | |||||
Total liabilities and unitholders’ capital | $ | 7,776,582 | $ | 3,769,921 | |||
The accompanying notes are an integral part of these Consolidated Financial Statements.
80
Rice Energy Operating LLC
Consolidated Statements of Operations
Years Ended December 31, | ||||||||||||
(in thousands, except share data) | 2016 | 2015 | 2014 | |||||||||
Operating revenues: | ||||||||||||
Natural gas, oil and natural gas liquids (NGL) sales | $ | 653,441 | $ | 446,515 | $ | 359,201 | ||||||
Gathering, compression and water services | 101,057 | 49,179 | 5,504 | |||||||||
Other revenue | 24,408 | 6,447 | 26,237 | |||||||||
Total operating revenues | 778,906 | 502,141 | 390,942 | |||||||||
Operating expenses: | ||||||||||||
Lease operating | 50,574 | 44,356 | 24,971 | |||||||||
Gathering, compression and transportation | 123,852 | 84,707 | 35,618 | |||||||||
Production taxes and impact fees | 13,866 | 7,609 | 4,647 | |||||||||
Exploration | 15,159 | 3,137 | 4,018 | |||||||||
Midstream operation and maintenance | 23,215 | 16,988 | 4,607 | |||||||||
Incentive unit expense | 51,761 | 36,097 | 105,961 | |||||||||
Impairment of gas properties | 20,853 | 18,250 | — | |||||||||
Impairment of goodwill | — | 294,908 | — | |||||||||
Impairment of fixed assets | 23,057 | — | — | |||||||||
General and administrative | 118,093 | 103,038 | 61,570 | |||||||||
Depreciation, depletion and amortization | 368,455 | 322,784 | 156,270 | |||||||||
Acquisition expense | 6,109 | 1,235 | 2,339 | |||||||||
Amortization of intangible assets | 1,634 | 1,632 | 1,156 | |||||||||
Other expense | 27,308 | 5,567 | 207 | |||||||||
Total operating expenses | 843,936 | 940,308 | 401,364 | |||||||||
Operating loss | (65,030 | ) | (438,167 | ) | (10,422 | ) | ||||||
Interest expense | (99,627 | ) | (87,446 | ) | (50,191 | ) | ||||||
Gain on purchase of Marcellus joint venture | — | — | 203,579 | |||||||||
Other income | 1,406 | 1,108 | 893 | |||||||||
(Loss) gain on derivative instruments | (220,236 | ) | 273,748 | 186,477 | ||||||||
Amortization of deferred financing costs | (7,545 | ) | (5,124 | ) | (2,495 | ) | ||||||
Loss on extinguishment of debt | — | — | (7,654 | ) | ||||||||
Write-off of deferred financing costs | — | — | (6,896 | ) | ||||||||
Equity in loss of joint ventures | — | — | (2,656 | ) | ||||||||
(Loss) income before income taxes | (391,032 | ) | (255,881 | ) | 310,635 | |||||||
Income tax benefit (expense) | 240,814 | (12,118 | ) | (91,600 | ) | |||||||
Net (loss) income | (150,218 | ) | (267,999 | ) | 219,035 | |||||||
Less: Net income attributable to noncontrolling interests | (75,415 | ) | (23,337 | ) | (581 | ) | ||||||
Net (loss) income attributable to Rice Energy Operating | (225,633 | ) | (291,336 | ) | 218,454 | |||||||
Less: Preferred dividends and accretion of redeemable noncontrolling interests | (28,450 | ) | — | — | ||||||||
Net (loss) income attributable to Rice Energy Operating common unitholders | $ | (254,083 | ) | $ | (291,336 | ) | $ | 218,454 | ||||
The accompanying notes are an integral part of these Consolidated Financial Statements.
81
Rice Energy Operating LLC
Consolidated Statements of Cash Flows
Years Ended December 31, | |||||||||||
(in thousands) | 2016 | 2015 | 2014 | ||||||||
Cash flows from operating activities: | |||||||||||
Net (loss) income | $ | (150,218 | ) | $ | (267,999 | ) | $ | 219,035 | |||
Adjustments to reconcile net income (loss) to net cash provided by operating activities: | |||||||||||
Depreciation, depletion and amortization | 368,455 | 322,784 | 156,270 | ||||||||
Impairment of gas properties | 20,853 | 18,250 | — | ||||||||
Impairment of goodwill | — | 294,908 | — | ||||||||
Impairment of fixed assets | 23,057 | — | — | ||||||||
Amortization of deferred finance costs and loss on extinguishment of debt | 7,545 | 5,124 | 10,149 | ||||||||
Amortization of intangibles | 1,634 | 1,632 | 1,156 | ||||||||
Exploration | 15,159 | 3,137 | 2,211 | ||||||||
Incentive unit expense | 51,761 | 36,097 | 105,961 | ||||||||
Write-off of deferred financing costs | — | — | 6,896 | ||||||||
Gain from sale of interest in gas properties | — | (953 | ) | — | |||||||
Stock compensation expense | 21,915 | 16,528 | 5,553 | ||||||||
Derivative instruments fair value loss (gain) | 220,236 | (273,748 | ) | (186,477 | ) | ||||||
Cash receipts (payments) for settled derivatives | 202,178 | 193,908 | (18,784 | ) | |||||||
Deferred income tax (benefit) expense | (247,921 | ) | 6,860 | 64,791 | |||||||
Impact of tax status change | (24,067 | ) | 1,219 | 22,848 | |||||||
Fair value gain on purchase of Marcellus joint venture | — | — | (203,579 | ) | |||||||
Equity in loss of joint ventures | — | — | 2,656 | ||||||||
Changes in operating assets and liabilities: | |||||||||||
Accounts receivable and receivable from affiliate | (44,272 | ) | 70,655 | (151,009 | ) | ||||||
Receivable from parent | (5,180 | ) | — | 1,990 | |||||||
Prepaid expenses and other assets | (3,155 | ) | 316 | (700 | ) | ||||||
Accounts payable and payable to affiliate | (49,546 | ) | (3,175 | ) | (14,570 | ) | |||||
Accrued liabilities and other | 110,406 | 106,550 | 39,703 | ||||||||
Payable to parent | (211 | ) | — | (9,714 | ) | ||||||
Royalties payable | 32,896 | 3,401 | 19,871 | ||||||||
Net cash provided by operating activities | 551,525 | 535,494 | 74,257 | ||||||||
Cash flows from investing activities: | |||||||||||
Capital expenditures for property and equipment | (864,983 | ) | (1,235,279 | ) | (962,807 | ) | |||||
Acquisition of Vantage Energy, net of cash acquired | (981,080 | ) | — | — | |||||||
Acquisition of Murray Assets | (44,266 | ) | — | — | |||||||
Other acquisitions | (11,700 | ) | 19,054 | (524,082 | ) | ||||||
Proceeds from sale of interest in gas properties | — | 10,201 | 12,891 | ||||||||
Net cash used in investing activities | (1,902,029 | ) | (1,206,024 | ) | (1,473,998 | ) | |||||
Cash flows from financing activities: | |||||||||||
Proceeds from borrowings | 338,000 | 502,000 | 190,000 | ||||||||
Repayments of debt obligations | (961,912 | ) | (342,697 | ) | (689,873 | ) | |||||
Restricted cash for convertible debt | — | — | 8,268 | ||||||||
Distributions to the Partnership’s public unitholders | (47,875 | ) | (17,017 | ) | — | ||||||
Costs related to initial public offering | — | (129 | ) | — | |||||||
Debt issuance costs | (31,971 | ) | (946 | ) | (2,543 | ) | |||||
Proceeds from issuance of common units sold by RMP, net of offering costs | 620,330 | 171,902 | 441,739 | ||||||||
Repurchase of profit interests | — | — | (36,306 | ) | |||||||
Proceeds from issuance of non-controlling redeemable interest | 368,747 | — | — | ||||||||
Contribution to Strike Force Midstream by Gulfport Midstream | 11,030 | — | — | ||||||||
Contribution from parent | 1,457,433 | 356,550 | 1,531,139 | ||||||||
Preferred dividends to redeemable noncontrolling interest holders | (6,900 | ) | — | — | |||||||
Employee tax withholding for settlement of stock compensation award vestings | (2,519 | ) | — | — | |||||||
Net cash provided by financing activities | 1,744,363 | 669,663 | 1,442,424 | ||||||||
Net increase (decrease) in cash | 393,859 | (867 | ) | 42,683 | |||||||
Cash at the beginning of the year | 73,428 | 74,295 | 31,612 | ||||||||
Cash at the end of the year | $ | 467,287 | $ | 73,428 | $ | 74,295 | |||||
82
Rice Energy Operating LLC
Consolidated Statements of Cash Flows
Years Ended December 31, | |||||||||||
(in thousands) | 2016 | 2015 | 2014 | ||||||||
Supplemental disclosure of noncash investing and financing activities | |||||||||||
Capital expenditures for natural gas properties financed by accounts payable | $ | 14,357 | $ | 77,882 | $ | 144,053 | |||||
Capital expenditures for natural gas properties financed by other accrued liabilities | 124,701 | 79,747 | 108,290 | ||||||||
Natural gas properties financed through deferred payment obligations | 32,106 | 23,628 | 34,984 | ||||||||
Rice Energy Operating units | 1,001,200 | — | — | ||||||||
Asset contribution to Strike Force Midstream by Gulfport Midstream | 22,500 | — | — | ||||||||
Application of advances from joint interest owners | (4,801 | ) | (6,994 | ) | (7,304 | ) | |||||
The accompanying notes are an integral part of these Consolidated Financial Statements.
83
Rice Energy Operating LLC
Statements of Consolidated Unitholders’ Capital
(in thousands) | Rice Energy Inc. Unitholders’ Capital | Vantage Sellers Unitholders’ Capital | Unitholders’ Capital before Noncontrolling interest | Noncontrolling Interest | Total Unitholders’ Capital | ||||||||||||||
Balance, January 1, 2014 | $ | 298,647 | $ | — | $ | 298,647 | $ | — | $ | 298,647 | |||||||||
Net contribution from member | 850,186 | — | 850,186 | — | 850,186 | ||||||||||||||
Unit-based compensation | — | — | — | 138 | 138 | ||||||||||||||
Common units issued in RMP IPO, net of offering costs | — | — | — | 441,739 | 441,739 | ||||||||||||||
Net income | 218,454 | — | 218,454 | 581 | 219,035 | ||||||||||||||
Balance, December 31, 2014 | 1,367,287 | — | 1,367,287 | 442,458 | 1,809,745 | ||||||||||||||
Net contribution from member | 102,399 | — | 102,399 | — | 102,399 | ||||||||||||||
Distributions to the Partnership’s public unitholders | — | — | — | (17,017 | ) | (17,017 | ) | ||||||||||||
Offering costs related to the Partnership’s IPO | — | — | — | (129 | ) | (129 | ) | ||||||||||||
Shares of common units issued by RMP, net of offering costs | — | — | — | 171,902 | 171,902 | ||||||||||||||
Unit-based compensation | — | — | — | 4,020 | 4,020 | ||||||||||||||
Net (loss) income | (291,336 | ) | — | (291,336 | ) | 23,337 | (267,999 | ) | |||||||||||
Balance, December 31, 2015 | 1,178,350 | — | 1,178,350 | 624,571 | 1,802,921 | ||||||||||||||
Net contribution from member | 1,644,506 | 395,910 | 2,040,416 | — | 2,040,416 | ||||||||||||||
Distributions to the Partnership’s public unitholders | — | — | — | (47,875 | ) | (47,875 | ) | ||||||||||||
Common units issued pursuant to the Partnership in June 2016 offering, net of offering costs | — | — | — | 163,985 | 163,985 | ||||||||||||||
Common units issued pursuant to the Partnership’s ATM program, net of offering costs | — | — | — | 15,713 | 15,713 | ||||||||||||||
Common units issued pursuant to the Partnership’s October 2016 private placement, net of offering costs | — | — | — | 440,632 | 440,632 | ||||||||||||||
Common unit issuance to Vantage Sellers | — | 1,001,200 | 1,001,200 | — | 1,001,200 | ||||||||||||||
Unit-based compensation | — | — | — | 2,825 | 2,825 | ||||||||||||||
Issuance of phantom units upon vesting of equity-based compensation, net of tax withholdings | (8,176 | ) | — | (8,176 | ) | 5,658 | (2,518 | ) | |||||||||||
Preferred dividends and accretion of redeemable noncontrolling interests | (28,450 | ) | — | (28,450 | ) | — | (28,450 | ) | |||||||||||
Contribution from noncontrolling interest | — | — | — | 33,530 | 33,530 | ||||||||||||||
Net (loss) income | (171,213 | ) | (54,420 | ) | (225,633 | ) | 75,415 | (150,218 | ) | ||||||||||
Balance, December 31, 2016 | $ | 2,615,017 | $ | 1,342,690 | $ | 3,957,707 | $ | 1,314,454 | $ | 5,272,161 | |||||||||
The accompanying notes are an integral part of these Consolidated Financial Statements.
84
Rice Energy Operating LLC
Notes to Consolidated Financial Statements
1. | Summary of Significant Accounting Policies and Related Matters |
Organization, Operations and Principles of Consolidation
The accompanying consolidated financial statements of Rice Energy Operating LLC (“Rice Energy Operating,” the “Company,” “we,” “our,” and “us”) have been prepared by the Company’s management in accordance with generally accepted accounting principles in the United States (“GAAP”) for financial information and applicable rules and regulations promulgated under the Securities Exchange Act of 1934, as amended (the “Exchange Act”). The Company is a subsidiary of Rice Energy Inc. (“Rice Energy”) (NYSE: RICE) and certain administrative and contractual arrangements are managed by Rice Energy and the associated benefits and costs are reflected in our results. The consolidated financial statements of the Company include the accounts of its wholly-owned subsidiaries. Rice Midstream GP Holdings LP, an indirect subsidiary of the Company (“GP Holdings”), owns a 28% interest in Rice Midstream Partners LP, a subsidiary of the Company, (“RMP” or the “Partnership”). The financial results of the Partnership are consolidated and, after giving effect to EIG’s ownership in GP Holdings, the approximate 74% interest in the Partnership is reflected as noncontrolling interest in the consolidated financial statements. In addition, the Company consolidates Strike Force Midstream LLC (“Strike Force Midstream”), a subsidiary of Midstream Holdings and Gulfport Midstream Holdings LLC (“Gulfport Midstream”), a wholly owned subsidiary of Gulfport Energy Corporation (“Gulfport”), and records a noncontrolling interest related to the ownership interests of Strike Force Midstream attributable to Gulfport Midstream. See Note 15 for further discussion of noncontrolling interest related to Strike Force Midstream. All intercompany transactions have been eliminated in consolidation.
On October 19, 2016, Rice Energy completed the acquisition of Vantage Energy, LLC and Vantage Energy II, LLC (collectively, “Vantage”) and their subsidiaries (the “Vantage Acquisition”) pursuant to the terms of a Purchase and Sale Agreement (the “Vantage Purchase Agreement”) dated September 26, 2016 by Rice Energy, Vantage Energy Investment LLC, Vantage Energy Investment II LLC and Vantage. Pursuant to the terms of the Vantage Purchase Agreement, the Company acquired Vantage from certain affiliates of Quantum Energy Partners, Riverstone Holdings LLC and Lime Rock Partners (such affiliates, the “Vantage Sellers”). As of December 31, 2016, Rice Energy owned an 83.51% membership interest in the Company. The remaining 16.49% membership interest is owned by the Vantage Sellers. See Note 3 for further information on Rice Energy’s acquisition of Vantage.
As part of the consideration for the Vantage Acquisition, the Vantage Sellers received membership interests in the Company. In connection with the issuance of such membership interests to the Vantage Sellers, Rice Energy and the Vantage Sellers entered into the Company’s third amended and restated limited liability company agreement (the “Third A&R LLC Agreement”). Under the Third A&R LLC Agreement, Rice Energy controls all of the day-to-day business affairs and decision making of the Company without approval of any other member, unless otherwise stated in the Third A&R LLC Agreement. As such, Rice Energy, through its officers and directors, is responsible for all operational and administrative decisions of the Company and the day-to-day management of the Company’s business. Pursuant to the terms of the Third A&R LLC Agreement, Rice Energy cannot, under any circumstances, be removed or replaced as the sole manager of the Company, except by its own election so long as it remains a member of the Company. Provisions regarding the operations of the Company, and the rights and obligations of the holders of the Company’s common units, are set forth in the Third A&R LLC Agreement.
Nature of Business
The Company is an independent natural gas and oil company focused on the acquisition, exploration and development of natural gas, oil and NGL properties in the Appalachian Basin. The Company operates in three business segments, which are managed separately in determining the allocation of the Company’s resources. The Company’s three reporting segments are as follows:
Exploration and Production. This segment is engaged in the acquisition, exploration and development of natural gas.
Rice Midstream Holdings. This segment is engaged in the gathering and compression of natural gas production in Belmont and Monroe Counties, Ohio.
Rice Midstream Partners. This segment is engaged in the gathering and compression of natural gas, oil and NGL production in Washington and Greene Counties, Pennsylvania, and in the provision of water services to support the well completion services of us and third parties in Washington and Greene Counties, Pennsylvania and Belmont County, Ohio.
Risks and Uncertainties
85
Rice Energy Operating LLC
Notes to Consolidated Financial Statements
The prices the Company receives for its natural gas production heavily influence its revenue, operating results profitability, access to capital, future rate of growth and carrying value of our properties. Natural gas is a commodity and, therefore, its price is subject to wide fluctuation in response to relatively minor changes in supply and demand. Historically, the commodities market has been volatile. The prices the Company receives for its production, and the levels of its production, depend on numerous factors beyond its control. See “Item 1A. Risk Factors” for a further discussion on risks and uncertainties relevant to the Company.
Use of Estimates
The preparation of consolidated financial statements in conformity with U.S. generally accepted accounting principles requires management to make estimates and assumptions that affect the reported amounts of assets and liabilities and disclosure of contingent assets and liabilities at the dates of the consolidated financial statements and the reported amounts of revenues and expenses during the reporting periods. Actual results could differ from those estimates and changes in these estimates are recorded when known.
Push-Down Accounting
The Company is a direct subsidiary of Rice Energy and has no employees. As such, various employee-related costs such as payroll, stock compensation and incentive unit distributions provided by Rice Energy for the benefit of the Company have been fully allocated to the Company and its subsidiaries. General and administrative expenses incurred by Rice Energy on behalf of the Company have been reflected in the accompanying consolidated financial statements. Additionally, Rice Energy has issued and completed public offerings and the related proceeds are generally contributed to the Company to be utilized to fund capital expenditures and working capital requirements. Rice Energy has also entered certain contracts, such as hedging agreements and debt agreements for the benefit of the Company and as such, the corresponding costs and benefits have been pushed down from Rice Energy to the Company. Amounts associated with the items pushed down from Rice Energy have been recorded within the current and long-term receivable from parent and current and long-term payable to parent captions within the consolidated balance sheet.
Revenue Recognition
Sales of natural gas, NGLs and oil are recognized when the products have been delivered to a custody transfer point, persuasive evidence of a sales arrangement exists, the rights and responsibility of ownership pass to the purchaser upon delivery, collection of revenue from the sale is reasonably assured, and the sales price is fixed or determinable. Natural gas is sold by the Company under contracts with the Company’s natural gas marketers. Pricing provisions are generally tied to the Platts Gas Daily market prices. Some transportation costs incurred by the Company are marketed for resale and are not incurred to transport gas produced by the Company’s Exploration and Production segment. These transportation costs are reflected as a deduction from the related firm transportation sales revenue at the time the transportation is provided to the customer. Revenue from the gathering and compression of natural gas and water services is recognized in the month in which the service is provided.
Cash
The Company maintains cash at financial institutions which may at times exceed federally insured amounts. The Company has no accounts that are considered cash equivalents.
Accounts Receivable
Accounts receivable are primarily from the Company’s joint interest partners and natural gas marketers. The Company extends credit to parties in the normal course of business based upon management’s assessment of their creditworthiness. A valuation allowance is provided for those accounts for which collection is estimated as doubtful; uncollectible accounts are written off and charged against the allowance. In estimating the allowance, management considers, among other things, how recently and how frequently payments have been received and the financial position of the party. Allowances for uncollectible accounts were not material for the periods presented. Accounts receivable as of December 31, 2016 and 2015 are detailed below.
86
Rice Energy Operating LLC
Notes to Consolidated Financial Statements
December 31, | |||||||
(in thousands) | 2016 | 2015 | |||||
Joint interest | $ | 53,577 | $ | 76,985 | |||
Natural gas sales | 145,887 | 67,444 | |||||
Other | 19,126 | 10,238 | |||||
Total accounts receivable | $ | 218,590 | $ | 154,667 | |||
Noncontrolling Interest
Noncontrolling interest represents third-party equity ownership of the Partnership and is presented as a component of equity in the consolidated balance sheets. In the consolidated statements of operations, noncontrolling interest reflects the allocation of earnings to third parties. As of December 31, 2016, GP Holdings owned a 28% equity interest in the Partnership. The financial results of the Partnership are consolidated and, after giving effect to the EIG ownership in GP Holdings, the approximate 74% interest in the Partnership is reflected as noncontrolling interest in the consolidated financial statements. See Note 7 for further discussion of noncontrolling interest related to the Partnership. In addition, as of December 31, 2016, the Company consolidates Strike Force Midstream, and records noncontrolling interest related to the ownership interests of Strike Force Midstream attributable to Gulfport Midstream. See Note 15 for further discussion of noncontrolling interest related to Strike Force Midstream.
Property, Plant and Equipment
Natural gas properties
The Company uses the successful efforts method of accounting for oil and gas producing activities. Costs to acquire mineral interests in oil and gas properties are capitalized as unproved properties, whereas costs to drill and equip exploratory wells that result in proved reserves are capitalized as proved properties. Costs to drill exploratory wells that do not identify proved reserves as well as geological and geophysical costs and costs of carrying and retaining unproved properties are expensed.
Capitalized costs of producing oil and gas properties and support equipment directly related to such properties, after considering estimated residual salvage values, are depreciated and depleted by the units of production method.
Capitalized costs of unproved properties are evaluated at least annually for recoverability on a prospective basis. This evaluation includes consideration of current economic conditions, changes in development plans or business strategy, expected lease expirations and historical experience. If it is determined that it is unlikely for an unproved property to yield proved reserves prior to lease expiration, an impairment of the respective unproved property is recognized in the period in which that determination is made. For the year ended December 31, 2016, the Company recognized $20.9 million of impairment expense in the consolidated statement of operations related to lease expirations on non-core assets. In addition, for the year ended December 31, 2016, the Company recognized $13.5 million of leasehold write-offs included in exploration expense in the consolidated statement of operations. For the year ended December 31, 2015, the Company recognized $7.3 million of impairment expense in the consolidated statement of operations, primarily the result of changes in the Company’s development plans and lease expirations. Upon the sale of an entire interest in an unproved property for cash, a gain or loss on the sale is recognized, taking into consideration the amount of any recorded impairment if the property had been assessed individually. If a partial interest in an unproved property is sold, the amount received is treated as a reduction of the cost of the interest retained unless the proceeds received are in excess of the cost basis which would result in gain on sale. No significant gains or losses were realized from the sale of unproved properties in the periods presented. Unproved oil and gas properties had a net book value of $2,001.8 million and $1,050.0 million at December 31, 2016 and 2015, respectively.
The carrying values of the Company’s proved properties are reviewed periodically when events or circumstances indicate that the remaining carrying amount may not be recoverable. This evaluation is performed at the lowest levels for which there are identifiable cash flows that are largely independent of other groups of assets by comparing estimated undiscounted cash flows to the carrying value and including risk-adjusted probable and possible reserves, if deemed reasonable. Key assumptions utilized in determining the estimated undiscounted future cash flows are generally consistent with assumptions used in the Company’s budgeting and forecasting processes. If the carrying value of proved properties exceeds the estimated undiscounted future cash flows, they are written down to fair value. Fair value of proved properties is estimated by discounting the estimated future cash flows using discount rates and consideration of expected assumptions that would be used by a market participant.
87
Rice Energy Operating LLC
Notes to Consolidated Financial Statements
During 2016, the Company performed a recoverability test on its proved properties. No impairment was recorded as a result of the recoverability test. Due to the significant decline in commodity prices in 2015, there were indications that the carrying values of certain proved properties may not be fully recoverable when compared to their fair value. The fair value was determined using an income approach based on estimated future production, future commodity prices adjusted for firm transportation and basis differentials, future operating and capital costs, and an assumed discount rate of 12%. As the assumptions used to calculate the estimated fair value were significant unobservable inputs, the valuation of the proved properties was considered to be a Level 3 fair value measurement. The Company determined that the carrying value of Upper Devonian proved properties was not fully recoverable and as a result, for the year ended December 31, 2015, the Company recognized $10.9 million of impairment expense in the consolidated statement of operations to write-down such proved properties to fair value of $7.3 million. For the year ended December 31, 2014, the Company did not recognize impairment charges for proved or unproved properties.
Midstream properties
Midstream property and equipment is recorded at cost and is being depreciated over estimated useful lives on a straight-line basis. Gathering pipelines and compressor stations are depreciated over a useful life of 60 years. Water pipelines, pumping stations and impoundment facilities are depreciated over a useful life of 10 to 15 years.
The Company evaluates its long-lived assets for impairment when events and circumstances indicate, in management’s judgment, that the carrying value of such assets may not be recoverable. Long-lived assets assessed for impairment are grouped at the lowest level for which identifiable cash flows are largely independent of the cash flows for other assets and liabilities. Impairment exists when the carrying amount of an asset exceeds estimates of the undiscounted cash flows expected to result from the use and eventual disposition of the asset. When alternative courses of action to recover the carrying amount of a long-lived asset are under consideration, estimates of future undiscounted cash flows take into account possible outcomes and probabilities of their occurrence. If the carrying amount of the long-lived asset is not recoverable, based on the estimated future undiscounted cash flows, the impairment loss is measured as the excess of the asset’s carrying amount over its estimated fair value, such that the asset’s carrying amount is adjusted to its estimated fair value with an offsetting charge to impairment expense.
Fair value represents the estimated price between market participants to sell an asset in the principal or most advantageous market for the asset, based on assumptions a market participant would make. When warranted, management assesses the fair value of long-lived assets using commonly accepted techniques and may use more than one source in making such assessments. Sources used to determine fair value include, but are not limited to, recent third-party comparable sales, internally developed discounted cash flow analyses and analyses from outside advisors. Significant changes, such as changes in contract rates or terms, the condition of an asset, or management’s intent to utilize the asset, generally require management to reassess the cash flows related to long-lived assets. A reduction of carrying value of fixed assets would represent a Level 3 fair value measure. No impairments for such assets have recorded for the years presented herein.
During the fourth quarter of 2016, the Company recorded a $20.3 million impairment within the Rice Midstream Holdings segment related to pipeline assets that were decommissioned.
Interest
The Company capitalizes interest on expenditures for significant exploration and development and midstream projects while activities are in progress to bring the assets to their intended use. Upon completion of construction of the asset, the associated capitalized interest costs are included within our asset base and depleted accordingly. The following table summarizes the components of the Company’s interest incurred for the years ended December 31, 2016, 2015 and 2014:
(in thousands) | 2016 | 2015 | 2014 | ||||||||
Interest incurred: | |||||||||||
Interest expensed | $ | 99,627 | $ | 87,446 | $ | 50,191 | |||||
Interest capitalized | 223 | 195 | 905 | ||||||||
Total incurred | $ | 99,850 | $ | 87,641 | $ | 51,096 | |||||
Goodwill
Goodwill is the cost of an acquisition less the fair value of the identifiable net assets of the acquired business. The Company evaluates goodwill for impairment at least annually during the fourth quarter, or whenever events or changes in circumstances indicate it is more likely than not that the fair value of a reporting unit is less than its carrying amount. A reporting unit is an operating segment or a component of an operating segment for which discrete financial information is
88
Rice Energy Operating LLC
Notes to Consolidated Financial Statements
available and reviewed by management on a regular basis. In 2014, $39.1 million of goodwill was allocated to the Rice Midstream Partners segment as a result of the acquisition of the remaining 50% interest in Alpha Natural Resources, Inc. in its Marcellus joint venture. In 2016, as a result of the Vantage Acquisition, $384.5 million and $455.4 million of goodwill was allocated to the Exploration and Production segment and the Rice Midstream Partners segment, respectively.
The Company may first consider qualitative factors to assess whether there are indicators that it is more likely than not that the fair value of a reporting unit may not exceed its carrying amount. To the extent that such indicators exist, the Company will complete the two-step goodwill impairment test. The Company may also perform the two-step goodwill impairment test at its discretion without performing the qualitative assessment. The first step compares the fair value of a reporting unit to its carrying value. If the carrying amount of a reporting unit exceeds its fair value, the second step is required which compares the implied fair value of the goodwill of a reporting unit to its carrying value. If the carrying value of the goodwill of a reporting unit exceeds its implied fair value, the difference is recognized as an impairment charge. The Company uses a combination of an income and market approach to estimate the fair value of a reporting unit. The fair value estimation process requires considerable judgment and determining the fair value is sensitive to changes in assumptions impacting management’s estimates of future financial results. Although the Company believes the estimates and assumptions used in estimating the fair value are reasonable and appropriate, different assumptions and estimates could materially impact the calculated fair value. Additionally, future results could differ from our current estimates and assumptions.
The Company’s fourth quarter 2016 annual test included the assessment of qualitative factors to determine whether it was more likely than not that the fair value of each reporting unit is less than its carrying value. The qualitative assessment encompassed a review of events and circumstances specific to the reporting units with goodwill as well as circumstances specific to the entity as a whole. The Company’s qualitative assessment considered, among other things, factors such as macroeconomic conditions, industry and market considerations, including changes in Rice Energy’s stock price and market multiples, projected financial performance, cost factors, changes in carrying values and other relevant factors. In considering the totality of the qualitative factors assessed, based on the weight of evidence, circumstances did not exist that would indicate it was more likely than not that goodwill was impaired. Accordingly, the Company did not perform a two-step quantitative analysis and no impairment was recorded.
For the year ended December 31, 2015, given the overall market conditions, the Company elected the option to default immediately to the first step of the annual goodwill impairment test. The results of the first step indicated that the carrying value of the Exploration and Production reporting unit exceeded its fair value. Due to the result of step one of the annual goodwill impairment test for the Exploration and Production reporting unit, the Company performed the second step of the goodwill impairment analysis comparing the implied fair value of the reporting unit’s goodwill to its carrying amount and determined that such goodwill was fully impaired. As a result, the Company recorded an impairment charge of $294.9 million to eliminate the carrying value of goodwill of the Exploration and Production reporting unit at December 31, 2015. Management considered the negative industry and market trends, including the decline in commodity prices and overall market performance of the Company’s peers and the Company, to be the primary reasons of impairment.
No impairment was recorded for the year ended December 31, 2014.
Goodwill as of December 31, 2016 and 2015 is detailed below.
(in thousands) | Exploration and Production | Rice Midstream Partners | |||||
Balance, December 31, 2014 | $ | 294,908 | $ | 39,142 | |||
Impairment | (294,908 | ) | — | ||||
Balance, December 31, 2015 | — | 39,142 | |||||
Additions (1) | 384,431 | 455,438 | |||||
Balance, December 31, 2016 | $ | 384,431 | $ | 494,580 | |||
(1) | 2016 additions to goodwill are associated with the Vantage Acquisition. Please see Note 3 for further information. |
Intangible Assets
Intangible assets are recorded under the acquisition method of accounting at their estimated fair values at the acquisition date. Fair value is calculated as the present value of estimated future cash flows using a risk-adjusted discount rate. The Company’s intangible assets are comprised of customer contracts acquired in our April 2014 acquisition of certain gas gathering assets in eastern Washington and Greene Counties, Pennsylvania. The customer contracts acquired had initial contract terms of 10 years with five and one-year renewal options. The Company calculates amortization of intangible assets using the
89
Rice Energy Operating LLC
Notes to Consolidated Financial Statements
straight-line method over the estimated useful life of the intangible assets, or 30 years. Amortization expense recorded in the consolidated statements of operations for the year ended December 31, 2016, 2015 and 2014 was $1.6 million, $1.6 million and $1.2 million, respectively. The estimated annual amortization expense over the next five years is as follows: 2017 $1.6 million, 2018 $1.6 million, 2019 $1.6 million, 2020 $1.6 million and 2021 $1.6 million.
Intangible assets, net as of December 31, 2016 and 2015 are detailed below.
(in thousands) | December 31, 2016 | December 31, 2015 | |||||
Intangible assets | $ | 48,947 | $ | 48,947 | |||
Less: accumulated amortization | (4,422 | ) | (2,788 | ) | |||
Intangible assets, net | 44,525 | 46,159 | |||||
Deferred Financing Costs
Deferred financing costs are amortized on a straight-line basis, which approximates the interest method, over the term of the related agreement. Accumulated amortization was $16.1 million and $8.6 million at December 31, 2016 and 2015, respectively. Amortization expense was $7.5 million, $5.1 million, and $2.5 million for the years ended December 31, 2016, 2015 and 2014, respectively.
Asset Retirement Obligations
The Company records the fair value of a legal liability for an asset retirement obligation in the period in which it is incurred. For oil and gas properties, this is the period in which an oil or gas well is acquired or drilled. The Company’s retirement obligations relate to the abandonment of oil and gas producing facilities and include costs to reclaim drilling sites and dismantle and reclaim or dispose of water services assets, wells and related structures. Estimates are based on historical experience in plugging and abandoning wells and estimated remaining lives of those wells based on reserve estimates. While components within our gathering systems will be replaced in the ordinary course of business, these systems will continue to exist indefinitely. Therefore, the timing of asset retirement obligations of our gathering systems is uncertain and a reasonable estimate cannot be established due to the lack of sufficient information.
When a new liability is recorded, the Company capitalizes the costs of the liability by increasing the carrying amount of the related long-lived asset. The liability is accreted to its present value each period and the capitalized cost is depreciated over the units of production basis. See Note 12 for additional information regarding asset retirement obligations.
Income Taxes
Prior to the change in tax status to a partnership on October 19, 2016, the Company’s income was reported as part of Rice Energy’s consolidated federal tax return and the Company was taxed as a corporation under the Internal Revenue Code, subject to federal income tax at a statutory rate of 35%. During the period of time the Company was taxed as a corporation it accumulated approximately $272.0 million in net deferred tax liabilities. The Company has not reported any income tax benefit or expense for periods subsequent to October 19, 2016 because, as a partnership, the Company is not subject to federal income tax. In addition, the Company wrote off its entire net deferred tax liabilities balance by recording a deferred tax benefit of approximately $272.0 million.
In addition, the Company has not reported any income tax benefit or expense for periods prior to the consummation of Rice Energy’s initial public offering (“IPO”) in January 2014 because Rice Drilling B LLC (“Rice Drilling B”), Rice Energy’s accounting predecessor, is a limited liability company that was not and currently is not subject to federal income tax. The reorganization of the Company’s business into a corporation in connection with the closing of Rice Energy’s IPO required the recognition of a deferred tax asset or liability for the initial temporary differences at the time of the IPO. The resulting deferred tax liability of approximately $162.3 million was recorded in capital at the date of the completion of Rice Energy’s IPO as it represents a transaction among shareholders.
During the period from January 29, 2014 through October 19, 2016, the following tax accounting policies and estimates were applied:
The two-step approach was used for recognizing and measuring tax benefits taken or expected to be taken in a tax return and disclosures regarding uncertainties in income tax positions. Only tax positions that meet the more likely than not recognition threshold are recognized. Based on management’s analysis, the Company did not have any uncertain tax positions as of December 31, 2016.
90
Rice Energy Operating LLC
Notes to Consolidated Financial Statements
Income taxes were accounted for under the asset and liability method, which requires recognition of deferred tax assets and liabilities for the expected future tax consequences of events that have been included in the financial statements. Under this method, deferred tax assets and liabilities are determined based on the differences between the financial statements and tax basis of assets and liabilities using enacted tax rates in effect for the year in which differences are expected to be recovered or settled pursuant to the provisions of ASC 740-Income Taxes. The effect of a change in tax rates on deferred tax assets and liabilities is recognized in income in the period that includes the enactment date.
The Company will record a valuation allowance if it is deemed more likely than not that all or a portion of its deferred income tax assets will not be realized. In addition, income tax rules and regulations are subject to interpretation and the application of those rules and regulations requires judgment by us and may be challenged by the taxation authorities.
Segment Reporting
Business segments are components of the Company for which separate financial information is produced internally and are subject to evaluation by the Company’s chief operating decision maker in deciding how to allocate resources. The Company reports its operations in three segments: (i) the Exploration and Production segment, (ii) the Rice Midstream Holdings segment and (iii) the Rice Midstream Partners segment. Operating segments are evaluated for their contribution to the Company’s combined results based on operating income. All of the Company’s operating revenues, income from operations and assets are located in the United States. See Note 8 for additional information regarding segment reporting.
2. | Property, Plant and Equipment |
The Company’s property, plant and equipment are as follows as of December 31, 2016 and 2015.
December 31, | |||||||
(in thousands) | 2016 | 2015 | |||||
Oil and gas producing properties | $ | 5,791,284 | $ | 2,870,691 | |||
Impairment of fixed assets | (2,765 | ) | — | ||||
Impairment of gas properties | (20,853 | ) | (18,250 | ) | |||
Accumulated depreciation | (883,055 | ) | (498,467 | ) | |||
Oil and gas producing properties, net | 4,884,611 | 2,353,974 | |||||
Midstream property and equipment | 1,274,150 | 889,776 | |||||
Impairment of fixed assets | (20,292 | ) | — | ||||
Accumulated depreciation | (54,771 | ) | (25,662 | ) | |||
Midstream property and equipment, net | 1,199,087 | 864,114 | |||||
Other property and equipment | 11,793 | 11,426 | |||||
Accumulated depreciation | (3,202 | ) | (3,854 | ) | |||
Other property and equipment, net | 8,591 | 7,572 | |||||
Property, plant and equipment, net | $ | 6,092,289 | $ | 3,225,660 | |||
3. | Acquisitions |
Vantage Acquisition
On October 19, 2016, Rice Energy completed the Vantage Acquisition pursuant to the terms of the Purchase and Sale Agreement (the “Vantage Purchase Agreement”) dated September 26, 2016 by Rice Energy, Vantage Energy Investment LLC, Vantage Energy Investment II LLC and Vantage. Pursuant to the terms of the Vantage Purchase Agreement, Rice Energy acquired Vantage from the Vantage Sellers for approximately $2.7 billion, which consisted of approximately $1.0 billion in cash, the assumption of net debt of approximately $707.0 million and the issuance of 40.0 million units in the Company that were immediately exchangeable into 40.0 million shares of common stock of Rice Energy, valued at approximately $1.0 billion. In connection with executing the Vantage Purchase Agreement, Rice Energy transferred $270.0 million to escrow as an acquisition deposit which was released in connection with the completion of the Vantage Acquisition to the Vantage Sellers as a portion of the cash consideration. Concurrent with the completion of the Vantage Acquisition, Rice Energy extinguished the debt assumed from the Vantage Sellers for $707.0 million in cash, which approximated the fair value of the debt at the time of extinguishment. In addition, the Vantage Sellers were issued 1/1,000th of a share of Rice Energy preferred stock for each common unit they received. The Rice Energy shares of preferred stock are intended to provide holders with non-economic voting rights in Rice Energy and are extinguished upon conversion of the associated common units into Rice Energy common stock. Following the completion of the Vantage Acquisition, as of December 31, 2016, Rice Energy owned an 83.51% membership interest in the Company and the Vantage Sellers owned the remaining 16.49% membership interest in the Company.
On September 30, 2016, Rice Energy issued and completed a public offering (the “September 2016 Equity Offering”) of common stock, the net proceeds from which were used to pay for a portion of the Vantage Acquisition. Pursuant to the Vantage Purchase Agreement, the Company acquired approximately 85,000 net core Marcellus acres in Greene County, Pennsylvania, with rights to the deeper Utica Shale on approximately 52,000 net acres and approximately 36,000 net acres in the Barnett Shale. The accounting for the Vantage Acquisition has been pushed down to the financial statements of the Company. All assets acquired and liabilities assumed were recorded in the consolidated financial statements at estimated fair value.
On September 26, 2016, Rice Energy entered into a Purchase and Sale Agreement (the “Midstream Purchase Agreement”) by and between Rice Energy and the Partnership. Pursuant to the terms of the Midstream Purchase Agreement, as amended, immediately following the close of the Vantage Acquisition on October 19, 2016, the Partnership acquired from Rice Energy all of the outstanding membership interests of Vantage Energy II Access, LLC and Vista Gathering, LLC (collectively, the “Vantage Midstream Entities”). The Partnership’s acquisition of the Vantage Midstream Entities from Rice Energy is accounted for as a combination of entities under common control at historical cost. The Vantage Midstream Entities, which became wholly-owned subsidiaries of the Partnership upon the completion of the acquisition of the Vantage Midstream Entities, own midstream assets, including approximately 30 miles of dry gas gathering and compression assets. In consideration
91
Rice Energy Operating LLC
Notes to Consolidated Financial Statements
for the acquisition of the Vantage Midstream Entities, the Partnership paid Rice Energy $600.0 million in aggregate cash consideration, which the Partnership funded through the net proceeds of a private placement of Partnership common units and borrowings under its revolving credit facility. Acquisition costs of $5.4 million were incurred related to the Vantage Acquisition.
Allocation of Purchase Price
The Vantage Acquisition has been accounted for as a business combination, using the acquisition method. The following table summarizes the preliminary purchase price and the preliminary estimated values of assets and liabilities assumed based on the fair value as of October 19, 2016, with any excess of the purchase price over the estimated fair value of the identified net assets acquired recorded as goodwill. Approximately, $384.5 million and $455.4 million of goodwill has been allocated to the Exploration and Production segment and Rice Midstream Partners segment, respectively. Goodwill primarily relates to the Company’s ability to control the Vantage acquired assets and recognize synergies related to administrative and capital efficiencies, extended laterals and the creation of additional contiguous leasing opportunities not previously available. Certain data necessary to complete the purchase price allocation is not yet available, and includes, but is not limited to, title defect analysis and final appraisals of assets acquired and liabilities assumed. The Company expects to complete the purchase price allocation once the Company has received all of the necessary information, during which time the value of the assets and liabilities may be revised as appropriate.
(in thousands) | ||||
Consideration Given: | ||||
Fair value of issued common units | $ | 1,001,200 | ||
Cash consideration, net of cash acquired | 981,080 | |||
Total consideration | $ | 1,982,280 | ||
Estimated Fair Value of Assets Acquired and Liabilities Assumed: | ||||
Current assets, net of cash acquired | $ | 49,532 | ||
Natural gas and oil properties | 2,178,076 | |||
Midstream property, plant and equipment | 144,562 | |||
Other non-current assets | 27,437 | |||
Current liabilities | (103,322 | ) | ||
Fair value of debt assumed | (706,912 | ) | ||
Other non-current liabilities | (51,052 | ) | ||
Member contribution | (395,910 | ) | ||
Total estimated fair value of assets acquired and liabilities assumed | $ | 1,142,411 | ||
Goodwill | 839,869 | |||
The fair value of natural gas and oil properties are based on inputs that are not observable in the market and therefore represent Level 3 inputs. The fair values of natural gas and oil properties were measured using valuation techniques that convert future cash flows into a single discounted amount. Significant inputs to the valuation of natural gas and oil properties included estimates of: (i) recoverable reserves; (ii) production rates; (iii) future operating and development costs; (iv) future commodity prices; and (v) a market-based weighted average cost of capital rate. These inputs required significant judgments and estimates by management at the time of the valuation and are the most sensitive and may be subject to change. The fair value of undeveloped property was determined based upon a market approach of comparable transactions using Level 3 inputs.
The fair value measurements of the debt assumed were determined using Level 1 inputs. The debt balance includes amounts related to Vantage’s second lien note and amounts outstanding under Vantage’s credit facility, which were assumed by the Company and repaid concurrent to the Vantage Acquisition.
The valuation of the Company’s common units issued as consideration were primarily calculated based upon Level 1 inputs. The common unit value was included as an input in determining the fair value of the member contribution, which was further adjusted using level 3 inputs.
Post-Acquisition Operating Results
92
Rice Energy Operating LLC
Notes to Consolidated Financial Statements
Subsequent to the completion of the Vantage Acquisition, the acquired entities contributed the following to the Company’s consolidated operating results for the period from October 19, 2016 through December 31, 2016.
(in thousands) | ||||
Revenue attributable to Rice Energy Operating | $ | 51,645 | ||
Net income attributable to Rice Energy Operating | $ | 5,543 | ||
Pro Forma Information
The following unaudited pro forma combined financial information presents the Company’s results as though the Vantage Acquisition had been completed at January 1, 2015. The pro forma combined financial information has been included for comparative purposes and is not necessarily indicative of the results that might have actually occurred had the Vantage Acquisition taken place on January 1, 2015; furthermore, the financial information is not intended to be a projection of future results.
Year Ended December 31, | ||||||||
(in thousands, except per share data) (unaudited) | 2016 | 2015 | ||||||
Pro forma operating revenues | $ | 935,639 | $ | 661,701 | ||||
Pro forma net loss | $ | (401,803 | ) | $ | (178,955 | ) | ||
Murray Energy Acquisition
On October 26, 2016, the Company entered into a purchase and sale agreement (the “Murray Purchase Agreement”) by and between the Company and Murray Energy Corporation (“Murray Energy”), an Ohio-based privately owned coal company. Pursuant to the Murray Purchase Agreement, Murray Energy agreed to sell approximately 5,900 Utica Shale acres located in Belmont and Monroe Counties, Ohio to the Company for $60.6 million, which consisted of a cash payment at closing of approximately $44.3 million, payments of $7.5 million in cash due in each of October 2017 and October 2018, and the assumption of net debt of approximately $1.3 million. On November 4, 2016, the Company completed the Murray Energy acquisition, which included all sub-surface rights, including any royalty and working interests owned by Murray Energy in the underlying acreage.
93
Rice Energy Operating LLC
Notes to Consolidated Financial Statements
4. Long-Term Debt
The Company became co-obligor of the Notes (defined herein) and certain entities acquired in the Vantage Acquisition became wholly-owned subsidiaries of the Company and guarantors of the Notes pursuant to certain supplemental indentures entered into in connection with the Vantage Acquisition. In addition, the Company and Rice Energy entered a debt assumption agreement (the “Debt Assumption Agreement”) dated as of October 19, 2016 pursuant to which the Company agreed to become a primary obligor of the Notes. For the year ended December 31, 2016, the Company, as primary obligor, has recognized debt and related interest charges associated with the Notes and the Senior Secured Revolving Credit Facility (defined herein) within the consolidated balance sheet. For periods prior to the Debt Assumption Agreement, Rice Energy was the primary obligor of the indentures governing the Notes and the Senior Secured Revolving Credit Facility and as such, long-term debt associated with the Notes for the year ended December 31, 2015 was pushed down from Rice Energy and recorded as a long-term payable to parent on the consolidated balance sheet.
Long-term debt consists of the following as of December 31, 2016 and 2015:
December 31, | |||||||
(in thousands) | 2016 | 2015 | |||||
Long-term Debt | |||||||
Senior Notes Due 2022, net of unamortized deferred financing costs and original discount issuances of $12,023(a)(1) | $ | 887,977 | $ | — | |||
Senior Notes Due 2023, net of unamortized deferred financing costs and original discount issuances of $8,496(b)(2) | 391,504 | — | |||||
Senior Secured Revolving Credit Facility(c) | — | — | |||||
Midstream Holdings Revolving Credit Facility(d) | 53,000 | 17,000 | |||||
RMP Revolving Credit Facility(e) | 190,000 | 143,000 | |||||
Total debt | $ | 1,522,481 | $ | 160,000 | |||
Less current portion | — | — | |||||
Long-term debt | $ | 1,522,481 | $ | 160,000 | |||
(1) | For the year ended December 31, 2015, approximately $885.7 million of debt related to the 2022 Notes, net of unamortized deferred financing costs of approximately $14.3 million, was pushed down from Rice Energy and recorded as a long-term payable to parent within the consolidated balance sheet. |
(2) | For the year ended December 31, 2015, approximately $390.1 million of debt related to the 2023 Notes, net of unamortized deferred financing costs of approximately $7.1 million, was pushed down from Rice Energy and recorded as a long-term payable to parent within the consolidated balance sheet. |
Senior Notes
6.25% Senior Notes Due 2022 (a)
The Company, as primary obligor, has $900.0 million in aggregate principal amount of 6.25% senior notes due 2022 outstanding (the “2022 Notes”). The 2022 Notes will mature on May 1, 2022, and interest is payable on the 2022 Notes on each May 1 and November 1. At any time prior to May 1, 2017, the Company may redeem up to 35% of the 2022 Notes at a redemption price of 106.25% of the principal amount, plus accrued and unpaid interest, with the proceeds of certain equity offerings so long as the redemption occurs within 180 days of completing such equity offering and at least 65% of the aggregate principal amount of the 2022 Notes remains outstanding after such redemption. Prior to May 1, 2017, the Company may redeem some or all of the 2022 Notes for cash at a redemption price equal to 100% of their principal amount plus an applicable make-whole premium and accrued and unpaid interest. Upon the occurrence of a change of control, unless the Company has given notice to redeem the 2022 Notes, the holders of the 2022 Notes will have the right to require the Company to repurchase all or a portion of the 2022 Notes at a price equal to 101% of the aggregate principal amount of the 2022 Notes, plus any accrued and unpaid interest. On or after May 1, 2017, the Company may redeem some or all of the 2022 Notes at redemption prices (expressed as percentages of principal amount) equal to 104.688% for the twelve-month period beginning on May 1, 2017, 103.125% for the twelve-month period beginning May 1, 2018, 101.563% for the twelve-month period beginning on May 1, 2019 and 100.000% beginning on May 1, 2020, plus accrued and unpaid interest.
7.25% Senior Notes Due 2023 (b)
94
Rice Energy Operating LLC
Notes to Consolidated Financial Statements
The Company, as primary obligor, has $400.0 million in aggregate principal amount of 7.25% senior notes due 2023 outstanding (the “2023 Notes”). For the years ended December 31, 2016 and 2015, Rice Energy recorded $0.4 million and $0.3 million, respectively, of amortization of the debt discount as interest expense using the effective interest rate method and a rate of 7.345%.
The 2023 Notes will mature on May 1, 2023, and interest is payable on the 2023 Notes on each May 1 and November 1, commencing on November 1, 2015. At any time prior to May 1, 2018, the Company may redeem up to 35% of the 2023 Notes at a redemption price of 107.250% of the principal amount, plus accrued and unpaid interest, with the proceeds of certain equity offerings so long as the redemption occurs within 180 days of completing such equity offering and at least 65% of the aggregate principal amount of the 2023 Notes remains outstanding after such redemption. Prior to May 1, 2018, the Company may redeem some or all of the notes for cash at a redemption price equal to 100% of their principal amount plus an applicable make-whole premium and accrued and unpaid interest. Upon the occurrence of a change of control, unless the Company has given notice to redeem the 2023 Notes, the holders of the 2023 Notes will have the right to require the Company to repurchase all or a portion of the 2023 Notes at a price equal to 101% of the aggregate principal amount of the 2023 Notes, plus any accrued and unpaid interest. On or after May 1, 2018, the Company may redeem some or all of the 2023 Notes at redemption prices (expressed as percentages of principal amount) equal to 105.438% for the twelve-month period beginning on May 1, 2017, 103.625% for the twelve-month period beginning May 1, 2019, 101.813% for the twelve-month period beginning on May 1, 2020 and 100.000% beginning on May 1, 2021, plus accrued and unpaid interest.
The 2022 Notes and the 2023 Notes (collectively, the “Notes”) are the Company’s senior unsecured obligations, rank equally in right of payment with all of the Company’s existing and future senior debt, and will rank senior in right of payment to all of the Company’s future subordinated debt. The Notes will be effectively subordinated to all of the Company’s existing and future secured debt to the extent of the value of the collateral securing such indebtedness. The Notes are jointly and severally, fully and unconditionally, guaranteed by the Company’s Guarantors.
Senior Secured Revolving Credit Facility (c)
In April 2013, Rice Energy entered into a Senior Secured Revolving Credit Facility (the “Senior Secured Revolving Credit Facility”) with Wells Fargo Bank, N.A., as administrative agent, and a syndicate of lenders. In April 2014, Rice Energy, as borrower, and Rice Drilling B, as predecessor borrower, amended and restated the credit agreement governing the Senior Secured Revolving Credit Facility (the “Amended Credit Agreement”) to, among other things, assign all of the rights and obligations of Rice Drilling B as borrower under the Senior Secured Revolving Credit Facility to Rice Energy.
In connection with the closing of the Vantage Acquisition, on October 19, 2016, Rice Energy entered into a Fourth Amended and Restated Credit Agreement (the “A&R Credit Agreement”) effective upon the closing of the Vantage Acquisition to, among other things, (i) permit the completion of the Vantage Acquisition, (ii) extend the maturity date of the credit facility from January 29, 2019 to October 19, 2021, (iii) increase the borrowing base from $875.0 million to $1.0 billion without giving effect to the oil and gas properties acquired pursuant to the Vantage Acquisition, (iv) provide for the assignment of Rice Energy’s rights and obligations as borrower under the Senior Secured Revolving Credit Facility to the Company and the addition of Rice Energy as a guarantor of those obligations, (v) increase the minimum required mortgage percentage (as it applies to proved reserves) to be 85% of proved reserves, (vi) amend the restricted payments covenant to permit certain distributions by the Company to its members, (vii) replace the interest coverage ratio with a consolidated total leverage ratio or consolidated net leverage ratio, as applicable, to commence with the last day of the fiscal quarter ended December 31, 2016 and (viii) adjust the interest rate payable on amounts borrowed thereunder (as described below).
On December 19, 2016, the Company, as borrower, and Rice Energy, as predecessor borrower, entered into the First Amendment to the A&R Credit Agreement among the Company, Rice Energy, Wells Fargo Bank, N.A., as administrative agent, and the lenders and other parties thereto (the “First Amendment”). The lenders under the A&R Credit Agreement completed an Interim Redetermination (as defined in the A&R Credit Agreement) of the borrowing base to give effect to the Pennsylvania oil and gas properties acquired in the Vantage Acquisition and, upon the effectiveness of the First Amendment and such Interim Redetermination, the Company’s borrowing base and the elected commitment amounts of the lenders under the Senior Secured Revolving Credit Facility increased from $1.0 billion to $1.45 billion.
As of December 31, 2016, the borrowing base was $1.45 billion and the sublimit for letters of credit was $400.0 million. The Company had zero borrowings outstanding and $240.9 million in letters of credit outstanding under the A&R Credit Agreement as of December 31, 2016, resulting in availability of $1.21 billion. The next redetermination of the borrowing base is scheduled for April 2017.
Following the effectiveness of the A&R Credit Agreement, Eurodollar loans under the Senior Secured Revolving Credit Facility bear interest at a rate per annum equal to LIBOR plus an applicable margin ranging from 225 to 325 basis points, depending on the percentage of borrowing base utilized, and base rate loans bear interest at a rate per annum equal to the
95
Rice Energy Operating LLC
Notes to Consolidated Financial Statements
greatest of (i) the agent bank’s reference rate, (ii) the federal funds effective rate plus 50 basis points and (iii) the rate for one month Eurodollar loans plus 100 basis points, plus an applicable margin ranging from 125 to 225 basis points, depending on the percentage of borrowing base utilized.
As of December 31, 2016, the Senior Secured Revolving Credit Facility was secured by liens on at least 85% of the proved oil and gas reserves of the Company and its subsidiaries (other than any subsidiary that is designated as an unrestricted subsidiary, including Midstream Holdings and its subsidiaries), as well as significant unproved acreage and substantially all of the personal property of the Company and such restricted subsidiaries, and the Senior Secured Revolving Credit Facility is guaranteed by such restricted subsidiaries.
The A&R Credit Agreement requires us to maintain certain financial ratios, which are measured at the end of each calendar quarter:
• | a consolidated current ratio, which is (a) the ratio of consolidated current assets (including unused commitments under the A&R Credit Agreement and excluding non-cash derivative assets) to consolidated current liabilities (excluding current maturities under the A&R Credit Agreement), of not less than 1.0 to 1.0; or (b) if no borrowings are then outstanding; and |
• | a consolidated leverage ratio, which is if borrowings are outstanding under the A&R Credit Agreement on the last day of such calendar quarter, the ratio of consolidated total funded debt to EBITDAX (as such term is defined in the A&R Credit Agreement) of not more than 4.0 to 1.0; and |
• | the ratio of consolidated net funded debt to EBITDAX (as such term is defined in the A&R Credit Agreement) of not more than 4.0 to 1.0. |
The Company was in compliance with its covenants and ratios effective as of December 31, 2016.
Midstream Holdings Revolving Credit Facility (d)
On December 22, 2014, Rice Midstream Holdings LLC (“Midstream Holdings”) entered into a revolving credit facility (the “Midstream Holdings Revolving Credit Facility”) with Wells Fargo Bank, N.A., as administrative agent, and a syndicate of lenders with a maximum credit amount of $300.0 million and a sublimit for letters of credit of $25.0 million. As of December 31, 2016, Midstream Holdings had $53.0 million of borrowings outstanding and no letters of credit under this facility, resulting in availability of $247.0 million. The average daily outstanding balance of the Midstream Holdings Revolving Credit Facility was approximately $27.1 million and interest was incurred on the facility at a weighted average annual interest rate of 5.6% during 2016. The Midstream Holdings Revolving Credit Facility is available to fund working capital requirements and capital expenditures and to purchase assets. The maturity date of the Midstream Holdings Revolving Credit Facility is December 22, 2019.
Principal amounts borrowed are payable on the maturity date, and interest is payable quarterly for base rate loans and at the end of the applicable interest period for Eurodollar loans. Under the Midstream Holdings Revolving Credit Facility, Midstream Holdings may elect to borrow in Eurodollars or at the base rate. Eurodollar loans bear interest at a rate per annum equal to the applicable LIBOR Rate plus an applicable margin ranging from 225 to 300 basis points, depending on the leverage ratio then in effect. Base rate loans bear interest at a rate per annum equal to the greatest of (i) the agent bank’s reference rate, (ii) the federal funds effective rate plus 50 basis points and (iii) the rate for one month Eurodollar loans plus 100 basis points, plus an applicable margin ranging from 125 to 200 basis points, depending on the leverage ratio then in effect. Midstream Holdings also pays a commitment fee based on the undrawn commitment amount ranging from 37.5 to 50 basis points.
The Midstream Holdings Revolving Credit Facility is secured by mortgages and other security interests on substantially all of the properties of, and guarantees from, Midstream Holdings and its restricted subsidiaries (which do not include RMP or Rice Midstream Management LLC, a Delaware limited liability company and the general partner of RMP or Rice Energy and its subsidiaries other than Midstream Holdings).
The Midstream Holdings Revolving Credit Facility limits Midstream Holdings’ and its restricted subsidiaries’ ability to, among other things, incur or guarantee additional debt; redeem or repurchase units or make distributions under certain circumstances; make certain investments and acquisitions; incur certain liens or permit them to exist; enter into certain types of transactions with affiliates; merge or consolidate with another company; and transfer, sell or otherwise dispose of assets.
The Midstream Holdings Revolving Credit Facility will also require Midstream Holdings to maintain the following financial ratios:
96
Rice Energy Operating LLC
Notes to Consolidated Financial Statements
• | an interest coverage ratio, which is the ratio of Midstream Holdings’ consolidated EBITDA (as defined within the Midstream Holdings Revolving Credit Facility) to its consolidated current interest expense of at least 2.50 to 1.0 at each end of each fiscal quarter; and |
• | a consolidated total leverage ratio, which is the ratio of Midstream Holdings consolidated debt to its consolidated EBITDA, of not more than 4.25 to 1.0. |
The Midstream Holdings Revolving Credit Facility also contains certain financial covenants and customary events of default. If an event of default occurs and is continuing, the lenders may declare all amounts outstanding under the Midstream Holdings Revolving Credit Facility to be immediately due and payable. Midstream Holdings was in compliance with its covenants and ratios effective as of December 31, 2016.
RMP Revolving Credit Facility (e)
On December 22, 2014, Rice Midstream OpCo LLC (“Rice Midstream OpCo”), a wholly-owned subsidiary of the Partnership, entered into a revolving credit facility (the “RMP Revolving Credit Facility”) with Wells Fargo Bank, N.A., as administrative agent, and a syndicate of lenders. The RMP Revolving Credit Facility provides for lender commitments of $450.0 million with an additional $200.0 million of commitments available under an accordion feature, subject to lender approval. The RMP Revolving Credit Facility provides for a letter of credit sublimit of $50.0 million. In connection with the completion of the Partnership’s acquisition of the midstream assets associated with the Vantage Acquisition from the Company (the “Vantage Midstream Asset Acquisition”), on October 19, 2016, Rice Midstream OpCo entered into a second amendment (the “Second Amendment”) to its credit agreement to, among other things, (i) permit the completion of the Vantage Midstream Asset Acquisition, (ii) increase the Partnership’s ability to borrow under the facility from $450.0 million to $850.0 million, without exercise of any portion of the $200.0 million accordion feature and (iii) adjust the interest rate payable on amounts borrowed thereunder (as described below).
As of December 31, 2016, Rice Midstream OpCo had $190.0 million borrowings outstanding and no letters of credit under this facility, resulting in availability of $660.0 million. The average daily outstanding balance of the RMP Revolving Credit Facility was approximately $110.0 million and interest was incurred on the facility at a weighted average annual interest rate of 4.7% during 2016. The RMP Revolving Credit Facility is available to fund working capital requirements and capital expenditures, to purchase assets, to pay distributions and repurchase units and for general partnership purposes and matures on December 22, 2019. The Partnership is the guarantor of the obligations under the credit facility.
Principal amounts borrowed are payable on the maturity date, and interest is payable quarterly for base rate loans and at the end of the applicable interest period for Eurodollar loans. Under the RMP Revolving Credit Facility, Rice Midstream OpCo may elect to borrow in Eurodollars or at the base rate. Following the effectiveness of the Second Amendment, Eurodollar loans bear interest at a rate per annum equal to the applicable LIBOR Rate plus an applicable margin ranging from 200 to 300 basis points, depending on the leverage ratio then in effect, and base rate loans bear interest at a rate per annum equal to the greatest of (i) the agent bank’s reference rate, (ii) the federal funds effective rate plus 50 basis points and (iii) the rate for one month Eurodollar loans plus 100 basis points, plus an applicable margin ranging from 100 to 200 basis points, depending on the leverage ratio then in effect. Following the effectiveness of the Second Amendment, Rice Midstream OpCo also pays a commitment fee based on the undrawn commitment amount ranging from 37.5 to 50 basis points.
The RMP Revolving Credit Facility is secured by mortgages and other security interests on substantially all of RMP’s properties and guarantees from RMP and its restricted subsidiaries. The RMP Revolving Credit Facility limits the ability of RMP and its restricted subsidiaries to, among other things, incur or guarantee additional debt; redeem or repurchase units or make distributions under certain circumstances; make certain investments and acquisitions; incur certain liens or permit them to exist; enter into certain types of transactions with affiliates; merge or consolidate with another company; and transfer, sell or otherwise dispose of assets.
The RMP Revolving Credit Facility also requires RMP to maintain the following financial ratios:
• | an interest coverage ratio, which is the ratio of RMP’s consolidated EBITDA (as defined within the RMP Revolving Credit Facility) to its consolidated current interest expense of at least 2.50 to 1.0 at the end of each fiscal quarter; |
• | a consolidated total leverage ratio, which is the ratio of consolidated debt to consolidated EBITDA, of not more than 4.75 to 1.0, and after electing to issue senior unsecured notes, a consolidated total leverage ratio of not more than 5.25 to 1.0, and, in each case, with certain increases in the permitted total leverage ratio following the completion of a material acquisition; and |
97
Rice Energy Operating LLC
Notes to Consolidated Financial Statements
• | if RMP elects to issue senior unsecured notes, a consolidated senior secured leverage ratio, which is the ratio of consolidated senior secured debt to consolidated EBITDA, of not more than 3.50 to 1.0. |
The RMP Revolving Credit Facility also contains certain financial covenants and customary events of default. If an event of default occurs and is continuing, the lenders may declare all amounts outstanding under the RMP Revolving Credit Facility to be immediately due and payable. RMP was in compliance with its covenants and ratios effective as of December 31, 2016.
Expected Aggregate Maturities
Expected aggregate maturities of the notes payable as of December 31, 2016 are as follows (in thousands):
Year Ending December 31, 2017 | $ | — | |
Year Ending December 31, 2018 | — | ||
Year Ending December 31, 2019 | 243,000 | ||
Year Ending December 31, 2020 and Beyond | 1,279,481 | ||
Total | $ | 1,522,481 | |
Interest paid in cash was $98.7 million, $82.1 million and $36.7 million for the years ended December 31, 2016, 2015 and 2014, respectively. See Note 1 for information on capitalized interest.
5. | Derivative Instruments |
As discussed in Note 1, Rice Energy has entered into certain hedging agreements for the benefit of the Company, and, as such, the corresponding costs and benefits have been pushed down from Rice Energy to the Company. Derivative commodity instruments pushed down from Rice Energy to the Company are recorded as current and long-term receivable from parent and current and long-term payable to parent on the consolidated balance sheet.
The Company and Rice Energy use derivative commodity instruments that are placed with major financial institutions whose creditworthiness is regularly monitored. Substantially all of the Company’s and Rice Energy’s derivative counterparties share in the Senior Secured Revolving Credit Facility collateral. The Company and Rice Energy have entered into various derivative contracts to manage price risk and to achieve more predictable cash flows. As a result of the Company’s and Rice Energy’s hedging activities, the Company may realize prices that are greater or less than the market prices that it would have received otherwise.
As of December 31, 2016, the Company and Rice Energy have entered into derivative instruments with various financial institutions, fixing the price it receives for a portion of its futures sales of produced natural gas. The Company’s and Rice Energy’s fixed price derivatives primarily include swap and collar contracts that are tied to the commodity prices on NYMEX. As of December 31, 2016, the Company and Rice Energy have entered into NYMEX hedging contracts through December 31, 2020 covering a total of approximately 941 Bcf of our projected natural gas production at a weighted average price of $3.09 per MMBtu. Additionally, the Company and Rice Energy have entered into basis swap contracts to hedge the difference between the NYMEX index price and various local index prices. The fixed price and basis hedging contracts the Company and Rice Energy have entered into through December 31, 2021 at other various sales points cover a total of approximately 784 Bcf.
The Company recognizes all derivative instruments as either assets or liabilities at fair value per the FASB ASC 815. The Company’s derivative commodity instruments have not been designated as hedges for accounting purposes; therefore, all gains and losses are recognized currently in earnings. The following tables present the gross amounts of the Company’s recognized derivative assets and liabilities, the amounts offset under netting arrangements with counterparties, and the resulting net amounts presented in the consolidated balance sheets for the periods presented, all at fair value:
As of December 31, 2016 | |||||||||||
(in thousands) | Derivative instruments, gross | Derivative instruments subject to master netting arrangements | Derivative Instruments, net | ||||||||
Derivative assets | $ | 28,322 | $ | (16,887 | ) | $ | 11,435 | ||||
Derivative liabilities | $ | 172,200 | $ | (87,425 | ) | $ | 84,775 | ||||
As of December 31, 2015 | |||||||||||
(in thousands) | Derivative instruments, gross | Derivative instruments subject to master netting arrangements | Derivative Instruments, net | ||||||||
Derivative assets | $ | 263,247 | $ | (47,575 | ) | $ | 215,672 | ||||
Derivative liabilities | $ | 369 | $ | (2 | ) | $ | 367 | ||||
As of December 31, 2016, approximately $18.8 million and $71.4 million has been pushed down from Rice Energy to the Company and has been included in long-term receivable from parent and current payable to parent, respectively, on the consolidated balance sheet. In addition, as of December 31, 2015, approximately $47.1 million and $13.6 million has been pushed down from Rice Energy to the Company and has been included in current receivable from parent and long-term receivable from parent, respectively, on the consolidated balance sheet.
6. | Fair Value of Financial Instruments |
The Company determines the fair value of its financial instruments, which are comprised primarily of derivative instruments, on a recurring basis as these instruments are required to be recorded at fair value for each reporting period. Certain amounts in the Company’s financial statements were measured at fair value on a nonrecurring basis including discounts associated with long-term debt. Fair value is based on quoted market prices, where available. If quoted market prices are not available, fair value is based upon models that use as inputs market-based parameters, including but not limited to forward curves, discount rates, broker quotes, volatilities, and nonperformance risk.
The Company has categorized its fair value measurements into a three-level fair value hierarchy, based on the priority of the inputs to the valuation technique. The fair value hierarchy gives the highest priority to quoted prices in active markets for identical assets and liabilities (Level 1) and the lowest priority to unobservable inputs (Level 3). The Company’s fair value measurements relating to derivative instruments are included in Level 2. Since the adoption of fair value accounting, the Company has not made any changes to its classification of financial instruments in each category.
Items included in Level 3 are valued using internal models that use significant unobservable inputs. Items included in Level 2 are valued using management’s best estimate of fair value corroborated by third-party quotes.
The following assets and liabilities were measured at fair value on a recurring basis during the period (refer to Note 5 for details relating to derivative instruments):
As of December 31, 2016 | |||||||||||||||||||
Fair Value Measurements at Reporting Date Using | |||||||||||||||||||
(in thousands) | Carrying Value | Total Fair Value | Quoted Prices in Active Markets for Identical Assets (Level 1) | Significant Other Observable Inputs (Level 2) | Significant Unobservable Inputs (Level 3) | ||||||||||||||
Assets: | |||||||||||||||||||
Derivative instruments, at fair value | $ | 11,435 | $ | 11,435 | $ | — | $ | 11,435 | $ | — | |||||||||
Total assets | $ | 11,435 | $ | 11,435 | $ | — | $ | 11,435 | $ | — | |||||||||
Liabilities: | |||||||||||||||||||
Derivative instruments, at fair value | $ | 84,775 | $ | 84,775 | $ | — | $ | 84,775 | $ | — | |||||||||
Total liabilities | $ | 84,775 | $ | 84,775 | $ | — | $ | 84,775 | $ | — | |||||||||
98
Rice Energy Operating LLC
Notes to Consolidated Financial Statements
As of December 31, 2015 | |||||||||||||||||||
Fair Value Measurements at Reporting Date Using | |||||||||||||||||||
(in thousands) | Carrying Value | Total Fair Value | Quoted Prices in Active Markets for Identical Assets (Level 1) | Significant Other Observable Inputs (Level 2) | Significant Unobservable Inputs (Level 3) | ||||||||||||||
Assets: | |||||||||||||||||||
Derivative instruments, at fair value | $ | 215,672 | $ | 215,672 | $ | — | $ | 215,672 | $ | — | |||||||||
Total assets | $ | 215,672 | $ | 215,672 | $ | — | $ | 215,672 | $ | — | |||||||||
Liabilities: | |||||||||||||||||||
Derivative instruments, at fair value | 367 | 367 | — | 367 | — | ||||||||||||||
Total liabilities | $ | 367 | $ | 367 | $ | — | $ | 367 | $ | — | |||||||||
The carrying value of cash equivalents, amounts receivable and payable to parent, accounts receivable and accounts payable approximate fair value due to the short maturity of the instruments. The Company’s non-financial assets, such as property, plant and equipment, goodwill and intangible assets are recorded at fair value upon business combination and are remeasured at fair value only if an impairment charge is recognized. To the extent necessary, the Company applies unobservable inputs and management judgment due to the absence of quoted market prices (Level 3) to the valuation methodologies for these non-financial assets.
The estimated fair value and gross carrying amount of long-term debt as reported on the consolidated balance sheets as of December 31, 2016 and 2015 is shown in the table below (refer to Note 4 for details relating to the debt instruments). The fair value was estimated using Level 2 inputs based on rates reflective of the remaining maturity as well as the Company’s financial position. The gross carrying value of the revolving credit facilities approximates fair value for the periods presented below.
As of December 31, 2016 | As of December 31, 2015 | ||||||||||||||
Long-Term Debt (in thousands) | Carrying Value | Fair Value | Carrying Value | Fair Value | |||||||||||
Senior Notes Due 2022(1) | $ | 900,000 | $ | 929,250 | $ | — | $ | — | |||||||
Senior Notes Due 2023(1) | 397,601 | 428,000 | — | — | |||||||||||
Midstream Holdings Revolving Credit Facility | 53,000 | 53,000 | 17,000 | 17,000 | |||||||||||
RMP Revolving Credit Facility | 190,000 | 190,000 | 143,000 | 143,000 | |||||||||||
Total | $ | 1,540,601 | $ | 1,600,250 | $ | 160,000 | $ | 160,000 | |||||||
(1) | For periods prior October 19, 2016, Rice Energy was the primary obligor of the indentures governing the Notes and was the borrower under the Senior Secured Revolving Credit Facility, and, as such, the carrying value less deferred financing costs on original issuance discounts of long-term debt associated with the Notes was pushed down from Rice Energy. As of December 31, 2015, the gross carrying value of the 2022 Notes and 2023 Notes was $900.0 million and $397.2 million, respectively. The Company recorded these balances as a long-term payable to parent on the consolidated balance sheet. As of December 31, 2015, the fair value of the 2022 Notes and 2023 Notes was $650.3 million and $294.0 million, respectively. |
7. | Rice Midstream Partners LP |
In August 2014, the Company formed the Partnership to own, operate, develop and acquire midstream assets in the Appalachian Basin. The Partnership’s assets consist of gathering pipelines and compressor stations, as well as water handling and treatment facilities. The Partnership provides gathering and compression and water services to the Company and third parties.
The Partnership completed its IPO in December 2014, issuing 28,750,000 common units representing limited partner interests in the Partnership, which represented 50% of the Partnership’s outstanding equity. The Company retained a 50% limited partner interest in the Partnership, consisting of 3,623 common units and 28,753,623 subordinated units. In connection with the RMP IPO, the Company contributed to the Partnership 100% of Rice Poseidon Midstream LLC. Rice Midstream Management LLC, a wholly-owned subsidiary of the Company, serves as the general partner of the Partnership.
99
Rice Energy Operating LLC
Notes to Consolidated Financial Statements
In February 2016, Midstream Holdings assigned all of its equity interests in the Partnership, consisting of 3,623 common units, 28,753,623 subordinated units and all of its incentive distribution rights in the Partnership, to GP Holdings.
In June 2016, the Partnership completed an underwritten public offering of 9,200,000 common units representing limited partner interests in the Partnership at a price to the public of $18.50 per unit, which included 1,200,000 common units sold pursuant to the exercise of the underwriters’ option to purchase additional units. After deducting underwriting discounts and commissions of approximately $6.0 million and transaction costs, the Partnership received net proceeds of approximately $164.1 million. The Partnership used a portion of the net proceeds to repay outstanding debt and the remainder for general partnership purposes, including acquisitions and capital expenditures.
During the second quarter of 2016, the Partnership entered into an equity distribution agreement that established an at-the-market common unit offering program (the “ATM program”), pursuant to which the Partnership may sell from time to time through a group of managers, acting as the Partnership’s sales agents, the Partnership’s common units having an aggregate offering price of up to $100.0 million. As of December 31, 2016, the Partnership had issued and sold 944,700 common units at an average price per unit of $17.21 through its ATM program. The Partnership used the net proceeds of $15.8 million for general partnership purposes, including repayment of outstanding debt, acquisitions and capital expenditures.
On September 26, 2016, Rice Energy entered into the Midstream Purchase Agreement by and between Rice Energy and the Partnership. Pursuant to the terms of the Midstream Purchase Agreement, as amended, immediately following the close of the Vantage Acquisition on October 19, 2016, the Partnership acquired from the Company the Vantage Midstream Entities. The Partnership’s acquisition of the Vantage Midstream Entities from the Company is accounted for as a combination of entities under common control at historical cost. In consideration for the acquisition of the Vantage Midstream Asset Acquisition, the Partnership paid the Company $600.0 million in aggregate cash consideration, which the Partnership funded through the net proceeds of a private placement of Partnership common units and borrowings under its revolving credit facility. In addition, in connection with the Vantage Midstream Asset Acquisition, the Partnership acquired a 67.5% interest in the Wind Ridge Gathering System previously owned by Access Midstream Partners for approximately $14.3 million, of which $10.9 million was ascribed to property and equipment and $3.4 million to goodwill.
On October 7, 2016, the Partnership issued 20,930,233 common units representing limited partner interests in the Partnership in a private placement (the “Private Placement”) for gross proceeds of approximately $450.0 million, or $21.50 per unit. After deducting underwriting discounts and commissions of approximately $9.4 million, the Partnership received net proceeds of $440.6 million. The Partnership used the proceeds of the Private Placement to fund a portion of the Vantage Midstream Asset Acquisition.
The following table presents the Partnership’s common and subordinated units issued from January 1, 2015 through December 31, 2016:
Limited Partners | GP Holdings | ||||||||||
Common | Subordinated | Total | Ownership % | ||||||||
Balance, January 1, 2015 | 28,753,623 | 28,753,623 | 57,507,246 | 50 | % | ||||||
Equity offering in November 2015 | 13,409,961 | — | 13,409,961 | ||||||||
Vested phantom units, net | 165 | — | 165 | ||||||||
Balance, December 31, 2015 | 42,163,749 | 28,753,623 | 70,917,372 | 41 | % | ||||||
Private placement in June 2016 | 9,200,000 | — | 9,200,000 | ||||||||
Equity offering in October 2016 | 20,930,233 | — | 20,930,233 | ||||||||
Common units issued under ATM program | 944,700 | — | 944,700 | ||||||||
Vested phantom units, net | 280,451 | — | 280,451 | ||||||||
Balance, December 31, 2016 | 73,519,133 | 28,753,623 | 102,272,756 | 28 | % | ||||||
As of December 31, 2016 and 2015, GP Holdings owned approximately 28% and 41%, respectively, and the Company indirectly owned approximately 26% and 41% of the Partnership, respectively, consisting of 3,623 common units, 28,753,623 subordinated units and all of the incentive distribution rights. The 16.49% membership interest in the Company owned by the Vantage Sellers does not impact the Company’s indirect ownership in the Partnership.
The Company consolidates the results of the Partnership and records an income tax provision only as to its ownership percentage. The Company records the noncontrolling interest of the public limited partners in its consolidated financial statements for net income of the Partnership attributed to third party unitholders for periods subsequent to the RMP IPO. Net
100
Rice Energy Operating LLC
Notes to Consolidated Financial Statements
income attributable to noncontrolling interests, before taking into consideration EIG’s 8.25% ownership interest in GP Holdings, was $80.0 million and $23.3 million for the years ended December 31, 2016 and 2015, respectively.
On January 20, 2017, the Board of Directors of the Partnership’s general partner declared a cash distribution to the Partnership’s unitholders for the fourth quarter of 2016 of $0.2505 per common and subordinated unit. The cash distribution was paid on February 16, 2017 to unitholders of record at the close of business on February 7, 2017. Also on February 16, 2017, a cash distribution of $0.9 million was made to GP Holdings related to its incentive distribution rights in the Partnership in accordance with the Partnership agreement.
101
Rice Energy Operating LLC
Notes to Consolidated Financial Statements
8. | Financial Information by Business Segment |
As a result of changes to the Company’s operations in the first quarter of 2016, management evaluated how the Company is organized and operates and identified the Exploration and Production segment, the Rice Midstream Holdings segment and the Rice Midstream Partners segment as separate operating segments. The segments represent components of the Company that engage in activities (a) from which revenue is earned and expenses are incurred; (b) whose operating results are regularly reviewed by the Chief Operating Decision Maker, who makes decisions about resources to be allocated to the segment and (c) for which discrete financial information is available. As a result of the changes to the Company’s operating segments, all prior period information has been revised to reflect the new operating segment structure. Operating segments are evaluated on their contribution to the Company’s consolidated results based on operating income. Other income and expenses, interest and income taxes are managed on a consolidated basis. The segment accounting policies are the same as those described in Note 1 of this report.
The operating results and assets of the Company’s reportable segments were as follows as of and for the year ended December 31, 2016:
(in thousands) | Exploration and Production | Rice Midstream Holdings | Rice Midstream Partners | Elimination of Intersegment Transactions | Consolidated Total | |||||||||||||||
Total operating revenues | $ | 677,849 | $ | 63,934 | $ | 201,623 | $ | (164,500 | ) | $ | 778,906 | |||||||||
Total operating expenses | 844,756 | 50,325 | 74,681 | (125,826 | ) | 843,936 | ||||||||||||||
Operating (loss) income | $ | (166,907 | ) | $ | 13,609 | $ | 126,942 | $ | (38,674 | ) | $ | (65,030 | ) | |||||||
Segment assets | $ | 6,079,590 | $ | 360,292 | $ | 1,399,217 | $ | (62,517 | ) | $ | 7,776,582 | |||||||||
Goodwill | $ | 384,431 | $ | — | $ | 494,580 | $ | — | $ | 879,011 | ||||||||||
Depreciation, depletion and amortization | $ | 350,187 | $ | 5,760 | $ | 25,170 | $ | (12,662 | ) | $ | 368,455 | |||||||||
Capital expenditures for segment assets | $ | 674,681 | $ | 110,889 | $ | 118,087 | $ | (38,673 | ) | $ | 864,983 | |||||||||
The operating results and assets of the Company’s reportable segments were as follows as of and for the year ended December 31, 2015:
(in thousands) | Exploration and Production | Rice Midstream Holdings | Rice Midstream Partners | Elimination of Intersegment Transactions | Consolidated Total | |||||||||||||||
Total operating revenues | $ | 452,962 | $ | 27,364 | $ | 114,459 | $ | (92,644 | ) | $ | 502,141 | |||||||||
Total operating expenses | 944,117 | 13,671 | 52,423 | (69,903 | ) | 940,308 | ||||||||||||||
Operating (loss) income | $ | (491,155 | ) | $ | 13,693 | $ | 62,036 | $ | (22,741 | ) | $ | (438,167 | ) | |||||||
Segment assets | $ | 2,803,827 | $ | 300,148 | $ | 689,790 | $ | (23,844 | ) | $ | 3,769,921 | |||||||||
Goodwill | $ | — | $ | — | $ | 39,142 | $ | — | $ | 39,142 | ||||||||||
Depreciation, depletion and amortization | $ | 308,194 | $ | 2,786 | $ | 16,399 | $ | (4,595 | ) | $ | 322,784 | |||||||||
Capital expenditures for segment assets | $ | 858,139 | $ | 156,013 | $ | 248,463 | $ | (27,336 | ) | $ | 1,235,279 | |||||||||
102
Rice Energy Operating LLC
Notes to Consolidated Financial Statements
The operating results and assets of the Company’s reportable segments were as follows as of and for the year ended December 31, 2014:
(in thousands) | Exploration and Production | Rice Midstream Holdings | Rice Midstream Partners | Elimination of Intersegment Transactions | Consolidated Total | |||||||||||||||
Total operating revenues | $ | 385,438 | $ | 852 | $ | 6,448 | $ | (1,796 | ) | $ | 390,942 | |||||||||
Total operating expenses | 356,019 | 10,126 | 37,015 | (1,796 | ) | 401,364 | ||||||||||||||
Operating income (loss) | $ | 29,419 | $ | (9,274 | ) | $ | (30,567 | ) | $ | — | $ | (10,422 | ) | |||||||
Segment assets | $ | 2,702,252 | $ | 149,044 | $ | 443,091 | $ | — | $ | 3,294,387 | ||||||||||
Goodwill | $ | 294,908 | $ | — | $ | 39,142 | $ | — | $ | 334,050 | ||||||||||
Depreciation, depletion and amortization | $ | 151,900 | $ | 205 | $ | 4,165 | $ | — | $ | 156,270 | ||||||||||
Capital expenditures for segment assets | $ | 685,662 | $ | 107,319 | $ | 169,826 | $ | — | $ | 962,807 | ||||||||||
9. | Commitments and Contingencies |
On October 14, 2013, the Company entered into a Development Agreement and Area of Mutual Interest Agreement (collectively, the “Utica Development Agreements”) with Gulfport covering approximately 50,000 aggregate net acres in the Utica Shale in Belmont County, Ohio. Pursuant to the Utica Development Agreements, the Company had approximately 68.7% participating interest in acreage currently owned or to be acquired by the Company or Gulfport located within Goshen and Smith Townships (the “Northern Contract Area”) and an approximately 48.2% participating interest in acreage currently owned or to be acquired by the Company or Gulfport located within Wayne and Washington Townships (the “Southern Contract Area”), each within Belmont County, Ohio. The majority of the remaining participating interests are held by Gulfport. The participating interests of the Company and Gulfport in each of the Northern and Southern Contract Areas approximated the Company’s then-current relative acreage positions in each area.
The Utica Development Agreements have terms of ten years and are terminable upon 90 days’ notice by either party; provided that, with respect to interests included within a drilling unit, such interests shall remain subject to the applicable joint operating agreement and the Company and Gulfport shall remain operators of drilling units located in the Northern and Southern Contract Areas, respectively, following such termination.
Firm Transportation
The Company has commitments for gathering and firm transportation under existing contracts with third parties. Future payments under these contracts as of December 31, 2016 totaled $4,917.2 million (2017 - $165.6 million, 2018 - $240.7 million, 2019 - $234.0 million, 2020 - $233.7 million, 2021 - $233.4 million and thereafter - $3,809.8 million).
Drilling Rig Service Commitments
The Company has three horizontal rigs under contract, of which two expire in 2017 and one expires in 2018. The Company also has one tophole drilling rig under contract, which expires in 2018. Future payments under these contracts as of December 31, 2016 totaled $36.7 million (2017 - $27.7 million and 2018 - $9.0 million). Any other rig performing work for the Company is performed on a well-by-well basis and therefore can be released without penalty at the conclusion of drilling on the current well, the costs of which have not been included in the amounts above. The values above represent the gross amounts that the Company is committed to pay without regard to its proportionate share based on its working interest.
Frac Sand Commitments
Commencing in January 2017, the Company has commitments for frac sand to be used as a proppant in its hydraulic fracturing operations. Future commitments under these contracts as of December 31, 2016 totaled $45.7 million (2017 - $15.2 million, 2018 - $15.2 million and 2019 - $15.4 million).
Litigation
From time to time the Company is party to various legal and/or regulatory proceedings arising in the ordinary course of business. While the ultimate outcome and impact to the Company cannot be predicted with certainty, the Company believes that all such matters are without merit and involve amounts which, if resolved unfavorably, either individually or in the
103
Rice Energy Operating LLC
Notes to Consolidated Financial Statements
aggregate, will not have a material adverse effect on its financial condition, results of operations or cash flows. When it is determined that a loss is probable of occurring and is reasonably estimable, the Company accrues an undiscounted liability for such contingencies based on its best estimate using information available at the time. The Company discloses contingencies where an adverse outcome may be material, or in the judgment of management, the matter should otherwise be disclosed.
In 2016, the Company reached a settlement with the Pennsylvania Department of Environmental Protection (“PADEP”) related to civil penalties for certain Notices of Violations (“NOVs”) received from December 2011 through April 2016 under the Clean Streams Law, the 2012 Oil and Gas Act, the Solid Waste Management Act, and the Dam Safety and Encroachments Act and has paid fines to settle such NOVs with the PADEP for $3.6 million.
10. | Mezzanine Equity |
On February 17, 2016, Rice Energy, Midstream Holdings and GP Holdings entered into a securities purchase agreement (the “Securities Purchase Agreement”) with EIG Energy Fund XVI, L.P., EIG Energy Fund XVI-E, L.P., and EIG Holdings (RICE) Partners, LP (collectively, the “Investors”) pursuant to which (i) Midstream Holdings agreed to issue and sell 375,000 Series B Units (“Series B Units”) with an aggregate liquidation preference of $375.0 million and (ii) GP Holdings agreed to issue and sell common units representing an 8.25% limited partner interest in GP Holdings (“GP Common Units”) for aggregate consideration of $375.0 million in a private placement (the “Midstream Holdings Investment”) exempt from the registration requirements under the Securities Act. In conjunction with the Securities Purchase Agreement, Midstream Holdings issued 1,000 Series A Units to the Company. The Midstream Holdings Investment closed on February 22, 2016 (the “Closing Date”).
In connection with the Closing Date, (i) the Company and the Investors entered into the Amended and Restated Limited Liability Company Agreement of Midstream Holdings (the “LLC Agreement”), which defines the preferences, rights, powers and duties of holders of the Series B Units and (ii) Rice Midstream GP Management LLC (“GP Management”), as general partner of GP Holdings, and Midstream Holdings and the Investors, as limited partners, entered into the Amended and Restated Agreement of Limited Partnership of GP Holdings, which defines the preferences, rights, powers and duties of holders of the GP Holdings Common Units (the “GP Holdings A&R LPA”).
In connection with the Midstream Holdings Investment, Midstream Holdings received gross proceeds of $375.0 million, less transaction fees and expenses of approximately $6.2 million. Midstream Holdings used approximately $69.0 million of the proceeds to reduce outstanding borrowings under the Midstream Holdings Revolving Credit Facility, and $300.0 million was distributed to the Company.
Series B Units
Pursuant to the LLC Agreement, the Series B Units rank senior to all other equity interests in Midstream Holdings with respect to the payment of distributions and distribution of assets upon liquidation, dissolution and winding up. The Series B Units will pay quarterly distributions at a rate of 8% per annum, payable in cash or “in-kind” through the issuance of additional Series B Units, subject to certain exceptions, at Midstream Holdings’ option for the first two years, and in cash thereafter. Distributions are payable on January 1, April 1, July 1 and October 1 of each year that the Series B Units remain outstanding. For the year ended December 31, 2016, the Company paid $26.2 million in distributions, of which $14.7 million was paid in cash and $11.5 million was paid in-kind.
The Investors holding Series B Units have the option to require Midstream Holdings to redeem the Series B Units on or after the tenth anniversary of the Closing Date at an amount equal to $1,000 per Series B Unit plus any accrued and unpaid distributions (the “Liquidation Preference”). The Series B Units are subject to an optional cash redemption by Midstream Holdings after the third anniversary of the Closing Date, at an amount equal to the Liquidation Preference. If any of Rice Energy, the Partnership or Midstream Holdings undergoes a Change in Control (as defined in the Securities Purchase Agreement), the Investors have the right to require Midstream Holdings to repurchase any or all of the Series B Units for cash, and Midstream Holdings has the right to repurchase any or all of the Series B Units for cash. The holders of the Series B units do not have the power to vote or dispose of the equity interest in the Partnership held by GP Holdings.
In relation to the Series B Units, the occurrence of certain events or violations of certain financial and non-financial restrictions will constitute “Triggering Events” (as defined in the Securities Purchase Agreement) that may result in various consequences, including additional restrictions on the activities of Midstream Holdings, including the termination of the Investor’s additional commitment, increases in the distribution rate, additional governance rights for the Investors and other measures depending on the applicable Triggering Event. As of December 31, 2016, the Company views the likelihood of the occurrence of a Triggering Event to be remote.
104
Rice Energy Operating LLC
Notes to Consolidated Financial Statements
In the event that Midstream Holdings or GP Holdings pursues an initial public offering, Midstream Holdings may redeem the Series B Units at a redemption price equal to the Liquidation Preference on the date of the closing of the applicable initial public offering plus all additional distributions that would have otherwise been paid through the third anniversary of the Closing Date. Midstream Holdings may satisfy this redemption price in cash or common equity interests of the entity that completes an initial public offering. In the event of any liquidation and winding up of Midstream Holdings, profits and losses will be allocated to the holders of the Series B Units so that, to the maximum extent possible, the capital accounts of the Series B unitholders will equal the aggregate Liquidation Preference.
GP Common Units
Pursuant to the GP Holdings A&R LPA, the holders of the GP Common Units are entitled to distributions of GP Holdings in proportion to their pro rata share of the outstanding GP Common Units. Distributions will occur upon GP Holdings receipt of any distributions of cash in respect of the equity interests in the Partnership held by GP Holdings.
The Investors holding GP Common Units have tag-along rights in connection with a sale of the common equity interests in GP Holdings to a third-party. The holders of GP Common Units will have drag-along rights in connection with a sale of the majority of the common equity interests in GP Holdings to a third-party, subject to the achievement of an agreed-upon minimum return. If a qualifying initial public offering of GP Holdings is not consummated prior to the fifth anniversary of the Closing Date, the holders of the GP Common Units shall have the right to require GP Holdings to repurchase all of their GP Common Units for cash in an aggregate purchase price of $125.0 million. In the event of a Change in Control or a GP Change in Control (as each term is defined in the GP Holdings A&R LPA) of Rice Energy, Midstream Holdings or GP Holdings, the Purchasers shall have the right to require GP Holdings to repurchase all of their GP Common Units for an aggregate purchase price of $125.0 million. The holders of the GP Common Units do not have the power to vote or dispose of the Partnership’s units held by GP Holdings.
In the event GP Holdings sells any of its assets, subject to certain exceptions, GP Holdings may only make distributions of such proceeds to the extent that GP Holdings meets certain requirements, including the requirement to retain a certain amount of cash or cash equivalents following the sale of such assets. In the event of any liquidation and winding up of GP Holdings, GP Management, in its capacity as general partner, will appoint a liquidator to wind up the affairs and make final distributions as provided for in the GP Holdings A&R LPA.
From September 30, 2016 until the eighteen-month anniversary of the closing of the Midstream Holdings Investment, upon the satisfaction of certain financial and operational metrics, Midstream Holdings has the right to require the Investors to purchase additional Series B Units and GP Common Units. Midstream Holdings may require the Investors to purchase at least $25.0 million of additional units on up to three occasions, up to a total aggregate amount of $125.0 million. Pursuant to the Securities Purchase Agreement, Midstream Holdings is required to pay the Investors a quarterly cash commitment fee of 2% per annum on any undrawn amounts of the additional $125.0 million commitment. The commitment fee paid in cash was approximately $2.1 million for the year ended December 31, 2016. No additional units have been purchased by the Investors since the closing of the Midstream Holdings Investment.
As the Investors have an option to redeem the Series B Units and GP Common Units for cash at a future date, the proceeds from the redeemable noncontrolling interest (net of accretion and issuances costs and fees) are not considered to be a component of stockholders’ equity on the consolidated balance sheet, and such Series B Units and GP Common Units are reported as mezzanine equity on the consolidated balance sheet. The following table represents the value allocated to the Series B Units and GP Common Units at inception.
(in thousands) | |||
At Inception | |||
Noncontrolling interest in Series B Units | $ | 341,661 | |
Noncontrolling interest in GP Holdings Common Units | 33,339 | ||
Less: issuance costs and fees | (6,242 | ) | |
Carrying amount of redeemable noncontrolling interest at inception | $ | 368,758 | |
105
Rice Energy Operating LLC
Notes to Consolidated Financial Statements
While the Series B Units are not currently redeemable, the initial value allocated to them will be accreted to their full redemption value through February 22, 2026 using the effective interest rate method, as it is considered probable that they will become redeemable. The following table represents detail of the balance of redeemable noncontrolling interest, net on the consolidated balance sheet as of December 31, 2016.
(in thousands) | |||
As of December 31, 2016 | |||
Face amount of Series B Units | $ | 375,000 | |
Plus: distributions paid in kind | 11,504 | ||
Less: discount | (31,592 | ) | |
Carrying amount of noncontrolling interest in Series B Units | 354,912 | ||
Plus: noncontrolling interest in GP Holdings Common Units | 33,339 | ||
Less: unamortized issuance costs and fees | (5,726 | ) | |
Redeemable noncontrolling interest, net | $ | 382,525 | |
11. | Lease Obligations |
The Company leases drilling rights under agreements which expire at various times. In addition, the Company leases various office spaces under lease agreements. The following represents the future minimum lease payments under these agreements as of December 31, 2016:
(in thousands) | |||
2017 | $ | 27,878 | |
2018 | 13,536 | ||
2019 | 5,165 | ||
2020 | 3,772 | ||
2021 and thereafter | 39,999 | ||
Total future minimum lease payments | $ | 90,350 | |
Current lease obligations related to future minimum payments for leasehold bonuses are included in leasehold payable in the accompanying consolidated balance sheets.
106
Rice Energy Operating LLC
Notes to Consolidated Financial Statements
12. | Asset Retirement Obligations |
The Company is subject to certain legal requirements which result in recognition of a liability related to the obligation to incur future plugging and abandonment costs of oil and gas producing facilities and costs to reclaim drilling sites and dismantle and reclaim or dispose of water services assets, wells and related structures. The Company records a liability for such asset retirement obligations and capitalizes a corresponding amount for asset retirement costs. The liability is estimated using the present value of expected future cash flows, adjusted for inflation and discounted at the Company’s credit adjusted risk-free rate. The current portion of asset retirement obligations are recorded in other accrued liabilities and the long term portion of asset retirement obligations are recorded in other long-term liabilities on the consolidated balance sheets.
A reconciliation of the beginning and ending aggregate carrying amount of asset retirement obligations for the years ended December 31, 2016 and 2015 is as follows:
(in thousands) | |||
Balance at December 31, 2014 | $ | 9,542 | |
Liabilities incurred | 5,198 | ||
Liabilities settled | (1,131 | ) | |
Accretion expense | 890 | ||
Revisions in estimated cash flows | (3,085 | ) | |
Balance at December 31, 2015 | $ | 11,414 | |
Liabilities incurred | 1,692 | ||
Liabilities assumed in Vantage Acquisition | 33,401 | ||
Liabilities settled | (46 | ) | |
Accretion expense | 1,372 | ||
Revisions in estimated cash flows (1) | 25,708 | ||
Balance at December 31, 2016 | $ | 73,540 | |
(1) | Current year revisions relate to an increase in the Company’s estimated cost to plug and abandon wells due to increased regulation of the locations in which the Company operates, as well as increases in estimated service costs. |
13. Unitholders’ Capital
As partial consideration for the Vantage Acquisition, the Vantage Sellers were issued 40.0 million REO common units immediately convertible into a proportionate number of shares of Rice Energy common stock, valued at approximately $1.0 billion. In addition, the Vantage Sellers were issued 1/1,000th of a share of Rice Energy Class A Preferred Stock (“Preferred Stock”) for each common unit they received. These shares of Preferred Stock are intended to provide holders with non-economic voting rights in the Company and are canceled upon redemption of the associated REO common units. As of December 31, 2016, Rice Energy and the Vantage Sellers held an 83.51% and 16.49% membership interest in the Company, respectively.
The following table presents the outstanding common units owned by Rice Energy and the Vantage Sellers along with their respective ownership percentages in the Company as of December 31, 2016.
Unitholders | Common Units | Preferred Stock | Unitholders’ Ownership (%) | ||||||
Rice Energy | 202,606,908 | — | 83.51 | % | |||||
Vantage Sellers | 40,000,000 | 40,000 | 16.49 | % | |||||
Total | 242,606,908 | 40,000 | 100.00 | % | |||||
107
Rice Energy Operating LLC
Notes to Consolidated Financial Statements
14. | Incentive Units |
In connection with Rice Energy’s IPO and the related corporate reorganization, the Company’s incentive unit holders contributed their incentive units in the Company to NGP Holdings and Rice Energy Holdings LLC (“Rice Holdings”) in return for (i) incentive units in such entities that, in the aggregate, were substantially similar to the Company’s incentive units they previously held and (ii) shares of common stock in the amount of $3.4 million related to the extinguishment of the incentive burden attributable to Mr. Daniel J. Rice III. No payments were made in respect of incentive units prior to the completion of Rice Energy’s IPO. As a result of the IPO, the payment likelihood related to the NGP Holdings and Rice Holdings incentive units was deemed probable, requiring the Company to recognize compensation expense. The compensation expense related to these interests is treated as a contribution from parent from NGP Holdings and Rice Holdings in the Company’s financial statements. The compensation expense recognized is a non-cash charge, with the settlement obligation resting on NGP Holdings and Rice Holdings, and as such the incentive units are not dilutive to the Company.
NGP Holdings
The NGP Holdings incentive units are considered a liability-based award and are adjusted to fair market value on a quarterly basis until all payments have been made. As a result of NGP’s sale of its remaining shares of Rice Energy’s common stock in connection with Rice Energy’s April 2016 Equity Offering, NGP Holdings paid approximately $47.5 million to holders of certain classes of NGP Holdings incentive units which resulted in the settlement of the remaining NGP Holdings incentive unit obligation. As such, the cumulative expense attributable to the NGP Holdings incentive units as of June 30, 2016 was adjusted to equal the cumulative cash payments made by NGP Holdings to NGP Holdings incentive unit holders. As a result, the Company recognized $27.3 million of compensation expense for the year ended December 31, 2016. No future expense will be recognized related to the NGP Holdings incentive units as a result of the April 2016 settlement of the remaining NGP Holdings incentive unit obligation. The Company recognized ($24.3) million and $44.5 million of non-cash compensation (income) expense for the twelve months ended December 31, 2015 and 2014.
Rice Holdings
The Rice Holdings incentive units are considered an equity-based award with the fair value of the award determined at the grant date and amortized over the service period of the award using the straight-line method. Compensation expense relative to the Rice Holdings incentive units was $24.5 million, $33.7 million and $41.7 million for the year ended December 31, 2016, 2015 and 2014, respectively. The Company will recognize approximately $14.7 million of additional compensation expense over the next year related to the Rice Holdings incentive units.
In August 2014, the triggering event for the Rice Holdings incentive units was achieved. As a result, in September 2014, 2015, and 2016 Rice Holdings distributed one quarter, one third and one half, respectively, of its then-remaining assets (consisting solely of shares of Rice Energy’s common stock) to its members pursuant to the terms of its limited liability company agreement. In addition, in September 2017, Rice Holdings will distribute all of its then-remaining assets (consisting solely of shares of Rice Energy’s common stock) to its members pursuant to the terms of its limited liability company agreement. As a result, over time, the shares of Rice Energy’s common stock held by Rice Holdings will be transferred in their entirety to the members of Rice Holdings.
Combined
Total combined compensation expense (income) attributable to the incentive units was $51.8 million, $36.1 million and $106.0 million for the year ended December 31, 2016, 2015 and 2014, respectively. Of the total compensation expense recognized for the year ended December 31, 2015, approximately $12.8 million related to changes in certain service condition assumptions.
The three tranches of the incentive units having a time vesting feature were fully vested as of December 31, 2016.
Two tranches of the incentive units do not have a time vesting feature, and their payouts are triggered upon a future payment condition. As such, none of these awards have legally vested as of December 31, 2016. The fair value of the incentive units was estimated using a Monte Carlo simulation valuation model with the following assumptions:
108
Rice Energy Operating LLC
Notes to Consolidated Financial Statements
Rice Holdings | ||
Valuation Date | 1/29/2014 | |
Dividend Yield | 0.00 | % |
Expected Volatility | 47.00 | % |
Risk-Free Rate | 1.11 | % |
Expected Life (Years) | 4.0 | |
Rice Holdings | ||
Valuation Date | 4/14/2014 | |
Dividend Yield | 0.00 | % |
Expected Volatility | 45.19 | % |
Risk-Free Rate | 1.13 | % |
Expected Life (Years) | 3.8 | |
Rice Holdings | ||
Valuation Date | 4/16/2014 | |
Dividend Yield | 0.00 | % |
Expected Volatility | 44.32 | % |
Risk-Free Rate | 1.18 | % |
Expected Life (Years) | 3.8 | |
15. | Variable Interest Entities |
Pursuant to an evaluation performed upon adoption of ASU 2015-02, “Consolidation (Topic 810): Amendments to the Consolidation Analysis,” the Company concluded that the Partnership, GP Holdings, and Strike Force Midstream each meet the criteria for variable interest entity (“VIE”) classification, as described in further detail below.
Rice Midstream Partners LP
The Company evaluated the Partnership for consolidation and determined the Partnership to be a VIE. The Company determined that the primary beneficiary of the Partnership is GP Holdings. As of December 31, 2016, Midstream Holdings held a significant indirect interest in the Partnership through (i) its ownership of a 91.75% limited liability partnership interest in GP Holdings, which owned an approximate 28% limited partner interest in the Partnership, and (ii) through ownership of its wholly-owned subsidiary Rice Midstream Management LLC (the “GP”), which holds all of the substantive voting and participating rights in the Partnership. As a result, through this ownership, the Company holds the power to direct the activities of the Partnership that most significantly impact the Partnership’s economic performance and the obligation to absorb losses or the right to receive benefits from the Partnership that could potentially be significant to the Partnership.
As of December 31, 2016, the Company consolidated the Partnership, recording noncontrolling interest related to the net income of the Partnership attributable to its public unitholders. The following table presents summary information of assets and liabilities of the Partnership that is included in the Company’s consolidated balance sheets that are for the use or obligation of the Partnership.
109
Rice Energy Operating LLC
Notes to Consolidated Financial Statements
(in thousands) | December 31, 2016 | December 31, 2015 | |||||
Assets (liabilities): | |||||||
Cash | $ | 21,834 | $ | 7,597 | |||
Accounts receivable | 8,758 | 9,926 | |||||
Other current assets | 64 | 192 | |||||
Property and equipment, net | 805,027 | 578,026 | |||||
Goodwill and intangible assets, net | 539,105 | 85,301 | |||||
Deferred financing costs, net | 12,591 | 2,310 | |||||
Accounts payable | (4,172 | ) | (13,484 | ) | |||
Accrued capital expenditures | (9,074 | ) | (15,277 | ) | |||
Other current liabilities | (8,376 | ) | (3,067 | ) | |||
Long-term debt | (190,000 | ) | (143,000 | ) | |||
Other long-term liabilities | (5,189 | ) | (3,128 | ) | |||
The following table presents summary information of the Partnership’s financial performance included in the consolidated statements of operations and cash flows for the twelve months ended December 31, 2016 and 2015, inclusive of affiliate amounts.
Years Ended December 31, | ||||||||
(in thousands) | 2016 | 2015 | ||||||
Operating revenues | $ | 201,623 | $ | 114,459 | ||||
Operating expenses | 74,681 | 52,423 | ||||||
Net income | $ | 121,610 | $ | 52,495 | ||||
Net cash provided by operating activities | $ | 154,117 | $ | 70,006 | ||||
Net cash used in investing activities | $ | (721,087 | ) | $ | (379,991 | ) | ||
Net cash provided by financing activities | $ | 581,207 | $ | 290,748 | ||||
The following table presents the Company’s change in limited partner ownership of the Partnership for the periods presented.
As of: | Partnership units owned by GP Holdings (Common and Subordinated) | Total Partnership Units Outstanding | GP Holdings % Ownership in the Partnership | % Ownership in the Partnership Retained by the Company | |||||||
December 31, 2015 | 28,757,246 | 70,917,372 | 41 | % | 41 | % | |||||
Equity offering in June 2016 | — | 9,200,000 | |||||||||
Equity offering in October 2016 | — | 20,930,233 | |||||||||
Units issued under ATM program | — | 944,700 | |||||||||
Vested phantom units, net | — | 280,451 | |||||||||
December 31, 2016 | 28,757,246 | 102,272,756 | 28 | % | 26 | % | |||||
Rice Midstream GP Holdings LP
The Company evaluated GP Holdings for consolidation and determined GP Holdings to be a VIE. The Company determined that the primary beneficiary of GP Holdings is Midstream Holdings. Midstream Holdings holds a 91.75% limited partnership interest in GP Holdings and GP Management holds all of the substantive voting and participating rights to direct the activities of GP Holdings. As a result, through this ownership, the Company holds the power to direct the activities of GP Holdings that most significantly impact GP Holdings’ economic performance and the obligation to absorb losses or the right to receive benefits from GP Holdings that could potentially be significant to GP Holdings.
110
Rice Energy Operating LLC
Notes to Consolidated Financial Statements
As of December 31, 2016, the Company consolidates GP Holdings, recording noncontrolling interest related to the ownership interests of GP Holdings attributable to the Investors. GP Holdings has no significant assets, liabilities or operations other than consolidation of the Partnership.
Strike Force Midstream Holdings LLC
On February 1, 2016, Strike Force Midstream Holdings LLC (“Strike Force Holdings”), a wholly-owned subsidiary of Midstream Holdings, and Gulfport Midstream Holdings entered into an Amended and Restated Limited Liability Company Agreement (the “Strike Force LLC Agreement”) of Strike Force Midstream to engage in the natural gas midstream business in approximately 319,000 acres in Belmont and Monroe Counties, Ohio. Under the terms of the Strike Force LLC Agreement, Strike Force Holdings made an initial contribution to Strike Force Midstream of certain pipelines, facilities and rights of way and cash in the amount of $41.0 million in exchange for a 75% membership interest in Strike Force Midstream. Gulfport Midstream made an initial contribution of a gathering system and related assets in exchange for a 25% membership interest in Strike Force Midstream. The assets contributed by Gulfport Midstream have a fair value of $22.5 million, which was determined using Level 3 valuation inputs included in the discounted cash flow method within the income approach. The income approach includes estimates and assumptions related to future throughput volumes, operating costs, capital spending and changes in working capital. Estimating the fair value of these assets required judgment and determining the fair value is sensitive to changes in assumptions. Additionally, on February 1, 2016, Strike Force Midstream and Strike Force Holdings entered into a services agreement whereby Strike Force Holdings will provide all of the services necessary to operate, manage and maintain Strike Force Midstream.
The Company evaluated Strike Force Midstream for consolidation and determined Strike Force Midstream to be a VIE. Strike Force Holdings was determined to be the primary beneficiary as a result of its power to direct the activities of Strike Force Midstream that most significantly impact Strike Force Midstream’s economic performance and the obligation to absorb losses or the right to receive benefits through its 75% membership interest in Strike Force Midstream.
As of December 31, 2016, the Company consolidates Strike Force Midstream, recording noncontrolling interest related to the ownership interests of Strike Force Midstream attributable to Gulfport Midstream. The following table presents summary information of assets and liabilities of Strike Force Midstream that is included in the Company’s consolidated balance sheet that are for the use or obligation of Strike Force Midstream.
(in thousands) | December 31, 2016 | ||
Assets (liabilities): | |||
Cash | $ | 36,572 | |
Accounts receivable | 2,529 | ||
Property and equipment, net | 100,232 | ||
Accounts payable | (3,863 | ) | |
Accrued capital expenditures | (18,962 | ) | |
Other current liabilities | (44 | ) | |
The following table presents summary information for Strike Force Midstream’s financial performance included in the consolidated statement of operations and cash flows for the period from February 1, 2016 through December 31, 2016, inclusive of affiliate amounts.
(in thousands) | |||
Operating revenues | $ | 7,687 | |
Operating expenses (1) | 26,059 | ||
Net loss | $ | (18,354 | ) |
Net provided by operating activities | $ | 835 | |
Net cash used in investing activities | $ | (49,263 | ) |
Net cash provided by financing activities | $ | 85,000 | |
(1) | As of December 31, 2016, the Company recorded a $20.3 million impairment related to pipeline assets that were decommissioned. |
111
Rice Energy Operating LLC
Notes to Consolidated Financial Statements
16. | Stock-Based Compensation |
From time to time, Rice Energy grants stock-based compensation awards to certain non-employee directors and employees under its long-term incentive plan (the “LTIP”). Pursuant to the LTIP, the aggregate maximum number of shares of common stock issued under the LTIP will not exceed 17,500,000 shares. Rice Energy has granted both restricted stock units, which vest upon the passage of time, and performance units, which vest based upon attainment of specified company performance criteria. These awards and associated costs are fully allocated to the Company.
Restricted Stock Unit Awards
Restricted stock unit awards are valued based upon the price of Rice Energy’s common stock on the grant date and vest over periods from one to three years, with compensation expense being recognized on a straight-line basis over the requisite service period. Compensation expense related to the restricted stock unit awards was $9.6 million, $5.7 million and $2.6 million for the years ended December 31, 2016, 2015 and 2014, respectively, and is recorded in general and administrative, lease operating and midstream operating and maintenance expenses on the consolidated statements of operations. The following table summarizes the restricted stock unit award activity during the year ended December 31, 2016 and 2015.
Number of shares | Weighted average grant date fair value | ||||||
Total unvested, January 1, 2015 | 322,659 | $ | 28.38 | ||||
Granted | 538,637 | 19.25 | |||||
Vested | (121,138 | ) | 27.98 | ||||
Forfeited | (34,027 | ) | 24.13 | ||||
Total unvested, December 31, 2015 | 706,131 | 21.69 | |||||
Granted | 1,336,525 | 10.85 | |||||
Vested | (271,364 | ) | 21.99 | ||||
Forfeited | (133,593 | ) | 14.89 | ||||
Total unvested - December 31, 2016 | 1,637,699 | $ | 13.35 | ||||
The following table details the scheduled vesting of the outstanding unvested restricted stock unit awards at December 31, 2016.
Vesting Date | Number of shares | ||
2017 | 658,723 | ||
2018 | 593,192 | ||
2019 | 376,730 | ||
2020 | 9,054 | ||
1,637,699 | |||
Total unrecognized compensation expense expected to be recognized in the future related to the restricted stock unit awards as of December 31, 2016 is $12.6 million.
Performance Stock Unit Awards
Under the LTIP, Rice Energy has granted certain employees performance stock unit awards, which entitles the holders to shares of common stock subject to the achievement of certain performance metrics established by the Compensation Committee of the Board of Directors. Each grant of performance stock units is subject to a designated three-year initial performance period. The number of performance stock units to be earned is subject to a market condition, which is based on a comparison of the total shareholder return (“TSR”) and the absolute shareholder return (“ASR”) achieved with respect to shares of Rice Energy’s common stock against the TSR and ASR achieved by a defined peer group at the end of the performance period. Depending on Rice Energy’s performance relative to the defined peer group, award recipients will earn between 0% and 200% of the initial performance stock units granted. The following table summarizes the performance stock unit award activity during the year ended December 31, 2016 and 2015.
112
Rice Energy Operating LLC
Notes to Consolidated Financial Statements
Number of shares | Weighted average grant date fair value | ||||||
Total unvested, January 1, 2015 | 270,104 | $ | 29.05 | ||||
Granted | 432,626 | 18.95 | |||||
Vested | — | — | |||||
Forfeited | (6,120 | ) | 22.94 | ||||
Total unvested, December 31, 2015 | 696,610 | 22.83 | |||||
Granted | 979,970 | 8.97 | |||||
Vested | — | — | |||||
Forfeited | (25,866 | ) | 15.10 | ||||
Total unvested - December 31, 2016 | 1,650,714 | $ | 14.72 | ||||
The following table details the scheduled vesting of the outstanding unvested performance stock unit awards at December 31, 2016.
Vesting Date | Number of shares | ||
2017 | 263,206 | ||
2018 | 422,052 | ||
2019 | 965,456 | ||
1,650,714 | |||
The compensation expense related to these awards is being recognized on a straight-line basis and the awards will cliff vest over the requisite service period of approximately three years. Compensation expense related to the performance unit stock awards was $10.0 million, $6.7 million and $2.8 million for the years ended December 31, 2016, 2015 and 2014, respectively, and is recorded in general and administrative expenses on the consolidated statements of operations.
The Company uses a Monte Carlo simulation valuation model to determine the fair value of the performance stock unit awards on the grant date. The key valuation assumptions for the Monte Carlo model are the initial value, risk-free interest rate, volatility and correlation coefficients. The risk-free interest rate is the U.S. Treasury bond rate on the date of grant. The initial value is the average of the volume weighted average prices for the 20 trading days prior to the start of the performance cycle for Rice Energy and each of its peers. Volatility is the standard deviation of the average percentage change in stock price over a historical period for Rice Energy and each of its peers. The correlation coefficients are measures of the strength of the linear relationship between and amongst Rice Energy and its peers estimated based on historical stock price data.
The following table presents information regarding the assumptions used in determining the fair value of the performance stock unit awards granted in 2016, 2015 and 2014.
2016 | 2015 | 2014 | ||||||||||
Dividend Yield | 0.00 | % | 0.00 | % | 0.00 | % | ||||||
Expected Volatility | 64.34 | % | 49.69 | % | 43.73 | % | ||||||
Risk-Free Rate | 0.91 | % | 1.00 | % | 0.70 | % | ||||||
Expected Life (Years) | 2.84 | 2.89 | 2.65 | |||||||||
Weighted average fair value of performance stock unit awards | $ | 10.78 | $ | 21.61 | $ | 38.77 | ||||||
Total unrecognized compensation expense expected to be recognized in the future related to the performance stock unit awards as of December 31, 2016 is $10.6 million.
RMP Phantom Unit Awards
Additionally, from time to time, phantom unit awards are granted under the Rice Midstream Partners LP 2014 Long Term Incentive Plan (“RMP LTIP”) to certain non-employee directors of the Partnership and executive officers and employees of the Company that provide services to the Partnership under an omnibus agreement. Pursuant to the RMP LTIP, the maximum aggregate number of common units that may be issued pursuant to any and all awards under the RMP LTIP shall not exceed
113
Rice Energy Operating LLC
Notes to Consolidated Financial Statements
5,000,000 common units, subject to adjustment due to recapitalization or reorganization, or related to forfeitures or the expiration of awards, as provided under the RMP LTIP. The equity-based awards are valued based upon the price of the Partnership’s common units on the grant date and will cliff vest over the requisite service period from one to two years. The Partnership recorded $2.8 million, $4.1 million and $0.1 million of stock compensation expense related to these awards for the years ended December 31, 2016, 2015 and 2014, respectively, and is recorded in general and administrative and midstream operating and maintenance expenses within the Company’s consolidated statements of operations. Total unrecognized compensation expense expected to be recognized over the remaining vesting period as of December 31, 2016 is $0.2 million for these awards.
The following table summarizes the activity for the equity-based awards during the year ended December 31, 2016 and 2015.
Number of units | Weighted average grant date fair value | ||||||
Total unvested, January 1, 2015 | 434,094 | $ | 16.50 | ||||
Granted | 18,196 | 16.87 | |||||
Vested | (242 | ) | 16.50 | ||||
Forfeited | (19,420 | ) | 16.50 | ||||
Total unvested, December 31, 2015 | 432,628 | 16.52 | |||||
Granted | 30,352 | 17.81 | |||||
Vested | (399,158 | ) | 16.52 | ||||
Forfeited | (33,470 | ) | 16.50 | ||||
Total unvested - December 31, 2016 | 30,352 | $ | 17.81 | ||||
Combined
Further information on stock-based compensation recorded for the years ended December 31, 2016, 2015 and 2014 in the consolidated financial statements is detailed below.
Year Ended December 31, | |||||||||||
(in thousands) | 2016 | 2015 | 2014 | ||||||||
General and administrative expense | $ | 21,290 | $ | 16,528 | $ | 5,553 | |||||
Lease operating and midstream operation and maintenance expense | 625 | — | — | ||||||||
Property, plant and equipment, net | 578 | — | — | ||||||||
Total cost of stock-based compensation plans | $ | 22,493 | $ | 16,528 | $ | 5,553 | |||||
17. Income Taxes
Prior to the Company’s change in tax status to a partnership on October 19, 2016, the Company’s income was reported as part of Rice Energy’s consolidated federal tax return, and the Company was taxed as a corporation under the Internal Revenue Code, subject to federal income tax at a statutory rate of 35%. The Company has not reported any income tax benefit or expense for periods subsequent to October 19, 2016 because, as a partnership, the Company is not subject to federal income tax.
In addition, the Company has not reported any income tax benefit or expense for periods prior to the consummation of Rice Energy’s IPO in January 2014 because Rice Drilling B, Rice Energy’s accounting predecessor, is a limited liability company that was not subject to federal income tax. The reorganization of Rice Energy into a corporation in connection with the closing of Rice Energy’s IPO required the recognition of a deferred tax asset or liability for the initial temporary differences at the time of its IPO. The resulting deferred tax liability of approximately $162.3 million was recorded in capital at the date of the completion of Rice Energy’s IPO, as it represents a transaction among shareholders.
The components of the income tax provision are as follows:
114
Rice Energy Operating LLC
Notes to Consolidated Financial Statements
Year Ended December 31, | |||||||||||
(in thousands) | 2016 | 2015 | 2014 | ||||||||
Current tax expense: | |||||||||||
Federal | $ | 9,909 | $ | 5,851 | $ | 23,414 | |||||
State | (2,802 | ) | (593 | ) | 3,395 | ||||||
Total | 7,107 | 5,258 | 26,809 | ||||||||
Deferred tax (benefit) expense: | |||||||||||
Federal | (201,288 | ) | 18,066 | 49,393 | |||||||
State | (46,633 | ) | (11,206 | ) | 15,398 | ||||||
Total | (247,921 | ) | 6,860 | 64,791 | |||||||
Total income tax (benefit) expense(1) | $ | (240,814 | ) | $ | 12,118 | $ | 91,600 | ||||
(1) | As a result of the Company’s October 19, 2016 change in status to an entity not subject to federal and state income tax, deferred tax liabilities in existence at that date were written off, yielding a tax benefit of approximately $272.0 million. Of the total amount written off, $247.9 million related to net liabilities of Rice Energy subsidiaries, and $24.1 million related to net liabilities due to Rice Energy. |
Income tax (benefit) expense differs from amounts computed at the federal statutory rate of 35% on pre-tax income as follows:
Year Ended December 31, | ||||||||||||
(in thousands) | 2016 | 2015 | 2014 | |||||||||
Tax at statutory rate | $ | (136,861 | ) | $ | (89,560 | ) | $ | 108,722 | ||||
Permanent tax differences | 41 | 74 | 18 | |||||||||
State income taxes(1) | (32,133 | ) | (7,668 | ) | 12,216 | |||||||
Partnership earnings (1/1/14 - 1/28/14) | — | — | (66,239 | ) | ||||||||
Partnership earnings (10/19/16 - 12/31/16) | 113,541 | — | — | — | ||||||||
Noncontrolling partners’ share of partnership earnings(2) | (26,395 | ) | (8,168 | ) | (203 | ) | ||||||
Change in entity tax status | (175,452 | ) | — | — | ||||||||
Goodwill impairment | — | 103,218 | — | |||||||||
Incentive unit expense | 15,716 | 12,634 | 37,086 | |||||||||
Other, net | 729 | 1,588 | — | |||||||||
Income tax (benefit) expense | $ | (240,814 | ) | $ | 12,118 | $ | 91,600 | |||||
Effective tax rate | 61.58 | % | (4.74 | )% | 29.49 | % | ||||||
(1) | Includes $28.3 million of state deferred benefit relating to the write-off of deferreds due to the change in entity tax status. |
(2) | Prior to 2016, the noncontrolling interest was principally due to the Partnership’s earnings. During 2016, noncontrolling interest includes the earnings of the Partnership, GP Holdings and Strike Force Midstream. |
The Company recognizes deferred tax liabilities for temporary differences between the financial statement and tax basis of assets and liabilities. The effect of changes in the tax laws or tax rates is recognized in income in the period such changes are enacted. Prior to 2016, the deferred tax liabilities primarily relate to intangible drilling costs, depreciation and depletion. As a result of the Company’s change in tax status to a partnership on October 19, 2016, all of the Company’s deferred tax liabilities and deferred tax assets were written off to tax expense because, as a partnership, the Company is not subject to federal income tax. The following table summarizes the source and tax effects of temporary differences that give rise to the deferred tax assets and deferred tax liabilities at December 31, 2016 and 2015.
115
Rice Energy Operating LLC
Notes to Consolidated Financial Statements
Year Ended December 31, | |||||||
(in thousands) | 2016 | 2015 | |||||
Deferred income taxes | |||||||
Total deferred tax assets | $ | — | $ | 299,023 | |||
Total deferred tax liabilities | — | (546,944 | ) | ||||
Total net deferred tax liabilities | — | (247,921 | ) | ||||
Principal components of deferred tax assets and liabilities: | |||||||
Drilling and development costs expensed for tax | — | (368,949 | ) | ||||
Tax depreciation in excess of book depreciation | — | (92,710 | ) | ||||
Investment in partnerships | — | 57,227 | |||||
Incentive compensation | — | 5,576 | |||||
Net operating loss carryforwards | — | 153,558 | |||||
Hedging loss | — | (85,285 | ) | ||||
AMT tax credit | — | 7,999 | |||||
IDC 59e election | — | 73,977 | |||||
Other | — | 686 | |||||
Total | $ | — | $ | (247,921 | ) | ||
Based on management’s analysis, the Company did not have any uncertain tax positions as of December 31, 2016.
18. | Related Party Transactions |
Prior to Rice Energy’s IPO, the Company reimbursed Rice Energy Family Holdings, LP (“Rice Partners”) for expenses incurred on behalf of the Company. General and administrative expenses incurred by the Rice Partners and reimbursed by the Company were $1.8 million for the year ended December 31, 2014. Prior to the closing of Rice Energy’s IPO, the Company terminated its agreement to reimburse Rice Partners for expenses incurred on its behalf.
The Company is a direct subsidiary of Rice Energy and has no employees. As such, various employee-related costs, such as payroll, stock compensation and incentive unit distributions, have been fully allocated to the Company and its subsidiaries. General and administrative expenses incurred by Rice Energy, on behalf of the Company have been reflected in the accompanying consolidated financial statements. Additionally, Rice Energy has issued and completed public offerings and the related proceeds are generally contributed to the Company to be utilized to fund capital expenditures and working capital requirements. Rice Energy has also entered into certain contracts, such as hedging agreements and debt agreements for the benefit of the Company, and, as such, the corresponding costs and benefits and have been pushed down from Rice Energy to the Company. Amounts associated with the items pushed down from Rice Energy have been recorded within the current and long-term receivable from parent and current and long-term payable to parent line items on the consolidated balance sheet. For the years ended December 31, 2016 and 2015, the balance of current receivable from parent was zero and $5.0 million, respectively, and the balance of long-term receivable from parent was $18.8 million and zero, respectively. In addition, for the years ended December 31, 2016 and 2015, the balance of current payable to parent was $93.8 million and zero, respectively, and the balance of long-term payable to parent was zero and $1.5 billion, respectively.
Contributions from parent represent proceeds related to Rice Energy and Partnership equity offerings, as well as other contributions and settlements of inter-company transactions. For the year ended December 31, 2016, the Company received a cash contribution from parent of approximately $1,457.4 million, which was primarily associated with Rice Energy’s April 2016 Equity Offering and its September 2016 Equity Offering.
19. | New Accounting Pronouncements |
In May 2014, the Financial Accounting Standards Board (“FASB”) issued ASU 2014-09, “Revenue from Contracts with Customers (Topic 606).” The FASB created Topic 606 which supersedes the revenue recognition requirements in Topic 605, “Revenue Recognition,” and most industry-specific guidance throughout the Industry Topics of the Codification. ASU 2014-09 will enhance comparability of revenue recognition practices across entities, industries and capital markets compared to existing guidance. Additionally, ASU 2014-09 will reduce the number of requirements which an entity must consider in recognizing revenue, as this update will replace multiple locations for guidance. In April 2016, the FASB issued ASU 2016-10, “Revenue from Contracts with Customers (Topic 606) - Identifying Performance Obligations and Licensing.” In May 2016, the FASB
116
Rice Energy Operating LLC
Notes to Consolidated Financial Statements
issued ASU 2016-11, “Revenue from Contracts with Customers (Topic 606) and Derivatives and Hedging (Topic 815) – Rescission of SEC Guidance Because of Accounting Standards Updates 2014-09 and 2014-16 Pursuant to Staff Announcements at the March 3, 2016 EITF Meeting” and ASU 2016-12, “Revenue from Contracts with Customers (Topic 606) – Narrow Scope Improvements and Practical Expedients.” These updates do not change the core principle of the guidance in Topic 606 (as amended by ASU 2014-09), but rather provide further guidance with respect to the implementation of ASU 2014-09. The effective date for ASU 2016-10, 2016-11, 2016-12 and ASU 2014-09, as amended by ASU 2015-14, is for annual reporting periods beginning after December 15, 2017, including interim periods within those years. In preparation for the adoption of the new standard in the fiscal year beginning January 2018, the Company has obtained representative samples of contracts and other forms of agreements with its customers and are evaluating the provisions contained therein in light of the five-step model specified by the new guidance. That five-step model includes: (1) determination of whether a contract-an agreement between two or more parties that creates legally enforceable rights and obligations-exists; (2) identification of the performance obligations in the contract; (3) determination of the transaction price; (4) allocation of the transaction price to the performance obligations in the contract; and (5) recognition of revenue when (or as) the performance obligation is satisfied. The Company anticipates adopting the standard using the modified retrospective approach at adoption. The Company will be evaluating individual customer contracts within each of our business segments as we continue to evaluate the impact of the adoption of this standard.
In August 2014, the FASB issued ASU 2014-15, “Disclosures of Uncertainties about an Entity’s Ability to Continue as a Going Concern,” which specifies the responsibility an entity’s management has to evaluate whether there is substantial doubt about the entity’s ability to continue as a going concern. The new guidance is effective for annual and interim periods beginning after December 15, 2016. The Company has adopted ASU 2014-15 in the fourth quarter of 2016 and has determined that substantial doubt does not exist about its ability to continue as a going concern.
In April 2015, the FASB issued ASU, 2015-03, “Interest—Imputation of Interest (Subtopic 835-30): Simplification of Debt Issuance Costs.” ASU 2015-03 was issued to simplify the presentation of debt issuance costs by requiring debt issuance costs related to a recognized debt liability be presented in the balance sheet as a direct deduction from the carrying amount of the related debt liability, consistent with debt discounts. ASU 2015-03 is effective for periods beginning after December 15, 2015. In August 2015, the FASB issued ASU 2015-15, “Presentation and Subsequent Measurement of Debt Issuance Costs Associated with Line-of-Credit Arrangements.” ASU 2015-15 clarifies the guidance in ASU 2015-03 regarding presentation and subsequent measurement of debt issuance costs related to line-of-credit arrangements. The Securities and Exchange Commission (“SEC”) staff announced they would not object to an entity deferring and presenting debt issuance costs as an asset and subsequently amortizing the deferred debt issuance costs ratably over the term of the line-of-credit arrangement, regardless of whether there are any outstanding borrowings on the line-of-credit arrangement. The Company adopted ASU 2015-03 in the first quarter of 2016 and presents debt issuance costs associated with its Notes as a deduction from the carrying amount of the Notes. The Company also adopted ASU 2015-15 in the first quarter and presents debt issuance costs associated with the Company’s revolving credit facilities as deferred financing costs, net in its consolidated balance sheets. The Company has retrospectively applied the guidance in ASU 2015-03 and ASU 2015-15, which resulted in the reclassification of $21.4 million of deferred financing costs related to the Notes from deferred financing costs, net, to long-term debt on the consolidated balance sheet at December 31, 2015.
In February 2016, the FASB issued ASU 2016-02, “Leases (Topic 842).” ASU 2016-02 requires, among other things, that lessees recognize the following for all leases (with the exception of short-term leases) at the commencement date: (i) a lease liability, which is a lessee’s obligation to make lease payments arising from a lease, measured on a discounted basis; and (ii) a right-of-use asset, which is an asset that represents the lessee’s right to use, or control the use of, a specified asset for the lease term. The new guidance is effective for annual and interim reporting periods beginning after December 15, 2018. The amendments should be applied at the beginning of the earliest period presented using a modified retrospective approach with earlier application permitted as of the beginning of an interim or annual reporting period. The Company is currently evaluating the impact of the new guidance on its consolidated financial statements.
In March 2016, the FASB issued ASU 2016-09, “Improvements to Employee Share-Based Payment Accounting.” ASU 2016-09 affects entities that issue share-based payment awards to their employees. ASU 2016-09 is designed to simplify several aspects of accounting for share-based payment award transactions, which include: (i) income tax consequences, (ii) classification of awards as either equity or liabilities, (iii) classification on the statement of cash flows and (iv) forfeiture rate calculations. The updated guidance is effective for annual periods beginning after December 15, 2016, including interim periods within those fiscal years. Early adoption of the update is permitted. The Company plans to adopt ASU 2016-09 in the first quarter of 2017. The Company does not anticipate that this guidance will have a material impact on its consolidated financial statements.
In August 2016, the FASB issued ASU 2016-15, “Statement of Cash Flows (Topic 230): Classification of Certain Cash Receipts and Cash Payments.” ASU 2016-15 clarifies and provides specific guidance on eight cash flow classification issues
117
Rice Energy Operating LLC
Notes to Consolidated Financial Statements
that are not currently addressed by current GAAP and thereby reduce the current diversity in practice. ASU 2016-15 is effective for public business entities for annual periods, including interim periods within those annual periods, beginning after December 15, 2017, with early application permitted. The Company does not anticipate that this guidance will have a material impact on its consolidated financial statements.
In January 2017, the FASB issued ASU 2017-04, “Intangibles — Goodwill and Other (Topic 350): Simplifying the Test for Goodwill Impairment.” This ASU eliminates Step 2 from the goodwill impairment test which previously required measurement of any goodwill impairment loss by comparing the implied fair value of a reporting unit’s goodwill with the carrying amount of that goodwill. Under the new standard, an entity should perform its annual, or interim, goodwill impairment test by comparing the fair value of a reporting unit with its carrying amount and recognize an impairment charge for the amount by which the carrying amount exceeds the reporting unit’s fair value, without exceeding the total amount of goodwill allocated to that reporting unit. The provisions of this ASU are effective for fiscal years, and any interim goodwill impairment tests within those fiscal years beginning after December 15, 2019. Early adoption is permitted for interim or annual goodwill impairment tests performed on testing dates after January 1, 2017. A reporting entity should apply the amendment on a prospective basis. The Company plans to adopt ASU 2017-04 in the first quarter of 2017.
20. | Subsequent Events |
The Company has evaluated subsequent events through the date these financial statements were issued. The Company determined there were no events, other than as described below, that required disclosure or recognition in these financial statements.
During the first quarter of 2017, the Vantage Sellers redeemed 1,980,000 Rice Energy Operating common units for newly-issued shares of Rice Energy common stock. Upon exercise of the redemption, the Vantage Sellers surrendered to the Company a corresponding 1,980 shares of Preferred Stock. As of March 31, 2017, the Vantage Sellers held a membership interest of approximately 15.64% in the Company.
21. | Guarantor Financial Information |
On April 25, 2014, Rice Energy issued $900.0 million in aggregate principal amount of the 2022 Notes and on March 26, 2015, Rice Energy issued $400.0 million in aggregate principal amount of the 2023 Notes. The obligations under the Notes are fully and unconditionally guaranteed by the Guarantors, subject to release provisions described in Note 4. In connection with the closing of the Vantage Acquisition, Rice Energy and the Company entered into a Debt Assumption Agreement dated as of October 19, 2016 pursuant to which the Company agreed to become the primary obligor of the Notes and certain entities acquired in the Vantage Acquisition became wholly-owned became subsidiaries of the Company and Guarantors of the Notes. Each of the Guarantors is 100% owned by the Company.
As of December 31, 2016, Rice Energy held approximately 83.51% of the economic interest in the Company, with the remaining 16.49% membership interest collectively held by the Vantage Sellers. The Vantage Sellers have no voting rights with respect to their membership interest in the Company.
The Vantage Sellers have a redemption right to cause the Company to redeem, from time to time, all or a portion of their common units. Each common unit will be redeemed for, at the Company’s option, a newly-issued share of common stock of Rice Energy or a cash payment equal to the volume-weighted average closing price of a share of Rice Energy’s common stock for the five trading days prior to and including the last full trading day immediately prior to the date that the member delivers a notice of redemption (subject to customary adjustments, including for stock splits, stock dividends and reclassifications). Upon the exercise of the redemption right, the redeeming member surrenders its common units to the Company and the corresponding number of 1/1000ths of shares of Rice Energy preferred stock in respect of each redeemed common unit to the Company for cancellation. The Third A&R LLC Agreement requires that Rice Energy contribute cash or shares of its common stock to the Company in exchange for the Company’s common units equal to the number of the Company’s common units to be redeemed from the member. The Company will then distribute such cash or shares of the Rice Energy common stock to such Vantage Seller to complete the redemption. Upon the exercise of the redemption right, Rice Energy may, at its option, effect a direct exchange of the Company’s common units (and the corresponding shares of Rice Energy preferred stock (or fractions thereof) from the redeeming Vantage Seller.
As a result, Rice Energy expects that over time it will have an increasing economic interest in the Company as the Vantage Sellers elect to exercise their redemption right. Moreover, any transfers of common units by the Vantage Sellers (other than permitted transfers to affiliates) must be approved by Rice Energy. Rice Energy intends to retain full voting and management control over the Company.
118
Rice Energy Operating LLC
Notes to Consolidated Financial Statements
The Company’s subsidiaries that comprise its Rice Midstream Holdings segment and Rice Midstream Partners segment are unrestricted subsidiaries under the indentures governing the Notes and consequently are not Guarantors. In accordance with positions established by the SEC, the following shows separate financial information with respect to the Company, the Guarantors and the Non-Guarantor subsidiaries. The principal elimination entries below eliminate investment in subsidiaries and certain intercompany balances and transactions.
Balance Sheet as of December 31, 2016 | ||||||||||||||||||||
(in thousands) | Rice Energy Operating LLC | Guarantors | Non-Guarantors | Eliminations | Consolidated | |||||||||||||||
Assets | ||||||||||||||||||||
Current assets: | ||||||||||||||||||||
Cash | $ | 230,944 | $ | 164,522 | $ | 71,821 | $ | — | $ | 467,287 | ||||||||||
Accounts receivable | — | 201,122 | 16,549 | 919 | 218,590 | |||||||||||||||
Receivable from affiliate | (3,060 | ) | — | 12,441 | (9,381 | ) | — | |||||||||||||
Prepaid expenses, deposits and other | — | 2,213 | 194 | — | 2,407 | |||||||||||||||
Total current assets | 227,884 | 367,857 | 101,005 | (8,462 | ) | 688,284 | ||||||||||||||
Gas collateral account | — | 5,220 | 112 | — | 5,332 | |||||||||||||||
Investments in subsidiaries | 4,738,088 | 6,101 | — | (4,744,189 | ) | — | ||||||||||||||
Property, plant and equipment, net | — | 4,947,518 | 1,203,047 | (58,276 | ) | 6,092,289 | ||||||||||||||
Deferred financing costs, net | 21,372 | — | 15,012 | — | 36,384 | |||||||||||||||
Goodwill | 384,430 | — | 494,581 | — | 879,011 | |||||||||||||||
Intangible assets, net | — | — | 44,525 | — | 44,525 | |||||||||||||||
Derivative instruments | — | 11,435 | — | — | 11,435 | |||||||||||||||
Long-term receivable from parent | 18,847 | — | — | — | 18,847 | |||||||||||||||
Other non-current assets | — | 475 | — | — | 475 | |||||||||||||||
Total assets | $ | 5,390,621 | $ | 5,338,606 | $ | 1,858,282 | $ | (4,810,927 | ) | $ | 7,776,582 | |||||||||
Liabilities and stockholders’ equity | ||||||||||||||||||||
Current liabilities: | ||||||||||||||||||||
Accounts payable | $ | — | $ | 8,724 | $ | 8,595 | $ | — | $ | 17,319 | ||||||||||
Royalties payables | — | 87,098 | — | — | 87,098 | |||||||||||||||
Payable to affiliate | — | 30,953 | — | (30,953 | ) | — | ||||||||||||||
Current payable to parent | 72,056 | — | — | 22,490 | 94,546 | |||||||||||||||
Accrued capital expenditures | — | 89,403 | 35,297 | — | 124,700 | |||||||||||||||
Leasehold payables | — | 22,869 | — | — | 22,869 | |||||||||||||||
Derivative instruments | 348 | 66,997 | — | — | 67,345 | |||||||||||||||
Other accrued liabilities | 15,933 | 53,998 | 16,451 | — | 86,382 | |||||||||||||||
Total current liabilities | 88,337 | 360,042 | 60,343 | (8,463 | ) | 500,259 | ||||||||||||||
Long-term liabilities: | ||||||||||||||||||||
Long-term debt | 1,279,481 | — | 243,000 | — | 1,522,481 | |||||||||||||||
Leasehold payable | — | 9,237 | — | — | 9,237 | |||||||||||||||
Deferred tax liabilities | — | — | — | — | — | |||||||||||||||
Derivative instruments | — | 17,430 | — | — | 17,430 | |||||||||||||||
Other long-term liabilities | 720 | 66,228 | 5,541 | — | 72,489 | |||||||||||||||
Total liabilities | 1,368,538 | 452,937 | 308,884 | (8,463 | ) | 2,121,896 | ||||||||||||||
Mezzanine equity: | ||||||||||||||||||||
Redeemable noncontrolling interest | — | — | 382,525 | — | 382,525 | |||||||||||||||
Unitholders’ capital before noncontrolling interest | 4,022,083 | 4,885,669 | (147,581 | ) | (4,802,464 | ) | 3,957,707 | |||||||||||||
Noncontrolling interests in consolidated subsidiaries | — | — | 1,314,454 | — | 1,314,454 | |||||||||||||||
Total liabilities and unitholders’ capital | $ | 5,390,621 | $ | 5,338,606 | $ | 1,858,282 | $ | (4,810,927 | ) | $ | 7,776,582 | |||||||||
119
Rice Energy Operating LLC
Notes to Consolidated Financial Statements
Balance Sheet as of December 31, 2015 | ||||||||||||||||||||
(in thousands) | Rice Energy Operating LLC | Guarantors | Non-Guarantors | Eliminations | Consolidated | |||||||||||||||
Assets | ||||||||||||||||||||
Current assets: | ||||||||||||||||||||
Cash | $ | 2 | $ | 57,798 | $ | 15,628 | $ | — | $ | 73,428 | ||||||||||
Accounts receivable | — | 140,493 | 14,174 | — | 154,667 | |||||||||||||||
Current receivable from parent | 32,711 | — | 4,501 | (32,172 | ) | 5,040 | ||||||||||||||
Prepaid expenses, deposits and other | — | 817 | 295 | — | 1,112 | |||||||||||||||
Derivative instruments | — | 139,698 | — | — | 139,698 | |||||||||||||||
Total current assets | 32,713 | 338,806 | 34,598 | (32,172 | ) | 373,945 | ||||||||||||||
Gas collateral account | — | 3,995 | 82 | — | 4,077 | |||||||||||||||
Investments in subsidiaries | 2,382,260 | — | — | (2,382,260 | ) | — | ||||||||||||||
Property, plant and equipment, net | — | 2,382,704 | 869,186 | (26,230 | ) | 3,225,660 | ||||||||||||||
Deferred financing costs, net | — | — | 4,915 | — | 4,915 | |||||||||||||||
Goodwill | — | — | 39,142 | — | 39,142 | |||||||||||||||
Intangible assets, net | — | — | 46,159 | — | 46,159 | |||||||||||||||
Derivative instruments | — | 75,974 | — | — | 75,974 | |||||||||||||||
Other non-current assets | — | 49 | — | — | 49 | |||||||||||||||
Total assets | $ | 2,414,973 | $ | 2,801,528 | $ | 994,082 | $ | (2,440,662 | ) | $ | 3,769,921 | |||||||||
Liabilities and stockholders’ equity | ||||||||||||||||||||
Current liabilities: | ||||||||||||||||||||
Accounts payable | $ | — | $ | 48,191 | $ | 31,184 | $ | — | $ | 79,375 | ||||||||||
Royalties payables | — | 40,572 | — | — | 40,572 | |||||||||||||||
Accrued capital expenditures | — | 45,240 | 34,507 | — | 79,747 | |||||||||||||||
Leasehold payables | — | 17,338 | — | — | 17,338 | |||||||||||||||
Derivative instruments | — | 367 | — | — | 367 | |||||||||||||||
Other accrued liabilities | (210 | ) | 71,283 | 3,367 | (32,172 | ) | 42,268 | |||||||||||||
Total current liabilities | (210 | ) | 222,991 | 69,058 | (32,172 | ) | 259,667 | |||||||||||||
Long-term liabilities: | ||||||||||||||||||||
Long-term debt | — | — | 160,000 | — | 160,000 | |||||||||||||||
Leasehold payable | — | 6,289 | — | — | 6,289 | |||||||||||||||
Deferred tax liabilities | (71,730 | ) | 299,741 | 19,910 | — | 247,921 | ||||||||||||||
Long-term payable to parent | 1,282,333 | — | — | — | 1,282,333 | |||||||||||||||
Other long-term liabilities | — | 7,661 | 3,129 | — | 10,790 | |||||||||||||||
Total liabilities | 1,210,393 | 536,682 | 252,097 | (32,172 | ) | 1,967,000 | ||||||||||||||
Unitholders’ capital before noncontrolling interest | 1,204,580 | 2,264,846 | 117,414 | (2,408,490 | ) | 1,178,350 | ||||||||||||||
Noncontrolling interests in consolidated subsidiaries | — | — | 624,571 | — | 624,571 | |||||||||||||||
Total liabilities and unitholders’ capital | $ | 2,414,973 | $ | 2,801,528 | $ | 994,082 | $ | (2,440,662 | ) | $ | 3,769,921 | |||||||||
120
Rice Energy Operating LLC
Notes to Consolidated Financial Statements
Statement of Operations for the Year Ended December 31, 2016 | ||||||||||||||||||||
(in thousands) | Rice Energy Operating LLC | Guarantors | Non-Guarantors | Eliminations | Consolidated | |||||||||||||||
Operating revenues: | ||||||||||||||||||||
Natural gas, oil and natural gas liquids (NGL) sales | $ | — | $ | 653,441 | $ | — | $ | — | $ | 653,441 | ||||||||||
Gathering, compression and water services | — | — | 265,556 | (164,499 | ) | 101,057 | ||||||||||||||
Other revenue | — | 24,408 | — | — | 24,408 | |||||||||||||||
Total operating revenues | — | 677,849 | 265,556 | (164,499 | ) | 778,906 | ||||||||||||||
Operating expenses: | ||||||||||||||||||||
Lease operating | — | 50,708 | — | (134 | ) | 50,574 | ||||||||||||||
Gathering, compression and transportation | — | 232,478 | — | (108,626 | ) | 123,852 | ||||||||||||||
Production taxes and impact fees | — | 13,866 | — | — | 13,866 | |||||||||||||||
Exploration | — | 15,159 | — | — | 15,159 | |||||||||||||||
Midstream operation and maintenance | — | — | 27,618 | (4,403 | ) | 23,215 | ||||||||||||||
Incentive unit expense | — | 49,426 | 2,335 | — | 51,761 | |||||||||||||||
Impairment of gas properties | 20,853 | — | — | 20,853 | ||||||||||||||||
Impairment of fixed assets | — | 23,057 | — | 23,057 | ||||||||||||||||
General and administrative | — | 78,094 | 39,999 | — | 118,093 | |||||||||||||||
Depreciation, depletion and amortization | — | 350,865 | 31,298 | (13,708 | ) | 368,455 | ||||||||||||||
Acquisition expense | — | 5,500 | 609 | — | 6,109 | |||||||||||||||
Amortization of intangible assets | — | — | 1,634 | — | 1,634 | |||||||||||||||
Other expense | — | 25,652 | 1,656 | — | 27,308 | |||||||||||||||
Total operating expenses | — | 842,601 | 128,206 | (126,871 | ) | 843,936 | ||||||||||||||
Operating (loss) income | — | (164,752 | ) | 137,350 | (37,628 | ) | (65,030 | ) | ||||||||||||
Interest expense | (91,734 | ) | (68 | ) | (7,825 | ) | — | (99,627 | ) | |||||||||||
Other income (expense) | (898 | ) | 2,206 | 98 | — | 1,406 | ||||||||||||||
Gain on derivative instruments | (83,324 | ) | (136,912 | ) | — | — | (220,236 | ) | ||||||||||||
Amortization of deferred financing costs | (5,283 | ) | — | (2,262 | ) | — | (7,545 | ) | ||||||||||||
Equity in income (loss) in affiliate | 108,187 | (3,197 | ) | — | (104,990 | ) | — | |||||||||||||
(Loss) income before income taxes | (73,052 | ) | (302,723 | ) | 127,361 | (142,618 | ) | (391,032 | ) | |||||||||||
Income tax (expense) benefit | (114,953 | ) | 384,376 | (28,609 | ) | — | 240,814 | |||||||||||||
Net (loss) income | (188,005 | ) | 81,653 | 98,752 | (142,618 | ) | (150,218 | ) | ||||||||||||
Less: net (income) loss attributable to noncontrolling interests | — | — | (75,415 | ) | — | (75,415 | ) | |||||||||||||
Net (loss) income attributable to Rice Energy Operating | (188,005 | ) | 81,653 | 23,337 | (142,618 | ) | (225,633 | ) | ||||||||||||
Less: accretion and preferred dividends on redeemable noncontrolling interests | — | (28,450 | ) | — | — | (28,450 | ) | |||||||||||||
Net (loss) income attributable to Rice Energy Operating common stockholders | $ | (188,005 | ) | $ | 53,203 | $ | 23,337 | $ | (142,618 | ) | $ | (254,083 | ) | |||||||
121
Rice Energy Operating LLC
Notes to Consolidated Financial Statements
Statement of Operations for the Year Ended December 31, 2015 | ||||||||||||||||||||
(in thousands) | Rice Energy Operating LLC | Guarantors | Non-Guarantors | Eliminations | Consolidated | |||||||||||||||
Operating revenues: | ||||||||||||||||||||
Natural gas, oil and natural gas liquids (NGL) sales | $ | — | $ | 446,515 | $ | — | $ | — | $ | 446,515 | ||||||||||
Gathering, compression and water services | — | — | 141,823 | (92,644 | ) | 49,179 | ||||||||||||||
Other revenue | — | 6,447 | — | — | 6,447 | |||||||||||||||
Total operating revenues | — | 452,962 | 141,823 | (92,644 | ) | 502,141 | ||||||||||||||
Operating expenses: | ||||||||||||||||||||
Lease operating | — | 44,356 | — | — | 44,356 | |||||||||||||||
Gathering, compression and transportation | — | 150,015 | — | (65,308 | ) | 84,707 | ||||||||||||||
Production taxes and impact fees | — | 7,609 | — | — | 7,609 | |||||||||||||||
Exploration | — | 3,137 | — | — | 3,137 | |||||||||||||||
Midstream operation and maintenance | — | — | 16,988 | — | 16,988 | |||||||||||||||
Incentive unit expense | — | 33,873 | 2,224 | — | 36,097 | |||||||||||||||
Impairment of gas properties | — | 18,250 | — | — | 18,250 | |||||||||||||||
Impairment of goodwill | — | 294,908 | — | — | 294,908 | |||||||||||||||
General and administrative | — | 78,592 | 24,446 | — | 103,038 | |||||||||||||||
Depreciation, depletion and amortization | — | 304,703 | 19,185 | (1,104 | ) | 322,784 | ||||||||||||||
Acquisition expense | — | 107 | 1,128 | — | 1,235 | |||||||||||||||
Amortization of intangible assets | — | — | 1,632 | — | 1,632 | |||||||||||||||
Other expense | — | 5,075 | 492 | — | 5,567 | |||||||||||||||
Total operating expenses | — | 940,625 | 66,095 | (66,412 | ) | 940,308 | ||||||||||||||
Operating (loss) income | — | (487,663 | ) | 75,728 | (26,232 | ) | (438,167 | ) | ||||||||||||
Interest expense | (82,664 | ) | (166 | ) | (4,616 | ) | — | (87,446 | ) | |||||||||||
Other income | 615 | 441 | 52 | — | 1,108 | |||||||||||||||
Gain on derivative instruments | 68,248 | 205,500 | — | — | 273,748 | |||||||||||||||
Amortization of deferred financing costs | (4,072 | ) | — | (1,052 | ) | — | (5,124 | ) | ||||||||||||
Equity in loss of joint ventures and subsidiaries | (287,044 | ) | — | — | 287,044 | — | ||||||||||||||
(Loss) income before income taxes | (304,917 | ) | (281,888 | ) | 70,112 | 260,812 | (255,881 | ) | ||||||||||||
Income tax benefit (expense) | 13,581 | (16,404 | ) | (9,295 | ) | — | (12,118 | ) | ||||||||||||
Net (loss) income | (291,336 | ) | (298,292 | ) | 60,817 | 260,812 | (267,999 | ) | ||||||||||||
Less: net income attributable to noncontrolling interests | — | — | (23,337 | ) | — | (23,337 | ) | |||||||||||||
Net (loss) income attributable to Rice Energy Operating | $ | (291,336 | ) | $ | (298,292 | ) | $ | 37,480 | $ | 260,812 | $ | (291,336 | ) | |||||||
122
Rice Energy Operating LLC
Notes to Consolidated Financial Statements
Statement of Operations for the Year Ended December 31, 2014 | ||||||||||||||||||||
(in thousands) | Rice Energy Operating LLC | Guarantors | Non-Guarantors | Eliminations | Consolidated | |||||||||||||||
Operating revenues: | ||||||||||||||||||||
Natural gas, oil and natural gas liquids (NGL) sales | $ | — | $ | 359,201 | $ | — | $ | — | $ | 359,201 | ||||||||||
Gathering, compression and water services | — | — | 7,300 | (1,796 | ) | 5,504 | ||||||||||||||
Other revenue | — | 26,237 | — | — | 26,237 | |||||||||||||||
Total operating revenues | — | 385,438 | 7,300 | (1,796 | ) | 390,942 | ||||||||||||||
Operating expenses: | ||||||||||||||||||||
Lease operating | — | 24,971 | — | — | 24,971 | |||||||||||||||
Gathering, compression and transportation | — | 37,180 | (1,562 | ) | 35,618 | |||||||||||||||
Production taxes and impact fees | — | 4,647 | — | — | 4,647 | |||||||||||||||
Exploration | — | 4,018 | — | 4,018 | ||||||||||||||||
Midstream operation and maintenance | — | — | 4,607 | — | 4,607 | |||||||||||||||
Incentive unit expense | — | 86,020 | 19,941 | — | 105,961 | |||||||||||||||
General and administrative | — | 45,268 | 16,303 | — | 61,570 | |||||||||||||||
Depreciation, depletion and amortization | — | 153,282 | 2,988 | — | 156,270 | |||||||||||||||
Acquisition expense | — | 820 | 1,519 | — | 2,339 | |||||||||||||||
Amortization of intangible assets | — | — | 1,156 | — | 1,156 | |||||||||||||||
Other expenses | — | — | 207 | — | 207 | |||||||||||||||
Total operating expenses | — | 356,206 | 46,721 | (1,562 | ) | 401,364 | ||||||||||||||
Operating income (loss) | — | 29,232 | (39,421 | ) | (234 | ) | (10,422 | ) | ||||||||||||
Interest expense | (27,177 | ) | (10,130 | ) | (12,884 | ) | — | (50,191 | ) | |||||||||||
Gain on purchase of Marcellus joint venture | — | 203,579 | — | — | 203,579 | |||||||||||||||
Other income (loss) | 247 | 754 | (108 | ) | — | 893 | ||||||||||||||
Gain on derivative instruments | 55,580 | 130,897 | — | — | 186,477 | |||||||||||||||
Amortization of deferred financing costs | (2,006 | ) | (489 | ) | — | — | (2,495 | ) | ||||||||||||
Loss on extinguishment of debt | — | (7,654 | ) | — | — | (7,654 | ) | |||||||||||||
Write-off of deferred financing costs | — | (6,896 | ) | — | — | (6,896 | ) | |||||||||||||
Equity in income (loss) of joint ventures and subsidiaries | 184,679 | (2,656 | ) | — | (184,679 | ) | (2,656 | ) | ||||||||||||
Income (loss) before income taxes | 211,323 | 336,637 | (52,413 | ) | (184,913 | ) | 310,635 | |||||||||||||
Income tax benefit (expense) | 7,131 | (107,171 | ) | 8,440 | — | (91,600 | ) | |||||||||||||
Net income (loss) | 218,454 | 229,466 | (43,973 | ) | (184,913 | ) | 219,035 | |||||||||||||
Less: net income attributable to noncontrolling interests | — | — | (581 | ) | — | (581 | ) | |||||||||||||
Net income (loss) attributable to Rice Energy | $ | 218,454 | $ | 229,466 | $ | (44,554 | ) | $ | (184,913 | ) | $ | 218,454 | ||||||||
123
Rice Energy Operating LLC
Notes to Consolidated Financial Statements
Condensed Statement of Cash Flows for the Year Ended December 31, 2016 | ||||||||||||||||||||
(in thousands) | Rice Energy Operating LLC | Guarantors | Non-Guarantors | Eliminations | Consolidated | |||||||||||||||
Net cash provided by (used in) operating activities | $ | 37,406 | $ | 396,899 | $ | 189,957 | $ | (72,737 | ) | $ | 551,525 | |||||||||
Capital expenditures for property and equipment | 12,549 | (688,998 | ) | (234,285 | ) | 45,751 | (864,983 | ) | ||||||||||||
Acquisition of Vantage Energy, net of cash acquired | (381,080 | ) | — | (600,000 | ) | — | (981,080 | ) | ||||||||||||
Acquisition of Murray Assets | — | (44,266 | ) | — | — | (44,266 | ) | |||||||||||||
Other acquisitions | — | — | (11,700 | ) | — | (11,700 | ) | |||||||||||||
Investment in subsidiaries | (139,499 | ) | (5,714 | ) | — | 145,213 | — | |||||||||||||
Net cash used in investing activities | (508,030 | ) | (738,978 | ) | (845,985 | ) | 190,964 | (1,902,029 | ) | |||||||||||
Proceeds from borrowings | — | — | 338,000 | — | 338,000 | |||||||||||||||
Repayments of debt obligations | (706,911 | ) | — | (255,001 | ) | — | (961,912 | ) | ||||||||||||
Debt issuance costs | (19,507 | ) | — | (12,464 | ) | — | (31,971 | ) | ||||||||||||
Distributions to the Partnership's public unitholders | — | — | (47,875 | ) | — | (47,875 | ) | |||||||||||||
Proceeds from the issuance of common stock, net of offering costs | — | — | — | — | — | |||||||||||||||
Proceeds from issuance of common units sold by RMP, net of offering costs | — | — | 620,330 | — | 620,330 | |||||||||||||||
Proceeds from conversion of warrants | — | — | — | — | — | |||||||||||||||
Proceeds from issuance of non-controlling redeemable interest | — | — | 368,747 | — | 368,747 | |||||||||||||||
Contribution to Strike Force Midstream by Gulfport Midstream | — | — | 11,030 | — | 11,030 | |||||||||||||||
Preferred dividends to redeemable noncontrolling interest holders | — | — | (6,900 | ) | — | (6,900 | ) | |||||||||||||
Employee tax withholding for settlement of stock compensation award vestings | (8,177 | ) | — | 5,658 | — | (2,519 | ) | |||||||||||||
Contributions from parent | 1,436,161 | 448,803 | (309,304 | ) | (118,227 | ) | 1,457,433 | |||||||||||||
Net cash provided by financing activities | 701,566 | 448,803 | 712,221 | (118,227 | ) | 1,744,363 | ||||||||||||||
Increase (decrease) in cash | 230,942 | 106,724 | 56,193 | — | 393,859 | |||||||||||||||
Cash, beginning of year | 2 | 57,798 | 15,628 | — | 73,428 | |||||||||||||||
Cash, end of year | $ | 230,944 | $ | 164,522 | $ | 71,821 | $ | — | $ | 467,287 | ||||||||||
124
Rice Energy Operating LLC
Notes to Consolidated Financial Statements
Condensed Statement of Cash Flows for the Year Ended December 31, 2015 | ||||||||||||||||||||
(in thousands) | Rice Energy Operating LLC | Guarantors | Non-Guarantors | Eliminations | Consolidated | |||||||||||||||
Net cash provided by operating activities | $ | 63,300 | $ | 413,984 | $ | 85,546 | $ | (27,336 | ) | $ | 535,494 | |||||||||
Capital expenditures for property and equipment | 1,220 | (859,359 | ) | (404,476 | ) | 27,336 | (1,235,279 | ) | ||||||||||||
Investment in subsidiaries | (421,068 | ) | — | — | 421,068 | — | ||||||||||||||
Other acquisitions | — | 19,054 | — | — | 19,054 | |||||||||||||||
Proceeds from sale of interest in gas properties | — | 10,201 | — | — | 10,201 | |||||||||||||||
Net cash used in investing activities | (419,848 | ) | (830,104 | ) | (404,476 | ) | 448,404 | (1,206,024 | ) | |||||||||||
Proceeds from borrowings | — | 502,000 | — | 502,000 | ||||||||||||||||
Repayments of debt obligations | (697 | ) | (342,000 | ) | — | (342,697 | ) | |||||||||||||
Distributions to the Partnership’s public unitholders | — | — | (17,017 | ) | — | (17,017 | ) | |||||||||||||
Debt issuance costs | — | (946 | ) | — | (946 | ) | ||||||||||||||
Costs related to initial public offering | — | — | (129 | ) | — | (129 | ) | |||||||||||||
Proceeds from issuance of common units sold by RMP, net of offering costs | — | — | 171,902 | — | 171,902 | |||||||||||||||
Contributions from parent | 356,550 | 432,682 | (11,614 | ) | (421,068 | ) | 356,550 | |||||||||||||
Net cash provided by financing activities | 356,550 | 431,985 | 302,196 | (421,068 | ) | 669,663 | ||||||||||||||
Increase (decrease) in cash | 2 | 15,865 | (16,734 | ) | — | (867 | ) | |||||||||||||
Cash, beginning of year | — | 41,933 | 32,362 | — | 74,295 | |||||||||||||||
Cash, end of year | $ | 2 | $ | 57,798 | $ | 15,628 | $ | — | $ | 73,428 | ||||||||||
Condensed Statement of Cash Flows for the Year Ended December 31, 2014 | ||||||||||||||||||||
(in thousands) | Rice Energy Operating LLC | Guarantors | Non-Guarantors | Eliminations | Consolidated | |||||||||||||||
Net cash provided by (used in) operating activities | $ | 1,866 | $ | 98,828 | $ | (26,437 | ) | $ | — | $ | 74,257 | |||||||||
Investment in subsidiaries | (1,913,945 | ) | — | — | 1,913,945 | — | ||||||||||||||
Capital expenditures for property and equipment | (1,121 | ) | (684,541 | ) | (277,145 | ) | — | (962,807 | ) | |||||||||||
Other acquisitions | — | (357,635 | ) | (166,447 | ) | — | (524,082 | ) | ||||||||||||
Proceeds from sale of interest in gas properties | — | 12,891 | — | — | 12,891 | |||||||||||||||
Net cash used in investing activities | (1,915,066 | ) | (1,029,285 | ) | (443,592 | ) | 1,913,945 | (1,473,998 | ) | |||||||||||
Proceeds from borrowings | — | 190,000 | — | — | 190,000 | |||||||||||||||
Repayments of debt obligations | — | (689,873 | ) | — | — | (689,873 | ) | |||||||||||||
Restricted cash for convertible debt | — | 8,268 | — | — | 8,268 | |||||||||||||||
Debt issuance costs | 2,479 | — | (5,022 | ) | — | (2,543 | ) | |||||||||||||
Proceeds from issuance of common units sold in RMP IPO, net of offering costs | — | — | 441,739 | — | 441,739 | |||||||||||||||
Repurchase of profit interests | (36,306 | ) | — | — | — | (36,306 | ) | |||||||||||||
Contributions from parent | 1,947,027 | 1,432,587 | 65,470 | (1,913,945 | ) | 1,531,139 | ||||||||||||||
Net cash provided by financing activities | 1,913,200 | 940,982 | 502,187 | (1,913,945 | ) | 1,442,424 | ||||||||||||||
(Decrease) increase in cash | — | 10,525 | 32,158 | — | 42,683 | |||||||||||||||
Cash, beginning of year | — | 31,408 | 204 | — | 31,612 | |||||||||||||||
Cash, end of year | $ | — | $ | 41,933 | $ | 32,362 | $ | — | $ | 74,295 | ||||||||||
125
Rice Energy Operating LLC
Notes to Consolidated Financial Statements
22. | Quarterly Financial Information (Unaudited) |
The Company’s quarterly financial information for the years ended December 31, 2016 and 2015 is as follows (in thousands):
Year ended December 31, 2016:(1) | First quarter | Second quarter | Third quarter | Fourth quarter(2)(3) | |||||||||||
Total operating revenues | $ | 139,942 | $ | 155,998 | $ | 198,920 | $ | 284,046 | |||||||
Total operating expenses | 187,332 | 189,777 | 183,047 | 283,780 | |||||||||||
Operating (loss) income | (47,390 | ) | (33,779 | ) | 15,873 | 266 | |||||||||
Net income (loss) | $ | 3,305 | $ | (138,709 | ) | $ | 91,078 | $ | (105,892 | ) | |||||
Net (loss) income attributable to Rice Energy Operating | $ | (17,588 | ) | $ | (156,686 | ) | $ | 74,413 | $ | (125,772 | ) | ||||
Net (loss) income attributable to Rice Energy Operating common unitholders | $ | (21,046 | ) | $ | (164,630 | ) | $ | 65,832 | $ | (134,239 | ) | ||||
Year ended December 31, 2015:(1) | First quarter | Second quarter | Third quarter | Fourth quarter | |||||||||||
Total operating revenues | $ | 109,539 | $ | 112,894 | $ | 143,621 | $ | 136,088 | |||||||
Total operating expenses | 140,619 | 159,065 | 160,295 | 480,329 | |||||||||||
Operating loss | (31,080 | ) | (46,171 | ) | (16,674 | ) | (344,241 | ) | |||||||
Net income (loss) | $ | 4,687 | $ | (63,519 | ) | $ | 65,084 | $ | (274,251 | ) | |||||
Net income (loss) attributable to Rice Energy Operating | $ | 152 | $ | (69,683 | ) | $ | 58,950 | $ | (280,755 | ) | |||||
(1) | The sum of quarterly data in some cases may not equal the yearly total due to rounding. |
(2) | Includes the results of the Vantage Acquisition for the period from October 19, 2016 to December 31, 2016. |
(3) | As a result of the Company’s change in tax status to a partnership on October 19, 2016, approximately $272.0 million of net deferred tax liabilities were written off to tax expense because, as a partnership, the Company is not subject to federal income tax. |
23. | Supplemental Information on Gas-Producing Activities (Unaudited) |
Capitalized costs relating to gas-producing activities are as follows:
As of December 31, | |||||||
(in thousands) | 2016 | 2015 | |||||
Proved properties | $ | 3,731,715 | $ | 1,780,918 | |||
Unproved properties | 2,035,951 | 1,071,523 | |||||
5,767,666 | 2,852,441 | ||||||
Accumulated depreciation and depletion | (883,055 | ) | (498,467 | ) | |||
Net capitalized costs | $ | 4,884,611 | $ | 2,353,974 | |||
Costs incurred for property acquisitions, exploration and development are as follows:
For the Years Ended December 31, | |||||||||||
(in thousands) | 2016 | 2015 | 2014 | ||||||||
Acquisitions: | |||||||||||
Proved leaseholds | $ | 1,245,704 | $ | — | $ | 439,284 | |||||
Unproved leaseholds | 1,137,215 | 100,172 | 233,185 | ||||||||
Development costs | 585,342 | 616,836 | 734,106 | ||||||||
Exploration costs: | |||||||||||
Geological and geophysical | 1,636 | 1,276 | 4,018 | ||||||||
126
Rice Energy Operating LLC
Notes to Consolidated Financial Statements
Results of operations related to natural gas, oil and NGL production are as follows:
For the Years Ended December 31, | |||||||||||
(in thousands) | 2016 | 2015 | 2014 | ||||||||
Revenues | $ | 653,441 | $ | 452,962 | $ | 385,438 | |||||
Production costs | 297,052 | 201,980 | 67,032 | ||||||||
Exploration costs | 15,159 | 3,137 | 4,018 | ||||||||
Depreciation, depletion and amortization | 350,187 | 308,194 | 151,900 | ||||||||
Incentive unit expense | 49,426 | 33,873 | 86,020 | ||||||||
Impairment of gas properties | 20,853 | 18,250 | — | ||||||||
Impairment of fixed assets | 2,765 | — | — | ||||||||
Impairment of goodwill | — | 294,908 | — | ||||||||
Acquisition costs | 5,500 | 108 | 820 | ||||||||
Gain from sale of interest in gas properties | — | (953 | ) | — | |||||||
Other expense | 4,856 | 6,028 | — | ||||||||
General and administrative expenses | 78,161 | 78,592 | 46,229 | ||||||||
Income tax (benefit) expense(1) | 13,468 | 6,039 | 38,871 | ||||||||
Results of operations from producing activities | $ | (183,986 | ) | $ | (497,194 | ) | $ | (9,452 | ) | ||
(1) | 2016 income tax expense does not reflect the impact of the Company’s October 19, 2016 change in tax status as the benefit from the change in tax status was not a direct result of operations. |
Reserve quantity information is as follows:
For the Years Ended December 31, | ||||||||
(in Bcfe)(1) | 2016 | 2015 | 2014 (2) | |||||
Proved developed and undeveloped reserves: | ||||||||
Beginning of year | 1,700.0 | 1,306.6 | 382.7 | |||||
Acquisitions | 924.7 | — | 282.4 | |||||
Extensions and discoveries | 1,667.8 | 869.0 | 692.2 | |||||
Revision of previous estimates | 17.2 | (274.3 | ) | 47.0 | ||||
Production | (304.4 | ) | (201.3 | ) | (97.7 | ) | ||
End of year | 4,005.3 | 1,700.0 | 1,306.6 | |||||
Proved developed reserves: | ||||||||
End of year | 2,178.8 | 1,014.9 | 644.1 | |||||
Proved undeveloped reserves: | ||||||||
End of year | 1,826.5 | 685.2 | 662.4 | |||||
(1) | As our oil and NGLs reserves are immaterial and constitute approximately one percent of our proved reserves at December 31, 2016, the Company presents our reserves on an Mcfe basis calculated at the rate of one barrel per six Mcf based upon the relative energy content of oil to natural gas, which may not be indicative of the relationship of oil and natural gas prices. |
(2) | Amounts presented in the table exclude amounts attributable to the Marcellus joint venture for periods prior to the completion of the Company’s IPO in January 2014. |
Acquisitions
For the year ended December 31, 2016, the Company added 924.7 Bcfe of proved developed and undeveloped reserves primarily as a result of the Vantage Acquisition on October 19, 2016. For the year ended December 31, 2014, the Company added 282.4 Bcfe through its purchase of the remaining 50% interest in the Marcellus joint venture in January 2014 and its Greene County acreage acquisition from Chesapeake Appalachia, L.L.C and its partners in August 2014.
127
Rice Energy Operating LLC
Notes to Consolidated Financial Statements
Extensions and Discoveries
For the year ended December 31, 2016, the Company added 1,667.8 Bcfe through its drilling program in the Marcellus Shale and Utica Shale and also as a result of changes in the Company’s operational plans. Extensions of approximately 1,118.0 Bcfe related to proved undeveloped reserves while extensions of approximately 549.8 Bcfe related to proved developed reserves that were not included within our 2015 development plan. The Company added 869.0 Bcfe and 692.2 Bcfe through its drilling program in the Marcellus Shale and Utica Shale in 2015 and 2014, respectively.
Revision of Previous Estimates
In 2016, the Company had net positive revisions of 17.2 Bcfe. Such revisions resulted from favorable well performance, partially offset by approximately 16 proved undeveloped locations that were removed from the Company’s estimate of reserves at December 31, 2015 and were no longer included in the Company’s operational plans.
The reserve quantity information is limited to reserves which had been evaluated as of December 31, 2016. Proved developed reserves represent only those reserves expected to be recovered from existing wells and support equipment. Proved undeveloped reserves are expected to be recovered from new wells after substantial development costs are incurred. Netherland, Sewell & Associates, Inc. reviewed 100% of the total net gas proved reserves attributable to the Company’s interests and the Company’s Marcellus joint venture as of December 31, 2016, 2015 and 2014.
The information presented represents estimates of proved natural gas reserves based on evaluations prepared by the independent petroleum engineering firms of Netherland, Sewell & Associates, Inc. in accordance with Standards Pertaining to the Estimating and Auditing of Oil and Gas Reserves Information promulgated by the Society of Petroleum Evaluation Engineers and definitions and guidelines established by the SEC. The Company’s independent reserve engineers were selected for their historical experience and geographic expertise in engineering unconventional resources. Since 1961, Netherland, Sewell & Associates, Inc. has evaluated oil and gas properties and independently certified petroleum reserves quantities in the United States and internationally.
Certain information concerning the assumptions used in computing the standardized measure of proved reserves and their inherent limitations are discussed below. The Company believes such information is essential for a proper understanding and assessment of the data presented. Future cash inflows are computed by applying the 12-month unweighted arithmetic average of the first-day-of-the-month price for each month in the period January through, respectively, to the period-end quantities of those reserves. Natural gas prices are held constant throughout the lives of the properties.
The assumptions used to compute estimated future net revenues do not necessarily reflect the Company’s expectations of actual revenues or costs, or their present worth. In addition, variations from the expected production rates also could result directly or indirectly from factors outside of the Company’s control, such as unintentional delays in development, changes in prices or regulatory controls. The standardized measure calculation further assumes that all reserves will be disposed of by production. However, if reserves are sold in place, this could affect the amount of cash eventually realized.
Future development and production costs are computed by estimating the expenditures to be incurred in developing and producing the proved natural gas reserves at the end of the year, based on period-end costs and assuming continuation of existing economic conditions.
An annual discount rate of 10% was used to reflect the timing of the future net cash flows relating to proved natural gas reserves.
Information with respect to the Company’s estimated discounted future net cash flows related to its proved natural gas and oil reserves is as follows:
As of December 31, | |||||||||||
(in thousands) | 2016 | 2015 | 2014 (1) | ||||||||
Future cash inflows | $ | 7,174,765 | $ | 4,497,738 | $ | 5,904,380 | |||||
Future production costs | (3,103,526 | ) | (2,378,541 | ) | (2,161,926 | ) | |||||
Future development costs | (1,124,478 | ) | (545,988 | ) | (610,179 | ) | |||||
Future income tax expense | — | — | (745,022 | ) | |||||||
Future net cash flows | 2,946,761 | 1,573,209 | 2,387,253 | ||||||||
10% annual discount for estimated timing of cash flows | (1,378,355 | ) | (686,936 | ) | (1,079,499 | ) | |||||
Standardized measure of discounted future net cash flows | $ | 1,568,406 | $ | 886,273 | $ | 1,307,754 | |||||
128
Rice Energy Operating LLC
Notes to Consolidated Financial Statements
(1) | Reflects the balances for Rice Drilling B. Amounts presented in the table exclude amounts attributable to the Company’s Marcellus joint venture for periods prior to the completion of its IPO in January 2014. |
For 2016, the reserves for the Company were computed using unweighted arithmetic averages of the closing prices on the first day of each month during 2016, adjusted for energy content and a regional price differential. For 2016, the adjusted natural gas prices were $1.80 and $1.66, the adjusted oil prices were $32.70 and $37.65, and the adjusted NGL prices were $14.76 and $9.74 for the Appalachian Basin and Fort Worth Basin, respectively.
For 2015, the reserves for the Company were computed using unweighted arithmetic averages of the closing prices on the first day of each month during 2015, adjusted for energy content and a regional price differential. For 2015, the adjusted natural gas price was $2.65, the adjusted oil price was $41.72 and the adjusted NGL price was $9.91.
For 2014, the reserves for the Company were computed using unweighted arithmetic averages of the closing prices on the first day of each month during 2014, adjusted for energy content and a regional price differential. For 2014, the adjusted natural gas price was $4.52 and the adjusted oil price was $85.70.
The following are the principal sources of changes in the standardized measure of discounted future net cash flows:
For the Years Ended December 31, | ||||||||||||
(in thousands) | 2016 | 2015 | 2014 | |||||||||
Balance at beginning of period | $ | 886,273 | $ | 1,307,754 | $ | 417,164 | ||||||
Net change in prices and production costs | (60,207 | ) | (949,774 | ) | 81,558 | |||||||
Net change in future development costs | 41,551 | 4,251 | (181,813 | ) | ||||||||
Natural gas and oil net revenues | (510,868 | ) | (312,269 | ) | (291,023 | ) | ||||||
Extensions | 516,370 | 370,636 | 930,534 | |||||||||
Acquisitions | 407,690 | (1) | — | 375,865 | (2) | |||||||
Revisions of previous quantity estimates | 46,894 | (274,503 | ) | 37,435 | ||||||||
Previously estimated development costs incurred | 111,276 | 122,532 | 62,653 | |||||||||
Net change in taxes | — | 436,319 | (436,319 | ) | ||||||||
Accretion of discount | 88,627 | 174,407 | 70,937 | |||||||||
Changes in timing and other | 40,800 | 6,920 | 240,763 | |||||||||
Balance at end of period | $ | 1,568,406 | $ | 886,273 | $ | 1,307,754 | ||||||
(1) | Reflects cash flows primarily attributable to the Company’s October 19, 2016 Vantage Acquisition. |
(2) | Reflects the purchase of the remaining 50% interest in the Marcellus joint venture in January 2014 and the Greene County acreage acquisition in August 2014. |
129
Item 9. Changes in and Disagreements with Accountants on Accounting and Financial Disclosure
Not applicable.
Item 9A. Controls and Procedures
Evaluation of Disclosure Controls and Procedures
As required by Rule 13a-15(b) under the Exchange Act, we have evaluated, under the supervision and with the participation of our management, including our principal executive officer and principal financial officer, the effectiveness of the design and operation of our disclosure controls and procedures (as defined in Rules 13a-15(e) and 15d-15(e) under the Exchange Act) as of the end of the period covered by this Annual Report. Our disclosure controls and procedures are designed to ensure that information required to be disclosed in the reports that we file or submit under the Exchange Act is recorded, processed, summarized and reported, within the time periods specified in the SEC’s rules and forms. Based upon that evaluation, our principal executive officer and principal financial officer concluded that their disclosure controls and procedures were effective as of December 31, 2016.
Changes in Internal Control over Financial Reporting
The Company’s management is also responsible for establishing and maintaining adequate internal controls over financial reporting, as defined in Rules 13a-15(f) and 15d-15(f) of the Exchange Act, as amended. The Company’s internal controls were designed to provide reasonable assurance as to the reliability of our financial reporting and the preparation and presentation of the consolidated financial statements for external purposes in accordance with US GAAP.
Because of its inherent limitations, internal control over financial reporting may not detect or prevent misstatements. Projections of any evaluation of the effectiveness to future periods are subject to the risk that controls may become inadequate because of changes in conditions, or that the degree of compliance with the policies or procedures may deteriorate.
The Company’s management has assessed the effectiveness of our internal controls over financial reporting as of December 31, 2016. As noted in the management report called for by Item 308(a) of Regulation S-K and incorporated by reference above, the Company’s assessment of, and conclusion on, the effectiveness of internal control over financial reporting did not include the internal controls of the entities acquired in the Vantage Acquisition on October 19, 2016. Under guidelines established by the SEC, companies are permitted to exclude acquisitions from their assessment of internal control over financial reporting during the first year of an acquisition while integrating the acquired company. The Company is in the process of integrating Vantage and the Company’s internal controls over financial reporting. As a result of these integration activities, certain controls will be evaluated and may be changed. Except as noted above, there were no changes in the Company’s internal control over financial reporting during its most recent fiscal quarter that has materially affected, or is reasonably likely to materially affect, internal control over financial reporting. Based on the Company’s assessment, its internal controls over financial reporting were effective.
Management’s Annual Report on Internal Control Over Financial Reporting
The management of Rice Energy is responsible for establishing and maintaining adequate internal control over financial reporting for us as defined in Rules 13a-15(f) and 15d-15(f) of the Exchange Act. This system is designed to provide reasonable assurance regarding the reliability of financial reporting and the preparation of financial statements for external purposes in accordance with accounting principles generally accepted in the United States of America.
Our internal control over financial reporting includes those policies and procedures that:
(i) pertain to the maintenance of records that, in reasonable detail, accurately and fairly reflect our transactions and dispositions of the assets;
(ii) provide reasonable assurance that transactions are recorded as necessary to permit preparation of financial statements in accordance with generally accepted accounting principles, and that our receipts and expenditures are being made only in accordance with authorizations of our management and Directors; and
(iii) provide reasonable assurance regarding prevention or timely detection of unauthorized acquisition, use, or disposition of our assets that could have a material effect on the financial statements.
Because of its inherent limitations, a system of internal control over financial reporting can provide only reasonable assurance and may not prevent or detect misstatements. Further, because of changes in conditions, effectiveness of internal controls over financial reporting may vary over time.
130
As of December 31, 2016, the Company’s management assessed the effectiveness of our internal control over financial reporting based on the criteria for effective internal control over financial reporting established in Internal Control—Integrated Framework (2013), issued by the Committee on Sponsoring Organizations of the Treadway Commission. Based on the assessment, management determined that we maintained effective internal control over financial reporting as of December 31, 2016. Our assessment of, and conclusion on, the effectiveness of internal control over financial reporting did not include the internal controls of the entities acquired in the Vantage Acquisition on October 19, 2016. Vantage’s consolidated total assets and total revenues represent approximately 42% of our total consolidated total assets at December 31, 2016 and 7% of the Company’s consolidated total revenues for the year ended December 31, 2016. The Company is in the process of integrating Vantage and its internal controls over financial reporting. As a result of these integration activities, certain controls will be evaluated and may be changed.
Attestation Report of the Registered Public Accounting Firm
This Annual Report on Form 10-K does not include an attestation report of our independent registered public accounting firm as such report is not required to be provided for non-accelerated filers under SEC rules.
131
PART III
Item 10. Directors, Executive Officers and Corporate Governance
Item 10 will be incorporated by reference pursuant to Regulation 14A under the Exchange Act. Rice Energy expects to file a definitive proxy statement with the SEC within 120 days after the close of the year ended December 31, 2016.
Item 11. Executive Compensation
Item 11 will be incorporated by reference pursuant to Regulation 14A under the Exchange Act. Rice Energy expects to file a definitive proxy statement with the SEC within 120 days after the close of the year ended December 31, 2016.
Item 12. Security Ownership of Certain Beneficial Owners and Management and Related Stockholder Matters
Item 12 will be incorporated by reference pursuant to Regulation 14A under the Exchange Act. Rice Energy expects to file a definitive proxy statement with the SEC within 120 days after the close of the year ended December 31, 2016.
Item 13. Certain Relationships and Related Transactions, and Director Independence
Item 13 will be incorporated by reference pursuant to Regulation 14A under the Exchange Act. Rice Energy expects to file a definitive proxy statement with the SEC within 120 days after the close of the year ended December 31, 2016.
Item 14. Principal Accountant Fees and Services
Item 14 will be incorporated by reference pursuant to Regulation 14A under the Exchange Act. Rice Energy expects to file a definitive proxy statement with the SEC within 120 days after the close of the year ended December 31, 2016.
132
PART IV
Item 15. Exhibits and Financial Statement Schedules
a. The following documents are filed as a part of this Annual Report on Form 10-K or incorporated herein by reference:
(1) Financial Statements:
See Item 8. Financial Statements and Supplementary Data.
(2) Financial Statement Schedules:
None.
(3) Exhibits:
The exhibits listed on the accompanying index to exhibits (pages 145 through 150) are filed as part of this Annual Report on Form 10-K.
133
SIGNATURES
Pursuant to the requirements of Section 13 or 15(d) of the Securities Exchange Act of 1934, the registrant has duly caused this report to be signed on its behalf by the undersigned, thereunto duly authorized.
RICE ENERGY OPERATING LLC | |
By: | RICE ENERGY INC., its sole manager |
By: | /s/ Daniel J. Rice IV |
Daniel J. Rice IV | |
Director, Chief Executive Officer | |
March 31, 2017 | |
Pursuant to the requirements of the Securities Act of 1934, this report has been signed below by the following persons on behalf of the registrant and in the capacities and on the dates indicated.
Name | Title | Date | ||
/s/ Daniel J. Rice IV | Director, Chief Executive Officer of Rice Energy Inc. | March 31, 2017 | ||
Daniel J. Rice IV | (Principal Executive Officer) | |||
/s/ Toby Z. Rice | Director, President and Chief Operating Officer of Rice Energy Inc. | March 31, 2017 | ||
Toby Z. Rice | ||||
/s/ Grayson T. Lisenby | Senior Vice President and Chief Financial Officer of Rice Energy Inc. | March 31, 2017 | ||
Grayson T. Lisenby | (Principal Financial Officer) | |||
/s/ James W. Rogers | Senior Vice President, Chief Accounting & | March 31, 2017 | ||
James W. Rogers | Administrative Officer, Treasurer of Rice Energy Inc. | |||
(Principal Accounting Officer) | ||||
/s/ Robert F. Vagt | Director of Rice Energy Inc. | March 31, 2017 | ||
Robert F. Vagt | ||||
/s/ Daniel J. Rice III | Director of Rice Energy Inc. | March 31, 2017 | ||
Daniel J. Rice III | ||||
/s/ Scott A. Gieselman | Director of Rice Energy Inc. | March 31, 2017 | ||
Scott A. Gieselman | ||||
/s/ James W. Christmas | Director of Rice Energy Inc. | March 31, 2017 | ||
James W. Christmas | ||||
/s/ John McCartney | Director of Rice Energy Inc. | March 31, 2017 | ||
John McCartney | ||||
134
Index to Exhibits
Exhibits are incorporated by reference or are filed with this report as indicated below (numbered in accordance with Item 601 of Regulation S-K).
Exhibit No. | Description |
2.1*** | Purchase and Sale Agreement, among M3 Appalachia Gathering, LLC, as seller, Rice Poseidon Midstream LLC, as Buyer, dated as of February 12, 2014 (incorporated by reference to Exhibit 2.1 of Rice Energy’s Current Report on Form 8-K (File No. 001-36273) filed with the Commission on February 14, 2014). |
2.2 | Purchase and Sale Agreement, dated July 11, 2014, by and among Rice Drilling B LLC, Chesapeake Appalachia, L.L.C. and Statoil USA Onshore Properties Inc. (incorporated by reference to Exhibit 2.1 of Rice Energy’s Current Report on Form 8-K (File No. 001-36273) filed with the Commission on August 7, 2014). |
2.3*** | Purchase and Sale Agreement, dated November 4, 2015, by and between Rice Energy Inc. and Rice Midstream Partners LP (incorporated by reference to Exhibit 2.1 of Rice Energy’s Current Report on Form 8-K (File No. 001-36273) filed with the Commission on November 5, 2015). |
2.4*** | Purchase and Sale Agreement, dated as of September 26, 2016, by and among Vantage Energy Investment LLC, Vantage Energy Investment II LLC, Rice Energy Inc., Vantage Energy, LLC, and Vantage Energy II, LLC (incorporated by reference to Exhibit 10.1 of Rice Energy’s Current Report on Form 8-K (File No. 001-36273) filed with the Commission on September 30, 2016). |
2.5*** | Purchase and Sale Agreement, dated as of September 26, 2016, by and between Rice Energy Inc. and Rice Midstream Partners LP (incorporated by reference to Exhibit 10.2 of Rice Energy’s Current Report on Form 8-K (File No. 001-36273) filed with the Commission on September 30, 2016). |
3.1 | Amended and Restated Certificate of Incorporation of Rice Energy Inc. (incorporated by reference to Exhibit 3.1 of Rice Energy’s Current Report on Form 8-K (File No. 001-36273) filed with the Commission on February 4, 2014). |
3.2 | Amended and Restated Bylaws of Rice Energy Inc. (incorporated by reference to Exhibit 3.1 of Rice Energy’s Current Report on Form 8-K (File No. 001-36273) filed with the Commission on February 23, 2017). |
3.3 | Certificate of Designation of Class A Preferred Stock of Rice Energy Inc. (incorporated by reference to Exhibit 3.1 of Rice Energy’s Current Report on Form 8-K (File No. 001-36273) filed with the Commission on October 25, 2016). |
4.1 | Specimen Common Stock Certificate (incorporated by reference to Exhibit 4.1 of Rice Energy’s Registration Statement on Form S-1 (File No. 133-192894) filed with the Commission on January 13, 2014). |
4.2 | Registration Rights Agreement, dated as of January 29, 2014, by and among Rice Energy Inc., Rice Energy Holdings LLC, Rice Energy Family Holdings, LP, NGP Rice Holdings LLC and Foundation PA Coal Company, LLC (incorporated by reference to Exhibit 4.2 of Rice Energy’s Current Report on Form 8-K (File No. 001-36273) filed with the Commission on February 4, 2014). |
4.3 | Stockholders’ Agreement, dated as of January 29, 2014, by and among Rice Energy Inc., Rice Energy Holdings LLC, Rice Energy Family Holdings, LP, NGP Rice Holdings LLC and Alpha Natural Resources, Inc. (incorporated by reference to Exhibit 4.1 of Rice Energy’s Current Report on Form 8-K (File No. 001-36273) filed with the Commission on February 4, 2014). |
4.4 | First Amendment to Stockholders’ Agreement, dated as of January 29, 2014, by and among Rice Energy, Inc., Rice Energy Holdings, LLC, NGP Rice Holdings, LLC and Alpha Natural Resources, Inc. (incorporated by reference as Exhibit 4.5 of Rice Energy’s Quarterly Report on Form 10-Q (File No. 001-36273) filed with the Commission on August 11, 2014). |
4.5 | Investor Rights Agreement, dated as of October 19, 2016, by and among Rice Energy Inc., Rice Energy Operating LLC, and the Investors party thereto (incorporated by reference to Exhibit 4.1 of Rice Energy’s Current Report on Form 8-K (File No. 001-36276) filed with the Commission on October 25, 2016). |
4.6 | Indenture, dated as of April 25, 2014, by and among Rice Energy Inc., the several guarantors named therein and Wells Fargo Bank, National Association, as trustee. (incorporated by reference as Exhibit 4.1 of Rice Energy’s Current Report on Form 8-K (File No. 001-36273) filed with the Commission on April 29, 2014). |
135
4.7 | Supplemental Indenture, dated as of November 10, 2014, by and among Rice Energy Inc., the several guarantors named therein and Wells Fargo Bank, National Association, as trustee (incorporated by reference to Exhibit 4.6 of Rice Energy’s Registration Statement on Form S-4 (File No. 333-200693) filed with the Commission on December 3, 2014). |
4.8 | Second Supplemental Indenture, dated as of October 19, 2016, by and among Rice Energy Inc., Rice Energy Operating LLC, the other Guarantors party thereto and Wells Fargo Bank, National Association, as trustee (incorporated by reference to Exhibit 10.3 of Rice Energy’s Current Report on Form 8-K (File No. 001-36273) filed with the Commission on October 25, 2016). |
4.9 | Third Supplemental Indenture, dated as of December 29, 2016, by and among Rice Energy Inc., Rice Energy Operating LLC, the other Guarantors party thereto and Wells Fargo Bank, National Association, as trustee. (incorporated by reference to Exhibit 4.9 of Rice Energy’s Annual Report on Form 10-K (File No. 001-36273) filed with the Commission on March 1, 2017). |
4.10 | Form of 6.250% Senior Note due 2022 (included as Exhibit A to Exhibit 4.6). |
4.11 | Agreement of Assignment and Assumption, dated as of November 17, 2014, by and between Rice Energy Family Holdings, LP and Rice Energy 2016 Irrevocable Trust (incorporated by reference to Exhibit 4 of Rice Energy’s Schedule 13D/A (CUSIP No. 762760106) filed with the Commission on November 26, 2014). |
4.12 | Agreement of Assignment and Assumption, dated as of December 28, 2016, by and among Rice Energy Inc., Rice Energy 2016 Irrevocable Trust, and Rice Energy 2016 Irrevocable Trust (incorporated by reference to Exhibit 5 of Amendment No. 11 to Rice Energy’s Schedule 13D (CUSIP No. 762760106) filed with the Commission on December 30, 2016). |
4.13 | Indenture, dated as of March 26, 2015, by and among Rice Energy Inc., the several guarantors named therein, and Wells Fargo Bank, N.A., as trustee (incorporated by reference to Exhibit 4.1 of Rice Energy’s Current Report on Form 8-K (File No. 001-36273) filed with the Commission on March 26, 2015). |
4.14 | First Supplemental Indenture, dated as of October 19, 2016, by and among Rice Energy Inc., Rice Energy Operating LLC, the other Guarantors party thereto and Wells Fargo Bank, National Association, as trustee (incorporated by reference to Exhibit 10.2 of Rice Energy’s Current Report on Form 8-K (File No. 001-36273) filed with the Commission on October 25, 2016). |
4.15 | Second Supplemental Indenture, dated as of December 29, 2016, by and among Rice Energy Inc., Rice Energy Operating LLC, the other Guarantors party thereto and Wells Fargo Bank, National Association, as trustee. (incorporated by reference to Exhibit 4.9 of Rice Energy’s Annual Report on Form 10-K (File No. 001-36273) filed with the Commission on March 1, 2017). |
4.16 | Form of 7.25% Senior Note due 2023 (included as Exhibit A to Exhibit 4.12). |
10.1 | Fourth Amended and Restated Credit Agreement, dated as of October 19, 2016, by and among Rice Energy Inc., Rice Energy Operating LLC, Wells Fargo Bank, N.A., as administrative agent, and each of the Lenders party thereto (incorporated by reference to Exhibit 10.4 of Rice Energy’s Current Report on Form 8-K (File No. 001-36273) filed with the Commission on October 25, 2016). |
10.2 | First Amendment to Fourth Amended and Restated Credit Agreement, dated as of December 19, 2016, by and among Rice Energy Inc., Rice Energy Operating LLC, Wells Fargo Bank, N.A., as administrative agent and each of the lenders party thereto (incorporated by reference to Exhibit 10.1 of Rice Energy’s Current Report on Form 8-K (File No. 001-36273) filed with the Commission on December 20, 2016). |
10.3 | Credit Agreement, dated as of December 22, 2014, among Rice Midstream Partners LP, as Parent Guarantor, Rice Midstream OpCo LLC, as Borrower, Wells Fargo Bank, National Association, as administrative agent, certain lenders party thereto and the other parties thereto (incorporated by reference to Exhibit 10.1 of Rice Energy’s Current Report on Form 8-K (File No. 001-36273) filed with the Commission on December 23, 2014). |
10.4 | Credit Agreement, dated as of December 22, 2014 among Rice Midstream Holdings LLC, as Borrower, Wells Fargo Bank, National Association, as administrative agent, certain lenders party thereto and the other parties thereto (incorporated by reference to Exhibit 10.2 of Rice Energy’s Current Report on Form 8-K (File No. 001-36273) filed with the Commission on December 23, 2014). |
10.5 | First Amendment to Credit Agreement, dated as of October 30, 2015, among Rice Midstream Holdings LLC as borrower, Wells Fargo Bank, N.A., as administrative agent, certain lenders party thereto and the other parties thereto (incorporated by reference to Exhibit 10.4 of Rice Energy’s Current Report on Form 8-K (File No. 001-36273) filed with the Commission on November 5, 2015). |
136
10.6 | Second Amendment to Credit Agreement and First Amendment to Guaranty and Collateral Agreement, dated as of February 19, 2016, by and among Rice Midstream Holdings LLC, as borrower, Wells Fargo Bank, N.A. as administrative agent, and the lenders and other parties thereto (incorporated by reference to Exhibit 10.5 of Rice Energy’s Quarterly Report on Form 10-Q (File No. 001-36273) filed with the Commission on May 5, 2016). |
10.7† | Amended and Restated Limited Liability Company Agreement of Rice Energy Holdings LLC (incorporated by reference to Exhibit 10.23 of Rice Energy’s Current Report on Form 8-K (File No. 001-36273) filed with the Commission on February 4, 2014). |
10.8† | First Amendment to the Amended and Restated Limited Liability Company Agreement of Rice Energy Holdings LLC, dated as of December 9, 2015 (incorporated by reference to Exhibit 7 of Rice Energy’s Schedule 13D/A (Cusip No. 762760106) filed with the Commission on December 21, 2015). |
10.9† | Amended and Restated Limited Liability Company Agreement of NGP Rice Holdings LLC (incorporated by reference to Exhibit 10.24 of Rice Energy’s Current Report on Form 8-K (File No. 001-36273) filed with the Commission on February 4, 2014). |
10.10 | Amended and Restated Agreement of Limited Partnership of Rice Midstream GP Holdings LP (incorporated by reference to Exhibit E of Amendment No. 1 to Schedule 13D (File No. 005-88475) filed with the Commission on March 7, 2016). |
10.11 | Amended and Restated Limited Liability Company Agreement of Rice Midstream Holdings LLC (incorporated by reference to Exhibit F of Amendment No. 1 to Schedule 13D (File No. 005-88475) filed with the Commission on March 7, 2016). |
10.12 *** | Amended and Restated Limited Liability Company Agreement of Strike Force Midstream LLC (incorporated by reference to Exhibit 10.4 of Rice Energy’s Quarterly Report on Form 10-Q (File No. 001-36273) filed with the Commission on May 5, 2016). |
10.13 | Third Amended and Restated Limited Liability Company Agreement of Rice Energy Operating LLC, dated as of October 19, 2016 (incorporated by reference to Exhibit 10.1 of Rice Energy’s Current Report on Form 8-K (File No. 001-36273) filed with the Commission on October 25, 2016). |
10.14† | Employment Agreement (Daniel J. Rice IV) (incorporated by reference to Exhibit 10.17 of Rice Energy’s Current Report on Form 8-K (File No. 001-36273) filed with the Commission on February 4, 2014). |
10.15† | Employment Agreement (Toby Z. Rice) (incorporated by reference to Exhibit 10.18 of Rice Energy’s Current Report on Form 8-K (File No. 001-36273) filed with the Commission on February 4, 2014). |
10.16† | Employment Agreement (Derek A. Rice) (incorporated by reference to Exhibit 10.19 of Rice Energy’s Current Report on Form 8-K (File No. 001-36273) filed with the Commission on February 4, 2014). |
10.18† | Employment Agreement (Grayson T. Lisenby) (incorporated by reference to Exhibit 10.20 of Rice Energy’s Current Report on Form 8-K (File No. 001-36273) filed with the Commission on February 4, 2014). |
10.19† | Employment Agreement (James W. Rogers) (incorporated by reference to Exhibit 10.21 of Rice Energy’s Current Report on Form 8-K (File No. 001-36273) filed with the Commission on February 4, 2014). |
10.20† | Employment Agreement (William E. Jordan) (incorporated by reference to Exhibit 10.22 of Rice Energy’s Current Report on Form 8-K (File No. 001-36273) filed with the Commission on February 4, 2014). |
10.21† | Employment Agreement (Robert R. Wingo) (incorporated by reference to Exhibit 10.19 of Rice Energy’s Annual Report on Form 10-K (File No. 001-36273) filed with the Commission on March 13, 2015). |
10.22† | Indemnification Agreement (Daniel J. Rice IV) (incorporated by reference to Exhibit 10.2 of Rice Energy’s Current Report on Form 8-K (File No. 001-36273) filed with the Commission on February 4, 2014). |
10.23† | Indemnification Agreement (Toby Z. Rice) (incorporated by reference to Exhibit 10.3 of Rice Energy’s Current Report on Form 8-K (File No. 001-36273) filed with the Commission on February 4, 2014). |
10.24† | Indemnification Agreement (Derek A. Rice) (incorporated by reference to Exhibit 10.4 of Rice Energy’s Current Report on Form 8-K (File No. 001-36273) filed with the Commission on February 4, 2014). |
10.25† | Indemnification Agreement (Grayson T. Lisenby) (incorporated by reference to Exhibit 10.5 of Rice Energy’s Current Report on Form 8-K (File No. 001-36273) filed with the Commission on February 4, 2014). |
137
10.26† | Indemnification Agreement (James W. Rogers) (incorporated by reference to Exhibit 10.6 of Rice Energy’s Current Report on Form 8-K (File No. 001-36273) filed with the Commission on February 4, 2014). |
10.27† | Indemnification Agreement (William E. Jordan) (incorporated by reference to Exhibit 10.7 of Rice Energy’s Current Report on Form 8-K (File No. 001-36273) filed with the Commission on February 4, 2014). |
10.28† | Indemnification Agreement (Daniel J. Rice III) (incorporated by reference to Exhibit 10.8 of Rice Energy’s Current Report on Form 8-K (File No. 001-36273) filed with the Commission on February 4, 2014). |
10.29† | Indemnification Agreement (Scott A. Gieselman) (incorporated by reference to Exhibit 10.9 of Rice Energy’s Current Report on Form 8-K (File No. 001-36273) filed with the Commission on February 4, 2014). |
10.30† | Indemnification Agreement (James W. Christmas) (incorporated by reference to Exhibit 10.11 of Rice Energy’s Current Report on Form 8-K (File No. 001-36273) filed with the Commission on February 4, 2014). |
10.31† | Indemnification Agreement (Robert F. Vagt) (incorporated by reference to Exhibit 10.13 of Rice Energy’s Current Report on Form 8-K (File No. 001-36273) filed with the Commission on February 4, 2014). |
10.32† | Indemnification Agreement (Robert R. Wingo) (incorporated by reference to Exhibit 10.34 of Rice Energy’s Annual Report on Form 10-K (File No. 001-36273) filed with the Commission on March 13, 2015). |
10.33† | Indemnification Agreement (John McCartney) (incorporated by reference to Exhibit 10.1 of Rice Energy’s Current Report on Form 8-K (File No. 001-36273) filed with the Commission on March 12, 2015). |
10.34† | Rice Energy Management Bonus Plan (incorporated by reference to Exhibit 10.14 of Rice Energy’s Registration Statement on Form S-1 (File No. 333-192894) filed with the Commission on November 12, 2013). |
10.35† | Rice Energy Inc. Annual Incentive Bonus Plan (incorporated by reference to Exhibit 10.1 of Rice Energy’s Current Report on Form 8-K (File No. 001-36273) filed with the Commission on June 5, 2015). |
10.36† | Form of Restricted Stock Unit Agreement (Employees) (incorporated by reference to Exhibit 10.13 of Rice Energy’s Registration Statement on Form S-1 (File No. 333-192894) filed with the Commission on December 16, 2013). |
10.37† | Form of Restricted Stock Unit Agreement (Directors) (incorporated by reference to Exhibit 10.19 of Rice Energy’s Registration Statement on Form S-1 (File No. 333-192894) filed with the Commission on January 8, 2014). |
10.38† | Amended and Restated Rice Energy Inc. 2014 Long-Term Incentive Plan (incorporated by reference to Exhibit 10.3 of Rice Energy’s Quarterly Report on Form 10-Q (File No. 001-36273) filed with the Commission on August 11, 2014). |
10.39† | Form of Performance Stock Unit (PSU) Agreement (incorporated by reference to Exhibit 10.44 of Rice Energy’s Registration Statement on Form S-1 (File No. 333-197266) filed with the Commission on July 7, 2014). |
10.40 | Form of Senior Subordinated Convertible Debentures due 2014 (incorporated by reference to Exhibit 10.14 of Rice Energy’s Registration Statement on Form S-1 (File No. 333-192894) filed with the Commission on December 16, 2013). |
10.41 | Amendment, Consent and Parent Guaranty to Senior Subordinated Convertible Debentures due 2014 (incorporated by reference to Exhibit 10.21 of Rice Energy’s Registration Statement on Form S-1 (File No. 333-192894) filed with the Commission on January 8, 2014). |
10.42 | Form of Warrant Agreement (incorporated by reference to Exhibit 10.16 of Rice Energy’s Registration Statement on Form S-1 (File No. 333-192894) filed with the Commission on December 16, 2013). |
10.43 | Form of Bonus Warrant Agreement (incorporated by reference to Exhibit 10.17 of Rice Energy’s Registration Statement on Form S-1 (File No. 333-192894) filed with the Commission on December 16, 2013). |
10.44 | Form of Amended and Restated Warrant to Purchase Shares of Common Stock (incorporated by reference to Exhibit 10.41 of Rice Energy’s Annual Report on Form 10-K (File No. 001-36273) filed with the Commission on March 21, 2014). |
10.45 | Form of Amended and Restated Bonus Warrant to Purchase Shares of Common Stock (incorporated by reference to Exhibit 10.42 of Rice Energy’s Annual Report on Form 10-K (File No. 001-36273) filed with the Commission on March 21, 2014). |
138
10.46 | Purchase Agreement dated as of April 16, 2014 among Rice Energy, the Guarantors and Barclays Capital Inc., as representative of the several initial purchasers (incorporated by reference to Exhibit 10.1 of Rice Energy’s Current Report on Form 8-K (File No. 001-36273) filed with the Commission on April 21, 2014). |
10.47 | Purchase Agreement, dated as of March 26, 2015, by and among Company, Guarantors, and Wells Fargo Securities, LLC, as representative of the initial purchasers named therein (incorporated by reference to Exhibit 10.1 of Rice Energy’s Current Report on Form 8-K (File No. 001-36273) filed with the Commission on March 26, 2015). |
10.48 | Securities Purchase Agreement, dated as of February 17, 2016, by and among Rice Midstream Holdings LLC, Rice Midstream GP Holdings LP, EIG Energy Fund XVI, L.P., EIG Energy Fund XVI-E, L.P. and EIG Holdings (RICE) Partners LP (incorporated by reference to Exhibit 10.3 of Rice Energy’s Quarterly Report on Form 10-Q (File No. 001-36273) filed with the Commission on May 5, 2016). |
10.49 | Contribution Agreement, dated as of December 22, 2014, by and among Rice Midstream Partners LP, Rice Midstream Management LLC, Rice Poseidon Midstream LLC, Rice Midstream Holdings LLC and Rice Energy Inc. (incorporated by reference to Exhibit 10.3 of Rice Energy’s Current Report on Form 8-K (File No. 001-36273) filed with the Commission on December 23, 2014). |
10.50 | Omnibus Agreement, dated as of December 22, 2014, by and between Rice Midstream Partners LP, Rice Midstream Management LLC, Rice Midstream Holdings LLC and Rice Energy Inc. (incorporated by reference to Exhibit 10.4 of Rice Energy’s Current Report on Form 8-K (File No. 001-36273) filed with the Commission on December 23, 2014). |
10.51 | Gas Gathering and Compression Agreement, dated as of December 22, 2014, by and between Rice Drilling B LLC, Rice Midstream Partners LP and Alpha Shale Resources, LP (incorporated by reference to Exhibit 10.5 of Rice Energy’s Current Report on Form 8-K (File No. 001-36273) filed with the Commission on December 23, 2014). |
10.52 | Amended and Restated Water Services Agreement, dated as of November 4, 2015, by and between Rice Drilling B LLC and Rice Water Services (PA) LLC (incorporated by reference to Exhibit 10.1 of Rice Energy’s Current Report on Form 8-K (File No. 001-36273) filed with the Commission on November 5, 2015). |
10.53 | Amended and Restated Water Services Agreement, dated as of November 4, 2015, by and between Rice Drilling D LLC and Rice Water Services (OH) LLC (incorporated by reference to Exhibit 10.2 of Rice Energy’s Current Report on Form 8-K (File No. 001-36273) filed with the Commission on November 5, 2015). |
21.1* | List of Subsidiaries of Rice Energy Operating LLC. |
23.1* | Consent of Ernst & Young LLP. |
23.2* | Consent of Netherland, Sewell & Associates, Inc. (Appalachia). |
23.3* | Consent of Netherland, Sewell & Associates, Inc. (Barnett). |
31.1* | Certification pursuant to Section 302 of the Sarbanes-Oxley Act of 2002, Rule 13a-14(a)/15d-14(a), by Chief Executive Officer. |
31.2* | Certification pursuant to Section 302 of the Sarbanes-Oxley Act of 2002, Rule 13a-14(a)/15d-14(a), by Chief Financial Officer. |
32.1** | Certification pursuant to 18 U.S.C. Section 1350, as adopted pursuant to Section 906 of the Sarbanes-Oxley Act of 2002, by Chief Executive Officer. |
32.2** | Certification pursuant to 18 U.S.C. Section 1350, as adopted pursuant to Section 906 of the Sarbanes-Oxley Act of 2002, by Chief Financial Officer. |
99.1 | Netherland, Sewell & Associates, Inc., Summary of Reserves at December 31, 2016 (Appalachia) (incorporated by referenced to Exhibit 99.1 of Rice Energy’s Annual Report on Form 10-K (File No. 001-36273) filed with the Commission on March 1, 2017). |
99.2 | Netherland, Sewell & Associates, Inc., Summary of Reserves at December 31, 2016 (Barnett) (incorporated by referenced to Exhibit 99.2 of Rice Energy’s Annual Report on Form 10-K (File No. 001-36273) filed with the Commission on March 1, 2017). |
101.INS* | XBRL Instance Document. |
101.SCH* | XBRL Schema Document. |
101.CAL* | XBRL Calculation Linkbase Document. |
101.DEF* | XBRL Definition Linkbase Document. |
101.LAB* | XBRL Labels Linkbase Document. |
101.PRE* | XBRL Presentation Linkbase Document. |
139
* | Filed herewith. |
** | Furnished herewith. Pursuant to SEC Release No. 33-8212, this certification will be treated as “accompanying” this Annual Report on Form 10-K and not “filed” as part of such report for purposes of Section 18 of the Securities Exchange Act, as amended, or otherwise subject to the liability of Section 18 of the Securities Exchange Act, as amended, and this certification will not be deemed to be incorporated by reference into any filing under the Securities Exchange Act of 1933, as amended, except to the extent that the registrant specifically incorporates it by reference. |
*** | The schedules to this agreement have been omitted from this filing pursuant to Item 601(b)(2) of Regulation S-K. The Company will furnish copies of such schedules to the Securities and Exchange Commission upon request. |
**** | Portions of this exhibit have been omitted pursuant to a granted request for confidential treatment. |
† | Management contract or compensatory plan or agreement. |
140
GLOSSARY OF OIL AND NATURAL GAS TERMS
The following are abbreviations and definitions of certain terms used in this document, which are commonly used in the oil and natural gas industry:
“BBtu.” One billion Btu
“Bcf.” One billion cubic feet of natural gas.
“Bcfe.” One billion cubic feet of natural gas equivalent, determined by using the ratio of six Mcf of natural gas to one Bbl of crude oil, condensate of natural gas liquids.
“Btu.” One British thermal unit, the quantity of heat required to raise the temperature of a one-pound mass of water by one degree of Fahrenheit.
“Basin.” A large natural depression on the earth’s surface in which sediments generally brought by water accumulate.
“Completion.” The process of treating a drilled well followed by the installation of permanent equipment for the production of natural gas or oil, or in the case of a dry hole, the reporting of abandonment to the appropriate agency.
“DD&A.” Depreciation, depletion, amortization and accretion.
“Delineation.” The process of placing a number of wells in various parts of a reservoir to determine its boundaries and production characteristics.
“Developed acreage.” The number of acres that are allocated or assignable to productive wells or wells capable of production.
“Drilling locations.” Total net resource play locations that we may be able to drill on our existing acreage. Actual drilling activities may change depending on the availability of capital, regulatory approvals, seasonal restrictions, natural gas and oil prices, costs, drilling results and other factors.
“Dry gas.” A natural gas containing insufficient quantities of hydrocarbons heavier than methane to allow their commercial extraction or to require their removal in order to render the gas suitable for fuel use.
“Dry hole.” A well found to be incapable of producing hydrocarbons in sufficient quantities such that proceeds from the sale of such production exceed production expenses and taxes.
“EUR.” Estimated ultimate recovery.
“Exploratory well.” A well drilled to find and produce natural gas or oil reserves not classified as proved, to find a new reservoir in a field previously found to be productive of natural gas or oil in another reservoir or to extend a known reservoir.
“Field.” An area consisting of a single reservoir or multiple reservoirs all grouped on, or related to, the same individual geological structural feature or stratigraphic condition. The field name refers to the surface area, although it may refer to both the surface and the underground productive formations.
“Formation.” A layer of rock which has distinct characteristics that differs from nearby rock.
“Gross acres” or “gross wells.” The total acres or wells, as the case may be, in which a working interest is owned.
“Net drilling locations.” Net drilling locations are those drilling locations identified by management based on the following criteria:
• | Undeveloped Net Marcellus Locations - We assume these locations have 8,000 foot laterals and 750 foot spacing between wells which yields approximately 138 acre spacing. In the Marcellus, we apply a 20% risking factor to our net acreage to account for inefficient unitization and the risk associated with our inability to force pool in Pennsylvania. As of December 31, 2016, we had approximately 185,000 net acres in the Marcellus which results in 861 undeveloped net locations. |
• | Undeveloped Net Ohio Utica Locations - We assume these locations have 9,000 foot laterals and 1,000 foot spacing between wells which yields approximately 207 acre spacing. In the Ohio Utica, we apply a 10% risking factor to our net |
141
acreage to account for inefficient unitization. As of December 31, 2016, we had approximately 63,000 net acres prospective for the Utica in Ohio which results in 241 undeveloped net locations.
• | Undeveloped Net Upper Devonian Locations - We assume these locations have 8,000 foot laterals and 1,000 foot spacing between wells which yields approximately 184 acre spacing. In the Upper Devonian, we apply a 20% risking factor to our net acreage to account for inefficient unitization and the risk associated with our inability to force pool in Pennsylvania. As of December 31, 2016, we had approximately 108,000 net acres prospective for the Upper Devonian which results in 464 undeveloped net locations. |
• | Undeveloped Net Pennsylvania Utica Locations - We assume these locations have 8,000 foot laterals and 2,000 foot spacing between wells which yields approximately 367 acre spacing. In the Pennsylvania Utica, we apply a 20% risking factor to our net acreage to account for inefficient unitization. As of December 31, 2016, we had approximately 105,000 net acres prospective for the Utica in Pennsylvania which results in 228 undeveloped net locations. |
• | Undeveloped Barnett Locations - These are mapped locations that we have deemed to have a high likelihood of producing economic quantities of hydrocarbons. As of December 31, 2016, we had approximately 36,000 net acres in the Barnett Shale, which results in 171 undeveloped net locations. |
“Horizontal drilling.” A drilling technique used in certain formations where a well is drilled vertically to a certain depth and then drilled at a right angle within a specified interval.
“Mcf.” One thousand cubic feet of natural gas.
“Mcfe.” One thousand cubic feet of natural gas equivalent, determined by using the ratio of six Mcf of natural gas to one Bbl of crude oil, condensate of natural gas liquids.
“MMcf.” One million cubic feet of natural gas.
“MMcfe.” One million cubic feet of natural gas equivalent, determined by using the ratio of six Mcf of natural gas to one Bbl of crude oil, condensate of natural gas liquids.
“MMBtu.” One million Btu.
MGal/D: One thousand gallons per day.
MMGal/D: One million gallons per day.
“NGLs.” Natural gas liquids. Hydrocarbons found in natural gas which may be extracted as liquefied petroleum gas and natural gasoline.
“NYMEX.” The New York Mercantile Exchange.
“Net acres.” The percentage of total acres an owner has out of a particular number of acres, or a specified tract. An owner who has 50% interest in 100 acres owns 50 net acres.
“Productive well.” A well that is found to be capable of producing hydrocarbons in sufficient quantities such that proceeds from the sale of the production exceed production expenses and taxes.
“Prospect.” A specific geographic area which, based on supporting geological, geophysical or other data and also preliminary economic analysis using reasonably anticipated prices and costs, is deemed to have potential for the discovery of commercial hydrocarbons.
“Proved developed reserves.” Reserves that can be expected to be recovered through existing wells with existing equipment and operating methods.
“Proved reserves.” The estimated quantities of oil, natural gas and NGLs which geological and engineering data demonstrate with reasonable certainty to be commercially recoverable in future years from known reservoirs under existing economic and operating conditions.
“Proved undeveloped reserves (“PUD”).” Proved reserves that are expected to be recovered from new wells on undrilled acreage or from existing wells where a relatively major expenditure is required for recompletion.
“PV-10.” When used with respect to natural gas and oil reserves, PV-10 means the estimated future gross revenue to be generated from the production of proved reserves, net of estimated production, future development and abandonment
142
costs, using prices and costs in effect at the determination date, before income taxes, and without giving effect to non-property-related expenses, discounted to a present value using an annual discount rate of 10% in accordance with the guidelines of the SEC.
“Recompletion.” The process of re-entering an existing wellbore that is either producing or not producing and completing new reservoirs in an attempt to establish or increase existing production.
“Reservoir.” A porous and permeable underground formation containing a natural accumulation of producible oil and/or natural gas that is confined by impermeable rock or water barriers and is separate from other reservoirs.
“Spacing.” The distance between wells producing from the same reservoir. Spacing is often expressed in terms of acres, e.g., 40-acre spacing, and is often established by regulatory agencies.
“Standardized measure.” Discounted future net cash flows estimated by applying year-end prices to the estimated future production of year-end proved reserves. Future cash inflows are reduced by estimated future production and development costs based on period-end costs to determine pre-tax cash inflows. Future income taxes, if applicable, are computed by applying the statutory tax rate to the excess of pre-tax cash inflows over our tax basis in the natural gas and oil properties. Future net cash inflows after income taxes are discounted using a 10% annual discount rate.
“Undeveloped acreage.” Lease acreage on which wells have not been drilled or completed to a point that would permit the production of commercial quantities of natural gas and oil regardless of whether such acreage contains proved reserves.
“Unit.” The joining of all or substantially all interests in a reservoir or field, rather than a single tract, to provide for development and operation without regard to separate property interests. Also, the area covered by a unitization agreement.
“Wellbore.” The hole drilled by the bit that is equipped for natural gas production on a completed well. Also called well or borehole.
“Working interest.” The right granted to the lessee of a property to explore for and to produce and own natural gas or other minerals. The working interest owners bear the exploration, development, and operating costs on either a cash, penalty, or carried basis.
143