Attached files
| file | filename |
|---|---|
| EX-32.2 - EXHIBIT 32.2 - Forbes Energy Services Ltd. | fes-ex322k2016.htm |
| EX-32.1 - EXHIBIT 32.1 - Forbes Energy Services Ltd. | fes-ex321k2016.htm |
| EX-31.2 - EXHIBIT 31.2 - Forbes Energy Services Ltd. | fes-ex312k2016.htm |
| EX-31.1 - EXHIBIT 31.1 - Forbes Energy Services Ltd. | fes-ex311k2016.htm |
| EX-23.1 - EXHIBIT 23.1 - Forbes Energy Services Ltd. | fes-ex2312016.htm |
| EX-21.1 - EXHIBIT 21.1 - Forbes Energy Services Ltd. | fes-ex2112016.htm |
UNITED STATES
SECURITIES AND EXCHANGE COMMISSION
WASHINGTON, D.C. 20549
____________________________________________________________
Form 10-K
____________________________________________________________
(Mark One)
ý | ANNUAL REPORT PURSUANT TO SECTION 13 OR 15(d) OF THE SECURITIES EXCHANGE ACT OF 1934 |
For the fiscal year ended December 31, 2016
OR
¨ | TRANSITION REPORT PURSUANT TO SECTION 13 OR 15(d) OF THE SECURITIES EXCHANGE ACT OF 1934 |
Commission file number 001-35281
____________________________________________________________
Forbes Energy Services Ltd.
(Exact name of registrant as specified in its charter)
____________________________________________________________
Texas | 98-0581100 | |
(State or other jurisdiction of incorporation or organization) | (I.R.S. Employer Identification No.) | |
3000 South Business Highway 281 Alice, Texas | 78332 | |
(Address of principal executive offices) | (Zip Code) | |
Registrant’s telephone number, including area code: (361) 664-0549
Securities registered pursuant to Section 12(b) of the Act:
Title of Each Class | Name of Each Exchange on Which Registered | |
Common Stock, $0.04 par value | Over-the-Counter (Pink Sheets) | |
Securities registered pursuant to Section 12(g) of the Act:
Title of Each Class
None
____________________________________________________________
Indicate by check mark if the registrant is a well-known seasoned issuer, as defined in Rule 405 of the Securities Act. ¨ Yes ý No
Indicate by check mark if the registrant is not required to file reports pursuant to Section 13 or Section 15(d) of the Act. ¨ Yes ý No
Indicate by check mark whether the registrant (1) has filed all reports required to be filed by Section 13 or 15(d) of the Securities Exchange Act of 1934 during the preceding 12 months (or for such shorter period that the registrant was required to file such reports), and (2) has been subject to such filing requirements for the past 90 days. ý Yes ¨ No
Indicate by check mark whether the registrant has submitted electronically and posted on its corporate website, if any, every Interactive Data File required to be submitted and posted pursuant to Rule 405 of Regulation S-T during the preceding 12 months (or for such shorter period that the registrant was required to submit and post such files). ý Yes ¨ No
Indicate by check mark if disclosure of delinquent filers pursuant to Item 405 of Regulation S-K is not contained herein and will not be contained, to the best of the registrant’s knowledge, in definitive proxy or information statements incorporated by reference in Part III of this Form 10-K or any amendment to this Form 10-K. ý
Indicate by check mark whether the registrant is a large accelerated filer, an accelerated filer, a non-accelerated filer or a smaller reporting company. See the definitions of “large accelerated filer,” “accelerated filer” and “smaller reporting company” in Rule 12b-2 of the Exchange Act.
Large Accelerated Filer | ¨ | Accelerated Filer | ¨ |
Non-Accelerated Filer | ¨ | Smaller Reporting Company | ý |
Indicate by check mark whether the registrant is a shell company (as defined in Exchange Act Rule 12b-2). ¨ Yes ý No
The aggregate market value of the stock held by non-affiliates of the registrant as of the last business day of the most recently completed second fiscal quarter, June 30, 2016, was approximately $3.8 million based on the closing sales price of the registrant’s common stock as reported by the NASDAQ Capital Market on June 30, 2016 of $0.18 per share and 21,140,907 shares held by non-affiliates.
As of March 28, 2017, there were 22,214,855 common shares outstanding.
FORBES ENERGY SERVICES LTD. AND SUBSIDIARIES (a/k/a the “Forbes Group”)
TABLE OF CONTENTS
Page | ||
Item 1. | ||
Item 1A. | ||
Item 1B. | ||
Item 2. | ||
Item 3. | ||
Item 4. | ||
Item 5. | ||
Item 6. | ||
Item 7. | ||
Item 7A. | ||
Item 8. | ||
Item 9. | ||
Item 9A. | ||
Item 9B. | ||
Item 10. | ||
Item 11. | ||
Item 12. | ||
Item 13. | ||
Item 14. | ||
Item 15. | ||
Item 16. | ||
i
FORWARD-LOOKING STATEMENTS
This Annual Report on Form 10-K and any oral statements made in connection with it include certain forward-looking statements within the meaning of the federal securities laws. You can generally identify forward-looking statements by the appearance in such a statement of words like “anticipate,” “believe,” “continue,” “could,” “estimate,” “expect,” “intend,” “may,” “plan,” “potential,” “predict,” “project” or “should” or other comparable words or the negative of these words. When you consider our forward-looking statements, you should keep in mind the risk factors we describe and other cautionary statements we make in this Annual Report on Form 10-K. Our forward-looking statements are only predictions based on expectations that we believe are reasonable. Our actual results could differ materially from those anticipated in, or implied by, these forward-looking statements as a result of known risks and uncertainties set forth below and elsewhere in this Annual Report on Form 10-K. These factors include or relate to the following:
• | our ability to obtain the Bankruptcy Court's approval with respect to motions or other requests made to the Bankruptcy Court in the chapter 11 cases, including maintaining strategic control as debtor-in-possession; |
• | our ability to consummate the Plan; |
• | the effects of the filing of the chapter 11 cases on our business and the interests of various constituents; |
• | our ability to execute our business and financial reorganization plan; |
• | increased advisory costs to execute our reorganization; |
• | the effect of the industry-wide downturn in energy exploration and development activities; |
• | continuing incurrence of operating losses due to such downturn; |
• | the willingness of the counterparties to our revolving credit facility and our indenture and senior notes to continue to forbear under such debt agreements; |
• | oil and natural gas commodity prices; |
• | market response to global demands to curtail use of oil and natural gas; |
• | capital budgets and spending by the oil and natural gas industry; |
• | the ability or willingness of the Organization of Petroleum Exporting Countries, or OPEC, to set and maintain production levels for oil; |
• | oil and natural gas production levels by non-OPEC countries; |
• | supply and demand for oilfield services and industry activity levels; |
• | our ability to maintain stable pricing; |
• | our level of indebtedness; |
• | possible impairment of our long-lived assets; |
• | potential for excess capacity; |
• | competition; |
• | substantial capital requirements; |
• | significant operating and financial restrictions under our indenture and revolving credit facility or any replacement financing; |
• | technological obsolescence of operating equipment; |
• | dependence on certain key employees; |
• | concentration of customers; |
• | substantial additional costs of compliance with reporting obligations, the Sarbanes-Oxley Act and indenture covenants; |
• | seasonality of oilfield services activity; |
• | collection of accounts receivable; |
• | environmental and other governmental regulation, including potential climate change legislation; |
ii
• | the potential disruption of business activities caused by the physical effects, if any, of climate change; |
• | risks inherent in our operations; |
• | ability to fully integrate future acquisitions; |
• | variation from projected operating and financial data; |
• | variation from budgeted and projected capital expenditures; |
• | volatility of global financial markets; and |
• | the other factors discussed under “Risk Factors” beginning on page 12 of this Annual Report on Form 10-K. |
We undertake no obligation to update or revise any forward-looking statements, whether as a result of new information, future events or otherwise. To the extent these risks, uncertainties and assumptions give rise to events that vary from our expectations, the forward-looking events discussed in this Annual Report on Form 10-K may not occur. All forward-looking statements attributable to us are qualified in their entirety by this cautionary statement.
iii
PART I
Item 1. | Business |
Overview
Forbes Energy Services Ltd., or FES Ltd., is an independent oilfield services contractor that provides a wide range of well site services to oil and natural gas drilling and producing companies to help develop and enhance the production of oil and natural gas. These services include fluid hauling, fluid disposal, well maintenance, completion services, workovers, and recompletions, plugging and abandonment, and tubing testing. Our operations are concentrated in the major onshore oil and natural gas producing regions of Texas, with an additional location in Pennsylvania. We believe that our broad range of services, which extends from initial drilling, through production, to eventual abandonment, is fundamental to establishing and maintaining the flow of oil and natural gas throughout the life cycle of our customers’ wells. Our headquarters and executive offices are located at 3000 South Business Highway 281, Alice, Texas 78332. We can be reached by phone at (361) 664-0549.
As used in this Annual Report on Form 10-K, the “Company,” the “Forbes Group,” “we,” and “our” mean FES Ltd. and its subsidiaries, except as otherwise indicated.
We currently provide a wide range of services to a diverse group of companies. During the year ended December 31, 2016, we provided services to over 480 companies. John E. Crisp and Charles C. Forbes, Jr., members of our senior management team, have cultivated deep and ongoing relationships with our customers during their average of over 40 years of experience in the oilfield services industry.
We currently conduct our operations through the following two business segments:
• | Well Servicing. Our well servicing segment comprised 61.0% of our total revenues for the year ended December 31, 2016. At December 31, 2016, our well servicing segment utilized our fleet of well servicing rigs, which was comprised of 159 workover rigs and 14 swabbing rigs, six coiled tubing spreads, and other related assets and equipment. These assets are used to provide (i) well maintenance, including remedial repairs and removal and replacement of downhole production equipment, (ii) well workovers, including significant downhole repairs, re-completions and re-perforations, (iii) completion and swabbing activities, (iv) plugging and abandonment services, and (v) testing of oil and natural gas production tubing and scanning tubing for pitting and wall thickness using tubing testing units. |
• | Fluid Logistics. Our fluid logistics segment comprised 39.0% of our total revenues for the year ended December 31, 2016. Our fluid logistics segment utilized our fleet of owned or leased fluid transport trucks and related assets, including specialized vacuum, high-pressure pump and tank trucks, frac tanks, water wells, salt water disposal wells and facilities, and related equipment. These assets are used to provide, transport, store, and dispose of a variety of drilling and produced fluids used in, and generated by, oil and natural gas production. These services are required in most workover and completion projects and are routinely used in the daily operation of producing wells. |
We believe that our two business segments are complementary and create synergies in terms of selling opportunities. Our multiple lines of service are designed to capitalize on our existing customer base to grow within existing markets, generate more business from existing customers, and increase our operating performance. By offering our customers the ability to reduce the number of vendors they use, we believe that we help improve our customers’ efficiency. This is demonstrated by the fact that 78.3% of our total revenues for the year ended December 31, 2016 were from customers that utilized services of both of our business segments. Further, by having multiple service offerings that span the life cycle of the well, we believe that we have a competitive advantage over smaller competitors offering more limited services.
1
The following table summarizes the number of locations and major components of our equipment fleet as of the dates indicated.
December 31, | ||||||||
2016 | 2015 | 2014 | ||||||
Locations | 23 | 25 | 28 | |||||
Well Servicing Segment: | ||||||||
Workover rigs | 159 | 159 | 158 | |||||
Swabbing rigs | 14 | 14 | 11 | |||||
Tubing testing units | 9 | 9 | 9 | |||||
Coiled tubing spreads | 6 | 6 | 6 | |||||
Fluid logistics segment: | ||||||||
Vacuum trucks | 431 | 453 | 453 | |||||
Other heavy trucks | 106 | 146 | 134 | |||||
Frac tanks and fluid mixing tanks | 2,908 | 3,060 | 3,209 | |||||
Salt water disposal wells (1) | 20 | 22 | 23 | |||||
(1) | At December 31, 2016, 15 salt water disposal wells, included in the above well count, were subject to verbal or written ground leases or other operating arrangements with third parties. The above well count does not include one well that has been permitted and drilled but has not been completed. |
Corporate Structure
FES Ltd. was initially organized as a Bermuda exempt company on April 9, 2008. On August 12, 2011, FES Ltd. discontinued its existence as a Bermuda entity and converted into a Texas corporation, or the Texas Conversion. FES Ltd. has been and is the holding company for all of our operations. Forbes Energy Services LLC, or FES LLC, a Delaware limited liability company, is a wholly-owned subsidiary of FES Ltd. that acts as an intermediate holding company for our direct and indirect wholly-owned operating companies that have conducted our business historically: C.C. Forbes, LLC, or CCF, TX Energy Services, LLC, or TES, and Forbes Energy International, LLC, or FEI. Effective July 1, 2015, we completed an internal corporate reorganization, which simplified our corporate structure. Our former subsidiary, Superior Tubing Testers, LLC, merged with and into CCF.
In connection with the Texas Conversion, FES Ltd. effected a 4-to-1 share consolidation, whereby each four shares of common stock of FES Ltd. with a par value $0.01 per share were consolidated into a single share of common stock with a par value $0.04. On August 16, 2011, the common stock of FES Ltd. was listed and began trading on the NASDAQ Global Market under the symbol "FES." We transferred our common stock listing from the NASDAQ Global Market to the NASDAQ Capital Market on March 31, 2016. Our common stock was listed on the NASDAQ Capital Market under the symbol "FES." As a result of our failure to satisfy the continued listing requirements of the NASDAQ Capital Market, on November 21, 2016, our common stock was suspended from trading on the NASDAQ Capital Market. Since November 21, 2016, our common stock has been quoted on the Pink Sheets under the symbol “FESLQ.” On February 4, 2017, our common stock was delisted from the NASDAQ Capital Market but continues to be quoted on the Pink Sheets.
Our Competitive Position
We believe that the following competitive strengths position us well within the oilfield services industry:
• | Exposure to Revenue Streams Throughout the Life Cycle of the Well. Our maintenance and workover services expose us to demand from our customers throughout the life cycle of a well, from drilling through production and eventual abandonment. Each new well that is drilled provides us a potential multi-year stream of well servicing revenue, as our customers attempt to maximize and maintain a well’s productivity. Accordingly, demand for our production services is generally driven by the total number of producing wells in a region and is generally less volatile than demand for new well drilling services. |
• | High Level of Customer Retention. Our top customers include many of the largest integrated and independent oil and natural gas companies operating onshore in the United States. We believe that our success comes from growing in our existing markets with existing customers due to the quality of our well servicing rigs, our personnel, and our safety record. We believe members of our senior management team have maintained excellent |
2
working relationships with our top customers in the United States during their average of over 40 years of experience in the oilfield services industry. We believe the complementary nature of our two business segments also helps retain customers because of the efficiency we offer a customer that has multiple needs at the wellsite. Notably, 78.3% of our total revenues from the year ended December 31, 2016 were from customers that utilize services in both of our business segments.
• | Industry-Leading Safety Record. During 2016, we had approximately 21.0% fewer reported incidents than the industry average as published by the Bureau of Labor Statistics. We believe that our safety record and reputation are critical factors to purchasing and operations managers in their decision-making process. We have a strong safety culture based on our training programs and safety seminars for our employees and customers. For example, for several years, members of our senior management have played an integral part in joint safety training meetings with customer personnel. In addition, our deployment of new well servicing rigs with enhanced safety features has contributed to our strong safety record and reputation. |
• | Experienced Senior Management Team and Operations Staff. Our senior management team of John E. Crisp and Charles C. Forbes, Jr. have over 80 years of combined experience within the oilfield services industry. In addition, our next level of management, which includes our location managers, has an average of over 36 years of experience in the industry. |
Our Business Strategy
Our strategy in this rapidly changing market:
• | Maintain Maximum Asset Utilization. We constantly monitor asset usage and industry trends as we strive to maximize utilization. We accomplish this through moving assets from regions with less activity to those with more activity or that are increasing in activity. We are focusing on basins that are either predominantly oil or contain natural gas with high liquids content, such as the Eagle Ford Shale basin in South Texas. In the current environment of the industry downturn, we are minimizing costs by concentrating utilization in as few assets as possible while eliminating or substantially reducing our operating expenses on the inactive assets. |
• | Maintain a Presence in Proven and Established Oil and Liquids Rich Basins. We focus our operations on customers that operate in well-established basins which have proven production histories and that have maintained a high level of activity throughout various oil and natural gas pricing environments. We believe production-related services help create a more stable revenue stream, as such services are tied more to producing wells and less to drilling activity. Our experience shows that historically, production-related services have generally withstood depressed economic or industry conditions better than drilling services. |
• | Establish and Maintain Leadership Position in Core Operating Areas. Based on our estimates, we believe that we have a significant market share in well servicing and fluid logistics in South Texas. We strive to establish and maintain significant positions within each of our core operating areas. To achieve this goal, we maintain close customer relationships and offer high-quality services to our customers. In addition, our significant presence in our core operating areas facilitates employee retention and hiring and brand recognition. |
• | Maintain a Disciplined Growth Strategy. We strategically evaluate opportunities for growth and expansion. In order to maximize our ability to take advantage of growth opportunities, from time to time, we have closed or sold operations in certain areas. In the current environment of the industry downturn, we are more focused on cost reductions which generally involve the review of all locations for potential cost savings, up to and including closing the location. |
• | Minimize Expenses. We constantly review our expenses seeking opportunities to reduce costs including, but not limited to, closing locations, reducing middle management, eliminating rental equipment, wage reductions, vendor consolidation, and headcount reductions, particularly during industry downturns such as the current condition. We believe these initiatives are necessary in order for the Company to be competitive in the current market environment. |
Description of Business Segments
Well Servicing Segment
Through our fleet of 173 well servicing rigs, which was comprised of 159 workover rigs and 14 swabbing rigs, as of December 31, 2016, located in 10 operational areas across Texas and one in Pennsylvania, we provide a comprehensive offering of well services to oil and natural gas companies, including completions of newly drilled oil and natural gas wells, wellbore maintenance, workovers and recompletions, tubing testing, and plugging and abandonment services. Due to the
3
current downturn, 100 rigs were stacked as of December 31, 2016. We currently operate six coiled tubing spreads that are used to mill, log, perforate, clean out, drill plugs, cement, acidize, and fish/retrieve tools/pipe in producing oil and gas wells. The services offered are customized to the customer's job specific requirements. Our well servicing rig fleet has an average age of less than eleven years. As part of our operational strategy, we enhanced our design specifications to improve the operational and safety characteristics of our well servicing rigs compared with some of the older well servicing rigs operated by others in the industry. These include increased derrick height and weight ratings and increased mud pump horsepower. We believe these enhanced features translate into increased demand for our equipment and services along with better pricing for our equipment and personnel. In addition, we augment our well servicing rig fleet with auxiliary equipment, such as mud pumps, power swivels, mud plants, mud tanks, blow-out preventers, lighting plants, generators, pipe racks, and tongs, which results in incremental rental revenue and increases financial performance of a typical well servicing job.
We provide the following services in our well servicing segment:
• | Completions. Utilizing our well servicing rig fleet and coiled tubing equipment, we perform completion services, which involve wellbore cleanout, well prepping for fracturing, drilling, setting and retrieving plugs, fishing operations, tool conveyance and logging, cementing, well unloading, casing and packer testing, pump-down plug, velocity strings, perforating, acidizing and/or stimulating a wellbore, along with swabbing operations that are utilized to clean a wellbore prior to production. Completion services are generally shorter term in nature and involve our equipment operating on a site for a period of two to three days, although some fishing jobs, which involve the recovery of equipment lost or stuck in the wellbore, can take longer. |
• | Maintenance. Through our fleet of well servicing rigs and coiled tubing units, we provide for the removal and repair of sucker rods, downhole pumps, and other production equipment, the repair of failed production tubing, and the removal of sand, paraffin, and other downhole production-related byproducts that impair well performance. These operations typically involve our well servicing rigs or coil tubing equipment operating on a wellsite for five to seven days. |
• | Workovers and Recompletions. We provide workover and re-completion services for existing wellbores. These services are designed to significantly enhance production by re-perforating to initiate or re-establish productivity from an oil or natural gas wellbore. In addition, we provide major downhole repairs such as casing repair, production tubing replacement, and deepening and sidetracking operations used to extend a wellbore laterally or vertically. These operations are typically longer term in nature and involve our well servicing rigs operating on a wellsite for one to two weeks at a time. |
• | Tubing Testing. Our downhole testing units provide downhole tubing testing services that allow operators to verify tubing integrity. Tubing testing services are performed as production tubing is run into a new wellbore or on older wellbores as production tubing is replaced during a workover operation. In addition to our downhole testing units, our electromagnetic scan trucks scan tubing while out of the wellbore. This scanning function provides key operational information related to corrosion pitting, holes and splits, and wall loss on tubing. Tubing testing services are complementary to our other service offerings and provide a significant opportunity for cross-selling. |
• | Plugging and Abandonment. Our well servicing rigs are also used in the process of permanently closing oil and natural gas wells that are no longer capable of producing in economic quantities, become mechanically impaired or are dry holes. Plugging and abandonment work can be performed with a well servicing rig along with wireline and cementing equipment; however, this service is typically provided by companies that specialize in plugging and abandonment work. Many well operators bid this work on a “lump sum” basis to include the sale or disposal of equipment salvaged from the well as part of the compensation received. We perform plugging and abandonment work in conjunction with equipment provided by other service companies. |
Fluid Logistics Segment
Our fluid logistics segment provides an integrated array of oilfield fluid sales, transportation, storage, and disposal services that are required on most workover, drilling, and completion projects and are routinely used in daily operation of producing wells by oil and natural gas producers. We have a substantial operational footprint with 13 fluid logistics locations across Texas as of December 31, 2016, and an extensive fleet of transportation trucks, high-pressure pump trucks, hot oil trucks, frac tanks, fluid mixing tanks and salt water disposal wells. This combination of services enables us to provide a one-stop source for oil and natural gas companies. Although there are large operators in our areas, we believe that the vast majority of our smaller competitors in this segment can provide some, but not all, of the equipment and services required by customers, thereby requiring our customers to use several companies to meet their requirements and increasing their administrative burden. In addition, by pursuing an integrated approach to service, we experience increased asset utilization rates, as multiple assets are usually required to service a customer.
4
We provide the following services in our fluid logistics segment:
• | Fluid Hauling. At December 31, 2016, we owned 431 fluid service vacuum trucks, trailers, and other hauling trucks equipped with a fluid hauling capacity of up to 150 barrels per unit, with most of the units having a capacity of 130 barrels. Due to the current downturn, 315 trucks and trailers were stacked as of December 31, 2016. Each fluid service truck unit is equipped to pump fluids from or into wells, pits, tanks, and other on-site storage facilities. The majority of our fluid service truck units are also used to transport water to fill frac tanks on well locations, including frac tanks provided by us and others, to transport produced salt water to disposal wells, including injection wells owned and/or operated by us, and to transport drilling and completion fluids to and from well locations. In conjunction with the rental of frac tanks, we use fluid service trucks to transport water for use by our customers in fracturing operations. Following completion of fracturing operations by our customers, our fluid service trucks are used to transport the flowback produced as a result of the fracturing operations from the wellsite to disposal wells. We also operate several hot oil trucks which are capable of providing heated water and oil for use in well and pipe maintenance. |
• | Disposal Services. Most oil and natural gas wells produce varying amounts of salt water throughout their productive lives. Under Texas law, oil and natural gas waste and salt water produced from oil and natural gas wells are required to be disposed of in authorized facilities, including permitted salt water disposal wells. Disposal, or injection, wells are licensed by state authorities and are completed in permeable formations below the fresh water table. At December 31, 2016, we operated 20 disposal wells in 17 locations across Texas, with an aggregate injection capacity of approximately 196,000 barrels per day. The wells are permitted to dispose of salt water and incidental non-hazardous oil and natural gas wastes throughout our operational bases in Texas. It is our intent to locate the salt water disposal wells in close proximity to the producing wells of our customers. Although, in the normal course of production development, it is not uncommon for drilling and production activity to migrate closer to or farther away from our disposal wells. We maintain separators at all of our disposal wells that permit us to reclaim residual crude oil that we sell. |
• | Equipment Rental. At December 31, 2016, we owned a fleet of 2,908 fluid storage tanks that can store up to 500 barrels of fluid each. Due to the current downturn, 8 fluid storage tanks were stacked as of December 31, 2016. This equipment is used by oilfield operators to store various fluids at the wellsite, including fresh water, brine and acid for frac jobs, flowback, temporary production, and drilling fluids. We transport the tanks with our trucks to well locations that are usually within a 75-mile radius of our nearest location. Frac tanks are used during all phases of the life of a producing well. A typical fracturing operation conducted by a customer can be completed within four days using five to 40 or more frac tanks. We believe we maintain one of the youngest frac tank fleets in the industry with an average equipment age of approximately six years. |
• | Fluid Sales. We sell and transport a variety of chemicals and fluids used in drilling, completion, and workover operations for oil and natural gas wells. Although this is a relatively small percentage of our overall business, the provision of these chemicals and fluids increases utilization of and enhances revenues from the associated equipment. Through these services, we provide fresh water used in fracturing fluid, completion fluids, cement, and drilling mud. In addition, we provide potassium chloride for completion fluids, brine water, and water-based drilling mud. |
Financial Information about Segments and Geographic Areas
See Item 7 “Management’s Discussion and Analysis of Financial Condition and Results of Operations” and Note 16 to our consolidated financial statements included in this Annual Report on Form 10-K for further discussion regarding financial information by segment and geographic location.
Seasonality and Cyclical Trends
Our operations are impacted by seasonal factors. Historically, our business has been negatively impacted during the winter months due to inclement weather, fewer daylight hours, and holidays. Our well servicing rigs are mobile and we operate a significant number of oilfield vehicles. During periods of heavy snow, ice or rain, we may not be able to move our equipment between locations, thereby reducing our ability to generate rig or truck hours. In addition, the majority of our well servicing rigs work only during daylight hours. In the winter months, as daylight time becomes shorter, the amount of time that the well servicing rigs work is shortened, which has a negative impact on total hours worked. Finally, we historically have experienced significant slowdown during the Thanksgiving and Christmas holiday seasons.
In addition, the oil and natural gas industry has traditionally been volatile and is influenced by a combination of long-term, short-term and cyclical trends, including the domestic and international supply and demand for oil and natural gas, current and expected future prices for oil and natural gas and the perceived stability and sustainability of those prices. Such cyclical trends also include the resultant levels of cash flows generated and allocated by exploration and production companies
5
to their drilling, completion and workover budget. The volatility of the oil and natural gas industry and the recent precipitous decline in oil and natural gas prices have negatively impacted the level of exploration and production activity and capital expenditures by our customers. This has adversely affected, and in the future may adversely affect, the demand for our services, which has had, and if it continues, will continue to have, a material adverse effect on our business, financial condition, results of operations, and cash flows.
Sales Organization
Our sales structure is primarily decentralized where each of our business regions cultivates and maintains relationships with customer representatives who manage operations in their respective regions. At the regional level, management maintains relationships with key personnel in the operators' branch or division offices and in each business unit function. In the field, district, or yard managers and supervisors are the primary point of contact for sales to operator field representatives. At the corporate level, account managers are assigned to our larger customers to act as liaison between the number of customer contacts within the organization and the appropriate contacts within each function of the Forbes organization. Sales representatives typically serve multiple roles and in that way are involved in most aspects of the sales cycle, from order fulfillment to billing. Our customers represent both large and small independent oil and natural gas companies that are largely managed at the field level, and depending on the structure, have corporate procurement groups also coordinating supply chain decisions. We cross-market our well servicing rigs along with our fluid logistics services, thereby offering our customers the ability to minimize vendors, which we believe improves the efficiency of our customers. This is demonstrated by the fact that 78.3% of our revenues for the year ended December 31, 2016 was from customers that utilized services of both of our business segments.
Employees
As of December 31, 2015, we had 1,182 employees and, as a result of cost saving measures during the ongoing industry downturn, as of December 31, 2016, we had 825 employees, a reduction of 357 employees, or 30.2%.
We provide comprehensive employee training and implement recognized standards for health and safety. None of our employees are represented by a union or employed pursuant to a collective bargaining agreement or similar arrangement. We have not experienced any strikes or work stoppages, and we believe we have good relations with our employees.
Continued retention of existing qualified management and field employees and availability of additional qualified management and field employees will be a critical factor in our continued success as we work to ensure that we have adequate levels of experienced personnel to service our customers.
Competition
Our competition includes small regional service providers as well as larger companies with operations throughout the continental United States and internationally. Our larger competitors are Basic Energy Services, Inc., Superior Energy Services, Inc., Nuverra Environmental Solutions, Key Energy Services, Inc., C&J Energy Services, Inc., and Stallion Oilfield Services, Ltd. We believe that some of these larger competitors have centralized management teams that direct their operations and decision-making primarily from corporate and regional headquarters. In addition, because of their size, these companies market a large portion of their work to the major oil and natural gas companies. We compete primarily on the basis of the young age and quality of our equipment, our safety record, the quality and expertise of our employees, and our responsiveness to customer needs.
Customers
We served in excess of 480 customers during the year ended December 31, 2016. For the years ended December 31, 2016, 2015, and 2014, our largest customer in each year comprised approximately 16.2%, 17.2%, and 18.8% of our total revenues, respectively; our five largest customers comprised approximately 56.8%, 48.5%, and 42.7% of our total revenues, respectively; and our ten largest customers comprised approximately 70.1%, 67.0%, and 56.6% of our total revenues, respectively. During 2016, ConocoPhillips, Chesapeake Energy, and EOG Resources made up 16.2%, 11.7%, and 11.3% of our total revenues, respectively. During 2015, ConocoPhillips and Anadarko Petroleum Corporation made up 17.2%, and 11.3% of our total revenues, respectively. During 2014, ConocoPhillips made up 18.8% of our total revenues. The loss of our top customer or of several of the customers in the top ten would materially adversely affect our revenues and results of operations. There can be no assurance that lost revenues could be replaced in a timely manner or at all, especially given the current market conditions.
We have master service agreements in place with most of our customers, under which jobs or projects are awarded on the basis of price, type of service, location of equipment, and the experience level of work crews. Our business segments charge customers by the hour, by the day, or by the project for the services, equipment, and personnel we provide.
6
Suppliers
We purchase well servicing chemicals, drilling fluids, and related supplies from various third-party suppliers. We purchase potassium chloride from three suppliers: Agri-Empresa, Inc., Chem Tech Services, Inc. and Tetra Technologies, Inc. For all other well servicing products, such as barite, surfactants, and drilling fluids, we purchase from various suppliers of well servicing products when needed.
Although we do not have written agreements with any of our suppliers (other than leases with respect to certain equipment), we have not historically suffered from an inability to purchase or lease equipment or purchase raw materials.
Insurance
Our operations are subject to risks inherent in the oilfield services industry, such as equipment defects, malfunctions, failures and natural disasters. In addition, hazards such as unusual or unexpected geological formations, pressures, blow-outs, fires or other conditions may be encountered in drilling and servicing wells, as well as the transportation of fluids and our assets between locations. We have obtained insurance coverage against certain of these risks which we believe is customary in the industry. We have $100.0 million of excess liability coverage. Our general liability policy is self-insured up to $250 thousand for each occurrence. We also make estimates and accrue for amounts we expect to owe in excess of any insurance and to satisfy deductibles or self-insured retentions. Such insurance is subject to coverage limits and exclusions and may not be available for all of the risks and hazards to which we are exposed. In addition, no assurance can be given that such insurance will be adequate to cover our liabilities or will be generally available in the future or, if available, that premiums will be commercially justifiable. If we incur substantial liability and such damages are not covered by insurance or are in excess of policy limits, or if we incur such liability at a time when we are not able to obtain liability insurance, our business, results of operations, and financial condition could be materially and adversely affected.
Environmental Regulations
Our operations are subject to various federal, state and local laws and regulations in the United States pertaining to health, safety, and the environment. Laws and regulations protecting the environment have become more stringent over the years, and in certain circumstances may impose strict, joint and several liability, rendering us potentially liable for environmental damage without regard to negligence or fault on our part and for environmental response costs for which others have contributed. Moreover, cleanup costs, penalties, and other damages arising as a result of new, or changes to existing, environmental laws and regulations could be substantial and could have a material adverse effect on our financial condition, results of operations, and cash flows. We believe that we conduct our operations in substantial compliance with current federal, state, and local requirements related to health, safety and the environment. There were no known material liabilities for each of the years ended December 31, 2016, 2015, and 2014.
The following is a summary of the more significant existing environmental, health, and safety laws and regulations to which our operations are subject and for which compliance may have a material adverse effect on our results of operation or financial position. See Item 1A beginning on page 12 of this Annual Report for further details on the following: Risk Factors— Due to the nature of our business, we may be subject to environmental liability.
Hazardous Substances and Waste
The Comprehensive Environmental Response, Compensation, and Liability Act, as amended, or CERCLA, and comparable state laws in the United States impose liability without regard to fault or the legality of the original conduct on certain defined persons, including current and prior owners or operators of the site where a release of hazardous substances occurred and entities that disposed or arranged for the disposal of the hazardous substances found at the site and entities that selected and transported the hazardous substances to the site. Under CERCLA, these responsible persons may be jointly and severally liable for the costs of cleaning up the hazardous substances, for damages to natural resources, and for the costs of certain health studies. In the course of our operations, we handle materials that are regulated as hazardous substances and, as a result, may incur CERCLA liability for cleanup costs. Also, claims may be filed for personal injury and property damage allegedly caused by the release of or exposure to hazardous substances or other pollutants.
We also handle solid wastes that are subject to the requirements of the Resource Conservation and Recovery Act, as amended, or RCRA, and comparable state statutes. Certain materials generated in the exploration, development, or production of crude oil and natural gas are excluded from RCRA’s hazardous waste regulation under RCRA Subtitle C, but may be subject to regulation as a solid waste under RCRA Subtitle D. Moreover, these wastes, which include wastes currently generated during our operations, could be designated as “hazardous wastes” in the future and become subject to more rigorous and costly disposal requirements. Any such changes in the laws and regulations could have a material adverse effect on our operating expenses.
Although we have used operating and disposal practices that were standard in the industry at the time, hydrocarbons or other wastes may have been released at properties owned or leased by us now or in the past, or at other locations where these
7
hydrocarbons and wastes were taken for treatment or disposal. Under CERCLA, RCRA and analogous state laws, we could be required to clean up contaminated property (including contaminated groundwater), perform remedial activities to prevent future contamination, pay for associated natural resource damages, or pay significant monetary penalties for such releases.
Water Discharges
We operate facilities that are subject to requirements of the Clean Water Act, as amended, or CWA, and analogous state laws that impose restrictions and controls on the discharge of pollutants into navigable waters. Pursuant to these laws, permits must be obtained to discharge pollutants into state waters or waters of the United States, including to discharge storm water runoff from certain types of facilities. Spill prevention, control, and countermeasure requirements under the CWA require implementation of measures to help prevent the contamination of navigable waters in the event of a hydrocarbon spill. The CWA can impose substantial civil and criminal penalties for non-compliance. We believe that our disposal and equipment cleaning facilities are in substantial compliance with CWA requirements.
Air Emissions
Our facilities and operations are also subject to regulation under the Clean Air Act (CAA) and analogous state and local laws and regulations for air emissions. Changes in and scheduled implementation of these laws could lead to the imposition of new air pollution control requirements for our operations. Therefore, we may incur future capital expenditures to upgrade or modify air pollution control equipment or come into compliance where needed. We believe that our operations are in substantial compliance with CAA requirements. The EPA proposed to amend the new source performance standards for the oil and natural gas source category on September 18, 2015. The new source performance standards regulating methane emissions from the oil and gas sector were finalized in June 2016. In the current form, these regulations require a reduction in methane emissions from new and modified infrastructure and equipment in the oil and gas sector, including the drilling of new wells, by up to 45% from 2012 levels by the year 2025. The Trump Administration has, however, indicated disapproval of the regulations and is expected to repeal, withdraw, or significantly modify the new source performance standards in the upcoming year.
Employee Health and Safety
We are subject to the requirements of the federal Occupational Safety and Health Act, as amended, or OSHA, and comparable state laws that regulate the protection of employee health and safety. OSHA’s hazard communication standard requires that information about hazardous materials used or produced in our operations be maintained and provided to employees, state and local government authorities, and citizens. In addition, OSHA requires that certain safety measures such as hazard controls and employee training be implemented to prevent employee exposure to safety and health hazards and dangerous conditions at oil and gas sites. We believe that our operations are in substantial compliance with OSHA requirements.
Climate Change Regulation
Continued political attention to issues concerning climate change, the role of human activity in it, and potential mitigation through regulation could have a material impact on our operations and financial results. International agreements and national or regional legislation and regulatory measures to limit greenhouse emissions are currently in various stages of discussion or implementation. These and other greenhouse gas emissions-related laws, policies, and regulations may result in substantial capital, compliance, operating and maintenance costs. Material price increases or incentives to conserve or use alternative energy sources could reduce demand for services that we currently provide and adversely affect our operations and financial results. The ultimate financial impact associated with compliance with these laws and regulations is uncertain and is expected to vary depending on the laws enacted in each jurisdiction, our activities in those jurisdictions and market conditions.
Other Laws and Regulations
We operate salt water disposal wells that are subject to the CWA, Safe Drinking Water Act, and state and local laws and regulations, including those established by the EPA’s Underground Injection Control Program which establishes the minimum program requirements. Our salt water disposal wells are located in Texas, which requires us to obtain a permit to operate each of these wells. We have such permits for each of our operating salt water disposal wells. The Texas regulatory agency may suspend, modify, or terminate any of these permits if such well operation is likely to result in pollution of fresh water, substantial violation of permit conditions or applicable rules, contributes to seismic activity or leaks to the environment. We maintain insurance against some risks associated with our well service activities, but there can be no assurance that this insurance will continue to be commercially available or available at premium levels that justify its purchase by us. The occurrence of a significant event that is not fully insured or indemnified could have a materially adverse effect on our financial condition and operations. In addition, hydraulic fracturing practices have come under increased scrutiny in recent years as various regulatory bodies and public interest groups investigate the potential impacts of hydraulic fracturing on fresh water sources. Risks associated with potential regulation of hydraulic fracturing are discussed in more detail under Item 1A. Risk
8
Factors: Federal and state legislative and regulatory initiatives relating to hydraulic fracturing could result in increased cost and additional operating restrictions or delays.
Recent Events
Reorganization and Chapter 11 Proceedings
On January 22, 2017, FES Ltd., FES LLC, CCF, TES and FEI or, collectively, the Debtors, filed voluntary petitions, or the Petitions, for reorganization under chapter 11 of the United States Bankruptcy Code, or the Bankruptcy Code, in the Bankruptcy Court pursuant to the terms of a Restructuring Support Agreement (as defined below) that contemplates the reorganization of the Debtors pursuant to the Plan. The Debtors will continue to operate their businesses as "debtors in possession" under the jurisdiction of the Bankruptcy Court and in accordance with the applicable provisions of the Bankruptcy Code and orders of the Bankruptcy Court. The Bankruptcy Court granted all first day motions filed by the Debtors allowing the Debtors to operate their businesses in the ordinary course throughout the pendency of the chapter 11 cases. The first day motions included, among other things, a cash collateral motion, a motion maintaining the Company's existing cash management system and motions permitting certain vendor payments, wage payments and tax payments in the ordinary course of business. Subject to certain exceptions under the Bankruptcy Code, the chapter 11 cases automatically stayed most judicial or administrative actions against the Debtors or their property to recover, collect, or secure a prepetition claim. This prohibits, for example, our lenders or note holders from pursuing claims for defaults under our debt agreements during the pendency of the chapter 11 cases. On March 29, 2017, the Bankruptcy Court entered an order confirming the Plan. We expect the consummation of the Plan to become effective on or about April 13, 2017; however, there can be no assurance that the effectiveness of the Plan will occur on such date, or at all.
Restructuring Support Agreement
Prior to filing the Petitions, on December 21, 2016, the Debtors entered into a restructuring support agreement, or the Restructuring Support Agreement, with certain holders, or the Supporting Noteholders, of our 9% senior unsecured notes due 2019, or the 9% Senior Notes, representing an aggregate of approximately 65.4% in principal amount of the 9% Senior Notes. The Restructuring Support Agreement contemplates the financial reorganization of the Debtors, or the Reorganization, pursuant to the Plan. Pursuant to the Restructuring Support Agreement, the Supporting Noteholders agreed to, among other things, support the Reorganization pursuant to the terms of the Plan. On December 22, 2016, the Debtors commenced a solicitation of votes to accept or reject the Plan from the holders of the 9% Senior Notes. Holders of approximately 87.14% in principal amount of the 9% Senior Notes voted in favor of the Plan. Of the holders of the 9% Senior Notes that voted to accept or reject the Plan, 93.75% of such holders voted to accept the Plan, which represents 99.46% in principal amount of the 9% Senior Notes held by such holders.
The Plan
The Plan, which was confirmed by the Bankruptcy Court on March 29, 2017, provides that among other things, on the effective date of the Plan:
• | All existing Equity Interests (as defined in the Plan and which include our common stock, our preferred stock, awards under our 2012 Incentive Compensation Plan, or the Compensation Plan, and the preferred stock purchase rights under the Rights Agreement dated as of May 19, 2008 and subsequently amended on July 8, 2013, or the Rights Agreement, between us and CIBC Mellon Trust Company, as rights agent) in FES Ltd. will be extinguished without recovery; |
• | The 9% Senior Notes will be canceled and each holder of the 9% Senior Notes will receive such holder’s pro rata share of (i) $20 million in cash and (ii) 100% of the new common stock of reorganized FES Ltd., subject to dilution only as a result of the shares of new common stock of reorganized FES Ltd. issued or available for issuance in connection with a proposed management incentive plan, or the Management Incentive Plan; |
• | Certain holders of the 9% Senior Notes will make available to the reorganized Debtors a $50 million new first lien term loan facility, or the Exit Facility, which will be backstopped by certain Supporting Noteholders; |
• | Reorganized FES Ltd. will adopt and implement the Management Incentive Plan, which will provide for the issuance of restricted stock units covering shares of common stock of reorganized FES Ltd. to the officers and other key employees of the reorganized Debtors in an amount up to 12.5% of the sum of (i) the number of shares of the common stock of reorganized FES Ltd. issued to the holders of the 9% Senior Notes and (ii) the number of shares of common stock of reorganized FES Ltd. issued or available for issuance under the Management Incentive Plan; |
9
• | The Debtors’ loan and security agreement governing their revolving credit facility, or the Loan Agreement, dated as of September 9, 2011, and subsequently amended, with Regions Bank, or Regions, and Regions as the sole lender party thereto, or the Lender, will be terminated and a new letter of credit facility will be entered into with Regions, or the New Regions Facility, on the Plan’s effective date covering the letters of credit and Bank Product Obligations (as defined in the Loan Agreement) outstanding under the Loan Agreement; |
• | The Lender, in full satisfaction and settlement of its claims against the Debtors, will (i) receive cash to satisfy all outstanding obligations with respect to the Revolving Advances (as defined in the Loan Agreement), including, without limitation, all outstanding Revolving Advances and all interest, fees, and other charges due and payable under the Loan Agreement relating to the Revolving Advances, and (ii) as to the Issuer and Bank Product Provider (as each term is defined in the Loan Agreement), continue to hold the cash pledged by Debtors to collateralize all outstanding letters of credit and Bank Product Obligations under the Loan Agreement that will be covered by the New Regions Facility; and |
• | Holders of allowed creditor claims, aside from holders of the 9% Senior Notes, will either receive, on account of such claims, payment in full in cash or otherwise have their rights reinstated under the Bankruptcy Code. |
Assuming implementation of the Plan, we expect that we will eliminate approximately $280 million in principal amount of the 9% Senior Notes plus accrued interest thereon.
Defaults under Outstanding Debt Instruments
FES Ltd.’s failure to make the semi-annual interest payments on the 9% Senior Notes on June 15, 2016, and December 31, 2016, or, collectively, the Missed Interest Payments, after the cure periods provided for in the Senior Indenture, other events of default resulting from technical breaches of covenants under the Senior Indenture and the Loan Agreement and the filing of the Petitions on January 22, 2017 or, collectively, the Debt Instrument Defaults, would have resulted in all outstanding indebtedness due under the Senior Indenture and the Loan Agreement immediately becoming due and payable. However, pursuant to (i) the forbearance agreement related to the Senior Indenture entered into July 15, 2016, as subsequently amended, or the Indenture Forbearance Agreement, by and among the Debtors and the Supporting Noteholders and (ii) the forbearance agreement related to the Loan Agreement entered into July 15, 2016, as subsequently amended and restated, or the Loan Forbearance Agreement, by and among the Debtors, Regions, as agent, and the Lender, the Supporting Noteholders, Regions and the Lender agreed to forbear from exercising default remedies or accelerating any indebtedness under their respective debt instrument resulting from the Debt Instrument Defaults while they worked with the Debtors to reach an agreement on the Reorganization. Additionally, any efforts to enforce such payment obligations were automatically stayed as a result of the filing of the Petitions, and the creditors' rights of enforcement in respect of the Senior Indenture and the Loan Agreement are subject to the applicable provisions of the Bankruptcy Code and orders of the Bankruptcy Court.
Going Concern and Financial Reporting in Reorganization
Our commencement of the chapter 11 cases and the weak industry conditions have negatively impacted our results of operations and cash flows and may continue to do so in the future. These factors raise substantial doubt about our ability to continue as a going concern. The accompanying consolidated financial statements have been prepared in conformity with accounting principles accepted in the United States of America which contemplate the continuation of the Company as a going concern.
Delisting of Our Common Stock from the NASDAQ Capital Market
On August 16, 2011, the common stock of FES Ltd. was listed and began trading on the NASDAQ Global Market. The Company transferred its common stock listing from the NASDAQ Global Market to the NASDAQ Capital Market on March 31, 2016. Our common stock was listed on the NASDAQ Capital Market under the symbol "FES." As a result of our failure to satisfy the continued listing requirements of the NASDAQ Capital Market, on November 21, 2016, our common stock was suspended from trading on the NASDAQ Capital Market. Since November 21, 2016, our common stock has been quoted on the Pink Sheets under the symbol “FESLQ.” On February 4, 2017, our common stock was delisted from the NASDAQ Capital Market but continues to be quoted on the Pink Sheets.
Available Information
Information regarding Forbes Energy Services Ltd. and its subsidiaries can be found on our website at http://www.forbesenergyservices.com. We make available on our website, free of charge, access to our annual reports on Form 10-K, quarterly reports on Form 10-Q, current reports on Form 8-K Proxy Statements and amendments to those reports, as well as
10
other documents that we file or furnish to the Securities and Exchange Commission, or the SEC, in accordance with Sections 13 or 15(d) of the Securities Exchange Act of 1934, as amended, or the Exchange Act, as soon as reasonably practicable after these reports have been electronically filed with, or furnished to, the SEC. We also post copies of any press releases we issue on our website. We intend to use our website as a means of disclosing material non-public information and for complying with disclosure obligations under Regulation FD. Such disclosures will be included on our website under the heading “Investor Relations.” Accordingly, investors should monitor such portion of our website, in addition to following our press releases, SEC filings and public conference calls and webcasts. Information filed with the SEC may be read or copied at the SEC’s Public Reference Room at 100 F Street, N.E., Washington, D.C. 20549. Information on operation of the Public Reference Room may be obtained by calling the SEC at 1-800-SEC-0330. The SEC also maintains an internet website (http://www.sec.gov) that contains reports, proxy and information statements, and other information regarding issuers that file electronically. Our Second Amended and Restated Employee Code of Business Conduct and Ethics (which applies to all employees, including our Chief Executive Officer and Chief Financial Officer), Amended and Restated Code of Business Conduct and Ethics for Members of the Board of Directors and the charters for our Audit, Nominating/Corporate Governance and Compensation Committees, can all be found on the Investor Relations page of our website under “Corporate Governance.” We intend to disclose any changes to or waivers from the Second Amended and Restated Employee Code of Business Conduct and Ethics that would otherwise be required to be disclosed under Item 5.05 of Form 8-K on our website. We will also provide printed copies of these materials to any shareholder upon request to Forbes Energy Services Ltd., Attn: Chief Financial Officer, 3000 South Business Highway 281, Alice, Texas 78332. The information on our website is not, and shall not be deemed to be, a part of this report or incorporated into any other filings we make with the Commission.
11
Item 1A. | Risk Factors |
The following information describes certain significant risks and uncertainties inherent in our business. You should take these risks into account when evaluating us. This section does not describe all risks applicable to us, our industry or our business, and it is intended only as a summary of known material risks that are specific to the Company. You should carefully consider such risks and uncertainties together with the other information contained in this Form 10-K. If any of such risks or uncertainties actually occurs, our business, financial condition or operating results could be harmed substantially and could differ materially from the plans and other forward-looking statements included in Item 7 “Management’s Discussion and Analysis of Financial Condition and Results of Operations” of this Annual Report on Form 10-K and elsewhere herein.
RISKS RELATING TO CHAPTER 11 PROCEEDINGS
We will be subject to the risks and uncertainties associated with the chapter 11 cases.
As a consequence of our filing for relief under the Bankruptcy Code, our operations and our ability to develop and execute our business plan, and our continuation as a going concern, will be subject to the risks and uncertainties associated with bankruptcy. These risks include the following:
• | our ability to execute and consummate the Plan or another plan of reorganization with respect to the chapter 11 cases; |
• | the high costs of bankruptcy proceedings and related fees; |
• | our ability to execute our business plan post-emergence in the current depressed commodity price environment; |
• | our ability to maintain our relationships with our suppliers, service providers, customers, employees and other third parties; |
• | our ability to maintain contracts that are critical to our operations; |
• | our ability to attract, motivate and retain key employees; |
• | the actions and decisions of our creditors and other third parties who have interests in our chapter 11 cases that may be inconsistent with our plans. |
These risks and uncertainties could affect our business and operations in various ways. For example, negative events associated with our chapter 11 cases could adversely affect our relationships with our vendors, customers, employees and other third parties, which in turn could adversely affect our operations and financial condition. While we expect to continue normal operations, public perception of our continued viability may affect, among other things, the desire of new and existing customers to enter into or continue their agreements or arrangements with us. The failure to maintain any of these important relationships could adversely affect our business, financial condition and results of operations. Because of the public disclosure of the chapter 11 cases and our liquidity constraints, our ability to maintain normal credit terms with vendors may be impaired.
Additionally, since the commencement of the chapter 11 cases, transactions outside the ordinary course of business require approval of the Bankruptcy Court, which may limit our ability to respond timely to certain events or to take advantage of certain opportunities. We are operating under a cash management strategy to preserve liquidity. This ongoing cash management strategy limits many of our operational and strategic initiatives designed to maintain or grow our business over the long term. Because of the risks and uncertainties associated with the chapter 11 cases, we cannot predict or quantify the ultimate impact that events occurring during the reorganization process will have on our business, financial condition and results of operations. Furthermore, as a result of the chapter 11 cases, the realization of assets and the satisfaction of liabilities are subject to uncertainty.
The commencement of the chapter 11 cases has consumed and will continue to consume a substantial portion of the time and attention of our management and will impact how our business is conducted, which may have an adverse effect on our business and results of operations.
The requirements of the chapter 11 cases have consumed and will continue to consume a substantial portion of our management’s time and attention and leave them with less time to devote to the operation of our business. This diversion of
attention may materially adversely affect the conduct of our business and, as a result, our financial condition and results of operations.
12
On the effective date of the Plan, our historical financial information may not be indicative of our future financial performance.
Our capital structure will be significantly altered under the Plan. Under fresh start reporting rules that will apply to us on the effective date of the Plan (or any alternative plan of reorganization), our assets and liabilities will be adjusted to fair values and our accumulated deficit will be restated to zero. Accordingly, when fresh start reporting rules apply, our financial condition and results of operations following our emergence from chapter 11 will not be comparable to the financial condition and results of operations reflected in our historical financial statements. Further, a plan of reorganization could materially change the amounts and classifications reported in our consolidated historical financial statements, which do not give effect to any adjustments to the carrying value of assets or amounts of liabilities that might be necessary as a consequence of confirmation of a plan of reorganization. In addition, in connection with the chapter 11 cases and the Plan, it is also possible that additional restructuring and related charges may be identified and recorded in future periods. Such charges could be material to our financial condition and results of operations in any given period.
Trading in our securities during the pendency of the chapter 11 cases is highly speculative and poses substantial risks. The Plan will result in the cancellation of our Equity Interests (as defined in the Plan).
Under the Plan, all existing Equity Interests (as defined in the Plan and which include our common stock, our preferred stock, awards under the Compensation Plan and the preferred stock purchase rights under the Rights Agreement) in FES Ltd. will be extinguished without recovery. Amounts invested by the holders of our common stock and preferred stock will not be recoverable and such securities will have no value. Trading prices for our existing equity or other securities bears no relationship to the actual recovery, if any, by the holders thereof in the chapter 11 cases. Accordingly, we urge extreme caution with respect to existing and future investments in our existing equity or other securities.
On the effective date of the Plan, the composition of our board of directors will change substantially.
Under the Plan, the composition of our board of directors will change substantially. On the effective date of the Plan, the board will be made up of five directors. Of those five directors, one will continue to be our President and Chief Executive Officer and the remaining four directors will be selected by the Supporting Noteholders. Accordingly, four of our five board members will be new to the Company. Any new directors are likely to have different backgrounds, experiences and perspectives from those individuals who previously served on the board of directors and, thus, may have different views on the issues that will determine our future. As a result, our future strategy and plans may differ materially from those of the past.
The Plan or any other plan of reorganization that we may implement will be based in large part upon assumptions and analyses developed by us. If these assumptions and analyses prove to be incorrect, such plan may be unsuccessful in its execution.
The Plan or any other plan of reorganization that we may implement will affect both our capital structure and the ownership, structure and operation of our businesses and will reflect assumptions and analyses based on our experience and perception of historical trends, current conditions and expected future developments, as well as other factors that we consider appropriate under the circumstances. Whether actual future results and developments will be consistent with our expectations and assumptions depends on a number of factors, including but not limited to (i) our ability to change substantially our capital structure; (ii) our ability to obtain adequate liquidity and financing sources; (iii) our ability to maintain customers’ confidence in our viability as a continuing entity and to attract and retain sufficient business from them; (iv) our ability to retain key employees, and (v) the overall strength and stability of general economic conditions and conditions of the oil and gas industry in the United States. The failure of any of these factors could materially adversely affect the successful reorganization of our businesses.
In addition, the Plan or any other plan of reorganization, will rely upon financial projections, including with respect to revenues, capital expenditures, debt service and cash flow. Financial forecasts are necessarily speculative, and it is likely that one or more of the assumptions and estimates that are the basis of these financial forecasts will not be accurate. In our case, the forecasts are even more speculative than normal, because they involve fundamental changes in the nature of our capital structure. Accordingly, we expect that our actual financial condition and results of operations will differ, perhaps materially, from what we have anticipated. Consequently, there can be no assurance that the results or developments contemplated by any plan of reorganization we may implement will occur or, even if they do occur, that they will have the anticipated effects on us or our businesses or operations. The failure of any such results or developments to materialize as anticipated could materially adversely affect the successful execution of any plan of reorganization.
13
Inadequate liquidity could materially adversely affect our future business operations.
Given the current business environment, our liquidity needs could be significantly higher than we currently anticipate. Our ability to maintain adequate liquidity through 2017 and beyond will depend on our ability to successfully implement an appropriate plan of reorganization, successful operation of our business, appropriate management of operating expenses and capital spending. Our expected liquidity needs are highly sensitive to changes in each of these and other factors. Even if we successfully take any of the actions described above, we may be required to execute asset sales or other capital generating actions over and above our normal business activities and cut back or eliminate other programs that are important to the future success of our business. In addition, our customers and suppliers might respond to further weakening of our liquidity position by requesting quicker payment or requiring collateral. If this were to happen, our need for cash would be intensified and we may be unable to operate our business successfully.
Even if a chapter 11 plan of reorganization is consummated, we may not be able to achieve our stated goals and continue as a going concern.
Even if the Plan, or any other plan of reorganization, is consummated, we will continue to face a number of risks, including further deterioration in commodity prices or other changes in economic conditions, changes in our industry, changes in demand for oil and natural gas and increasing expenses. Accordingly, we cannot guarantee that the Plan, or any other plan of reorganization, will achieve our stated goals.
Furthermore, even if our debts are reduced or discharged through the Plan, we may need to raise additional funds through public or private debt or equity financing or other various means to fund our business after the completion of our chapter 11 cases. Our access to additional financing is, and for the foreseeable future will likely continue to be, extremely limited, if it is available at all. Therefore, adequate funds may not be available when needed or may not be available on favorable terms.
We may be subject to claims that will not be discharged in our chapter 11 proceedings, which could have a material adverse effect on our financial condition and results of operations.
Except as set forth in the Plan or any other plan of reorganization, the Bankruptcy Code provides that the confirmation of such plan discharges a debtor from substantially all debts arising prior to confirmation. Under the Plan, on the effective date of the Plan, the 9% Senior Notes will be canceled and the Loan Agreement will be terminated. However, holders of allowed creditor claims, aside from holders of the 9% Senior Notes, will receive, on account of such claims, payment in full in cash or otherwise have their rights reinstated under the Bankruptcy Code. Accordingly, any creditor claims reinstated under the Bankruptcy Code could have an adverse effect on our financial condition and results of operations on a post-reorganization basis.
There may be a delay of the Effective Date.
Although we expect the consummation of the Plan to become effective on or about April 13, 2017, there can be no assurance as to such timing or that the conditions to such effective date contained in the Plan will ever occur. The impact that a prolonging of the chapter 11 cases may have on our operations cannot be accurately predicted or quantified. The continuation of the chapter 11 cases, particularly if the Plan is not implemented within the time frame currently contemplated, could adversely affect our operations and the relationships that we have with our customers, suppliers, and creditors. The continuation could also result in increased professional fees and similar expenses. Any substantial delay of the effective date of the Plan could further weaken our liquidity position.
Transfers or issuances of our equity, before or in connection with our chapter 11 cases, may impair our ability to utilize our federal income tax net operating loss carryforwards in future years.
Under U.S. federal income tax law, a corporation is generally permitted to deduct from taxable income net operating losses carried forward from prior years. We had net operating loss carryforwards of approximately $149.2 million as of December 31, 2016. We believe that we will generate additional net operating losses for the 2017 tax year. Our ability to utilize our net operating loss carryforwards to offset future taxable income and to reduce our U.S. federal income tax liability is subject to certain requirements and restrictions. If we experience an “ownership change,” as defined in section 382 of the Internal Revenue Code, or the Code, our ability to use our pre-emergence net operating loss carryforwards may be substantially limited, which could have a negative impact on our financial position and results of operations. Generally, there is an “ownership change” if one or more shareholders owning five percent or more of a corporation’s common stock have aggregate increases in their ownership of such stock of more than 50 percentage points over the prior three-year period. Under section 382 of the Code, absent an applicable exception, if a corporation undergoes an “ownership change,” the amount of its
14
net operating losses that may be utilized to offset future taxable income generally is subject to an annual limitation. Even if the net operating loss carryforwards are subject to limitation under Section 382, our net operating losses may be absorbed by cancellation of indebtedness income pursuant to Internal Revenue Code Section 108.
We requested that the Bankruptcy Court approve restrictions on certain transfers of our stock to limit the risk of an “ownership change” prior to our restructuring in our chapter 11 cases. Following the implementation of our Plan, it is likely that an “ownership change” will be deemed to occur and our net operating losses will nonetheless be subject to annual limitation.
We may be unable to obtain a listing of the new common stock of reorganized FES Ltd. on the NASDAQ Capital Market or the OTC Markets.
We have submitted an application for listing the new common stock of reorganized FES Ltd. on the NASDAQ Global Market under the symbol “FRB.” If we are unable to obtain such a listing on the NASDAQ Global Market, we will instead seek to have the new common stock of reorganized FES Ltd. listed on the NASDAQ Capital Market or quoted on the OTC Markets or the Pink Sheets until such time as we are able to obtain a NASDAQ Global Market or NASDAQ Capital Market listing for the new common stock of reorganized FES Ltd. However, there can be no assurance that we will be successful in obtaining a listing of the new common stock of reorganized FES Ltd. on the NASDAQ Global Market or NASDAQ Capital Market or the OTC Markets or the Pink Sheets. Furthermore, even if the new common stock of reorganized FES Ltd. is approved for listing on the NASDAQ Global Market or NASDAQ Capital Market or is approved for quotation on the OTC Markets, we are not certain that any trading market will develop or, if it develops, whether such trading market will be sustained.
RISKS RELATING TO OUR BUSINESS
The industry in which we operate is highly volatile and dependent on domestic spending by the oil and natural gas industry, and continued and prolonged reductions in oil and natural gas prices and in the overall level of exploration and development activities may further reduce our levels of utilization, demand for our services, or pricing for our services.
The levels of utilization, demand, pricing, and terms for oilfield services in our existing or future service areas largely depend upon the level of exploration and development activity for both crude oil and natural gas in the United States. Oil and natural gas industry conditions are influenced by numerous factors over which we have no control, including oil and natural gas prices, expectations about future oil and natural gas prices, levels of supply and consumer demand, the cost of exploring for, producing and delivering oil and natural gas, the expected rates of current production, the discovery rates of new oil and natural gas reserves, available pipeline and other oil and natural gas transportation capacity, political instability in oil and natural gas producing countries, merger and divestiture activity among oil and natural gas producers, political, regulatory and economic conditions, and the ability of oil and natural gas companies to raise equity capital or debt financing. Any addition to, or elimination or curtailment of, government incentives for companies involved in the exploration for and production of oil and natural gas could have a significant effect on the oilfield services industry in the United States.
Our operations may be materially affected by severe weather conditions, such as hurricanes, drought, or extreme temperatures. Such events could result in evacuation of personnel, suspension of operations or damage to equipment and facilities. Damage from adverse weather conditions could result in a material adverse effect on our financial condition, results of operations and cash flows.
Beginning in October 2014, through 2015 and 2016, oil prices worldwide dropped significantly. If the current depressed oil and natural gas prices persist for a prolonged period, or decline further, in addition to cancellations and curtailments that have already taken place, oil and gas exploration and production companies will likely cancel or curtail additional drilling programs and lower production spending on existing wells even more than they have already, thereby further reducing demand for our services. Lower oil and natural gas prices could also cause our customers to seek to terminate, renegotiate, or fail to honor our service contracts.
A continued and prolonged reduction in the overall level of exploration and development activities, whether resulting from changes in oil and natural gas prices or otherwise, could materially and adversely affect us by negatively impacting:
• | our revenues, cash flows and profitability; |
• | the fair market value of our equipment fleet; |
• | our ability to maintain or increase our borrowing capacity; |
15
• | our ability to obtain additional capital to finance our business and make acquisitions, and the cost of that capital; |
• | the collectability of our receivables; and |
• | our ability to retain skilled personnel whom we would need in the event of an upturn in the demand for our services. |
The ongoing decrease in utilization, demand for our services and pricing has had, and if it continues will continue to have a material adverse effect on our business, financial condition, results of operations, and cash flows.
We extend credit to our customers which presents a risk of non-payment.
A substantial portion of our accounts receivable are with customers involved in the oil and natural gas industry, whose revenues are also affected by fluctuations in oil and natural gas prices, including the recent substantial decline in oil prices. Collection of some of these receivables will be more difficult, and due to economic factors affecting this industry, we may experience an increase in uncollectible accounts. Failure to collect a significant level of receivables from one or more customers could have a material adverse effect on our business, financial condition, results of operations, and cash flows.
We may be adversely affected by uncertainty in the global financial markets and any significant softening in the already limited worldwide economic recovery.
Despite the recent modest global economic recovery, our future results still may be impacted by any significant reversal as well as any further slowdown in such recovery or inflation, deflation, or other adverse economic conditions. These conditions may negatively affect us or parties with whom we do business. The impact on such third parties could result in their non-payment or inability to perform obligations owed to us such as the failure of customers to honor their commitments or the failure of major suppliers to complete orders. Additionally, credit market conditions have changed slowing our collection efforts as customers experience increased difficulty in obtaining requisite financing, potentially leading to lost revenue and higher than normal accounts receivable. This has resulted in greater expense associated with collection efforts and increased bad debt expense. Failure to collect a significant level of receivables from one or more customers could have a material adverse effect on our business, financial condition, results of operations, and cash flows.
A deterioration of the economic recovery may cause institutional investors to respond to their customers by increasing interest rates, enacting tighter lending standards, or refusing to refinance existing debt upon its maturity or on terms similar to the expiring debt. We will likely require additional capital in the future. However, due to the above listed factors, we cannot be certain that additional funding will be available, if needed, and, to the extent required, on acceptable terms.
The market for oil and natural gas may be adversely affected by global demands to curtail use of such fuels.
Fuel conservation measures, alternative fuel requirements, increasing consumer demand for alternatives to oil and natural gas and technological advances in fuel economy and energy generation devices could reduce the demand for oil and other liquid hydrocarbons. We cannot predict the effect of changing demand for oil and natural gas products, and any major changes may have a material adverse effect on our business, financial condition, results of operations and cash flows.
We may be unable to maintain or increase pricing on our core services.
We may periodically seek to increase the prices on our services to offset rising costs or to generate higher returns for our shareholders. However, we operate in a very competitive industry and, as a result, we are not always successful in raising or maintaining our existing prices. Additionally, during periods of increased market demand, a significant amount of new service capacity may enter the market, which also puts pressure on the pricing of our services and limits our ability to increase prices.
Even when we are able to increase our prices, we may not be able to do so at a rate that is sufficient to offset such rising costs. In periods of high demand for oilfield services, a tighter labor market may result in higher labor costs. During such periods, our labor costs could increase at a greater rate than our ability to raise prices for our services. Also, we may not be able to successfully increase prices without adversely affecting our activity levels. The inability to maintain or increase our pricing as costs increase could have a material adverse effect on our business, financial position, and results of operations.
Our customer base is concentrated within the oil and natural gas production industry and loss of a significant customer could cause our revenue to decline substantially.
We served in excess of 480 customers for the year ended December 31, 2016, and over 700 for the year ended December 31, 2015. For those same time periods, our largest customer comprised approximately 16.2% and 17.2% of our total revenues, respectively; our five largest customers comprised approximately 56.8% and 48.5% of our total revenues, respectively; and our top ten customers comprised approximately 70.1% and 67.0% of our total revenues, respectively. Our
16
top 100 customers amounted to 96.1% and 95.4% for the years ended December 31, 2016 and 2015, respectively. The loss of our top customer or of several of our top customers would adversely affect our revenues and results of operations. We may be able to replace customers lost with other customers, but there can be no assurance that lost revenues could be replaced in a timely manner with the same margins or, perhaps, at all.
Our indebtedness and operating lease commitments could restrict our operations and make us more vulnerable to adverse economic conditions.
As of December 31, 2016, our long-term debt, including current portions, was $299.2 million and our annual commitment for operating leases for 2017 is $2.2 million. In the event the decline in activity continues or further declines are encountered, our level of indebtedness and operating lease payment obligations may adversely affect operations and limit our growth. Our level of indebtedness and operating lease payments may affect our operations in several ways, including the following:
• | by increasing our vulnerability to general adverse economic and industry conditions; |
• | due to the fact that the covenants that are contained in the Senior Indenture and the Loan Agreement limit our ability to borrow funds, dispose of assets, pay dividends and make certain investments; |
• | due to the fact that any failure to comply with the covenants of the Senior Indenture and the Loan Agreement (including failure to make the required interest payments) could result and did result in an event of default under the Senior Indenture and the Loan Agreement, which would result in all outstanding indebtedness due under the Senior Indenture and the Loan Agreement becoming immediately due and payable, as discussed more fully in Part I-Item 1. Business-Reorganization and Chapter 11 Proceedings; |
• | all of our indebtedness may become immediately due and payable; and |
• | due to the fact that our level of debt may impair our ability to obtain additional financing in the future for working capital, capital expenditures, acquisitions, or other general corporate purposes. |
These restrictions could have a material adverse effect on our business, financial position, results of operations, and cash flows, and the ability to satisfy the obligations under the Senior Indenture and the Loan Agreement. Further, due to cross-default provisions in the Senior Indenture and the Loan Agreement, with certain exceptions, a default and acceleration of outstanding debt under one debt agreement would result in the default and possible acceleration of outstanding debt under the other debt agreement. Accordingly, an event of default could result in all or a portion of our outstanding debt under our debt agreements becoming immediately due and payable. If this occurred, we might not be able to obtain waivers or secure alternative financing to satisfy all of our obligations simultaneously, which would adversely affect our business and operations. On the effective date of the Plan, the 9% Senior Notes will be canceled and the Loan Agreement will be terminated; however, we will be subject to similar restrictions under the Exit Facility.
Impairment of our long-term assets may adversely impact our financial position and results of operations.
During the second quarter of 2016, we determined that the continued decline in revenues and industry-wide slowdown related to oil prices was other than temporary and was an impairment indicator. Therefore, we assessed all of our long-lived assets for impairment, which resulted in the carrying amounts of long-lived assets associated with our fluid logistics segment in exceeding the recoverable amounts based upon the undiscounted cash flow analysis. As a result, we hired an independent consulting firm to measure the fair values of the long-lived assets associated with our fluid logistics segment. Based on the fair value analysis, the fair values of certain intangible assets were determined to be less than their carrying amounts; therefore, an impairment loss of $14.5 million was recorded as a component of operating expenses based on the amount that the carrying value exceeded fair value. Fair value of the intangible assets was determined utilizing a combination of the income, cost and market approaches. Specific intangible assets affected were customer relationships and other intangibles. We did not experience any additional triggering events in the third or fourth quarters of 2016; however, we could have material impairments in the future.
17
The industry in which we operate is highly competitive.
The oilfield services industry is highly competitive and we compete with a substantial number of companies, some of which have greater technical and financial resources than we have. Examples of our larger competitors performing both well servicing and fluid logistics are Basic Energy Services, Inc., Superior Energy Services, Inc., Key Energy Services, Inc., and C&J Energy Services, Inc. Our largest competitors that compete only with our fluid logistics segment are Nuverra Environmental Solutions and Stallion Oilfield Services, Ltd. Our ability to generate revenues and earnings depends primarily upon our ability to win bids in competitive bidding processes and to perform awarded projects within estimated times and costs. There can be no assurance that competitors will not substantially increase the resources devoted to the development and marketing of products and services that compete with ours or that new or existing competitors will not enter the various markets in which we are active. In certain aspects of our business, we also compete with a number of small and medium-sized companies that, like us, have certain competitive advantages such as low overhead costs and specialized regional strengths. In addition, reduced levels of activity in the oil and natural gas industry has intensified competition and the pressure on competitive pricing and may result in lower revenues or margins to us.
The Senior Indenture and the Loan Agreement impose significant operating and financial restrictions on us that may prevent us from pursuing certain business opportunities and restrict or limit our ability to operate our business.
The Senior Indenture and the Loan Agreement contain covenants that restrict or limit our ability to take various actions, such as:
• | incurring or guaranteeing additional indebtedness or issuing disqualified capital stock; |
• | creating or incurring liens; |
• | engaging in business other than our current business and reasonably related extensions thereof; |
• | making loans and investments; |
• | paying certain dividends, distributions, redeeming subordinated indebtedness or making other restricted payments; |
• | incurring dividend or other payment restrictions affecting certain subsidiaries; |
• | transferring or selling assets; |
• | entering into transactions with affiliates; and |
• | consummating a merger, consolidation or sale of all or substantially all of our assets. |
Availability under our revolving credit facility is subject to a borrowing base, which is based on eligible accounts receivable and the lesser of the net book value or the net orderly liquidation value of certain fixed assets, or the Fixed Asset Valuation. To the extent that our eligible accounts receivable and/or the Fixed Asset Valuation decline, our borrowing base will decrease and the availability under that facility may decrease below its stated amount. In addition, if at any time the amount of outstanding borrowings and letters of credit under that facility exceeds the borrowing base, such excess amount will be immediately due and payable.
The restrictions contained in the Senior Indenture could also limit our ability to plan for or react to market conditions, meet capital needs, or otherwise restrict our activities or business plans and adversely affect our ability to fund our operations, enter into acquisitions, or to engage in other business activities that would be in our interest. On the effective date of the Plan, the 9% Senior Notes will be canceled and the Loan Agreement will be terminated.
We are subject to the risk of technological obsolescence.
We anticipate that our ability to maintain our current business and win new business will depend upon continuous improvements in operating equipment, among other things. There can be no assurance that we will be successful in our efforts in this regard or that we will have the resources available to continue to support this need to have our equipment remain technologically up to date and competitive. Our failure to do so could have a material adverse effect on us. No assurances can be given that competitors will not achieve technological advantages over us.
We are highly dependent on certain of our officers and key employees.
Our success is dependent upon our key management, technical and field personnel, especially John E. Crisp, our President and Chief Executive Officer, and Charles C. Forbes, our Executive Vice President and Chief Operating Officer. Any loss of the services of either one of these officers, or managers with strong relationships with customers or suppliers, or a
18
sufficient number of other employees could have a material adverse effect on our business and operations. Our ability to expand our services is dependent upon our ability to attract and retain additional qualified employees.
We expect that we will continue to incur significant costs as a result of being obligated to comply with Securities Exchange Act reporting requirements, the Sarbanes-Oxley Act, and the Senior Indenture and the Loan Agreement covenants and that our management will be required to devote substantial time to compliance matters.
Under the Senior Indenture and the Loan Agreement, we are required to comply with several covenants, including requirements to deliver certain opinions and certificates, and file reports under the Securities Exchange Act of 1934, as amended, or the Exchange Act, with the Securities and Exchange Commission, or the SEC. Additionally, we have reporting requirements under the Exchange Act. Furthermore, the Sarbanes-Oxley Act of 2002, and rules subsequently implemented by the SEC, have imposed various requirements on public companies, including the establishment and maintenance of effective disclosure controls and procedures, internal controls, and corporate governance practices. Accordingly, we expect to continue to incur significant legal, accounting and other expenses. The Sarbanes-Oxley Act of 2002 requires, among other things, that we assess internal controls for financial reporting and disclosure. We have performed and will perform system and process evaluation and testing of our internal control over financial reporting to allow management to report on the effectiveness of our internal controls over financial reporting, as required by Section 404 of the Sarbanes-Oxley Act of 2002. In certain prior years our testing revealed, and our future testing may reveal, deficiencies in our internal control over financial reporting that are deemed to be material weaknesses. We expect to continue to incur significant expense and devote substantial management effort toward ensuring compliance, in particular with Section 404. Moreover, if we are not able to comply with the requirements of Section 404 in a timely manner, if we identify, or our independent registered public accounting firm identifies, possible future deficiencies in our internal controls or if we fail to adequately address future deficiencies, we could be subject to sanctions or investigations by the SEC or other regulatory authorities, which would entail expenditure of additional financial and management resources. We anticipate that our management and other personnel will continue to devote a substantial amount of time and resources to comply with these requirements. On the effective date of the Plan, the 9% Senior Notes will be canceled and the Loan Agreement will be terminated; however, our SEC reporting obligations will continue following the effective date.
We engage in transactions with related parties and such transactions present possible conflicts of interest that could have an adverse effect on us.
We have entered into a significant number of transactions with related parties. The details of certain of these transactions are set forth in Note 11 to our consolidated financial statements included in this Annual Report on Form 10-K. Related party transactions create the possibility of conflicts of interest with regard to our management. Such a conflict could cause an individual in our management to seek to advance his or her economic interests above ours. Further, the appearance of conflicts of interest created by related party transactions could impair the confidence of our investors. Our board of directors has adopted a Related Persons Transaction Policy that requires the Audit Committee to approve or ratify related party transactions that involve consideration in excess of $120,000. Further, as required by the Senior Indenture, we seek the approval of the independent board members when such a related party transaction exceeds an aggregate consideration of $500,000 and an opinion regarding the fairness of such transaction from an outside firm when such a transaction exceeds an aggregate consideration of $2.5 million. Notwithstanding this, it is possible that a conflict of interest could have a material adverse effect on our business, financial condition, results of operations, and cash flows.
Activity in the oilfield services industry is seasonal and may affect our revenues during certain periods.
Our operations are impacted by seasonal factors. Historically, our business has been negatively impacted during the winter months due to inclement weather, fewer daylight hours, and holidays. Our well servicing rigs are mobile and we operate a significant number of oilfield vehicles. During periods of heavy snow, ice or rain, we may not be able to move our equipment between locations, thereby reducing our ability to generate rig or truck hours. In addition, the majority of our well servicing rigs work only during daylight hours. In the winter months as daylight time becomes shorter, the amount of time that the well servicing rigs work is shortened, which has a negative impact on total hours worked. Finally, we historically have experienced significant slowdown during the Thanksgiving and Christmas holiday seasons.
In addition, the oil and natural gas industry has traditionally been volatile and is influenced by a combination of long-term, short-term and cyclical trends, including the domestic and international supply and demand for oil and natural gas, current and expected future prices for oil and natural gas and the perceived stability and sustainability of those prices. Such cyclical trends also include the resultant levels of cash flows generated and allocated by exploration and production companies to their drilling, completion and workover budget. The volatility of the oil and natural gas industry and the precipitous decline in oil and natural gas prices have negatively impacted the level of exploration and production activity and capital expenditures by our customers. This has adversely affected, and in the future may adversely affect, the demand for our services, which has
19
had, and if it continues, will continue to have, a material adverse effect on our business, financial condition, results of operations, and cash flows.
We rely heavily on our suppliers and do not maintain written agreements with any suppliers.
Our ability to compete and grow will be dependent on our access to equipment, including well servicing rigs, parts, and components, among other things, at a reasonable cost and in a timely manner. We do not maintain written agreements with any of our suppliers (other than operating leases for certain equipment), and we are, therefore, dependent on the relationships we maintain with them. Failure of suppliers to deliver such equipment, parts and components at a reasonable cost and in a timely manner would be detrimental to our ability to maintain existing customers and obtain new customers. No assurance can be given that we will be successful in maintaining our required supply of such items.
We rely heavily on three suppliers for potassium chloride, a principal raw material that is critical for our operations. While the materials are generally available, if we were to have a problem sourcing these raw materials or transporting these materials from one of these two vendors, our ability to provide some of our services could be limited. Multiple alternate suppliers exist for all other raw materials. The source and supply of materials has been consistent in the past, however, in periods of high industry activity, periodic shortages of certain materials have been experienced and costs have been affected. If current or future suppliers are unable to provide the necessary raw materials, or otherwise fail to deliver products in the quantities required, any resulting delays in the provision of services to our customers could have a material adverse effect on our business, results of operations, financial condition, and cash flows.
We do not maintain current written agreements with respect to some of our salt water disposal wells.
Our ability to continue to provide well maintenance services depends on our continued access to salt water disposal wells. Many of our currently active salt water disposal wells are not subject to written operating agreements or are located on the premises of third parties with whom we do not have a current written lease. We do not maintain current written surface leases or right of way agreements with these third parties and we are, therefore, dependent on the relationships we maintain with them. Failure to maintain relationships with these third parties could impair our ability to access and maintain the applicable salt water disposal wells and any well servicing equipment located on their property. If that occurred, we would increase the levels of fluid injection at our remaining salt water disposal wells and would need to use additional third party disposal wells at substantial additional cost. Additionally, our permits to inject fluid into the salt water disposal wells are subject to maximum pressure limitations and if multiple salt water disposal wells became unavailable, this might adversely impact our operations.
Due to the nature of our business, we may be subject to environmental liability.
Our business operations and ownership of real property are subject to numerous federal, state and local environmental and health and safety laws and regulations, including those relating to emissions to air, discharges to water, treatment, storage and disposal of regulated materials, and remediation of soil and groundwater contamination. The nature of our business, including operations at our current and former facilities by prior owners, lessors or operators, exposes us to risks of liability under these laws and regulations due to the production, generation, storage, use, transportation, and disposal of materials that can cause contamination or personal injury if released into the environment or if certain types of exposures occur. Environmental laws and regulations may have a significant effect on the costs of transportation and storage of raw materials as well as the costs of the transportation, treatment, storage, and disposal of wastes. We believe we are in material compliance with applicable environmental and worker health and safety requirements. However, we may incur substantial costs, including fines, penalties, damages, criminal or civil sanctions, remediation costs, or experience interruptions in our operations for violations or liabilities arising under these laws and regulations. Although we may have the benefit of insurance maintained by our customers or by other third parties or by us such insurances may not cover every expense. Further, we may become liable for damages against which we cannot adequately insure, or against which we may elect not to insure, because of high costs or other reasons.
Our customers are subject to similar environmental laws and regulations, as well as limits on emissions to the air and discharges into surface and sub-surface waters. Although regulatory developments that may occur in subsequent years could have the effect of reducing industry activity, we cannot predict the nature of any new restrictions or regulations that may be imposed. We may be required to increase operating expenses or capital expenditures in order to comply with any new restrictions or regulations.
20
Climate change legislation or regulations restricting emissions of “greenhouse gases” could result in increased operating costs and reduced demand for our services.
Continued political attention to issues concerning climate change, the role of human activity in it, and potential mitigation through regulation could have a material impact on our operations and financial results. International agreements and national or regional legislation and regulatory measures to limit greenhouse emissions are currently in various stages of discussion or implementation. These and other greenhouse gas emissions-related laws, policies, and regulations may result in substantial capital, compliance, operating and maintenance costs. Material price increases or incentives to conserve or use alternative energy sources could reduce demand for services that we currently provide and adversely affect our operations and financial results. The ultimate financial impact associated with compliance with these laws and regulations is uncertain and is expected to vary depending on the laws enacted in each jurisdiction, our activities in those jurisdictions and market conditions.
Significant physical effects of climatic change, if they should occur, have the potential to damage oil and natural gas facilities, disrupt production activities and could cause us or our customers to incur significant costs in preparing for or responding to those effects.
In an interpretative guidance on climate change disclosures, the SEC indicates that climate change could have an effect on the severity of weather (including hurricanes and floods), sea levels, the arability of farmland, and water availability and quality. If any such effects were to occur, they could have an adverse effect on our assets and operations or the assets and operations of our customers. We may not be able to recover through insurance some or any of the damages, losses, or costs that may result should the potential physical effects of climate change occur. Unrecovered damages and losses incurred by our customers could result in decreased demand for our services.
Increasing trucking regulations may increase our costs and negatively affect our results of operations.
In connection with the services we provide, we operate as a motor carrier and, therefore, are subject to regulation by the U.S. Department of Transportation, or U.S. DOT, and by various state agencies. These regulatory authorities exercise broad powers governing activities such as the authorization to engage in motor carrier operations and regulatory safety. There are additional regulations specifically relating to the trucking industry, including testing and specification of equipment and product handling requirements. The trucking industry is subject to possible regulatory and legislative changes that may affect the economics of the industry by requiring changes in operating practices or by changing the demand for common or contract carrier services or the cost of providing truckload services. Some of these possible changes include increasingly stringent environmental regulations and changes in the regulations that govern the amount of time a driver may drive in any specific period, onboard black box recorder devices, or limits on vehicle weight and size.
Interstate motor carrier operations are subject to safety requirements prescribed by the U.S. DOT. To a large degree, intrastate motor carrier operations are subject to state safety regulations that mirror federal regulations. Such matters as weight and dimension of equipment are also subject to federal and state regulations.
From time to time, various legislative proposals are introduced, including proposals to increase federal, state, or local taxes, including taxes on motor fuels, which may increase our costs or adversely affect the recruitment of drivers. Management cannot predict whether, or in what form, any increase in such taxes applicable to us will be enacted. We may be required to increase operating expenses or capital expenditures in order to comply with any new restrictions or regulations.
We are subject to extensive additional governmental regulation.
In addition to environmental and trucking regulations, our operations are subject to a variety of other federal, state, and local laws, regulations and guidelines, including laws and regulations relating to health and safety, the conduct of operations, and the manufacture, management, transportation, storage and disposal of certain materials used in our operations. Also, we may become subject to such regulation in any new jurisdiction in which we may operate. We believe that we are in material compliance with such laws, regulations and guidelines.
We have invested financial and managerial resources to comply with applicable laws, regulations and guidelines and expect to continue to do so in the future. Although regulatory expenditures have not historically been material to us, such laws, regulations and guidelines are subject to change. Accordingly, it is impossible for us to predict the cost or effect of such laws, regulations, or guidelines on our future operations.
Our ability to use net operating loss carryforwards may be subject to limitations under Section 382 of the Internal Revenue Code.
As of January 1, 2017, we had U.S. federal tax net operating loss carryforwards of approximately $149.2 million. Generally, net operating loss, or NOL, carryforwards, may be used to offset future taxable income and thereby reduce or
21
eliminate U.S. federal income taxes. If we were to experience a change in ownership within the meaning of Section 382 of the Internal Revenue Code of 1986, as amended, or the Code, however, our ability to utilize our NOLs might be significantly limited or possibly eliminated. A change of ownership under Section 382 is defined as a cumulative change of more than 50% in the ownership positions of certain shareholders over a three-year period.
Based on our review of the issue, we do not believe that we have experienced an ownership change under Section 382 of the Code. However, the issuance of additional equity in the future may result in an ownership change pursuant to Section 382 of the Code. In addition, an ownership change under Section 382 could be caused by circumstances beyond our control, such as market purchases of our stock or the purchase or sale by significant shareholders. Thus, there can be no assurance that we will not experience an ownership change that would limit our application of our NOL carryforwards in calculating future federal tax liabilities. Furthermore, in 2017, the Company filed for bankruptcy protection under Chapter 11 of the bankruptcy code. We anticipate that the majority of our NOLs will be absorbed by cancellation of indebtedness income pursuant to Internal Revenue Code Section 108. Any NOL remaining following the implementation of the Plan will likely be subject to annual limitation under Section 382.
Our operations are inherently risky, and insurance may not always be available at commercially justifiable rates or in amounts sufficient to fully protect us.
We have an insurance and risk management program in place to protect our assets, operations, and employees. We also have programs in place to address compliance with current safety and regulatory standards. However, our operations are subject to risks inherent in the oilfield services industry, such as equipment defects, malfunctions, failures, accidents, and natural disasters. In addition, hazards such as unusual or unexpected geological formations, pressures, blow-outs, fires, or other conditions may be encountered in drilling and servicing wells, as well as the transportation of fluids and company assets between locations. These risks and hazards could expose us to substantial liability for personal injury, loss of life, business interruption, property damage or destruction, pollution, and other environmental damages.
Although we have obtained insurance against certain of these risks, such insurance is subject to coverage limits and exclusions and may not be available for the risks and hazards to which we are exposed. In addition, no assurance can be given that such insurance will be adequate to cover our liabilities or will be generally available in the future or, if available, that premiums will be commercially justifiable or that such coverage may not require us to accept additional deductibles. If we were to incur substantial liability and such damages were not covered by insurance or were in excess of policy limits, or if we were to incur such liability at a time when we are not able to obtain liability insurance, our business, results of operations, and financial condition could be materially adversely affected.
We cannot predict how an exit by any of our principal founding equity investors could affect our operations or business.
As of December 31, 2016, John E. Crisp and Charles C. Forbes, our principal founding equity holders, beneficially owned 6.1% and 12.3%, respectively, of our common stock. Our principal founding equity investors may transfer their interests in us or engage in other business combination transactions with a third party that could result in a change in ownership or a change of control. Any transfer of an equity interest in us or a change of control could affect our governance. We cannot be certain that such equity investors will not sell, transfer, or otherwise modify their ownership interest in us, whether in transactions involving third parties or other investors, nor can we predict how a change of equity investors or change of control would affect our operations or business. On the effective date of the Plan, all existing Equity Interests (as defined in the Plan and which include our common stock, our preferred stock, awards under the Compensation Plan and the preferred stock purchase rights under the Rights Agreement) in FES Ltd. will be extinguished without recovery.
Our principal founding equity investors, acting in their capacities as members of the board of directors and officers, control important decisions affecting our governance and our operations, and their interests may differ from those of our other shareholders.
Circumstances may arise in which the interest of our principal founding equity investors could be in conflict with those of the other shareholders. In particular, our principal founding equity investors may have an interest in pursuing certain strategies or transactions that, in their judgment, enhance the value of their investment in us even though these strategies or transactions may involve risks to other shareholders.
Although Texas corporate law provides certain procedural protections and requires that certain business combinations between us and certain interested or affiliated shareholders meet certain approval requirements, this does not address all conflicts of interest that may arise. For example, our principal founding equity investors and their affiliates are not prohibited from competing with us. Because our principal founding equity investors control us, conflicts of interest arising due to competition between us and a principal founding equity investor could be resolved in a manner adverse to us. It is possible
22
that there will be situations where our principal founding equity investors’ interests are in conflict with our interests, and our principal founding equity investors acting through the board of directors or through our executive officers could resolve these conflicts in a manner adverse to us.
As discussed in Part I-Item 1. Business-Reorganization and Chapter 11 Proceedings, on the effective date of the Plan, all existing Equity Interests (as defined in the Plan and which include our common stock, our preferred stock, awards under the Compensation Plan and the preferred stock purchase rights under the Rights Agreement) in FES Ltd. will be extinguished without recovery. Additionally, the board of directors will be made up of five directors of which one will continue to be our President and Chief Executive Officer and four will be selected by the Supporting Noteholders. Accordingly, four of our five board members will be new to the Company.
We have anti-takeover provisions in our organizational and other documents that may discourage a change of control.
Our organizational documents contain provisions that could make it more difficult for a third party to acquire us without the consent of our board of directors. These provisions provide for the following:
• | restrictions on the time period in which directors may be nominated; |
• | the ability of our board of directors to determine the powers, preferences and rights of the preferred stock and to authorize the issuance of shares of preferred or common stock without shareholder approval; and |
• | requirements that a majority of the members of our board of directors approve certain corporate transactions. |
We also have a shareholder rights plan which can make it difficult for anyone to accumulate more than a certain percentage of our outstanding equity without approval of our board of directors. These provisions could make it more difficult for a third party to acquire, or discourage a third party from attempting to acquire, control of us, even if the third party’s offer was considered beneficial by many shareholders. As a result, these provisions could limit the price that investors might be willing to pay in the future for shares of our common stock and may have the effect of delaying or preventing a takeover of the Company that would otherwise be beneficial to investors. On the effective date of the Plan, all existing Equity Interests (as defined in the Plan and which include our common stock, our preferred stock, awards under the Compensation Plan and the preferred stock purchase rights under the Rights Agreement) in FES Ltd. will be extinguished without recovery; however, similar provisions may be included in our organizational documents for reorganized FES Ltd.
Future legal proceedings could adversely affect us and our operations.
Given the nature of our business, we are involved in litigation from time to time in the ordinary course of business. While we are not presently a party to any material legal proceedings, legal proceedings could be filed against us in the future. No assurance can be given as to the final outcome of any legal proceedings or that the ultimate resolution of any legal proceedings will not have a material adverse effect on us.
We may not be able to fully integrate future acquisitions.
We may undertake future acquisitions of businesses and assets in the ordinary course of business. Achieving the benefits of acquisitions depends in part on having the acquired assets perform as expected, successfully consolidating functions, retaining key employees and customer relationships, and integrating operations and procedures in a timely and efficient manner. Such integration may require substantial management effort, time, and resources and may divert management’s focus from other strategic opportunities and operational matters, and ultimately we may fail to realize anticipated benefits of acquisitions.
Federal and state legislative and regulatory initiatives relating to hydraulic fracturing could result in increased cost and additional operating restrictions or delays.
Hydraulic fracturing is an important and common practice that is used to stimulate production of hydrocarbons, particularly natural gas, from tight formations. Hydraulic fracturing involves the injection of water, sand, and chemicals under pressure into the formation to fracture the surrounding rock and stimulate production. Various governmental entities (within and outside the United States) are in the process of studying, restricting, regulating, or preparing to regulate hydraulic fracturing, directly and indirectly. Hydraulic fracturing operations are regulated through the underground injection control programs under the Safe Drinking Water Act and other environmental statutes. The EPA has adopted air emissions standards that apply to well completion activities. In June 2016, the EPA developed new standards for wastewater discharges associated with hydraulic fracturing and, in December 2016, completed a study on the impacts of hydraulic fracturing on groundwater. In 2015, the Bureau of Land Management also enacted regulations for hydraulic fracturing activities that would be unique to federal lands. These rules were, however, struck down by a federal court in June 2016 that determined that BLM did not have
23
authority over fracking operations pursuant to the Energy Policy Act of 2005. Since then, legislation has been proposed that would provide for federal regulation of hydraulic fracturing and require disclosure of the chemicals used in the fracturing process. The legislation remains in committee and has not passed either house. In addition, many state governments now require the disclosure of chemicals used in the fracturing process and some jurisdictions have imposed an express or de facto ban on hydraulic fracturing. A law enacted by the Texas legislature and a rule enacted by The Railroad Commission of Texas in 2011 require disclosure regarding the composition of hydraulic fracturing products to certain parties, including The Railroad Commission of Texas. Furthermore, local groundwater districts may regulate the amount of groundwater that can be withdrawn and used for hydraulic fracturing operations. This could be a material issue due to the water-intensive nature of these operations. If new laws or regulations that significantly restrict hydraulic fracturing are adopted, such laws could make it more difficult or costly for producers to perform fracturing to stimulate production from tight formations. In addition, if hydraulic fracturing is regulated at the federal level, fracturing activities could become subject to additional permitting requirements, and also to attendant permitting delays and potential increases in costs. Increased consumer activism against hydraulic fracturing or the prohibition or restriction of hydraulic fracturing on the part of our customers could potentially result in materially reduced demand for the Company’s services and could have a material adverse effect on our business, results of operations or financial condition.
The dividend, liquidation, and redemption rights of the holders of our Series B Senior Convertible Preferred Stock may adversely affect our financial position and the rights of the holders of our common stock.
The Series B Senior Convertible Preferred Stock, or the Series B Preferred Stock, is entitled to receive preferential dividends equal to five percent (5.0%) per annum of the original issue price per share, payable quarterly in February, May, August and November of each year. Such dividends may be paid by the Company in cash or in kind (in the form of additional shares of Series B Preferred Stock). As shares of the Series B Preferred Stock are convertible into shares of our common stock, any dividend paid in kind would have a dilutive effect on our shares of common stock. Dividends were paid as required through February 28, 2016. The Company did not make the dividend payments due on May 28, 2016, August 28, 2016, November 28, 2016 and February 28, 2017.
Further, we are required, at the seventh anniversary of the issuance of the Series B Preferred Stock on May 28, 2017, to redeem any such outstanding shares at their original issue price, plus any accumulated and unpaid dividends, to be paid, at our election, in cash or shares of common stock (the "Series B Purchase Price"). The payment of the redemption price in cash would result in reduced capital resources available to the Company. The payment of the redemption price in shares of common stock would directly dilute the common shareholders. The payment of dividends in-kind would also have a dilutive effect on the common shareholders (as any Series B Preferred Stock issued as dividends would themselves be convertible into common shares). In the event that the Company is liquidated while shares of Series B Preferred Stock is outstanding, holders of the Series B Preferred Stock will be entitled to receive a preferred liquidation distribution, plus any accumulated and unpaid dividends, before holders of common stock receive any distributions. On the effective date of the Plan, the Series B Preferred Stock will be extinguished without recovery.
Holders of the Series B Preferred Stock have certain voting and other rights that may adversely affect holders of our common stock, and the holders of our Series B Preferred Stock may have different interests from, and vote their shares in a manner deemed adverse to, holders of our common stock.
In the event that we fail to pay dividends, in cash or in-kind, on the Series B Preferred Stock for an aggregate of at least eight quarterly dividend periods (whether or not consecutive), the holders of the Series B Preferred Stock will be entitled to vote at any meeting of the shareholders with the holders of the common shares and to cast the number of votes equal to the number of shares of whole common stock into which the Series B Preferred Stock held by such holders are then convertible. If the holders of the current Series B Preferred Stock were able to vote pursuant to this provision at this time or converted the Series B Preferred Stock into common stock, we believe that, as of March 29, 2017, those holders would be entitled to an aggregate of 5,292,531 votes resulting from their ownership of Series B Preferred Stock, based on shareholding information provided to us by the current holder of the Series B Preferred Stock. Further, the holders of Series B Preferred Stock may have certain voting rights with respect to the approval of amendments to the certificate of formation of the Company or certain transactions between the Company and affiliate shareholders.
The holders of Series B Preferred Stock may have different interests from the holders of our common stock and could vote their shares in a manner deemed adverse to the holders of common stock. On the effective date of the Plan, the Series B Preferred Stock will be extinguished without recovery.
24
Our common stock is no longer listed on the NASDAQ Capital Market and is quoted only in the Pink Sheets, which could negatively affect our stock price and liquidity.
On August 16, 2011, the common stock of FES Ltd. was listed and began trading on the NASDAQ Global Market. We transferred our common stock listing from the NASDAQ Global Market to the NASDAQ Capital Market on March 31, 2016. As a result of our failure to satisfy the continued listing requirements of the NASDAQ Capital Market, on November 21, 2016, our common stock was suspended from trading on the NASDAQ Capital Market. Since November 21, 2016, our common stock has been quoted on the Pink Sheets under the symbol “FESLQ.” On February 4, 2017, our common stock was delisted from the NASDAQ Capital Market but continues to be quoted on the Pink Sheets. The over-the-counter market is a significantly more limited market than the NASDAQ Capital Market, and the quotation of our common stock in the Pink Sheets may result in a less liquid market available for existing and potential shareholders to trade shares of our common stock. This could further depress the trading price of our common stock and could also have a long-term adverse effect on our ability to raise capital. On the effective date of the Plan, all existing Equity Interests (as defined in the Plan and which include our common stock, our preferred stock, awards under the Compensation Plan and the preferred stock purchase rights under the Rights Agreement) in FES Ltd. will be extinguished without recovery. The risk related to less liquid markets will, however, be applicable to the new common stock issued in the Reorganization.
25
Item 1B. | Unresolved Staff Comments |
None.
Item 2. | Properties |
The following sets forth the principal locations from which the Company currently conducts its operations. The Company leases or rents all of the properties set forth below, except for the Alice rig yard, the San Ygnacio truck yard, and the Madisonville truck yard which are owned by the Company.
Locations | Date in Service | Service Offering | ||
South Texas | ||||
Alice - truck location | 9/1/2003 | Fluid Logistics | ||
Alice - rig location | 9/1/2003 | Well Servicing | ||
Freer | 9/1/2003 | Fluid Logistics | ||
San Ygnacio | 4/1/2004 | Fluid Logistics | ||
Goliad | 8/1/2005 | Fluid Logistics | ||
Bay City | 9/1/2005 | Fluid Logistics | ||
Edna | 2/1/2006 | Well Servicing | ||
Three Rivers | 8/1/2006 | Fluid Logistics | ||
Carrizo Springs | 12/1/2006 | Fluid Logistics | ||
Victoria | 2/15/2011 | Well Servicing | ||
Giddings | 1/1/2013 | Well Servicing | ||
Pleasanton | 3/6/2013 | Well Servicing | ||
Agua Dulce | 8/1/2014 | Well Servicing | ||
West Texas | ||||
Ozona | 3/1/2006 | Fluid Logistics | ||
San Angelo | 7/1/2006 | Well Servicing | ||
Monahans | 8/31/2007 | Well Servicing/Fluid Logistics | ||
Odessa | 9/30/2007 | Well Servicing | ||
Big Lake | 7/16/2008 | Fluid Logistics | ||
Midland | 11/1/2012 | Fluid Logistics | ||
East Texas | ||||
Marshall | 12/1/2005 | Fluid Logistics | ||
Carthage | 3/1/2007 | Well Servicing | ||
Madisonville | 8/1/2013 | Fluid Logistics | ||
Pennsylvania | ||||
Indiana | 7/9/2009 | Well Servicing | ||
Item 3. | Legal Proceedings |
From time to time, we are involved in legal proceedings and regulatory proceedings arising out of our operations. We establish reserves for specific liabilities in connection with legal actions that we deem to be probable and estimable. We are not currently a party to any proceeding, the adverse outcome of which would have a material adverse effect on our financial position or results of operations.
Chapter 11 Proceedings
On January 22, 2017, the Debtors filed the Petitions in the Bankruptcy Court seeking relief under the provisions of chapter 11 of the Bankruptcy Code. The commencement of the chapter 11 cases automatically stayed certain actions against the Debtors, including actions to collect prepetition liabilities or to exercise control over the property of the Debtors. The Plan in our chapter 11 cases provides for the treatment of prepetition liabilities that have not otherwise been satisfied or addressed during the chapter 11 cases. On March 29, 2017, the Bankruptcy Court entered an order confirming the Plan. We expect the consummation of the Plan to become effective on or about April 13, 2017.
26
Item 4. | Mine Safety Disclosures |
Not applicable.
27
PART II
Item 5. | Market for Registrant’s Common Equity, Related Stockholder Matters and Issuer Purchases of Equity Securities |
Price Range of Common Shares
From August 12, 2011 to March 30, 2016, our common stock was listed and traded on the NASDAQ Global Market under the symbol “FES.” From March 31, 2016 to November 20, 2016, our common stock was listed and traded on the NASDAQ Capital Market under the symbol “FES.” Since November 21, 2016, as a result of our failure to satisfy the continued listing requirements of the NASDAQ Capital Market, our common stock has been quoted on the Pink Sheets under the symbol “FESLQ.” On February 4, 2017, our common stock was delisted from the NASDAQ Capital Market but continues to be quoted on the Pink Sheets.
The following table sets forth, for the periods indicated, the high and low sales prices per share of our common stock, as reported on the NASDAQ Global Market, the NASDAQ Capital Market and the Pink Sheets.
High | Low | |||||||
Pink Sheets | ||||||||
Fiscal Year 2016: | ||||||||
November 22, 2016 - December 30, 2016 | $ | 0.08 | $ | 0.03 | ||||
NASDAQ Capital Market | ||||||||
Fiscal Year 2016: | ||||||||
October 1, 2016 - November 21, 2016 | $ | 0.14 | $ | 0.09 | ||||
Third Quarter | 0.23 | 0.13 | ||||||
Second Quarter | 0.48 | 0.17 | ||||||
NASDAQ Global Market | ||||||||
Fiscal Year 2016: | ||||||||
First Quarter | $ | 0.60 | $ | 0.20 | ||||
Fiscal Year 2015: | ||||||||
Fourth Quarter | $ | 0.80 | $ | 0.23 | ||||
Third Quarter | 1.38 | 0.53 | ||||||
Second Quarter | 1.64 | 1.04 | ||||||
First Quarter | 1.32 | 0.89 | ||||||
As of March 28, 2017, the last reported sales price of our common shares on the Pink Sheets was $0.02 per share. As of March 28, 2017, we had 22,214,855 shares of common stock issued and outstanding, held by 15 shareholders of record. All common stock held in street name are recorded in the Company’s stock register as being held by one stockholder.
The Company has never declared a cash dividend on its common stock and has no plans of doing so now or in the foreseeable future. The loan agreement governing the credit facility prohibits the payment of dividends on the Company’s common stock. It does, however, permit dividend payments on the Company’s Series B Preferred Stock. Further, the Senior Indenture restricts the Company’s ability to pay dividends on our equity interests, except dividends payable in equity interests and cash dividends on the Series B Preferred Stock up to $260,000 per quarter, unless, among other things, the Company is able to incur at least $1.00 of additional Indebtedness (as defined in the Senior Indenture) pursuant to the Fixed Charge Coverage Ratio set forth in such indenture.
The Series B Preferred Stock accrues dividends at a rate of $1.25 per share per year, which, at our discretion, is payable in cash or in-kind. The Company anticipates not paying the preferred dividends in cash for the foreseeable future. Our board of directors presently intends to retain all earnings for use in our business and, therefore, does not anticipate paying any other cash dividends in the foreseeable future. The declaration of dividends on common equity, if any, in the future would be subject to the discretion of the board of directors, which may consider factors such as our credit facility and indenture restrictions discussed
28
above, the Company’s results of operations, financial condition, capital needs, liquidity, and acquisition strategy, among others. Additionally, the certificate of designation that governs the Series B Preferred Stock prohibits the Company from paying a dividend on the common shares if dividends on the Series B Preferred Stock are not paid through the respective quarterly payment date. Further, if the aggregate cash payment of dividends on the common stock over a twelve month period were to exceed five percent of the fair market value of the common shares, then we would be required under the certificate of designation of the Series B Preferred Stock, to pay the holders of such shares the amount that they would be entitled to receive had such holders converted their shares to common shares prior to the record date of such dividends.
As discussed in Part I-Item 1. Business-Reorganization and Chapter 11 Proceedings, all existing Equity Interests (as defined in the Plan and which include our common stock, our preferred stock, awards under the Compensation Plan and the preferred stock purchase rights under the Rights Agreement) in FES Ltd. will be extinguished without recovery on the effective date of the Plan.
29
Item 6. | Selected Financial Data |
The following statement of operations data for the years ended December 31, 2016, 2015 and 2014 and the balance sheet data as of December 31, 2016 and 2015, have been derived from our audited consolidated financial statements included elsewhere in this Annual Report on Form 10-K. The statement of operations data for the years ended December 31, 2013 and 2012 and the balance sheet data as of December 31, 2014, 2013 and 2012, have been derived from our audited consolidated financial statements not included in this Annual Report on Form 10-K. Our historical results are not necessarily indicative of results to be expected for any future period. The data presented below have been derived from financial statements that have been prepared in accordance with accounting principles generally accepted in the United States and should be read with our financial statements, including notes, and with Item 7 “Management’s Discussion and Analysis of Financial Condition and Results of Operations” on page 32 of this Annual Report on Form 10-K.
Year Ended December 31, | |||||||||||||||||||
2016 | 2015 | 2014 | 2013 | 2012 | |||||||||||||||
(dollars in thousands) | |||||||||||||||||||
Statement of Operations Data: | |||||||||||||||||||
Revenues | |||||||||||||||||||
Well servicing | $ | 70,921 | $ | 150,949 | $ | 285,338 | $ | 231,930 | $ | 202,670 | |||||||||
Fluid logistics | 45,284 | 93,158 | 163,940 | 188,003 | 269,927 | ||||||||||||||
Total revenues | 116,205 | 244,107 | 449,278 | 419,933 | 472,597 | ||||||||||||||
Expenses | |||||||||||||||||||
Well servicing | 61,279 | 117,514 | 213,278 | 182,180 | 158,302 | ||||||||||||||
Fluid logistics | 42,744 | 74,905 | 127,775 | 141,957 | 196,383 | ||||||||||||||
General and administrative | 18,832 | 31,591 | 36,428 | 30,186 | 33,382 | ||||||||||||||
Depreciation and amortization | 52,374 | 55,034 | 54,959 | 54,838 | 50,997 | ||||||||||||||
Loss on impairment of assets | 14,537 | — | — | — | — | ||||||||||||||
Restructuring costs | 7,548 | — | — | — | — | ||||||||||||||
Total expenses | 197,314 | 279,044 | 432,440 | 409,161 | 439,064 | ||||||||||||||
Operating (loss) income | (81,109 | ) | (34,937 | ) | 16,838 | 10,772 | 33,533 | ||||||||||||
Other income (expense) | |||||||||||||||||||
Interest income | 31 | 211 | 9 | 27 | 78 | ||||||||||||||
Interest expense | (27,879 | ) | (27,962 | ) | (28,228 | ) | (28,211 | ) | (28,033 | ) | |||||||||
Pre-tax income (loss) | (108,957 | ) | (62,688 | ) | (11,381 | ) | (17,412 | ) | 5,578 | ||||||||||
Income tax expense (benefit) | 172 | (16,614 | ) | (3,060 | ) | (4,615 | ) | 3,359 | |||||||||||
Income (loss) from continuing operations | (109,129 | ) | (46,074 | ) | (8,321 | ) | (12,797 | ) | 2,219 | ||||||||||
Loss from discontinued operations | — | — | — | (293 | ) | (633 | ) | ||||||||||||
Net income (loss) | (109,129 | ) | (46,074 | ) | (8,321 | ) | (13,090 | ) | 1,586 | ||||||||||
Preferred stock dividends | (776 | ) | (776 | ) | (776 | ) | (776 | ) | (776 | ) | |||||||||
Net income (loss) attributable to common shareholders | $ | (109,905 | ) | $ | (46,850 | ) | $ | (9,097 | ) | $ | (13,866 | ) | $ | 810 | |||||
Income (loss) per share of common stock from continuing operations | |||||||||||||||||||
Basic and diluted | $ | (4.95 | ) | $ | (2.12 | ) | $ | (0.42 | ) | $ | (0.64 | ) | $ | 0.07 | |||||
Loss per share of common stock from discontinued operations | |||||||||||||||||||
Basic and diluted | — | — | — | (0.01 | ) | (0.03 | ) | ||||||||||||
Income (loss) per share of common stock | |||||||||||||||||||
Basic and diluted | $ | (4.95 | ) | $ | (2.12 | ) | $ | (0.42 | ) | $ | (0.65 | ) | $ | 0.04 | |||||
Weighted average number of shares outstanding | |||||||||||||||||||
Basic | 22,214 | 22,071 | 21,749 | 21,388 | 21,062 | ||||||||||||||
Diluted | 22,214 | 22,071 | 21,749 | 21,388 | 21,340 | ||||||||||||||
30
Year Ended December 31, | ||||||||||||||
2016 | 2015 | 2014 | 2013 | 2012 | ||||||||||
Operating Data: | ||||||||||||||
Well servicing rigs (end of periods) | 173 | 173 | 169 | 167 | 162 | |||||||||
Rig hours | 166,833 | 281,960 | 503,694 | 449,277 | 435,560 | |||||||||
Heavy trucks (end of period) (1) | 537 | 599 | 587 | 591 | 578 | |||||||||
Trucking hours | 388,671 | 728,498 | 1,070,606 | 1,182,429 | 1,676,778 | |||||||||
Salt water disposal wells (end of period) | 20 | 22 | 23 | 24 | 24 | |||||||||
Locations (end of period) | 23 | 25 | 28 | 27 | 25 | |||||||||
Frac tanks and fluid mixing tanks (end of period) | 2,908 | 3,060 | 3,209 | 3,271 | 3,208 | |||||||||
Coiled tubing spreads | 6 | 6 | 6 | 5 | 4 | |||||||||
(1) | Includes vacuum trucks, high pressure pump trucks, and other heavy trucks. |
Year Ended December 31, | |||||||||||||||||||
2016 | 2015 | 2014 | 2013 | 2012 | |||||||||||||||
(dollars in thousands) | |||||||||||||||||||
Balance Sheet Data: | |||||||||||||||||||
Cash and cash equivalents | $ | 20,437 | $ | 74,611 | $ | 34,918 | $ | 26,409 | $ | 17,619 | |||||||||
Restricted cash, short-term | 27,563 | — | — | — | — | ||||||||||||||
Property and equipment, net | 233,362 | 277,029 | 322,663 | 341,869 | 348,442 | ||||||||||||||
Total assets | 312,881 | 409,154 | 479,405 | 495,414 | 506,603 | ||||||||||||||
Total current debt | 298,932 | 25,243 | 11,204 | 9,374 | 13,026 | ||||||||||||||
Total long-term debt | 240 | 279,798 | 282,479 | 285,122 | 287,223 | ||||||||||||||
Total liabilities | 340,109 | 327,131 | 350,914 | 359,836 | 359,917 | ||||||||||||||
Temporary equity-preferred stock | 15,298 | 14,644 | 14,602 | 14,560 | 14,518 | ||||||||||||||
Shareholders’ (deficit) equity | (42,526 | ) | 67,379 | 113,889 | 121,018 | 132,168 | |||||||||||||
31
Item 7. | Management’s Discussion and Analysis of Financial Condition and Results of Operations |
The following discussion and analysis of our financial condition and results of operations should be read in conjunction with the accompanying consolidated financial statements and related notes included elsewhere in this Annual Report on Form 10-K. This discussion and analysis contains forward-looking statements within the meaning of the federal securities laws, including statements using terminology such as “anticipate,” “believe,” “continue,” “could,” “estimate,” “expect,” “intend,” “may,” “plan,” “potential,” “predict,” “project” or “should” or other comparable words or the negative of these words. Forward-looking statements involve various risks and uncertainties. Any forward-looking statements made by or on our behalf are made pursuant to the safe harbor provisions of the Private Securities Litigation Reform Act of 1995. Readers are cautioned that such forward-looking statements involve risks and uncertainties in that the actual results may differ materially from those projected in the forward-looking statements. Important factors that could cause actual results to differ include risks set forth in “Part I-Item 1A. Risk Factors” included on page 12 herein.
The oil and natural gas industry has experienced a significant downturn in oil exploration and production activity that began in the fourth quarter of 2014 and continued through 2015 and into 2016. Our business is not immune to such downturn. In response to this significant downturn, many companies are taking steps to delever their balance sheets and complete capital restructurings in order to ensure they have the financial flexibility to continue to operate with sufficient liquidity in the longer term.
Recent Developments
The Debtors filed voluntary petitions, or the Petitions, for reorganization under chapter 11 of the United States Bankruptcy Code, or the Bankruptcy Code, in the Bankruptcy Court pursuant to the terms of a Restructuring Support Agreement that contemplates the reorganization of the Debtors pursuant to the Plan. The Debtors will continue to operate their businesses as "debtors in possession" under the jurisdiction of the Bankruptcy Court and in accordance with the applicable provisions of the Bankruptcy Code and orders of the Bankruptcy Court. The Bankruptcy Court granted all first day motions filed by the Debtors allowing the Debtors to operate their businesses in the ordinary course throughout the pendency of the chapter 11 cases. The first day motions included, among other things, a cash collateral motion, a motion maintaining the Company's existing cash management system and motions permitting certain vendor payments, wage payments and tax payments in the ordinary course of business. Subject to certain exceptions under the Bankruptcy Code, the chapter 11 cases automatically stayed most judicial or administrative actions against the Debtors or their property to recover, collect, or secure a prepetition claim. This prohibits, for example, our lenders or note holders from pursuing claims for defaults under our debt agreements during the pendency of the chapter 11 cases. On March 29, 2017, the Bankruptcy Court entered an order confirming the Plan. We expect the consummation of the Plan to become effective on or about April 13, 2017; however, there can be no assurance that the effectiveness of the Plan will occur on such date, or at all.
The matters described herein, to the extent that they relate to future events or expectations, may be significantly affected by the chapter 11 cases. The chapter 11 cases involve various restrictions on our activities, limitations on financing, the need to obtain Bankruptcy Court approval for various matters and uncertainty as to relationships with others with whom we may conduct or seek to conduct business. See Part I-Item 1. Business-Reorganization and Chapter 11 Proceedings for a further description of the chapter 11 cases, the impact of the chapter 11 cases, the proceedings in Bankruptcy Court and our status as a going concern.
Overview
FES Ltd. is an independent oilfield services contractor that provides well site services to oil and natural gas drilling and producing companies to help develop and enhance the production of oil and natural gas. These services include fluid hauling, fluid disposal, well maintenance, completion services, workovers and recompletions, plugging and abandonment, and tubing testing. Our operations are concentrated in the major onshore oil and natural gas producing regions of Texas, with an additional location in Pennsylvania. We believe that our broad range of services, which extends from initial drilling, through production, to eventual abandonment, is fundamental to establishing and maintaining the flow of oil and natural gas throughout the life cycle of our customers’ wells.
We currently provide a wide range of services to a diverse group of companies. During the year ended December 31, 2016, we provided services to over 480 companies. John E. Crisp and Charles C. Forbes, Jr., members of our senior management team, have cultivated deep and ongoing relationships with our customers during their average of over 40 years of experience in the oilfield services industry.
We currently conduct our operations through the following two business segments:
• | Well Servicing. Our well servicing segment comprised 61.0% of our total revenues for the year ended December 31, 2016. At December 31, 2016, our well servicing segment utilized our fleet of well servicing rigs, |
32
which was comprised of 159 workover rigs and 14 swabbing rigs, six coiled tubing spreads and other related assets and equipment. These assets are used to provide (i) well maintenance, including remedial repairs and removal and replacement of downhole production equipment, (ii) well workovers, including significant downhole repairs, re-completions and re-perforations, (iii) completion and swabbing activities, (iv) plugging and abandonment services, and (v) testing of oil and natural gas production tubing and scanning tubing for pitting and wall thickness using tubing testing units.
• | Fluid Logistics. Our fluid logistics segment comprised 39.0% of our total revenues for the year ended December 31, 2016. Our fluid logistics segment utilized our fleet of owned or leased fluid transport trucks and related assets, including specialized vacuum, high-pressure pump and tank trucks, frac tanks, water wells, salt water disposal wells and facilities, and related equipment. These assets are used to provide, transport, store, and dispose of a variety of drilling and produced fluids used in, and generated by, oil and natural gas production. These services are required in most workover and completion projects and are routinely used in the daily operation of producing wells. |
We believe that our two business segments are complementary and create synergies in terms of selling opportunities. Our multiple lines of service are designed to capitalize on our existing customer base to grow within existing markets, generate more business from existing customers, and increase our operating performance. By offering our customers the ability to reduce the number of vendors they use, we believe that we help improve our customers’ efficiency. This is demonstrated by the fact that 78.3% of our total revenues for the year ended December 31, 2016, were from customers that utilized services of both of our business segments. Further, by having multiple service offerings that span the life cycle of the well, we believe that we have a competitive advantage over smaller competitors offering more limited services.
Market Conditions
The oil and natural gas industry has experienced a significant decline in oil exploration and production activity that began in the fourth quarter of 2014 and continued through 2016 and into 2017. The price of West Texas Intermediate (“WTI”) oil fell from a price of $104 per barrel as of June 30, 2014 to a low of $30 per barrel in February of 2016. Oil prices stabilized in 2016; however, they still remain at depressed levels. As of December 31, 2016, the price of WTI was approximately $52 per barrel. In response to this precipitous drop in WTI oil prices, exploration and production companies decreased the number of U.S. drilling rigs from 1,873 operating as of June 30, 2014 to 658 operating as of December 31, 2016, a decrease of 64.9%. During this period the Texas drilling rig count dropped from an average of 891 in June 2014 to an average of 310 in December 2016, a decrease of 65.2%.
33
Below are three charts that provide total U.S. rig counts, total Texas rig counts and WTI oil price trends for the twelve months ended December 31, 2015 and 2016, respectively.
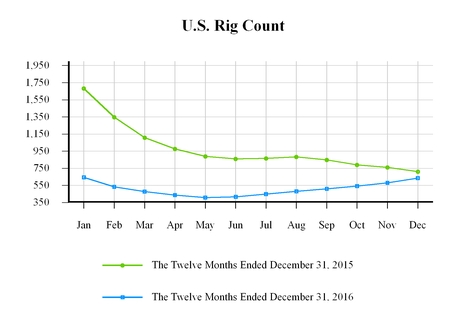
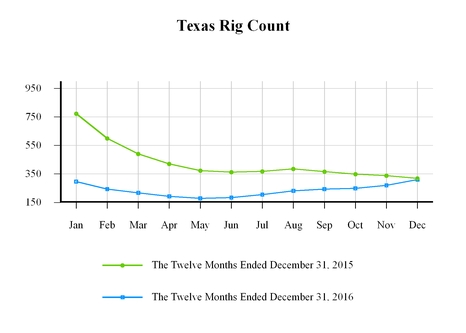
Source: Rig counts are per Baker Hughes, Inc. (www.bakerhughes.com). Rig counts are the averages of the weekly rig count activity.
34
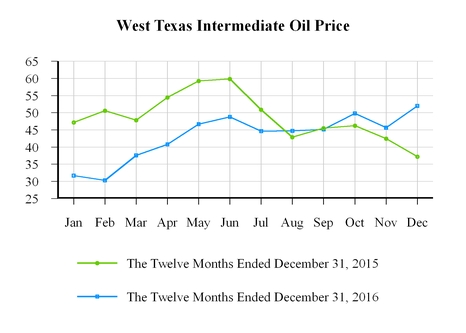
The declines in oil and natural gas prices and exploration activities that began in 2014 and has continued through 2015 and 2016 and into 2017 created a more challenging market for the provision of our services. In response to these market conditions, we implemented cost reduction measures and continue to analyze cost reduction opportunities while ensuring that appropriate functions and capacity are preserved to allow us to be opportunistic as market conditions improve. Cost reductions, which began in the fourth quarter of 2014 and continued throughout all of 2015 and 2016, included reductions in headcount, labor rates, bonuses, over-time, travel and entertainment, vendor pricing, and other cost controls that contribute to earnings. We have also consolidated locations where levels of activity dictated greater efficiencies with operations performed out of a single location. Capital spending has largely been limited to capital commitments incurred before the market downturn, purchases of certain, limited pieces of equipment with greater operating efficiencies to improve margins, and the purchase of certain equipment under operating leases at the end of their term.
In May 2016, Texas drilling rig count reached a low point. From that point until the end of 2016, drilling rig counts in Texas had increased by 157 rigs to a total of 340. Of this increase, 127, 13, and 17 were attributable to West Texas, East Texas, and South Texas, respectively. Our revenues for 2016 were 19.8%, 3.3%, and 76.9% in West Texas, East Texas, and South Texas, respectively.
The second key metric, other than volume of work, that impacts profitability is pricing. Although price increases were requested from customers in certain operating areas toward the end of 2016, pricing was relatively flat in the last half of 2016 and has remained flat into the first quarter of 2017.
Impact of the Current Environment
Activity was substantially the same in the last half of 2016 and in the first half of the first quarter of 2017. Although the Texas rig count increased by 157 rigs since the low point in May of 2016, as noted above, rig count in South Texas, where 76.9% of our work is performed, only increased by 17 drilling rigs.
Price competition continued into the first quarter of 2017 with competitors, both large and small, bidding prices that our management does not believe can be sustained in the long-term.
In this environment of lower activity and lower pricing, we continue to focus on meeting our customers' expectations and adjusting our cost structure where possible.
In the short-term, our business strategy is to continue to focus on minimizing our costs of providing these products and services to offset as much of the price reductions granted to our customers as possible. Through 2015 and 2016, we accomplished cost reductions through labor expense reductions and price reductions from our vendors. Our vendor cost reductions occurred primarily in 2015 and were accomplished with price decreases, as well as volume decreases, due to decreased demand. Our labor expense reductions were accomplished with reductions in headcount and wage rate decreases.
35
However, with the upturn in drilling rig count in the latter half of 2016, we began experiencing pressures to increase our labor rates.
Factors Affecting Results of Operations
Oil and Natural Gas Prices
Demand for well servicing and fluid logistics services is generally a function of the willingness of oil and natural gas companies to make operating and capital expenditures to explore for, develop, and produce oil and natural gas, which in turn is affected by current and anticipated levels of oil and natural gas prices. Exploration and production spending is generally categorized as either operating expenditures or capital expenditures. Activities by oil and natural gas companies designed to add oil and natural gas reserves are classified as capital expenditures, and those associated with maintaining or accelerating production, such as workover and fluid logistics services, are categorized as operating expenditures. Operating expenditures are typically more stable than capital expenditures and may be less sensitive to oil and natural gas price volatility. However, in the current environment, even operating expenditures have been curtailed. In contrast, capital expenditures for drilling are more directly influenced by current and expected oil and natural gas prices and generally reflect the volatility of commodity prices.
Currently, indications are that the balance between supply and demand globally is over-supplied and will take an extended period to re-balance in part due to substantial increases in U.S. production over the past five years.
Workover Rig Rates
Our well servicing segment revenues are dependent on the prevailing market rates for workover rigs. Since December 31, 2015 and through 2016, both utilization and rates continued to decline; dropping 22.1% and 20.0% respectively, due to the current market decline. Oil and natural gas prices have dropped significantly and subsequently, our customers began requesting rate reductions, which we began implementing in 2015. Rates in the last half of 2016, while at depressed levels, were relatively stable.
Fluid Logistics Rates
Our fluid logistics segment revenues are dependent on the prevailing market rates for fluid transport trucks and the related assets, including specialized vacuum, high-pressure pump and tank trucks, hot oil trucks, frac tanks, fluid mixing tanks, and salt water disposal wells. Pricing and utilization continued to decrease throughout 2016. Most notably rental rates have dropped by more than 67.0% from December 31, 2015 to December 31, 2016 in response to the current market environment.
Operating Expenses
During 2016, operating expenses decreased at a slower rate relative to the decrease in revenues in both the well servicing and fluid logistics segments, as noted under 'Results of Operations' below. The expense decline was primarily driven by reductions in headcount, along with other cost reduction measures. We continue to focus on managing our overall cost structure as well as on efforts to maintain or increase rates to customers.
Capital Expenditures
During 2016, we purchased equipment that had previously been leased in the amount of $8.1 million.
36
Results of Operations
Year Ended December 31, | ||||||||||||||||||
2016 | % of Revenue | 2015 | % of Revenue | 2014 | % of Revenue | |||||||||||||
(Dollars in Thousands) | ||||||||||||||||||
Revenue | $ | 116,205 | 100.0 | % | $ | 244,107 | 100.0 | % | $ | 449,278 | 100.0 | % | ||||||
Operating expenses | 104,023 | 89.5 | % | 192,419 | 78.8 | % | 341,053 | 75.9 | % | |||||||||
General & administrative expenses | 18,832 | 16.2 | % | 31,591 | 12.9 | % | 36,428 | 8.1 | % | |||||||||
Depreciation & amortization | 52,374 | 45.1 | % | 55,034 | 22.5 | % | 54,959 | 12.2 | % | |||||||||
Loss on impairment of assets | 14,537 | 12.5 | % | — | — | % | — | — | % | |||||||||
Reorganization costs | 7,548 | 6.5 | % | — | — | % | — | — | % | |||||||||
Operating (loss) income | (81,109 | ) | (69.8 | )% | (34,937 | ) | (14.3 | )% | 16,838 | 3.7 | % | |||||||
Interest and other expenses | (27,848 | ) | (24.0 | )% | (27,751 | ) | (11.4 | )% | (28,219 | ) | (6.3 | )% | ||||||
Pre-tax loss | (108,957 | ) | (93.8 | )% | (62,688 | ) | (25.7 | )% | (11,381 | ) | (2.5 | )% | ||||||
Income tax (benefit) expense | 172 | 0.15 | % | (16,614 | ) | (6.8 | )% | (3,060 | ) | (0.7 | )% | |||||||
Net loss | $ | (109,129 | ) | (93.9 | )% | $ | (46,074 | ) | (18.9 | )% | $ | (8,321 | ) | (1.9 | )% | |||
Comparison of Years Ended December 31, 2016 and December 31, 2015
Revenues — For the year ended December 31, 2016, revenues decreased by $127.9 million, or 52.4%, to $116.2 million when compared to the same period in the prior year. This is a direct result of the current decrease in spending by our customers during this period of low oil and natural gas prices.
Operating Expenses — Our operating expenses decreased to $104.0 million for the year ended December 31, 2016, from $192.4 million for the year ended December 31, 2015, a decrease of $88.4 million, or 45.9%. The decrease in direct operating expenses was attributable to lower operating hours related to the industry downturn. Operating expenses as a percentage of revenues were 89.5% and 78.8% for the years ended December 31, 2016 and 2015, respectively. The increase in operating expenses as a percentage of revenues was partially due to the fixed nature of certain costs and lower pricing from our customers, which reduced revenues but not the cost required to deliver the products and services.
General and Administrative Expenses — General and administrative expenses decreased by approximately $12.8 million, or 40.4%, to $18.8 million. General and administrative expenses as a percentage of revenues were 16.2% and 12.9% for the years ended December 31, 2016 and 2015, respectively. The increase in general and administrative expenses as a percentage of revenues was partially due to the fixed nature of certain costs, as well as negotiated settlement amounts totaling $0.4 million paid in order to cancel certain contracts in connection with our chapter 11 cases.
Depreciation and Amortization — Depreciation and amortization expenses decreased approximately by $2.7 million or 4.8%, when compared to the same period in the prior year. Depreciation and amortization decreased due to lower capital expenditures in 2016 and certain assets reaching the end of their depreciable lives.
Loss on impairment of assets — Loss on impairment of assets increased by $14.5 million, or 100.0%, when compared to the same period in the prior year. This increase is due to a triggering event that occurred in the second quarter of 2016, which required us to record an impairment loss against our intangible assets.
Reorganization costs — Reorganization costs increased by $7.5 million, or 100%, when compared to the prior year. This increase is due to professional and legal fees incurred as a result of the Reorganization.
Interest and Other Expenses — Interest and other expenses remained flat at $27.8 million for both years ended December 31, 2016 and 2015.
Income Taxes — Our income tax expense was $0.2 million ((0.2%) effective rate) on a pre-tax loss of $109.0 million for the year ended December 31, 2016, compared to an income tax benefit of $16.6 million (26.5% effective rate) on pre-tax loss of $62.7 million in 2015. The difference in the tax rate is primarily due to non-deductible expenses and the application of a valuation allowance against our federal deferred tax assets based on recent earnings history. Realization of deferred tax assets associated with net operating loss carryforwards is dependent upon generating sufficient taxable income in the appropriate
37
jurisdiction prior to their expiration. We established a valuation allowance equal to the net federal deferred tax assets due to uncertainties regarding the realization of those deferred tax assets based on our lack of recent earnings history. The valuation allowance increased by approximately $33.2 million during 2016.
Comparison of Years Ended December 31, 2015 and December 31, 2014
Revenues — For the year ended December 31, 2015, revenues decreased by $205.2 million, or 45.7%, to $244.1 million when compared to the same period in the prior year. This is a direct result of the current decrease in spending by our customers during this period of low oil and natural gas prices. The primary drivers in the drop in revenues were a 44.8% decrease in rig revenue in our well servicing segment and decreases of 35.7% and 57.6% in vacuum truck revenue and equipment rental revenue, respectively, in our fluid logistics segment over the same period last year.
Operating Expenses — Our operating expenses decreased to $192.4 million for the year ended December 31, 2015, from $341.1 million for the year ended December 31, 2014, a decrease of $148.7 million or 43.6%. The decrease in direct operating expenses was attributable to lower operating hours related to the industry downturn. Operating expenses as a percentage of revenues were 78.8% and 75.9% for the years ended December 31, 2015 and 2014, respectively. The increase in operating expenses as a percentage of revenue was primarily driven by the impact of fixed costs not decreasing at the same rate as revenues, plus a 45.7% increase in bad debt expense, due to increasing bankruptcies and risk of collection caused by the downturn in the industry.
General and Administrative Expenses — General and administrative expenses decreased by approximately $4.8 million, or 13.3%, to $31.6 million. General and administrative expenses as a percentage of revenues were 12.9% and 8.1% for the years ended December 31, 2015 and 2014, respectively. The increase in general and administrative expenses as a percentage of revenue was primarily driven by an increase in insurance expense, due to higher claims paid in 2015, as well as the impact of fixed costs not decreasing at the same rate as revenues.
Depreciation and Amortization — Depreciation and amortization expenses were relatively flat between the two years, at $55.0 million for each of the years ended December 31, 2015 and 2014.
Interest and Other Expenses—Interest and other expenses were $27.8 million in the year ended December 31, 2015, and $28.2 million in the year ended December 31, 2014.
Income Taxes — Our income tax benefit was $16.6 million (26.5% effective rate) on a pre-tax loss of $62.7 million for the year ended December 31, 2015, compared to an income tax benefit of $3.1 million (26.9% effective rate) on a pre-tax loss of $11.4 million in 2014. The difference in the tax rate is due to the Texas Margins Tax, other non-deductible expenses, and a change in Texas Margins Tax Rate enacted in the current year. Realization of deferred tax assets associated with net operating loss carryforwards is dependent upon generating sufficient taxable income in the appropriate jurisdiction prior to their expiration. We established a valuation allowance equal to the net federal deferred tax assets due to uncertainties regarding the realization of those deferred tax assets based on our lack of recent earnings history. A valuation allowance in the amount of $0.8 million had been established as of December 31, 2014 and increased by approximately $2.8 million during 2015.
Well Servicing
Year Ended December 31, | ||||||||||||||||||
2016 | % of Revenue | 2015 | % of Revenue | 2014 | % of Revenue | |||||||||||||
(Dollars in Thousands) | ||||||||||||||||||
Revenue | $ | 70,921 | 100.0 | % | $ | 150,949 | 100.0 | % | $ | 285,338 | 100.0 | % | ||||||
Direct operating costs | 61,279 | 86.4 | % | 117,514 | 77.9 | % | 213,278 | 74.7 | % | |||||||||
Segment profits | $ | 9,642 | 13.6 | % | $ | 33,435 | 22.1 | % | $ | 72,060 | 25.3 | % | ||||||
Results for 2016 compared to 2015 - Well Servicing
Revenues - Revenues from our well servicing segment decreased by $80.0 million for 2016, or 53.0%, to $70.9 million compared to the prior year primarily due to lower spending by our customers as a result of lower oil prices and from lower pricing for the work that was performed. Of this decrease, approximately 22.4% was due to decreasing rig rates and approximately 77.6% was due to decreased rig hours billed for well service activities. We had 173 well service rigs as of both, December 31, 2016 and 2015. The average rate charged per hour for our well servicing rigs during the year ended December 31, 2016 as compared to the same period in 2015 was down approximately 20.0%. Average utilization of our well
38
service rigs during the years ended December 31, 2016 and 2015 was 31.5% and 53.6%, respectively, calculated by comparing actual hours billed to theoretical full utilization which we based on a twelve hour day, working five days a week, except U.S. holidays.
Direct Operating Costs - Direct operating costs for our well servicing segment decreased by $56.2 million, or 47.9%, to $61.3 million. Well servicing direct operating costs as a percentage of well servicing revenues were 86.4% for the year ended December 31, 2016 compared to 77.9% for the year ended December 31, 2015, an increase of 8.5%. This increase was primarily due to an increase in bad debt expense of $0.5 million over the prior year as it has become more difficult for customers to pay their bills under current market conditions, and a swing of $0.5 million in gain/loss on disposal of assets. In 2015, we recognized a net gain of $0.4 million on disposal of assets as compared to 2016 where we recognized a net loss of $0.1 million on disposal of assets.
The dollar decrease in well servicing direct operating costs between the two years was due, in large part, to a decrease in labor, fuel, maintenance and supplies and parts expenses totaling approximately $32.0 million for the year ended December 31, 2016 compared to the prior year, as a result of the decreased activity. The employee count in our well servicing segment as of December 31, 2016 was 447, compared to 616 employees as of December 31, 2015. Insurance expense increased as a percentage of revenue for the year ended December 31, 2016 compared to 2015 due to increased claims costs. The increase in operating expenses as a percentage of revenues was partially due to the fixed nature of certain costs and lower pricing from our customers, which reduced revenues but not the cost required to deliver the services.
Results for 2015 compared to 2014 - Well Servicing
Revenues - Revenues from our well servicing segment decreased by $134.4 million for 2015, or 47.1%, to $150.9 million compared to the prior year. Of this decrease, approximately 5.6% was due to decreased rig rates and 94.4% was due to decreased rig hours billed for well service. We had 173 and 169 well service rigs as of December 31, 2015 and 2014, respectively. The rate charged per hour for our well servicing rigs during the year ended December 31, 2015 as compared to the same period in 2014 decreased approximately 4.6%. Average utilization of our well service rigs during the years ended December 31, 2015 and 2014 was 53.6% and 97.4%, respectively, calculated by comparing actual hours billed to theoretical full utilization which we based on a twelve hour day, working five days a week, except U.S. holidays.
Direct Operating Costs - Direct operating costs from our well servicing segment decreased by $95.8 million, or 44.9%, to $117.5 million. Well servicing direct operating costs as a percentage of well servicing revenues were 77.9% for the year ended December 31, 2015 compared to 74.7% for the year ended December 31, 2014, an increase of 3.2%. This increase, as a percentage of revenues, was primarily due to an 11.8% increase in operating lease expense, an 11.5% increase in insurance expense, and a 49.9% increase in bad debt expense, due to increasing bankruptcies and risk of collection caused by the downturn in the industry.
The dollar decrease in well servicing direct operating costs between the two years was due to the decrease in labor costs of $45.6 million, or 48.7%, for the year ended December 31, 2015 compared to the prior year due to lower utilization. The employee count in our well servicing segment at December 31, 2015 was 616 compared to 1,241 employees as of December 31, 2014. Labor costs as a percentage of revenues were 31.7% and 32.7% for the years ended December 31, 2015 and 2014, respectively.
39
Fluid Logistics
Year Ended December 31, | ||||||||||||||||||
2016 | % of Revenue | 2015 | % of Revenue | 2014 | % of Revenue | |||||||||||||
(Dollars in Thousands) | ||||||||||||||||||
Revenue | $ | 45,284 | 100.0 | % | $ | 93,158 | 100.0 | % | $ | 163,940 | 100.0 | % | ||||||
Direct operating costs | 42,744 | 94.4 | % | 74,905 | 80.4 | % | 127,775 | 77.9 | % | |||||||||
Segment profit | $ | 2,540 | 5.6 | % | $ | 18,253 | 19.6 | % | $ | 36,165 | 22.1 | % | ||||||
Results for 2016 compared to 2015 - Fluid Logistics
Revenues — Revenues for our fluid logistics segment for the year ended December 31, 2016 decreased by $47.9 million, or 51.4%, to $45.3 million compared to the prior year, driven primarily by a decrease in trucking hours of 46.7%, along with price reductions and a decrease in frac tank rentals and skim oil sales. Utilization and rate decreases resulted from the market downturn. Our principal fluid logistics assets at December 31, 2016 and 2015 were as follows:
December 31, | |||||||||
Asset | 2016 | 2015 | % Increase (decrease) | ||||||
Vacuum trucks | 431 | 453 | (4.9 | ) | |||||
High-pressure pump trucks | 106 | 146 | (27.4 | ) | |||||
Frac tanks and fluid mixing tanks | 2,908 | 3,060 | (5.0 | ) | |||||
Salt water disposal wells | 20 | 22 | (9.1 | ) | |||||
Direct Operating Costs — Direct operating costs from our fluid logistics segment decreased by $32.2 million, or 42.9%, to $42.7 million for 2016. Fluid logistics operating expenses as a percentage of fluid logistics revenues were 94.4% for the year ended December 31, 2016 compared to 80.4% for the year ended December 31, 2015, an increase of 14%. The increase in operating expenses as a percentage of revenues was primarily due to the fixed nature of certain costs and lower pricing from our customers, which reduced revenues but not the cost required to deliver the services.
The decrease in fluid logistics direct operating costs of $32.2 million was due primarily to a decrease in trucking hours which caused operating labor, fuel, and other variable operating expenses to decrease. The largest decrease was a reduction in labor costs of approximately $11.0 million driven by a decrease in the employee count to 350 at December 31, 2016 from 540 at December 31, 2015. Other significant cost reductions were attributable to fuel, repairs and maintenance, and supplies and parts expenses totaling approximately $7.5 million. These reductions were in line with the decrease in activity. These cost reductions were offset by an increase in frac tank expense in comparison to the prior year due to the resolution in the first half of 2015 of a settlement from a prior year's dispute which resulted in a reduction in frac tank expense in the first half of 2015 of just under $0.8 million, and an increase in bad debt expense of $0.4 million over the prior year as it has become more difficult for customers to pay their bills under current market conditions.
Results for 2015 compared to 2014 - Fluid Logistics
Revenues — Revenues from our fluid logistics segment for the year ended December 31, 2015 decreased by $70.8 million, or 43.2%, to $93.2 million compared to the prior year, driven primarily by a decrease in trucking hours of 32.0% along with price reductions and a decrease in frac tank rentals. Utilization and rate decreases resulted from the current market down-turn. Skim oil revenues declined due to lower activity and lower skim oil sales prices. Our principal fluid logistics assets at December 31, 2015 and 2014 were as follows:
40
Years Ended December 31, | |||||||||
Asset | 2015 | 2014 | % Increase (decrease) | ||||||
Vacuum trucks | 453 | 453 | — | ||||||
Other heavy trucks | 146 | 134 | 9.0 | ||||||
Frac tanks and fluid mixing tanks | 3,060 | 3,209 | (4.6 | ) | |||||
Salt water disposal wells | 22 | 23 | (4.3 | ) | |||||
Direct Operating Costs — Direct operating costs from our fluid logistics segment decreased by $52.9 million, or 41.4%, to $74.9 million. Fluid logistics operating expenses as a percentage of fluid logistics revenues were 80.4% for the year ended December 31, 2015, compared to 77.9% for the year ended December 31, 2014, an increase of 2.5%. This increase, as a percentage of revenues, was primarily due to a 40.2% increase in bad debt expense, due to increased bankruptcies and risk of collection caused by the downturn in the industry, and also due to fixed costs not decreasing at the same rate as the decrease in revenues.
The decrease in fluid logistics direct operating costs of $52.9 million was due primarily to a decrease in trucking hours which caused operating labor, fuel, and other variable operating expenses to decrease. The majority of the decrease was due to a decrease in labor costs of $19.7 million, or 43.2%, due to a decrease in the employee count to 540 at December 31, 2015 from 957 at December 31, 2014. The remainder was composed of a decrease in fuel and oil expense of $10.2 million, or 56.3%, to $7.9 million, a decrease in equipment rent expense of $2.7 million, or 35.3%, to $5.0 million, and a decrease in repairs and maintenance and supplies and parts expenses of $10.7 million, or 61.7%, to $6.6 million for the year ended December 31, 2015.
Liquidity and Capital Resources
Overview
As of December 31, 2016, we had and presently have outstanding under our Senior Indenture $280.0 million aggregate principal amount of 9% Senior Notes and $15.0 million outstanding under our Loan Agreement. Prior to the Loan Forbearance Agreement, the Loan Agreement provided for an asset based revolving credit facility with a maximum borrowing credit of $90.0 million, subject to borrowing base availability, any reserves established by the facility agent in its discretion, compliance with a fixed charge coverage ratio covenant if availability under the facility falls below certain thresholds and, for borrowings above $75.0 million, compliance with the debt incurrence covenant in the Senior Indenture. Subsequent to entering into and pursuant to the Loan Forbearance Agreement, the maximum borrowing availability under the Loan Agreement was reduced from $90 million to $30 million and the Lender is no longer obligated to make further advances under the Loan Agreement.
The Senior Indenture covenant prohibits the incurrence of debt except for certain limited exceptions, including indebtedness incurred under the permitted credit facility debt basket to the greater of $75.0 million or 18% of our Consolidated Tangible Assets (as defined in the Senior Indenture) reported for the last fiscal quarter for which financial statements are available. Under the Senior Indenture, Consolidated Tangible Assets is defined as our total assets, determined on a consolidated basis in accordance with GAAP, excluding unamortized debt discount and expenses and other unamortized deferred charges, to the extent such items are non-cash expenses or charges, goodwill, patents, trademarks, service marks, trade names, copyrights and other items classified as intangibles in accordance with GAAP.
As of December 31, 2016, 18% of our Consolidated Tangible Assets was approximately $55.7 million. If our availability under the credit facility dropped below 15% of our total borrowing credit (as described above), we are required to maintain a trailing four-quarter fixed charge coverage ratio of 1.1 to 1.0. Prior to the Loan Forbearance Agreement, under the Loan Agreement, our borrowing base at any time was equal to (i) 85% of eligible accounts, which are determined by the Agent in its reasonable discretion, plus (ii) the lesser of 85% of the appraised value, subject to certain adjustments, of our well services equipment that has been properly pledged and appraised, is in good operating condition and is located in the United States, or 100% of the net book value of such equipment, minus (iii) any reserves established by the Agent in its reasonable discretion. As discussed above, the Loan Forbearance Agreement reduced the borrowing base from $90.0 million to $30.0 million. Accordingly, as of December 31, 2016, the borrowing base was $30.0 million. Furthermore, our borrowing availability under the Loan Agreement as of December 31, 2016 was and remains uncertain since the Lender was and is not obligated to make any advances under the Loan Agreement.
As of December 31, 2016, there was $15.0 million drawn and $9.0 million in outstanding letters of credit posted to the facility. The Loan Agreement has a stated maturity of July 26, 2018.
The Senior Indenture and the Loan Agreement governing our senior secured revolving credit facility impose significant restrictions on us and increase our vulnerability to adverse economic and industry conditions that could limit our ability to
41
obtain additional or replacement financing. For example, the Senior Indenture only allows us to incur indebtedness, other than certain specific types of permitted indebtedness, if such indebtedness is unsecured and if the Fixed Charge Coverage Ratio (as defined in the Senior Indenture) for the most recently completed four full fiscal quarters is at least 2.0 to 1.0.
Our inability to satisfy our obligations under the Senior Indenture and the Loan Agreement constituted an event of default under such debt instruments. Accordingly, all of our outstanding debt, excluding some capital lease obligations, have been classified as current in the consolidated balance sheet.
On December 21, 2016, the Debtors and the Supporting Noteholders entered into the Restructuring Support Agreement. The Restructuring Support Agreement contemplates the Reorganization pursuant to the Plan. Pursuant to the Plan, on the effective date of the Plan, the 9% Senior Notes will be canceled and each holder of the 9% Senior Notes will receive such holder’s pro rata share of (i) $20 million in cash and (ii) 100% of the new common stock of reorganized FES Ltd., subject to dilution only as a result of the shares of new common stock of reorganized FES Ltd. issued or available for issuance in connection with the Management Incentive Plan. In addition, on the effective date of the Plan, certain holders of the 9% Senior Note will make available to the reorganized Debtors the Exit Facility. Furthermore, on the effective date of the Plan, the Loan Agreement will be terminated and the New Regions Facility will be entered into covering the outstanding letters of credit and Bank Product Obligations (as defined in the Loan Agreement) under the Loan Agreement and Regions, as sole new Lender, in full satisfaction and settlement of its claims against the Debtors, will (i) receive cash to satisfy all outstanding obligations with respect to the Revolving Advances (as defined in the Loan Agreement), including, without limitation, all outstanding Revolving Advances and all interest, fees, and other charges due and payable under the Loan Agreement relating to the Revolving Advances, and (ii) as to the Issuer and Bank Product Provider (as each term is defined in the Loan Agreement), continue to hold the cash pledged by Debtors to collateralize all outstanding letters of credit and Bank Product Obligations under the Loan Agreement that will be covered by the New Regions Facility. As of December 31, 2016, the Revolving Advances consisted of a $15.0 million advance against the credit facility, Bank Product Obligations consisted of $0.5 million for our corporate credit card program, and we had $9.0 million in outstanding letters of credit.
The Debtors filed the Petitions on January 22, 2017, and on March 29, 2017, the Bankruptcy Court entered an order confirming the Plan. We expect the consummation of the Plan to become effective on or about April 13, 2017. While we expect we will eliminate approximately $280.0 million in principal amount of the 9% Senior Notes plus accrued interest thereon on the effective date of the Plan, there is no assurance that the effectiveness of the Plan will occur on April 13, 2017 or at all. The Debt Instrument Defaults would have resulted in all outstanding indebtedness due under the Senior Indenture and the Loan Agreement becoming immediately due and payable. However, pursuant to the Indenture Forbearance Agreement and the Loan Forbearance Agreement, the Supporting Noteholders, Regions and the Lender agreed to forbear from exercising default remedies or accelerating any indebtedness under their respective debt instrument resulting from the Debt Instrument Defaults while they worked with the Debtors to reach an agreement on the Reorganization. Additionally, any efforts to enforce such payment obligations were automatically stayed as a result of the filing of the Petitions, and the creditors' rights of enforcement in respect of the Senior Indenture and the Loan Agreement are subject to the applicable provisions of the Bankruptcy Code and orders of the Bankruptcy Court.
Within certain constraints, we can conserve capital by reducing or delaying capital expenditures, deferring non-regulatory maintenance expenditures, and further reducing operating and administrative costs.
We have historically funded our operations, including capital expenditures, with bank borrowings, vendor financings, cash flow from operations, the issuance of our senior notes, common stock and our Series B Preferred Stock.
As of December 31, 2016, we had $20.4 million in unrestricted cash and cash equivalents, $27.6 million in restricted cash, and $299.2 million in contractual debt and capital leases. Also, as of December 31, 2016, we had 588,059 outstanding shares of Series B Preferred Stock which is reflected in the balance sheet as temporary equity-preferred stock in an amount of $15.3 million.
As discussed in Part I-Item 1. Business Reorganization and Chapter 11 Proceedings, all existing Equity Interests (as defined in the Plan and which include our common stock, our preferred stock, awards under the Compensation Plan and the preferred stock purchase rights under the Rights Agreement) in FES Ltd. will be extinguished without recovery.
The $299.2 million in contractual debt was comprised of $277.7 million in 9% Senior Notes ($280.0 million par value less $2.3 million of unamortized debt issuance costs), $6.5 million in capital leases on equipment and insurance notes, and $15.0 million drawn on our revolving credit facility. Of our total debt, $0.2 million was long-term debt and $298.9 million was current. The 9% Senior Notes are considered current liabilities as the result of the Debt Instrument Defaults under the Senior Indenture. The $6.5 million in notes consisted of $1.4 million in capital leases on equipment and $5.1 million in insurance notes related to our general liability, workers compensation and other insurances.
42
Notwithstanding the impact of our chapter 11 cases on our liquidity, including the stay of payments on our obligations under the Senior Indenture and the Loan Agreement, our current and future liquidity is greatly dependent upon our operating results. Our ability to continue to meet our liquidity needs is subject to and will be affected by cash utilized in operations, including our ongoing reorganization activities, the economic or business environment in which we operate, weakness in oil and natural gas industry conditions, the financial condition of our customers and vendors, our ability to reorganize our capital structure under Bankruptcy Court supervision and other factors. Furthermore, as a result of the challenging market conditions we continue to face, we anticipate continued net cash used in operating activities after reorganization and capital expenditures.
Additionally, costs associated with the reorganization and the chapter 11 cases could negatively impact our financial condition. Upon emergence from Chapter 11, we anticipate certain holders of the 9% Senior Notes will make available to us the Exit Facility, from which $20.0 million will be used to pay to the noteholders. The Exit Facility contains covenants similar to those in the existing Loan Agreement.
Cash Flows
Our cash flows depend, to a large degree, on the level of spending by oil and gas companies' development and production activities. The sustained decreases in the price of oil and natural gas have had a material impact on these activities, and could also materially affect our future cash flows. Certain sources and uses of cash, such as the level of discretionary capital expenditures, purchases and sales of investments, issuances and repurchases of debt and of our common stock are within our control and are adjusted as necessary based on market conditions.
Cash Flows from Operating Activities
Net cash used in operating activities was $13.9 million for the year ended December 31, 2016 compared to $36.6 million in net cash provided by operating activities for the year ended December 31, 2015, a decrease of $50.5 million. The decrease in net cash from operating activities was primarily a combination of a larger net loss in 2016 compared to 2015, coupled with a reduction in cash provided by the change in accounts receivable. This was largely offset by our election not to make the Missed Interest Payments.
Net cash provided by operating activities was $36.6 million for the year ended December 31, 2015 compared to $47.2 million for the year ended December 31, 2014, a decrease of $10.6 million. While cash provided by the change in accounts receivable was significantly higher than in the prior year, it was offset by a much higher net loss in 2015 than in 2014, as well as decreases in accounts payable and accrued expenses from the prior year, resulting in overall cash provided by operating activities being down compared to the prior year.
Cash Flows Used in Investing Activities
Net cash used in investing activities was $6.8 million for the year ended December 31, 2016 compared to $5.4 million from the year ended December 31, 2015, an increase of $1.4 million. This increase was primarily due to the receipt of $1.3 million in insurance proceeds in 2015.
Net cash used in investing activities was $5.4 million for the year ended December 31, 2015 compared to $32.4 million for the year ended December 31, 2014, a decrease of $27.0 million. This decrease resulted from a decrease in capital spending in 2015 compared to 2014.
Capital expenditures for 2016 were comprised of additions to our fluid logistics segment of approximately $4.4 million and additions to our well servicing segment of approximately $4.3 million. Additions to our fluid logistics segment were primarily purchases of trucks and trailers, which had previously been on operating leases and were at the end of their respective terms. Additions to the well servicing segment were primarily purchases of trucks and coil tubing equipment, which had previously been on operating leases and were at the end of their respective terms.
43
Cash Flows from Financing Activities
Net cash used in financing activities was $33.5 million for the year ended December 31, 2016 compared to net cash provided by financing activities of $8.5 million for the year ended December 31, 2015, a decrease of $42.0 million. This decrease primarily resulted from the pledging in 2016 of restricted cash to collateralize our $9.0 million in letters of credit, for which there was no comparable transaction in 2015, and the $15.0 million draw on our revolving credit facility in 2015 for which there was no comparable transaction in 2016.
Net cash provided by financing activities amounted to $8.5 million for the year ended December 31, 2015 compared to net cash used in financing activities of $6.3 million for the year ended December 31, 2014, an increase of $14.8 million. The increase was due to a $15.0 million draw on our revolving credit facility in 2015 for which there was no comparable transaction in 2014.
9% Senior Notes
On June 7, 2011, FES Ltd. issued $280.0 million in principal amount of 9% Senior Notes. The 9% Senior Notes mature on June 15, 2019, and require semi-annual interest payments, in arrears, at an annual rate of 9% on June 15 and December 15 of each year until maturity. Pursuant to the Senior Indenture, no principal payments are scheduled until maturity.
The 9% Senior Notes are guaranteed by FES LLC, CCF, TES, and FEI LLC, or collectively, the Guarantor Subs. All of the Guarantor Subs are 100% owned and each guarantees the securities on a full and unconditional and joint and several basis, subject to customary release provisions which include: (i) the transfer, sale or other disposition (by merger or otherwise) of all or substantially all of the assets of the applicable Guarantor, or all of its capital stock; (ii) the proper designation of a Guarantor as an "Unrestricted Subsidiary"; (iii) the legal defeasance or satisfaction and discharge of the Senior Indenture; and (iv) as may be provided in any intercreditor agreement entered into in connection with any current and future credit facilities, in each such case specified in clauses (i) through (iii) above in accordance with the requirements therefor set forth in the Senior Indenture. FES Ltd. has no independent assets or operations. There are no significant restrictions on FES Ltd.'s ability or the ability of any Guarantor Sub to obtain funds from its subsidiaries by means as a dividend or loan. FES Ltd. may, at its option, redeem all or part of the 9% Senior Notes from time to time at specified redemption prices and subject to certain conditions required by the Senior Indenture. FES Ltd. is required to make an offer to purchase the notes and to repurchase any notes for which the offer is accepted at 101% of their principal amount, plus accrued and unpaid interest, if there is a change of control. FES Ltd. is required to make an offer to purchase the notes and to repurchase any notes for which the offer is accepted at 100% of their principal amount, plus accrued and unpaid interest, following certain asset sales.
Prior to the Debt Instrument Defaults, as discussed below, we were permitted under the terms of the Senior Indenture to incur additional indebtedness in the future, provided that certain financial conditions set forth in the Senior Indenture are satisfied. We are subject to certain covenants contained in the Senior Indenture, including provisions that limit or restrict FES Ltd.'s and certain future subsidiaries' abilities to incur additional debt, to create, incur or permit to exist certain liens on assets, to make certain dispositions of assets, to make payments on certain subordinated indebtedness, to pay dividends or certain other payments to FES Ltd.'s equity holders, to engage in mergers, consolidations or other fundamental changes, to change the nature of its business or to engage in transactions with affiliates. Due to cross-default provisions in the Senior Indenture and the Loan Agreement, with certain exceptions, a default and acceleration of outstanding debt under one debt agreement would result in the default and possible acceleration of outstanding debt under the other debt agreement. Accordingly, an event of default could result in all or a portion of our outstanding debt under our debt agreements becoming immediately due and payable. If this occurred, we might not be able to obtain waivers or secure alternative financing to satisfy all of our obligations simultaneously, which would adversely affect our business and operations.
Details of two of the more significant restrictive covenants in the Senior Indenture are set forth below:
• | Limitation on the Incurrence of Additional Debt - In addition to certain indebtedness defined in the Senior Indenture as "Permitted Debt," which includes indebtedness under any credit facility not to exceed the greater of $75.0 million or 18% of our Consolidated Tangible Assets (as defined in the Senior Indenture), we may only incur additional debt if the Fixed Charge Coverage Ratio (as defined in the Senior Indenture) for the most recently completed four full fiscal quarters is at least 2.0 to 1.0. |
• | Limitation on Restricted Payments - Subject to certain limited exceptions, including specific permission to pay cash dividends on our Series B Preferred Stock up to $260,000 per quarter, we are prohibited from (i) declaring or paying dividends or other distributions on its equity securities (other than dividends or distributions payable in equity securities), (ii) purchasing or redeeming any of our equity securities, (iii) making any payment on indebtedness contractually subordinated to the 9% Senior Notes, except a payment of interest or principal at the stated maturity thereof, or (iv) making any investment defined as a "Restricted Investment," unless, at the time of |
44
and after giving effect to such payment, we are not in default and we are able to incur at least $1.00 of additional Indebtedness pursuant to the Fixed Charge Coverage Ratio (as defined in the Senior Indenture). Further, the amount of such payment plus all other such payments made by us since the issuance of the 9% Senior Notes must be less than the aggregate of (a) 50% of Consolidated Net Income (as defined in the Senior Indenture) since the April 1, 2011 (or 100%, if such figure is a deficit), (b) 100% of the aggregate net cash proceeds from equity offerings since the issuance of the 9% Senior Notes, (c) if any Restricted Investments have been sold for cash, the proceeds from such sale (or the original cash investment if that amount is lower); and (d) 50% of any dividends received by us.
We experienced the Debt Instrument Defaults under the Senior Indenture which would have resulted in all outstanding indebtedness due under the Senior Indenture immediately due and payable. However, pursuant to the Indenture Forbearance Agreement, the Supporting Noteholders agreed to forbear from exercising default remedies or accelerating any indebtedness under the Senior Indenture resulting from the Debts Instrument Defaults while they worked with the Debtors to reach an agreement on the Reorganization. Additionally, as discussed above, any efforts to enforce such payment obligations were automatically stayed as a result of the filing of the Petitions, and the creditors' rights of enforcement in respect of the Senior Indenture are subject to the applicable provisions of the Bankruptcy Code and orders of the Bankruptcy Court. Moreover, on March 29, 2017, the Bankruptcy Court entered an order confirming the Plan and the Debtors expect the consummation of the Plan to become effective on or about April 13, 2017. On the effective date of the Plan, the 9% Senior Notes will be canceled and each holder of the 9% Senior Notes will receive such holder’s pro rata share of (i) $20 million in cash and (ii) 100% of the new common stock of reorganized FES Ltd., subject to dilution only as a result of the shares of new common of reorganized FES Ltd. issued or available for issuance in connection with the Management Incentive Plan. The amounts outstanding under the Senior Indenture are classified as current in the consolidated balance sheet for December 31, 2016.
Revolving Credit Facility
On September 9, 2011, we entered into the Loan Agreement. Prior to the Loan Forbearance Agreement, the Loan Agreement provided for an asset based revolving credit facility with a maximum borrowing credit of $90.0 million, subject to borrowing base availability, any reserves established by the facility agent in its discretion, compliance with a fixed charge coverage ratio covenant if availability under the facility falls below certain thresholds and, for borrowings above $75.0 million, compliance with the debt incurrence covenant in the Senior Indenture that prohibits the incurrence of debt except for certain limited exceptions, including indebtedness incurred under the permitted credit facility debt basket to the greater of $75.0 million or 18% of our Consolidated Tangible Assets (as defined in the Senior Indenture) reported for the last fiscal quarter for which financial statements are available. As of December 31, 2016, 18% of our Consolidated Tangible Assets was approximately $55.7 million. If our availability under the credit facility dropped below 15% of our total borrowing credit (as described above), we are required to maintain a trailing four-quarter fixed charge coverage ratio of at least 1.1 to 1. Prior to the Loan Forbearance Agreement, under the Loan Agreement, our borrowing base at any time was equal to (i) 85% of eligible accounts, which are determined by the Agent in its reasonable discretion, plus (ii) the lesser of 85% of the appraised value, subject to certain adjustments, of our well services equipment that has been properly pledged and appraised, is in good operating condition and is located in the United States, or 100% of the net book value of such equipment, minus (iii) any reserves established by the Agent in its reasonable discretion. As discussed above, the Loan Forbearance Agreement reduced the borrowing base from $90.0 million to $30.0 million. Accordingly, as of December 31, 2016, the borrowing base was $30.0 million. Furthermore, our borrowing availability under the Loan Agreement at December 31, 2016 was and remains uncertain because the Lender was and is not obligated to make any advances under the Loan Agreement.
The Loan Agreement has a stated maturity of July 26, 2018. In June 2015, FES LLC borrowed $15.0 million under the facility. As of December 31, 2016, the facility had a revolving loan balance outstanding of $15.0 million and $9.0 million in letters of credit outstanding against the facility.
Borrowings bear interest at a rate equal to either (a) the LIBOR rate plus an applicable margin of between 2.00% to 2.50% based on borrowing availability or (b) a base rate plus an applicable margin of between 1.00% to 1.50% based on borrowing availability, where the base rate is equal to the greater of the prime rate established by Regions Bank, the overnight federal funds rate plus 0.5% or the LIBOR rate for a one-month period plus 1%. As a result of Debt Instrument Defaults that gave rise to the Loan Forbearance Agreement, our effective interest rate as of December 31, 2016 was 4.75%, plus a 2.0% default rate.
In addition to paying interest on outstanding principal under the facility, a fee of 0.375% per annum will accrue on unutilized availability under the credit facility. We are required to pay a fee of between 2.25% to 2.75%, based on borrowing availability, with respect to the principal amount of any letters of credit outstanding under the facility. We are also responsible for certain other administrative fees and expenses.
45
FES LLC, FEI LLC, TES, and CCF are the named borrowers under the loan and security agreement. Their obligations have been guaranteed by one another and by FES Ltd. Subject to certain exceptions and permitted encumbrances, including the exemption of real property interests from the collateral package, the obligations under this facility are secured by a first priority security interest in all of our assets.
The Loan Agreement contains customary covenants for an asset-based credit facility, which include (i) restrictions on certain mergers, consolidations and sales of assets; (ii) restrictions on the creation or existence of liens; (iii) restrictions on making certain investments; (iv) restrictions on the incurrence or existence of indebtedness; (v) restrictions on transactions with affiliates; (vi) requirements to deliver financial statements, reports and notices to the Agent and (vii) a springing requirement to maintain a consolidated Fixed Charge Coverage Ratio (which is defined in the Loan Agreement) of 1.1:1.0 in the event that our excess availability under the credit facility falls below the greater of $11.3 million or 15.0% of our maximum credit under the facility for 60 consecutive days; provided that, the restrictions described in (i)-(v) above are subject to certain exceptions and permissions limited in scope and dollar value. The Loan Agreement also contains customary representations and warranties and event of default provisions.
Under cross default provisions in the Loan Agreement, an event of default under the 9% Senior Notes constitutes an event of default under the Loan Agreement. As mentioned above, we experienced the Debt Instrument Defaults under the Senior Indenture and Loan Agreement. The Debt Instrument Defaults under the Senior Indenture and the Loan Agreement would have resulted in all outstanding indebtedness due under the Senior Indenture and the Loan Agreement becoming immediately due and payable. However, pursuant to the Indenture Forbearance Agreement and the Loan Forbearance Agreement, the Supporting Noteholders, Regions and the Lender agreed to forbear from exercising default remedies or accelerating any indebtedness under their respective debt instrument resulting from the Debt Instrument Defaults while they worked with the Debtors to reach an agreement on the Reorganization. Additionally, as discussed above, any efforts to enforce such payment obligations were automatically stayed as a result of the filing of the Petitions, and the creditors' rights of enforcement in respect of the Senior Indenture and the Loan Agreement are subject to the applicable provisions of the Bankruptcy Code and orders of the Bankruptcy Court. Moreover, on March 29, 2017, the Bankruptcy Court entered an order confirming the Plan and the Debtors expect the consummation of the Plan to become effective on or about April 13, 2017. On the effective date of the Plan, the Loan Agreement will be terminated and the New Regions Facility will be entered into covering the outstanding letters of credit and Bank Product Obligations (as defined in the Loan Agreement) under the Loan Agreement and Regions, as sole new Lender, in full satisfaction and settlement of its claims against the Debtors, will (i) receive cash to satisfy all outstanding obligations with respect to the Revolving Advances (as defined in the Loan Agreement), including, without limitation, all outstanding Revolving Advances and all interest, fees, and other charges due and payable under the Loan Agreement relating to the Revolving Advances, and (ii) as to the Issuer and Bank Product Provider (as each term is defined in the Loan Agreement), continue to hold the cash pledged by Debtors to collateralize all outstanding letters of credit and Bank Product Obligations under the Loan Agreement that will be covered by the New Regions Facility. As of December 31, 2016, the Revolving Advances consisted of a $15.0 million advance against the credit facility, Bank Product Obligations consisted of $0.5 million for our corporate credit card program, and we had $9.0 million in outstanding letters of credit. The amounts outstanding under the Senior Indenture and the Loan Agreement are classified as current in the consolidated balance sheet as of December 31, 2016.
Series B Preferred Stock
On May 28, 2010, we completed a private placement of 580,800 shares of Series B Preferred Stock at a price per share of CAD $26.37 for an aggregate purchase price in the amount of USD $14.5 million based on the exchange rate between U.S. dollars and Canadian dollars then in effect of $1.00 to CDN $1.0547.
We have obligations to pay the holders of our Series B Preferred Stock quarterly dividends of five percent per annum of the original issue price, payable in cash or in-kind.
The Senior Indenture specifically allows the payment of cash dividends on the Series B Preferred Stock of up to $260,000 per quarter. Therefore, there are no contractual or stock exchange restrictions on our paying the Series B Preferred Stock dividends in cash or in-kind. The annual dividend payments for the Series B Preferred Stock is approximately $0.7 million. We paid in cash all required dividends on its Series B Preferred Stock for completed dividend periods through February 29, 2016. We did not make the dividend payments due on May 28, 2016, August 28, 2016, November 28, 2016 and February 28, 2017.
During periods when our common stock maintains a five day volume weighted average trading price above $3.33 per share, the Series B Preferred Stock is redeemable, in whole or in part, at our option for a price of $25 per share, plus accrued and unpaid dividends. Nevertheless, if we elect to redeem the Series B Preferred Stock, the holders thereof would have the opportunity prior to redemption to convert each share of Series B Preferred Stock into nine shares of common stock. On May 28, 2017, we are required to redeem any of the shares of Series B Preferred Stock then outstanding. The cost of the redemption at this date would be $15.6 million. Such mandatory redemption may, at our election, be paid in cash or common
46
stock (valued for such purpose at 95% of the then fair market value of the common stock). As of December 31, 2016, we had 588,059 shares of Series B Preferred Stock outstanding. For a discussion of the rights and preferences of the Series B Preferred Stock, see Note 17 to the consolidated financial statements for the year ended December 31, 2016, included herein.
As discussed in Part I-Item 1. Business Reorganization and Chapter 11 Proceedings, all existing Equity Interests (as defined in the Plan and which include our common stock, our preferred stock, awards under the Compensation Plan and the preferred stock purchase rights under the Rights Agreement) in FES Ltd. will be extinguished without recovery.
Contractual Obligations and Financing
The table below provides estimated timing of future payments for which we were obligated as of December 31, 2016. The table does not reflect any potential changes to our contractual obligations and other commitments that may result from the chapter 11 process and activities contemplated by the Plan. For example, the Plan contemplates that approximately $280.0 million of our debt obligations reflected in the table below would be canceled and exchanged for equity. The Debt Instrument Defaults under the terms of the Senior Indenture and the Loan Agreement would have resulted in all outstanding indebtedness due under the Senior Indenture and the Loan Agreement immediately due and payable. However, pursuant to the Indenture Forbearance Agreement and the Loan Forbearance Agreement, the Supporting Noteholders, Regions and the Lender agreed to forbear from exercising default remedies or accelerating any indebtedness under their respective debt instrument resulting from the Debt Instrument Defaults while they worked with the Debtors to reach an agreement on the Reorganization. Additionally, as discussed above any efforts to enforce such payment obligations were automatically stayed as a result of the filing of the Petitions, and the creditors' rights of enforcement in respect of the Senior Indenture and the Loan Agreement are subject to the applicable provisions of the Bankruptcy Code and orders of the Bankruptcy Court. See Note 2 to the consolidated financial statements for the year ended December 31, 2016, included herein.
Total | 2017 | 2018-2019 | 2020-2021 | Thereafter | |||||||||||||||
(dollars in thousands) | |||||||||||||||||||
Maturities of long-term debt, including current portion, excluding capital lease obligations (1) | $ | 300,124 | $ | 300,124 | $ | — | $ | — | $ | — | |||||||||
Capital lease obligations (1) | 1,385 | 1,145 | 240 | — | — | ||||||||||||||
Operating lease commitments | 7,622 | 2,192 | 1,645 | 1,344 | 2,441 | ||||||||||||||
Interest on debt (2) | 27,062 | 27,059 | 3 | — | — | ||||||||||||||
Series B senior preferred stock dividends | 919 | 919 | — | — | — | ||||||||||||||
Series B senior preferred stock redemption | 14,701 | 14,701 | — | — | — | ||||||||||||||
Total | $ | 351,813 | $ | 346,140 | $ | 1,888 | $ | 1,344 | $ | 2,441 | |||||||||
(1) | The sum of maturities of long-term debt and capital lease obligations reflects the full contractual obligation amount. This is higher than the total debt amount reflected on the Company's balance sheet, due to the requirement under ASU 2015-03 that debt issuance costs be shown as a direct deduction from the carrying amount of the liability. |
(2) | Interest on debt includes the Missed Interest Payments, plus accrued interest through the chapter 11 filing date of January 22, 2017. |
Settlement of Lease Obligations and Other Commitments
As part of the proposed financial restructuring of the Company, the Company and its subsidiaries have settled certain lease obligations and other commitments that would otherwise have required the future payment of $3.2 million for $1.9 million thereby resulting in savings to the Company of approximately $1.3 million. Included among such settlements, on October 25, 2016, each of CCF and TES entered into a settlement and termination agreement with certain equipment lessors whereby it acquired certain equipment and eliminated any ongoing lease obligations.
Critical Accounting Policies and Estimates
The preparation of our consolidated financial statements in accordance with generally accepted accounting principles requires management to make estimates and assumptions that affect the reported amounts of assets and liabilities and the disclosure of contingent assets and liabilities as of the dates of the financial statements and the reported amounts of revenue and expenses during the applicable reporting periods. On an ongoing basis, management reviews its estimates, particularly those
47
related to depreciation and amortization methods, useful lives and the impairment of long-lived assets, and the allowance for doubtful accounts, using currently available information. Changes in facts and circumstances may result in revised estimates, and actual results could differ from those estimates.
Estimated Depreciable Lives
A substantial portion of our total assets is comprised of equipment. Each asset included in equipment is recorded at cost and depreciated using the straight-line method over the asset’s estimated economic useful life. As a result of these estimates of economic useful lives, net equipment as of December 31, 2016 totaled $233.4 million, which represented 74.6% of total assets. Depreciation expense for the year ended December 31, 2016 totaled $50.7 million, which represented 48.7% of total operating expenses. Given the significance of equipment to our financial statements, the determination of an asset’s economic useful life is considered to be a critical accounting estimate. The estimated economic useful life is monitored by management to determine its continued appropriateness.
Impairment
During the second quarter of 2016, we determined that the continued decline in revenues and industry-wide slowdown related to oil prices was other than temporary and was an impairment indicator. Therefore, we assessed all of our long-lived assets for impairment, which resulted in the carrying amounts of long-lived assets associated with our fluid logistics segment in exceeding the recoverable amounts based upon the undiscounted cash flow analysis. As a result, we hired an independent consulting firm to measure the fair values of the long-lived assets associated with our fluid logistics segment. Based on the fair value analysis, the fair values of certain intangible assets were determined to be less than their carrying amounts; therefore, an impairment loss of $14.5 million was recorded as a component of operating expenses based on the amount that the carrying value exceeded fair value. Fair value of the intangible assets was determined utilizing a combination of the income, cost and market approaches. Specific intangible assets affected were customer relationships and other intangibles. We did not experience any additional triggering events in the third or fourth quarters of 2016.
Allowance for Doubtful Accounts
The determination of the collectability of amounts due from our customers requires us to use estimates and make judgments regarding future events and trends, including monitoring our customers’ payment history and current credit worthiness to determine that collectability is reasonably assured, as well as consideration of the overall business climate in which our customers operate. Inherently, these uncertainties require us to make frequent judgments and estimates regarding our customers’ ability to pay amounts due to us in order to determine the appropriate amount of valuation allowances required for doubtful accounts. Provisions for doubtful accounts are recorded when it becomes evident that the customer will not make the required payments at either contractual due dates or in the future. At December 31, 2016 and 2015, the allowance for doubtful accounts totaled $1.4 million, or 8.0%, and $1.8 million, or 6.8%, of gross accounts receivable, respectively. We believe that our allowance for doubtful accounts is adequate to cover potential bad debt losses under current conditions; however, uncertainties regarding changes in the financial condition of our customers, either adverse or positive, and particularly in light of the ongoing depressed industry conditions, could impact the amount and timing of any additional provisions for doubtful accounts that may be required. A five percent change in the allowance for doubtful accounts would have had an impact on our pre-tax loss of approximately $0.1 million in 2016.
Revenue Recognition
Well Servicing — Well servicing consists primarily of maintenance services, workover services, completion services, plugging and abandonment services, and tubing testing. We price well servicing primarily by the hour of service performed or, on occasion, bid/turnkey pricing.
Fluid Logistics — Fluid logistics consists primarily of the sale, transportation, storage, and disposal of fluids used in drilling, production, and maintenance of oil and natural gas wells. We price fluid logistics by the job, by the hour, or by the quantities sold, disposed, or hauled.
We recognize revenue when services are performed, collection of the relevant receivables is probable, persuasive evidence of an arrangement exists, and the price is fixed or determinable.
Income Taxes
Our income tax expense on continuing operations was $0.2 million ((0.2%) effective rate) on a pre-tax loss of $109.0 million for the year ended December 31, 2016, compared to an income tax benefit of $16.6 million (26.5% effective rate) on a pre-tax loss of $62.7 million in 2015. For the years ended December 31, 2016 and 2015, $0.0 million and $0.1 million in state tax expense was recorded, respectively. There were no foreign income taxes recorded for the years ended December 31, 2016
48
and 2015. As of December 31, 2016 and 2015, $1.1 million and $0.9 million in deferred state income tax liability was reflected in the FES Ltd.’s balance sheet, respectively.
Current and deferred net tax liabilities are recorded in accordance with enacted tax laws and rates. Valuation allowances are established to reduce deferred tax assets when it is more likely than not that some portion or all of the deferred tax assets will not be realized. In determining the need for valuation allowances, we have considered and made judgments and estimates regarding estimated future taxable income and ongoing prudent and feasible tax planning strategies. These estimates and judgments include some degree of uncertainty and changes in these estimates and assumptions could require us to adjust the valuation allowances for our deferred tax assets. The existence of reversing taxable temporary differences supports the recognition by the Company of deferred tax assets. In the event that the Company's federal deferred tax assets exceed the Company's reversing taxable temporary differences, it is not more likely than not that those deferred tax assets would be realized due to the Company's lack of earnings history. Therefore, a valuation allowance in the amount of $0.8 million was established as of December 31, 2014 and increased by approximately $2.8 million during 2015 and by approximately $33.2 million during 2016, based on the extent that the Company's federal deferred tax assets exceeded the Company's reversing taxable temporary differences. In 2017, the Debtors filed for bankruptcy protection under Chapter 11 of the bankruptcy code. We anticipate that the majority of our NOLs will be absorbed by cancellation of indebtedness income pursuant to Internal Revenue Code Section 108. Any NOL remaining following the implementation of the Plan will likely be subject to annual limitation under Section 382.
Environmental
We are subject to extensive federal, state, and local environmental laws and regulations. These laws, which are constantly changing, regulate the discharge or release of materials into the environment and may require us to remove or mitigate the adverse environmental effects of the disposal or release of petroleum, chemical, or other hazardous substances at various sites. Environmental expenditures are expensed or capitalized depending on their future economic benefit. Expenditures that relate to an existing condition caused by past operations and that have no future economic benefits are expensed. Liabilities for expenditures of a non-capital nature are recorded when environmental assessment and/or remediation is probable and the costs can be reasonably estimated. We believe, on the basis of presently available information, that regulation of known environmental matters will not materially affect our liquidity, capital resources or consolidated financial condition. There were no material environmental liabilities for each of the years ended December 31, 2016 and 2015. However, there can be no assurances that future costs and liabilities will not be material.
Recently Issued Accounting Pronouncements
In November 2016, Financial Accounting Standards Board, or the FASB, issued ASU No. 2016-18, "Statement of Cash Flows (Topic 230), Restricted Cash," ("ASU 2016-18"). ASU 2016-18 provides guidance on the presentation of restricted cash and restricted cash equivalents in the statement of cash flows. Restricted cash and restricted cash equivalents should be included with cash and cash equivalents when reconciling the beginning-of-period and end-of-period amounts shown on the statement of cash flows. The amendments of ASU 2016-18 should be applied using a retrospective transition method and are effective for reporting periods beginning after December 15, 2017, with early adoption permitted. We believe the adoption of this pronouncement will only change the presentation of the statement of cash flows for restricted cash.
In August 2016, the FASB issued ASU No. 2016-15, “Statement of Cash Flows (Topic 230): Classification of Certain Cash Receipts and Cash Payments” (“ASU 2016-15”). ASU 2016-15 will make eight targeted changes to how cash receipts and cash payments are presented and classified in the statement of cash flows. ASU 2016-15 is effective for fiscal years beginning after December 15, 2017. The new standard will require adoption on a retrospective basis unless it is impracticable to apply, in which case, the new standard would apply the amendments prospectively as of the earliest date practicable. We are currently in the process of evaluating the impact of adoption on our consolidated financial statements.
In June 2016, the FASB issued ASU No. 2016-13, 'Financial Instruments-Credit Losses (Topic 326): Measurement of Credit Losses on Financial Instruments ("ASU 2016-13"), which introduces a new impairment model for financial instruments that is based on expected credit losses rather than incurred credit losses. The new impairment model applies to most financial assets, including trade accounts receivable. The amendments in ASU 2016-13 are effective for interim and annual reporting periods beginning after December 15, 2019, with early adoption permitted for annual periods beginning after December 15, 2018. We will be evaluating the impact of adopting this pronouncement on our consolidated financial statements.
In March 2016, the FASB issued ASU No. 2016-09, "Compensation - Stock Compensation - Improvements to Employee Share-Based Payment Accounting" ("ASU 2016-09"), which involves several aspects of the accounting for share-based payment transactions, including the income tax consequences, classification of awards as either equity or liabilities, and classification on the statement of cash flows. Under the new standard, income tax benefits and deficiencies are to be recognized as income tax expense or benefit in the income statement and the tax effects of exercised or vested awards should be treated as
49
discrete items in the reporting period in which they occur. An entity should also recognize excess tax benefits regardless of whether the benefit reduces taxes payables in the current period. Excess tax benefits should be classified along with other income tax cash flows as an operating activity. In regard to forfeitures, the entity may make an entity-wide accounting policy election to either estimate the number of awards that are expected to vest or account for forfeitures when they occur. ASU 2016-09 is effective for fiscal years beginning after December 15, 2016, including interim periods within that reporting period. Early adoption is permitted. We have determined the adoption of this new pronouncement will not have a material impact on our consolidated financial statements and related disclosures.
In February 2016, the FASB issued ASU No. 2016-02, "Leases (Topic 842)" ("ASU 2016-02"), which increases the transparency and comparability about leases among entities. The new guidance requires lessees to recognize a lease liability and a corresponding lease asset for operating leases with lease terms greater than 12 months. It also requires additional disclosures about leasing arrangements to help users of financial statements better understand the amount, timing, and uncertainty of cash flows arising from leases. ASU 2016-02 becomes effective for interim and annual periods beginning after December 15, 2018, and requires a modified retrospective approach to adoption. Early adoption is permitted. We plan to engage a third party to assist in evaluating the impact of this new standard on our consolidated financial statements and related disclosures.
In May 2014, the FASB issued ASU No. 2014-09, “Revenue from Contracts with Customers (Topic 606)” ("ASU 2014-09"), which provides guidance for revenue recognition and which supersedes nearly all existing revenue recognition guidance under ASU 2014-09. This ASU provides guidance that an entity should recognize revenue to depict the transfer of promised goods or services to customers in an amount that reflects the consideration to which the entity expects to be entitled in exchange for those goods and services. Additionally, the guidance permits two methods of transition upon adoption: full retrospective and modified retrospective. Under the full retrospective method, the standard would be applied to each prior reporting period presented. Under the modified retrospective method, the cumulative effect of applying the standard would be recognized at the date of initial application. In August 2015, the FASB issued final revised guidance that defers the effective date of the revenue recognition standard to be for annual and interim periods beginning after December 15, 2017, with early adoption permitted for interim and annual reporting periods beginning after December 15, 2016. We plan to engage a third party to assist in evaluating the impact of this new standard on our consolidated financial statements and related disclosures.
Off-Balance Sheet Arrangements
We are often party to certain transactions that require off-balance sheet arrangements such as performance bonds, guarantees, operating leases for equipment, and bank guarantees that are not reflected in our consolidated balance sheets. These arrangements are made in our normal course of business and they are not reasonably likely to have a current or future material adverse effect on our financial condition, results of operations, liquidity, or cash flows.
Reorganization Items
The Debtors have incurred and will continue to incur significant costs associated with the reorganization and the chapter 11 cases. These costs, which are being expensed as incurred, significantly impact our results of operations. Reorganization items include professional fees and other expenses incurred in the chapter 11 cases. For the year ended December 31, 2016, reorganization items totaled $7.5 million. See Note 2 to the consolidated financial statements for the year ended December 31, 2016 included herein.
50
Item 7A. | Quantitative and Qualitative Disclosures About Market Risk |
In addition to the risks inherent in our operations, we are exposed to financial, market, and economic risks. Changes in interest rates may result in changes in the fair market value of our financial instruments, interest income, and interest expense. Our financial instruments that are exposed to interest rate risk are long-term borrowings. The following discussion provides information regarding our exposure to the risks of changing interest rates and fluctuating currency exchange rates.
Our primary debt obligations are the outstanding 9% Senior Notes and any borrowings under our revolving credit facility. Changes in interest rates do not affect interest expense incurred on our 9% Senior Notes as such notes bear interest at a fixed rate. However, changes in interest rates would affect their fair values. In general, the fair market value of debt with a fixed interest rate will increase as interest rates fall. Conversely, the fair market value of debt will decrease as interest rates rise. A hypothetical change in interest rates of 10% relative to interest rates as of December 31, 2016, would have no impact on our interest expense for the 9% Senior Notes.
Our revolving credit facility has a variable interest rate and, therefore, is subject to interest rate risk. As of December 31, 2016, we had borrowed $15 million on this facility. A 100 basis point increase in interest rates on our variable rate debt would result in additional annual interest expense in the amount of $0.2 million.
We expect we will eliminate approximately $280.0 million in principal amount of the 9% Senior Notes plus accrued interest thereon on the effective date of the Plan. In addition, on the effective date of the Plan, certain holders of the 9% Senior Notes will make available to the reorganized Debtors the Exit Facility. Furthermore, on the effective date of the Plan, the Loan Agreement will be terminated and the New Regions Facility will be entered into covering the outstanding letters of credit and Bank Product Obligations (as defined in the Loan Agreement) under the Loan Agreement. However, there can be no assurance that the effectiveness of the Plan will occur on April 13, 2017, or at all.
We have not entered into any derivative financial instrument transactions to manage or reduce market risk or for speculative purposes.
51
Item 8. | Consolidated Financial Statements and Supplementary Data |
Index to Financial Statements
Forbes Energy Services Ltd. and Subsidiaries (a/k/a The “Forbes Group”)
Consolidated Financial Statements
Page | |
52
Report of Independent Registered Public Accounting Firm
Board of Directors and Shareholders
Forbes Energy Services, Ltd.
Alice, Texas
We have audited the accompanying consolidated balance sheets of Forbes Energy Services Ltd. as of December 31, 2016 and 2015 and the related consolidated statements of operations, changes in shareholders’ equity, and cash flows for each of the three years in the period ended December 31, 2016. These financial statements are the responsibility of the Company’s management. Our responsibility is to express an opinion on these financial statements based on our audits.
We conducted our audits in accordance with the standards of the Public Company Accounting Oversight Board (United States). Those standards require that we plan and perform the audit to obtain reasonable assurance about whether the financial statements are free of material misstatement. The Company is not required to have, nor were we engaged to perform, an audit of its internal control over financial reporting. Our audits included consideration of internal control over financial reporting as a basis for designing audit procedures that are appropriate in the circumstances, but not for the purpose of expressing an opinion on the effectiveness of the Company’s internal control over financial reporting. Accordingly, we express no such opinion. An audit includes examining, on a test basis, evidence supporting the amounts and disclosures in the financial statements, assessing the accounting principles used and significant estimates made by management, as well as evaluating the overall financial statement presentation. We believe that our audits provide a reasonable basis for our opinion.
In our opinion, the consolidated financial statements referred to above present fairly, in all material respects, the financial position of Forbes Energy Services, Ltd. at December 31, 2016 and 2015, and the results of its operations and its cash flows for each of the three years in the period ended December 31, 2016, in conformity with accounting principles generally accepted in the United States of America.
The accompanying consolidated financial statements have been prepared assuming that the Company will continue as a going concern. As described in Notes 2 and 3 to the consolidated financial statements, on January 22, 2017, the Company and certain of its subsidiaries filed voluntary petitions for reorganization under chapter 11 of the United States Bankruptcy Code, which raises substantial doubt about its ability to continue as a going concern. Management’s plans in regard to these matters are also described in Notes 2 and 3. The consolidated financial statements do not include any adjustments that might result from the outcome of this uncertainty.
/S/ BDO USA, LLP
Houston, Texas
March 31, 2017
53
Forbes Energy Services Ltd. and Subsidiaries (a/k/a the “Forbes Group”)
Consolidated Balance Sheets
(in thousands, except per share amounts)
December 31, | |||||||
2016 | 2015 | ||||||
Assets | |||||||
Current assets | |||||||
Cash and cash equivalents | $ | 20,437 | $ | 74,611 | |||
Restricted cash | 27,563 | — | |||||
Accounts receivable - trade, net | 16,962 | 26,486 | |||||
Accounts receivable - other | 290 | 1,216 | |||||
Prepaid expenses | 7,957 | 8,386 | |||||
Other current assets | 821 | 1,100 | |||||
Total current assets | 74,030 | 111,799 | |||||
Property and equipment, net | 233,362 | 277,029 | |||||
Intangible assets, net | 3,220 | 19,431 | |||||
Restricted cash | — | 51 | |||||
Other assets | 2,269 | 844 | |||||
Total assets | $ | 312,881 | $ | 409,154 | |||
Liabilities and Shareholders’ Equity (Deficit) | |||||||
Current liabilities | |||||||
Current portions of long-term debt | $ | 298,932 | $ | 25,243 | |||
Accounts payable - trade | 4,505 | 8,995 | |||||
Accounts payable - related parties | 18 | 8 | |||||
Accrued dividends | — | 61 | |||||
Accrued interest payable | 26,578 | 1,401 | |||||
Accrued expenses | 8,740 | 10,726 | |||||
Total current liabilities | 338,773 | 46,434 | |||||
Long-term debt, net of current portion | 240 | 279,798 | |||||
Deferred tax liability | 1,096 | 899 | |||||
Total liabilities | 340,109 | 327,131 | |||||
Temporary equity | |||||||
Series B senior convertible preferred stock (redemption value of $15.6 million) | 15,298 | 14,644 | |||||
Shareholders’ equity (deficit) | |||||||
Common stock, $.04 par value, 112,500 shares authorized, 22,215 and 22,210 shares issued and outstanding at December 31, 2016 and 2015, respectively | 889 | 889 | |||||
Additional paid-in capital | 193,477 | 194,253 | |||||
Accumulated deficit | (236,892 | ) | (127,763 | ) | |||
Total shareholders’ equity (deficit) | (42,526 | ) | 67,379 | ||||
Total liabilities and shareholders’ equity (deficit) | $ | 312,881 | $ | 409,154 | |||
The accompanying notes are an integral part of these consolidated financial statements.
54
Forbes Energy Services Ltd. and Subsidiaries (a/k/a the “Forbes Group”)
Consolidated Statements of Operations
(in thousands except, per share amounts)
Year Ended December 31, | |||||||||||
2016 | 2015 | 2014 | |||||||||
Revenues | |||||||||||
Well servicing | $ | 70,921 | $ | 150,949 | $ | 285,338 | |||||
Fluid logistics | 45,284 | 93,158 | 163,940 | ||||||||
Total revenues | 116,205 | 244,107 | 449,278 | ||||||||
Expenses | |||||||||||
Well servicing | 61,279 | 117,514 | 213,278 | ||||||||
Fluid logistics | 42,744 | 74,905 | 127,775 | ||||||||
General and administrative | 18,832 | 31,591 | 36,428 | ||||||||
Depreciation and amortization | 52,374 | 55,034 | 54,959 | ||||||||
Loss on impairment of assets | 14,537 | — | — | ||||||||
Reorganization costs | 7,548 | — | — | ||||||||
Total expenses | 197,314 | 279,044 | 432,440 | ||||||||
Operating (loss) income | (81,109 | ) | (34,937 | ) | 16,838 | ||||||
Other income (expense) | |||||||||||
Interest income | 31 | 211 | 9 | ||||||||
Interest expense | (27,879 | ) | (27,962 | ) | (28,228 | ) | |||||
Pre-tax loss | (108,957 | ) | (62,688 | ) | (11,381 | ) | |||||
Income tax expense (benefit) | 172 | (16,614 | ) | (3,060 | ) | ||||||
Net loss | (109,129 | ) | (46,074 | ) | (8,321 | ) | |||||
Preferred stock dividends | (776 | ) | (776 | ) | (776 | ) | |||||
Net loss attributable to common shareholders | $ | (109,905 | ) | $ | (46,850 | ) | $ | (9,097 | ) | ||
Loss per share of common stock | |||||||||||
Basic and diluted | $ | (4.95 | ) | $ | (2.12 | ) | $ | (0.42 | ) | ||
Weighted average number of shares of common stock outstanding | |||||||||||
Basic and diluted | 22,214 | 22,071 | 21,749 | ||||||||
The accompanying notes are an integral part of these consolidated financial statements.
55
Forbes Energy Services Ltd. and Subsidiaries (a/k/a the “Forbes Group”)
Consolidated Statements of Changes in Shareholders’ Equity
(in thousands)
Temporary Equity | Permanent Equity | ||||||||||||||||||||||||
Preferred Stock | Common Stock | Additional Paid-In Capital | Accumulated Deficit | Total Shareholders’ Equity (Deficit) | |||||||||||||||||||||
Shares | Amount | Shares | Amount | ||||||||||||||||||||||
Balance: | |||||||||||||||||||||||||
December 31, 2013 | 588 | $ | 14,560 | 21,474 | $ | 859 | $ | 193,527 | $ | (73,368 | ) | $ | 121,018 | ||||||||||||
Share-based compensation | — | — | — | — | 1,324 | — | 1,324 | ||||||||||||||||||
Net loss | — | — | — | — | — | (8,321 | ) | (8,321 | ) | ||||||||||||||||
Common shares issued under stock plan: | |||||||||||||||||||||||||
Issuance of restricted stock | — | — | 371 | 15 | 629 | — | 644 | ||||||||||||||||||
Preferred stock dividends and accretion | — | 42 | — | — | (776 | ) | — | (776 | ) | ||||||||||||||||
Balance: | |||||||||||||||||||||||||
December 31, 2014 | 588 | 14,602 | 21,845 | 874 | 194,704 | (81,689 | ) | 113,889 | |||||||||||||||||
Net loss | — | — | — | — | — | (46,074 | ) | (46,074 | ) | ||||||||||||||||
Common shares issued under stock plan: | |||||||||||||||||||||||||
Issuance of restricted stock | — | — | 365 | 15 | 325 | — | 340 | ||||||||||||||||||
Preferred stock dividends and accretion | — | 42 | — | — | (776 | ) | — | (776 | ) | ||||||||||||||||
Balance: | |||||||||||||||||||||||||
December 31, 2015 | 588 | 14,644 | 22,210 | 889 | 194,253 | (127,763 | ) | 67,379 | |||||||||||||||||
Net loss | — | — | — | — | — | (109,129 | ) | (109,129 | ) | ||||||||||||||||
Common shares issued under stock plan: | |||||||||||||||||||||||||
Issuance of restricted stock | — | — | 5 | — | — | — | — | ||||||||||||||||||
Preferred stock dividends and accretion | — | 654 | — | — | (776 | ) | — | (776 | ) | ||||||||||||||||
Balance: | |||||||||||||||||||||||||
December 31, 2016 | 588 | $ | 15,298 | 22,215 | $ | 889 | $ | 193,477 | $ | (236,892 | ) | $ | (42,526 | ) | |||||||||||
The accompanying notes are an integral part of these consolidated financial statements.
56
Forbes Energy Services Ltd. and Subsidiaries (a/k/a the “Forbes Group”)
Consolidated Statements of Cash Flows
(in thousands)
Years Ended December 31, | |||||||||||
2016 | 2015 | 2014 | |||||||||
Cash flows from operating activities: | |||||||||||
Net loss | $ | (109,129 | ) | $ | (46,074 | ) | $ | (8,321 | ) | ||
Adjustments to reconcile net loss to net cash (used in) provided by operating activities: | |||||||||||
Depreciation expense | 50,675 | 52,173 | 52,098 | ||||||||
Amortization expense | 1,699 | 2,861 | 2,861 | ||||||||
Share-based compensation | (298 | ) | 442 | 3,264 | |||||||
Deferred tax expense (benefit) | 197 | (16,754 | ) | (3,957 | ) | ||||||
Gain on disposal of assets, net | (449 | ) | (705 | ) | (684 | ) | |||||
Loss on impairment of assets | 14,537 | — | — | ||||||||
Bad debt expense | 2,230 | 1,409 | 967 | ||||||||
Amortization of deferred financing cost | 1,260 | 1,455 | 1,807 | ||||||||
Changes in operating assets and liabilities: | |||||||||||
Accounts receivable | 8,220 | 54,989 | (2,296 | ) | |||||||
Accounts receivable - related parties | — | 342 | (157 | ) | |||||||
Prepaid expenses and other assets | (2,099 | ) | 3,320 | 4,225 | |||||||
Accounts payable - trade | (4,274 | ) | (8,679 | ) | (5,514 | ) | |||||
Accounts payable - related parties | 10 | (178 | ) | (373 | ) | ||||||
Dividends payable | (61 | ) | — | — | |||||||
Accrued expenses | (1,613 | ) | (8,056 | ) | 3,327 | ||||||
Accrued interest payable | 25,177 | 37 | (3 | ) | |||||||
Net cash (used in) provided by operating activities | (13,918 | ) | 36,582 | 47,244 | |||||||
Cash flows from investing activities: | |||||||||||
Purchases of property and equipment | (8,917 | ) | (9,568 | ) | (37,877 | ) | |||||
Proceeds from sale of property and equipment | 2,142 | 1,554 | 5,431 | ||||||||
Insurance proceeds | — | 1,262 | — | ||||||||
Restricted cash | — | 1,330 | (1 | ) | |||||||
Net cash used in investing activities | (6,775 | ) | (5,422 | ) | (32,447 | ) | |||||
Cash flows from financing activities: | |||||||||||
Restricted cash | (27,512 | ) | — | — | |||||||
Borrowings on debt | — | 15,000 | — | ||||||||
Repayments of debt | (5,722 | ) | (5,564 | ) | (5,083 | ) | |||||
Dividends paid on Series B Senior Convertible Preferred Stock | (123 | ) | (735 | ) | (735 | ) | |||||
Payments of tax withholding obligations related to restricted stock | (124 | ) | (168 | ) | (470 | ) | |||||
Net cash (used in) provided by financing activities | (33,481 | ) | 8,533 | (6,288 | ) | ||||||
Net (decrease) increase in cash and cash equivalents | (54,174 | ) | 39,693 | 8,509 | |||||||
Cash and cash equivalents: | |||||||||||
Beginning of year | 74,611 | 34,918 | 26,409 | ||||||||
End of year | $ | 20,437 | $ | 74,611 | $ | 34,918 | |||||
The accompanying notes are an integral part of these consolidated financial statements.
57
Forbes Energy Services Ltd. and Subsidiaries (a/k/a the “Forbes Group”)
Notes to Consolidated Financial Statements
1. Organization and Nature of Operations
Nature of Business
Forbes Energy Services Ltd., or FES Ltd., is an independent oilfield services contractor that provides well site services to oil and natural gas drilling and producing companies to help develop and enhance the production of oil and natural gas. These services include fluid hauling, fluid disposal, well maintenance, completion services, workovers and recompletions, plugging and abandonment, and tubing testing. The Company's operations are concentrated in the major onshore oil and natural gas producing regions of Texas, with an additional location in Pennsylvania. The Company believes that its broad range of services, which extends from initial drilling, through production, to eventual abandonment, is fundamental to establishing and maintaining the flow of oil and natural gas throughout the life cycle of our customers’ wells. The Company's headquarters and executive offices are located at 3000 South Business Highway 281, Alice, Texas 78332. The Company can be reached at (361) 664-0549.
As used in these consolidated financial statements, the “Company” and the “Forbes Group” mean FES Ltd. and its subsidiaries, except as otherwise indicated.
2. Chapter 11 Proceedings
On January 22, 2017, FES Ltd., Forbes Energy Services LLC, or FES, C.C. Forbes, LLC, or CCF, TX Energy Services, LLC, or TES, and Forbes Energy International, LLC, FEI, or, collectively, the Debtors, filed voluntary petitions, or the Petitions, for reorganization under chapter 11 of the United States Bankruptcy Code, or the Bankruptcy Code, in the Bankruptcy Court pursuant to the terms of a Restructuring Support Agreement (as defined below) that contemplates the reorganization of the Debtors pursuant to the Debtors' prepackaged plan of reorganization, or the Plan. The Debtors will continue to operate their businesses as “debtors in possession” under the jurisdiction of the Bankruptcy Court and in accordance with the applicable provisions of the Bankruptcy Code and orders of the Bankruptcy Court. The Bankruptcy Court granted all first day motions filed by the Debtors allowing the Debtors to operate their businesses in the ordinary course throughout the pendency of the chapter 11 cases. The first day motions included, among other things, a cash collateral motion, a motion maintaining the Company's existing cash management system and motions permitting certain vendor payments, wage payments and tax payments in the ordinary course of business. Subject to certain exceptions under the Bankruptcy Code, the chapter 11 cases automatically stayed most judicial or administrative actions against the Debtors or their property to recover, collect, or secure a prepetition claim. This prohibits, for example, the Company’s lenders or note holders from pursuing claims for defaults under its debt agreements during the pendency of the chapter 11 cases. On March 29, 2017, the Bankruptcy Court entered an order confirming the Plan. The Company expects the consummation of the Plan to become effective on or about April 13, 2017; however, there can be no assurance that the effectiveness of the Plan will occur on such date, or at all.
Restructuring Support Agreement
Prior to filing the Petitions, on December 21, 2016, the Debtors entered into a restructuring support agreement, or the Restructuring Support Agreement, with certain holders, or the Supporting Noteholders, of FES Ltd.’s 9% senior unsecured notes due 2019, or the 9% Senior Notes, representing an aggregate of approximately 65.4% in principal amount of the 9% Senior Notes. The Restructuring Support Agreement contemplates the financial reorganization of the Debtors, or the Reorganization, pursuant to the Plan. Pursuant to the Restructuring Support Agreement, the Supporting Noteholders agreed to, among other things, support the Reorganization pursuant to the terms of the Plan. On December 22, 2016, the Debtors commenced a solicitation of votes to accept or reject the Plan from the holders of the 9% Senior Notes. Holders of approximately 87.14% in principal amount of the 9% Senior Notes voted in favor of the Plan. Of the holders of the 9% Senior Notes that voted to accept or reject the Plan, 93.75% of such holders voted to accept the Plan, which represents 99.46% in principal amount of the 9% Senior Notes held by such holders.
The Plan
The Plan, which is subject to approval of the Bankruptcy Court, anticipates that, among other things, on the effective date of the Plan:
• | All existing Equity Interests (as defined in the Plan and which include FES Ltd.’s common stock, FES Ltd.’s preferred stock, awards under our 2012 Incentive Compensation Plan, or the Compensation Plan, and the preferred stock purchase rights under the Rights Agreement dated as of May 19, 2008 and subsequently amended |
58
on July 8, 2013, or the Rights Agreement, between us and CIBC Mellon Trust Company, as rights agent) in FES Ltd. will be extinguished without recovery;
• | The 9% Senior Notes will be canceled and each holder of the 9% Senior Notes will receive such holder’s pro rata share of (i) $20 million in cash and (ii) 100% of the new common stock of reorganized FES Ltd., subject to dilution only as a result of the shares of new common stock of reorganized FES Ltd. issued or available for issuance in connection with a proposed management incentive plan, or the Management Incentive Plan; |
• | Certain holders of the 9% Senior Notes will make available to the reorganized Debtors a $50 million new first lien term loan facility, or the Exit Facility, which will be backstopped by certain Supporting Noteholders; |
• | Reorganized FES Ltd. will adopt and implement the Management Incentive Plan, which will provide for the issuance of restricted stock units covering shares of common stock of reorganized FES Ltd. to the officers and other key employees of the reorganized Debtors in an amount up to 12.5% of the sum of (i) the number of shares of the common stock of reorganized FES Ltd. issued to the holders of the 9% Senior Notes and (ii) the number of shares of common stock of reorganized FES Ltd. issued or available for issuance under the Management Incentive Plan; |
• | The Debtors’ loan and security agreement governing their revolving credit facility, or the Loan Agreement, dated as of September 9, 2011 and subsequently amended, with Regions Bank, or Regions, as the sole lender party thereto, or the Lender, will be terminated and a new letter of credit facility will be entered into with Regions, or the New Regions Facility, on the Plan’s effective date covering the letters of credit and Bank Product Obligations (as defined in the Loan Agreement) outstanding under the Loan Agreement; |
• | The Lender, in full satisfaction and settlement of its claims against the Debtors, will receive, as applicable, (i) cash to satisfy all outstanding obligations with respect to the Revolving Advances (as defined in the Loan Agreement), including, without limitation, all outstanding Revolving Advances and all interest, fees, and other charges due and payable under the Loan Agreement relating to the Revolving Advances, and (ii) as to the Issuer and Bank Product Provider (as each term is defined in the Loan Agreement), continue to hold the cash pledged by the Debtors to collateralize all outstanding letters of credit and Bank Product Obligations under the Loan Agreement that will be covered by the New Regions Facility; and |
• | Holders of allowed creditor claims, aside from holders of the 9% Senior Notes, will either receive, on account of such claims, payment in full in cash or otherwise have their rights reinstated under the Bankruptcy Code. |
Assuming implementation of the Plan, the Company expects that it will eliminate approximately $280.0 million in principal amount of the 9% Senior Notes plus accrued interest thereon.
Defaults under Outstanding Debt Instruments
FES Ltd.’s failure to make the semi-annual interest payments on the 9% Senior Notes on June 15, 2016 and December 31, 2016 or, collectively, the Missed Interest Payments, after the cure periods provided for in the indenture governing the 9% Senior Notes, or the Senior Indenture, other events of default resulting from technical breaches of covenants under the Senior Indenture and the Loan Agreement and the filing of the Petitions on January 22, 2017 or, collectively, the Debt Instrument Defaults, would have resulted in all outstanding indebtedness due under the Senior Indenture and the Loan Agreement immediately becoming due and payable. However, pursuant to (i) the forbearance agreement related to the Senior Indenture entered into July 15, 2016, as subsequently amended, or the Indenture Forbearance Agreement, by and among the Debtors and the Supporting Noteholders and (ii) the forbearance agreement related to the Loan Agreement entered into July 15, 2016, as subsequently amended and restated, or the Loan Forbearance Agreement, by and among the Debtors, Regions, as agent, and the Lender, the Supporting Noteholders, Regions and the Lender agreed to forbear from exercising default remedies or accelerating any indebtedness under their respective debt instrument resulting from the Debt Instrument Defaults while they worked with the Debtors to reach an agreement on the Reorganization. Additionally, any efforts to enforce such payment obligations were automatically stayed as a result of the filing of the Petitions, and the creditors' rights of enforcement in respect of the Senior Indenture and the Loan Agreement are subject to the applicable provisions of the Bankruptcy Code and orders of the Bankruptcy Court.
59
3. Going Concern
The significant decline in oil and natural gas prices from the fourth quarter of 2014 through 2015 and 2016 resulted in reduced revenue and cash flows and negatively impacted the Company’s liquidity position. Additionally, the level of the Company’s indebtedness and the depressed oil and natural gas prices presented challenges related to the Company’s ability to comply with the covenants in the agreements governing its indebtedness. In order to address these issues, the Company worked with financial and legal advisors throughout 2016 and structured the Plan to address its liquidity and capital structure. In connection with the Company's restructuring efforts, the Debtors filed the Petitions seeking relief under the provisions of chapter 11 of the Bankruptcy Code. See Note 2 Chapter 11 Proceedings. On March 29, 2017, the Bankruptcy Court entered an order confirming the Plan. The Debtors expect the consummation of the Plan to become effective on or about April 13, 2017. On the effective date of the Plan, the Company expects that it will eliminate approximately $280.0 million in principal amount of Senior Notes, plus accrued interest thereon.
While the Debtors expect the consummation of the Plan to become effective on or about April 13, 2017, there can be no assurance that the effectiveness of the Plan will occur on such date, or at all. The uncertainty surrounding the Debtors’ chapter 11 cases raises substantial doubt about the Company’s ability to continue as a going concern.
The accompanying consolidated financial statements have been prepared assuming the Company will continue as a going concern, which contemplates continuity of operations, realization of assets and the satisfaction of liabilities in the normal course of business for the twelve month period following the date of these consolidated financial statements. As such, the accompanying consolidated financial statements do not include any adjustments relating to the recoverability and classification of assets and their carrying amounts, or the amount and classification of liabilities that may result from the outcome of this uncertainty.
4. Risk and Uncertainties
As an independent oilfield services contractor that provides a broad range of drilling-related and production-related services to oil and natural gas companies, primarily onshore in Texas, the Company's revenue, profitability, cash flows and future rate of growth are substantially dependent on the Company's ability to (1) maintain adequate equipment utilization, (2) maintain adequate pricing for the services the Company provides, and (3) maintain a trained work force. Failure to do so could adversely affect the Company's financial position, results of operations, and cash flows.
Because the Company's revenues are generated primarily from customers who are subject to the same factors generally impacting the oil and natural gas industry, its operations are also susceptible to market volatility resulting from economic, seasonal and cyclical, weather related, or other factors related to such industry. Changes in the level of operating and capital spending in the industry, decreases in oil and natural gas prices, or industry perception about future oil and natural gas prices could materially decrease the demand for the Company's services, adversely affecting its financial position, results of operations, and cash flows.
5. Summary of Significant Accounting Policies
Reclassification
Certain prior year amounts have been reclassified to conform to the current year presentation with no material effect on the consolidated financial statements.
Principles of Consolidation
The Company’s consolidated financial statements include the accounts of FES Ltd. and all of its wholly owned, direct and indirect subsidiaries. All significant intercompany balances and transactions have been eliminated in consolidation.
Use of Estimates
The preparation of consolidated financial statements in conformity with accounting principles generally accepted in the United States of America, or GAAP, requires management to make estimates and assumptions that affect the reported amounts of assets and liabilities and disclosure of contingent assets and liabilities at the date of the consolidated balance sheets and the reported amounts of revenues and expenses during the reporting period. Actual results could materially differ from those estimates.
60
Revenue Recognition
Well Servicing –Well servicing consists primarily of maintenance services, workover services, completion services, plugging and abandonment services, and tubing testing. The Company prices well servicing by the hour of service performed, or on occasion, bid/turnkey pricing.
Fluid Logistics – Fluid logistics consists primarily of the sale, transportation, storage, and disposal of fluids used in drilling, production, and maintenance of oil and natural gas wells. The Company prices fluid logistics services by the job, by the hour, or by the quantities sold, disposed, or hauled.
The Company recognizes revenue when services are performed, collection of the relevant receivables is probable, persuasive evidence of an arrangement exists, and the price is fixed or determinable. Revenues are presented net of any sales taxes collected by the Company from its customers that are remitted to governmental authorities.
Cash and Cash Equivalents
The Company considers all highly liquid investments purchased with an original maturity of three months or less to be cash equivalents.
Accounts Receivable and Allowance for Doubtful Accounts
Accounts receivable are based on earned revenues. The Company provides an allowance for doubtful accounts, which is based on a review of outstanding receivables, historical collection information, and existing economic conditions. Provisions for doubtful accounts are recorded when it becomes evident that the customer will not be likely to make the required payments at either contractual due dates or in the future. The accounts are written off against the provision when it becomes evident that the account is not collectible.
The following reflects changes in the Company's allowance for doubtful accounts:
Balance as of January 1, 2014 | $ | 3,952 | |
Provision | 967 | ||
Bad debt write-off | (880 | ) | |
Balance as of December 31, 2014 | 4,039 | ||
Provision | 1,409 | ||
Bad debt write-off | (3,644 | ) | |
Balance as of December 31, 2015 | 1,804 | ||
Provision | 1,873 | ||
Bad debt write-off | (2,320 | ) | |
Balance as of December 31, 2016 | $ | 1,357 | |
Property and Equipment
Property and equipment are recorded at cost. Improvements or betterments that extend the useful life of the assets are capitalized. Expenditures for maintenance and repairs are charged to expense when incurred. The costs of assets retired or otherwise disposed of and the related accumulated depreciation are eliminated from the accounts in the period of disposal. Gains or losses resulting from property disposals are credited or charged to operations. Depreciation is recorded using the straight-line method over the estimated useful lives of the assets. Depreciation expense was $50.7 million, $52.2 million, and $52.1 million for the years ended December 31, 2016, 2015, and 2014, respectively.
Impairment
Long-lived assets consist of property and equipment and intangible assets. The Company makes judgments and estimates regarding the carrying value of these assets, including amounts to be capitalized, estimated useful lives, depreciation and amortization methods to be applied, and possible impairment. The Company evaluates its long-lived assets whenever events and changes in circumstances indicate the carrying amount of its net assets may not be recoverable due to various external or internal factors.
When an indicator of possible impairment exists, the Company uses estimated future undiscounted cash flows to assess recoverability of its long-lived assets. These cash flow projections require the Company to make judgments regarding long-
61
term forecasts of future revenue and costs related to the assets subject to review. These forecasts include assumptions related to the rates the Company bills its customers, equipment utilization, equipment additions, staffing levels, pay rates, and other expenses. These forecasts also require assumptions about demand for the Company's products and services, future market conditions, and technological developments. These assumptions considered the drop in oil and natural gas prices over the last two and one half years and projected future pricing trends.
Impairment is indicated when future cash flows are less than the carrying amount of the assets. An impairment loss would be recorded in the period in which it is determined the carrying amount is not recoverable. The impairment loss is the amount by which the carrying amount exceeds the fair market value.
During the second quarter of 2016, we determined that the continued decline in revenues and industry-wide slowdown related to oil prices was other than temporary and was an impairment indicator. Therefore, we assessed all of our long-lived assets for impairment, which resulted in the carrying amounts of long-lived assets associated with our fluid logistics segment in exceeding the recoverable amounts based upon the undiscounted cash flow analysis. As a result, we hired an independent consulting firm to measure the fair values of the long-lived assets associated with our fluid logistics segment. Based on the fair value analysis, the fair values of certain intangible assets were determined to be less than their carrying amounts; therefore, an impairment loss of $14.5 million was recorded as a component of operating expenses based on the amount that the carrying value exceeded fair value. Fair value of the intangible assets was determined utilizing a combination of the income, cost and market approaches. Specific intangible assets affected were customer relationships and other intangibles. We did not experience any additional triggering events in the third or fourth quarters of 2016.
Volatility in the oil and natural gas industry, which is driven by factors over which the Company has no control, could affect the fair market value of the Company's equipment fleet and cause the Company to conclude at a future date that additional impairment is evident and may trigger a write-down of the Company's assets for accounting purposes, which could have a material adverse impact on the Company's financial position and results of operations.
Restricted Cash
Restricted cash serves as collateral for loans and certain outstanding letters of credit and the Company's corporate credit card program. The Company had restricted cash balances of $27.6 million and $51.3 thousand at December 31, 2016 and 2015, respectively.
Intangible Assets
The Company's major classes of intangible assets consisted of its customer relationships, trade names, safety training program and dispatch software in 2015. Due to the Company recording an impairment loss of $14.5 million in the second quarter of 2016, the Company's only remaining class of intangible assets at December 31, 2016, was its trade names.
Deferred Financing Costs
The Company amortizes deferred financing costs over the period of the agreement governing the 9% Senior Notes and the revolving credit facility on an effective interest basis, as a component of interest expense. Amortization of deferred financing costs was $1.3 million, $1.5 million, and $1.8 million for the years ended December 31, 2016, 2015, and 2014, respectively.
As a result of the adoption of Accounting Standards Update ("ASU") 2015-03, “Simplifying the Presentation of Debt Issuance Costs” on January 1, 2016, the Company recorded debt issuance costs of $2.3 million and retrospectively recorded debt issuance costs of $3.3 million as a reduction in the carrying amount of the related 9% Senior Notes of $280.0 million as of December 31, 2016 and December 31, 2015, respectively.
Share-Based Compensation
The Company measures share-based compensation cost as of the grant date based on the estimated fair value of the award less an estimated rate for pre-vesting forfeitures, and recognizes compensation expense on a straight-line basis over the vesting period. The Company classifies stock awards as either an equity award or a liability award. Equity classified awards are valued as of the grant date using market price. Liability classified awards are re-measured at fair value at the end of each reporting date until settled.
Income Taxes
The Company recognizes deferred tax assets and liabilities for the future tax consequences attributable to differences between the financial statement carrying amounts of existing assets and liabilities and their respective tax bases. Deferred tax assets and liabilities are measured using statutory tax rates expected to apply to taxable income in the years in which those
62
temporary differences are expected to be recovered or settled. The effect on deferred tax assets and liabilities of a change in tax rate is recognized in the period that includes the statutory enactment date. Valuation allowances are established to reduce deferred tax assets when it is more likely than not that some portion or all of the deferred tax assets will not be realized. The Company records uncertain tax positions at their net recognizable amount, based on the amount that management deems is more likely than not to be sustained upon ultimate settlement with tax authorities.
The Company’s policy for recording interest and penalties associated with uncertain tax positions is to record such items as a component of tax expense. The Company has not recognized any material uncertain tax positions for the years ended December 31, 2016, 2015, and 2014.
Earnings per Share (EPS)
Basic EPS is calculated by dividing the net income (loss) attributable to common shareholders of the Company by the weighted average number of shares of common stock outstanding during the period. Diluted EPS is determined by adjusting the profit or loss attributable to common shareholders and the weighted average number of shares of common stock outstanding adjusted for the effects of all dilutive potential common shares comprised of options granted, restricted stock, and restricted stock units. Preferred stock may participate in undistributed earnings with common stock. Such securities are deemed to not be participating in losses if there is no obligation to fund such losses. The holders of the Company's Series B Senior Convertible Preferred Stock, or the Series B Preferred Stock, would be entitled to share in dividends, on an as-converted basis, if the holders of common stock were to receive dividends in excess of 5% of the then current common stock market price on a cumulative basis over the past twelve months, provided that the holders of the Series B Preferred Stock would only share in that portion of the dividend that exceeds 5%. The Series B Preferred Stock was not deemed to be participating since there were net losses for the years ended December 31, 2016, 2015, and 2014.
Fair Values of Financial Instruments
Fair value is the price that would be received to sell an asset or the amount paid to transfer a liability in an orderly transaction between market participants (an exit price) at the measurement date.
There is a fair value hierarchy that prioritizes the inputs used to measure fair value. The hierarchy gives the highest priority to quoted prices in active markets for identical assets or liabilities (Level 1 measurement) and the lowest priority to unobservable inputs (Level 3 measurement). The Company classifies fair value balances based on the observability of those inputs. The three levels of the fair value hierarchy are as follows:
• | Level 1 - Quoted prices in active markets for identical assets or liabilities that the Company has the ability to access. Active markets are those in which transactions for the asset or liability occur in sufficient frequency and volume to provide pricing information on an ongoing basis. |
• | Level 2 - Inputs are other than quoted prices in active markets included in Level 1, which are either directly or indirectly observable. These inputs are either directly observable in the marketplace or indirectly observable through corroboration with market data for substantially the full contractual term of the asset or liability being measured. |
• | Level 3 - Inputs reflect management’s best estimate of what market participants would use in pricing the asset or liability at the measurement date. Consideration is given to the risk inherent in the valuation technique and the risk inherent in the inputs to the model. |
In valuing certain assets and liabilities, the inputs used to measure fair value may fall into different levels of the fair value hierarchy. For disclosure purposes, assets and liabilities are classified in their entirety in the fair value hierarchy level based on the lowest level of input that is significant to the overall fair value measurement. The Company’s assessment of the significance of a particular input to the fair value measurement requires judgment and may affect the placement within the fair value hierarchy levels.
The carrying amounts of cash and cash equivalents, accounts receivable-trade, accounts receivable-other, accounts payable-trade, accounts payable-related parties, and insurance notes approximate fair value because of the short maturity of these instruments.
63
The Company has assets measured and recorded at fair value on a non-recurring basis. These nonfinancial assets include property, plant and equipment and intangible assets for which fair value is calculated in connection with impairment testing. These fair value calculations incorporate a market and a cost approach and the inputs include projected revenue, costs, equipment utilization and other assumptions. Given the unobservable inputs, these fair value measurements are classified as Level 3.
December 31, 2016 | December 31, 2015 | |||||||||||||||
Carrying Amount | Fair Value | Carrying Amount | Fair Value | |||||||||||||
(dollars in thousands) | ||||||||||||||||
9% Senior Notes | $ | 277,662 | $ | 98,570 | $ | 276,727 | $ | 130,062 | ||||||||
The fair value of the Company's 9% Senior Notes is based on dealer quoted market prices at December 31, 2016 and 2015, and is considered Level 1 within the fair value hierarchy.
Environmental
The Company is subject to extensive federal, state, and local environmental laws and regulations. These laws, which are constantly changing, regulate the discharge of materials into the environment and may require the Company to remove or mitigate the adverse environmental effects of the disposal or release of petroleum or chemical substances at various sites. Environmental expenditures are expensed or capitalized depending on their future economic benefit. Expenditures that relate to an existing condition caused by past operations and that have no future economic benefits are expensed. Liabilities for expenditures of a non-capital nature are recorded when environmental assessment and/or remediation is probable and the costs can be reasonably estimated. There were no material environmental liabilities for each of the years ended December 31, 2016, 2015, and 2014.
Recent Accounting Pronouncements
In November 2016, Financial Accounting Standards Board, or the FASB, issued ASU No. 2016-18, "Statement of Cash Flows (Topic 230), Restricted Cash," ("ASU 2016-18"). ASU 2016-18 provides guidance on the presentation of restricted cash and restricted cash equivalents in the statement of cash flows. Restricted cash and restricted cash equivalents should be included with cash and cash equivalents when reconciling the beginning-of-period and end-of-period amounts shown on the statement of cash flows. The amendments of ASU 2016-18 should be applied using a retrospective transition method and are effective for reporting periods beginning after December 15, 2017, with early adoption permitted. The Company believes the adoption of this pronouncement will only change the presentation of the statement of cash flows for restricted cash.
In August 2016, the FASB issued ASU 2016-15, “Statement of Cash Flows (Topic 230): Classification of Certain Cash Receipts and Cash Payments” (“ASU 2016-15”). ASU 2016-15 will make eight targeted changes to how cash receipts and cash payments are presented and classified in the statement of cash flows. ASU 2016-15 is effective for fiscal years beginning after December 15, 2017. The new standard will require adoption on a retrospective basis unless it is impracticable to apply, in which case, the new standard would apply the amendments prospectively as of the earliest date practicable. The Company is currently in the process of evaluating the impact of adoption on its consolidated financial statements.
In June 2016, the FASB issued ASU No. 2016-13, 'Financial Instruments-Credit Losses (Topic 326): Measurement of Credit Losses on Financial Instruments ("ASU 2016-13"), which introduces a new impairment model for financial instruments that is based on expected credit losses rather than incurred credit losses. The new impairment model applies to most financial assets, including trade accounts receivable. The amendments in ASU 2016-13 are effective for interim and annual reporting periods beginning after December 15, 2019, with early adoption permitted for annual periods beginning after December 15, 2018. The Company will be evaluating the impact of adopting this pronouncement on its consolidated financial statements.
64
In March 2016, the FASB issued ASU No. 2016-09, "Compensation - Stock Compensation - Improvements to Employee Share-Based Payment Accounting" ("ASU 2016-09"), which involves several aspects of the accounting for share-based payment transactions, including the income tax consequences, classification of awards as either equity or liabilities, and classification on the statement of cash flows. Under the new standard, income tax benefits and deficiencies are to be recognized as income tax expense or benefit in the income statement and the tax effects of exercised or vested awards should be treated as discrete items in the reporting period in which they occur. An entity should also recognize excess tax benefits regardless of whether the benefit reduces taxes payables in the current period. Excess tax benefits should be classified along with other income tax cash flows as an operating activity. In regard to forfeitures, the entity may make an entity-wide accounting policy election to either estimate the number of awards that are expected to vest or account for forfeitures when they occur. ASU 2016-09 is effective for fiscal years beginning after December 15, 2016, including interim periods within that reporting period. Early adoption is permitted. The Company has determined the adoption of this new pronouncement will not have a material impact on its consolidated financial statements and related disclosures.
In February 2016, the FASB issued ASU No. 2016-02, "Leases (Topic 842)" ("ASU 2016-02"), which increases the transparency and comparability about leases among entities. The new guidance requires lessees to recognize a lease liability and a corresponding lease asset for operating leases with lease terms greater than 12 months. It also requires additional disclosures about leasing arrangements to help users of financial statements better understand the amount, timing, and uncertainty of cash flows arising from leases. ASU 2016-02 becomes effective for interim and annual periods beginning after December 15, 2018, and requires a modified retrospective approach to adoption. Early adoption is permitted. The Company plans to engage a third party to assist in evaluating the impact of this new standard on its consolidated financial statements and related disclosures.
In May 2014, the FASB issued ASU No. 2014-09, “Revenue from Contracts with Customers (Topic 606)” ("ASU 2014-09"), which provides guidance for revenue recognition and which supersedes nearly all existing revenue recognition guidance under ASU 2014-09. This ASU provides guidance that an entity should recognize revenue to depict the transfer of promised goods or services to customers in an amount that reflects the consideration to which the entity expects to be entitled in exchange for those goods and services. Additionally, the guidance permits two methods of transition upon adoption: full retrospective and modified retrospective. Under the full retrospective method, the standard would be applied to each prior reporting period presented. Under the modified retrospective method, the cumulative effect of applying the standard would be recognized at the date of initial application. In August 2015, the FASB issued final revised guidance that defers the effective date of the revenue recognition standard to be for annual and interim periods beginning after December 15, 2017, with early adoption permitted for interim and annual reporting periods beginning after December 15, 2016. The Company plans to engage a third party to assist in evaluating the impact of this new standard on its consolidated financial statements and related disclosures.
6. Intangible Assets
The Company's major classes of intangible assets consisted of its customer relationships, trade names, safety training program and dispatch software in 2015. Due to the Company recording an impairment loss of $14.5 million in the second quarter of 2016, the Company's only remaining class of intangible assets at December 31, 2016 was its trade names.
The Company expenses costs associated with extensions or renewals of intangible assets. There were no such extensions or renewals in the years ended December 31, 2016, 2015, or 2014. Amortization expense is calculated using the straight-line method over the period indicated. Amortization expense for each of the years ended December 31, 2016, 2015, and 2014 was $1.7 million, $2.9 million, and $2.9 million, respectively. Estimated amortization expense is $0.5 million per year for each of the years 2017 through 2022.
65
The following sets forth the identified intangible assets by major asset class:
As of December 31, 2016 | As of December 31, 2015 | ||||||||||||||||||||||||||||||||
Useful Life (years) | Gross Carrying Value | Accumulated Amortization | Impairment | Net Book Value | Gross Carrying Value | Accumulated Amortization | Impairment | Net Book Value | |||||||||||||||||||||||||
(in thousands) | |||||||||||||||||||||||||||||||||
Customer relationships | 15 | $ | 31,896 | $ | (18,073 | ) | $ | (13,823 | ) | $ | — | $ | 31,896 | $ | (17,011 | ) | $ | — | $ | 14,885 | |||||||||||||
Trade names | 15 | 8,050 | (4,830 | ) | — | 3,220 | 8,050 | (4,293 | ) | — | 3,757 | ||||||||||||||||||||||
Other | 10-15 | 2,375 | (1,686 | ) | (689 | ) | — | 2,375 | (1,586 | ) | — | 789 | |||||||||||||||||||||
$ | 42,321 | $ | (24,589 | ) | $ | (14,512 | ) | $ | 3,220 | $ | 42,321 | $ | (22,890 | ) | $ | — | $ | 19,431 | |||||||||||||||
66
7. Share-Based Compensation
Incentive Compensation Plans
From time to time, the Company grants stock options, restricted stock units, or other awards to its employees, including executive officers, and directors. After taking into account the restricted stock units granted during 2016 (as discussed in the Restricted Stock Units paragraph below), at December 31, 2016, there were 1,785,543 shares available for future grants under the Compensation Plan. There were no stock option awards issued or granted under the Compensation Plan for the years ended December 31, 2016, 2015, and 2014. As discussed in Note 2, on the effective date of the Plan, all awards under the Compensation Plan will be extinguished without recovery.
Stock Options
The following table presents a summary of the Company’s stock option activity for the years ended December 31, 2016 and 2015:
Shares | Weighted- Average Exercise Price | Weighted- Average Remaining Contractual Term | Aggregate Intrinsic Value | |||||||||
Options outstanding at December 31, 2014 | 1,148,625 | $ | 7.94 | 5.44 years | $ | — | ||||||
Stock options: | ||||||||||||
Granted | — | — | ||||||||||
Exercised | — | — | ||||||||||
Forfeited | (534,500 | ) | 9.25 | |||||||||
Options outstanding at December 31, 2015 | 614,125 | $ | 6.80 | 4.87 years | $ | — | ||||||
Stock options: | ||||||||||||
Granted | — | — | ||||||||||
Exercised | — | — | ||||||||||
Forfeited | (11,500 | ) | 7.86 | |||||||||
Options outstanding at December 31, 2016 | 602,625 | $ | 6.78 | 3.90 years | $ | — | ||||||
Vested and expected to vest at December 31, 2016 | 602,625 | $ | 6.78 | 3.90 years | $ | — | ||||||
Exercisable at December 31, 2016 | 602,625 | $ | 6.78 | 3.90 years | $ | — | ||||||
During the years ended December 31, 2016 and 2015, the Company recorded no stock-based compensation expense related to stock options due to all stock options being fully vested and expensed in previous years. During the year ended December 31, 2014, the Company recorded total stock-based compensation expense related to stock options of $1.2 million. No stock-based compensation costs were capitalized in 2016, 2015, or 2014. As of December 31, 2016, there is no unrecognized cost for stock options.
There were no stock options granted during the years ended December 31, 2016 and 2015.
67
Restricted Stock Units
Restricted Stock Units granted to employees, executives, and directors range from immediately vesting to vesting over a period from one to five years. Unvested restricted stock units are forfeited upon termination of grantee's employment.
The following table presents a summary of restricted stock unit activity for the years ended December 31, 2016, 2015 and 2014:
Equity Based | Liability Based | Total Number of Units | Grant Date Average Fair Value Per Unit | |||||||||
Outstanding at December 31, 2013 | 674,789 | — | 674,789 | $ | 3.49 | |||||||
Granted | 199,254 | 262,273 | 461,527 | 3.85 | ||||||||
Vested | (498,821 | ) | — | (498,821 | ) | 3.84 | ||||||
Forfeited | — | — | — | — | ||||||||
Nonvested at December 31, 2014 | 375,222 | 262,273 | 637,495 | $ | 3.47 | |||||||
Granted | 127,008 | 1,191,704 | 1,318,712 | 1.19 | ||||||||
Vested | (310,451 | ) | (214,432 | ) | (524,883 | ) | 2.33 | |||||
Forfeited | (73,000 | ) | — | (73,000 | ) | 3.53 | ||||||
Nonvested at December 31, 2015 | 118,779 | 1,239,545 | 1,358,324 | $ | 1.70 | |||||||
Granted | — | — | — | — | ||||||||
Vested | (118,779 | ) | (523,866 | ) | (642,645 | ) | 1.88 | |||||
Forfeited | — | — | — | — | ||||||||
Nonvested at December 31, 2016 | — | 715,679 | 715,679 | $ | 1.53 | |||||||
There were 642,645, 524,883, and 498,821 shares vested for the years ended December 31, 2016, 2015, and 2014, respectively. Of the vested shares, 4,500, 364,881, and 371,459 shares were issued for the years ended December 31, 2016, 2015, and 2014, respectively. There were 636,645 shares settled in cash for the year ended December 31, 2016. There were no shares settled in cash for the years ended December 31, 2015 and 2014, respectively.
In the years ended December 31, 2016, 2015, and 2014, participants utilized a net withholding exercise method, in which restricted stock units were surrendered to cover payroll withholding tax. There were 1,500, 160,002, and 127,362 shares surrendered for payroll withholding tax for the years ended December 31, 2016, 2015, and 2014, respectively. The total pretax cash outflow, as included in withholding tax payments in the Company's consolidated statements of cash flows, for these net withholding exercises was $0.1 million, $0.2 million, and $0.5 million, respectively.
The following table summarizes the Company's equity and liability stock based compensation expense (in thousands):
2016 | 2015 | 2014 | |||||||||
Restricted stock unit expense | $ | — | $ | 508 | $ | 1,253 | |||||
Stock option expense | — | — | 1,185 | ||||||||
Performance based liability award expense associated with restricted stock units | (298 | ) | (66 | ) | 826 | ||||||
Total stock-based compensation expense | $ | (298 | ) | $ | 442 | $ | 3,264 | ||||
The Plan, as described in Note 2 - Chapter 11 Proceedings, provides that all existing Equity Interests (as defined in the Plan and which include FES Ltd.’s common stock, FES Ltd.’s preferred stock, awards under the Compensation Plan and the preferred stock purchase rights under Rights Agreement) in FES Ltd. will be extinguished without recovery. In 2017, all restricted stock units were canceled.
68
8. Property and Equipment
Property and equipment at December 31, 2016 and 2015 consisted of the following:
Estimated Life in Years | December 31, | ||||||||
2016 | 2015 | ||||||||
(in thousands) | |||||||||
Well servicing equipment | 9-15 years | $ | 411,199 | $ | 413,543 | ||||
Autos and trucks | 5-10 years | 126,580 | 126,994 | ||||||
Disposal wells | 5-15 years | 37,752 | 38,426 | ||||||
Building and improvements | 5-30 years | 14,125 | 14,107 | ||||||
Furniture and fixtures | 3-15 years | 6,779 | 6,573 | ||||||
Land | 1,524 | 1,524 | |||||||
597,959 | 601,167 | ||||||||
Accumulated depreciation | (364,597 | ) | (324,138 | ) | |||||
$ | 233,362 | $ | 277,029 | ||||||
The Company is obligated under various capital leases for certain vehicles and equipment that expire at various dates during the next five years. The gross amount of property and equipment and related accumulated depreciation recorded under capital leases and included above consists of the following:
December 31, | |||||||
2016 | 2015 | ||||||
(in thousands) | |||||||
Well servicing equipment | $ | 13,696 | $ | 15,215 | |||
Autos and trucks | 12,706 | 15,181 | |||||
26,402 | 30,396 | ||||||
Accumulated depreciation | (15,146 | ) | (14,219 | ) | |||
$ | 11,256 | $ | 16,177 | ||||
Depreciation of assets held under capital leases of approximately $0.9 million, $3.4 million, and $4.6 million for the years ended December 31, 2016, 2015, and 2014, respectively, is included in depreciation and amortization expense in the consolidated statements of operations.
69
9. Accounts Payable and Accrued Expenses
Accrued expenses and accounts payable – trade at December 31, 2016 and 2015, consisted of the following:
December 31, | |||||||
2016 | 2015 | ||||||
(in thousands) | |||||||
Accrued wages | $ | 601 | $ | 2,264 | |||
Accrued insurance | 7,193 | 7,266 | |||||
Other accrued expenses | 946 | 1,196 | |||||
Total accrued expenses | $ | 8,740 | $ | 10,726 | |||
Accounts payable - vendor financings | $ | 26 | $ | 242 | |||
Accounts payable - other | 4,479 | 8,753 | |||||
Total accounts payable - trade | $ | 4,505 | $ | 8,995 | |||
10. Long-Term Debt
Debt at December 31, 2016 and 2015, consisted of the following:
December 31, | |||||||
2016 | 2015 | ||||||
(in thousands) | |||||||
9% Senior Notes, net of deferred financing costs of $2,338 and $3,273 as of December 31, 2016 and 2015, respectively | $ | 277,662 | $ | 276,727 | |||
Revolving credit facility | 15,000 | 15,000 | |||||
Third party equipment notes and capital leases | 1,386 | 7,133 | |||||
Insurance notes | 5,124 | 6,181 | |||||
299,172 | 305,041 | ||||||
Less: Current portion | (298,932 | ) | $ | (25,243 | ) | ||
$ | 240 | $ | 279,798 | ||||
Aggregate maturities of long-term debt, excluding deferred financing costs, as of December 31, 2016 are as follows (in thousands):
2017 | 301,270 | ||
2018 | 240 | ||
2019 | — | ||
2020 | — | ||
Total | $ | 301,510 | |
9% Senior Notes
On June 7, 2011, FES Ltd. issued $280.0 million in principal amount of 9% Senior Notes. The 9% Senior Notes mature on June 15, 2019, and require semi-annual interest payments, in arrears, at an annual rate of 9% on June 15 and December 15 of each year, until maturity. Pursuant to the indenture governing the 9% Senior Notes, or the Senior Indenture, no principal payments are scheduled until maturity.
The 9% Senior Notes are guaranteed by FES LLC, CCF, TES, and FEI LLC, or collectively, the Guarantor Subs. All of the Guarantor Subs are 100% owned and each guarantees the securities on a full and unconditional and joint and several basis,
70
subject to customary release provisions which include: (i) the transfer, sale or other disposition (by merger or otherwise) of all or substantially all of the assets of the applicable Guarantor, or all of its capital stock; (ii) the proper designation of a Guarantor as an "Unrestricted Subsidiary;" (iii) the legal defeasance or satisfaction and discharge of the Senior Indenture; and (iv) as may be provided in any intercreditor agreement entered into in connection with any current and future credit facilities, in each such case specified in clauses (i) through (iii) above in accordance with the requirements therefor set forth in the Senior Indenture. FES Ltd. has no independent assets or operations. There are no significant restrictions on FES Ltd.’s ability or the ability of any Guarantor Sub to obtain funds from its subsidiaries by means of a dividend or loan. FES Ltd. may, at its option, redeem all or part of the 9% Senior Notes from time to time at specified redemption prices and subject to certain conditions required by the Senior Indenture. FES Ltd. is required to make an offer to purchase the notes and to repurchase any notes for which the offer is accepted at 101% of their principal amount, plus accrued and unpaid interest, if there is a change of control. FES Ltd. is required to make an offer to purchase the notes and to repurchase any notes for which the offer is accepted at 100% of their principal amount, plus accrued and unpaid interest, following certain asset sales.
Prior to the Debt Instrument Defaults, as discussed below, the Company was permitted under the terms of the Senior Indenture to incur additional indebtedness in the future, provided that certain financial conditions set forth in the Senior Indenture are satisfied. The Company is subject to certain covenants contained in the Senior Indenture, including provisions that limit or restrict FES Ltd.'s and certain future subsidiaries’ abilities to incur additional debt, to create, incur, or permit to exist certain liens on assets, to make certain dispositions of assets, to make payments on certain subordinated indebtedness, to pay dividends or certain other payments to FES Ltd.'s equity holders, to engage in mergers, consolidations or other fundamental changes, to change the nature of its business, or to engage in transactions with affiliates. Due to cross-default provisions in the Senior Indenture and the Loan Agreement, with certain exceptions, a default and acceleration of outstanding debt under one debt agreement would result in the default and possible acceleration of outstanding debt under the other debt agreement. Accordingly, an event of default could result in all or a portion of the Company's outstanding debt under its debt agreements becoming immediately due and payable. If this occurred, the Company might not be able to obtain waivers or secure alternative financing to satisfy all of its obligations simultaneously, which would adversely affect its business and operations.
Details of two of the more significant restrictive covenants in the Senior Indenture are set forth below:
• | Limitation on the Incurrence of Additional Debt - In addition to certain indebtedness defined in the Senior Indenture as "Permitted Debt," which includes indebtedness under any credit facility not to exceed the greater of $75.0 million or 18% of the Company's Consolidated Tangible Assets (as defined in the Senior Indenture), the Company may only incur additional debt if the Fixed Charge Coverage Ratio (as defined in the Senior Indenture) for the most recently completed four full fiscal quarters is at least 2.0 to 1.0. |
• | Limitation on Restricted Payments - Subject to certain limited exceptions, including specific permission to pay cash dividends on the Series B Preferred Stock up to $260,000 per quarter, the Company is prohibited from (i) declaring or paying dividends or other distributions on its equity securities (other than dividends or distributions payable in equity securities), (ii) purchasing or redeeming any of the Company's equity securities, (iii) making any payment on indebtedness contractually subordinated to the 9% Senior Notes, except a payment of interest or principal at the stated maturity thereof, or (iv) making any investment defined as a "Restricted Investment," unless, at the time of and after giving effect to such payment, the Company is not in default and the Company is able to incur at least $1.00 of additional Indebtedness pursuant to the Fixed Charge Coverage Ratio (as defined in the Senior Indenture). Further, the amount of such payment plus all other such payments made by the Company since the issuance of the 9% Senior Notes must be less than the aggregate of (a) 50% of Consolidated Net Income (as defined in the Senior Indenture) since the April 1, 2011 (or 100%, if such figure is a deficit), (b) 100% of the aggregate net cash proceeds from equity offerings since the issuance of the 9% Senior Notes, (c) if any Restricted Investments have been sold for cash, the proceeds from such sale (or the original cash investment if that amount is lower); and (d) 50% of any dividends received by the Company. |
The Company experienced the Debt Instrument Defaults under the Senior Indenture which would have resulted in all outstanding indebtedness due under the Senior Indenture immediately due and payable. However, pursuant to the Indenture Forbearance Agreement, the Supporting Noteholders agreed to forbear from exercising default remedies or accelerating any indebtedness under the Senior Indenture resulting from the Debts Instrument Defaults while they worked with the Debtors to reach an agreement on the Reorganization. Additionally, as discussed above, any efforts to enforce such payment obligations were automatically stayed as a result of the filing of the Petitions, and the creditors' rights of enforcement in respect of the Senior Indenture are subject to the applicable provisions of the Bankruptcy Code and orders of the Bankruptcy Court. Moreover, on March 29, 2017, the Bankruptcy Court entered an order confirming the Plan and the Debtors expect the consummation of the Plan to become effective on or about April 13, 2017. On the effective date of the Plan, the 9% Senior
71
Notes will be canceled and each holder of the 9% Senior Notes will receive such holder’s pro rata share of (i) $20 million in cash and (ii) 100% of the new common stock of reorganized FES Ltd., subject to dilution only as a result of the shares of new common of reorganized FES Ltd. issued or available for issuance in connection with the Management Incentive Plan. The amounts outstanding under the Senior Indenture are classified as current in the consolidated balance sheet for December 31, 2016.
Revolving Credit Facility
On September 9, 2011, the Company entered into the Loan Agreement. Prior to the Loan Forbearance Agreement, the Loan Agreement provided for an asset based revolving credit facility with a maximum borrowing credit of $90.0 million, subject to borrowing base availability, any reserves established by the facility agent in its discretion, compliance with a fixed charge coverage ratio covenant if availability under the facility falls below certain thresholds and, for borrowings above $75.0 million, compliance with the debt incurrence covenant in the Senior Indenture that prohibits the incurrence of debt except for certain limited exceptions, including indebtedness incurred under the permitted credit facility debt basket to the greater of $75.0 million or 18% of the Company's Consolidated Tangible Assets (as defined in the Senior Indenture) reported for the last fiscal quarter for which financial statements are available. As of December 31, 2016, 18% of the Company's Consolidated Tangible Assets was approximately $55.7 million. If the Company's availability under the credit facility dropped below 15% of our total borrowing credit (as described above), it is required to maintain a trailing four-quarter fixed charge coverage ratio of at least 1.1 to 1. Prior to the Loan Forbearance Agreement, under the Loan Agreement, the Company's borrowing base at any time was equal to (i) 85% of eligible accounts, which are determined by the Agent in its reasonable discretion, plus (ii) the lesser of 85% of the appraised value, subject to certain adjustments, the Company's well servicing equipment that has been properly pledged and appraised, is in good operating condition and is located in the United States, or 100% of the net book value of such equipment, minus (iii) any reserves established by the Agent in its reasonable discretion. Subsequent to entering into and pursuant to the Loan Forbearance Agreement, the maximum borrowing credit under the Loan Agreement was reduced from $90 million to $30 million and the Lender is no longer obligated to make further advances under the Loan Agreement. Accordingly, as of December 31, 2016, the borrowing base was $30.0 million. Furthermore, the Company's and borrowing availability under the Loan Agreement at December 31, 2016, was and remains uncertain because the Lender was and is not obligated to make any advances under the Loan Agreement.
The Loan Agreement has a stated maturity of July 26, 2018. In June 2015, FES LLC borrowed $15.0 million under the facility. As of December 31, 2016, the facility had a revolving loan balance outstanding of $15.0 million and $9.0 million in letters of credit outstanding against the facility.
Borrowings bear interest at a rate equal to either (a) the LIBOR rate plus an applicable margin of between 2.00% to 2.50% based on borrowing availability or (b) a base rate plus an applicable margin of between 1.00% to 1.50% based on borrowing availability, where the base rate is equal to the greater of the prime rate established by Regions Bank, the overnight federal funds rate plus 0.5% or the LIBOR rate for a one month period plus 1%. As a result of Debt Instrument Defaults that gave rise to the Loan Forbearance Agreement, the Company's effective interest rate as of December 31, 2016 was 4.75%, plus a 2.0% default rate.
In addition to paying interest on outstanding principal under the facility, a fee of 0.375% per annum will accrue on unutilized availability under the credit facility. The Company is required to pay a fee of between 2.25% to 2.75%, based on borrowing availability, with respect to the principal amount of any letters of credit outstanding under the facility. The Company is also responsible for certain other administrative fees and expenses.
FES LLC, FEI LLC, TES, and CCF are the named borrowers under the loan and security agreement. Their obligations have been guaranteed by one another and by FES Ltd. Subject to certain exceptions and permitted encumbrances, including the exemption of real property interests from the collateral package, the obligations under this facility are secured by a first priority security interest in all of the Company's assets.
The Loan Agreement contains customary covenants for an asset-based credit facility, which include (i) restrictions on certain mergers, consolidations and sales of assets; (ii) restrictions on the creation or existence of liens; (iii) restrictions on making certain investments; (iv) restrictions on the incurrence or existence of indebtedness; (v) restrictions on transactions with affiliates; (vi) requirements to deliver financial statements, reports and notices to the Agent and (vii) a springing requirement to maintain a consolidated Fixed Charge Coverage Ratio (which is defined in the Loan Agreement) of 1.1:1.0 in the event that the Company's excess availability under the credit facility falls below the greater of $11.3 million or 15.0% of the Company's maximum credit under the facility for 60 consecutive days, provided that, the restrictions described in (i)-(v) above are subject to certain exceptions and permissions limited in scope and dollar value. The Loan Agreement also contains customary representations and warranties and event of default provisions.
72
Under cross default provisions in the Loan Agreement, an event of default under the 9% Senior Notes constitutes an event of default under the Loan Agreement. As mentioned above, the Company experienced the Debt Instrument Defaults under the Senior Indenture and Loan Agreement. The Debt Instrument Defaults under the Senior Indenture and the Loan Agreement would have resulted in all outstanding indebtedness due under the Senior Indenture and the Loan Agreement becoming immediately due and payable. However, pursuant to the Indenture Forbearance Agreement and the Loan Forbearance Agreement, the Supporting Noteholders, Regions and the Lender agreed to forbear from exercising default remedies or accelerating any indebtedness under their respective debt instrument resulting from the Debt Instrument Defaults while they worked with the Debtors to reach an agreement on the Reorganization. Additionally, as discussed above, any efforts to enforce such payment obligations were automatically stayed as a result of the filing of the Petitions, and the creditors' rights of enforcement in respect of the Senior Indenture and the Loan Agreement are subject to the applicable provisions of the Bankruptcy Code and orders of the Bankruptcy Court. Moreover, on March 29, 2017, the Bankruptcy Court entered an order confirming the Plan and the Debtors expect the consummation of the Plan to become effective on or about April 13, 2017. On the effective date of the Plan, the Loan Agreement will be terminated and the New Regions Facility will be entered into covering the outstanding letters of credit and Bank Product Obligations (as defined in the Loan Agreement) under the Loan Agreement and Regions, as sole new Lender, in full satisfaction and settlement of its claims against the Debtors, will (i) receive cash to satisfy all outstanding obligations with respect to the Revolving Advances (as defined in the Loan Agreement), including, without limitation, all outstanding Revolving Advances and all interest, fees, and other charges due and payable under the Loan Agreement relating to the Revolving Advances, and (ii) as to the Issuer and Bank Product Provider (as each term is defined in the Loan Agreement), continue to hold the cash pledged by Debtors to collateralize all outstanding letters of credit and Bank Product Obligations under the Loan Agreement that will be covered by the New Regions Facility. As of December 31, 2016, the Revolving Advances consisted of a $15.0 million advance against the credit facility, Bank Product Obligations consisted of $0.5 million for the Company's corporate credit card program, and we had $9.0 million in outstanding letters of credit. The amounts outstanding under the Loan Agreement are classified as current in the consolidated balance sheet as of December 31, 2016.
Third Party Equipment Notes and Capital Leases
The Company financed the purchase of certain vehicles and equipment through commercial loans and capital leases with aggregate principal amounts outstanding as of December 31, 2016 and 2015 of approximately $1.4 million and $7.1 million, respectively. These loans are repayable in a range of 42 to 60 monthly installments with the maturity dates ranging from January 2017 to July 2018. Interest accrues at rates ranging from 3.07% to 8.42% and is payable monthly. The loans are collateralized by equipment purchased with the proceeds of such loans. The Company paid total principal payments of approximately $5.7 million, $5.6 million, and $5.1 million for the years ended December 31, 2016, 2015, and 2014, respectively.
Following are required principal payments due on third party equipment notes and capital leases (other than the 9% Senior Notes and revolving credit facility) existing as of December 31, 2016:
2017 | 2018 | 2019 | 2020 | 2021 and thereafter | ||||||||||||||||
(in thousands) | ||||||||||||||||||||
Third party equipment notes and capital lease principal payments | $ | 1,145 | $ | 240 | $ | — | $ | — | $ | — | ||||||||||
Management currently acquires all light duty trucks (pickup trucks) through capital leases and may use capital leases or cash to purchase equipment held under operating leases that has reached the end of the lease term. See Note 12 - Commitments and Contingencies.
Insurance Notes
During 2016 and 2015, the Company entered into promissory notes for the payment of insurance premiums at interest rates of 2.87% and 3.35% respectively, with an aggregate principal amount outstanding as of December 31, 2016 and 2015, of approximately $5.1 million and $6.2 million, respectively. The amount outstanding could be substantially offset by the cancellation of the related insurance coverage which is classified in prepaid insurance. These notes are or were payable in twelve monthly installments with maturity dates of October 15, 2017 and October 15, 2016, respectively.
11. Related Party Transactions
The Company enters into transactions with related parties in the normal course of conducting business. The following tables summarizes the related party transactions.
As of December 31, | ||||||||||||
2016 | 2015 | |||||||||||
(in thousands) | ||||||||||||
Related parties cash and cash equivalents balances: | ||||||||||||
Balance at Texas Champion Bank (1) | $ | 295 | $ | 1,132 | ||||||||
Balance at Brush Country Bank (2) | — | 485 | ||||||||||
$ | 295 | $ | 1,617 | |||||||||
Related parties payable: | ||||||||||||
Dorsal Services, Inc. (3) | $ | — | $ | 2 | ||||||||
Tasco Tool Services, Inc. (4) | — | 2 | ||||||||||
Texas Quality Gate Guard Services, LLC (5) | 18 | 4 | ||||||||||
$ | 18 | $ | 8 | |||||||||
Years ended December, 31 | ||||||||||||
2016 | 2015 | 2014 | ||||||||||
(in thousands) | ||||||||||||
Related parties capital expenditures: | ||||||||||||
Tasco Tool Services, Inc. (4) | $ | — | $ | — | $ | 16 | ||||||
JITSU Services, LLC (6) | — | — | 240 | |||||||||
$ | — | $ | — | $ | 256 | |||||||
Related parties revenue activity: | ||||||||||||
Tasco Tool Services, Inc. (4) | $ | — | $ | 1 | $ | 2 | ||||||
Wolverine Construction, Inc. (7) | — | — | 249 | |||||||||
Texas Water Disposal, LLC (8) | — | — | 12 | |||||||||
$ | — | $ | 1 | $ | 263 | |||||||
Related parties expense activity: | ||||||||||||
Alice Environmental Services, LP/Alice Environmental Holdings, LLC (9) | $ | 1,012 | $ | 1,889 | $ | 1,861 | ||||||
Dorsal Services, Inc. (3) | 13 | 20 | 371 | |||||||||
Tasco Tool Services, Inc. (4) | 36 | 172 | 224 | |||||||||
FCJ Management, LLC (10) | — | 15 | 27 | |||||||||
JITSU Services, LLC (6) | — | — | 243 | |||||||||
Texas Quality Gate Guard Services, LLC (5) | 200 | 188 | 214 | |||||||||
Animas Holdings, LLC (11) | 172 | 225 | 265 | |||||||||
CJW Group, LLC (12) | 38 | 38 | 13 | |||||||||
$ | 1,471 | $ | 2,547 | $ | 3,218 | |||||||
Other payments to related parties: | ||||||||||||
SB Factoring, LLC (13) | $ | 402 | $ | 1,900 | $ | 3,863 | ||||||
$ | 402 | $ | 1,900 | $ | 3,863 | |||||||
73
There were no related party receivables as of December, 2016 and December 31, 2015.
(1)The Company has a deposit relationship with Texas Champion Bank. Travis Burris, one of the directors of the Company, is the President, Chief Executive Officer, and director of Texas Champion Bank. John E. Crisp, or Mr. Crisp, an executive officer and director of the Company, serves on the board of directors of Texas Champion Bank.
(2)Mr. Crisp and Charles C. Forbes, Jr., or Mr. Forbes, are directors and shareholders of Brush Country Bank, an institution with which the Company conducts business and has deposits. Mr. Forbes is an executive officer and director of the Company.
(3)Dorsal Services, Inc., or Dorsal Services, is a trucking service company. Mr. Crisp is a partial owner of Dorsal Services. The Company uses Dorsal Services from time to time.
(4)Tasco Tool Services, Inc., or Tasco, is a down-hole tool company that is partially owned and managed by a company that is partially owned by Mr. Forbes. Tasco rents and sells tools to the Company from time to time.
(5)Texas Quality Gate Guard Services, LLC, or Texas Quality Gate Guard Services, is an entity owned by Messrs. Crisp and Forbes, and a son of Mr. Crisp. Texas Quality Gate Guard Services has provided security services to the Company.
(6)JITSU Services, LLC, or JITSU, is a financial leasing company owned by Janet Forbes, or Ms. Forbes, and Mr. Crisp. The Company previously leased ten vacuum trucks from JITSU. This lease was terminated in November 2014. Ms. Forbes served as a Company director until June 11, 2014.
(7)Wolverine Construction, Inc., or Wolverine, is an entity that was owned by two sons and a brother of Mr. Crisp, and a son of Mr. Forbes. Wolverine provided construction and site preparation services to certain customers of the Company. The related party interests in Wolverine were sold in 2014.
(8) Texas Water Disposal Services, LLC, or TWDS, is partially owned by a brother of Mr. Crisp. TWDS is a company that owns a salt water disposal well that was used by the Company. The Company has not done business with TWDS since March 2014.
(9)Messrs. Crisp and Forbes are also owners and managers of Alice Environmental Holdings, LLC, or AEH, and indirect owners and managers of Alice Environmental Services, LP, or AES, Alice Environmental West Texas, LLC, or AEWT and AEH Operating, LLC. The Company leases or rents land and buildings, and aircraft from AES. During January 2015, the Company purchased land from AEWT for an additional operating location. The aircraft leases were terminated during the third quarter of 2015.
(10)FCJ Management, LLC, or FCJ, is an entity that leases land and facilities to the Company and is partially owned by Messrs. Crisp and Forbes. The lease with FCJ was terminated during the third quarter of 2015.
(11)Animas Holdings, LLC, or Animas, is owned by the two sons of Mr. Crisp and three children of Mr. and Ms. Forbes. Animas owns land and property that it leases to the Company.
(12) CJW Group, LLC is an entity that leases office space to the Company and is partially owned by Messrs. Crisp and Forbes.
(13) From time to time, vendors of the Company factor their receivables from the Company and direct that the Company make payment of such factored amounts directly to the applicable factor. One such factor to whom payments have been made by the Company is SB Factoring LLC which is owned in part by each of Mr. Crisp and Mr. Forbes. The nature of these transactions does not result in recording in the Company's financial records any revenue, any expense or any receivable and does not result in any payable distinct in amount from the amount payable to such vendors as originally incurred.
12. Commitments and Contingencies
Concentrations of Credit Risk
Financial instruments which subject the Company to credit risk consist primarily of cash balances maintained in excess of federal depository insurance limits and trade receivables. Insurance coverage is currently $250,000 per depositor at each financial institution, and the Company's non-interest bearing cash balances exceeded federally insured limits. The Company restricts investment of temporary cash investments to financial institutions with high credit standings. The Company’s customer base consists primarily of multi-national and independent oil and natural gas producers. The Company does not require collateral on its trade receivables. For the year ended December 31, 2016, the Company’s largest customer, five largest customers, and ten largest customers constituted 16.2%, 56.8%, and 70.1% of total revenues, respectively. For the year ended December 31, 2015 the Company’s largest customer, five largest customers, and ten largest customers constituted 17.2%, 48.5%, and 67.0% of total revenues, respectively. For the year ended December 31, 2014 the Company’s largest customer, five largest customers, and ten largest customers constituted 18.8%, 42.7%, and 56.6% of total revenues, respectively. The loss of any one of the Company's top five customers would have a materially adverse effect on the revenues and profits of the Company. Further, the Company's trade accounts receivable are from companies within the oil and natural gas industry and as such the Company is exposed to normal industry credit risks. As of December 31, 2016, the Company's largest customer, five largest customers, and ten largest customers constituted 22.9%, 58.0%, and 69.8% of trade accounts receivable, respectively. As of December 31, 2015, the Company's largest customer, five largest customers, and ten largest customers constituted 16.5%, 44.8%, and 62.6% of trade accounts receivable, respectively. The Company continually evaluates its reserves for potential credit losses and establishes reserves for such losses.
74
Employee Benefit Plan
The Company has a 401(k) retirement plan for substantially all of its employees based on certain eligibility requirements. The Company may provide profit sharing contributions to the plan at the discretion of management. No such discretionary contributions have been made since inception of the plan.
Self-Insurance
The Company is self-insured under its Employee Group Medical Plan for the first $150 thousand per individual. The Company is self-insured with a retention for the first $250 thousand in general liability. The Company also retains the first $1.0 million within the auto liability buffer policy which is in excess of a primary $1.0 million auto liability limit. The Company has an additional premium payable clause under its lead $10.0 million limit excess policy that states in the event losses exceed $0.5 million, a loss additional premium of up to 15% of paid losses in excess of $0.5 million will be due. The loss additional premium is payable at the time when the loss is paid and will be payable over a period agreed by insurers. The Company has accrued liabilities totaling $7.2 million and $7.3 million as of December 31, 2016 and 2015, respectively, for the projected additional premium and self-insured portion of these insurance claims as of the financial statement dates. This accrual includes claims made as well as an estimate for claims incurred but not reported as of the financial statement dates.
Litigation
The Company is subject to various other claims and legal actions that arise in the ordinary course of business. The Company does not believe that any of these claims and actions, separately or in the aggregate, will have a material adverse effect on the Company's business, financial condition, results of operations, or cash flows, although the Company cannot guarantee that a material adverse effect will not occur.
Chapter 11 Proceedings
On January 22, 2017, the Debtors filed the Petitions in the Bankruptcy Court seeking relief under the provisions of chapter 11 of the Bankruptcy Code. The commencement of the chapter 11 cases automatically stayed certain actions against the Debtors, including actions to collect prepetition liabilities or to exercise control over the property of the Debtors. The Plan in the Debtors’ chapter 11 cases provides for the treatment of prepetition liabilities that have not otherwise been satisfied or addressed during the chapter 11 cases. On March 29, 2017, the Bankruptcy Court entered an order confirming the Plan. The Company expects the consummation of the Plan to become effective on or about April 13, 2017.
Off-Balance Sheet Arrangements
The Company is often party to certain transactions that require off-balance sheet arrangements such as performance bonds, guarantees, operating leases for equipment, and bank guarantees that are not reflected in the Company's consolidated balance sheets. These arrangements are made in the Company's normal course of business and they are not reasonably likely to have a current or future material adverse effect on its financial condition, results of operations, liquidity, or cash flows. The Company's off-balance sheet arrangements include $9.0 million in letters of credit and operating leases for equipment, which is summarized in the table below.
Leases
Future minimum lease payments under non-cancellable operating leases as of December 31, 2016 are as follows (in thousands):
Related Party | Other | Total | |||||||||
2017 | $ | 854 | $ | 1,338 | $ | 2,192 | |||||
2018 | 133 | 821 | 954 | ||||||||
2019 | — | 691 | 691 | ||||||||
2020 | — | 671 | 671 | ||||||||
2021 and thereafter | — | 3,114 | 3,114 | ||||||||
Total | $ | 987 | $ | 6,635 | $ | 7,622 | |||||
Rent expense for the years ended December 31, 2016, 2015, and 2014 totaled approximately $7.8 million, $16.0 million and $20.6 million, respectively.
75
13. Supplemental Cash Flow Information
Years Ended December 31, | |||||||||||
2016 | 2015 | 2014 | |||||||||
(in thousands) | |||||||||||
Cash paid for | |||||||||||
Interest | $ | 432 | $ | 26,009 | $ | 26,096 | |||||
Income tax | — | 182 | 70 | ||||||||
Supplemental schedule of non-cash investing and financing activities | |||||||||||
Financing of insurance notes | $ | 7,737 | $ | 7,705 | $ | 6,976 | |||||
Change in accounts payable related to capital expenditures | (216 | ) | (1,487 | ) | (2,395 | ) | |||||
Capital leases on equipment | — | 527 | 2,144 | ||||||||
Preferred stock dividends and accretion costs | (654 | ) | (42 | ) | (42 | ) | |||||
76
14. Income Taxes
Income tax expense (benefit) included in the consolidated statements of operations for the years ended December 31 was as follows (in thousands):
2016 | 2015 | 2014 | |||||||||
(in thousands) | |||||||||||
Continuing operations: | |||||||||||
Current: | |||||||||||
Federal | $ | — | $ | 15 | $ | 238 | |||||
State | — | 148 | 641 | ||||||||
Foreign | (25 | ) | (23 | ) | 18 | ||||||
Total current income tax (benefit) expense | $ | (25 | ) | $ | 140 | $ | 897 | ||||
Deferred: | |||||||||||
Federal | $ | (96 | ) | $ | (16,562 | ) | $ | (4,008 | ) | ||
State | 293 | (192 | ) | 51 | |||||||
Total deferred income tax expense (benefit) | $ | 197 | $ | (16,754 | ) | $ | (3,957 | ) | |||
Total income tax expense (benefit) | $ | 172 | $ | (16,614 | ) | $ | (3,060 | ) | |||
The provision for income taxes attributable to loss from continuing operations differed from the amount obtained by applying the federal statutory income tax rate to loss from continuing operations before taxes, as follows:
2016 | 2015 | 2014 | |||||||||
(in thousands) | |||||||||||
Income tax benefit at statutory rate of 35% | $ | (38,135 | ) | $ | (21,941 | ) | $ | (3,983 | ) | ||
Nondeductible expenses | 5,293 | 2,531 | 654 | ||||||||
State taxes, net of federal benefit | — | 60 | 374 | ||||||||
Change in deferred tax valuation allowance | 33,177 | 2,790 | — | ||||||||
Other | (163 | ) | (54 | ) | (105 | ) | |||||
$ | 172 | $ | (16,614 | ) | $ | (3,060 | ) | ||||
Deferred income taxes reflect the net tax effects of temporary differences between the carrying amounts of assets and liabilities for financial reporting purposes and the amounts used for income tax purposes. Significant components of the Company's deferred tax liabilities and assets as of December 31 were as follows:
2016 | 2015 | ||||||
(in thousands) | |||||||
Deferred tax assets: | |||||||
Net operating loss carryforwards | $ | 52,274 | $ | 30,991 | |||
Foreign tax credits | 796 | 796 | |||||
Alternative minimum tax credit | 1,228 | 1,228 | |||||
Share-based compensation | 1,062 | 3,568 | |||||
Bad debts | 484 | 644 | |||||
Other | 2,595 | 3,068 | |||||
Total deferred tax assets | 58,439 | 40,295 | |||||
Less: valuation allowance | (36,762 | ) | (3,586 | ) | |||
Total deferred tax assets, net | $ | 21,677 | $ | 36,709 | |||
Deferred tax liabilities: | |||||||
Tax over book depreciation | $ | (21,411 | ) | $ | (30,689 | ) | |
Intangible assets | (1,362 | ) | (6,919 | ) | |||
Total deferred tax liabilities | (22,773 | ) | (37,608 | ) | |||
Net deferred tax liability | $ | (1,096 | ) | $ | (899 | ) | |
77
During the preparation of its 2016 consolidated financial statements, the Company identified an error in its 2015 deferred tax analysis. The Company has corrected the 2015 tax information noted above to reflect an adjustment to reduce deferred income tax assets relating to stock-based compensation by $2.0 million with a similar reduction of the valuation allowance. This adjustment had no impact on the Company's consolidated balance sheet or annual statement of operations, cash flows, or stockholders' equity for any periods presented. The Company has evaluated the impact of this restatement and determined that it was not material. See Note 18.
As of December 31, 2016, the Company had federal net operating loss carryforwards of approximately $149.2 million, which will begin to expire in 2028 if not utilized prior to that time. Realization of deferred tax assets associated with net operating loss carryforwards is dependent upon generating sufficient taxable income in the appropriate jurisdiction prior to their expiration. The existence of reversing taxable temporary differences supports the recognition by the Company of deferred tax assets. It is not more likely than not that those deferred tax assets would be realized due to the Company's lack of earnings history. Therefore, a valuation allowance in the amount of $0.8 million was established as of December 31, 2014, and increased by approximately $2.8 million during 2015 and by approximately $33.2 million during 2016.
Deferred taxes have not been recognized on undistributed earnings of foreign subsidiaries since these amounts were not material at December 31, 2016 and 2015.
The Company files U.S. federal, U.S. state, and foreign tax returns, and is generally no longer subject to tax examinations for fiscal years prior to 2011.
15. Earnings (loss) per Share
Basic earnings (loss) per share, or EPS, is computed by dividing net income (loss) available to common shareholders by the weighted average shares of common stock outstanding during the period. Diluted earnings (loss) per share takes into account the potential dilution that could occur if securities or other contracts to issue common shares, such as options, unvested restricted stock and restricted stock units and convertible preferred stock, were exercised and converted into common stock. Potential common stock equivalents that have been issued by the Company relate to outstanding stock options and unvested restricted stock and restricted stock units, which are determined using the treasury stock method, and the shares of Series B Preferred Stock, which are determined using the "if converted" method. In applying the if-converted method, conversion is not assumed for purposes of computing diluted EPS if the effect would be antidilutive.
A company is required to use the two-class method when computing EPS when a company has a security that qualifies as a “participating security.” The two-class method is an earnings allocation formula that determines EPS for each class of common stock and participating security according to dividends declared (or accumulated) and participation rights in undistributed earnings. A participating security is included in the computation of basic EPS using the two-class method. Under the two-class method, basic EPS for the Company’s common stock is computed by dividing net income applicable to common stock by the weighted-average common stock outstanding during the period. Diluted EPS for the Company’s common stock is computed using the more dilutive of the two-class method or the if-converted method. Due to the Company's net operating loss position in each such year, there is no dilutive effect for the years ended December 31, 2016, 2015, and 2014.
2016
There were 602,625 stock options, 0 units of unvested restricted stock units, and 5,292,531 shares of common stock equivalents underlying the series B Preferred stock outstanding as of December 31, 2016 that were not included in the calculation of diluted EPS because their effect would have been antidilutive.
2015
There were 614,125 stock options, 1,358,324 units of unvested restricted stock units, and 5,292,531 shares of common stock equivalents underlying the series B Preferred stock outstanding as of December 31, 2015 that were not included in the calculation of diluted EPS because the effect would have been antidilutive.
2014
There were 1,148,625 stock options, 637,495 units of unvested restricted stock units, and 5,292,531 shares of common stock equivalents underlying the series B Preferred stock outstanding as of December 31, 2014 that were not included in the calculation of diluted EPS because the effect would have been antidilutive.
78
The following table sets forth the computation of basic and diluted loss per share:
Years Ended December 31, | |||||||||||
2016 | 2015 | 2014 | |||||||||
(in thousands, except per share amounts) | |||||||||||
Basic and diluted: | |||||||||||
Net loss | $ | (109,129 | ) | $ | (46,074 | ) | $ | (8,321 | ) | ||
Preferred stock dividends and accretion | (776 | ) | (776 | ) | (776 | ) | |||||
Net loss attributable to common shareholders | $ | (109,905 | ) | $ | (46,850 | ) | $ | (9,097 | ) | ||
Weighted-average common shares | 22,214 | 22,071 | 21,749 | ||||||||
Basic and diluted loss per share | $ | (4.95 | ) | $ | (2.12 | ) | $ | (0.42 | ) | ||
16. Business Segment Information
The Company has determined that it has two reportable segments organized based on its products and services—well servicing and fluid logistics. The accounting policies of the segments are the same as those described in the summary of significant accounting policies.
Well Servicing
At December 31, 2016, the Company's well servicing segment utilized its fleet of 173 well servicing rigs, which was comprised of 159 workover rigs and 14 swabbing rigs, six coiled tubing spreads, and other related assets and equipment. These assets are used to provide (i) well maintenance, including remedial repairs and removal and replacement of downhole production equipment, (ii) well workovers, including significant downhole repairs, re-completions and re-perforations, (iii) completion and swabbing activities, (iv) plugging and abandonment services, and (v) pressure testing of oil and natural gas production tubing and scanning tubing for pitting and wall thickness using tubing testing units.
Fluid Logistics
The Company's fluid logistics segment utilized its fleet of owned or leased fluid transport trucks and related assets, including specialized vacuum, high-pressure pump and tank trucks, frac tanks, water wells, salt water disposal wells and facilities, and related equipment. These assets are used to provide, transport, store, and dispose of a variety of drilling and produced fluids used in, and generated by, oil and natural gas production. These services are required in most workover and completion projects and are routinely used in the daily operation of producing wells.
79
The following table sets forth certain financial information from continuing operations with respect to the Company’s reportable segments (dollars in thousands):
Well Servicing | Fluid Logistics | Consolidated | |||||||||
2016 | |||||||||||
Operating revenues | $ | 70,921 | $ | 45,284 | $ | 116,205 | |||||
Direct operating costs | 61,279 | 42,744 | 104,023 | ||||||||
Segment operating profits | $ | 9,642 | $ | 2,540 | $ | 12,182 | |||||
Depreciation and amortization | $ | 26,246 | $ | 26,128 | $ | 52,374 | |||||
Loss on impairment of assets | 25 | 14,512 | 14,537 | ||||||||
Capital expenditures (1) | 4,293 | 4,408 | 8,701 | ||||||||
Total assets | 611,090 | 434,663 | 1,045,753 | ||||||||
Long lived assets | 142,509 | 90,853 | 233,362 | ||||||||
2015 | |||||||||||
Operating revenues | $ | 150,949 | $ | 93,158 | $ | 244,107 | |||||
Direct operating costs | 117,514 | 74,905 | 192,419 | ||||||||
Segment operating profits | $ | 33,435 | $ | 18,253 | $ | 51,688 | |||||
Depreciation and amortization | $ | 25,914 | $ | 29,120 | $ | 55,034 | |||||
Capital expenditures (1) | 4,844 | 3,764 | 8,608 | ||||||||
Total assets | 662,819 | 470,788 | 1,133,607 | ||||||||
Long lived assets | 165,416 | 111,613 | 277,029 | ||||||||
2014 | |||||||||||
Operating revenues | $ | 285,338 | $ | 163,940 | $ | 449,278 | |||||
Direct operating costs | 213,278 | 127,775 | 341,053 | ||||||||
Segment operating profits | $ | 72,060 | $ | 36,165 | $ | 108,225 | |||||
Depreciation and amortization | $ | 24,396 | $ | 30,563 | $ | 54,959 | |||||
Capital expenditures (1) | 16,263 | 21,363 | 37,626 | ||||||||
Total assets | 646,912 | 485,944 | 1,132,856 | ||||||||
Long lived assets | 188,726 | 133,937 | 322,663 | ||||||||
(1) Capital expenditures listed above include all cash and non-cash additions to property and equipment, including capital leases and fixed assets recorded in accounts payable at year-end. | |||||||||||
Year Ended December 31, | |||||||||||
2016 | 2015 | 2014 | |||||||||
Reconciliation of the Forbes Group Operating Loss As Reported: | |||||||||||
Segment operating profits | $ | 12,182 | $ | 51,688 | $ | 108,225 | |||||
General and administrative expense | 18,832 | 31,591 | 36,428 | ||||||||
Depreciation and amortization | 52,374 | 55,034 | 54,959 | ||||||||
Loss on impairment of assets | 14,537 | — | — | ||||||||
Reorganization costs | 7,548 | — | — | ||||||||
Operating (loss) income | (81,109 | ) | (34,937 | ) | 16,838 | ||||||
Other income and expenses, net | (27,848 | ) | (27,751 | ) | (28,219 | ) | |||||
Pre-tax loss | $ | (108,957 | ) | $ | (62,688 | ) | $ | (11,381 | ) | ||
80
December 31, | |||||||
2016 | 2015 | ||||||
Reconciliation of the Forbes Group Assets As Reported: | |||||||
Total reportable segments | $ | 1,045,753 | $ | 1,133,607 | |||
Elimination of internal transactions | (1,935,640 | ) | (1,894,434 | ) | |||
Parent | 1,202,768 | 1,169,981 | |||||
Total assets | $ | 312,881 | $ | 409,154 | |||
81
17. Equity Securities
Common Stock
Holders of common stock have no pre-emptive, redemption, conversion, or sinking fund rights. Holders of common stock are entitled to one vote per share on all matters submitted to a vote of holders of common stock. Unless a different majority is required by law or by the bylaws, resolutions to be approved by holders of common stock require approval by a simple majority of votes cast at a meeting at which a quorum is present. In the event of the liquidation, dissolution, or winding up of the Company, the holders of common stock are entitled to share equally and ratably in the Company’s assets, if any, remaining after the payment of all of its debts and liabilities, subject to any liquidation preference on any issued and outstanding preferred stock.
Series B Preferred Stock
Under the Company's Series B Certificate of Designation, the Company is authorized to issue 825,000 shares of Series B Senior Convertible Preferred Stock, or the Series B Preferred Stock, par value $0.01 per share. This is presented as temporary equity on the balance sheet. The common stock into which the Series B Preferred Stock is convertible has certain demand and “piggyback” registration rights. There were 588,059 shares of Series B Preferred Stock outstanding as of December 31, 2016 and 2015.
The value of the Series B Preferred Stock, for accounting purposes, is being accreted up to redemption value from the date of issuance to the earliest redemption date of the instrument using the effective interest rate method. If the Series B Preferred Stock had been redeemed as of December 31, 2016, the redemption amount applicable at such date would have been approximately $15.6 million.
The primary terms of the Series B Preferred Stock is as follows:
Rank - The Series B Preferred Stock ranks senior in right of payment to the common stock and any class or series of capital stock that is junior to the Series B Preferred Stock, and pari passu with any series of the Company's preferred stock that is by its terms ranked pari passu in right of payment as to dividends and liquidation with the Series B Preferred Stock.
Conversion - The Series B Preferred Stock is convertible into the Company's common stock at an initial rate of nine common shares per share of Series B Preferred Stock (as adjusted for the Share Consolidation) (subject to further adjustment). If all such Series B Preferred Stock is converted, at the initial conversion rate, 5,292,531 shares of common stock will be issued to holders of the Series B Preferred Stock. Notwithstanding the foregoing, pursuant to a Certificate of Designation, no holder of the Series B Preferred Stock is entitled to effect a conversion of Series B Preferred Stock if such conversion would result in the holder (and affiliates) beneficially owning 20% or more of the Company's common stock.
Dividends Rights - The Series B Preferred Stock is entitled to receive preferential dividends equal to five percent (5%) per annum of the original issue price per share, payable quarterly in February, May, August, and November of each year. Such dividends may be paid by the Company in cash or in kind (in the form of additional shares of Series B Preferred Stock). In the event that the payment in cash or in kind of any such dividend would cause the Company to violate a covenant under its debt agreements, the obligation to pay, in cash or in kind, will be suspended until and only to the extent any restrictions under the debt agreements lapse or are no longer applicable. During any such suspension period, the preferential dividends shall continue to accrue and accumulate. As shares of the Series B Preferred Stock are convertible into shares of the Company's common stock, each dividend paid in kind will have a dilutive effect on the Company's shares of common stock. The dividends paid on February 28, 2016, were paid in cash. Dividends for all quarterly periods in the years ended December 31, 2015 and 2014 have been paid in cash.
Liquidation - Upon any voluntary or involuntary liquidation, dissolution, or winding up of the Company, no distribution shall be made as follows:
(i) | to the holders of shares ranking junior to the Series B Preferred Stock unless the holders of Series B Preferred Stock shall have received an amount equal to the original issue price per share of the Series B Preferred Stock (subject to adjustment) plus an amount equal to accumulated and unpaid dividends and distributions thereon to the date of such payment, and |
(ii) | to the holders of shares ranking on a parity with the Series B Preferred Stock, unless simultaneously therewith distributions are made ratably on the Series B Preferred Stock and all other such parity stock in proportion to the total amounts to which the holders of Series B Preferred Stock are entitled. |
82
Voting Rights - The holders of Series B Preferred Stock are not entitled to any voting rights except as provided in the following sentence, in the Company's bylaws or otherwise under the Texas law. If the preferential dividends on the Series B Preferred Stock have not been declared and paid in full in cash or in kind for eight or more quarterly dividend periods (whether or not consecutive), the holders of the Series B Preferred Stock shall be entitled to vote at any meeting of shareholders with the holders of common stock and to cast the number of votes equal to the number of whole Common Shares into which the Series B Preferred Stock held by such holders are then convertible.
Redemption - All or any number of the shares of Series B Preferred Stock may be redeemed by the Company at any time after May 28, 2013 at a redemption price of $25 per share plus accrued and unpaid dividends and provided that the current equity value of the Company's common stock exceeds a five day volume weighted average of $3.33 per share. On May 28, 2017, the Company is required to redeem any Series B Preferred Stock then outstanding at a redemption price determined in accordance with the Certificate of Designation plus accrued but unpaid dividends. Such mandatory redemption may, at the Company's election, be paid in cash or in common shares (valued for such purpose at 95% of the then fair market value of the common stock). In the event certain corporate transactions occur (such as a reorganization, recapitalization, reclassification, consolidation or merger) under which the Company's common stock (but not the Series B Preferred Stock) is converted into or exchanged for securities, cash or other property, then following such transaction, each share of Series B Preferred Stock shall thereafter be convertible into the same kind and amount of securities, cash or other property.
Certain of the redemption features are outside of the Company's control, and as a result, the Series B Preferred Stock have been reflected in the consolidated balance sheet as temporary equity.
Preferred stock dividends are recorded at their fair value. If paid in cash, the amount paid represents fair value. If paid in kind, the fair value of the preferred stock dividends is determined using valuation techniques that include a component representing the intrinsic value of the dividends (which represents the fair value of the common stock into which the preferred stock could be converted) and an option component (which is determined using a Black-Scholes Option Pricing Model). Dividends and accretion for each of the years ended December 31, 2016, 2015, and 2014 were $0.8 million. The Company has paid the quarterly dividends through February 29, 2016, but did not make the dividend payments due on May 28, 2016, August 28, 2016, November 28, 2016 and February 28, 2017.
The Plan, as described in Note 2 - Chapter 11 Proceedings, provides that all existing Equity Interests (as defined in the Plan and which include FES Ltd.'s common stock, FES Ltd.'s Company's preferred stock, awards under the Compensation Plan and the preferred stock purchase rights under Rights Agreement) in the FES Ltd. will be extinguished without recovery. On March 29, 2017, the Plan was confirmed by the Bankruptcy Court and the Company expects the consummation of the Plan to become effective on or about April 13, 2017.
18. Supplemental Financial Information Quarterly Financial Data (Unaudited)
First Quarter | Second Quarter | Third Quarter | Fourth Quarter | ||||||||||||
(in thousands except for per share amounts) | |||||||||||||||
2016: | |||||||||||||||
Revenues | $ | 31,931 | $ | 28,411 | $ | 27,857 | $ | 28,006 | |||||||
Operating loss (1) | (17,495 | ) | (31,790 | ) | (16,273 | ) | (15,551 | ) | |||||||
Net loss (1) | (24,468 | ) | (38,686 | ) | (23,209 | ) | (22,766 | ) | |||||||
Preferred stock dividends | (194 | ) | (194 | ) | (194 | ) | (194 | ) | |||||||
Loss attributable to common shares | (24,662 | ) | (38,880 | ) | (23,403 | ) | (22,960 | ) | |||||||
Loss per share: | |||||||||||||||
Basic and diluted | (1.11 | ) | (1.75 | ) | (1.05 | ) | (1.04 | ) | |||||||
2015: | |||||||||||||||
Revenues | $ | 84,333 | $ | 62,810 | $ | 55,557 | $ | 41,407 | |||||||
Operating income (loss) | 356 | (6,858 | ) | (11,218 | ) | (17,217 | ) | ||||||||
Net loss - as previously reported | (4,434 | ) | (8,748 | ) | (13,510 | ) | (19,382 | ) | |||||||
Correction of error (2) | (2,000 | ) | — | — | 2,000 | ||||||||||
Net loss - as revised | (6,434 | ) | (8,748 | ) | (13,510 | ) | (17,382 | ) | |||||||
Preferred stock dividends | (194 | ) | (194 | ) | (194 | ) | (194 | ) | |||||||
Loss attributable to common shares - as previously reported | (4,628 | ) | (8,942 | ) | (13,704 | ) | (19,576 | ) | |||||||
Correction of error (2) | (2,000 | ) | — | — | 2,000 | ||||||||||
Loss attributable to common shares - as revised | (6,628 | ) | (8,942 | ) | (13,704 | ) | (17,576 | ) | |||||||
Loss per share: | |||||||||||||||
Basic and diluted - as previously reported | (0.21 | ) | (0.41 | ) | (0.62 | ) | (0.88 | ) | |||||||
Correction of error (2) | (0.09 | ) | — | — | 0.09 | ||||||||||
Basic and diluted - as revised | (0.30 | ) | (0.41 | ) | (0.62 | ) | (0.79 | ) | |||||||
(1) Operating and net losses for the quarter ended June 30, 2016 include an impairment loss of $14.5 million.
(2) During the preparation of its 2016 consolidated financial statements, the Company identified an error in its 2015 deferred tax analysis. The Company has corrected the 2015 tax information noted above to reflect an adjustment to reduce deferred income tax assets relating to stock-based compensation by $2.0 million with a similar reduction of the valuation allowance. This adjustment had no impact on the Company's consolidated balance sheet as of December 31, 2015, or annual statement of operations, cash flows, or stockholders' equity for any periods presented. The Company has evaluated the impact of this restatement and determined that it was not material.
83
Item 9.Changes in or Disagreements with Accountants on Accounting and Financial Disclosure
Not applicable.
Item 9A. | Controls and Procedures |
Evaluation of Disclosure Controls and Procedures
The Company's management, with the participation of its chief executive officer and chief financial officer, evaluated the effectiveness of the Company's disclosure controls and procedures as of December 31, 2016. The term “disclosure controls and procedures,” as defined in Rules 13a-15(e) and 15d-15(e) under the Securities Exchange Act of 1934, as amended or the Exchange Act, means controls and other procedures of a company that are designed to ensure that information required to be disclosed by a company in the reports that it files or submits under the Exchange Act is recorded, processed, summarized and reported, within the time periods specified in the SECs rules and forms. Disclosure controls and procedures include, without limitation, controls and procedures designed to ensure that information required to be disclosed by a company in the reports that it files or submits under the Exchange Act is accumulated and communicated to the Company’s management, including its principal executive and principal financial officers, as appropriate to allow timely decisions regarding required disclosure. Management recognizes that any controls and procedures, no matter how well designed and operated, can provide only reasonable assurance of achieving their objectives and management necessarily applies its judgment in evaluating the cost-benefit relationship of possible controls and procedures. Based on the evaluation of the Company's disclosure controls and procedures as of December 31, 2016, the Company's chief executive officer and chief financial officer concluded that, as of such date, the Company's disclosure controls and procedures over financial reporting were effective.
Management's Report on Internal Control Over Financial Reporting
Management of the Company is responsible for establishing and maintaining adequate internal control over financial reporting, as such term is defined in Rule 13(a)-15(f) or Rule15d-15(f) under the Exchange Act. Internal control over financial reporting is a process to provide reasonable assurance regarding the reliability of the Company's financial reporting for external purposes in accordance with U.S. generally accepted accounting principles. Internal control over financial reporting includes maintaining records that, in reasonable detail, accurately and fairly reflect the Company's transactions; providing reasonable assurance that transactions are recorded as necessary for preparation of the Company's financial statements in accordance with U.S. generally accepted accounting principles; providing reasonable assurance that receipts and expenditures of company assets are made in accordance with authorizations of the Company’s management and board of directors; and providing reasonable assurance that unauthorized acquisition, use or disposition of company assets that could have a material effect on the Company's financial statements would be prevented or detected on a timely basis.
The Company's management conducted an evaluation of the effectiveness of internal control over financial reporting based on the Internal Control—Integrated Framework (2013) issued by the Committee of Sponsoring Organizations of the Treadway Commission. Based on the evaluation of the Company's internal control over financial reporting as of December 31, 2016, the Company's chief executive officer and chief financial officer concluded that, as of such date, the Company's internal control over financial reporting is effective.
Changes in Internal Control Over Financial Reporting
No change in the Company's internal control over financial reporting (as defined in Rules 13a-15(f) and 15d-15(f) under the Exchange Act) occurred during the fourth quarter of 2016 that has materially affected, or is reasonably likely to materially affect, the Company's internal control over financial reporting.
Item 9B. | Other Information |
Not Applicable.
84
PART III
Item 10. | Directors, Executive Officers and Corporate Governance |
The information required under this item will be filed in a definitive proxy statement within 120 days after December 31, 2016 pursuant to General Instruction G(3) of Form 10-K.
Item 11. | Executive Compensation |
The information required under this item will be filed in a definitive proxy statement within 120 days after December 31, 2016 pursuant to General Instruction G(3) of Form 10-K.
Item 12. | Security Ownership of Certain Beneficial Owners and Management and Related Stockholder Matters |
The information required under this item will be filed in a definitive proxy statement within 120 days after December 31, 2016 pursuant to General Instruction G(3) of Form 10-K.
Item 13. | Certain Relationships and Related Transaction, and Director Independence |
The information required under this item will be filed in a definitive proxy statement within 120 days after December 31, 2016 pursuant to General Instruction G(3) of Form 10-K.
Item 14. | Principal Accounting Fees and Services |
The information required under this item will be filed in a definitive proxy statement within 120 days after December 31, 2016 pursuant to General Instruction G(3) of Form 10-K.
85
PART IV
Item 15. | Exhibits, Financial Statement Schedules |
(a) | The following items are filed as part of this report: |
1. | Financial Statements. The financial statements and information required by Item 8 appear on pages 52 through 85 of this report. The Index to Consolidated Financial Statements appears on page 52. |
2. | Financial Statement Schedules. All schedules are omitted because they are not applicable or the required information is shown in the financial statements or the notes thereto. |
3. | Exhibits. The Exhibits set forth below. |
Number | Description of Exhibits | |
2.1 — | Plan of Conversion of Forbes Energy Services Ltd. (incorporated by reference to Exhibit 2.1 to the Company’s Registration Statement on Form 8-A filed August 12, 2011). | |
2.2 — | Certificate of Conversion of Forbes Energy Services Ltd. (incorporated by reference to Exhibit 2.2 to the Company’s Registration Statement on Form 8-A filed August 12, 2011). | |
2.3 — | Disclosure Statement and Exhibits, including the Prepackaged Joint Plan of Reorganization (incorporated by reference to Exhibit 99.1 to the Company's Current Report on Form 8-K filed December 23, 2016). | |
3.1 — | Certificate of Formation of Forbes Energy Services Ltd. (including the certificates of designation for the Company’s Series A Preferred Stock and Series B Preferred Stock attached as appendices thereto) (incorporated by reference to Exhibit 3.1 to the Company’s Registration Statement on Form 8-A filed August 12, 2011). | |
3.2 — | Amended and Restated Bylaws of Forbes Energy Services Ltd. (incorporated by reference to Exhibit 3.2 to the Company’s Registration Statement on Form 8-A filed August 12, 2011). | |
3.3 — | Certificate of Correction to Certificate of Conversion (incorporated by reference to Exhibit 3.3 of the Company's Quarterly Report on Form 10-Q for the quarter ended March 31, 2014). | |
4.1 — | Rights Agreement dated as of May 19, 2008, between Forbes Energy Services Ltd. and CIBC Mellon Trust Company, as Rights Agent, which includes as Exhibit A the Certificate of Designations of Series A Junior Participating Preferred Shares, as Exhibit B the form of Right Certificate and as Exhibit C the form of Summary of Rights to Purchase Shares (incorporated by reference to Exhibit 4.8 to the Company’s Registration Statement on Form S-4/A filed June 27, 2008, Registration No. 333-150853). | |
4.2 — | Indenture dated June 7, 2011, among Forbes Energy Services Ltd., as issuer, the guarantors party thereto and Wells Fargo Bank, N.A., as trustee (incorporated by reference to Exhibit 4.1 to the Company’s Current Report on Form 8-K filed June 7, 2011). | |
4.3 — | Amended and Restated Certificate of Designation of the Series B Senior Convertible Preferred Shares (incorporated by reference to Exhibit 4.1 to the Company’s Current Report on Form 8-K filed January 25, 2011). | |
4.4 — | Specimen Certificate for the Company’s common stock, $0.04 par value (incorporated by reference to Exhibit 4.2 to the Company’s Registration Statement on Form 8-A filed August 12, 2011). | |
4.5 — | Specimen Global 9% Senior Note Due 2019 (incorporated by reference to Exhibit 4.15 to the Company’s Registration Statement on Form S-4/A filed October 6, 2011, Registration No. 333-176794-5). | |
86
4.6 — | Amendment to Rights Agreement dated as of July 8, 2013, between Forbes Energy Services Ltd. and CIBC Mellon Trust Company, as Rights Agent (incorporated by reference to Exhibit 4.1 to the Company’s Current Report on Form 8-K filed June 8, 2013). | |
10.1 — | Forbes Energy Services Ltd. Incentive Compensation Plan effective May 19, 2008 (incorporated by reference to Exhibit 10.1 to the Company’s Registration Statement on Form S-4/A filed June 27, 2008, Registration No. 333-150853). | |
10.2 — | Amendment to 2008 Incentive Compensation Plan (incorporated by reference to Exhibit 10.18 to the Company’s Registration Statement on Form S-4/A filed on August 8, 2011, Registration No. 333-170741). | |
10.3 — | Employment Agreement effective May 1, 2008, by and between John E. Crisp and Forbes Energy Services LLC (incorporated by reference to Exhibit 10.2 to the Company’s Registration Statement on Form S-4/A filed June 27, 2008, Registration No. 333-150853). | |
10.4 — | Employment Agreement effective May 1, 2008, by and between Charles C. Forbes and Forbes Energy Services LLC (incorporated by reference to Exhibit 10.3 to the Company’s Registration Statement on Form S-4/A filed June 27, 2008, Registration No. 333-150853). | |
10.5 — | Employment Agreement effective May 1, 2008, by and between L. Melvin Cooper and Forbes Energy Services LLC (incorporated by reference to Exhibit 10.4 to the Company’s Registration Statement on Form S-4/A filed June 27, 2008, Registration No. 333-150853). | |
10.6 — | Form of Executive Non-Qualified Stock Option Agreement (incorporated by reference to Exhibit 10.6 to the Company’s Registration Statement on Form S-4/A filed June 27, 2008, Registration No. 333-150853). | |
10.7 — | Form of Director Non-Qualified Stock Option Agreement (incorporated by reference to Exhibit 10.7 to the Company’s Registration Statement on Form S-4/A filed June 27, 2008, Registration No. 333-150853). | |
10.8 — | Subscription Agreement dated as of May 17, 2010, by and among Forbes Energy Services Ltd., West Face Long Term Opportunities Limited Partnership, West Face Long Term Opportunities (USA) Limited Partnership and West Face Long Term Opportunities Master Fund L.P., including the Form of Certificate of Designation of Series B Senior Convertible Preferred Shares and Form of Registration Rights Agreement attached as exhibits thereto (incorporated by reference to the Company’s Quarterly Report on Form 10-Q for the quarter ended March 31, 2010). | |
10.9 — | Registration Rights Agreement dated as of May 28, 2010, between Forbes Energy Services Ltd. and the Shareholders listed therein (incorporated by reference to Exhibit 10.1 to the Company’s Current Report on Form 8-K filed May 28, 2010). | |
10.10 — | Loan and Security Agreement, dated as of September 9, 2011, by and among Forbes Energy Services LLC, Forbes Energy International, LLC, TX Energy Services, LLC, C.C. Forbes, LLC, and Superior Tubing Testers, LLC, as borrowers, Forbes Energy Services Ltd., as guarantor, certain lenders party thereto, and Regions Bank, as administrative agent for the lenders (incorporated by reference to Exhibit 10.15 to the Company’s Registration Statement on Form S-4 filed September 13, 2011, Registration No. 333-176794). | |
10.11 — | First Amendment to Loan and Security Agreement, dated as of December 13, 2011, by and among Forbes Energy Services LLC, Forbes Energy International, LLC, TX Energy Services, LLC, C.C. Forbes, LLC and Superior Tubing Testers, LLC, as borrowers, Forbes Energy Services Ltd., as guarantor, certain lenders party thereto, and Regions Bank, as administrative agent for the lenders (incorporated by reference to Exhibit 10.1 to the Company’s Current Report on Form 8-K filed December 19, 2011). | |
10.12 — | Master Agreement dated June 6, 2012 among TX Energy Services, LLC, C.C. Forbes, LLC, Regions Equipment Finance Corporation, and Regions Commercial Equipment Finance, LLC, including the First Amendment to Master Agreement dated as of July 12, 2012 (incorporated by reference to exhibit 10.3 to the Company's Quarterly Report on form 10-Q for the quarter ended June 30, 2012). | |
87
10.13 — | Continuing Guaranty Agreement dated June 6, 2012 among Forbes Energy Services Ltd., TX Energy Services, LLC, C.C. Forbes, LLC, Regions Equipment Finance Corporation and Regions Commercial Equipment Finance, LLC (incorporated by reference to Exhibit 10.3 to the Company's Quarterly Report on Form 10-Q for the quarter ended June 30, 2012). | |
10.14 — | Second Amendment to Loan and Security Agreement, dated as of July 3, 2012, by and among Forbes Energy Services LLC, Forbes Energy International, LLC, TX Energy Services, LLC, C.C. Forbes, LLC, and Superior Tubing Testers, LLC, as borrowers, Forbes Energy Services Ltd., as guarantor, certain lender party thereto, and Regions Bank, as administrative agent for the lenders (incorporated by reference to Exhibit 10.1 to the Company's Current Report on form 8-K filed July 10, 2012). | |
10.15 — | 2012 Incentive Compensation Plan of Forbes Energy Services Ltd. (incorporated by reference to Exhibit 10.2 to the Company's Current Report on Form 8-K filed on July 10, 2012). | |
10.16* — | Form of Restricted Stock Award Agreement for directors. | |
10.17 — | Form of Restricted Stock Award Agreement for consultants and employees (incorporated by reference to Exhibit 10.24 to the Company's Annual Report on Form 10-K for the year ended December 31, 2012). | |
10.18 — | Form of Restricted Stock Unit Award Agreement (incorporated by reference to Exhibit 10.25 to the Company's Annual Report on Form 10-K for the year ended December 31, 2012). | |
10.19 — | Annual Bonus Plan (incorporated by reference to Exhibit 10.26 to the Company's Annual Report on Form 10-K for the year ended December 31, 2012). | |
10.20 — | Form of Recoupment Clawback Executive Acknowledgement (incorporated by reference to Exhibit 10.1 of the Company's Quarterly Report on Form 10-Q for the quarter ended March 31, 2014). | |
10.21 — | Form of Indemnification Agreement for directors, officers, and key employees. | |
10.22 — | Third Amendment to Loan and Security Agreement, dated as of July 25, 2013, by and among Forbes Energy Services LLC, Forbes Energy International, LLC, TX Energy Services, LLC, C.C. Forbes, LLC and Superior Tubing Testers, LLC, as borrowers, Forbes Energy Services Ltd., as guarantor, certain lenders party thereto, and Regions Bank, as administrative agent for the lenders (incorporated by reference to Exhibit 10.1 to the Company’s Current Report on Form 8-K filed August 1, 2013). | |
10.23 — | Forbearance Agreement and Fourth Amendment to Loan and Security Agreement made and entered into on July 15, 2016, by and among Forbes Energy Services Ltd., Forbes Energy Services LLC, TX Energy Services, LLC, C.C. Forbes, LLC, Forbes Energy International, LLC, lenders party thereto and Regions Bank, as agent for such lenders and other secured parties (incorporated by reference to Exhibit 10.1 to the Company’s Quarterly Report on Form 10-Q for the quarter ended June 30, 2016). | |
10.24 — | Forbearance Agreement made and entered into on July 15, 2016, by and among Forbes Energy Services Ltd., as issuer, or the issuer, of the 9% senior notes due 2019, or the Notes, issued pursuant to that certain indenture dated as of June 7, 2011 by and among the Issuer, Guarantors (as defined below) and Wells Fargo Bank, National Association, as trustee, Forbes Energy Services LLC, TX Energy Services, LLC, C.C. Forbes, LLC and Forbes Energy International, LLC, or the Guarantors, and certain beneficial holders of the Notes party thereto (incorporated by reference to Exhibit 10.2 to the Company’s Quarterly Report on Form 10-Q for the quarter ended June 30, 2016). | |
10.25 — | Amendment No. 1 to the Forbearance Agreement, dated as of September 13, 2016, by and among Forbes Energy Services Ltd., as issuer, or the Issuer, of the 9% senior notes due 2019, or the Notes, issued pursuant to that certain indenture dated as of June 7, 2011 by and among the Issuer, the Guarantors (as defined below) and Wells Fargo Bank, National Association, as trustee, Forbes Energy Services, LLC, TX Energy Services, LLC, C.C. Forbes, LLC and Forbes Energy International, LLC, or the Guarantors, and certain beneficial holders of the Notes party thereto (incorporated by reference to Exhibit 10.1 to the Company’s Current Report on Form 8-K filed September 16, 2016). | |
10.26 — | Amendment No. 2 to the Forbearance Agreement, dated as of October 14, 2016 (incorporated by reference to Exhibit 10.1 to the Company’s Current Report on Form 8-K filed October 18, 2016). | |
88
10.27 — | First Amendment to Forbearance Agreement and Fourth Amendment to Loan and Security Agreement made and entered into on October 14, 2016 (incorporated by reference to Exhibit 10.2 to the Company’s Current Report on Form 8-K filed October 18, 2016). | |
10.28 — | Amendment No. 3 to the Forbearance Agreement dated as of November 15, 2016 (incorporated by reference to Exhibit 10.1 to the Company’s Current Report on Form 8-K filed November 17, 2016). | |
10.29 — | Amendment No. 4 to the Forbearance Agreement dated as of November 30, 2016 (incorporated by reference to Exhibit 10.1 to the Company’s Current Report on Form 8-K filed December 1, 2016). | |
10.30 — | Amendment No. 5 to the Forbearance Agreement dated as of December 14, 2016 (incorporated by reference to Exhibit 10.1 to the Company’s Current Report on Form 8-K filed December 16, 2016). | |
10.31 — | Restructuring Support Agreement dated December 21, 2016 (incorporated by reference to Exhibit 10.1 to the Company’s Current Report on Form 8-K filed December 23, 2016). | |
10.32 — | Backstop Agreement dated December 21, 2016 (incorporated by reference to Exhibit 10.2 to the Company’s Current Report on Form 8-K filed December 23, 2016). | |
10.33 — | Amended and Restated Forbearance Agreement and Fourth Amendment to Loan and Security Agreement dated as of December 23, 2016 (incorporated by reference to Exhibit 10.1 to the Company’s Current Report on Form 8-K filed December 28, 2016). | |
21.1* — | Subsidiaries of Forbes Energy Services Ltd. | |
23.1* — | Consent of BDO USA, LLP. | |
31.1* — | Certification of Chief Executive Officer pursuant to Rule 13a-14(a)/15d-14(a). | |
31.2* — | Certification of Chief Financial Officer pursuant to Rule 13a-14(a)/15d-14(a). | |
32.1* — | Certification of Chief Executive Officer Pursuant to Section 18 U.S.C. Section 1350, as Adopted Pursuant to Section 906 of the Sarbanes-Oxley Act of 2002. | |
32.2* — | Certification of Chief Financial Officer Pursuant to Section 18 U.S.C. Section 1350, as Adopted Pursuant to Section 906 of the Sarbanes-Oxley Act of 2002. | |
101* — | Interactive Data Files. | |
____________________
* | Filed herewith. |
Item 16. Form 10-K Summary
None.
89
SIGNATURES
Pursuant to the requirements of Section 13 or 15(d) of the Securities Exchange Act of 1934, as amended, the registrant has duly caused this report to be signed on its behalf by the undersigned, thereunto duly authorized, in the City of Alice, the State of Texas, on March 31, 2017.
FORBES ENERGY SERVICES LTD. | ||
By: | /S/ JOHN E. CRISP | |
John E. Crisp | ||
President and Chief Executive Officer | ||
Pursuant to the requirements of the Securities Exchange Act of 1934, as amended, this report has been signed by the following persons on behalf of the registrant and in the capacities and on the dates indicated.
Signature | Title | Date | ||
/s/ JOHN E. CRISP (John E. Crisp) | Chairman of the Board, President, Chief Executive Officer and Director (Principal Executive Officer) | March 31, 2017 | ||
/s/ L. MELVIN COOPER (L. Melvin Cooper) | Senior Vice President, Chief Financial Officer and Secretary (Principal Financial and Accounting Officer) | March 31, 2017 | ||
/s/ CHARLES C. FORBES (Charles C. Forbes) | Director | March 31, 2017 | ||
/s/ DALE W. BOSSERT (Dale W. Bossert) | Director | March 31, 2017 | ||
/s/ TRAVIS H. BURRIS (Travis H. Burris) | Director | March 31, 2017 | ||
/s/ WILLIAM W. SHERRILL (William W. Sherrill) | Director | March 31, 2017 | ||
/s/ TED W. IZATT (Ted W. Izatt) | Director | March 31, 2017 | ||
EXHIBIT INDEX
Number | Description of Exhibits | |
2.1 — | Plan of Conversion of Forbes Energy Services Ltd. (incorporated by reference to Exhibit 2.1 to the Company’s Registration Statement on Form 8-A filed August 12, 2011). | |
2.2 — | Certificate of Conversion of Forbes Energy Services Ltd. (incorporated by reference to Exhibit 2.2 to the Company’s Registration Statement on Form 8-A filed August 12, 2011). | |
90
2.3 — | Disclosure Statement and Exhibits, including the Prepackaged Joint Plan of Reorganization (incorporated by reference to Exhibit 99.1 to the Company’s Current Report on Form 8-K filed December 23, 2016). | |
3.1 — | Certificate of Formation of Forbes Energy Services Ltd. (including the certificates of designation for the Company’s Series A Preferred Stock and Series B Preferred Stock attached as appendices thereto) (incorporated by reference to Exhibit 3.1 to the Company’s Registration Statement on Form 8-A filed August 12, 2011). | |
3.2 — | Amended and Restated Bylaws of Forbes Energy Services Ltd. (incorporated by reference to Exhibit 3.2 to the Company’s Registration Statement on Form 8-A filed August 12, 2011). | |
3.3 — | Certificate of Correction to Certificate of Conversion (incorporated by reference to Exhibit 3.3 of the Company's Quarterly Report on Form 10-Q for the quarter ended March 31, 2014). | |
4.1 — | Rights Agreement dated as of May 19, 2008, between Forbes Energy Services Ltd. and CIBC Mellon Trust Company, as Rights Agent, which includes as Exhibit A the Certificate of Designations of Series A Junior Participating Preferred Shares, as Exhibit B the form of Right Certificate and as Exhibit C the form of Summary of Rights to Purchase Shares (incorporated by reference to Exhibit 4.8 to the Company’s Registration Statement on Form S-4/A filed June 27, 2008, Registration No. 333-150853). | |
4.2 — | Indenture dated June 7, 2011, among Forbes Energy Services Ltd., as issuer, the guarantors party thereto and Wells Fargo Bank, N.A., as trustee (incorporated by reference to Exhibit 4.1 to the Company’s Current Report on Form 8-K filed June 7, 2011). | |
4.3 — | Amended and Restated Certificate of Designation of the Series B Senior Convertible Preferred Shares (incorporated by reference to Exhibit 4.1 to the Company’s Current Report on Form 8-K filed January 25, 2011). | |
4.4 — | Specimen Certificate for the Company’s common stock, $0.04 par value (incorporated by reference to Exhibit 4.2 to the Company’s Registration Statement on Form 8-A filed August 12, 2011). | |
4.5 — | Specimen Global 9% Senior Note Due 2019 (incorporated by reference to Exhibit 4.15 to the Company’s Registration Statement on Form S-4/A filed October 6, 2011, Registration No. 333-176794-5). | |
4.6 — | Amendment to Rights Agreement dated as of July 8, 2013, between Forbes Energy Services Ltd. and CIBC Mellon Trust Company, as Rights Agent (incorporated by reference to Exhibit 4.1 to the Company’s Current Report on Form 8-K filed June 8, 2013). | |
10.1 — | Forbes Energy Services Ltd. Incentive Compensation Plan effective May 19, 2008 (incorporated by reference to Exhibit 10.1 to the Company’s Registration Statement on Form S-4/A filed June 27, 2008, Registration No. 333-150853). | |
10.2 — | Amendment to 2008 Incentive Compensation Plan (incorporated by reference to Exhibit 10.18 to the Company’s Registration Statement on Form S-4/A filed on August 8, 2011, Registration No. 333-170741). | |
10.3 — | Employment Agreement effective May 1, 2008, by and between John E. Crisp and Forbes Energy Services LLC (incorporated by reference to Exhibit 10.2 to the Company’s Registration Statement on Form S-4/A filed June 27, 2008, Registration No. 333-150853). | |
10.4 — | Employment Agreement effective May 1, 2008, by and between Charles C. Forbes and Forbes Energy Services LLC (incorporated by reference to Exhibit 10.3 to the Company’s Registration Statement on Form S-4/A filed June 27, 2008, Registration No. 333-150853). | |
91
10.5 — | Employment Agreement effective May 1, 2008, by and between L. Melvin Cooper and Forbes Energy Services LLC (incorporated by reference to Exhibit 10.4 to the Company’s Registration Statement on Form S-4/A filed June 27, 2008, Registration No. 333-150853). | |
10.6 — | Form of Executive Non-Qualified Stock Option Agreement (incorporated by reference to Exhibit 10.6 to the Company’s Registration Statement on Form S-4/A filed June 27, 2008, Registration No. 333-150853). | |
10.7 — | Form of Director Non-Qualified Stock Option Agreement (incorporated by reference to Exhibit 10.7 to the Company’s Registration Statement on Form S-4/A filed June 27, 2008, Registration No. 333-150853). | |
10.8 — | Subscription Agreement dated as of May 17, 2010, by and among Forbes Energy Services Ltd., West Face Long Term Opportunities Limited Partnership, West Face Long Term Opportunities (USA) Limited Partnership and West Face Long Term Opportunities Master Fund L.P., including the Form of Certificate of Designation of Series B Senior Convertible Preferred Shares and Form of Registration Rights Agreement attached as exhibits thereto (incorporated by reference to the Company’s Quarterly Report on Form 10-Q for the quarter ended March 31, 2010). | |
10.9 — | Registration Rights Agreement dated as of May 28, 2010, between Forbes Energy Services Ltd. and the Shareholders listed therein (incorporated by reference to Exhibit 10.1 to the Company’s Current Report on Form 8-K filed May 28, 2010). | |
10.10 — | Loan and Security Agreement, dated as of September 9, 2011, by and among Forbes Energy Services LLC, Forbes Energy International, LLC, TX Energy Services, LLC, C.C. Forbes, LLC, and Superior Tubing Testers, LLC, as borrowers, Forbes Energy Services Ltd., as guarantor, certain lenders party thereto, and Regions Bank, as administrative agent for the lenders (incorporated by reference to Exhibit 10.15 to the Company’s Registration Statement on Form S-4 filed September 13, 2011, Registration No. 333-176794). | |
10.11 — | First Amendment to Loan and Security Agreement, dated as of December 13, 2011, by and among Forbes Energy Services LLC, Forbes Energy International, LLC, TX Energy Services, LLC, C.C. Forbes, LLC and Superior Tubing Testers, LLC, as borrowers, Forbes Energy Services Ltd., as guarantor, certain lenders party thereto, and Regions Bank, as administrative agent for the lenders (incorporated by reference to Exhibit 10.1 to the Company’s Current Report on Form 8-K filed December 19, 2011). | |
10.12 — | Master Agreement dated June 6, 2012 among TX Energy Services, LLC, C.C. Forbes, LLC, Regions Equipment Finance Corporation, and Regions Commercial Equipment Finance, LLC, including the First Amendment to Master Agreement dated as of July 12, 2012 (incorporated by reference to exhibit 10.3 to the Company's Quarterly Report on form 10-Q for the quarter ended June 30, 2012). | |
10.13 — | Continuing Guaranty Agreement dated June 6, 2012 among Forbes Energy Services Ltd., TX Energy Services, LLC, C.C. Forbes, LLC, Regions Equipment Finance Corporation and Regions Commercial Equipment Finance, LLC (incorporated by reference to Exhibit 10.3 to the Company's Quarterly Report on Form 10-Q for the quarter ended June 30, 2012). | |
10.14 — | Second Amendment to Loan and Security Agreement, dated as of July 3, 2012, by and among Forbes Energy Services LLC, Forbes Energy International, LLC, TX Energy Services, LLC, C.C. Forbes, LLC, and Superior Tubing Testers, LLC, as borrowers, Forbes Energy Services Ltd., as guarantor, certain lender party thereto, and Regions Bank, as administrative agent for the lenders (incorporated by reference to Exhibit 10.1 to the Company's Current Report on form 8-K filed July 10, 2012). | |
10.15 — | 2012 Incentive Compensation Plan of Forbes Energy Services Ltd. (incorporated by reference to Exhibit 10.2 to the Company's Current Report on Form 8-K filed on July 10, 2012). | |
10.16* — | Form of Restricted Stock Award Agreement for directors. | |
10.17 — | Form of Restricted Stock Award Agreement for consultants and employees (incorporated by reference to Exhibit 10.24 to the Company's Annual Report on Form 10-K for the year ended December 31, 2012). | |
10.18 — | Form of Restricted Stock Unit Award Agreement (incorporated by reference to Exhibit 10.25 to the Company's Annual Report on Form 10-K for the year ended December 31, 2012). | |
92
10.19 — | Annual Bonus Plan (incorporated by reference to Exhibit 10.26 to the Company's Annual Report on Form 10-K for the year ended December 31, 2012). | |
10.20 — | Form of Recoupment Clawback Executive Acknowledgement (incorporated by reference to Exhibit 10.1 of the Company's Quarterly Report on Form 10-Q for the quarter ended March 31, 2014). | |
10.21 — | Form of Indemnification Agreement for directors, officers, and key employees. | |
10.22 — | Third Amendment to Loan and Security Agreement, dated as of July 25, 2013, by and among Forbes Energy Services LLC, Forbes Energy International, LLC, TX Energy Services, LLC, C.C. Forbes, LLC and Superior Tubing Testers, LLC, as borrowers, Forbes Energy Services Ltd., as guarantor, certain lenders party thereto, and Regions Bank, as administrative agent for the lenders (incorporated by reference to Exhibit 10.1 to the Company’s Current Report on Form 8-K filed August 1, 2013). | |
10.23 — | Forbearance Agreement and Fourth Amendment to Loan and Security Agreement made and entered into on July 15, 2016, by and among Forbes Energy Services Ltd., Forbes Energy Services LLC, TX Energy Services, LLC, C.C. Forbes, LLC, Forbes Energy International, LLC, lenders party thereto and Regions Bank, as agent for such lenders and other secured parties (incorporated by reference to Exhibit 10.1 to the Company’s Quarterly Report on Form 10-Q for the quarter ended June 30, 2016). | |
10.24 — | Forbearance Agreement made and entered into on July 15, 2016, by and among Forbes Energy Services Ltd., as issuer, or the issuer, of the 9% senior notes due 2019, or the Notes, issued pursuant to that certain indenture dated as of June 7, 2011 by and among the Issuer, Guarantors (as defined below) and Wells Fargo Bank, National Association, as trustee, Forbes Energy Services LLC, TX Energy Services, LLC, C.C. Forbes, LLC and Forbes Energy International, LLC, or the Guarantors, and certain beneficial holders of the Notes party thereto (incorporated by reference to Exhibit 10.2 to the Company’s Quarterly Report on Form 10-Q for the quarter ended June 30, 2016). | |
10.25 — | Amendment No. 1 to the Forbearance Agreement, dated as of September 13, 2016, by and among Forbes Energy Services Ltd., as issuer, or the Issuer, of the 9% senior notes due 2019, or the Notes, issued pursuant to that certain indenture dated as of June 7, 2011 by and among the Issuer, the Guarantors (as defined below) and Wells Fargo Bank, National Association, as trustee, Forbes Energy Services, LLC, TX Energy Services, LLC, C.C. Forbes, LLC and Forbes Energy International, LLC, or the Guarantors, and certain beneficial holders of the Notes party thereto (incorporated by reference to Exhibit 10.1 to the Company’s Current Report on Form 8-K filed September 16, 2016). | |
10.26 — | Amendment No. 2 to the Forbearance Agreement, dated as of October 14, 2016 (incorporated by reference to Exhibit 10.1 to the Company’s Current Report on Form 8-K filed October 18, 2016). | |
10.27 — | First Amendment to Forbearance Agreement and Fourth Amendment to Loan and Security Agreement made and entered into on October 14, 2016 (incorporated by reference to Exhibit 10.2 to the Company’s Current Report on Form 8-K filed October 18, 2016). | |
10.28 — | Amendment No. 3 to the Forbearance Agreement dated as of November 15, 2016 (incorporated by reference to Exhibit 10.1 to the Company’s Current Report on Form 8-K filed November 17, 2016). | |
10.29 — | Amendment No. 4 to the Forbearance Agreement dated as of November 30, 2016 (incorporated by reference to Exhibit 10.1 to the Company’s Current Report on Form 8-K filed December 1, 2016). | |
10.30 — | Amendment No. 5 to the Forbearance Agreement dated as of December 14, 2016 (incorporated by reference to Exhibit 10.1 to the Company’s Current Report on Form 8-K filed December 16, 2016). | |
10.31 — | Restructuring Support Agreement dated December 21, 2016 (incorporated by reference to Exhibit 10.1 to the Company’s Current Report on Form 8-K filed December 23, 2016). | |
10.32 — | Backstop Agreement dated December 21, 2016 (incorporated by reference to Exhibit 10.2 to the Company’s Current Report on Form 8-K filed December 23, 2016). | |
93
10.33 — | Amended and Restated Forbearance Agreement and Fourth Amendment to Loan and Security Agreement dated as of December 23, 2016 (incorporated by reference to Exhibit 10.1 to the Company’s Current Report on Form 8-K filed December 28, 2016). | |
21.1* — | Subsidiaries of Forbes Energy Services Ltd. | |
23.1* — | Consent of BDO USA, LLP. | |
31.1* — | Certification of Chief Executive Officer pursuant to Rule 13a-14(a)/15d-14(a). | |
31.2* — | Certification of Chief Financial Officer pursuant to Rule 13a-14(a)/15d-14(a). | |
32.1* — | Certification of Chief Executive Officer Pursuant to Section 18 U.S.C. Section 1350, as Adopted Pursuant to Section 906 of the Sarbanes-Oxley Act of 2002. | |
32.2* — | Certification of Chief Financial Officer Pursuant to Section 18 U.S.C. Section 1350, as Adopted Pursuant to Section 906 of the Sarbanes-Oxley Act of 2002. | |
101* — | Interactive Data Files. | |
____________________
* | Filed herewith. |
94