Attached files
| file | filename |
|---|---|
| EX-10.37 - EXHIBIT 10.37 - Eagle Bulk Shipping Inc. | ex10-37.htm |
| EX-32.2 - EXHIBIT 32.2 - Eagle Bulk Shipping Inc. | ex32-2.htm |
| EX-32.1 - EXHIBIT 32.1 - Eagle Bulk Shipping Inc. | ex32-1.htm |
| EX-31.2 - EXHIBIT 31.2 - Eagle Bulk Shipping Inc. | ex31-2.htm |
| EX-31.1 - EXHIBIT 31.1 - Eagle Bulk Shipping Inc. | ex31-1.htm |
| EX-23.3 - EXHIBIT 23.3 - Eagle Bulk Shipping Inc. | ex23-3.htm |
| EX-23.2 - EXHIBIT 23.2 - Eagle Bulk Shipping Inc. | ex23-2.htm |
| EX-23.1 - EXHIBIT 23.1 - Eagle Bulk Shipping Inc. | ex23-1.htm |
| EX-21.1 - EXHIBIT 21.1 - Eagle Bulk Shipping Inc. | ex21-1.htm |
| EX-10.38 - EXHIBIT 10.38 - Eagle Bulk Shipping Inc. | ex10-38.htm |
UNITED STATES SECURITIES AND EXCHANGE COMMISSION
Washington, D.C. 20549
FORM 10-K
☒ ANNUAL REPORT PURSUANT TO SECTION 13 OR 15(d) OF
THE
SECURITIES EXCHANGE ACT OF 1934
For the Fiscal Year Ended December 31, 2016
OR
☐ TRANSITION REPORT PURSUANT TO SECTION 13 OR 15(d) OF
THE
SECURITIES EXCHANGE ACT OF 1934
For the transition period from to
Commission File Number 001-33831
EAGLE BULK SHIPPING INC.
(Exact name of Registrant as specified in its charter)
|
Republic of the Marshall Islands |
98–0453513 |
|
(State or other jurisdiction of incorporation or organization) |
(I.R.S. Employer Identification No.) |
|
300 First Stamford Place, 5th Floor |
|
|
Stamford, Connecticut |
06902 |
|
(Address of principal executive offices) |
(Zip Code) |
Registrant’s telephone number, including area code: (203) 276–8100
Securities registered pursuant to Section 12(b) of the Act:
Common Stock, par value $0.01 per share
(Title of Class)
The Common Stock is registered on the Nasdaq Stock Market LLC
(Name of exchange on which registered)
Securities registered pursuant to Section 12(g) of the Act: None
Indicate by check mark if the registrant is a well-known seasoned issuer, as defined in Rule 405 of the Securities Act. Yes☐ No☒
Indicate by check mark if the registrant is not required to file reports pursuant to Section 13 or Section 15(d) of the Act. Yes☐ No☒
Indicate by check mark whether the registrant: (1) has filed all reports required to be filed by Section 13 or 15(d) of the Securities Exchange Act of 1934 during the preceding 12 months (or for such shorter period that the registrant was required to file such reports), and (2) has been subject to such filing requirements for the past 90 days. Yes☒ No☐
Indicate by check mark whether the registrant has submitted electronically and posted on its corporate Web site, if any, every Interactive Data File required to be submitted and posted pursuant to Rule 405 of Regulation S-T during the preceding 12 months (or for such shorter period that the registrant was required to submit and post such files). Yes☒ No☐
Indicate by check mark if disclosure of delinquent filers pursuant to Item 405 of Regulation S-K is not contained herein, and will not be contained, to the best of registrant’s knowledge, in definitive proxy or information statements incorporated by reference in Part III of this Form 10-K or any amendment to this Form 10-K.☒
Indicate by check mark whether the registrant is a large accelerated filer, an accelerated filer, a non-accelerated filer, or a smaller reporting company. See the definitions of “large accelerated filer”, “accelerated filer” and “smaller reporting company” in Rule 12b-2 of the Exchange Act. (Check one):
|
Large accelerated filer☐ |
Accelerated filer☐ |
Non-Accelerated filer☐ |
Smaller reporting company☒ |
(Do not check if a smaller reporting company)
Indicate by check mark whether the registrant is a shell company (as defined in Rule 12b-2 of the Act). Yes☐ No☒
The aggregate market value of the registrant’s common stock held by non-affiliates of the registrant on June 30, 2016, the last business day of the registrant’s most recently completed second quarter, was $8,350,559 based on the closing price of $0.44 per share on the Nasdaq Global Select Market on that date, which was prior to and does not reflect the August 5, 2016, 1 for 20 reverse stock split. (For this purpose, all outstanding shares of common stock have been considered held by non-affiliates, other than the shares beneficially owned by directors, officers and certain shareholders of the registrant holding above 10% of the outstanding shares of common stock; without conceding that any of the excluded parties are "affiliates" of the registrant for purposes of the federal securities laws.)
As of March 28, 2017, 74,103,956 shares of the registrant’s common stock were outstanding.
Indicate by check mark whether the registrant has filed all documents and reports required to be filed by Section 12, 13 or 15(d) of the Securities Exchange Act of 1934 subsequent to the distribution of securities under a plan confirmed by a court. Yes☒ No☐
DOCUMENTS INCORPORATED BY REFERENCE
Portions of the registrant’s definitive proxy statement for its 2017 annual meeting of shareholders or an amendment to this Form 10-K, which will be filed with the Securities and Exchange Commission within 120 days of December 31, 2016, are incorporated by reference into Part III of this report for the year ended December 31, 2016.
TABLE OF CONTENTS
|
|
|
Page |
|
PART I |
|
5 |
|
Item 1. |
Business |
5 |
|
Item 1A. |
Risk Factors |
30 |
|
Item 1B. |
Unresolved Staff Comments |
47 |
|
Item 2. |
Properties |
47 |
|
Item 3. |
Legal Proceedings |
47 |
|
Item 4. |
Mine Safety Disclosure |
47 |
|
PART II |
|
48 |
|
Item 5. |
Market for Registrant's Common Equity, Related Stockholder Matters and Issuer Purchases of Equity Securities |
48 |
|
Item 6. |
Selected Financial Data |
51 |
|
Item 7. |
Management's Discussion and Analysis of Financial Condition and Results of Operations |
53 |
|
Item 7A. |
Quantitative and Qualitative Disclosures about Market Risk |
74 |
|
Item 8. |
Financial Statements and Supplementary Data |
75 |
|
Item 9. |
Changes in and Disagreements with Accountants on Accounting and Financial Disclosure |
75 |
|
Item 9A. |
Controls and Procedures |
75 |
|
Item 9B. |
Other Information |
78 |
|
PART III |
|
78 |
|
Item 10. |
Directors, Executive Officers and Corporate Governance |
78 |
|
Item 11. |
Executive Compensation |
78 |
|
Item 12. |
Security Ownership of Certain Beneficial Owners and Management and Related Stockholder Matters |
78 |
|
Item 13. |
Certain Relationships and Related Transactions, and Director Independence |
78 |
|
Item 14. |
Principal Accountant Fees and Services |
78 |
|
PART IV |
|
79 |
|
Item 15. |
Exhibits, Financial Statement Schedules |
79 |
|
|
Signatures |
82 |
References in this Annual Report on Form 10-K (this “Form 10-K” or “Annual Report”) to “we,” “us,” “our,” “Eagle Bulk,” the “Company” and similar terms all refer to Eagle Bulk Shipping Inc. and its subsidiaries, unless otherwise stated or the context otherwise requires. References to “Predecessor” refer to the Company between the period January 1, 2014 and October 15, 2014 and prior. References to “Successor” refer to the Company on or after October 16, 2014.
A glossary of shipping terms (the “Glossary”) that should be used as a reference when reading this Annual Report can be found immediately prior to Item 1A. Capitalized terms that are used in this Annual Report are either defined when they are first used or in the Glossary.
All dollar amounts are stated in U.S. dollars unless otherwise stated.
Effective as of the opening of trading on August 5, 2016, the Company completed a 1 for 20 reverse stock split (the “Reverse Stock Split”) of its issued and outstanding shares of common stock, par value $0.01 per share, as previously approved by the Board of Directors and shareholders. Proportional adjustments were made to the Company’s issued and outstanding common stock and to its common stock underlying stock options and other common stock-based equity grants outstanding immediately prior to the effectiveness of the Reverse Stock Split as well as the applicable exercise price. In addition, proportional adjustments were made to the number of shares of common stock issuable upon exercise of outstanding warrants and to the exercise price of such warrants, pursuant to the terms thereof. No fractional shares were issued in connection with the Reverse Stock Split, and shareholders who would have received a fractional share of common stock in connection with the Reverse Stock Split instead received a cash payment in lieu of such fractional share. All references to common stock and all per share data for the Successor contained in this 10-K have been retrospectively adjusted to reflect the Reverse Stock Split unless explicitly stated otherwise. Please see “Note 1 to the consolidated financial statements”.
Forward-Looking Statements
This Form 10-K contains forward-looking statements within the meaning of Section 27A of the Securities Act of 1933, as amended (the “Securities Act”), Section 21E of the Securities Exchange Act of 1934, as amended (the “Exchange Act”), and the Private Securities Litigation Reform Act of 1995, and are intended to be covered by the safe harbor provided for under these sections. These statements may include words such as “believe,” “estimate,” “project,” “intend,” “expect,” “plan,” “anticipate,” and similar expressions in connection with any discussion of the timing or nature of future operating or financial performance or other events. Forward-looking statements reflect management's current expectations and observations with respect to future events and financial performance.
Where we express an expectation or belief as to future events or results, such expectation or belief is expressed in good faith and believed to have a reasonable basis. However, our forward-looking statements are subject to risks, uncertainties, and other factors, which could cause actual results to differ materially from future results expressed, projected, or implied by those forward-looking statements. The principal factors that affect our financial position, results of operations and cash flows include, charter market rates, which have declined significantly from historic highs, periods of charter hire, vessel operating expenses and voyage costs, which are incurred primarily in U.S. dollars, depreciation expenses, which are a function of the cost of our vessels, significant vessel improvement costs and our vessels' estimated useful lives, and financing costs related to our indebtedness. Our actual results may differ materially from those anticipated in these forward-looking statements as a result of certain factors which could include the following: (i) changes in demand in the dry bulk market, including, without limitation, changes in production of, or demand for, commodities and bulk cargoes, generally or in particular regions; (ii) greater than anticipated levels of dry bulk vessel new building orders or lower than anticipated rates of dry bulk vessel scrapping; (iii) changes in rules and regulations applicable to the dry bulk industry, including, without limitation, legislation adopted by international bodies or organizations such as the International Maritime Organization and the European Union (the “EU”) or by individual countries; (iv) actions taken by regulatory authorities including without limitation the U.S. Treasury Department’s Office of Foreign Assets Control (“OFAC”); (v) changes in trading patterns significantly impacting overall dry bulk tonnage requirements; (vi) changes in the typical seasonal variations in dry bulk charter rates; (vii) changes in the cost of other modes of bulk commodity transportation; (viii) changes in general domestic and international political conditions; (ix) changes in the condition of the Company's vessels or applicable maintenance or regulatory standards (which may affect, among other things, our anticipated dry docking costs); (x) significant deteriorations in charter hire rates from current levels or the inability of the Company to achieve its cost-cutting measures; and (xi) the outcome of legal proceeding in which we are involved; and other factors listed from time to time in our filings with the Securities and Exchange Commission (the “SEC”). This discussion also includes statistical data regarding world dry bulk fleet and orderbook and fleet age. We generated some of this data internally, and some were obtained from independent industry publications and reports that we believe to be reliable sources. We have not independently verified this data nor sought the consent of any organizations to refer to their reports in this Annual Report. We disclaim any intent or obligation to update publicly any forward-looking statements, whether as a result of new information, future events or otherwise, except as may be required under applicable securities laws.
PART I
ITEM 1. BUSINESS
Overview and Recent Developments
We are Eagle Bulk Shipping Inc., a Marshall Islands corporation incorporated on March 23, 2005 and headquartered in Stamford, Connecticut. We own one of the largest fleets of Supramax/Ultramax dry bulk vessels in the world. Supramax dry bulk are vessels which are constructed with on-board cranes, ranging in size from approximately 50,000 to 59,000 “dwt” and Ultramax dry bulk vessels range in size from 60,000 to 65,000 dwt. They are considered a sub-category of the Handymax segment; typically defined as 40,000 to 65,000 dwt. We transport a broad range of major and minor bulk cargoes, including but not limited to coal, grain, ore, petcoke, cement and fertilizer, along worldwide shipping routes. As of December 31, 2016, we owned and operated a modern fleet of 41 Handymax dry bulk vessels. We chartered-in a 37,000 dwt newbuilding Japanese vessel that was delivered in October 2014 for seven years with an option for one additional year.
We are focused on maintaining a high quality fleet that is concentrated primarily in Supramax/Ultramax dry bulk carriers. These vessels have the cargo loading and unloading flexibility of on-board cranes while offering cargo carrying capacities approaching that of Panamax dry bulk vessels, which range in size from 72,000 to 83,000 dwt and rely on port facilities to load and offload their cargoes. We believe that the cargo handling flexibility and cargo carrying capacity of the Supramax/Ultramax class vessels make them attractive to cargo interests and vessel charterers. The 41 vessels in our operating fleet, with an aggregate carrying capacity of 2,260,943 dwt, have an average age of 8.7 years as of December 31, 2016.
We carry out the commercial and strategic management of our fleet through our indirectly wholly-owned subsidiary, Eagle Shipping International (USA) LLC, a Marshall Islands limited liability company which maintains its principal executive offices in Stamford, Connecticut. We own each of our vessels through a separate wholly-owned Marshall Islands limited liability company.
Corporate Reorganization and Refinancing
On March 30, 2016, we entered into the Contribution Agreement (the “Contribution Agreement”) with a newly-formed wholly-owned subsidiary, Eagle Shipping LLC, a limited liability company organized under the laws of the Marshall Islands (“Eagle Shipping”) pursuant to which the Company transferred, assigned and contributed to Eagle Shipping, and Eagle Shipping received, accepted and assumed, all of the tangible and intangible assets of the Company other than the membership interests in Eagle Shipping owned by the Company and certain deposit accounts held by the Company, which deposit account balances were transferred and all of the liabilities of the Company, including all of the Company’s rights and obligations under the Exit Financing Facility (as defined below) (the “Contribution”). Immediately following the Contribution, Eagle Shipping became the direct parent company of each of the Company’s previously directly-owned subsidiaries and the indirect parent company of each of the Company’s previously indirectly-owned subsidiaries. The Contribution was part of a series of transactions contemplated by the agreements also entered into on March 30, 2016 and described below, which transactions were consummated on March 30, 2016, after the fulfillment of certain conditions precedent. See “Note 2. Corporate Reorganization” to the consolidated financial statements.
New Office, New Subsidiary and Vessel Acquisitions
On June 20, 2016, the Company announced the expansion of its global commercial presence with the establishment of a new office in Hamburg, Germany, and which is operated through a new subsidiary, Eagle Bulk Europe GmbH, which commenced operations in August 2016.
On September 30, 2016, a newly formed subsidiary, Eagle Bulk Shipco LLC (“Eagle Shipco”), signed a memorandum of agreement to acquire a 2016 Nantong COSCO Kawasaki Heavy Industries Engineering Co Ltd (“NACKS”) built Ultramax 61,000 dwt vessel for $18.85 million. The Company took delivery of the vessel in the fourth quarter of 2016.
On November 14, 2016, Eagle Shipco, signed a memorandum of agreement to acquire a 2017 built 64,000 dwt SDARI-64 Ultramax dry bulk vessel constructed at Chengxi Shipyard Co., Ltd for $17.9 million. The Company took the delivery of the vessel in the first quarter of 2017.
On February 28, 2017, Eagle Bulk Ultraco LLC, a wholly-owned subsidiary of the Company (“Eagle Ultraco”), entered into a framework agreement (the “Greenship Agreement”) with Greenship Bulk Manager Pte. Ltd., as Trustee-Manager of Greenship Bulk Trust, a Norwegian OTC-listed entity (the “Greenship Sellers”), for the purchase of nine modern sister vessels built between 2012 and 2015 (each a “Greenship Vessel,” and collectively, the “Greenship Vessels”). Of the nine Greenship Vessels, three Greenship Vessels were subject to certain customary conditions as well as the approval of the requisite majority of the unitholders of the Greenship Sellers which approval was obtained. The aggregate purchase price for the nine Greenship Vessels is $153.0 million. The allocated purchase price for each Greenship Vessel is $17.0 million. The Greenship Vessels are expected to be delivered charter free between April and September 2017. See “Note 20. Subsequent Events” to the consolidated financial statements.
Management of Our Fleet
Our Connecticut-based management team primarily focuses on the sub-Panamax dry bulk sectors, such as Supramax, Ultramax, Handymax and Handysize vessels, undertakes all commercial and strategic management of our fleet. We have established in-house technical management capabilities, through which we provide technical management services to all of our vessels. On August 24, 2015, the Company provided its three months’ notice to V. Ships Limited to terminate the technical management contract between the companies. During the first quarter of 2016, the Company completed the process of transferring the vessels to our in-house technical management.
Our Competitive Strengths and our Business Strategy
We believe that we have a number of strengths that provide us with a competitive advantage in the dry bulk shipping industry, including:
|
● |
A large and homogeneous fleet of Supramax/Ultramax dry bulk vessels. We own and operate one of the largest Supramax/Ultramax fleets in the world. As of December 31, 2016, our owned-fleet totaled 41 vessels, supplemented by chartered in vessels. We view Handymax vessels, especially the Supramax class of vessels, as an attractive sector of the dry bulk shipping industry relative to larger vessel sectors due to their: |
| o | Increased operating flexibility; | |
| o | Ability to access more ports; and | |
| o | Ability to carry a more diverse range of cargoes. |
|
● |
A modern, high quality fleet. The 41 Handymax vessels in our operating fleet as of December 31, 2016 had an average age of approximately 8.7 years. In 2011, we completed our Supramax vessel newbuilding program, pursuant to which we took delivery of 27 Supramax newbuilding vessels from 2008 to 2011. We believe that owning a modern, high quality fleet reduces operating costs, improves safety and provides us with a competitive advantage in securing employment for our vessels. Our fleet was built to high standards and all of our vessels were built at leading Japanese and Chinese shipyards, including Mitsui Engineering and Shipbuilding Co., Ltd., and Oshima Shipbuilding Co., Ltd. The newbuilding vessels were built at shipyards including IHI Marine United, Japan and Yangzhou Dayang Shipbuilding Co. Ltd, China. On September 30, 2016, the Company, through its subsidiary, Eagle Shipco, signed a memorandum of agreement to acquire a 2016 NACKS built Ultramax 61,530 dwt vessel for $18.85 million. The Company took delivery of the vessel in the fourth quarter of 2016. On November 14, 2016, the Company through Eagle Shipco, signed a memorandum of agreement to acquire a 2017 built 64,000 dwt SDARI-64 Ultramax dry bulk vessel constructed at Chengxi Shipyard Co., Ltd for $17.9 million. The Company took delivery of the vessel in the first quarter of 2017. On February 28, 2017, Eagle Ultraco entered into the Greenship Agreement for the purchase of nine modern sister vessels built between 2012 and 2015 for an aggregate purchase price of $153.0 million, subject to certain conditions. See “Note 20. Subsequent Events” to the consolidated financial statements. |
|
● |
A fleet of sister and similar ships allows us to maintain low cost, and highly efficient operations. Our current operating fleet of 41 vessels includes eight identical sister ships built at the Mitsui shipyard based on the same design specifications, two sets of five and 17 identical sister ships built at Dayang shipyard, five identical sister ships built at IHI Marine United shipyard, and three similar ships built at the Oshima shipyard that use many of the same parts and equipment. Furthermore, the recently announced Greenship Agreement for the purchase of nine Crown-63 vessels are of identical specification, and these vessels were all built by Sinopacific Shipbuilding Group at the Dayang Shipyard, and Zhejiang Shipyards. In addition to the owned fleet, we charter-in a 37,000 dwt new built Japanese vessel which delivered to the Company as a new building in 2014 and has charter expiry in 2021. Operating sister and similar ships provides us with operational and scheduling flexibility, efficiencies in employee training and lower inventory and maintenance expenses. We believe that this should allow us both to increase revenue and lower operating costs. We intend to actively monitor and control vessel operating expenses while maintaining the high quality of our fleet through regular inspection and maintenance programs. |
|
● |
Balanced charter program. The Company’s chartering strategy has historically been to time charter the vessels on short- to medium-term charters, often with vessel operators. However, under its new management team, the Company transitioned to an active operating model where it is entering into a higher percentage of voyage charters and developing contractual relationships directly with cargo interests. In 2016, 35% of the charters were on a voyage basis, as compared to 6% in 2015. Voyage charters and contracts as well as the relationships with actual users (shippers, receivers and traders) have what we believe to be the dual benefit of providing greater operational efficiencies and can act as a balance to the Company’s naturally long position to the market. Notwithstanding the focus on voyage chartering, the Company consistently monitors the dry bulk shipping market and, based on market conditions, will consider taking advantage of long-term time charters at higher rates when appropriate. |
|
● |
Expand our fleet through selective acquisitions of dry bulk vessels. Depending on market conditions, we intend to acquire additional modern, high-quality vessels through timely and selective acquisitions in a manner that is accretive to our cash flows. We expect to focus primarily in the Supramax and Ultramax classes within the Handymax sector of the dry bulk shipping industry. While not a priority, we may also consider acquisitions of other sizes of dry bulk vessels. |
Our Fleet
Our operating fleet of 41 vessels is fitted with cargo cranes and cargo grabs that permit our vessels to load and unload cargo in ports that do not have cargo handling infrastructure in place. Our vessels are flagged in the Marshall Islands. Our vessels are all employed on time and voyage charters. The following table represents certain information about our operating fleet as of December 31, 2016:
|
Vessel |
|
|
Class |
|
|
|
Dwt |
|
|
|
Year Built |
| |
|
|
|
|
|
|
|
|
|
|
|
|
|
| |
|
Avocet |
|
|
Supramax |
|
|
|
53,462 |
|
|
|
2010 |
| |
|
|
|
|
|
|
|
|
|
|
|
|
|
| |
|
Bittern |
|
|
Supramax |
|
|
|
57,809 |
|
|
|
2009 |
| |
|
|
|
|
|
|
|
|
|
|
|
|
|
| |
|
Canary |
|
|
Supramax |
|
|
|
57,809 |
|
|
|
2009 |
| |
|
|
|
|
|
|
|
|
|
|
|
|
|
| |
|
Cardinal |
|
|
Supramax |
|
|
|
55,362 |
|
|
|
2004 |
| |
|
|
|
|
|
|
|
|
|
|
|
|
|
| |
|
Condor |
|
|
Supramax |
|
|
|
50,296 |
|
|
|
2001 |
| |
|
|
|
|
|
|
|
|
|
|
|
|
|
| |
|
Crane |
|
|
Supramax |
|
|
|
57,809 |
|
|
|
2010 |
| |
|
|
|
|
|
|
|
|
|
|
|
|
|
| |
|
Crested Eagle |
|
|
Supramax |
|
|
|
55,989 |
|
|
|
2009 |
| |
|
|
|
|
|
|
|
|
|
|
|
|
|
| |
|
Crowned Eagle |
|
|
Supramax |
|
|
|
55,940 |
|
|
|
2008 |
| |
|
|
|
|
|
|
|
|
|
|
|
|
|
| |
|
Egret Bulker |
|
|
Supramax |
|
|
|
57,809 |
|
|
|
2010 |
| |
|
|
|
|
|
|
|
|
|
|
|
|
|
| |
|
Gannet Bulker |
|
|
Supramax |
|
|
|
57,809 |
|
|
|
2010 |
| |
|
|
|
|
|
|
|
|
|
|
|
|
|
| |
|
Golden Eagle |
|
|
Supramax |
|
|
|
55,989 |
|
|
|
2010 |
| |
|
|
|
|
|
|
|
|
|
|
|
|
|
| |
|
Goldeneye |
|
|
Supramax |
|
|
|
52,421 |
|
|
|
2002 |
| |
|
|
|
|
|
|
|
|
|
|
|
|
|
| |
|
Grebe Bulker |
|
|
Supramax |
|
|
|
57,809 |
|
|
|
2010 |
| |
|
|
|
|
|
|
|
|
|
|
|
|
|
| |
|
Hawk I |
|
|
Supramax |
|
|
|
50,296 |
|
|
|
2001 |
| |
|
|
|
|
|
|
|
|
|
|
|
|
|
| |
|
Ibis Bulker |
|
|
Supramax |
|
|
|
57,775 |
|
|
|
2010 |
| |
|
|
|
|
|
|
|
|
|
|
|
|
|
| |
|
Imperial Eagle |
|
|
Supramax |
|
|
|
55,989 |
|
|
|
2010 |
| |
|
Jaeger |
|
|
Supramax |
|
|
|
52,248 |
|
|
|
2004 |
| |
|
|
|
|
|
|
|
|
|
|
|
|
| ||
|
Jay |
|
|
Supramax |
|
|
|
57,802 |
|
|
|
2010 |
| |
|
|
|
|
|
|
|
|
|
|
|
|
|
| |
|
Kestrel I |
|
|
Supramax |
|
|
|
50,326 |
|
|
|
2004 |
| |
|
|
|
|
|
|
|
|
|
|
|
|
|
| |
|
Kingfisher |
|
|
Supramax |
|
|
|
57,776 |
|
|
|
2010 |
| |
|
|
|
|
|
|
|
|
|
|
|
|
|
| |
|
Martin |
|
|
Supramax |
|
|
|
57,809 |
|
|
|
2010 |
| |
|
|
|
|
|
|
|
|
|
|
|
|
|
| |
|
Merlin |
|
|
Supramax |
|
|
|
50,296 |
|
|
|
2001 |
| |
|
|
|
|
|
|
|
|
|
|
|
|
|
| |
|
Nighthawk |
|
|
Supramax |
|
|
|
57,809 |
|
|
|
2011 |
| |
|
|
|
|
|
|
|
|
|
|
|
|
|
| |
|
Oriole |
|
|
Supramax |
|
|
|
57,809 |
|
|
|
2011 |
| |
|
|
|
|
|
|
|
|
|
|
|
|
|
| |
|
Osprey I |
|
|
Supramax |
|
|
|
50,206 |
|
|
|
2002 |
| |
|
|
|
|
|
|
|
|
|
|
|
|
|
| |
|
Owl |
|
|
Supramax |
|
|
|
57,809 |
|
|
|
2011 |
| |
|
|
|
|
|
|
|
|
|
|
|
|
|
| |
|
Petrel Bulker |
|
|
Supramax |
|
|
|
57,809 |
|
|
|
2011 |
| |
|
|
|
|
|
|
|
|
|
|
|
|
|
| |
|
Puffin Bulker |
|
|
Supramax |
|
|
|
57,809 |
|
|
|
2011 |
| |
|
|
|
|
|
|
|
|
|
|
|
|
|
| |
|
Redwing |
|
|
Supramax |
|
|
|
53,411 |
|
|
|
2007 |
| |
|
|
|
|
|
|
|
|
|
|
|
|
|
| |
|
Roadrunner Bulker |
|
|
Supramax |
|
|
|
57,809 |
|
|
|
2011 |
| |
|
|
|
|
|
|
|
|
|
|
|
|
|
| |
|
Sandpiper Bulker |
|
|
Supramax |
|
|
|
57,809 |
|
|
|
2011 |
| |
|
|
|
|
|
|
|
|
|
|
|
|
|
| |
|
Shrike |
|
|
Supramax |
|
|
|
53,343 |
|
|
|
2003 |
| |
|
|
|
|
|
|
|
|
|
|
|
|
|
| |
|
Skua |
|
|
Supramax |
|
|
|
53,350 |
|
|
|
2003 |
| |
|
|
|
|
|
|
|
|
|
|
|
|
|
| |
|
Sparrow |
|
|
Handymax |
|
|
|
48,225 |
|
|
|
2000 |
| |
|
|
|
|
|
|
|
|
|
|
|
|
|
| |
|
Stamford Eagle |
|
|
Ultramax |
|
|
|
61,530 |
|
|
|
2016 |
| |
|
Stellar Eagle |
|
|
Supramax |
|
|
|
55,989 |
|
|
|
2009 |
| |
|
|
|
|
|
|
|
|
|
|
|
|
|
| |
|
Tern |
|
|
Supramax |
|
|
|
50,200 |
|
|
|
2003 |
| |
|
|
|
|
|
|
|
|
|
|
|
|
|
| |
|
Thrasher |
|
|
Supramax |
|
|
|
53,360 |
|
|
|
2010 |
| |
|
|
|
|
|
|
|
|
|
|
|
|
|
| |
|
Thrush |
|
|
Supramax |
|
|
|
53,297 |
|
|
|
2011 |
| |
|
|
|
|
|
|
|
|
|
|
|
|
|
| |
|
Woodstar |
|
|
Supramax |
|
|
|
53,390 |
|
|
|
2008 |
| |
|
|
|
|
|
|
|
|
|
|
|
|
|
| |
|
Wren |
|
|
Supramax |
|
|
|
53,349 |
|
|
|
2008 |
| |
Nature of Business
As mentioned above, the Company’s chartering strategy has historically been to time charter the vessels on short-to medium-term charter, often with vessel operators. However, under its new management team, the Company is in the midst of a transition to an active operating model where it is entering into a higher percentage of voyage charters and developing contractual relationships directly with cargo interests. These relationships and the related cargo contracts have what we believe to be the dual benefit of providing greater operational efficiencies and act as a balance to the Company’s naturally long position to the market. Notwithstanding the focus on voyage chartering, the Company consistently monitors the dry bulk shipping market and, based on market conditions, will consider taking advantage of long-term time charters at higher rates when appropriate.
The following table represents various types of employment arrangements for our vessels.
|
Voyage Charter |
Time Charter |
Index Charter |
Commercial Pool | ||||
|
Typical contract length |
Single voyage |
|
One or multiple voyages |
Six months or more |
|
Varies | |
|
Hire rate basis (1) |
Per MT of cargo loaded |
Daily |
Linked to BSI |
Varies | |||
|
Voyage expenses (2) |
We pay |
|
Customer pays |
Customer pays |
|
Pool pays | |
|
Vessel expenses for owned vessels (3) |
We pay |
We pay |
We pay |
We pay | |||
|
Charter hire expense for vessels chartered-in |
We pay |
|
We pay |
We pay |
|
We pay | |
|
Off-hire (4) |
Customer does not pay |
Customer does not pay |
Customer does not pay |
Pool does not pay |
|
(1) |
“Hire rate” refers to a sum of money paid to the vessel owner by a charterer under a time charter party for the use of a vessel. “BSI” refers to “Baltic Supramax Index” and the daily hire rate varies based on the Index. The BSI is an index published by the Baltic Exchange which tracks the gross time charter value for a specific 52,000 dwt vessel. |
|
(2) |
“Voyage expenses” includes fuel, port charges, canal tolls, cargo handling operations and brokerage commissions paid by the Company. |
|
(3) |
“Vessel expenses” includes crewing, repairs and maintenance, insurance, stores, lubes, communication expenses. |
|
(4) |
“Off-hire” refers to the time a vessel is unavailable for performing the service either due to scheduled or unscheduled repairs. |
The following summary represents the number of our fleet of vessels performing the various types of employments as of December 31, 2016, 2015 and 2014.
|
December 31, 2016 |
December 31, 2015 |
December 31, 2014 | |||
|
Time Charter |
23 |
32 |
23 | ||
|
Voyage Charter |
17 |
9 |
4 | ||
|
Index Charter |
- |
- |
4 | ||
|
Commercial Pool |
1 |
1 |
12 | ||
|
Unemployed/ Drydock |
1 |
3 |
2 | ||
|
42 |
45 |
45 |
We have established our own in-house technical management capability, through which we provide technical management services to all of our vessels. During the first quarter of 2016, we completed the transfer of all vessels to in-house technical management.
In connection with the charters of each of our vessels, we pay commissions ranging from 1.25% to 5.00% of the total daily charter hire rate of each charter to unaffiliated ship brokers and to in-house ship brokers associated with the charterers, depending on the number of brokers involved with arranging the relevant charter.
Our vessels operate worldwide within the trading limits imposed by insurance terms and do not operate in countries or territories that are subject to United States, EU or United Nations (the “UN”) comprehensive country-wide or territory-wide sanctions.
Our Customers
Our customers include international companies such as SK Shipping, Mur Shipping, Oldendorff Carriers GmbH, Cargill International S.A. Hyundai Merchant Marine Co Ltd, and Arcelo Mittal Sourcing SCA. Our assessment of customers’ financial condition and reliability is an important factor in negotiating employment for our vessels. We aim to charter our vessels to major trading houses (including commodities traders), publicly traded companies, reputable vessel owners and operators, major producers and government-owned entities rather than to more speculative or undercapitalized entities. We evaluate the counterparty risk of potential customers based on our management's experience in the shipping industry combined with the additional input of two independent credit risk consultants. In 2016, we did not have any customer who accounted for more than 10% of our time and voyage charter revenue. In 2015, the Navig8 pool (the “Navig8 Pool”) accounted for approximately 17.2% of our time and voyage charter revenue. In 2014, for the period January 1 to October 15, one customer and the Navig8 Pool individually accounted for approximately 10.5% and 17.7% of our time and voyage charter revenue, respectively. For the period October 16, 2014 to December 31, 2014, the Navig8 Pool accounted for 27.7% of our time and voyage charter revenue.
Operations
There are two central aspects to the operation of our fleet:
|
● |
Commercial operations, which involve chartering and operating a vessel; and |
|
● |
Technical operations, which involve maintaining, crewing and insuring a vessel. |
We carry out the commercial and strategic management of our fleet through our indirectly wholly-owned subsidiaries, Eagle Shipping International (USA) LLC, a Marshall Islands limited liability company that was formed in January 2005 and maintains its principal executive offices in Stamford, Connecticut, and Eagle Bulk Pte. Ltd, a Singapore company. On June 20, 2016, the Company announced the expansion of its global commercial presence with the establishment of a new office in Hamburg, Germany. A new subsidiary, Eagle Bulk Europe GmbH, commenced its operations in the Hamburg office in August 2016. Our office staff, either directly or through these subsidiaries, provides the following services:
|
● |
Commercial operations and technical supervision; |
|
● |
Safety monitoring; |
|
● |
Vessel acquisition; and |
|
● |
Financial accounting and information technology services. |
We currently have an aggregate of approximately 75 shore-based personnel in our principal executive office in Stamford, Connecticut, as well as our offices in Hamburg, Germany and Singapore.
Each of the Company’s vessels serve the same type of customer, have similar operation and maintenance requirements, operate in the same regulatory environment, and are subject to similar economic characteristics. Based on this, the Company has determined that it operates in one reportable segment which is engaged in the ocean transportation of dry bulk cargoes worldwide through the ownership and operation of dry bulk carrier vessels. The Company’s vessels regularly move between countries in international waters, over hundreds of trade routes and, as a result, the disclosure of geographic information is impracticable.
Commercial and Strategic Management
We perform all of the commercial and strategic management of our fleet including obtaining employment for our vessels and maintaining relationships with the charterers of our vessels. In order to increase our market coverage, we opened a commercial office in Hamburg, Germany in August 2016. Now, we have three offices across the globe including Singapore and Stamford and we effectively have twenty four hour global market coverage. We believe that because of our management team’s experience in operating dry bulk vessels, we have access to a broad range of charterers and can employ our fleet efficiently in any diverse market conditions and achieve high utilization rates.
Being an active owner-operator means effectively seeking to operate our own vessels when possible, as compared with time chartering them to other operators, all with a view toward achieving higher than market net time charter equivalent (“TCE”). In doing so, we believe we can take advantage of rapidly changing market information and obtain better operational efficiencies from our fleet. In addition, we constantly look to arbitrage cargo and vessels positions by taking in additional vessels on time charter, and/or reletting cargo commitments on voyage basis. We also constantly monitor the dry bulk shipping market, and opportunistically time-charter charter vessels in for a period of time, where we typically obtain some optionality on the duration of the period. We also buy and sell freight forward agreements (“FFAs”) contracts to hedge exposure of physical commitments in order to mitigate market risk.
Under a voyage charter, the owner of a vessel provides the vessel for the transport of goods between specific ports in return for the payment of an agreed-upon freight per ton of cargo or, alternatively, a specified total amount. All operating costs, including fuel costs and port charges are borne by the owner of the vessel. A single voyage charter is often referred to as a “spot charter,” which generally lasts from two to ten weeks. Operating vessels in the spot market may afford greater opportunity to capitalize on fluctuations in the spot market; when vessel demand is high we earn higher rates, but when demand is low our rates are lower and potentially insufficient to cover costs. Spot market rates are volatile and are affected by world economics, international events, weather conditions, strikes, governmental policies, supply and demand, and other factors beyond our control. If the markets are especially weak for protracted periods, there is a risk that vessels in the spot market may spend time idle waiting for business, or in extreme cases may even have to be "laid up".
|
|
● |
Identifying, purchasing, and selling vessels. We believe that our commercial management team has longstanding relationships in the dry bulk industry, which provides us access to an extensive network of ship brokers and vessel owners that we believe will provide us with an advantage in future transactions. |
|
|
● |
Obtaining insurance coverage for our vessels. We have well-established relationships with reputable marine underwriters in all the major insurance markets around the world that helps insure our fleet at competitive rates. |
Technical Management
We have established in-house technical management capabilities, through which we provide technical management services to all of our vessels. On August 24, 2015, we provided three months’ notice to V. Ships Limited to terminate the technical management contract,and, during the first quarter of 2016, we completed the transfer of all the vessels to in-house technical management.
Technical management includes managing day-to-day vessel operations, performing general vessel maintenance, ensuring regulatory and classification society compliance, supervising the maintenance and general efficiency of vessels, arranging the hire of qualified officers and crew, arranging and supervising drydocking and repairs, purchasing supplies, spare parts, lubricants, and new equipment for vessels, appointing supervisors and technical consultants and providing technical support.
We currently crew our vessels primarily with officers and seamen from Ukraine, Russia, Myanmar (formerly Burma), and Eastern European countries who are hired through our third party crew managers. As of December 31, 2016, we employed approximately 820 officers and seamen on the 41 vessels in our operating fleet. Each crew manager handles each seaman's training, travel, and payroll and is obligated to assure that all our seamen have the qualifications and licenses required to comply with current international regulations and shipping conventions. Additionally, our seafaring employees perform most operational and maintenance work and assist in supervising work during cargo operations and at drydock facilities. We typically man our vessels with more crew members than are required by the country of the vessel's flag safe manning certification in order to allow for the performance of routine maintenance duties. All of our crew members are subject to and are paid commensurate with international collective bargaining agreements and, therefore, we do not anticipate any labor disruptions. All international collective bargaining agreements to which we are a party are renewed for two years, prior to their expiry.
Permits, Authorizations and Regulations
We are required by various governmental and quasi-governmental agencies to obtain certain permits, licenses and certificates with respect to our vessels. The kinds of permits, licenses and certificates required depend upon several factors, including the commodity transported, the waters in which the vessel operates, the nationality of the vessel's crew and the age of a vessel. We expect to be able to obtain all permits, licenses and certificates currently required to permit our vessels to operate. Additional laws and regulations, environmental or otherwise, may be adopted which could limit our ability to do business or increase the cost of us doing business.
Our vessels operate worldwide within the trading limits imposed by our insurance terms and do not operate in countries or territories that are subject to United States, EU or UN comprehensive country-wide or territory wide sanctions.
In November 2015, the Company filed a voluntary self-disclosure report with OFAC regarding certain apparent violations of U.S. sanctions regulations in the provision of shipping services for third party charterers with respect to the transportation of cargo to or from Myanmar (formerly Burma). At the time of such apparent violations, the Company had a different senior operational management team. Notwithstanding the fact that the apparent violations took place under a different senior operational management team and although the Company’s new board and management have implemented robust remedial measures and significantly enhanced its compliance safeguards there can be no assurance that OFAC will not conclude that these past actions warrant the imposition of civil penalties and/or referral for further investigation by the U.S. Department of Justice. The report was provided to OFAC for the agency’s review, consideration and determination regarding what action, if any, may be taken in resolution of this matter. The Company will continue to cooperate with the agency regarding this matter and cannot estimate when such review will be concluded. While the ultimate impact of these matters cannot be determined, there can be no assurance that the impact will not be material to the Company’s financial condition or results of operations. See “Note 11. Commitments and Contingencies – Legal Proceedings” to the consolidated financial statements.
Environmental and Other Regulations
Government regulation significantly affects the ownership and operation of our vessels. We are subject to international conventions and treaties, national, state and local laws and regulations in force in the countries in which our vessels may operate or are registered relating to safety and health and environmental protection including the storage, handling, emission, transportation and discharge of hazardous and non-hazardous materials, and the remediation of contamination and liability for damage to natural resources. Compliance with such laws, regulations and other requirements entails significant expense, including vessel modifications and implementation of certain operating procedures.
A variety of government and private entities subject our vessels to both scheduled and unscheduled inspections. These entities include the local port authorities (United States Coast Guard, (the “USCG”) harbor master or equivalent), classification societies; flag state administrations (country of registry) and charterers, particularly terminal operators. Certain of these entities require us to obtain permits, licenses and certificates for the operation of our vessels. Failure to maintain necessary permits or approvals could require us to incur substantial costs or temporarily suspend the operation of one or more of our vessels.
We believe that the heightened level of environmental and quality concerns among insurance underwriters, regulators and charterers is leading to greater inspection and safety requirements on all vessels and may accelerate the scrapping of older vessels throughout the dry bulk shipping industry. Increasing environmental concerns have created a demand for vessels that conform to the stricter environmental standards. We are required to maintain operating standards for all of our vessels that emphasize operational safety, quality maintenance, continuous training of our officers and crews and compliance with United States and international regulations. We believe that the operation of our vessels is in substantial compliance with applicable environmental laws and regulations and that our vessels have all material permits, licenses, certificates or other authorizations necessary for the conduct of our operations. However, because such laws and regulations are frequently changed and may impose increasingly stricter requirements, we cannot predict the ultimate cost of complying with these requirements, or the impact of these requirements on the resale value or useful lives of our vessels. In addition, a future serious marine incident, such as the 2010 Deepwater Horizon oil spill, that causes significant adverse environmental impact could result in additional legislation or regulation that could negatively affect our profitability.
International Maritime Organization
The UN’s International Maritime Organization (the “IMO”) has adopted several international conventions, including the International Convention for the Prevention of Pollution from Ships, 1973, as modified by the Protocol of 1978 relating thereto (collectively referred to as MARPOL 73/78 and herein as “MARPOL”). MARPOL entered into force on October 2, 1983. It has been adopted by over 150 nations, including many of the jurisdictions in which our vessels operate. MARPOL sets forth pollution-prevention requirements applicable to dry bulk carriers, among other vessels, and is broken into six Annexes, each of which regulates a different source of pollution. Annex I relates to oil leakage or spilling; Annexes II and III relate to harmful substances carried, in bulk, in liquid or packaged form, respectively; Annexes IV and V relate to sewage and garbage management, respectively; and Annex VI, lastly, relates to air emissions. Annex VI was separately adopted by the IMO in September of 1997, and relates to air emissions.
In 2012, the IMO’s Marine Environmental Protection Committee (“MEPC”) adopted by resolution amendments to the International Code for the Construction and Equipment of Ships Carrying Dangerous Chemicals in Bulk (the “IBC Code”). The provisions of the IBC Code are mandatory under MARPOL and the International Convention for the Safety of Life at Sea, (the “SOLAS”). These amendments, which entered into force in June 2014, pertain to revised international certificates of fitness for the carriage of dangerous chemicals in bulk and identifying new products that fall under the IBC Code. We may need to make certain financial expenditures to comply with these amendments.
In 2013, the MEPC adopted by resolution amendments to the MARPOL Annex I Conditional Assessment Scheme, or CAS. The amendments, which became effective on October 1, 2014, pertain to revising references to the inspections of bulk carriers and tankers after the 2011 ESP Code, which enhances the programs of inspections, became mandatory. We may need to make certain financial expenditures to comply with these amendments.
Air Emissions
In September of 1997, the IMO adopted Annex VI to MARPOL to address air pollution (“Annex VI”). Effective May 2005, Annex VI sets limits on nitrogen oxide emissions from ships whose diesel engines were constructed (or underwent major conversions) on or after January 1, 2000. It also prohibits “deliberate emissions” of “ozone depleting substances,” defined to include certain halons and chlorofluorocarbons. “Deliberate emissions” are not limited to times when the ship is at sea; they can for example include discharges occurring in the course of the ship’s repair and maintenance. Emissions of “volatile organic compounds” from certain tankers, and the shipboard incineration (from incinerators installed after January 1, 2000) of certain substances (such as polychlorinated biphenyls (PCBs)) are also prohibited. Annex VI also includes a global cap on the sulfur content of fuel oil and allows for special areas to be established with more stringent controls of sulfur emissions known as “Emission Control Areas” (“ECAs”) (see below).
MEPC, adopted amendments to Annex VI on October 10, 2008, which entered into force on July 1, 2010. The amended Annex VI seeks to further reduce air pollution by, among other things, implementing a progressive reduction of the amount of sulfur contained in any fuel oil used on board ships. As of January 1, 2012, the amended Annex VI requires that fuel oil contain no more than 3.50% sulfur. By January 1, 2020, sulfur content must not exceed 0.50%, subject to a feasibility review to be completed no later than 2018. On October 27, 2016, following a feasibility review, the IMO announced it will implement the global sulfur cap. By January 1, 2020, the sulfur content of fuel must not exceed 0.50%.
Sulfur content standards are even stricter within certain ECAs. As of July 1, 2010, ships operating within an ECA may not use fuel with sulfur content in excess of 1.0% which was further reduced to 0.10% on January 1, 2015. Amended Annex VI establishes procedures for designating new ECAs. Currently, the Baltic Sea the North Sea and certain coastal areas of North America have been designated as ECAs. Furthermore as of January 1, 2014 the applicable areas of the United States and the Caribbean Sea were designated as ECAs. Ocean-going vessels in these areas will be subject to stringent emissions controls and may cause us to incur additional costs. If other ECAs are approved by the IMO or other new or more stringent requirements relating to emissions from marine diesel engines or port operations by vessels are adopted by the U.S. Environmental Protection Agency (the “EPA”), or the states where we operate, compliance with these regulations could entail significant capital expenditures, operational changes, or otherwise increase the costs of our operations.
Amended Annex VI also establishes new tiers of stringent nitrogen oxide emissions standards for new marine engines, depending on their date of installation. The EPA promulgated equivalent (and in some senses stricter) emissions standards in late 2009.
As of January 1, 2010, the Directive 2005/33/EC of the European Parliament and of the Council of July 6, 2005, amending Directive 1999/32/EC, came into force. The objective of the directive is to reduce emission of sulfur dioxide and particulate matter caused by the combustion of certain petroleum derived fuels. The directive imposes limits on the sulfur content of such fuels as a condition of their use within a Member State territory. The maximum sulfur content for marine fuels used by inland waterway vessels and ships at berth in ports in EU countries after January 1, 2010, is 0.10% by mass. As of January 1, 2015, all vessels operating within ECAs worldwide must comply with 0.1% sulfur requirements. Currently, the only grade of fuel meeting 0.1% sulfur content requirements is low Sulfur marine gas oil. On July 15, 2011, the European Commission also adopted a proposal for an amendment of Directive 1999/32/EC which would align requirements with those imposed by the revised MARPOL Annex VI which introduced stricter sulfur limits.
Safety Management System Requirements
The IMO also adopted SOLAS, and the International Convention on Load Lines,( the “LL Convention”), which impose a variety of standards that regulate the design and operational features of ships. The IMO periodically revises the SOLAS and LL Convention standards. May 2012 SOLAS amendments entered into force on January 1, 2014. The Convention on Limitation of Liability for Maritime Claims was recently amended and the amendments are expected to go into effect on June 8, 2015. The amendments alter the limits of liability for loss of life or personal injury claim and property claims against ship-owners.
The operation of our ships is also affected by the requirements set forth in Chapter IX of SOLAS, which sets forth the IMO's International Management Code for the Safe Operation of Ships and Pollution Prevention, (the “ISM Code”). The ISM Code requires ship owners and bareboat charterers to develop and maintain an extensive Safety Management System (“SMS”) that includes among other things the adoption of a safety and environmental protection policy setting forth instructions and procedures for safe operation and describing procedures for dealing with emergencies. We rely upon the safety management system that we and our technical manager have developed for compliance with the ISM Code. The failure of a ship owner or bareboat charterer to comply with the ISM Code may subject such party to increased liability, may decrease available insurance coverage for the affected vessels and may result in a denial of access to, or detention in, certain ports. As of the date of this filing, all of the vessels in our operating fleet are ISM code-certified.
The ISM Code requires that vessel operators obtain a safety management certificate, or SMC, for each vessel they operate. This certificate evidences compliance by a vessel’s operators with the ISM Code requirements for a safety management system, or SMS. No vessel can obtain an SMC under the ISM Code unless its manager has been awarded a document of compliance, or DOC, issued in most instances by the vessel's flag state. Our appointed ship managers have obtained documents of compliance for their offices and safety management certificates for all of our vessels for which the certificates are required by the IMO, which are renewed as required.
Pollution Control and Liability Requirements
The IMO has negotiated international conventions that impose liability for pollution in international waters and the territorial waters of the signatories to such conventions. For example, the IMO adopted the International Convention for the Control and Management of Ships' Ballast Water and Sediments in February 2004 (the “BWM Convention”). The BWM Convention’s implementing regulations called for a phased introduction of mandatory ballast water exchange requirements, to be replaced in time with mandatory concentration limits. On September 8, 2016, the BWM Convention met the requirement to be adopted by 30 states, the combined merchant fleets of which represent not less than 35% of the gross tonnage of the world's merchant shipping, becoming effective 12 months later on September 8, 2017. Many of the implementation dates originally written in the BWM Convention have already passed, so that once the BWM Convention enters into force, the period for installation of mandatory ballast water exchange requirements would be extremely short, with several thousand ships a year needing to install ballast water management systems (“BWMS”). For this reason, on December 4, 2013, the IMO Assembly passed a resolution revising the application dates of BWM Convention so that they are triggered by the entry into force date and not the dates originally in the BWM Convention. This in effect makes all vessels constructed before the entry into force date “existing’ vessels, and allows for the installation of a BWMS on such vessels at the first renewal survey following entry into force. The mid-ocean ballast exchange or ballast water treatment requirements became mandatory. The cost of compliance could increase for ocean carriers. Although we do not believe that the costs of such compliance would be material, it is difficult to predict the overall impact of such a requirement on our operations. On March 23, 2012, the USCG issued amended regulations relating to ballast water management for vessels operating in U.S. waters. The costs of compliance with ballast water treatment regulations may be material.
The IMO adopted the International Convention on Civil Liability for Bunker Oil Pollution Damage (the “Bunker Convention”) to impose strict liability on ship owners for pollution damage in jurisdictional waters of ratifying states caused by discharges of bunker fuel. The Bunker Convention requires registered owners of ships over 1,000 gross tons to maintain insurance for pollution damage in an amount equal to the limits of liability under the applicable national or international limitation regime (but not exceeding the amount calculated in accordance with the Convention on Limitation of Liability for Maritime Claims of 1976, as amended). With respect to non-ratifying states, liability for spills or releases of oil carried as fuel in ship’s bunkers typically is determined by the national or other domestic laws in the jurisdiction where the events or damages occur.
In March 2006, the IMO amended Annex I to MARPOL, including a regulation relating to oil fuel tank protection, which became effective August 1, 2007. The regulation applies to various ships delivered on or after August 1, 2010. The requirements it contains address issues like the fuel tanks, protected location accidental oil fuel outflow performance standards, a tank capacity limit and certain other maintenance, inspection and engineering standards.
IMO regulations also require owners and operators of certain vessels to adopt Ship Oil Pollution Emergency Plans. Periodic training and drills for response personnel and for vessels and their crews are required.
Anti-Fouling Requirements
In 2001, the IMO adopted the International Convention on the Control of Harmful Anti-fouling Systems on Ships, the Anti-fouling Convention. The Anti-fouling Convention prohibits the use of organotin compound coatings to prevent the attachment of mollusks and other sea life to the hulls of vessels. Vessels of over 400 gross tons engaged in international voyages are required to undergo an initial survey before the vessel is put into service or before an International Anti-fouling System Certificate is issued for the first time; and subsequent surveys when the anti-fouling systems are altered or replaced. We have obtained Anti-fouling System Certificates for all of our vessels that are subject to the Anti-fouling Convention.
The IMO continues to review and introduce new regulations. For example, in July 2011, MARPOL adopted amendments for the prevention of air pollution, which designate certain waters near the coasts of Puerto Rico and the U.S. Virgin Islands ECAs for emissions of nitrogen oxides, sulfur oxides, and particulate matter. The new ECA designation entered into force on January 1, 2014. It is impossible to predict what additional regulations, if any, may be passed by the IMO and what effect, if any, such regulations might have on our operations.
Compliance Enforcement
The flag state, as defined by the UN Convention on the Law of the Sea, is responsible for implementing and enforcing a broad range of international maritime regulations with respect to all ships granted the right to fly its flag. The “Shipping Industry Guidelines on Flag State Performance” evaluates and reports on flag states based on factors such as sufficiency of infrastructure, ratification, implementation, and enforcement of principal international maritime treaties, supervision of statutory ship surveys, casualty investigations, and participation at IMO and International Labor Organization (“ILO”) meetings. Our vessels are flagged in the Marshall Islands. Marshall Islands-flagged vessels have historically received a good assessment in the shipping industry. We recognize the importance of a credible flag state and do not intend to use flags of convenience or flag states with poor performance indicators.
Noncompliance with the ISM Code or other IMO regulations may subject the ship owner or bareboat charterer to increased liability, lead to decreases in available insurance coverage for affected vessels or result in the denial of access to, or detention in, some ports. As of the date of this report, each of our vessels is ISM Code certified. However, there can be no assurance that such certificates will be maintained in the future.
The IMO continues to introduce new regulations. It is impossible to predict what additional regulations, if any, may be passed by the IMO and what effect, if any, such regulations might have on our operations.
The U.S. Oil Pollution Act of 1990 and the Comprehensive Environmental Response, Compensation and Liability Act
The U.S. Oil Pollution Act of 1990 (“OPA”) established an extensive regulatory and liability regime for the protection and cleanup of the environment from oil spills. OPA affects all “owners and operators” whose vessels trade with the United States, its territories and possessions or whose vessels operate in United States waters, which includes the United States’ territorial sea and its 200 nautical mile exclusive economic zone around the United States. The United States has also enacted the Comprehensive Environmental Response, Compensation and Liability Act (“CERCLA”), which applies to the discharge of hazardous substances other than oil, except in limited circumstances whether on land or at sea. OPA and CERCLA both define “owner and operator” “in the case of a vessel, as any person owning, operating or chartering by demise, the vessel.” Both OPA and CERCLA impact our operations.
Under OPA, vessel owners and operators are “responsible parties” and are jointly, severally and strictly liable (unless the spill results solely from the act or omission of a third party, an act of God or an act of war) for all containment and clean-up costs and other damages arising from discharges or threatened discharges of oil from their vessels. OPA defines these other damages broadly to include:
|
● |
Injury to, destruction or loss of, or loss of use of, natural resources and related assessment costs; |
|
● |
Injury to, or economic losses resulting from, the destruction of real and personal property; |
|
● |
Net loss of taxes, royalties, rents, fees or net profit revenues resulting from injury, destruction or loss of real or personal property, or natural resources; |
|
● |
Loss of subsistence use of natural resources that are injured, destroyed, or lost; |
|
● |
Lost profits or impairment of earning capacity due to injury, destruction or loss of real or personal property or natural resources; and |
|
● |
Net cost of increased of additional public services necessitated by removal activities following a discharge of oil such as protection from fire, safety or health hazards, and loss of subsistence use of natural resources. |
OPA contains statutory caps on liability and damages; such caps do not apply to direct cleanup costs. Effective July 31, 2009, the USCG adjusted the limits of OPA liability for non-tank vessels (e.g. dry bulk) to the greater of $1,000 per gross ton or $854,400 (subject to periodic adjustment for inflation). These limits of liability do not apply if an incident was proximately caused by the violation of an applicable U.S. federal safety, construction or operating regulation by a responsible party (or its agent, employee or a person acting pursuant to a contractual relationship), or a responsible party’s gross negligence or willful misconduct. The limitation on liability similarly does not apply if the responsible party fails or refuses to (i) report the incident where the responsibility party knows or has reason to know of the incident; (ii) reasonably cooperate and assist as requested in connection with oil removal activities; or (iii) without sufficient cause, comply with an order issued under the Federal Water Pollution Act (Section 311 (c), (e)) or the Intervention on the High Seas Act.
CERCLA contains a similar liability regime whereby owners and operators of vessels are liable for cleanup, removal and remedial costs, as well as damage for injury to, or destruction or loss of, natural resources, including the reasonable costs associated with assessing same, and health assessments or health effects studies. There is no liability if the discharge of a hazardous substance results solely from the act or omission of a third party, an act of God or an act of war. Liability under CERCLA is limited to the greater of $300 per gross ton or $5.0 million for vessels carrying a hazardous substance as cargo or residue and the greater of $300 per gross ton or $500,000 for any other vessel. These limits do not apply (rendering the responsible person liable for the total cost of response and damages) if the release or threat of release of a hazardous substance resulted from willful misconduct or negligence, or the primary cause of the release was a violation of applicable safety, construction or operating standards or regulations. The limitation on liability also does not apply if the responsible person fails or refused to provide all reasonable cooperation and assistance as requested in connection with response activities where the vessel is subject to OPA.
OPA and CERCLA each preserve the right to recover damages under existing law, including maritime tort law.
OPA and CERCLA both require owners and operators of vessels to establish and maintain with the USCG evidence of financial responsibility sufficient to meet the maximum amount of liability to which the particular responsible person may be subject. Vessel owners and operators may satisfy their financial responsibility obligations by providing a proof of insurance, a surety bond, qualification as a self-insurer or a guarantee. We have complied with the regulations by providing a certificate of responsibility from third party entities that are acceptable to the USCG evidencing sufficient self-insurance.
We currently maintain pollution liability coverage insurance in the amount of $1 billion per incident for each of our vessels. If the damages from a catastrophic spill were to exceed our insurance coverages, it could have an adverse effect on our business and results of operation.
OPA specifically permits individual states to impose their own liability regimes with regard to oil pollution incidents occurring within their boundaries, provided they accept, at a minimum, the levels of liability established under OPA and some states have enacted legislation providing for unlimited liability for oil spills. In some cases, states which have enacted such legislation have not yet issued implementing regulations defining vessel owners’ responsibilities under these laws. We intend to comply with all applicable state regulations in the ports where our vessels call. We believe that we are in substantial compliance with all applicable existing state requirements. In addition, we intend to comply with all future applicable state regulations in the ports where our vessels call.
Other Environmental Initiatives
The U.S. Clean Water Act (the “CWA”) prohibits the discharge of oil, hazardous substances and ballast water in U.S. navigable waters unless authorized by a duly-issued permit or exemption, and imposes strict liability in the form of penalties for any unauthorized discharges. The CWA also imposes substantial liability for the costs of removal, remediation and damages and complements the remedies available under OPA and CERCLA. Furthermore, many U.S. states that border a navigable waterway have enacted environmental pollution laws that impose strict liability on a person for removal costs and damages resulting from a discharge of oil or a release of a hazardous substance. These laws may be more stringent than U.S. federal law.
The EPA and the USCG, have enacted rules relating to ballast water discharge, compliance with which requires the installation of equipment on our vessels to treat ballast water before it is discharged or the implementation of other port facility disposal arrangements or procedures at potentially substantial cost, and/or otherwise restrict our vessels from entering U.S. waters.
The EPA has enacted rules requiring a permit regulating ballast water discharges and other discharges incidental to the normal operation of certain vessels within United States waters under the Vessel General Permit for Discharges Incidental to the Normal Operation of Vessels (“the VGP”). For a new vessel delivered to an owner or operator after September 19, 2009 to be covered by the VGP, the owner must submit a Notice of Intent (“NOI”) at least 30 days before the vessel operates in United States waters. On March 28, 2013, the EPA re-issued the VGP for another five years; this 2013 VGP took effect December 19, 2013. The 2013 VGP contains numeric ballast water discharge limits for most vessels to reduce the risk of invasive species in US waters, more stringent requirements for exhaust gas scrubbers and the use of environmentally acceptable lubricants. We have submitted NOIs for our vessels where required and do not believe that the costs associated with obtaining and complying with the VGP will have a material impact on our operations.
In addition, under Section 401 of the CWA, the VGP must be certified by the state where the discharge is to take place. Certain states have enacted additional discharge standards as conditions to their certification of the VGP. These local standards bring the VGP into compliance with more stringent state requirements, such as those further restricting ballast water discharges and preventing the introduction of non-indigenous species considered to be invasive. The VGP and its state-specific regulations and any similar restrictions enacted in the future will increase the costs of operating in the relevant waters.
The USCG, regulations adopted under the U.S. National Invasive Species Act also impose mandatory ballast water management practices for all vessels equipped with ballast water tanks entering or operating in U.S. waters which require the installation of equipment to treat ballast water before it is discharged in U.S. waters or, in the alternative, the implementation of other port facility disposal arrangements or procedures. Vessels not complying with these regulations are restricted from entering U.S. waters. The USCG must approve any technology before it is placed on a vessel.
Notwithstanding the foregoing, as of January 1, 2014, vessels are technically subject to the phasing-in of these standards. As a result, the USCG has provided waivers to vessels which cannot install the as-yet unapproved technology. The EPA, on the other hand, has taken a different approach to enforcing ballast discharge standards under the VGP. On December 27, 2013, the EPA issued an enforcement response policy in connection with the new VGP in which the EPA indicated that it would take into account the reasons why vessels do not have the requisite technology installed, but will not grant any waivers.
The U.S. Clean Air Act of 1970 (including its amendments of 1977 and 1990) (the “CAA”) requires the EPA to promulgate standards applicable to emissions of volatile organic compounds and other air contaminants. The CAA also requires states to draft State Implementation Plans (“SIPs”) designed to attain national health-based air quality standards in each state. Although state-specific, SIPs may include regulations concerning emissions resulting from vessel loading and unloading operations by requiring the installation of vapor control equipment.
As referenced above, the amended Annex VI to the IMO's MARPOL Convention, which addresses air pollution from ships, was ratified by the United States on October 8, 2008 and entered into force on January 1, 2010. The EPA and the state of California, however, have each proposed more stringent regulations of air emissions from ocean-going vessels. On July 24, 2008, the California Air Resources Board of the State of California (“CARB”), approved clean-fuel regulations applicable to all vessels sailing within 24 miles of the California coastline. The new CARB regulations require such vessels to use low sulfur marine fuels rather than bunker fuel. As of July 1, 2009, such vessels were required to switch either to marine gas oil with a sulfur content of no more than 1.5% or marine diesel oil with a sulfur content of no more than 0.5%. As of August 1, 2012, only marine gas oil with a sulfur content of no more than 1% or marine diesel oil with a sulfur content of no more than 0.5% is allowed. As of January 1, 2014, only marine gas oil and marine diesel oil fuels with 0.1% sulfur is allowed. These new regulations may require significant expenditures on low-sulfur fuel and would increase our operating costs.
Our operations occasionally generate and require the transportation, treatment and disposal of both hazardous and non-hazardous solid wastes that are subject to the requirements of the U.S. Resource Conservation and Recovery Act (“RCRA,”) or comparable state, local or foreign requirements. The RCRA imposes significant recordkeeping and reporting requirements on transporters of hazardous waste. In addition, from time to time we arrange for the disposal of hazardous waste or hazardous substances at offsite disposal facilities. If such materials are improperly disposed of by third parties, we may still be held liable for cleanup costs under applicable laws.
In October 2009, the EU amended a directive to impose criminal sanctions for illicit ship-source discharges of polluting substances, including minor discharges, if committed with intent, recklessly or with serious negligence and the discharges individually or in the aggregate result in deterioration of the quality of water. Aiding and abetting the discharge of a polluting substance may also lead to criminal penalties. Member States were required to enact laws or regulations to comply with the directive by the end of 2010. Criminal liability for pollution may result in substantial penalties or fines and increased civil liability claims. The directive applies to all types of vessels, irrespective of their flag, but certain exceptions apply to warships or where human safety or that of the ship is in danger.
Greenhouse Gas Regulation
Currently, the emissions of greenhouse gases from international shipping are not subject to the Kyoto Protocol to the UN Framework Convention on Climate Change, which entered into force in 2005 and pursuant to which adopting countries have been required to implement national programs to reduce greenhouse gas emissions. As of January 1, 2013, all new ships must comply with two new sets of mandatory requirements, which were adopted by MEPC in July 2011, to address greenhouse gas emissions from ships. Currently operating ships will be required to develop Ship Energy Efficient Management Plans, and minimum energy efficiency levels per capacity mile will apply to new ships, as defined by the Energy Efficiency Design Index .These requirements could cause us to incur additional compliance costs. The IMO is also planning to implement market-based mechanisms to reduce greenhouse gas emissions from ships at an upcoming MEPC session. The European Parliament and Council of Ministers are expected to endorse regulations that would require monitoring and reporting of greenhouse gas emissions from marine vessels in 2015. In the United States, the EPA has issued a finding that greenhouse gases endanger the public health and safety and has adopted regulations to limit greenhouse gas emissions from certain mobile sources and large stationary sources. The EPA enforces both the CAA and the international standards found in Annex VI of MARPOL concerning marine diesel emissions, and the sulfur content found in marine fuel. Any passage of climate control legislation or other regulatory initiatives by the IMO, the EU, the U.S. or other countries where we operate, or any treaty adopted at the international level to succeed the Kyoto Protocol, that restrict emissions of greenhouse gases could require us to make significant financial expenditures, including capital expenditures to upgrade our vessels, which we cannot predict with certainty at this time.
International Labor Organization
ILO is a specialized agency of the UN with headquarters in Geneva, Switzerland. The ILO has adopted the Maritime Labor Convention 2006 (the “MLC 2006”). A Maritime Labor Certificate and a Declaration of Maritime Labor Compliance will be required to ensure compliance with the MLC 2006 for all ships above 500 gross tons in international trade. The MLC 2006 entered into force on August 20, 2013. The MLC 2006 requires us to develop new procedures to ensure full compliance.
Vessel Security Regulations
Since the terrorist attacks of September 11, 2001 in the United States, there have been a variety of initiatives intended to enhance vessel security such as the Maritime Transportation Security Act of 2002 (“MTSA”). To implement certain portions of the MTSA, in July 2003, the USCG issued regulations requiring the implementation of certain security requirements aboard vessels operating in waters subject to the jurisdiction of the United States. The regulations also impose requirements on certain ports and facilities, some of which are regulated by the EPA.
Similarly, in December 2002, amendments to SOLAS created a new chapter of the convention dealing specifically with maritime security. The new Chapter V became effective in July 2004 and imposes various detailed security obligations on vessels and port authorities, and mandates compliance with the International Ship and Port Facilities Security Code (“ISPS Code”). The ISPS Code is designed to enhance the security of ports and ships against terrorism. Amendments to SOLAS Chapter VII, made mandatory in 2004, apply to vessels transporting dangerous goods and require those vessels be in compliance with the International Maritime Dangerous Goods Code. To trade internationally, a vessel must attain an International Ship Security Certificate (“ISSC”) from a recognized security organization approved by the vessel’s flag state. Among the various requirements are:
|
● |
On-board installation of automatic identification systems to provide a means for the automatic transmission of safety-related information from among similarly equipped ships and shore stations, including information on a ship’s identity, position, course, speed and navigational status; |
|
● |
On board installation of ship security alert systems, which do not sound on the vessel but only alert the authorities on shore; the development of vessel security plans; |
|
● |
Ship identification number to be permanently marked on a vessel’s hull; |
|
● |
A continuous synopsis record kept onboard showing a vessel’s history including the name of the ship, the state whose flag the ship is entitled to fly, the date on which the ship was registered with that state, the ship’s identification number, the port at which the ship is registered and the name of the registered owner(s) and their registered address; and |
|
● |
Compliance with flag state security certification requirements. |
Ships operating without a valid certificate may be detained at port until it obtains an ISSC, or it may be expelled from port, or refused entry at port.
Furthermore, additional security measures could be required in the future which could have a significant financial impact on us. The USCG regulations, intended to be aligned with international maritime security standards, exempt non-U.S. vessels from MTSA vessel security measures, provided such vessels have on board a valid ISSC that attests to the vessel's compliance with SOLAS security requirements and the ISPS Code. We have implemented the various security measures addressed by the MTSA, SOLAS and the ISPS Code.
Financial Regulations
Our business operations in countries outside the U.S. are subject to a number of laws and regulations, including restrictions imposed by the U.S. Foreign Corrupt Practices Act (“FCPA”), as well as economic sanctions and trade embargos administered by OFAC. The FCPA prohibits bribery of foreign officials and requires us to keep books and records that accurately and fairly reflect our transactions. OFAC administers and enforces economic sanctions and trade embargos based on U.S. foreign policy and national security goals against targeted foreign states, organizations and individuals.
In November 2015, the Company filed a voluntary self-disclosure report with OFAC regarding certain apparent violations of U.S. sanctions regulations in the provision of shipping services for third party charterers with respect to the transportation of cargo to or from Myanmar. While the ultimate impact of these matters cannot be determined, there can be no assurance that the impact will not be material to the Company’s financial condition or results of operations. See “Note 11. Commitments and Contingencies – Legal Proceedings” of the financial statements.
Inspection by Classification Societies
Every oceangoing vessel must be “classed” by a classification society. The classification society certifies that the vessel is "in class," signifying that the vessel has been built and maintained in accordance with the rules of the classification society and complies with applicable rules and regulations of the vessel's country of registry and the international conventions of which that country is a member. In addition, where surveys are required by international conventions and corresponding laws and ordinances of a flag state, the classification society will undertake them on application or by official order, acting on behalf of the authorities concerned.
The classification society also undertakes on request other surveys and checks that are required by regulations and requirements of the flag state. These surveys are subject to agreements made in each individual case and/or to the regulations of the country concerned.
For maintenance of the class certification, regular and extraordinary surveys of hull, machinery, including the electrical plant, and any special equipment classed are required to be performed as follows:
Annual Surveys. For seagoing ships, annual surveys are conducted for the hull and the machinery, including the electrical plant, and where applicable for special equipment classed, within three months before or after each anniversary date of the date of commencement of the class period indicated in the certificate.
Intermediate Surveys. Extended annual surveys are referred to as intermediate surveys and typically are conducted two and one-half years after commissioning and each class renewal. Intermediate surveys are to be carried out at or between the second or third annual survey.
Class Renewal Surveys. Class renewal surveys, also known as special surveys, are carried out for the ship’s hull, machinery, including the electrical plant and for any special equipment classed, at the intervals indicated by the character of classification for the hull. At the special survey the vessel is thoroughly examined, including audio-gauging to determine the thickness of the steel structures. Should the thickness be found to be less than class requirements, the classification society would prescribe steel renewals. The classification society may grant a one year grace period for completion of the special survey. Substantial amounts of money may have to be spent for steel renewals to pass a special survey if the vessel experiences excessive wear and tear. In lieu of the special survey approximately every five years, depending on whether a grace period was granted, a ship owner has the option of arranging with the classification society for the vessel’s hull or machinery to be on a continuous survey cycle, in which every part of the vessel would be surveyed within a five year cycle. At an owner’s application, the surveys required for class renewal may be split according to an agreed schedule to extend over the entire period of class. This process is referred to as continuous class renewal.
All areas subject to survey as defined by the classification society are required to be surveyed at least once per class period, unless shorter intervals between surveys are prescribed elsewhere. The period between two subsequent surveys of each area must not exceed five years.
Most vessels are also drydocked every 30 to 36 months for inspection of the underwater parts and for repairs related to inspections. If any defects are found, the classification surveyor will issue a "recommendation" which must be rectified by the ship owner within prescribed time limits.
Most insurance underwriters make it a condition for insurance coverage that a vessel be certified as “in class” by a classification society which is a member of the International Association of Classification Societies (the “IACS”). In December 2013, the IACS adopted new harmonized Common Structure Rules, which will apply to oil tankers and bulk carriers to be constructed on or after July 1, 2015. All our vessels that we have purchased and may agree to purchase in the future must be certified as being “in class” prior to their delivery under our standard purchase contracts and memorandum of agreement. If the vessel is not certified on the date of closing, we have no obligation to take delivery of the vessel. We have all of our vessels, and intend to have all vessels that we acquire in the future, classed by IACS members.
Risk of Loss and Liability Insurance
General
The operation of any dry bulk vessel includes risks such as mechanical failure, collision, property loss, cargo loss or damage and business interruption due to political circumstances in foreign countries, hostilities and labor strikes. In addition, there is always an inherent possibility of marine disaster, including oil spills (e.g. fuel oil) and other environmental mishaps, and the liabilities arising from owning and operating vessels in international trade. OPA, which imposes virtually unlimited liability upon owners, operators and demise charterers of vessels trading in the United States exclusive economic zone for certain oil pollution accidents in the United States, has made liability insurance more expensive for ship owners and operators trading in the U.S. market.
While we maintain hull and machinery insurance, war risks insurance, protection and indemnity cover and freight, demurrage and defense cover for our operating fleet in amounts that we believe to be prudent to cover normal risks in our operations, we may not be able to achieve or maintain this level of coverage throughout a vessel's useful life. Furthermore, while we believe that our current insurance coverage is adequate, not all risks can be insured, and there can be no guarantee that any specific claim will be paid, or that we will always be able to obtain adequate insurance coverage at reasonable rates.
Hull & Machinery and War Risks Insurance
We maintain marine hull and machinery, war risks insurances, which cover the risk of actual or constructive total loss for all of our vessels. Our vessels are each covered up to at least their fair market value with a deductible of $100,000 per vessel per incident.
Protection and Indemnity Insurance
Protection and indemnity insurance is provided by mutual protection and indemnity associations (“P&I Associations”), which insure our third-party liabilities in connection with our shipping activities. This includes third-party liability and other related expenses resulting from the injury, illness or death of crew, passengers and other third parties, the loss or damage to cargo, claims arising from collisions with other vessels, damage to other third-party property, pollution arising from oil or other substances and salvage, towing and other related costs, including wreck removal. Protection and indemnity insurance is a form of mutual indemnity insurance, extended by protection and indemnity mutual associations, or "clubs." Subject to the "capping" discussed below, our coverage, except for pollution, is unlimited.
Our current protection and indemnity insurance coverage for pollution is $1 billion per vessel per incident. The 13 P&I Associations that comprise the International Group insure approximately 90% of the world’s commercial tonnage and have entered into a pooling agreement to reinsure each association’s liabilities. As a member of a P&I Association, which is a member of the International Group, we are subject to calls payable to the associations based on the group’s claim records as well as the claim records of all other members of the individual associations and members of the pool of P&I Associations comprising the International Group.
Competition
We compete with a large number of international dry bulk owners. The international shipping industry is highly competitive and fragmented with many market participants with no single owner accounting for more than 5% of tonnage shipped in 2016. As of December 31, 2016 there are approximately 10,867 dry bulk carriers aggregating approximately 794 million dwt. We compete with other (primarily private) owners of dry bulk vessels in the Handysize, Handymax, and Panamax asset classes.
Competition in the ocean shipping industry varies primarily according to the nature of the contractual relationship as well as with respect to the kind of commodity being shipped. Our business will fluctuate in line with the main patterns of trade of dry bulk cargoes and varies according to changes in the supply and demand for these items. Competition in virtually all bulk trades is intense and based primarily on supply and demand. We compete for charters on the basis of price, vessel location, size, age and condition of the vessel, as well as on our reputation as an owner and operator. Increasingly, major customers are demonstrating a preference for modern vessels based on concerns about the environmental and operational risks associated with older vessels. Consequently, owners of large modern fleets have gained a competitive advantage over owners of older fleets.
As in the spot market, the time charter market is price sensitive and also depends on our ability to demonstrate the high quality of our vessels and operations to chartering customers. However, because of the longer term commitment, customers entering time charters are more concerned about their exposure and image from chartering vessels that do not comply with environmental regulations or that will be forced out of service for extensive maintenance and repairs. Consequently, in the time charter market, factors such as the age and quality of a vessel and the reputation of the owner and operator tend to be more significant than in the spot market in competing for business.
Seasonality
Demand for vessel capacity has historically exhibited seasonal variations and, as a result, fluctuations in charter rates. This seasonality may result in quarter-to-quarter volatility in our operating results for our vessels trading in the spot market and our vessels operating under time index-based time charters. The dry bulk carrier market is typically stronger in the fall and winter months in anticipation of increased consumption of coal and other raw materials in the northern hemisphere during the winter months. In addition, unpredictable weather patterns in these months tend to disrupt vessel scheduling and supplies of certain commodities. To the extent that we must enter into a new charter or renew an existing charter for a vessel in our fleet during a time when seasonal variations have reduced prevailing charter rates, our operating results may be adversely affected.
Value of Assets and Cash Requirements
The replacement costs of comparable new vessels may be above or below the book value of our fleet. The market value of our fleet may be below book value when market conditions are weak and exceed book value when markets are strong. In common with other ship owners, we may consider asset redeployment which at times may include the sale of vessels at less than their book value.
The Company's results of operations and cash flows may be significantly affected by future charter and COA markets.
Exchange Controls
Under Marshall Islands law, there are currently no restrictions on the export or import of capital, including foreign exchange controls or restrictions that affect the remittance of dividends, interest or other payments to non-resident holders of our common stock.
Tax Considerations
The following is a discussion of the material Marshall Islands and United States federal income tax considerations relevant to owning common stock by a United States Holder or a Non-United States Holder, each as defined below. This discussion does not purport to deal with the tax consequences of owning the common stock to all categories of investors, some of which (such as financial institutions, regulated investment companies, real estate investment trusts, tax-exempt organizations, insurance companies, persons holding our common stock as part of a hedging, integrated, conversion or constructive sale transaction or a straddle, traders in securities that have elected the mark-to-market method of accounting for their securities, persons liable for alternative minimum tax, persons who are investors in pass-through entities, dealers in securities or currencies, persons who own 10% or more of our common stock and investors whose functional currency is not the United States dollar) may be subject to special rules. This discussion deals only with holders who own the common stock as a capital asset. Shareholders are encouraged to consult their own tax advisors concerning the overall tax consequences arising in their own particular situation under United States federal, state, local or foreign law of the ownership of our common stock.
Marshall Islands Tax Considerations
In the opinion of Seward & Kissel LLP, the following are the material Marshall Islands tax consequences of our activities to us and shareholders of our common stock. We are incorporated in the Marshall Islands. Under current Marshall Islands law, we are not subject to tax on income or capital gains, and no Marshall Islands withholding tax will be imposed upon payments of dividends by us to our shareholders.
United States Federal Income Tax Considerations
In the opinion of Seward & Kissel LLP, our United States tax counsel, the following are the material United States federal income tax consequences to us of our activities and to United States Holders and to Non-United States Holders of our common stock. The following discussion of United States federal income tax matters is based on the Internal Revenue Code of 1986, as amended, or the Code, judicial decisions, administrative pronouncements, and existing and proposed regulations issued by the United States Department of the Treasury, all of which are subject to change, possibly with retroactive effect. In addition, the discussion below is based, in part, on the description of our business as described in “Item 1. Business” in this Annual Report and assumes that we conduct our business as described in that section.
We have made, or will make, special United States federal income tax elections in respect of each of our ship owning or operating subsidiaries that is potentially subject to tax as a result of deriving income attributable to the transportation of cargoes to or from the United States. The effect of the special U.S. tax elections is to ignore or disregard the subsidiaries for which elections have been made as separate taxable entities and to treat them as part of their parent, the ''Company.'' Therefore, for purposes of the following discussion, the Company, and not the subsidiaries subject to this special election, will be treated as the owner and operator of the vessels and as receiving the income therefrom.
United States Federal Income Taxation of Our Company
Taxation of Operating Income: In General
The Company currently earns, and anticipates that it will continue to earn, substantially all its income from the hiring or leasing of vessels for use on a time or voyage charter basis or from the performance of services directly related to those uses, all of which we refer to as ''shipping income.''
Unless exempt from United States federal income taxation under the rules of Section 883 of the Code (“Section 883”), as discussed below, a foreign corporation such as ourselves will be subject to United States federal income taxation on its ''shipping income'' that is treated as derived from sources within the United States, to which we refer as ''United States source shipping income.'' For tax purposes, ''United States source shipping income'' includes 50% of shipping income that is attributable to transportation that begins or ends, but that does not both begin and end, in the United States.
Shipping income attributable to transportation exclusively between non-United States ports will be considered to be 100% derived from sources outside the United States. Shipping income derived from sources outside the United States will not be subject to any United States federal income tax.
Shipping income attributable to transportation exclusively between United States ports is considered to be 100% derived from United States sources. However, the Company is not permitted by United States law to engage in the transportation of cargoes that produces 100% United States source income.
Unless exempt from tax under Section 883, the Company's gross United States source shipping income would be subject to a 4% tax imposed without allowance for deductions as described below.
Exemption of Operating Income from United States Federal Income Taxation
Under Section 883 and the regulations thereunder, a foreign corporation will be exempt from United States federal income taxation on its United States source shipping income if:
|
● |
it is organized in a qualified foreign country, which is one that grants an ''equivalent exemption'' from tax to corporations organized in the United States in respect of each category of shipping income for which exemption is being claimed under Section 883 and to which we refer as the ''Country of Organization Test''; and |
|
● |
one of the following tests is met: |
|
o |
more than 50% of the value of its shares is beneficially owned, directly or indirectly, by qualified shareholders, which as defined includes individuals who are ''residents'' of a qualified foreign country, to which we refer as the ''50% Ownership Test''; |
|
o |
subject to an exception for closely-held corporations, its shares are ''primarily and regularly traded on an established securities market'' in a qualified foreign country or in the United States, to which we refer as the "Publicly-Traded Test"; or |
|
o |
it is a ''controlled foreign corporation'' and satisfies an ownership test, to which, collectively, we refer to as the ''CFC Test.'' |
The Republic of the Marshall Islands, the jurisdiction where the Company is incorporated, has been officially recognized by the United States Internal Revenue Service (the “IRS”) as a qualified foreign country that grants the requisite ''equivalent exemption'' from tax in respect of each category of shipping income the Company earns and currently expects to earn in the future. Therefore, the Company will be exempt from United States federal income taxation with respect to its United States source shipping income if it satisfies any one of the 50% Ownership Test, the Publicly-Traded Test, or the CFC Test.
For its 2016 taxable year, the Company does not believe it satisfied any of the ownership tests. As a result, the Company expects to be subject to United States federal income taxation on its United States source shipping income and its sale of vessels as discussed in more detail below. Depending on the composition of its ownership, the Company may qualify for the benefits of Section 883 for future taxable years.
Taxation in Absence of Section 883 Exemption
Because the Company does not qualify for the benefits of Section 883 for the 2016 taxable year, the Company's United States source shipping income was subject to a 4% tax imposed by Section 887 of the Code on a gross basis, without the benefit of deductions, to the extent that such income is not considered to be ''effectively connected'' with the conduct of a United States trade or business, as described below. Since under the sourcing rules described above, no more than 50% of the Company's shipping income would be treated as being United States source shipping income, the maximum effective rate of United States federal income tax on the Company’s shipping income can never exceed 2% under the 4% gross basis tax regime. The Company’s United States federal income tax liability was approximately $648,570 for the taxable year ended December 31, 2016 and is included in voyage expenses in our consolidated statement of operations. It should be noted that with respect to any future taxable year, the Company can give no assurance that the operation of its vessels, which are under the control of third party charterers, will not change such that its United States federal income tax liability would be substantially higher.
To the extent the Company's United States source shipping income is considered to be ''effectively connected'' with the conduct of a United States trade or business, as described below, any such ''effectively connected'' United States source shipping income, net of applicable deductions, would be subject to United States federal income tax, currently imposed at rates of up to 35%. In addition, the Company may be subject to the 30% ''branch profits'' tax on earnings effectively connected with the conduct of such trade or business, as determined after allowance for certain adjustments, and on certain interest paid or deemed paid attributable to the conduct of the Company's United States trade or business.
The Company's United States source shipping income would be considered ''effectively connected'' with the conduct of a United States trade or business only if:
|
● |
the Company has, or is considered to have, a fixed place of business in the United States involved in the earning of United States source shipping income; and |
|
● |
substantially all of the Company's United States source shipping income is attributable to regularly scheduled transportation, such as the operation of a vessel that follows a published schedule with repeated sailings at regular intervals between the same points for voyages that begin or end in the United States. |
The Company did not have any vessel sailing to or from the United States on a regularly scheduled basis during its 2016 taxable year. The Company does not intend to have, or permit circumstances that would result in having, any such vessels in future taxable years, but there can be no assurances that this will be the case. Based on the foregoing and on the expected mode of the Company's shipping operations and other activities, the Company believes that none of its United States source shipping income will be ''effectively connected'' with the conduct of a United States trade or business for its 2016 taxable year or any future taxable year.
United States Taxation of Gain on Sale of Vessels
Assuming that any decision on a vessel sale is made from and attributable to the United States office of the Company, as we believe likely to be the case as the Company is currently structured, then any gain derived from the sale of any such vessel will be treated as derived from United States sources and subject to United States federal income tax as ''effectively connected'' income (determined under rules different from those discussed above) under the above described net income tax regime. If the Company were to qualify for exemption from tax under Section 883 in respect of the shipping income derived from the international operation of its vessels, then gain from the sale of any such vessel should likewise be exempt from tax under Section 883.
United States Federal Income Taxation of United States Holders
As used herein, the term ''United States Holder'' means a beneficial owner of our common stock that is an individual United States citizen or resident, a United States corporation or other United States entity taxable as a corporation, an estate the income of which is subject to United States federal income taxation regardless of its source, or a trust if a court within the United States is able to exercise primary jurisdiction over the administration of the trust and one or more United States persons have the authority to control all substantial decisions of the trust.
If a partnership holds our common stock, the tax treatment of a partner will generally depend upon the status of the partner and upon the activities of the partnership. If you are a partner in a partnership holding our common stock, you are encouraged to consult your tax advisor.
Distributions
Subject to the discussion of passive foreign investment companies below, any distributions made by the Company with respect to its common stock to a United States Holder will generally constitute dividends to the extent of the Company's current or accumulated earnings and profits, as determined under United States federal income tax principles. Distributions in excess of such earnings and profits will be treated first as a nontaxable return of capital to the extent of the United States Holder's tax basis in his common stock on a dollar-for-dollar basis and thereafter as capital gain. Because the Company is not a United States corporation, United States Holders that are corporations will not be entitled to claim a dividends received deduction with respect to any distributions they receive from us. Dividends paid with respect to the Company's common stock will generally be treated as ''passive category income'' for purposes of computing allowable foreign tax credits for United States foreign tax credit purposes.
Dividends paid on the Company's common stock to a United States Holder who is an individual, trust or estate (a ''United States Non-Corporate Holder'') will generally be treated as ''qualified dividend income'' that is taxable to such United States Non-Corporate Holder at preferential tax rates provided that (1) the common stock is readily tradable on an established securities market in the United States (such as the Nasdaq Global Select Market on which the Company's common stock is traded); (2) the Company is not a passive foreign investment company for the taxable year during which the dividend is paid or the immediately preceding taxable year (which we do not believe we have been, are or will be); (3) the United States Non-Corporate Holder has owned the common stock for more than 60 days in the 121-day period beginning 60 days before the date on which the common stock becomes ex-dividend; and (4) the United States Non-Corporate Holder is not under an obligation to make related payments with respect to positions in substantially similar or related property.
There is no assurance that any dividends paid on the Company's common stock will be eligible for these preferential rates in the hands of a United States Non-Corporate Holder, although we believe that they will be so eligible. Any dividends out of earnings, and profits the Company pays, which are not eligible for these preferential rates will be taxed as ordinary income to a United States Non-Corporate Holder.
Special rules may apply to any ''extraordinary dividend''—generally, a dividend in an amount which is equal to or in excess of 10% of a shareholder's adjusted basis in a common share—paid by the Company. If the Company pays an ''extraordinary dividend'' on its common stock that is treated as ''qualified dividend income,'' then any loss derived by a United States Non-Corporate Holder from the sale or exchange of such common stock will be treated as long-term capital loss to the extent of such dividend.
Sale, Exchange or Other Disposition of Common Stock
Assuming the Company does not constitute a passive foreign investment company for any taxable year, a United States Holder generally will recognize taxable gain or loss upon a sale, exchange or other disposition of the Company's common stock in an amount equal to the difference between the amount realized by the United States Holder from such sale, exchange or other disposition and the United States Holder's tax basis in such stock. Such gain or loss will be treated as long-term capital gain or loss if the United States Holder's holding period is greater than one year at the time of the sale, exchange or other disposition. Such capital gain or loss will generally be treated as United States source income or loss, as applicable, for United States foreign tax credit purposes. Long-term capital gains of United States Non-Corporate Holders are currently eligible for reduced rates of taxation. A United States Holder's ability to deduct capital losses is subject to certain limitations.
Passive Foreign Investment Company Status and Significant Tax Consequences
Special United States federal income tax rules apply to a United States Holder that holds shares in a foreign corporation classified as a ''passive foreign investment company'' for United States federal income tax purposes. In general, the Company will be treated as a passive foreign investment company with respect to a United States Holder if, for any taxable year in which such holder holds the Company's common stock, either:
|
● |
at least 75% of our gross income for such taxable year consists of passive income (e.g., dividends, interest, capital gains and rents derived other than in the active conduct of a rental business); or |
|
● |
at least 50% of the average value of our assets during such taxable year produce, or are held for the production of, passive income. |
Income earned, or deemed earned, by the Company in connection with the performance of services would not constitute passive income. By contrast, rental income would generally constitute ''passive income'' unless the Company was treated under specific rules as deriving its rental income in the active conduct of a trade or business.
Based on the Company's current operations and future projections, we do not believe that the Company has been or is, nor do we expect the Company to become, a passive foreign investment company with respect to any taxable year. Although there is no legal authority directly on point, our belief is based principally on the position that, for purposes of determining whether the Company is a passive foreign investment company, the gross income it derives from its time chartering and voyage chartering activities should constitute services income, rather than rental income. Accordingly, such income should not constitute passive income, and the assets that the Company owns and operates in connection with the production of such income, in particular, the vessels, should not constitute passive assets for purposes of determining whether the Company is a passive foreign investment company.
We believe there is substantial legal authority supporting our position consisting of case law and IRS pronouncements concerning the characterization of income derived from time charters and voyage charters as services income for other tax purposes. However, there is also authority which characterizes time charter income as rental income rather than services income for other tax purposes. In addition, we have obtained an opinion from our counsel, Seward & Kissel LLP, that, based upon the Company's operations as described herein, its income from time charters and voyage charters should not be treated as passive income for purposes of determining whether it is a passive foreign investment company. However, in the absence of any legal authority specifically relating to the statutory provisions governing passive foreign investment companies, the United States Internal Revenue Service, or the IRS or a court could disagree with our position. In addition, although the Company intends to conduct its affairs in a manner to avoid being classified as a passive foreign investment company with respect to any taxable year, we cannot assure you that the nature of its operations will not change in the future.
As discussed more fully below, if the Company were to be treated as a passive foreign investment company for any taxable year, a United States Holder would be subject to different taxation rules depending on whether the United States Holder makes an election to treat the Company as a ''Qualified Electing Fund,'' which election we refer to as a ''QEF election.'' As an alternative to making a QEF election, a United States Holder should be able to make a ''mark-to-market'' election with respect to the Company's common stock, as discussed below. In addition, if we were to be treated as a passive foreign investment company, a United States holder would be required to file an annual report with the IRS for that year with respect to such holder’s common stock.
Taxation of United States Holders Making a Timely QEF Election
If a United States Holder makes a timely QEF election, which United States Holder we refer to as an ''Electing Holder,'' the Electing Holder must report for United States federal income tax purposes its pro rata share of the Company's ordinary earnings and net capital gain, if any, for each taxable year of the Company for which it is a passive foreign investment company that ends with or within the taxable year of the Electing Holder, regardless of whether or not distributions were received from the Company by the Electing Holder. No portion of any such inclusions of ordinary earnings will be treated as ''qualified dividend income.'' Net capital gain inclusions of United States Non-Corporate Holders would be eligible for preferential capital gains tax rates. The Electing Holder's adjusted tax basis in the common stock will be increased to reflect taxed but undistributed earnings and profits. Distributions of earnings and profits that had been previously taxed will result in a corresponding reduction in the adjusted tax basis in the common stock and will not be taxed again once distributed. An Electing Holder would not, however, be entitled to a deduction for its pro rata share of any losses that the Company incurs with respect to any year. An Electing Holder would generally recognize capital gain or loss on the sale, exchange or other disposition of the Company's common stock. A United States Holder would make a timely QEF election for shares of the Company by filing one copy of IRS Form 8621 with his United States federal income tax return for the first year in which he held such shares when the Company was a passive foreign investment company. If the Company were to be treated as a passive foreign investment company for any taxable year, the Company would provide each United States Holder with all necessary information in order to make the QEF election described above.
Taxation of United States Holders Making a ''Mark-to-Market'' Election
Alternatively, if the Company were to be treated as a passive foreign investment company for any taxable year and, as we anticipate, its shares are treated as "marketable stock", a United States Holder would be allowed to make a ''mark-to-market'' election with respect to the Company's common stock, provided the United States Holder completes and files IRS Form 8621 in accordance with the relevant instructions and related Treasury regulations. If that election is made, the United States Holder generally would include as ordinary income in each taxable year the excess, if any, of the fair market value of the common stock at the end of the taxable year over such holder's adjusted tax basis in the common stock. The United States Holder would also be permitted an ordinary loss in respect of the excess, if any, of the United States Holder's adjusted tax basis in the common stock over its fair market value at the end of the taxable year, but only to the extent of the net amount previously included in income as a result of the mark-to-market election. A United States Holder's tax basis in his common stock would be adjusted to reflect any such income or loss amount. Gain realized on the sale, exchange or other disposition of the Company's common stock would be treated as ordinary income, and any loss realized on the sale, exchange or other disposition of the Company’s common stock would be treated as ordinary loss to the extent that such loss does not exceed the net mark-to-market gains previously included by the United States Holder. No income inclusions under this election will be treated as "qualified dividend income."
Taxation of United States Holders Not Making a Timely QEF or Mark-to-Market Election
Finally, if the Company were to be treated as a passive foreign investment company for any taxable year, a United States Holder who does not make either a QEF election or a ''mark-to-market'' election for that year, whom we refer to as a ''Non-Electing Holder,'' would be subject to special rules with respect to (1) any excess distribution (i.e., the portion of any distributions received by the Non-Electing Holder on the common stock in a taxable year in excess of 125% of the average annual distributions received by the Non-Electing Holder in the three preceding taxable years, or, if shorter, the Non-Electing Holder's holding period for the common stock), and (2) any gain realized on the sale, exchange or other disposition of the Company's common stock. Under these special rules:
|
|
● |
the excess distribution or gain would be allocated ratably over the Non-Electing Holder's aggregate holding period for the common stock; |
|
|
● |
the amount allocated to the current taxable year, and any taxable year prior to the first taxable year in which the Company was a passive foreign investment company, would be taxed as ordinary income and would not be ''qualified dividend income''; and |
|
|
● |
the amount allocated to each of the other taxable years would be subject to tax at the highest rate of tax in effect for the applicable class of taxpayer for that year, and an interest charge for the deemed deferral benefit would be imposed with respect to the resulting tax attributable to each such other taxable year. |
These special rules would not apply to a qualified pension, profit sharing or other retirement trust or other tax-exempt organization that did not borrow money or otherwise utilize leverage in connection with its acquisition of the Company's common stock. If the Company is a passive foreign investment company and a Non-Electing Holder who is an individual dies while owning the Company's common stock, such holder's successor generally would not receive a step-up in tax basis with respect to such shares.
United States Federal Income Taxation of ''Non-United States Holders''
A beneficial owner of common stock (other than a partnership) that is not a United States Holder is referred to herein as a "Non-United States Holder".
If a partnership holds our common stock, the tax treatment of a partner will generally depend upon the status of the partner and upon the activities of the partnership. If you are a partner in a partnership holding our common stock, you are encouraged to consult your tax advisor.
Dividends on Common Stock
Non-United States Holders generally will not be subject to United States federal income tax or withholding tax on dividends received from the Company with respect to its common stock, unless that income is effectively connected with the Non-United States Holder's conduct of a trade or business in the United States. If the Non-United States Holder is entitled to the benefits of a United States income tax treaty with respect to those dividends, that income is taxable only if it is attributable to a permanent establishment maintained by the Non-United States Holder in the United States.
Sale, Exchange or Other Disposition of Common Stock
Non-United States Holders generally will not be subject to United States federal income tax or withholding tax on any gain realized upon the sale, exchange or other disposition of the Company's common stock, unless:
|
● |
The gain is effectively connected with the Non-United States Holder’s conduct of a trade or business in the United States (and, if the Non-United States holder is entitled to the benefits of an income tax treaty with respect to that gain, that gain is attributable to a permanent establishment maintained by the Non-United States holder in the United States); or |
|
● |
The Non-United States Holder is an individual who is present in the United States for 183 days or more during the taxable year of disposition and other conditions are met. |
If the Non-United States Holder is engaged in a United States trade or business for United States federal income tax purposes, the income from the common stock, including dividends and the gain from the sale, exchange or other disposition of the shares, that is effectively connected with the conduct of that trade or business will generally be subject to regular United States federal income tax in the same manner as discussed in the previous section relating to the taxation of United States Holders. In addition, if you are a corporate Non-United States Holder, your earnings and profits that are attributable to the effectively connected income, which are subject to certain adjustments, may be subject to an additional branch profits tax at a rate of 30%, or at a lower rate as may be specified by an applicable income tax treaty.
Backup Withholding and Information Reporting
In general, dividend payments, or other taxable distributions, made within the United States to you will be subject to information reporting requirements if you are a non-corporate United States Holder. Such payments or distributions may also be subject to backup withholding tax if you are a non-corporate United States Holder and you:
|
● |
Fail to provide an accurate taxpayer identification number; |
|
● |
Are notified by the IRS that you have failed to report all interest or dividends required to be shown on your federal income tax returns; or |
|
● |
In certain circumstances, fail to comply with applicable certification requirements. |
Non-United States Holders may be required to establish their exemption from information reporting and backup withholding by certifying their status on an appropriate IRS Form W-8.
If you are a Non-United States Holder and you sell your common stock to or through a United States office of a broker, the payment of the proceeds is subject to both United States backup withholding and information reporting unless you certify that you are a non-United States person, under penalties of perjury, or you otherwise establish an exemption. If you sell your common stock through a non-United States office of a non-United States broker and the sales proceeds are paid to you outside the United States, then information reporting and backup withholding generally will not apply to that payment. However, United States information reporting requirements, but not backup withholding, will apply to a payment of sales proceeds, even if that payment is made to you outside the United States, if you sell your common stock through a non-United States office of a broker that is a United States person or has some other contacts with the United States. Such information reporting requirements will not apply, however, if the broker has documentary evidence in its records that you are a non-United States person and certain other conditions are met, or you otherwise establish an exemption.
Backup withholding tax is not an additional tax. Rather, you generally may obtain a refund of any amounts withheld under backup withholding rules that exceed your income tax liability by filing a refund claim with the IRS.
Individuals who are United States Holders (and to the extent specified in applicable Treasury regulations, certain United States entities and Non-United States Holders) who hold “specified foreign financial assets” (as defined in Section 6038D of the Code) are required to file IRS Form 8938 with information relating to the asset for each taxable year in which the aggregate value of all such assets exceeds $75,000 at any time during the taxable year or $50,000 on the last day of the taxable year (or such higher dollar amount as prescribed by applicable Treasury regulations). Specified foreign financial assets would include, among other assets, our common shares, unless the shares are held through an account maintained with a United States financial institution. Substantial penalties apply to any failure to timely file IRS Form 8938, unless the failure is shown to be due to reasonable cause and not due to willful neglect. Additionally, in the event an individual United States Holder (and to the extent specified in applicable Treasury regulations, a United States entity and Non-United States Holders) that is required to file IRS Form 8938 does not file such form, the statute of limitations on the assessment and collection of United States federal income taxes of such holder for the related tax year may not close until three years after the date that the required information is filed. United States Holders (including United States entities) and Non-United States Holders are encouraged to consult their own tax advisors regarding their reporting obligations under this legislation.
Glossary of Shipping Terms
The following are definitions of shipping terms used in this Form 10-K.
Annual Survey— The inspection of a vessel by a classification society, on behalf of a flag state, that takes place every year.
Baltic Dry Index or BDI —The BDI is an index published by the Baltic Exchange which tracks worldwide international shipping prices of various dry bulk cargoes. The index provides an assessment of the price for moving major raw materials by sea and is composed of 20 key shipping routes.
Baltic Exchange—Based in London, the Baltic Exchange is a market for the trading and settlement of shipping and freight contracts. The exchange publishes daily freight market prices and maritime shipping cost indices, including: Baltic Dry Index (BDI), Baltic Supramax Index (BSI), Baltic Panamax Index (BPI), Baltic Capesize Index (BCI), Baltic Tanker Dirty Index (BDTI), and Baltic Tanker Clean Index (BCTI).
Baltic Supramax Index or BSI —The BSI is an index published by the Baltic Exchange which tracks gross time charter value for a specific 52,000 dwt. vessel.
Bareboat Charter—Also known as "demise charter." Contract or hire of a ship under which the ship owner is usually paid a fixed amount of charter hire rate for a certain period of time during which the charterer is responsible for the operating costs and voyage costs of the vessel as well as arranging for crewing.
Bulk Vessels/Carriers—Vessels which are specially designed and built to carry large volumes of cargo in bulk cargo form.
Bunkers—Heavy fuel oil used to power a vessel's engines.
Capesize—A dry bulk carrier in excess of 100,000 dwt.
Charter— The hire of a vessel for a specified period of time or to carry a cargo for a fixed fee from a loading port to a discharging port. The contract for a charter is called a charter party.
Charterer— The individual or company hiring a vessel.
Charter Hire Rate— A sum of money paid to the vessel owner by a charterer under a time charter party for the use of a vessel.
Classification Society—An independent organization which certifies that a vessel has been built and maintained in accordance with the rules of such organization and complies with the applicable rules and regulations of the country of such vessel and the international conventions of which that country is a member.
Contract of Affreightment or “COA”—An agreement providing for the transportation between specified points for a specific quantity of cargo over a specific time period but without designating specific vessels or voyage schedules, thereby allowing flexibility in scheduling since no vessel designation is required. COAs can either have a fixed rate or a market-related rate.
Deadweight Ton or "dwt"—A unit of a vessel's capacity for cargo, fuel oil, stores and crew, measured in metric tons of 1,000 kilograms. A vessel's DWT or total deadweight is the total weight the vessel can carry when loaded to a particular load line.
Demise Charter—See bareboat charter.
Demurrage—Additional revenue paid to the ship owner on its Voyage Charters for delays experienced in loading and/or unloading cargo that are not deemed to be the responsibility of the ship owner, calculated in accordance with specific Charter terms.
Despatch —The amount payable by the ship owner if the vessel completes loading or discharging before the laytime has expired, calculated in accordance with specific charter terms.
Draft—Vertical Distance between the waterline and the bottom of the vessel's keel.
Dry Bulk—Non-liquid cargoes of commodities shipped in an unpackaged state.
Drydocking—The removal of a vessel from the water for inspection and/or repair of submerged parts.
Gross Ton—Unit of 100 cubic feet or 2.831 cubic meters used in arriving at the calculation of gross tonnage.
Handymax—A dry bulk carrier of approximately 35,000 to 65,000 dwt.
Handysize—A dry bulk carrier having a carrying capacity of up to approximately 35,000 dwt.
Hull—The shell or body of a vessel.
International Maritime Organization or "IMO"—A UN agency that issues international trade standards for shipping.
Intermediate Survey—The inspection of a vessel by a classification society surveyor which takes place between two and three years before and after each Special Survey for such vessel pursuant to the rules of international conventions and classification societies.
ISM Code—The International Management Code for the Safe Operation of Ships and for Pollution Prevention, as adopted by the IMO.
Metric Ton—A unit of measurement equal to 1,000 kilograms.
Newbuilding—A newly constructed vessel.
OPA—The United States Oil Pollution Act of 1990 (as amended).
Orderbook—A reference to currently placed orders for the construction of vessels (e.g., the Panamax orderbook).
Panamax—A dry bulk carrier of approximately 60,000 to 100,000 dwt of maximum length, depth and draft capable of passing fully loaded through the Panama Canal.
Protection & Indemnity Insurance—Insurance obtained through a mutual association formed by ship owners to provide liability insurance protection from large financial loss to one member through contributions towards that loss by all members.
Scrapping—The disposal of old or damaged vessel tonnage by way of sale as scrap metal.
Short-Term Time Charter—A time charter which lasts less than approximately 12 months.
Sister Ships—Vessels of the same class and specification which were built by the same shipyard.
SOLAS—The International Convention for the Safety of Life at Sea 1974, as amended, adopted under the auspices of the IMO.
Special Survey—The inspection of a vessel by a classification society surveyor which takes place a minimum of every four years and a maximum of every five years.
Spot Market—The market for immediate chartering of a vessel usually for single voyages.
Strict Liability—Liability that is imposed without regard to fault.
Supramax—A new class of Handymax dry bulk carrier of approximately 50,000 to 59,000 dwt.
Technical Management—The management of the operation of a vessel, including physically maintaining the vessel, maintaining necessary certifications, and supplying necessary stores, spares, and lubricating oils. Responsibilities also generally include selecting, engaging and training crew, and arranging necessary insurance coverage.
Time Charter—Contract for hire of a ship. A charter under which the ship-owner is paid charter hire rate on a per day basis for a certain period of time, the ship owner being responsible for providing the crew and paying operating costs while the charterer is responsible for paying the voyage costs. Any delays at port or during the voyages are the responsibility of the charterer, save for certain specific exceptions such as loss of time arising from vessel breakdown and routine maintenance.
Ton —A metric ton.
Ultramax- A new class of Handymax dry bulk carrier of approximately 60,000 to 65,000 dwt.
Voyage Charter—Contract for hire of a vessel under which a ship owner is paid freight on the basis of moving cargo from a loading port to a discharge port. The ship owner is responsible for paying both operating costs and voyage costs. The charterer is typically responsible for any delay at the loading or discharging ports.
Voyage Expenses—Includes fuel, port charges, canal tolls, cargo handling operations and brokerage commissions paid by the Company under Voyage Charters. These expenses are subtracted from shipping revenues to calculate Time Charter Equivalent revenues for Voyage Charters.
Vessel expenses – Includes crewing, repairs and maintenance, insurance, stores, lubes, communication expenses.
Available Information
The Company makes available free of charge through its internet website, www.eagleships.com, its annual reports on Form 10-K, quarterly reports on Form 10-Q, current reports on Form 8-K and amendments to these reports filed or furnished pursuant to Section 13(a) or 15(d) of the Exchange Act, as soon as reasonably practicable after the Company electronically files such material with, or furnishes it to, the SEC. You may read and copy any document we file with the SEC at the SEC's public reference facilities maintained by the SEC at 100 F Street, N.E., Room 1580, Washington, D.C. 20549. Please call the SEC at 1-800-SEC-0330 for further information on the public reference facilities. Our SEC filings are also available to the public at the SEC's web site at http://www.sec.gov. The information on our website is not incorporated by reference into this Annual Report.
We maintain our principal executive offices at 300 First Stamford Place 5th Floor, Stamford, Connecticut. Our telephone number at that address is (203) 276-8100. Our website address is www.eagleships.com. Information contained on our website does not constitute part of this Annual Report.
ITEM 1A. RISK FACTORS
We operate in an intensely competitive industry. Some of the following risks relate principally to the industry in which we operate and our business in general. Other risks relate principally to the securities market, national and global economic conditions and the ownership of our common stock. The occurrence of specific factors, including the risks described below could cause our results to differ materially from those contained in the forward-looking statements made in this report, and could significantly and negatively affect our business, financial condition or operating results.
Industry Specific Risk Factors
Charter hire rates for dry bulk vessels are volatile and have declined significantly since their historic highs and may continue to decrease in the future, which may adversely affect our earnings, revenue and profitability and our ability to comply with our loan covenants.
The dry bulk shipping industry is cyclical with high volatility in charter hire rates and profitability. The degree of charter hire rate volatility among different types of dry bulk vessels has varied widely; however, the continued downturn in the dry bulk charter market has severely affected the entire dry bulk shipping industry and charter hire rates for dry bulk vessels have declined significantly from historically high levels. The Baltic Dry Index (the “BDI”), a daily average of charter rates for key dry bulk routes published by The Baltic Exchange, which has long been viewed as the main benchmark to monitor the movements of the dry bulk vessel charter market and the performance of the entire dry bulk shipping market, declined 94% in 2008 from a peak of 11,793 in May 2008 to a low of 663 in December 2008. Since 2008, the BDI recorded a high of 4,661 in November 2009 and posted an all-time low of 290 in February 2016. During 2016, the high and low reached 1,257 and 290, respectively. There can be no assurance that the dry bulk charter market will increase further, and the market could decline.
Fluctuations in charter rates result from changes in the supply of and demand for vessel capacity and changes in the supply of and demand for the major commodities carried by water internationally. Because the factors affecting the supply of and demand for vessels are outside of our control and are unpredictable, the nature, timing, direction and degree of changes in industry conditions are also unpredictable. If charter rates in the dry bulk market continue to decline and remain at low levels for any significant period in 2017, this will have an adverse effect on our revenues, profitability, cash flows and our ability to comply with the financial covenants in our loan agreements.
Factors that influence demand for dry bulk vessel capacity include:
|
● |
supply of and demand for energy resources, commodities and industrial products; |
|
● |
changes in the exploration or production of energy resources, commodities, consumer and industrial products; |
|
● |
the location of regional and global exploration, production and manufacturing facilities; |
|
● |
the location of consuming regions for energy resources, commodities, semi-finished and finished consumer and industrial products; |
|
● |
the globalization of production and manufacturing; |
|
● |
global and regional economic and political conditions, including armed conflicts and terrorist activities; embargoes and strikes; |
|
● |
developments in international trade; |
|
● |
changes in seaborne and other transportation patterns, including the distance cargo is transported by sea; |
|
● |
environmental and other regulatory developments; |
|
● |
currency exchange rates; and |
|
● |
weather. |
Factors that influence the supply of vessel capacity include:
|
● |
the number of newbuilding deliveries; |
|
● |
port and canal congestion; |
|
● |
the scrapping of older vessels; |
|
● |
vessel casualties; |
|
● |
slow steaming; and |
|
● |
the number of vessels that are out of service, namely those that are laid-up, drydocked awaiting repairs or otherwise not available for hire. |
In addition to the prevailing and anticipated freight rates, factors that affect the rate of newbuilding, scrapping and laying-up include newbuilding prices, secondhand vessel values in relation to scrap prices, costs of bunkers and other operating costs, costs associated with classification society surveys, normal maintenance and insurance coverage, the efficiency and age profile of the existing dry bulk fleet in the market and government and industry regulation of maritime transportation practices, particularly environmental protection laws and regulations. These factors influencing the supply of and demand for shipping capacity are outside of our control, and we may not be able to correctly assess the nature, timing and degree of changes in industry conditions.
We anticipate that the future demand for our dry bulk vessels will be dependent upon economic growth in the world's economies, including China and India, seasonal and regional changes in demand, changes in the capacity of the global dry bulk fleet and the sources and supply of dry bulk cargo to be transported by sea. Given the large number of new dry bulk carriers currently on order with the shipyards, the capacity of the global dry bulk carrier fleet seems likely to increase and there can be no assurance that economic growth will resume or continue. Adverse economic, political, social or other developments could have a material adverse effect on our business and operating results.
Because we employ most of our vessels on short-term time and voyage charters, we are exposed to changes in the spot market and short-term charter rates for dry bulk carriers and such changes may affect our earnings and the value of our vessels at any given time. We cannot assure you that we will be able to successfully renew the charters for these vessels at rates sufficient to allow us to meet our obligations. If the very low charter rates in the dry bulk market continue to exist when we are required to renew these charters or in the future when our other charters must be renewed, this may have an adverse effect on our revenues, profitability, cash flows and our ability to comply with the financial covenants in our loan agreements
In addition, because the market value of our vessels may fluctuate significantly, we may incur losses when we sell vessels, which may adversely affect our earnings. If we sell vessels at a time when vessel prices have fallen and before we have recorded an impairment adjustment to our financial statements, the sale may be at less than the vessel's carrying amount on our financial statements, resulting in a loss and a reduction in earnings.
The current global economic environment may continue to negatively impact our business.
While economies in certain parts of the world are in the initial stages of recovery, growth in economies such as China that have historically led to increased demand for dry bulk cargoes has decelerated. Decreasing demand for dry bulk cargoes has led to lower demand for dry bulk vessels, which combined with increased supply of dry bulk vessels has created downward pressure on charter rates. General market volatility has endured as a result of uncertainty about sovereign debt and government austerity measures and speculation about the growth rate of the Chinese economy. The economies of the EU and other parts of the world continue to experience relatively slow growth or exhibit weak economic trends. If the current global economic environment persists or worsens, we may be negatively affected in the following ways:
|
● |
We may not be able to employ our vessels at charter rates as favorable to us as historical rates or operate our vessels profitably. |
|
● |
Our earnings and cash flows could remain at depressed levels or decline, which may leave us with insufficient cash resources to make required amortization payments under our credit facilities or cause us to breach one or more of the covenants in our credit facilities, thereby potentially accelerating the repayment of outstanding indebtedness. |
|
● |
The market values of our vessels could further decrease, which may cause us to recognize losses if any of our vessels are sold or if their values are impaired. A further decline in the market value of our vessels could trigger defaults under our credit facilities’ covenants. |
|
● |
Our charterers may fail to meet their obligations under our time charter or voyage charter agreements. |
|
● |
The occurrence of one or more of these events could have a material adverse effect on our business, results of operations, cash flows and financial condition. |
The current state of global financial markets and current economic conditions may adversely impact our ability to obtain additional financing or refinance our existing credit facilities on acceptable terms, which may hinder or prevent us from operating or expanding our business.
Global financial markets and economic conditions have been, and continue to be, volatile. Although capital markets have shown signs of improvement recently, they still remain volatile. These issues, along with significant write-offs in the financial services sector, the re-pricing of credit risk and the current weak economic conditions, have made, and will likely continue to make, it difficult to obtain additional financing. The current state of global financial markets and current economic conditions might adversely impact our ability to issue additional equity.
Also, as a result of concerns about the stability of financial markets generally and the solvency of counterparties specifically, the cost of obtaining money from the credit markets has increased as many lenders have increased interest rates, enacted tighter lending standards, refused to refinance existing debt at all or on terms similar to current debt and reduced, and in some cases ceased, to provide funding to borrowers. Due to these factors, we cannot be certain that additional financing will be available if needed and to the extent required, or that we will be able to refinance our existing credit facilities, on acceptable terms or at all. If additional financing or refinancing is not available when needed, or is available only on unfavorable terms, we may be unable to meet our obligations as they come due or we may be unable to enhance our existing business, complete additional acquisitions or otherwise take advantage of business opportunities as they arise. For more information on the First Lien Facility (as defined herein) and Second Lien Facility (as defined herein), see “Item 7 Management’s Discussion and Analysis of Financial Condition and Results of Operation—Liquidity and Capital Resources” and “Note 2. Corporate Reorganization” of the financial statements.
The instability of the euro or the inability of countries to refinance their debts could have a material adverse effect on our revenue, profitability and financial position.
As a result of the credit crisis in Europe, the European Commission created the European Financial Stability Facility (the “EFSF”) and the European Financial Stability Mechanism (the “EFSM”) to provide funding to Eurozone countries in financial difficulties that seek such support. In September 2012, the European Council established a permanent stability mechanism, the European Stability Mechanism, or the ESM, to assume the role of the EFSF and the EFSM in providing external financial assistance to Eurozone countries. Despite these measures, concerns persist regarding the debt burden of some Eurozone countries, such as Greece, and their ability to meet future financial obligations and the overall stability of the euro. An extended period of adverse development in the outlook for European countries could reduce the overall demand for dry bulk goods. These potential developments, or negative market perceptions, could affect our financial position, results of operations and cash flow.
Changes in the economic and political environment in China and policies adopted by the government to regulate its economy may have a material adverse effect on our business, financial condition and results of operations.
The Chinese economy differs from the economies of most countries belonging to the Organization for Economic Cooperation and Development, or OECD, in such respects as structure, government involvement, level of development, growth rate, capital reinvestment, allocation of resources, rate of inflation and balance of payments position. Prior to 1978, the Chinese economy was a planned economy. Since 1978, increasing emphasis has been placed on the utilization of market forces in the development of the Chinese economy. Annual and five year State Plans are adopted by the Chinese government in connection with the development of the economy. Although state-owned enterprises still account for a substantial portion of the Chinese industrial output, in general, the Chinese government is reducing the level of direct control that it exercises over the economy through State Plans and other measures. There is an increasing level of freedom and autonomy in areas such as allocation of resources, production, pricing and management and a gradual shift in emphasis to a "market economy" and enterprise reform. Limited price reforms were undertaken with the result that prices for certain commodities are principally determined by market forces.
Many of the reforms are unprecedented or experimental and may be subject to revision, change or abolition based upon the outcome of such experiments. If the Chinese government does not continue to pursue a policy of economic reform, the level of imports to and exports from China could be adversely affected by changes to these economic reforms by the Chinese government, as well as by changes in political, economic and social conditions or other relevant policies of the Chinese government, such as changes in laws, regulations or export and import restrictions, all of which could, adversely affect our business, operating results and financial condition.
The market values of our vessels have declined and may further decrease, which could limit the amount of funds that we can borrow or cause us to breach certain financial covenants in our current or future credit facilities and we may incur a loss if we sell vessels following a decline in their market value.
The fair market values of our vessels have generally experienced high volatility and have recently declined significantly. The market prices for secondhand Handymax and Supramax dry bulk carriers have recently decreased sharply from their historically high levels. The fair market value of our vessels may continue to fluctuate depending on a number of factors, including:
|
● |
prevailing level of charter rates; |
|
● |
general economic and market conditions affecting the shipping industry; |
|
● |
types, sizes and ages of vessels; |
|
● |
supply of and demand for vessels; |
|
● |
other modes of transportation; |
|
● |
cost of new buildings; |
|
● |
governmental or other regulations; |
|
● |
the need to upgrade secondhand and previously owned vessels as a result of charterer requirements, technological advances in vessel design or equipment or otherwise; and |
|
● |
technological advances. |
Conversely, if vessel values are elevated at a time when we wish to acquire additional vessels, the cost of acquisition may increase and this could adversely affect our business, results of operations, cash flow and financial condition.
Fuel cost, or bunker prices, may adversely affect profits.
While we generally do not bear the cost of fuel, or bunkers, for vessels operating on time charters, fuel is a significant factor in negotiating charter rates. As a result, an increase in the price of fuel beyond our expectations may adversely affect our profitability at the time of charter negotiation. Fuel is also a significant, if not the largest, expense in our shipping operations when vessels are under voyage charter. The price and supply of fuel is unpredictable and fluctuates based on events outside our control, including geopolitical developments, supply and demand for oil and gas, actions by the Organization of Petroleum Exporting Countries (“OPEC”) and other oil and gas producers, war and unrest in oil producing countries and regions, regional production patterns and environmental concerns. Further, fuel may become much more expensive in the future, which may reduce the profitability and competitiveness of our business versus other forms of transportation, such as truck or rail.
Compliance with safety and other vessel requirements imposed by classification societies may be very costly and may adversely affect our business.
The hull and machinery of every commercial vessel must be classed by a classification society authorized by its country of registry. The classification society certifies that a vessel is safe and seaworthy in accordance with the applicable rules and regulations of the country of registry of the vessel and the Safety of Life at Sea Convention.
A vessel must undergo annual surveys, intermediate surveys and special surveys. In lieu of a special survey, a vessel’s machinery may be on a continuous survey cycle under which the machinery would be surveyed periodically over a five-year period. Every vessel is also required to be drydocked every two and a half to five years for inspection of its underwater parts.
Compliance with the above requirements may result in significant expense. If any vessel does not maintain its class or fails any annual, intermediate or special survey, the vessel will be unable to trade between ports and will be unemployable and uninsurable, which could negatively impact our results of operations and financial condition.
We are subject to complex laws and regulations, including environmental regulations that can adversely affect the cost, manner or feasibility of doing business.
Our operations are subject to numerous laws and regulations in the form of international conventions and treaties, national, state and local laws and national and international regulations in force in the jurisdictions in which our vessels operate or are registered, which can significantly affect the ownership and operation of our vessels. These regulations include, but are not limited to, OPA, CERCLA, the CAA, the CWA, the MTSA, requirements of the USCG and the EPA, and regulations of the IMO, including MARPOL, as from time to time amended including designation of ECAs thereunder, SOLAS, as from time to time amended, the ISM Code, the International Convention on Load Lines of 1966, as from time to time amended, the IMO International Convention on Civil Liability for Oil Pollution Damage of 1969, as from time to time amended and replaced by the 1992 protocol, and generally referred to as CLC, the IMO International Convention on Civil Liability for Bunker Oil Pollution Damage of 2001, or the Bunker Convention, and EU regulations. Compliance with such laws, regulations and standards, where applicable, may require installation of costly equipment or operational changes and may affect the resale value or useful lives of our vessels. We may also incur additional costs in order to comply with other existing and future regulatory obligations, including, but not limited to, costs relating to air emissions, the management of ballast and bilge waters, elimination of tin-based paint, maintenance and inspection, development and implementation of emergency procedures and insurance coverage or other financial assurance of our ability to address pollution incidents. These costs could have a material adverse effect on our business, results of operations, cash flows and financial condition. A failure to comply with applicable laws and regulations may result in administrative and civil penalties, criminal sanctions or the suspension or termination of our operations. Environmental laws often impose strict liability for remediation of spills and releases of oil and hazardous substances, which could subject us to liability without regard to whether we were negligent or at fault. Under OPA, for example, owners, operators and bareboat charterers are jointly and severally strictly liable for the discharge of oil within the 200-mile exclusive economic zone around the United States. An oil spill could result in significant liability, including fines, penalties and criminal liability and remediation costs for natural resource damages under other federal, state and local laws, as well as third-party damages. We are required to satisfy insurance and financial responsibility requirements for potential oil (including marine fuel) spills and other pollution incidents. Although we have arranged insurance to cover certain environmental risks, there can be no assurance that such insurance will be sufficient to cover all such risks or that any claims will not have a material adverse effect on our business, results of operations, cash flows and financial condition and our ability to pay dividends, if any, in the future.
Further declines in charter rates and vessel values could cause us to incur impairment charges.
We evaluate the carrying amounts of our vessels to determine if events have occurred that would require an impairment of their carrying amounts. The recoverable amount of vessels is reviewed based on events and changes in circumstances that would indicate that the carrying amount of the assets might not be recovered. The review for potential impairment indicators and projection of future cash flows related to the vessels is complex and requires us to make various estimates including future freight rates, earnings from the vessels and discount rates. All of these items have been historically volatile.
We evaluate the recoverable amount as the higher of fair value less costs to sell and value in use. If the recoverable amount is less than the carrying amount of the vessel, the vessel is deemed impaired. The carrying values of our vessels may not represent their fair market value in the future because the new market prices of second-hand vessels tend to fluctuate with changes in charter rates and the cost of new buildings. Any impairment charges incurred as a result of declines in charter rates could have a material adverse effect on our business, results of operations, cash flows and financial condition.
An over-supply of dry bulk carrier capacity may prolong or further depress the current low charter rates, which may limit our ability to operate our dry bulk carriers profitably.
The market supply of dry bulk carriers has been increasing as a result of the delivery of numerous newbuilding orders over the last few years. Newbuildings have been delivered in significant numbers since the beginning of 2006. The oversupply of dry bulk carrier capacity has contributed to a reduction of charter hire rates, as evidenced by the low rates we have experienced during 2016. The market is historically volatile. Although the current year charter rates are higher, we do not know if it will last and whether we can recharter our vessels at competitive rates or we may not be able to charter these vessels at all. The occurrence of these events could have a material adverse effect on our business, results of operations, cash flows, financial condition.
A decrease in the level of China’s export of goods or an increase in trade protectionism could have a material adverse impact on our charterers’ business and, in turn, could cause a material adverse impact on our results of operations, financial condition and cash flows.
China exports considerably more goods than it imports. Our vessels may be deployed on routes involving trade in and out of emerging markets, and our charterers’ shipping and business revenue may be derived from the shipment of goods from the Asia Pacific region to various overseas export markets including the United States and Europe. Any reduction in or hindrance to the output of China-based exporters could have a material adverse effect on the growth rate of China’s exports and on our charterers’ business. For instance, the government of China has recently implemented economic policies aimed at increasing domestic consumption of Chinese-made goods. This may have the effect of reducing the supply of goods available for export and may, in turn, result in a decrease of demand. Additionally, though in China there is an increasing level of autonomy and a gradual shift in emphasis to a “market economy” and enterprise reform, many of the reforms, particularly some limited price reforms that result in the prices for certain commodities being principally determined by market forces, are unprecedented or experimental and may be subject to revision, change or abolition. The level of imports to and exports from China could be adversely affected by changes to these economic reforms by the Chinese government, as well as by changes in political, economic and social conditions or other relevant policies of the Chinese government.
Our operations expose us to the risk that increased trade protectionism will adversely affect our business. If the incipient global recovery is undermined by downside risks and the recent economic downturn is prolonged, governments may turn to trade barriers to protect their domestic industries against foreign imports, thereby depressing the demand for shipping. Specifically, increasing trade protectionism in the markets that our charterers serve has caused and may continue to cause an increase in: (i) the cost of goods exported from China, (ii) the length of time required to deliver goods from China and (iii) the risks associated with exporting goods from China, as well as a decrease in the quantity of goods to be shipped.
Any increased trade barriers or restrictions on trade, especially trade with China, would have an adverse impact on our charterers’ business, operating results and financial condition and could thereby affect their ability to make timely charter hire payments to us and to renew and increase the number of their time charters with us. This could have a material adverse effect on our business, results of operations and financial condition and our ability to pay dividends to our shareholders.
World events, including terrorist attacks and international hostilities could affect our results of operations and financial condition.
Terrorist attacks such as those in New York on September 11, 2001, in London on July 7, 2005, and in Mumbai on November 26, 2008, as well as the threat of future terrorist attacks around the world, continues to cause uncertainty in the world’s financial markets and may affect our business, operating results and financial condition. Continuing conflicts and recent developments in the Middle East, including Egypt and North Africa, and the presence of U.S. or other armed forces in the Middle East, may lead to additional acts of terrorism and armed conflict around the world, which may contribute to further economic instability in the global financial markets. These uncertainties could also adversely affect our ability to obtain additional financing on terms acceptable to us or at all. In the past, political conflicts have also resulted in attacks on vessels, such as the attack on the MT Limburg, a vessel unaffiliated with us, in October 2002. Mining of waterways and other efforts to disrupt international shipping, particularly in the Arabian Gulf region could also affect our business, operating results and financial condition. Acts of terrorism and piracy have also affected vessels trading in regions such as the South China Sea and the Gulf of Aden off the coast of Somalia. Any of these occurrences could have a material adverse impact on our operating results, revenues and costs.
Acts of piracy on ocean-going vessels have had and may continue to have an adverse effect on our business.
Acts of piracy have historically affected ocean-going vessels trading in regions of the world such as the South China Sea, the Indian Ocean and in the Gulf of Aden off the coast of Somalia. Although the frequency of sea piracy worldwide has decreased from 2014 to 2016, sea piracy incidents continue to occur, particularly in the Gulf of Aden and increasingly in the Gulf of Guinea and the West Coast of Africa, with dry bulk vessels and tankers particularly vulnerable to such attacks. If these piracy attacks occur in regions that are characterized as “war risk” zones, or Joint War Committee “war and strikes” listed areas, premiums payable for such coverage could increase significantly and such insurance coverage may be more difficult to obtain. In addition, crew costs and costs in relation to the employment of onboard security guards, could increase in such circumstances. Furthermore, while we believe the charterer remains liable for charter payments when a vessel is seized by pirates, the charterer may dispute this and withhold charter hire until the vessel is released. A charterer may also claim that a vessel seized by pirates was not “on-hire” for a certain number of days and is therefore entitled to cancel the charter party, a claim that we would dispute. We may not be adequately insured to cover losses from these incidents, which could have a material adverse effect on us. In addition, any detention or hijacking as a result of an act of piracy against our vessels, or an increase in cost, or unavailability, of insurance for our vessels, could have a material adverse impact on our business, financial condition and results of operations.
If our vessels call on ports located in countries or territories that are subject to sanctions imposed by the UN, the United States, the EU or other relevant authorities, or if we otherwise are found to be in violation of sanctions, there could be an adverse effect on our reputation, business position, financial condition or results of operations, or the market for our common shares
As a company operating in the United States, we are subject to U.S. economic sanctions and trade embargo laws and regulations as well as equivalent economic sanctions laws of other relevant jurisdictions in connection with our activities. The laws and regulations of these different jurisdictions vary in their application and do not all apply to the same covered persons or proscribe the same activities. In addition, the sanctions and embargo laws and regulations of each jurisdiction may be amended to increase or reduce the restrictions they impose over time, and the lists of persons and entities designated under these laws and regulations are amended frequently. For example, on October 7, 2016, President Obama issued Executive Order 13742, which effectively eliminated sanctions against Myanmar and removed sanctions designations of formerly restricted parties under the Burma sanctions program. However, the termination of U.S. sanctions on Myanmar does not affect any potential violations that occurred prior to October 7, 2016. Additionally, new sanctions programs have been enacted in recent years, including the U.S. and EU, Ukraine-/Russia-related sanctions programs as well as the comprehensive sanctions imposed by the United States with respect to the territory of Crimea.
In recent years, multilateral international sanctions targeting Iran have restricted and/or prohibited us and our charterers from engaging in Iran-related activities, including calling on ports in Iran. On January 16, 2016, the International Atomic Energy Agency verified that Iran implemented its key nuclear-related commitments described in the Joint Comprehensive Plan of Action, triggering the suspension and/or easing of certain U.S., EU, and UN nuclear-related sanctions. The United States lifted most, though not all, of its secondary sanctions on Iran, including those related to Iran’s energy, shipping, shipbuilding, and insurance sectors and provided a general authorization under OFAC’s Iranian Transactions and Sanctions Regulations for foreign entities owned or controlled by U.S. persons to engage in certain activities involving the Government of Iran and persons subject to the jurisdiction of Iran, subject to certain conditions. Nevertheless, the United States continues to prohibit persons and companies in the United States and U.S. persons, wherever located, from engaging in nearly all Iran-related activity. The EU lifted nearly all of its sanctions targeting Iran, except for targeted asset freezes and travel bans against certain Iranian individuals and entities and restrictions on activities related to weapons proliferation and human rights abuses. Accordingly, residual U.S. secondary sanctions designations and residual EU sanctions listings remain in effect against certain Iranian individuals and entities. While UN, U.S. and EU sanctions relief creates potential opportunities for businesses, risks that existed prior to January 16, 2016 continue to persist, and new risks have arisen, including in particular the divergence between U.S. and EU sanctions and evolving interpretation of the sanctions relief.
Although we intend to maintain compliance with all applicable economic sanctions and trade embargo laws and regulations, there can be no assurance that, notwithstanding our compliance safeguards, we will not be found in the future to have been in violation, particularly as the sanctions and embargo laws and regulations are amended, the scope of certain laws and regulations may be unclear, and laws and regulations are subject to strict liability and are subject to discretionary interpretations by regulators which may change over time. Any such violation could result in fines or other penalties and could severely impact our ability to access U.S. capital markets and conduct our business, and could result in some investors and/or lenders deciding, or being required, to divest their interest, or not to invest, in us or lend to us. In addition, certain institutional investors may have investment policies or restrictions that prevent them from holding securities of companies that have contracts with countries identified by the U.S. government as state sponsors of terrorism. The determination by these investors not to invest in, or to divest from, our common shares may adversely affect the price at which our common shares trade.
Although no vessels owned or operated by us have called on ports located in countries or territories subject to comprehensive country-wide or territory-wide economic sanctions and trade embargoes imposed by the U.S., UN. or EU (Crimea, North Korea, Cuba, Iran, Sudan and Syria), in the future, our vessels may call on ports in countries or territories subject to such comprehensive sanctions from time to time, whether as a result of the easing of such sanctions, on charterers’ instructions notwithstanding contractual provisions that prohibit them from doing so, or otherwise. Moreover, our charterers or other contractual counter-parties may violate applicable sanctions and embargo laws and regulations as a result of actions that do not involve us or our vessels, and those violations could in turn negatively affect our reputation. In addition, our reputation and the market for our securities may be adversely affected if we engage in certain other activities with individuals or entities designated under or in countries or territories subject to sanctions and embargo laws even if the specific activities are lawful.
Investor perception of the value of our common shares may be adversely affected by the consequences of war, the effects of terrorism, civil unrest and governmental actions in these and surrounding countries.
In November 2015, the Company filed a voluntary self-disclosure report regarding certain apparent violations of U.S. sanctions regulations in the provision of shipping services for third party charterers with respect to the transportation of cargo to or from Myanmar (formerly Burma). At the time of such apparent violations, the Company had a different senior operational management team.
Notwithstanding the fact that the apparent violations took place under a different senior operational management team and although the Company’s new board and management have implemented robust remedial measures and significantly enhanced its compliance safeguards there can be no assurance that OFAC will not conclude that these past actions warrant the imposition of civil penalties and/or referral for further investigation by the U.S. Department of Justice. The self-disclosure report was provided to OFAC for the agency’s review, consideration and determination regarding what action, if any, may be taken in resolution of this matter. The Company will continue to cooperate with the agency regarding this matter and cannot estimate when such review will be concluded. While the ultimate impact of these matters cannot be determined, there can be no assurance that the impact will not be material to the Company’s financial condition or results of operations.
If economic conditions throughout the world do not improve, it will impede our results of operations, financial condition and cash flows, and could cause the market price of our common shares to decline.
Continuing economic instability could have a material adverse effect on our ability to implement our business strategy. The United States, the EU and other parts of the world have recently been or are currently in a recession and continue to exhibit weak economic trends. The credit markets in the United States and Europe have experienced significant contraction, deleveraging and reduced liquidity, and the U.S. federal and state governments and European authorities have implemented a broad variety of governmental action and/or new regulation of the financial markets and may implement additional regulations in the future. Securities and futures markets and the credit markets are subject to comprehensive statutes, regulations and other requirements. The SEC, other regulators, self-regulatory organizations and exchanges are authorized to take extraordinary actions in the event of market emergencies, and may effect changes in law or interpretations of existing laws. Global financial markets and economic conditions have been, and continue to be, severely disrupted and volatile. Credit markets and the debt and equity capital markets have been exceedingly distressed and the uncertainty surrounding the future of the credit markets in the United States and the rest of the world has resulted in reduced access to credit worldwide.
We face risks attendant to changes in economic environments, changes in interest rates, and instability in the banking and securities markets around the world, among other factors. Major market disruptions and the current adverse changes in market conditions and regulatory climate in the United States and worldwide may adversely affect our business or impair our ability to borrow amounts under our credit facilities or any future financial arrangements. We cannot predict how long the current market conditions will last. However, these recent and developing economic and governmental factors, together with the concurrent decline in charter rates and vessel values, may have a material adverse effect on our results of operations, financial condition or cash flows, have caused the trading price of our common shares on the Nasdaq Global Select Market to decline and could cause the price of our common shares to continue to decline..
A significant number of the port calls made by our vessels involve the loading or discharging of raw materials and semi-finished products in ports in the Asia Pacific region. As a result, a negative change in economic conditions in any Asia Pacific country, and particularly in China, India or Japan, could have an adverse effect on our business, results of operations, cash flows, financial condition and ability to pay dividends. In particular, in recent years, China has been one of the world’s fastest growing economies in terms of gross domestic product. China’s gross domestic product grew by 6.7%, 6.9% and 7.4% in 2016, 2015 and 2014, respectively. We cannot assure you that the Chinese economy will not experience a significant contraction in the future. If the Chinese government does not continue to pursue a policy of economic growth and urbanization, the level of imports to and exports from China could be adversely affected by changes to these initiatives by the Chinese government, as well as by changes in political, economic and social conditions or other relevant policies of the Chinese government, such as changes in laws, regulations or export and import restrictions. Notwithstanding economic reform, the Chinese government may adopt policies that favor domestic dry bulk shipping companies and may hinder our ability to compete with them effectively. Moreover, a significant or protracted slowdown in the economies of the United States, the EU or various Asian countries may adversely affect economic growth in China and elsewhere. Our business, results of operations, cash flows, financial condition and ability to pay dividends will likely be materially and adversely affected by an economic downturn in any of these countries.
Our operating results will be subject to seasonal fluctuations, which could affect our operating results.
We operate our vessels in markets that have historically exhibited seasonal variations in demand and, as a result, in charter hire rates. This seasonality may result in volatility in our operating results to the extent that we enter into new charter agreements or renew existing agreements during a time when charter rates are weaker or we operate our vessels on the spot market or index based time charters, which may result in quarter-to-quarter volatility in our operating results. The dry bulk sector is typically stronger in the fall and winter months in anticipation of increased consumption of coal and other raw materials in the northern hemisphere. In addition, unpredictable weather patterns in these months tend to disrupt vessel scheduling and supplies of certain commodities. As a result, our revenues from our dry bulk carriers may be weaker during the fiscal quarters ended June 30 and September 30, and, conversely, our revenues from our dry bulk carriers may be stronger in fiscal quarters ended December 31 and March 31.
We are subject to international safety regulations and the failure to comply with these regulations may subject us to increased liability, may adversely affect our insurance coverage and may result in a denial of access to, or detention in, certain ports.
The operation of our vessels is affected by the requirements set forth in the ISM Code. The ISM Code requires ship owners, ship managers and bareboat charterers to develop and maintain an extensive “Safety Management System” that includes the adoption of a safety and environmental protection policy setting forth instructions and procedures for safe operation and describing procedures for dealing with emergencies. The failure of a ship owner or bareboat charterer to comply with the ISM Code may subject it to increased liability, may invalidate existing insurance or decrease available insurance coverage for the affected vessels and may result in a denial of access to, or detention in, certain ports. Each of the vessels that has been delivered to us is ISM Code-certified and we expect that each other vessel that we have agreed to purchase will be ISM Code-certified when delivered to us. However, if we are subject to increased liability for non-compliance or if our insurance coverage is adversely impacted as a result of non-compliance, it may negatively affect our ability to pay dividends, if any, in the future. If any of our vessels are denied access to, or are detained in, certain ports, our revenues may be adversely impacted.
In addition, vessel classification societies also impose significant safety and other requirements on our vessels. In complying with current and future environmental requirements, vessel-owners and operators may also incur significant additional costs in meeting new maintenance and inspection requirements, in developing contingency arrangements for potential spills and in obtaining insurance coverage. Government regulation of vessels, particularly in the areas of safety and environmental requirements, can be expected to become stricter in the future and require us to incur significant capital expenditures on our vessels to keep them in compliance.
The operation of our vessels is also affected by other government regulation in the form of international conventions, national, state and local laws and regulations in force in the jurisdictions in which the vessels operate, as well as in the country or countries of their registration. Because such conventions, laws, and regulations are often revised, we cannot predict the ultimate cost of complying with such conventions, laws and regulations or the impact thereof on the resale prices or useful lives of our vessels. Additional conventions, laws and regulations may be adopted which could limit our ability to do business or increase the cost of our doing business and which may materially adversely affect our operations. We are required by various governmental and quasi-governmental agencies to obtain certain permits, licenses, certificates, and financial assurances with respect to our operations.
Increased inspection procedures and tighter import and export controls could increase costs and disrupt our business.
International shipping is subject to various security and customs inspection and related procedures in countries of origin and destination and trans-shipment points. Inspection procedures may result in the seizure of contents of our vessels, delays in the loading, offloading, trans-shipment or delivery and the levying of customs duties, fines or other penalties against us.
It is possible that changes to inspection procedures could impose additional financial and legal obligations on us. Changes to inspection procedures could also impose additional costs and obligations on our customers and may, in certain cases, render the shipment of certain types of cargo uneconomical or impractical. Any such changes or developments may have a material adverse effect on our business, financial condition and results of operations.
Arrests of our vessels by maritime claimants could cause a significant loss of earnings for the related off-hire period.
Crew members, suppliers of goods and services to a vessel, shippers of cargo and other parties may be entitled to a maritime lien against a vessel for unsatisfied debts, claims or damages. In many jurisdictions, a maritime lienholder may enforce its lien by “arresting” or “attaching” a vessel through foreclosure proceedings. The arrest or attachment of one or more of our vessels could result in a significant loss of earnings for the related off-hire period. In addition, in jurisdictions where the “sister ship” theory of liability applies, a claimant may arrest the vessel which is subject to the claimant’s maritime lien and any “associated” vessel, which is any vessel owned or controlled by the same owner. In countries with “sister ship” liability laws, claims might be asserted against us or any of our vessels for liabilities of other vessels that we own.
Risks associated with operating ocean going vessels could affect our business and reputation, which could adversely affect our revenues and stock price.
The operation of ocean going vessels carries inherent risks. These risks include the possibility of:
|
● |
marine disasters; |
|
● |
environmental accidents; |
|
● |
cargo and property losses or damage; |
|
● |
business interruptions caused by mechanical failure, human error, war, terrorism, political action in various countries, labor strikes or adverse weather conditions; and |
|
● |
piracy. |
These hazards may result in death or injury to persons, loss of revenues or property, environmental damage, higher insurance rates, damage to our customer relationships, delay or rerouting. If our vessels suffer damage, they may need to be repaired at a drydocking facility. The costs of drydock repairs are unpredictable and may be substantial. We may not have insurance that is sufficient to cover these costs or losses and may have to pay drydocking costs not covered by our insurance. The loss of earnings while these vessels are being repaired and repositioned, as well as the actual cost of these repairs, would decrease our earnings and reduce the amount of cash that we have available for dividends. In addition, space at drydocking facilities is sometimes limited and not all drydocking facilities are conveniently located. We may be unable to find space at a suitable drydocking facility or our vessels may be forced to travel to a drydocking facility that is not conveniently located to our vessels’ positions. Any of these circumstances or events could increase our costs or lower our revenues. The involvement of our vessels in an environmental disaster may harm our reputation as a safe and reliable vessel owner and operator.
Our business has inherent operational risks, which may not be adequately covered by insurance.
The operation of our company has certain unique risks. With a dry bulk carrier, the cargo itself and its interaction with the vessel can be an operational risk. By their nature, dry bulk cargoes are often heavy, dense, easily shifted, and react badly to water exposure. In addition, dry bulk carriers are often subjected to battering treatment during unloading operations with grabs, jackhammers (to pry encrusted cargoes out of the hold) and small bulldozers. This treatment may cause damage to the vessel. Vessels damaged due to treatment during unloading procedures may be more susceptible to breach to the sea. Hull breaches in dry bulk carriers may lead to the flooding of the vessels’ holds. If a dry bulk carrier suffers flooding in its forward holds, the bulk cargo may become so dense and waterlogged that its pressure may buckle the vessel’s bulkheads leading to the loss of a vessel. If we are unable to adequately maintain our vessels we may be unable to prevent these events. Any of these circumstances or events could negatively impact our business, financial condition, results of operations and ability to pay dividends, if any, in the future. In addition, the loss of any of our vessels could harm our reputation as a safe and reliable vessel owner and operator.
Our vessels and their cargoes are at risk of being damaged or lost because of events such as marine disasters, bad weather, mechanical failures, human error, environmental accidents, war, terrorism, piracy and other circumstances or events. In addition, transporting cargoes across a wide variety of international jurisdictions creates a risk of business interruptions due to political circumstances in foreign countries, hostilities, labor strikes and boycotts, the potential for changes in tax rates or policies, and the potential for government expropriation of our vessels. Any of these events may result in loss of revenues, increased costs and decreased cash flows to our customers, which could impair their ability to make payments to us under our charters.
In the event of a casualty to a vessel or other catastrophic event, we will rely on our insurance to pay the insured value of the vessel or the damages incurred. Through our management agreements with our technical managers, we procure insurance for the vessels in our fleet employed under time charters against those risks that we believe the shipping industry commonly insures against. These insurances include marine hull and machinery insurance, protection and indemnity insurance, which include pollution risks and crew insurances, and war risk insurance. Currently, the amount of coverage for liability for pollution, spillage and leakage available to us on commercially reasonable terms through protection and indemnity associations and providers of excess coverage is $1 billion per vessel per occurrence.
We have procured hull and machinery insurance, protection and indemnity insurance, which include environmental damage and pollution insurance coverage and war risk insurance for our fleet. We do not maintain, for our vessels, insurance against loss of hire, which covers business interruptions that result from the loss of use of a vessel. We may not be adequately insured against all risks. We may not be able to obtain adequate insurance coverage for our fleet in the future, and we may not be able to obtain certain insurance coverage, including insurance against charter party defaults, that we have obtained in the past on terms that are acceptable to us or at all. The insurers may not pay particular claims. Our insurance policies may contain deductibles for which we will be responsible and limitations and exclusions which may increase our costs or lower our revenue. Moreover, insurers may default on claims they are required to pay.
We cannot assure you that we will be adequately insured against all risks or that we will be able to obtain adequate insurance coverage at reasonable rates for our vessels in the future. For example, in the past more stringent environmental regulations have led to increased costs for, and in the future may result in the lack of availability of, insurance against risks of environmental damage or pollution. Additionally, our insurers may refuse to pay particular claims. Any significant loss or liability for which we are not insured could have a material adverse effect on our financial condition.
Governments could requisition our vessels during a period of war or emergency, resulting in a loss of earnings.
A government could requisition one or more of our vessels for title or for hire. Requisition for title occurs when a government takes control of a vessel and becomes her owner, while requisition for hire occurs when a government takes control of a vessel and effectively becomes her charterer at dictated charter rates. Generally, requisitions occur during periods of war or emergency, although governments may elect to requisition vessels in other circumstances. Although we would be entitled to compensation in the event of a requisition of one or more of our vessels, the amount and timing of payment would be uncertain. Government requisition of one or more of our vessels may negatively impact our revenues.
Failure to comply with the U.S. Foreign Corrupt Practices Act could result in fines, criminal penalties, and an adverse effect on our business.
We may operate in a number of countries throughout the world, including countries known to have a reputation for corruption. We are committed to doing business in accordance with applicable anti-corruption laws and have adopted a code of business conduct and ethics which is consistent and in full compliance with the FCPA. We are subject, however, to the risk that we, our affiliated entities or our or their respective officers, directors, employees and agents may take actions determined to be in violation of such anti-corruption laws, including the FCPA. Any such violation could result in substantial fines, sanctions, civil and/or criminal penalties, curtailment of operations in certain jurisdictions, and might adversely affect our business, results of operations or financial condition. In addition, actual or alleged violations could damage our reputation and ability to do business. Furthermore, detecting, investigating, and resolving actual or alleged violations is expensive and can consume significant time and attention of our senior management.
Company Specific Risk Factors
We have significantly increased our indebtedness, and if we default under our loan agreements, our lenders may act to accelerate our outstanding indebtedness under our credit facilities, which would impact our ability to continue to conduct our business.
At December 31, 2016, our outstanding debt consists of a First Lien Facility comprised of a first lien term loan of $184 million and a first lien revolving loan of $25 million and a Second Lien term loan of $67 million. Our first lien debt matures on October 15, 2019 and our second lien debt matures on January 19, 2020. Amounts drawn under the First Lien Facility bear interest at an annual rate of LIBOR plus the margin. The revolving credit facility under the First Lien Facility is subject to an annual commitment fee of 40% of the margin on the undrawn portion of the facility. The Second Lien Facility carries an interest rate of LIBOR plus 14.00% per annum (with a 1.0% LIBOR floor).
On March 30, 2016, Eagle Shipping entered into the A&R First Lien Loan Agreement (as defined herein), which amended and restated our Exit Financing Facility, and the Second Lien Loan Agreement (as defined herein), and after giving effect to the entry into these agreements, our outstanding debt consisted of a term loan under the A&R First Lien Loan Agreement in the amount of approximately $201.5 million outstanding, a revolving loan under the A&R First Loan Agreement in the amount of approximately $9.8 million outstanding, and a term loan under the Second Lien Loan Agreement in the amount of $60 million outstanding. As described under “Note 2. Corporate Reorganization” to the consolidated financial statements, the obligations under these agreements are secured by collateral, contain a number of operating restrictions, covenants and events of default, and a breach of any of the covenants could result in an event of default under one or more of these agreements, including as a result of cross default provisions, and subject to the terms of the intercreditor agreement and the loan agreements, the agents could proceed against the collateral granted to them to secure that indebtedness.
The failure of our charterers to meet their obligations under our time charter agreements, on which we depend for substantially all of our revenues, could cause us to suffer losses or otherwise adversely affect our business and ability to comply with covenants in our credit facilities.
The ability and willingness of each of our counterparties to perform its obligations under a time charter agreement with us will depend on a number of factors that are beyond our control and may include, among other things, general economic conditions, the condition of the dry bulk shipping industry and the overall financial condition of the counterparties. Charterers are sensitive to the commodity markets and may be impacted by market forces affecting commodities, such as iron ore, coal, grain, and other minor bulks. In addition, in depressed market conditions, there have been reports of charterers, including some of our charter counterparties, defaulting on their obligations under charters, and our customers may fail to pay charter hire.
Consistent with dry bulk shipping industry practice, we have not independently analyzed the creditworthiness of the charterers. In addition, given the depressed market conditions, our charterers may no longer need a vessel that is currently under charter or may be able to obtain a comparable vessel at lower rates. As a result, charterers may seek to renegotiate the terms of their existing charter parties or avoid their obligations under those contracts.
Should a counterparty fail to honor its obligations under its charter with us, it may be difficult to secure substitute employment for such vessel, and any new charter arrangements we secure in the spot market or on time charters would be at lower rates given currently decreased dry bulk carrier charter rate levels. If our charterers fail to meet their obligations to us or attempt to renegotiate our charter agreements, we could sustain significant losses which could have a material adverse effect on our business, financial condition, results of operations and cash flows, if any, in the future, and compliance with covenants in our credit facilities, certain of which specifically require the maintenance of minimum charter rate levels.
We are dependent on spot charters and any decrease in spot charter rates in the future may adversely affect our earnings, our ability to pay dividends or meet our financial covenants on our indebtedness.
We currently own a fleet of 41 vessels, of which all are employed for less than one year as of December 31, 2016, exposing us to fluctuations in spot market charter rates. Historically, the dry bulk market has been volatile as a result of the many conditions and factors that can affect the price, supply and demand for dry bulk capacity. The continuing global economic crisis may further reduce demand for transportation of dry bulk cargoes over longer distances and supply of dry bulk vessels to carry such dry bulk cargoes, which may materially affect our revenues, profitability and cash flows. The spot charter market may fluctuate significantly based upon supply of and demand for vessels and cargoes. The successful operation of our vessels in the competitive spot charter market depends upon, among other things, obtaining profitable spot charters and minimizing, to the extent possible, time spent waiting for charters and time spent traveling unladen to pick up cargo. The spot market is very volatile, and, in the past, there have been periods when spot rates have declined below the operating cost of vessels. If future spot charter rates decline, then we may be unable to operate our vessels trading in the spot market profitably, meet our obligations, including payments on indebtedness, or to pay dividends, if any, in the future. Furthermore, as charter rates for spot charters are fixed for a single voyage, which may last up to several weeks, during periods in which spot charter rates are rising, we will generally experience delays in realizing the benefits from such increases.
Our ability to renew the charters on all of our 41 owned vessels, and the charter rates payable under any such replacement charters, will depend upon, among other things, economic conditions in the sectors in which our vessels operate at that time, changes in the supply of and demand for vessel capacity and changes in the supply of and demand for the seaborne transportation of energy resources.
The laws of the Marshall Islands generally prohibit the payment of dividends other than from surplus (retained earnings and the excess of consideration received for the sale of shares above the par value of the shares) or while a company is insolvent or would be rendered insolvent by the payment of such a dividend. We may not have sufficient surplus in the future to pay dividends and our subsidiaries may not have sufficient funds or surplus to make distributions to us. We can give no assurance that dividends will be paid at all.
In addition, the declaration and payment of dividends, if any, will always be subject to the discretion of the board of directors, restrictions contained in the First Lien Facility, the Second Lien Facility, and the requirements of Marshall Islands law. The timing and amount of any dividends declared will depend on, among other things, the Company's earnings, financial condition and cash requirements and availability, the ability to obtain debt and equity financing on acceptable terms as contemplated by the Company's growth strategy, the terms of its outstanding indebtedness and the ability of the Company's subsidiaries to distribute funds to it. The Company does not currently expect to pay dividends in the near term. Please see "Item 7. Management's Discussion and Analysis of Financial Condition and Results of Operations—Dividends."
We may have difficulty managing our planned growth properly and integrating our newly acquired vessels.
The acquisition and management of the 41 vessels in our operating fleet have imposed, and additional dry bulk vessels that we may acquire in the future will impose, significant responsibilities on our management and staff. The addition of vessels to our fleet may require us to increase the number of our personnel. Further, we are providing technical management services to all of our vessels in our fleet. We will also have to manage our customer base so that we can provide continued employment for our vessels upon the expiration of our existing time charters.
We intend to continue to grow our business. Our future growth will primarily depend on:
|
● |
locating and acquiring suitable vessels; |
|
● |
obtaining required financing on acceptable terms; |
|
● |
identifying and consummating acquisitions or joint ventures; |
|
● |
enhancing our customer base; and |
|
● |
managing our expansion. |
Growing any business by acquisition presents numerous risks, such as undisclosed liabilities and obligations, the possibility that indemnification agreements will be unenforceable or insufficient to cover potential losses and difficulties associated with imposing common standards, controls, procedures and policies, obtaining additional qualified personnel, managing relationships with customers and integrating newly acquired assets and operations into existing infrastructure. We cannot give any assurance that we will be successful in executing our growth plans or that we will not incur significant expenses and losses in connection with our future growth.
Purchasing and operating secondhand vessels may result in increased operating costs and reduced fleet utilization.
While we have the right to inspect previously owned vessels prior to purchase, such an inspection does not provide us with the same knowledge about their condition that we would have if these vessels had been built for and operated exclusively by us. A secondhand vessel may have conditions or defects that we were not aware of when we bought the vessel and which may require us to incur costly repairs to the vessel. These repairs may require us to put a vessel into dry dock, which would reduce our fleet utilization. Furthermore, we usually do not receive the benefit of warranties on secondhand vessels.
We are subject to certain risks with respect to our counterparties on contracts, and failure of such counterparties to meet their obligations could cause us to suffer losses or otherwise adversely affect our business.
We have entered into and may enter into in the future, among other things, charter agreements with our customers, credit facilities with banks and interest rate swap agreements. Such agreements subject us to counterparty risks. The ability of each of our counterparties to perform its obligations under a contract with us will depend on a number of factors that are beyond our control and may include, among other things, general economic conditions, the condition of the maritime industry, the overall financial condition of the counterparty, charter rates received for specific types of vessels, the supply and demand for commodities such as iron ore, coal, grain, and other minor bulks and various expenses. Should a counter party fail to honor its obligations under agreements with us, we could sustain significant losses which could have a material adverse effect on our business, financial condition, results of operations and cash flows.
We depend upon a few significant customers for a large part of our revenues and the loss of one or more of these customers could adversely affect our financial performance.
We derive a significant part of our revenues from a small number of charterers. In 2016, we did not have any customers who accounted for greater than 10% of our revenue. However, in 2015, the Navig8 Pool accounted for approximately 17.2% of our revenue. Some of our charterers are privately owned companies for which limited credit and financial information was available to us in making our assessment of counterparty risk when we entered into our charter. In addition, the ability of each of our charterers to perform its obligations under a charter will depend on a number of factors that are beyond our control. These factors may include general economic conditions, the condition of the dry bulk shipping industry, the charter rates received for specific types of vessels and various operating expenses. If one or more of these charterers terminates its charter or chooses not to re-charter our vessel or is unable to perform under its charter with us and we are not able to find a replacement charter, we could suffer a loss of revenues that could adversely affect our financial condition, results of operations and cash available for distribution as dividends to our shareholders. In addition, we may be required to change the flagging or registration of the related vessel and may incur additional costs, including maintenance and crew costs if a charterer were to default on its obligations. Our shareholders do not have any recourse against our charterers.
In the highly competitive international shipping industry, we may not be able to compete for charters with new entrants or established companies with greater resources, and as a result, we may be unable to employ our vessels profitably.
Our vessels are employed in a highly competitive market that is capital intensive and highly fragmented. Competition arises primarily from other vessel owners, some of whom have substantially greater resources than we do. Competition for the transportation of dry bulk cargo by sea is intense and depends on price, location, size, age, condition and the acceptability of the vessel and its operators to the charterers. Due in part to the highly fragmented market, competitors with greater resources could enter the dry bulk shipping industry and operate larger fleets through consolidations or acquisitions and may be able to offer lower charter rates and higher quality vessels than we are able to offer. If we are unable to successfully compete with other dry bulk shipping companies, our results of operations would be adversely impacted.
We may be unable to attract and retain key management personnel and other employees in the shipping industry, which may negatively impact the effectiveness of our management and results of operations.
Our success depends to a significant extent upon the abilities and efforts of our management team. Our success will depend upon our ability to retain key members of our management team and to hire new members as may be necessary. The loss of any of these individuals could adversely affect our business prospects and financial condition. Difficulty in hiring and retaining replacement personnel could have a similar effect. We do not maintain "key man" life insurance on any of our officers.
The aging of our fleet may result in increased operating costs in the future, which could adversely affect our earnings.
In general, the cost of maintaining a vessel in good operating condition increases with the age of the vessel. Although the weighted average age of the 41 dry bulk vessels in our operating fleet as of December 31, 2016 was approximately 8.7 years, as our fleet ages, we will incur increased costs. Older vessels are typically less fuel efficient and more costly to maintain than more recently constructed vessels due to improvements in engine technology. Cargo insurance rates increase with the age of a vessel, making older vessels less desirable to charterers. Governmental regulations and safety or other equipment standards related to the age of vessels may also require expenditures for alterations or the addition of new equipment, to our vessels and may restrict the type of activities in which our vessels may engage. We cannot assure you that, as our vessels age, market conditions will justify those expenditures or enable us to operate our vessels profitably during the remainder of their useful lives.
Technological innovation could reduce our charter hire income and the value of our vessels.
The charter hire rates and the value and operational life of a vessel are determined by a number of factors including the vessel's efficiency, operational flexibility and physical life. Efficiency includes speed, fuel economy and the ability to load and discharge cargo quickly. Flexibility includes the ability to enter harbors, utilize related docking facilities and pass through canals and straits. The length of a vessel's physical life is related to its original design and construction, its maintenance and the impact of the stress of operations. If new dry bulk carriers are built that are more efficient or more flexible or have longer physical lives than our vessels, competition from these more technologically advanced vessels could adversely affect the amount of charter hire payments we receive for our vessels once their initial charters expire and the resale value of our vessels could significantly decrease. As a result, our business, results of operations, cash flows and financial condition could be adversely affected.
We may be subject to litigation that, if not resolved in our favor and not sufficiently insured against, could have a material adverse effect on us.
We may be, from time to time, involved in various litigation matters. These matters may include, among other things, contract disputes, personal injury claims, environmental claims or proceedings, asbestos and other toxic tort claims, employment matters, governmental claims for taxes or duties, and other litigation that arises in the ordinary course of our business. Although we intend to defend these matters vigorously, we cannot predict with certainty the outcome or effect of any claim or other litigation matter, and the ultimate outcome of any litigation or the potential costs to resolve them may have a material adverse effect on us. Insurance may not be applicable or sufficient in all cases and/or insurers may not remain solvent which may have a material adverse effect on our financial condition.
We will have to pay tax on United States source income, which will reduce our earnings.
Under the United States Internal Revenue Code of 1986, as amended, or the Code, 50% of the gross shipping income of a vessel owning or chartering corporation, such as ourselves and our subsidiaries, that is attributable to transportation that begins or ends, but that does not both begin and end, in the United States is characterized as United States source shipping income and such income is subject to a 4% United States federal income tax without allowance for any deductions, unless that corporation qualifies for exemption from tax under Section 883 of the Code and the Treasury regulations promulgated thereunder.
We believe that we did not qualify for this statutory tax exemption for our 2016 taxable year. Since we are not entitled to this exemption under Section 883 for the 2016 taxable year, we were subject to a 4% United States federal income tax on our gross United States source shipping income without allowance for deductions.
Our United States federal income tax liability was approximately $648,570 for the tax year ended December 31, 2016. It should be noted that with respect to any future taxable year, we can give no assurance that the operation of our vessels, which are under the control of third party charterers, will not change such that our United States federal income tax liability would be substantially higher. However, since no more that 50% of our shipping income would be treated as derived from U.S. sources, our maximum tax liability under the 4% tax regime would never exceed 2% of our shipping income.
If we were to realize gains on the sales of our vessels, then any such gain (less applicable deductions) would be subject to United States federal income tax, currently imposed at rates of up to 35%. In addition, we may be subject to the 30% ''branch profits'' tax on such gain, as determined after allowance for certain adjustments
United States tax authorities could treat us as a "passive foreign investment company," which could have adverse United States federal income tax consequences to United States holders.
A foreign corporation will be treated as a "passive foreign investment company," or PFIC, for United States federal income tax purposes if either (1) at least 75% of its gross income for any taxable year consists of certain types of "passive income" or (2) at least 50% of the average value of the corporation's assets produce or are held for the production of those types of "passive income." For purposes of these tests, "passive income" includes dividends, interest, and gains from the sale or exchange of investment property and rents and royalties other than rents and royalties which are received from unrelated parties in connection with the active conduct of a trade or business. For purposes of these tests, income derived from the performance of services does not constitute "passive income." United States shareholders of a PFIC are subject to a disadvantageous United States federal income tax regime with respect to the income derived by the PFIC, the distributions they receive from the PFIC and the gain, if any, they derive from the sale or other disposition of their shares in the PFIC.
Based on our current method of operation, we do not believe that we have been, are or will be a PFIC with respect to any taxable year. In this regard, we intend to treat the gross income we derive or are deemed to derive from our time and voyage chartering activities as services income, rather than rental income. Accordingly, we believe that our income from our time and voyage chartering activities does not constitute "passive income," and the assets that we own and operate in connection with the production of that income do not constitute passive assets.
There is, however, no direct legal authority under the PFIC rules addressing our method of operation and there is authority which characterizes time charter income as rental income rather than services income for other tax purposes. Accordingly, no assurance can be given that the IRS or a court of law will accept our position, and there is a risk that the IRS or a court of law could determine that we are a PFIC. Moreover, no assurance can be given that we would not constitute a PFIC for any future taxable year if there were to be changes in the nature and extent of our operations.
If the IRS were to find that we are or have been a PFIC for any taxable year, our United States shareholders may face adverse United States tax consequences and information reporting obligations. Under the PFIC rules, unless those shareholders made an election available under the Code (which election could itself have adverse consequences for such shareholders), such shareholders would be liable to pay United States federal income tax upon excess distributions and upon any gain from the disposition of our common stock at the then prevailing income tax rates applicable to ordinary income plus interest as if the excess distribution or gain had been recognized ratably over the shareholder’s holding period of our common stock.
We may be subject to additional taxes, including as a result of challenges by tax authorities or changes in applicable law, which could adversely impact our business and financial results.
We are subject to tax in certain jurisdictions in which we are organized, own assets or have operations. In computing our tax obligations in these jurisdictions, we are required to take various tax accounting and reporting positions on matters that are not entirely free from doubt and for which we have not received rulings from the governing authorities. We cannot assure you that, upon review of these positions, the applicable authorities will agree with our positions. A successful challenge by a tax authority, or a change in applicable law, could result in additional tax imposed on us, which could adversely impact our business and financial results.
We are a holding company, and we depend on the ability of our subsidiaries to distribute funds to us in order to satisfy our financial obligations and to make dividend payments.
We are a holding company and our subsidiaries conduct all of our operations and own all of our operating assets. We have no significant assets other than the equity interests in our subsidiaries. As a result, our ability to satisfy our financial obligations and to make dividend payments in the future depends on our subsidiaries and their ability to distribute funds to us. If we are unable to obtain funds from our subsidiaries, our board of directors may exercise its discretion not to declare or pay dividends. We do not intend to obtain funds from other sources to pay dividends. We do not currently expect to pay dividends in the near term.
As we expand our business, we may need to improve our operating and financial systems and will need to recruit suitable employees and crew for our vessels.
Our current operating and financial systems may not be adequate if we continue to expand the size of our fleet in the future, as we recently did in the second half of 2016 and in connection with the Greenship Agreement and our attempts to improve those systems may be ineffective. In addition, if we further expand our fleet, we will need to recruit suitable additional seafarers and shore side administrative and management personnel. We cannot guarantee that we will be able to hire suitable employees as we expand our fleet. If we or our crewing agent encounters business or financial difficulties, we may not be able to adequately staff our vessels. If we are unable to grow our financial and operating systems or to recruit suitable employees as we expand our fleet, our financial performance may be adversely affected and, among other things, the amount of cash available for distribution as dividends to our shareholders may be reduced.
Investment in derivative instruments, such as forward freight and swap agreements, could result in losses.
From time to time, we may take positions in derivative instruments, including FFAs. FFAs and other derivative instruments may be used to hedge a vessel owner's exposure to the charter market by providing for the sale of a contracted charter rate along a specified route and period of time. Upon settlement, if the contracted charter rate is less than the average of the rates, as reported by an identified index, for the specified route and period, the seller of the FFA is required to pay the buyer an amount equal to the difference between the contracted rate and the settlement rate, multiplied by the number of days in the specified period. Conversely, if the contracted rate is greater than the settlement rate, the buyer is required to pay the seller the settlement sum. If we take positions in FFAs or other derivative instruments and do not correctly anticipate charter rate movements over the specified route and time period, we could suffer losses in the settling or termination of the FFA. This could adversely affect our results of operations and cash flows. During 2016, we incurred a loss of $561,495 on FFAs which was recorded in other expense in the consolidated statement of operations for the year ended December 31, 2016.
In addition, we may enter into interest rate swaps to effectively convert a portion of our debt from a floating to a fixed-rate basis. Under these swap contracts, exclusive of applicable margins, we pay fixed rate interest and receive floating-rate interest amounts based on three-month LIBOR settings. Our hedging strategies, however, may not be effective and we may incur substantial losses if interest rates move materially differently from our expectations. In addition, our financial condition could be materially adversely affected to the extent we do not hedge our exposure to interest rate fluctuations under our financing arrangements. Any hedging activities we engage in may not effectively manage our interest rate exposure or have the desired impact on our financial conditions or results of operations. At December 31, 2016, we had not entered into interest rate swaps.
If the increase in LIBOR continues, it could affect our profitability, earnings and cash flow.
If the spread between LIBOR and the prime lending rate widening it would affect the amount of interest payable on our debt, which in turn, could have an adverse effect on our profitability, earnings and cash flow.
Furthermore, interest in most loan agreements in our industry has been based on published LIBOR rates. Recently, however, lenders have insisted on provisions that entitle the lenders, in their discretion, to replace published LIBOR as the base for the interest calculation with their cost-of-funds rate. If we are required to agree to such a provision in future loan agreements, our lending costs could increase.
As a result of the adoption of fresh-start reporting, our consolidated balance sheets and consolidated statements of operations subsequent to October 15, 2014 are not comparable in many respects to our consolidated balance sheets and consolidated statements of operations prior to October 15, 2014.
Following the consummation of the Plan (as defined herein), our financial condition and results of operations from and after October 15, 2014 (the “Effective Date”) are not comparable to the financial condition or results of operations reflected in our historical financial statements prior to the Effective Date due to the application of fresh-start reporting. Fresh-start reporting requires us to adjust our assets and liabilities to their estimated fair values using the acquisition method. Adjustments to the carrying amounts were material and will affect prospective results of operations as balance sheet items are settled, depreciated, amortized or impaired. As a result, this makes it difficult to assess our performance in relation to prior periods.
We conduct business in China, where the legal system is not fully developed and has inherent uncertainties that could limit the legal protections available to us.
Some of our vessels may be chartered to Chinese customers or from time to time on our charterers’ instructions, our vessels may call on Chinese ports. Such charters and any additional charters that we enter into may be subject to new regulations in China that may require us to incur new or additional compliance or other administrative costs and may require that we pay to the Chinese government new taxes or other fees. Changes in laws and regulations, including with regards to tax matters, and their implementation by local authorities could affect our vessels chartered to Chinese customers as well as our vessels calling to Chinese ports and could have a material adverse impact on our business, financial condition and results of operations.
Risks Relating to Our Common Stock
We are incorporated in the Marshall Islands, which does not have a well-developed body of corporate law.
Our corporate affairs are governed by our Third Amended and Restated Articles of Incorporation (the “Charter”) and Second Amended and Restated By-laws (the “Bylaws”) and by the Marshall Islands Business Corporations Act (the “BCA”). The provisions of the BCA resemble provisions of the corporation laws of a number of states in the United States. However, there have been few judicial cases in the Marshall Islands interpreting the BCA. The rights and fiduciary responsibilities of directors under the laws of the Marshall Islands are not as clearly established as the rights and fiduciary responsibilities of directors under statutes or judicial precedent in existence in the United States. The rights of shareholders of companies incorporated in the Marshall Islands may differ from the rights of shareholders of companies incorporated in the United States. While the BCA provides that it is to be interpreted according to the laws of the State of Delaware and other states with substantially similar legislative provisions, there have been few, if any, court cases interpreting the BCA in the Marshall Islands and we cannot predict whether Marshall Islands courts would reach the same conclusions as United States courts. Thus, you may have more difficulty in protecting your interests in the face of actions by the management, directors or controlling shareholders than would shareholders of a corporation incorporated in a United States jurisdiction which has developed a relatively more substantial body of case law.
The market price of our common shares has fluctuated widely and may continue to fluctuate in the future.
The market price of our common shares has fluctuated widely since we became a public company in June 2005 and may continue to do so as a result of many factors, including our actual results of operations and perceived prospects, the prospects of our competition and of the shipping industry in general and in particular the dry bulk sector, differences between our actual financial and operating results and those expected by investors and analysts, changes in analysts’ recommendations or projections, changes in general valuations for companies in the shipping industry, particularly the dry bulk sector, changes in general economic or market conditions and broad market fluctuations.
The public market for our common shares may not be active and liquid enough for you to resell our common shares in the future.
We maintained our NASDAQ listing throughout our Chapter 11 proceeding. Since 2008, the stock market has experienced extreme price and volume fluctuations. If the volatility in the market continues or worsens, it could continue to have an adverse effect on the market price of our common shares and could impact a potential sale price if holders of our common stock decide to sell their shares.
The seaborne transportation industry has been highly unpredictable and volatile. The market for common shares in this industry may be equally volatile. The market price of our common shares may be influenced by many factors, many of which are beyond our control, including:
|
● |
actual or anticipated fluctuations in our quarterly and annual results and those of other public companies in our industry; |
|
● |
announcements by us or our competitors of significant contracts, acquisitions or capital commitments; |
|
● |
mergers and strategic alliances in the shipping industry; |
|
● |
terrorist acts; |
|
● |
future sales of our common shares or other securities; |
|
● |
market conditions in the shipping industry; |
|
● |
economic and regulatory trends; |
|
● |
shortfalls in our operating results from levels forecast by securities analysts; |
|
● |
announcements concerning us or our competitors; |
|
● |
the general state of the securities market; and |
|
● |
investors’ perception of us and the dry bulk shipping industry. |
As a result of these and other factors, investors in our common stock may not be able to resell their shares at or above the price they paid for such shares. These broad market and industry factors may materially reduce the market price of our common shares, regardless of our operating performance.
Certain shareholders own large portions of our outstanding common stock, which may limit your ability to influence our actions.
Certain shareholders currently hold significant percentages of our common stock. As of December 31, 2016, funds and/or managed accounts affiliated with Oaktree Capital Management LP owned approximately 32%, funds and/or managed accounts affiliated with GoldenTree Asset Management LP owned approximately 18% of our common stock.
To the extent a significant percentage of the ownership of our common stock is concentrated in a small number of holders, such holders will be able to influence the outcome of any shareholder vote, including the election of directors, the adoption or amendment of provisions in our articles of incorporation or by-laws and possible mergers, corporate control contests and other significant corporate transactions. This concentration of ownership may have the effect of delaying, deferring or preventing a change in control, merger, consolidation, takeover or other business combination involving us. This concentration of ownership could also discourage a potential acquirer from making a tender offer or otherwise attempting to obtain control of us, which could in turn have an adverse effect on the market price of our common stock.
Future sales of our common stock could cause the market price of our common stock to decline and could dilute our shareholders’ interests in the Company.
Sales of a substantial number of shares of our common stock in the public market, or the perception that these sales could occur, may depress the market price for our common stock. These sales could also impair our ability to raise additional capital through the sale of our equity securities in the future. Our Charter authorizes us to issue 700,000,000 shares of common stock, of which 48,106,827 and 74,103,956, shares excluding restricted shares, were issued and outstanding as of December 31, 2016 and March 28, 2017, respectively. As we did in 2016 and the first quarter of 2017, we intend to issue additional shares of our common stock in the future. Our shareholders may incur dilution from any future equity offering and upon the issuance of additional shares of our common stock upon the exercise of options we have granted to certain of our executive officers or upon the issuance of additional shares of common stock pursuant to our equity incentive plan. In addition, we have a registration rights agreement in favor of certain of our shareholders. Sales of our common stock by one or more of those holders could lower the trading price of our shares.
Our shareholders are limited in their ability to elect or remove directors.
The Charter prohibits cumulative voting in the election of directors. The Bylaws require parties other than the board of directors to give advance written notice of nominations for the election of directors. The Charter also provides that directors may only be removed for cause upon the affirmative vote of a majority of the outstanding shares of capital stock entitled to vote for the election of directors. Newly created directorships resulting from an increase in the number of directors and vacancies occurring in the board of directors for any reason may only be filled by a majority of the directors then in office, even if less than a quorum exists.
Our shareholders may take action only at Annual or Special Meetings.
The Charter and the Bylaws provide that any action required or permitted to be taken by shareholders must be effected at a duly called annual or special meeting of shareholders. Except as otherwise mandated by law, shareholders may not act by written consent.
Under the Bylaws, annual shareholder meetings will be held at a time and place selected by the board of directors. The meetings may be held in or outside of the Marshall Islands. These provisions may impede shareholders’ ability to take actions with respect to the Company that they deem appropriate or advisable.
The Charter and the Bylaws provide that, except as otherwise required by law, special meetings of shareholders may be called at any time only by (i) the lead director (if any), (ii) the chairman of the board of directors, (iii) the board of directors pursuant to a resolution duly adopted by a majority of the board stating the purpose or purposes thereof, or (iv) any one or more shareholders who beneficially owns, in the aggregate, 15% or more of the aggregate voting power of all then-outstanding shares of Voting Stock. The notice of any such special meeting is to include the purpose or purposes thereof, and the business transacted at the special meeting is limited to the purpose or purposes stated in the notice (or any supplement thereto). These provisions may impede the ability of shareholders to bring matters before a special meeting of shareholders.
The board of directors may set a record date between 15 and 60 days before the date of any meeting to determine the shareholders that will be eligible to receive notice and vote at the meeting.
Our shareholders are subject to advance notice requirements for shareholder proposals and director nominations
The Bylaws provide that shareholders seeking to nominate candidates for election as directors or to bring business before an annual meeting of shareholders must provide timely notice of their proposal in writing to the corporate secretary. To be timely, a shareholder's notice will have to be received at the Company’s principal executive offices not less than 60 days nor more than 90 days prior to the anniversary date of the immediately preceding annual meeting of shareholders; provided, however, that in the event that the annual meeting is called for a date that is not within 30 days before or after such anniversary date, notice by the shareholder must be received not later than the close of business on the tenth day following the day on which such notice of the date of the annual meeting was mailed or public disclosure of the date of the annual meeting was made, whichever occurs first, in order for such notice by a shareholder to be timely. The Bylaws also specify requirements as to the form and content of a shareholder's notice. These advance notice requirements, particularly the 60 to 90 day requirement, may impede shareholders' ability to bring matters before an annual meeting of shareholders or make nominations for directors at an annual meeting of shareholders.
Certain super majority provisions in our organizational documents may discourage, delay or prevent changes to such documents.
The Charter provides that a two-thirds vote is required to amend or repeal certain provisions of the Charter and Bylaws, including those provisions relating to: the number and election of directors; filling of board vacancies; resignations and removals of directors; director liability and indemnification of directors; the power of shareholders to call special meetings; advance notice of director nominations and shareholders proposals; and amendments to the Charter and Bylaws. These supermajority provisions may discourage, delay or prevent changes to the Charter or Bylaws.
ITEM 1B. UNRESOLVED STAFF COMMENTS
None.
ITEM 2. PROPERTIES
We do not own any real property. We lease office space at 300 First Stamford Place, Stamford CT 06902. In addition, we lease offices in Singapore and Hamburg, Germany. Our interests in our dry bulk vessels are our only material properties. See “Item 1. Business—Our Fleet.”
ITEM 3. LEGAL PROCEEDINGS
See Note 11, “Commitments and Contingencies” to the Company’s consolidated financial statements set forth in Item 8, “Financial Statements and Supplementary Data” of this Form 10-K, for information regarding legal proceedings in which we are involved.
ITEM 4. MINE SAFETY DISCLOSURE
Not applicable.
PART II
ITEM 5. MARKET FOR REGISTRANT'S COMMON EQUITY, RELATED STOCKHOLDER MATTERS AND ISSUER PURCHASES OF EQUITY SECURITIES
Common Stock
The trading market for shares of our common stock is the Nasdaq Global Select Market, on which our shares are quoted under the symbol "EGLE.” The following table summarizes the quarter high and low sales prices per share of our common stock as reported on the Nasdaq Global Select Market for the two most recent fiscal years.
|
For the period: |
High* |
Low* |
||||||
|
January 1, 2015 to March 31, 2015* |
$ | 288.40 | $ | 147.80 | ||||
|
April 1, 2015 to June 30, 2015* |
$ | 211.40 | $ | 133.80 | ||||
|
July 1, 2015 to September 30, 2015* |
$ | 179.20 | $ | 117.40 | ||||
|
October 1, 2015 to December 31, 2015* |
$ | 123.40 | $ | 53.20 | ||||
|
January 1, 2016 to March 31, 2016* |
$ | 65.00 | $ | 7.20 | ||||
|
April 1, 2016 to June 30, 2016* |
$ | 18.20 | $ | 6.40 | ||||
|
July 1, 2016 to September 30, 2016* |
$ | 10.40 | $ | 5.49 | ||||
|
October 1, 2016 to December 31, 2016* |
$ | 9.18 | $ | 4.12 | ||||
|
*Adjusted for stock split on August 5, 2016. |
On March 28, 2017, the closing sale price of our common stock, as reported on the Nasdaq Global Select Market, was $5.78 per share.
Holders. The number of shareholders of record of our common stock was approximately 99 on March 28, 2017, which does not include beneficial owners whose shares are held by a clearing agency, such as a broker or a bank.
Reverse Stock Split Authorization
On August 2, 2016, the Company held a Special Meeting of Shareholders where the shareholders approved, among other things, to increase the number of authorized shares of the Company’s common stock, from 150,000,000 to 700,000,000 and establish the number of authorized shares of preferred stock, par value US$0.01 per share, at 25,000,000 shares.
On August 5, 2016, the Company effected a 1 – for – 20 reverse stock split of its issued and outstanding shares of common stock. Upon the effectiveness of the reverse stock split, every 20 shares of issued and outstanding common stock were combined into one issued and outstanding share of common stock, with no change in par value per share.
Payment of Dividends to Shareholders
The Company did not make any dividend payments in 2016, 2015 and 2014. In the future, the declaration and payment of dividends, if any, will always be subject to the discretion of the board of directors, restrictions contained in the First Lien Facility, the Second Lien Facility, and the requirements of Marshall Islands law. The timing and amount of any dividends declared will depend on, among other things, the Company's earnings, financial condition and cash requirements and availability, the ability to obtain debt and equity financing on acceptable terms as contemplated by the Company's growth strategy, the terms of its outstanding indebtedness and the ability of the Company's subsidiaries to distribute funds to it. The Company does not currently expect to pay dividends in the near term.. Please see "Item 7. Management's Discussion and Analysis of Financial Condition and Results of Operations—Dividends" and Note 2. “Corporate Reorganization” to the consolidated financial statements.
Equity Compensation Plan Information
On October 15, 2014, the Company adopted the post-emergence Management Incentive Program, which provided for the distribution of Company equity in the form of shares of Company common stock, and options, to the participating senior management and other employees of the reorganized Company (the “2014 Plan”).
On December 15, 2016, the Company adopted 2016 Equity Incentive Plan (the “2016 Plan”) which replaced the 2014 Plan. Outstanding awards under the 2014 Plan will continue to be governed by the terms of the 2014 Plan until exercised, expired or otherwise terminated or cancelled. Under the terms of the 2016 Plan, a maximum of 5,348,613 shares may be issued. Any director, officer, employee or consultant of the Company or any of its subsidiaries (including any prospective officer or employee) is eligible to be designated to participate in the 2016 Plan.
The following table sets forth certain information as of December 31, 2016 regarding the 2016 Plan. The 2016 Plan was approved by our shareholders on December 15, 2016.
|
Number of Securities to be issued upon exercise of outstanding options, warrants and rights |
Weighted-average exercise price of outstanding options, warrants and rights |
Number of securities remaining available for future issuance under equity compensation plans(excluding securities reflected in column (a)) |
||||||||||
|
Plan Category |
(a)* |
(b) |
(c)* |
|||||||||
|
Equity compensation plans approved by security holders |
2,650,096 | $ | 4.17 | 2,698,517 |
| |||||||
|
Equity compensation plans not approved by security holders |
- | - | N/A | |||||||||
|
Total |
2,650,096 | 4.17 | 2,698,517 | |||||||||
|
* |
Consists of 5,348,613 shares eligible to be granted under the 2016 Plan. |
Company Common Stock Performance Graph
The following graph illustrates a comparison of the cumulative total shareholder return (change in stock price plus reinvested dividends) of Eagle Bulk’s common stock with the Standard and Poor’s 500 Index and a peer group “Dry Index” consisting of DryShips, Inc., Diana Shipping Inc., Excel Maritime Carriers Ltd., Navios Maritime Holdings, Inc. and Genco Shipping and Trading Limited. The comparison graph assumes a $100 investment in each of the Company's common stock, the Standard & Poor's 500 Index and the Dry Index peer group on October 16, 2014, the date of the Company's emergence from bankruptcy.
|
|
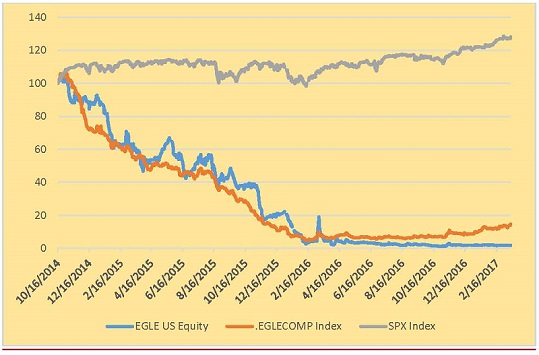
ITEM 6. SELECTED FINANCIAL DATA
The following table sets forth selected financial data for the Successor for the years ended December 31, 2016 and 2015 and for the period from October 16, 2014 to December 31, 2014 and the Predecessor for the period January 1, 2014 to October 15, 2014 and the years ended December 31, 2013 and 2012. Income Statement data in the table has been derived from the Company's audited financial statements and notes thereto for the years ended December 31, 2016 and 2015 (Successor), the period from October 16, 2014 to December 31, 2014 (Successor) and for the period January 1, 2014 to October 15, 2014 (Predecessor) and as of December 31, 2016 and 2015 (Successor) included herein and for the years ended December 31, 2013 and 2012 and as of December 31, 2014, 2013 and 2012 not appearing in this Form 10-K. The data for the years ended December 31, 2016 and 2015, the period from October 16, 2014 to December 31, 2014 and for the period January 1, 2014 to October 15, 2014 and as of December 31, 2016 and 2015 should be read in conjunction with the consolidated financial statements, related notes and other financial information included herein. The period from October 16, 2014 to December 31, 2014 (Successor) and the period from January 1, 2014 to October 15, 2014 (Predecessor) are distinct reporting periods as a result of our emergence from bankruptcy on October 15, 2014 as reported in our consolidated financial statements.
(Dollar amounts in thousands except Per Share amounts and Fleet Data)
| Successor | Predecessor | |||||||||||||||||||||||
|
Income Statement Data (a) |
2016 |
2015 |
Period from October 16, 2014 to December 31, 2014 |
Period from January 1, 2014 to October 15, 2014 |
2013 |
2012 |
||||||||||||||||||
|
Revenues, net |
$ | 124,493 | $ | 103,857 | $ | 31,090 | $ | 123,150 | $ | 202,440 | $ | 190,811 | ||||||||||||
|
Voyage expenses |
42,094 | 23,832 | 6,262 | 14,704 | 26,423 | 26,111 | ||||||||||||||||||
|
Vessel expenses |
74,017 | 86,329 | 17,331 | 71,679 | 78,830 | 85,079 | ||||||||||||||||||
|
Charter hire expenses |
12,845 | 4,126 | 1,043 | 188 | - | 1,713 | ||||||||||||||||||
|
Depreciation and Amortization |
38,884 | 43,001 | 8,782 | 61,239 | 76,947 | 77,588 | ||||||||||||||||||
|
General and Administrative Expenses |
22,906 | 25,537 | 5,933 | 18,679 | 21,621 | 37,539 | ||||||||||||||||||
|
Restructuring Charges |
5,869 | - | - | - | - | - | ||||||||||||||||||
|
Vessel Impairment** |
129,028 | 50,873 | ||||||||||||||||||||||
|
Loss (gain) on Sale of Vessels |
102 | 5,697 | - | - | - | - | ||||||||||||||||||
|
Gain on time charter agreement termination |
- | - | - | - | (32,525 |
) |
- | |||||||||||||||||
|
Total Operating Expenses |
325,745 | 239,394 | 39,351 | 166,489 | 171,296 | 228,030 | ||||||||||||||||||
|
Interest Expense, net |
21,799 | 11,927 | 2,360 | 60,737 | 82,833 | 66,610 | ||||||||||||||||||
|
Interest Income |
(215 |
) |
(6 |
) |
(2 |
) |
(8 |
) |
- | - | ||||||||||||||
|
Other expenses (income) |
687 | 838 | 884 | - | 18,832 | (1,028 |
) | |||||||||||||||||
|
Reorganization Expense |
- | - | 46 | 427,735 | - | - | ||||||||||||||||||
|
Net loss |
$ | (223,523 |
) |
$ | (148,296 |
) |
$ | (11,549 |
) |
$ | (531,803 |
) |
$ | (70,521 |
) |
$ | (102,801 |
) | ||||||
|
Share and Per Share Data* |
||||||||||||||||||||||||
|
Basic loss per share |
$ | (10.87 |
) |
$ | (78.88 |
) |
$ | (6.16 |
) |
$ | (29.78 |
) |
$ | (4.15 |
) |
$ | (6.30 |
) | ||||||
|
Diluted loss per share |
$ | (10.87 |
) |
$ | (78.88 |
) |
$ | (6.16 |
) |
$ | (29.78 |
) |
$ | (4.15 |
) |
$ | (6.30 |
) | ||||||
|
Weighted Average Shares Outstanding – Diluted |
20,566 | 1,881 | 1,875 | 17,857 | 16,984 | 16,328 | ||||||||||||||||||
|
Cash Dividends Declared per share |
- | - | - | - | - | - | ||||||||||||||||||
|
Consolidated Cash Flow Data |
||||||||||||||||||||||||
|
Net cash (used in)/ provided by operating activities |
$ | (45,434 |
) |
$ | (43,787 |
) |
$ | (279 |
) |
$ | (19,465 |
) |
$ | (354 |
) |
$ | 4,778 | |||||||
|
Net cash (used in)/ provided by investing activities |
(9,280 |
) |
10,252 | 4,206 | (491 |
) |
2,317 | (294 |
) | |||||||||||||||
|
Net cash (used in)/ provided by financing activities |
106,335 | 18,456 | - | (36,322 |
) |
(400 |
) |
(12,028 |
) | |||||||||||||||
*Adjusted to give effect for the 1 for 20 reverse stock split for the Successor that became effective as of the opening of trading on August 5, 2016.
** As of December 31, 2016, the Company intends to divest some of the older as well as less efficient vessels from its fleet to achieve operating cost savings as well as potentially acquiring newer and more efficient vessels. The anticipated sale of such vessels in the next two years reduced our estimated holding period of the vessels resulting in an impairment charge. As a result, we reduced the carrying value of each vessel to its fair market value as of December 31, 2016 and recorded an impairment charge of $122,860,600. An impairment charge was also recorded in 2015 and then subsequently in the first quarter of 2016 for six vessels which were subsequently sold.
|
Successor |
Predecessor |
|||||||||||||||||||
|
Consolidated Balance Sheet Data |
December 31, 2016 |
December 31, 2015 |
December 31, 2014(a) |
December 31, 2013 |
December 31, 2012 |
|||||||||||||||
|
Current Assets |
$ | 104,265 | $ | 41,025 | $ | 76,591 | $ | 61,931 | $ | 43,799 | ||||||||||
|
Total Assets |
686,382 | 786,603 | 913,877 | 1,723,414 | 1,789,144 | |||||||||||||||
|
Total Liabilities |
285,899 | 268,259 | 249,786 | 1,192,219 | 1,194,950 | |||||||||||||||
|
Short-term Debt |
- | 15,625 | 15,625 | 1,174,044 | - | |||||||||||||||
|
Long-term Debt |
255,944 | 225,577 | 203,556 | - | 1,119,770 | |||||||||||||||
|
Stockholders' Equity |
400,483 | 518,344 | 664,091 | 531,195 | 594,195 | |||||||||||||||
|
Other Data |
||||||||||||||||||||
|
Capital Expenditures: |
||||||||||||||||||||
|
Vessels |
$ | 21,787 | $ | 1,747 | $ | 486 | $ | 92 | $ | 58 | ||||||||||
|
Payments for drydockings |
3,689 | $ | 11,142 | $ | 5,764 | $ | 3,638 | $ | 1,094 | |||||||||||
|
Ratio of Total Debt to Total Capitalization (b) |
39.0 |
% |
31.8 |
% |
24.8 |
% |
68.8 |
% |
65.3 |
% | ||||||||||
|
Fleet Data |
||||||||||||||||||||
|
Number of Vessels in operating fleet |
41 | 44 | 45 | 45 | 45 | |||||||||||||||
|
Average Age of Fleet (in dwt weighted years) |
8.7 | 8.4 | 8 | 7 | 6 | |||||||||||||||
|
Fleet Ownership Days |
15,408 | 16,186 | 16,425 | 16,425 | 16,470 | |||||||||||||||
|
Charter-in under operating lease Days |
1,494 | 382 | 91 | 0 | 90 | |||||||||||||||
|
Fleet Available Days |
16,695 | 16,151 | 16,325 | 16,305 | 16,512 | |||||||||||||||
|
Fleet Operating Days |
16,485 | 15,766 | 15,988 | 16,180 | 16,389 | |||||||||||||||
|
Fleet Utilization Days |
98.79 |
% |
97.6 |
% |
97.9 |
% |
99.2 |
% |
99.3 |
% | ||||||||||
|
(a) |
The consolidated and other financial data for the year ended December 31, 2014 presents the results of operations for the period from October 16, 2014 to December 31, 2014 (Successor) and the period from January 1, 2014 to October 15, 2014 (Predecessor). The period from October 16, 2014 to December 31, 2014 (Successor) and the period from January 1, 2014 to October 15, 2014 (Predecessor) are distinct reporting periods because of our emergence from bankruptcy on October 15, 2014 as reported in our consolidated financial statements. As result of the bankruptcy our capital structure, our financial statements and share and per share, amounts are not comparable between the Successor and Predecessor. |
|
(b) |
Ratio of Total Debt to Total Capitalization was calculated as debt divided by capitalization (debt plus stockholders' equity). |
ITEM 7. MANAGEMENT'S DISCUSSION AND ANALYSIS OF FINANCIAL CONDITION AND RESULTS OF OPERATIONS
The following discussion and analysis of our financial condition and results of operations should be read in conjunction with our consolidated financial statements and related notes set forth in “Item 8. Financial Statements and Supplementary Data,” our consolidated financial data set forth in “Item 6. Selected Financial Data” and the risk factors identified in “Item 1A. Risk Factors” of this Annual Report.
General Overview
We are Eagle Bulk Shipping Inc., a Marshall Islands corporation incorporated on March 23, 2005 and headquartered in Stamford, Connecticut. We own one of the largest fleets of Supramax/Ultramax dry bulk vessels in the world. Supramax dry bulk are vessels which are constructed with on-board cranes, ranging in size from approximately 50,000 to 59,000 dwt and Ultramax dry bulk vessels range in size from 60,000 to 65,000 dwt. They are considered a sub-category of the Handymax segment typically defined as 40,000 to 65,000 dwt. We transport a broad range of major and minor bulk cargoes, including but not limited to coal, grain, ore, petcoke, cement and fertilizer, along worldwide shipping routes. As of December 31, 2016, we owned and operated a modern fleet of 41 Handymax dry bulk vessels. We chartered-in a 37,000 dwt newbuilding Japanese vessel that was delivered in October 2014 for seven years with an option for one additional year.
We are focused on maintaining a high quality fleet that is concentrated primarily in Supramax/ Ultramax dry bulk carriers. These vessels have the cargo loading and unloading flexibility of on-board cranes while offering cargo carrying capacities approaching that of Panamax dry bulk vessels, which range in size from 72,000 to 83,000 dwt and rely on port facilities to load and offload their cargoes. We believe that the cargo handling flexibility and cargo carrying capacity of the Supramax class vessels make them attractive to cargo interests and vessel charterers. The 41 vessels in our operating fleet, with an aggregate carrying capacity of 2,260,943 dwt, have an average age of 8.7 years as of December 31, 2016.
We carry out the commercial and strategic management of our fleet through our indirectly wholly-owned subsidiary, Eagle Shipping International (USA) LLC, a Marshall Islands limited liability company, which maintains its principal executive offices in Stamford, Connecticut. We own each of our vessels through a separate wholly-owned Marshall Islands limited liability company.
Corporate Reorganization and Refinancing
On March 30, 2016, we entered into the contribution agreement (the “Contribution Agreement”) with a newly-formed wholly-owned subsidiary, Eagle Shipping LLC, a limited liability company organized under the laws of the Marshall Islands and a wholly-owned subsidiary of the Company (“Eagle Shipping”), pursuant to which the Company transferred, assigned and contributed to Eagle Shipping, and Eagle Shipping received, accepted and assumed, all of the tangible and intangible assets of the Company (other than the membership interests in Eagle Shipping owned by the Company and certain deposit accounts held by the Company, which deposit account balances were transferred) and all of the liabilities of the Company, including all of the Company’s rights and obligations under the senior secured credit facility dated as of October 9, 2014 (the “Exit Financing Facility”) (the “Contribution”). Immediately following the Contribution, Eagle Shipping became the direct parent company of each of the Company’s previously directly-owned subsidiaries and the indirect parent company of each of the Company’s previously indirectly-owned subsidiaries. The Contribution was part of a series of transactions contemplated by the agreements also entered into on March 30, 2016 and described below, which transactions were consummated on March 30, 2016, after the fulfillment of certain conditions precedent.
First Lien Facility
On March 30, 2016, Eagle Shipping, as borrower, and certain of its subsidiaries that were guarantors of the Company’s obligations under the Company’s senior secured credit facility (the “Exit Financing Facility”), as guarantors, entered into an Amended and Restated First Lien Loan Agreement (the “A&R First Lien Loan Agreement”) with the lenders thereunder (the “First Lien Lenders”) and ABN AMRO Capital USA LLC, as agent and security trustee for the lenders. The A&R First Lien Loan Agreement amends and restates the Exit Financing Facility in its entirety, providing for Eagle Shipping to be the borrower in the place of the Company, and further provides for a waiver of any and all events of default occurring as a result of the Company’s previously reported self-disclosure report with OFAC. The A&R First Lien Loan Agreement provides for a term loan (which was outstanding in the amount of $201,468,750 after giving effect to the entry into the A&R First Lien Loan Agreement and the Second Lien Loan Agreement) as well as a $50,000,000 revolving credit facility, of which $10,000,000 was undrawn as of March 30, 2016 (the term loan, together with the revolving credit facility, the “First Lien Facility”). The First Lien Facility matures on October 15, 2019. An aggregate fee of $600,000 was paid to the agent and the First Lien Lenders in connection with the First Lien Facility.
Eagle Shipping’s obligations under the First Lien Facility are secured by a first priority mortgage on each of the vessels currently in Eagle Shipping’s fleet and such other vessels that it may from time to time include with the approval of the First Lien Lenders, a first priority assignment of its earnings account, its liquidity account and its vessel-owning subsidiaries’ earnings accounts, a first priority assignment of all charters with terms that may exceed 18 months, freights, earnings, insurances, requisition compensation and management agreements with respect to the vessels, a first priority pledge of the membership interests of each of Eagle Shipping’s vessel-owning subsidiaries, and a non-recourse pledge by the Company of the membership interests of Eagle Shipping. In the future, Eagle Shipping may grant additional security to the First Lien Lenders from time to time in the future, subject to the terms of the intercreditor agreement between the first lien agent and the second lien agent (the “Intercreditor Agreement”). See “Note 2. Corporate Reorganization” to the consolidated financial statements.
Second Lien Facility
On March 30, 2016, Eagle Shipping, as borrower, and certain of its subsidiaries, that were guarantors of the Company’s obligations under the Exit Financing Facility, as guarantors, entered into a Second Lien Loan Agreement (the “Second Lien Loan Agreement”) with certain lenders (the “Second Lien Lenders”) and Wilmington Savings Fund Society, FSB as agent for the Second Lien Lenders (the “Second Lien Agent”). The Second Lien Lenders include certain of the Company’s existing shareholders, as well as other investors. The Second Lien Loan Agreement provides for a term loan in the amount of $60,000,000 (the “Second Lien Facility”), and matures on January 14, 2020 (the date that is 91 days after the original stated maturity of the First Lien Facility). The term loan under the Second Lien Facility bears interest at a rate of LIBOR plus 14.00% per annum (with a 1.0% LIBOR floor) or the Base Rate (as defined in the Second Lien Loan Agreement) plus 13.00% per annum, paid in kind quarterly in arrears. The Company used the proceeds from the Second Lien Facility to pay down $30,158,500, a portion of the amount outstanding in respect of the revolving credit facility under the First Lien Facility, pay three quarters of amortization payments under the First Lien Facility, pay transaction fees in connection with the entry into the A&R First Lien Loan Agreement and the Second Lien Loan Agreement, and add cash to the balance sheet.
Eagle Shipping’s obligations under the Second Lien Facility are secured by a second priority lien on the same collateral securing Eagle Shipping’s obligations under the First Lien Facility, subject to the terms of the Intercreditor Agreement. Eagle Shipping may grant additional security to the Second Lien Lenders from time to time in the future, subject to the terms of the Intercreditor Agreement. See “Note 2. Corporate Reorganization” to the consolidated financial statements.
Intercreditor Agreement
Concurrently with Eagle Shipping’s entry into the A&R First Lien Loan Agreement and the Second Lien Loan Agreement, and in connection with the granting of security interests in and liens on the collateral securing obligations under those agreements, Eagle Shipping entered into the Intercreditor Agreement. The Intercreditor Agreement governs the relative rights and priorities of the secured parties in respect of liens on the assets of Eagle Shipping and its subsidiaries securing the First Lien Facility and the Second Lien Facility.
Preferred Stock Private Placement
On May 26, 2016, the Company entered into a Preferred Stock Purchase Agreement (the “Preferred Stock Purchase Agreement”) with certain investors named therein, including certain of our existing shareholders and our Chairman and Chief Executive Officer (the “Purchasers”), pursuant to which the Company agreed to issue to the Purchasers in a private placement (the “Private Placement”) pursuant to the private placement exemption from registration under Section 4(a)(2) of the Securities Act and Rule 506 of Regulation D promulgated under the Securities Act, shares of the Company’s 15% Cumulative Nonparticipating Redeemable Series A Preferred Stock, par value $0.01 per share (the “Series A Preferred Stock”), at a purchase price of $1,000.00 per share with a 1.0% original issue discount, for aggregate gross proceeds expected to amount to approximately $6.3 million.
On September 7, 2016, the Company and each of the Purchasers executed the Termination Agreement, terminating the Preferred Stock Purchase Agreement (the “Termination Agreement”). Pursuant to the Termination Agreement, the Company and each Purchaser exchanged mutual releases of any and all claims or actions against each other in connection with or resulting from the Preferred Stock Purchase Agreement and the transactions contemplated thereby. The Company also agreed to make an aggregate termination payment to the Purchasers of $125,254.80, with such aggregate amount allocated among the Purchasers in proportion to the percentage of the shares of Series A Preferred Stock each Purchaser had previously agreed to purchase. The fees paid to the shareholders were recorded as other expense in the consolidated statements of operations for the year ended December 31, 2016. See “Note 3. Equity Offerings” to the consolidated financial statements.
Common Stock Private Placements
On July 1, 2016 and July 10, 2016, respectively, the Company entered into Common Stock Purchase Agreements (collectively, the “Common Stock Purchase Agreements”), with certain purchasers (the “Common Stock Purchasers”). The Common Stock Purchasers include certain of our existing shareholders, who held approximately 70% of our outstanding equity prior to entry into the Common Stock Purchase Agreements and prior to giving effect to the delivery of all of the shares of common stock issued in connection with the Second Lien Loan Agreement, as well as our Chairman and Chief Executive Officer. The Common Stock Purchase Agreements provided for the issuance and sale by the Company to the Common Stock Purchasers of an aggregate amount of $88 million of common stock, at an initial price per share of $0.15, which amount per share was increased to $3.00 per share based on the reverse stock split ratio of 1-for-20 that became effective as of the opening of trading on August 5, 2016.
On August 10, 2016, the Company closed the transactions contemplated by the Common Stock Purchase Agreements for aggregate proceeds of $86.0 million, net of fees and legal expenses. After giving effect to the Company’s previously announced reverse stock split of its issued and outstanding shares of common stock, including the rounding down of fractional shares pursuant to such split, the private placement included the issuance of 29,333,318 shares of the Company’s common stock. The Company intends to use the proceeds of the private placement for the acquisition of dry bulk vessels and general corporate purposes.
On December 13, 2016, the Company entered into a Stock Purchase Agreement (the “December Stock Purchase Agreement”) with certain investors (the “Investors”), pursuant to which the Company agreed to issue to the Investors in a private placement (the “December Private Placement”) approximately 22.2 million shares of the Company’s common stock, par value $0.01 per share, at an initial purchase price of $4.50 per share, for aggregate gross proceeds of $100.0 million. On January 20, 2017, the Company closed its previously announced December Private Placement for aggregate gross proceeds of $100 million. The Company plans to use the proceeds from the December Private Placement for the acquisition of dry bulk tonnage and general corporate purposes. See “Note 3. Equity Offerings” to the consolidated financial statements.
The following are certain significant events that occurred during 2016 and 2017:
|
● |
On April 26, 2016, the Company sold the vessel Peregrine for $2.6 million, after brokerage commissions and associated selling expenses, and recorded a net loss of approximately $150,000 in the second quarter of 2016. A portion of the proceeds was used towards repayment of the term loan under the First Lien Facility. |
|
● |
On June 16, 2016, the Company sold the vessel Falcon for $3.2 million, after brokerage commissions and associated selling expenses, and recorded a net loss of approximately $140,000 in the second quarter of 2016. A portion of the proceeds was used towards repayment of the term loan under the First Lien Facility. |
|
● |
On July 13, 2016, the Company sold the vessel Harrier for $3.2 million, after brokerage commissions, associated selling expenses, and recorded a loss of $115,000. A portion of the proceeds was used towards repayment of the term loan under the First Lien Facility. |
|
● |
On September 6, 2016, the Company sold the vessel Kittiwake for $4.0 million, after brokerage commission, associated selling expenses, and recorded a net gain of approximately $316,000 in the third quarter of 2016. A portion of the proceeds was used towards repayment of the term loan under the First Lien Facility. |
|
● |
On September 30, 2016, Eagle Shipco signed a memorandum of agreement to acquire a 2016 NACKS built Ultramax 61,000 dwt. vessel for $18.85 million. The Company took the delivery of the vessel in the fourth quarter of 2016. |
|
● |
On November 14, 2016, the Company announced it has acquired a resale 2017-built 64,000 deadweight SDARI-64 Ultramax dry bulk vessel constructed at Chengxi Shipyard Co., Ltd for $18.5 million. The vessel was delivered to the Company in the first quarter of 2017. |
|
● |
On December 22, 2016, the Company signed a memorandum of agreement to sell the vessel Redwing for $5.8 million after brokerage commissions and associated selling expenses. The vessel was delivered to the buyers in first quarter of 2017. The Company will record a gain on sale of vessel of $0.3 million in the first quarter of 2017. A portion of the proceeds was used towards repayment of the term loan under the First Lien Facility. As of December 31, 2016, the Company determined that all held for sale criteria were met for the vessel and classified the carrying amount of the vessel as a current asset in its consolidated balance sheet. |
|
● |
On February 28, 2017, a wholly-owned subsidiary of the Company entered into the Greenship Agreement with the Greenship Sellers for the purchase of the Greenship Vessels. Of the nine Greenship Vessels, three Greenship Vessels are subject to certain customary conditions as well as the approval of the requisite majority of the unitholders of the Greenship Sellers, which approval was obtained. The aggregate purchase price for the nine Greenship Vessels is $153.0 million. The allocated purchase price for each Greenship Vessel is $17.0 million. The Greenship Vessels are expected to be delivered charter free between April and September 2017. See Note 20, “Subsequent Events” to the consolidated financial statements. |
|
● |
On March 15, 2017, the Company signed a memorandum of agreement to sell the vessel Sparrow for $4.8 million after brokerage commissions and associated selling expenses. The vessel will be delivered to the buyers in the second quarter of 2017. The Company will record a gain on sale of vessel of $1.0 million in the second quarter of 2017. A portion of the proceeds will be used towards repayment of the term loan under the First Lien Facility. As of December 31, 2016, the Company determined that all held for sale criteria were met for the vessel and classified the carrying amount of the vessel as a current asset in its consolidated balance sheet. |
The following are certain significant events that occurred during 2015:
|
● |
In April 2015, the Company decided to sell the Kite, a 1997-built Handymax, and reached an agreement to sell the vessel for $4,297,100 after brokerage commissions payable to a third party. On May 7, 2015, the Company sold the vessel and realized a net loss of approximately $5.7 million in the second quarter of 2015. |
|
● |
On May 20, 2015, the Company delivered a 90 day termination notice to Navig8 Pool to terminate the pool arrangements for all of its vessels in the Navig8 Pool. The notice of termination was given pursuant to the terms of the Company’s pool agreement. |
|
● |
On August 24, 2015, the Company provided three months’ notice to V. Ships Limited to terminate the technical management contract. The Company completed the transfer of all vessels to in-house technical management during the first quarter of 2016. |
Bankruptcy and Reorganization
On August 6, 2014, the Company entered into a restructuring support agreement (the “Restructuring Support Agreement”) with lenders constituting the “Majority Lenders” under the Exit Financing Facility (the “Consenting Lenders”), which contemplated a plan of reorganization through a balance sheet restructuring of the Company’s obligations upon the terms specified therein. On the same day, the Company filed a voluntary prepackaged case (the “Prepackaged Case”) under chapter 11 of title 11 of the United States Code (the “Bankruptcy Code”) in the United States Bankruptcy Court for the Southern District of New York (the “Court”). The Prepackaged Case was filed only in respect of the Company, but not any of its subsidiaries. Through the Prepackaged Case, the Company sought to implement a balance sheet restructuring pursuant to the terms of its prepackaged plan of reorganization filed with the Court (the “Plan”). The Company continued to operate its business as a “debtor in possession” under the jurisdiction of the Court and in accordance with the applicable provisions of the Bankruptcy Code and orders of the Court.
The Company emerged from bankruptcy on October 16, 2014 through a series of transactions contemplated by the Plan, and the Plan became effective pursuant to its terms. See “Note 18. Bankruptcy” to the consolidated financial statements.
Business Strategy and Outlook:
We believe our strong balance sheet allows us the flexibility to opportunistically make investments in the dry bulk segment that will drive shareholder growth. In order to accomplish this, we intend to:
|
● |
Maintain a highly efficient and the high quality fleet in the dry bulk segment. |
|
● |
Maintain a revenue strategy that takes advantage of a rising rate environment and at the same time mitigate risk in a declining rate environment. |
|
● |
Maintain a cost structure that allow us to be competitive in all economic cycles without sacrificing safety and maintenance. |
|
● |
Continue to grow our relationships with our charterers and vendors. |
|
● |
Continue to invest in our on-shore operations and development of processes. |
Our financial performance is based on the following key elements of our business strategy:
|
|
(1) |
concentration in one vessel category: Supramax/Ultramax dry bulk vessels, which we believe offer certain size, operational and geographical advantages relative to other classes of dry bulk vessels, such as Handy, Panamax and Capesize vessels, |
|
|
(2) |
An active owner-operator model where we seek to operate our own fleet and develop contractual relationships directly with cargo interests. These relationships and the related cargo contracts have the dual benefit of providing greater operational efficiencies and act as a balance to the Company’s naturally long position to the market. Notwithstanding the focus on voyage chartering, we consistently monitor the dry bulk shipping market and, based on market conditions, will consider taking advantage of long-term time charters at higher rates when appropriate. As the Company executed on its chartering strategy, the percentage of revenue earned from voyage charters increased from 6% in 2015 to 35% in 2016. The percentage of revenue earned from commercial pool arrangements decreased from 18% in 2015 to 1% in 2016. |
|
|
(3) |
Maintain high quality vessels and improve standards of operation through improved standards and procedures, crew training and repair and maintenance procedures. |
We have employed all of our vessels on time and voyage charters. The following table represents certain information about our revenue earning charters on our operating fleet as of December 31, 2016:
|
Vessel |
Year Built |
Dwt |
Charter Expiration |
Daily Charter Hire Rate |
|||||||
|
Avocet |
2010 |
53,462 |
Jan 2017 |
$ | 6,000 | ||||||
|
Bittern |
2009 |
57,809 |
Feb 2017 |
$ | 12,000 | ||||||
|
Canary |
2009 |
57,809 |
Feb 2017 |
$ | 14,000 | ||||||
|
Cardinal |
2004 |
55,362 |
Feb 2017 |
Voyage |
|||||||
|
Condor |
2001 |
50,296 |
Jan 2017 |
$ | 9,500 | ||||||
|
Crane |
2010 |
57,809 |
Jan 2017 |
$ | 2,300 | (1) | |||||
|
Crested Eagle |
2009 |
55,989 |
Feb 2017 |
Voyage |
|||||||
|
Crowned Eagle |
2008 |
55,940 |
Jan 2017 |
Voyage |
|||||||
|
Egret Bulker |
2010 |
57,809 |
Feb 2017 |
Voyage |
|||||||
|
Gannet Bulker |
2010 |
57,809 |
Feb 2017 |
Voyage |
|||||||
|
Golden Eagle |
2010 |
55,989 |
Jan 2017 |
$ | 6,750 | ||||||
|
Goldeneye |
2002 |
52,421 |
Feb 2017 |
Voyage |
|||||||
|
Grebe Bulker |
2010 |
57,809 |
Jan 2017 |
$ | 7,000 | ||||||
|
Hawk I |
2001 |
50,296 |
Jan 2017 |
Voyage |
|||||||
|
Ibis Bulker |
2010 |
57,775 |
Jan 2017 |
$ | 15,000 | ||||||
|
Imperial Eagle |
2010 |
55,989 |
Feb 2017 |
$ | 3,600 | (2) | |||||
|
Jaeger |
2004 |
52,248 |
Jan 2017 |
$ | 5,500 | ||||||
|
Jay |
2010 |
57,802 |
Jan 2017 |
Voyage |
|||||||
|
Kestrel I |
2004 |
50,326 |
Feb 2017 |
$ | 6,325 | ||||||
|
Kingfisher |
2010 |
57,776 |
Jan 2017 |
$ | 9,000 | ||||||
|
Martin |
2010 |
57,809 |
Mar 2017 |
$ | 2,050 | (3) | |||||
|
Merlin |
2001 |
50,296 |
Jan 2017 |
Voyage |
|||||||
|
Nighthawk |
2011 |
57,809 |
Feb 2017 |
$ | 2,150 | (4) | |||||
|
Oriole |
2011 |
57,809 |
Mar 2017 |
$ | 3,000 | (5) | |||||
|
Osprey I |
2002 |
50,206 |
Awaiting orders |
(6) | |||||||
|
Owl |
2011 |
57,809 |
Jan 2017 |
$ | 19,600 | ||||||
|
Petrel Bulker |
2011 |
57,809 |
Jan 2017 |
Voyage |
|||||||
|
Puffin Bulker |
2011 |
57,809 |
Jan 2017 |
Voyage |
|||||||
|
Redwing |
2007 |
53,411 |
Awaiting sale |
(7) | |||||||
|
Roadrunner Bulker |
2011 |
57,809 |
Jan 2017 |
Voyage |
|||||||
|
Sandpiper Bulker |
2011 |
57,809 |
Feb 2017 |
$ | 2,400 | (8) | |||||
|
Shrike |
2003 |
53,343 |
Mar 2017 |
Voyage |
|||||||
|
Skua |
2003 |
53,350 |
Mar 2017 |
Voyage |
|||||||
|
Sparrow |
2000 |
48,225 |
Feb 2017 |
$ | 13,500 | (11) | |||||
|
Stamford Eagle |
2016 |
61,530 |
Feb 2017 |
Voyage |
|||||||
|
Stellar Eagle |
2009 |
55,989 |
Jan 2017 |
$ | 10,000 | ||||||
|
Tern |
2003 |
50,200 |
Jan 2017 |
Voyage |
|||||||
|
Thrasher |
2010 |
53,360 |
Jan 2017 |
$ | 6,000 | ||||||
|
Thrush |
2011 |
53,297 |
Apr 2017 |
$ | 1,000 | (9) | |||||
|
Woodstar |
2008 |
53,390 |
Jan 2017 |
Voyage |
|||||||
|
Wren |
2008 |
53,349 |
Jan 2017 |
$ | 2,750 | (10) | |||||
|
|
(1) |
The vessel is contracted to continue the existing time charter at an increased charter rate of $6,800 after January 3, 2017. |
|
|
(2) |
The vessel is contracted to continue the existing time charter at an increased charter rate of $7,000 after January 9, 2017 and $10,000 after February 3, 2017. |
|
|
(3) |
The vessel is contracted to continue the existing time charter at an increased charter rate of $6,750 after March 5, 2017. |
|
|
(4) |
The vessel is contracted to continue the existing time charter at an increased charter rate of $6,400 after February 6, 2017. |
|
|
(5) |
The vessel is contracted to continue the existing time charter at an increased charter rate of $7,000 after January 12, 2017 |
|
|
(6) |
The vessel is contracted to perform a short-term time charter after December 31, 2016. |
|
|
(7) |
On December 22, 2016, the Company signed the memorandum of agreement to sell the vessel Redwing for $5.8 million after brokerage commissions and associated selling expenses. The vessel was delivered to the buyer in first quarter of 2017. The Company will record a gain of $0.3 million in the first quarter of 2017. A portion of the proceeds was used towards repayment of the term loan under the First Lien Facility. As of December 31, 2016, the Company determined that all held for sale criteria were met for the vessel and classified the carrying amount of the vessel as a current asset in its consolidated balance sheet. |
|
(8) |
The vessel is contracted to continue the existing time charter at an increased charter rate of $6,250 after January 24, 2017. | |
|
(9) |
The vessel is contracted to continue the existing time charter at an increased charter rate of $7,000 after March 6, 2017. | |
|
(10) |
The vessel is contracted to continue the existing time charter at an increased charter rate of $6,850 after January 14, 2017. | |
|
(11) |
On March 22, 2017, the Company signed the memorandum of agreement to sell the vessel Sparrow for $4.8 million after brokerage commissions and associated selling expenses. As of December 31, 2016, the Company determined that all held for sale criteria were met for the vessel and reclassified the carrying amount of the vessel as a current asset in its consolidated balance sheet. |
Market Overview
The international shipping industry is highly competitive and fragmented with no single owner accounting for more than 5% of the on-the-water fleet. As of December 31, 2016, there are approximately 10,867 dry bulk carriers (over 10,000 dwt) totaling 794 million dwt. We compete with other (primarily private) owners of dry bulk vessels in the Handysize, Supramax, and Panamax asset classes.
Competition in the dry bulk trade is robust. Demand is a function of world economic conditions and the consequent requirement for commodities, production and consumption patterns, as well as events, which interrupt production, trade routes, and consumption. We compete for charters based on price, vessel location, size, age, and condition, as well as on our reputation as an owner and operator. Customers, or charterers, tend to prefer modern vessels (over older ships) due to their greater operational reliability, lower fuel consumption, and improved built-designs complying with more recent regulation standards. Consequently, owners of large modern fleets tend to have a competitive advantage over owners operating older ships.
Our strategy is to focus on the Supramax/Ultramax asset class, which is part of the the broader Handymax segment, defined as dry bulk vessels between 40,000 to 65,000 dwt. Supramaxes range in size from approximately 50,000 to 59,000 dwt, while Ultramaxes dry bulk vessels range in size from approximately 60,000 to 65,000 dwt. These vessels have the cargo loading and unloading flexibility offered by their on-board cranes, while the cargo carrying capacity approaches that of Panamax, which ranges in size between 75,000 and 83,000 dwt and which require onshore facilities to load and offload their cargoes. We believe that the cargo handling flexibility and cargo carrying capacity of the Supramax/Ultramax class makes it the preferred type of ship attractive to potential charterers. All 41 of our owned vessels, as of December 31, 2016, range in size between 48,000 and 64,000 dwt. We also have one logs-fitted Handysize vessel on a long-term charter-in which is roughly 37,000 dwt in size.
The supply of dry bulk vessels depends primarily on the level of the orderbook, the fleet age profile, and the operating efficiency of the existing fleet. As of December 2016, 7% of the world Handymax fleet was 20 years or older, while the newbuilding orderbook stood at 10% of the (Handymax) on-the-water fleet. The 41 vessels in our operating fleet have an average age of approximately 8.7 years as of December 31, 2016. The typical trading life of a Handymax vessel is approximately 25 years.
The Handymax Market
The Dry Bulk market was extremely challenged during 2016 due to elevated supply growth, especially during the first half of the year, and weak cargo demand, highlighted by reduced coal shipments to China and weather-related issues in Brazil and Australia that temporarily reduced iron ore output. The Baltic Supramax Index (“BSI”), a dry bulk index based on 52,000 dwt vessels, averaged $6,235 for 2016, a historic low. During 2016, the BSI reached an all-time low of $2,544 in February and started to recover from there, averaging $5,795 for the second quarter, $7,064 for the third quarter, and $8,317 for the fourth quarter. The improvement in rates during the year was driven by increased demolition (of older vessels), lower supply growth, and higher iron ore and coal flows into China.
Looking ahead, newbuilding deliveries for 2017 and beyond are expected to be significantly less than in recent prior years, with the orderbook currently standing at under 10% of the existing fleet. Within this figure, there is broad consensus that a meaningful number of these vessels will be delayed and/or may never be built, given the state of construction of the vessels themselves and/or financial situation in part due to an improving macroeconomic environment. Drybulk trade, which tends to be correlated to Global GDP, is expected to improve by over 2%, driven by increased flows in iron ore, coal, and minor bulks.
Critical Accounting Policies and Estimates
The discussion and analysis of our financial condition and results of operations is based upon our consolidated financial statements, which have been prepared in accordance with accounting principles generally accepted in the United States (“U.S. GAAP” or “GAAP”). The preparation of those financial statements requires us to make estimates and judgments that affect the reported amounts of assets and liabilities, revenues and expenses and related disclosure of contingent assets and liabilities at the date of our financial statements. Actual results may differ from these estimates under different assumptions and conditions.
Critical accounting policies are those that reflect significant judgments of uncertainties and potentially result in materially different results under different assumptions and conditions. We have described below what we believe are our most critical accounting policies, because they generally involve a comparatively higher degree of judgment in their application. For a description of all our accounting policies, see Note 4. “Significant Accounting Policies” to our consolidated financial statements included herein.
Revenue Recognition
Revenues are generated from time charters, voyage charters and commercial pool arrangements. Time charter revenues are recognized on a straight-line basis over the term of the respective time charter agreements as service is provided. Voyage revenues for cargo transportation are recognized ratably over the estimated relative transit time of each voyage. Voyage revenue is deemed to commence upon the completion of discharge of the previous charterer’s cargo and is deemed to end upon the completion of discharge of the current cargo, provided an agreed non-cancelable charter between the Company and the charterer is in existence, the charter rate is fixed and determinable, and collectability is reasonably assured. Revenue under voyage charters will not be recognized until a charter has been agreed even if the vessel has discharged its previous cargo and is proceeding to an anticipated port of loading.
Revenues generated from time charters linked to the Baltic Supramax index and/or revenues generated from profit sharing arrangements are recognized over the term of the respective time charter agreements as service is provided and the profit sharing is fixed and determinable.
For the Company’s vessel operating in a Commercial Pool, revenues and voyage expenses are pooled and allocated to each pool participant under a time charter agreement basis in accordance with an agreed-upon formula. The formula in the pool agreement for allocating gross shipping revenues net of voyage expenses is based on points allocated to participants’ vessels based on cargo carrying capacity and other technical characteristics, such as speed and fuel consumption. We currently have one vessel operating in a commercial pool.
In May 2014, the FASB issued Accounting Standards Update (“ASU”) No. 2014-09, Revenue from Contracts with Customers (“ASU 2014-09”), which supersedes nearly all existing revenue recognition guidance under U.S. GAAP. The core principle is that a company should recognize revenue when promised goods or services are transferred to customers in an amount that reflects the consideration to which an entity expects to be entitled for those goods or services. ASU 2014-09 defines a five-step process to achieve this core principle and, in doing so, more judgment and estimates may be required within the revenue recognition process than are required under existing U.S. GAAP. The standard is effective for annual periods beginning after December 15, 2017, and interim periods therein, and shall be applied either retrospectively to each period presented or as a cumulative-effect adjustment as of the date of adoption. In May 2016, the FASB issued Accounting Standards Update No. 2016-12, Revenue from Contracts with Customers. This update provides further guidance on applying collectability criterion to assess whether the contract is valid and represents a substantive transaction on the basis whether a customer has the ability and intention to pay the promised consideration. The requirements of this standard include an increase in required disclosures. Management has not yet selected a transition method and is currently analyzing the impact of the adoption of this guidance on the Company’s consolidated financial statements, including assessing changes that might be necessary to information technology systems, processes and internal controls to capture new data and address changes in financial reporting. The Company believes that the adoption of the standard will impact the timing of recognition of revenue.
Performance Claims
Revenue is based on contracted charter parties, including spot-market related time charters for which rates fluctuate based on changes in the spot market. However, there is always the possibility of dispute over terms and payment of hires and freights. In particular, disagreements may arise as to the responsibility for third party costs incurred by the customer and revenue due to us as a result. Additionally, there are certain performance parameters included in contracted charter parties, which if not met, can result in customer claims. Accordingly, we periodically assess the recoverability of amounts outstanding and estimate a provision if there is a possibility of non-recoverability. At each balance sheet date, we provide a provision based on a review of all outstanding charter receivables. Although we believe our provisions to be reasonable at the time they are made, it is possible that an amount under dispute is not ultimately recovered and the estimated provision for doubtful accounts is inadequate.
Vessel Lives and Impairment
Historically, we depreciated our dry bulk vessels on a straight-line basis over their estimated useful lives, estimated to be 28 years from date of initial delivery from the shipyard to the original owner. Depreciation is based on cost less the estimated residual salvage value. Salvage, or scrap, value is based upon a vessel's lightweight tonnage ("lwt") multiplied by a scrap rate. Historically, we used a scrap rate of $150 per lwt, to compute each vessel's salvage value. However, when regulations place limitations over the ability of a vessel to trade on a worldwide basis, the vessel's useful life is adjusted to end at the date such regulations become effective. An increase in the useful life of a dry bulk vessel or in its salvage value has the effect of decreasing the annual depreciation charge and extending it into later periods. A decrease in the useful life of a dry bulk vessel or in its salvage value has the effect of increasing the annual depreciation charge.
On the Effective Date, as part of fresh-start reporting, we revalued our vessel assets, which resulted in a decrease in vessel assets and drydocking assets. Effective October 16, 2014, the Successor estimates the useful life of the Company's vessels to be 25 years from the date of initial delivery from the shipyard to the original owner. The change in the estimated useful life results in an increase in depreciation expense over the remaining life of the vessel assets. In addition, on the Effective Date, the Company increased the estimated scrap value of the vessels from $150 per lwt to $300 per lwt prospectively based on the 15-year average scrap value of steel. The change in the estimated scrap value results in a decrease in depreciation expense over the remaining life of the vessel assets.
The carrying values of the Company's vessels may not represent their fair market value at any point in time since the market prices of second-hand vessels tend to fluctuate with changes in charter rates and the cost of new buildings. Historically, both charter rates and vessel values tend to be cyclical. We evaluate the carrying amounts and periods over which long-lived assets are depreciated to determine if events have occurred which would require modification to their carrying values or useful lives. In evaluating useful lives and carrying values of long-lived assets, we review certain indicators of potential impairment, such as vessel sales and purchases, business plans and overall market conditions.
We follow FASB Accounting Standards Codification (“ASC”) subtopic 360-10, “Property, Plant and Equipment” (“ASC 360-10”) which requires impairment losses to be recorded on long-lived assets used in operations when indicators of impairment are present and the undiscounted cash flows estimated to be generated by those assets are less than their carrying amounts.
If indicators of impairment are present, we perform an analysis of the undiscounted projected net operating cash flow for each vessel and compare it to the vessel’s carrying value. This assessment is made at the individual vessel level since separately identifiable cash flow information for each vessel is available. In developing estimates of future cash flows, the Company must make assumptions about future charter rates, ship-operating expenses, and the estimated remaining useful lives of the vessels. These assumptions are based on historical trends as well as future expectations. Specifically, we utilize the rates currently in effect for the duration of their current time charters, without assuming additional profit sharing. For periods of time where our vessels are not fixed on time charters, we utilize an estimated daily time charter equivalent for our vessels’ unfixed days based on the last twenty five years of historical average of one to three years’ time charters. Actual equivalent dry bulk shipping rates are currently lower than the estimated rate. We believe current rates have been driven by short-term disruptions in demand and a slowdown in the availability of global credit. The projected net operating cash flows are determined by considering the future charter revenues from existing time charters for the fixed fleet days and an estimated daily time charter equivalent for the unfixed days over the estimated remaining life of the vessel, assumed to be 25 years from the delivery of the vessel from the shipyard, reduced by brokerage commissions, expected outflows for vessels’ maintenance and vessel operating expenses (including planned drydocking and special survey expenditures) and capital expenditures adjusted annually for inflation.
Of the inputs that the Company uses for its impairment analysis, future time charter rates are the most significant and most volatile. Historical twenty five year blended average of one and three year charter rates used in our impairment test are in line with the shipping cycle and the age of our vessels. In periods/years of depressed charter rates; they reflect the full operating history of vessels of the same type and particulars with our operating fleet and they cover the full life cycle of our vessels. Our vessels remain fully utilized and have a relatively long average remaining useful life of approximately 16.3 years in which to provide sufficient cash flows on an undiscounted basis to recover their carrying values as of December 31, 2016. Management will continue to monitor developments in charter rates in our participatory markets with respect to the expectation of future rates over an extended period.
A comparison of the average estimated daily time charter equivalent rate used in our impairment analysis with the average break even rate at which the undiscounted cash flows for all of our vessels will be lower than their carrying value as of December 31, 2016 (“average break even rate”) for our vessels is presented below:
|
Vessel Class |
Average estimated daily time charter rate used |
Percentage decline from average estimated daily time charter rate used in impairment test at which point impairment would be recorded |
||||||
|
Supramax |
$ | 11,742 | (29.7 |
)% | ||||
For the purpose of presenting our investors with additional information to determine how the Company’s future results of operations may be impacted in the event that daily time charter rates do not improve from their current levels in future periods, we set forth in the table below analysis that shows the 1 year, 3 year, 5 year and 10 year averages blended rates and the effect of the use of each of these rates would have on the Company’s impairment analysis:
|
Incremental number of vessels |
Potential Incremental Impairment (in millions) |
|||||||
|
1 year historical average |
22 | $ | 181.0 | |||||
|
3 year historical average |
5 | 44.8 | ||||||
|
5 year historical average |
1 | 9.0 | ||||||
|
10 year historical average |
- | - | ||||||
Management does not believe that one year, three year, and five year historical average is reflective of the cyclical nature of shipping business, which tends to have cycles much longer than one, three or five years.
We determined that as of December 31, 2016, the future income streams expected to be earned by our fleet over their remaining operating lives on an undiscounted basis would be sufficient to recover their carrying values, with the exception of sixteen of our vessels. We have begun a fleet renewal strategy, which has been made possible as a result of our raising capital through private placements of our common equity in the latter part of 2016. As of December 31, 2016, as part of our fleet renewal program, management considers it probable that we will divest some of our older vessels as well as certain less efficient vessels from its fleet to achieve operating cost savings. The Company identified two groups of vessels. Group 1 vessels were selected based on the shipyard they were built and their technical specifications. The group consists of five sister ships constructed in the Dayang shipyard with 53,000 dwt. These vessels were identified by management as having poorer fuel efficiency, among other reasons, compared to their peers. The second group of 11 vessels are older than 13 years and less than 53,000 dwt. As vessels get older, they become more expensive to maintain and drydock. Additionally, our strategy entails trading larger Ultramax vessels as we renew our fleet. For those sixteen vessels, we project that it is probable that such vessels will be sold within the next two years. Based on our projected undiscounted cash flows prior to sale, factoring the probability of sale, such vessels were determined to be impaired, and written down to their current fair value as of December 31, 2016, which was determined by obtaining broker quotes from two unaffiliated shipbrokers. As a result, we recorded an impairment charge of $122,860,600 in the fourth quarter of 2016. The carrying value of these vessels prior to impairment was $234,860,600. In addition to the above, in 2015, we identified six vessels as probable sales, and recognized an impairment charge in 2015 of $50,872,734. As the value of such vessels further declined in the first quarter of 2016, we recorded an additional impairment charge of $6,167,262 in that quarter. Out of the six vessels initially identified in 2015, four vessels were sold and two vessels have been reclassified to assets held for sale as of December 31, 2016 and subsequently sold.
Although management believes that the assumptions used to evaluate potential impairment are reasonable and appropriate, such assumptions are highly subjective. Charter rates may remain at depressed levels for some time, which could adversely affect our revenue and profitability, and future assessments of vessel impairment. In the event that any future impairment were to occur, we would determine the fair value of the related asset and record a charge to operations calculated by comparing the asset's carrying value to its estimated fair value. We estimate fair value primarily through the use of third party valuations performed on an individual vessel basis. Such valuations are not necessarily the same as the amount any vessel may bring upon sale, which may be more or less, and should not be relied upon as such.
The table set forth below indicates the carrying value of each of our vessels as of December 31, 2016 and 2015 prior to impairment, which we believe based on broker quotes recently obtained have a basic charter free market value below its carrying value. Noted below the table is the aggregate difference between the carrying value and the basic market value, which represents the approximate amount by which we believe we would have to reduce our net income if we sold all of such vessels excluding commissions as of December 31, 2016, on industry standard terms, in cash transactions, and to a willing buyer where we are not under any compulsion to sell, and where the buyer is not under any compulsion to buy. Additionally, given the current dynamic in the dry bulk market, were we to sell a vessel, we might not be able to realize proceeds consistent with the amounts disclosed below.
|
Dwt |
Year Purchased |
Carrying Value* as of December 31, 2016 |
Carrying Value* as of December 31, 2015 |
||||||||
|
Dry bulk Vessels |
|||||||||||
|
AVOCET |
53,462 | 2010 |
$18.0 million* |
$18.9 million* |
|||||||
|
BITTERN |
57,809 | 2009 |
$17.9 million* |
$18.8 million* |
|||||||
|
CANARY |
57,809 | 2009 |
$18.0 million* |
$18.8 million* |
|||||||
|
CARDINAL |
55,362 | 2005 |
$15.4 million* |
$16.5 million* |
|||||||
|
CONDOR |
50,296 | 2005 |
$12.7 million* |
$12.3 million* |
|||||||
|
CRANE |
57,809 | 2010 |
$19.1 million* |
$20.2 million* |
|||||||
|
CRESTED EAGLE |
55,989 | 2009 |
$21.6 million* |
$22.7 million* |
|||||||
|
CROWNED EAGLE |
55,940 | 2008 |
$20.3 million* |
$21.3 million* |
|||||||
|
EGRET BULKER |
57,809 | 2010 |
$19.1 million* |
$20.0 million* |
|||||||
|
GANNET BULKER |
57,809 | 2010 |
$18.9 million* |
$19.8 million* |
|||||||
|
GOLDEN EAGLE |
55,989 | 2010 |
$22.9 million* |
$24.0 million* |
|||||||
|
GOLDENEYE |
52,421 | 2008 |
$12.9 million* |
$14.0 million* |
|||||||
|
GREBE BULKER |
57,809 | 2010 |
$18.9 million* |
$19.8 million* |
|||||||
|
HAWK I |
50,296 | 2005 |
$12.7 million* |
$12.9 million* |
|||||||
|
IBIS BULKER |
57,775 | 2010 |
$18.9 million* |
$19.8 million* |
|||||||
|
IMPERIAL EAGLE |
55,989 | 2010 |
$22.9 million* |
$24.0 million* |
|||||||
|
JAEGER |
52,248 | 2006 |
$14.3 million* |
$15.2 million* |
|||||||
|
JAY |
57,802 | 2010 |
$18.9 million* |
$19.8 million* |
|||||||
|
KESTREL |
50,326 | 2006 |
$14.7 million* |
$15.7 million* |
|||||||
|
KINGFISHER |
57,776 | 2010 |
$18.9 million* |
$19.8 million* |
|||||||
|
MARTIN |
57,809 | 2010 |
$18.9 million* |
$19.8 million* |
|||||||
|
MERLIN |
50,296 | 2005 |
$11.9 million* |
$12.9 million* |
|||||||
|
NIGHTHAWK |
57,809 | 2012 |
$19.9 million* |
$20.8 million* |
|||||||
|
ORIOLE |
57,809 | 2012 |
$19.9 million* |
$20.8 million* |
|||||||
|
OSPREY I |
50,206 | 2005 |
$12.8 million* |
$13.8 million* |
|||||||
|
OWL |
57,809 | 2012 |
$19.9 million* |
$20.8 million* |
|||||||
|
PETREL BULKER |
57,809 | 2012 |
$19.9 million* |
$20.8 million* |
|||||||
|
PUFFIN BULKER |
57,809 | 2012 |
$19.9 million* |
$20.8 million* |
|||||||
|
ROADRUNNER BULKER |
57,809 | 2012 |
$19.9 million* |
$20.8 million* |
|||||||
|
SANDPIPER BULKER |
57,809 | 2012 |
$19.9 million* |
$20.8 million* |
|||||||
|
SHRIKE |
53,343 | 2007 |
$14.1 million* |
$15.1 million* |
|||||||
|
SKUA |
53,350 | 2007 |
$14.1 million* |
$15.1 million* |
|||||||
|
STELLAR EAGLE |
55,989 | 2009 |
$21.6 million* |
$22.7 million* |
|||||||
|
STAMFORD EAGLE |
61,530 | 2016 |
$18.9 million |
- | |||||||
|
TERN |
50,200 | 2006 |
$13.8 million* |
$14.9 million* |
|||||||
|
THRASHER |
53,360 | 2010 |
$18.0 million* |
$18.9 million* |
|||||||
|
THRUSH |
53,297 | 2012 |
$18.8 million* |
$19.6 million* |
|||||||
|
WOODSTAR |
53,390 | 2008 |
$15.6 million* |
$16.3 million* |
|||||||
|
WREN |
53,349 | 2008 |
$15.6 million* |
$16.3 million* |
|||||||
|
Total DWT |
2,260,943 | ||||||||||
|
|
*Indicates dry bulk carriers for which we believe, as of December 31, 2016 and 2015, the basic charter-free market value is lower than the vessel’s carrying value. We believe that the aggregate carrying value of these vessels exceed their December 31, 2016 and December 31, 2015 aggregate basic charter-free market value by approximately $180 million and $348 million, respectively. During the year ended December 31, 2016 we have recorded an impairment charge of $129.0 million on twenty two of our vessels. At December 31, 2015, we have recorded an impairment charge of $50.8 million on six of our vessels. Such impairments have not been reflected in the above table. |
Deferred Drydock Cost
There are two methods that are used by the shipping industry to account for drydockings: (a) the deferral method where drydock costs are capitalized when incurred and amortized over the period to the next scheduled drydock; and (b) expensing drydocking costs in the period it is incurred. We use the deferral method of accounting for drydock expenses. Under the deferral method, drydock expenses are capitalized and amortized on a straight-line basis until the next drydock, which we estimate to be a period of two to five years. We believe the deferral method better matches costs with revenue than expensing the costs as incurred. We use judgment when estimating the period between drydocks performed, which can result in adjustments to the estimated amortization of drydock expense. If the vessel is disposed of before the next drydock, the remaining balance in deferral drydock is written-off to the gain or loss upon disposal of vessels in the period when contracted. We expect that our vessels will be required to be drydocked approximately every 30 months for vessels older than 15 years and 60 months for vessels younger than 15 years.
Costs capitalized as part of the drydocking include direct costs that are incurred as part of the drydocking to meet regulatory requirements, or are expenditures that add economic life to the vessel, increase the vessel’s earnings capacity or improve the vessel’s efficiency. Direct costs include the shipyard costs, parts, inspection fees, steel, blasting and painting. Expenditures for normal maintenance and repairs, whether incurred as part of the drydocking or not, are expensed as incurred. Unamortized drydocking costs are written off as drydocking expense if the vessels are drydocked earlier than the applicable amortization period.
Vessel Acquisitions
Where we identify any intangible assets or liabilities associated with the acquisition of a vessel, we record all identified tangible and intangible assets or liabilities at fair value. Fair value is determined by reference to market data and the amount of expected future cash flows. We value any asset or liability arising from the market value of the time charters assumed when an acquired vessel is delivered to us.
Where we have assumed an existing charter obligation or enter into a time charter with the existing charterer in connection with the purchase of a vessel at charter rates that are less than market charter rates, we record a liability in fair value below contract value of time charters acquired based on the difference between the assumed charter rate and the market charter rate for an equivalent vessel. Conversely, where we assume an existing charter obligation or enter into a time charter with the existing charterer in connection with the purchase of a vessel at charter rates that are above market charter rates, we record an asset in fair value above contract value of time charters acquired, based on the difference between the market charter rate and the contracted charter rate for an equivalent vessel. This determination is made at the time the vessel is delivered to us, and such assets and liabilities are amortized to revenue over the remaining period of the charter. The determination of the fair value of acquired assets and assumed liabilities requires us to make significant assumptions and estimates of many variables including market charter rates, expected future charter rates, future vessel operation expenses, the level of utilization of our vessels and our weighted average cost of capital. The use of different assumptions could result in a material change in the fair value of these items, which could have a material impact on our financial position and results of operations. In the event that the market charter rates relating to the acquired vessels are lower than the contracted charter rates at the time of their respective deliveries to us, our net earnings for the remainder of the terms of the charters may be adversely affected although our cash flows will not be so affected.
Insurance Claims
Insurance claims are recorded on an accrual basis and represent the claimable expenses, net of deductibles, incurred through each balance sheet date, which are expected to be recovered from insurance companies.
Deferred Financing Costs
Fees incurred for obtaining new loans or refinancing existing loans are deferred and amortized to interest expense over the life of the related debt using the effective interest method. Unamortized deferred financing costs are written off when the related debt is repaid, or there is a reduction in the facility, and such amounts are expensed in the period the repayment or refinancing is made.
Results of Operations for Successor (years ended December 31, 2016 and 2015 and the period between October 16, 2014 and December 31, 2014) and for Predecessor (the period between January 1, 2014 and October 15, 2014)
Factors Affecting our Results of Operations
The following tables represent the operating data and certain financial statement data for the years ended December 31, 2016, 2015 and the period between October 16, 2014 and December 31, 2014 (Successor) and the period between January 1, 2014 and October 15, 2014 (Predecessor) on a consolidated basis. The period from January 1, 2014 to October 15, 2014 (Predecessor) and the period from October 16, 2014 to December 31, 2014 (Successor) are distinct reporting periods because of our emergence from bankruptcy on October 15, 2014. The application of fresh-start reporting significantly affected certain assets, liabilities and expenses. As a result, certain financial information at and for any period after October 16, 2014 is not comparable to financial information for the Predecessor. Therefore, we did not combine financial information in the period January 1, 2014 to October 15, 2014 (Predecessor) and the period from October 16, 2014 to December 31, 2014 (Successor) for comparison to other periods. Our results have been separated by a vertical line to identify these different bases of accounting. We also did not compare the share and per share amounts, since the change in our capital structure because of the bankruptcy renders these not comparable between the Successor and the Predecessor.
We believe that the important measures for analyzing future trends in our results of operations consist of the following:
|
Successor |
Predecessor |
|||||||||||||||
|
2016 |
2015 |
October 16, 2014 to December 31, 2014 |
January 1, 2014 to October 15, 2014 |
|||||||||||||
|
Ownership Days |
15,408 | 16,186 | 3,465 | 12,960 | ||||||||||||
|
Chartered-in Days |
1,494 | 382 | 77 | 14 | ||||||||||||
|
Total |
16,902 | 16,568 | 3,542 | 12,974 | ||||||||||||
|
Available Days |
16,695 | 16,151 | 3,493 | 12,832 | ||||||||||||
|
Operating Days |
16,485 | 15,766 | 3,397 | 12,592 | ||||||||||||
|
Fleet Utilization |
98.7 |
% |
97.6 |
% |
97.3 | % | 98.1 | % | ||||||||
|
● |
Ownership days: We define ownership days as the aggregate number of days in a period during which each vessel in our fleet has been owned by us. Ownership days are an indicator of the size of our fleet over a period and affect both the amount of revenues and the amount of expenses that we record during a period. |
|
● |
Chartered-in Days: The Company defines chartered-in days as the aggregate number of days in a period during which the Company chartered-in vessels. |
|
● |
Available days: We define available days as the number of our ownership days less the aggregate number of days that our vessels are off-hire due to vessel familiarization upon acquisition, scheduled repairs or repairs under guarantee, vessel upgrades or special surveys and drydockings, and the aggregate amount of time that we spend positioning our vessels. The shipping industry uses available days to measure the number of days in a period during which vessels should be capable of generating revenues. We drydocked four vessels in the period January 1, 2014 through October 15, 2014, three vessels in the period October 16, 2014 through December 31, 2014, nineteen vessels in 2015 and nine vessels in 2016. |
|
● |
Operating days: We define operating days as the number of our available days in a period less the aggregate number of days that our vessels are off-hire due to any reason, including unforeseen circumstances. The shipping industry uses operating days to measure the aggregate number of days in a period during which vessels actually generate revenues. |
|
● |
Fleet utilization: We calculate fleet utilization by dividing the number of our operating days during a period by the number of our available days during the period. The shipping industry uses fleet utilization to measure a company's efficiency in finding suitable employment for its vessels and minimizing the amount of days that its vessels are off-hire for reasons other than scheduled repairs or repairs under guarantee, vessel upgrades, special surveys or vessel positioning. Our fleet continues to perform at very high utilization rates. |
Time Charter and Voyage Revenue
Shipping revenues are highly sensitive to patterns of supply and demand for vessels of the size and design configurations owned and operated by a company and the trades in which those vessels operate. In the dry bulk sector of the shipping industry, rates for the transportation of dry bulk cargoes such as ores, grains, steel, fertilizers, and similar commodities, are determined by market forces such as the supply and demand for such commodities, the distance that cargoes must be transported, and the number of vessels expected to be available at the time such cargoes need to be transported. The demand for shipments is significantly affected by the state of the global economy and in discrete geographical areas. The number of vessels is affected by newbuilding deliveries and by the removal of existing vessels from service, principally because of scrapping.
The mix of charters between spot or voyage charters and mid-term time charters also affects revenues. Because the mix between voyage charters and time charters significantly affects shipping revenues and voyage expenses, vessel revenues are benchmarked based on TCE. TCE comprises revenue from vessels operating on time charters, and voyage revenue less voyage expenses from vessels operating on voyage charters in the spot market. TCE serves as a measure of analyzing fluctuations between financial periods and as a method of equating revenue generated from a voyage charter to time charter revenue. TCE also serves as an industry standard for measuring revenue and comparing results between geographical regions and among competitors.
The following table represents the reconciliation of TCE for the Successor for the years ended December 31, 2016 and 2015, and for the period between October 16, 2014 and December 31, 2014 and for the period between January 1, 2014 and October 15, 2014 for the Predecessor.
|
Successor |
Predecessor |
|||||||||||||||
|
2016 |
2015 |
October 16, 2014 to December 31, 2014 |
January 1, 2014 to October 15, 2014 |
|||||||||||||
|
Revenue, Net |
$ | 124,492,844 | $ | 103,856,876 | $ | 31,089,603 | $ | 123,150,214 | ||||||||
|
Voyage Expenses |
42,093,714 | 23,832,457 | 6,262,082 | 14,703,850 | ||||||||||||
|
Time charter equivalent |
82,399,130 | 80,024,419 | 24,827,521 | 108,446,364 | ||||||||||||
|
% of TCE from |
||||||||||||||||
|
Time charter |
64 | % | 76 | % | 65 | % | 76 | % | ||||||||
|
Voyage charter |
35 | % | 6 | % | 6 | % | 3 | % | ||||||||
|
Commercial pool |
1 | % | 18 | % | 29 | % | 21 | % | ||||||||
Our economic decisions are based on anticipated TCE rates and we evaluate financial performance based on TCE rates achieved. Our revenues are driven primarily by the number of vessels in our fleet, the number of days during which our vessels operate and the amount of the daily TCE that our vessels earn under charters, which, in turn, are affected by a number of factors, including:
|
● |
the duration of our charters; |
|
● |
our decisions relating to vessel acquisitions and disposals; |
|
● |
the amount of time that we spend positioning our vessels; |
|
● |
the amount of time that our vessels spend in drydock undergoing repairs; |
|
● |
maintenance and upgrade work; |
|
● |
the age, condition and specifications of our vessels; |
|
● |
levels of supply and demand in the dry bulk shipping industry; and |
|
● |
other factors affecting spot market charter rates for dry bulk carriers. |
Our revenues for the years ended December 31, 2016 and 2015 and the period between October 16, 2014 and December 31, 2014 (Successor) and the period between January 1, 2014 and October 15, 2014 (Predecessor) were earned from time charters, voyage charters and vessel pools. As is common in the shipping industry, we pay commissions ranging from 1.25% to 5% of the total daily charter hire rate of each charter to unaffiliated ship brokers and in-house brokers associated with the charterers, depending on the number of brokers involved with arranging the charter.
Net revenues for the year ended December 31, 2016 were $124,492,844. Net revenues for the year ended December 31, 2016 were 20% higher than net revenues for the year ended December 31, 2015, primarily due to the increase in the number of freight voyages performed and increase in available days. The charter rates year over year have remained flat. The increase in available days was due to the charter-in of vessels and the delivery of a 2016 built Ultramax 61,530 dwt vessel in the fourth quarter of 2016 offset by the sale of four vessels during 2016. Our fleet utilization increased from 97.6% during 2015 to 98.7% during 2016.
Net revenues for the Successor for the year ended December 31, 2015, and the period between October 16, 2014 and December 31, 2014 were $103,856,876 and $31,089,603, respectively. The variance is mainly because the revenue for 2014 covers only a period of two and half months after the Company’s emergence from bankruptcy. The net revenues for the Predecessor for the period between January 1, 2014 and October 15, 2014 were $123,150,214. The available days for the Predecessor period were 12,832.
Voyage Expenses
To the extent that we employ our vessels on voyage charters, we incur expenses that include bunkers, port charges, canal tolls, cargo handling operations and brokerage commissions, as these expenses are borne by the vessel owner on voyage charters. Bunkers, port charges, and canal toll expenses primarily increase in periods during which vessels are employed on voyage charters.
Voyage expenses for the year ended December 31, 2016 were $42,093,714, compared with $23,832,457 for the year ended December 31, 2015. Voyage expenses have primarily increased due to an increase in bunker prices as well as an increased number of freight voyages performed in the current year compared to the prior year.
Voyage expenses for the year ended December 31, 2015 were $23,832,457, compared with $6,262,082 for the period between October 16, 2014 and December 31, 2014 for the Successor. Our voyage expenses were lower in the successor period in 2014 because it covers only two and half months after the Company’s emergence from bankruptcy. Voyage expenses were $14,703,850 for the period between January 1, 2014 and October 15, 2014 for the Predecessor. Voyage expenses for the Predecessor consist of bunker consumption, port costs and canal dues mainly on the voyage charters we performed during the period.
Vessel Expenses
Vessel expenses include expenses relating to vessel operations, general vessel maintenance, regulatory and classification society compliance, crewing costs, repairs, stores, supplies, spare parts and technical consultants.
Vessel operating expenses for the year ended December 31, 2016 were $74,016,763, which represents a decrease of $12,312,297 compared with $86,329,060 for the year ended December 31, 2015. The lower vessel expenses are attributable to the efficiencies achieved through in-house technical management of vessels as well as sale of the Falcon, Harrier,Peregrine and Kittiwake during 2016, and the sale of the Kite during 2015 offset by the purchase of a 2016 built Ultramax 61,530 dwt vessel in the fourth quarter of 2016.
Vessel operating expenses for the Successor for the year ended December 31, 2015 were $86,329,060 and $17,331,575 for the period between October 16, 2014 and December 31, 2014. The decrease in vessel expenses is mainly due to less number of owned days in the Successor period in 2014 compared to 2015. Vessel operating expenses for the Predecessor were $71,679,034 for the period between January 1, 2014 and October 15, 2014. Vessel operating expenses for the Predecessor include crew wages and related costs, the cost of insurance, expenses relating to repairs and maintenance, the cost of spares and consumable stores, tonnage taxes and other miscellaneous vessel expenses.
We believe daily vessel operating expenses are a good measure for comparative purposes over a 12-month period in order to take into account all of the expenses that each vessel in our fleet will incur over a full year of operation.
Average daily vessel operating expenses for our fleet decreased by $528 per day to $4,803 during 2016 as compared to $5,331 in 2015. The decrease in daily vessel operating expenses was primarily due to lower vessel insurance and cost of lubes.
Insurance expense varies with overall insurance market conditions as well as the insured's loss record, level of insurance and desired coverage. The main insurance expenses include hull and machinery insurance (i.e. asset insurance) costs, Protection, and Indemnity ("P & I") insurance (i.e. liability insurance) costs. Certain other insurances, such as basic war risk premiums based on voyages into designated war risk areas are often for the account of the charterers for time charter voyages and on owners’ account for voyage charters.
Our vessel expenses, which generally represent costs under the vessel operating budgets, cost of insurance and vessel registry and other regulatory fees, will increase with the enlargement of our fleet. Other factors beyond our control, some of which may affect the shipping industry in general, may also cause these expenses to increase, including, for instance, developments relating to market prices for crew, insurance and petroleum-based lubricants and supplies.
Charter Hire Expense
The charter hire expenses for the year ended December 31, 2016 were $12,845,468 compared to $4,125,766 for the year ended December 31, 2015. The increase in charter hire expense in 2016 compared with 2015 was principally the result of the delivery of a 63,000 dwt new building vessel in May 2016 for a period of nine to fourteen months and a 61,000 dwt new building vessel that was delivered in July 2016 for a period of eleven to thirteen months. In addition, the Company chartered in vessels on a short-term basis as needed. The total charter in days for the year ended December 31, 2016 were 1,494 compared to 382 for the year ended December 31, 2015.
The charter hire expenses for the Successor for the year ended December 31, 2015 and for the period between October 16, 2014 and December 31, 2014 were $4,125,766 and $1,042,760, respectively. The increase in charter hire expense for the Sucessor was primarily due to less number of chartered-in days in the Successor period in 2014 compared to 2015. In addition, the Company charters in vessels on a short-term basis as needed. The charter hire expenses for the Predecessor for the period between January 1, 2014 and October 15, 2014 were $188,233.
Depreciation and Amortization
We depreciate the cost of our vessels on a straight-line basis over the expected useful life of each vessel. Depreciation is based on the cost of the vessel less its estimated residual value. We estimate the useful life of our vessels to be 25 years from the date of initial delivery from the shipyard to the original owner. On October 15, 2014, as part of fresh-start reporting, we revalued our vessels, which resulted in a decrease in vessel assets and drydocking assets. On October 15, 2014, we also increased the estimated scrap value of our vessels from $150/lwt to $300/lwt, which results in an overall decrease in vessels depreciation expense over the remaining life of the vessels.
Depreciation and amortization expenses for the year ended December 31, 2016 were $38,884,322, which represents a decrease of $4,116,419 compared with $43,000,741 for the year ended December 31, 2015. The decrease was substantially due to the operation of a smaller fleet resulting from the sale of four vessels in 2016, impairment of six vessels in 2015 reducing the depreciation base and sale of one vessel in 2015 offset by an increase in drydock amortization and the addition of a 2016 built Ultramax 62,350 dwt vessel in the fourth quarter of 2016. Total depreciation and amortization expenses for the year ended December 31, 2016 includes $35,556,911 of depreciation and $3,327,411 of amortization of deferred drydocking costs. Total depreciation and amortization expense for the year ended December 31, 2015 includes $41,044,397 of depreciation and $1,956,344 of amortization of deferred drydocking costs.
Depreciation and amortization expenses for the Successor for the year ended December 31, 2015 and the period between October 16, 2014 and December 31, 2014 were $43,000,741 and $8,781,846, respectively. Depreciation and amortization expenses for the Predecessor for the period between January 1, 2014 and October 16, 2014 were $61,238,760. As a result of the Company’s emergence from bankruptcy and application of fresh start accounting starting October 16, 2014, the Predecessor’s depreciation and amortization is not comparable to the Successor’s.
Drydocking relates to our regularly scheduled maintenance program necessary to preserve the quality of our vessels as well as to comply with international shipping standards and environmental laws and regulations. Management anticipates that vessels are to be drydocked every two and a half years for vessels older than 15 years and every five years for vessels younger than 15 years, accordingly, these expenses are deferred and amortized over that period.
General and Administrative Expenses
Our general and administrative expenses include onshore vessel administration related expenses such as technical management, legal and professional expenses and recurring administrative and other expenses including payroll and expenses relating to our executive officers and office staff, office rent and expenses, directors fees, and directors and officers insurance. General and administrative expenses also include non-cash compensation expenses.
We historically entered into technical management agreements for some of our vessels with independent technical managers. On August 24, 2015, the Company provided three months’ notice to V. Ships Limited to terminate the technical management contract. The Company completed the transfer of all vessels to in-house technical management during the first quarter of 2016. The technical management fees for the Successor of $229,062 for the year ended December 31, 2016, $6,110,489 for the year ended December 31, 2015, $1,247,629 for the period between October 16, 2014 and December 31, 2014 and $4,714,821 for the period between January 1, 2014 and October 15, 2014 for the Predecessor is recorded as a component of general and administrative expenses.
General and administrative expenses for the years ended December 31, 2016 and 2015 were $22,905,802 and $25,537,007, respectively. The decrease in General and administrative expenses in 2016 was primarily attributable to lower office lease expense, advisers fees, non-cash compensation expenses and third party technical manager fees offset by lower third party management fees received due to the cancellation of the management agreement with Delphin Shipping LLC.
General and administrative expenses for the year ended December 31, 2015 were $25,537,007, for the period between October 16, 2014 and December 31, 2014 (Successor) were $5,933,011 and were $18,679,265 for the period between January 1, 2014 and October 15, 2014 (Predecessor), respectively.
General and administrative expenses include non-cash compensation charges of $2,206,690 and $3,969,989, respectively, for the years ended December 31, 2016 and 2015. General and administrative expenses include non-cash compensation charges of $2,121,505 and $1,072,383, respectively, for the period between October 16, 2014 and December 31, 2014 (Successor) and for the period between January 1, 2014 and October 15, 2014 (Predecessor). These non-cash compensation charges relate to the stock options and restricted stock units granted to members of management and certain directors of the Company under the Stock Incentive Plans (see Note 15 “Stock Incentive Plans” in the consolidated financial statements).
Interest and Finance Costs
Interest Expense, inclusive of the Payment In Kind loans (“PIK loans”) and Debtor-in-possession loans (“DIP loans”), consisted of:
|
Successor |
Predecessor |
|||||||||||||||
|
2016 |
2015 |
October 16, 2014 To December 31, 2014 |
January 1, 2014 To October 15, 2014 |
|||||||||||||
|
First Lien Facility / Exit Financing Facility Interest |
$ | 9,938,822 | $ | 9,781,106 | $ | 2,103,151 | $ | - | ||||||||
|
Amortization of Debt issuance costs |
4,532,481 | 2,146,316 | 256,175 | - | ||||||||||||
|
Payment-in-Kind interest on Second Lien Facility |
7,327,843 | |||||||||||||||
|
Term loan Interest |
- | - | 43,314,831 | |||||||||||||
|
Amortization of Term Loan Deferred Financing Costs |
- | - | - | 16,278,544 | ||||||||||||
|
Debtor-In-Possession (“DIP”) Interest |
- | - | - | 394,096 | ||||||||||||
|
Write off of DIP Deferred Financing Costs |
- | - | - | 750,000 | ||||||||||||
|
Total Interest Expense |
$ | 21,799,146 | $ | 11,927,422 | $ | 2,359,326 | $ | 60,737,471 | ||||||||
Interest paid amounted to $10,257,766 in 2016, $9,911,793 in 2015, $10,886,687 from January 1, 2014 to October 15, 2014 and $1,586,303 from October 16, 2014 to December 31, 2014.
For 2016, interest rates on our outstanding debt ranged from 3.86% to 4.99%, including a margin over LIBOR applicable under the terms of the First Lien Facility. The weighted average effective interest rate including the amortization of debt discount for this period was 6.83%.
For 2015, interest rates on our outstanding debt ranged from 3.696% to 4.08%, including a margin over LIBOR applicable under the terms of the amended credit facility for the Successor. The weighted average effective interest rate including the amortization of debt discount for this period was 5.06%.
For the period between October 16, 2014 and December 31, 2014, interest rates on our outstanding debt ranged from 4.03% to 6.0%, including a margin over LIBOR applicable under the terms of the amended credit facility for the Successor. The weighted average effective interest rate was 4.13% for the Successor.
For the period between January 1, 2014 and October 15, 2014, interest rates on our outstanding debt ranged from 3.63% to 7.40%, including a margin over LIBOR applicable under the terms of the amended credit facility for the Predecessor. The weighted average effective interest rate was 2.93% for the Predecessor.
For 2016 and 2015, Commitment fees of 40% of the margin on the undrawn portion of the First Lien Facility were incurred. Commitment fees of 0.70% were incurred on the undrawn portion of the facility for the Predecessor for the period January 1, 2014 to October 15, 2014. Commitment fees of 40% of the margin were incurred on the undrawn portion of the Exit Financing Facility for the Successor for the period October 16, 2014 to December 31, 2014.
Forward freight agreements
The Company trades in forward freight agreements (“FFAs”), with the objective of utilizing this market as economic hedging instruments that reduce the risk of specific vessels to changes in the freight market. The Company’s FFAs have not qualified for hedge accounting treatment. As such, unrealized and realized gains are recognized as a component of other expense in the Consolidated Statement of Operations. There are no open positions as of December 31, 2016.
The effect of non-designated derivative instruments on the Consolidated Statements of Operations:
|
Derivatives not designated as hedging instruments |
Location of Gain/Loss Recognized |
Successor For the year ended December 31, 2016 |
Successor For the year ended December 31, 2015 |
Successor Period from October 16, 2014 to December 31, 2014 |
Predecessor Period from January 1, 2014 to October 15, 2014 |
||||||||||||
|
FFA’s |
Other Expense |
$561,495 | -0- | -0- | -0- | ||||||||||||
Reorganization items, Net
There were no reorganization items for the years ended December 31, 2016 and 2015. The reorganization expense for the period between October 16, 2014 and December 31, 2014 (Successor) and the period between January 1, 2014 and October 15, 2014 (Predecessor) were $45,542 and $427,735,210, respectively. These reorganization items include trustee fees, professional fees incurred after the petition date in relation to the Chapter 11 cases, the revaluation of assets and liabilities recorded as part of fresh-start reporting, the gain on the settlement of liabilities subject to compromise as well as a net gain on debt and equity discharge and issuance pursuant to the Plan. See “Note 18. Bankruptcy” to the consolidated financial statements.
Effects of Inflation
The Company does not believe that inflation has had or is likely, in the near future, to have a significant impact on vessel operating expenses, drydocking expenses and general and administrative expenses.
Liquidity and Capital Resources
The following table presents the cash flow information for the years ended December 31, 2016 and 2015 and for the period between October 16, 2014 and December 31, 2014 for the Successor and for the period between January 1, 2014 and October 15, 2014 for the Predecessor.
|
Successor |
Predecessor |
|||||||||||||||
|
(in thousands of U.S. dollars) |
Year Ended December 31, 2016 |
Year Ended December 31, 2015 |
October 16, 2014 to December 31, 2014 |
January 1, 2014 to October 15, 2014 |
||||||||||||
|
Net cash used in operating activities |
$ | (45,434 | ) | $ | (43,787 | ) | $ | (279 | ) | $ | (19,465 | ) | ||||
|
Net cash (used in) / provided by investing activities |
(9,281 | ) | 10,252 | 4,206 | (491 | ) | ||||||||||
|
Net cash provided by financing activities |
106,335 | 18,456 | - | 36,322 | ||||||||||||
|
(Decrease)/increase in cash and cash equivalents |
51,620 | (15,079 | ) | 3,927 | 16,366 | |||||||||||
|
Cash and cash equivalents, beginning of year |
24,896 | 39,975 | 36,048 | 19,683 | ||||||||||||
|
Cash and cash equivalents, end of year |
$ | 76,516 | $ | 24,896 | $ | 39,975 | $ | 36,049 | ||||||||
Net cash used in operating activities during 2016 was $45,434,310, compared with net cash used in operating activities of $43,786,769 in 2015. The increase in cash flow used in operations resulted from negative working capital changes offset by lower drydock expenditures.
Net cash used in operating activities during 2015 was $43,786,769 compared with net cash used in operating activities of $279,181 for the period between October 16, 2014 and December 31, 2014 (Successor). Net cash used in operating activities was $19,464,930 for the period between January 1, 2014 and October 15, 2014 (Predecessor).
Net cash used in investing activities during 2016 was $9,280,391, compared with net cash provided by investing activities of $10,251,871 in 2015. During 2016, the Company purchased a 2016 built Ultramax for $18.85 million. In addition, the Company paid $1.9 million as an advance for acquisition of a 2017 built Ultramax. The Company took delivery of the vessel in the first quarter of 2017. The Company sold four vessels (the Falcon, Peregrine, Kittiwake and Harrier) during 2016 for net proceeds of $13.0 million during the year. In 2015, the Company received $7.8 million from the sale of its investment in Korea Line Corporation and $4.2 million from sale of one vessel (the Kite).
Net cash provided by investing activities during 2015 was $10,251,871, compared with net cash provided by investing activities of $4,205,764 for the period between October 16, 2014 to December 31, 2014 (Successor). The net cash used in investing activities was $490,665 for the period between January 1, 2014 and October 15, 2014 (Predecessor).
Net cash provided by financing activities in 2016 was $106,334,650, compared to net cash provided by financing activities of $18,455,772 in 2015. The increase in cash from financing activities is due to net proceeds from the private common stock placement closed on August 10, 2016 of $85,700,535, $60,000,000 received from our Second Lien Loan facility and $15,158,500 from the revolver under the First Lien Facility offset by repayment of $21,276,000 of our term loan and $30,158,500 of our revolver each under the First Lien Facility. The Company also paid $3,086,947 in deferred financing costs.
During 2015, we borrowed $40,000,000 from our revolving credit facility under the Exit Financing Facility and repaid $19,625,000 toward the term loan facility under the Exit Financing Facility. In August 2015, we also paid $500,000 to our lenders to amend our Exit Financing Facility and $1,419,228 to settle taxes on net share equity awards
As of December 31, 2016, our cash and cash equivalents balance was $76,516,110 compared to a cash and cash equivalents balance of $24,896,161 at December 31, 2015. In addition, our restricted cash balance includes $74,917 and $141,561 for collateralizing letters of credit relating to our office leases as of December 31, 2016 and 2015, respectively.
At December 31, 2016, the Company’s debt consisted of $209,099,000 in term loans, net of a $4,746,682 debt discount and debt issuance costs under the First Lien Facility and $67,327,843 under the Second Lien Facility net of a $15,736,617 debt discount and debt issuance costs. In addition, we have $25 million in undrawn revolver availability under the First Lien Facility.
On December 13, 2016, the Company entered into the December Stock Purchase Agreement with the Investors, pursuant to which the Company agreed to issue common shares at an initial purchase price of $4.50 per share, for aggregate gross proceeds of $100.0 million. On January 20, 2017, the Company closed its previously announced December Private Placement for aggregate gross proceeds of $100 million. The Company plans to use the proceeds from the December Private Placement for the acquisition of dry bulk tonnage and general corporate purposes. See “Note 3. Equity Offerings” to the consolidated financial statements.
On February 28, 2017, Eagle Ultraco entered into the Greenship Agreement with the Greenship Sellers for the purchase of the Greenship Vessels. Of the nine Greenship Vessels, three Greenship Vessels are subject to certain customary conditions as well as the approval of the requisite majority of the unitholders of the Greenship Sellers, which approval was obtained. The aggregate purchase price for the nine Greenship Vessels is $153.0 million. The allocated purchase price for each Greenship Vessel is $17.0 million. The Greenship Vessels are expected to be delivered charter free between April and September 2017. See Note 20. “Subsequent Events” to the consolidated financial statements.
Our principal sources of funds are operating cash flows, long-term bank borrowings and borrowings under our revolving credit facility (see “–Overview—First Lien Facility” and “–Overview—Second Lien Facility”). Our principal use of funds is capital expenditures to establish and grow our fleet, maintain the quality of our vessels, comply with international shipping standards and environmental laws and regulations, fund working capital requirements and repayments of interest on our outstanding loan facilities. See “–Overview—First Lien Facility” and “–Overview—Second Lien Facility” for additional information concerning our loan facilities.
We believe that our current financial resources, together with the undrawn revolving credit facility and cash generated from operations will be sufficient to meet our ongoing business needs and other obligations over the next twelve months. Our ability to generate sufficient cash depends on many factors beyond our control including, among other things, continuing to improve the profitability of its operations and future cash flows, which contemplates an improvement in charter rates.
Dividends
The Company did not make any dividend payments in 2016, 2015 and 2014. In the future, the declaration and payment of dividends, if any, will always be subject to the discretion of the board of directors, restrictions contained in the First Lien Facility, the Second Lien Facility, and the requirements of Marshall Islands law. The timing and amount of any dividends declared will depend on, among other things, the Company's earnings, financial condition and cash requirements and availability, the ability to obtain debt and equity financing on acceptable terms as contemplated by the Company's growth strategy, the terms of its outstanding indebtedness and the ability of the Company's subsidiaries to distribute funds to it. The Company does not currently expect to pay dividends in the near term.
Credit Agreement
Refer to Note 2. “Corporate Reorganization” and Note 9 “Debt” to our consolidated financial statements above for a summary of our credit agreements.
Contractual Obligations
The following table sets forth our expected contractual obligations and their maturity dates as of December 31, 2016:
|
(in thousands of U.S. dollars) |
Within One Year |
One to Three Years |
Three to Five Years |
More than Five Years |
Total |
|||||||||||||||
|
Bank Loans(1) |
$ | - | $ | 209,099 | $ | — | $ | — | $ | 209,099 | ||||||||||
|
Interest and borrowing fees(1) |
11,491 | 22,823 | — | — | 34,314 | |||||||||||||||
|
Second Lien Facility and interest(1) |
— | — | 102,488 | — | 102,488 | |||||||||||||||
|
Chartering agreement (2,3) |
4,928 | 9,855 | 8,704 | — | 23,487 | |||||||||||||||
|
Office lease |
577 | 881 | 926 | 728 | 3,112 | |||||||||||||||
|
Vessel acquisition (4) (5) |
16,110 | — | — | — | — | |||||||||||||||
|
Total |
$ | 33,106 | $ | 242,658 | $ | 112,118 | $ | 728 | $ | 388,610 | ||||||||||
|
|
(1) |
See Note 2 and Note 9 in the financial statements. Interest is based on Libor assumption ranging between 0.5% to 1.75%. |
|
|
(2) |
Does not include obligations of charter-in vessels less than one year. |
|
|
(3) |
On July 28, 2012, the Company entered into an agreement to charter-in a 37,000 dwt newbuilding Japanese vessel that was delivered in October 2014 for seven years with an option for additional one year. The hire rate for the 1st to 7th year is $13,500 per day and for the 8th year option is $13,750 per day. |
|
(4) |
In November 14, 2016, the Company, through the newly formed subsidiary, Eagle Shipco, signed a memorandum of agreement to acquire a 2017 built 64,000 deadweight SDARI-64 Ultramax dry bulk vessel constructed at Chengxi Shipyard Co., Ltd for $17.9 million. The Company paid $1.9 million advance towards the purchase as of December 31, 2016. The Company took the delivery of the vessel in the first quarter of 2017. | |
| (5) | Excludes purchase commitment for Greenship Agreement entered into in the first quarter of 2017 for acquisition of nine Vessels for an aggregate purchase price of $153 million. |
Capital Expenditures
Our capital expenditures relate to the purchase of vessels and capital improvements to our vessels, which are expected to enhance the revenue earning capabilities and safety of these vessels.
In addition to acquisitions that we may undertake in future periods, the Company's other major capital expenditures include funding the Company's program of regularly scheduled drydocking necessary to comply with international shipping standards and environmental laws and regulations. Although the Company has some flexibility regarding the timing of its drydocking, the costs are relatively predictable. Management anticipates that vessels are to be drydocked every two and a half years for vessels older than 15 years and 5 years for vessels younger than 15 years. Funding of these requirements is anticipated to be met with cash from operations. We anticipate that this process of recertification will require us to reposition these vessels from a discharge port to shipyard facilities, which will reduce our available days and operating days during that period.
Drydocking costs incurred are deferred and amortized to expense on a straight-line basis over the period through the date of the next scheduled drydocking for those vessels. In 2016, nine of our vessels were drydocked and we incurred $3,688,711 in drydocking related costs. In 2015, nineteen of our vessels were drydocked and we incurred $11,141,561 in drydocking related costs. In the period between October 16, 2014 and December 31, 2014, three vessels were drydocked and we incurred $1,960,792 in drydock related costs. In the period between January 1, 2014 and October 15, 2014, four of our vessels were drydocked and we incurred $3,802,795 in drydocking related costs.
The following table represents certain information about the estimated costs for anticipated vessel drydockings in the next four quarters, along with the anticipated off-hire days:
|
Quarter Ending |
|
Off-hire Days(1) |
Projected Costs(2) | ||
|
March 31, 2017 |
|||||
|
June 30, 2017 |
|||||
|
September 30, 2017 |
22 |
$0.65 million | |||
|
December 31, 2017 |
|
(1) |
Actual duration of drydocking will vary based on the condition of the vessel, yard schedules and other factors. |
|
|
|
|
(2) |
Actual costs will vary based on various factors, including where the drydockings are actually performed. |
Contracted Time Charter Revenue
We have time charter contracts currently for all our vessels in the operating fleet. The contracted time charter revenue schedule, included in Management's Discussion and Analysis of Financial Condition and Results of Operations should be read in conjunction with the off-hire days in the drydock schedule above.
Off-balance Sheet Arrangements
We do not have any off-balance sheet arrangements.
Other Contingencies
We refer you to Note 11 “Commitment and Contingencies” to our consolidated financial statements included in this Annual Report for a discussion of our contingencies related to claim litigation. The potential impact from legal proceedings on our business, liquidity, results of operations, financial position and cash flows, could change in the future.
Item 7A. Quantitative and Qualitative Disclosures about Market Risk
Interest Rate Risk
The Company is exposed to market risk from changes in interest rates, which could impact its results of operations and financial condition. The Company's objective is to manage the impact of interest rate changes on earnings and cash flows of its borrowings. The Company expects to manage this exposure to market risk through its regular operating and financing activities and, when deemed appropriate, using derivative financial instruments. The Company expects to use interest rate swaps to manage net exposure to interest rate changes related to its borrowings and to lower its overall borrowing costs.
At December 31, 2016, the Company’s debt consisted of $209,099,000 in term loans, net of $4,746,682 debt discount, debt issuance costs under the First Lien Facility and $67,327,843, including accrued PIK interest, under the Second Lien Facility, net of $15,717,317 debt discount and debt issuance costs. In addition, we have $25 million in undrawn revolver availability under the First Lien Facility. Our cash interest expense on the First Lien Facility for the year ended December 31, 2016 was $9,938,824 compared to $9,781,106 for the year ended December 31, 2015. The table below provides sensitivity analysis of changes in interest rates for an increase or decrease of 100 basis points and an increase of 200 basis points and the increase in annual interest expense under each scenario.
|
Incremental interest expense |
||||||||
|
For the year ended December 31, 2016 |
For the year ended December 31, 2015 |
|||||||
|
+200 basis points |
$ | 4,181,980 | $ | 4,907,500 | ||||
|
+100 basis points |
2,090,990 | 2,453,750 | ||||||
|
-100 basis points* |
(899,126 |
) |
(1,055,113 |
) | ||||
*LIBOR was 43 basis points as of December 31, 2016. The LIBOR floor is 0%, therefore the interest rates decrease by 43 basis points.
For the period from January 1, 2016 to December 31, 2016, interest on the outstanding debt ranged from 3.86% to 4.99%, including a margin over LIBOR. The weighted average effective interest rate was 6.83%.
For the period from January 1, 2015 to December 31, 2015, interest on the outstanding debt ranged from 3.696% to 4.08%, including a margin over LIBOR. The weighted average effective interest rate was 5.06%.
For the period from January 1, 2014 to October 15, 2014, interest rates on the outstanding debt ranged from 3.63% to 7.40%, including a margin over LIBOR. The weighted average effective interest rate was 2.93%.
For the period from October 16, 2014 to December 31, 2014, interest rates on the outstanding debt ranged from 4.028% to 4.037%, including a margin over LIBOR. The weighted average effective interest rate was 4.13%.
Foreign Currency and Exchange Rate Risk
The shipping industry in which the Company operates substantially transacts using the U.S. dollar. The Company generates all of its revenues in U.S. dollars and the Company’s current exposure to currency fluctuations is not material. The majority of the Company's operating expenses and the entirety of its management expenses are in U.S. dollars. However, we incur some of our voyage expenses and vessel expenses in other currencies. The amount and frequency of some of these expenses may fluctuate from period to period. Depreciation in the value of the U.S. dollar relative to other currencies will increase the U.S. dollar cost to us of paying such expenses. There is currently no expectation that that there would be an increase in the business conducted in foreign currencies. In the future if there is a substantial increase in our foreign currency transactions, our exposure could increase and we may seek to hedge against any currency fluctuation.
Item 8. Financial Statements and Supplementary Data
The information required by this item is contained in the financial statements set forth in Item 15(a) under the caption "Consolidated Financial Statements" as part of this Annual Report on Form 10-K.
Item 9. Changes in and Disagreements with Accountants on Accounting and Financial Disclosure
None.
Item 9A. Controls and Procedures
Disclosure Controls and Procedures
Our management, including our Chief Executive Officer and our Chief Financial Officer, has conducted an evaluation of the effectiveness of our disclosure controls and procedures (as defined in Rules 13a-15(e) and 15d-15(e) under the Securities Exchange Act as of the end of the period covered by this Annual Report. Based upon that evaluation, our Chief Executive Officer and Chief Financial Officer have concluded that our disclosure controls and procedures were effective as of December 31, 2016. The Company’s disclosure controls and procedures are designed to provide reasonable assurance that information required to be disclosed by the Company in the reports that it files or submits to the SEC under the Exchange Act is recorded, processed, summarized and reported within the time periods specified in SEC rules and forms and that such information is accumulated and communicated to our management, including our Chief Executive Officer and Chief Financial Officer, as appropriate, to allow timely decisions regarding required disclosure.
Management's Report on Internal Control Over Financial Reporting
Management is responsible for establishing and maintaining adequate internal control over financial reporting, as such term is defined in Rule 13a-15(f) and 15d-15(f) of the Exchange Act. The Company's internal control over financial reporting is a process designed by, or under the supervision of, the Company's Chief Executive Officer and Chief Financial Officer to provide reasonable assurance regarding the reliability of financial reporting and the preparation of the Company's financial statements for external reporting purposes in accordance with generally accepted accounting principles.
Management assessed the effectiveness of the Company’s internal control over financial reporting as of December 31, 2016. In making this assessment, management used the criteria set forth by the Committee of Sponsoring Organizations of the Treadway Commission (COSO) in Internal Control-Integrated Framework (2013). Based on management’s assessment and those criteria, management has concluded that the Company maintained effective internal control over financial reporting as of December 31, 2016.
Our internal control over financial reporting includes policies and procedures that pertain to the maintenance of records that, in reasonable detail, accurately and fairly reflect transactions and dispositions of the Company's assets; provide reasonable assurance that transactions are recorded as necessary to permit preparation of financial statements in accordance with generally accepted accounting principles, and that the Company's receipts and expenditures are being made only in accordance with authorizations of management and the directors of the Company; and provide reasonable assurance regarding prevention or timely detection of unauthorized acquisition, use or disposition of the Company's assets that could have a material effect on the financial statements.
The effectiveness of the Company's internal control over financial reporting as of December 31, 2016 has been audited by Deloitte & Touche LLP, an independent registered public accounting firm, as stated in their report appearing in Item 9A herein.
Changes in Internal Control Over Financial Reporting
In addition, we evaluated our internal control over financial reporting, as defined in Rules 13a-15(f) and 15d-15(f) of the Exchange Act and there have been no changes in our internal control over financial reporting that occurred during the fourth quarter of 2016 that materially affected, or are reasonably likely to materially affect, our internal control over financial reporting.
REPORT OF INDEPENDENT REGISTERED PUBLIC ACCOUNTING FIRM
To the Board of Directors and Shareholders of Eagle Bulk Shipping Inc.
We have audited the internal control over financial reporting of Eagle Bulk Shipping Inc. and subsidiaries (the "Company") as of December 31, 2016, based on criteria established in Internal Control — Integrated Framework (2013) issued by the Committee of Sponsoring Organizations of the Treadway Commission. The Company's management is responsible for maintaining effective internal control over financial reporting and for its assessment of the effectiveness of internal control over financial reporting, included in the accompanying Management’s Report on Internal Control over Financial Reporting. Our responsibility is to express an opinion on the Company's internal control over financial reporting based on our audit.
We conducted our audit in accordance with the standards of the Public Company Accounting Oversight Board (United States). Those standards require that we plan and perform the audit to obtain reasonable assurance about whether effective internal control over financial reporting was maintained in all material respects. Our audit included obtaining an understanding of internal control over financial reporting, assessing the risk that a material weakness exists, testing and evaluating the design and operating effectiveness of internal control based on the assessed risk, and performing such other procedures as we considered necessary in the circumstances. We believe that our audit provides a reasonable basis for our opinion.
A company's internal control over financial reporting is a process designed by, or under the supervision of, the company's principal executive and principal financial officers, or persons performing similar functions, and effected by the company's board of directors, management, and other personnel to provide reasonable assurance regarding the reliability of financial reporting and the preparation of financial statements for external purposes in accordance with generally accepted accounting principles. A company's internal control over financial reporting includes those policies and procedures that (1) pertain to the maintenance of records that, in reasonable detail, accurately and fairly reflect the transactions and dispositions of the assets of the company; (2) provide reasonable assurance that transactions are recorded as necessary to permit preparation of financial statements in accordance with generally accepted accounting principles, and that receipts and expenditures of the company are being made only in accordance with authorizations of management and directors of the company; and (3) provide reasonable assurance regarding prevention or timely detection of unauthorized acquisition, use, or disposition of the company's assets that could have a material effect on the financial statements.
Because of the inherent limitations of internal control over financial reporting, including the possibility of collusion or improper management override of controls, material misstatements due to error or fraud may not be prevented or detected on a timely basis. In addition, projections of any evaluation of the effectiveness of the internal control over financial reporting to future periods are subject to the risk that the controls may become inadequate because of changes in conditions, or that the degree of compliance with the policies or procedures may deteriorate.
In our opinion, the Company maintained, in all material respects, effective internal control over financial reporting as of December 31, 2016, based on the criteria established in Internal Control — Integrated Framework (2013) issued by the Committee of Sponsoring Organizations of the Treadway Commission.
We have also audited, in accordance with the standards of the Public Company Accounting Oversight Board (United States), the consolidated financial statements as of and for the year ended December 31, 2016 of the Company and our report dated March 30, 2017 expressed an unqualified opinion on those financial statements.
/s/ DELOITTE & TOUCHE LLP
New York, New York
March 30, 2017
Item 9B. Other Information
The basic and diluted loss per share for the three months ended September 30, 2016 has been restated from the previously reported basic and diluted loss per share of $0.52 to a $0.65 basic and diluted loss per share to correct a clerical error. Additionally, the basic and diluted loss per share previously reported in the Company’s Quarterly Report on Form 10-Q for the nine months ended September 30, 2016 as $3.94 per share, will be restated to a basic and diluted loss of $7.17 per share due to a clerical error when next presented in our Quarterly Report on Form 10-Q for the quarterly period ending September 30, 2017.
PART III
Item 10. Directors, Executive Officers and Corporate Governance
Information regarding our directors, executive officers and certain corporate governance items will be included in an amendment to this Form 10‑K or in the proxy statement for the 2017 annual meeting of shareholders, in either case, to be filed within 120 days after December 31, 2016, and is incorporated by reference to this report
Item 11. Executive Compensation
Information regarding executive compensation will be included in an amendment to this Form 10‑K or in the proxy statement for the 2017 annual meeting of shareholders, in either case, to be filed within 120 days after December 31, 2016, and is incorporated by reference to this report.
Item 12. Security Ownership of Certain Beneficial Owners and Management and Related Stockholder Matters
Information regarding beneficial ownership and management and related stockholder matters will be included in an amendment to this Form 10‑K or in the proxy statement for the 2017 annual meeting of shareholders, in either case, to be filed within 120 days after December 31, 2016, and is incorporated by reference to this report.
Item 13. Certain Relationships and Related Transactions, and Director Independence
Information regarding certain relationships and related transactions and director independence will be included in an amendment to this Form 10‑K or in the proxy statement for the 2017 annual meeting of shareholders, in either case, to be filed within 120 days after December 31, 2016, and is incorporated by reference to this report.
Item 14. Principal Accountant Fees and Services
Information regarding principal accounting fees and services will be included in an amendment to this Form 10‑K or in the proxy statement for the 2017 annual meeting of shareholders, in either case, to be filed within 120 days after December 31, 2016, and is incorporated by reference to this report.
PART IV
Item 15. Exhibits, Financial Statement Schedules
(a) Documents filed as part of this Annual Report on Form 10-K
|
|
1. |
Consolidated Financial Statements: See accompanying Index to Consolidated Financial Statements. |
|
|
2. |
Consolidated Financial Statement Schedule: Financial statement schedules are omitted either due to the absence of conditions under which they are required or because the information required is included in the notes to the Company’s consolidated financial statements. |
(b) Exhibits
|
|
3.1 |
Second Amended and Restated By-Laws of Eagle Bulk Shipping Inc., dated as of October 15, 2014, incorporated by reference to Exhibit 3.2 to the Report on Form 8-K of Eagle Bulk Shipping Inc., filed with the SEC on October 16, 2014; File No. 001-33831. |
|
|
3.2 |
Third Amended and Restated Articles of Incorporation of Eagle Bulk Shipping Inc., dated as of August 4, 2016, incorporated by reference to Exhibit 3.1 to the Report on Form 8-K of Eagle Bulk Shipping Inc., filed with the SEC on August 4, 2016; File No. 001-33831. |
|
|
4.1 |
Form of Specimen Stock Certificate of Eagle Bulk Shipping Inc., incorporated by reference to Exhibit 4.1 to the Report on Form 8-K of Eagle Bulk Shipping Inc., filed with the SEC on October 16, 2014; File No. 001-33831. |
|
|
4.2 |
Form of Specimen Warrant Certificate of Eagle Bulk Shipping Inc., incorporated by reference to Exhibit 4.2 to the Report on Form 8-K of Eagle Bulk Shipping Inc., filed with the SEC on October 16, 2014; File No. 001-33831. |
|
4.3 |
Amended and Restated Registration Rights Agreement, dated as of May 13, 2016, by and between Eagle Bulk Shipping Inc. and the Holders party thereto, incorporated by reference to Exhibit 10.1 to the Report on Form 8-K of Eagle Bulk Shipping Inc., filed with the SEC on May 17, 2016; File No. 001-33831. | |
| 10.1 | Delphin Management Agreement, dated August 4, 2009, by and between Delphin Shipping LLC and Eagle Bulk Shipping Inc., incorporated by reference to Exhibit 10.7 to the Annual Report on Form 10-K of Eagle Bulk Shipping Inc., filed with the SEC on March 5, 2010; File No. 001-33831. | |
|
|
10.2# |
Form of Indemnification Agreement entered into between Eagle Bulk Shipping Inc. and certain directors, officers and employees, incorporated by reference to Exhibit 10.14 to the Annual Report on Form 10-K of Eagle Bulk Shipping Inc., filed with the SEC on March 31, 2014; File No. 001-33831. |
|
|
10.3 |
Loan Agreement, dated as of October 9, 2014, incorporated by reference to Exhibit 10.1 to the Report on Form 8-K of Eagle Bulk Shipping Inc., filed with the SEC on October 16, 2014; File No. 001-33831. |
|
|
10.4 |
Amendatory Agreement to the Loan Agreement, dated as of August 14, 2015, incorporated by reference to Exhibit 10.3 to the Quarterly Report on Form 10-Q of Eagle Bulk Shipping Inc., filed with the SEC on November 16, 2015; File No. 001-33831. |
|
|
10.5 |
Warrant Agreement, dated as of October 15, 2014, by and among Eagle Bulk Shipping Inc., Computershare Inc., as Warrant Agent, and Computershare Trust Company N.A., as Warrant Agent, incorporated by reference to Exhibit 10.3 to the Report on Form 8-K of Eagle Bulk Shipping Inc., filed with the SEC on October 16, 2014; File No. 001-33831. |
| 10.6 | Amended and Restated Management Agreement, dated as of August 15, 2014, between Eagle Bulk Shipping Inc., as Manager, and Delphin Shipping LLC, incorporated by reference to Exhibit 10.4 to the Report on Form 8-K of Eagle Bulk Shipping Inc., filed with the SEC on October 16, 2014; File No. 001-33831. | |
|
|
10.7# |
Separation Agreement and General Release Agreement, dated March 9, 2015, between Eagle Bulk Shipping Inc. and Sophocles Zoullas, incorporated by reference to Exhibit 10.20 to the Annual Report on Form 10-K of Eagle Bulk Shipping Inc., filed with the SEC on April 2, 2015; File No. 001-33831. |
|
|
10.8# |
Separation Agreement and General Release, dated May 1, 2015, between Eagle Bulk Shipping Inc. and Alexis P. Zoullas, incorporated by reference to Exhibit 10.2 to the Quarterly Report on Form 10-Q of Eagle Bulk Shipping Inc., filed with the SEC on May 15, 2015; File No. 001-33831. |
|
|
10.9# |
Employment Agreement, dated July 6, 2015, among Eagle Bulk Shipping Inc., Eagle Shipping International (USA) LLC and Gary Vogel, incorporated by reference to Exhibit 10.2 to the Quarterly Report on Form 10-Q of Eagle Bulk Shipping Inc., filed with the SEC on August 14, 2015; File No. 001-33831. |
|
|
10.10# |
Eagle Bulk Shipping Inc. 2014 Equity Incentive Plan, incorporated by reference to Exhibit 10.3 to the Quarterly Report on Form 10-Q of Eagle Bulk Shipping Inc., filed with the SEC on August 14, 2015; File No. 001-33831. |
|
|
10.11# |
Restricted Stock Award Agreement under the Eagle Bulk Shipping Inc. 2014 Equity Incentive Plan, by and between Eagle Bulk Shipping Inc. and Gary Vogel, dated as of September 29, 2015, incorporated by reference to Exhibit 10.1 to the Quarterly Report on Form 10-Q of Eagle Bulk Shipping Inc., filed with the SEC on November 16, 2015; File No. 001-33831. |
|
|
10.12# |
Option Award Agreement under the Eagle Bulk Shipping Inc. 2014 Equity Incentive Plan, by and between Eagle Bulk Shipping Inc. and Gary Vogel, dated as of September 29, 2015, incorporated by reference to Exhibit 10.2 to the Quarterly Report on Form 10-Q of Eagle Bulk Shipping Inc., filed with the SEC on November 16, 2015; File No. 001-33831. |
|
|
10.13 |
Forbearance and Standstill Agreement, dated as of January 15, 2016, incorporated by reference to Exhibit 10.1 to the Report on Form 8-K of Eagle Bulk Shipping Inc., filed with the SEC on January 19, 2016; File No. 001-33831. |
|
|
10.14 |
Amendment No. 1 to Forbearance and Standstill Agreement, dated as of February 1, 2016, incorporated by reference to Exhibit 10.1 to the Report on Form 8-K of Eagle Bulk Shipping Inc., filed with the SEC on February 2, 2016; File No. 001-33831. |
|
|
10.15 |
Limited Waiver to the Loan Agreement and Amendment No. 2 to Forbearance and Standstill Agreement, dated as of February 9, 2016, incorporated by reference to Exhibit 10.1 to the Report on Form 8-K of Eagle Bulk Shipping Inc., filed with the SEC on February 9, 2016; File No. 001-33831. |
|
|
10.16 |
Limited Waiver to the Loan Agreement and Amendment No. 3 to Forbearance and Standstill Agreement, dated as of February 22, 2016, incorporated by reference to Exhibit 10.1 to the Report on Form 8-K of Eagle Bulk Shipping Inc., filed with the SEC on February 22, 2016; File No. 001-33831. |
|
|
10.17 |
Second Limited Waiver to the Loan Agreement and Amendment No. 4 to Forbearance and Standstill Agreement, dated as of February 29, 2016, incorporated by reference to Exhibit 10.1 to the Report on Form 8-K of Eagle Bulk Shipping Inc., filed with the SEC on March 1, 2016; File No. 001-33831. |
|
|
10.18 |
Amendment No. 5 to Forbearance and Standstill Agreement, dated as of March 6, 2016, incorporated by reference to Exhibit 10.1 to the Report on Form 8-K of Eagle Bulk Shipping Inc., filed with the SEC on March 7, 2016; File No. 001-33831. |
|
|
10.19 |
Third Limited Waiver to the Loan Agreement and Amendment No. 6 to Forbearance and Standstill Agreement, dated as of March 8, 2016, incorporated by reference to Exhibit 10.1 to the Report on Form 8-K of Eagle Bulk Shipping Inc., filed with the SEC on March 9, 2016; File No. 001-33831. |
|
|
10.20 |
Fourth Limited Waiver to the Loan Agreement, dated as of March 18, incorporated by reference to Exhibit 10.1 to the Report on Form 8-K of Eagle Bulk Shipping Inc., filed with the SEC on March 22, 2016; File No. 001-33831. |
|
|
10.21 |
Amendment No. 7 to Forbearance and Standstill Agreement, dated as of March 22, 2016, incorporated by reference to Exhibit 10.2 to the Report on Form 8-K of Eagle Bulk Shipping Inc., filed with the SEC on March 22, 2016; File No. 001-33831. |
|
|
10.22 |
Amended and Restated First Lien Loan Agreement, dated as of March 30, 2016, incorporated by reference to Exhibit 10.1 to the Report on Form 8-K of Eagle Bulk Shipping Inc., filed with the SEC on March 30, 2016; File No. 001-33831. |
|
10.23 |
Second Lien Loan Agreement, among Eagle Shipping LLC, as borrower, the guarantor subsidiaries party thereto, the lenders thereto from time to time, and Wilmington Savings Fund Society, FSB, as Second Lien Agent, dated as of March 30, 2016, incorporated by reference to Exhibit 10.2 to the Report on Form 8-K of Eagle Bulk Shipping Inc., filed with the SEC on March 30, 2016; File No. 001-33831. | |
|
10.24 |
Nominating Agreement, dated as of March 30, 2016, by and between Eagle Bulk Shipping Inc. and GoldenTree Asset Management LP, incorporated by reference to Exhibit 10.3 to the Report on Form 8-K of Eagle Bulk Shipping Inc., filed with the SEC on March 30, 2016; File No. 001-33831. | |
|
10.25 |
First Amendment to Nominating Agreement, dated as of April 18, 2016, by and between Eagle Bulk Shipping Inc. and GoldenTree Asset Management LP, incorporated by reference to Exhibit 10.1 to the Report on Form 8-K of Eagle Bulk Shipping Inc., filed with the SEC on April 19, 2016; File No. 001-33831. | |
|
10.26 |
Preferred Stock Purchase Agreement, dated as of May 26, 2016, by and among Eagle Bulk Shipping Inc. and the Purchasers party thereto, incorporated by reference to Exhibit 10.1 to the Report on Form 8-K of Eagle Bulk Shipping Inc., filed with the SEC on May 27, 2016; File No. 001-33831. | |
|
10.27 |
Stock Purchase Agreement, dated as of July 1, 2016, by and among Eagle Bulk Shipping Inc. and the Investors party thereto, incorporated by reference to Exhibit 10.1 to the Report on Form 8-K of Eagle Bulk Shipping Inc., filed with the SEC on July 5, 2016; File No. 001-33831. | |
|
10.28 |
Stock Purchase Agreement, dated as of July 10, 2016, by and among Eagle Bulk Shipping Inc. and the Investors party thereto, incorporated by reference to Exhibit 10.1 to the Report on Form 8-K of Eagle Bulk Shipping Inc., filed with the SEC on July 11, 2016; File No. 001-33831. |
|
10.29 |
First Amendment to the Preferred Stock Purchase Agreement, dated as of July 19, 2016, by and between Eagle Bulk Shipping Inc. and the Purchasers party thereto, incorporated by reference to Exhibit 10.1 to the Report on Form 8-K of Eagle Bulk Shipping Inc., filed with the SEC on July 20, 2016; File No. 001-33831. | |
|
10.30 |
Termination Agreement of the Preferred Stock Purchase Agreement, dated September 7, 2016, by and among Eagle Bulk Shipping Inc. and the Investors party thereto, incorporated by reference to Exhibit 10.1 to the Report on Form 8-K of Eagle Bulk Shipping Inc., filed with the SEC on September 7, 2016; File No. 001-33831. | |
|
10.31# |
Separation Agreement and General Release, dated September 29, 2016, between Eagle Bulk Shipping Inc. and Adir Katzav, incorporated by reference to Exhibit 10.5 to the Quarterly Report on Form 10-Q of Eagle Bulk Shipping Inc., filed with the SEC on November 9, 2016; File No. 001-33831. | |
|
10.32# |
Employment Agreement, dated September 3, 2016, among Eagle Bulk Shipping Inc., Eagle Shipping International (USA) LLC and Frank De Costanzo, incorporated by reference to Exhibit 10.6 to the Quarterly Report on Form 10-Q of Eagle Bulk Shipping Inc., filed with the SEC on November 9, 2016; File No. 001-33831. | |
|
|
10.33# |
Option Award Agreement, dated November 7, 2016, between Frank De Costanzo and Eagle Bulk Shipping Inc., incorporated by reference to Exhibit 10.1 to the Report on Form 8-K of Eagle Bulk Shipping Inc., filed with the SEC on November 9, 2016; File No. 001-33831. |
|
|
10.34# |
Restricted Stock Award Agreement, dated November 7, 2016, between Frank De Costanzo and Eagle Bulk Shipping Inc., incorporated by reference to Exhibit 10.2 to the Report on Form 8-K of Eagle Bulk Shipping Inc., filed with the SEC on November 9, 2016; File No. 001-33831. |
|
|
10.35 |
Stock Purchase Agreement, dated as of December 13, 2016, by and among Eagle Bulk Shipping Inc. and the Investors party thereto, incorporated by reference to Exhibit 10.1 to the Report on Form 8-K of Eagle Bulk Shipping Inc., filed with the SEC on December 13, 2016; File No. 001-33831. |
|
|
10.36# |
Eagle Bulk Shipping Inc. 2016 Equity Incentive Plan, incorporated by reference to Appendix A to the definitive proxy statement on Schedule 14A of Eagle Bulk Shipping Inc., filed with the SEC on November 4, 2016; File No. 001-33831. |
|
|
10.37#* |
Restricted Stock Award Agreement, dated December 15, 2016, between Gary Vogel and Eagle Bulk Shipping Inc. |
| 10.38#* | Option Award Agreement, dated December 15, 2016, between Gary Vogel and Eagle Bulk Shipping Inc. | |
|
|
21.1* |
Subsidiaries of the Registrant. |
|
|
23.1* |
Consent of Independent Registered Public Accounting Firm –Deloitte & Touche LLP. |
|
|
23.2* |
Consent of Independent Registered Public Accounting Firm –PricewaterhouseCoopers LLP. |
|
|
23.3* |
Consent of Seward & Kissel LLP. |
|
|
31.1* |
Rule 13a-14(d) / 15d-14(a)_Certification of Principal Executive Officer. |
|
|
31.2* |
Rule 13a-14(d) / 15d-14(a)_Certification of Principal Financial Officer. |
|
|
32.1** |
Section 1350 Certification of Principal Executive Officer. |
|
|
32.2** |
Section 1350 Certification of Principal Financial Officer. |
|
|
101.INS* |
XBRL Instance Document. |
|
|
101.CAL* |
XBRL Schema Document. |
|
|
101.SCH* |
XBRL Calculation Linkbase Document. |
|
|
101.DEF* |
XBRL Definition Linkbase Document. |
|
|
101.LAB* |
XBRL Labels Linkbase Document. |
|
|
101.PRE* |
XBRL Presentation Linkbase Document. |
* Filed herewith.
** Furnished herewith.
# Management contract or compensatory plan or arrangement.
SIGNATURES
Pursuant to the requirements of Section 13 or 15(d) of the Securities Exchange of 1934, the Registrant has duly caused this report to be signed on its behalf by the undersigned thereunto duly authorized.
|
|
EAGLE BULK SHIPPING INC. |
| ||
|
|
|
|
| |
|
|
By: |
/s/ Gary Vogel |
| |
|
|
|
|
|
|
|
|
|
Name: |
Gary Vogel |
|
|
|
|
Title: |
Chief Executive Officer |
|
March 31, 2017
Pursuant to the requirements of the Securities Exchange Act of 1934, this report has been signed below by the following persons on behalf of the registrant and in the capacities indicated on March 31, 2017.
|
Name |
|
Title | |
|
|
|
| |
|
/s/ Gary Vogel |
|
Chief Executive Officer and Director | |
|
Gary Vogel |
|
(Principal Executive Officer) | |
|
|
|
| |
|
/s/ Frank De Costanzo |
|
Chief Financial Officer | |
|
Frank De Costanzo |
|
(Principal Financial and Accounting Officer) | |
|
|
|
| |
|
/s/ Paul M. Leand, Jr. |
|
Chairman of the Board of Directors | |
|
Paul M. Leand, Jr. |
|
| |
|
|
|
| |
|
/s/ Randee E. Day |
|
Director | |
|
Randee E. Day |
|
| |
|
|
|
| |
|
/s/ Justin A. Knowles |
|
Director | |
|
Justin A. Knowles |
|
| |
|
|
|
| |
|
/s/ Casey Shanley |
|
Director | |
|
Casey Shanley |
|
| |
|
|
|
| |
|
/s/ Bart Veldhuizen |
|
Director | |
|
Bart Veldhuizen |
|
| |
|
|
|
| |
|
/s/ Gary Weston |
|
Director | |
|
Gary Weston |
| ||
INDEX TO CONSOLIDATED FINANCIAL STATEMENTS
|
Reports of Independent Registered Public Accounting Firms |
F-2 | |
|
|
| |
|
Consolidated Balance Sheets as of December 31, 2016 and December 31, 2015 |
F-5 | |
|
|
| |
|
Consolidated Statements of Operations for the years ended December 31, 2016 and December 31, 2015 and for the period from October 16, 2014 to December 31, 2014 (Successor), and for the period from January 1, 2014 to October 15, 2014 (Predecessor) |
F-6 | |
|
|
| |
|
Consolidated Statements of Comprehensive Loss for the years ended December 31, 2016 and December 31, 2015, for the period from October 16, 2014 to December 31, 2014 (Successor), and for the period from January 1, 2014 to October 15, 2014 (Predecessor) |
F-7 | |
|
|
| |
|
Consolidated Statements of Changes in Stockholders' Equity for the years ended December 31, 2016 and December 31, 2015, for the period from October 16, 2014 to December 31, 2014 (Successor), and for the period from January 1, 2014 to October 15, 2014 (Predecessor) |
F-8 | |
|
|
| |
|
Consolidated Statements of Cash Flows for the years ended December 31, 2016 and December 31 2015, and for the period from October 16, 2014 to December 31, 2014 (Successor), and for the period from January 1, 2014 to October 15, 2014 (Predecessor) |
F-9 | |
|
|
| |
|
Notes to Consolidated Financial Statements |
F-10 |
Report of Independent Registered Public Accounting Firm
To the Board of Directors and Shareholders of Eagle Bulk Shipping Inc.
We have audited the accompanying consolidated balance sheets of Eagle Bulk Shipping Inc. and subsidiaries (the "Company") as of December 31, 2016 and 2015, and the related consolidated statements of operations, comprehensive loss, changes in stockholders' equity, and cash flows for the years then ended. Our responsibility is to express an opinion on the financial statements based on our audits.
We conducted our audits in accordance with the standards of the Public Company Accounting Oversight Board (United States). Those standards require that we plan and perform the audit to obtain reasonable assurance about whether the financial statements are free of material misstatement. An audit includes examining, on a test basis, evidence supporting the amounts and disclosures in the financial statements. An audit also includes assessing the accounting principles used and significant estimates made by management, as well as evaluating the overall financial statement presentation. We believe that our audits provide a reasonable basis for our opinion.
In our opinion, such consolidated financial statements present fairly, in all material respects, the financial position of Eagle Bulk Shipping Inc. and subsidiaries as of December 31, 2016 and 2015, and the results of their operations and their cash flows for the years then ended, in conformity with accounting principles generally accepted in the United States of America.
We have also audited, in accordance with the standards of the Public Company Accounting Oversight Board (United States), the Company's internal control over financial reporting as of December 31, 2016, based on the criteria established in Internal Control — Integrated Framework (2013) issued by the Committee of Sponsoring Organizations of the Treadway Commission and our report dated March 30, 2017 expressed an unqualified opinion on the Company's internal control over financial reporting.
/s/ DELOITTE & TOUCHE LLP
New York, New York
March 30, 2017
Report of Independent Registered Public Accounting Firm
To the Board of Directors and Shareholders of Eagle Bulk Shipping Inc.
In our opinion, the accompanying consolidated statements of operations, comprehensive loss, changes in stockholders’ equity and cash flows for the period from January 1, 2014 to October 15, 2014, present fairly, in all material respects, the results of operations and cash flows of Eagle Bulk Shipping Inc. and its subsidiaries (Predecessor) for the period from January 1, 2014 to October 15, 2014 in conformity with accounting principles generally accepted in the United States of America. These financial statements are the responsibility of the Company’s management. Our responsibility is to express an opinion on these financial statements based on our audit. We conducted our audit of these financial statements in accordance with the standards of the Public Company Accounting Oversight Board (United States). Those standards require that we plan and perform the audit to obtain reasonable assurance about whether the financial statements are free of material misstatement. An audit includes examining, on a test basis, evidence supporting the amounts and disclosures in the financial statements, assessing the accounting principles used and significant estimates made by management, and evaluating the overall financial statement presentation. We believe that our audit provides a reasonable basis for our opinion.
As discussed in Note 18 to the consolidated financial statements, the Company filed a petition on August 6, 2014 with the United States Bankruptcy Court for the Southern District of New York for reorganization under the provisions of Chapter 11 of the Bankruptcy Code. The Company’s Restructuring Support Agreement (“RSA”) was substantially consummated on October 15, 2014 and the Company emerged from bankruptcy. In connection with its emergence from bankruptcy, the Company adopted fresh start accounting.
/s/ PricewaterhouseCoopers LLP
Stamford, Connecticut
April 2, 2015
Report of Independent Registered Public Accounting Firm
To the Board of Directors and Shareholders of Eagle Bulk Shipping Inc.
In our opinion, the accompanying consolidated statements of operations, comprehensive loss, changes in stockholders’ equity (deficit) and cash flows for the period from October 16, 2014 to December 31, 2014, present fairly, in all material respects, the results of operations and cash flows of Eagle Bulk Shipping Inc. and its subsidiaries (Successor) for the period from October 16, 2014 to December 31, 2014 in conformity with accounting principles generally accepted in the United States of America. These financial statements are the responsibility of the Company’s management. Our responsibility is to express an opinion on these financial statements based on our audit. We conducted our audit of these financial statements in accordance with the standards of the Public Company Accounting Oversight Board (United States). Those standards require that we plan and perform the audit to obtain reasonable assurance about whether the financial statements are free of material misstatement. An audit includes examining, on a test basis, evidence supporting the amounts and disclosures in the financial statements, assessing the accounting principles used and significant estimates made by management, and evaluating the overall financial statement presentation. We believe that our audit provides a reasonable basis for our opinion.
As discussed in Note 18 to the consolidated financial statements, the United States Bankruptcy Court for the Southern District of New York confirmed the Company's Restructuring Support Agreement (“RSA”) on September 22, 2014. Confirmation of the plan resulted in the discharge of all claims against the Company that arose before October 15, 2014 and substantially alters rights and interests of equity security holders as provided for in the plan. The plan was substantially consummated on October 15, 2014 and the Company emerged from bankruptcy. In connection with its emergence from bankruptcy, the Company adopted fresh start accounting as of October 16, 2014.
/s/ PricewaterhouseCoopers LLP
Stamford, Connecticut
April 2, 2015, except for the effects of the reverse stock split as discussed in Note 3 to the consolidated financial statements and except for Note 19 to the consolidated financial statements, as to which the date is March 30, 2017
EAGLE BULK SHIPPING INC. AND SUBSIDIARIES
CONSOLIDATED BALANCE SHEETS
|
Successor December 31, 2016 |
Successor December 31, 2015 |
|||||||
|
ASSETS: |
||||||||
|
Current assets: |
||||||||
|
Cash and cash equivalents |
$ | 76,516,110 | $ | 24,896,161 | ||||
|
Accounts receivable |
5,089,708 | 7,076,528 | ||||||
|
Prepaid expenses |
3,093,962 | 3,232,763 | ||||||
|
Inventories |
10,876,713 | 5,574,406 | ||||||
|
Vessels held for sale |
8,688,601 | - | ||||||
|
Other assets |
22 | 245,569 | ||||||
|
Total current assets |
104,265,116 | 41,025,427 | ||||||
|
Noncurrent assets: |
||||||||
|
Vessels and vessel improvements, at cost, net of accumulated depreciation of $76,463,743 and $49,148,080, respectively |
567,592,950 | 733,960,731 | ||||||
|
Advances for vessel purchase |
1,926,886 | - | ||||||
|
Other fixed assets, net of accumulated amortization of $307,880 and $159,827, respectively |
632,805 | 220,509 | ||||||
|
Restricted cash |
74,917 | 141,161 | ||||||
|
Deferred drydock costs, net |
11,507,309 | 11,146,009 | ||||||
|
Other assets |
381,634 | 109,287 | ||||||
|
Total noncurrent assets |
582,116,501 | 745,577,697 | ||||||
|
Total assets |
$ | 686,381,617 | $ | 786,603,124 | ||||
|
LIABILITIES & STOCKHOLDERS' EQUITY |
||||||||
|
Current liabilities: |
||||||||
|
Accounts payable |
$ | 7,135,156 | $ | 8,216,473 | ||||
|
Accrued interest |
28,872 | 401,232 | ||||||
|
Other accrued liabilities |
11,545,447 | 10,827,075 | ||||||
|
Fair value below contract value of time charters acquired |
820,313 | 1,283,926 | ||||||
|
Unearned charter hire revenue |
6,046,032 | 1,560,402 | ||||||
|
Current portion of long-term debt |
- | 15,625,000 | ||||||
|
Total current liabilities |
25,575,820 | 37,914,108 | ||||||
|
Noncurrent liabilities: |
||||||||
|
First Lien Facility, net of debt discount and debt issuance costs |
204,352,318 | 225,577,491 | ||||||
|
Second Lien Facility, inclusive of payment-in-kind interest, net of debt discount and debt issuance costs |
51,591,226 | - | ||||||
|
Other liabilities |
483,132 | 672,941 | ||||||
|
Fair value below contract value of time charters acquired |
3,896,482 | 4,094,122 | ||||||
|
Total noncurrent liabilities |
260,323,158 | 230,344,554 | ||||||
|
Total liabilities |
285,898,978 | 268,258,662 | ||||||
|
Commitment and contingencies |
||||||||
|
Stockholders' equity: |
||||||||
|
Preferred stock, $.01 par value, 25,000,000 shares authorized, none issued as of December 31, 2016 |
- | - | ||||||
|
Common stock, $.01 par value, 700,000,000 shares authorized, 48,106,827 and 1,883,303 shares issued and outstanding as of December 31, 2016 and 2015, respectively* |
481,069 | 18,833 | ||||||
|
Additional paid-in capital* |
783,369,698 | 678,171,322 | ||||||
|
Accumulated deficit |
(383,368,128 |
) |
(159,845,693 |
) | ||||
|
Total stockholders' equity |
400,482,639 | 518,344,462 | ||||||
|
Total liabilities and stockholders' equity |
$ | 686,381,617 | $ | 786,603,124 | ||||
*Adjusted to give effect for the 1 for 20 reverse stock split for the Successor that became effective as of the opening of trading on August 5, 2016.
The accompanying notes are an integral part of these Consolidated Financial Statements.
EAGLE BULK SHIPPING INC. AND SUBSIDIARIES
CONSOLIDATED STATEMENTS OF OPERATIONS
|
Successor |
Predecessor |
|||||||||||||||
|
Period from |
Period from |
|||||||||||||||
|
For the year ended |
For the year ended |
October 16, 2014 To |
January 1, 2014 To |
|||||||||||||
|
December 31, 2016 |
December 31, 2015 |
December 31, 2014 |
October 15, 2014 |
|||||||||||||
|
Revenues, net |
$ | 124,492,844 | $ | 103,856,876 | $ | 31,089,603 | $ | 123,150,214 | ||||||||
|
Voyage expenses |
42,093,714 | 23,832,457 | 6,262,082 | 14,703,850 | ||||||||||||
|
Vessel expenses |
74,016,763 | 86,329,060 | 17,331,575 | 71,679,034 | ||||||||||||
|
Charter hire expenses |
12,845,468 | 4,125,766 | 1,042,760 | 188,233 | ||||||||||||
|
Depreciation and amortization |
38,884,322 | 43,000,741 | 8,781,846 | 61,238,760 | ||||||||||||
|
General and administrative expenses |
22,905,802 | 25,537,007 | 5,933,011 | 18,679,265 | ||||||||||||
|
Restructuring charges |
5,869,025 | - | - | - | ||||||||||||
|
Loss on sale of vessels |
101,860 | 5,696,675 | - | - | ||||||||||||
|
Vessel impairment |
129,027,862 | 50,872,734 | - | - | ||||||||||||
|
Total operating expenses |
325,744,816 | 239,394,440 | 39,351,274 | 166,489,142 | ||||||||||||
|
Operating income (loss) |
(201,251,972 |
) |
(135,537,564 |
) |
(8,261,671 |
) |
(43,338,928 |
) | ||||||||
|
Interest expense |
21,799,146 | 11,927,422 | 2,359,326 | 60,737,471 | ||||||||||||
|
Interest income |
(215,433 |
) |
(6,222 |
) |
(2,238 |
) |
(8,352 |
) | ||||||||
|
Other expense |
686,750 | 838,201 | 884,427 | - | ||||||||||||
|
Reorganization items, net |
- | - | 45,542 | 427,735,210 | ||||||||||||
|
Total other expense (income), net |
22,270,463 | 12,759,401 | 3,287,057 | 488,464,329 | ||||||||||||
|
Net loss |
$ | (223,522,435 |
) |
$ | (148,296,965 |
) |
$ | (11,548,728 |
) |
$ | (531,803,257 |
) | ||||
|
Weighted average shares outstanding: |
||||||||||||||||
|
Basic* |
20,565,652 | 1,880,116 | 1,875,227 | 17,857,408 | ||||||||||||
|
Diluted* |
20,565,652 | 1,880,116 | 1,875,227 | 17,857,408 | ||||||||||||
|
Per share amounts: |
||||||||||||||||
|
Basic net loss |
$ | (10.87 |
) |
$ | (78.88 |
) |
$ | (6.16 |
) |
$ | (29.78 |
) | ||||
|
Diluted net loss |
$ | (10.87 |
) |
$ | (78.88 |
) |
$ | (6.16 |
) |
$ | (29.78 |
) | ||||
*Adjusted to give effect for the 1 for 20 reverse stock split for the Successor that became effective as of the opening of trading on August 5, 2016.
The accompanying notes are an integral part of these Consolidated Financial Statements.
EAGLE BULK SHIPPING INC. AND SUBSIDIARIES
CONSOLIDATED STATEMENTS OF COMPREHENSIVE LOSS
|
Successor |
Predecessor |
|||||||||||||||
|
December 31, 2016 |
December 31, 2015
|
October 16, 2014 to December 31, 2014 |
January 1, 2014 to October 15, 2014 |
|||||||||||||
|
Net loss |
$ | (223,522,435 |
) |
$ | (148,296,965 |
) |
$ | (11,548,728 |
) |
$ | (531,803,257 |
) | ||||
|
Other comprehensive loss: |
||||||||||||||||
|
Change in unrealized loss on available for sale investment |
- | - | - | (231,995 |
) | |||||||||||
|
Total other comprehensive loss |
- | - | - | (231,995 |
) | |||||||||||
|
Comprehensive loss |
$ | (223,522,435 |
) |
$ | (148,296,965 |
) |
$ | (11,548,728 |
) |
$ | (532,035,252 |
) | ||||
The accompanying notes are an integral part of these Consolidated Financial Statements.
EAGLE BULK SHIPPING INC. AND SUBSIDIARIES
CONSOLIDATED STATEMENTS OF CHANGES IN STOCKHOLDERS' EQUITY
|
Common Shares* |
Common Shares Amount* |
Additional paid-in Capital* |
Accumulated Deficit |
Other Comprehensive Loss |
Total Stockholders’ Equity |
|||||||||||||||||||
|
Balance at January 1, 2014 - (Predecessor) |
16,783,071 | 167,828 | 766,823,808 | (235,796,772 |
) |
— | 531,194,864 | |||||||||||||||||
|
Net Loss |
— | — | — | (531,803,257 |
) |
— | (531,803,257 |
) | ||||||||||||||||
|
Change in unrealized loss on investment |
— | — | — | — | $ | (231,995 |
) |
(231,995 |
) | |||||||||||||||
|
Exercise of Warrants |
1,770,877 | 17,709 | (17,709 |
) |
— | — | — | |||||||||||||||||
|
Non-cash compensation |
— | — | 1,072,383 | — | — | 1,072,383 | ||||||||||||||||||
| Cancellation of Predecessor common stock | (18,553,948 | ) | (185,537 | ) | (767,878,482 | ) | (768,064,019 | ) | ||||||||||||||||
|
Elimination of Predecessor accumulated deficit |
767,600,029 | 767,600,029 | ||||||||||||||||||||||
|
Elimination of Predecessor other comprehensive income |
231,995 | 231,995 | ||||||||||||||||||||||
|
Issuance of new equity interest in connection with emergence from Chapter 11 |
37,504,541 | 375,045 | 673,142,844 | 673,517,889 | ||||||||||||||||||||
|
Balance at October 15, 2014 - (Predecessor) |
37,504,541 | 375,045 | 673,142,844 | — | — | 673,517,889 | ||||||||||||||||||
|
Balance at October 16, 2014 (Successor)* |
1,875,227 | 18,752 | 673,499,137 | — | — | 673,517,889 | ||||||||||||||||||
|
Net loss |
(11,548,728 |
) |
(11,548,728 |
) | ||||||||||||||||||||
|
Non-cash compensation |
2,121,505 | 2,121,505 | ||||||||||||||||||||||
|
Balance at December 31, 2014 (Successor)* |
1,875,227 | 18,752 | 675,620,642 | (11,548,728 |
) |
— | 664,090,666 | |||||||||||||||||
|
Net loss |
— | — | — | (148,296,965 |
) |
— | (148,296,965 |
) | ||||||||||||||||
|
Vesting of restricted shares, net of shares withheld for employee tax |
8,076 | 81 | (1,419,309 |
) |
— | — | (1,419,228 |
) | ||||||||||||||||
|
Non-cash compensation |
— | — | 3,969,989 | — | — | 3,969,989 | ||||||||||||||||||
|
Balance at December 31, 2015 (Successor)* |
1,883,303 | 18,833 | 678,171,322 | (159,845,693 |
) |
— | 518,344,462 | |||||||||||||||||
|
Net loss |
— | — | — | (223,522,435 |
) |
— | (223,522,435 |
) | ||||||||||||||||
|
Issuance of shares in connection with the Second Lien loan Agreement |
16,889,828 | 168,899 | 17,587,426 | — | — | 17,756,325 | ||||||||||||||||||
|
Issuance of shares for private placement, net of issuance costs |
29,333,318 | 293,333 | 85,407,202 | — | — | 85,700,535 | ||||||||||||||||||
|
Reverse stock split adjustment |
(32 |
) |
— | — | — | — | — | |||||||||||||||||
|
Vesting of restricted shares withheld for employee tax |
410 | 4 | (2,942 |
) |
— | — | (2,938 |
) | ||||||||||||||||
|
Non-cash compensation |
— | — | 2,206,690 | — | — | 2,206,690 | ||||||||||||||||||
|
Balance at December 31, 2016 (Successor)* |
48,106,827 | $ | 481,069 | $ | 783,369,698 | $ | (383,368,128 |
) |
— | $ | 400,482,639 | |||||||||||||
*Adjusted to give effect for the 1 for 20 reverse stock split for the Successor that became effective as of the opening of trading on August 5, 2016.
The accompanying notes are an integral part of these Consolidated Financial Statements.
EAGLE BULK SHIPPING INC. AND SUBSIDIARIES
CONSOLIDATED STATEMENTS OF CASH FLOWS
|
Successor |
Predecessor |
|||||||||||||||
|
Year ended December 31, 2016 |
Year ended December 31, 2015 |
Period from October 16, 2014 To December 31, 2014 |
Period from January 1, 2014 to October 15, 2014 |
|||||||||||||
|
Cash flows from operating activities: |
||||||||||||||||
|
Net loss |
$ | (223,522,435 |
) |
$ | (148,296,965 |
) |
$ | (11,548,728 |
) |
$ | (531,803,257 |
) | ||||
|
Adjustments to reconcile net loss to net cash used in operating activities: |
||||||||||||||||
|
Depreciation |
35,556,911 | 41,044,397 | 8,781,846 | 58,717,282 | ||||||||||||
|
Amortization of deferred drydocking costs |
3,327,411 | 1,956,344 | - | 2,521,478 | ||||||||||||
|
Amortization of debt discount and debt issuance costs |
4,532,481 | 2,146,316 | 256,175 | 17,028,544 | ||||||||||||
|
Reorganization items and fresh-start reporting adjustments, net |
- | - | - | 402,423,980 | ||||||||||||
|
Amortization of fair value below contract value of time charter acquired |
(661,253 |
) |
(948,741 |
) |
(235,709 |
) |
- | |||||||||
|
Payment-in-kind interest on debt |
7,327,843 | - | - | 17,858,132 | ||||||||||||
|
Net loss on sale of vessels |
101,860 | 5,696,675 | - | - | ||||||||||||
|
Impairment of vessels |
129,027,862 | 50,872,734 | - | - | ||||||||||||
|
Realized loss from sale of investment |
462,394 | 884,426 | - | |||||||||||||
|
Allowance for accounts receivable |
- | - | - | 2,289,509 | ||||||||||||
|
Non-cash compensation expense |
2,206,690 | 3,969,989 | 2,121,505 | 1,072,383 | ||||||||||||
|
Drydocking expenditures |
(3,688,711 |
) |
(11,141,561 |
) |
(1,960,792 |
) |
(3,802,795 |
) | ||||||||
|
Changes in operating assets and liabilities: |
||||||||||||||||
|
Accounts receivable |
1,986,820 | 7,654,773 | (1,007,975 |
) |
(4,815,734 |
) | ||||||||||
|
Other assets |
(26,799 |
) |
4,691,158 | 1,086,391 | (5,880,809 |
) | ||||||||||
|
Prepaid expenses |
138,801 | (19,833 |
) |
43,355 | 1,710,579 | |||||||||||
|
Inventories |
(5,302,307 |
) |
174,867 | 2,919,530 | 941,469 | |||||||||||
|
Accounts payable |
(1,081,317 |
) |
(3,447,224 |
) |
(1,903,888 |
) |
7,145,279 | |||||||||
|
Accrued interest |
(372,360 |
) |
(130,686 |
) |
516,849 | 14,964,109 | ||||||||||
|
Accrued expenses |
528,563 | 2,357,787 | (4,342 |
) |
2,935,346 | |||||||||||
|
Unearned revenue |
4,485,630 | (829,193 |
) |
(227,824 |
) |
(2,770,425 |
) | |||||||||
|
Net cash used in operating activities |
(45,434,310 |
) |
(43,786,769 |
) |
(279,181 |
) |
(19,464,930 |
) | ||||||||
|
Cash flows from investing activities: |
||||||||||||||||
|
Vessel purchases /improvements |
(19,860,401 |
) |
(1,747,099 |
) |
(194,514 |
) |
(291,244 |
) | ||||||||
|
Advance for vessel purchase |
(1,926,886 |
) |
- | - | - | |||||||||||
|
Proceeds from sale of investment |
- | 7,838,346 | 4,400,278 | - | ||||||||||||
|
Proceeds from sale of vessels |
13,001,000 | 4,235,542 | - | - | ||||||||||||
|
Purchase of other fixed assets |
(560,348 |
) |
- | - | (199,421 |
) | ||||||||||
|
Changes in restricted cash |
66,244 | (74,918 |
) |
- | - | |||||||||||
|
Net cash provided by/(used in) investing activities |
(9,280,391 |
) |
10,251,871 | 4,205,764 | (490,665 |
) | ||||||||||
|
Cash flows from financing activities: |
||||||||||||||||
|
Debtor-In-Possession Loan |
- | - | - | 25,000,000 | ||||||||||||
|
Repayment of Debtor-In-Possession Loan |
- | - | - | (25,000,000 |
) | |||||||||||
|
Long-Term borrowings |
- | - | - | 219,500,000 | ||||||||||||
|
Repayment of Term Loan |
(21,276,000 | ) | (19,625,000 |
) |
- | (182,603,425 |
) | |||||||||
|
Proceeds from Revolver Loan facility |
15,158,500 | 40,000,000 | - | - | ||||||||||||
|
Proceeds from Second Lien Facility |
60,000,000 | - | - | - | ||||||||||||
|
Proceeds from common stock placement, net of issuance costs |
85,700,535 | - | - | - | ||||||||||||
|
Repayment of Revolver Loan |
(30,158,500 |
) |
- | - | - | |||||||||||
|
Deferred financing costs |
(3,086,947 |
) |
(500,000 | ) | - | (575,000 |
) | |||||||||
|
Cash used to settle net share equity awards |
(2,938 |
) |
(1,419,228 |
) |
- | - | ||||||||||
|
Net cash provided by financing activities |
106,334,650 | 18,455,772 | - | 36,321,575 | ||||||||||||
|
Net increase/(decrease) in cash and cash equivalents |
51,619,949 | (15,079,126 |
) |
3,926,583 | 16,365,980 | |||||||||||
|
Cash and cash equivalents at beginning of period |
24,896,161 | 39,975,287 | 36,048,704 | 19,682,724 | ||||||||||||
|
Cash and cash equivalents at end of period |
$ | 76,516,110 | $ | 24,896,161 | $ | 39,975,287 | $ | 36,048,704 | ||||||||
|
Supplemental cash flow information: |
||||||||||||||||
|
Cash paid during the period for interest |
$ | 10,257,766 | $ | 9,911,793 | $ | 1,586,303 | $ | 10,886,687 | ||||||||
The accompanying notes are an integral part of these Consolidated Financial Statements.
EAGLE BULK SHIPPING INC. AND SUBSIDIARIES
NOTES TO CONSOLIDATED FINANCIAL STATEMENTS
Note 1. General Information:
The accompanying consolidated financial statements include the accounts of Eagle Bulk Shipping Inc. and its wholly-owned subsidiaries (collectively, the "Company,” “we” or “our” or similar terms). The Company is engaged in the ocean transportation of dry bulk cargoes worldwide through the ownership, charter and operation of dry bulk vessels. The Company's fleet is comprised of Supramax and Ultramax bulk carriers and the Company operates its business in one business segment.
Each of the Company’s vessels serve the same type of customer, have similar operation and maintenance requirements, operate in the same regulatory environment, and are subject to similar economic characteristics. Based on this, the Company has determined that it operates in one reportable segment, which is engaged in the ocean transportation of dry bulk cargoes worldwide through the ownership and operation of dry bulk carrier vessels.
The Company is a holding company incorporated in 2005, under the laws of the Republic of the Marshall Islands and is the sole owner of all of the outstanding shares of its wholly-owned subsidiaries formed in the Republic of the Marshall Islands. The primary activity of each of the subsidiaries is the ownership of a vessel. The operations of the vessels are managed by an indirectly wholly-owned subsidiary of the Company, Eagle Shipping International (USA) LLC, a Republic of the Marshall Islands limited liability company.
As of December 31, 2016, the Company owned and operated a modern fleet of 41 oceangoing vessels, 39 Supramax, 1 Ultramax and 1 Handymax, with a combined carrying capacity of 2,260,943 dwt and an average age of approximately 8.7 years. Additionally, the Company chartered in a 38,000 dwt new building beginning October 2, 2014 for a period of seven years.
The following table represents certain information about the Company's charterers, which individually accounted for more than 10% of the Company's gross charter revenue during the periods indicated:
Percentage of Consolidated Charter Revenue
|
Successor |
Predecessor |
|||||||||||||||
|
2016 |
2015 |
October 16, 2014 To December 31, 2014 |
January 1, 2014 To October 15, 2014 |
|||||||||||||
|
Charterer |
||||||||||||||||
|
Charterer A |
- | - | - | 10.5 |
% | |||||||||||
|
Charterer B* |
- | 17.2 |
% |
27.7 |
% |
17.7 |
% | |||||||||
*Includes charter revenue from a pool in which the Company participated.
Note 2. Corporate Reorganization:
Corporate Reorganization
On March 30, 2016, we entered into the contribution agreement (the “Contribution Agreement”) with a newly-formed wholly-owned subsidiary, Eagle Shipping LLC, a limited liability company organized under the laws of the Marshall Islands and a wholly-owned subsidiary of the Company (“Eagle Shipping”), pursuant to which the Company transferred, assigned and contributed to Eagle Shipping, and Eagle Shipping received, accepted and assumed, all of the tangible and intangible assets of the Company (other than the membership interests in Eagle Shipping owned by the Company and certain deposit accounts held by the Company, which deposit account balances were transferred) and all of the liabilities of the Company, including all of the Company’s rights and obligations under the senior secured credit facility dated as of October 9, 2014 (the “Exit Financing Facility”) (the “Contribution”). Immediately following the Contribution, Eagle Shipping became the direct parent company of each of the Company’s previously directly-owned subsidiaries and the indirect parent company of each of the Company’s previously indirectly-owned subsidiaries. The Contribution was part of a series of transactions contemplated by the agreements also entered into on March 30, 2016 and described below, which transactions were consummated on March 30, 2016, after the fulfillment of certain conditions precedent.
First Lien Facility
On March 30, 2016, Eagle Shipping, as borrower, and certain of its subsidiaries that were guarantors of the Company’s obligations under the Company’s senior secured credit facility (the “Exit Financing Facility”), as guarantors, entered into an Amended and Restated First Lien Loan Agreement (the “A&R First Lien Loan Agreement”) with the lenders thereunder (the “First Lien Lenders”) and ABN AMRO Capital USA LLC, as agent and security trustee for the lenders. The A&R First Lien Loan Agreement amended and restated the Exit Financing Facility in its entirety, providing for Eagle Shipping to be the borrower in the place of the Company, and further provided for a waiver of any and all events of default occurring as a result of the voluntary OFAC Disclosure (as defined below under Note 11 “Commitments and Contingencies - Legal Proceedings”). The A&R First Lien Loan Agreement provides for a term loan which was outstanding as of March 30, 2016, in the amount of $201,468,750 after giving effect to the entry into the A&R First Lien Loan Agreement and the Second Lien Loan Agreement (as defined below) as well as a $50,000,000 revolving credit facility, of which $10,000,000 was undrawn as of March 30, 2016 (the term loan, together with the revolving credit facility, the “First Lien Facility”). The First Lien Facility matures on October 15, 2019. An aggregate fee of $600,000 was paid to the agent and First Lien Lenders in connection with the First Lien Facility.
As of December 31, 2016, Eagle Shipping’s total availability in the revolving credit facility under the First Lien Facility was $25,000,000.
Eagle Shipping’s obligations under the First Lien Facility are secured by a first priority mortgage on each of the vessels currently in Eagle Shipping’s fleet and such other vessels that it may from time to time include with the approval of the First Lien Lenders, a first priority assignment of its earnings account, its liquidity account and its vessel-owning subsidiaries’ earnings accounts, a first priority assignment of all charters with terms that may exceed 18 months, freights, earnings, insurances, requisition compensation and management agreements with respect to the vessels,a first priority pledge of the membership interests of each of Eagle Shipping’s vessel-owning subsidiaries, and a non-recourse pledge by the Company of the membership interests of Eagle Shipping. In the future, Eagle Shipping may grant additional security to the lenders from time to time.
The A&R First Lien Agreement contains financial covenants requiring Eagle Shipping, among other things, to ensure that the aggregate market value of the vessels in Eagle Shipping’s fleet (plus the value of certain additional collateral) at all times on or after July 1, 2017 does not fall below 100% in the third and fourth quarters of 2017, 110% in 2018 and 120% in 2019 of the aggregate principal amount of debt outstanding (subject to certain adjustments) under the First Lien Facility and maintain minimum liquidity of not less than the greater of (i) $8,140,000 and (ii) $185,000 per vessel in Eagle Shipping’s fleet. In addition, the A&R First Lien Agreement also imposes operating restrictions on Eagle Shipping including limiting Eagle Shipping’s ability to, among other things: pay dividends; incur additional indebtedness; create liens on assets; acquire and sell capital assets (including vessels); and merge or consolidate with, or transfer all or substantially all of Eagle Shipping’s assets to, another person. The A&R First Lien Loan Agreement also includes customary events of default, including those relating to a failure to pay principal or interest, a breach of covenant, representation or warranty, a cross-default to other indebtedness and non-compliance with security documents. Further, there would be a default if any event occurs or circumstances arise in light of which, in the First Lien Lenders’ judgment, there is significant risk that Eagle Shipping is or would become insolvent. Eagle Shipping is not permitted to pay dividends. Indebtedness under the First Lien Facility may also be accelerated if Eagle Shipping experiences a change of control.
Upon entering into the A&R First Lien Loan Agreement, Eagle Shipping paid three quarters of amortization payments with respect to the term loan under the First Lien Facility in the aggregate amount of $11,718,750, paid down $30,158,500, a portion of the amount outstanding in respect of the revolving credit facility under the First Lien Facility, and added cash to the balance sheet. In addition, the Company paid the first quarter amortization of $3,906,250 under the previously outstanding Exit Financing Facility. For the fiscal quarters ending June 30, 2017, and June 30, 2018 and the fiscal years ending December 31, 2017 and December 31, 2018 (each, a “Semi-Annual Determination Date”), Eagle Shipping is obligated to repay the term loan under the First Lien Facility in an amount equal to 75% of Eagle Shipping’s excess cash flow for the two fiscal quarters ended as of such Semi-Annual Determination Date, subject to a cap of such mandatory prepayments of $15,625,000 in any fiscal year. Thereafter, Eagle Shipping will make payments of $3,906,250 on January 15, 2019, April 15, 2019, and July 15, 2019, and a final balloon payment equal to the remaining amount outstanding under the term loan under the First Lien Facility on October 15, 2019.
Eagle Shipping has prepaid $5,651,000 of the term loan as of December 31, 2016 pursuant to the terms of the A&R First Lien Loan Agreement relating to the mandatory prepayments upon sale of vessels. The repayment schedule above therefore has been adjusted to account for such prepayments made through December 31, 2016, such that Eagle Shipping is required to make the payments of $3,786,346 on January 15, 2019, April 15, 2019, and July 15, 2019, and a final balloon payment equal to the remaining amount outstanding under the First Lien Facility on October 15, 2019. As a result of the mandatory prepayments made through December 31, 2016, Eagle Shipping is not required to comply with the minimum security covenant until October 2017 pursuant to the terms of the A&R First Lien Loan Agreement.
Second Lien Facility
On March 30, 2016, Eagle Shipping, as borrower, and certain of its subsidiaries that were guarantors of the Company’s obligations under the Exit Financing Facility, as guarantors, entered into a Second Lien Loan Agreement (the “Second Lien Loan Agreement”) with certain lenders (the “Second Lien Lenders”) and Wilmington Savings Fund Society, FSB as agent for the Second Lien Lenders (the “Second Lien Agent”). The Second Lien Lenders include certain of the Company’s existing shareholders as well as other investors. The Second Lien Loan Agreement provides for a term loan in the amount of $60,000,000 (the “Second Lien Facility”), and matures on January 14, 2020 (91 days after the original stated maturity of the First Lien Facility). The term loan under the Second Lien Facility bears interest at a rate of LIBOR plus 14.00% per annum (with a 1.0% LIBOR floor) or the Base Rate (as defined in the Second Lien Loan Agreement) plus 13.00% per annum, paid in kind quarterly in arrears. The Company used the proceeds from the Second Lien Facility to pay down $30,158,500, a portion of the amount outstanding in respect of the revolving credit facility under the First Lien Facility, pay three quarters of amortization payments under the First Lien Facility, pay transaction fees in connection with the entry into the A&R First Lien Loan Agreement and the Second Lien Loan Agreement, and add cash to the balance sheet.
Eagle Shipping’s obligations under the Second Lien Facility are secured by a second priority lien on the same collateral securing Eagle Shipping’s obligations under the First Lien Facility, subject to the terms of the Intercreditor Agreement (as defined below). Eagle Shipping may grant additional security to the Second Lien Lenders from time to time in the future, subject to the terms of the Intercreditor Agreement.
The Second Lien Loan Agreement contains financial covenants substantially similar to those in the A&R First Lien Loan Agreement, subject to standard cushions, requiring Eagle Shipping, among other things, to ensure that the aggregate market value of the vessels in Eagle Shipping’s fleet (plus the value of certain additional collateral) at all times on or after July 1, 2017 does not fall below 100% in the third and fourth quarters of 2017, 110% in 2018 and 120% in 2019 of the aggregate principal amount of debt outstanding (subject to certain adjustments) under the Second Lien Facility (provided that Eagle Shipping will not be required to comply with such covenant until the discharge of its obligations under the A&R First Lien Loan Agreement) and to maintain a minimum liquidity of not less than the greater of (i) $6,512,000 and (ii) $148,000 per vessel in Eagle Shipping’s fleet. In addition, the Second Lien Loan Agreement also imposes operating restrictions on Eagle Shipping including limiting Eagle Shipping’s ability to, among other things: pay dividends; incur additional indebtedness; create liens on assets; acquire and sell capital assets (including vessels); and merge or consolidate with, or transfer all or substantially all of Eagle Shipping’s assets to, another person. Eagle Shipping may not prepay the Second Lien Facility while amounts or commitments under the First Lien Facility remain outstanding.
The Second Lien Loan Agreement also includes customary events of default, including those relating to a failure to pay principal or interest, a breach of covenant, representation or warranty, a cross-default to other indebtedness and non-compliance with security documents. Further, there would be a default if any event occurs or circumstances arise in light of which, in the Second Lien Lenders’ judgment, there is significant risk that Eagle Shipping is or would become insolvent. Eagle Shipping is not permitted to pay dividends. Indebtedness under the Second Lien Facility may also be accelerated if Eagle Shipping experiences a change of control.
In connection with the entry into the Second Lien Loan Agreement, on March 30, 2016, the Company agreed to issue 16,889,828 shares of common stock to the Second Lien Lenders pro rata based on their participation in the Second Lien Facility, which Second Lien Lenders received shares equivalent to approximately 90% of the outstanding common stock of the Company after such issuance. The issuance of the shares of common stock was made pursuant to the exemption from registration under Section 4(a)(2) of the Securities Act of 1933, as amended (the “Securities Act”).
In a first step, the Company issued and delivered 371,276 shares of common stock, representing approximately 19.4% of the Company’s pre-transaction outstanding shares of common stock, to the Second Lien Lenders. In a second step, approved by the Company’s shareholders at a special meeting held on August 2, 2016, the Company issued and delivered an additional 16,420,098 shares of common stock, to the Second Lien Lenders and an additional 98,454 shares of common stock, to the Chairman and Chief Executive Officer, both of whom participated as Second Lien Lenders.
The Company has proportionately allocated the proceeds from the Second Lien Loan Agreement based on the relative fair values of the Second Lien Facility and the common stock issued to the Second Lien Lenders. The difference between the $60 million principal value of the Second Lien Facility and its relative fair value, amounting to approximately $17.8 million, has been recorded as a discount to the recorded value of the Second Lien Facility and as Additional Paid-in capital. This discount is being amortized using the effective interest method over the term of the Second Lien Facility as a component of interest expense.
Intercreditor Agreement
Concurrently with Eagle Shipping’s entry into the A&R First Lien Loan Agreement and the Second Lien Loan Agreement, and in connection with the granting of security interests in and liens on the collateral securing obligations under those agreements, Eagle Shipping entered into the Intercreditor Agreement between the first lien agent and the second lien agent (the “Intercreditor Agreement”). The Intercreditor Agreement governs the relative rights and priorities of the secured parties in respect of liens on the assets of Eagle Shipping and its subsidiaries securing the First Lien Facility and the Second Lien Facility.
Note 3. Equity Offerings
Preferred Stock Private Placement
On May 26, 2016, the Company entered into a Preferred Stock Purchase Agreement (the “Preferred Stock Purchase Agreement”) with certain investors named therein, including certain of our existing shareholders and our Chairman and Chief Executive Officer (the “Purchasers”), pursuant to which the Company agreed to issue to the Purchasers in a private placement (the “Private Placement”) pursuant to the private placement exemption from registration under Section 4(a)(2) of the Securities Act and Rule 506 of Regulation D promulgated under the Securities Act, shares of the Company’s 15% Cumulative Nonparticipating Redeemable Series A Preferred Stock, par value $0.01 per share (the “Series A Preferred Stock”), at a purchase price of $1,000.00 per share with a 1.0% original issue discount, for aggregate gross proceeds expected to amount to approximately $6.3 million.
On September 7, 2016, the Company and each of the Purchasers executed the Termination Agreement, terminating the Preferred Stock Purchase Agreement. The Company agreed to make an aggregate termination payment to the Purchasers of $125,255, which is allocated among the Purchasers in proportion to the percentage of the shares of Series A Preferred Stock each Purchaser had previously agreed to purchase. The fees paid to the shareholders were recorded as other expense in the consolidated statement of operations for the year ended December 31, 2016.
Common Stock Offerings
On July 1, 2016 and July 10, 2016, respectively, the Company entered into Common Stock Purchase Agreements (collectively, the “Common Stock Purchase Agreements”), with certain purchasers (the “Common Stock Purchasers”). The Common Stock Purchasers include certain of our existing shareholders, who held approximately 70% of our outstanding equity prior to entry into the Common Stock Purchase Agreements and prior to giving effect to the delivery of all of the shares of common stock issued in connection with the Second Lien Loan Agreement, as well as our Chairman and Chief Executive Officer. The Common Stock Purchase Agreements provided for the issuance and sale by the Company to the Common Stock Purchasers of an aggregate amount of $88 million of common stock, at an initial price per share of $0.15, which amount per share was increased to $3.00 per share based on the reverse stock split ratio of 1-for-20 that became effective as of the opening of trading on August 5, 2016.
On August 10, 2016, the Company closed the transactions contemplated by the Common Stock Purchase Agreements for aggregate proceeds of $85.7 million net of fees and legal expenses. After giving effect to the Company’s previously announced reverse stock split of its issued and outstanding shares of common stock, including the rounding down of fractional shares pursuant to such split, the private placement included the issuance of 29,333,318 shares of the Company’s common stock. The Company intends to use the proceeds of the private placement for the acquisition of dry bulk vessels and general corporate purposes.
On December 13, 2016, the Company entered into a Stock Purchase Agreement with certain investors (the “Investors”), pursuant to which the Company agreed to issue to the Investors in a private placement (the “December Private Placement”) approximately 22.2 million shares of the Company’s common stock, par value $0.01 per share, at an initial purchase price of $4.50 per share, for aggregate gross proceeds of $100.0 million. On January 20, 2017, the Company closed its previously announced December Private Placement for aggregate net proceeds of $95 million. The Company plans to use the proceeds from the December Private Placement for the acquisition of dry bulk tonnage and general corporate purposes.
Authorized Shares and Reverse Split
On August 2, 2016, the Company held a Special Meeting of Shareholders where the shareholders approved, among other things, to increase the number of authorized shares of the Company’s common stock, from 150,000,000 to 700,000,000 and establish the number of authorized shares of preferred stock, par value US$0.01 per share, at 25,000,000 shares.
On August 5, 2016, the Company effected a 1-for-20 reverse stock split of its issued and outstanding shares of common stock. Upon the effectiveness of the reverse stock split, every 20 shares of issued and outstanding common stock for the Successor were combined into one issued and outstanding share of common stock, with no change in par value per share. The impact of the reverse stock split has been retrospectively applied to all Successor periods in the consolidated financial statements.
Note 4. Significant Accounting Policies:
|
(a) |
Principles of Consolidation and Fresh Start Accounting: The accompanying consolidated financial statements have been prepared in accordance with U.S. generally accepted accounting principles and include the accounts of Eagle Bulk Shipping Inc. and its wholly-owned subsidiaries. All intercompany balances and transactions were eliminated upon consolidation. We have made a reclassification adjustment to conform the prior period amounts to the current period presentation in the Consolidated Statements of Operations. This change in classification had no effect on the previously reported total operating expenses. For the year ended December 31, 2015, and for the period between October 16, 2014 and December 31, 2014 (Successor), we have reclassified the technical management costs of $6.1 million and $1.2 million respectively from vessel expenses to general and administrative expenses. For the period between January 1, 2014 and October 15, 2014 (Predecessor), $4.7 million of technical management costs included in Vessel expenses were reclassified to General and administrative expenses. This reclassification was done to align the Company’s presentation to that of many of its peers.
Upon the Company’s emergence from the Chapter 11 cases on October 15, 2014, the Company adopted fresh-start accounting in accordance with provisions of ASC 852, Reorganizations (“ASC 852”). Upon adoption of fresh-start accounting, the Company’s assets and liabilities were recorded at their fair value as of October 15, 2014, the fresh-start reporting date. The fair values of the Company’s assets and liabilities as of that date differed materially from the recorded values of its assets and liabilities as reflected in its historical consolidated financial statements. In addition, the Company’s adoption of fresh-start accounting materially affected its results of operations following the fresh-start reporting date, as the Company has a new basis in its assets and liabilities. Consequently, the Company’s historical financial statements prior to October 15, 2014 may not be reliable indicators of its financial condition and results of operations for any period after it adopted fresh-start accounting. As a result of the adoption of fresh-start reporting, the Company’s balance sheets and consolidated statements of operations subsequent to October 15, 2014 are not comparable in many respects to our consolidated balance sheets and consolidated statements of operations prior to October 15, 2014. |
|
(b) |
Use of Estimates: The preparation of consolidated financial statements in conformity with U.S. generally accepted accounting principles requires management to make estimates and assumptions that affect the reported amounts of assets and liabilities and disclosure of contingent assets and liabilities at the date of the consolidated financial statements and the reported amounts of revenues and expenses during the reporting period. Significant estimates include vessel valuations, residual value of vessels, useful life of vessels and the fair value of derivative instruments. Actual results could differ from those estimates. |
|
(c) |
Other Comprehensive loss: The Company records the fair value of interest rate swaps and foreign currency swaps as an asset or liability on the balance sheet. The effective portion of the swap is recorded in accumulated other comprehensive loss. Comprehensive loss is composed of net loss relating to the swaps, and unrealized gains or losses associated with the Company’s available for sale investment. The Company did not have any swaps and available for sale investments as of December 31, 2016 and 2015. |
|
(d) |
Cash, Cash Equivalents and Restricted Cash: The Company considers liquid investments such as time deposits and certificates of deposit with an original maturity of three months or less at the time of purchase to be cash equivalents. Restricted Cash amounting to $74,917 and $141,161 is collateralizing a letter of credit as of December 31, 2016 and December 31, 2015, respectively. |
|
(e) |
Accounts Receivable: Accounts receivable includes receivables from charterers for hire and voyage charterers. At each balance sheet date, all potentially uncollectible accounts are assessed for purposes of determining the appropriate provision for doubtful accounts. |
|
(f) |
Insurance Claims: Insurance claims are recorded on an accrual basis and represent the claimable expenses, net of deductibles, incurred through each balance sheet date, which are expected to be recovered from insurance companies. |
|
(g) |
Inventories: Inventories, which consist of bunkers, are stated at the lower of cost or market. Cost is determined on a first-in, first-out method. Lubes and spares are expensed as incurred. We will adopt Accounting Standard Update No. 2015-11, “Simplifying the Measurement of Inventory” prospectively effective January 1, 2017 that requires the inventory to be measured at the lower of cost and net realizable value. We believe that there will be no impact on the consolidated financial statements as a result of the adoption of the new accounting standard. |
|
(h) |
Investments: Prior to December 2015, the Company held an investment in the capital stock of Korea Line Corporation (“KLC”). This investment was designated as Available For Sale (“AFS”) and reported at fair value, with unrealized gains and losses recorded in stockholders’ equity as a component of accumulated other comprehensive loss. Investment gains and losses arise when investments are sold (as determined on a specific identification basis) or are other-than-temporarily impaired. If a decline in the value of an investment below cost is deemed other than temporary, the cost of the investment is written down to fair value, with a corresponding charge to earnings. Factors considered in judging whether an impairment is other than temporary include: the financial condition, business prospects and creditworthiness of the issuer, the relative amount of the decline, our ability and intent to hold the investment until the fair value recovers and the length of time that fair value has been less than cost. There is no investment balance as of December 31, 2016 and 2015. |
|
(i) |
Vessels and vessel improvements, at cost: Vessels are stated at cost, which consists of the contract price, and other direct costs relating to acquiring and placing the vessels in service. Major vessel improvements are capitalized and depreciated over the remaining useful lives of the vessels. At October 15, 2014, the Company’s vessels were adjusted to a fair value aggregating $842,625,000 as part of fresh start accounting. |
|
(j) |
Vessel lives and Impairment of Long-Lived Assets: The Company estimates the useful life of the Company's vessels to be 25 years from the date of initial delivery from the shipyard to the original owner. In addition, the Company estimates the scrap value of the vessels to be $300 per lwt based on the 15-year average scrap value of steel. Prior to October 15, 2014, the Company used a 28 year useful life for its vessels and a $150 per lwt estimate for scrap value.
The Company reviews long-lived assets for impairment whenever events or changes in circumstances indicate that the carrying amount of the assets may not be recoverable. When the estimate of undiscounted cash flows, excluding interest charges, expected to be generated by the use of the asset is less than its carrying amount, the Company will evaluate the asset for an impairment loss. Measurement of the impairment loss is based on the fair value of the asset as provided by third parties or discounted cash flow analyses. In this respect, management regularly reviews the carrying amount of the vessels in connection with the estimated recoverable amount for each of the Company's vessels. The Company has begun a fleet renewal strategy, which has been made possible as a result of raising capital through private placements of our common stock in the latter part of 2016. As of December 31, 2016, as part of our fleet renewal program, management considers it probable that we will divest some of our older vessels as well as certain less efficient vessels from its fleet to achieve operating cost savings. The Company identified two groups of vessels. Group 1 vessels were selected based on the shipyard they were built and their technical specifications. The group consists of five sister ships constructed in Dayang shipyard with 53,000 dwt. These vessels were identified by management as having poorer fuel efficiency, among other reasons, compared to their peers. The second group of 11 vessels are older than 13 years and less than 53,000 dwt. As vessels get older, they become more expensive to maintain and drydock. Additionally, management’s strategy entails trading larger Ultramax vessels as the Company renews its fleet. For those sixteen vessels, management believes that it is probable that such vessels will be sold within the next two years. Based on management’s projected undiscounted cash flows prior to sale, factoring the probability of sale, such vessels were determined to be impaired, and written down to their current fair value as of December 31, 2016, which was determined by obtaining broker quotes from two unaffiliated shipbrokers. As a result, the Company recorded an impairment charge of $122,860,600 in the fourth quarter of 2016. The carrying value of these vessels prior to impairment was $234,860,600. In addition to the above, in 2015, the Company identified six vessels which it was probable that the Company was going to sell, and recognized an impairment charge in 2015 of $50,872,734. The carrying value of these vessels prior to impairment in 2015 was $76,332,734. As the value of such vessels further declined in the first quarter of 2016, the Company recorded an additional impairment charge of $6,167,262 in that quarter. Out of the six vessels initially identified in 2015, four vessels were sold and two vessels have been reclassified to assets held for sale as of December 31, 2016 and subsequently sold. |
|
(k) |
Accounting for Drydocking Costs: The Company follows the deferral method of accounting for drydocking costs whereby actual costs incurred are deferred and are amortized on a straight-line basis over the period through the date the next drydocking is required to become due, generally 30 months if the vessels are 15 years old or more and 60 months for the vessels younger than 15 years. Costs deferred as part of the drydocking include direct costs that are incurred as part of the drydocking to meet regulatory requirements. Certain costs are capitalized during drydocking if they are expenditures that add economic life to the vessel, increase the vessel’s earnings capacity or improve the vessel’s efficiency. Direct costs that are deferred include the shipyard costs, parts, inspection fees, steel, blasting and painting. Expenditures for normal maintenance and repairs, whether incurred as part of the drydocking or not, are expensed as incurred. Unamortized drydocking costs of vessels that are sold are written off and included in the calculation of the resulting gain or loss in the year of the vessels’ sale. Unamortized drydocking costs are written off as drydocking expense if the vessels are drydocked before the expiration of the applicable amortization period. |
|
(l) |
Deferred Financing Costs: Fees incurred for obtaining new loans or refinancing existing ones are deferred and amortized to interest expense over the life of the related debt using the effective interest method. Unamortized deferred financing costs are written off when the related debt is repaid or refinanced and such amounts are expensed in the period the repayment or refinancing is made. Such amounts are classified as a reduction of the long-term debt balance on the consolidated balance sheets. Accordingly, $435,816 previously classified in other assets was retrospectively classified as a reduction of the long-term debt balance as of December 31, 2015 as a result of the adoption of ASU 2015-03 in 2016. |
|
(m) |
Other fixed assets: Other fixed assets are stated at cost less accumulated depreciation. Depreciation is based on a straight line basis over the estimated useful life of the asset. Other fixed assets consist principally of leasehold improvements, computers and software and are depreciated over 3-10 years. |
|
(n) |
Accounting for Revenues and Expenses: Revenues generated from time charters and/or revenues generated from profit sharing arrangements are recognized over the term of the respective time charter agreements as service is provided and the profit sharing is fixed and determinable. |
|
|
Under voyage charters, voyage expenses such as bunkers, port charges, canal tolls, cargo handling operations and brokerage commissions are paid by the Company whereas, under time charters, such voyage costs are paid by the Company's customers. Vessel operating costs include crewing, vessel maintenance and vessel insurance. All voyage and vessel operating expenses are expensed as incurred on an accrual basis, except for commissions. Commissions are recognized over the related time or voyage charter period since commissions are earned as the Company's revenues are earned. Probable losses on voyages are provided for in full at the time such loss can be estimated. |
|
|
For the Company’s vessels operating in a pool, revenues and voyage expenses are pooled and allocated to each pool participant under a time charter agreement basis in accordance with an agreed-upon formula. The formula in the pool agreement for allocating gross shipping revenues net of voyage expenses is based on points allocated to participants’ vessels based on cargo carrying capacity and other technical characteristics, such as speed and fuel consumption. The selection of charterers, negotiation of rates and collection of related receivables and the payment of voyage expenses, which include the cost of bunkers and port expenses, are the responsibility of the pool. The operating costs including crews, maintenance and insurance are typically paid by the owner of the vessel. The pool may enter into contracts that earn either voyage charter revenue or time charter revenue. Since the members of the pool share in the revenue less voyage expenses generated by the entire group of vessels in the pool, and the pool operates in the spot market, the revenue earned by these vessels is subject to the fluctuations of the spot market. The Company recognizes revenue from this pool arrangement based on its portion of the net distributions reported by the pool, which represents the net voyage revenue of the pool after voyage expenses and pool manager fees. The pool follows the same revenue recognition principles, as applied by the Company, in determining shipping revenues and voyage expenses, including recognizing revenue only after a charter has been agreed to by both the pool and the customer, even if the vessel has discharged its cargo and is sailing to the anticipated load port on its next voyage. |
|
(o) |
Unearned Charter Hire Revenue: Unearned charter hire revenue represents cash received from charterers prior to the time such amounts are earned. These amounts are recognized as revenue as services are provided in future periods. |
|
(p) |
Repairs and Maintenance: All repair and maintenance expenses are expensed as incurred and are recorded in Vessel Expenses. |
|
(q) |
Protection and Indemnity Insurance: The Company’s Protection and Indemnity Insurance is subject to additional premiums referred to as "back calls" or "supplemental calls" which are accounted for on an accrual basis and are recorded in Vessel Expenses. |
|
(r) |
Earnings Per Share: Basic earnings per share is computed by dividing the net income or loss by the weighted average number of common shares outstanding during the period. Diluted earnings per share reflects the impact of stock options, warrants and restricted stock unless their impact is antidilutive. |
|
(s) |
Interest Rate Risk Management: The Company is exposed to the impact of interest rate changes. The Company's objective is to manage the impact of interest rate changes on earnings and cash flows of its borrowings. The Company may use interest rate swaps to manage net exposure to interest rate changes related to its borrowings. |
|
(t) |
Federal Taxes: The Company is a Republic of the Marshall Islands Corporation. The Company does not believe its operations will quality for Internal Revenue Code Section 883 exemption and therefore will be subject to United States federal taxes on United States source shipping income. Such taxes, amounting to $0.6 million and $0.3 million, are included as a component of voyage expenses in the consolidated statements of operations for the years ended December 31, 2016 and 2015, respectively. Prior to October 16, 2014, we qualified for Internal Revenue Code Section 883 exemption and were not subject to federal taxes. |
|
(u) |
Restructuring charges : Restructuring charges consist of professional fees for advisors and attorneys who assisted the Company in the debt restructuring relative to the First Lien Facility in 2016. |
Impact of Recently Issued Accounting Standards
In May 2014, the FASB issued Accounting Standards Update, (“ASU”) No. 2014-09, Revenue from Contracts with Customers (“ASU 2014-09”), which supersedes nearly all existing revenue recognition guidance under U.S. GAAP. The core principle is that a company should recognize revenue when promised goods or services are transferred to customers in an amount that reflects the consideration to which an entity expects to be entitled for those goods or services. ASU 2014-09 defines a five-step process to achieve this core principle and, in doing so, more judgment and estimates may be required within the revenue recognition process than are required under existing U.S. GAAP. The standard is effective for annual periods beginning after December 15, 2017, and interim periods therein, and shall be applied either retrospectively to each period presented or as a cumulative-effect adjustment as of the date of adoption. In May 2016, the FASB issued Accounting Standards Update No. 2016-12, Revenue from Contracts with Customers. This update provides further guidance on applying collectability criterion to assess whether the contract is valid and represents a substantive transaction on the basis whether a customer has the ability and intention to pay the promised consideration. The requirements of this standard include an increase in required disclosures. Management has not yet selected a transition method and is currently analyzing the impact of the adoption of this guidance on the Company’s consolidated financial statements, including assessing changes that might be necessary to information technology systems, processes and internal controls to capture new data and address changes in financial reporting. The Company believes that the adoption of the standard will impact the timing of recognition of revenue.
In August 2014, the FASB issued ASU No. 2014-15, “Disclosure of Uncertainties about an Entity's Ability to Continue as a Going Concern.” This ASU establishes specific guidance to an organization's management on their responsibility to evaluate whether there is substantial doubt about the organization's ability to continue as a going concern. The provisions of this ASU are effective for interim and annual periods ending after December 15, 2016. There was no impact on the financial statements due to the adoption of this accounting standard.
In July 2015, the FASB issued ASU No. 2015-11, “Simplifying the Measurement of Inventory.” The new guidance specifies that the inventory be measured at the lower of cost and net realizable value. The amendment would apply prospectively and would be effective for annual reporting periods beginning after December 15, 2016 and interim reporting periods within annual reporting periods after December 15, 2017. The Company intends to adopt the new accounting standard as of January 1, 2017. The Company believes that there will be no impact on the consolidated financial statements because of the adoption of the new accounting standard.
In February 2016, the FASB issued Accounting Standards Update No. 2016-02, Leases. ASU 2016-02 is intended to increase the transparency and comparability among organizations by recognizing lease assets and lease liabilities on the balance sheet and disclosing key information about leasing arrangements. In order to meet that objective, the new standard requires recognition of the assets and liabilities that arise from leases. A lessee will be required to recognize on the balance sheet the assets and liabilities for leases with lease terms of more than 12 months. Accounting by lessors will remain largely unchanged from current U.S. generally accepted accounting principles. The requirements of this standard include an increase in required disclosures. The new standard is effective for public companies for fiscal years beginning after December 15, 2018, and interim periods within those years, with early adoption permitted. Lessees and lessors will be required to apply the new standard at the beginning of the earliest period presented in the financial statements in which they first apply the new guidance, using a modified retrospective transition method. The Company is currently evaluating the effect that adopting this standard will have on our financial statements and related disclosures. Management expects that the Company will recognize increases in reported amounts for vessel and other fixed assets and related lease liabilities upon adoption of the new standard. Refer to Note 11- Commitments and Contingencies for disclosure about the Company’s time charter and lease commitments as of December 31, 2016.
In March 2016, the FASB issued Accounting Standards Update No. 2016-09, “Stock Compensation”. The new guidance is intended to simplify several aspects of the accounting for share-based payment transactions, including the income tax consequences, classification of awards as either equity or liabilities and classification on the statement of cash flows. The Accounting Standard Update allows the entity to make an accounting policy election to account for forfeitures when they occur. The standard is effective for annual periods beginning after December 15, 2016 and interim periods within those annual periods. The Company believes there will be no impact on the consolidated financial statements as a result of the adoption of the new accounting standard.
In August 2016, the FASB issued Accounting Standards Update No. 2016-15, “Statement of Cash Flows (Topic 230) - Classification of Certain Cash Receipts and Cash Payments.” The new guidance is intended to provide specific guidance on cash flow classification issues such as debt prepayment or debt extinguishment costs, settlement of zero coupon debt instruments or cases where the coupon interest rate is insignificant compared to the effective interest rate of the borrowing, contingent consideration payments in a business combination, proceeds from insurance claim settlements and distributions received by equity method investees. The standard is effective for annual periods beginning after December 15, 2017 and interim periods within those annual periods. The amendments should be applied using a retrospective transition method to each period presented. The Company believes there will be no impact on the consolidated financial statements as a result of the adoption of the new accounting standard.
In October 2016, the FASB issued Accounting Standards Update No. 2016-17, “Interests held through related parties that are under Common Control. The amendments change the evaluation of whether a reporting entity is the primary beneficiary of a Variable Interest Entity by changing how a reporting entity that is a single decision maker of a VIE treats indirect interests in the entity held through related parties that are under common control. The amendments in this Update are effective for fiscal years beginning after December 15, 2016 and interim periods within those annual periods. The Company is not expecting any impact of the adoption of this standard on its consolidated financial statements.
In November 2016, the FASB issued Accounting Standards Update No. 2016-18, “Statement of Cash Flows- Restricted Cash”. The amendments in this Update require that a statement of cash flows explain the change during the period in the total of cash, cash equivalents, and amounts described as restricted cash and restricted cash equivalents. Therefore, the restricted cash and restricted cash equivalents should be included with cash and cash equivalents when reconciling the beginning-of-period and end-of-period total amounts shown on the statement of cash flows. The amendments in this Update are effective for fiscal years beginning after December 15, 2017 and interim periods within those fiscal years. The Company will include $74,917 of restricted cash within cash and cash equivalents when reconciling the beginning-of-period and end-of-period totals shown on the consolidated statement of cash flows upon adoption of this standard.
In January 2017, the FASB issued Accounting Standards Update No. 2017-01, “Business Combinations (Topic 805).” The amendments in this Update are intended to clarify the definition of business. The current guidance specifies three elements of a business – inputs, processes, and outputs. The new guidance provides a screen to determine when a set is not a business. The screen requires that when substantially all of the fair value of the gross assets acquired is concentrated in a single identifiable asset or group of similar identifiable assets, the set is not a business. This screen reduces the number of transactions that need to be further evaluated. The standard is effective to annual periods beginning after December 15, 2017, including interim periods within those periods. The Company is evaluating the potential impact of the adoption of this standard on its consolidated financial statements.
Note 5. Vessels
As of December 31, 2016, the Company’s operating fleet consisted of 41 dry bulk vessels. As of October 15, 2014, the Company’s vessels were adjusted to a fair value aggregating $842,625,000 as part of fresh start accounting. The Company estimated the fair values based primarily on valuations obtained from third-party specialists principally utilizing the market value approach.
As of December 31, 2015, we determined that the future undiscounted cash flows did not exceed the net book value on six of our vessels. This resulted from our intention to divest six of our older vessels in the short-term period. As a result, we reduced the carrying value of each identified vessel to its fair market value as of December 31, 2015 and recorded an impairment charge of $50,872,734.
As of March 31, 2016, due to further reduction in asset values of the aforementioned six vessels during the first quarter of 2016, we determined that the future undiscounted cash flows of six of our vessels did not exceed their net book value. As a result, we reduced the carrying value of each vessel to its fair market value as of March 31, 2016 and recorded an impairment charge of $6,167,262. Out of the six vessels, the Company sold four vessels during 2016 and two vessels were sold during the first quarter of 2017. The two vessels sold in the first quarter of 2017 were reclassified to assets held for sale as of December 31, 2016.
On April 26, 2016, the Company sold the vessel Peregrine for $2.6 million, after brokerage commissions and associated selling expenses, and recorded a net loss of approximately $150,000 in the second quarter of 2016. A portion of the proceeds was used towards repayment of the term loan under the First Lien Facility.
On June 16, 2016, the Company sold the vessel Falcon for $3.2 million, after brokerage commissions and associated selling expenses, and recorded a net loss of approximately $140,000 in the second quarter of 2016. A portion of the proceeds was used towards repayment of the term loan under the First Lien Facility.
On July 13, 2016, the Company sold the vessel Harrier for $3.2 million, after brokerage commissions and associated selling expenses, and recorded a net loss of $134,000. A portion of the proceeds was used towards repayment of the term loan under the First Lien Facility.
On September 6, 2016, the Company sold the vessel Kittiwake for $4.0 million, after brokerage commission, associated selling expenses, and recorded a net gain of approximately $316,000 in the third quarter of 2016. A portion of the proceeds was used towards repayment of the term loan under the First Lien Facility.
On September 30, 2016, the Company, through Eagle Shipco, signed a memorandum of agreement to acquire a 2016 NACKS built Ultramax 61,000 dwt vessel for $18.85 million. The Company took the delivery of the vessel in the fourth quarter of 2016. The purchase has been financed with cash on hand.
In November 14, 2016, the Company, through Eagle Shipco, signed a memorandum of agreement to acquire a 2017 built 64,000 dwt SDARI-64 Ultramax dry bulk vessel constructed at Chengxi Shipyard Co., Ltd for $17.9 million. The Company paid $1.9 million advance towards the purchase as of December 31, 2016. The Company took the delivery of the vessel in the first quarter of 2017.
On December 22, 2016, the Company signed a memorandum of agreement to sell the vessel Redwing for $5.8 million after brokerage commissions and associated selling expenses. The vessel was delivered to the buyers in first quarter of 2017. The Company will record a gain of $0.1 million in the first quarter of 2017. A portion of the proceeds was used towards repayment of the term loan under the First Lien Facility. As of December 31, 2016, the Company determined that all held for sale criteria were met for the vessel and classified the carrying amount of the vessel as a current asset in its consolidated balance sheet.
On March 15, 2017, the Company signed a memorandum of agreement to sell the vessel Sparrow for $4.8 million after brokerage commissions and associated selling expenses. The vessel will be delivered to the buyers in the second quarter of 2017. The Company will record a gain of $1.8 million in the second quarter of 2017. A portion of the proceeds will be used towards repayment of the term loan under the First Lien Facility. As of December 31, 2016, the Company determined that held for sale criteria were met for the vessel and classified the carrying amount of the vessel as a current asset in its consolidated balance sheet.
As of December 31, 2016, the Company is considering divesting some of the older as well as inefficient vessels from its fleet to achieve operating cost savings as well as potentially acquiring newer and more efficient vessels. The expected sale of vessels in the next two years reduces the useful life of the vessels resulting in impairment charge. As a result, we reduced the carrying value of each vessel to its fair market value as of December 31, 2016 and recorded an impairment charge of $122,860,600.
|
Vessels and Vessel Improvements, at December 31, 2015 |
$ | 733,960,731 | ||
|
Purchase of Vessel and Vessel Improvements |
19,860,401 | |||
|
Disposal of Vessels |
(13,102,860 |
) | ||
|
Reclassification to vessels held for sale |
(8,688,601 |
) | ||
|
Depreciation Expense |
(35,408,859 |
) | ||
|
Vessel impairment charge |
(129,027,862 |
) | ||
|
Vessels and Vessel Improvements, at December 31, 2016 |
$ | 567,592,950 | ||
Note 6. Investment
Korea Line Corporation (“KLC”)
During the year ended December 31, 2015, all the KLC shares have been sold for net proceeds of $7.8 million and a loss of $0.5 million recorded for the year ended December 31, 2015.
The KLC investment was designated as Available For Sale (“AFS”) and was reported at its fair value, with unrealized gains and losses recorded in equity as a component of accumulated other comprehensive income (loss) (“AOCI”). The fair value of KLC shares are determined from the market price as quoted on the Korean Stock Exchange and by converting the South Korean Won (“KRW”) extended value into U.S. dollars with the exchange rate applicable on date of conversion. The Company reviewed the investment in KLC for impairment on a quarterly basis.
The following table represents the movement in KLC capital stock, which was recorded at fair value:
|
No. of KLC Shares |
Cost Basis-Adjusted |
Fair Value |
Unrealized Gain/(Loss) reported in OCI |
Other-than Temporary Loss reported in Earnings-YTD |
Gain/(Loss) On Sale of KLC Stock-YTD |
|||||||||||||||||||
|
Balance at January 1, 2014 (Predecessor) |
566,529 | $ | 13,817,439 | $ | 13,817,439 | $ | (18,414,366 |
) |
$ | (417,966 |
) | |||||||||||||
|
Fair Value-Adjustments, net |
(442,288 |
) |
(442,288 |
) |
||||||||||||||||||||
|
Fair Value-Adjustments, net |
210,293 | 210,293 | ||||||||||||||||||||||
|
Reorganization Adjustment |
(231,995 |
) |
231,995 | |||||||||||||||||||||
|
Balance at October 16, 2014 (Successor) |
566,529 | 13,585,444 | 13,585,444 | - | ||||||||||||||||||||
|
KLC Stock sold |
(179,076 |
) |
(4,294,267 |
) |
(4,294,267 |
) |
||||||||||||||||||
|
Other-than-Temporary Loss Adjustments |
(990,437 |
) |
(990,437 |
) |
(990,437 |
) |
- | |||||||||||||||||
|
Balance at December 31, 2014 (Successor) |
387,453 | 8,300,740 | 8,300,740 | (990,437 |
) |
|||||||||||||||||||
|
KLC Stock sold |
(387,453 |
) |
$ | (8,300,740 |
) |
$ | (7,838,346 |
) |
||||||||||||||||
|
Loss on sale of KLC stock |
(462,394 |
) |
$ | (462,394 |
) | |||||||||||||||||||
|
Balance at December 31, 2015 (Successor) |
- | $ | - | $ | - | $ | - | - | $ | (462,394 |
) | |||||||||||||
Note 7. Deferred Drydock Costs
Drydocking activity is summarized as follows:
|
Successor |
Predecessor |
|||||||||||||||
|
2016 |
2015 |
October 16, 2014 To December 31, 2014 |
January 1, 2014 To October 15, 2014 |
|||||||||||||
|
Beginning Balance |
$ | 11,146,009 | $ | 1,960,792 | $ | - | $ | 3,826,685 | ||||||||
|
Payment for drydocking |
3,688,711 | 11,141,561 | 1,960,792 | 3,802,795 | ||||||||||||
|
Drydock amortization |
(3,327,411 |
) |
(1,956,344 |
) |
- | (2,521,478 |
) | |||||||||
|
Write-off as part of Fresh Start Accounting |
- | - | - | (5,108,002 |
) | |||||||||||
|
Ending Balance |
$ | 11,507,309 | $ | 11,146,009 | $ | 1,960,792 | $ | - | ||||||||
Note 8. Other Accrued Liabilities
Other accrued liabilities consist of:
|
December 31, 2016 |
December 31, 2015 |
|||||||
|
Vessel and voyage expenses |
$ | 6,986,486 | $ | 8,901,904 | ||||
|
General and administrative expenses |
3,446,113 | 1,347,951 | ||||||
|
Other expenses |
1,112,848 | 577,220 | ||||||
|
Balance |
$ | 11,545,447 | $ | 10,827,075 | ||||
Note 9. Debt
Long-term debt consists of the following:
|
December 31, 2016 |
December 31, 2015 |
|||||||
|
First Lien Facility / Exit Financing Facility* |
$ | 209,099,000 | $ | 245,375,000 | ||||
|
Debt issuance costs - First Lien / Exit Financing Facility |
(4,746,682 |
) |
(4,172,509 |
) | ||||
|
First Lien Facility / Exit Financing Facility net of debt issuance costs |
204,352,318 | 241,202,491 | ||||||
|
Second Lien Facility |
67,327,843 | - | ||||||
|
Debt discount and Debt issuance costs - Second Lien Facility |
(15,736,617 |
) |
- | |||||
|
Second Lien Facility, net of Debt issuance costs debt discount |
51,591,226 | - | ||||||
|
Less: Current Portion Exit Financing Facility |
- | (15,625,000 |
) | |||||
|
Total debt |
$ | 255,943,544 | $ | 225,577,491 | ||||
*Includes loan balances on term loan and revolver loan facility under the First Lien Facility and Exit Financing Facility as of December 31, 2016 and 2015, respectively.
Refer to “Note 2. Corporate Reorganization” for discussion of recent debt-related transactions.
For 2016, interest rates on our outstanding debt ranged from 3.86% to 4.99%, including a margin over LIBOR applicable under the terms of the First Lien Facility. The weighted average effective interest rate for the First Lien Facility including the amortization of debt discount for this period was 6.83%. The interest rate on payment-in-kind interest on our Second Lien Facility was 15% including a margin over LIBOR. The weighted average effective interest rate on our Second Lien Facility including the amortization of debt discount for this period was 17.05%. The payment-in-kind interest is due January 19, 2020.
For 2015, interest rates on our outstanding debt ranged from 3.696% to 4.08%, including a margin over LIBOR applicable under the terms of the amended Exit Financing Facility. The weighted average effective interest rate including the amortization of debt discount for this period was 5.06%.
For 2014, interest rates on our outstanding debt ranged from 3.63% to 7.40%, including a margin over LIBOR applicable under the terms of the amended credit facility for the Predecessor. The weighted average effective interest rate was 2.93% for the Predecessor. For 2014, interest rates on our outstanding debt ranged from 4.028% to 4.037%, including a margin over LIBOR applicable under the terms of the amended credit facility for the Successor. The weighted average effective interest rate was 4.13% for the Successor.
For the years ended December 31, 2016 and 2015, a commitment fee of 40% of the margin was incurred on the undrawn portion of the First Lien Facility. For the period between October 16, 2014 and December 31, 2014 (Successor), a commitment fee of 0.7% was incurred on the undrawn portion of the Exit Financing Facility and for the period between January 1, 2014 and October 15, 2014 (Predecessor), a commitment fee of 0.7% was incurred on the undrawn portion of the facility.
Interest Expense consisted of:
|
Successor |
Predecessor |
||||||||||||||||
|
2016 |
2015 |
October 16, To December 31, 2014 |
January 1, To October 15, 2014 |
||||||||||||||
|
First Lien Facility / Exit Financing Facility Interest |
$ | 9,938,822 | $ | 9,781,106 | $ | 2,103,151 | $ | - | |||||||||
|
Amortization of Debt issuance costs |
4,532,481 | 2,146,316 | 256,175 | - | |||||||||||||
|
Payment in kind interest on Second Lien Facility |
7,327,843 | ||||||||||||||||
|
Term loan Interest |
- | - | - | 43,314,831 | |||||||||||||
|
Amortization of Term Loan Deferred Financing Costs |
- | - | - | 16,278,544 | |||||||||||||
|
Debtor-In-Possession Interest |
- | - | - | 394,096 | |||||||||||||
|
Amortization of DIP Deferred Financing Costs |
- | - | - | 750,000 | |||||||||||||
|
Total Interest Expense |
$ | 21,799,146 | $ | 11,927,422 | $ | 2,359,326 | $ | 60,737,471 | |||||||||
Interest paid amounted to $10,257,766 in 2016, $9,911,793 in 2015, $10,886,687 from January 1, 2014 to October 15, 2014 and $1,586,303 from October 16, 2014 to December 31, 2014.
The United States Bankruptcy Code generally provides guidance that specifically limits post-petition interest accruals on secured debt and allows accrual only when the collateral securing the claims exceeds the principal amount of the debt and any accrued interest. As these criteria were not met, the Company ceased to accrue interest on the term and PIK Loans as of August 6, 2014, with the exception of the interest on the DIP Loan Facility (described below). As a result, during the bankruptcy proceedings, interest in the amount of $14,844,413 was not accrued for the period from August 6, 2014 through October 15, 2014. The Company did not make the scheduled June 30, 2014 interest payment or any other payment subsequent to this date. The Consenting Lenders (as defined herein) agreed to forbear from exercising any rights or remedies with respect to this otherwise due interest payment until the termination of the forbearance period afforded by the waiver. Interest continued to accrue on the unpaid interest payment during the period of forbearance at the penalty rate specified in the Exit Financing Facility. The commencement of the Chapter 11 cases constituted an event of default that accelerated the Company’s obligations under the Exit Financing Facility, subject to an automatic stay of any action to collect, assert or recover a claim against the Company and the application of the applicable provisions of the Bankruptcy Code.
Senior Secured Debtor-in-Possession Term Loan Agreement
On August 6, 2014, the Company filed the Chapter 11 cases in the United States Bankruptcy Court for the Southern District of New York (the “Court”). Through the Chapter 11 cases, the Company sought to implement a balance sheet restructuring pursuant to the terms of its prepackaged plan of reorganization filed with the Court (the “Plan”). The Company continued to operate its business as a “debtor in possession” under the jurisdiction of the Court and in accordance with the applicable provisions of the Bankruptcy Code and orders of the Court.
Refer to “Note 2. Corporate Reorganization” and “Note 18. Bankruptcy”.
On August 8, 2014, the Court entered an interim order (the “Interim Order”) authorizing the Company’s entry into the DIP Loan Facility. Following the entry of the Interim Order, on August 8, 2014, the Company entered into (the “DIP Loan Facility”) among the Company, the subsidiary guarantors from time to time party thereto (the “Guarantors”), the lenders party thereto (the “DIP Lenders”), Wilmington Trust (London) Limited, as DIP Agent and Security Trustee (the “DIP Security Trustee”) and Goldman Sachs Lending Partners LLC, as Sole Book runner and Sole Lead Arranger.
The DIP Loan Facility had a nine-month term, subject to a three month extension at the option of the Company (the “Extension Option”) provided no default or Event of Default had occurred thereunder and upon payment by the Company of an extension fee to the DIP Lenders equal to 0.75% of each DIP Lender’s commitment thereunder, unless prior to the end of such nine month period, the Plan was confirmed pursuant to an order entered by the Court, in which case, the DIP Loan Facility would terminate on the date of such confirmation. The amount committed and made available under the DIP Loan Facility was $50 million, of which $25 million was available following the entry of the Interim Order. On September 19, 2014, the Court entered an order approving the DIP Loan Facility on a final basis.
The DIP Loan Facility bore interest at a rate of LIBOR plus an applicable margin of (i) 5.00% or (ii) upon the exercise of the Extension Option, 7.00%. The DIP Loan Facility had a minimum liquidity covenant of $22.5 million and a maximum capital expenditures covenant, each tested as of the end of each fiscal monthly period, and a budget compliance covenant tested on a rolling four-week look-back basis, commencing with the four-week period ending August 29, 2014 and on each four week anniversary of such date.
Discharge
On the Effective Date, and in accordance with the Plan, the amended credit agreement was terminated and all liens and mortgages related thereto were released as part of the Plan, and the DIP Loan Facility was repaid in full and all liens and mortgages related thereto were released.
Exit Financing Facility
On October 9, 2014, the Company entered into the Exit Financing Facility with the Exit Lenders. The Exit Financing Facility was in the amount of $275 million, including a $50 million revolving credit facility out of which $40 million was drawn as of December 31, 2015, and had a maturity date of on October 15, 2019. A fee of $5.5 million was paid to the lenders in connection with the Exit Financing Facility. Amounts drawn under the Exit Financing Facility bore interest at a rate of LIBOR plus margin ranging between 3.50% and 4.00% per annum. The revolving credit facility was subject to an annual commitment fee of 40% of the margin.
The Company’s obligations under the Exit Financing Facility were secured by a first priority mortgage on each of the vessels in its fleet and such other vessels that it may from time to time include with the approval of the Exit Lenders, a first assignment of its earnings account, its liquidity account and its vessel-owning subsidiaries’ earnings accounts, a first assignment of all charters (having a term which may exceed 18 months), freights, earnings, insurances, requisition compensation and management agreements with respect to the vessels and a first priority pledge of the membership interests of each of its vessel-owning subsidiaries.
The Exit Financing Facility contained certain restrictive financial covenants requiring the Company, among other things to repay the Exit Financing Facility in 20 equal consecutive quarterly repayment installments each in an amount of $3,906,250.
The Exit Financing Facility also included customary events of default, including those relating to a failure to pay principal or interest, a breach of covenant, representation or warranty, a cross-default to other indebtedness and non-compliance with security documents.
Forbearance Agreement
On January 15, 2016, the Company entered into a Forbearance and Standstill Agreement (the “Forbearance Agreement”) by and among the Company, certain subsidiaries of the Company party to the Exit Financing Facility as guarantors and each lender under the loan agreement executing the Forbearance Agreement, which constitute the majority lenders (the “Specified Lenders”) where by the Specified Lenders agreed to forbear, during the forbearance period, from exercising certain of their available remedies under the Exit Financing Facility with respect to or arising out of:
|
|
● |
one or more events of default that exist as a result of the Company’s voluntary self-disclosure report file with OFAC described above (the “Disclosed Defaults”); and |
| ● |
the subsequent event of default that occurred as a result of the Company’s failure to pay when due the quarterly repayment installment due January 15, 2016, under the loan agreement (the “Payment Default” and, together with the Disclosed Defaults, the “Specified Defaults”). |
The Company, the guarantors, the Specified Lenders and the agent and security trustee under the Exit Financing Facility amended the Forbearance Agreement seven times to extend the period of forbearance, the final amendment dated as of March 22, 2016, until March 29, 2016. In connection with the second amendment to the Forbearance Agreement, on February 9, 2016, the Company made the quarterly payment installment to the Exit Lenders that was due on January 15, 2016 in the amount of $3,906,250, which payment served to cure the related event of default under the Exit Financing Facility. In addition, in connection with the second, fourth amendment and sixth amendment, the Specified Lenders and the agent and security trustee agreed to temporarily waive the Company’s compliance with the minimum liquidity covenant under the Exit Financing Facility, each time reducing the liquidity that was required to be maintained. Under the fourth waiver, dated as of March 18, 2016, the Company was granted a further temporary waiver of minimum liquidity covenant to temporarily eliminate its application.
Corporate Reorganization and Refinancing
See “Note 2. Corporate Reorganization.”
First Lien Facility
See “Note 2. Corporate Reorganization.”
Second Lien Facility
See “Note 2. Corporate Reorganization.”
Note 10. Derivative Instruments and Fair Value Measurements
Historically, the Company entered into interest rate swaps to effectively convert a portion of its debt from a floating to a fixed-rate basis. Under these swap contracts, exclusive of applicable margins, the Company pays fixed rate interest and receives floating-rate interest amounts based on three-month LIBOR settings. The swaps are designated and qualify as cash flow hedges. As of December 31, 2016 and December 31, 2015, the Company did not have any open positions and as such, no asset or liability is recorded in the accompanying consolidated balance sheets.
Forward freight agreements, bunker swaps and freight derivatives
The Company trades in forward freight agreements (“FFAs”), with the objective of utilizing this market as economic hedging instruments that reduce the risk of specific vessels to changes in the freight market. The Company’s FFAs have not qualified for hedge accounting treatment. As such, unrealized and realized gains are recognized as a component of other expense in the Consolidated Statement of Operations for the year ended December 31, 2016. The Company did not have any open positions in FFAs for the Successor as of December 31, 2016 and December 31, 2015.
The effect of non-designated derivative instruments on the consolidated statements of operations:
|
Derivatives not designated as hedging instruments |
Location of loss recognized |
Amount of Loss |
Amount of Loss |
||||||||||||||
|
Successor |
Predecessor |
||||||||||||||||
|
For the year ended December 31, 2016 |
For the year ended December 31, 2015 |
October 16, 2014 to December 31, 2014 |
January 1, 2014 to October 15, 2014 |
||||||||||||||
|
FFAs |
Other expense |
$ | 561,495 | $ | - | $ | - | $ | - | ||||||||
|
Total |
$ | 561,495 | $ | - | $ | - | $ | - | |||||||||
Cash Collateral Disclosures
The Company does not offset fair value amounts recognized for derivatives by the right to reclaim cash collateral or the obligation to return cash collateral. As of December 31, 2016 and 2015, the Company does not have any open positions and there was no cash collateral related to derivative instruments under its collateral security arrangements.
Fair Value Measurements
The following methods and assumptions were used to estimate the fair value of each class of financial instrument:
Cash, cash equivalents and restricted cash—the carrying amounts reported in the consolidated balance sheets for interest-bearing deposits approximate their fair value due to their short-term nature thereof.
Debt—the carrying amounts of borrowings under the First Lien Facility (prior to application of the discount and debt issuance costs) including the revolving credit agreement approximate their fair value, due to the variable interest rate nature thereof.
The Company defines fair value, establishes a framework for measuring fair value and provides disclosures about fair value measurements. The fair value hierarchy for disclosure of fair value measurements is as follows:
Level 1 – Quoted prices in active markets for identical assets or liabilities. Our Level 1 non-derivatives include cash, money-market accounts and restricted cash accounts.
Level 2 – Quoted prices for similar assets and liabilities in active markets or inputs that are observable. Our Level 2 non-derivatives include our debt balances under the First Lien Facility.
Level 3 – Inputs that are unobservable (for example cash flow modeling inputs based on assumptions).
As of December 31, 2016, as part of its fleet renewal program, the Company considers it probable that it will divest some of its older vessels as well as certain less efficient vessels from its fleet to achieve operating cost savings. For the sixteen vessels identified, the Company projects that they will probably be sold within the next two years. Based on market prices for such vessels and our projected undiscounted cash flows prior to sale, such vessels were determined to be impaired, and written down to their current fair value, which was determined by obtaining broker quotes from two unaffiliated shipbrokers. As a result, we recorded an impairment charge of $122,860,600 in the fourth quarter of 2016. The carrying value of these vessels prior to impairment was $234,860,600. The Company considers the valuation on such vessels to be a level 3 valuation. In addition to the above, we recorded an additional impairment charge of $6,167,262 in first quarter of 2016 on six vessels which were identified as probable to dispose as of December 31, 2015. Out of the six vessels initially identified in 2015, four vessels were sold during 2016 and two vessels were sold in the first quarter of 2017 and have been reclassified to assets held for sale as of December 31, 2016.
Note 11. Commitments and Contingencies
Operating Lease
On October 15, 2015, the Company entered into a new commercial lease agreement as a subtenant for office space in Stamford, Connecticut. The lease is effective from January 1, 2016 through June 29, 2023, with an average annual rent of $419,536. The lease is secured by a letter of credit backed by cash collateral of $74,917 which amount is recorded as restricted cash in the accompanying consolidated balance sheets. Rent expense recorded for the years ended December 31, 2016 and 2015 was $840,303 and $2,591,489 respectively. Rent expense for 2015 includes lease termination fees of $1,334,301 on its office space in New York, New York. The rent expense for the period from October 16, 2014 to December 31, 2014 was $272,365. During the period from January 1, 2014 to October 15, 2014, the rent expense for the Predecessor was $1,061,608. In September 2014, the Company entered into a lease office agreement in Singapore which expires in October 2017.
The future minimum commitments under the leases for office space as of December 31, 2016 are as follows:
(In thousands of US dollars)
|
2017 |
$ | 577 | ||
|
2018 |
438 | |||
|
2019 |
443 | |||
|
2020 |
456 | |||
|
Thereafter |
1,198 | |||
|
Total |
$ | 3,112 |
Legal Proceedings
The Company is involved in legal proceedings and may become involved in other legal matters arising in the ordinary course of its business. The Company evaluates these legal matters on a case-by-case basis to make a determination as to the impact, if any, on its business, liquidity, results of operations, financial condition or cash flows.
In November 2015, the Company filed a voluntary self-disclosure report regarding certain apparent violations of U.S. sanctions regulations in the provision of shipping services for third party charterers with respect to the transportation of cargo to or from Myanmar. At the time of such apparent violations, the Company had a different senior operational management team. There can be no assurance that Office of Foreign Assets Control (“OFAC”) will not conclude that these past actions warrant the imposition of civil penalties and/or referral for further investigation by the U.S. Department of Justice. The report was provided to OFAC for the agency’s review, consideration and determination regarding what action, if any, may be taken in resolution of this matter. The Company will continue to cooperate with the agency regarding this matter and cannot estimate when such review will be concluded. While the ultimate impact of these matters cannot be determined, there can be no assurance that the impact will not be material to the Company’s financial condition or results of operations.
Other Commitments
On July 28, 2011, the Company entered into an agreement to charter-in a 37,000 dwt newbuilding Japanese vessel that was delivered in October 2014 for seven years with an option for an additional one year. The hire rate for the first to seventh year is $13,500 per day and $13,750 per day for the eighth year option.
On May 9, 2016, the Company entered into an agreement to charter-in a 63,000 dwt newbuilding Chinese vessel that was delivered on May 20, 2016 for a period of nine to fourteen months. The hire rate for the term is $6,000 per day.
On July 12, 2016, the Company entered into an agreement to charter-in a 61,000 dwt Japanese vessel that was delivered in July 2016 for a period of eleven to thirteen months. The hire rate for the term is $6,000 per day.
On November 14, 2016, the Company, through the newly formed subsidiary, Eagle Shipco, signed a memorandum of agreement to acquire a 2017 built 64,000 deadweight SDARI-64 Ultramax dry bulk vessel constructed at Chengxi Shipyard Co., Ltd for $17.9 million. The Company paid a $1.9 million advance towards the acquisition of the vessel in 2016. The Company took delivery of the vessel in the first quarter of 2017.
Note 12. Reorganization Items, Net
Reorganization items, net represent amounts incurred and recovered subsequent to the bankruptcy filing as a direct result of the filing of the Prepackaged Case and are comprised of the following:
|
Successor |
Predecessor |
|||||||||||||||
|
Year Ended December 31, 2016 |
Year Ended December 31, 2015 |
October 16, 2014 To December 31, 2014 |
January 1, 2014 To October 15, 2014 |
|||||||||||||
|
Professional Fees Incurred |
$ | - | $ | - | $ | 45,542 | $ | 25,311,230 | ||||||||
|
Reorganization items and fresh-start reporting adjustments, net |
- | - | - | 402,423,980 | ||||||||||||
|
Total Reorganization Items |
$ | - | $ | - | $ | 45,542 | $ | 427,735,210 | ||||||||
Note 13. Transactions with related party
On October 15, 2014, the Company entered into a Management Agreement (the “Management Agreement”) with Delphin Shipping LLC (“Delphin”). As per the Management Agreement, the technical management fee is $700 per vessel per day. The commercial management fee is 1.25% of charter hire; provided, however, that no commercial management fee shall be payable with respect to a charter hire that is earned while a vessel is a member of a pool and with respect to which a fee is paid to the pool manager. The former Chief Executive Officer of the Company was one of the investors in Delphin.
On May 22, 2015, the Company received a termination notice to the Amended Management Agreement from Delphin. The notice of termination was given pursuant to the terms of the Amended Management Agreement and became effective as of August 22, 2015.
Total management fees for the year ended December 31, 2015 amounted to $2,379,787. The total reimbursable expenses amounted to $227,105. Total management fees for the period October 16, 2014 to December 31, 2014 amounted to $402,661. The total reimbursable expenses for the period October 16, 2014 to December 31, 2014 amounted to $27,115. The advance balance received from Delphin on account for the management of its vessels as of December 31, 2015 was $245,569.
For the Predecessor, total management fees for the period from January 1, 2014 to October 15, 2014 was $1,722,973. The total reimbursable expenses for the period from January 1, 2014 to October 15, 2014 amounted to $203,097.
Note 14. Loss per Common Share
The computation of basic net loss per share is based on the weighted average number of common shares outstanding for the years ended December 31, 2016 and December 31, 2015 and for the period ended December 31, 2014 for the Successor and for the period ended October 15, 2014 for the Predecessor, respectively. The Predecessor diluted net loss per share for the period ended October 15, 2014 also reflects the weighted average of the underlying Warrant Shares issuable upon exercise of the 615,997 warrants at the exercise price of $0.01 per share. In accordance with the accounting literature, the Company has given effect to the issuance of these warrants in computing basic net loss per share because the underlying shares are issuable for little or no cash consideration. Diluted net loss per share gives effect to stock awards, stock options and restricted stock units using the treasury stock method, unless the impact is anti-dilutive. Diluted net loss per share for the year ended December 31, 2016 does not include 1,413,461 unvested stock awards, 152,266 warrants and 1,942,909 stock options as their effect was anti-dilutive. Diluted net loss per share for the year ended December 31, 2015 does not include 39,231 unvested stock awards, 68,867 stock options and 152,266 warrants as their effect was anti-dilutive. Diluted net loss per share for the Successor Period ended December 31, 2014 does not include 45,045 stock awards, 123,874 stock options and 152,266 warrants, as their effect was anti-dilutive. Diluted net loss per share as of October 15, 2014 does not include 123,667 restricted stock units and 1,727,667 stock options, as their effect was anti-dilutive.
|
Successor |
Predecessor |
|||||||||||||||
|
Year Ended December 31, 2016 |
Year Ended December 31, 2015 |
October 16, 2014 To December 31, 2014 |
January 1, 2014 To October 15, 2014 |
|||||||||||||
|
Net loss |
$ | (223,522,435 |
) |
$ | (148,296,965 |
) |
$ | (11,548,728 |
) |
$ | (531,803,257 |
) | ||||
|
Weighted Average Shares-Basic* |
20,565,652 | 1,880,116 | 1,875,227 | 17,857,408 | ||||||||||||
|
Dilutive effect of stock options and restricted stock units |
- | - | - | |||||||||||||
|
Weighted Average Shares - Diluted* |
20,565,652 | 1,880,116 | 1,875,227 | 17,857,408 | ||||||||||||
|
Basic loss Per Share |
$ | (10.87 |
) |
$ | (78.88 |
) |
$ | (6.16 |
) |
$ | (29.78 |
) | ||||
|
Diluted loss Per Share |
$ | (10.87 |
) |
$ | (78.88 |
) |
$ | (6.16 |
) |
$ | (29.78 |
) | ||||
*Adjusted to give effect for the 1 for 20 reverse stock split for the Successor that became effective as of the opening of trading on August 5, 2016.
Note 15. Stock Incentive Plans
Eagle Bulk Shipping - Predecessor
2011 Equity Incentive Plan. In November 2011, our shareholders approved the 2011 Equity Incentive Plan (the “2011 Plan”) for the purpose of affording an incentive to eligible persons. The 2011 Equity Incentive Plan provided for the grant of equity based awards, including stock options, stock appreciation rights, restricted stock, restricted stock units, dividend equivalents, unrestricted stock, other equity based or equity related awards, and/or performance compensation awards based on or relating to the Company's common shares to eligible non-employee directors, officers, employees or consultants. A compensation committee or such other committee of the Company’s board of directors administered the 2011 Plan. An aggregate of 5.9 million of the Company's common shares have been authorized for issuance under the 2011 Plan. The shares reserved for issuance under the 2011 Plan were not subject to adjustment in the event of a stock split commenced prior to the Company’s 2011 Annual General Meeting. However, the 2011 Plan was approved by shareholders subject to the Company’s confirmation in the proxy materials relating to the approval of the 2011 Plan that no options granted under the plan would, in the aggregate, exceed 10% of the Company’s issued and outstanding shares on a fully diluted basis on the date the options first become exercisable.
On June 26, 2012, upon the Company’s refinancing of its credit facility, the Company granted options, under the 2011 Plan, to certain members of the Company’s senior management to purchase an aggregate of 1,580,000 of the Company's common shares. The options had an exercise price of $3.34 per share, vested in four equal annual installments beginning on the grant date, and expired between five to ten years from the date of grant. The Company has recorded non-cash compensation charges $555,344 for the period between January 1, 2014 and October 15, 2014 (Predecessor).
In December 2011, the Company granted 415,750 Restricted Stock Units ("RSUs") to members of its management and certain employees. Each RSU granted to the participant represented the right to receive one share of the Company's common stock as of the date of vesting, with such vesting to occur ratably over three years. The fair value of the non-vested restricted stock at the grant date for the period between January 1, 2014 and October 15, 2014 was $517,039.
As part of the Plan, on the Effective Date all outstanding and unvested RSUs and options have been canceled.
Eagle Bulk Shipping - Successor
2014 Management Incentive Plan
On October 15, 2014, in accordance with the Plan, the Company adopted the post-emergence Management Incentive Program (the “2014 Plan”), which provides for the distribution of New Eagle MIP Primary Equity in the form of shares of New Eagle Common Stock, and New Eagle MIP Options, to the participating senior management and other employees of the reorganized Company with 2% of the New Eagle Common Stock (on a fully diluted basis) on the Effective Date, and two tiers of options to acquire 5.5% of the New Eagle Common Stock (on a fully diluted basis) with different strike prices based on the equity value for the reorganized Company and a premium to the equity value, each of the foregoing to vest generally over a four year schedule through 25% annual installments commencing on the first anniversary of the Effective Date. The New Eagle MIP Primary Equity is subject to vesting, but the holder thereof is entitled to receive all dividends paid with respect to such shares as if such New Eagle MIP Primary Equity had vested on the grant date (subject to forfeiture by the holder in the event that such grant is terminated prior to vesting unless the administrator of the 2014 Plan determines otherwise). The New Eagle MIP Options contain adjustment provisions to reflect any transaction involving shares of New Eagle Common Stock, including as a result of any dividend, recapitalization, or stock split, to prevent any diminution or enlargement of the holder’s rights under the award.
The following schedule shows the stock awards and options granted under the 2014 Plan:
|
Restricted shares 1 |
Price on grant date |
Aggregate fair value (in millions) |
Vesting Terms |
|||||||||||||
|
Granted on October 15, 2014 |
27,027 | $ | 329.60 | $ | 8.9 |
25% annually over four year term |
||||||||||
|
Granted on December 2, 2014 |
18,018 | $ | 275.60 | $ | 5.0 |
25% annually over four year term |
||||||||||
|
Balance outstanding as of December 31, 2014 (Successor)* |
45,045 | $ | 308.58 | $ | 13.9 | |||||||||||
|
Granted on June 12, 2015 |
2,750 | $ | 179.60 | $ | 0.5 |
25% annually over four year term |
||||||||||
|
Granted on September 29, 2015 3 |
16,250 | $ | 117.40 | $ | 1.9 |
100% on third anniversary date |
||||||||||
|
Granted on November 13, 20153 |
5,000 | $ | 78.40 | $ | 0.4 |
100% on third anniversary date |
||||||||||
|
Total Granted in 2015 |
24,000 | $ | 2.8 | |||||||||||||
|
Issued on October 15, 2015 |
(1,335 |
) |
||||||||||||||
|
Vesting of shares - Tax |
(1,098 |
) |
||||||||||||||
|
Forfeited |
(35,457 |
) |
$ | (11.2 | ) | |||||||||||
|
Balance outstanding as of December 31, 2015 (Successor)* |
31,155 | $ | 174.48 | $ | 5.5 | |||||||||||
|
Granted on November 7, 2016 2 |
131,197 | $ | 4.24 | $ | 0.6 |
100% on first anniversary date |
||||||||||
|
Granted on December 15, 2016 2 |
50,000 | $ | 5.90 | $ | 0.3 |
100% on third anniversary date |
||||||||||
|
Issued on June 12, 2016 |
(688 |
) |
||||||||||||||
|
Cancelled on December 15, 2016 3 |
(21,250 |
) |
$ | (1.4 | ) | |||||||||||
|
Forfeited during 2016 |
(4,741 |
) |
$ | (1.4 | ) | |||||||||||
|
Balance outstanding as of December 31, 2016 |
185,673 | $ | 19.58 | $ | 3.6 | |||||||||||
* Adjusted to give effect for the 1 for 20 reverse stock split that became effective as of the opening of trading on August 5, 2016.
1. Amortization of all restricted shares unless otherwise stated were calculated using the graded method vesting and included in the General and administrative expenses.
.
2. Amortization of above stock awards were calculated using the cliff method of vesting and included in General and administrative expenses.
3. The above stock awards were cancelled and concurrently new grants under the 2016 Plan (as defined herein) were issued. Therefore, the transaction was accounted for as modification as per ASC 718 “Compensation-Stock Compensation.” The incremental compensation cost was calculated as the excess of the fair value of the replacement award over the fair value of the cancelled award at the cancellation date.
|
|
|||||||||||||||||||
| Options** |
Exercise Price ** |
Expiration |
Risk free interest rate |
Volatility |
Dividend % |
Fair Value of Options on grant date |
Aggregate fair value (in millions) |
Expected Term and vesting conditions | |||||||||||||||||||||||||
|
Granted on October 15, 2014 |
33,784 | $ | 360.00 | 5 | 1.29 | % | 43 | % | 0 | % | $ | 5.80 | $ | 3.92 |
4.75 years and 25% vesting annually over four year term | ||||||||||||||||||
|
Granted on October 15, 2014 |
40,540 | $ | 505.00 | 5 | 1.29 | % | 43 | % | 0 | % | $ | 4.12 | $ | 3.34 |
4.75 years and 25% vesting annually over four year term | ||||||||||||||||||
|
Granted on December 2, 2014 |
22,523 | $ | 360.00 | 5 | 1.51 | % | 44 | % | 0 | % | $ | 4.26 | $ | 1.92 |
4.75 years and 25% vesting annually over four year term | ||||||||||||||||||
|
Granted on December 2, 2014 |
27,027 | $ | 505.00 | 5 | 1.51 | % | 44 | % | 0 | % | $ | 2.95 | $ | 1.60 |
4.75 years and 25% vesting annually over four year term | ||||||||||||||||||
|
Balance outstanding as of December 31, 2014 ** |
123,874 | $ | 10.78 | ||||||||||||||||||||||||||||||
|
Granted on September 29, 2015*** |
16,250 | $ | 117.40 | 5 | 1.09 | % | 42 | % | 0 | % | $ | 38.38 | $ | 0.63 |
3.75 years and 25% vesting annually over four year term | ||||||||||||||||||
|
Granted on September 29, 2015*** |
16,250 | $ | 260.00 | 5 | 1.09 | % | 42 | % | 0 | % | $ | 12.32 | $ | 0.20 |
3.75 years and 25% vesting annually over four year term | ||||||||||||||||||
|
Granted on November 15, 2015*** |
5,000 | $ | 78.40 | 5 | 1.37 | % | 43 | % | 0 | % | $ | 26.49 | $ | 0.10 |
3.75 years and 25% vesting annually over four year term | ||||||||||||||||||
|
Granted on November 15, 2015*** |
5,000 | $ | 260.00 | 5 | 1.37 | % | 43 | % | 0 | % | $ | 4.05 | $ | 0.02 |
3.75 years and 25% vesting annually over four year term | ||||||||||||||||||
|
Forfeited in 2015 |
(97,507 |
) |
$ | (8.89 |
) |
||||||||||||||||||||||||||||
|
Vested in 2015 |
(6,591 |
) |
$ | (0.47 |
) |
||||||||||||||||||||||||||||
|
Balance outstanding as of December 31, 2015 (Successor)** |
62,276 | $ | 2.37 | ||||||||||||||||||||||||||||||
|
Forfeited in 2016 |
(13,038 |
) |
$ | (0.92 |
) |
||||||||||||||||||||||||||||
|
Cancelled on December 15, 2016*** |
(42,500 |
) |
$ | (0.67 |
) |
||||||||||||||||||||||||||||
|
Balance outstanding as of December 31, 2016 |
6,738 | $ | 0.78 | ||||||||||||||||||||||||||||||
* For the purposes of determining the non-cash compensation cost for the Company's stock option plan using the fair value method of ASC 718 "Compensation-Stock Compensation,” the fair value of the New Eagle MIP Options was estimated on the date of grant using the Black-Scholes option pricing model. The volatility was calculated by comparing the Company’s share price movement since emergence from bankruptcy on October 14, 2014 and its peers’ share price movement for the past five years. Amortization of above stock options for the 2014 Plan was calculated using the graded method of vesting and included in General and administrative expenses
** Adjusted to give effect for the 1 for 20 reverse stock split that became effective as of the opening of trading on August 5, 2016.
*** The above stock options were cancelled and concurrently new grants under the 2016 Plan was issued. Therefore, the transaction was accounted for as a modification as per ASC 718 “Compensation-Stock Compensation”. The incremental compensation cost was calculated as the excess of the fair value of the replacement award over the fair value of the cancelled award at the cancellation date.
There are 6,591 options vested but not exercised as of December 31, 2016 and 6,738 options that are not vested but are expected to vest. The fair value of vested options is insignificant.
Non-cash expense for the above stock awards and options issued under the 2014 Plan included in general and administrative expenses is as follows:
|
Successor
|
Predecessor | |||||||||||||||
|
2016 |
2015 |
October 16, 2014 To December 31, 2014 |
January 1, 2014 To October 15, 2014 |
|||||||||||||
|
Stock awards /Stock Option Plans |
$ | 624,099 | $ | 3,969,989 | $ | 2,121,505 | $ | 1,072,383 | ||||||||
|
Total non-cash compensation expense |
$ | 624,099 | $ | 3,969,989 | $ | 2,121,505 | $ | 1,072,383 | ||||||||
On November 7, 2016, the Company granted 233,863 shares of restricted common stock and options to purchase 280,000 shares of the Company’s common stock in connection with the appointment to the senior management. The restricted stock and option were not granted under, but are subject to, the terms of the Company’s 2014 Plan. The details of the grant are below:
|
Restricted shares * |
Fair value on grant date |
Aggregate fair value (in millions) |
Vesting Terms |
|||||||||||||
|
Granted on November 7, 2016 |
233,863 | $ | 4.24 | $ | 1.0 |
100% vesting on third anniversary date |
||||||||||
|
Balance outstanding as of December 31, 2016 (Successor)* |
233,863 | $ | 4.24 | $ | 1.0 | |||||||||||
* Amortization of the above stock awards was calculated using the cliff method of vesting and included in general and administrative expenses.
| Options* |
Exercise Price |
Expiration |
Risk free interest rate |
Volatility |
Dividend % |
Fair Value of Options on grant date |
Aggregate fair value (in millions) |
Expected term and Vesting conditions | |||||||||||||||||||||||||
|
Granted on November 7, 2016 |
280,000 | $ | 4.28 | 5 | 1.10 | % | 61 | % | 0 | % | $ | 1.91 | $ | 0.53 |
3.75 years and 25% vesting annually over four year term | ||||||||||||||||||
|
Balance outstanding at December 31, 2016 |
280,000 | $ | 0.53 | ||||||||||||||||||||||||||||||
* For the purposes of determining the non-cash compensation cost for the Company's stock option plan using the fair value method of ASC 718 "Compensation-Stock Compensation,” the fair value of the New Eagle MIP Options was estimated on the date of grant using the Black-Scholes option pricing model. The volatility was calculated by comparing the Company’s share price movement since emergence from bankruptcy on October 14, 2014 and its peers’ share price movement for the past five years. The amortization of the above stock options was calculated using the graded method of vesting and included in general and administrative expenses.
The 280,000 options disclosed above are not vested, but are expected to vest.
Non-cash compensation expense for the above stock awards and options included in General and administrative expenses:
|
Successor
|
Predecessor |
|||||||||||||||
|
For the year ended December 31, 2016 |
For the year ended December 31, 2015 |
October 16, 2014 To December 31, 2014 |
January 1, 2014 To October 15, 2014 |
|||||||||||||
|
Stock awards /Stock Option Plans |
$ | 89,437 | $ | - | $ | - | $ | - | ||||||||
|
Total non-cash compensation expense |
$ | 89,437 | $ | - | $ | - | $ | - | ||||||||
2016 Equity Compensation Plan
On December 15, 2016, the Company’s shareholders approved the 2016 Equity Compensation Plan (the “2016 Plan”) and the Company registered 5,348,613 shares of common stock which may be issued under the 2016 Plan. The 2016 Plan replaced the 2014 Plan and no other awards will be granted under the 2014 Plan. Outstanding awards under the 2014 Plan will continue to be governed by the terms of the 2014 Plan until exercised, expired, otherwise terminated, or canceled. As of December 31, 2016, 24,644 shares of common stock were subject to outstanding awards under the 2014 Plan. Under the terms of the 2016 Plan, awards for up to a maximum of 3,000,000 shares may be granted under the 2016 Plan to any one employee of the Company and its subsidiaries during any one calendar year, and awards in the form of options and stock appreciation rights for up to a maximum of 3,000,000 shares may be granted under the 2016 Plan. The total number of shares of common stock with respect to which awards may be granted under the 2016 Plan to any non-employee director during any one calendar year shall not exceed 500,000, subject to adjustment as provided in the 2016 Plan. Any Director, officer, employee or consultant of the Company or any of its subsidiaries (including any prospective officer or employee) is eligible to be designated to participate in the 2016 Plan.
The following schedule represents outstanding stock awards and options granted under the 2016 Plan.
| Restricted shares* |
Fair value on grant date |
Aggregate |
Vesting Terms | ||||||||||
|
Granted on December 15 , 2016** |
760,056 | $ | 5.90 | $ | 4.40 |
100% on September 1, 2018 | |||||||
|
Granted on December 15, 2016** |
233,869 | $ | 5.90 | $ | 1.38 |
100% on October 14, 2018 | |||||||
|
Balance outstanding as of December 31, 2016 |
993,925 | $ | 5.78 | ||||||||||
*The above stock awards were issued concurrently with the cancellation of outstanding stock awards and options under the 2014 Plan. Therefore, the issuance was accounted for as a modification as per ASC 718 “Compensation-Stock Compensation.” The fair value is the incremental compensation cost, which was calculated as the excess of the fair value of the replacement award over the fair value of the cancelled award at the cancellation date. The amortization of the above stock awards was calculated using the cliff method of vesting and included in general and administrative expenses.
| Options* |
Exercise |
Expiration |
Risk free |
Volatility |
Dividend % |
Fair Value of |
Aggregate fair value (in millions) ** |
Expected Term and Vesting conditions |
||||||||||||||||||||||||||||
|
Granted on December 15, 2016 |
1,266,476 | $ | 4.28 | 5 | 1.79 | % | 62 | % | 0 | % | $ | 3.12 | $ | 3.96 | 3.15 years and 25% vesting annually | |||||||||||||||||||||
|
Granted on December 15, 2016 |
389,695 | $ | 4.28 | 5 | 1.79 | % | 62 | % | 0 | % | $ | 3.14 | $ | 1.21 | 3.15 years and 25% vesting annually | |||||||||||||||||||||
| Balance outstanding as of December 31, 2016 | 1,656,171 | $ | 5.17 | |||||||||||||||||||||||||||||||||
*For the purposes of determining the non-cash compensation cost for the Company's stock option plan using the fair value method of ASC 718 "Compensation-Stock Compensation,” the fair value of the New Eagle MIP Options was estimated on the date of grant using the Black-Scholes option pricing model. The volatility was calculated by comparing the Company’s share price movement since emergence from bankruptcy on October 14, 2014 and its peers’ share price movement for the past five years.
**The above stock options were issued concurrently with cancellation of outstanding stock awards and options under the 2014 Equity Incentive Plan. Therefore, the transaction was accounted for as a modification as per ASC 718 “Compensation-Stock Compensation.” The fair value is the incremental compensation cost, which was calculated as the excess of the fair value of the replacement award over the fair value of the cancelled award at the cancellation date. The amortization of the above stock options was calculated using the graded method of vesting and included in general and administrative expenses.
The above options are not vested as of December 31, 2016 and are expected to vest.
Non-cash compensation expense for the above stock awards and options under the 2016 Plan included in General and administrative expenses:
|
Successor |
Predecessor |
|||||||||||||||
|
December 31, 2016 |
December 31, 2015 |
October 16, 2014 To December 31, 2014 |
January 1, 2014 To October 15, 2014 |
|||||||||||||
|
Stock awards /Stock Option Plans |
$ | 1,493,154 | $ | - | $ | - | $ | - | ||||||||
|
Total non-cash compensation expense |
$ | 1,493,154 | $ | - | $ | - | $ | - | ||||||||
The future compensation to be recognized for all the grants issued for the years ending December 31, 2017, 2018 and 2019 will be $7,340,237, $5,837,145 and $787,924, respectively.
Note 16. Employee Benefit Plan
In October 2010, the Company established a safe harbor 401(k) plan, which is available to full-time office employees who meet the plan’s eligibility requirements. The plan allows participants to contribute to the plan a percentage of pre-tax compensation, but not in excess of the maximum allowed under the Internal Revenue Code. The Company is matching contributions amounting to 100% of the first 3% and 50% of the next 2% of each employee’s salary. The matching contribution vests immediately. The total matching contribution paid by the Company and included in general and administrative expenses for the years ended December 31, 2016 and 2015 and for the period between October 16, 2014 and December 31, 2014 for the Successor was $167,778, $212,223 and $43,333, respectively. The matching contribution paid by the Company and included in general and administrative expenses for the period between January 1, 2014 and October 15, 2014 for the Predecessor was $157,078.
The Company has a discretionary profit sharing contribution program under which employees may receive profit sharing contributions based on the Company’s annual operating performance. For the years ended December 31, 2016, 2015 and 2014, the Company did not make a profit sharing contribution.
Note 17. 2016 and 2015 Quarterly Results of Operations (Unaudited)
We have presented the unaudited quarterly results of operations for the fiscal years ended December 31, 2016 and December 31, 2015.
Consolidated Statement of Operations
(Unaudited)
2016
|
Three Months ended March 31 |
Three Months ended June 30 |
Three Months ended September 30 |
Three Months ended December 31 |
|||||||||||||
|
Revenues |
$ | 21,278,288 | $ | 25,590,434 | $ | 35,788,181 | $ | 41,835,941 | ||||||||
|
Total Operating Expenses |
57,742,766 | (a) | 42,882,423 | 47,512,409 | 177,607,218 | (b) | ||||||||||
|
Operating Loss |
(36,464,478 | ) | (17,291,989 | ) | (11,724,228 | ) | (135,771,277 | ) | ||||||||
|
Net Loss |
(39,278,670 | ) | (22,495,573 | ) | (19,359,044 | ) | (142,389,148 | ) | ||||||||
|
Basic Loss Per Share |
$ | (20.77 |
)(c) |
$ | (9.98 | ) | $ | (0.65 | )(d) | $ | (2.96 | ) | ||||
|
Diluted Loss Per Share |
$ | (20.77 |
) |
$ | (9.98 | ) | $ | (0.65 | )(d) | $ | (2.96 | ) | ||||
|
a. |
Includes impairment charge of $6,167,262. |
|
b. |
Includes impairment charge of $122,860,600. |
|
c. |
Basic and Diluted loss per share have been restated to reflect the 1 for 20 reverse stock split, effective August 5, 2016. | |
| d. | The basic and diluted loss per share for the three months ended September 30, 2016 has been restated from the previously reported basic and diluted loss per share of $0.52 to a $0.65 basic and diluted loss per share to correct a clerical error. Additionally, the basic and diluted loss per share previously reported in the Company’s Quarterly Report on Form 10-Q for the nine months ended September 30, 2016 as $3.94 per share, will be restated to a basic and diluted loss of $7.17 per share due to a clerical error when next presented in our Quarterly Report on Form 10-Q for the quarterly period ending September 30, 2017. |
(Unaudited)
2015
|
Three Months ended March 31 |
Three Months ended June 30 |
Three Months ended September 30 |
Three Months ended December 31 |
|||||||||||||
|
Revenues |
$ | 26,331,166 | $ | 22,657,372 | $ | 29,127,482 | $ | 25,740,856 | ||||||||
|
Total Operating Expenses |
43,839,019 | 47,011,056 | 46,135,325 | 102,409,040* | ||||||||||||
|
Operating Loss |
(17,507,853 |
) |
(24,353,684 |
) |
(17,007,843 |
) |
(76,668,184 |
) | ||||||||
|
Net Loss |
(20,667,064 |
) |
(27,508,300 |
) |
(20,376,620 |
) |
(79,744,981 |
) | ||||||||
|
Basic Loss Per Share ** |
$ | (11.01 |
) |
$ | (14.62 |
) |
$ | (10.83 |
) |
$ | (42.37 |
) | ||||
|
Diluted Loss Per Share ** |
$ | (11.01 |
) |
$ | (14.62 |
) |
$ | (10.83 |
) |
$ | (42.37 |
) | ||||
*includes impairment charge of $50,872,734.
** Basic and Diluted loss per share have been restated to reflect the 1 for 20 reverse stock split, effective August 5, 2016.
Note 18. Bankruptcy
On August 6, 2014, the Company entered into the Restructuring Support Agreement with the Consenting Lenders, which contemplated a plan of reorganization through a balance sheet restructuring of the Company’s obligations upon the terms specified therein. On the same day, the Company filed the Prepackaged Case under chapter 11 of title 11 of the Bankruptcy Code in the Court. The Prepackaged Case was filed only in respect of the Company, but not any of its subsidiaries. Through the Prepackaged Case, the Company sought to implement a balance sheet restructuring pursuant to the terms of the Plan. The Company continued to operate its business as a “debtor in possession” under the jurisdiction of the Court and in accordance with the applicable provisions of the Bankruptcy Code and orders of the Court.
On September 22, 2014, the Court entered (the “Confirmation Order”) confirming the Plan. On October 15,2014 (the “Effective Date”), the Company completed its balance sheet restructuring and emerged from Chapter 11 through a series of transactions contemplated by the Plan, and the Plan became effective pursuant to its terms.
Key components of the Plan included:
Entry into a new senior secured credit facility (the “Exit Financing Facility”) as of October 9, 2014, in the amount of $275 million (inclusive of a $50 million revolving credit facility).
|
● |
The cancellation of all outstanding equity interests in the Company as of the Effective Date, with the then current holders of such equity interests (other than the Consenting Lenders on account of certain warrants held by them or shares of common stock received upon conversion of such warrants ) receiving (i) shares of New Eagle Common Stock equal to 0.5% of the total number of shares of New Eagle Common Stock issued and outstanding on the Effective Date (subject to dilution by the New Eagle Equity Warrants and the 2014 Plan), and (ii) an aggregate of 152,266 New Eagle Equity Warrants. Each New Eagle Equity Warrant has a 7-year term (commencing on the Effective Date) and is exercisable for one share of New Eagle Common Stock (subject to adjustment as set forth in the New Eagle Equity Warrant Agreement and dilution by the 2014 Plan). |
|
● |
The extinguishment of all loans and other obligations under the Exit Financing Facility as of the Effective Date, with the current holders thereof receiving (i) shares of New Eagle Common Stock equal to 99.5% of the total number of shares of New Eagle Common Stock issued and outstanding on the Effective Date, subject to dilution by the New Eagle Equity Warrants and the 2014 Plan, and (ii) a cash distribution as contemplated by the Plan .On the Effective Date, the Exit Financing Facility was terminated, and the liens and mortgages thereunder were released. |
|
● |
All claims of unsecured creditors of Eagle Bulk Shipping Inc. were unaffected and paid in full. |
|
● |
The establishment of a 2014 Plan that provided senior management and certain other employees of the reorganized Company with 2% of the New Eagle Common Stock (on a fully diluted basis) on the Effective Date, and two tiers of options to acquire 5.5% of the New Eagle Common Stock (on a fully diluted basis) with different strike prices based on the equity value for the reorganized Company and a premium to the equity value, each of the foregoing to vest generally over a four year schedule through 25% annual installments commencing on the first anniversary of the Effective Date. The 2014 Plan also provided for the reservation of certain additional shares for future issuance thereunder, as further described in the Plan. |
The Plan also provided for certain releases of various parties by certain holders of claims against and equity interests in the Company.
Exit Financing Facility
On October 9, 2014, Eagle Bulk Shipping Inc., as borrower, and certain of its subsidiaries, as guarantors, entered into the Exit Financing Facility with the Exit Lenders. The Exit Financing Facility is in the amount of $275 million, including a $50 million revolving credit facility, and matures on October 15, 2019. Amounts drawn under the Exit Financing Facility bear interest at a rate of LIBOR plus the Margin. The revolving credit facility is subject to an annual commitment fee of 40% of the margin.
Registration Rights Agreement
On the Effective Date, and in accordance with the Plan, the Company entered into the Registration Rights Agreement (“the Registration Rights Agreement”) with certain parties that received shares of New Eagle Common Stock under the Plan. The Registration Rights Agreement provided such parties with demand and piggyback registration rights. On May 13, 2016, the Company entered into an Amended and Restated Registration Rights Agreement.
New Eagle Equity Warrant Agreement
On the Effective Date, and in accordance with the Plan, the 152,266 New Eagle Equity Warrants were issued pursuant to the terms of the New Eagle Equity Warrant Agreement. Each New Eagle Equity Warrant has a 7-year term (commencing on the Effective Date) and are exercisable for one share of New Eagle Common Stock (subject to adjustment as set forth in the New Eagle Equity Warrant Agreement and dilution by the 2014 Plan).The New Eagle Equity Warrants are exercisable at an exercise price of $556.40 per share (subject to adjustment as set forth in the New Eagle Equity Warrant Agreement). The New Eagle Equity Warrant Agreement contains customary anti-dilution adjustments in the event of any stock split, reverse stock split, stock dividend, reclassification, dividend or other distributions (including, but not limited to, cash dividends), or business combination transaction.
Note 19. Condensed Financial Information for Eagle Bulk Shipping Inc. (Parent Company Only)
Condensed Balance Sheets (Parent Company Only)
|
December 31, 2016 |
December 31, 2015 |
|||||||
|
ASSETS: |
||||||||
|
Current assets: |
||||||||
|
Cash and cash equivalents |
$ | 62,326,786 | $ | 22,104,462 | ||||
|
Prepaid expenses |
376,215 | 411,214 | ||||||
|
Total current assets |
62,703,001 | 22,515,676 | ||||||
|
Noncurrent assets: |
||||||||
|
Investment in subsidiaries* |
338,340,211 | 737,821,862 | ||||||
|
Other assets |
310,000 | - | ||||||
|
Total noncurrent assets |
338,650,211 | 737,821,862 | ||||||
|
Total assets |
$ | 401,353,212 | $ | 760,337,538 | ||||
|
LIABILITIES & STOCKHOLDERS' EQUITY |
||||||||
|
Current liabilities: |
||||||||
|
Accounts payable |
$ | 189,039 | $ | 366,603 | ||||
|
Accrued interest |
- | 401,232 | ||||||
|
Current portion of long-term debt |
- | 15,625,000 | ||||||
|
Other accrued liabilities |
681,534 | 22,750 | ||||||
|
Total current liabilities |
870,573 | 16,415,585 | ||||||
|
Noncurrent liabilities : |
||||||||
|
Exit Financing Facility, net of debt discount and debt issuance costs |
- | 225,577,491 | ||||||
|
Total noncurrent liabilities |
- | 225,577,491 | ||||||
|
Total liabilities |
870,573 | 241,993,076 | ||||||
|
Commitment and contingencies |
||||||||
|
Stockholders' equity: |
||||||||
|
Preferred stock, $.01 par value, 25,000,000 shares authorized, none issued as of December 31, 2016 |
- | - | ||||||
|
Common stock, $0.01 par value, 700,000,000 shares authorized, 48,106,827 and 1,883,303 shares issued and outstanding as of December 31, 2016 and 2015, respectively |
481,069 | 18,833 | ||||||
|
Additional paid-in capital |
783,369,698 | 678,171,322 | ||||||
|
Accumulated deficit |
(383,368,128 | ) | (159,845,693 | ) | ||||
|
Total stockholders' equity |
400,482,639 | 518,344,462 | ||||||
|
Total liabilities and stockholders' equity |
$ | 401,353,212 | $ | 760,337,538 | ||||
* Eliminated in the consolidated financial statements.
Condensed Statements of Operations (Parent Company Only)
|
Successor |
||||||||||||
|
For the year ended |
For the year ended |
Period from October 16, 2014 To |
||||||||||
|
December 31, 2016 |
December 31, 2015 |
December 31, 2014 |
||||||||||
|
General and administrative expenses |
$ | 2,101,094 | $ | 2,554,795 | $ | 313,877 | ||||||
|
Total operating expenses |
2,101,094 | 2,554,795 | 313,877 | |||||||||
|
Operating loss |
(2,101,094 | ) | (2,554,795 | ) | (313,877 | ) | ||||||
|
Interest expense |
2,817,646 | 11,927,422 | 2,359,326 | |||||||||
|
Interest income |
(215,433 | ) | (6,222 | ) | (2,238 | ) | ||||||
|
Other expense |
125,255 | - | - | |||||||||
|
Reorganization items, net |
- | - | 45,542 | |||||||||
|
Total other expense (income), net |
2,727,468 | 11,921,200 | 2,402,630 | |||||||||
|
Equity in net loss of subsidiaries** |
(218,693,873 |
) |
(133,820,970 |
) |
(8,832,221 | ) | ||||||
|
Net loss |
$ | (223,522,435 |
) |
$ | (148,296,965 |
) |
$ | (11,548,728 | ) | |||
|
Weighted average shares outstanding: |
||||||||||||
|
Basic* |
20,565,652 | 1,880,116 | 1,875,227 | |||||||||
|
Diluted* |
20,565,652 | 1,880,116 | 1,875,227 | |||||||||
|
Per share amounts: |
||||||||||||
|
Basic net loss |
$ | (10.87 | ) | $ | (78.88 | ) | $ | (6.16 | ) | |||
|
Diluted net loss |
$ | (10.87 | ) | $ | (78.88 | ) | $ | (6.16 | ) | |||
*Adjusted to give effect for the 1 for 20 reverse stock split for the Successor that became effective as of the opening of trading on August 5, 2016.
**Eliminated in the consolidated financial statements.
Condensed Statements of Cash Flows (Parent Company Only)
|
Successor |
||||||||||||
|
Year ended December 31, 2016 |
Year ended December 31, 2015 |
Period from October 16, 2014 To December 31, 2014 |
||||||||||
|
Net cash (used in) / provided by operating activities |
$ | (4,715,072 | ) | (18,496,422 | ) | $ | (5,013,295 | ) | ||||
|
Cash flows from investing activities: |
||||||||||||
|
Cash distributed to wholly-owned subsidiaries |
(36,853,951 | ) | (4,762,134 | ) | (2,797,401 | ) | ||||||
|
Net cash used in investing activities |
(36,853,951 | ) | (4,762,134 | ) | (2,797,401 | ) | ||||||
|
Cash flows from financing activities: |
||||||||||||
|
Repayment of Term Loan |
(3,906,250 | ) | (19,625,000 | ) | - | |||||||
|
Proceeds from Revolver Loan facility under Exit Financing Facility |
- | 40,000,000 | - | |||||||||
|
Proceeds from common stock placement, net of issuance costs |
85,700,535 | - | - | |||||||||
|
Deferred financing costs |
- | (500,000 | ) | |||||||||
|
Cash used to settle net share equity awards |
(2,938 | ) | (1,419,229 | ) | - | |||||||
|
Net cash provided by financing activities |
81,791,347 | 18,455,771 | - | |||||||||
|
Net increase/(decrease) in cash and cash equivalents |
40,222,324 | (4,802,785 | ) | (7,810,696 | ) | |||||||
|
Cash and cash equivalents at beginning of period |
22,104,462 | 26,907,247 | 34,717,943 | |||||||||
|
Cash and cash equivalents at end of period |
$ | 62,326,786 | $ | 22,104,462 | $ | 26,907,247 | ||||||
|
Supplemental cash flow information: |
||||||||||||
|
Cash paid during the period for interest |
$ | 2,529,674 | $ | 9,911,793 | $ | 1,586,303 | ||||||
Notes to the Condensed Financial Statements
|
|
Basis of Presentation |
In the parent-company-only condensed financial statements, Eagle Bulk Shipping Inc. (the “Parent Company”) investment in subsidiaries is accounted for under the equity method of accounting. The Parent Company did not receive cash dividends from its subsidiaries for the years ended December 31, 2016 and 2015 and for the period between October 16, 2014 and December 31, 2014.
The parent-company-only condensed financial statements should be read in conjunction with the Company's consolidated financial statements. The condensed financial statements for the Predecessor for the period between January 1, 2014 and October 15, 2014 are not presented in the parent-company-only condensed financial statements because such information is not comparable due to the adoption of fresh-start accounting in accordance with the provisions of ASC 852, Reorganizations (“ASC 852”). Upon adoption of fresh-start accounting, the Parent Company’s assets and liabilities were recorded at their fair value as of October 15, 2014, the fresh-start reporting date. The Parent Company’s adoption of fresh-start accounting materially affected its results of operations following the fresh-start reporting date, as the Parent Company has a new basis in its assets and liabilities. Consequently, the Parent Company’s historical financial statements prior to October 15, 2014 are not considered to be reliable indicators of its results of operations for periods after it adopted fresh-start accounting and not relevant to the assessment of the trends in financial performance. Based upon the above, the omission of the Predecessor information is not considered material to the consolidated financial statements.
There are legal or regulatory restrictions on the Parent Company's ability to obtain funds from its subsidiaries through dividends, loans or advances sufficient to satisfy the obligations that may come due.
|
|
Equity Offerings |
Preferred Stock Private Placement
On May 26, 2016, the Parent Company entered into a Preferred Stock Purchase Agreement (the “Preferred Stock Purchase Agreement”) with certain investors named therein, including certain of our existing shareholders and our Chairman and Chief Executive Officer (the “Purchasers”), pursuant to which the Parent Company agreed to issue to the Purchasers in a private placement (the “Private Placement”) pursuant to the private placement exemption from registration under Section 4(a)(2) of the Securities Act and Rule 506 of Regulation D promulgated under the Securities Act, shares of the Parent Company’s 15% Cumulative Nonparticipating Redeemable Series A Preferred Stock, par value $0.01 per share (the “Series A Preferred Stock”), at a purchase price of $1,000.00 per share with a 1.0% original issue discount, for aggregate gross proceeds expected to amount to approximately $6.3 million.
On September 7, 2016, the Parent Company and each of the Investors executed the Termination Agreement, terminating the Preferred Stock Purchase Agreement. The Parent Company agreed to make an aggregate termination payment to the Purchasers of $125,255, which is allocated among the Purchasers in proportion to the percentage of the shares of Series A Preferred Stock each Purchaser had previously agreed to purchase. The fees paid to the shareholders were recorded as other expense in the condensed statement of operations for the year ended December 31, 2016.
Common Stock Offerings
On July 1, 2016 and July 10, 2016, respectively, the Parent Company entered into Common Stock Purchase Agreements (collectively, the “Common Stock Purchase Agreements”), with certain purchasers (the “Common Stock Purchasers”). The Common Stock Purchasers include certain of our existing shareholders, who held approximately 70% of our outstanding equity prior to entry into the Common Stock Purchase Agreements and prior to giving effect to the delivery of all of the shares of common stock issued in connection with the Second Lien Loan Agreement, as well as our Chairman and Chief Executive Officer. The Common Stock Purchase Agreements provided for the issuance and sale by the Parent Company to the Common Stock Purchasers of an aggregate amount of $88 million of common stock, at an initial price per share of $0.15, which amount per share was increased to $3.00 per share based on the reverse stock split ratio of 1-for-20 that became effective as of the opening of trading on August 5, 2016.
On August 10, 2016, the Parent Company closed the transactions contemplated by the Common Stock Purchase Agreements for aggregate proceeds of $85.7 million net of fees and legal expenses. After giving effect to the Parent Company’s previously announced reverse stock split of its issued and outstanding shares of common stock, including the rounding down of fractional shares pursuant to such split, the private placement included the issuance of 29,333,318 shares of the Parent Company’s common stock. The Parent Company intends to use the proceeds of the private placement for the acquisition of dry bulk vessels and general corporate purposes by its susbsidiaries.
On December 13, 2016, the Parent Company entered into a Stock Purchase Agreement (the “Purchase Agreement”) with certain investors (the “Investors”), pursuant to which the Parent Company agreed to issue to the Investors in a private placement (the “December Private Placement”) approximately 22.2 million shares of the Parent Company’s common stock, par value $0.01 per share, at an initial purchase price of $4.50 per share, for aggregate gross proceeds of $100.0 million. On January 20, 2017, the Parent Company closed its previously announced December Private Placement for aggregate net proceeds of $95 million. The Parent Company plans to use the proceeds from the December Private Placement for the acquisition of dry bulk tonnage and general corporate purposes by its subsidiaries.
Corporate Reorganization and Refinancing
On March 30, 2016, we entered into the Contribution Agreement with Eagle Shipping, pursuant to which the Parent Company and Eagle Shipping consummated the Contribution. Immediately following the Contribution, Eagle Shipping became the direct parent company of each of the Parent Company’s previously directly-owned subsidiaries and the indirect parent company of each of the Parent Company’s previously indirectly-owned subsidiaries. The Contribution was part of a series of transactions contemplated by the agreements also entered into on March 30, 2016 and described below, which transactions were consummated on March 30, 2016, after the fulfillment of certain conditions precedent. See “Note 2. Corporate Reorganization” to the consolidated financial statements.
Non Cash Investing and Financing Activities
For the year ended December 31, 2016, a subsidiary of the Parent Company assumed approximately $237 million of debt obligations of the Parent Company, which reduced the Parent Company’s investment in subsidiaries. The Parent Company also issued equity instruments to the employees of the subsidiary companies and to the subsidiary companies’ Second Lien Lenders, increasing its investment in subsidiaries by approximately $20 million. For the year ended December 31, 2015, there was approximately $4 million of equity issued by the Parent Company granted to employees of the wholly-owned subsidiaries of the Parent Company, which increased the Parent Company’s investment in subsidiaries. For the period from October 16, 2014 to December 31, 2014, there were approximately $2 million of equity compensation issued by the Parent Company which was granted to employees of the wholly-owned subsidiaries of the Parent Company, which increased the Parent Company’s investment in subsidiaries.
Note 20. Subsequent Events
On February 28, 2017, Eagle Bulk Ultraco LLC, a wholly-owned subsidiary of the Company, entered into a framework agreement (the “Agreement”) with Greenship Bulk Manager Pte. Ltd., as Trustee-Manager of Greenship Bulk Trust, a Norwegian OTC-listed entity (the “Sellers”), for the purchase of nine modern sister vessels built between 2012 and 2015 (each a “Vessel,” and collectively, the “Vessels”). Of the nine Vessels, three Vessels are subject to certain customary conditions as well as the approval of the requisite majority of the unitholders of the Sellers (the “Contingent Vessels”). The approval to acquire the Contingent Vessels was obtained subsequently on March 27, 2017. The aggregate purchase price for the nine Vessels is $153.0 million. The allocated purchase price for each Vessel is $17.0 million (“Allocated Purchase Price”).
After the satisfaction of the conditions set forth in the Agreement, the sale of each Vessel will be made pursuant to a separate memorandum of agreement as set forth in the Agreement.
The Vessels are expected to be delivered charter free between April and September 2017.
F-40