Attached files
UNITED STATES
SECURITIES AND EXCHANGE COMMISSION
Washington, D.C. 20549
Form 10-K
(Mark One)
|
☒ |
ANNUAL REPORT PURSUANT TO SECTION 13 OR 15(d) OF THE SECURITIES EXCHANGE ACT OF 1934 |
For the fiscal year ended February 3, 2017
or
|
☐ |
TRANSITION REPORT PURSUANT TO SECTION 13 OR 15(d) OF THE SECURITIES EXCHANGE ACT OF 1934 |
For the transition period from to
|
Commission File Number |
|
|
|
Exact Name of Registrant as Specified in its Charter, |
|
State or other |
|
I.R.S. Employer |
|
001-35832 |
|
|
|
Science Applications International Corporation |
|
Delaware |
|
46-1932921 |
|
|
|
|
|
1710 SAIC Drive, McLean, Virginia 22102 |
|
|
|
|
|
|
|
|
|
703-676-4300 |
|
|
|
|
Securities registered pursuant to Section 12(b) of the Act:
|
Title of each class |
|
Name of each exchange on which registered |
|
Science Applications International Corporation Common Stock, Par Value $.0001 Per Share |
|
New York Stock Exchange |
Securities registered pursuant to Section 12(g) of the Act:
None
|
Indicate by check mark if the registrant is a well-known seasoned issuer, as defined in Rule 405 of the Securities Act. |
|
|
Yes ☒ |
|
|
|
No ☐ |
|
|
Indicate by check mark if the registrant is not required to file reports pursuant to Section 13 or Section 15(d) of the Act. |
|
|
Yes ☐ |
|
|
|
No ☒ |
|
|
Indicate by check mark whether the registrant (1) has filed all reports required to be filed by Section 13 or 15(d) of the Securities Exchange Act of 1934 during the preceding 12 months (or for such shorter period that the registrant was required to file such reports), and (2) has been subject to such filing requirements for the past 90 days. |
|
|
Yes ☒ |
|
|
|
No ☐ |
|
|
Indicate by check mark whether the registrant has submitted electronically and posted on its corporate Web site, if any, every Interactive Data File required to be submitted and posted pursuant to Rule 405 of Regulation S-T (§232.405 of this chapter) during the preceding 12 months (or for such shorter period that the registrant was required to submit and post such files). |
|
|
Yes ☒ |
|
|
|
No ☐ |
|
|
Indicate by check mark if disclosure of delinquent filers pursuant to Item 405 of Regulation S-K (§229.405 of this chapter) is not contained herein, and will not be contained, to the best of registrant’s knowledge, in definitive proxy or information statements incorporated by reference in Part III of this Form 10-K or any amendment to this Form 10-K. |
|
|
☒ |
|
|
|
|
|
|
Indicate by check mark whether the registrant is a large accelerated filer, an accelerated filer, a non-accelerated filer, or a smaller reporting company. See the definitions of “large accelerated filer,” “accelerated filer” and “smaller reporting company” in Rule 12b-2 of the Exchange Act. |
|
|
|
|
|
|
|
|
|
Large accelerated filer |
|
☒ |
|
Accelerated filer |
|
☐ |
|
Non-accelerated filer |
|
☐ |
|
Smaller reporting company |
|
☐ |
|
Indicate by check mark whether the registrant is a shell company (as defined in Rule 12b-2 of the Act). |
|
|
Yes ☐ |
|
|
|
No ☒ |
|
As of August 5, 2016 (the last business day of the registrant’s most recently completed second quarter), the aggregate market value of the registrant’s common stock (based upon the closing stock price) held by non-affiliates was $2.6 billion.
The number of shares issued and outstanding of the registrant’s common stock as of March 10, 2017 was 43,573,568 shares ($.0001 par value per share).
DOCUMENTS INCORPORATED BY REFERENCE
Portions of Science Applications International Corporation’s Definitive Proxy Statement for the 2017 Annual Meeting of Stockholders are incorporated by reference in Part III of this report.
SCIENCE APPLICATIONS INTERNATIONAL CORPORATION
FORM 10-K
TABLE OF CONTENTS
|
|
|
|
Page |
|
|
Part I |
|
|
|
|
|
|
|
|
|
|
|
Item 1. |
|
|
1 |
|
|
Item 1A. |
|
|
7 |
|
|
Item 1B. |
|
|
17 |
|
|
Item 2. |
|
|
17 |
|
|
Item 3. |
|
|
17 |
|
|
Item 4. |
|
|
17 |
|
|
|
|
|
|
|
|
Part II |
|
|
|
|
|
|
|
|
|
|
|
Item 5. |
|
|
18 |
|
|
Item 6. |
|
|
21 |
|
|
Item 7. |
|
Management’s Discussion and Analysis of Financial Condition and Results of Operations |
|
22 |
|
Item 7A. |
|
|
34 |
|
|
Item 8. |
|
|
35 |
|
|
Item 9. |
|
Changes in and Disagreements With Accountants on Accounting and Financial Disclosure |
|
35 |
|
Item 9A. |
|
|
35 |
|
|
Item 9B. |
|
|
38 |
|
|
|
|
|
|
|
|
Part III |
|
|
|
|
|
|
|
|
|
|
|
Item 10. |
|
|
39 |
|
|
Item 11. |
|
|
40 |
|
|
Item 12. |
|
Security Ownership of Certain Beneficial Owners and Management and Related Stockholder Matters |
|
41 |
|
Item 13. |
|
Certain Relationships and Related Transactions, and Director Independence |
|
41 |
|
Item 14. |
|
|
41 |
|
|
|
|
|
|
|
|
Part IV |
|
|
|
|
|
|
|
|
|
|
|
Item 15. |
|
|
42 |
|
|
Item 16. |
|
|
45 |
|
|
|
|
|
||
|
|
45 |
|||
|
|
|
|
||
|
|
F-1 |
|||
i
SCIENCE APPLICATIONS INTERNATIONAL CORPORATION
The Company
Science Applications International Corporation (herein referred to as “SAIC,” the “Company,” “we,” “us,” or “our”) is a leading provider of technical, engineering and enterprise information technology (IT) services primarily to the U.S. government. We provide engineering, systems integration and information technology offerings for large, complex government projects and offer a broad range of services with a targeted emphasis on higher-end, differentiated technology services. Our end-to-end enterprise IT offerings span the entire spectrum of our customers’ IT infrastructure. We commenced operations on September 27, 2013 (the Distribution Date) following completion of a spin-off transaction from our former parent, Leidos Holdings, Inc. (collectively with its consolidated subsidiaries, “former Parent”).
Our business has a long and successful history, tracing its roots to the earliest days of former Parent which was founded in 1969 as a scientific research and engineering firm. The U.S. federal government agencies we serve include all branches of the U.S. military (Army, Air Force, Navy, Marines and Coast Guard), U.S. Defense Logistics Agency, National Aeronautics and Space Administration (NASA), U.S. Department of State, and U.S. Department of Homeland Security (DHS). In May 2015 we completed the acquisition of privately held Scitor Holdings, Inc. (Scitor), a leading provider of services to the intelligence community, which enabled us to gain sufficient scale to competitively pursue opportunities within the intelligence community. Our long-standing customer relationships have enabled us to achieve an in-depth understanding of our customers’ missions and provide differentiated service offerings to meet our customers’ most complex requirements. Our offerings include: engineering; technology and equipment platform integration; maintenance of ground and maritime systems; logistics; training and simulation; operation and program support services; and end-to-end services spanning the design, development, integration, deployment, management and operations, sustainment and security of our customers’ entire IT infrastructure. We serve our customers through approximately 1,400 active contracts and task orders. We have approximately 15,500 employees that are led by an experienced executive team of proven industry leaders.
Our core strengths have supported our successful performance on programs of national importance. Those strengths include:
Enduring Customer Relationships and Mission-Orientation. We have strong and long-lasting customer relationships throughout the U.S. government. Our track record of serving the missions of our government customer spans decades, including several enduring customer relationships that have lasted 20 years or more. Our employees, many of whom are deployed at customer sites, work closely with our customers in fulfilling their missions. Our strong customer relationships enable us to develop deep customer knowledge and translate our mission understanding into successful program execution that fosters continued demand for our services.
Full Life Cycle Offerings. We integrate technologies and deliver services that provide our customers with seamless end-to-end solutions. Our expertise includes initial requirements definition, development and integration services, training, logistics and sustainment. These full life cycle offerings, combined with deep customer knowledge, allow us to more effectively support our customers’ missions.
Significant Scale and Diversified Contract Base. With approximately $4.5 billion in revenue in fiscal 2017, we are one of the largest pure-play technical service providers to the U.S. government. Our significant scale advantage enables us to serve as a prime systems integrator on large, complex programs and to allocate resources toward further developing and expanding our repeatable, proven solutions and differentiated technical capabilities. Our diversified revenue base consists of programs ranging from research and development to operations and maintenance.
Technical Experts Led by Experienced Management. The quality, training and knowledge of our employees are important competitive assets. Our skilled workforce ranges from entry-level technicians to expert-level professionals in network engineering, software design and development, logistics, technology integration and systems engineering. Additionally, the majority of our workforce holds an active security clearance, which is required on many of our existing programs and future program opportunities.
-1-
SCIENCE APPLICATIONS INTERNATIONAL CORPORATION
Our workforce is led by a talented and experienced senior leadership team with a long history of solving our customers’ most difficult challenges. Collectively, our executive team averages more than 25 years of industry experience, consisting of members who have served as senior leaders in public companies and are recognized as leaders in their respective markets by customers and partners.
Repeatable Methodologies and Certified Processes. Our technical excellence is driven by our proven, repeatable, disciplined processes for management, engineering, technical support and services. We deploy our tools and processes enterprise-wide and emphasize a consistent approach to planning, designing, and delivering solutions and services to our customers. We hold certifications from the International Organization for Standardization (including ISO 9001:2008, ISO/IEC 27001:2013, ISO 20000-1:2011 and AS9100), and from the Capability Maturity Model Integration Institute as a CMMI®-DEV Maturity Level 3 organization.
The Company is organized as a matrix comprised of five customer facing operating segments supported by several service line organizations. The five operating segments are responsible for customer relationships, business development and program management, and delivery and execution, while the service line organizations manage our workforce and the development of our offerings, solutions and capabilities. Each of the Company’s five operating segments is focused on providing the Company’s comprehensive technical and enterprise IT service offerings to one or more agencies of the U.S. federal government. The Company’s operating segments are aggregated into one reportable segment for financial reporting purposes.
For additional discussion and analysis related to recent business developments, see “Economic Opportunities, Challenges and Risks” in “Management’s Discussion and Analysis of Financial Condition and Results of Operations” in Part II of this report.
Key Customers
In each of fiscal 2017, 2016 and 2015, over 95% of our total revenues were attributable to prime contracts with the U.S. government or to subcontracts with other contractors engaged in work for the U.S. government. Substantially all of our revenues were earned by entities located in the United States.
We generated more than 10% of our total revenues during each of the last three fiscal years from each of the U.S. Army and U.S. Navy. The percentages of total revenues for the U.S. government, its agencies and other customers, including those comprising more than 10% of total revenues for each of the three years ended February 3, 2017 were approximately:
|
|
|
Year Ended |
|
|||||||||
|
|
|
February 3, 2017 |
|
|
January 29, 2016 |
|
|
January 30, 2015 |
|
|||
|
U.S. Army |
|
|
28 |
% |
|
|
29 |
% |
|
|
28 |
% |
|
U.S. Navy |
|
|
13 |
% |
|
|
16 |
% |
|
|
20 |
% |
|
Other DoD |
|
|
17 |
% |
|
|
21 |
% |
|
|
22 |
% |
|
Other federal government |
|
|
40 |
% |
|
|
31 |
% |
|
|
27 |
% |
|
Total U.S. government |
|
|
98 |
% |
|
|
97 |
% |
|
|
97 |
% |
|
Other |
|
|
2 |
% |
|
|
3 |
% |
|
|
3 |
% |
|
Total |
|
|
100 |
% |
|
|
100 |
% |
|
|
100 |
% |
-2-
SCIENCE APPLICATIONS INTERNATIONAL CORPORATION
Our business is heavily regulated and we must comply with and are affected by laws and regulations, including Federal Acquisition Regulations (FAR) and Cost Accounting Standards (CAS), relating to the award, administration and performance of U.S. government and other contracts. These regulations set forth policies, procedures and requirements for the acquisition of goods and services by the U.S. government and impose a broad range of requirements, many of which are unique to government contracting and include procurement, import and export, security, contract termination and adjustment, and audit requirements. In addition, these regulations govern contract pricing and reimbursable costs by, among other things, requiring certification and disclosure of cost or pricing data in connection with certain contract negotiations, defining allowable and unallowable costs, and otherwise governing the right to reimbursement under various flexibly priced contracts. These laws and regulations impose specific cost accounting practices that may increase accounting and internal control costs associated with compliance with government standards. The U.S. government may revise its procurement practices or adopt new contract rules and regulations at any time. Our compliance with these regulations is monitored by the Defense Contract Management Agency and the Defense Contract Audit Agency.
The U.S. government has the ability to cancel contracts at any time through a termination for the convenience of the U.S. government. Most of our contracts have cancellation terms that would permit us to recover all or a portion of our incurred costs and contract profit for work performed when the U.S. government issues a termination for convenience.
Some of our operations and service offerings involve our access to and use of personally identifiable information and protected health information, which activities are regulated by extensive federal and state privacy and data security laws requiring organizations to provide certain privacy protections and security safeguards for such information.
Internationally, we are subject to foreign government laws and regulations, and U.S. government laws, regulations, and procurement policies and practices (including laws and regulations relating to bribery of foreign government officials, import and export control, investments, exchange controls and repatriation of earnings). We are also susceptible to varying political and economic risks.
In order to help ensure compliance with these complex laws and regulations, we have established policies and procedures that address our approach to meeting these requirements and also administer a robust ethics and compliance training program to maintain a compliance-oriented workforce.
These regulations and risks affecting our business are described in more detail under “Risk Factors” in this report.
Contracts
We must comply with and are affected by laws and regulations relating to the formation, administration and performance of U.S. government and other contracts. The U.S. government procurement environment has evolved due to statutory and regulatory procurement reform initiatives. Budgetary pressures and reforms in the procurement process have increasingly caused many U.S. government agencies to purchase services and solutions using contracting processes that give them the ability to select multiple winners or pre-qualify certain contractors to provide various services or solutions on established general terms and conditions rather than through single award contracts. The predominant contracting methods through which U.S. government agencies procure services and solutions include the following:
Single Award Contracts. U.S. government agencies may procure services and solutions through single award contracts which specify the scope of work that will be delivered and identify the contractor that will provide the specified services. When an agency has a requirement, interested contractors are solicited, qualified and then provided with a request for proposal. The process of qualifying prospective bidders, soliciting proposals and evaluating contractor bids requires the agency to maintain a large, professional procurement staff and the bidding and selection process can take a year or more to complete. This method of contracting may provide the contractor with greater certainty of the timing and amounts to be received at the time of contract award because it generally results in the customer contracting for a specific scope of work from the single successful awardee.
Indefinite Delivery, Indefinite Quantity (IDIQ) Contracts. The U.S. government uses IDIQ contracts to obtain commitments from contractors to provide certain services or solutions on pre-established terms and conditions. The U.S. government then issues task orders under the IDIQ contracts to purchase the specific services or solutions it needs. IDIQ contracts are awarded to one or more contractors following a competitive procurement process. Under a single award IDIQ contract, all task orders under that contract are awarded to one pre-selected contractor. Under a
-3-
SCIENCE APPLICATIONS INTERNATIONAL CORPORATION
multi-award IDIQ contract, task orders can be awarded to any of the pre-selected contractors, which can result in further limited competition for the award of task orders. Multi-award IDIQ contracts that are open for any government agency to use for the procurement of services are commonly referred to as “government-wide acquisition contracts.” IDIQ contracts often have multi-year terms and unfunded ceiling amounts that enable, but not commit, the U.S. government to purchase substantial amounts of services or solutions from one or more contractors. At the time an IDIQ contract is awarded (prior to the letting of any task orders), a contractor may have limited or no visibility as to the ultimate amount of services or solutions that the U.S. government will purchase under the contract, and, in the case of a multi-award IDIQ, the contractor from which such purchases may be made.
U.S. General Services Administration (GSA) Schedule Contracts. The GSA maintains listings of approved suppliers of services and solutions with pre-negotiated prices for use throughout the U.S. government. In order for a company to provide services under a GSA Schedule contract, a company must be pre-qualified and awarded a contract by the GSA. When an agency uses a GSA Schedule to meet its requirements, the agency (or the GSA on behalf of the agency) conducts the procurement and bidders are limited to GSA Schedule-qualified contractors. GSA Schedule contracts are designed to provide the user agency with reduced procurement time and lower procurement costs. Similar to IDIQ contracts, at the time a GSA Schedule contract is awarded, a contractor may have limited or no visibility as to the ultimate amount of services or solutions that customers will ultimately purchase under the contract.
Contract Types
Generally, the type of contract used for the acquisition of our services and solutions is determined by or negotiated with the U.S. government and may depend on certain factors, including: the type and complexity of the work to be performed; degree and timing of the responsibility to be assumed by the contractor for the costs of performance; the extent of price competition; and the amount and nature of the profit incentive offered to the contractor for achieving or exceeding specified standards or goals. We generate revenues under several types of contracts, including the following:
|
|
• |
Cost-reimbursement contracts provide for reimbursement of our direct contract costs and allocable indirect costs, plus a fee (contract profit). This type of contract is generally used when uncertainties involved in contract performance do not permit costs to be estimated with sufficient accuracy to use a fixed-price contract. Cost-reimbursement contracts usually subject us to lower risk and generally require us to use our best efforts to accomplish the scope of the work within a specified time and amount of costs. |
|
|
• |
Time-and-materials (T&M) contracts typically provide for negotiated fixed hourly rates for specified categories of direct labor plus reimbursement of other direct costs. This type of contract is generally used when there is uncertainty of the extent or duration of the work to be performed by the contractor at the time of contract award or it is not possible to anticipate costs with any reasonable degree of confidence. On T&M contracts, we assume the risk of providing appropriately qualified staff to perform these contracts at the hourly rates set forth in the contracts over their period of performance. |
|
|
• |
Firm-fixed price (FFP) contracts provide for a predetermined price for specific solutions. These contracts offer us potential increased profits if we can complete the work at lower costs than planned. While FFP contracts allow us to benefit from cost savings, these contracts also increase our exposure to reduced profits or losses from increased or unexpected costs. |
Our earnings and profitability may vary materially depending on changes in the proportionate amount of revenues derived from each type of contract, the nature of services or solutions provided, as well as the achievement of performance objectives and the stage of performance at which the right to receive fees is finally determined. Given the relative amount of risk assumed by the contractor, cost-reimbursement and T&M contracts generally have lower profitability than FFP contracts. For the proportionate amount of revenues derived from each type of contract for the last three fiscal years, see “Other Key Performance Measures—Contract Types” in “Management’s Discussion and Analysis of Financial Condition and Results of Operations” in Part II of this report.
Selected Financial Data
See “Selected Financial Data” in Part II of this report.
-4-
SCIENCE APPLICATIONS INTERNATIONAL CORPORATION
Backlog represents the estimated amount of future revenues to be recognized under negotiated contracts as work is performed. Our backlog consists of funded backlog and negotiated unfunded backlog. At February 3, 2017 and January 29, 2016 our total backlog was $8.0 billion and $7.2 billion, respectively. For a complete description of our backlog, see “Other Key Performance Measures—Bookings and Backlog” in “Management’s Discussion and Analysis of Financial Condition and Results of Operations” in Part II of this report.
Competition
Competition for contracts is intense and we often compete against a large number of established multinational companies which may have greater name recognition, financial resources and larger technical staffs than we do. We also compete against smaller, more specialized companies that concentrate their resources on particular areas, as well as the U.S. government’s own capabilities. As a result of the diverse requirements of the U.S. government, we frequently collaborate with other companies to compete for large contracts and bid against these same companies in other situations. Our principal competitors include the following:
|
|
• |
the engineering and technical services divisions of large defense contractors that provide IT services in addition to other hardware systems and products, which include companies such as General Dynamics Corporation, Northrop Grumman Corporation, L-3 Communications Corporation and Raytheon Company; |
|
|
• |
contractors focused principally on technical and IT services, such as Booz Allen Hamilton Inc., Engility Holdings, Inc., CACI International, Inc., Leidos Holdings, Inc., ManTech International Corporation, Serco Group plc, Vencore and CSRA Inc.; |
|
|
• |
diversified commercial providers that also provide U.S. government IT services, such as Accenture plc, HP Enterprise Services, International Business Machines Corporation and Unisys Corporation; and |
|
|
• |
contractors providing supply chain management and other logistics services, such as Agility Logistics Corporation. |
We compete on various factors, which include: our technical expertise and qualified and/or security-cleared personnel; our ability to deliver innovative cost-effective solutions in a timely manner; successful program execution on previous programs; our reputation and standing with customers; pricing; and the size and geographic presence of our company.
Competition within the government services industry has intensified which has led to fewer sole-source awards and an increased emphasis on cost competitiveness and affordability. In addition, procurement initiatives to improve efficiency, refocus priorities and enhance best practices could result in fewer new opportunities for our industry as a whole, which would intensify competition within the industry as companies compete for a more limited set of new programs.
Patents and Proprietary Information
Our technical services and solutions are not generally dependent on patent protection, although we do selectively seek patent protection. We claim a proprietary interest in certain of our solutions, software programs, methodologies and know-how. This proprietary information is protected by copyrights, trade secrets, licenses, contracts and other means. We selectively pursue opportunities to license or transfer our technologies to third parties.
In connection with the performance of services, the U.S. government has certain rights to inventions, data, software codes and related material that we develop under U.S. government-funded contracts and subcontracts. Generally, the U.S. government may disclose or license such information to third parties, including, in some instances, our competitors. In the case of some subcontracts that we perform, the prime contractor may also have certain rights to the programs and solutions that we develop under the subcontract.
Research and Development
For information related to our research and development activities, see Note 1 of the notes to the consolidated financial statements contained within this report.
-5-
SCIENCE APPLICATIONS INTERNATIONAL CORPORATION
The U.S. government’s fiscal year ends on September 30. It is not uncommon for U.S. government agencies to award extra tasks or complete other contract actions leading up to the end of its fiscal year in order to avoid the loss of unexpended fiscal year funds, which may favorably impact our third fiscal quarter. In addition, as a result of a greater number of holidays occurring in our fourth fiscal quarter, as compared to our third fiscal quarter, we may experience sequentially higher revenues in our third fiscal quarter and lower revenues in our fourth fiscal quarter. For selected quarterly financial data, see Note 15 of the notes to the consolidated financial statements contained within this report.
Environmental Matters
Our operations are subject to various foreign, federal, state and local environmental protection and health and safety laws and regulations. Although we do not currently anticipate that compliance costs or the liabilities associated with environmental laws will materially and adversely affect us, we cannot ensure that we will not incur material costs or liabilities in the future. These regulations and risks are described in more detail under “Risk Factors” in this report.
Executive Officers
For information about our executive officers, see “Directors, Executive Officers and Corporate Governance” in Part III of this report.
Company Website and Available Information
Our corporate headquarters is located at 1710 SAIC Drive, McLean, VA 22102. Our phone number is (703) 676-4300 and our homepage on the internet is www.saic.com, which contains information about our Company and operations. Through a link on the Investor Relations section of our website, copies of each of our filings with the Securities and Exchange Commission (SEC) can be viewed and downloaded free of charge as soon as reasonably practicable after the reports and amendments are electronically filed with or furnished to the SEC. The information on our website is not incorporated by reference into and is not a part of this report.
You may also request hard copies of the materials referenced in the preceding paragraph, at no cost, by emailing investor relations at InvestorRelations@saic.com.
-6-
SCIENCE APPLICATIONS INTERNATIONAL CORPORATION
In your evaluation of our Company and business, you should carefully consider the risks and uncertainties described below, together with information included elsewhere within this report and other documents we file with the SEC. These risks, as well as additional risks and uncertainties not currently known to us or that we currently believe are immaterial also may materially harm our business, financial condition or operating results and result in a decline in the price of our stock.
Risks Relating to Our Business
We depend on U.S. government agencies as our primary customer and, if our reputation or relationships with these agencies were harmed, our future revenues and cash flows would be adversely affected.
We generated either as a prime contractor or a subcontractor to other contractors engaged in work for the U.S. government over 95% of our total revenues during each of the last three fiscal years from contracts with the U.S. government. We expect to continue to derive substantially all of our revenues from work performed under U.S. government contracts. Our reputation and relationship with the U.S. government, and in particular with the agencies of the DoD, are key factors in maintaining and growing these revenues. Negative press reports or publicity, regardless of accuracy, could harm our reputation. If our reputation is negatively affected, or if we are suspended or debarred from contracting with government agencies for any reason, the amount of business with government and other customers would decrease and our future revenues, cash flows, and financial results would be adversely affected.
A decline in the U.S. government defense budget, changes in spending or budgetary priorities, the failure to approve U.S. government budgets on a timely basis or delays in contract awards and other procurement activity may significantly and adversely affect our future revenues, cash flow and financial results.
Because we generate substantially all of our revenues from contracts with U.S. government agencies, our operating results could be adversely affected by spending caps or changes in budgetary priorities, as well as by delays in the government budget process, program starts or the award of contracts or task orders under contracts. Current U.S. government spending levels for defense-related and other programs may not be sustained. Future spending and program authorizations may not increase or may decrease or shift to programs in areas in which we do not provide services or are less likely to be awarded contracts. Such changes in spending authorizations and budgetary priorities may occur as a result of shifts in spending priorities from defense-related and other programs as a result of competing demands for federal funds and the number and intensity of military conflicts or other factors.
When the U.S. Congress does not complete a budget before the end of the fiscal year, government operations typically are funded through one or more continuing resolutions that authorize agencies of the U.S. government to continue to operate, but do not authorize new spending initiatives. When the U.S. government operates under a continuing resolution, contract awards may be delayed, canceled, or funded at lower levels which could adversely impact our operations, cash flows and financial results. Continuing resolutions have become commonplace in recent years. Failure to complete a budget or to provide for a continuing resolution by applicable deadlines, may result in a federal government shutdown, which could cause us to incur labor or other costs without reimbursement under customer contracts or the delay or cancellation of key programs, and could adversely impact our operations, cash flows and financial results.
The Bipartisan Budget Act of 2015 (the Budget Act) raised the statutory limit on the amount of permissible federal debt (the debt ceiling) until March 2017 and raised the sequestration caps imposed by the Budget Control Act of 2011 (the Budget Control Act). However, unless Congress and the Administration can reach a new agreement by the end of GFY 2017, the full effect of sequestration will once again take effect in GFY 2018 which will significantly reduce defense spending. Congress and the Administration will also need to once again raise the federal debt ceiling. If no agreement is reached before the “extraordinary measures” currently allowing the Secretary of Treasury to manage government payments expire, the government will exceed the debt ceiling, which could result in the delay of the U.S. government's timely payment of our billings, resulting in delayed cash collection, and have significant consequences for our company, our employees, our suppliers and the defense industry.
-7-
SCIENCE APPLICATIONS INTERNATIONAL CORPORATION
The U.S. government also conducts periodic reviews of U.S. defense strategies and priorities which may shift DoD budgetary priorities, reduce overall spending or delay contract or task order awards for defense-related programs from which we would otherwise expect to derive a significant portion of our future revenues. A significant decline in overall U.S. government spending, a significant shift in spending priorities, the substantial reduction or elimination of particular defense-related programs or significant budget-related delays in contract or task order awards for large programs could adversely affect our future revenues and limit our growth prospects.
Our failure to comply with a variety of complex procurement rules and regulations could result in our being liable for penalties, including termination of our U.S. government contracts, disqualification from bidding on future U.S. government contracts and suspension or debarment from U.S. government contracting.
We must comply with laws and regulations relating to the formation, administration and performance of U.S. government contracts, which affect how we do business with our customers and may impose added costs on our business. Some significant statutes and regulations that affect us include:
|
|
• |
the FAR and agency supplements, which regulate the formation, administration and performance of U.S. government contracts; |
|
|
• |
the Truth in Negotiations Act, which requires certification and disclosure of cost or pricing data in connection with certain contract awards; |
|
|
• |
the Procurement Integrity Act, which restricts access to competitor bid and proposal information and government source selection information and limits our ability to provide compensation to certain former government officials; |
|
|
• |
the Civil False Claims Act, which provides for substantial damages and civil penalties for submission of a false claim to the U.S. government for payment or approval; and |
|
|
• |
the U.S. government Cost Accounting Standards (CAS), which impose requirements that govern our right to reimbursement under certain cost-based U.S. government contracts. |
Many of our U.S. government contracts contain organizational conflict of interest (OCI) clauses that may limit our ability to compete for or perform certain other contracts or other types of services for particular customers. OCI arises when we engage in activities that may make us unable to render impartial assistance or advice to the U.S. government, impair our objectivity in performing contract work or provide us with an unfair competitive advantage. Existing OCI, and any OCI that may develop, could preclude our competition for or performance on a significant project or contract, which could limit our opportunities.
The U.S. government may adopt new contract rules and regulations or revise its procurement practices in a manner adverse to us at any time.
Our industry continues to experience significant changes to business practices as a result of an increased focus on affordability, efficiencies and recovery of costs, among other items. U.S. government agencies may face restrictions or pressure regarding the type and amount of services that they may obtain from private contractors. Legislation, regulations and initiatives dealing with procurement reform, mitigation of potential OCI’s, deterrence of fraud, and environmental responsibility or sustainability could have an adverse effect on us. Moreover, shifts in the buying practices of U.S. government agencies (such as increased usage of fixed price contracts, multiple award contracts and small business set-aside contracts) could have adverse effects on government contractors, including us. Any of these changes could impair our ability to obtain new contracts or contract renewals. Any new contracting requirements or procurement methods could be costly or administratively difficult for us to implement and could adversely affect our future revenues, profitability and prospects.
-8-
SCIENCE APPLICATIONS INTERNATIONAL CORPORATION
Our business is subject to reviews, audits and cost adjustments by the U.S. government, which, if resolved unfavorably to us, could adversely affect our profitability, cash flows or growth prospects.
The Defense Contract Audit Agency (DCAA), Defense Contract Management Agency (DCMA) and others routinely audit and review a contractor’s performance on government contracts, indirect cost rates and pricing practices, and compliance with applicable contracting and procurement laws, regulations and standards. They also review the adequacy of the contractor’s compliance with government standards for its business systems, which are defined as the contractor’s accounting, earned value management, estimating, materials management, property management and purchasing systems. A finding of significant control deficiencies in a contractor’s business systems or a finding of noncompliance with CAS can result in decremented billing rates to U.S. government customers until the control deficiencies are corrected and their remediation is accepted by the DCMA. The agencies conducting these audits and reviews have come under increased scrutiny. As a result, audits and reviews have become more rigorous and the standards to which we are held are being more strictly interpreted which has increased the likelihood of an audit or review resulting in an adverse outcome.
Government audits and reviews may conclude that our practices are not consistent with applicable laws and regulations and result in adjustments to contract costs and mandatory customer refunds. Such adjustments can be applied retroactively, which could result in significant customer refunds. Receipt of adverse audit findings or the failure to obtain an “approved” determination on our various business systems could significantly and adversely affect our business by, among other things, restricting our ability to bid on new contracts and, for those proposals under evaluation, diminishing our competitive position. A determination of noncompliance could also result in the U.S. government imposing penalties and sanctions against us, including withholding of payments, suspension of payments and increased government scrutiny. Increased scrutiny could adversely impact our ability to perform on contracts, affect our ability to invoice for work performed, delay the receipt of timely payment on contracts, and weaken our ability to compete for new contracts with the U.S. government.
The indirect cost audits by the DCAA of our business remain open for fiscal 2011 and subsequent years. We have recorded contract revenues subsequent to and including fiscal 2011 based on an estimate of costs that we believe will be approved on final audit. However, we do not know the outcome of any ongoing or future audits or whether future adjustments will exceed our reserves for potential adjustments.
We have recorded reserves for estimated net amounts to be refunded to customers for potential adjustments for indirect cost audits and compliance with CAS for indemnification obligations owing to former Parent for periods prior to the spin-off date. Any additional amounts which may be determined to be owed for periods prior to the separation will be allocated to former Parent and us in proportions determined in accordance with the Distribution Agreement. Additional amounts that are allocated to us could have a material, adverse impact to our profitability and cash flows. For a more detailed discussion of the terms of the Distribution Agreement governing financial impacts of audits and reviews for periods prior to the spin-off, see Note 14 of the notes to the consolidated financial statements contained within this report.
Our business is subject to governmental review and investigation which could adversely affect our profitability, cash position and growth prospects.
We are routinely subject to governmental investigations relating to our contracts and operations. If a review or investigation identifies improper or illegal activities, we may be subject to civil or criminal penalties or administrative sanctions which could include the termination of contracts, forfeiture of profits, the triggering of price reduction clauses, suspension of payments, fines, and suspension or debarment from doing business with governmental agencies. We may suffer harm to our reputation if allegations of impropriety are made against us, which would impair our ability to win new contract awards or receive contract renewals. Penalties and sanctions are not uncommon in our industry. If we incur a material penalty or administrative sanction or otherwise suffer harm to our reputation, our profitability, cash position and future prospects could be adversely affected.
-9-
SCIENCE APPLICATIONS INTERNATIONAL CORPORATION
The U.S. government may terminate, cancel, modify or curtail our contracts at any time and, if we do not replace them, we may be unable to achieve or sustain revenue growth and may suffer a decline in revenues and profitability.
Many of the U.S. government programs in which we participate as a contractor or subcontractor may extend for several years and include one or more base years and one or more option years. Under our contracts, the U.S. government generally has the right not to exercise options to extend or expand our contracts and may otherwise terminate, cancel, modify or curtail our contracts at its convenience. Any decision by the U.S. government not to exercise contract options or to terminate, cancel, modify or curtail our major programs or contracts would adversely affect our revenues, revenue growth and profitability.
We have experienced and continue to experience periodic performance issues under certain of our contracts. If a government customer terminates a contract for default, we may be exposed to liability, including for excess costs incurred by the customer in procuring undelivered services and solutions from another source. Depending on the nature and value of the contract, a performance issue or termination for default could cause our actual results to differ from those anticipated and could harm our reputation.
We face aggressive competition that can impact our ability to obtain contracts and may affect our future revenues, profitability and growth prospects.
We expect that a majority of the business that we seek in the foreseeable future will be awarded through a competitive bidding process as the U.S. government increasingly relies on IDIQ, GSA Schedule and other multi-award contracts, which has resulted in greater competition and increased pricing pressure. The competitive bidding process involves substantial costs and a number of risks, including significant cost and managerial time to prepare bids and proposals for contracts that may not be awarded to us, or that may be awarded but for which we do not receive meaningful task orders. For contracts awarded to us, we also face the risk of inaccurately estimating the resources and costs that will be required to fulfill any contract we win. Following contract award, we may encounter significant expense, delay, contract modifications or even contract loss as a result of our competitors protesting the award of contracts to us in competitive bidding. Any resulting loss or delay of startup and funding of work under protested contract awards may adversely affect our revenues and/or profitability. In addition, multi-award contracts require that we make sustained post-award efforts to obtain task orders under the contract. As a result, we may not be able to obtain these task orders or recognize revenues under these multi-award contracts. Our failure to compete effectively in this procurement environment would adversely affect our revenues and profitability.
We compete with larger companies that have greater name recognition, financial resources and larger technical staffs and with smaller, more specialized companies that are able to concentrate their resources on particular areas. Additionally, we may compete with the U.S. government’s own capabilities. To remain competitive, we must consistently provide superior service, technology and performance on a cost-effective basis to our customers and there is no assurance that we will do so.
A failure to attract, train, retain and utilize skilled employees and our senior management team would adversely affect our ability to execute our strategy and may disrupt our operations.
Our business relies heavily upon the expertise and services of our employees. Our continued success depends on our ability to recruit and retain highly trained and skilled engineering, technical and professional personnel. Competition for skilled personnel is intense and competitors aggressively recruit key employees. In addition, many U.S. government programs require contractors to have security clearances. Depending on the level of required clearance, security clearances can be difficult and time-consuming to obtain and personnel with security clearances are in great demand. Particularly in highly specialized areas, it has become more difficult to retain employees and meet all of our needs for employees in a timely manner, which may affect our growth in the current and future fiscal years. Although we intend to continue to devote significant resources to recruit, train and retain qualified employees, we may not be able to attract, effectively train and retain these employees. Any failure to do so could impair our ability to efficiently perform our contractual obligations, timely meet our customers’ needs and ultimately win new business, all of which could adversely affect our future results. In addition, salaries and related costs are a significant portion of the cost of providing our services and, accordingly, our ability to efficiently utilize our workforce impacts our profitability. If our employees are under-utilized, our profitability could suffer.
-10-
SCIENCE APPLICATIONS INTERNATIONAL CORPORATION
We believe that our success also depends on the continued employment of a highly qualified and experienced senior management team and that team’s ability to retain existing business and generate new business. The loss of key personnel in critical functions could lead to lack of business continuity or disruptions in our business until we are able to hire and train replacement personnel.
In the prior fiscal year, we completed a significant acquisition and may make other acquisitions, investments, joint ventures and divestitures in the future that involve numerous risks, which if realized, may adversely affect our business and our future results.
In May 2015, we acquired Scitor Holdings, Inc. and its subsidiaries (Scitor) for a total purchase price of $764 million, net of cash acquired. In connection with the acquisition, we amended our Credit Facility to incur approximately $670 million of additional debt and converted the Credit Facility from an unsecured facility to a facility secured by a lien on substantially all of our assets. Under the terms of the Credit Facility, we are required to maintain a certain ratio of debt to earnings before interest, taxes, depreciation and amortization (referred to as the Leverage Ratio). Further, under the terms of the Credit Facility, may be limited in our ability to pay dividends beyond our current regular dividend and repurchase shares of our stock above a certain Leverage Ratio may be required to make certain mandatory prepayments based on the cash flow of our business, and are subject to other operational limitations.
Our Credit Facility also imposes limitations on our ability to make other acquisitions. Subject to those limitations, we may selectively pursue additional strategic acquisitions, investments and joint ventures. The Scitor acquisition and other acquisitions, investments and joint ventures pose many risks that could adversely affect our reputation, operations or financial results, including:
|
|
• |
we may not retain key employees (including those with needed security clearances), customers and business partners of Scitor or those of an acquired business in the future; |
|
|
• |
we may fail to successfully integrate Scitor or other future acquired businesses, such as failing to successfully implement IT and other control systems relating to the operations of Scitor or any other future acquired business; |
|
|
• |
we may not generate sufficient earnings to meet the required Leverage Ratio under the Credit Facility, which would give lenders the right to, among other things, foreclose on our assets; |
|
|
• |
acquisitions normally require a significant investment of time and resources, which may disrupt our business and distract our management from other important responsibilities; |
|
|
• |
we may not be able to accurately estimate the financial effect of the Scitor acquisition or any future acquisitions and investments on our business and we may not realize anticipated revenue opportunities, cost savings, or other synergies or benefits, or acquisitions may not result in improved operating performance; and |
|
|
• |
we may assume known as well as unknown material liabilities, legal or regulatory risks that were not identified as part of our due diligence or for which we are unable to receive a purchase price adjustment or reimbursement through indemnification; |
If the Scitor acquisition or any other acquisitions, investments or joint ventures fail, perform poorly or their value is otherwise impaired for any reason, including contractions in credit markets and global economic conditions, our business and financial results would be adversely affected.
In addition, we may periodically divest businesses, including businesses that are no longer a part of our ongoing strategic plan. These divestitures similarly require significant investment of time and resources and may disrupt our business, distract management from other responsibilities and may result in losses on disposal or continued financial involvement in the divested business, including through indemnification, guarantee or other financial arrangements, for a period of time following the transaction, which could adversely affect our financial results.
-11-
SCIENCE APPLICATIONS INTERNATIONAL CORPORATION
Our earnings and profitability may vary based on the mix of our contracts and may be adversely affected by our failure to accurately estimate and manage costs, time and resources.
We generate revenues under various types of contracts, which include cost-reimbursement, T&M and FFP contracts. Our earnings and profitability may vary materially depending on changes in the proportionate amount of revenues derived from each type of contract, the nature of services or solutions provided, as well as the achievement of performance objectives and the stage of performance at which the right to receive fees, particularly under incentive and award fee contracts, is finally determined. Cost-reimbursement and T&M contracts generally have lower profitability than FFP contracts.
To varying degrees, each of our contract types involves some risk that we could underestimate the costs and resources necessary to fulfill the contract. Our profitability is adversely affected when we incur costs on cost-reimbursement and T&M contracts that we cannot bill to our customers. While FFP contracts allow us to benefit from cost savings, these contracts also increase our exposure to the risk of cost overruns. Revenues derived from FFP contracts represented approximately 29% of our total revenues for fiscal 2017. When making proposals on FFP contracts, we rely heavily on our estimates of costs and timing for completing the associated projects, as well as assumptions regarding technical issues. In each case, our failure to accurately estimate costs or the resources and technology needed to perform our contracts or to effectively manage and control our costs during the performance of work could result, and in some instances has resulted, in reduced profits or in losses. More generally, any increased or unexpected costs or unanticipated delays in connection with the performance of our contracts, including costs and delays caused by contractual disputes or other factors outside of our control (such as performance failures of our subcontractors, natural disasters or other force majeure events) could make our contracts less profitable than expected or unprofitable.
We use estimates in recognizing revenues and, if we make changes to estimates used in recognizing revenues, our profitability may be adversely affected.
A significant portion of our contract revenues are recognized using the percentage-of-completion method. This method requires estimates of total costs at completion, fees earned on the contract, or both. Particularly due to the technical nature of the services being performed and the length of certain contracts, this estimation process is complex and involves significant judgment. Adjustments to original estimates are often required as work progresses, experience is gained and additional information becomes known, even though the scope of the work required under the contract may not change. Any adjustment as a result of a change in estimate is recognized immediately. Changes in the underlying assumptions, circumstances or estimates could result in adjustments that may adversely affect future financial results.
Our business and financial results could be negatively affected by cyber or other security threats.
As a U.S. government contractor and a provider of IT services operating in multiple regulated industries and geographies, we handle a variety of sensitive information including personally identifiable information, protected health information, personnel information, classified information, and financial information, concerning our business and employees and those of our customers. We are continuously exposed to cyber and other security threats, including computer viruses, attacks by hackers, malware, insider threats and physical break-ins. Any unauthorized electronic or physical intrusion or other security threat may jeopardize the protection of sensitive or other information stored or transmitted through our IT systems and networks. This could lead to disruptions in mission-critical systems, unauthorized release of sensitive information and the theft or corruption of data. Although we have implemented and regularly update and improve policies, procedures and other controls to monitor, protect against, detect and mitigate cyber and other security threats, attempts to gain unauthorized access to our IT systems and networks are becoming more sophisticated. We, however, seek to detect and investigate all security events and prevent their occurrence.
-12-
SCIENCE APPLICATIONS INTERNATIONAL CORPORATION
In addition, we work with industry and the U.S. government to share threat intelligence and promote increased awareness and enhanced protections against cybersecurity threats. However, because of the evolving nature of these security threats, there can be no assurance that our policies, procedures and other controls will detect or prevent them, and we cannot predict their full impact. We may experience similar security threats to the IT systems that we develop, install or maintain under customer contracts, including customer contracts under which we may have access to or management responsibility for customer databases or networks that contain sensitive information relating to our customers, their employees or related third parties. Although we work cooperatively with our customers to seek to minimize the impacts of cyber and other security threats, we must usually rely on the safeguards used or required by those customers. In the event of unauthorized access to sensitive information for which are responsible under customer contracts, our customers, their employees, or third parties may seek to hold us liable for any costs or other damages associated with the unauthorized access. In addition, government agencies may bring legal actions against us for violation of or noncompliance with regulatory requirements relating to any unauthorized access to sensitive information. Any remediation costs, damages or other liabilities related to unauthorized access of sensitive information of ours or our customers caused by cyber or other security threats may not be fully insured or indemnified by other means. Occurrence of any unauthorized access caused by these security threats could adversely affect our reputation, business operations and financial results.
Customer systems failures could damage our reputation and adversely affect our revenues and profitability.
Many of the systems and networks that we develop, install and maintain for our customers involve managing and protecting personal information and information relating to national security and other sensitive government functions. While we have programs designed to comply with relevant privacy and security laws and restrictions, if a system or network that we develop, install or maintain were to fail or experience a security breach or service interruption, whether caused by us, third-party service providers, cybersecurity threats or other events, we may experience loss of revenue, remediation costs or face claims for damages or contract termination. Any such event could cause serious harm to our reputation and prevent us from having access to or being eligible for further work on such systems and networks. Our errors and omissions liability insurance may be inadequate to compensate us for all of the damages that we may incur and, as a result, our future results could be adversely affected.
Legal disputes could require us to pay potentially large damage awards and could be costly to defend, which would adversely affect our cash balances and profitability, and could damage our reputation.
We are subject to a number of lawsuits and claims described under “Legal Proceedings” in Part I of this report. We are also subject to, and may become a party to, a variety of other litigation or claims and suits that arise from time to time in the ordinary course of our business. The Department of Justice and other enforcement agencies of the U.S. government may bring claims or lawsuits against us in connection with our performance of government contracts or our billing or record-keeping relating to those contracts. The Department of Justice has considerably more resources at its disposal than we do, and can bring suspension and debarment proceedings against us that would prevent us from working for some or all U.S. government customers. In addition, certain statutes under which the Department of Justice may bring claims (like the False Claims Act) provide for treble damages and penalties on a per invoice basis against government contractors. These circumstances generally give the Department of Justice significantly more leverage in any legal dispute with us than if we were defending ourselves against claims brought by a commercial enterprise. Adverse judgments or settlements in some or all of these legal disputes may result in significant monetary damages or injunctive relief against us. Any claims or litigation could be costly to defend, and even if we are successful or if fully indemnified or insured, could damage our reputation and make it more difficult to compete effectively or obtain adequate insurance in the future. Litigation and other claims, including those described under “Legal Proceedings” in Part I of this report, are subject to inherent uncertainties and management’s view of these matters may change in the future.
-13-
SCIENCE APPLICATIONS INTERNATIONAL CORPORATION
Our business is subject to numerous legal and regulatory requirements and any violation of these requirements or any misconduct by our employees, subcontractors, agents or business partners could harm our business and reputation.
In addition to government contract procurement laws and regulations, we are subject to numerous other federal, state and foreign legal requirements on matters as diverse as data privacy and protection, employment and labor relations, immigration, taxation, anti-corruption, import/export controls, trade restrictions, internal and disclosure control obligations, securities regulation and anti-competition. Compliance with diverse and changing legal requirements is costly, time-consuming and requires significant resources. Violations of one or more of these requirements in the conduct of our business could result in significant fines and other damages, criminal sanctions against us or our officers, prohibitions on doing business and damage to our reputation. Violations of these regulations or contractual obligations related to regulatory compliance in connection with the performance of customer contracts could also result in liability for significant monetary damages, fines and/or criminal prosecution, unfavorable publicity and other reputational damage, restrictions on our ability to compete for certain work and allegations by our customers that we have not performed our contractual obligations.
Misconduct by our employees, subcontractors, agents or business partners could subject us to fines and penalties, restitution or other damages, loss of security clearance, loss of current and future customer contracts and suspension or debarment from contracting with federal, state or local government agencies, any of which would adversely affect our business and our future results. Such misconduct could include fraud or other improper activities such as falsifying time or other records, failure to comply with our policies and procedures or violations of applicable laws and regulations.
Goodwill and intangible assets represent a significant amount of our total assets and any impairment of these assets would negatively impact our results of operations.
As a result of the Scitor acquisition, our goodwill and intangible assets increased significantly. Goodwill and intangible assets are tested for impairment annually or whenever events or changes in circumstances indicate that the carrying value may not be recoverable. Examples of events or changes in circumstances indicating that the carrying value of goodwill may not be recoverable could include a significant adverse change in legal factors or in the business climate, an adverse action or assessment by a regulator, unanticipated competition, loss of key contracts, customer relationships, or personnel that affect current and future operating cash flows of the reporting unit. Any future impairment of goodwill or other intangible assets would have a negative impact on our profitability and financial results.
We depend on our teaming arrangements and relationships with other contractors and subcontractors. If we are not able to maintain these relationships, or if these parties fail to satisfy their obligations to us or the customer, our revenues, profitability and growth prospects could be adversely affected.
We rely on teaming relationships with other prime contractors and subcontractors in order to submit bids for large procurements or other opportunities where we believe the combination of services, products and solutions provided by us and our teammates will help us to win and perform the contract. Our future revenues and growth prospects could be adversely affected if other contractors eliminate or reduce their contract relationships with us, or if the U.S. government terminates or reduces these other contractors’ programs, does not award them new contracts or refuses to pay under a contract. Companies that do not have access to U.S. government contracts or experience with our customers may perform services as our subcontractor that we cannot otherwise provide ourselves, and that exposure could enhance such companies’ prospect of securing a future position as a prime U.S. government contractor which could increase competition for future contracts and impair our ability to win these contracts.
-14-
SCIENCE APPLICATIONS INTERNATIONAL CORPORATION
Whenever our subcontractors fail to timely meet their contractual obligations, have regulatory compliance or other problems, our ability to fulfill our obligations as a prime contractor or higher tier subcontractor may be jeopardized. In addition, we have certain obligations to our former Parent to permit it to perform up to one hundred percent (100%) of task orders as a subcontractor to us under certain contracts that were novated to us in the spin-off transaction. Subcontractor performance deficiencies under subcontracts with us as the prime contractor, including performance by our former Parent, could lead to significant losses in future periods and could result in our termination for default as the prime contractor even though it was the subcontractor that failed to perform and not our personnel.
We have only a limited ability to protect our intellectual property rights, which are important to our success. Our failure to adequately protect our proprietary information and intellectual property rights could adversely affect our competitive position.
We rely principally on trade secrets to protect much of our intellectual property in cases where we do not believe that patent protection is appropriate or obtainable. However, trade secrets are difficult to protect. Although our employees are subject to confidentiality obligations, this protection may be inadequate to deter or prevent misappropriation of our confidential information. We may be unable to detect unauthorized use of our intellectual property or otherwise take appropriate steps to enforce our rights. Failure to obtain or maintain trade secret protection could adversely affect our competitive business position. If we are unable to prevent third parties from infringing or misappropriating our copyrights, trademarks or other proprietary information, our competitive position could be adversely affected. In addition, in connection with the performance of services, the U.S. government has certain rights to inventions, data, software codes and related material that we develop under government-funded contracts and subcontracts, which may permit the U.S. government to disclose or license this information to third parties, including, in some instances, our competitors.
In the course of conducting our business, we may inadvertently infringe the intellectual property rights of others, resulting in claims against us or our customers. Our contracts generally indemnify our customers for third-party claims for intellectual property infringement by the services and solutions we provide. The expense of defending these claims may adversely affect our financial results.
We could incur significant liabilities and suffer negative publicity if our detection systems fail to operate as intended or our assessment reports prove to be inaccurate.
We have developed and sold tsunami buoys and related services that are designed to assist in the detection of tsunamis or large waves that may have catastrophic consequences to coastal communities. Our buoys have been deployed by the U.S. National Oceanic and Atmospheric Administration and non-U.S. governments in other areas around the world. There are many factors, some of which are beyond our control, which could result in the failure of these buoys. We may develop other products or provide services for the detection of natural or manmade threats that could have catastrophic consequences if the threats are realized. In addition, we prepare reports for various government customers in the evaluation or assessment of the consequences of certain threats or natural disasters. The failure of our products and services to help detect the threats for which they were designed or the failure of our reports to accurately assess the consequences of certain threats could contribute to injury, death and extensive property damage and may lead to product liability, professional liability, or other claims against us. Further, if our products, services or reports fail to, or are perceived to have failed to help detect or adequately assess a threat, the negative publicity from such incident could have a material adverse effect on our business.
-15-
SCIENCE APPLICATIONS INTERNATIONAL CORPORATION
Our services and operations sometimes involve using, handling or disposing of hazardous substances or dangerous materials, which could expose us to potentially significant liabilities.
Some of our services and operations involve the use, handling or disposal of hazardous substances or dangerous materials, including explosive, chemical, biological, radiological or nuclear materials. These activities generally subject us to extensive foreign, federal, state and local environmental protection and health and safety laws and regulations, which, among other things, require us to incur costs to comply with these regulations and could impose liability on us for handling or disposing of hazardous substances or dangerous materials. Furthermore, failure to comply with these environmental protection and health and safety laws and regulations could result in civil, criminal, regulatory, administrative or contractual sanctions, including fines, penalties or suspension or debarment from contracting with the U.S. government or could cause us to incur costs to change, upgrade, remediate and/or close some of our operations or properties. Although we do not have extensive real estate holdings, our ownership and operation of real property also subjects us to environmental protection laws, some of which hold current or previous owners or operators of businesses and real property liable for hazardous substance releases, even if they did not know of and were not responsible for the releases. If we have any violations of, or incur liabilities pursuant to, these laws or regulations, our financial condition and operating results could be adversely affected.
We face risks associated with our international business.
Our international business operations may be subject to additional and different risks than our U.S. business. Failure to comply with U.S. government laws and regulations applicable to international business such as the Foreign Corrupt Practices Act or U.S. export control regulations could have an adverse impact on our business with the U.S. government and could expose us to administrative, civil or criminal penalties and may expose us to potentially significant contract losses. In addition, we provide services and solutions in support of U.S. government customers in countries with governments that may be or may become unstable or are in areas of active military or intelligence operations. Operating in such environments may increase the risk of an incident resulting in injury or loss of life, or damage or destruction of property, or inability to meet our contractual obligations. Although our international operations have historically generated a small proportion of our revenues, we do not know the impact that these regulatory, geopolitical and other factors may have on our business in the future and any of these factors could adversely affect our business.
Risks Relating to our Stock
We have contracts with the U.S. government that are classified which may limit investor insight into portions of our business.
We derive a portion of our revenues from programs with the U.S. government that are subject to security restrictions (classified programs), which preclude the dissemination of information that is classified for national security purposes. We are limited in our ability to provide information about these classified programs, their risks or any disputes or claims relating to such programs. As a result, investors have less insight into our classified programs than our other programs and therefore less ability to fully evaluate the risks related to our classified business.
Forward-Looking Statement Risks
You may not be able to rely on forward-looking statements.
This report contains forward-looking statements that are based on our management’s belief and assumptions about the future in light of information currently available to our management. In some cases, you can identify forward-looking statements by words such as “may,” “will,” “should,” “expects,” “projects,” “intends,” “plans,” “anticipates,” “believes,” “estimates,” “predicts,” “potential,” “continue,” “outlook,” and similar words or phrases or the negative of these words or phrases. These statements relate to future events or our future financial performance, and involve known and unknown risks, uncertainties and other factors that may cause our actual results, levels of activity, performance or achievements to be materially different from any future results, levels of activity, performance or achievements expressed or implied by these forward-looking statements. Although we believe that the expectations reflected in the forward-looking statements are reasonable when made, we cannot guarantee future results, levels of activity, performance or achievements. There are a number of important factors that could cause our actual results to differ materially from those results anticipated by our forward-looking statements, which include, but are not limited to the risk factors discussed above.
-16-
SCIENCE APPLICATIONS INTERNATIONAL CORPORATION
We do not undertake any obligation to update or revise any of the forward-looking statements to reflect events, circumstances, changes in expectations, or the occurrence of unanticipated events after the date of those statements or to conform these statements to actual results.
Item 1B. Unresolved Staff Comments
No information is required in response to this item.
We occupy approximately 3 million square feet of floor space, substantially all of which is leased. Our corporate headquarters is located in McLean, Virginia. Our principal locations outside of McLean, Virginia include Chantilly, Virginia, Huntsville, Alabama and Oak Ridge, Tennessee. As of February 3, 2017, we conducted our operations in approximately 100 offices located in 29 states, the District of Columbia, and various foreign countries. We consider our facilities suitable and adequate for our present needs, which are generally limited to office, warehouse and computer laboratory spaces.
We have provided information about legal proceedings in which we are involved in Note 14 of the notes to the consolidated financial statements contained within this report.
We are also routinely subject to investigations and reviews relating to compliance with various laws and regulations. Additional information regarding such investigations and reviews is described under the heading “Government Investigations, Audits and Reviews” in Note 14 of the notes to the consolidated financial statements contained within this report.
Item 4. Mine Safety Disclosures
No information is required in response to this item.
-17-
SCIENCE APPLICATIONS INTERNATIONAL CORPORATION
Item 5. Market for Registrant’s Common Equity, Related Stockholder Matters and Issuer Purchase of Equity Securities
Holders of Common Stock, Historical Prices and Dividends
Our common stock is listed on the New York Stock Exchange under the ticker symbol “SAIC” and started trading on September 30, 2013. Prior to September 30, 2013, there was no public market for our common stock. The following table presents, for the periods indicated, the high and low prices for our common stock as reported in the consolidated reporting system for the New York Stock Exchange Composite Transactions:
|
|
|
Fiscal 2017 |
|
Fiscal 2016 |
|
First Quarter |
|
$40.50 to $54.17 |
|
$48.78 to $55.70 |
|
Second Quarter |
|
$51.45 to $62.09 |
|
$49.83 to $54.19 |
|
Third Quarter |
|
$60.52 to $70.62 |
|
$39.89 to $53.69 |
|
Fourth Quarter |
|
$70.66 to $88.65 |
|
$40.87 to $51.60 |
As of March 10, 2017, there were approximately 27,000 holders of record of our common stock. The number of holders of record of our common stock may not be representative of the number of beneficial owners due to shares that may be held by depositories, brokers or nominees.
Quarterly dividends per common share declared for the most recent two fiscal years are as follows:
|
|
|
Fiscal 2017 |
|
|
Fiscal 2016 |
|
||
|
First Quarter |
|
$ |
0.31 |
|
|
$ |
0.28 |
|
|
Second Quarter |
|
$ |
0.31 |
|
|
$ |
0.31 |
|
|
Third Quarter |
|
$ |
0.31 |
|
|
$ |
0.31 |
|
|
Fourth Quarter |
|
$ |
0.31 |
|
|
$ |
0.31 |
|
We intend to continue paying dividends on a quarterly basis, although the declaration of any future dividends will be determined by our Board of Directors and will depend on available cash, estimated cash needs, earnings, financial condition, operating results, capital requirements, applicable contractual restrictions and other factors that our Board of Directors deems relevant. In addition, our ability to declare and pay future dividends on our stock may be restricted by the provisions of Delaware law and covenants in our Credit Facility.
-18-
SCIENCE APPLICATIONS INTERNATIONAL CORPORATION
The following graph compares the total cumulative return on our common stock from September 30, 2013 (the date on which our stock began trading) through fiscal 2017 to three indices: (i) the Standard & Poor’s (S&P) MIDCAP 400 Index, (ii) the Russell 1000 Index and (iii) the Dow Jones US Computer Services Index. The graph assumes an initial investment of $100 on September 30, 2013 and that dividends have been reinvested. The comparisons in the graph are required by the U.S. Securities and Exchange Commission (SEC), based upon historical data and are not intended to forecast or be indicative of possible future performance of our common stock.
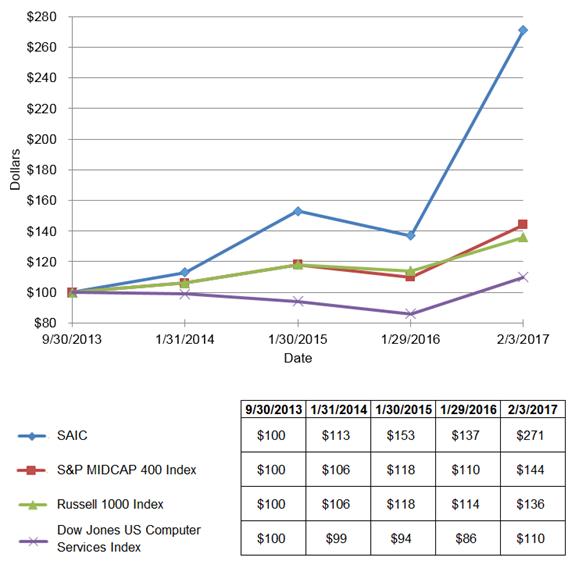
-19-
SCIENCE APPLICATIONS INTERNATIONAL CORPORATION
Purchases of Equity Securities
We may repurchase shares on the open market in accordance with established repurchase plans. Whether repurchases are made and the timing and amount of repurchases depend on a variety of factors including market conditions, our capital position, internal cash generation and other factors.
The following table presents repurchases of our common stock during the three months ended February 3, 2017:
|
Period (1) |
|
Total Number of Shares (or Units) Purchased (2) |
|
|
Average Price Paid per Share (or Unit) |
|
|
Total Number of Shares (or Units) Purchased as Part of Publicly Announced Plans or Programs |
|
|
Maximum Number of Shares (or Units) that May Yet Be Purchased Under the Plans or Programs (3) |
|
||||
|
November 5, 2016 - December 9, 2016 |
|
|
196,236 |
|
|
$ |
79.77 |
|
|
|
189,552 |
|
|
|
1,734,737 |
|
|
December 10, 2016 - January 6, 2017 |
|
|
131,956 |
|
|
|
85.02 |
|
|
|
129,339 |
|
|
|
4,892,711 |
|
|
January 7, 2017 - February 3, 2017 |
|
|
141,094 |
|
|
|
83.21 |
|
|
|
138,092 |
|
|
|
4,754,619 |
|
|
Total |
|
|
469,286 |
|
|
$ |
82.28 |
|
|
|
456,983 |
|
|
|
|
|
|
(1) |
Date ranges represent our fiscal periods during the current quarter. Our fiscal quarters typically consist of one five-week period and two four-week periods. |
|
(2) |
Includes shares purchased on surrender by stockholders of previously owned shares to satisfy minimum statutory tax withholding obligations related to stock option exercises and vesting of stock awards in addition to shares purchased under our publicly announced plans or programs. |
|
(3) |
On December 15, 2016 the number of additional shares of our common stock that may be repurchased under our existing repurchase program previously announced in October 2013 was increased by approximately 3.3 million shares, bringing the total authorized shares to be repurchased under the program to approximately 11.8 million shares. As of February 3, 2017, we have repurchased approximately 7.1 million shares of common stock under the program. |
-20-
SCIENCE APPLICATIONS INTERNATIONAL CORPORATION
Item 6. Selected Financial Data
We commenced operations on September 27, 2013 following completion of a spin-off transaction from our former parent, Leidos Holdings, Inc. (collectively with its consolidated subsidiaries, “former Parent”). Our consolidated and combined statement of income data for fiscal year 2013 consists entirely of the combined results of the technical, engineering and enterprise information technology (IT) services business of former Parent. Our consolidated and combined balance sheet data as of the end of fiscal year 2013 has been reflected on a historical basis from records maintained by former Parent, as prior to the separation all of the assets and liabilities presented were wholly-owned by former Parent. For fiscal 2014, our consolidated and combined statement of income data consists of the combined results of the technical, engineering and enterprise IT services business of former Parent through separation and our consolidated results subsequent to separation. Our consolidated balance sheet data at January 31, 2014 consists of our consolidated balances.
On May 4, 2015, we acquired 100% of privately held Scitor Holdings, Inc. (Scitor) and the consolidated statement of income data includes the results of the operations of Scitor subsequent to the acquisition.
This information should be read in conjunction with “Management’s Discussion and Analysis of Financial Condition and Results of Operations” and our consolidated financial statements and the notes thereto contained within this report.
|
|
|
Year Ended |
|
|||||||||||||||||
|
|
|
February 3, 2017 |
|
|
January 29, 2016 |
|
|
January 30, 2015 |
|
|
January 31, 2014 |
|
|
January 31, 2013 |
|
|||||
|
|
|
(in millions, except per share data) |
|
|||||||||||||||||
|
Consolidated and Combined Statement of Income Data: |
|
|
|
|
|
|
|
|
|
|
|
|
|
|
|
|
|
|
|
|
|
Total revenues |
|
$ |
4,450 |
|
|
$ |
4,315 |
|
|
$ |
3,885 |
|
|
$ |
4,121 |
|
|
$ |
4,781 |
|
|
Operating income |
|
|
271 |
|
|
|
227 |
|
|
|
240 |
|
|
|
183 |
|
|
|
281 |
|
|
Net income |
|
|
148 |
|
|
|
117 |
|
|
|
141 |
|
|
|
113 |
|
|
|
182 |
|
|
Earnings per share(a): |
|
|
|
|
|
|
|
|
|
|
|
|
|
|
|
|
|
|
|
|
|
Basic |
|
$ |
3.33 |
|
|
$ |
2.55 |
|
|
$ |
3.01 |
|
|
$ |
2.33 |
|
|
$ |
3.74 |
|
|
Diluted |
|
$ |
3.22 |
|
|
$ |
2.47 |
|
|
$ |
2.91 |
|
|
$ |
2.27 |
|
|
$ |
3.66 |
|
|
Cash dividend per share |
|
$ |
1.24 |
|
|
$ |
1.21 |
|
|
$ |
1.12 |
|
|
$ |
0.56 |
|
|
$ |
- |
|
|
|
|
|
|
|
|
|
|
|
|
|
|
|
|
|
|
|
|
|
|
|
|
|
|
|
|
|
|
|
|
|
|
|
|
|
|
|
|
|
|
|
|
|
|
Consolidated and Combined Balance Sheet Data: |
|
February 3, 2017 |
|
|
January 29, 2016 |
|
|
January 30, 2015 |
|
|
January 31, 2014 |
|
|
January 31, 2013 |
|
|||||
|
Total assets |
|
$ |
2,042 |
|
|
$ |
2,122 |
|
|
$ |
1,389 |
|
|
$ |
1,442 |
|
|
$ |
1,229 |
|
|
Long-term debt and capital lease obligations, including current portion |
|
|
1,047 |
|
|
|
1,070 |
|
|
|
486 |
|
|
|
498 |
|
|
|
3 |
|
|
Other long-term liabilities and deferred income taxes |
|
|
51 |
|
|
|
41 |
|
|
|
38 |
|
|
|
31 |
|
|
|
10 |
|
|
|
(a) |
For more information on the calculation of Basic and Diluted Earnings per share see Note 2 of the notes to the consolidated financial statements contained within this report. |
-21-
SCIENCE APPLICATIONS INTERNATIONAL CORPORATION
Item 7. Management’s Discussion and Analysis of Financial Condition and Results of Operations
The following discussion and analysis of our financial condition and results of operations, and quantitative and qualitative disclosures about market risk should be read in conjunction with our consolidated financial statements and the related notes. It contains forward-looking statements (which may be identified by words such as those described in “Risk Factors—Forward-Looking Statement Risks” in Part I of this report), including statements regarding our intent, belief, or current expectations with respect to, among other things: trends affecting our financial condition or results of operations (including our financial targets discussed below under “Management of Operating Performance and Reporting” and “Liquidity and Capital Resources”); backlog; our industry; government budgets and spending; market opportunities; the impact of competition; and the impact of the Scitor acquisition. Such statements are not guarantees of future performance and involve risks and uncertainties, and actual results may differ materially from those in the forward-looking statements as a result of various factors. Factors that could cause or contribute to these differences include those discussed below and elsewhere in this report, particularly in “Risk Factors” in Part I of this report. Due to such uncertainties and risks, you are cautioned not to place undue reliance on such forward-looking statements, which speak only as of the date hereof. We do not undertake any obligation to update these factors or to publicly announce the results of any changes to our forward-looking statements due to future results or developments.
We use the terms “Company,” “we,” “us” and “our” to refer to Science Applications International Corporation and its consolidated subsidiaries. References herein to “former Parent” refer to Leidos Holdings, Inc. (formerly SAIC, Inc.) collectively with its consolidated subsidiaries.
The Company utilizes a 52/53 week fiscal year ending on the Friday closest to January 31, with fiscal quarters typically consisting of 13 weeks. Fiscal 2015 began on February 1, 2014 and ended on January 30, 2015, fiscal 2016 began on January 31, 2015 and ended on January 29, 2016, and fiscal 2017 began on January 30, 2016 and ended on February 3, 2017. The number of weeks for each quarter for fiscal 2017, 2016 and 2015 are as follows:
|
|
|
Fiscal 2017 |
|
|
Fiscal 2016 |
|
Fiscal 2015 |
|
|
|
|
(weeks) |
||||||
|
First Quarter |
|
|
14 |
|
|
13 |
|
13 |
|
Second Quarter |
|
|
13 |
|
|
13 |
|
13 |
|
Third Quarter |
|
|
13 |
|
|
13 |
|
13 |
|
Fourth Quarter |
|
|
13 |
|
|
13 |
|
13 |
|
Fiscal Year |
|
|
53 |
|
|
52 |
|
52 |
Business Overview
We are a leading technology integrator providing full life cycle services and solutions in the technical, engineering and enterprise information technology (IT) markets. We developed our brand by addressing our customers’ mission critical needs and solving their most complex problems for over 45 years. As one of the largest pure-play technical service providers to the U.S. government, we serve markets of significant scale and opportunity. Our primary customers are the departments and agencies of the U.S. government. We serve our customers through approximately 1,400 active contracts and task orders and employ approximately 15,500 individuals who are led by an experienced executive team of proven industry leaders. Our long history of serving the U.S government has afforded us the ability to develop strong and longstanding relationships with some of the largest customers in the markets we serve.
Substantially all of our revenues and tangible long-lived assets are generated by or owned by entities located in the United States.
-22-
SCIENCE APPLICATIONS INTERNATIONAL CORPORATION
Economic Opportunities, Challenges and Risks
In fiscal 2017, we generated greater than 95% of our total revenues from contracts with the U.S. government, including subcontracts on which we perform. Our business performance is affected by the overall level of U.S. government spending and the alignment of our offerings and capabilities with the budget priorities of the U.S. government. While we believe that national security will continue to be a priority, the U.S. government budget deficit and the national debt have created pressure to examine and reduce spending across all federal agencies. Baseline spending for the Department of Defense (DoD) through U.S. government fiscal year 2023 has been reduced and there may be further changes that negatively impact discretionary spending trends across all government agencies. Adverse changes in fiscal and economic conditions could materially impact our business. Some changes that could have an adverse impact on our business are the manner in which spending reductions are implemented (including sequestration), future government shutdowns, and issues related to required increases to the nation’s debt ceiling.
The U.S. government has increasingly relied on contracts that are subject to a competitive bidding process (including indefinite delivery, indefinite quantity (IDIQ), U.S. General Services Administration (GSA) schedules and other multi-award contracts) which has resulted in greater competition and increased pricing pressure. We expect that a majority of the business that we seek in the foreseeable future will be awarded through a competitive bidding process.
Despite the budget and competitive pressures impacting the industry, we believe we are well positioned to protect and expand existing customer relationships and benefit from opportunities that we have not previously pursued. Our scale, size and prime contractor leadership position are expected to help differentiate us from our competitors, especially on large contracts. Our long-term, trusted customer relationships and deep technical expertise provide us with the sophistication to handle highly complex mission-critical contracts. SAIC’s value proposition is found in the proven ability to serve as a trusted adviser to our customers. In doing so, we leverage our expertise and scale to help them execute their mission.
We succeed as a business based on the solutions we deliver, our past performance and our ability to compete on price. Our solutions, inspired through innovation, are based on best practices and technology transfer. Our past performance was achieved by employee dedication and customer focus. Our current cost structure, as well as our ongoing efforts to reduce costs by strategic sourcing and developing repeatable offerings, is expected to allow us to compete effectively on price in an evolving environment. Our ability to be competitive in the future will continue to be driven by our reputation of successful program execution, competitive cost structure and efficiencies in assigning the right people, at the right time, in support of our contracts.
See “Risk Factors” in Part I of this report for additional discussion of our industry and regulatory environment.
Management of Operating Performance and Reporting
We manage our business to achieve our long-term financial targets, which we expect to accomplish on average and over time. These financial targets include:
|
|
• |
low single digit annual internal revenue growth percentage, |
|
|
• |
margin expansion of 10 to 20 basis points annually, and |
|
|
• |
return of capital in excess of operating needs. |
Internal revenue growth (or internal revenue contraction if negative) is the method by which we evaluate the growth generated by SAIC after acquisitions. We calculate internal revenue growth percentage by comparing our reported revenue for the current year to the reported revenue for the prior year comparable period adjusted to include any pre-acquisition historical revenue of acquired businesses. Internal revenue growth percentage is a non-GAAP financial measure described in more detail in “Non-GAAP Measures” below.
-23-
SCIENCE APPLICATIONS INTERNATIONAL CORPORATION
Our business and program management process is directed by professional managers focused on satisfying our customers by providing high quality services in achieving contract requirements. These managers carefully monitor contract margin performance by constantly evaluating contract risks and opportunities. Through each contract’s life cycle, program managers review performance and update contract performance estimates to reflect their understanding of the best information available. For contracts accounted for under the percentage-of-completion method in which incurred costs or efforts expended are used as a measure of progress to project completion, updates to estimates are recognized on inception-to-date activity, during the period of adjustment, resulting in either a favorable or unfavorable impact to operating income.
We evaluate our results of operations by considering the drivers causing changes in revenues, operating income and operating cash flows. Given that revenues fluctuate on our contract portfolio over time due to contract awards and completions, changes in customer requirements, and increases or decreases in ordering volume of materials, we evaluate significant trends and fluctuations in these terms. Whether performed by our employees or by our subcontractors, we primarily provide services and, as a result, our cost of revenues are predominantly variable. We also analyze our cost mix (labor, subcontractor or materials) in order to understand operating margin because contracts performed with a higher proportion of SAIC labor are generally more profitable. Changes in costs of revenues as a percentage of revenue other than from revenue volume or cost mix are normally driven by fluctuations in shared or corporate costs, or cumulative revenue adjustments due to changes in contract estimates.
Changes in operating cash flows are described with regard to changes in cash generated through the delivery of services, significant drivers of fluctuations in assets or liabilities and the impacts of changes in timing of cash receipts or disbursements.
Results of Operations
The primary financial performance measures we use to manage our business and monitor results of operations are revenues, operating income and cash flows from operating activities. The following table summarizes our results of operations:
|
|
|
Year Ended |
|
|||||||||||||||||
|
|
|
February 3, 2017 |
|
|
Percent change |
|
|
January 29, 2016 |
|
|
Percent change |
|
|
January 30, 2015 |
|
|||||
|
|
(dollars in millions) |
|
||||||||||||||||||
|
Revenues |
|
$ |
4,450 |
|
|
|
3 |
% |
|
$ |
4,315 |
|
|
|
11 |
% |
|
$ |
3,885 |
|
|
Cost of revenues |
|
|
4,003 |
|
|
|
3 |
% |
|
|
3,904 |
|
|
|
10 |
% |
|
|
3,550 |
|
|
Selling, general and administrative expenses |
|
|
166 |
|
|
|
5 |
% |
|
|
158 |
|
|
|
66 |
% |
|
|
95 |
|
|
Acquisition and integration costs |
|
|
10 |
|
|
|
(62 |
%) |
|
|
26 |
|
|
|
100 |
% |
|
|
- |
|
|
Operating income |
|
|
271 |
|
|
|
19 |
% |
|
|
227 |
|
|
|
(5 |
%) |
|
|
240 |
|
|
As a percentage of revenues |
|
|
6.1 |
% |
|
|
|
|
|
|
5.3 |
% |
|
|
|
|
|
|
6.2 |
% |
|
As a percentage of revenues, excluding acquisition and integration costs |
|
|
6.3 |
% |
|
|
|
|
|
|
5.9 |
% |
|
|
|
|
|
|
6.2 |
% |
|
Net income |
|
$ |
148 |
|
|
|
26 |
% |
|
$ |
117 |
|
|
|
(17 |
%) |
|
$ |
141 |
|
|
Cash flows provided by operating activities |
|
$ |
273 |
|
|
|
21 |
% |
|
$ |
226 |
|
|
|
(18 |
%) |
|
$ |
277 |
|
Revenues. Revenues increased $135 million from fiscal 2016 to 2017 primarily due to revenues earned on contracts obtained through the acquisition of Scitor (which occurred in the second quarter of the prior year period), revenues on newly awarded programs including the Amphibious Combat Vehicle and GSA Enterprise Operations programs ($138 million) as well as revenues due to one additional week in the current year period ($88 million). These increases were partially offset by lower activity on our supply chain and logistics services programs as the result of the loss of two contracts in the prior year ($75 million), the expected decline on the Assault Amphibious Vehicle program as we near completion of the prototyping phase ($25 million), and various other decreases across our contract portfolio due to programs that have ended or have experienced lower activity. Revenues from work performed jointly with our former parent company also continued to decrease, as expected, as we complete pre-separation joint work ($22 million).
-24-
SCIENCE APPLICATIONS INTERNATIONAL CORPORATION
Revenues increased $430 million from fiscal 2015 to 2016 primarily due to the acquisition of Scitor which contributed revenues of $428 million during fiscal 2016. The remainder of the increase is due primarily to revenue on newly awarded programs ($96 million), offset by decreased activity on our supply chain and logistics services and other programs ($60 million) and a DoD contract that ended in fiscal 2016 ($19 million).
Cost of Revenues. Cost of revenues increased $99 million from fiscal 2016 to fiscal 2017 primarily due to an increase in revenue volume ($121 million). Cost of revenues as a percentage of revenues decreased from 90.5% in fiscal 2016 to 90.0% in fiscal 2017, which was driven by cost savings initiatives ($10 million) and improved profitability across our contract portfolio ($9 million).
Cost of revenues increased $354 million from fiscal 2015 to fiscal 2016 primarily driven by the acquisition of Scitor which contributed costs of $363 million during fiscal 2016. Cost of revenues as a percentage of revenues decreased from 91.4% in fiscal 2015 to 90.5% in fiscal 2016, which was partially driven by improved profitability across our contract portfolio ($2 million).
Cost of revenues also decreased in fiscal 2016 and fiscal 2017 due to an annual update to our Disclosure Statements that we prepare in accordance with U.S. government Cost Accounting Standards. We classify indirect costs as a cost of revenues or selling, general and administrative expenses (SG&A) in the same manner as such costs are defined in our Disclosure Statements. The update resulted in certain types of costs that had previously been included in cost of revenues to be included in SG&A ($6 million and $10 million for fiscal 2017 and fiscal 2016, respectively); however, total operating costs were not affected by this change.
Selling, General and Administrative Expenses. SG&A increased $8 million from fiscal 2016 to 2017 primarily due to higher bid and proposal (B&P) activity to address a strong pipeline of opportunities ($9 million), lease exit costs ($5 million), and the update to our Disclosure Statements. These increases were partially offset by lower amortization of intangible assets ($8 million).
SG&A increased $63 million, from fiscal 2015 to 2016 primarily due to additional amortization of intangible assets from the Scitor acquisition ($32 million) and other administrative costs attributable to Scitor’s operations ($22 million). In addition, as described above, SG&A increased, with a corresponding decrease to cost of revenues, as a result of the update to our Disclosure Statements.
Operating Income. Operating income increased $44 million to 6.1% of revenues from fiscal 2016 to 2017 primarily due to a decrease in acquisition and integration costs ($16 million), higher net favorable changes in estimates on contracts accounted for using the percentage-of-completion method ($9 million), cost savings initiatives ($10 million), lower intangible asset amortization ($8 million) and increased revenue volume ($12 million). These increases were partially offset by higher B&P activity ($9 million) and lease exit costs ($5 million).
Operating income decreased $13 million to 5.3% of revenues from fiscal 2015 to 2016 primarily due to acquisition and integration expenses related to the acquisition of Scitor ($26 million) which was partially offset by operating income generated by Scitor ($11 million after $32 million of amortization of intangible assets acquired) and a net favorable increase in the change in estimates on contracts accounted for under the percentage-of-completion method ($2 million).
Net Income. Net income increased $31 million from fiscal 2016 to 2017 primarily due to increased operating income ($28 million, net of tax) and a lower effective tax rate ($7 million), partially offset by increased interest expense primarily due to one additional quarter of interest in the current year on additional borrowings.
Net income decreased $24 million from fiscal 2015 to 2016 primarily due to increased interest expense on incremental term loan borrowings related to the Scitor acquisition ($17 million, net of tax) and decreased operating income ($8 million, net of tax) partially offset by a decrease in the effective tax rate ($1 million).
Cash Flows Provided by Operating Activities. Cash flows provided by operating activities were $273 million for fiscal 2017 which represented an increase from fiscal 2016 primarily due to a net reduction in working capital investments in Marine Corps platform integration and IT services programs ($34 million), strong customer receipts, and lower payments for acquisition and integration costs ($13 million) and income taxes ($7 million). Cash flows were also higher due to one additional quarter of operating activities of Scitor. These increases were partially offset by higher interest payments due to one additional quarter of interest incurred on additional borrowings ($13 million) and one extra payroll payment in the current year.
-25-
SCIENCE APPLICATIONS INTERNATIONAL CORPORATION
Cash flows provided by operating activities were $226 million for fiscal 2016 which represented a decrease from fiscal 2015 primarily due to the timing of income tax payments in the fiscal 2015 ($29 million), fiscal 2016 payments for acquisition and integration costs ($18 million), an increase in working capital investments in fiscal 2016 for Marine Corps platform integration services programs ($29 million), and higher interest payments in fiscal 2016 as a result of additional borrowings ($19 million). These decreases were partially offset by cash provided from the operating activities of Scitor during fiscal 2016.
Non-GAAP Measures
Internal revenue growth (contraction), earnings before interest, taxes, depreciation and amortization (EBITDA), and adjusted EBITDA are non-GAAP financial measures. While we believe that these non-GAAP financial measures may be useful in evaluating our financial information, they should be considered as supplemental in nature and not as a substitute for financial information prepared in accordance with GAAP. Reconciliations, definitions, and how we believe these measures are useful to management and investors are provided below. Other companies may define similar measures differently.
Internal Revenue Growth. Internal revenue growth (or internal revenue contraction if negative) is utilized to evaluate revenue growth after the completion of acquisitions. Internal revenue growth is calculated by comparing our reported revenues for the current year to the reported revenues for the prior year comparable period adjusted to include any pre-acquisition historical revenues of acquired businesses. We adjust current and prior year revenue to exclude the impact of revenue performed by our former parent company, Leidos Holdings, Inc. (“former Parent”) since revenues on pre-separation joint work are recorded equal to cost and are expected to decline over time (see Note 1 of the notes to the consolidated financial statements for information regarding our separation from former Parent). For fiscal 2017, a 53-week fiscal year, we have also adjusted revenue to exclude the estimated impact of the additional week in order to facilitate comparison to fiscal 2016, a 52-week fiscal year. We estimate the revenue impact of the additional week by dividing the current year’s revenues for the first quarter by the number of days in the first quarter and multiplying that amount by the number of additional days in the first quarter. We believe that adjusting current year revenues to reflect the impact of the additional week improves comparability since differences in the number of days generally have a direct impact on the amount of revenues earned in our business during the respective periods.
We believe internal revenue growth provides management and investors with useful information in assessing trends on how successful the Company has been at growing revenues of our base business and the businesses that we acquire.
Internal revenue growth for the current fiscal year was estimated as follows:
|
|
|
Year Ended |
|
|||||
|
|
|
February 3, 2017 |
|
|
January 29, 2016 |
|
||
|
|
(in millions) |
|
||||||
|
Prior year period's revenues, as reported |
|
$ |
4,315 |
|
|
$ |
3,885 |
|
|
Prior year period's revenues performed by former Parent |
|
|
(31 |
) |
|
|
(50 |
) |
|
Revenues of acquired business for the pre-acquisition prior year period |
|
|
154 |
|
|
|
452 |
|
|
Prior year period's revenues, as adjusted |
|
|
4,438 |
|
|
|
4,287 |
|
|
Current year revenues, as reported |
|
|
4,450 |
|
|
|
4,315 |
|
|
Revenues performed by former Parent |
|
|
(9 |
) |
|
|
(31 |
) |
|
Estimated impact of 53rd week |
|
|
(88 |
) |
|
|
- |
|
|
Current year period's revenues, as adjusted |
|
|
4,353 |
|
|
|
4,284 |
|
|
Internal revenue growth (contraction) |
|
$ |
(85 |
) |
|
$ |
(3 |
) |
|
Internal revenue growth (contraction) percentage |
|
|
(1.9 |
%) |
|
|
(0.1 |
%) |
Internal revenue contraction for fiscal 2017 was primarily due to lower volume on our supply chain logistics services contracts. Internal revenue contraction for fiscal 2016 was primarily due to lower revenues generated by Scitor due to delays in contract awards and transition of work to small business set aside contracts offset by net increases in revenue across other programs.
-26-
SCIENCE APPLICATIONS INTERNATIONAL CORPORATION
EBITDA and Adjusted EBITDA. The performance measure EBITDA is calculated by taking net income excluding interest expense, provision for income taxes, and depreciation and amortization. Adjusted EBITDA is calculated by taking EBITDA and excluding acquisition and integration costs. Adjusted EBITDA is a performance measure that excludes acquisition and integration costs that we do not consider to be indicative of our ongoing operating performance as they relate to the Company’s significant acquisition of Scitor.
We believe that EBITDA and adjusted EBITDA provide management and investors with useful information in assessing trends in our ongoing operating performance and may provide greater visibility in understanding the long-term financial performance of the Company.
EBITDA and adjusted EBITDA for the current and prior fiscal years were calculated as follows:
|
|
|
Year Ended |
|
|||||||||
|
|
|
February 3, 2017 |
|
|
January 29, 2016 |
|
|
January 30, 2015 |
|
|||
|
|
|
(in millions) |
|
|||||||||
|
Net income |
|
$ |
148 |
|
|
$ |
117 |
|
|
$ |
141 |
|
|
Interest expense |
|
|
52 |
|
|
|
44 |
|
|
|
17 |
|
|
Provision for income taxes |
|
|
72 |
|
|
|
66 |
|
|
|
82 |
|
|
Depreciation and amortization |
|
|
50 |
|
|
|
59 |
|
|
|
20 |
|
|
EBITDA |
|
|
322 |
|
|
|
286 |
|
|
|
260 |
|
|
EBITDA as a percentage of revenues |
|
|
7.2 |
% |
|
|
6.6 |
% |
|
|
6.7 |
% |
|
Acquisition and integration costs |
|
|
10 |
|
|
|
26 |
|
|
|
- |
|
|
Depreciation included in acquisition and integration costs |
|
|
(2 |
) |
|
|
(3 |
) |
|
|
- |
|
|
Adjusted EBITDA |
|
$ |
330 |
|
|
$ |
309 |
|
|
$ |
260 |
|
|
Adjusted EBITDA as a percentage of revenues |
|
|
7.4 |
% |
|
|
7.2 |
% |
|
|
6.7 |
% |
Fiscal 2017 adjusted EBITDA increased to 7.4% of revenues from 7.2% of revenues for the prior year primarily due to an increase in net favorable changes in estimates on contracts accounted for under the percentage-of-completion method and cost savings initiatives. Fiscal 2016 adjusted EBITDA increased to 7.2% of revenues from 6.7% of revenues for the prior year due to the acquisition of Scitor, which had a relatively higher EBITDA margin percentage than our historical business, and a net increase in profitability across our existing contract portfolio.
Other Key Performance Measures
In addition to the financial measures described above, we believe that bookings and backlog are useful measures for management and investors to evaluate our potential future revenues. We also consider measures such as contract types and cost of revenues mix to be useful for management and investors to evaluate our operating income and performance.
Net Bookings and Backlog. Net bookings represent the estimated amount of revenue to be earned in the future from funded and negotiated unfunded contract awards that were received during the period, net of adjustments to estimates on previously awarded contracts. We calculate net bookings as the period’s ending backlog plus the period’s revenues less the prior period’s ending backlog and initial backlog obtained through acquisitions.
Backlog represents the estimated amount of future revenues to be recognized under negotiated contracts as work is performed. We do not include in backlog estimates of revenues to be derived from IDIQ contracts, but rather record backlog and bookings when task orders are awarded on these contracts. Given that much of our revenue is derived from IDIQ contract task orders that renew annually, bookings on these contracts tend to refresh annually as the task orders are renewed. Additionally, we do not include in backlog contract awards that are under protest until the protest is resolved in our favor.
-27-
SCIENCE APPLICATIONS INTERNATIONAL CORPORATION
We segregate our backlog into two categories as follows:
|
|
• |
Funded Backlog. Funded backlog for contracts with government agencies primarily represents estimated amounts of revenue to be earned in the future from contracts for which funding is appropriated less revenues previously recognized on these contracts. It does not include the unfunded portion of contracts in which funding is incrementally appropriated or authorized on a quarterly or annual basis by the U.S. government and other customers even though the contract may call for performance over a number of years. Funded backlog for contracts with non-government customers represents the estimated value on contracts, which may cover multiple future years, under which we are obligated to perform, less revenues previously recognized on these contracts. |
|
|
• |
Negotiated Unfunded Backlog. Negotiated unfunded backlog represents estimated amounts of revenue to be earned in the future from negotiated contracts for which funding has not been appropriated or otherwise authorized and from unexercised priced contract options. Negotiated unfunded backlog does not include any estimate of future potential task orders expected to be awarded under IDIQ, GSA Schedule or other master agreement contract vehicles. |
We expect to recognize revenue from a substantial portion of our funded backlog within the next twelve months. However, the U.S. government can adjust the scope of services of or cancel contracts at any time. Similarly, certain contracts with commercial customers include provisions that allow the customer to cancel prior to contract completion. Most of our contracts have cancellation terms that would permit us to recover all or a portion of our incurred costs and fees (contract profit) for work performed.
The estimated value of our total backlog as of the dates presented was:
|
|
|
February 3, 2017 |
|
|
January 29, 2016 |
|
||
|
|
|
(in millions) |
|
|||||
|
Funded backlog |
|
$ |
1,811 |
|
|
$ |
1,879 |
|
|
Negotiated unfunded backlog |
|
|
6,209 |
|
|
|
5,319 |
|
|
Total backlog |
|
$ |
8,020 |
|
|
$ |
7,198 |
|
We had net bookings worth an estimated $5.3 billion and $4.3 billion during fiscal 2017 and fiscal 2016, respectively. Fiscal 2017 total backlog has increased from the prior year primarily due to several large awards including the High Performance Computing Modernization Program (HPCMP) Integrated Technical Services (HITS) task order and the Enterprise Applications Service Technologies (EAST) 2 contract.
Contract Types. Our earnings and profitability may vary materially depending on changes in the proportionate amount of revenues derived from each type of contract. For a discussion of the types of contracts under which we generate revenue, see “Business—Contract Types” in Part I of this report. The following table summarizes revenues by contract type as a percentage of revenues for the periods presented:
|
|
|
Year Ended |
|
|||||||||
|
|
|
February 3, 2017 |
|
|
January 29, 2016 |
|
|
January 30, 2015 |
|
|||
|
Cost reimbursement |
|
|
41 |
% |
|
|
39 |
% |
|
|
37 |
% |
|
Time and materials (T&M) |
|
|
30 |
% |
|
|
29 |
% |
|
|
29 |
% |
|
Firm-fixed price (FFP) |
|
|
29 |
% |
|
|
32 |
% |
|
|
34 |
% |
|
Total |
|
|
100 |
% |
|
|
100 |
% |
|
|
100 |
% |
-28-
SCIENCE APPLICATIONS INTERNATIONAL CORPORATION
Cost of Revenues Mix. We generate revenues by providing a customized mix of services to our customers. The profit generated from our service contracts is affected by the proportion of cost of revenues incurred from the efforts of our employees (which we refer to below as labor-related cost of revenues), the efforts of our subcontractors and the cost of materials used in the performance of our service obligations under our contracts. Contracts performed with a higher proportion of SAIC labor are generally more profitable. The following table presents changes in cost mix for the periods presented:
|
|
|
|
Year Ended |
|
|||||||||||||
|
|
|
|
February 3, 2017 |
|
|
|
|
January 29, 2016 |
|
|
|
|
January 30, 2015 |
|
|||
|
|
|
(as a % of total cost of revenues) |
|
||||||||||||||
|
Labor-related cost of revenues |
|
|
|
48 |
% |
|
|
|
|
46 |
% |
|
|
|
|
45 |
% |
|
Subcontractor-related cost of revenues |
|
|
|
34 |
% |
|
|
|
|
34 |
% |
|
|
|
|
32 |
% |
|
Supply chain materials-related cost of revenues |
|
|
|
12 |
% |
|
|
|
|
14 |
% |
|
|
|
|
16 |
% |
|
Other materials-related cost of revenues |
|
|
|
6 |
% |
|
|
|
|
6 |
% |
|
|
|
|
7 |
% |
|
|
|
|
|
|
|
|
|
|
|
|
|
|
|
|
|
|
|
Labor-related cost of revenues increased in fiscal 2017 over the prior year period primarily due to newly awarded contracts and the acquisition of Scitor (Scitor’s revenues are primarily generated through labor and subcontractors). Supply chain materials-related cost of revenues decreased in fiscal 2017 compared to the prior year period primarily as a result of a contract loss.
Labor and subcontractor-related cost of revenues increased and supply-chain and other materials-related cost of revenues decreased as a percentage of total cost of revenues in fiscal 2016 relative to fiscal 2015 primarily due to the Scitor acquisition because Scitor’s revenues were substantially generated through labor and subcontractors. Additionally, other materials-related cost of revenues decreased in fiscal 2016 as a result of changes in order volume.
Liquidity and Capital Resources
As a services provider, our business generally requires minimal infrastructure investment. We expect to fund our ongoing working capital, commitments and any other discretionary investments with cash on hand, future operating cash flows and, if needed, borrowings under our $200 million Revolving Credit Facility.
We anticipate that our future cash needs will be for working capital, capital expenditures, and contractual and other commitments. We consider various financial measures when we develop and update our cash deployment strategy, which include evaluating cash provided by operating activities, free cash flow and financial leverage. When our cash generation enables us to exceed our target average minimum cash balance of $150 million, we intend to deploy excess cash through dividends, share repurchases, debt prepayments or strategic acquisitions.
Our ability to fund these needs will depend, in part, on our ability to generate cash in the future, which depends on our future financial results. Our future results are subject to general economic, financial, competitive, legislative and regulatory factors that may be outside of our direct control. Although we believe that the financing arrangements in place will permit us to finance our operations on acceptable terms and conditions for at least the next year, our future access to, and the availability of financing on acceptable terms and conditions will be impacted by many factors (including our credit rating, capital market liquidity and overall economic conditions). Therefore, we cannot ensure that such financing will be available to us on acceptable terms or that such financing will be available at all. Nevertheless, we believe that our existing cash on hand, generation of future operating cash flows, and access to bank financing and capital markets will provide adequate resources to fund our short-term liquidity and long-term capital needs.
Borrowings under our Term Loan Facilities and, if used in the future, our Revolving Credit Facility incur interest at a variable rate. In accordance with our risk management objectives, we hold fixed interest rate swap agreements to hedge the variability in interest payment cash flows on a substantial portion of our outstanding variable rate debt. These instruments are used to hedge the variability in interest payment cash flows and are accounted for as cash flow hedges. Under the swap agreements, we pay the fixed rate and the counterparties to the agreement pay a floating interest rate.
-29-
SCIENCE APPLICATIONS INTERNATIONAL CORPORATION
Our Credit Facility contains customary terms and conditions including financial covenants and covenants restricting the Company's ability to merge or consolidate with another entity or undertake other fundamental changes, enter into property sale and leaseback transactions, and incur liens. The Company’s dividends and share repurchases may be limited under certain leverage ratios, and we may be required to make an annual debt prepayment based on our cash flows from operating activities. See Note 9 to the consolidated financial statements in this annual report for a more complete understanding of our Credit Facility.
We currently maintain credit ratings from major U.S. rating agencies on our senior secured debt. There have been no changes to any of these ratings during fiscal year 2017. Failure to maintain acceptable ratings could have an adverse effect on the Company’s future cost of capital and any significant increase in the level of our borrowings could negatively impact these ratings.
During fiscal 2017 we repurchased approximately 2.4 million shares of our common stock for $149 million from the open market in connection with our existing share repurchase program. During fiscal 2016 we repurchased approximately 1.1 million shares for $50 million, bringing the total since the program’s inception in December of 2013 to 7.1 million shares or $349 million.
Historical Cash Flow Trends
The following table summarizes our cash flows:
|
|
|
Year Ended |
|
|||||||||
|
|
|
February 3, 2017 |
|
|
January 29, 2016 |
|
|
January 30, 2015 |
|
|||
|
|
|
(in millions) |
|
|||||||||
|
Total cash flows provided by operating activities |
|
$ |
273 |
|
|
$ |
226 |
|
|
$ |
277 |
|
|
Total cash flows used in investing activities |
|
|
(11 |
) |
|
|
(798 |
) |
|
|
(22 |
) |
|
Total cash flows (used in) provided by financing activities |
|
|
(247 |
) |
|
|
466 |
|
|
|
(208 |
) |
|
Total increase (decrease) in cash and cash equivalents |
|
$ |
15 |
|
|
$ |
(106 |
) |
|
$ |
47 |
|
Cash Provided by Operating Activities. Refer to “Results of Operations” above for a discussion of the changes in cash provided by operating activities between fiscal 2017 and fiscal 2016 and between fiscal 2016 and fiscal 2015.
Cash Used in Investing Activities. Cash used in investing activities decreased in fiscal 2017 compared to the prior year period, and increased in fiscal 2016 compared to fiscal 2015, primarily due to the acquisition of Scitor in fiscal 2016.
Cash Used in/Provided by Financing Activities. Cash used in financing activities in fiscal 2017 was $247 million compared to cash provided by financing activities of $466 million during the prior year period. This change is primarily due to proceeds from borrowings obtained to fund the Scitor acquisition in the prior year and the additional plan share repurchases under our publicly announced repurchase program in the current year.
Cash provided by financing activities increased in fiscal 2016 primarily due to proceeds from borrowings obtained to fund the Scitor acquisition and lower share repurchase activity in fiscal 2016 under our publicly announced repurchase program. These changes were partially offset by fiscal 2016 payments of deferred financing costs, related to the additional borrowings, and term loan principal payments.
Off-Balance Sheet Arrangements
For an understanding of our obligations relating to surety bonds, see Note 14 of the notes to the consolidated financial statements contained within this report. For an understanding of our operating leases, see “Contractual Obligations” within this section and Note 12 of the notes to the consolidated financial statements contained within this report.
-30-
SCIENCE APPLICATIONS INTERNATIONAL CORPORATION
The following table summarizes, as of February 3, 2017, our obligations to make future payments pursuant to certain contracts or arrangements and provides an estimate of the fiscal years in which these obligations are expected to be satisfied:
|
|
|
Payments Due by Fiscal Year |
|
|||||||||||||||||
|
|
|
Total |
|
|
2018 |
|
|
2019 - 2020 |
|
|
2021 - 2022 |
|
|
2023 - Thereafter |
|
|||||
|
|
|
(in millions) |
|
|||||||||||||||||
|
Contractual obligations: |
|
|
|
|
|
|
|
|
|
|
|
|
|
|
|
|
|
|
|
|
|
Long-term debt including current portion (1) |
|
$ |
1,060 |
|
|
$ |
25 |
|
|
$ |
99 |
|
|
$ |
535 |
|
|
$ |
401 |
|
|
Interest payments on long-term debt (2) |
|
|
200 |
|
|
|
35 |
|
|
|
81 |
|
|
|
74 |
|
|
|
10 |
|
|
Operating lease obligations |
|
|
145 |
|
|
|
42 |
|
|
|
65 |
|
|
|
36 |
|
|
|
2 |
|
|
Estimated purchase obligations (3) |
|
|
58 |
|
|
|
41 |
|
|
|
15 |
|
|
|
2 |
|
|
|
- |
|
|
Other long-term liabilities (4) |
|
|
25 |
|
|
|
4 |
|
|
|
8 |
|
|
|
5 |
|
|
|
8 |
|
|
Total contractual obligations |
|
$ |
1,488 |
|
|
$ |
147 |
|
|
$ |
268 |
|
|
$ |
652 |
|
|
$ |
421 |
|
|
(1) |
The amounts presented are based on an anticipated loan repayment schedule. However, we may be required to make certain mandatory prepayments based on our level of cash flow generation and we also have the option to prepay loan principal amounts at any time. |
|
(2) |
Amounts represent an estimate of future variable interest payments on the Term Loan Facilities based on scheduled outstanding principal amounts, current applicable margin and projected 1- and 3-month LIBOR as of February 3, 2017. In addition, the above table excludes the effects of interest rate swaps used to hedge against changes in 1- and 3-month LIBOR. |
|
(3) |
Includes estimated obligations to transfer funds under legally enforceable agreements for fixed or minimum amounts or quantities of goods or services at fixed or minimum prices. Excludes purchase orders for services or products to be delivered pursuant to U.S. government contracts in which we have full recourse under normal contract termination clauses. |
|
(4) |
Other long-term liabilities primarily consist of liabilities associated with deferred compensation plan obligations, and liabilities for unrecognized tax benefits. Deferred compensation plan obligations have been allocated to fiscal years based on participants’ payment elections on retirement and estimated retirement ages, but is subject to acceleration on participants’ termination of employment prior to retirement. Liabilities for unrecognized tax benefits are allocated to the fiscal years in which the statute of limitations is currently expected to expire. |
Commitments and Contingencies
We are subject to a number of reviews, investigations, claims, lawsuits and other uncertainties related to our business. For a discussion of these items, see Note 14 of the notes to the consolidated financial statements contained within this report.
Critical Accounting Policies
Our discussion and analysis of our financial condition and results of operations are based upon our consolidated financial statements, which are prepared in accordance with U.S. generally accepted accounting principles. The preparation of these financial statements requires management to make estimates and assumptions that affect the reported amounts of assets and liabilities and the disclosure of contingencies, as well as the reported amounts of revenues, expenses, gains and losses during the reporting periods. Management evaluates these estimates and assumptions on an ongoing basis. Our estimates and assumptions have been prepared on the basis of the most current reasonably available information and, in some cases, are our basis for making judgments about the carrying values of assets and liabilities that are not readily apparent from other sources. Estimates and assumptions may change in the future as more current information is available.
Management believes that our critical accounting policies are those that are both material to the presentation of our financial condition and results of operations and require management’s most difficult, subjective and complex judgments. Typically, the circumstances that make these judgments difficult, subjective and complex have to do with making estimates about the effect of matters that are inherently uncertain. These policies are described below.
-31-
SCIENCE APPLICATIONS INTERNATIONAL CORPORATION
Revenue Recognition. We generate our revenues primarily from long-term contracts in which we provide technical, engineering and enterprise IT services directly for the U.S. government and as a subcontractor with other contractors engaged in work for the U.S. government. We evaluate the nature of the contract and the services provided when determining the accounting method utilized for each contract. We recognize a significant portion of our revenues using the cost-to-cost percentage-of-completion method of accounting which requires us to rely on the skill and expertise of our engineers, program managers and business management professionals in the many areas of cost estimation. These estimates of costs can span several years and take into account many factors which include the availability, productivity and cost of labor, potential delays in our performance and the level of future indirect cost allocations.
We provide for anticipated losses on our contracts accounted for using the percentage-of-completion revenue recognition method by recording an expense in the amount of the total expected contract loss during the period when the loss is determined. Amounts billed and collected but not yet earned as revenues under certain types of contracts are deferred. Contract costs incurred for U.S. government contracts (including allocated indirect costs) are subject to audit and adjustment through negotiations with government representatives. Revenues on U.S. government contracts have been recorded in amounts that are expected to be realized on final settlement.
Changes in Estimates on Contracts. Changes in estimates of revenues, cost of revenues, or profits related to contracts accounted for using the percentage-of-completion method of accounting in which incurred costs or efforts expended are used to measure contract progress are recognized in the period in which such changes are made for the inception-to-date effect of the changes. Changes in these estimates can routinely occur during contract performance for a variety of reasons which include: changes in contract scope; changes in contract cost estimates due to unanticipated cost growth or retirements of risk for amounts different than estimated; changes in estimated incentive or award fees; and performance being better or worse than previously estimated. Aggregate changes in contract estimates increased operating income by $22 million for fiscal 2017, increased operating income by $13 million for fiscal 2016 and increased operating income by $11 million for fiscal 2015. For additional information related to changes in estimates on contracts, including gross favorable and unfavorable adjustments as well as the impact to earnings per share, see Note 1 of the notes to the consolidated financial statements contained within this report.
Business Combinations. We record all tangible and intangible assets acquired and liabilities assumed in a business combination at fair value as of the acquisition date, which is determined using a cost, market or income approach. The excess amount of the aggregated purchase consideration paid over the fair value of the net of assets acquired and liabilities assumed is recorded as goodwill. Acquisition date fair value represents the price that would be received to sell an asset or paid to transfer a liability in an orderly transaction between market participants as measured on the acquisition date.
The valuations are based on information that existed as of the acquisition date. During the measurement period that shall not exceed one year from the acquisition date, we may adjust provisional amounts recorded for assets acquired and liabilities assumed to reflect new information that we have subsequently obtained regarding facts and circumstances that existed as of the acquisition date.
Acquisition-related costs that are not part of the purchase price consideration are expensed as incurred. These costs typically include transaction-related costs, such as finder’s fees, and legal, accounting and other professional costs.
Goodwill and Intangible Assets. Goodwill is recorded as the difference between the aggregate consideration paid for an acquisition and the fair value of the net tangible and intangible assets acquired and liabilities assumed. Goodwill is not amortized, but rather tested for potential impairment annually at the beginning of the fourth quarter, or whenever events or changes in circumstances indicate that the carrying value may not be recoverable.
The goodwill impairment test is performed at the reporting unit level. The Company estimates and compares the fair value of each reporting unit to its respective carrying value including goodwill. If the fair value is less than the carrying value, the amount of impairment expense is equal to the difference between the reporting unit’s fair value and the reporting unit’s carrying value.
Determining the fair value of each reporting unit involves judgment and the use of estimates and assumptions. We estimate the fair value of our reporting units using either a market approach, income approach, or a combination of both. For our annual impairment analysis, we reconcile the aggregate fair value of all of our reporting units our market capitalization as of the measurement date.
-32-
SCIENCE APPLICATIONS INTERNATIONAL CORPORATION
Under the income approach, we estimate the fair value of a reporting unit using a multi-year discounted cash flow model that involves assumptions about projected future revenue growth, operating margins, income tax rates, capital expenditures, discount rate and terminal value. The discount rate is an estimate of the cost of capital that a market participant would expect for the respective reporting unit. The terminal value represents the present value in the last year of the projection period of all subsequent cash flows into perpetuity.
Under the market approach, we estimate the fair value of a reporting unit based on multiples of earnings derived from observable market data of comparable public companies. We evaluate companies within our industry that have operations with observable and comparable economic characteristics and are similar in nature, scope and size to the reporting unit being compared. We analyze historical acquisitions in our industry to estimate a control premium that we incorporate into the fair value estimate of a reporting unit under the market approach.
In addition, determining the carrying value of each reporting unit requires judgment and involves the assignment of assets and liabilities to the reporting units based on a systematic and rational allocation methodology. Certain assets and liabilities may be specifically identified and assigned to a reporting unit based on the information contained within our financial systems; whereas, other assets and liabilities may be allocated using measurable relationships or other basis for allocation.
With the completion of the Scitor acquisition in May 2015, we established a new reporting unit (Intelligence Community/Air Force Customer Group) primarily consisting of a majority of the former Scitor business. This reporting unit has a goodwill balance of $482 million. During the fourth quarter of fiscal 2017, we completed our annual goodwill impairment testing and determined that the excess of fair value over the carrying value (the “excess”) for this new reporting unit was approximately 8%, or $51 million. However, if future operating results are lower than anticipated or there are increases in market participant cost of capital, then a reduction in, or elimination of, the excess and potential impairment charges could result. There was significant cushion associated with the Company’s other reporting units as of the fourth quarter fiscal 2017 annual goodwill impairment test date.
Intangible assets with finite lives are amortized using the method that best reflects how their economic benefits are utilized or, if a pattern of economic benefits cannot be reliably determined, on a straight-line basis over their estimated useful lives. Intangible assets with finite lives are assessed for impairment whenever events or changes in circumstances indicate that the carrying value may not be recoverable.
Income Taxes. Our income tax expense, deferred tax assets and liabilities, and liabilities for unrecognized tax benefits reflect our best estimate of current and future taxes to be paid and includes judgments related to matters for which ultimate resolution may not become known until the final resolution of an examination by taxing authorities or the statute of limitations lapses.
We record net deferred tax assets to the extent we believe these assets will more likely than not be realized. In making this determination, we consider all available positive and negative evidence, including future reversals of existing taxable temporary differences, projected future taxable income, tax planning strategies and recent operating results. If we were to determine that we would be able to realize our deferred income tax assets in the future in excess of their net recorded amount or would no longer be able to realize our deferred income tax assets in the future as currently recorded, we would make an adjustment to the valuation allowance which would either decrease or increase, respectively, the provision for income taxes.
We also recognize liabilities for uncertainty in income taxes when it is more likely than not that a tax position will not be sustained on examination and settlement with various taxing authorities. Liabilities for any uncertainty in income taxes are measured based on our estimate of the largest amount of benefit that is greater than 50% likely of being realized on ultimate settlement.
-33-
SCIENCE APPLICATIONS INTERNATIONAL CORPORATION
Stock-Based Compensation. We issue stock-based awards, including stock options, vesting stock awards and performance share awards as compensation to employees and directors. These awards are accounted for as equity awards. We recognize stock-based compensation expense net of estimated forfeitures on a straight-line basis over the underlying award’s requisite service period, as measured using the award’s grant date fair value. For performance share awards, we reassess the probability of achieving the performance conditions at each reporting period and adjust compensation expense based on the number of shares we expect to ultimately issue. Absent sufficient history as a stand-alone company, we estimate forfeitures using former Parent’s historical experience.
We use the Black-Scholes option-pricing model to calculate the grant date fair value of stock options awarded. The model calculates the fair value based on input assumptions about, among other things, employee exercise behavior and the expected volatility of our common stock. The assumptions used in the model represent our best estimates, but these estimates involve inherent uncertainties and the application of judgment. As a result, if factors change and we use different assumptions, our stock-based compensation expense could be materially different in the future. In addition, we are required to estimate the expected forfeiture rate and recognize expense only for those awards expected to vest. If our actual forfeiture rate is materially different from our estimate, the stock-based compensation expense could be significantly different from what we have recorded over the awards’ respective service periods. For further discussion on the assumptions used, see Note 6 of the notes to the consolidated financial statements contained within this report.
Recently Issued But Not Yet Adopted Accounting Pronouncements
For information on recently issued but not yet adopted accounting pronouncements, see Note 1 of the notes to the consolidated financial statements contained within this report.
Effects of Inflation
For any of the most recent three fiscal years ended February 3, 2017, inflation has not had a significant impact on revenues or costs. Most of our contracts are paid in U.S. dollars and our cost to perform on these contracts are generally paid in U.S. dollars, so inflation risk is generally limited to that which is related to the U.S. dollar. Approximately 41% of our revenues for fiscal 2017 were derived from cost-reimbursement type contracts, which have limited inflation risk because our contracts generally entail the provision of labor on a reimbursable basis, and, when materials are acquired, they provide for billing to the customer during the period in which the materials were received. Bids for longer-term FFP and T&M contracts typically include sufficient provisions for labor and other cost escalations to cover anticipated cost increases over the period of performance. As a result, if we were to experience significant levels of inflation, our revenues and costs for cost-type contracts would generally both increase commensurate with inflation and operating income as a percentage of total revenues would not be significantly affected. Operating income as a percentage of total revenues would not be significantly affected for longer-term FFP and T&M contracts to the extent that bid contract cost escalations are sufficient to cover heightened inflation levels.
Item 7A. Quantitative and Qualitative Disclosures About Market Risk
We are exposed to certain market risks in the normal course of business. The following information about our market sensitive financial instruments contains forward-looking statements.
Foreign Currency Risk
Since the substantial majority of our business is conducted in U.S. dollars, a 10% change in any foreign currency exchange rates would not have a material impact to our financial condition or results of operations.
-34-
SCIENCE APPLICATIONS INTERNATIONAL CORPORATION
Debt obligations. Our financial risk management objective is to reduce variability in earnings from changes in interest rates, which we may manage through operational means or the use of financial instruments, such as interest rate swaps. We have approximately $1.1 billion of variable rate debt. The fair value of our outstanding long-term debt obligations approximates its carrying value. In connection with the issuances of our variable rate Term Loan A and Term Loan B Facilities, we entered into fixed interest rate swap agreements, effectively converting a substantial portion of our variable rate debt to fixed rate debt in order to mitigate our exposure to fluctuations in interest rates. We expect to evaluate any additional debt that we incur in the future in accordance with our risk management objectives. A hypothetical 50 basis points (bps) change to interest rates would not materially change our results of operations or cash flows. For additional information related to our debt and interest rate swap agreements, see Note 9 and Note 10, respectively, of the notes to the consolidated financial statements contained in this report.
Derivatives. As of February 3, 2017, the fair value of our fixed interest rate swaps was $3 million (liability). Under the swap agreements, we pay a fixed rate and the counterparties to the agreements pay a floating interest rate based on 1-month or 3-month LIBOR. A hypothetical 50 bps change in the 1-month LIBOR and 3-month LIBOR curves would change the fair value of the fixed interest rate swaps up to $8 million (liability or asset). Since the interest rate swaps are accounted for as cash flow hedges, the change in fair value is reported as a component of equity (accumulated other comprehensive income or loss). We do not hold or issue derivative financial instruments for trading or speculative purposes. For additional information related to calculating the fair value of our interest rate swaps, see Note 10 of the consolidated financial statements included in this report.
Cash equivalents. A 10% unfavorable interest rate movement for interest earned on our cash and cash equivalents would not materially impact the value of our cash holdings and would have a negligible impact on interest income at current market interest rates.
Inflation Risk
We have generally been able to anticipate increases in costs when pricing our contracts. Bids for longer-term FFP contracts typically include labor and other cost escalations in amounts that historically have been sufficient to cover cost increases over the period of contract performance.
Item 8. Financial Statements and Supplementary Data
See our consolidated financial statements attached hereto and listed on the index found on page F-1 of this report.
Item 9. Changes in and Disagreements With Accountants on Accounting and Financial Disclosure
No information is required in response to this item.
Item 9A. Controls and Procedures
Evaluation of Disclosure Controls and Procedures
Our management, with the participation of our principal executive officer (our Chief Executive Officer) and principal financial officer (our Chief Financial Officer), has evaluated the effectiveness of our disclosure controls and procedures (as defined in Rules 13a-15(e) and 15d-15(e) under the Securities Exchange Act of 1934) as of February 3, 2017, and our principal executive officer and principal financial officer have concluded that our disclosure controls and procedures are effective to ensure that information required to be disclosed by us in the reports that we file or submit under the Securities Exchange Act of 1934 is recorded, processed, summarized and reported within the time periods specified in the rules and forms of the SEC. These disclosure controls and procedures include, without limitation, controls and procedures designed to ensure that information required to be disclosed by us in the reports that we file or submit under the Securities Exchange Act of 1934 is accumulated and communicated to our management, including our principal executive officer and our principal financial officer, as appropriate to allow timely decisions regarding required disclosure.
-35-
SCIENCE APPLICATIONS INTERNATIONAL CORPORATION
Changes in Internal Control Over Financial Reporting
There have been no changes in our internal control over financial reporting during the fourth quarter of fiscal 2017 that materially affected, or are likely to materially affect, our internal control over financial reporting.
Management’s Report On Internal Control Over Financial Reporting
Our management is responsible for establishing and maintaining adequate internal control over financial reporting. Internal control over financial reporting is a process designed to provide reasonable assurance regarding the reliability of financial reporting and the preparation of financial statements for external purposes in accordance with GAAP.
Internal control over financial reporting includes those policies and procedures that (i) pertain to the maintenance of records that, in reasonable detail, completely, accurately and fairly reflect the transactions and dispositions of our assets; (ii) provide reasonable assurance that transactions are recorded as necessary to permit preparation of the financial statements in accordance with GAAP; (iii) provide reasonable assurance that our receipts and expenditures are made only in accordance with the authorization of our management and directors; and (iv) provide reasonable assurance regarding prevention or timely detection of unauthorized acquisition, use or disposition of assets that could have a material effect on the consolidated financial statements. Internal control over financial reporting includes the controls themselves, monitoring and internal auditing practices and actions taken to correct deficiencies as identified.
Our management, with the participation of the Chief Executive Officer and Chief Financial Officer, has evaluated the effectiveness of our internal control over financial reporting as of February 3, 2017 based on the framework established in the 2013 Internal Control – Integrated Framework issued by the Committee of Sponsoring Organizations of the Treadway Commission. Our management has assessed in its evaluation the effectiveness of our internal control over financial reporting as of February 3, 2017 and has concluded that our internal control over financial reporting as of that date was effective.
Deloitte & Touche LLP, an independent registered public accounting firm, audited our consolidated financial statements included in this report and our internal control over financial reporting, and the firm’s report on our internal control over financial reporting are set forth below this report.
Although our management, including the Chief Executive Officer and the Chief Financial Officer, is responsible for establishing and maintaining adequate internal control over financial reporting, because of inherent limitations, our management does not expect that our internal controls over financial reporting will prevent or detect all errors and all fraud. Also, projections of any evaluation of effectiveness in such assessment to future periods are subject to the risk that controls may be inadequate because of changes in conditions or that the degree of compliance with the policies or procedures may deteriorate.
-36-
SCIENCE APPLICATIONS INTERNATIONAL CORPORATION
REPORT OF INDEPENDENT REGISTERED PUBLIC ACCOUNTING FIRM
To the Board of Directors and Stockholders of
Science Applications International Corporation
McLean, Virginia
We have audited the internal control over financial reporting of Science Applications International Corporation and subsidiaries (the "Company") as of February 3, 2017, based on the criteria established in Internal Control — Integrated Framework (2013) issued by the Committee of Sponsoring Organizations of the Treadway Commission. The Company's management is responsible for maintaining effective internal control over financial reporting and for its assessment of the effectiveness of internal control over financial reporting, included in the accompanying Management’s Report on Internal Control over Financial Reporting. Our responsibility is to express an opinion on the Company's internal control over financial reporting based on our audit.
We conducted our audit in accordance with the standards of the Public Company Accounting Oversight Board (United States). Those standards require that we plan and perform the audit to obtain reasonable assurance about whether effective internal control over financial reporting was maintained in all material respects. Our audit included obtaining an understanding of internal control over financial reporting, assessing the risk that a material weakness exists, testing and evaluating the design and operating effectiveness of internal control based on the assessed risk, and performing such other procedures as we considered necessary in the circumstances. We believe that our audit provides a reasonable basis for our opinion.
A company's internal control over financial reporting is a process designed by, or under the supervision of, the company's principal executive and principal financial officers, or persons performing similar functions, and effected by the company's board of directors, management, and other personnel to provide reasonable assurance regarding the reliability of financial reporting and the preparation of financial statements for external purposes in accordance with generally accepted accounting principles. A company's internal control over financial reporting includes those policies and procedures that (1) pertain to the maintenance of records that, in reasonable detail, accurately and fairly reflect the transactions and dispositions of the assets of the company; (2) provide reasonable assurance that transactions are recorded as necessary to permit preparation of financial statements in accordance with generally accepted accounting principles, and that receipts and expenditures of the company are being made only in accordance with authorizations of management and directors of the company; and (3) provide reasonable assurance regarding prevention or timely detection of unauthorized acquisition, use, or disposition of the company's assets that could have a material effect on the financial statements.
Because of the inherent limitations of internal control over financial reporting, including the possibility of collusion or improper management override of controls, material misstatements due to error or fraud may not be prevented or detected on a timely basis. Also, projections of any evaluation of the effectiveness of the internal control over financial reporting to future periods are subject to the risk that the controls may become inadequate because of changes in conditions, or that the degree of compliance with the policies or procedures may deteriorate.
In our opinion, the Company maintained, in all material respects, effective internal control over financial reporting as of February 3, 2017, based on the criteria established in Internal Control — Integrated Framework (2013) issued by the Committee of Sponsoring Organizations of the Treadway Commission.
We have also audited, in accordance with the standards of the Public Company Accounting Oversight Board (United States), the consolidated financial statements as of and for the fiscal year ended February 3, 2017 of the Company and our report dated March 30, 2017 expressed an unqualified opinion on those financial statements.
/s/ DELOITTE & TOUCHE LLP
McLean, Virginia
March 30, 2017
-37-
SCIENCE APPLICATIONS INTERNATIONAL CORPORATION
No information is required in response to this item.
-38-
SCIENCE APPLICATIONS INTERNATIONAL CORPORATION
Item 10. Directors, Executive Officers, and Corporate Governance
Our executive officers as of March 30, 2017, are listed below, along with their ages on that date, positions and offices held and business experience during at least the past five years. All such persons have been elected to serve until their successors are elected and qualified or until their earlier resignation or removal.
|
Name of officer |
|
Age |
|
Position(s) with the Company and prior business experience |
|
|
|
|
|
|
|
Nazzic S. Keene |
|
56 |
|
Sector President, Global Markets and Missions, since September 2013. Ms. Keene served as former Parent’s Senior Vice President for Corporate Strategy and Planning from August 2012 to September 2013. Prior to joining us, Ms. Keene was the Senior Vice President and General Manager for U.S. Enterprise Markets at CGI Group, Inc. from 2004. |
|
|
|
|
|
|
|
Steven G. Mahon |
|
55 |
|
General Counsel and Corporate Secretary since November 2015. Mr. Mahon previously served as General Counsel, Chief Compliance Officer and Corporate Secretary at MTS Systems Corporation (MTS) from October 2011 to November 2015. Prior to MTS, Mr. Mahon was Assistant General Counsel for Alliant Techsystems Inc. and is a retired Colonel from the U.S. Army where he served in the U.S. Judge Advocate’s General’s Corps, practicing law in a variety of roles on active duty and in the U.S. Army Reserve. |
|
|
|
|
|
|
|
Charles A. Mathis |
|
57 |
|
Chief Financial Officer since November 2016. Mr. Mathis previously served as CFO at ScanSource Inc., a global public company focused on technology services and products, since 2012. Prior to ScanSource, Mathis was CFO from 2008 to 2012 for Force Protection Inc., based in South Carolina, where he led strategic and operational improvements of the global defense company. He was also the CFO for Fort Worth-based EFW, Inc., the U.S.-based subsidiary of the Israeli defense contractor, Elbit Systems from 2006 to 2008. |
|
|
|
|
|
|
|
Anthony J. Moraco |
|
57 |
|
Chief Executive Officer since September 2013. Mr. Moraco previously served as the President for the Government Solutions Group of former Parent from February 2013 to September 2013. Mr. Moraco also held positions as Group President of former Parent’s Intelligence, Surveillance and Reconnaissance organization from March 2012 to February 2013, Executive Vice President for Operations and Performance Excellence from August 2010 to March 2012, and Business Unit General Manager and other positions for the Space and Geospatial Intelligence business unit from February 2006 to August 2010. Prior to joining us in 2006, Mr. Moraco worked for The Boeing Company from 2000 to 2006 where he served as the Deputy General Manager of Mission Systems in the Space and Intelligence Systems organization as well as the Director of Homeland Security Technology Integration. |
|
|
|
|
|
|
|
Douglas M. Wagoner |
|
52 |
|
Sector President, Services and Solutions since December 2013. Prior to this role, Mr. Wagoner was the Program Manager for former Parent’s separation of SAIC from former Parent. He served as General Manager for the Homeland and Civilian Solutions business unit from 2008 to 2012. Prior to joining SAIC, Mr. Wagoner was the Senior Vice President of Data Systems Analysts from 2001 to 2006, and a Vice President at ChoicePoint until 2001. |
For additional information required by Item 10 with respect to executive officers and directors, including audit committee and audit committee financial experts, procedures by which stockholders may recommend nominees to the Board of Directors, and compliance with Section 16(a) of the Securities Exchange Act of 1934, see the information set forth under the captions “Proposal 1—Election of Directors,” “Corporate Governance” and “Other Information” in the 2017 Definitive Proxy Statement, which information is incorporated by reference into this report.
-39-
SCIENCE APPLICATIONS INTERNATIONAL CORPORATION
We have adopted a code of conduct, which describes our standards for protecting SAIC and customer assets, fostering a safe and healthy work environment, dealing fairly with customers and others, conducting international business properly, reporting misconduct and protecting employees from retaliation. This code applies to all executive officers and employees and forms the foundation of our corporate policies and procedures designed to promote ethical behavior in all aspects of our business.
Our directors also are required to comply with the Code of Business Conduct of the Board of Directors, which is intended to describe areas of ethical risk, provide guidance to directors and help foster a culture of honesty and accountability. This code addresses areas of professional conduct relating to service on SAIC's Board of Directors, including conflicts of interest, protection of confidential information, and fair dealing and compliance with all applicable laws and regulations. To obtain copies of the Code of Conduct and Code of Business Conduct of the Board of Directors, visit our website at www.saic.com and click on the links entitled “About” then “Investors” then “Corporate Governance” and then “Code of Conduct.” We intend to post on our website any material changes to or waivers from our code of business ethics. The information on our website is not incorporated by reference into and is not a part of this report.
Item 11. Executive Compensation
For information required by Item 11 with respect to executive compensation, see the information set forth under the captions “Compensation Discussion and Analysis,” “Executive Compensation” and “Corporate Governance” in the 2017 Definitive Proxy Statement, which information is incorporated by reference into this report.
For information required by Item 11 with respect to compensation committee interlocks and insider participation, see the information set forth under the caption “Corporate Governance” in the 2017 Definitive Proxy Statement, which information is incorporated by reference into this report.
-40-
SCIENCE APPLICATIONS INTERNATIONAL CORPORATION
Item 12. Security Ownership of Certain Beneficial Owners and Management and Related Stockholder Matters
For information required by Item 12 with respect to the security ownership of certain beneficial owners and management, see the information set forth under the caption “Other Information” in the 2017 Definitive Proxy Statement, which information is incorporated by reference into this report.
We currently maintain four shareholder-approved equity compensation plans that issue stock-based awards including the 2013 Equity Incentive Plan, the Stock Compensation Plan, the Management Stock Compensation Plan and the 2013 Employee Stock Purchase Plan. For summaries of these plans, see Note 6 of the notes to the consolidated financial statements contained within this report. The following table provides the number of shares of our common stock subject to stock options, the weighted-average exercise price of the outstanding stock options and the number of shares remaining for future award grants as of February 3, 2017:
|
Equity Compensation Plan Information |
|
|||||||||||
|
Plan Category |
|
Number of securities to be issued upon exercise of outstanding options, warrants and rights (1) |
|
|
Weighted-average exercise price of outstanding options, warrants and rights (2) |
|
|
Number of securities remaining available for future issuance under equity compensation plans (excluding securities reflected in column (a)) (3) |
|
|||
|
|
|
(a) |
|
|
(b) |
|
|
(c) |
|
|||
|
Equity compensation plans approved by security holders |
|
|
3,684,319 |
|
|
$ |
38.57 |
|
|
|
5,959,153 |
|
|
Equity compensation plans not approved by security holders |
|
|
- |
|
|
$ |
- |
|
|
|
- |
|
|
Total |
|
|
3,684,319 |
|
|
|
|
|
|
|
5,959,153 |
|
|
(1) |
This amount includes 1,907,763 stock options outstanding and 1,777,156 shares issuable for other stock-based awards under the 2013 Equity Incentive Plan. This amount does not include shares to be issued pursuant to purchase rights under the 2013 Employee Stock Purchase Plan. |
|
(2) |
Does not include shares to be issued for stock-based awards, other than stock options, which will not require any payment upon issuance of those shares. |
|
(3) |
Includes 3,162,490 shares of our common stock available for issuance under the 2013 Employee Stock Purchase Plan (ESPP). The maximum number of shares initially available for issuance under the ESPP was 1 million. The ESPP provides for an automatic increase to the share reserve on the first day of each fiscal year beginning on February 1, 2014 in an amount equal to the lesser of (i) 1 million shares, (ii) two percent of the number of shares of our common stock outstanding on the last day of the immediately preceding fiscal year or (iii) a number determined by the Compensation Committee of the Board of Directors. The amount authorized for issuance under the ESPP increased 500,000, 916,198, and 973,477 during fiscal 2017, 2016, and 2015, respectively. In addition, this includes 2,796,663 shares of our common stock available for issuance under the 2013 Equity Incentive Plan (EIP). The maximum number of shares initially available for issuance under the EIP was 5.7 million, which was increased by 2.8 million per the amended and restated 2013 Equity Incentive Plan, adopted June 4, 2014, amounting to a total authorized for issuance of 8.5 million. We expect that the number of shares actually issued under the EIP will be significantly less than the number of total awards outstanding under the plan because (a) a net option exercise results in a smaller portion of the number of award shares being issued when a participant uses award shares, rather than cash, to pay the exercise price, which historically most participants have elected to do, (b) most participants historically have elected to let the Company retain award shares to pay for taxes due on the exercise of options and all participants are required to use award shares to pay for taxes upon the vesting of restricted stock or restricted stock units, (c) some participants may terminate employment with the Company before the vesting of awards resulting in awards being forfeited and (d) some participants may not exercise stock options before the expiration date for a variety of reasons, including if the exercise price exceeds the then current market price of shares. |
Item 13. Certain Relationships and Related Transactions, and Director Independence
For information required by Item 13 with respect to certain relationships and related transactions and the independence of directors and nominees, see the information set forth under the caption “Corporate Governance” in the 2017 Definitive Proxy Statement, which information is incorporated by reference into this report.
Item 14. Principal Accounting Fees and Services
For information required by Item 14 with respect to principal accounting fees and services, see the information set forth under the caption “Audit Matters” in the 2017 Definitive Proxy Statement, which information is incorporated by reference into this report.
-41-
SCIENCE APPLICATIONS INTERNATIONAL CORPORATION
Item 15. Exhibits, Financial Statement Schedules
|
|
(a) |
Documents filed as part of the report |
1. Financial Statements
Our consolidated financial statements are attached hereto and listed on the Index to Consolidated Financial Statements set forth on page F-1 of this report.
2. Financial Statement Schedules
Financial statement schedules are omitted because they are not applicable or the required information is shown in our consolidated financial statements or the notes thereto.
3. Exhibits
|
Exhibit Number |
|
Description of Exhibit |
|
|
|
|
|
2.1 |
|
Distribution Agreement dated September 25, 2013, between the Company (formerly SAIC Gemini, Inc.) and Leidos Holdings, Inc. (formerly SAIC, Inc.). Incorporated by reference to Exhibit 2.1 to the Company’s Current Report on Form 8-K as filed with the SEC on October 1, 2013. |
|
|
|
|
|
2.2 |
|
Agreement and Plan of Merger by and among SAIC, Caymus Acquisition Corporation, Scitor Holdings, Inc. and Leonard Green & Partners L.P., solely in its capacity as holder representative, dated March 1, 2015. (Pursuant to Item 601(b)(2) of Regulation S-K, the registrant hereby agrees to supplementally furnish to the Securities and Exchange Commission upon request any omitted schedule or exhibit to the Agreement and Plan of Merger.) Incorporated by reference to Exhibit 2.1 to the Company’s Current Report on Form 8-K as filed with the SEC on March 2, 2015. |
|
|
|
|
|
3.1 |
|
Amended and Restated Certificate of Incorporation. Incorporated by reference to Exhibit 3.1 to the Company’s Current Report on Form 8-K as filed with the SEC on October 1, 2013. |
|
|
|
|
|
3.2 |
|
Amended and Restated Bylaws. Incorporated by reference to Exhibit 3.1 to the Company’s Current Report on Form 8-K as filed with the SEC on February 3, 2016. |
|
|
|
|
|
10.1 |
|
First Amendment to the Second Amended & Restated Credit Agreement, dated August 23, 2016 by and among the Company, Citibank N.A. as administrative agent and collateral agent, and certain other lenders and parties thereto. Incorporated by reference to Exhibit 10.1 to the Company’s Current Report on Form 8-K as filed with the SEC on August 25, 2016. |
|
|
|
|
|
10.2 |
|
Second Amended & Restated Credit Agreement, dated May 4, 2015 by and among the Company, Citibank N.A. as administrative agent and collateral agent, and Bank of America, N.A., as a syndication agent, and certain other lenders and parties thereto. Incorporated by reference to Exhibit 10.1 to the Company’s Current Report on Form 8-K as filed with the SEC on May 4, 2015. |
|
|
|
|
|
10.3* |
|
Science Applications International Corporation Stock Compensation Plan, effective September 27, 2013. Incorporated by reference to Exhibit 4.3 to the Company’s Registration Statement on Form S-8 as filed with the SEC on September 27, 2013. |
|
|
|
|
|
10.4* |
|
Science Applications International Corporation Management Stock Compensation Plan, effective September 27, 2013. Incorporated by reference to Exhibit 4.4 to the Company’s Registration Statement on Form S-8 as filed with the SEC on September 27, 2013. |
|
|
|
|
-42-
SCIENCE APPLICATIONS INTERNATIONAL CORPORATION
|
Exhibit Number |
|
Description of Exhibit |
|
|
Science Applications International Corporation Key Executive Stock Deferral Plan, effective September 27, 2013. Incorporated by reference to Exhibit 4.5 to the Company’s Registration Statement on Form S-8 as filed with the SEC on September 27, 2013. |
|
|
|
|
|
|
10.6* |
|
Keystaff Deferral Plan, effective September 27, 2013. Incorporated by reference to Exhibit 4.6 to the Company’s Registration Statement on Form S-8 as filed with the SEC on September 27, 2013. |
|
|
|
|
|
10.7* |
|
Science Applications International Corporation 2013 Employee Stock Purchase Plan, effective October 1, 2013. Incorporated by reference to Exhibit 4.7 to the Company’s Registration Statement on Form S-8 as filed with the SEC on September 27, 2013. |
|
|
|
|
|
10.8* |
|
Science Applications International Corporation 401(k) Excess Deferral Plan, effective September 27, 2013. Incorporated by reference to Exhibit 4.8 to the Company’s Registration Statement on Form S-8 as filed with the SEC on September 27, 2013. |
|
|
|
|
|
10.9* |
|
Science Applications International Corporation Retirement Plan, effective September 27, 2013. Incorporated by reference to Exhibit 4.9 to the Company’s Registration Statement on Form S-8 as filed with the SEC on September 27, 2013. |
|
|
|
|
|
10.10* |
|
Science Applications International Corporation Amended and Restated 2013 Equity Incentive Plan, effective June 4, 2014. Incorporated by reference to Appendix A to the Company’s Definitive Proxy Statement on Schedule 14A as filed with the SEC on April 24, 2014. |
|
|
|
|
|
10.11* |
|
Form of Restricted Stock Unit Award Agreement (Management) of the Science Applications International Corporation 2013 Equity Incentive Plan. Incorporated by reference to Exhibit 10.2 to the Company’s Quarterly Report on Form 10-Q as filed with the SEC on December 13, 2013. |
|
|
|
|
|
10.12* |
|
Form of Restricted Stock Unit Award Agreement (3 Year Cliff Vesting) of the Science Applications International Corporation 2013 Equity Incentive Plan. Incorporated by reference to Exhibit 10.3 to the Company’s Quarterly Report on Form 10-Q as filed with the SEC on December 13, 2013. |
|
|
|
|
|
10.13* |
|
Form of Restricted Stock Unit Award Agreement of the Science Applications International Corporation 2013 Equity Incentive Plan. Incorporated by reference to Exhibit 10.12 to the Company’s Annual Report on Form 10-K as filed with the SEC on April 9, 2014. |
|
|
|
|
|
10.14* |
|
Form of Nonstatutory Stock Option Agreement (3 Year Cliff Vesting) of the Science Applications International Corporation 2013 Equity Incentive Plan. Incorporated by reference to Exhibit 10.4 to the Company’s Quarterly Report on Form 10-Q as filed with the SEC on December 13, 2013. |
|
|
|
|
|
10.15* |
|
Form of Nonstatutory Stock Option Agreement of the Science Applications International Corporation 2013 Equity Incentive Plan. Incorporated by reference to Exhibit 10.14 to the Company’s Annual Report on Form 10-K as filed with the SEC on April 9, 2014. |
|
|
|
|
|
10.16* |
|
Form of Performance Share Award Agreement of the Science Applications International Corporation 2013 Equity Incentive Plan. Incorporated by reference to Exhibit 10.15 to the Company’s Annual Report on Form 10-K as filed with the SEC on April 9, 2014. |
|
|
|
|
|
10.17* |
|
Agreement and general release dated as of January 19, 2017, by and between Science Applications International Corporation and Kimberly Admire. Incorporated by reference to Exhibit 10.1 to the Company’s Current Report on Form 8-K as filed with the SEC on January 20, 2017. |
|
|
|
|
-43-
SCIENCE APPLICATIONS INTERNATIONAL CORPORATION
|
* |
Executive Compensation Plans and Arrangements |
-44-
SCIENCE APPLICATIONS INTERNATIONAL CORPORATION
Pursuant to the requirements of Section 13 or 15(d) of the Securities Exchange Act of 1934, the registrant has duly caused this report to be signed on its behalf by the undersigned, thereunto duly authorized.
|
Science Applications International Corporation |
||
|
|
|
|
|
By |
|
/s/ Charles A. Mathis
|
|
|
|
Charles A. Mathis Chief Financial Officer |
Dated: March 30, 2017
Pursuant to the requirements of the Securities Exchange Act of 1934, this report has been signed below by the following persons on behalf of the registrant in the capacities and on the dates indicated.
|
|
|
|
|
|
|
Signature |
|
Title |
|
Date |
|
|
|
|
|
|
|
/s/ Anthony J. Moraco Anthony J. Moraco |
|
Principal Executive Officer and Director |
|
March 30, 2017 |
|
|
|
|
|
|
|
/s/ Charles A. Mathis Charles A. Mathis |
|
Principal Financial Officer and |
|
March 30, 2017 |
|
|
|
|
|
|
|
/s/ Edward J. Sanderson, Jr. Edward J. Sanderson, Jr. |
|
Chairman of the Board |
|
March 30, 2017 |
|
|
|
|
|
|
|
/s/ Robert A. Bedingfield Robert A. Bedingfield |
|
Director |
|
March 30, 2017 |
|
|
|
|
|
|
|
/s/ Deborah B. Dunie Deborah B. Dunie |
|
Director |
|
March 30, 2017 |
|
|
|
|
|
|
|
/s/ Thomas F. Frist III Thomas F. Frist, III |
|
Director |
|
March 30, 2017 |
|
|
|
|
|
|
|
/s/ John J. Hamre John J. Hamre |
|
Director |
|
March 30, 2017 |
|
|
|
|
|
|
|
/s/ Timothy J. Mayopoulos Timothy J. Mayopoulos |
|
Director |
|
March 30, 2017 |
|
|
|
|
|
|
|
/s/ Donna S. Morea Donna S. Morea |
|
Director |
|
March 30, 2017 |
|
|
|
|
|
|
|
/s/ Steven R. Shane Steven R. Shane |
|
Director |
|
March 30, 2017 |
|
|
|
|
|
|
-45-
SCIENCE APPLICATIONS INTERNATIONAL CORPORATION
INDEX TO CONSOLIDATED FINANCIAL STATEMENTS
|
CONSOLIDATED FINANCIAL STATEMENTS |
|
Page |
|
|
|
|
|
|
|
|
|
|
F-2 |
|
|
|
|
|
|
|
F-3 |
|
|
|
|
|
|
|
F-4 |
|
|
|
|
|
|
|
F-5 |
|
|
|
|
|
|
|
F-6 |
|
|
|
|
|
|
|
F-7 |
|
|
|
|
|
|
Note 1—Business Overview and Summary of Significant Accounting Policies |
|
F-7 |
|
|
F-14 |
|
|
Note 3—Scitor Acquisition |
|
F-15 |
|
|
F-16 |
|
|
|
F-17 |
|
|
Note 6—Stock-Based Compensation |
|
F-17 |
|
Note 7—Retirement Plans |
|
F-21 |
|
Note 8—Income Taxes |
|
F-22 |
|
Note 9—Debt Obligations |
|
F-24 |
|
Note 10—Derivative Instruments Designated as Cash Flow Hedges |
|
F-26 |
|
Note 11—Changes in Accumulated Other Comprehensive Loss by Component |
|
F-27 |
|
Note 12—Operating Leases |
|
F-27 |
|
Note 13—Business Segment Information |
|
F-28 |
|
|
F-28 |
|
|
|
F-30 |
Financial statement schedules are omitted because they are not applicable or the required information is shown in our consolidated financial statements or the notes thereto.
F-1
SCIENCE APPLICATIONS INTERNATIONAL CORPORATION
REPORT OF INDEPENDENT REGISTERED PUBLIC ACCOUNTING FIRM
To the Board of Directors and Stockholders of
Science Applications International Corporation
McLean, Virginia
We have audited the accompanying consolidated balance sheets of Science Applications International Corporation and subsidiaries (the "Company") as of the fiscal years ended February 3, 2017, and January 29, 2016, and the related consolidated statements of income and comprehensive income, stockholders' equity, and cash flows for each of the three fiscal years in the period ended February 3, 2017. These financial statements are the responsibility of the Company's management. Our responsibility is to express an opinion on these financial statements based on our audits.
We conducted our audits in accordance with the standards of the Public Company Accounting Oversight Board (United States). Those standards require that we plan and perform the audit to obtain reasonable assurance about whether the financial statements are free of material misstatement. An audit includes examining, on a test basis, evidence supporting the amounts and disclosures in the financial statements. An audit also includes assessing the accounting principles used and significant estimates made by management, as well as evaluating the overall financial statement presentation. We believe that our audits provide a reasonable basis for our opinion.
In our opinion, such consolidated financial statements present fairly, in all material respects, the financial position of Science Applications International Corporation and subsidiaries as of February 3, 2017 and January 29, 2016, and the results of their operations and their cash flows for each of the three fiscal years in the period ended February 3, 2017, in conformity with accounting principles generally accepted in the United States of America.
We have also audited, in accordance with the standards of the Public Company Accounting Oversight Board (United States), the Company's internal control over financial reporting as of February 3, 2017, based on the criteria established in Internal Control — Integrated Framework (2013) issued by the Committee of Sponsoring Organizations of the Treadway Commission and our report dated March 30, 2017 expressed an unqualified opinion on the Company's internal control over financial reporting.
/s/ DELOITTE & TOUCHE LLP
McLean, Virginia
March 30, 2017
F-2
SCIENCE APPLICATIONS INTERNATIONAL CORPORATION
CONSOLIDATED STATEMENTS OF INCOME AND COMPREHENSIVE INCOME
|
|
|
Year Ended |
|
|||||||||
|
|
|
February 3, 2017 |
|
|
January 29, 2016 |
|
|
January 30, 2015 |
|
|||
|
|
(in millions, except per share amounts) |
|
||||||||||
|
Revenues |
|
$ |
4,450 |
|
|
$ |
4,315 |
|
|
$ |
3,885 |
|
|
Cost of revenues |
|
|
4,003 |
|
|
|
3,904 |
|
|
|
3,550 |
|
|
Selling, general and administrative expenses |
|
|
166 |
|
|
|
158 |
|
|
|
95 |
|
|
Acquisition and integration costs (Note 3) |
|
|
10 |
|
|
|
26 |
|
|
|
- |
|
|
Operating income |
|
|
271 |
|
|
|
227 |
|
|
|
240 |
|
|
Interest expense |
|
|
52 |
|
|
|
44 |
|
|
|
17 |
|
|
Other income (expense), net |
|
|
1 |
|
|
|
- |
|
|
|
- |
|
|
Income before income taxes |
|
|
220 |
|
|
|
183 |
|
|
|
223 |
|
|
Provision for income taxes (Note 8) |
|
|
(72 |
) |
|
|
(66 |
) |
|
|
(82 |
) |
|
Net income |
|
$ |
148 |
|
|
$ |
117 |
|
|
$ |
141 |
|
|
Other comprehensive income (loss): |
|
|
|
|
|
|
|
|
|
|
|
|
|
Other comprehensive income (loss), pre-tax |
|
|
11 |
|
|
|
(6 |
) |
|
|
(5 |
) |
|
Income tax (expense) benefit |
|
|
(4 |
) |
|
|
2 |
|
|
|
2 |
|
|
Total other comprehensive income (loss), net of tax (Note 11) |
|
|
7 |
|
|
|
(4 |
) |
|
|
(3 |
) |
|
Comprehensive income |
|
$ |
155 |
|
|
$ |
113 |
|
|
$ |
138 |
|
|
Earnings per share (Note 2): |
|
|
|
|
|
|
|
|
|
|
|
|
|
Basic |
|
$ |
3.33 |
|
|
$ |
2.55 |
|
|
$ |
3.01 |
|
|
Diluted |
|
$ |
3.22 |
|
|
$ |
2.47 |
|
|
$ |
2.91 |
|
See accompanying notes to consolidated financial statements.
F-3
SCIENCE APPLICATIONS INTERNATIONAL CORPORATION
CONSOLIDATED BALANCE SHEETS
|
|
|
February 3, 2017 |
|
|
January 29, 2016 |
|
||
|
|
|
(in millions) |
|
|||||
|
ASSETS |
|
|
|
|
|
|
|
|
|
Current assets: |
|
|
|
|
|
|
|
|
|
Cash and cash equivalents |
|
$ |
210 |
|
|
$ |
195 |
|
|
Receivables: |
|
|
|
|
|
|
|
|
|
Billed and billable receivables |
|
|
419 |
|
|
|
469 |
|
|
Unbillable receivables |
|
|
112 |
|
|
|
159 |
|
|
Contract retentions |
|
|
10 |
|
|
|
10 |
|
|
Allowance for doubtful accounts |
|
|
(2 |
) |
|
|
(3 |
) |
|
Receivables, net |
|
|
539 |
|
|
|
635 |
|
|
Inventories, net |
|
|
71 |
|
|
|
68 |
|
|
Prepaid expenses |
|
|
27 |
|
|
|
21 |
|
|
Other current assets |
|
|
54 |
|
|
|
33 |
|
|
Total current assets |
|
|
901 |
|
|
|
952 |
|
|
Goodwill (Note 4) |
|
|
863 |
|
|
|
860 |
|
|
Intangible assets, net (Note 4) |
|
|
200 |
|
|
|
224 |
|
|
Property, plant, and equipment, net (Note 5) |
|
|
60 |
|
|
|
71 |
|
|
Other assets |
|
|
18 |
|
|
|
15 |
|
|
Total assets |
|
$ |
2,042 |
|
|
$ |
2,122 |
|
|
|
|
|
|
|
|
|
|
|
|
LIABILITIES AND EQUITY |
|
|
|
|
|
|
|
|
|
Current liabilities: |
|
|
|
|
|
|
|
|
|
Accounts payable |
|
$ |
329 |
|
|
$ |
351 |
|
|
Accrued payroll and other employee benefits |
|
|
76 |
|
|
|
108 |
|
|
Accrued vacation |
|
|
82 |
|
|
|
76 |
|
|
Other accrued liabilities |
|
|
103 |
|
|
|
96 |
|
|
Long-term debt, current portion (Note 9) |
|
|
25 |
|
|
|
57 |
|
|
Total current liabilities |
|
|
615 |
|
|
|
688 |
|
|
Long-term debt, net of current portion (Note 9) |
|
|
1,022 |
|
|
|
1,013 |
|
|
Deferred income taxes |
|
|
13 |
|
|
|
8 |
|
|
Other long-term liabilities |
|
|
38 |
|
|
|
33 |
|
|
Commitments and contingencies (Note 14) |
|
|
|
|
|
|
|
|
|
Equity: |
|
|
|
|
|
|
|
|
|
Common stock, $.0001 par value, 1 billion shares authorized, 44 million shares and 45 million shares issued and outstanding as of February 3, 2017 and January 29, 2016, respectively |
|
|
- |
|
|
|
- |
|
|
Additional paid-in capital |
|
|
91 |
|
|
|
215 |
|
|
Retained earnings |
|
|
265 |
|
|
|
174 |
|
|
Accumulated other comprehensive loss (Note 11) |
|
|
(2 |
) |
|
|
(9 |
) |
|
Total equity |
|
|
354 |
|
|
|
380 |
|
|
Total liabilities and equity |
|
$ |
2,042 |
|
|
$ |
2,122 |
|
See accompanying notes to consolidated financial statements.
F-4
SCIENCE APPLICATIONS INTERNATIONAL CORPORATION
CONSOLIDATED STATEMENTS OF EQUITY
|
|
|
Shares of common stock |
|
|
Additional paid-in capital |
|
|
Retained earnings |
|
|
Accumulated other comprehensive loss |
|
|
Total |
|
|||||
|
|
|
(in millions) |
|
|||||||||||||||||
|
Balance at January 31, 2014 |
|
|
49 |
|
|
$ |
349 |
|
|
$ |
30 |
|
|
$ |
(2 |
) |
|
$ |
377 |
|
|
Net income |
|
|
- |
|
|
|
- |
|
|
|
141 |
|
|
|
- |
|
|
|
141 |
|
|
Issuances of stock |
|
|
- |
|
|
|
5 |
|
|
|
- |
|
|
|
- |
|
|
|
5 |
|
|
Other comprehensive loss, net of tax |
|
|
- |
|
|
|
- |
|
|
|
- |
|
|
|
(3 |
) |
|
|
(3 |
) |
|
Cash dividends of $1.12 per share |
|
|
- |
|
|
|
- |
|
|
|
(55 |
) |
|
|
- |
|
|
|
(55 |
) |
|
Stock-based compensation |
|
|
- |
|
|
|
28 |
|
|
|
- |
|
|
|
- |
|
|
|
28 |
|
|
Repurchases of stock |
|
|
(3 |
) |
|
|
(144 |
) |
|
|
- |
|
|
|
- |
|
|
|
(144 |
) |
|
Separation-related tax adjustment |
|
|
- |
|
|
|
(4 |
) |
|
|
- |
|
|
|
- |
|
|
|
(4 |
) |
|
Balance at January 30, 2015 |
|
|
46 |
|
|
|
234 |
|
|
|
116 |
|
|
|
(5 |
) |
|
|
345 |
|
|
Net income |
|
|
- |
|
|
|
- |
|
|
|
117 |
|
|
|
- |
|
|
|
117 |
|
|
Issuances of stock |
|
|
- |
|
|
|
7 |
|
|
|
- |
|
|
|
- |
|
|
|
7 |
|
|
Other comprehensive loss, net of tax |
|
|
- |
|
|
|
- |
|
|
|
- |
|
|
|
(4 |
) |
|
|
(4 |
) |
|
Cash dividends of $1.21 per share |
|
|
- |
|
|
|
- |
|
|
|
(59 |
) |
|
|
- |
|
|
|
(59 |
) |
|
Stock-based compensation |
|
|
- |
|
|
|
25 |
|
|
|
- |
|
|
|
- |
|
|
|
25 |
|
|
Income tax benefits from stock-based compensation |
|
|
- |
|
|
|
10 |
|
|
|
- |
|
|
|
- |
|
|
|
10 |
|
|
Repurchases of stock |
|
|
(1 |
) |
|
|
(61 |
) |
|
|
- |
|
|
|
- |
|
|
|
(61 |
) |
|
Balance at January 29, 2016 |
|
|
45 |
|
|
$ |
215 |
|
|
$ |
174 |
|
|
$ |
(9 |
) |
|
$ |
380 |
|
|
Net income |
|
|
- |
|
|
|
- |
|
|
|
148 |
|
|
|
- |
|
|
|
148 |
|
|
Issuances of stock |
|
|
1 |
|
|
|
8 |
|
|
|
- |
|
|
|
- |
|
|
|
8 |
|
|
Other comprehensive income, net of tax |
|
|
- |
|
|
|
- |
|
|
|
- |
|
|
|
7 |
|
|
|
7 |
|
|
Cash dividends of $1.24 per share |
|
|
- |
|
|
|
- |
|
|
|
(57 |
) |
|
|
- |
|
|
|
(57 |
) |
|
Stock-based compensation |
|
|
- |
|
|
|
6 |
|
|
|
- |
|
|
|
- |
|
|
|
6 |
|
|
Income tax benefits from stock-based compensation |
|
|
- |
|
|
|
18 |
|
|
|
- |
|
|
|
- |
|
|
|
18 |
|
|
Repurchases of stock |
|
|
(2 |
) |
|
|
(156 |
) |
|
|
- |
|
|
|
- |
|
|
|
(156 |
) |
|
Balance at February 3, 2017 |
|
|
44 |
|
|
$ |
91 |
|
|
$ |
265 |
|
|
$ |
(2 |
) |
|
$ |
354 |
|
See accompanying notes to consolidated financial statements.
F-5
SCIENCE APPLICATIONS INTERNATIONAL CORPORATION
CONSOLIDATED STATEMENTS OF CASH FLOWS
|
|
|
Year Ended |
|
|||||||||
|
|
|
February 3, 2017 |
|
|
January 29, 2016 |
|
|
January 30, 2015 |
|
|||
|
|
|
(in millions) |
|
|||||||||
|
Cash flows from operating activities: |
|
|
|
|
|
|
|
|
|
|
|
|
|
Net income |
|
$ |
148 |
|
|
$ |
117 |
|
|
$ |
141 |
|
|
Adjustments to reconcile net income to net cash provided by operating activities: |
|
|
|
|
|
|
|
|
|
|
|
|
|
Depreciation and amortization |
|
|
53 |
|
|
|
62 |
|
|
|
21 |
|
|
Deferred income taxes |
|
|
1 |
|
|
|
3 |
|
|
|
4 |
|
|
Stock-based compensation expense |
|
|
31 |
|
|
|
33 |
|
|
|
35 |
|
|
Excess tax benefits from stock-based compensation |
|
|
(18 |
) |
|
|
(10 |
) |
|
|
(3 |
) |
|
Loss on disposal of property, plant, and equipment |
|
|
1 |
|
|
|
1 |
|
|
|
- |
|
|
Loss on extinguishment of debt |
|
|
2 |
|
|
|
- |
|
|
|
- |
|
|
Increase (decrease) resulting from changes in operating assets and liabilities net of the effect of the acquisition: |
|
|
|
|
|
|
|
|
|
|
|
|
|
Receivables |
|
|
96 |
|
|
|
(5 |
) |
|
|
77 |
|
|
Inventory, prepaid expenses and other current assets |
|
|
(36 |
) |
|
|
(11 |
) |
|
|
16 |
|
|
Accounts payable and accrued liabilities |
|
|
16 |
|
|
|
44 |
|
|
|
(19 |
) |
|
Accrued payroll and employee benefits |
|
|
(26 |
) |
|
|
(4 |
) |
|
|
4 |
|
|
Other long-term liabilities |
|
|
5 |
|
|
|
(4 |
) |
|
|
1 |
|
|
Total cash flows provided by operating activities |
|
|
273 |
|
|
|
226 |
|
|
|
277 |
|
|
Cash flows from investing activities: |
|
|
|
|
|
|
|
|
|
|
|
|
|
Change in restricted cash |
|
|
6 |
|
|
|
(14 |
) |
|
|
- |
|
|
Expenditures for property, plant, and equipment |
|
|
(15 |
) |
|
|
(20 |
) |
|
|
(22 |
) |
|
Asset acquisition |
|
|
(2 |
) |
|
|
- |
|
|
|
- |
|
|
Cash paid for acquisition, net of cash acquired |
|
|
- |
|
|
|
(764 |
) |
|
|
- |
|
|
Total cash flows used in investing activities |
|
|
(11 |
) |
|
|
(798 |
) |
|
|
(22 |
) |
|
Cash flows from financing activities: |
|
|
|
|
|
|
|
|
|
|
|
|
|
Dividend payments to stockholders |
|
|
(54 |
) |
|
|
(55 |
) |
|
|
(52 |
) |
|
Principal payments on borrowings |
|
|
(236 |
) |
|
|
(72 |
) |
|
|
(13 |
) |
|
Issuances of stock |
|
|
5 |
|
|
|
4 |
|
|
|
3 |
|
|
Stock repurchased and retired or withheld for taxes on equity awards |
|
|
(180 |
) |
|
|
(69 |
) |
|
|
(149 |
) |
|
Excess tax benefits from stock-based compensation |
|
|
18 |
|
|
|
10 |
|
|
|
3 |
|
|
Disbursements for obligations assumed from Scitor acquisition |
|
|
(7 |
) |
|
|
(5 |
) |
|
|
- |
|
|
Proceeds from borrowings |
|
|
209 |
|
|
|
670 |
|
|
|
- |
|
|
Deferred financing costs |
|
|
(2 |
) |
|
|
(17 |
) |
|
|
- |
|
|
Total cash flows (used in) provided by financing activities |
|
|
(247 |
) |
|
|
466 |
|
|
|
(208 |
) |
|
Total increase (decrease) in cash and cash equivalents |
|
|
15 |
|
|
|
(106 |
) |
|
|
47 |
|
|
Cash and cash equivalents at beginning of period |
|
|
195 |
|
|
|
301 |
|
|
|
254 |
|
|
Cash and cash equivalents at end of period |
|
$ |
210 |
|
|
$ |
195 |
|
|
$ |
301 |
|
|
|
|
|
|
|
|
|
|
|
|
|
|
|
|
Supplementary cash flow disclosure: |
|
|
|
|
|
|
|
|
|
|
|
|
|
Cash paid for interest |
|
$ |
48 |
|
|
$ |
36 |
|
|
$ |
17 |
|
|
Cash paid for income taxes |
|
$ |
46 |
|
|
$ |
53 |
|
|
$ |
49 |
|
|
|
|
|
|
|
|
|
|
|
|
|
|
|
|
Non-cash investing and financing activities: |
|
|
|
|
|
|
|
|
|
|
|
|
|
Increase (Decrease) in accrued plan share repurchases |
|
$ |
- |
|
|
$ |
2 |
|
|
$ |
(1 |
) |
|
Decrease in accrued plant, property, and equipment |
|
$ |
(1 |
) |
|
$ |
(2 |
) |
|
$ |
(4 |
) |
|
Increase in accrued cash dividend equivalents |
|
$ |
1 |
|
|
$ |
1 |
|
|
$ |
- |
|
See accompanying notes to consolidated financial statements.
F-6
SCIENCE APPLICATIONS INTERNATIONAL CORPORATION
NOTES TO CONSOLIDATED FINANCIAL STATEMENTS
Note 1—Business Overview and Summary of Significant Accounting Policies:
Overview
Description of Business. Science Applications International Corporation (collectively, with its consolidated subsidiaries, the “Company”) is a leading provider of technical, engineering and enterprise information technology (IT) services primarily to the U.S. government. The Company provides engineering and integration services for large, complex projects and offers a broad range of services with a targeted emphasis on higher-end, differentiated technology services. The Company is organized as a matrix comprised of five operating segments supported by several service line organizations. Each of the Company’s operating segments is focused on providing the Company’s comprehensive technical and enterprise IT service offerings to one or more agencies of the U.S federal government. The Company’s operating segments have been aggregated into one reporting segment for financial reporting purposes, as discussed in Note 13.
Acquisition of Scitor. On May 4, 2015, the Company acquired 100% of privately held Scitor Holdings, Inc. (Scitor), a leading global provider of technical services to the U.S. intelligence community and other U.S. government customers. This strategic acquisition enabled the Company to gain sufficient scale to competitively pursue opportunities within the intelligence community.
Separation from Former Parent. The Company commenced its operations on September 27, 2013 (the Distribution Date) following completion of a tax-free spin-off transaction from its former parent company, Leidos Holdings, Inc. (formerly SAIC, Inc., collectively with its consolidated subsidiaries, “former Parent”). In the spin-off transaction, former Parent’s technical, engineering and enterprise IT services business was separated (the separation) into an independent, publicly traded company named Science Applications International Corporation (formerly SAIC Gemini, Inc.).
Principles of Consolidation and Basis of Presentation
References to “financial statements” refer to the consolidated financial statements of the Company, which include the statements of income and comprehensive income, balance sheets, statements of equity and statements of cash flows. These financial statements were prepared in accordance with U.S. generally accepted accounting principles (GAAP). All intercompany transactions and account balances within the Company have been eliminated.
Use of Estimates
The preparation of the financial statements in conformity with GAAP requires management to make estimates and assumptions that affect the reported amounts of assets and liabilities and the disclosure of contingencies at the date of the financial statements, as well as the reported amounts of revenues and expenses during the reporting periods. Significant estimates inherent in the preparation of the financial statements may include, but are not limited to: estimated profitability of long-term contracts, income taxes, fair value measurements, fair value of goodwill and other intangible assets, and contingencies. Estimates have been prepared by management on the basis of the most current and best available information at the time of estimation and actual results could differ from those estimates.
Reporting Periods
The Company utilizes a 52/53 week fiscal year ending on the Friday closest to January 31, with fiscal quarters typically consisting of 13 weeks. Fiscal 2015 began on February 1, 2014 and ended on January 30, 2015, fiscal 2016 began on January 31, 2015 and ended on January 29, 2016, and fiscal 2017 began on January 30, 2016 and ended on February 3, 2017. The number of weeks for each quarter for fiscal 2017 and 2016 are as follows:
|
|
|
Fiscal 2017 |
|
|
Fiscal 2016 |
|
Fiscal 2015 |
|
|
|
|
(weeks) |
||||||
|
First Quarter |
|
|
14 |
|
|
13 |
|
13 |
|
Second Quarter |
|
|
13 |
|
|
13 |
|
13 |
|
Third Quarter |
|
|
13 |
|
|
13 |
|
13 |
|
Fourth Quarter |
|
|
13 |
|
|
13 |
|
13 |
|
Fiscal Year |
|
|
53 |
|
|
52 |
|
52 |
F-7
SCIENCE APPLICATIONS INTERNATIONAL CORPORATION
NOTES TO CONSOLIDATED FINANCIAL STATEMENTS
Revenue Recognition
The Company’s revenues are generated primarily from long-term contracts with the U.S. government including subcontracts with other contractors engaged in work for the U.S. government. The Company also generates revenues from contracts with commercial and international customers, and state and local governments. The Company performs under various types of contracts, which include firm-fixed price (FFP), time-and-materials (T&M), cost-plus-fixed-fee, cost-plus-award-fee and cost-plus-incentive-fee contracts.
FFP contracts—Revenues and profits on these contracts that are system integration or engineering in nature are primarily recognized using percentage-of-completion accounting in which revenues and profits are recognized based on the ratio of actual incurred costs to total estimated costs to complete (cost-to-cost method).
T&M contracts—Revenues are recognized on T&M contracts with the U.S. government using the percentage-of-completion method of accounting utilizing an output measure of progress. Revenues are recognized on T&M contracts with non-U.S. government customers using a proportional performance method. Under both of these methods revenues are recognized based on the hours provided in contract performance multiplied by the negotiated contract billing rates, and, for contract materials and reimbursable out-of-pocket expenses, as the costs are incurred.
Cost-plus-fixed-fee contracts—Revenues are recognized on cost-plus-fixed-fee contracts with the U.S. government on the basis of partial performance equal to costs incurred, plus an estimate of applicable fees earned as the Company becomes contractually entitled to reimbursement of costs and the applicable fees.
Cost-plus-award-fee/cost-plus-incentive-fee contracts—Revenues and fees on these contracts with the U.S. government are primarily recognized using the percentage-of-completion method of accounting. The Company includes an estimate of the ultimate incentive or award fee to be received on the contract in the estimate of contract revenues for purposes of applying the percentage-of-completion method of accounting.
The Company also uses the efforts-expended method of percentage-of-completion accounting in which an alternative measure that is more representative of contract progress is used for measuring progress toward completion. For example, the efforts-expended method is utilized when there are significant amounts of materials or hardware procured for the contract and the timing of these purchases is not representative of contract progress. In these cases, an alternative measure such as the ratio of actual incurred labor dollars to total estimated labor dollars may be more representative of progress and, therefore, would be used to determine revenues earned on the contract.
Additionally, the Company utilizes the units-of-delivery method on contracts where separate units of output are produced. Under the units-of-delivery method, revenues are generally recognized when the units are delivered to the customer, provided that all other requirements for revenue recognition have been met. The Company recognizes revenue on our supply chain and logistics arrangements as the services are provided to the customer under a single profit center using an output method (units-of-delivery) measure of progress. Service revenues are recorded gross of reimbursable material costs, as well as fees, when the Company is responsible for the ultimate acceptability of performance of the contract based on the timely fulfillment of conforming materials delivered to the customer.
Contract costs (including allocated indirect costs) that are incurred for U.S. government contracts are subject to audit and adjustment through negotiations between government representatives and the Company and, depending on the outcome of the negotiations, may impact the amount of revenues and profit earned by the Company. Revenues on U.S. government contracts have been recorded in amounts that are expected to be realized on final settlement. Contract claims are unanticipated additional costs incurred but not provided for in the executed contract price that the Company seeks to recover from the customer. Such costs are expensed as incurred. Additional revenues related to contract claims are recognized when the amounts are awarded by the customer. The Company provides for anticipated losses on contracts accounted for using the percentage-of-completion revenue recognition method by recording an expense representing the total expected loss, during the period in which the losses are determined. Amounts billed and collected by not yet recognized as revenues under certain types of contracts are deferred.
F-8
SCIENCE APPLICATIONS INTERNATIONAL CORPORATION
NOTES TO CONSOLIDATED FINANCIAL STATEMENTS
Revenues from services and maintenance contracts are recognized over the term of the respective contracts as the services are performed. The Company evaluates its contracts for multiple elements and, when appropriate, separates the contracts into separate units of accounting for revenue and profit recognition purposes.
Changes in Estimates on Contracts
Changes in estimates of revenues, cost of revenues or profits related to contracts accounted for using the cost-to-cost and efforts expended methods of percentage-of-completion accounting are recognized in operating income in the period in which such changes are made for the inception-to-date effect of the changes. Changes in these estimates can routinely occur over the contract performance period for a variety of reasons, which include: changes in contract scope; changes in contract cost estimates due to unanticipated cost growth or reassessments of risks impacting costs; changes in estimated incentive or award fees; and performance being better or worse than previously estimated.
Changes in contract estimates were:
|
|
|
Year Ended |
|
|||||||||
|
|
|
February 3, 2017 |
|
|
January 29, 2016 |
|
|
January 30, 2015 |
|
|||
|
|
|
(in millions, except per share amounts) |
|
|||||||||
|
Favorable adjustments |
|
$ |
42 |
|
|
$ |
29 |
|
|
$ |
23 |
|
|
Unfavorable adjustments |
|
|
(20 |
) |
|
|
(16 |
) |
|
|
(12 |
) |
|
Net favorable adjustments |
|
|
22 |
|
|
|
13 |
|
|
|
11 |
|
|
Income tax effect |
|
|
(7 |
) |
|
|
(5 |
) |
|
|
(4 |
) |
|
Net favorable adjustments, after tax |
|
|
15 |
|
|
|
8 |
|
|
|
7 |
|
|
Basic EPS impact |
|
$ |
0.34 |
|
|
$ |
0.17 |
|
|
$ |
0.15 |
|
|
Diluted EPS impact |
|
$ |
0.33 |
|
|
$ |
0.17 |
|
|
$ |
0.14 |
|
Stock-based Compensation
The Company issues stock-based awards as compensation to employees and directors. Stock-based awards include stock options, vesting stock awards and performance share awards. These awards are accounted for as equity awards. The Company recognizes stock-based compensation expense net of estimated forfeitures on a straight-line basis over the underlying award’s requisite service period, as measured using the award’s grant date fair value. For performance share awards, the Company reassesses the probability of achieving the performance conditions at each reporting period end and adjusts compensation expense based on the number of shares the Company expects to ultimately issue. Absent sufficient history as a stand-alone company, the Company estimates forfeitures using former Parent’s historical experience.
Income Taxes
The Company accounts for income taxes under the asset and liability method of accounting, which requires the recognition of deferred tax assets and liabilities for the expected future tax consequences of temporary differences between the carrying amounts and the tax bases of assets and liabilities. Under this method, changes in tax rates and laws are recognized in income in the period such changes are enacted. The provision for federal, state, local and foreign income taxes is calculated on income before income taxes based on current tax law and includes the cumulative effect of any changes in tax rates from those used previously in determining deferred tax assets and liabilities. Such provision differs from the amounts currently payable because certain items of income and expense are recognized in different reporting periods for financial reporting purposes than for income tax purposes. Recording the provision for income taxes requires management to make significant judgments and estimates for matters for which the ultimate resolution may not become known until the final resolution of an examination by taxing authorities or the statute of limitations lapses. Additionally, recording liabilities for uncertainty in income taxes involves significant judgment in evaluating the Company’s tax positions and developing the best estimate of the taxes ultimately expected to be paid. Tax penalties and interest are included in income tax expense.
F-9
SCIENCE APPLICATIONS INTERNATIONAL CORPORATION
NOTES TO CONSOLIDATED FINANCIAL STATEMENTS
The Company records net deferred tax assets to the extent these assets will more likely than not be realized. In making such determination, the Company considers all available positive and negative evidence, including future reversals of existing taxable temporary differences, projected future taxable income, tax planning strategies and recent results of operations. If it is determined that the Company would be able to realize the deferred income tax assets in the future in excess of their net recorded amount or would no longer be able to realize the deferred income tax assets in the future as currently recorded, an adjustment would be made to the valuation allowance which would decrease or increase the provision for income taxes.
The Company has also recognized liabilities for uncertainty in income taxes when it is more likely than not that a tax position will not be sustained on examination and settlement with various taxing authorities. Liabilities for uncertainty in income taxes are measured based on the largest amount of benefit that is greater than 50% likely of being realized upon ultimate settlement.
Deferred tax assets and liabilities are netted by taxable jurisdiction and classified as noncurrent on the consolidated balance sheets.
Costs Allocated to Contracts
The Company classifies indirect costs as overhead (included in cost of revenues) or general and administrative expenses in the same manner as such costs are defined in the Company’s Disclosure Statements under U.S. government Cost Accounting Standards (CAS).
Cash and Cash Equivalents
Cash and cash equivalents are comprised of cash in banks and highly liquid instruments, which primarily consist of bank deposits and investments in institutional money market funds. The Company does not invest in high yield or high risk securities. The cash in bank accounts at times may exceed federally insured limits.
Restricted Cash
Restricted cash consists of cash on deposit in rabbi trusts that are contractually restricted from use in operations, but are subject to future claims of creditors. At February 3, 2017, $8 million of restricted cash was held in rabbi trust accounts which are restricted to fund future payment obligations, including obligations assumed in connection with the acquisition of Scitor and deferred compensation plans. Of this amount, $1 million is presented in other current assets and $7 million in other assets in the consolidated balance sheets. At January 29, 2016, $14 million of restricted cash was held in rabbi trust accounts. Of this amount $7 million is presented in other current assets and $7 million in other assets in the consolidated balance sheets.
F-10
SCIENCE APPLICATIONS INTERNATIONAL CORPORATION
NOTES TO CONSOLIDATED FINANCIAL STATEMENTS
Receivables include outstanding invoices billed to customers, unbilled receivables and contract retentions. The Company’s receivables are primarily due from the U.S. government, or from prime contractors on which we are subcontractors and the end customer is the U.S. government, and are generally considered collectable from the perspective of the customer’s ability to pay. The Company does not have a material credit risk exposure.
Unbilled receivables, substantially all of which are expected to be billed and collected within one year, are stated at their estimated realizable value and consist of costs and fees billable on contract completion or the occurrence of a specified event. Legal title to the related accumulated costs of contracts in progress generally vests with the U.S. government on the Company’s receipt of progress payments. Progress payments received of $56 million are offset against unbilled receivables as of February 3, 2017; no progress payments offset unbilled receivables as of January 29, 2016. Contract retentions are billed when contract conditions have been met and may relate to uncompleted indirect cost negotiations with the U.S. government. Based on historical experience, the majority of retention balances are expected to be collected beyond one year and write-offs of retention balances have not been significant. The Company establishes an allowance for doubtful accounts based on the latest information available to determine whether outstanding invoices are ultimately collectable. The Company determines its allowance for doubtful accounts by analyzing individual receivables, historical bad debts, and, for non-U.S. government customers, customer creditworthiness. Receivable balances are written off in the period during which management determines they are uncollectable, and, at that time, such balances are removed from billed receivables and, if previously reserved, from the allowance for doubtful accounts.
Inventory
Inventory is substantially comprised of finished goods inventory purchased for resale to customers, such as tires and lubricants, and is valued at the lower of cost or market. The Company evaluates current inventory against historical and planned usage to estimate the appropriate provision for obsolete inventory.
Business Combinations
The Company records all tangible and intangible assets acquired and liabilities assumed in a business combination at fair value as of the acquisition date, which is determined using a cost, market or income approach. The excess amount of the aggregated purchase consideration paid over the fair value of the net of assets acquired and liabilities assumed is recorded as goodwill. Acquisition date fair value represents the price that would be received to sell an asset or paid to transfer a liability in an orderly transaction between market participants as measured on the acquisition date.
The valuations are based on information that existed as of the acquisition date. During the measurement period that shall not exceed one year from the acquisition date, the Company may retrospectively adjust provisional amounts recorded for assets acquired and liabilities assumed to reflect new information that the Company has subsequently obtained regarding facts and circumstances that existed as of the acquisition date.
Acquisition-related costs that are not part of the purchase price consideration are expensed as incurred. These costs typically include transaction-related costs, such as finder’s fees, and legal, accounting and other professional costs.
Goodwill and Intangible Assets
Goodwill is recorded as the difference, if any, between the aggregate consideration paid for an acquisition and the fair value of the net tangible and intangible assets acquired and liabilities assumed. Goodwill and indefinite-lived intangible assets are not amortized, but rather are tested for potential impairment annually at the beginning of the fourth quarter, or whenever events or changes in circumstances indicate that the carrying value may not be recoverable. There were no impairments during the periods presented.
The goodwill impairment test is performed at the reporting unit level. The Company estimates and compares the fair value of each reporting unit to its respective carrying value including goodwill. The fair value of the Company’s reporting units are determined using either a market approach, income approach, or a combination of both, which involves the use of estimates and assumptions, including projected future operating results and cash flows, the cost of capital, and financial measures derived from observable market data of comparable public companies. If the fair value is less than the carrying
F-11
SCIENCE APPLICATIONS INTERNATIONAL CORPORATION
NOTES TO CONSOLIDATED FINANCIAL STATEMENTS
value, the amount of impairment expense is equal to the difference between the reporting unit’s fair value and the reporting unit’s carrying value.
Intangible assets with finite lives are amortized using the method that best reflects how their economic benefits are utilized or, if a pattern of economic benefits cannot be reliably determined, on a straight-line basis over their estimated useful lives. Intangible assets with finite lives are assessed for impairment whenever events or changes in circumstances indicate that the carrying value may not be recoverable.
Impairment of Long-lived Assets
The Company evaluates its long-lived assets for potential impairment whenever there is evidence that events or changes in circumstances indicate that the carrying value may not be recoverable and the carrying amount of the asset exceeds its estimated future undiscounted cash flows. When the carrying amount of the asset exceeds its estimated future undiscounted cash flows, an impairment loss is recognized to reduce the asset’s carrying amount to its estimated fair value based on the present value of its estimated future cash flows.
Commitments and Contingencies
Accruals for commitments and loss contingencies are recorded when it is both probable that they will occur and the amounts can be reasonably estimated. In addition, legal fees are accrued for cases where a loss is probable and the related fees can be reasonably estimated. Significant judgment is required to determine both probability and the estimated amount of loss. The Company reviews these accruals quarterly and adjusts the accruals to reflect the impact of negotiations, settlements, rulings, advice of legal counsel and other updated information.
Fair Value Measurements
The Company utilizes fair value measurement guidance prescribed by GAAP to value its financial instruments. The accounting standard for fair value measurements establishes a three-tier value hierarchy, which prioritizes the inputs used in measuring fair value as follows: observable inputs such as quoted prices in active markets (Level 1); inputs other than the quoted prices in active markets that are observable either directly or indirectly (Level 2); and unobservable inputs in which there is little or no market data, which requires the Company to develop its own assumptions (Level 3).
The carrying amounts of cash and cash equivalents, receivables, accounts payable and other amounts included in other current assets and current liabilities that meet the definition of a financial instrument approximate fair value because of the short-term nature of these amounts. The carrying value of the Company’s outstanding debt obligations approximates its fair value. The fair value of long-term debt is calculated using Level 2 inputs, based on interest rates available for debt with terms and maturities similar to the Company’s existing debt arrangements.
Derivative Instruments Designated as Cash Flow Hedges
Derivative instruments are recorded on the consolidated balance sheets at fair value. Unrealized gains and losses on derivatives designated as cash flow hedges are reported in other comprehensive (loss) income and reclassified to earnings in a manner that matches the timing of the earnings impact of the hedged transactions. The ineffective portion of all hedges, if any, is recognized immediately in earnings.
F-12
SCIENCE APPLICATIONS INTERNATIONAL CORPORATION
NOTES TO CONSOLIDATED FINANCIAL STATEMENTS
The Company’s fixed interest rate swaps are considered over-the-counter derivatives, and fair value is calculated using a standard pricing model for interest rate swaps with contractual terms for maturities, amortization and interest rates. Level 2, or market observable inputs (such as yield and credit curves), are used within the standard pricing models in order to determine fair value. The fair value is an estimate of the amount that the Company would pay or receive as of a measurement date if the agreements were transferred to a third party or canceled. See Note 10 for further discussion on the Company’s derivative instruments designated as cash flow hedges.
Operating Cycle
The Company’s operating cycle for long-term contracts may be greater than one year and is measured by the average time intervening between the inception and the completion of those contracts. Contract-related assets and liabilities are classified as current assets and current liabilities.
Research and Development
The Company conducts research and development activities under customer-funded contracts and with company-funded independent research and development (IR&D) funds. IR&D efforts consist of projects involving basic research, applied research, development, and systems and other concept formulation studies. Company-funded IR&D expense is included in selling, general and administrative expenses and was $4 million, $4 million and $5 million in fiscal 2017, 2016 and 2015, respectively. Customer-funded research and development activities performed under customer contracts are charged directly to cost of revenues for those particular contracts.
Accounting Standards Updates
In May 2014, the Financial Accounting Standards Board (FASB) issued Accounting Standards Update (ASU) No. 2014-09, Revenue from Contracts with Customers (Topic 606), which supersedes the revenue recognition requirements and some cost guidance included in the Accounting Standards Codification (ASC). This ASU is based on the principle that revenue is recognized to depict the transfer of goods or services to customers at an amount that reflects the consideration to which the entity expects to be entitled in exchange for those goods or services. The ASU also requires additional disclosure about the nature, amount, timing and uncertainty of revenue and cash flows arising from customer contracts, including significant judgments and changes in judgments, and assets recognized from costs incurred to obtain or fulfill a contract. In August 2015, the FASB issued ASU 2015-14, Deferral of the Effective Date, resulting in a one-year deferral of the effective date of ASU 2014-09, which will become effective for the Company in the first quarter of fiscal 2019, using one of two retrospective methods of adoption. The Company is currently evaluating the potential effects on its financial statements as well as its accounting policies and procedures. The Company has identified an implementation project team, related oversight processes and has commenced the assessment phase of the project. The Company has not selected a method for adoption nor determined the potential effects on its financial statements.
In February 2016, the FASB issued ASU No. 2016-02, Leases (Topic 842), which supersedes the existing lease accounting standards (Topic 840). Under the new guidance, a lessee will be required to recognize lease assets and lease liabilities for all leases with lease terms in excess of twelve months. The recognition, measurement and presentation of expenses and cash flows arising from a lease by a lessee primarily will depend on its classification as either a finance lease or operating lease. The criteria for distinction between a finance lease and an operating lease are substantially similar to existing lease guidance for capital leases and operating leases. Some changes to lessor accounting have been made to conform and align that guidance with the lessee guidance and other areas within GAAP, such as Revenue from Contracts with Customers (Topic 606). ASU 2016-02 becomes effective for the Company in the first quarter of fiscal 2020 and will be adopted using a modified retrospective approach. The Company has commenced the assessment phase of the project and is evaluating the impact on its financial statements from the future adoption of the standard.
F-13
SCIENCE APPLICATIONS INTERNATIONAL CORPORATION
NOTES TO CONSOLIDATED FINANCIAL STATEMENTS
In March 2016, the FASB issued ASU No. 2016-09, Improvements to Employee Share-Based Payment Accounting, which provides amendments to simplify several aspects of the accounting for share-based payment transactions. Among other requirements in the new standard, the ASU requires that an entity, (i) recognize excess tax benefits and deficiencies related to employee share-based payment transactions as income tax expense or benefit in the income statement rather than in equity; and (ii) present the excess tax benefits as an operating activity on the statement of cash flows versus current guidance to present them as financing activities. ASU 2016-09 becomes effective for the Company in the first quarter of fiscal 2018. On adoption, the amendments will be applied retrospectively or prospectively based on each amendment’s transition requirements. The amounts of excess tax benefits and deficiencies recognized are determined, in part, by the difference between the grant date fair value of share-based payments and the price of the Company’s common stock on the date on which the share-based payments vest or options are exercised. As such, the Company cannot estimate the impact of the future adoption of the ASU on our earnings and cash flows from operating activities.
In November 2016, the FASB issued ASU No. 2016-18, Statement of Cash Flows (Topic 230): Restricted Cash, which requires entities to show the changes in the total of cash, cash equivalents, restricted cash, and restricted cash equivalents in the statement of cash flows. As a result, entities will no longer present transfers between cash and cash equivalents and restricted cash and restricted cash equivalents in the statement of cash flows. ASU 2016-18 becomes effective for the Company in the first quarter of fiscal 2019 and will be applied retrospectively. The Company is evaluating the impact on its financial statements resulting from the future adoption of the standard.
In January 2017, the FASB issued ASU No. 2017-04, Intangible--Goodwill and Other (Topic 350): Simplifying the Test for Goodwill Impairment, which eliminates Step 2, from the annual, or interim, goodwill impairment test. As a result, entities should perform their annual, or interim, goodwill impairment test by comparing the fair value of a reporting unit with its carrying amount recognizing an impairment charge for the amount by which the carrying amount exceeds the reporting unit’s fair value. The Company elected to early adopt this ASU on January 1, 2017 on prospective basis from the date of the adoption. The adoption of this standard had no material impact to the Company’s financial statements.
Other Accounting Standards Updates effective after February 3, 2017 are not expected to have a material effect on the Company’s financial statements.
Note 2—Earnings Per Share, Share Repurchases and Dividends:
Earnings per Share (EPS)
Basic EPS is computed by dividing net income by the basic weighted average number of shares outstanding. Diluted EPS is computed similarly to basic EPS, except the weighted average number of shares outstanding is increased to include the dilutive effect of outstanding stock options and other stock-based awards.
A reconciliation of the weighted average number of shares outstanding used to compute basic and diluted EPS was:
|
|
|
Year Ended |
|
|||||||||
|
|
|
February 3, 2017 |
|
|
January 29, 2016 |
|
|
January 30, 2015 |
|
|||
|
|
(in millions) |
|
||||||||||
|
Basic weighted-average number of shares outstanding |
|
|
44.5 |
|
|
|
45.8 |
|
|
|
46.9 |
|
|
Dilutive common share equivalents - stock options and other stock-based awards |
|
|
1.4 |
|
|
|
1.6 |
|
|
|
1.6 |
|
|
Diluted weighted-average number of shares outstanding |
|
|
45.9 |
|
|
|
47.4 |
|
|
|
48.5 |
|
The following stock-based awards were excluded from the weighted average number of shares outstanding used to compute diluted EPS:
|
|
|
Year Ended |
|
|||||||||
|
|
|
February 3, 2017 |
|
|
January 29, 2016 |
|
|
January 30, 2015 |
|
|||
|
|
(in millions) |
|
||||||||||
|
Antidilutive stock options excluded |
|
|
0.2 |
|
|
|
0.3 |
|
|
|
0.3 |
|
F-14
SCIENCE APPLICATIONS INTERNATIONAL CORPORATION
NOTES TO CONSOLIDATED FINANCIAL STATEMENTS
The Company may repurchase shares in accordance with established repurchase plans. The Company retires its common stock upon repurchase with the excess over par value allocated to additional paid-in capital. The Company has not made any material purchases of common stock other than in connection with established share repurchase plans. On December 15, 2016, the number of shares of our common stock that may be repurchased under our existing repurchase plan, previously announced in October 2013, was increased by approximately 3.3 million shares, bringing the total authorized shares to be repurchased under the plan to approximately 11.8 million shares. As of February 3, 2017, the Company has repurchased approximately 7.1 million shares of common stock under the plan.
Dividends
The Company declared and paid quarterly dividends every quarter for the years presented, increasing from $0.28 to $0.31 per share in the second quarter of fiscal 2016. Total dividends declared and paid were $1.24 per share during fiscal 2017, $1.21 per share during fiscal 2016, and $1.12 per share during fiscal 2015.
On March 29, 2017, the Company’s Board of Directors declared a cash dividend of $0.31 per share of the Company’s common stock payable on April 28, 2017 to stockholders of record on April 14, 2017.
On May 4, 2015 the Company completed the acquisition of Scitor, a leading global provider of technical services to the U.S. intelligence community and other U.S. government customers. The acquisition was funded from cash on hand and increased borrowings. Purchase consideration paid to acquire Scitor was $764 million (net of cash acquired), including $43 million which was deposited to escrow accounts. In August 2015 $3 million was released from escrow to the sellers after finalizing the working capital adjustment and another $13 million was released in September 2016 that was held in escrow to secure a portion of the sellers’ indemnification obligations. Any remaining amount in escrow at the end of the indemnification period will be distributed to the sellers.
The purchase price was allocated among assets acquired and liabilities assumed at fair value based on the best available information, with the excess purchase price recorded as goodwill. During the first quarter of fiscal 2017, the Company completed its review of Scitor’s historical government accounting practices and adjusted the preliminary purchase price allocation to recognize $5 million in additional liabilities for potential questioned costs under U.S. Government Cost Accounting Standards (CAS) and $2 million of related deferred income tax assets resulting in a $3 million net increase to goodwill. The Company has completed the purchase accounting valuation for this transaction and recorded final purchase accounting entries as follows:
|
|
|
|
|
(in millions) |
|
|
|
Cash and cash equivalents |
|
|
|
$ |
39 |
|
|
Accounts receivable |
|
|
|
|
86 |
|
|
Prepaid and other current assets |
|
|
|
|
7 |
|
|
Deferred income taxes |
|
|
|
|
12 |
|
|
Equipment and leasehold improvements |
|
|
|
|
21 |
|
|
Intangible assets |
|
|
|
|
255 |
|
|
Goodwill |
|
|
|
|
484 |
|
|
Other noncurrent assets |
|
|
|
|
1 |
|
|
Total assets acquired |
|
|
|
|
905 |
|
|
|
|
|
|
|
|
|
|
Accounts payable and accrued liabilities |
|
|
|
|
49 |
|
|
Accrued payroll and employee benefits |
|
|
|
|
35 |
|
|
Other noncurrent liabilities |
|
|
|
|
18 |
|
|
Total liabilities assumed |
|
|
|
|
102 |
|
|
Net assets acquired |
|
|
|
$ |
803 |
|
F-15
SCIENCE APPLICATIONS INTERNATIONAL CORPORATION
NOTES TO CONSOLIDATED FINANCIAL STATEMENTS
As discussed in Note 8, the Company inherited Scitor’s historical tax basis in deductible goodwill, certain other intangible assets and net operating loss carryforwards.
The Company incurred $54 million in total costs associated with the acquisition and integration of Scitor. Acquisition-related expenses, all of which were incurred in prior fiscal years, were $28 million, including $17 million of deferred financing fees. Acquisition-related expenses for fiscal 2016 and fiscal 2015 were $10 million and $1 million, respectively. The Company also incurred $10 million in fiscal 2017 and $16 million in fiscal 2016 for expenses in connection with the integration of Scitor, primarily for strategic consulting services, facility consolidation, severance costs and other integration-related costs. These costs are included in acquisition and integration costs on the consolidated statements of income and comprehensive income.
The following unaudited pro forma financial information presents the combined results of operations for Scitor and the Company:
|
|
|
Year Ended |
|
|||||
|
|
|
January 29, 2016 |
|
|
January 30, 2015 |
|
||
|
|
(in millions, except per share amounts) |
|
||||||
|
Total revenues |
|
$ |
4,463 |
|
|
$ |
4,495 |
|
|
Net income |
|
$ |
143 |
|
|
$ |
115 |
|
|
Earnings per share: |
|
|
|
|
|
|
|
|
|
Basic |
|
$ |
3.12 |
|
|
$ |
2.45 |
|
|
Diluted |
|
$ |
3.02 |
|
|
$ |
2.37 |
|
The unaudited pro forma, combined financial information presented above has been prepared from historical financial statements that have been adjusted to give effect to the acquisition of Scitor as though it had occurred on February 1, 2014. They include adjustments for intangible asset amortization; interest expense and debt issuance costs on long-term debt; acquisition, integration, and other transaction costs; and the elimination of intercompany revenue and expenses.
Note 4—Goodwill and Intangible Assets:
Goodwill
Goodwill had a carrying value of $863 million and $860 million as of February 3, 2017 and January 29, 2016, respectively. There were no impairments of goodwill during the periods presented.
Intangible Assets
Intangible assets, all of which were finite-lived, consisted of the following:
|
|
|
February 3, 2017 |
|
|
January 29, 2016 |
|
||||||||||||||||||
|
|
|
Gross carrying value |
|
|
Accumulated amortization |
|
|
Net carrying value |
|
|
Gross carrying value |
|
|
Accumulated amortization |
|
|
Net carrying value |
|
||||||
|
|
|
(in millions) |
|
|||||||||||||||||||||
|
Intangible assets: |
|
|
|
|
|
|
|
|
|
|
|
|
|
|
|
|
|
|
|
|
|
|
|
|
|
Customer relationships |
|
$ |
240 |
|
|
$ |
(40 |
) |
|
$ |
200 |
|
|
$ |
238 |
|
|
$ |
(19 |
) |
|
$ |
219 |
|
|
Trade name |
|
|
- |
|
|
|
- |
|
|
|
- |
|
|
|
9 |
|
|
|
(4 |
) |
|
|
5 |
|
|
Total intangible assets |
|
$ |
240 |
|
|
$ |
(40 |
) |
|
$ |
200 |
|
|
$ |
247 |
|
|
$ |
(23 |
) |
|
$ |
224 |
|
Intangible assets with a gross carrying value of $9 million became fully amortized during fiscal 2017 and are no longer reflected in the gross carrying value as of February 3, 2017. Amortization expense related to intangible assets was $26 million, $33 million and $2 million for fiscal 2017, 2016 and 2015, respectively. There were no intangible asset impairment losses during the periods presented.
The estimated annual amortization expense related to intangible assets as of February 3, 2017 was as follows:
F-16
SCIENCE APPLICATIONS INTERNATIONAL CORPORATION
NOTES TO CONSOLIDATED FINANCIAL STATEMENTS
|
|
|
|
|
|
|
|
|
|
|
|
(in millions) |
|
||
|
2018 |
|
|
|
|
|
|
|
|
|
|
|
$ |
21 |
|
|
2019 |
|
|
|
|
|
|
|
|
|
|
|
|
20 |
|
|
2020 |
|
|
|
|
|
|
|
|
|
|
|
|
20 |
|
|
2021 |
|
|
|
|
|
|
|
|
|
|
|
|
20 |
|
|
2022 |
|
|
|
|
|
|
|
|
|
|
|
|
20 |
|
|
Thereafter |
|
|
|
|
|
|
|
|
|
|
|
|
99 |
|
|
Total |
|
|
|
|
|
|
|
|
|
|
|
$ |
200 |
|
Actual amortization expense in future periods could differ from these estimates as a result of future acquisitions, divestitures, impairments and other factors.
Note 5—Property, Plant and Equipment:
Property, plant and equipment are carried at cost net of accumulated depreciation and amortization. Purchases of property, plant and equipment, as well as costs associated with major renewals and betterments, are capitalized. Maintenance, repairs and minor renewals and betterments are expensed as incurred. When assets are sold or otherwise disposed of, the cost and related accumulated depreciation or amortization are removed from the accounts and any resulting gain or loss is recognized. Depreciation and amortization is recognized using the methods and estimated useful lives as follows:
|
|
|
Depreciation or amortization method |
|
Estimated useful lives (in years) |
|
February 3, 2017 |
|
|
January 29, 2016 |
|
||
|
|
|
|
|
|
|
(in millions) |
|
|||||
|
Computer equipment |
|
Straight-line or declining balance |
|
3-10 |
|
$ |
67 |
|
|
$ |
61 |
|
|
Capitalized software and software licenses |
|
Straight-line or declining balance |
|
3-10 |
|
|
55 |
|
|
|
55 |
|
|
Leasehold improvements |
|
Straight-line |
|
Shorter of lease term or 10 |
|
|
46 |
|
|
|
48 |
|
|
Office furniture and fixtures |
|
Straight-line or declining balance |
|
2-10 |
|
|
11 |
|
|
|
12 |
|
|
Buildings and improvements |
|
Straight-line |
|
40 |
|
|
7 |
|
|
|
7 |
|
|
Property, plant and equipment |
|
|
|
|
|
|
186 |
|
|
|
183 |
|
|
Accumulated depreciation and amortization |
|
|
|
|
|
|
(126 |
) |
|
|
(112 |
) |
|
Property, plant and equipment, net |
|
|
|
|
|
$ |
60 |
|
|
$ |
71 |
|
Depreciation and amortization expense for property, plant and equipment was $24 million, $26 million and $19 million in fiscal 2017, 2016 and 2015, respectively.
Note 6—Stock-Based Compensation:
Plan Summaries
Certain of the Company’s employees participate in the following four stock-based compensation plans: “2013 Equity Incentive Plan” (EIP), “Management Compensation Plan,” “Stock Compensation Plan,” and “Employee Stock Purchase Plan” (ESPP) which are herein referred to together as the “Plans.” The Company issues new shares on the vesting of stock awards or exercise of stock options under these Plans.
The EIP provides the Company’s employees and directors the opportunity to receive various types of stock-based compensation and cash awards. The terms of the stock-based awards granted to employees and directors are the same, except that those for directors cliff vest within one year of the grant date. As of February 3, 2017, the Company has outstanding stock options, vested and vesting stock awards, performance share awards and cash awards under this plan. Vesting stock awards and stock options granted under the EIP prior to fiscal 2015 generally vest or become exercisable 20%, 20%, 20%, and 40% after one, two, three and four years, respectively. Stock options granted under the EIP in fiscal 2015 and thereafter generally become exercisable 33%, 33% and 33% after one, two and three years, respectively, while vesting stock awards granted in fiscal 2015 and thereafter generally vest 25%, 25%, 25% and 25% after one, two, three and four years, respectively. The maximum contractual term for stock options granted under the EIP is ten years, but
F-17
SCIENCE APPLICATIONS INTERNATIONAL CORPORATION
NOTES TO CONSOLIDATED FINANCIAL STATEMENTS
historically the Company has granted stock options with a seven-year contractual term. Vesting may be accelerated for employees meeting retirement eligibility conditions. Stock-based awards generally provide for accelerated vesting if there is a change in control (as defined in the EIP). Vesting stock awards and performance share awards have forfeitable rights to dividends. In June 2014, the EIP was amended and restated to increase the total authorized shares of common stock for issuance under the EIP from 5.7 million to 8.5 million.
The Company grants performance-based stock awards to certain officers and key employees under the EIP. Performance shares are rights to receive shares of the Company’s stock on the satisfaction of service requirements and performance conditions. These awards cliff vest at the end of the third fiscal year following the grant date, subject to meeting the minimum service requirements and the achievement of certain annual and cumulative financial metrics of the Company’s performance, with the number of shares ultimately issued, if any, ranging up to 150% of the specified target shares. If performance is below the minimum threshold level of performance, no shares will be issued. For all performance share awards granted, the annual financial metrics are based on operating cash flows and the cumulative financial metrics are based on operating income.
The Company has a Management Stock Compensation Plan and a Stock Compensation Plan, together referred to as the “Stock Compensation Plans.” The Board of Directors may at any time amend or terminate the Stock Compensation Plans. The Stock Compensation Plans provide for awards in share units to eligible employees. Benefits from these plans are payable in shares of the Company’s stock that are held in a trust for the purpose of funding benefit payments to the participants. Compensation expense is generally recognized over the vesting period of four years and vest 100% after four years following the date of the award. The Stock Compensation Plans permit a vesting period up to seven years after the date of grant. During fiscal 2017 all remaining outstanding awards in the Stock Compensation Plans vested, and all share awards for the Stock Compensation Plan were distributed upon vesting. In the event of a change in control of the Company (as defined by the Management Stock Compensation Plan), participant accounts will be immediately distributed, otherwise will generally be distributed upon retirement, based on the participant’s payout election, or upon termination. The Stock Compensation Plans do not provide for a maximum number of shares available for future issuance.
Prior to the separation, certain Company employees and directors participated in stock-based compensation plans sponsored by former Parent that were denominated in former Parent’s common shares. At separation, all unvested stock awards and all outstanding stock options held by the Company’s employees and directors under former Parent’s plans converted into awards under the Plans. This conversion was designed to maintain the same intrinsic value of the awards immediately before and after the separation. The converted awards have substantially the same terms and conditions as immediately before the separation under former Parent’s plans. Unrecognized compensation expense as of the separation date related to the converted awards is recognized by the Company over the remaining vesting periods of the awards.
The Company’s ESPP allows eligible employees to purchase shares of the Company’s stock at a discount of up to 15% of the fair market value on the date of purchase. During the three years ended February 3, 2017, the discount was 5% of the fair market value on the date of purchase for purchases made under the Company’s ESPP, thereby resulting in the ESPP being non-compensatory. As of February 3, 2017, 3.4 million shares of the Company’s stock are authorized for issuance under the ESPP.
F-18
SCIENCE APPLICATIONS INTERNATIONAL CORPORATION
NOTES TO CONSOLIDATED FINANCIAL STATEMENTS
Expense and Related Tax Benefits Recognized
Stock-based compensation expense and related tax benefits recognized under the Plans were:
|
|
|
Year Ended |
|
|||||||||
|
|
|
February 3, 2017 |
|
|
January 29, 2016 |
|
|
January 30, 2015 |
|
|||
|
|
|
(in millions) |
|
|||||||||
|
Stock-based compensation expense: |
|
|
|
|
|
|
|
|
|
|
|
|
|
Stock options |
|
$ |
4 |
|
|
$ |
4 |
|
|
$ |
4 |
|
|
Vesting stock awards |
|
|
24 |
|
|
|
25 |
|
|
|
30 |
|
|
Performance share awards |
|
|
3 |
|
|
|
4 |
|
|
|
1 |
|
|
Total stock-based compensation expense |
|
$ |
31 |
|
|
$ |
33 |
|
|
$ |
35 |
|
|
Tax benefits recognized from stock-based compensation |
|
$ |
12 |
|
|
$ |
13 |
|
|
$ |
13 |
|
Stock Options
Stock options are granted with their exercise price equal to the closing market price of the Company’s stock on the last trading day preceding the grant date, except for those stock options outstanding as of September 27, 2013, for which the exercise prices (and number of stock options) were adjusted for the conversion at separation.
Stock option activity for the year ended February 3, 2017 was:
|
|
|
Shares of stocks under stock options |
|
|
Weighted average exercise price |
|
|
Weighted average remaining contractual term |
|
|
Aggregate intrinsic value |
|
||||
|
|
|
(in millions) |
|
|
|
|
|
|
(in years) |
|
|
(in millions) |
|
|||
|
Outstanding at January 29, 2016 |
|
|
2.3 |
|
|
$ |
34.75 |
|
|
|
4.4 |
|
|
$ |
21 |
|
|
Options granted |
|
|
0.3 |
|
|
|
53.79 |
|
|
|
|
|
|
|
|
|
|
Options forfeited or expired |
|
|
(0.1 |
) |
|
|
38.49 |
|
|
|
|
|
|
|
|
|
|
Options exercised |
|
|
(0.6 |
) |
|
|
32.27 |
|
|
|
|
|
|
|
|
|
|
Outstanding at February 3, 2017 |
|
|
1.9 |
|
|
$ |
38.57 |
|
|
|
4.0 |
|
|
$ |
84 |
|
|
Options exercisable at February 3, 2017 |
|
|
1.0 |
|
|
$ |
34.10 |
|
|
|
3.4 |
|
|
$ |
49 |
|
|
Vested and expected to vest as of February 3, 2017 |
|
|
1.9 |
|
|
$ |
38.39 |
|
|
|
4.0 |
|
|
$ |
83 |
|
As of February 3, 2017 there was $3 million of unrecognized compensation cost, net of estimated forfeitures, related to stock options, which is expected to be recognized over a weighted average period of 1.2 years.
The following table summarizes activity related to exercises of stock options:
|
|
|
Year Ended |
|
|||||||||
|
|
|
February 3, 2017 |
|
|
January 29, 2016 |
|
|
January 30, 2015 |
|
|||
|
|
|
(in millions) |
|
|||||||||
|
Cash received from exercises of stock options |
|
$ |
- |
|
|
$ |
- |
|
|
$ |
- |
|
|
Stock exchanged at fair value upon exercises of stock options |
|
$ |
3 |
|
|
$ |
3 |
|
|
$ |
2 |
|
|
Tax benefits realized from exercises of stock options |
|
$ |
8 |
|
|
$ |
3 |
|
|
$ |
1 |
|
|
Total intrinsic value of options exercised |
|
$ |
21 |
|
|
$ |
10 |
|
|
$ |
7 |
|
The fair value of stock option awards granted under the Company’s plan were valued using the Black-Scholes option-pricing model based on the following assumptions:
Expected Term--The expected term is calculated using the U.S. Security and Exchange Commission’s “simplified method” as the midpoint between the vesting term and contractual term.
F-19
SCIENCE APPLICATIONS INTERNATIONAL CORPORATION
NOTES TO CONSOLIDATED FINANCIAL STATEMENTS
Expected Volatility--For options granted during fiscal 2017, the expected volatility was based on the historical volatility of SAIC since the separation from former Parent. For options granted during fiscal 2016 and fiscal 2015, the expected volatility is based on a leverage-adjusted daily average volatility of the Company’s peer group companies over a period consistent with the expected term. Peer group companies were selected from companies within the Company’s industry that most closely match the Company’s business, including size, capital structure and customer base.
Risk-Free Interest Rate--The risk-free interest rate is based on the yield curve of a zero-coupon U.S. Treasury bond with a maturity equal to the expected term of the stock option on the date of grant.
Dividend Yield--The dividend yield assumed over the expected term of the option is based on the announced dividend as of the grant date and the three month average stock price as of the grant date.
The weighted average grant date fair value and assumptions used to determine the fair value of stock options granted for the periods presented were:
|
|
|
Year Ended |
|
|||||||||
|
|
|
February 3, 2017 |
|
|
January 29, 2016 |
|
|
January 30, 2015 |
|
|||
|
|
|
|
|
|
|
|
|
|
|
|
|
|
|
Weighted average grant-date fair value |
|
$ |
10.20 |
|
|
$ |
11.76 |
|
|
$ |
5.91 |
|
|
Expected term (in years) |
|
|
4.4 |
|
|
|
4.5 |
|
|
|
4.5 |
|
|
Expected volatility |
|
|
28.9 |
% |
|
|
31.7 |
% |
|
|
24.1 |
% |
|
Risk-free interest rate |
|
|
1.2 |
% |
|
|
1.2 |
% |
|
|
1.5 |
% |
|
Dividend yield |
|
|
2.7 |
% |
|
|
2.1 |
% |
|
|
3.0 |
% |
|
|
Vesting Stock Awards
Vesting stock award activity for the year ended February 3, 2017 was:
|
|
|
Shares of stock under stock awards |
|
|
Weighted average grant date fair value |
|
||
|
|
|
(in millions) |
|
|
|
|
|
|
|
Unvested at January 29, 2016 |
|
|
2.2 |
|
|
$ |
35.93 |
|
|
Awards granted |
|
|
0.5 |
|
|
|
53.62 |
|
|
Awards forfeited |
|
|
(0.1 |
) |
|
|
43.65 |
|
|
Awards vested |
|
|
(1.2 |
) |
|
|
33.31 |
|
|
Unvested at February 3, 2017 |
|
|
1.4 |
|
|
$ |
43.46 |
|
The grant date fair value of vesting stock awards is based on the closing market price of the Company’s stock on the last trading day preceding the grant date, except for those granted prior to the separation under former Parent’s Plan which were based on the fair value of former Parent’s common stock and adjusted for the separation conversion on September 27, 2013. The weighted average grant date fair value of the vesting stock awards granted for fiscal 2017, fiscal 2016 and fiscal 2015 was $53.62, $50.26 and $38.16, respectively. As of February 3, 2017 there was $26 million of unrecognized compensation cost, net of estimated forfeitures, related to vesting stock awards, which is expected to be recognized over a weighted average period of 1.5 years. The fair value of vesting stock awards that vested in fiscal 2017, fiscal 2016 and fiscal 2015 was $64 million, $39 million and $33 million, respectively.
F-20
SCIENCE APPLICATIONS INTERNATIONAL CORPORATION
NOTES TO CONSOLIDATED FINANCIAL STATEMENTS
Performance Share Awards
Performance share award activity for the year ended February 3, 2017 was:
|
|
|
Shares of stock under performance shares |
|
|
Weighted average grant-date fair value |
|
||
|
|
|
(in millions) |
|
|
|
|
|
|
|
Unvested performance shares at January 29, 2016 |
|
|
0.3 |
|
|
$ |
44.97 |
|
|
Performance shares granted |
|
|
0.1 |
|
|
|
53.34 |
|
|
Performance shares forfeited |
|
|
(0.1 |
) |
|
|
45.46 |
|
|
Performance shares vested |
|
|
(0.1 |
) |
|
|
38.77 |
|
|
Performance shares adjustment |
|
|
- |
|
|
|
- |
|
|
Unvested performance shares at February 3, 2017 |
|
|
0.2 |
|
|
$ |
52.73 |
|
The actual number of shares to be issued upon vesting range between 0-150% of the specified target shares. The number of performance shares are presented at 100% of the specified target shares in the table above, except for performance shares that vested and performance shares adjustment. Performance shares vested reflects the number of shares to be issued based on the actual achievement of the performance goals for shares that vested during the period. Performance shares adjustment reflects the difference between the number of performance shares vested and the number of performance shares that vested at target. The fair value of performance share awards that vested in fiscal 2017 was $10 million. For unvested performance shares as of February 3, 2017 the Company expects to issue 0.2 million shares of stock in the future based on estimated future achievement of the performance goals. The weighted average grant date fair value of the performance share awards granted for fiscal 2017, fiscal 2016, and fiscal 2015 was $53.34, $52.11 and $38.77, respectively. The grant date fair value of performance share awards is based on the closing market price of the Company’s common stock on the last trading day preceding the grant date. As of February 3, 2017 there was $3.8 million of unrecognized compensation cost, net of estimated forfeitures, related to performance share awards, which is expected to be recognized over a weighted average period of 1.6 years.
Defined Contribution Plans
The Company sponsors the Science Applications International Corporation Retirement Plan (a defined contribution plan), which is both a 401(k) plan and an employee stock ownership plan, in which most employees are eligible to participate. Scitor sponsored the Scitor Corporation Salary Savings and Profit Sharing Plan, which was a 401(k) plan in which most employees of Scitor were eligible to participate. The Scitor Corporation Salary Savings and Profit Sharing Plan merged into the Science Applications International Corporation Retirement Plan on September 23, 2016.
The Science Applications International Corporation Retirement Plan allows eligible participants to contribute a portion of their income through payroll deductions and the Company may also make discretionary contributions. The Company contributions expensed for defined contribution plans were $48 million, $47 million and $34 million in fiscal 2017, 2016 and 2015, respectively.
Deferred Compensation Plans
The Company has established the Science Applications International Corporation Deferred Compensation Plan (DCP), effective January 1, 2015, providing certain eligible employees and directors an opportunity to defer some or all of their compensation on an unfunded, nonqualified basis. Participant deferrals are fully vested and diversified at the participant’s direction among the investment options offered under the DCP. Participant accounts will be credited with a rate of return based on the performance of the investment options selected. Distributions are made in cash. Deferred balances will be paid on retirement, based on the participant’s payout election, or upon termination. The Company may provide discretionary contributions to participants, but no Company contributions have been made.
F-21
SCIENCE APPLICATIONS INTERNATIONAL CORPORATION
NOTES TO CONSOLIDATED FINANCIAL STATEMENTS
The Science Applications International Corporation Key Executive Stock Deferral Plan (KESDP) was closed on December 31, 2014, and no further deferrals are allowed. Benefits from the KESDP are payable in shares of the Company’s stock that may be held in trust for the purpose of funding benefit payments to KESDP participants. Vested deferred balances will generally be paid on retirement, based on the participant’s payout election, or upon termination.
The Science Applications International Corporation 401(k) Excess Deferral Plan (Excess Plan) was also closed on December 31, 2014, and no further deferrals are allowed. Participant deferrals are fully vested and diversified at the participant’s direction among the investment options offered under the Excess Plan. Deferred balances will generally be paid following retirement or termination.
Substantially all of the Company’s income before income taxes for the three years ended February 3, 2017 is subject to taxation in the United States. The provision for income taxes for each of the three years ended February 3, 2017 included the following:
|
|
|
Year Ended |
|
|||||||||
|
|
|
February 3, 2017 |
|
|
January 29, 2016 |
|
|
January 30, 2015 |
|
|||
|
|
|
(in millions) |
|
|||||||||
|
Current: |
|
|
|
|
|
|
|
|
|
|
|
|
|
Federal |
|
$ |
59 |
|
|
$ |
51 |
|
|
$ |
66 |
|
|
State |
|
|
12 |
|
|
|
12 |
|
|
|
12 |
|
|
Deferred: |
|
|
|
|
|
|
|
|
|
|
|
|
|
Federal |
|
|
4 |
|
|
|
5 |
|
|
|
4 |
|
|
State |
|
|
(3 |
) |
|
|
(2 |
) |
|
|
- |
|
|
Total |
|
$ |
72 |
|
|
$ |
66 |
|
|
$ |
82 |
|
A reconciliation of the provision for income taxes to the amount computed by applying the statutory federal income tax rate to income before income taxes for each of the three years ended February 3, 2017 follows:
|
|
|
Year Ended |
|
|||||||||
|
|
|
February 3, 2017 |
|
|
January 29, 2016 |
|
|
January 30, 2015 |
|
|||
|
|
|
(in millions) |
|
|||||||||
|
Amount computed at the statutory federal income tax rate (35%) |
|
$ |
77 |
|
|
$ |
64 |
|
|
$ |
78 |
|
|
State income taxes, net of federal tax benefit |
|
|
6 |
|
|
|
6 |
|
|
|
8 |
|
|
Research and development credits |
|
|
(8 |
) |
|
|
(2 |
) |
|
|
(1 |
) |
|
Manufacturer's deduction |
|
|
(2 |
) |
|
|
(4 |
) |
|
|
(1 |
) |
|
Non-deductible acquisition costs |
|
|
- |
|
|
|
2 |
|
|
|
- |
|
|
Other |
|
|
(1 |
) |
|
|
- |
|
|
|
(2 |
) |
|
Total |
|
$ |
72 |
|
|
$ |
66 |
|
|
$ |
82 |
|
|
Effective income tax rate |
|
|
32.9 |
% |
|
|
36.0 |
% |
|
|
36.8 |
% |
The effective income tax rate for fiscal 2017 is lower than fiscal 2016 primarily due to increased research and development credits in the current year. The effective income tax rate in fiscal 2016 was lower than fiscal 2015 primarily due to an increase in the manufacturer’s deduction, and research and development credits, offset by non-deductible acquisition costs in fiscal 2016.
F-22
SCIENCE APPLICATIONS INTERNATIONAL CORPORATION
NOTES TO CONSOLIDATED FINANCIAL STATEMENTS
Deferred income taxes are recorded for differences in the basis of assets and liabilities for financial reporting purposes and tax reporting purposes. Deferred tax assets (liabilities) were comprised of:
|
|
|
February 3, 2017 |
|
|
January 29, 2016 |
|
||
|
|
|
(in millions) |
|
|||||
|
Accrued vacation and bonuses |
|
$ |
27 |
|
|
$ |
26 |
|
|
Accrued liabilities |
|
|
8 |
|
|
|
11 |
|
|
Deferred compensation |
|
|
22 |
|
|
|
24 |
|
|
Stock awards |
|
|
17 |
|
|
|
19 |
|
|
Net operating loss carry-forward & tax credits-carry forward |
|
|
21 |
|
|
|
28 |
|
|
Accumulated other comprehensive loss |
|
|
1 |
|
|
|
5 |
|
|
Valuation allowance |
|
|
(1 |
) |
|
|
- |
|
|
Total deferred tax assets |
|
|
95 |
|
|
|
113 |
|
|
Deferred revenue |
|
|
(31 |
) |
|
|
(52 |
) |
|
Fixed asset basis differences |
|
|
(6 |
) |
|
|
(6 |
) |
|
Purchased intangible assets |
|
|
(69 |
) |
|
|
(63 |
) |
|
Total deferred tax liabilities |
|
|
(106 |
) |
|
|
(121 |
) |
|
Net deferred tax liabilities |
|
$ |
(11 |
) |
|
$ |
(8 |
) |
Net federal deferred tax liabilities of $13 million are presented as deferred income taxes, and net state deferred tax assets of $2 million are presented in other assets, on the consolidated balance sheets. Net deferred tax assets include state research tax credit carryforwards for which the Company has set up a $1 million valuation allowance.
The changes in the unrecognized tax benefits, excluding accrued interest and penalties, were:
|
|
|
Year Ended |
|
|||||||||
|
|
|
February 3, 2017 |
|
|
January 29, 2016 |
|
|
January 30, 2015 |
|
|||
|
|
|
(in millions) |
|
|||||||||
|
Unrecognized tax benefits at beginning of the year |
|
$ |
- |
|
|
$ |
- |
|
|
$ |
- |
|
|
Additions for tax positions related to prior years |
|
|
2 |
|
|
|
- |
|
|
|
- |
|
|
Additions for tax positions related to the current year |
|
|
3 |
|
|
|
- |
|
|
|
- |
|
|
Unrecognized tax benefits at end of the year |
|
$ |
5 |
|
|
$ |
- |
|
|
$ |
- |
|
|
Unrecognized tax benefits that, if recognized, would affect the effective income tax rate |
|
$ |
5 |
|
|
$ |
- |
|
|
$ |
- |
|
Unrecognized tax benefits for fiscal 2017 of $4 million are presented as other long-term liabilities and $1 million is classified as a reduction to the corresponding deferred tax asset, presented in other assets on the consolidated balance sheets. Although the timing of such reviews is not certain, we do not believe that it is reasonably possible that the unrecognized tax benefits will materially change in the next 12 months. In fiscal 2016 and 2015, the Company did not have any unrecognized tax benefits.
For the periods presented, there was not a significant amount of accrued interest and penalties recognized in the consolidated balance sheets and statements of income and comprehensive income. Tax interest and tax penalties, if any, would be included in income tax expense.
F-23
SCIENCE APPLICATIONS INTERNATIONAL CORPORATION
NOTES TO CONSOLIDATED FINANCIAL STATEMENTS
Beginning with fiscal 2014, the Company has filed income tax returns in the U.S. and various state jurisdictions, which may be subject to routine compliance reviews by the IRS and other taxing authorities. While the Company believes it has adequate accruals for uncertain tax positions, the tax authorities may determine that the Company owes taxes in excess of recorded accruals or the recorded accruals may be in excess of the final settlement amounts agreed to by tax authorities. The Company’s tax returns for fiscal 2016, 2015 and 2014 remain subject to examination by the IRS and various other tax jurisdictions. The Company is not responsible for any tax items on operations before the separation except for Scitor’s tax returns that remain subject to examination by the U.S. Internal Revenue Service and various other tax jurisdictions from 2005 through the acquisition.
In fiscal 2016 the Company acquired all of Scitor’s stock in a transaction taxable to the selling shareholders. The Company inherited Scitor’s historical tax basis in deductible goodwill, certain other intangible assets, and operating loss carryforwards. At the date of the acquisition, the tax deductible goodwill was $136 million and the tax deductible identified intangible assets were $163 million. The Company inherited a federal and state net operating loss of $90 million subject to Internal Revenue Code Section 382 limitations. The Company expects to utilize these losses completely by fiscal 2020. The net operating losses will begin to expire in fiscal 2027.
The Company has $5 million of state credit carryforwards that will begin to expire in fiscal 2026.
The Company’s long-term debt as of the periods presented was as follows:
|
|
|
February 3, 2017 |
|
|
January 29, 2016 |
|
||||||||||||||||||||||||||
|
|
|
Stated interest rate |
|
|
Effective interest rate |
|
|
Principal |
|
|
Unamortized Debt Issuance Costs |
|
|
Net |
|
|
Principal |
|
|
Unamortized Debt Issuance Costs |
|
|
Net |
|
||||||||
|
|
|
|
|
|
|
|
|
|
|
(in millions) |
|
|||||||||||||||||||||
|
Term Loan A Facility due August 2021 |
|
|
2.81 |
% |
|
|
2.92 |
% |
|
$ |
660 |
|
|
$ |
(2 |
) |
|
$ |
658 |
|
|
$ |
551 |
|
|
$ |
(2 |
) |
|
$ |
549 |
|
|
Term Loan B Facility due May 2022 |
|
|
3.44 |
% |
|
|
4.02 |
% |
|
|
400 |
|
|
|
(11 |
) |
|
|
389 |
|
|
|
536 |
|
|
|
(15 |
) |
|
|
521 |
|
|
Total long-term debt |
|
|
|
|
|
|
|
|
|
$ |
1,060 |
|
|
$ |
(13 |
) |
|
$ |
1,047 |
|
|
$ |
1,087 |
|
|
$ |
(17 |
) |
|
$ |
1,070 |
|
|
Less current portion |
|
|
|
|
|
|
|
|
|
|
25 |
|
|
|
- |
|
|
|
25 |
|
|
|
57 |
|
|
|
- |
|
|
|
57 |
|
|
Total long-term debt, net of current portion |
|
|
|
|
|
|
|
|
|
$ |
1,035 |
|
|
$ |
(13 |
) |
|
$ |
1,022 |
|
|
$ |
1,030 |
|
|
$ |
(17 |
) |
|
$ |
1,013 |
|
As of February 3, 2017, the Company has a $1.3 billion credit facility (the Credit Facility) between the Company, as borrower, and Citibank, N.A. (Citibank), as administrative agent, which consists of a $200 million secured revolving credit facility (the Revolving Credit Facility), a $660 million secured term facility (Term Loan A Facility), and a $400 million secured term facility (Term Loan B Facility) (together, the Term Loan Facilities). The Revolving Credit Facility capacity is available to the Company through August 2021, but no draws have been made. Any obligations under the Credit Facility are secured by liens on substantially all of the assets of the Company and its subsidiaries.
The Term Loan A Facility was funded in September 2013 in an initial aggregate principal amount of $500 million (Initial Term Loan A Facility). In order to fund the Scitor acquisition and related transaction costs, on May 4, 2015, through an amendment to the Credit Facility (Second Amended Credit Agreement), the Term Loan A Facility principal amount was increased by $100 million (Incremental Term Loan A); the Term Loan B Facility was funded with an initial aggregate principal amount of $570 million; and the prior existing Term Loan A and Revolving Credit Facility were converted from unsecured to secured facilities. Any obligations under the Credit Facility are secured by liens on substantially all of the assets of the Company and its subsidiaries.
F-24
SCIENCE APPLICATIONS INTERNATIONAL CORPORATION
NOTES TO CONSOLIDATED FINANCIAL STATEMENTS
On August 23, 2016, the Company amended the Second Amended and Restated Credit Agreement (Amendment) to extend the maturity of the Term Loan A Facility and the termination date of the Revolving Credit Facility from September 2018 to August 2021, and to transfer $132 million of principal outstanding under the Term Loan B Facility to the Term Loan A Facility. Further, the Amendment lowered the interest rate margins on the Revolving Credit Facility and the Term Loan Facilities, reset the Term Loan A Facility’s quarterly principal repayment schedule and eliminated the required quarterly principal repayments for the Term Loan B Facility. In fiscal 2017, the Company recognized $5 million in expenses associated with the amendment, which is included in interest expense and includes $2 million in write-offs of unamortized debt issuance costs. The Company deferred an additional $2 million in financing fees that are amortized to interest expense utilizing the effective interest method.
Borrowings under the Credit Facility bear a variable rate of interest based on the Eurocurrency Rate or Base Rate, plus applicable margin. The applicable margin with respect to Term Loan A Facility and borrowings under the Revolving Credit Facility range from 1.50% to 2.25% for Eurocurrency Rate loans, and 0.50% to 1.25% for Base Rate loans. Interest rate margins for the Term Loan B Facility are 2.50%, subject to a 0.75% floor for Eurocurrency Rate loans or 1.50% for Base Rate loans. The Company also pays a commitment fee with respect to undrawn amounts under the Revolving Credit Facility ranging from 0.30% to 0.40%. Except for the Term Loan B Facility, the applicable margin and commitment fees will vary based on the Company’s leverage ratio.
Interest payments are due based on the type of loan selected. Interest in respect of Base Rate loans is payable quarterly in arrears on the last day of each calendar quarter. Interest in respect of Eurocurrency Rate loans is payable in arrears on the last day of the applicable interest period and every three months in the case of interest periods in excess of three months. The Term Loan A Facility and Term Loan B Facility are Eurocurrency Rate loans indexed to 1-month LIBOR and 3-month LIBOR, respectively. Interest is due for the Term Loan A Facility on the last business day of every month while interest on the Term Loan B Facility is paid quarterly on the 7th of every August, November, February, and May.
The Term Loan A Facility principal under the Amendment is repaid quarterly on the last business day of each July, October, January, and April. The Company will make scheduled quarterly principal repayments of $8.3 million through July 31, 2018; $12.4 million between October 31, 2018 to July 31, 2019; and $16.5 million between October 31, 2019 and the Term Loan A Facility maturity date. The Term Loan B Facility principal under the Amendment is payable in full upon maturity. Prior to the Amendment, Term Loan B Facility principal amortized quarterly in an amount equal to $1.4 million plus accrued interest on the amount of principal repaid, which was payable on each October 31, January 31, April 30, and July 31. Principal amortization began July 31, 2015.
The scheduled principal repayments for Term Loan A may be further reduced or eliminated by mandatory principal prepayments. Mandatory principal prepayments are allocated to Term Loan A and Term Loan B on a pro rata basis and reduce the remaining scheduled principal installments for each facility. Voluntary principal prepayments may be applied to either or both loans at the Company’s direction. The Company made voluntary principal prepayments applied to Term Loan B Facility of $4 million and $30 million during fiscal 2017 and fiscal 2016, respectively.
Subsequent to the end of fiscal 2017, on March 30, 2017, the Company made a $9 million voluntary principal prepayment, which was applied to Term Loan A Facility and is included in the current portion of long-term debt on the consolidated balance sheets.
The Credit Facility requires the maintenance of a Senior Secured Leverage Ratio (as defined in the Second Amended and Restated Credit Agreement) of not greater than 4.00 to 1.00 until July 31, 2016, and not greater than 3.75 to 1.00 thereafter, and requires the Company to make an annual prepayment as a portion of its Excess Cash Flow (as defined in the Amendment). The Company does not have a mandatory prepayment for the year ended February 3, 2017.
F-25
SCIENCE APPLICATIONS INTERNATIONAL CORPORATION
NOTES TO CONSOLIDATED FINANCIAL STATEMENTS
The Credit Facility contains certain restrictive covenants applicable to the Company and its subsidiaries, which include limitations on the ability to merge or consolidate with other entities; enter into property sale and lease-back transactions and pay dividends or make stock repurchases under certain leverage ratios. The Credit Facility also contains certain customary events of default, including, among others, defaults based on certain bankruptcy and insolvency events, nonpayment, cross-defaults to other debt, breach of specified covenants, ERISA events, material monetary judgments, change of control events and the material inaccuracy of the Company’s representations and warranties. If an event of default occurs and is continuing under the Credit Facility, the administrative agent shall at the request of the required lenders or may with the consent of the required lenders terminate the commitments thereunder, declare amounts outstanding (including principal and accrued interest and fees) payable immediately, and enforce any and all rights and interests. As of February 3, 2017 the Company was in compliance with the covenants under its Credit Facility.
Maturities of long-term debt as of February 3, 2017 are:
|
Fiscal Year Ending |
|
|
|
|
|
|
|
Total |
|
|
|
|
|
|
|
|
|
|
|
(in millions) |
|
|
|
2018 |
|
|
|
|
|
|
|
$ |
25 |
|
|
2019 |
|
|
|
|
|
|
|
|
41 |
|
|
2020 |
|
|
|
|
|
|
|
|
58 |
|
|
2021 |
|
|
|
|
|
|
|
|
66 |
|
|
2022 |
|
|
|
|
|
|
|
|
469 |
|
|
Thereafter |
|
|
|
|
|
|
|
|
401 |
|
|
Total principal payments |
|
|
|
|
|
|
|
$ |
1,060 |
|
As of February 3, 2017 and January 29, 2016, the carrying value of the Company’s outstanding debt obligations approximated its fair value. The fair value of long-term debt is calculated using Level 2 inputs, based on interest rates available for debt with terms and maturities similar to the Company’s Term Loan Facilities.
Note 10—Derivative Instruments Designated as Cash Flow Hedges:
The Company’s derivative instruments designated as cash flow hedges consist of:
|
|
|
|
|
|
|
|
|
|
|
|
|
|
|
Liability Fair Value (1) at |
|
|||||
|
|
|
Notional Amount at February 3, 2017 |
|
|
Pay Fixed Rate |
|
|
Receive Variable Rate |
|
Settlement and Termination |
|
February 3, 2017 |
|
|
January 29, 2016 |
|
||||
|
|
|
(in millions) |
|
|
|
|
|
|
|
|
|
|
(in millions) |
|
||||||
|
Term loan A interest rate swaps |
|
$ |
413 |
|
|
|
1.41 |
% |
|
1-month LIBOR |
|
Monthly through September 26, 2018 |
|
$ |
1 |
|
|
$ |
7 |
|
|
Term loan B interest rate swaps |
|
|
350 |
|
|
|
1.88 |
% |
|
3-month LIBOR (2) |
|
Quarterly through May 7, 2020 |
|
|
2 |
|
|
|
8 |
|
|
Total |
|
$ |
763 |
|
|
|
|
|
|
|
|
|
|
$ |
3 |
|
|
$ |
15 |
|
(1) The fair value of the fixed interest rate swaps liability is included in accounts payable and accrued liabilities on the consolidated balance sheets.
(2) Subject to a 0.75% floor.
The Company is party to fixed interest rate swap instruments that are designated and accounted for as cash flow hedges to manage risks associated with interest rate fluctuations on a portion of the Company’s floating rate debt. The counterparties to all swap agreements are financial institutions. See Note 11 for the effective portion of the unrealized change in fair values on cash flow hedges recognized in other comprehensive loss and the amounts reclassified from accumulated other comprehensive loss into earnings for the current and comparative periods presented. There was no ineffectiveness during any of the periods presented. The Company estimates that it will reclassify $4 million of unrealized losses from accumulated other comprehensive loss into earnings in the twelve months following February 3, 2017.
F-26
SCIENCE APPLICATIONS INTERNATIONAL CORPORATION
NOTES TO CONSOLIDATED FINANCIAL STATEMENTS
Note 11—Changes in Accumulated Other Comprehensive Loss by Component:
The following table presents the changes in accumulated other comprehensive loss attributable to the Company’s fixed interest rate swap cash flow hedges that are discussed in Note 10.
|
|
|
Unrealized Losses on Fixed Interest Rate Swap Cash Flow Hedges |
|
|||||||||
|
|
|
Pre-Tax Amount (a) |
|
|
Income Tax (b) |
|
|
Net Amount |
|
|||
|
|
|
(in millions) |
|
|||||||||
|
Balance at January 29, 2016 |
|
$ |
14 |
|
|
$ |
(5 |
) |
|
$ |
9 |
|
|
Other comprehensive income before reclassifications |
|
|
(3 |
) |
|
|
1 |
|
|
|
(2 |
) |
|
Amounts reclassified from accumulated other comprehensive loss |
|
|
(8 |
) |
|
|
3 |
|
|
|
(5 |
) |
|
Net other comprehensive income |
|
|
(11 |
) |
|
|
4 |
|
|
|
(7 |
) |
|
Balance at February 3, 2017 |
|
$ |
3 |
|
|
$ |
(1 |
) |
|
$ |
2 |
|
|
|
|
|
|
|
|
|
|
|
|
|
|
|
|
Balance at January 30, 2015 |
|
$ |
8 |
|
|
$ |
(3 |
) |
|
$ |
5 |
|
|
Other comprehensive loss before reclassifications |
|
|
15 |
|
|
|
(6 |
) |
|
|
9 |
|
|
Amounts reclassified from accumulated other comprehensive loss |
|
|
(9 |
) |
|
|
4 |
|
|
|
(5 |
) |
|
Net other comprehensive loss |
|
|
6 |
|
|
|
(2 |
) |
|
|
4 |
|
|
Balance at January 29, 2016 |
|
$ |
14 |
|
|
$ |
(5 |
) |
|
$ |
9 |
|
|
|
|
|
|
|
|
|
|
|
|
|
|
|
|
Balance at January 31, 2014 |
|
$ |
3 |
|
|
$ |
(1 |
) |
|
$ |
2 |
|
|
Other comprehensive loss before reclassifications |
|
|
11 |
|
|
|
(4 |
) |
|
|
7 |
|
|
Amounts reclassified from accumulated other comprehensive loss |
|
|
(6 |
) |
|
|
2 |
|
|
|
(4 |
) |
|
Net other comprehensive loss |
|
|
5 |
|
|
|
(2 |
) |
|
|
3 |
|
|
Balance at January 30, 2015 |
|
$ |
8 |
|
|
$ |
(3 |
) |
|
$ |
5 |
|
|
(a) |
The amount reclassified from accumulated other comprehensive loss is included in interest expense. |
|
(b) |
The amount reclassified from accumulated other comprehensive loss is included in the provision for income taxes. |
The Company occupies most of its facilities under operating leases. Most of the leases require the Company to pay maintenance and operating expenses (such as taxes, insurance and utilities), and also contain renewal options to extend the lease and provisions for periodic rate escalations to reflect inflationary increases. Certain equipment is leased under short-term or cancelable operating leases. Rental expense for facilities and equipment was $65 million, $66 million and $41 million in fiscal 2017, 2016 and 2015, respectively.
Future minimum operating lease commitments at February 3, 2017 are:
|
Fiscal Year Ending |
|
|
|
|
|
|
|
|
|
|
|
(in millions) |
|
|
|
2018 |
|
|
|
|
|
|
|
|
|
|
|
$ |
42 |
|
|
2019 |
|
|
|
|
|
|
|
|
|
|
|
|
36 |
|
|
2020 |
|
|
|
|
|
|
|
|
|
|
|
|
29 |
|
|
2021 |
|
|
|
|
|
|
|
|
|
|
|
|
20 |
|
|
2022 |
|
|
|
|
|
|
|
|
|
|
|
|
16 |
|
|
Thereafter |
|
|
|
|
|
|
|
|
|
|
|
|
2 |
|
|
Total |
|
|
|
|
|
|
|
|
|
|
|
$ |
145 |
|
F-27
SCIENCE APPLICATIONS INTERNATIONAL CORPORATION
NOTES TO CONSOLIDATED FINANCIAL STATEMENTS
Note 13—Business Segment Information:
The Company defines its operating segments based on the way the chief operating decision maker, currently its chief executive officer, manages the operations of the Company for purposes of allocating resources and assessing performance. The Company is organized as a matrix comprised of five customer facing operating segments supported by several service line organizations. The five operating segments are responsible for customer relationships, business development and program management, and delivery and execution, while the service line organizations manage our workforce and the development of our offerings, solutions and capabilities. The company does not track, and does not practicably have the ability to track, revenue or profit by service line. Each of the Company’s five operating segments is focused on providing the Company’s comprehensive technical and enterprise IT service offerings to one or more agencies of the U.S. federal government. The Company’s operating segments are aggregated into one reportable segment because they have similar economic characteristics and meet the other aggregation criteria within the accounting standard on segment reporting, including similarities in the nature of the services provided, methods of service delivery, customers served and the regulatory environment in which they operate.
Substantially all of the Company’s revenues were generated by, and tangible long-lived assets owned by, entities located in the United States. As such, financial information by geographic location is not presented.
In each of fiscal 2017, 2016, and 2015 over 95% of our total revenues were attributable to prime contracts with the U.S. government or to subcontracts with other contractors engaged in work for the U.S. government.
Note 14—Legal Proceedings and Commitments and Contingencies:
Legal Proceedings
The Company is involved in various claims and lawsuits arising in the normal conduct of its business, none of which the Company’s management believes, based on current information, is expected to have a material adverse effect on the Company’s financial position, results of operations or cash flows.
Agreements with Former Parent
Former Parent and the Company executed various agreements to provide mechanisms for an orderly transition and to govern certain ongoing relationships between the companies following the separation. The agreements include a Distribution Agreement, Employee Matters Agreement, Tax Matters Agreement, Master Transition Services Agreement, and Master Transitional Contracting Agreement (MTCA). These agreements generally provide that each party is responsible for its respective assets, liabilities and obligations, including employee benefits, insurance and tax-related assets and liabilities. The MTCA also governs the relationship between former Parent and the Company with regard to the treatment of contracts, proposals, and teaming arrangements where both companies are or will be jointly performing work after separation. Each of former Parent and the Company indemnify the other party for work performed by it under the MTCA.
Contingent losses that were unknown at the time of separation and arise from the operation of the Company’s historical business or the former Parent’s historical corporate losses will be shared between the parties to the extent that losses in any such category exceed $50 million in the aggregate. If they arise and exceed the $50 million threshold, the Company will be responsible for 30% of the former Parent’s incremental contingent losses on corporate claims (and former Parent will be responsible for 70% of the Company’s incremental losses on claims relating to operations that exceed $50 million).
F-28
SCIENCE APPLICATIONS INTERNATIONAL CORPORATION
NOTES TO CONSOLIDATED FINANCIAL STATEMENTS
Government Investigations, Audits and Reviews
The Company is routinely subject to investigations and reviews relating to compliance with various laws and regulations with respect, in particular, to its role as a contractor to federal, state and local government customers and in connection with performing services in countries outside of the United States. U.S. government agencies, including the Defense Contract Audit Agency (DCAA), the Defense Contract Management Agency and others, routinely audit and review a contractor’s performance on government contracts, indirect rates and pricing practices, and compliance with applicable contracting and procurement laws, regulations and standards. They also review the adequacy of the contractor’s compliance with government standards for its business systems. Adverse findings in these investigations, audits, or reviews can lead to criminal, civil or administrative proceedings, and the Company could face disallowance of previously billed costs, penalties, fines, compensatory damages, and suspension or debarment from doing business with governmental agencies. Due to the Company’s reliance on government contracts, adverse findings could also have a material impact on the Company’s business, including its financial position, results of operations and cash flows.
The indirect cost audits by the DCAA of the Company’s business remain open for fiscal 2011 and subsequent years. Although the company has recorded contract revenues subsequent to and including fiscal 2011 based on an estimate of costs that the Company believes will be approved on final audit, the Company does not know the outcome of any ongoing or future audits. If future completed audit adjustments exceed the Company’s reserves for potential adjustments, the Company’s profitability could be materially adversely affected.
The Company has recorded reserves for estimated net amounts to be refunded to customers for potential adjustments for indirect cost audits and compliance with Cost Accounting Standards, which include indemnification obligations owing to former Parent for periods prior to the Distribution Date. As of February 3, 2017, the Company has recorded a total liability of $38 million for estimated net amounts to be refunded to customers for potential adjustments from audits of contract costs, which is presented in other accrued liabilities on the consolidated balance sheets. Any additional amounts which may be determined to be owed for periods prior to the separation will be allocated to former Parent and the Company in proportions determined in accordance with the Distribution Agreement.
Army Brigade Combat Team Modernization Engineering, Manufacturing and Development (BCTM) Program
The BCTM program was terminated for convenience by the Department of Defense (DoD) effective in September 2011. From October 2009 through termination, the Company and its prime contractor performed on this program under an undefinitized change order with a provision that allowed the Company to receive a provisional fixed fee (contract profit) lower than the estimated fixed fee due, pending completion of contract negotiations. The Company recognized revenues of approximately $480 million (including provisional fixed fee) from October 2009 through August 2013 under the undefinitized change order. The Company expects that acceptance of the final contract termination proposal will occur in the second half of fiscal 2018. The Company had an outstanding receivable of approximately $2 million on this contract as of February 3, 2017.
Letters of Credit and Surety Bonds
The Company has outstanding obligations relating to letters of credit of $9 million as of February 3, 2017, principally related to guarantees on insurance policies. The Company also has outstanding obligations relating to surety bonds in the amount of $18 million, principally related to performance and payment bonds on the Company’s contracts. The majority of the surety bonds outstanding were initially obtained by former Parent and the Company is required to satisfy these obligations under the terms of the Distribution Agreement.
F-29
SCIENCE APPLICATIONS INTERNATIONAL CORPORATION
NOTES TO CONSOLIDATED FINANCIAL STATEMENTS
Note 15—Selected Quarterly Financial Data (Unaudited):
Selected unaudited financial data for each quarter of the most recent two fiscal years was:
|
|
|
First Quarter |
|
|
Second Quarter |
|
|
Third Quarter |
|
|
Fourth Quarter |
|
||||
|
|
|
(in millions, except per share amounts) |
|
|||||||||||||
|
Fiscal 2017 |
|
|
|
|
|
|
|
|
|
|
|
|
|
|
|
|
|
Revenues |
|
$ |
1,215 |
|
|
$ |
1,095 |
|
|
$ |
1,114 |
|
|
$ |
1,026 |
|
|
Operating income |
|
|
66 |
|
|
|
70 |
|
|
|
74 |
|
|
$ |
61 |
|
|
Net income |
|
|
33 |
|
|
|
37 |
|
|
|
42 |
|
|
$ |
36 |
|
|
Basic EPS |
|
$ |
0.73 |
|
|
$ |
0.83 |
|
|
$ |
0.95 |
|
|
$ |
0.82 |
|
|
Diluted EPS |
|
$ |
0.71 |
|
|
$ |
0.81 |
|
|
$ |
0.91 |
|
|
$ |
0.79 |
|
|
|
|
|
|
|
|
|
|
|
|
|
|
|
|
|
|
|
|
Fiscal 2016 |
|
|
|
|
|
|
|
|
|
|
|
|
|
|
|
|
|
Revenues |
|
$ |
1,009 |
|
|
$ |
1,099 |
|
|
$ |
1,136 |
|
|
$ |
1,071 |
|
|
Operating income |
|
|
57 |
|
|
|
52 |
|
|
|
64 |
|
|
|
54 |
|
|
Net income |
|
|
33 |
|
|
|
22 |
|
|
|
34 |
|
|
|
28 |
|
|
Basic EPS |
|
$ |
0.72 |
|
|
$ |
0.48 |
|
|
$ |
0.74 |
|
|
$ |
0.61 |
|
|
Diluted EPS |
|
$ |
0.69 |
|
|
$ |
0.46 |
|
|
$ |
0.72 |
|
|
$ |
0.60 |
|
|
Exhibit Number |
|
Description of Exhibit |
|
|
|
|
|
2.1 |
|
Distribution Agreement dated September 25, 2013, between the Company (formerly SAIC Gemini, Inc.) and Leidos Holdings, Inc. (formerly SAIC, Inc.). Incorporated by reference to Exhibit 2.1 to the Company’s Current Report on Form 8-K as filed with the SEC on October 1, 2013. |
|
|
|
|
|
2.2 |
|
Agreement and Plan of Merger by and among SAIC, Caymus Acquisition Corporation, Scitor Holdings, Inc. and Leonard Green & Partners L.P., solely in its capacity as holder representative, dated March 1, 2015. (Pursuant to Item 601(b)(2) of Regulation S-K, the registrant hereby agrees to supplementally furnish to the Securities and Exchange Commission upon request any omitted schedule or exhibit to the Agreement and Plan of Merger.) Incorporated by reference to Exhibit 2.1 to the Company’s Current Report on Form 8-K as filed with the SEC on March 2, 2015. |
|
|
|
|
|
3.1 |
|
Amended and Restated Certificate of Incorporation. Incorporated by reference to Exhibit 3.1 to the Company’s Current Report on Form 8-K as filed with the SEC on October 1, 2013. |
|
|
|
|
|
3.2 |
|
Amended and Restated Bylaws. Incorporated by reference to Exhibit 3.1 to the Company’s Current Report on Form 8-K as filed with the SEC on February 3, 2016. |
|
|
|
|
|
10.1 |
|
First Amendment to the Second Amended & Restated Credit Agreement, dated August 23, 2016 by and among the Company, Citibank N.A. as administrative agent and collateral agent, and certain other lenders and parties thereto. Incorporated by reference to Exhibit 10.1 to the Company’s Current Report on Form 8-K as filed with the SEC on August 25, 2016. |
|
|
|
|
|
10.2 |
|
Second Amended & Restated Credit Agreement, dated May 4, 2015 by and among the Company, Citibank N.A. as administrative agent and collateral agent, and Bank of America, N.A., as a syndication agent, and certain other lenders and parties thereto. Incorporated by reference to Exhibit 10.1 to the Company’s Current Report on Form 8-K as filed with the SEC on May 4, 2015. |
|
|
|
|
|
10.3* |
|
Science Applications International Corporation Stock Compensation Plan, effective September 27, 2013. Incorporated by reference to Exhibit 4.3 to the Company’s Registration Statement on Form S-8 as filed with the SEC on September 27, 2013. |
|
|
|
|
|
10.4* |
|
Science Applications International Corporation Management Stock Compensation Plan, effective September 27, 2013. Incorporated by reference to Exhibit 4.4 to the Company’s Registration Statement on Form S-8 as filed with the SEC on September 27, 2013. |
|
|
|
|
|
10.5* |
|
Science Applications International Corporation Key Executive Stock Deferral Plan, effective September 27, 2013. Incorporated by reference to Exhibit 4.5 to the Company’s Registration Statement on Form S-8 as filed with the SEC on September 27, 2013. |
|
|
|
|
|
10.6* |
|
Keystaff Deferral Plan, effective September 27, 2013. Incorporated by reference to Exhibit 4.6 to the Company’s Registration Statement on Form S-8 as filed with the SEC on September 27, 2013. |
|
|
|
|
|
10.7* |
|
Science Applications International Corporation 2013 Employee Stock Purchase Plan, effective October 1, 2013. Incorporated by reference to Exhibit 4.7 to the Company’s Registration Statement on Form S-8 as filed with the SEC on September 27, 2013. |
|
|
|
|
|
10.8* |
|
Science Applications International Corporation 401(k) Excess Deferral Plan, effective September 27, 2013. Incorporated by reference to Exhibit 4.8 to the Company’s Registration Statement on Form S-8 as filed with the SEC on September 27, 2013. |
|
|
|
|
F-30
SCIENCE APPLICATIONS INTERNATIONAL CORPORATION
EXHIBIT INDEX
|
Exhibit Number |
|
Description of Exhibit |
|
|
Science Applications International Corporation Retirement Plan, effective September 27, 2013. Incorporated by reference to Exhibit 4.9 to the Company’s Registration Statement on Form S-8 as filed with the SEC on September 27, 2013. |
|
|
|
|
|
|
10.10* |
|
Science Applications International Corporation Amended and Restated 2013 Equity Incentive Plan, effective June 4, 2014. Incorporated by reference to Appendix A to the Company’s Definitive Proxy Statement on Schedule 14A as filed with the SEC on April 24, 2014. |
|
|
|
|
|
10.11* |
|
Form of Restricted Stock Unit Award Agreement (Management) of the Science Applications International Corporation 2013 Equity Incentive Plan. Incorporated by reference to Exhibit 10.2 to the Company’s Quarterly Report on Form 10-Q as filed with the SEC on December 13, 2013. |
|
|
|
|
|
10.12* |
|
Form of Restricted Stock Unit Award Agreement (3 Year Cliff Vesting) of the Science Applications International Corporation 2013 Equity Incentive Plan. Incorporated by reference to Exhibit 10.3 to the Company’s Quarterly Report on Form 10-Q as filed with the SEC on December 13, 2013. |
|
|
|
|
|
10.13* |
|
Form of Restricted Stock Unit Award Agreement of the Science Applications International Corporation 2013 Equity Incentive Plan. Incorporated by reference to Exhibit 10.12 to the Company’s Annual Report on Form 10-K as filed with the SEC on April 9, 2014. |
|
|
|
|
|
10.14* |
|
Form of Nonstatutory Stock Option Agreement (3 Year Cliff Vesting) of the Science Applications International Corporation 2013 Equity Incentive Plan. Incorporated by reference to Exhibit 10.4 to the Company’s Quarterly Report on Form 10-Q as filed with the SEC on December 13, 2013. |
|
|
|
|
|
10.15* |
|
Form of Nonstatutory Stock Option Agreement of the Science Applications International Corporation 2013 Equity Incentive Plan. Incorporated by reference to Exhibit 10.14 to the Company’s Annual Report on Form 10-K as filed with the SEC on April 9, 2014. |
|
|
|
|
|
10.16* |
|
Form of Performance Share Award Agreement of the Science Applications International Corporation 2013 Equity Incentive Plan. Incorporated by reference to Exhibit 10.15 to the Company’s Annual Report on Form 10-K as filed with the SEC on April 9, 2014. |
|
|
|
|
|
10.17* |
|
Agreement and general release dated as of January 19, 2017, by and between Science Applications International Corporation and Kimberly Admire. Incorporated by reference to Exhibit 10.1 to the Company’s Current Report on Form 8-K as filed with the SEC on January 20, 2017. |
|
|
|
|
|
10.18* |
|
Settlement agreement and general release, dated as of June 8, 2016, by and between Science Applications International Corporation and John R. Hartley. Incorporated by reference to Exhibit 10.1 to the Company’s Quarterly Report on Form 10-Q as filed with the SEC on June 13, 2016. |
|
|
|
|
|
10.19* |
|
Deferred Compensation Plan, effective January 1, 2015. Incorporated by reference to Exhibit 10.17 of the Company’s Annual Report on Form 10-K as filed with the SEC on March 31, 2015. |
|
|
|
|
|
10.20* |
|
SAIC Executive Severance and Change of Control Policy, effective August 1, 2015. Incorporated by reference to Exhibit 10.18 to the Company’s Annual Report on Form 10-K as filed with the SEC on March 29, 2016. |
|
|
|
|
|
10.21 |
|
Master Transition Services Agreement dated September 25, 2013, between the Company (formerly SAIC Gemini, Inc.) and Leidos Holdings, Inc. (formerly SAIC, Inc.). Incorporated by reference to Exhibit 10.3 to the Company’s Current Report on Form 8-K as filed with the SEC on October 1, 2013. |
|
|
|
|
SCIENCE APPLICATIONS INTERNATIONAL CORPORATION
EXHIBIT INDEX
|
Exhibit Number |
|
Description of Exhibit |
|
|
Tax Matters Agreement dated September 25, 2013, between the Company (formerly SAIC Gemini, Inc.) and Leidos Holdings, Inc. (formerly SAIC, Inc.). Incorporated by reference to Exhibit 10.2 to the Company’s Current Report on Form 8-K as filed with the SEC on October 1, 2013. |
|
|
|
|
|
|
10.23 |
|
Employee Matters Agreement dated September 25, 2013, between the Company (formerly SAIC Gemini, Inc.) and Leidos Holdings, Inc. (formerly SAIC, Inc.). Incorporated by reference to Exhibit 10.1 to the Company’s Current Report on Form 8-K as filed with the SEC on October 1, 2013. |
|
|
|
|
|
10.24 |
|
Master Transitional Contracting Agreement between the Company (formerly SAIC Gemini, Inc.) and Leidos Holdings, Inc. (formerly SAIC, Inc.) dated September 25, 2013. Incorporated by reference to Exhibit 10.1 to the Company’s Quarterly Report on Form 10-Q as filed with the SEC on December 13, 2013. |
|
|
|
|
|
10.25 |
|
Administrative Agreement, dated August 21, 2012, between Leidos, Inc. (formerly Science Applications International Corporation) and the United States Army on behalf of the U.S. Government. Incorporated by reference to Exhibit 10.14 of Amendment No. 3 to the Company’s Registration Statement on Form 10 as filed with the SEC on August 20, 2013. |
|
|
|
|
|
10.26 |
|
Deferred Prosecution Agreement, effective March 14, 2012, between Leidos, Inc. (formerly Science Applications International Corporation) and the U.S. Attorney’s Office for the Southern District of New York. Incorporated by reference to Exhibit 10.1 to the Current Report on Form 8-K as filed by Leidos, Inc. as filed with the SEC on March 14, 2012. |
|
|
|
|
|
21 |
|
Subsidiaries of Registrant. |
|
|
|
|
|
23 |
|
Consent of Independent Registered Public Accounting Firm. |
|
|
|
|
|
31.1 |
|
Certification of Chief Executive Officer pursuant to Section 302 of the Sarbanes-Oxley Act of 2002. |
|
|
|
|
|
31.2 |
|
Certification of Chief Financial Officer pursuant to Section 302 of the Sarbanes-Oxley Act of 2002. |
|
|
|
|
|
32.1 |
|
Certification of Chief Executive Officer pursuant to 18 U.S.C. Section 1350, as adopted pursuant to Section 906 of the Sarbanes-Oxley Act of 2002. |
|
|
|
|
|
32.2 |
|
Certification of Chief Financial Officer pursuant to 18 U.S.C. Section 1350, as adopted pursuant to Section 906 of the Sarbanes-Oxley Act of 2002. |
|
|
|
|
|
101 |
|
Interactive Data File. |
|
|
|
|
|
* |
Executive Compensation Plans and Arrangements |