Attached files
| file | filename |
|---|---|
| EX-32.2 - EXHIBIT 32.2 - Ollie's Bargain Outlet Holdings, Inc. | h10042467x1_ex32-2.htm |
| EX-32.1 - EXHIBIT 32.1 - Ollie's Bargain Outlet Holdings, Inc. | h10042467x1_ex32-1.htm |
| EX-31.2 - EXHIBIT 31.2 - Ollie's Bargain Outlet Holdings, Inc. | h10042467x1_ex31-2.htm |
| EX-31.1 - EXHIBIT 31.1 - Ollie's Bargain Outlet Holdings, Inc. | h10042467x1_ex31-1.htm |
| EX-23.1 - EXHIBIT 23.1 - Ollie's Bargain Outlet Holdings, Inc. | h10042467x1_ex23-1.htm |
| EX-21.1 - EXHIBIT 21.1 - Ollie's Bargain Outlet Holdings, Inc. | h10042467x1_ex21-1.htm |
UNITED STATES
SECURITIES AND EXCHANGE COMMISSION
Washington, D.C. 20549
FORM 10-K
|
(Mark One)
|
|
|
☒
|
ANNUAL REPORT PURSUANT TO SECTION 13 OR 15(d) OF THE SECURITIES EXCHANGE ACT OF 1934
|
|
|
|
|
For the fiscal year ended January 28, 2017
|
|
|
|
|
|
o
|
TRANSITION REPORT PURSUANT TO SECTION 13 OR 15(d) OF THE SECURITIES EXCHANGE ACT OF 1934
|
|
|
|
|
For the transition period from to
|
|
Commission file number: 001-37501
OLLIE’S BARGAIN OUTLET HOLDINGS, INC.
(Exact name of registrant as specified in its charter)
|
Delaware
|
80-0848819
|
|
(State or other jurisdiction of incorporation or organization)
|
(I.R.S. Employer Identification No.)
|
|
|
|
|
6295 Allentown Boulevard
Suite 1. Harrisburg, Pennsylvania |
17112
|
|
(Address of principal executive offices)
|
(Zip Code)
|
(717) 657-2300
(Registrant's telephone number, including area code)
Securities registered pursuant to Section 12(b) of the Act:
|
Title of each class
|
Name of each exchange on which registered
|
|
Common Stock, $0.001 par value
|
The NASDAQ Stock Market LLC
|
Securities registered pursuant to Section 12(g) of the Act: None
Indicate by check mark if the registrant is a well-known seasoned issuer, as defined in Rule 405 of the Securities Act. Yes ☒ No o
Indicate by check mark if the registrant is not required to file reports pursuant to Section 13 or Section 15(d) of the Act. Yes o No ☒
Indicate by check mark whether the registrant (1) has filed all reports required to be filed by Section 13 or 15(d) of the Securities Exchange Act of 1934 during the preceding 12 months (or for such shorter period that the registrant was required to file such reports), and (2) has been subject to such filing requirements for the past 90 days. Yes ☒ No o
Indicate by check mark whether the registrant has submitted electronically and posted on its corporate Web site, if any, every Interactive Data File required to be submitted and posted pursuant to Rule 405 of Regulation S-T (§232.405 of this chapter) during the preceding 12 months (or for such shorter period that the registrant was required to submit and post such files). Yes ☒ No o
Indicate by check mark if disclosure of delinquent filers in response to Item 405 of Regulation S-K (§229.405 of this chapter) is not contained herein, and will not be contained, to the best of registrant's knowledge, in definitive proxy or information statements incorporated by reference in Part III of this Form 10-K or any amendment to this Form 10-K ☒
Indicate by check mark whether the registrant is a large accelerated filer, an accelerated filer, a non-accelerated filer, or a smaller reporting company. See the definitions of “large accelerated filer,” “accelerated filer” and “smaller reporting company” in Rule 12b-2 of the Exchange Act.
|
Large accelerated filer ☒
|
Accelerated filer o
|
Non-accelerated filer o
(Do not check if a smaller reporting company) |
Smaller reporting company o
|
Indicate by check mark whether the registrant is a shell company (as defined in Rule 12b-2 of the Act). Yes o No ☒
The aggregate market value of the voting stock held by non-affiliates of the registrant was approximately $884.0 million as of July 30, 2016, the last business day of the registrant’s most recently completed second fiscal quarter. For purposes of this calculation only, the registrant has excluded all shares held in the treasury or that may be deemed to be beneficially owned by executive officers and directors of the registrant. By doing so, the registrant does not concede that such persons are affiliates for purposes of the federal securities laws.
The number of issued and outstanding shares of the registrant's common stock, $.001 par value, as of March 27, 2017 was 60,882,015.
DOCUMENTS INCORPORATED BY REFERENCE
Portions of the Registrant's Proxy Statement for the 2017 Annual Meeting of Stockholders, to be filed pursuant to Regulation 14A within 120 days after the end of the 2016 fiscal year, are incorporated by reference into Part III of this Form 10-K.
Cautionary note regarding forward-looking statements
This Annual Report on Form 10-K contains forward-looking statements within the meaning of the U.S. Private Securities Litigation Reform Act. Forward-looking statements can be identified by words such as “could,” “may,” “might,” “will,” “likely,” “anticipates,” “intends,” “plans,” “seeks,” “believes,” “estimates,” “expects,” “continues,” “projects” and similar references to future periods, or by the inclusion of forecasts or projections, the outlook for the Company’s future business, prospects, financial performance, industry outlook, 2017 business outlook and financial guidance. Examples of forward-looking statements include, but are not limited to, statements we make regarding the outlook for our future business and financial performance, such as those contained in “Item 7, Management’s Discussion and Analysis of Financial Condition and Results of Operations,” included elsewhere in this Annual Report on Form 10-K.
Forward-looking statements are based on our current expectations and assumptions regarding our business, the economy and other future conditions. Because forward-looking statements relate to the future, by their nature, they are subject to inherent uncertainties, risks and changes in circumstances that are difficult to predict. As a result, our actual results may differ materially from those contemplated by the forward-looking statements. Important factors that could cause actual results to differ materially from those in the forward-looking statements include regional, national or global political, economic, business, competitive, market and regulatory conditions and the following:
| • | our failure to adequately procure and manage our inventory or anticipate consumer demand; |
| • | changes in consumer confidence and spending; |
| • | risks associated with intense competition; |
| • | our failure to open new profitable stores, or successfully enter new markets, on a timely basis or at all; |
| • | our ability to manage our inventory balances; |
| • | our failure to hire and retain key personnel and other qualified personnel; |
| • | our inability to obtain favorable lease terms for our properties; |
| • | the loss of, or disruption in the operations of, our centralized distribution centers; |
| • | fluctuations in comparable store sales and results of operations, including on a quarterly basis; |
| • | risks associated with our lack of operations in the growing online retail marketplace; |
| • | our inability to successfully implement our marketing, advertising and promotional efforts; |
| • | the seasonal nature of our business; |
| • | the risks associated with doing business with international manufacturers; |
| • | changes in government regulations, procedures and requirements; and |
| • | our ability to service our indebtedness and to comply with our financial covenants. |
See “Item 1A, Risk Factors” for a further description of these and other factors. For the reasons described above, we caution you against relying on any forward-looking statements, which should also be read in conjunction with the other cautionary statements that are included elsewhere in this Annual Report on Form 10-K. Any forward-looking statement made by us in this annual report speaks only as of the date on which we make it. Factors or events that could cause our actual results to differ may emerge from time to time, and it is not possible for us to predict all of them. We undertake no obligation to publicly update or revise any forward-looking statement, whether as a result of new information, future developments or otherwise, except as may be required by law.
PART I
| Item 1. | Business. |
Our company
Ollie’s Bargain Outlet Holdings, Inc. is a highly differentiated and fast-growing, extreme value retailer of brand name merchandise at drastically reduced prices. In this report, the terms “Ollie’s,” “the Company,” “we,” “us” or “our” mean Ollie’s Bargain Outlet Holdings, Inc. and its wholly-owned subsidiaries, unless the context indicates otherwise. Known for our assortment of “Good Stuff Cheap,” we offer customers a broad selection of brand name products, including food, housewares, books and stationery, bed and bath, floor coverings, electronics and toys. Our differentiated go-to market strategy is characterized by a unique, fun and engaging treasure hunt shopping experience, compelling customer value proposition and witty, humorous in-store signage and advertising campaigns. These attributes have driven our rapid growth and strong and consistent store performance.
Mark Butler, our Chairman, President and Chief Executive Officer, co-founded Ollie’s in 1982, based on the idea that “everyone in America loves a bargain.” Since opening our first store in Mechanicsburg, PA, we have expanded throughout the Eastern half of the United States. From the time Mr. Butler assumed his current position as President and Chief Executive Officer in 2003, we have grown from operating 28 stores in three states to 234 stores in 19 states as of January 28, 2017. Our no-frills, “semi-lovely” warehouse style stores average approximately 33,000 square feet and generate consistently strong financial returns across all vintages, geographic regions, population densities, demographic groups, real estate formats and regardless of any co-tenant. Our business model has resulted in positive financial performance during strong and weak economic cycles. We believe there is opportunity for more than 950 Ollie’s locations across the United States based on internal estimates and third party research conducted by Jeff Green Partners, a retail real estate feasibility consultant that provides market analysis and strategic planning and consulting services.
Our constantly changing merchandise assortment is procured by a highly experienced merchant team, who leverage deep, long-standing relationships with hundreds of major manufacturers, wholesalers, distributors, brokers and retailers. These relationships enable our merchant team to find and select only the best buys from a broad range of brand name and closeout product offerings and to pass drastically reduced prices along to our customers. As we grow, we believe our increased scale will provide us with even greater access to brand name products because many large manufacturers favor large buyers capable of acquiring an entire deal. Our merchant team augments these deals with directly sourced products including Ollie’s own private label brands and other products exclusive to Ollie’s.
Our business model has produced consistently strong growth and financial performance. From fiscal year 2012 to the fiscal year ended January 28, 2017 (“fiscal year 2016”) (except as noted):
| • | Our store base expanded from 131 stores to 234 stores, a compound annual growth rate, or CAGR, of 15.7% and we entered seven new states. |
| • | Comparable store sales grew at an average rate of 3.5% per year. |
| • | Net sales increased from $476.5 million to $890.3 million, a CAGR of 17.0%. |
| • | Net income increased from $13.0 million to $59.8 million. |
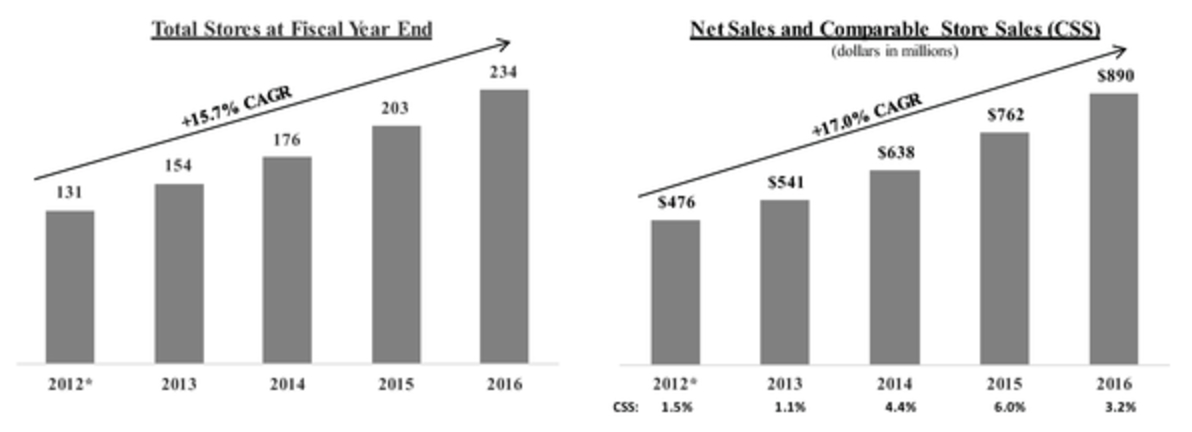
| * | Represents successor period 2012 and predecessor period 2012, as adjusted to eliminate the impact of the four-week period ended January 28, 2012 and to reflect a 53-week period. See “Item 6 - Selected Consolidated Financial Data.” |
1
Our competitive strengths
We believe the following strengths differentiate us from our competitors and serve as the foundation for our current and future growth:
“Good Stuff Cheap”—Ever changing product assortment at drastically reduced prices. Our stores offer something for everyone across a diverse range of merchandise categories at prices up to 70% below department and fancy stores and up to 20-50% below mass market retailers. Our product assortment frequently changes based on the wide variety of deals available from the hundreds of brand name suppliers we have relationships with. We augment these opportunistic deals on brand name merchandise with directly sourced unbranded products or those under our own private label brands such as Sarasota Breeze, Steelton Tools and American Way and exclusively licensed recognizable brands and celebrity names such as Magnavox, Marcus Samuelsson Signature Cookware and Kasey Kahne Car Care. Brand name and closeout merchandise represented approximately 70% and non-closeout goods and private label products collectively represented approximately 30% of our fiscal year 2016 merchandise purchases. Our treasure hunt shopping environment and slogan “when it’s gone, it’s gone” help to instill a “shop now” sense of urgency that encourages frequent customer visits.
Highly experienced and disciplined merchant team. Our 16-member merchant team maintains strong, long-standing relationships with a diverse group of suppliers, allowing us to procure branded merchandise at compelling values for our customers. This team is led by five senior merchants, including Mark Butler, and has over 112 years of combined industry experience and 95 combined years of experience at Ollie’s. We have been doing business with our top 15 suppliers for an average of 13 years, and no supplier accounted for more than 6.0% of our purchases during fiscal year 2016. Our well-established relationships with our suppliers together with our scale, buying power, financial credibility and responsiveness often makes Ollie’s the first call for available deals. Our direct relationships with our suppliers have increased as we have grown and we continuously strive to broaden our supplier network. These factors provide us with increased access to goods, which enables us to be more selective in our deal-making and which we believe helps us provide compelling value and assortment of goods to our customers and fuels our continued profitable growth.
Distinctive brand and engaging shopping experience. Our distinctive and often self-deprecating humor and highly recognizable caricatures are used in our stores, flyers, mailers, website and email campaigns. We attempt to make our customers laugh as we poke fun at ourselves and current events. We believe this approach creates a strong connection to our brand and sets us apart from other, more traditional retailers. Our “semi-lovely” stores feature these same brand attributes together with witty signage in a warehouse format that create a fun, relaxed and engaging shopping environment. We believe that by disarming our customers by getting them to giggle a bit, they are more likely to look at and trust our products for what they are—extremely great bargains. We offer a “30-day no hard time guarantee” as a means to overcome any skepticism associated with our cheap prices and to build trust and loyalty, because if our customers are not happy, we are not happy. We welcome customers to bring back their merchandise within that timeframe for a “no hard time” full refund. We also make it easy for our customers to browse our stores by displaying our products on easily accessible fixtures and by keeping the stores clean and well-lit. We believe our humorous brand image, compelling values and welcoming stores resonate with our customers and define Ollie’s as a unique and comfortable destination shopping location.
Extremely loyal “Ollie’s Army” customer base. Our best customers are members of our Ollie’s Army customer loyalty program, which stands at 7.3 million members as of January 28, 2017. For fiscal year 2016, over 65% of our sales were from Ollie’s Army members, and we have grown our base of loyal members by 31.2% in fiscal year 2016. Ollie’s Army members spend approximately 40% more per shopping trip at Ollie’s and typically shop more frequently than non-members. We identify our target customer as “anyone between the ages of 25-70 with a wallet or a purse” seeking a great bargain.
Strong and consistent store model built for growth. We employ a proven new store model that generates strong cash flow, consistent financial results and attractive returns on investment regardless of the economic environment. Our highly flexible real estate approach has proven successful across all vintages, geographic regions, population densities, demographic groups, real estate formats and regardless of any co-tenant. New stores opened from fiscal year 2011 to fiscal year 2015 have generated an average of $4.0 million in net sales in their first 12 months of operations and produced an average payback period of approximately two years. We believe that our consistent store performance and disciplined approach to site selection support the portability and predictability of our new unit growth strategy.
2
Highly experienced and passionate founder-led management team. Our leadership team, directed by our co-founder, Chairman, President and Chief Executive Officer, Mark Butler, has guided our organization through its expansion and positioned us for continued growth. Mark Butler has assembled a talented and dedicated team of executives with an average of 24 years of retail experience, including an average 12 years of experience at Ollie’s. Our senior executives possess extensive experience across a broad range of disciplines, including merchandising, marketing, real estate, finance, store operations, supply chain management and information technology. We believe by encouraging equity ownership and fostering a strong team culture, we have aligned the interests of our employees with those of our stockholders. We believe these factors result in a cohesive team focused on sustainable long-term growth.
Our growth strategy
We plan to continue to drive growth in sales and profitability by executing on the following strategies:
Grow our store base. We believe our compelling value proposition and the success of our stores across a broad range of geographic regions, population densities and demographic groups creates a significant opportunity to profitably increase our store count. Our internal estimates and third party research conducted by Jeff Green Partners indicate the potential for more than 950 national locations. Our new store real estate model is flexible and focuses predominately on second generation sites ranging in size from 25,000 to 35,000 square feet. We believe there is an ample supply of suitable low-cost, second generation real estate to allow us to infill within our existing markets as well as to expand into new, contiguous geographies. This approach leverages our distribution infrastructure, field management team, store management, marketing investments and brand awareness. We expect our new store openings to be the primary driver of our continued, consistent growth in sales and profitability.
Increase our offerings of great bargains. We will continue to enhance our supplier relationships and develop additional sources to acquire brand name and closeout products for our customers. Our strong sourcing relationships with leading major manufacturers and our purchasing scale provide us with significant opportunities to expand our ever changing assortment of brand name and closeout merchandise at extreme values. We plan to further invest in our merchandising team in order to expand and enhance our sourcing relationships and product categories, which we expect will drive shopping frequency and increase customer spending.
Leverage and expand Ollie’s Army. We intend to recruit new Ollie’s Army members and increase their frequency of store visits and spending by enhancing our distinctive, fun and recognizable marketing programs, building brand awareness, rewarding member loyalty and utilizing more sophisticated data driven targeted marketing. We believe these strategies, coupled with a larger store base, will enable us to increase the amount of sales driven by loyal Ollie’s Army customers seeking the next great deal.
Segments
We operate in one reporting segment. See Note 12, “Segment Reporting.”
Our merchandise
Strategy
We offer a highly differentiated, constantly evolving assortment of brand name merchandise across a broad range of categories at drastically reduced prices. Our ever changing assortment of “Good Stuff Cheap” includes brand name and closeout merchandise from leading manufacturers. We augment our brand name merchandise with opportunistic purchases of unbranded goods and our own domestic and direct-import private label brands in underpenetrated categories to further enhance the assortment of products that we offer. Brand name and closeout merchandise represented approximately 70% and non-closeout goods and private label products collectively represented approximately 30% of our fiscal year 2016 merchandise purchases. We believe our compelling value proposition and the unique nature of our merchandise offerings have fostered our customer appeal across a variety of demographics and socioeconomic profiles.
Our warehouse format stores feature a broad number of categories including food, housewares, books and stationery, bed and bath, floor coverings, electronics and toys as well as other products including hardware, personal health care, candy, clothing, sporting goods, pet and lawn and garden products. We focus on buying cheap to sell cheap and source products as unique buying opportunities present themselves. Our merchandise mix is designed to combine unique and
3
brand name bargains at extremely attractive price points. This approach results in frequently changing product assortments and localized offerings which encourage shopper frequency and a “shop now” sense of urgency as customers hunt to discover the next deal.
The common element of our dynamic merchandise selection is the consistent delivery of great deals to our customers, with products offered at prices up to 70% below department stores and fancy stores and up to 20-50% below mass market retailers. Our product price tags allow customers to compare our competitor’s price against Ollie’s price to further highlight the savings they can realize by shopping at our stores.
Product mix
Examples of our product offerings include:
| • | Housewares: cooking utensils, dishes, appliances, plastic containers, cutlery, storage and garbage bags, detergents and cleaning supplies, cookware and glassware, fans and space heaters, candles, frames and giftware; |
| • | Food: packaged food including coffee, bottled non-carbonated beverages, salty snacks, condiments, sauces, spices, dry pasta, canned goods, cereal and cookies; |
| • | Books and stationery: novels, children’s, how-to, business, cooking, inspirational and coffee table books along with DVDs, greeting cards and various office supplies and party goods; |
| • | Bed and bath: household goods including bedding, towels, curtains and associated hardware; |
| • | Floor coverings: laminate flooring, commercial and residential carpeting, area rugs and floor mats; |
| • | Electronics: air conditioners, home electronics, cellular accessories and as seen on TV; |
| • | Toys: dolls, action figures, puzzles, educational toys, board games and other related items; and |
| • | Other: hardware, personal health care, candy, clothing, sporting goods, pet products, luggage, automotive, seasonal, furniture, summer furniture and lawn & garden. |
The following chart shows the breakdown of our fiscal year 2016 net sales by merchandise category:
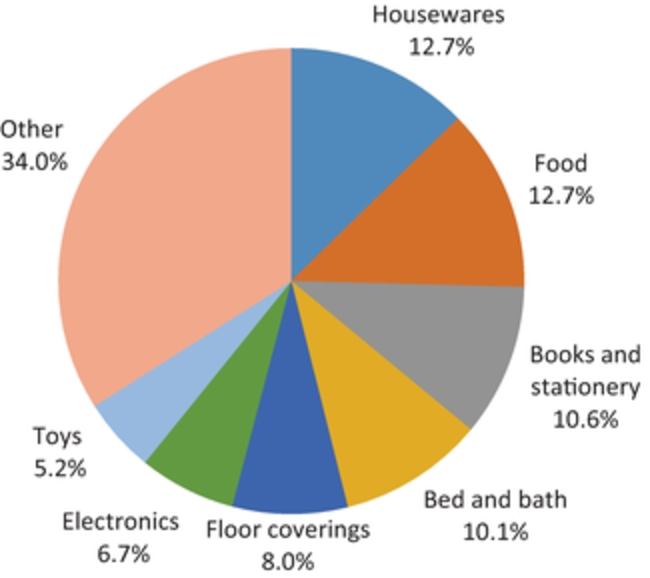
4
Product categories
We maintain consistent average margins across our primary product categories described below.
Brand name and closeout merchandise (approximately 70% of merchandise purchases in fiscal year 2016)
Our focus is to provide huge savings to our customers primarily through brand name products across a broad range of merchandise. Our experienced merchant team purchases deeply discounted, branded or closeout merchandise primarily from manufacturers, retailers, distributors and brokers. This merchandise includes overstocks, discontinued merchandise, package changes, cancelled orders, excess inventory and buybacks from retailers and major manufacturers.
Non-closeout goods/private label (approximately 30% of merchandise purchases in fiscal year 2016)
We augment the breadth of our brand name merchandise with non-closeout and private label merchandise. In categories where the consumer is not as brand conscious, such as food, home textiles, and furniture, or when we may not be offering a current brand name merchandise deal, we will buy deeply discounted unbranded merchandise. These extreme value offerings are mixed in the stores with our brand name merchandise. We also have a variety of domestic and direct-import private label merchandise and exclusive products sold under brands such as Sarasota Breeze, Steelton Tools and American Way. These high quality products are developed in key categories such as housewares, are designed to create brand-like excitement and complement our brand name merchandise. We also have licenses for private label products that use recognizable celebrity names like Marcus Samuelsson, Josh Capon and Kasey Kahne, or brand names like Country Living, Magnavox, Popular Mechanics and Wells Lamont. We routinely evaluate the quality and condition of these private label goods to ensure that we are delivering our customer a high quality product at a great price.
Merchandise procurement and distribution
Our disciplined buying strategy and strict adherence to purchasing margins support our merchandising strategy of buying cheap to sell cheap.
Merchandising team
Our 16-member merchant team maintains strong, long-standing relationships with a diverse group of suppliers, allowing us to procure branded merchandise at compelling values for our customers. This team is led by five senior merchants, including Mark Butler, and has over 112 years of combined industry experience and 95 combined years of experience at Ollie’s. Our merchants specialize by department in order to build category expertise, in-depth knowledge and sourcing relationships. We believe our buying approach coupled with long-standing and newly formed relationships enable us to find the best deals from major manufacturers and pass drastically reduced prices along to our customers. We plan to further invest in and grow our merchandising team in order to expand and enhance our sourcing relationships and product categories, which we expect will drive shopping frequency and increase customer spending.
Merchandise procurement
We believe that our strong sourcing capabilities are the result of our tenured merchant team’s ability to leverage deep, long-standing relationships with hundreds of manufacturers, wholesalers, brokers, retailers and other suppliers. Our merchants maintain direct relationships with brand manufacturers, regularly attend major tradeshows and travel the world to source extreme value offerings across a broad assortment of product categories. We are an ideal partner to major manufacturers because our merchants are experienced and empowered to make quick decisions. Each opportunity is unique and our merchants negotiate directly with the supplier to lock in a particular deal. Our ability to select the most attractive opportunistic purchases from a growing number of available deals enables us to provide a wide assortment of goods to our customers at great deals.
We source from over 1,000 suppliers, and no supplier accounted for more than 6% of our purchases during fiscal year 2016. Our dedication to building strong relationships with suppliers is evidenced by a 13-year average relationship with our top 15 suppliers. As we grow, we believe our increased scale will provide us with even greater access to brand name products since many major manufacturers seek a single buyer to acquire the entire deal.
5
Distribution and logistics
We have made significant investments to support our store growth plan. In April 2014, we opened our second distribution center, located in Commerce, GA, to support our store operations and expansion plans in the Southeast. We distribute over 90% of our merchandise from our two distribution centers. Our York, PA distribution center is 603,000 square feet and our Commerce, GA distribution center is currently 699,840 square feet and will increase to 962,280 square feet by November 2017. In order to minimize the amount of time our retail stores devote to inventory management, all of our merchandise is seeded with price tickets and labeled with a bar code for shipping.
Our stores generally receive shipments from our distribution centers two to three times a week, depending on the season and specific store size and sales volume. We utilize independent third party freight carriers and, on average, load and ship between 50 and 60 trucks per day. We believe our existing distribution capabilities will support our anticipated store growth of between 375 to 400 stores over the next several years.
Our stores
As of January 28, 2017, we operated 234 stores averaging approximately 33,000 square feet across 19 contiguous states in the Eastern half of the United States. Our highly flexible real estate approach has proven successful across all vintages, geographic regions, population densities, demographic groups, real estate formats and regardless of any co-tenant. Our business model has resulted in positive financial performance during strong and weak economic cycles. We have successfully opened stores in six new states since fiscal year 2012, highlighting the portability of our new store model. The following map shows the number of stores in each of the states in which we operated as of January 28, 2017:

Store design and layout
All of our warehouse format stores incorporate the same philosophy: no-frills, bright, “semi-lovely” stores and a fun, treasure hunt shopping experience. We present our stores as “semi-lovely” to differentiate our stores from other traditional retailers, and to minimize operating and build-out costs. Our stores also welcome our customers with vibrant and colorful caricatures together with witty signage. We attempt to make our customers laugh as we poke fun at ourselves and current events. We believe that by disarming our customers by getting them to giggle a bit, they are able to look at and trust our products for what they are—extremely great bargains.
We believe the store layout and merchandising strategy helps to instill a “shop now” sense of urgency and increase frequency of customer visits as customers never know what they might come across in our stores. We make it easy for our customers to browse our stores by displaying our frequently changing assortment of products on rolling tables, pallets and other display fixtures. Our store team leaders are responsible for maintaining our treasure hunt shopping
6
experience, keeping the stores clean and well-lit and ensuring our customers are engaged. We believe our humorous brand image, compelling values and welcoming stores resonate with our customers and define Ollie’s as a unique and comfortable destination shopping location.
Expansion opportunities and site selection
We believe we can profitably expand our store count on a national scale to more than 950 locations based on internal estimates and third party research conducted by Jeff Green Partners. We plan to continue to expand into attractive markets in the Southeastern United States. Our disciplined real estate strategy focuses on infilling existing geographies as well as expanding into contiguous markets in order to leverage our distribution infrastructure, field management team, store management, marketing investments and brand awareness.
We maintain a pipeline of real estate sites that have been approved by our real estate committee. Our recent store growth is summarized in the following table:
Fiscal year |
|||||||||
2016 |
2015 |
2014 |
|||||||
Stores open at beginning of period |
203 | 176 | 154 | ||||||
Stores opened |
31 | 28 | 22 | ||||||
Stores closed |
— | (1 | ) |
— | |||||
Stores open at end of period |
234 | 203 | 176 | ||||||
We utilize a rigorous site selection and real estate approval process in order to leverage our infrastructure, marketing investments and brand awareness. Members of our real estate team spend considerable time evaluating prospective sites before bringing a new lease proposal to our real estate committee, which is composed of senior management and executive officers. Our flexible store layout allows us to quickly take over a variety of low-cost, second generation sites including former big box retail and grocery stores.
We believe there is an ample supply of suitable low-cost, second generation real estate allowing us to infill within our existing markets as well as to expand into new, contiguous geographies. By focusing on key characteristics such as proximity to the nearest Ollie’s store, ability to leverage distribution infrastructure, visibility, traffic counts, population densities of at least 50,000 people within ten miles and low rent per square foot, we have developed a new store real estate model that has consistently delivered attractive returns on invested capital.
Our strong unit growth is supported by our predictable and compelling new store model. We target a store size between 25,000 to 35,000 square feet and an average initial cash investment of approximately $1.0 million, which includes store fixtures and equipment, store-level and distribution center inventory (net of payables) and pre-opening expenses. With our relatively low investment costs and strong new store opening performance, we target new store sales of $3.7 million. New stores opened from fiscal year 2011 to fiscal year 2015 have generated an average of $4.0 million in net sales in their first full year of operations and produced an average payback period of approximately two years. We believe that our consistent store performance, corporate infrastructure, including our recently opened second distribution center, and disciplined approach to site selection support the portability and predictability of our new unit growth strategy.
Store-level management and training
Our Senior Vice President of Store Operations oversees all store activities. Our stores are grouped into three regions, divided generally along geographic lines. We employ three regional directors, who have responsibility for the day to day operations of the stores in their region. Reporting to the regional directors are 23 district team leaders who each manage a group of stores in their markets. At the store level, the leadership team consists of a store team leader (manager), co-team leader (first level assistant manager) and assistant team leader (second level assistant manager). Supervisors oversee specific areas within each store.
Each store team leader is responsible for the daily operations of the store, including the processing of merchandise to the sales floor and the presentation of goods throughout the store. Store team leaders are trained to maintain a clean and appealing store environment for our customers. Store team leaders and co-team leaders are also responsible for the hiring, training and development of associates. While each store’s sales volume is reviewed to determine the optimal store-level staffing requirements, our typical store employs 16 to 30 associates. Part-time associates generally comprise approximately 60% of the associates in a typical store, with approximately 40% being full-time associates.
7
We work tirelessly to hire talented people, to improve our ability to assess talent during the interview process and to regularly train those individuals at Ollie’s who are responsible for interviewing candidates. We also devote substantial resources to training our new managers through our Team Leader Training Program. This program operates at designated training stores located across our footprint. It provides an in-depth review of our operations, including merchandising, policies and procedures, asset protection and safety, and human resources. Part-time associates receive structured training as part of their onboarding throughout their first five scheduled shifts.
Our Ollie’s Leadership Institute (“OLI”) is a program that is used to equip associates with the ability to advance their career. Each OLI participant receives an individual development plan, designed to prepare him or her for his or her next level position. Our strong growth provides opportunities for advancement and OLI is focused on preparing eligible candidates for these positions. OLI is our preferred source for new supervisors and team leaders as “home grown” talent has proven to be successful. Since the program was implemented in 2009, our internal promotion rate has increased from approximately 18% to approximately 50% in fiscal year 2016. We believe our training and development programs help create a positive work environment and result in stores that operate at a high level.
Marketing and advertising
Our marketing and advertising campaigns feature colorful caricatures and witty sayings in order to make our customers laugh. We believe that by disarming our customers by getting them to giggle a bit, they are able to look at and trust our products for what they are—extremely great bargains. Our distinctive and often self-deprecating humor and highly recognizable caricatures are used in all of our stores, flyers and advertising campaigns.
We tailor our marketing mix and strategy for each market, deal or promotion. We primarily use the following forms of marketing and advertising:
| • | Print and direct mail: During fiscal year 2016, we distributed approximately 460 million highly recognizable flyers. Our flyers serve as the foundation of our marketing strategy and highlight current deals to create shopping urgency and drive traffic and increase frequency of store visits. |
| • | Radio and television: We selectively utilize creative radio and television advertising campaigns in targeted markets at certain times of the year, particularly during the holiday sales season to create brand awareness and support new store openings. |
| • | Sports marketing, charity and community events: We sponsor professional and amateur athletics including Major League Baseball, NASCAR, National Hockey League, NCAA basketball and football, as well as various local athletic programs. Additionally, we are dedicated to maintaining a visible presence in the communities in which our stores are located through the sponsorship of charitable organizations such as the Children’s Miracle Network, Cal Ripken, Sr. Foundation and the Kevin Harvick Foundation. We believe these sponsorships promote our brand, underscore our values and build a sense of community. |
| • | Digital marketing and social media: We maintain an active web presence and promote our brand through our website and social media outlets. We also utilize targeted email marketing to highlight our latest brand name offerings and drive traffic to our stores. |
Ollie’s Army
Our customer loyalty program, Ollie’s Army, stands at 7.3 million members as of January 28, 2017 and has increased 31.2% from fiscal year 2015 to fiscal year 2016. In fiscal year 2016, Ollie’s Army members accounted for over 65% of net sales and spent approximately 40% more per shopping trip, on average, than non-members. Consistent with our marketing strategy, we engage new and existing Ollie’s Army members through the use of witty phrases and signage; examples include “Enlist in Ollie’s Army today,” “become one of the few, the cheap, the proud” and “Ollie’s Army Boot Camp… all enlistees will receive 15% off their next purchase.” Historically, Ollie’s Army members have demonstrated double digit redemption rates for promotional activities exclusive to Ollie’s Army members, such as our Valentine’s, Boot Camp and Buzzard 15% off mailers, as well as Ollie’s Army Night, a special annual one-day after-hours sale in December for Ollie’s Army members. We expect to continue leveraging the data gathered from our proprietary database of Ollie’s Army members to better segment and target our marketing initiatives and increase shopping frequency.
Competition
We compete with a diverse group of retailers including discount, closeout, mass merchant, department, grocery, drug, convenience, hardware, variety, online and other specialty stores.
8
The principal basis on which we compete against other retailers is by offering an ever changing selection of brand name products at compelling price points in an exciting shopping environment. Accordingly, we compete against a fragmented group of retailers, wholesalers and jobbers to acquire merchandise for sale in our stores.
Our established relationships with our suppliers coupled with our scale, associated buying power, financial credibility and responsiveness often makes Ollie’s the first call for available deals. Our direct relationships with suppliers have increased as we have grown, and we continuously strive to broaden our supplier network.
Trademarks and other intellectual property
We own several state and federally owned registered trademarks related to our brand, including “Ollie’s,” “Ollie’s Bargain Outlet,” “Good Stuff Cheap,” “Ollie’s Army” and “Real Brands! Real Bargains!” In addition, we maintain a trademark for the image of Ollie, the face of our company. We also own registered trademarks for many of our private labels such as “American Way,” “Steelton Tools,” “Sarasota Breeze” and “Commonwealth Classics” among others. We are also in the process of prosecuting several other trademarks, both for private label goods and to further identify our services. We enter into trademark license agreements where necessary, which may include our private label offerings, such as the Magnavox products and Marcus Samuelsson Cookware available in our stores. Our trademark registrations have various expiration dates; however, assuming that the trademark registrations are properly renewed, they have a perpetual duration. We also own several domain names, including www.ollies.us, www.olliesbargainoutlet.com, www.olliesarmy.com, www.ollies.cheap, www.sarasotabreeze.com and www.olliesmail.com, and unregistered copyrights in our website content. We attempt to obtain registration of our trademarks as practical and pursue infringement of those marks when appropriate.
Technology
Our management information systems provide a full range of business process assistance and timely information to support our merchandising team and strategy, management of multiple distribution centers, stores and operations, and financial reporting. We believe our current systems provide us with operational efficiencies, scalability, management control and timely reporting that allow us to identify and respond to merchandising and operating trends in our business. We use a combination of internal and external resources to support store point-of-sale, merchandise acquisition and distribution, inventory management, financial reporting, real estate and administrative functions. We continuously assess ways to maximize productivity and efficiency, as well as evaluate opportunities to further enhance our existing systems. Our existing systems are scalable to support future growth.
Government regulation
We are subject to labor and employment laws, including minimum wage requirements, laws governing advertising, privacy laws, safety regulations and other laws, including consumer protection regulations that regulate retailers and/or govern product standards, the promotion and sale of merchandise and the operation of stores and warehouse facilities. We monitor changes in these laws and believe that we are in material compliance with applicable laws.
We source a portion of our products from outside the United States. The U.S. Foreign Corrupt Practices Act and other similar anti-bribery and anti-kickback laws and regulations generally prohibit companies and their intermediaries from making improper payments to non-U.S. officials for the purpose of obtaining or retaining business. Our policies and our vendor compliance agreements mandate compliance with applicable law, including these laws and regulations.
Insurance
We maintain third-party insurance for a number of risk management activities, including workers’ compensation, general liability, commercial property, ocean marine, cyber, director and officer and employee benefit related insurance policies. We evaluate our insurance requirements on an ongoing basis to ensure we maintain adequate levels of coverage.
Employees
As of the fiscal year ended January 28, 2017, we employed more than 5,500 associates, approximately 2,500 of whom were full-time and approximately 3,000 of whom were part-time. Of our total associate base, 124 were based at our store support center in Harrisburg, PA. Our distribution centers employ approximately 370 associates, 230 of whom
9
were in York, PA and 140 of whom were in Commerce, GA. The remaining were store and field associates. The number of associates in a fiscal year fluctuates depending on the business needs at different times of the year. In fiscal year 2016, we employed approximately 1,800 additional seasonal associates during our peak holiday sales season. We have a long history of maintaining a culture that embraces our associates. We take pride in providing a great work environment and strong growth opportunities for our associates. None of our associates belong to a union or are party to any collective bargaining or similar agreement.
Seasonality
Our business is seasonal in nature and demand is generally the highest in our fourth fiscal quarter due to the holiday sales season. To prepare for the holiday sales season, we must order and keep in stock more merchandise than we carry during other times of the year and generally engage in additional marketing efforts. We expect inventory levels, along with accounts payable and accrued expenses, to reach their highest levels in our third and fourth fiscal quarters in anticipation of increased net sales during the holiday sales season. As a result of this seasonality, and generally because of variation in consumer spending habits, we experience fluctuations in net sales and working capital requirements during the year. Because we offer a broad selection of merchandise at extreme values, we believe we are less impacted than other retailers by economic cycles which correspond with declines in general consumer spending habits and we believe we still benefit from periods of increased consumer spending.
Available Information
Our annual reports on Form 10-K, quarterly reports on Form 10-Q, current reports on Form 8-K and amendments to those reports filed or furnished pursuant to Section 13(a) or 15(d) of the Securities and Exchange Act are available free of charge on our website, www.ollies.us, as soon as reasonably practicable after the electronic filing of such reports with the SEC.
| Item 1A. | Risk Factors |
Investing in our common stock involves a high degree of risk. You should carefully consider the following risk factors, as well as other information in this Annual Report on Form 10-K, before deciding whether to invest in the shares of our common stock. The occurrence of any of the events described below could have a material adverse effect on our business, financial condition or results of operations. In the case of such an event, the trading price of our common stock may decline and you may lose all or part of your investment.
Risks Related to our Business and Industry
We may not be able to execute our opportunistic buying, adequately manage our supply of inventory or anticipate customer demand, which could have a material adverse effect on our business, financial condition and results of operations.
Our business is dependent on our ability to strategically source a sufficient volume and variety of brand name merchandise at opportunistic pricing. We do not have significant control over the supply, design, function, cost or availability of many of the products that we offer for sale in our stores. Additionally, because a substantial amount of our store products are sourced by us from suppliers on a closeout basis or with significantly reduced prices for specific reasons, we are not always able to purchase specific merchandise on a recurring basis. We do not have long-term contracts with our suppliers and therefore, we have no contractual assurances of pricing or access to products, and any supplier could discontinue sales to us at any time or offer us less favorable terms on future transactions. We generally make individual purchase decisions for products that become available, and these purchases may be for large quantities that we may not be able to sell on a timely or cost-effective basis. Due to economic uncertainties, some of our suppliers may cease operations or may otherwise become unable to continue supplying discounted or closeout merchandise on terms or in quantities acceptable to us.
We also compete with other retailers, wholesalers and jobbers for discounted or closeout merchandise to sell in our stores. Although we work with a range of suppliers, to the extent that certain of our suppliers are better able to manage their inventory levels and reduce the amount of their excess inventory, the amount of discount or closeout merchandise available to us could also be materially reduced, potentially compromising profit margin goals for procured merchandise.
Shortages or disruptions in the availability of brand name or unbranded products of a quality acceptable to our customers and us could have a material adverse effect on our business, financial condition and results of operations
10
and also may result in customer dissatisfaction. In addition, we may significantly overstock products that prove to be undesirable and be forced to take significant markdowns. We cannot assure that our merchant team will continue to identify the appropriate customer demand and take advantage of appropriate buying opportunities, which could have a material adverse effect on our business, financial condition and results of operations.
Our ability to generate revenues is dependent on consumer confidence and spending, which may be subject to factors beyond our control, including changes in economic and political conditions.
The success of our business depends, to a significant extent, upon the level of consumer confidence and spending. A number of factors beyond our control affect the level of customer confidence and spending on merchandise that we offer, including, among other things:
| • | energy and gasoline prices; |
| • | disposable income of our customers; |
| • | discounts, promotions and merchandise offered by our competitors; |
| • | personal debt levels of our customers; |
| • | negative reports and publicity about the discount retail industry; |
| • | unemployment levels; |
| • | minimum wages; |
| • | general economic and industry conditions; |
| • | food prices; |
| • | interest rates; |
| • | the state of the housing market; |
| • | customer confidence in future economic conditions; |
| • | fluctuations in the financial markets; |
| • | tax rates and policies; |
| • | outbreak of viruses or widespread illness; and |
| • | natural disasters, war, terrorism and other hostilities. |
Reduced customer confidence and spending cut backs may result in reduced demand for our merchandise, including discretionary items, and may force us to take inventory markdowns. Reduced demand also may require increased selling and promotional expenses. Adverse economic conditions and any related decrease in customer demand for our merchandise could have a material adverse effect on our business, financial condition and results of operations.
Many of the factors identified above also affect commodity rates, transportation costs, costs of labor, insurance and healthcare, the strength of the U.S. dollar, lease costs, measures that create barriers to or increase the costs associated with international trade, changes in other laws and regulations and other economic factors, all of which may impact our cost of goods sold and our selling, general and administrative expenses, which could have a material adverse effect on our business, financial condition and results of operations.
We face intense competition which could limit our growth opportunities and adversely impact our financial performance.
We compete with a highly fragmented group of competitors including discount, closeout, mass merchant, department, grocery, drug, convenience, hardware, variety, online and other specialty stores. We compete with these retailers with respect to price, store location, supply and quality of merchandise, assortment and presentation and customer service. This competitive environment subjects us to the risk of an adverse impact to our financial performance because of the lower prices, and thus the lower margins, that are required to maintain our competitive position. A number of different competitive factors outside of our control could impact our ability to compete effectively, including:
| • | entry of new competitors in our markets; |
| • | increased operational efficiencies of competitors; |
11
| • | online retail capabilities by our competitors; |
| • | competitive pricing strategies, including deep discount pricing by a broad range of retailers during periods of poor customer confidence, low discretionary income or economic uncertainty; |
| • | continued and prolonged promotional activity by our competitors; |
| • | liquidation sales by our competitors that have filed or may file in the future for bankruptcy; |
| • | geographic expansion by competitors into markets in which we currently operate; and |
| • | adoption by existing competitors of innovative store formats or retail sales methods. |
A number of our competitors also have greater financial and operational resources, greater brand recognition, longer operating histories and broader geographic presences than us. We remain vulnerable to the marketing power and high level of customer recognition of these larger competitors and to the risk that these competitors or others could attract our customer base, including members of Ollie’s Army.
In addition, if any of our competitors were to consolidate their operations, such consolidation may result in competitors with greatly improved financial resources, improved access to merchandise, greater market penetration and other improvements in their competitive positions, as well as result in the provision of a wider variety of products and services at competitive prices by these consolidated companies, which could adversely affect our financial performance.
We cannot guarantee that we will continue to be able to successfully compete against existing or future competitors. Our inability to respond effectively to competitive pressures, improved performance by our competitors and changes in the retail markets could result in lost market share and have a material adverse effect on our business, financial condition and results of operations.
We may not be able to retain the loyalty of our customers, particularly Ollie’s Army members, which could have a material adverse effect on our business, financial condition and results of operations.
We depend on our loyal customer base, particularly members of Ollie’s Army, for our consistent sales and sales growth. Competition for customers has intensified as competitors have moved into, or increased their presence in, our geographic markets and from the use of mobile and web-based technology that facilitates online shopping and real-time product and price comparisons. We expect this competition to continue to increase. Our competitors may be able to offer consumers promotions or loyalty program incentives that could attract Ollie’s Army members or divide their loyalty among several retailers. If we are unable to retain the loyalty of our customers, our net sales could decrease and we may not be able to grow our store base as planned, which could have a material adverse effect on our business, financial condition and results of operations.
If we fail to open new profitable stores on a timely basis or successfully enter new markets, our financial performance could be materially adversely affected.
Our primary growth strategy is to open new profitable stores and expand our operations into new geographic regions. We opened 31 and 27 net new stores in fiscal years 2016 and 2015, respectively, as we continue to backfill in existing markets and expand into contiguous geographies. Our ability to timely open new stores depends in part on several factors, including the availability of attractive rents and store locations; the absence of occupancy delays; the ability to negotiate acceptable lease terms; our ability to obtain permits and licenses; our ability to hire and train new personnel, especially store managers, in a cost effective manner; our ability to adapt our distribution and other operational and management systems to a changing network of stores; the availability of capital funding for expansion; our ability to respond to demographic shifts in areas where our stores are located and general economic conditions.
We may not anticipate all of the challenges imposed by the expansion of our operations into new geographic markets. Some new stores may be located in areas with different competitive and market conditions, customer tastes and discretionary spending patterns than our existing markets. We may face a higher cost of entry, alternative customer demands, reduced brand recognition and minimal operating experience in these areas. Although we are extremely sensitive to cannibalizing existing stores, opening new stores in our established markets may also result in inadvertent
12
oversaturation, sales volume transfer from existing stores to new stores and reduced comparable store sales, thus adversely affecting our overall financial performance. We may not manage our expansion effectively, and our failure to achieve or properly execute our expansion plans could limit our growth or have a material adverse effect on our business, financial condition and results of operations.
Our success depends on our executive officers, our merchant team and other key personnel. If we lose key personnel or are unable to hire additional qualified personnel, it could have a material adverse effect on our business, financial condition and results of operations.
Our future success depends to a significant degree on the skills, experience and efforts of our executive officers, our merchant team and other key personnel. The loss of services of any of our executive officers, particularly Mark Butler, our co-founder, Chairman, President and Chief Executive Officer, could materially adversely affect our business and operations. Competition for skilled and experienced management in the retail industry is intense, and our future success will also depend on our ability to attract and retain qualified personnel, including our merchant team which is responsible for purchasing and negotiating the terms of our merchandise. Failure to attract and retain new qualified personnel could have a material adverse effect on our business, financial condition and results of operations.
Factors such as inflation, cost increases and energy prices could have a material adverse effect on our business, financial condition and results of operations.
Future increases in costs, such as the cost of merchandise, shipping rates, freight costs and store occupancy costs, may reduce our profitability, given our pricing model. These cost increases may be the result of inflationary pressures which could further reduce our sales or profitability. Increases in other operating costs, including changes in energy prices, wage rates and lease and utility costs, may increase our cost of goods sold or selling, general and administrative expenses. Our low price model and competitive pressures in our industry may have the effect of inhibiting our ability to reflect these increased costs in the prices of our products and therefore reduce our profitability and have a material adverse effect on our business, financial condition and results of operations.
If we are not successful in managing our inventory balances, it could have a material adverse effect on our business, financial condition and results of operations.
Our inventory balance represented 58.1% of our total assets exclusive of goodwill, trade name and other intangible assets, net, as of January 28, 2017. Efficient inventory management is a key component of our profitability and ability to generate revenue. To be successful, we must maintain sufficient inventory levels and an appropriate product mix to meet our customers’ demands without allowing those levels to increase to such an extent that the costs to store and hold the goods adversely impact our results of operations. If our buying decisions do not accurately correspond to customer preferences, if we inappropriately price products or if our expectations about customer spending levels are inaccurate, we may have to take unanticipated markdowns to dispose of any excess inventory, which could have a material adverse effect on our business, financial condition and results of operations. We continue to focus on ways to reduce these risks, but we cannot ensure that we will be successful in our inventory management. If we are not successful in managing our inventory balances, it could have a material adverse effect on our business, financial condition and results of operations.
We may not be successful in the implementation of our long-term business strategy, which could materially adversely affect our business, results of operations, cash flows and financial condition.
Our success depends, to a significant degree, on our ability to successfully implement our long-term business strategy. Our ability to successfully implement our business strategies depends upon a significant number of factors, including but not limited to our ability to:
| • | expand our store base and increase our customers; |
| • | access an adequate supply of quality brand name and closeout merchandise from suppliers at competitive prices; |
| • | achieve profitable sales and to make adjustments as market conditions change; |
| • | customer acceptance of our marketing and merchandise strategies; |
| • | respond to competitive pressures in our industry; |
13
| • | attract and retain store-level and management-level associates; |
| • | the extent to which our management team can properly respond to the dynamics and demands of our market; |
| • | maintain our relationships with our suppliers and customers; |
| • | achieve positive cash flow, particularly during our peak inventory build-ups in advance of the holiday sales season; and |
| • | adapt to any revised or new strategic initiatives and organizational structure. |
Any failure to achieve any or all of our business strategies could have a material adverse effect on our business, financial condition and results of operations.
If we are unable to attract, train and retain highly qualified managerial personnel and sales associates in our stores and our distribution centers, our sales, financial performance and business operations may be materially adversely affected.
We focus on providing our customers with a memorable and engaging shopping experience. To grow our operations and meet the needs and expectations of our customers, we must attract, train and retain a large number of highly qualified store management personnel and sales associates, while controlling labor costs. Our ability to control labor costs is subject to numerous external factors, including competition for and availability of qualified personnel in a given market, unemployment levels within those markets, governmental bodies such as the Equal Employment Opportunity Commission and the National Labor Relations Board, prevailing wage rates, minimum wage laws, the impact of legislation governing labor and employee relations or benefits, such as the Affordable Care Act, health insurance costs and our ability to maintain good relations with our associates. We compete with other retail businesses for many of our store management personnel and sales associates in hourly and part-time positions. These positions have historically had high turnover rates, which can lead to increased training and retention costs. We also rely on associates in our distribution centers to ensure the efficient processing and delivery of products from our suppliers to our stores. If we are unable to attract and retain quality sales associates and management personnel, it could have a material adverse effect on our business, financial condition and results of operations.
Our business requires that we lease substantial amounts of space and there can be no assurance that we will be able to continue to lease space on terms as favorable as the leases negotiated in the past.
Other than one store location, which is owned, we lease our store locations, our corporate headquarters and our distribution facilities in York, PA and Commerce, GA. Our stores are leased from third parties, with typical initial lease terms of five to seven years with options to renew for three successive five-year periods. We believe that we have been able to negotiate favorable rental rates over the last few years due in large part to the general state of the economy, the increased availability of vacant big box retail sites and our careful identification of favorable lease opportunities. While we will continue to seek out advantageous lease opportunities, there is no guarantee that we will continue to be able to find low-cost second generation sites or obtain favorable lease terms. Many of our lease agreements have defined escalating rent provisions over the initial term and any extensions. Increases in our occupancy costs and difficulty in identifying economically suitable new store locations could have significant negative consequences, which include:
| • | requiring that a greater portion of our available cash be applied to pay our rental obligations, thus reducing cash available for other purposes and reducing profitability; |
| • | increasing our vulnerability to general adverse economic and industry conditions; and |
| • | limiting our flexibility in planning for, or reacting to changes in, our business or in the industry in which we compete. |
We depend on cash flow from operations to pay our lease expenses and to fulfill our other cash needs. If our business does not generate sufficient cash flow from operating activities to fund these expenses and needs and sufficient funds are not otherwise available to us, we may not be able to service our lease expenses, grow our business, respond to competitive challenges or fund our other liquidity and capital needs, which could harm our business. Additional sites that we lease may be subject to long-term non-cancelable leases if we are unable to negotiate our current standard lease terms. If an existing or future store is not profitable, and we decide to close it, we may nonetheless be committed to perform our obligations under the applicable lease including, among other things, paying the base rent for the
14
balance of the lease term. Moreover, even if a lease has an early cancellation clause, we may not satisfy the contractual requirements for early cancellation under that lease. In addition, if we are not able to enter into new leases or renew existing leases on terms acceptable to us, this could have a material adverse effect on our business, financial condition and results of operations.
The loss of, or disruption in the operations of, our centralized distribution centers could materially adversely affect our business and operations.
With few exceptions, our entire inventory is shipped directly from suppliers to our two distribution centers in York, PA, and Commerce, GA, where the inventory is then processed, sorted and shipped to our stores. We depend in large part on the orderly operation of this receiving and distribution process, which depends, in turn, on adherence to shipping schedules and effective management of our distribution centers. Increases in transportation costs (including increases in fuel costs), supplier-side delays, reductions in the capacity of carriers, changes in shipping companies, labor strikes or shortages in the transportation industry and unexpected delivery interruptions also have the potential to derail our orderly distribution process. We also may not anticipate changing demands on our distribution system, including the effect of expanding operations in our distribution center in Commerce, GA. In addition, events beyond our control, such as disruptions in operations due to fire or other catastrophic events or labor disagreements, may result in delays in the delivery of merchandise to our stores. While we maintain business interruption insurance, in the event our distribution centers are shut down for any reason, such insurance may not be sufficient, and any related insurance proceeds may not be timely paid to us. In addition, our new store locations receiving shipments may be further away from our distribution centers which may increase transportation costs and may create transportation scheduling strains. Any repeated, intermittent, or long-term disruption in the operations of our distribution centers would hinder our ability to provide merchandise to our stores and could have a material adverse effect on our business, financial condition and results of operations.
Our new store growth is dependent upon our ability to successfully expand our distribution network capacity, and failure to achieve or sustain these plans could affect our performance adversely.
We maintain distribution centers in York, PA and Commerce, GA to support our existing stores and our growth objectives. We continuously assess ways to maximize the productivity and efficiency of our existing distribution facilities and evaluate opportunities for additional distribution centers. Should we open additional distribution centers, delays in such openings could adversely affect our future operations by slowing store growth, which could, in turn, reduce sales growth. In addition, any distribution related construction or expansion projects entail risks which could cause delays and cost overruns, such as, shortages of materials, shortages of skilled labor or work stoppages, unforeseen construction, scheduling, engineering, environmental or geological problems, weather interference, fires or other casualty losses and unanticipated cost increases. The completion date and ultimate cost of future projects could differ significantly from initial expectations due to construction related or other reasons. We cannot guarantee that any project will be completed on time or within established budgets.
We do not compete in the growing online retail marketplace, which could have a material adverse effect on our business, financial condition and results of operations.
Our long-term business strategy does not presently include the development of online retailing capabilities. To the extent that we implement online operations, we would incur substantial expenses related to such activities and be exposed to additional cybersecurity risks. Further, any development of an online retail marketplace is a complex undertaking, and there is no guarantee that any resources we apply to this effort will result in increased revenues or operating performance. With the growing acceptance of online shopping and the increased proliferation of mobile computing devices, however, competition from other retailers in the online retail marketplace is expected to increase. Certain of our competitors and a number of pure online retailers have established robust online operations. Increased competition from online retailers and our lack of online retail presence may reduce our customers’ desire to purchase goods from us and could have a material adverse effect on our business, financial condition and results of operations.
Our success depends upon our marketing, advertising and promotional efforts. If we are unable to implement them successfully, or if our competitors are more effective than we are, it could have a material adverse effect on our business, financial condition and results of operations.
We use marketing and promotional programs to attract customers to our stores and to encourage purchases by our customers. Although we use various media for our promotional efforts, including regular and Ollie’s Army mailers, email campaigns, radio and television advertisements and sports marketing, we primarily advertise our in-store
15
offerings through printed flyers. In fiscal year 2016, approximately 70% of our advertising spend was for the printing and distribution of flyers. If the efficacy of printed flyers as an advertising medium declines, or if we fail to successfully develop and implement new marketing, advertising and promotional strategies, such as an effective social media strategy, our competitors may be able to attract the interest of our customers, which could reduce customer traffic in our stores. Changes in the amount and degree of promotional intensity or merchandising strategy by our competitors could cause us to have difficulties in retaining existing customers and attracting new customers. If the efficacy of our marketing or promotional activities declines or if such activities of our competitors are more effective than ours, or if for any other reason we lose the loyalty of our customers, including our Ollie’s Army members, it could have a material adverse effect on our business, financial condition and results of operations.
If we fail to protect our brand names, competitors may adopt trade names that dilute the value of our brand name.
We may be unable or unwilling to strictly enforce our trademarks in each jurisdiction in which we do business. Also, we may not always be able to successfully enforce our trademarks against competitors or against challenges by others. Our failure to successfully protect our trademarks could diminish the value and efficacy of our brand recognition and could cause customer confusion, which could have a material adverse effect on our business, financial condition and results of operations.
Because our business is seasonal, with the highest volume of net sales during the holiday season, adverse events during our fourth quarter could materially adversely affect our business, operations, cash flow and financial condition.
We generally recognize our highest volume of net sales in connection with the holiday sales season, which occurs in the fourth quarter of our fiscal year. In anticipation of the holiday sales season, we purchase substantial amounts of seasonal inventory and hire many part-time associates. Because a significant percentage of our net sales and operating income are generated in our fourth fiscal quarter, we have limited ability to compensate for shortfalls in our fourth fiscal quarter sales or earnings by changing our operations or strategies in other fiscal quarters. Adverse events, such as deteriorating economic conditions, higher unemployment, higher gas prices, public transportation disruptions, or unanticipated adverse weather conditions could result in lower-than-planned sales during the holiday sales season. If our fourth fiscal quarter sales results were substantially below expectations, we would realize less cash from operations, and may be forced to mark down our merchandise, especially our seasonal merchandise, which could have a material adverse effect on our business, financial condition and results of operations.
Fluctuations in comparable store sales and results of operations, including fluctuations on a quarterly basis, could cause our business performance to decline substantially.
Our results of operations have fluctuated in the past, including on a quarterly basis, and can be expected to continue to fluctuate in the future.
Our comparable store sales and results of operations are affected by a variety of factors, including:
| • | national and regional economic trends in the United States; |
| • | changes in gasoline prices; |
| • | changes in our merchandise mix; |
| • | changes in pricing; |
| • | changes in the timing of promotional and advertising efforts; |
| • | holidays or seasonal periods; and |
| • | weather. |
If our future comparable store sales fail to meet expectations, then our cash flow and profitability could decline substantially, which could have a material adverse effect on our business, financial condition and results of operations.
We rely on manufacturers in foreign countries for merchandise and a significant amount of our domestically-purchased merchandise is manufactured abroad. Our business may be materially adversely affected by risks associated with international trade.
We purchase merchandise directly from suppliers outside of the United States. In fiscal year 2016, substantially all of our private label inventory purchases were direct imports. Our direct imports represented approximately 16% at
16
cost of our total merchandise purchases in fiscal year 2016. Additionally, a significant amount of our domestically-purchased merchandise is manufactured abroad. Our ability to identify qualified suppliers and to access products in a timely and efficient manner is a significant challenge, especially with respect to goods sourced outside of North America. Global sourcing and foreign trade involve numerous factors and uncertainties beyond our control, including possible changes to U.S. trade policy, increased shipping costs, increased import duties, more restrictive quotas, loss of most favored nation trading status, currency, work stoppages, transportation delays, port of entry issues, economic uncertainties such as inflation, foreign government regulations, political unrest, natural disasters, war, terrorism, trade restrictions, political instability, the financial stability of vendors, merchandise quality issues, and tariffs. Moreover, negative press or reports about internationally manufactured products may sway public opinion, and thus customer confidence, away from the products sold in our stores. These and other issues affecting our international vendors could have a material adverse effect on our business, financial condition and results of operations.
We are subject to governmental regulations, procedures and requirements. A significant change in, or noncompliance with, these regulations could have a material adverse effect on our business, financial condition and results of operations.
We routinely incur significant costs in complying with federal, state and local laws and regulations. The complexity of the regulatory environment in which we operate and the related cost of compliance are increasing due to expanding and additional legal and regulatory requirements and increased enforcement efforts. New laws or regulations, including those dealing with healthcare reform, product safety, consumer credit, privacy and information security and labor and employment, among others, or changes in existing laws and regulations, particularly those governing the sale of products and food safety and quality (including changes in labeling or disclosure requirements), federal or state wage requirements, employee rights, health care, social welfare or entitlement programs such as health insurance, paid leave programs, or other changes in workplace regulation, may result in significant added expenses or may require extensive system and operating changes that may be difficult to implement and/or could materially increase our cost of doing business. Untimely compliance or noncompliance with applicable regulations or untimely or incomplete execution of a required product recall can result in the imposition of penalties, including loss of licenses or significant fines or monetary penalties, class action litigation or other litigation, in addition to reputational damage. Additionally, changes in tax laws, the interpretation of existing laws, or our failure to sustain our reporting positions on examination could materially adversely affect our effective tax rate and could have a material adverse effect on our business, financial condition and results of operations.
If we are unable to maintain or upgrade our information technology systems or if we are unable to convert to alternate systems in an efficient and timely manner, our operations may be disrupted or become less efficient.
We depend on a variety of information technology systems for the efficient functioning of our business. We rely on certain hardware, telecommunications and software vendors to maintain and periodically upgrade many of these systems so that we can continue to support our business. Various components of our information technology systems, including hardware, networks, and software, are licensed to us by third party vendors. We rely extensively on our information technology systems to process transactions, summarize results and manage our business. Additionally, because we accept debit and credit cards for payment, we are subject to the Payment Card Industry Data Security Standard (the “PCI Standard”), issued by the Payment Card Industry Security Standards Council. The PCI Standard contains compliance guidelines with regard to our security surrounding the physical and electronic storage, processing and transmission of cardholder data. We are in compliance with the PCI Standard as of the end of fiscal year 2016, and compliance with the PCI Standard and implementing related procedures, technology and information security measures requires significant resources and ongoing attention. Costs and potential problems and interruptions associated with the implementation of new or upgraded systems and technology such as those necessary to achieve compliance with the PCI Standard or with maintenance or adequate support of existing systems could also disrupt or reduce the efficiency of our operations. Any material interruptions or failures in our payment-related systems could have a material adverse effect on our business, financial condition and results of operations.
If our information technology systems are damaged or cease to function properly, we may have to make a significant investment to fix or replace them. If there are amendments to the PCI Standard, the cost of re-compliance could also be substantial and we may suffer loss of critical data and interruptions or delays in our operations as a result. In addition, we may have to upgrade our existing information technology systems from time to time, in order for such systems to withstand the increasing needs of our expanding business. Any material interruption experienced by our information technology systems could have a material adverse effect on our business, financial condition and results
17
of operations. Costs and potential interruptions associated with the implementation of new or upgraded systems and technology or with maintenance or adequate support of our existing systems could disrupt or reduce the efficiency of our business.
Any disruptions to our information technology systems or breaches of our network security could interrupt our operations, compromise our reputation, expose us to litigation, government enforcement actions and costly response measures and could have a material adverse effect on our business, financial condition and results of operations.
We rely on the integrity, security and successful functioning of our information technology systems and network infrastructure across our operations, including point-of-sale processing at our stores. In connection with sales, we transmit encrypted confidential credit and debit card information.
As of the end of fiscal year 2016, we are compliant with the PCI Standard. However, there can be no assurance that in the future we will be able to operate our facilities and our customer service and sales operations in accordance with PCI or other industry recommended or contractually required practices. We expect to incur additional expenses to maintain PCI compliance. Even though we are compliant with such standards, we still may not be able to prevent security breaches.
We also have access to, collect or maintain private or confidential information regarding our customers, associates and suppliers, as well as our business. The protection of our customer, associates, supplier and company data is critical to us. The regulatory environment surrounding information security and privacy is increasingly demanding, with the frequent imposition of new and constantly changing requirements across our business. In addition, customers have a high expectation that we will adequately protect their personal information from cyber-attack or other security breaches. We have procedures in place to safeguard such data and information. However, a significant breach of customer, employee, supplier, or company data could attract a substantial amount of negative media attention, damage our customer and supplier relationships and our reputation, and result in lost sales, fines and/or lawsuits.
An increasingly significant portion of our sales depends on the continuing operation of our information technology and communications systems, including but not limited to our point-of-sale system and our credit card processing systems. Our information technology, communication systems and electronic data may be vulnerable to damage or interruption from earthquakes, acts of war or terrorist attacks, floods, fires, tornadoes, hurricanes, power loss and outages, computer and telecommunications failures, computer viruses, loss of data, unauthorized data breaches, usage errors by our associates or our contractors or other attempts to harm our systems, including cyber-security attacks or other breaches of cardholder data. Some of our systems are not fully redundant, and our disaster recovery planning cannot account for all eventualities. The occurrence of a natural disaster, intentional sabotage or other unanticipated problems could result in lengthy interruptions in our service. Any errors or vulnerabilities in our systems, or damage to or failure of our systems, could result in interruptions in our services and non-compliance with certain regulations, which could have a material adverse effect on our business, financial condition and results of operations.
The cost of compliance with product safety regulations and risks related to product liability claims and product recalls could damage our reputation, increase our cost of doing business and could have a material adverse effect on our business, financial condition and results of operations.
New federal or state legislation, including new product safety laws and regulations, may negatively impact our operations. Future changes in product safety legislation or regulations may lead to product recalls and the disposal or write-off of merchandise. While we work to comply in all material respects with applicable legislation and regulations, and to execute product recalls in a timely manner, if our merchandise, including food and consumable products and flooring, does not meet applicable governmental safety standards or our customers’ expectations regarding quality or safety, we could experience lost sales and increased costs, be exposed to legal and reputational risk and face fines or penalties which could materially adversely affect our financial results. We also purchase a material portion of our products on a closeout basis. Some of these products are obtained through brokers or intermediaries rather than through manufacturers. The closeout nature of a portion of our products sometimes makes it more difficult for us to investigate all aspects of these products. Furthermore, customers have asserted claims, and may in the future assert claims that they have sustained injuries from merchandise offered by us, and we may be subject to lawsuits relating to these claims. There is a risk that these claims may exceed, or fall outside the scope of, our insurance coverage. Even with adequate insurance and indemnification from third-party suppliers, such claims, even if unsuccessful or not fully pursued, could significantly damage our reputation and customer confidence in our products. If this occurs, it may be difficult for us to regain lost sales, which could have a material adverse effect on our business, financial condition and results of operations.
18
We face litigation risks from customers, associates and other third parties in the ordinary course of business.
Our business is subject to the risk of litigation by customers, current and former associates, suppliers, stockholders, intellectual property rights holders, government agencies and others through private actions, class actions, administrative proceedings, regulatory actions, or other litigation. The outcome of litigation, particularly class action lawsuits and regulatory actions, is difficult to assess or quantify. Plaintiffs in these types of lawsuits may seek recovery of very large or indeterminate amounts, and the magnitude of the potential loss relating to such lawsuits may remain unknown for substantial periods of time. The cost to defend future litigation may be significant and may negatively affect our operating results if changes to our business operations are required. There may also be negative publicity associated with litigation that could decrease customer acceptance of merchandise offerings, regardless of whether the allegations are valid or whether we are ultimately found liable. As a result, litigation may adversely affect our business, financial condition, results of operations or liquidity.
Our indebtedness may limit our ability to invest in the ongoing needs of our business and if we are unable to comply with our financial covenants, it could have a material adverse effect on our liquidity and our business, financial condition and results of operations.
As of January 28, 2017, we had $195.0 million of outstanding indebtedness under our senior secured term loan facility (the “Term Loan Facility”) and $1.0 million of outstanding letters of credit and $0.2 million of outstanding rent reserves under our senior secured asset-based revolving credit facility (of which $98.8 million of undrawn commitments remained available for borrowing) (the “Revolving Credit Facility,” and together with the Term Loan Facility, the “Credit Facilities”). We may, from time to time, incur additional indebtedness.
The agreements governing our Credit Facilities place certain conditions on us, including that they:
| • | increase our vulnerability to adverse general economic or industry conditions; |
| • | limit our flexibility in planning for, or reacting to, changes in our business or the industries in which we operate; |
| • | make us more vulnerable to increases in interest rates, as borrowings under our Credit Facilities are at variable rates; |
| • | limit our ability to obtain additional financing in the future for working capital or other purposes; |
| • | require us to utilize our cash flow from operations to make payments on our indebtedness, reducing the availability of our cash flow to fund working capital, capital expenditures, development activity and other general corporate purposes; and |
| • | place us at a competitive disadvantage compared to our competitors that have less indebtedness. |
Our Credit Facilities place certain limitations on our ability to incur additional indebtedness. However, subject to the qualifications and exceptions in our Credit Facilities, we may be permitted to incur substantial additional indebtedness and may incur obligations that do not constitute indebtedness under the terms of the Credit Facilities. Our Credit Facilities also place certain limitations on, among other things, our ability to enter into certain types of transactions, financing arrangements and investments, to make certain changes to our capital structure and to guarantee certain indebtedness. Our Credit Facilities also place certain restrictions on the payment of dividends and distributions and certain management fees. These restrictions limit or prohibit, among other things, our ability to:
| • | pay dividends on, redeem or repurchase our stock or make other distributions; |
| • | incur or guarantee additional indebtedness; |
| • | sell stock in our subsidiaries; |
| • | create or incur liens; |
| • | make acquisitions or investments; |
| • | transfer or sell certain assets or merge or consolidate with or into other companies; |
| • | make certain payments or prepayments of indebtedness subordinated to our obligations under our Credit Facilities; and |
| • | enter into certain transactions with our affiliates. |
19
Failure to comply with certain covenants or the occurrence of a change of control under our Credit Facilities could result in the acceleration of our obligations under the Credit Facilities, which would materially adversely affect our liquidity, capital resources and results of operations.
Under certain circumstances, our Credit Facilities require us to comply with certain financial covenants regarding our fixed charge coverage ratio and total leverage ratio. Changes with respect to the total leverage ratio may increase our interest rate and failure to comply with each covenant could result in a default and an acceleration of our obligations under the Credit Facilities, which could have a material adverse effect on our liquidity and our business, financial condition and results of operations. See “Item 7, Management’s Discussion and Analysis of Financial Condition and Results of Operations – Liquidity and Capital Resources – Credit Facilities.”
We may be unable to generate sufficient cash flow to satisfy our significant debt service obligations, which could have a material adverse effect on our business, financial condition and results of operations.
Our ability to make principal and interest payments on and to refinance our indebtedness will depend on our ability to generate cash in the future and is subject to general economic, financial, competitive, legislative, regulatory and other factors that are beyond our control. If our business does not generate sufficient cash flow from operations, in the amounts projected or at all, or if future borrowings are not available to us in amounts sufficient to fund our other liquidity needs, our business financial condition and results of operations could be materially adversely affected. If we cannot generate sufficient cash flow from operations to make scheduled principal and interest payments in the future, we may need to refinance all or a portion of our indebtedness on or before maturity, sell assets, delay capital expenditures or seek additional equity. The terms of our existing or future debt agreements, including our Credit Facilities, may also restrict us from affecting any of these alternatives. Further, changes in the credit and capital markets, including market disruptions and interest rate fluctuations, may increase the cost of financing, make it more difficult to obtain favorable terms, or restrict our access to these sources of future liquidity. If we are unable to refinance any of our indebtedness on commercially reasonable terms or at all or to effect any other action relating to our indebtedness on satisfactory terms or at all, it could have a material adverse effect on our business, financial condition and results of operations.
Natural disasters, whether or not caused by climate change, unusual weather condition, epidemic outbreaks, terrorist acts and political events could disrupt business and result in lower sales and otherwise adversely affect our financial performance.
The occurrence of one or more natural disasters, such as tornadoes, hurricanes, fires, floods and earthquakes, unusual weather conditions, epidemic outbreaks, terrorist attacks or disruptive political events in certain regions where our stores are located could adversely affect our business and result in lower sales. Severe weather, such as heavy snowfall or extreme temperatures, may discourage or restrict customers in a particular region from traveling to our stores, thereby reducing our sales and profitability. If severe weather conditions occur during the second or fourth quarter of our fiscal year, the adverse impact to our sales and profitability could be even greater than at other times during the year because we generate a larger portion of our sales and profits during this period. Natural disasters including tornadoes, hurricanes, floods and earthquakes may damage our stores or other operations, which may materially adversely affect our consolidated financial results. To the extent these events also impact one or more of our key suppliers or result in the closure of one or both of our centralized distribution centers or our corporate headquarters, we may be unable to maintain inventory balances, maintain delivery schedules or provide other support functions to our stores. This could have a sustained material adverse effect on our business, financial condition and results of operations.
Our current insurance program may expose us to unexpected costs and negatively affect our financial performance.
Our insurance coverage reflects deductibles, self-insured retentions, limits of liability and similar provisions that we believe are prudent based on the dispersion of our operations. However, there are types of losses we may incur but against which we cannot be insured or which we believe are not economically reasonable to insure, such as losses due to acts of war, employee and certain other crime, wage and hour and other employment-related claims, including class actions, and some natural disasters. If we incur these losses and they are material, our business could suffer. Certain material events may result in sizable losses for the insurance industry and adversely impact the availability of adequate insurance coverage or result in excessive premium increases. To offset negative insurance market trends, we may elect to self-insure, accept higher deductibles or reduce the amount of coverage in response to these market
20
changes. In addition, we self-insure a significant portion of expected losses under our worker’s compensation, general liability and group health insurance programs. Unanticipated changes in any applicable actuarial assumptions and management estimates underlying our recorded liabilities for these losses, including expected increases in medical and indemnity costs, could result in materially different expenses than expected under these programs, which could have a material adverse effect on our results of operations and financial condition. Although we continue to maintain property insurance for catastrophic events at our store support center, distribution centers and stores, we are not self-insured for other property losses. In addition, because of ongoing changes in healthcare law, among other things, we may experience an increase in participation in our group health insurance programs, which may lead to a greater number of medical claims. If we experience a greater number of these losses than we anticipate, it could have a material adverse effect on our business, financial condition and results of operations.
Inventory shrinkage could have a material adverse effect on our business, financial condition and results of operations.
We are subject to the risk of inventory loss and theft. Although our inventory shrinkage rates have not been material, or fluctuated significantly in recent years, we cannot ensure that actual rates of inventory loss and theft in the future will be within our estimates or that the measures we are taking will effectively reduce the problem of inventory shrinkage. Although some level of inventory shrinkage is an unavoidable cost of doing business, if we were to experience higher rates of inventory shrinkage or incur increased security costs to combat inventory theft, it could have a material adverse effect on our business, financial condition and results of operations.
If our estimates or judgments relating to our critical accounting policies prove to be incorrect, our operating results could be adversely affected.
The preparation of financial statements in conformity with U.S. Generally Accepted Accounting Principles (“GAAP”) requires management to make estimates and assumptions that affect the amounts reported in the consolidated financial statements and accompanying notes. We base our estimates on historical experience and on various other assumptions that we believe to be reasonable under the circumstances, as provided in “Item 7, Management’s Discussion and Analysis of Financial Condition and Results of Operations” included elsewhere in this Annual Report on Form 10-K. The results of these estimates form the basis for making judgments about the carrying values of assets, liabilities and equity, and the amount of revenue and expenses that are not readily apparent from other sources. Our operating results may be adversely affected if our assumptions change or if actual circumstances differ from those in our assumptions, which could cause our operating results to fall below the expectations of securities analysts and investors, resulting in a decline in our stock price. Significant assumptions and estimates used in preparing our consolidated financial statements include those related to inventory valuation, impairment of goodwill and intangible assets, impairment of long-lived assets, stock-based compensation expense and accounting for income taxes including deferred tax assets and liabilities.
Changes to accounting rules or regulations could have a material adverse effect on our business, financial condition and results of operations.
Changes to existing accounting rules or regulations may impact our future results of operations or cause the perception that we are more highly leveraged. Other new accounting rules or regulations and varying interpretations of existing accounting rules or regulations have occurred and may occur in the future. For instance, accounting regulatory authorities will require lessees to capitalize operating leases in their financial statements beginning in fiscal year 2019. The change will require us to record significant lease obligations on our consolidated balance sheet and make other changes to our financial statements. This and other future changes to accounting rules or regulations could have a material adverse effect on our business, financial condition and results of operations.
Risks Related to Ownership of Our Common Stock
Future sales of our common stock in the public market could cause the market price of our common stock to decrease significantly.
Sales of substantial amounts of our common stock in the public market by our existing stockholders or upon the exercise of outstanding stock options or grant of stock options or restricted stock units in the future may cause the market price of our common stock to decrease significantly. As of January 28, 2017, we have an aggregate of 5,562,678 shares of common stock issuable upon exercise of outstanding options and the vesting of restricted stock units under the 2015 Equity Incentive Plan (the “2015 Plan” and together with the 2012 Equity Incentive Plan, the “Equity Plans”) (2,924,654 of which are fully vested).
21
The perception that such sales could occur could also depress the market price of our common stock. Any such sales could also create public perception of difficulties or problems with our business and might also make it more difficult for us to raise capital through the sale of equity securities in the future at a time and price that we deem appropriate.
Ollie’s Bargain Outlet Holdings, Inc. (“Holdings”) is a holding company and relies on dividends and other payments, advances and transfers of funds from its subsidiaries to meet its obligations and pay any dividends.
Holdings has no direct operations and no significant assets other than ownership of 100% of the capital stock of its subsidiaries. Because Holdings conducts operations through subsidiaries, it depends on those entities for dividends and other payments to generate the funds necessary to meet financial obligations, and to pay any dividends with respect to its common stock. Legal and contractual restrictions in the Credit Facilities and other agreements which may govern future indebtedness of subsidiaries, as well as the financial condition and operating requirements of subsidiaries, may limit its ability to obtain cash from subsidiaries. The earnings from, or other available assets of, subsidiaries might not be sufficient to pay dividends or make distributions or loans to enable Holdings to pay any dividends on its common stock or other obligations. Any of the foregoing could materially and adversely affect our business, financial condition, results of operations and cash flows.
We do not expect to pay any cash dividends for the foreseeable future.
The continued operation and expansion of our business will require substantial funding. We do not anticipate that we will pay any dividends to holders of our common stock for the foreseeable future. Any payment of cash dividends will be at the discretion of our Board and will depend on our financial condition, capital requirements, legal requirements, earnings and other factors. Our ability to pay dividends is restricted by the terms of our Credit Facilities and might be restricted by the terms of any indebtedness that we incur in the future. Accordingly, realization of any gain on our common stock will depend on the appreciation of the price of the shares of our common stock, which may never occur.
As of January 28, 2017, we are no longer an “emerging growth company,” and the reduced disclosure requirements applicable to emerging growth companies no longer apply.
Prior to January 28, 2017, we were an “emerging growth company,” or EGC, as defined in the JOBS Act. As of July 30, 2016, the market value of our common stock that was held by non-affiliates exceeded $700 million and, therefore, we no longer qualify for such status. As a large accelerated filer, we are subject to certain disclosure requirements that are applicable to other public companies that had not been applicable to us as an EGC, beginning with this Annual Report on Form10-K filed for the fiscal year ended January 28, 2017. These requirements include, but are not limited to:
| • | being required to comply with the auditor attestation requirements of Section 404 of the Sarbanes-Oxley Act of 2002, or the Sarbanes Oxley Act; |
| • | being required to comply with any requirement that may be adopted by the Public Company Oversight Board regarding mandatory audit firm rotation or the supplement to the auditor’s report providing additional information about the audit and the financial statements; and |
| • | disclosure obligations regarding executive compensation. |
In addition, we no longer have an extended transition period for complying with new or revised accounting standards.
We incur increased costs as a result of operating as a public company, and our management is now required to devote substantial time to new compliance initiatives.
As a public company we incur, and particularly commencing January 28, 2017, when we ceased to hold EGC status, we expect to incur further, significant legal, accounting and other expenses that we did not incur as a private company. In addition, the Sarbanes-Oxley Act and rules subsequently implemented by the SEC and NASDAQ have imposed various requirements on public companies, including establishment and maintenance of effective disclosure and financial controls and corporate governance practices. Our management and other personnel devote a substantial amount of time to these compliance initiatives. Moreover, these rules and regulations have increased our legal and financial compliance costs and will make some activities more time-consuming and costly.
Pursuant to Section 404 of the Sarbanes-Oxley Act, or Section 404, we are required to furnish a report by our management on our internal control over financial reporting, including an attestation report on internal control over
22
financial reporting issued by our independent registered public accounting firm, both of which are included with this Annual Report on Form 10-K for the fiscal year ended January 28, 2017. To be in compliance with Section 404, we are required to document and evaluate our internal control over financial reporting, which has been both costly and challenging. If we fail to maintain an effective internal control environment or to comply with the numerous legal and regulatory requirements imposed on public companies, we could make material errors in, and be required to restate, our financial statements. Any such restatement could result in a loss of public confidence in the reliability of our financial statements and sanctions imposed on us by the SEC. If we are unable to satisfy our obligations as a public company, we could be subject to delisting of our common stock, fines, sanctions and other regulatory action and potentially civil litigation.
Our Chief Executive Officer owns a substantial percentage of our outstanding common stock and his interests may be different from or conflict with those of our other stockholders.
As of January 28, 2017, Mark Butler, our co-founder, Chairman, President and Chief Executive Officer, beneficially owns 21.9% of our outstanding common stock. Accordingly, Mr. Butler is able to exert a significant degree of influence over our management and affairs and over matters requiring stockholder approval, including the election of directors, a merger, consolidation or sale of all or substantially all of our assets, and any other significant transaction. Our principal stockholder’s interests might not always coincide with our interests or the interests of our other stockholders.
Anti-takeover provisions in our second amended and restated certificate of incorporation and bylaws and under Delaware law could make an acquisition of us more difficult, limit attempts by our stockholders to replace or remove our current management and limit the market price of our common stock.
Provisions in our second amended and restated certificate of incorporation and amended and restated bylaws may have the effect of delaying or preventing a change of control or changes in our management. Our second amended and restated certificate of incorporation and amended and restated bylaws include provisions that:
| • | authorize our Board to issue, without further action by the stockholders, up to 50,000,000 shares of undesignated preferred stock; |
| • | subject to certain exceptions, require that any action to be taken by our stockholders be effected at a duly called annual or special meeting and not by written consent; |
| • | specify that special meetings of our stockholders can be called only by a majority of our Board or upon the request of the Chief Executive Officer; |
| • | establish an advance notice procedure for stockholder proposals to be brought before an annual meeting, including proposed nominations of persons for election to our Board; |
| • | establish that our Board is divided into three classes, with each class serving three-year staggered terms; |
| • | prohibit cumulative voting in the election of directors; and |
| • | provide that vacancies on our Board may be filled only by a majority of directors then in office, even though less than a quorum. |
These provisions may frustrate or prevent any attempts by our stockholders to replace or remove our current management by making it more difficult for stockholders to replace members of our Board, which is responsible for appointing the members of our management.
If securities analysts or industry analysts downgrade our shares, publish negative research or reports, or do not publish reports about our business, our share price and trading volume could decline.
The trading market for our common stock is to some extent influenced by the research and reports that industry or securities analysts publish about us, our business and our industry. If no or few analysts commence coverage of us, the trading price of our stock could decrease. Even if we do obtain analyst coverage, if one or more analysts adversely change their recommendation regarding our shares or our competitors’ stock, our share price might decline. If one or more analysts cease coverage of us or fail to regularly publish reports on us, we might lose visibility in the financial markets, which in turn could cause our share price or trading volume to decline.
| Item 1B. | Unresolved Staff Comments |
None.
23
| Item 2. | Properties |
Other than one store location, which we own, we lease our retail stores, often in second generation sites ranging in size from 25,000 to 50,000 square feet. Our corporate headquarters, located in Harrisburg, PA, is 28,128 square feet and is leased under an agreement that expires in October 2023, with options to renew for three successive five-year periods. Our 603,000 square foot distribution center located in York, PA is leased under an agreement that expires in March 2028 with options to renew for two successive five-year periods. During fiscal year 2014, we opened a second distribution center in Commerce, GA. This distribution center is 699,840 square feet and is leased under an agreement that expires in April 2024 with options to renew for three successive five-year periods. Our lease provides that we will lease and pay for additional space in our Commerce, GA distribution center until we occupy a total of 962,280 square feet by November 2017. As of January 28, 2017, there were 234 Ollie’s Bargain Outlet locations across 19 contiguous states in the Eastern half of the United States.
We maintain a focused and disciplined approach to entering into lease arrangements. All leases are approved by our real estate committee, which is composed of senior management and executive officers. Our leases generally have an initial term of five to seven years with options to renew for three successive five-year periods and generally require us to pay a proportionate share of real estate taxes, insurance and common area or other charges.
| Item 3. | Legal Proceedings |
We are occasionally a party to legal actions arising in the ordinary course of our business, including employment-related claims and actions relating to intellectual property. None of these legal actions, many of which are covered by insurance, has had a material effect on us. Although, as of the date of this annual report, we are not a party to any material pending legal proceedings and are not aware of any claims, litigation is inherently unpredictable. Therefore, we could incur judgments or enter into settlements that could have a material adverse effect on our business, financial condition or results of operations.
| Item 4. | Mine Safety Disclosures |
Not applicable.
24
PART II
| Item 5. | Market for Registrant's Common Equity, Related Stockholder Matters and Issuer Purchases of Equity Securities |
Our common stock has traded on NASDAQ under the symbol “OLLI” since July 16, 2015, our first day of trading subsequent to our initial public offering (“IPO”). Prior to that time, there was no public market for our shares. The following tables set forth for the periods indicated the high and low sales prices of our common stock on NASDAQ.
Fiscal year 2016 |
||||||
High |
Low |
|||||
First Quarter (January 31, 2016 through April 30, 2016) |
$ | 28.72 | $ | 18.97 | ||
Second Quarter (May 1, 2016 through July 30, 2016) |
$ | 26.83 | $ | 22.25 | ||
Third Quarter (July 31, 2016 through October 29, 2016) |
$ | 28.60 | $ | 24.12 | ||
Fourth Quarter (October 30, 2016 through January 28, 2017) |
$ | 32.75 | $ | 25.65 | ||
Fiscal year 2015 |
||||||
High |
Low |
|||||
Second Quarter (July 16, 2015 (first trading date after IPO) through August 1, 2015) |
$ | 22.99 | $ | 18.28 | ||
Third Quarter (August 2, 2015 through October 31, 2015) |
$ | 21.19 | $ | 14.88 | ||
Fourth Quarter (November 1, 2015 through January 30, 2016) |
$ | 22.53 | $ | 15.61 | ||
As of January 28, 2017, we had approximately 230 stockholders of record.
Stock Performance Graph
The graph set forth below compares the cumulative stockholder return on our common stock between July 16, 2015 (the first day of trading following our IPO) and January 28, 2017 to the cumulative return of (i) the NASDAQ Composite Total Return index and (ii) the NASDAQ US Benchmark Retail Index over the same period. This graph assumes an initial investment of $100 on July 16, 2015 in our common stock, the NASDAQ Composite Total Return index and the NASDAQ US Benchmark Retail Index and assumes the reinvestment of dividends, if any. Such returns are based on historical results and are not intended to suggest future performance.
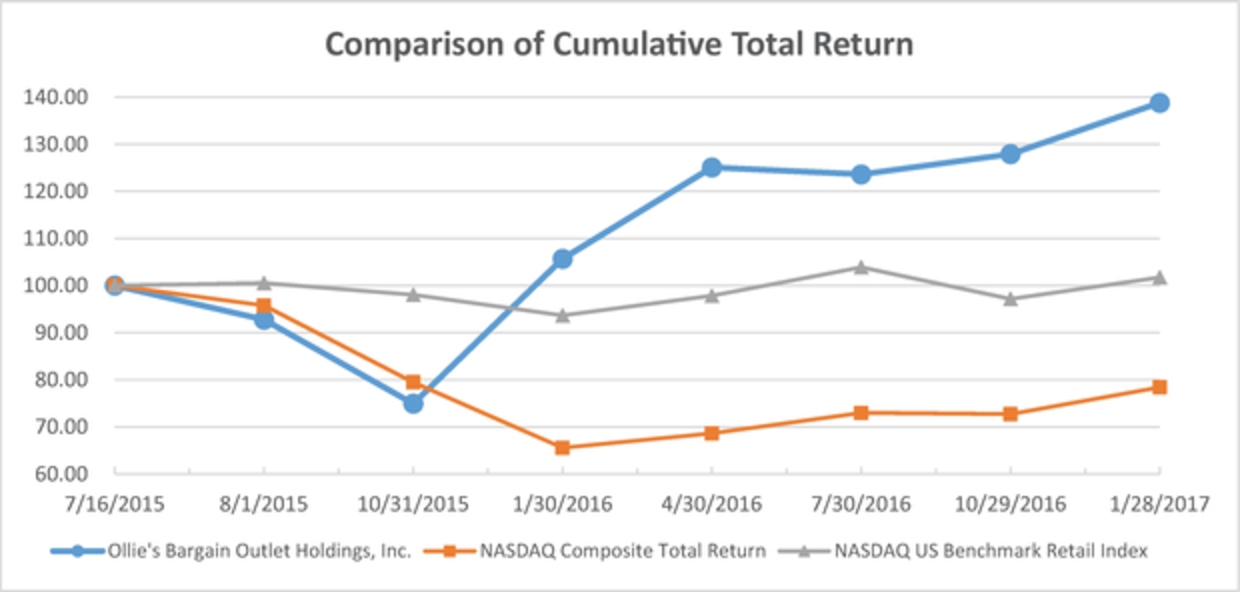
7/16/15 |
8/1/15 |
10/31/15 |
1/30/16 |
4/30/16 |
7/30/16 |
10/29/16 |
1/28/17 |
|||||||||||||||||
Ollie’s Bargain Outlet Holdings, Inc. |
$ | 100.00 | 92.77 | 74.94 | 105.67 | 125.06 | 123.59 | 127.90 | 138.77 | |||||||||||||||
NASDAQ Global Market Composite Index |
$ | 100.00 | 95.76 | 79.47 | 65.56 | 68.62 | 72.98 | 72.70 | 78.42 | |||||||||||||||
NASDAQ US Benchmark Retail Index |
$ | 100.00 | 100.52 | 98.05 | 93.65 | 97.84 | 103.89 | 97.17 | 101.74 | |||||||||||||||
25
Dividends
Our common stock began trading on July 16, 2015. Since then, we have not declared any cash dividends nor do we expect to in the foreseeable future as we intend to retain our earnings to finance the development and growth of our business and operations.
The Credit Facilities contain a number of restrictive covenants that, among other things and subject to certain exceptions, restrict Ollie’s Bargain Outlet, Inc.’s and Ollie’s Holdings, Inc.’s (together the “Borrowers”) ability and the ability of its subsidiaries to pay dividends on our capital stock or redeem, repurchase or retire our capital stock.
Securities Authorized for Issuance Under Equity Compensation Plans
The information required by this Item will be set forth in the Proxy Statement and is incorporated herein by reference.
| Item 6. | Selected Consolidated Financial Data |
The following tables set forth Ollie’s Bargain Outlet Holdings, Inc.’s selected historical consolidated financial and other data for the periods ending on and as of the dates indicated. We derived the consolidated statement of income data and consolidated statement of cash flow data for fiscal years 2016, 2015 and 2014 and the consolidated balance sheet data as of January 28, 2017 and January 30, 2016 from our audited consolidated financial statements and related notes thereto included elsewhere in this Annual Report on Form 10-K. We derived the consolidated statement of income data and consolidated statement of cash flow data for fiscal year 2013 and successor period 2012 and predecessor period 2012 (both described below) and the consolidated balance sheet data as of January 31, 2015, February 1, 2014 and February 2, 2013 from our audited consolidated financial statements and related notes thereto not included in this Annual Report on Form 10-K.
Prior to fiscal year 2013, we operated on a fiscal calendar which resulted in a given fiscal year consisting of a 52- or 53-week period ending on the Saturday closest to December 31 of that year. In connection with the CCMP Acquisition (as defined in Item 7, Management’s Discussion and Analysis of Financial Condition and Results of Operations), as part of the purchase price allocation, assets acquired and liabilities assumed were adjusted to their estimated fair value as of September 28, 2012, the closing date of the CCMP Acquisition. The periods on and prior to September 28, 2012 are referred to as the predecessor periods. The periods on and following September 29, 2012 are referred to as the successor periods. We refer to the period from January 1, 2012 through September 28, 2012 as “predecessor period 2012” and the period from September 29, 2012 through February 2, 2013 as “successor period 2012.”
Each of fiscal years 2016, 2015, 2014, and 2013 consisted of 52-week periods. Successor period 2012 consisted of an 18-week period and predecessor period 2012 consisted of a 39-week period. As a result of the application of purchase accounting in connection with the CCMP Acquisition impacting the successor periods, fiscal years 2016, 2015, 2014 and 2013 and successor period 2012 may not be comparable to predecessor period 2012.
The consolidated statement of income data and consolidated statement of cash flow data for fiscal years 2016, 2015 and 2014 and the consolidated balance sheet data as of January 28, 2017 and January 30, 2016 are not necessarily indicative of the results expected for fiscal year 2017 or for any future period. You should read the information set forth below together with the consolidated financial statements and accompanying notes and the information under “Item 7, Management’s Discussion and Analysis of Financial Condition and Results of Operations” included elsewhere in this Annual Report on Form 10-K.
26
Successor |
||||||||||||||||||
Fiscal year |
Successor period (1) |
Predecessor Period (1) |
||||||||||||||||
2016 |
2015 |
2014 |
2013 |
2012 |
2012 |
|||||||||||||
(in thousands, except per share amounts) |
||||||||||||||||||
Consolidated Statement of Income Data: |
||||||||||||||||||
Net Sales |
$ | 890,315 | $ | 762,370 | $ | 637,975 | $ | 540,718 | $ | 183,644 | $ | 316,135 | ||||||
Cost of sales |
529,904 | 459,506 | 384,465 | 323,908 | 113,376 | 187,811 | ||||||||||||
Gross profit |
360,411 | 302,864 | 253,510 | 216,810 | 70,268 | 128,324 | ||||||||||||
Selling, general and administrative expenses |
242,891 | 209,783 | 178,832 | 153,807 | 53,440 | 100,233 | ||||||||||||
Depreciation and amortization expenses |
8,443 | 7,172 | 6,987 | 8,011 | 3,423 | 3,846 | ||||||||||||
Pre-opening expenses |
6,883 | 6,337 | 4,910 | 4,833 | 665 | 3,521 | ||||||||||||
Operating income |
102,194 | 79,572 | 62,781 | 50,159 | 12,740 | 20,724 | ||||||||||||
Interest expense, net |
5,935 | 15,416 | 18,432 | 17,493 | 5,832 | 4,425 | ||||||||||||
Loss on extinguishment of debt |
— | 6,710 | 671 | 1,848 | — | — | ||||||||||||
Income before income taxes |
96,259 | 57,446 | 43,678 | 30,818 | 6,908 | 16,299 | ||||||||||||
Income tax expense |
36,495 | 21,607 | 16,763 | 11,277 | 3,303 | 7,286 | ||||||||||||
Net income |
$ | 59,764 | $ | 35,839 | $ | 26,915 | $ | 19,541 | $ | 3,605 | $ | 9,013 | ||||||
Earnings per common share: |
||||||||||||||||||
Basic |
$ | 0.99 | $ | 0.67 | $ | 0.56 | $ | 0.40 | ||||||||||
Diluted |
$ | 0.96 | $ | 0.64 | $ | 0.55 | $ | 0.40 | ||||||||||
Weighted average common shares outstanding: |
||||||||||||||||||
Basic |
60,160 | 53,835 | 48,202 | 48,519 | ||||||||||||||
Diluted |
62,415 | 55,796 | 48,609 | 48,519 | ||||||||||||||
Consolidated Statement of Cash Flows Data: |
||||||||||||||||||
Net cash provided by (used in): |
||||||||||||||||||
Operating activities |
$ | 67,088 | $ | 45,848 | $ | 31,842 | $ | 19,713 | $ | 25,161 | $ | (6,152 | ) |
|||||
Investing activities |
(16,423 | ) |
(14,337 | ) |
(14,007 | ) |
(9,554 | ) |
(696,505 | ) |
(6,948 | ) |
||||||
Financing activities |
17,759 | (23,204 | ) |
(8,049 | ) |
(2,593 | ) |
675,944 | 2,503 | |||||||||
As of |
||||||||||||||||||
January 28, 2017 |
January 30, 2016 |
January 31, 2015 |
February 1, 2014 |
February 2, 2013 |
||||||||||||||
(dollars in thousands) |
||||||||||||||||||
Consolidated Balance Sheet Data: |
||||||||||||||||||
Cash and cash equivalents |
$ | 98,683 | $ | 30,259 | $ | 21,952 | $ | 12,166 | $ | 4,600 | ||||||||
Total assets |
1,039,375 | 943,822 | 917,131 | 879,278 | 851,165 | |||||||||||||
Total debt (2) |
194,000 | 198,451 | 321,287 | 268,479 | 222,062 | |||||||||||||
Total liabilities |
388,114 | 381,873 | 500,296 | 435,139 | 383,809 | |||||||||||||
Total stockholders’ equity |
651,261 | 561,949 | 416,835 | 444,139 | 467,356 | |||||||||||||
| (1) | Successor period 2012 consists of the 18-week period from September 29, 2012 to February 2, 2013, and Predecessor period 2012 consists of the 39-week period from January 1, 2012 to September 28, 2012. For the month ended January 28, 2012, net sales were $23.3 million and net loss was $0.3 million. For the month ended February 2, 2013, net sales were $32.4 million and net loss was $0.6 million. |
| (2) | Represents total outstanding indebtedness, net of unamortized original issue discount of $0.1 million and deferred financing fees of $1.2 million and $1.5 million, as of January 28, 2017 and January 30, 2016, respectively. See Note 5 to our audited consolidated financial statements included elsewhere in this Annual Report on Form 10-K. |
27
| Item 7. | Management’s Discussion and Analysis of Financial Condition and Results of Operations |
You should read the following discussion together with “Item 6, Selected Consolidated Financial Data” and the financial statements and related notes included elsewhere in this Annual Report on Form 10-K. The statements in this discussion regarding expectations of our future performance, liquidity and capital resources and other non-historical statements are forward-looking statements. These forward-looking statements are subject to numerous risks and uncertainties, including, but not limited to, the risks and uncertainties described in “Item 1A, Risk Factors” and “Cautionary note regarding forward-looking statements.” Our actual results may differ materially from those contained in or implied by any forward-looking statements.
We operate on a fiscal calendar widely used by the retail industry that results in a given fiscal year consisting of a 52- or 53-week period ending on the Saturday closest to January 31 of the following year. References to “fiscal year 2016” refer to the fiscal year ended January 28, 2017, references to “fiscal year 2015” refer to the fiscal year ended January 30, 2016 and references to “fiscal year 2014” refer to the fiscal year ended January 31, 2015. Each of fiscal years 2016, 2015 and 2014 consisted of a 52-week period. References to “fiscal year 2017” refer to the fiscal year ending February 3, 2018, which consists of a 53-week period.
Overview
Ollie’s is a highly differentiated and fast-growing, extreme value retailer of brand name merchandise at drastically reduced prices. Known for our assortment of “Good Stuff Cheap®,” we offer customers a broad selection of brand name products, including food, housewares, books and stationery, bed and bath, floor coverings, electronics, and toys. Our differentiated go-to market strategy is characterized by a unique, fun and engaging treasure hunt shopping experience, compelling customer value proposition and witty, humorous in-store signage and advertising campaigns. These attributes have driven our rapid growth and strong and consistent store performance as evidenced by our store base expansion from 131 stores to 234 stores, net sales growth from $476.5 million to $890.3 million and average net sales per store ranging from $3.8 million to $4.1 million between fiscal year 2012 and fiscal year 2016. Furthermore, our comparable store sales increased from $713.4 million in fiscal year 2015 to $736.0 million in fiscal year 2016, or 3.2%, and our non-comparable store sales increased from $49.0 million in fiscal year 2015 to $154.3 million in fiscal year 2016.
Our Growth Strategy
Since the founding of Ollie’s in 1982, we have grown organically by backfilling existing markets and leveraging our brand awareness, marketing and infrastructure to expand into new markets in contiguous states. In 2003, Mark Butler, our co-founder, assumed his current role as President and Chief Executive Officer. Under Mr. Butler’s leadership, we expanded from 28 stores located in three states at the end of fiscal year 2003 to 234 stores located in 19 states as of January 28, 2017.
Our stores are supported by two distribution centers, one in York, PA and one in Commerce, GA, which we believe can support between 375 to 400 stores. We have invested in our associates, infrastructure, distribution network and information systems to allow us to continue to rapidly grow our store footprint, including:
| • | growing our merchant buying team to increase our access to brand name/closeout merchandise; |
| • | adding members to our senior management team; |
| • | opening two new distribution centers since 2011 with a total capacity of approximately 1.6 million square feet; and |
| • | investing in information technology, accounting, and warehouse management systems. |
Our business model has produced consistent and predictable store growth over the past several years, during both strong and weaker economic cycles. We plan to continue to enhance our competitive positioning and drive growth in sales and profitability by executing on the following strategies:
| • | growing our store base; |
| • | increasing our offerings of great bargains; and |
| • | leveraging and expanding Ollie’s Army. |
We have a proven portable, flexible, and highly profitable store model that has produced consistent financial results and returns. Our new store model targets a store size between 25,000 to 35,000 square feet and an average initial cash
28
investment of $1.0 million, which includes store fixtures and equipment, store-level and distribution center inventory (net of payables) and pre-opening expenses. We target new stores sales of $3.7 million.
While we are focused on driving comparable store sales and managing our expenses, our revenue and profitability growth will primarily come from opening new stores. The core elements of our business model are procuring great deals, offering extreme values to our customers and creating consistent, predictable store growth and margins. In addition, our new stores generally open strong, immediately contributing to the growth in net sales and profitability of our business. From fiscal year 2012 to fiscal year 2016, net sales grew at a CAGR of 17.0%. We plan to achieve continued net sales growth, including comparable stores sales, by adding additional stores to our store base and by continuing to provide quality merchandise at a value for our customers as we scale and gain more access to purchase directly from major manufacturers. We also plan to leverage and expand our Ollie’s Army database marketing strategies. In addition, we plan to continue to manage our selling, general and administrative expenses by continuing to make process improvements and by maintaining our standard policy of reviewing our operating costs.
Our ability to grow and our results of operations may be impacted by additional factors and uncertainties, such as consumer spending habits, which are subject to macroeconomic conditions and changes in discretionary income. Our customers’ discretionary income is primarily impacted by gas prices, wages and consumer trends and preferences, which fluctuate depending on the environment. The potential consolidation of our competitors or other changes in our competitive landscape could also impact our results of operations or our ability, even though we compete with a broad range of retailers.
Our key competitive advantage is our direct buying relationships with many major manufacturers, wholesalers, distributors, brokers and retailers for our brand name and closeout products and unbranded goods. We also augment our product mix with private label brands. As we continue to grow, we believe our increased scale will provide us with even greater access to brand name and closeout products as major manufacturers seek a single buyer to acquire an entire deal.
How We Assess the Performance of Our Business and Key Line Items
We consider a variety of financial and operating measures in assessing the performance of our business. The key measures we use are number of new stores, net sales, comparable store sales, gross profit and gross margin, selling, general and administrative expenses, pre-opening expenses, operating income, EBITDA and Adjusted EBITDA.
Number of New Stores
The number of new stores reflects the number of stores opened during a particular reporting period. Before we open new stores, we make initial capital investments in fixtures, equipment and inventory, which we amortize over time, and we incur pre-opening expenses described below under “Pre-Opening Expenses.”
We opened 31 new stores in fiscal year 2016. We expect new store growth to be the primary driver of our sales growth. Our initial lease terms are typically between five to seven years with options to renew for two or three successive five-year periods. Our portable and predictable real estate model focuses on backfilling existing markets and entering new markets in contiguous states. Our new stores often open with higher sales levels as a result of greater advertising and promotional spend in connection with grand opening events, but decline shortly thereafter to our new store model levels.
Net Sales
Net sales constitute gross sales net of returns and sales tax. Net sales consist of sales from comparable stores and non-comparable stores, described below under “Comparable Store Sales.” Growth of our net sales is primarily driven by expansion of our store base in existing and new markets. As we continue to grow, we believe we will have greater access to brand name and closeout merchandise and an increased deal selection, resulting in more potential offerings for our customers. Net sales are impacted by product mix, merchandise mix and availability, as well as promotional activities and the spending habits of our customers. Our broad selection of offerings across diverse product categories supports growth in net sales by attracting new customers, which results in higher spending levels and frequency of shopping visits from our customers, including Ollie’s Army members.
The spending habits of our customers are subject to macroeconomic conditions and changes in discretionary income. Our customers’ discretionary income is primarily impacted by gas prices, wages, and consumer trends and
29
preferences, which fluctuate depending on the environment. However, because we offer a broad selection of merchandise at extreme values, we believe we are less impacted than other retailers by economic cycles. These cycles correspond with declines in general consumer spending habits and we benefit from periods of increased consumer spending.
Comparable Store Sales
Comparable store sales measure performance of a store during the current reporting period against the performance of the same store in the corresponding period of the previous year. Comparable store sales consists of net sales from our stores beginning on the first day of the sixteenth full fiscal month following the store’s opening, which is when we believe comparability is achieved. Comparable store sales are impacted by the same factors that impact net sales.
We define comparable stores to be stores:
| • | that have been remodeled while remaining open; |
| • | that are closed for five or fewer days in any fiscal month; |
| • | that are closed temporarily and relocated within their respective trade areas; and |
| • | that have expanded, but are not significantly different in size, within their current locations. |
Non-comparable store sales consist of new store sales and sales for stores not open for a full 15 months. Stores which are closed temporarily, but for more than five days in any fiscal month, are included in non-comparable store sales beginning in the fiscal month in which the temporary closure begins until the first full month of operation once the store re-opens, at which time they are included in comparable store sales.
Opening new stores is the primary component of our growth strategy and as we continue to execute on our growth strategy, we expect a significant portion of our sales growth will be attributable to non-comparable store sales. Accordingly, comparable store sales are only one measure we use to assess the success of our growth strategy.
Gross Profit and Gross Margin
Gross profit is equal to our net sales less our cost of sales. Cost of sales includes merchandise costs, transportation costs, inventory markdowns, shrink, and certain distribution, warehousing and storage costs, including depreciation. Gross margin is gross profit as a percentage of our net sales. Gross margin is a measure used by management to indicate whether we are selling merchandise at an appropriate gross profit.
In addition, our gross profit margin is impacted by product mix, as some products generally provide higher gross margins, by our merchandise mix and availability, and by our merchandise cost, which can vary.
Our gross profit is variable in nature and generally follows changes in net sales. We regularly analyze the components of gross profit, as well as gross profit as a percentage of sales. Specifically, our product margin and merchandise mix is reviewed by our merchant team and senior management, ensuring strict adherence to internal margin goals. Our disciplined buying approach has produced consistent gross margins and we believe helps to mitigate adverse impacts on gross profit and results of operation.
The components of our cost of sales may not be comparable to the components of cost of sales or similar measures of our competitors and other retailers. As a result, our gross profit and gross margin may not be comparable to similar data made available by our competitors and other retailers.
Selling, General and Administrative Expenses
Selling, general and administrative expenses are comprised of payroll and benefits for store, field support and support center associates. Selling, general and administrative expenses also include marketing and advertising, occupancy, utilities, supplies, credit card processing fees, insurance and professional services. The components of our selling, general and administrative expense remain relatively consistent per store and for each new store opening. Consolidated selling, general and administrative expenses generally increase as we grow our store base and as our net sales increase. A significant portion of our expenses is primarily fixed in nature, and we expect to continue to maintain strict discipline while carefully monitoring selling, general and administrative expenses as a percentage of net sales.
The components of our selling, general and administrative expenses may not be comparable to the components of similar measures of other retailers. We expect that our selling, general and administrative expenses will continue to
30
increase in future periods with future growth and in part due to additional legal, accounting, insurance, and other expenses as a result of being a public company, including compliance with the Sarbanes-Oxley Act and related rules and regulations.
Pre-Opening Expenses
Pre-opening expenses consist of expenses of opening new stores and distribution centers. For new stores, pre-opening expenses include grand opening advertising costs, payroll expenses, travel expenses, employee training costs, rent expenses and store setup costs, as well as store closing costs. Pre-opening expenses for new stores are expensed as they are incurred, which is typically within 30 to 45 days of opening a new store. For distribution centers, pre-opening expenses primarily include inventory transportation costs, employee travel expenses and occupancy costs.
Operating Income
Operating income is gross profit less selling, general and administrative expenses, depreciation and amortization and pre-opening expenses. Operating income excludes interest expense, net and income tax expense. We use operating income as an indicator of the productivity of our business and our ability to manage expenses.
Depreciation and amortization expenses
Property and equipment are stated at original cost less accumulated depreciation and amortization. Depreciation and amortization are calculated over the estimated useful lives of the related assets, or in the case of leasehold improvements, the lesser of the useful lives or the remaining term of the lease. Expenditures for additions, renewals, and betterments are capitalized; expenditures for maintenance and repairs are charged to expense as incurred. Depreciation is computed on the straight-line method for financial reporting purposes. Depreciation as it relates to our distribution centers is included within cost of sales on the consolidated statements of income.
EBITDA and Adjusted EBITDA
EBITDA and Adjusted EBITDA are key metrics used by management and our Board to assess our financial performance. EBITDA and Adjusted EBITDA are also frequently used by analysts, investors and other interested parties to evaluate companies in our industry. We use Adjusted EBITDA to supplement GAAP measures of performance to evaluate the effectiveness of our business strategies, to make budgeting decisions, to evaluate our performance in connection with compensation decisions and to compare our performance against that of other peer companies using similar measures. Management believes it is useful to investors and analyst to evaluate these non-GAAP measures on the same basis as management uses to evaluate the Company’s operating results. We believe that excluding items that may not be indicative of, or are unrelated to, our core operating results, and that may vary in frequency or magnitude from operating income, net income and net income per diluted share, enhances the comparability of our results and provides a better baseline for analyzing trends in our business.
We define EBITDA as net income before net interest expense, loss on extinguishment of debt, depreciation and amortization expenses and income taxes. Adjusted EBITDA represents EBITDA as further adjusted for non-cash stock based compensation expense, non-cash purchase accounting items, transaction related expenses and debt financing expenses, which we do not consider representative of our ongoing operating performance. EBITDA and Adjusted EBITDA are non-GAAP measures and may not be comparable to similar measures reported by other companies. EBITDA and Adjusted EBITDA have limitations as analytical tools, and you should not consider them in isolation, or as a substitute for analysis of our results as reported under GAAP. In the future we may incur expenses or charges such as those added back to calculate Adjusted EBITDA. Our presentation of Adjusted EBITDA should not be construed as an inference that our future results will be unaffected by these items. For further discussion of EBITDA and Adjusted EBITDA and for reconciliations of EBITDA and Adjusted EBITDA to net income, the most directly comparable GAAP measure, see “Results of Operations.”
Factors Affecting the Comparability of our Results of Operations
Our results over the past three years have been affected by the following events, which must be understood in order to assess the comparability of our period-to-period financial performance and condition.
Initial Public Offering and Subsequent Equity Offerings
On July 15, 2015, we priced our initial public offering of 8,925,000 shares of our common stock. As a result of the IPO, we received net proceeds of $153.1 million, after deducting the underwriting fees of $11.1 million. We used the net proceeds from the IPO to pay off outstanding borrowings under our then-existing senior secured asset-based
31
revolving credit facility (the “Old Revolving Credit Facility”) and a portion of the outstanding principal balance of our then-existing senior secured term loan facility (the “Old Term Loan Facility” and together, the “Old Credit Facilities”), which we had entered into in connection with the CCMP Acquisition described below. In advance of and in connection with the IPO, on June 17, 2015, the Company effected a stock split of the Company’s common stock at a ratio of 115 shares for every share previously held. All common stock share and common stock per share amounts for all periods presented in these financial statements have been adjusted retroactively to reflect the stock split.
Following our IPO, we completed several secondary equity offerings of shares of common stock held by affiliates of our private equity sponsor, CCMP Capital Advisors, LLC (collectively “CCMP”) and other management stockholders. We were acquired by CCMP and certain members of management in September 2012 (the “CCMP Acquisition”). During fiscal year 2016, CCMP liquidated its ownership position in Ollie’s.
Financing Transactions and Payments to Stockholders
On April 11, 2014, we entered into an amendment to the Old Term Loan Facility, which allowed additional borrowings in an aggregate principal amount of $60.0 million, allowing us to distribute $58.0 million as a special cash dividend to common stockholders as consented by the original Old Term Loan Facility lenders. The proceeds received were net of $2.0 million in fees, of which $1.3 million was recognized as deferred financing fees, $0.4 million was recorded as additional original issue discount, and $0.3 million was recognized as selling, general and administrative expenses. In connection with this amendment, $0.4 million of debt issuance cost and $0.2 million of original issue discount were accelerated on the date of the amendment and included within loss on extinguishment of debt.
On May 27, 2015 we amended the credit agreements governing our Old Credit Facilities to, among other things, increase the size of the Old Revolving Credit Facility from $75.0 million to $125.0 million and to permit a dividend to holders of our outstanding common stock. We also drew $50.0 million of borrowings on the Old Revolving Credit Facility, the proceeds of which were used to pay an aggregate cash dividend of $48.8 million to holders of our common stock, $1.1 million of bank fees and $0.1 million of legal and other expenses.
On July 15, 2015, we priced our IPO of 8,925,000 shares of our common stock. As noted above, we used the net proceeds from the IPO to pay off outstanding borrowings under the Old Revolving Credit Facility and a portion of the outstanding principal balance of the Old Term Loan Facility.
On January 29, 2016, we completed a transaction in which we refinanced the Old Credit Facilities with the proceeds of our Credit Facilities, consisting of the $200.0 million Term Loan Facility and the $100.0 million Revolving Credit Facility, which includes a $25.0 million sub-facility for letters of credit and a $25.0 million sub-facility for swingline loans (the “Refinancing”). We incurred various arrangement fees and legal fees totaling $2.1 million in connection with the Refinancing, of which $2.0 million was recorded as deferred financing fees and $0.1 million was recognized as selling, general and administrative expense on the date of the Refinancing. See “Liquidity and Capital Resources.”
Store Openings
During fiscal years 2016, 2015 and 2014, we opened 31 new stores, opened 28 new stores and closed one store and opened 22 new stores, respectively. In connection with these store openings, we incurred pre-opening expenses of $6.9 million, $6.3 million and $4.9 million in fiscal years 2016, 2015 and 2014, respectively. In fiscal 2017, we expect to open between 33 and 35 new stores and enter the state of Rhode Island.
Distribution Center
In April 2014, we opened our second distribution center, located in Commerce, GA. We incurred certain start-up costs related to the opening of this distribution center, including costs associated with securing the 962,280 square foot site and entering into the lease arrangements. As of January 28, 2017, we are entitled to occupy 699,840 square feet of the facility and are under a lease obligation to incrementally add square footage up to 962,280 square feet through November 2017. In fiscal year 2014, we also incurred additional costs of $0.3 million associated with the opening and start-up of the Commerce, GA distribution center. In addition, we incurred costs related to hiring and training new associates for this distribution center. We expect to make additional expenditures related to our utilization of this additional space through 2017.
32
Results of Operations
The following tables summarize key components of our results of operations for the periods indicated, both in dollars and as a percentage of our net sales.
We derived the consolidated statements of income for fiscal years 2016, 2015 and 2014 from our consolidated financial statements and related notes. Our historical results are not necessarily indicative of the results that may be expected in the future.
Fiscal year |
|||||||||
2016 |
2015 |
2014 |
|||||||
(dollars in thousands) |
|||||||||
Net sales |
$ | 890,315 | $ | 762,370 | $ | 637,975 | |||
Cost of sales |
529,904 | 459,506 | 384,465 | ||||||
Gross profit |
360,411 | 302,864 | 253,510 | ||||||
Selling, general and administrative expenses |
242,891 | 209,783 | 178,832 | ||||||
Depreciation and amortization expenses |
8,443 | 7,172 | 6,987 | ||||||
Pre-opening expenses |
6,883 | 6,337 | 4,910 | ||||||
Operating income |
102,194 | 79,572 | 62,781 | ||||||
Interest expense, net |
5,935 | 15,416 | 18,432 | ||||||
Loss on extinguishment of debt |
— | 6,710 | 671 | ||||||
Income before income taxes |
96,259 | 57,446 | 43,678 | ||||||
Income tax expense |
36,495 | 21,607 | 16,763 | ||||||
Net income |
$ | 59,764 | $ | 35,839 | $ | 26,915 | |||
Percentage of net sales (1): |
|||||||||
Net sales |
100.0 | % |
100.0 | % |
100.0 | % |
|||
Cost of sales |
59.5 | 60.3 | 60.3 | ||||||
Gross profit |
40.5 | 39.7 | 39.7 | ||||||
Selling, general and administrative expenses |
27.3 | 27.5 | 28.0 | ||||||
Depreciation and amortization expenses |
0.9 | 0.9 | 1.1 | ||||||
Pre-opening expenses |
0.8 | 0.8 | 0.8 | ||||||
Operating income |
11.5 | 10.4 | 9.8 | ||||||
Interest expense, net |
0.7 | 2.0 | 2.9 | ||||||
Loss on extinguishment of debt |
— | 0.9 | 0.1 | ||||||
Income before income taxes |
10.8 | 7.5 | 6.8 | ||||||
Income tax expense |
4.1 | 2.8 | 2.6 | ||||||
Net income |
6.7 | % |
4.7 | % |
4.2 | % |
|||
Select Operating Data: |
|||||||||
Number of new stores |
31 | 28 | 22 | ||||||
Number of store closings |
— | (1 | ) |
— | |||||
Number of stores open at end of period |
234 | 203 | 176 | ||||||
Average net sales per store (2) |
$ | 4,050 | $ | 4,007 | $ | 3,815 | |||
Comparable stores sales change |
3.2 | % |
6.0 | % |
4.4 | % |
|||
| (1) | Components may not add to totals due to rounding. |
| (2) | Average net sales per store represents the weighted average of total net sales divided by the number of stores open, in each case at the end of each week in each fiscal period. |
33
The following table provides a reconciliation of our net income to Adjusted EBITDA for the periods presented:
Fiscal year |
|||||||||
2016 |
2015 |
2014 |
|||||||
(dollars in thousands) |
|||||||||
Net Income |
$ | 59,764 | $ | 35,839 | $ | 26,915 | |||
Interest expense, net |
5,935 | 15,416 | 18,432 | ||||||
Loss on extinguishment of debt |
— | 6,710 | 671 | ||||||
Depreciation and amortization expenses (1) |
10,668 | 9,342 | 8,785 | ||||||
Income tax expense |
36,495 | 21,607 | 16,763 | ||||||
EBITDA |
$ | 112,862 | $ | 88,914 | $ | 71,566 | |||
Non-cash stock based compensation expense |
6,685 | 5,035 | 3,761 | ||||||
Non-cash purchase accounting items (2) |
(134 | ) |
(284 | ) |
(383 | ) |
|||
Transaction related expenses (3) |
1,736 | 322 | — | ||||||
Debt financing expenses (4) |
— | 89 | 446 | ||||||
Adjusted EBITDA |
$ | 121,149 | $ | 94,076 | $ | 75,390 | |||
| (1) | Includes depreciation and amortization relating to our distribution centers, which is included within cost of sales on our consolidated statements of income. |
| (2) | Includes purchase accounting impact from unfavorable lease liabilities related to the CCMP Acquisition. |
| (3) | Represents professional services and one-time compensation expenses related to the fiscal year 2015 IPO and the fiscal year 2016 secondary offering transactions. |
| (4) | Represents fees and expenses related to amendments to our Old Credit Facilities in fiscal years 2014 and 2015. |
Fiscal year 2016 compared to fiscal year 2015
Net Sales
Net sales increased to $890.3 million for fiscal year 2016 from $762.4 million for fiscal year 2015, an increase of $127.9 million, or 16.8%. The increase was the result of a comparable store sales increase of $22.6 million, or 3.2%, and a non-comparable store sales increase of $105.3 million. Our increase in non-comparable store sales was primarily driven by the timing of new stores which opened during fiscal year 2015 but were not open for a full 15 months during fiscal year 2016, as well as 31 new stores which opened during fiscal year 2016.
Comparable store sales increased 3.2% for fiscal year 2016 compared to a 6.0% increase for fiscal year 2015. The increase in comparable store sales during fiscal year 2016 was driven by an increase in the number of customer transactions as well as an increase in the average transaction size. On a department basis, the increase was primarily driven by strong results in the health and beauty aids, electronics, food and candy, seasonal and toy departments, slightly offset by decreases in our books and stationery, furniture and hardware departments.
Cost of Sales
Cost of sales increased to $529.9 million for fiscal year 2016 from $459.5 million for fiscal year 2015, an increase of $70.4 million, or 15.3%. The increase in cost of sales was primarily a result of increased net sales.
Gross Profit and Gross Margin
Gross profit increased to $360.4 million for fiscal year 2016 from $302.9 million for fiscal year 2015, an increase of $57.5 million, or 19.0%. The increase in gross profit was primarily the result of new store growth and increases in comparable store sales. Our gross margin increased to 40.5% from 39.7% for fiscal years 2016 and 2015, respectively. The increase in gross margin in fiscal year 2016 was due to lower distribution and transportation expenses as a percentage of net sales, primarily due to lower fuel costs and import container rates.
Selling, General and Administrative Expenses
Selling, general and administrative expenses increased to $242.9 million for fiscal year 2016 from $209.8 million for fiscal year 2015, an increase of $33.1 million, or 15.8%. As a percentage of net sales, selling, general and administrative expenses decreased 20 basis points to 27.3% for fiscal year 2016 compared to 27.5% for fiscal year
34
2015. The increase in selling, general and administrative expenses was primarily the result of increases in store-related expenses of $25.8 million to support new store growth. These increased expenses consisted primarily of store payroll and benefits, store occupancy costs, and other store-related expenses, as well as investments in general and administration infrastructure to support continued growth in the business, public company expenses and costs related to our secondary offering transactions.
Depreciation and Amortization Expense
Depreciation and amortization expenses increased to $8.4 million for fiscal year 2016 from $7.2 million for fiscal year 2015, an increase of $1.3 million, or 17.7%. The increase is primarily a result of new store growth.
Pre-Opening Expenses
Pre-opening expenses increased to $6.9 million for fiscal year 2016 from $6.3 million for fiscal year 2015, an increase of $0.5 million, or 8.6%. The increase primarily relates to expenses incurred in opening 31 stores during fiscal year 2016 compared to opening 28 stores and one store closing during fiscal year 2015.
Interest Expense, Net
Net interest expense decreased to $5.9 million for fiscal year 2016 from $15.4 million for fiscal year 2015, a decrease of $9.5 million or 61.5%. The decrease in fiscal year 2016 was primarily due to proceeds from the IPO reducing borrowings on our Credit Facilities. Additionally, the effective interest rate on our Credit Facilities decreased as a result of the Refinancing that occurred on January 29, 2016.
Income Tax Expense
Income tax expense increased to $36.5 million for fiscal year 2016 from $21.6 million for fiscal year 2015, an increase of $14.9 million, or 68.9%. This increase in income tax expense was primarily the result of the $38.8 million increase in pre-tax net income, or 67.6%. Our effective tax rate increased to 37.9% for fiscal year 2016 from 37.6% for fiscal year 2015.
Net Income
As a result of the foregoing, net income increased to $59.8 million for fiscal year 2016 from $35.8 million for fiscal year 2015, an increase of $23.9 million, or 66.8%.
Adjusted EBITDA
Adjusted EBITDA increased to $121.1 million for fiscal year 2016 from $94.1 million for fiscal year 2015, an increase of $27.1 million, or 28.8%. The increase in Adjusted EBITDA for fiscal year 2016 is due primarily to our increase in net sales, which was driven by a 3.2% increase in comparable store sales and a 15.3% increase in store count over fiscal year 2015. We achieved increased gross profit dollars due to the increased sales volume as well as an 80-basis-point increase in our gross margin rate, largely driven by reduced distribution and transportation costs in fiscal year 2016. Additionally, as a result of the sales increase in fiscal year 2016, our selling, general and administrative expenses as a percentage of net sales decreased by 20 basis points, all resulting in the improvement of our Adjusted EBITDA performance compared to the same period last year.
Fiscal year 2015 compared to fiscal year 2014
Net Sales
Net sales increased to $762.4 million for fiscal year 2015 from $638.0 million for fiscal year 2014, an increase of $124.4 million, or 19.5%. The increase was the result of a comparable store sales increase of $36.5 million, or 6.0% and a non-comparable store sales increase of $87.9 million. Our increase in non-comparable store sales was primarily driven by the timing of new stores, which opened during fiscal year 2014, but were not open for a full 15 months during fiscal year 2015, as well as 28 new stores which opened during fiscal year 2015.
Comparable store sales increased 6.0% for fiscal year 2015 compared to a 4.4% increase for fiscal year 2014. The increase in comparable store sales during fiscal year 2015 was driven by increased sales volume and increased
35
customer visits at our locations. On a department basis the increase was primarily driven by strong results in the food and candy, electronic accessories and the books and stationery departments, slightly offset by decreases in our housewares department as predominately mild weather during the last months of the fiscal year negatively impacted the sales of heaters.
Cost of Sales
Cost of sales increased to $459.5 million for fiscal year 2015 from $384.5 million for fiscal year 2014, an increase of $75.0 million, or 19.5%. The increase in cost of sales was primarily a result of increased net sales and to a lesser extent increased transportation and distribution expenses.
Gross Profit and Gross Margin
Gross profit increased to $302.9 million for fiscal year 2015 from $253.5 million for fiscal year 2014, an increase of $49.4 million, or 19.5%. The increase in gross profit was primarily the result of new store growth and increases in comparable store sales. Our gross margin remained at 39.7% for fiscal years 2015 and 2014. The consistency in gross margin was primarily attributable to favorable increases in our merchandise margin for fiscal year 2015 and was partially offset by increased distribution center costs.
Selling, General and Administrative Expenses
Selling, general and administrative expenses increased to $209.8 million for fiscal year 2015 from $178.8 million for fiscal year 2014, an increase of $31.0 million, or 17.3%. As a percentage of net sales, selling, general and administrative expenses decreased 50 basis points to 27.5% for fiscal year 2015 compared to 28.0% for fiscal year 2014. The increase in selling, general and administrative expenses was primarily the result of increases in store-related expenses of $26.2 million to support new store growth. These increased expenses consisted primarily of store payroll and benefits, store occupancy costs, and other store related expenses, as well as, investments in general and administration infrastructure to support continued growth in the business, public company expenses and costs related to our IPO.
Depreciation and Amortization Expense
Depreciation and amortization expenses increased to $7.2 million for fiscal year 2015, from $7.0 million for fiscal year 2014, an increase of $0.2 million, or 2.7%. The increase is primarily a result of new store growth and the annualized impact of the opening of the Commerce, GA distribution center in April 2014.
Pre-Opening Expenses
Pre-opening expenses increased to $6.3 million for fiscal year 2015 from $4.9 million for fiscal year 2014, an increase of $1.4 million, or 29.1%. The increase primarily relates to the pre-opening expenses incurred in opening 28 stores and closing one store during fiscal year 2015 compared to 22 store openings during fiscal year 2014. The increase in pre-opening expenses was partially offset by reductions in the expense from the Commerce, GA distribution center which opened in April 2014.
Interest Expense, Net
Net interest expense decreased to $15.4 million for fiscal year 2015 from $18.4 million in fiscal year 2014, a decrease of $3.0 million or 16.4%. Proceeds from the IPO were used to reduce borrowings on the Term Loan Facility and the Revolving Credit Facility, which primarily caused the decrease in interest expense for fiscal year 2015.
Loss on extinguishment of debt
Loss on extinguishment of debt increased to $6.7 million for fiscal year 2015 from $0.7 million for fiscal year 2014, an increase of $6.0 million. The loss on extinguishment of debt for fiscal year 2015 represents the write off of debt issuance costs and original issue discount due to the pay down of a portion of the Term Loan Facility using the proceeds from the IPO in July 2015 and the Refinancing on January 29, 2016. The loss on extinguishment of debt for fiscal year 2014 relates to the debt issuance cost and original issue discount which was written off as a result of the second amendment to the Old Term Loan Facility which occurred in April 2014.
36
Income Tax Expense
Income tax expense increased to $21.6 million for fiscal year 2015 from $16.8 million for fiscal year 2014, an increase of $4.8 million, or 28.9%. This increase in income tax expense was primarily the result of the $13.8 million increase in pre-tax net income, or 31.5%. Our effective tax rate decreased to 37.6% for fiscal year 2015 from 38.4% for fiscal year 2014. The effective tax rate for fiscal year 2015 was lower than the prior year effective tax rates primarily as a result of a discrete tax benefit related to the impact from the finalization of employment-based tax credits associated with fiscal years 2015 and 2014 and the impact from a slight reduction in the projected state effective tax on the net deferred income tax liabilities.
Net Income
As a result of the foregoing, net income increased to $35.8 million for fiscal year 2015 from $26.9 million for fiscal year 2014, an increase of $8.9 million, or 33.2%.
Adjusted EBITDA
Adjusted EBITDA increased to $94.1 million for fiscal year 2015 from $75.4 million for fiscal year 2014, an increase of $18.7 million, or 24.8%. The increase in Adjusted EBITDA for fiscal year 2015 is due primarily to our increase in net sales which was driven by a 6.0% increase in comparable store sales and a 15.3% increase in store count over fiscal year 2014. Also, as a result of the sales increase, we were able to leverage a 50 basis point decrease in our selling, general and administrative expenses as a percentage of net sales for fiscal year 2015, all resulting to improve our Adjusted EBITDA performance compared to the same period last year.
Liquidity and Capital Resources
Overview
Our primary sources of liquidity are net cash provided by operating activities and borrowings under our Revolving Credit Facility. Our primary cash needs are for capital expenditures and working capital. As of January 28, 2017, we had $98.8 million available to borrow under our $100.0 million Revolving Credit Facility and $98.7 million of cash and cash equivalents on hand. We had $195.0 million of outstanding borrowings under our Term Loan Facility. On May 27, 2015, we amended the credit agreements governing our Old Credit Facilities to, among other things, increase the size of the Old Revolving Credit Facility from $75.0 million to $125.0 million and to permit a dividend to holders of our outstanding common stock. We also drew $50.0 million of borrowings on the Old Revolving Credit Facility, the proceeds of which were used to pay an aggregate cash dividend of $48.8 million to holders of our common stock. We repaid borrowings under our Old Revolving Credit Facility and a portion of our Old Term Loan Facility with the proceeds of our IPO. On January 29, 2016, we completed the Refinancing, in which we refinanced the Old Credit Facilities with the proceeds of the Credit Facilities, consisting of the $200.0 million Term Loan Facility and the $100.0 million Revolving Credit Facility, which includes a $25.0 million sub-facility for letters of credit and a $25.0 million sub-facility for swingline loans. See “—Factors affecting the comparability of our results of operations—Financing transactions and payments to stockholders” and “—Credit facilities.”
Our capital expenditures are primarily related to new store openings, store resets, which consist of improvements to stores as they are needed, expenditures related to our distribution centers, and infrastructure-related investments, including investments related to upgrading and maintaining our information technology systems. For fiscal year 2016, we spent $16.4 million for capital expenditures compared to $14.2 million for fiscal year 2015. We expect to fund capital expenditures from net cash provided by operating activities. We opened 31 new stores during fiscal year 2016 and expect to open between 33 and 35 new stores during fiscal year 2017. We also expect to invest in our distribution centers, store resets and general corporate capital expenditures, including information technology, in fiscal year 2017.
Historically, we have funded our capital expenditures and working capital requirements during the fiscal year with cash on hand and borrowings under our revolving credit facility. When we have used our revolving credit facility, the amount of indebtedness outstanding under it has tended to be the highest in the beginning of our fourth fiscal quarter. Over the past two fiscal years, to the extent we have drawn on the revolving credit facility, we have paid down the borrowings before the end of December each fiscal year with cash generated during our peak selling season in our fourth fiscal quarter.
Our primary working capital requirements are for the purchase of inventory, payroll, rent, other store operating costs, distribution costs and general and administrative costs. Our working capital requirements fluctuate during the year,
37
rising in our third fiscal quarter as we increase quantities of inventory in anticipation of our peak holiday sales season in our fourth fiscal quarter. Fluctuations in working capital are also driven by the timing of new store openings.
Based on our new store growth plans, we believe our cash and cash equivalents position, net cash provided by operating activities and availability under our Revolving Credit Facility will be adequate to finance our planned capital expenditures, working capital requirements and debt service over the next 12 months. If cash provided by operating activities and borrowings under our Revolving Credit Facility are not sufficient or available to meet our capital requirements, then we will be required to obtain additional equity or debt financing in the future. There can be no assurance equity or debt financing will be available to us when we need it or, if available, the terms will be satisfactory to us and not dilutive to our then-current stockholders.
Summary of Cash Flows
A summary of our cash flows from operating, investing and financing activities is presented in the following table:
Fiscal year |
|||||||||
2016 |
2015 |
2014 |
|||||||
(in thousands) |
|||||||||
Net cash provided by operating activities |
$ | 67,088 | $ | 45,848 | $ | 31,842 | |||
Net cash used in investing activities |
(16,423 | ) |
(14,337 | ) |
(14,007 | ) |
|||
Net cash provided by (used in) financing activities |
17,759 | (23,204 | ) |
(8,049 | ) |
||||
Net increase during period in cash |
$ | 68,424 | $ | 8,307 | $ | 9,786 | |||
Cash Provided By Operating Activities
Net cash provided by operating activities for fiscal year 2016 was $67.1 million, an increase from $45.8 million for fiscal year 2015. The increase in net cash provided by operating activities was primarily the result of increased net income due to the opening of 31 new stores and increased profitability.
Net cash provided by operating activities for fiscal year 2015 was $ 45.8 million, an increase from $31.8 million for fiscal year 2014. The increase in fiscal year 2015 net cash provided by operating activities was primarily the result of increased income due to the opening of 27 net new stores and increased profitability. In addition, increases in accrued expenses were offset by a decrease in accounts payable due to the timing of rent and other payments.
Cash Used in Investing Activities
Net cash used in investing activities increased for fiscal year 2016 to $16.4 million from $14.3 million for fiscal year 2015. The increase in cash used in investing activities relates to capital expenditures for 31 new store openings in fiscal year 2016 compared to 28 new store openings in fiscal year 2015 and a purchase of one of our store locations in fiscal year 2016.
Net cash used in investing activities for fiscal year 2015 was $14.3 million, an increase from $14.0 million for fiscal year 2014. The increase in cash used in investing activities relates to capital expenditures for 28 new store openings in fiscal year 2015 compared to 22 new store openings in fiscal year 2014. The increase in cash used in investing activities can also be attributed to the purchase of certain tradenames during fiscal year 2015.
Cash Provided by/Used In Financing Activities
Net cash provided by financing activities for fiscal year 2016 was $17.8 million and net cash used in financing activities for fiscal year 2015 was $23.2 million. The current year favorable variance primarily reflects the $48.8 million dividend payment in fiscal year 2015, with no similar payments in fiscal year 2016.
Net cash used in financing activities for fiscal years 2015 and 2014 was $23.2 million and $8.0 million, respectively. The increase in net cash used in financing activities for fiscal year 2015 was primarily related to the repayment of debt offset by a decrease in the dividend payment in fiscal year 2015 when compared to the dividend payment in fiscal year 2014.
Credit facilities
On January 29, 2016, the Borrowers completed a transaction in which they refinanced the Old Credit Facilities with the proceeds of the Credit Facilities, consisting of the $200.0 million Term Loan Facility and the $100.0 million Revolving Credit Facility, which includes a $25.0 million sub-facility for letters of credit and a $25.0 million
38
sub-facility for swingline loans. The proceeds of the Term Loan Facility, together with cash on hand, were used to repay the existing Old Credit Facilities. Loans under the Credit Facilities mature on January 29, 2021. The interest rates for the Credit Facilities are not subject to a floor and are calculated as the higher of the Prime Rate, the Federal Funds Effective Rate plus 0.50% or the Eurodollar Rate plus 1.0%, plus the Applicable Margin, or, for Eurodollar Loans, the Eurodollar Rate plus the Applicable Margin. The Applicable Margin will vary from 0.75% to 1.25% for a Base Rate Loan and 1.75% to 2.25% for a Eurodollar Loan, based on reference to the total leverage ratio (total debt to Adjusted EBITDA, as defined in the agreement).
The credit agreement governing the Credit Facilities provides that the Borrowers may request increased commitments under the Revolving Credit Facility and additional term loans or additional term facilities under the Term Loan Facility, in each case, subject to certain conditions and in an aggregate principal amount not to exceed (x) $100.0 million, plus (y) in the case of any incremental term loans that serve to effectively extend the maturity of the Term Loan Facility, an amount equal to the reductions in the Term Loan Facility to be replaced thereby plus (z) an additional amount, subject to compliance on a pro forma basis with a total leverage ratio of no greater than 3.25: 1.00 as of January 28, 2017. The effective yield for any such incremental facility under the Term Loan Facility will be subject to a “most favored nation” pricing protection provision with a cushion of 0.50%. The incurrence of any incremental facility under the Term Loan Facility is subject to customary conditions precedent.
As of January 28, 2017, the Term Loan Facility is subject to amortization with principal payable in quarterly installments of $1.25 million to be made on the last business day of each fiscal quarter. The quarterly installment payments increase after January 29, 2018 to $2.50 million. The remaining initial aggregate advances under the Term Loan Facility are payable at maturity.
Under the terms of the Revolving Credit Facility, we can borrow up to 90.0% of the most recent appraised value (valued at cost, discounted for the current net orderly liquidation value) of our eligible inventory, as defined, up to $100.0 million. The Revolving Credit Facility includes a $25.0 million sub-facility for letters of credit and a $25.0 million swingline loan facility. A variable unused line fee will be charged on the average daily unused portion of the Revolving Credit Facility of 0.375% per annum if the total leverage ratio is greater than 3.25: 1.00 or 0.250% if the total leverage ratio is less than 3.25: 1.00. A letter of credit fee will accrue on the aggregate face amount of outstanding letters of credit under the Revolving Credit Facility equal to the interest rate margin for Eurodollar Loans under the Revolving Credit Facility. In addition, a fronting fee will be paid to the letter of credit issuer on the aggregate face amount of outstanding standby letters of credit not to exceed 0.125% per annum, which fee shall be calculated based upon the actual number of days elapsed over a 360 day year and payable in arrears, on the first day of each quarter.
The Credit Facilities require the Borrowers to prepay, subject to certain exceptions, outstanding term loans with:
| • | 100% of net cash proceeds of any incurrence, issuance or sale of indebtedness, other than the net cash proceeds of indebtedness permitted under the Credit Facilities; and |
| • | 100% of net cash proceeds of asset sales, subject to reinvestment rights and certain other exceptions. |
The Revolving Credit Facility requires the Borrowers to first prepay outstanding loans and then cash collateralize outstanding letters of credit if at any time the aggregate amount of outstanding loans, unreimbursed letter of credit drawings and outstanding letters of credit under the Revolving Credit Facility exceeds the Line Cap, in an aggregate amount equal to such excess.
The Borrowers may voluntarily reduce the unutilized portion of the commitment amount and repay outstanding loans under the Credit Facilities at any time without premium or penalty other than customary “breakage” costs with respect to Eurodollar borrowings.
There is no scheduled amortization under the Revolving Credit Facility. The Revolving Credit Facility has a maturity date of January 29, 2021. The term loans under the Term Loan Facility mature on January 29, 2021. The Borrowers are required to repay installments on the term loans in quarterly principal amounts of (i) for each payment date that occurs on or prior to January 29, 2018, $1.25 million or (ii) for each payment date that occurs after January 29, 2018, $2.50 million, with the remaining amount payable on the maturity date.
39
All obligations under the Credit Facilities are unconditionally guaranteed by Bargain Parent, Inc. and certain of Ollie’s Holdings, Inc. existing and future direct and indirect wholly-owned domestic subsidiaries. All obligations under the Credit Facilities, and the guarantees of those obligations, are secured, subject to certain exceptions, by substantially all of Ollie’s Holdings, Inc.’s assets and the assets of the guarantors, including:
| • | A first-priority pledge of all of Ollie’s Bargain Outlet, Inc.’s capital stock directly held by Ollie’s Holdings, Inc., a first-priority pledge of all of Ollie’s Holdings, Inc.’s capital stock directly held by Bargain Parent, Inc. and a first-priority pledge of all of the capital stock directly held by Ollie’s Holdings, Inc. and its subsidiary guarantors (which pledge, in the case of the capital stock of any foreign subsidiary or any “disregarded” domestic subsidiary, will be limited to 65% of the stock of such subsidiary); and |
| • | A first-priority security interest in substantially all of Ollie’s Holdings, Inc.’s and the guarantors’ tangible and intangible assets, including certain deposit accounts. |
The Credit Facilities contain a number of restrictive covenants that, among other things and subject to certain exceptions, restrict the Borrowers’ ability and the ability of its subsidiaries to:
| • | incur additional indebtedness; |
| • | pay dividends on our capital stock or redeem, repurchase or retire our capital stock; |
| • | make investments, acquisitions, loans and advances; |
| • | create negative pledge or restrictions on the payment of dividends or payment of other amounts owed to us from our subsidiaries; |
| • | engage in transactions with our affiliates; |
| • | sell, transfer or otherwise dispose of our assets, including capital stock of our subsidiaries; |
| • | materially alter the business we conduct; |
| • | modify material debt documents and certain other material documents; |
| • | change our fiscal year; |
| • | merge or consolidate; |
| • | enter into any sale and lease-back transactions; |
| • | incur liens; and |
| • | make payments on material subordinated or other debt. |
In addition, we are subject to a consolidated fixed charge coverage ratio test of at least 1.1 to 1.0, tested quarterly. We also were subject to a total leverage ratio test of 4.00:1.00 through October 29, 2016 and are hereafter subject to a total leverage ratio test of 3.50:1.00.
The Credit Facilities also contain certain customary representations and warranties, affirmative covenants and reporting obligations. In addition, the lenders under the Credit Facilities will be permitted to accelerate the loans and terminate commitments thereunder or exercise other specified remedies available to secured creditors upon the occurrence of certain events of default, subject to certain grace periods and exceptions, which will include, among others, payment defaults, breaches of representations and warranties, covenant defaults, cross-defaults to certain material indebtedness, certain events of bankruptcy and insolvency, certain pension plan related events, material judgments and any change of control.
As of January 28, 2017, we had $195.0 million of outstanding borrowings on the Term Loan Facility and no outstanding borrowings under the Revolving Credit Facility, with $98.8 million of borrowing availability, letter of credit commitments of $1.0 million and $0.2 million of rent reserves. The interest rate on the outstanding borrowings under the Term Loan Facility was 1.75% plus the 30-day Eurodollar Rate, or 2.53%. The Revolving Credit Facility also contains a variable unused line fee ranging from 0.250% to 0.375% per annum. We incurred unused line fees of $0.3 million, $0.4 million and $0.2 million for fiscal years 2016, 2015 and 2014, respectively. The loans under the Credit Facilities mature on January 29, 2021.
40
Contractual Obligations
We enter into long-term contractual obligations and commitments in the normal course of business, primarily operating leases.
As of January 28, 2017, our contractual obligations and other commitments were:
Less than 1 year |
1-3 Years |
3-5 Years |
Thereafter |
Total |
|||||||||||
(in thousands) |
|||||||||||||||
Operating lease obligation (1) |
$ | 44,664 | $ | 80,950 | $ | 57,715 | $ | 55,008 | $ | 238,337 | |||||
Principal payments of debt (2) |
5,077 | 20,182 | 170,000 | — | 195,259 | ||||||||||
Interest on long-term debt (3) |
5,045 | 9,272 | 4,223 | — | 18,540 | ||||||||||
Total |
$ | 54,786 | $ | 110,404 | $ | 231,938 | $ | 55,008 | $ | 452,136 | |||||
| (1) | Includes the initial lease term and optional renewal terms that are included in the lease term of our store and distribution center leases in accordance with accounting guidance related to leases. |
| (2) | Includes the aggregate principal payments under the Term Loan Facility and assumes no borrowings under our Revolving Credit Facility. |
| (3) | Represents the expected cash payments for interest on our long-term debt based on the interest rates in place and the amounts outstanding as of the end of each period. |
Off-Balance Sheet Arrangements
Except for operating leases entered into in the normal course of business, we do not have any off-balance sheet arrangements that have or are reasonably likely to have a current or future effect on our financial condition, changes in financial condition, revenues or expenses, results of operations, liquidity, capital expenditures or capital resources that is material to investors.
Seasonality
Our business is seasonal in nature and demand is generally the highest in our fourth fiscal quarter due to the holiday sales season. To prepare for the holiday sales season, we must order and keep in stock more merchandise than we carry during other times of the year and generally engage in additional marketing efforts. We expect inventory levels, along with accounts payable and accrued expenses, to reach their highest levels in our third and fourth fiscal quarters in anticipation of increased net sales during the holiday sales season. As a result of this seasonality, and generally because of variation in consumer spending habits, we experience fluctuations in net sales and working capital requirements during the year. Because we offer a broad selection of merchandise at extreme values, we believe we are less impacted than other retailers by economic cycles which correspond with declines in general consumer spending habits and we believe we still benefit from periods of increased consumer spending.
Critical Accounting Policies and Estimates
We have identified the policies below as critical to our business operations and understanding of our results of operations. The impact and any associated risks related to these policies on our business operations are discussed throughout “Management’s Discussion and Analysis of Financial Condition and Results of Operations” where such policies affect our reported and expected financial results. Our financial statements, which have been prepared in accordance with GAAP, require us to make estimates and judgments that affect the reported amounts of assets, liabilities, revenues, expenses and related disclosures. We base our estimates on historical experience and various other assumptions that we believe to be reasonable under the circumstances. Actual results may differ from these estimates. For a detailed discussion on the application of these and other accounting policies, See Note 1 to our audited consolidated financial statements included elsewhere in this Annual Report on Form 10-K.
Inventories
Inventories are stated at the lower of cost or market determined using the retail inventory method on a first-in, first-out basis. The cost of inventories includes the merchandise cost, transportation costs, and distribution and storage costs. Such costs are thereafter expensed as cost of sales upon the sale of the merchandise.
41
Under the retail inventory method, inventory is segregated into departments of merchandise having similar characteristics, and is stated at its current retail selling value. Inventory retail values are converted to a cost basis by applying specific average cost factors for each merchandise department. Cost factors represent the average cost-to-retail ratio for each merchandise department based on beginning inventory and the current period purchase activity.
The retail inventory method inherently requires management judgments and estimates, such as the amount and timing of permanent markdowns to clear unproductive or slow-moving inventory, which may impact the ending inventory valuation as well as gross margins.
Permanent markdowns designated for clearance activity are recorded when the utility of the inventory has diminished. Factors considered in the determination of permanent markdowns include current and anticipated demand, customer preferences, and age of the merchandise. When a decision is made to permanently markdown merchandise, the resulting gross profit reduction is recognized in the period the markdown is recorded. Demand for merchandise can fluctuate greatly. A significant increase in the demand for merchandise could result in a short-term increase in inventory purchases while a significant decrease in demand could result in an increase in the amount of excess inventory quantities on-hand. If our inventory is determined to be overvalued in the future, we would be required to recognize such costs in costs of goods sold and reduce operating income at the time of such determination. Therefore, although every effort is made to ensure the accuracy of forecasts of merchandise demand, any significant unanticipated changes in demand or in economic conditions within our markets could have a significant impact on the value of our inventory and reported operating results.
Goodwill/Intangible assets
We amortize intangible assets over their useful lives unless it is determined such lives are indefinite. Goodwill and intangible assets having indefinite useful lives are not amortized to earnings, but instead are subject to annual impairment testing or more frequently if events or circumstances indicate that the value of goodwill or intangible assets having indefinite useful lives might be impaired.
Entities have an option to perform a qualitative assessment to determine whether further impairment testing on goodwill is necessary. Specifically, an entity has the option to first assess qualitative factors to determine whether it is necessary to perform the two-step quantitative test. The goodwill quantitative impairment test is a two-step test. Under the first step, the fair value of the reporting unit is compared with its carrying value (including goodwill). If the fair value of the reporting unit is less than its carrying value, an indication of goodwill impairment exists for the reporting unit and the enterprise must perform step two of the impairment test (measurement). Under step two, an impairment loss is recognized for any excess of the carrying amount of the reporting unit’s goodwill over the implied fair value of that goodwill. The implied fair value of goodwill is determined by allocating the fair value of the reporting unit in a manner similar to a purchase price allocation. The residual fair value after the allocation is the implied fair value of the reporting unit goodwill. Fair value of the sole reporting unit for our most recent quantitative test was determined utilizing a combination of valuation methods including both the income approach (including a discounted cash flow analysis) and market approaches (including prior transaction method and comparable public company multiples). The fair value estimates utilized in the impairment testing reflect the use of Level 3 inputs. If the fair value of the reporting unit exceeds its carrying value, step two does not need to be performed. If an entity believes, as a result of its qualitative assessment, that it is more likely than not that the fair value of a reporting unit is less than its carrying amount, the quantitative impairment test is required. Otherwise, no further testing is required. We have selected the fiscal month ending date of October as the annual impairment testing date. For fiscal years 2016, 2015 and 2014, we completed a qualitative impairment test. Based upon the procedures described above, no impairment of goodwill existed.
We are also required to perform impairment tests annually or more frequently if events or circumstances indicate that the value of our nonamortizing intangible assets might be impaired. Our nonamortizing intangible assets as of January 28, 2017 and January 30, 2016 consisted of a tradename. Entities have an option to perform a qualitative assessment to determine whether further impairment testing of nonamortizing intangible assets is necessary. Specifically, an entity has the option to first assess qualitative factors to determine whether it is necessary to perform a quantitative test. We perform the quantitative impairment test using the discounted cash flow method based on management’s projections to determine the fair value of the asset. The carrying amount of the asset is then compared to the fair value. If the carrying amount is greater than fair value, an impairment loss is recorded for the amount that fair value is less than the carrying amount. If an entity believes, as a result of its qualitative assessment, that it is more
42
likely than not that the fair value is less than its carrying amount, the quantitative impairment test is required. Otherwise, no further testing is required. For fiscal years 2016, 2015 and 2014, we completed a qualitative impairment test. Based upon the procedures described above, no impairment of the tradename existed.
Intangible assets with determinable useful lives are amortized over their estimated useful lives and reviewed for impairment whenever events or changes in circumstances indicate that its carrying amount may not be recoverable.
Impairment of long-lived assets
Long-lived assets, such as property and equipment, are reviewed for impairment whenever events or changes in circumstances indicate that the carrying amount of an asset may not be recoverable. If circumstances require a long-lived asset or asset group be tested for possible impairment, we first compare undiscounted cash flows expected to be generated by that asset or asset group to its carrying value. If the carrying value of the long-lived asset or asset group is not recoverable on an undiscounted cash flow basis, impairment is recognized to the extent that the carrying value exceeds its fair value. Fair value is determined through various valuation techniques including discounted cash flow models, quoted market values and third-party independent appraisals, as considered necessary.
We believe that impairment assessment of long-lived assets is critical to the financial statements because the recoverability of the amounts, or lack thereof, could significantly affect our results of operations. Determining whether an impairment has occurred typically requires various estimates and assumptions, including determining which cash flows are directly related to the potentially impaired asset, the useful life over which cash flows will occur, amount of such cash flows, and the asset’s residual value, if any. Measurement of an impairment loss, if any, requires a determination of fair value, which is based on the best information available. We use internal discounted cash flow estimates and independent appraisals as appropriate to determine fair value. We derive the required cash flow estimates from our historical experience and our internal business plans and apply an appropriate discount rate. We group and evaluate long-lived assets for impairment at the individual store level, which is the lowest level at which individual identifiable cash flows are available.
Revenue recognition
Ollie’s recognizes retail sales in its stores when merchandise is sold and the customer takes possession of merchandise. Net sales are presented net of returns and sales tax. We provide an allowance for estimated retail merchandise returns based on prior experience.
Stock-based compensation
Our share-based compensation expense is measured at the grant date, based on the calculated fair value of the award, and is recognized as an expense on a straight-line basis over the associate’s requisite service period (generally the vesting period of the equity grant). We recognize compensation expense based on the estimated grant date fair value using the Black-Scholes option-pricing model for grants of stock options. The determination of the grant date fair value is based on our expected stock price volatility over the expected term of the options, stock option exercise and cancellation behaviors, risk-free interest rates and expected dividends. As a result, if any of the inputs or assumptions used in the Black-Scholes model change significantly, share-based compensation for future awards may differ materially compared with the awards granted previously.
There are significant judgments and estimates inherent in the determination of fair value of share-based awards. These judgments and estimates include determinations of an appropriate valuation method and the selection of appropriate inputs to be used in the valuation model. The use of alternative assumptions, including expected term, volatility, risk-free interest rate and dividend yield, could cause share-based compensation to differ significantly from what has been recorded in the past. Future share-based compensation cost will increase when we grant additional equity awards. Modifications, cancellations or repurchases of awards may require us to accelerate any remaining unearned share-based compensation cost or incur additional cost.
Determination of the fair value of common stock on grant date.
Prior to the consummation of the IPO, our associates were eligible to receive awards as part of our equity incentive plan (the “2012 Plan”). Following the consummation of the IPO, associates are eligible to receive awards from our 2015 Plan. Our stock-based compensation cost is measured at the grant date based on the fair value of the award and is recognized as expense over the requisite service period, which generally represents the vesting period, and includes
43
an estimate of the awards which will be forfeited. Prior to the IPO, we were a private company with no active public market for our common stock. Therefore, prior to the IPO, in connection with each grant of stock options, the fair value of the common stock underlying the awards was determined by and approved by our Board with the assistance of management, which intended all stock options granted to be exercisable at a price per share not less than the per share fair value of our common stock. Given the absence of a public trading market for our common stock, estimating the fair value of our common stock has required complex and subjective judgments and assumptions, including:
| • | valuations of our common stock at each grant date based on our actual operational and financial performance and current business conditions; and |
| • | the trading multiple of companies which we have deemed guideline companies based on a number of factors, including similarity to us with respect to industry, business model, and growth profile. |
For the period from September 28, 2012 to March 11, 2014 the Board considered alternative valuation methodologies but determined the best indication of the fair value of our common stock was the value at which the CCMP Acquisition occurred.
Stock option grants
We granted stock options at an exercise price of $8.70 per share pursuant to our 2012 Plan and determined that the fair value of the common stock on the date of grant was $8.70 per share for the following grant dates:
Issuance date |
Number of options issued |
||
September 28, 2012 |
5,152,575 | ||
March 13, 2013 |
304,750 | ||
June 11, 2013 |
28,750 | ||
September 10, 2013 |
34,500 | ||
December 10, 2013 |
11,500 | ||
March 11, 2014 |
362,250 | ||
In assessing the reasonableness of the fair value of our common stock for the above grants, we considered the following:
| • | the grants that were issued on September 28, 2012 were concurrent with the CCMP Acquisition, which occurred at a value per common stock share of $8.70, which therefore, was determined to be the fair value of the common stock for purposes of the grants. |
| • | for the period from September 28, 2012 to March 11, 2014, no material changes had occurred to the variables impacting the fair value of our common stock that would result in a better indication of fair value than the price at which the CCMP Acquisition was completed. |
On April 11, 2014, we entered into an additional term loan borrowing of $60.0 million as described above in “—Factors affecting the comparability of our results of operations—Financing transactions and payments to stockholders.” The proceeds were used for a special cash dividend to our stockholders.
Pursuant to the anti-dilutive clause in the 2012 Plan, the option exercise price for all options issued prior to the dividend date was reduced to $7.49 from $8.70.
On June 10, 2014, we granted stock options to purchase a total of 408,250 shares of common stock at an exercise price of $9.04 per share pursuant to the 2012 Plan. We determined that the fair value of the common stock on the date of grant was $9.04 per share. To assess the reasonableness of the fair value of our common stock on this date, we considered a valuation approved by the Board (or its compensation committee) utilizing the above valuation method that indicated a valuation price of $9.04 per common share as of May 3, 2014 financial statement date.
Changes from our previous valuation were primarily due to the following:
| • | multiples of our guideline public company peer group were generally higher than at the time of our previous valuation; and |
| • | continued growth in our last 12 months Adjusted EBITDA. |
44
On September 9, 2014 we granted stock options to purchase a total of 86,250 shares of common stock at an exercise price of $9.99 per share pursuant to the 2012 Plan. We determined the fair value of the common stock on the date of grant was $9.99 per share. To assess the reasonableness of the fair value of our common stock on this date, we considered a valuation approved by the Board utilizing the above valuation method which indicated a valuation price of $9.99 per common share as of August 2, 2014 financial statement date.
Changes from our previous valuation were primarily due to the following:
| • | multiples of our guideline public company peer group were generally higher than at the time of our previous valuation; and |
| • | continued growth in our last 12 months Adjusted EBITDA. |
On December 9, 2014, we granted stock options to purchase a total of 63,250 shares of common stock at an exercise price of $11.62 per share pursuant to the 2012 Plan. We determined the fair value of the common stock on the date of both grants was $11.62 per share. To assess the reasonableness of the fair value of our common stock on these dates, we considered a valuation approved by the Board utilizing the above valuation method which indicated a valuation price of $11.62 per common share as of November 1, 2014 financial statement date.
Changes from our previous valuation were primarily due to the following:
| • | multiples of our guideline public company peer group were generally higher than at the time of our previous valuation; and |
| • | continued growth in our last 12 months Adjusted EBITDA. |
For valuations after the consummation of the IPO, our Board (or its compensation committee) will generally determine the fair value of each share of underlying common stock based on the closing price of our common stock as reported on the date of grant.
On March 10, 2015, we granted stock options to purchase a total of 770,500 shares of common stock at an exercise price of $12.56 per share pursuant to the 2012 Plan. We determined the fair value of the common stock on the date of both grants was $12.56 per share. To assess the reasonableness of the fair value of our common stock on these dates, we considered a valuation approved by the Board utilizing the above valuation method which indicated a valuation price of $12.56 per common share as of January 31, 2015.
Changes from our previous valuation were primarily due to the following:
| • | multiples of our guideline public company peer group were generally higher than at the time of our previous valuation; and |
| • | continued growth in our last 12 months Adjusted EBITDA. |
For valuations after the consummation of the IPO, our Board (or its compensation committee) will generally determine the fair value of each share of underlying common stock based on the closing price of our common stock as reported on the date of grant.
On May 27, 2015, we amended the Term Loan and Revolving Credit Facility to, among other things, increase the size of the Revolving Credit Facility from $75.0 million to $125.0 million and to permit a dividend to holders of our outstanding common stock. On May 27, 2015, we borrowed $50.0 million under the Revolving Credit Facility and the proceeds were used to pay an aggregate cash dividend of $48.8 million to holders of outstanding common stock. In addition, pursuant to the anti-dilutive clause in the 2012 Plan, the option exercise price for all options issued prior to the dividend date were reduced as follows:
Grant Date |
Pre-dividend exercise price |
Post-dividend exercise price |
||||
All grants on or before March 11, 2014 |
$ | 7.49 | $ | 6.48 | ||
June 10, 2014 |
9.04 | 8.03 | ||||
September 9, 2014 |
9.99 | 8.97 | ||||
December 9, 2014 |
11.62 | 10.60 | ||||
March 10, 2015 |
12.56 | 11.54 | ||||
45
Income taxes
Income taxes are accounted for under the asset and liability method. Deferred tax assets and liabilities are recognized for the future tax consequences attributable to differences between the financial statement carrying amounts of existing assets and liabilities and their respective tax bases and operating losses and tax credit carry-forwards. Deferred tax assets and liabilities are measured using enacted tax rates expected to apply to taxable income in the years in which those temporary differences are expected to be recovered or settled.
In assessing the realizability of deferred tax assets, we consider whether it is more likely than not that some portion or all of the deferred tax assets will not be realized. The ultimate realization of deferred tax assets is dependent upon the generation of future taxable income during the periods in which the temporary differences become deductible. We consider the scheduled reversal of deferred tax liabilities, projected future taxable income and tax-planning strategies in making this assessment. As of January 28, 2017 and January 30, 2016, we have a net deferred tax liability of $89.2 million and $87.2 million, respectively.
We have no material accrual for uncertain tax positions or interest or penalties related to income taxes as of January 28, 2017 or January 30, 2016, and have not recognized any material uncertain tax positions or interest or penalties related to income taxes during fiscal years 2016, 2015 or 2014.
Recently Issued Accounting Pronouncements
Recently issued accounting standards are discussed in Note 1(w) to the audited consolidated financial statements included elsewhere in this Annual Report on Form 10-K.
| Item 7A. | Quantitative and Qualitative Disclosures About Market Risks |
Interest Rate Risk
Our operating results are subject to risk from interest rate fluctuations on our Credit Facilities, which carry variable interest rates. Our Credit Facilities include a Term Loan Facility and a Revolving Credit Facility with advances tied to a borrowing base. Because our Credit Facilities bear interest at a variable rate, we are exposed to market risks relating to changes in interest rates. As of January 28, 2017, we had no outstanding variable rate debt under our Revolving Credit Facility and $195.0 million of outstanding variable rate debt under our Term Loan Facility. Based on our January 28, 2017 Term Loan Facility balance, an increase or decrease of 1% in the effective interest rate would cause an increase or decrease in interest cost of approximately $2.0 million over the next 12 months. We do not use derivative financial instruments for speculative or trading purposes, but this does not preclude our adoption of specific hedging strategies in the future.
Impact of Inflation
Our results of operations and financial condition are presented based on historical cost. While it is difficult to accurately measure the impact of inflation due to the imprecise nature of the estimates required, we believe the effects of inflation, if any, on our historical results of operations and financial condition have been immaterial. We cannot be assured that our results of operations and financial condition will not be materially impacted by inflation in the future.
46
| Item 8: | Financial Statements and Supplementary Data. |
OLLIE’S BARGAIN OUTLET HOLDINGS, INC. AND SUBSIDIARIES
Index to Consolidated Financial Statements
Page |
|||
Consolidated Financial Statements: |
|||
47
Report of Independent Registered Public Accounting Firm
The Board of Directors and Stockholders
Ollie’s Bargain Outlet Holdings, Inc.:
We have audited the accompanying consolidated balance sheets of Ollie’s Bargain Outlet Holdings, Inc. and subsidiaries as of January 28, 2017 and January 30, 2016, and the related consolidated statements of income, stockholders’ equity, and cash flows for each of the fiscal years in the three-year period ended January 28, 2017. In connection with our audits of the consolidated financial statements, we also have audited the financial statement Schedule 1. These consolidated financial statements and financial statement schedule are the responsibility of the Company’s management. Our responsibility is to express an opinion on these consolidated financial statements and financial schedule based on our audits.
We conducted our audits in accordance with the standards of the Public Company Accounting Oversight Board (United States). Those standards require that we plan and perform the audit to obtain reasonable assurance about whether the financial statements are free of material misstatement. An audit includes examining, on a test basis, evidence supporting the amounts and disclosures in the financial statements. An audit also includes assessing the accounting principles used and significant estimates made by management, as well as evaluating the overall financial statement presentation. We believe that our audits provide a reasonable basis for our opinion.
In our opinion, the consolidated statements referred to above present fairly, in all material respects, the financial position of Ollie’s Bargain Outlet Holdings, Inc. and subsidiaries as of January 28, 2017 and January 30, 2016, and the results of their operations and their cash flows for each of the fiscal years in the three-year period ended January 28 2017, in conformity with U.S. generally accepted accounting principles. Also in our opinion, the related financial statement schedule, when considered in relation to the basic consolidated financial statements taken as a whole, present fairly, in all material respects, the information set forth therein.
We also have audited, in accordance with the standards of the Public Company Accounting Oversight Board (United States), Ollie’s Bargain Outlet Holdings, Inc.’s internal control over financial reporting as of January 28, 2017, based on criteria established in Internal Control – Integrated Framework (2013) issued by the Committee of Sponsoring Organizations of the Treadway Commission (COSO), and our report dated March 29, 2017 expressed an unqualified opinion on the effectiveness of the Company’s internal control over financial reporting.
/s/KPMG LLP
Philadelphia, Pennsylvania
March 29, 2017
48
OLLIE’S BARGAIN OUTLET HOLDINGS, INC. AND SUBSIDIARIES
Consolidated Balance Sheets
(In thousands, except per share amounts)
January 28, 2017 |
January 30, 2016 |
|||||
Assets |
||||||
Current assets: |
||||||
Cash and cash equivalents |
$ | 98,683 | $ | 30,259 | ||
Inventories |
210,107 | 190,608 | ||||
Accounts receivable |
301 | 183 | ||||
Prepaid expenses and other assets |
3,739 | 2,756 | ||||
Total current assets |
312,830 | 223,806 | ||||
Property and equipment, net of accumulated depreciation of $38,393 and $28,270, respectively |
46,333 | 39,292 | ||||
Goodwill |
444,850 | 444,850 | ||||
Trade name and other intangible assets, net of accumulated amortization of $1,636 and $1,259, respectively |
232,977 | 233,354 | ||||
Other assets |
2,385 | 2,520 | ||||
Total assets |
$ | 1,039,375 | $ | 943,822 | ||
Liabilities and Stockholders’ Equity |
||||||
Current liabilities: |
||||||
Current portion of long-term debt |
$ | 5,077 | $ | 5,018 | ||
Accounts payable |
50,448 | 52,075 | ||||
Income taxes payable |
4,548 | 4,102 | ||||
Accrued expenses |
44,748 | 35,573 | ||||
Total current liabilities |
104,821 | 96,768 | ||||
Revolving credit facility |
— | — | ||||
Long-term debt |
188,923 | 193,433 | ||||
Deferred income taxes |
89,224 | 87,171 | ||||
Other long-term liabilities |
5,146 | 4,501 | ||||
Total liabilities |
388,114 | 381,873 | ||||
Stockholders’ equity: |
||||||
Preferred stock - 50,000 shares authorized at $0.001 par value; no shares issued |
— | — | ||||
Common stock - 500,000 shares authorized at $0.001 par value; 60,756 and 58,807 shares issued, respectively |
61 | 59 | ||||
Additional paid-in capital |
565,861 | 536,315 | ||||
Retained earnings |
85,425 | 25,661 | ||||
Treasury - common stock, at cost; 9 shares |
(86 | ) |
(86 | ) |
||
Total stockholders’ equity |
651,261 | 561,949 | ||||
Total liabilities and stockholders’ equity |
$ | 1,039,375 | $ | 943,822 | ||
See accompanying notes to the consolidated financial statements.
49
OLLIE’S BARGAIN OUTLET HOLDINGS, INC. AND SUBSIDIARIES
Consolidated Statements of Income
(In thousands, except per share amounts)
Fiscal year ended |
|||||||||
January 28, 2017 |
January 30, 2016 |
January 31, 2015 |
|||||||
Net sales |
$ | 890,315 | $ | 762,370 | $ | 637,975 | |||
Cost of sales |
529,904 | 459,506 | 384,465 | ||||||
Gross profit |
360,411 | 302,864 | 253,510 | ||||||
Selling, general and administrative expenses |
242,891 | 209,783 | 178,832 | ||||||
Depreciation and amortization expenses |
8,443 | 7,172 | 6,987 | ||||||
Pre-opening expenses |
6,883 | 6,337 | 4,910 | ||||||
Operating income |
102,194 | 79,572 | 62,781 | ||||||
Interest expense, net |
5,935 | 15,416 | 18,432 | ||||||
Loss on extinguishment of debt |
— | 6,710 | 671 | ||||||
Income before income taxes |
96,259 | 57,446 | 43,678 | ||||||
Income tax expense |
36,495 | 21,607 | 16,763 | ||||||
Net income |
$ | 59,764 | $ | 35,839 | $ | 26,915 | |||
Earnings per common share: |
|||||||||
Basic |
$ | 0.99 | $ | 0.67 | $ | 0.56 | |||
Diluted |
$ | 0.96 | $ | 0.64 | $ | 0.55 | |||
Weighted average common shares outstanding: |
|||||||||
Basic |
60,160 | 53,835 | 48,202 | ||||||
Diluted |
62,415 | 55,796 | 48,609 | ||||||
See accompanying notes to the consolidated financial statements.
50
OLLIE’S BARGAIN OUTLET HOLDINGS, INC. AND SUBSIDIARIES
Consolidated Statements of Stockholders’ Equity
(In thousands, except per share amounts)
Common stock – Class A |
Common stock |
Treasury stock |
Additional paid-in capital |
Retained earnings |
Total stockholders’ equity |
||||||||||||||||||||||
Shares |
Amount |
Shares |
Amount |
Shares |
Amount |
||||||||||||||||||||||
Balance as of February 1, 2014 |
48,203 | $ | 48 | — | $ | — | — | $ | — | $ | 423,668 | $ | 20,423 | $ | 444,139 | ||||||||||||
Stock-based compensation expense |
— | — | — | — | — | — | 3,761 | — | 3,761 | ||||||||||||||||||
Dividend paid ($1.20 per share) |
— | — | — | — | — | — | (34,351 | ) |
(23,600 | ) |
(57,951 | ) |
|||||||||||||||
Purchase of treasury stock |
— | — | — | — | (3 | ) |
(29 | ) |
— | — | (29 | ) |
|||||||||||||||
Net income |
— | — | — | — | — | — | — | 26,915 | 26,915 | ||||||||||||||||||
Balance as of January 31, 2015 |
48,203 | 48 | — | — | (3 | ) |
(29 | ) |
393,078 | 23,738 | 416,835 | ||||||||||||||||
Stock-based compensation expense |
— | — | — | — | — | — | 5,035 | — | 5,035 | ||||||||||||||||||
Proceeds from stock options exercised |
5 | — | 335 | 1 | — | — | 2,270 | — | 2,271 | ||||||||||||||||||
Excess tax benefit related to exercises of stock options |
— | — | — | — | — | — | 1,068 | — | 1,068 | ||||||||||||||||||
Conversion of Class A and Class B common stock to a single class of common stock |
(48,208 | ) |
(48 | ) |
48,208 | 48 | — | — | — | — | — | ||||||||||||||||
Proceeds from issuance of common stock, net of expenses |
— | — | 10,264 | 10 | — | — | 149,796 | — | 149,806 | ||||||||||||||||||
Dividend paid ($1.01 per share) |
— | — | — | — | — | — | (14,932 | ) |
(33,916 | ) |
(48,848 | ) |
|||||||||||||||
Purchase of treasury stock |
— | — | — | — | (6 | ) |
(57 | ) |
— | — | (57 | ) |
|||||||||||||||
Net income |
— | — | — | — | — | — | — | 35,839 | 35,839 | ||||||||||||||||||
Balance as of January 30, 2016 |
— | — | 58,807 | 59 | (9 | ) |
(86 | ) |
536,315 | 25,661 | 561,949 | ||||||||||||||||
Stock-based compensation expense |
— | — | — | — | — | — | 6,685 | — | 6,685 | ||||||||||||||||||
Proceeds from stock options exercised |
— | — | 1,949 | 2 | — | — | 13,302 | — | 13,304 | ||||||||||||||||||
Excess tax benefit related to exercises of stock options |
— | — | — | — | — | — | 9,559 | — | 9,559 | ||||||||||||||||||
Net income |
— | — | — | — | — | — | — | 59,764 | 59,764 | ||||||||||||||||||
Balance as of January 28, 2017 |
— | — | 60,756 | $ | 61 | (9 | ) |
$ | (86 | ) |
$ | 565,861 | $ | 85,425 | $ | 651,261 | |||||||||||
See accompanying notes to the consolidated financial statements.
51
OLLIE’S BARGAIN OUTLET HOLDINGS, INC. AND SUBSIDIARIES
Consolidated Statements of Cash Flows
(In thousands)
Fiscal year ended |
|||||||||
January 28, 2017 |
January 30, 2016 |
January 31, 2015 |
|||||||
Cash flows from operating activities: |
|||||||||
Net income |
$ | 59,764 | $ | 35,839 | $ | 26,915 | |||
Adjustments to reconcile net income to net cash provided by operating activities: |
|||||||||
Depreciation and amortization of property and equipment |
10,291 | 8,913 | 8,051 | ||||||
Amortization of debt issuance costs |
746 | 1,273 | 1,471 | ||||||
Amortization of original issue discount |
25 | 436 | 579 | ||||||
Loss on extinguishment of debt |
— | 6,710 | 671 | ||||||
Amortization of intangibles |
377 | 428 | 734 | ||||||
Gain on disposal of assets |
(4 | ) |
— | (14 | ) |
||||
Deferred income tax provision (benefit) |
1,867 | (1,731 | ) |
(3,419 | ) |
||||
Deferred rent expense |
1,369 | 1,873 | 1,144 | ||||||
Stock-based compensation expense |
6,685 | 5,035 | 3,761 | ||||||
Excess tax benefit related to exercises of stock options |
(9,559 | ) |
(1,068 | ) |
— | ||||
Changes in operating assets and liabilities: |
|||||||||
Inventories |
(19,499 | ) |
(20,736 | ) |
(23,654 | ) |
|||
Accounts receivable |
(118 | ) |
135 | 21 | |||||
Prepaid expenses and other assets |
(1,264 | ) |
(730 | ) |
3,220 | ||||
Accounts payable |
(1,822 | ) |
1,543 | 13,113 | |||||
Income taxes payable |
10,005 | 468 | (2,330 | ) |
|||||
Accrued expenses and other liabilities |
8,225 | 7,460 | 1,579 | ||||||
Net cash provided by operating activities |
67,088 | 45,848 | 31,842 | ||||||
Cash flows from investing activities: |
|||||||||
Purchases of property and equipment |
(16,438 | ) |
(14,203 | ) |
(14,110 | ) |
|||
Acquisition of intangible assets |
— | (157 | ) |
— | |||||
Proceeds from sale of property and equipment |
15 | 23 | 103 | ||||||
Net cash used in investing activities |
(16,423 | ) |
(14,337 | ) |
(14,007 | ) |
|||
Cash flows from financing activities: |
|||||||||
Borrowings on revolving credit facility |
946,683 | 858,053 | 674,457 | ||||||
Repayments on revolving credit facility |
(946,683 | ) |
(858,053 | ) |
(674,457 | ) |
|||
Borrowings on term loan |
— | 200,000 | 59,592 | ||||||
Repayments on term loan and capital leases |
(5,104 | ) |
(324,076 | ) |
(7,612 | ) |
|||
Proceeds from issuance of common stock, net of expenses |
— | 149,806 | — | ||||||
Proceeds from stock option exercises |
13,304 | 2,271 | — | ||||||
Excess tax benefit related to exercises of stock options |
9,559 | 1,068 | — | ||||||
Payment of debt issuance costs |
— | (3,368 | ) |
(2,049 | ) |
||||
Payment of dividend |
— | (48,848 | ) |
(57,951 | ) |
||||
Purchase of treasury stock |
— | (57 | ) |
(29 | ) |
||||
Net cash provided by (used in) financing activities |
17,759 | (23,204 | ) |
(8,049 | ) |
||||
Net increase in cash and cash equivalents |
68,424 | 8,307 | 9,786 | ||||||
Cash and cash equivalents at the beginning of the period |
30,259 | 21,952 | 12,166 | ||||||
Cash and cash equivalents at the end of the period |
$ | 98,683 | $ | 30,259 | $ | 21,952 | |||
Supplemental disclosure of cash flow information: |
|||||||||
Cash paid during the period for: |
|||||||||
Interest |
$ | 5,179 | $ | 13,829 | $ | 19,867 | |||
Income taxes |
$ | 24,859 | $ | 22,824 | $ | 22,703 | |||
Non-cash investing activities: |
|||||||||
Accrued purchases of property and equipment |
$ | 1,009 | $ | 402 | $ | 437 | |||
See accompanying notes to the consolidated financial statements.
52
OLLIE’S BARGAIN OUTLET HOLDINGS, INC. AND SUBSIDIARIES
Notes to Consolidated Financial Statements
| (1) | Organization and Summary of Significant Accounting Policies |
| (a) | Description of Business |
Ollie’s Bargain Outlet Holdings, Inc. and subsidiaries (collectively referenced to as “the Company” or “Ollie’s”), principally buys overproduced, overstocked, and closeout merchandise from manufacturers, wholesalers, and other retailers. In addition, the Company augments its name-brand closeout deals with directly sourced private label products featuring names exclusive to Ollie’s, in order to provide consistently value-priced goods in select key merchandise categories.
Since the first store opened in 1982, the Company has grown to 234 Ollie’s Bargain Outlet retail locations as of January 28, 2017. Ollie’s Bargain Outlet retail locations are currently located in 19 states (Alabama, Connecticut, Delaware, Florida, Georgia, Indiana, Kentucky, Maryland, Michigan, Mississippi, New Jersey, New York, North Carolina, Ohio, Pennsylvania, South Carolina, Tennessee, Virginia, and West Virginia).
| (b) | Fiscal Year |
Ollie’s follows a 52/53-week fiscal year, which ends on the Saturday nearest to January 31st. References to the fiscal year ended January 28, 2017 refer to the period from January 31, 2016 to January 28, 2017 (“fiscal year 2016”). References to the fiscal year ended January 30, 2016 refer to the period from February 1, 2015 to January 30, 2016 (“fiscal year 2015”). References to the fiscal year ended January 31, 2015 refer to the period from February 2, 2014 to January 31, 2015 (“fiscal year 2014”). Fiscal years 2016, 2015 and 2014 each include 52 weeks.
| (c) | Principles of Consolidation |
The consolidated financial statements include the accounts of the Company and its subsidiaries. Intercompany transactions have been eliminated in consolidation.
| (d) | Use of Estimates |
The preparation of consolidated financial statements in conformity with U.S. Generally Accepted Accounting Principles (“GAAP”) requires management to make estimates and assumptions that affect the reported amounts of assets and liabilities and disclosure of contingent assets and liabilities at the date of the consolidated financial statements and the reported amounts of revenues and expenses during the reporting period. Actual results could differ from those estimates.
| (e) | Fair Value Disclosures |
Fair value is defined as the price which the Company would receive to sell an asset or pay to transfer a liability (an exit price) in an orderly transaction between market participants on the measurement date. In determining fair value, GAAP establishes a three-level hierarchy used in measuring fair value, as follows:
| • | Level 1 inputs are quoted prices available for identical assets and liabilities in active markets. |
| • | Level 2 inputs are observable for the asset or liability, either directly or indirectly, including quoted prices for similar assets and liabilities in active markets or other inputs that are observable or can be corroborated by observable market data. |
| • | Level 3 inputs are less observable and reflect the Company’s assumptions. |
Ollie’s financial instruments consist of cash and cash equivalents, accounts receivable, accounts payable and the Company’s term loan. The carrying amounts of cash, accounts receivable and accounts payable approximate fair value because of their short maturities. The carrying amount of the Company’s term loan facility approximates its fair value because the interest rates are adjusted regularly based on current market conditions.
53
OLLIE’S BARGAIN OUTLET HOLDINGS, INC. AND SUBSIDIARIES
Notes to Consolidated Financial Statements
| (f) | Cash and Cash Equivalents |
The Company considers cash on hand in stores, bank deposits, credit card receivables, and all highly liquid investments with remaining maturities of three months or less at the date of acquisition to be cash and cash equivalents. Amounts receivable from credit card issuers are typically converted to cash within one to two business days of the original sales transaction.
| (g) | Concentration of Credit Risk |
A financial instrument which potentially subjects the Company to a concentration of credit risk is cash. Ollie’s currently maintains its day-to-day operating cash balances with major financial institutions. The Company’s operating cash balances are in excess of the Federal Deposit Insurance Corporation (FDIC) insurance limit. From time to time, Ollie’s invests temporary excess cash in overnight investments with expected minimal volatility, such as money market funds. Although the Company maintains balances which exceed the FDIC insured limit, it has not experienced any losses related to this balance, and Ollie’s believes the credit risk to be minimal.
| (h) | Inventories |
Inventories are stated at the lower of cost or market determined using the retail inventory method on a first-in, first-out basis. The cost of inventories includes the merchandise cost, transportation costs, and certain distribution and storage costs. Such costs are thereafter expensed as cost of sales upon the sale of the merchandise. The retail inventory method uses estimates for shrink and markdowns to calculate ending inventory. These estimates made by management could significantly impact the ending inventory valuation at cost and the resulting gross margin.
| (i) | Property and Equipment |
Property and equipment are stated at original cost less accumulated depreciation and amortization. Depreciation and amortization are calculated over the estimated useful lives of the related assets, or in the case of leasehold improvements, the lesser of the useful lives or the remaining term of the lease. Expenditures for additions, renewals, and betterments are capitalized; expenditures for maintenance and repairs are charged to expense as incurred. Depreciation is computed on the straight-line method for financial reporting purposes.
The useful lives for the purpose of computing depreciation and amortization are as follows:
|
Software
|
3 years
|
|
Automobiles
|
5 years
|
|
Computer equipment
|
5 years
|
|
Furniture, fixtures, and equipment
|
7-10 years
|
|
Buildings
|
27.5 years
|
|
Leasehold improvements
|
Lesser of lease term or useful life
|
| (j) | Goodwill/Intangible Assets |
The Company amortizes intangible assets over their useful lives unless it determines such lives to be indefinite. Goodwill and intangible assets having indefinite useful lives are not amortized to earnings, but instead are subject to annual impairment testing or more frequently if events or circumstances indicate that the value of goodwill or intangible assets having indefinite useful lives might be impaired.
Entities have an option to perform a qualitative assessment to determine whether further impairment testing on goodwill is necessary. Specifically, an entity has the option to first assess qualitative factors to determine whether it is necessary to perform the two-step quantitative test. The goodwill quantitative impairment test is a two-step test. Under the first step, the fair value of the reporting unit is compared with its carrying value (including goodwill). If the fair value of the reporting unit is less than its carrying value, an indication of
54
OLLIE’S BARGAIN OUTLET HOLDINGS, INC. AND SUBSIDIARIES
Notes to Consolidated Financial Statements
goodwill impairment exists for the reporting unit and the enterprise must perform step two of the impairment test (measurement). Under step two, an impairment loss is recognized for any excess of the carrying amount of the reporting unit’s goodwill over the implied fair value of that goodwill. The implied fair value of goodwill is determined by allocating the fair value of the reporting unit in a manner similar to a purchase price allocation. The residual fair value after the allocation is the implied fair value of the reporting unit goodwill. Fair value of the sole reporting unit for the most recent quantitative test was determined utilizing a combination of valuation methods including both the income approach (including a discounted cash flow analysis) and market approaches (including prior transaction method and comparable public company multiples). The fair value estimates utilized in the impairment testing reflect the use of Level 3 inputs. If the fair value of the reporting unit exceeds its carrying value, step two does not need to be performed. If an entity believes, as a result of its qualitative assessment, that it is more likely than not that the fair value of a reporting unit is less than its carrying amount, the quantitative impairment test is required. Otherwise, no further testing is required. The Company has selected the fiscal month ending date of October as the annual impairment testing date. For fiscal years 2016, 2015 and 2014, the Company completed a qualitative impairment test. Based upon the procedures described above, no impairment of goodwill existed.
The Company is also required to perform impairment tests annually or more frequently if events or circumstances indicate that the value of its nonamortizing intangible assets might be impaired. The Company’s nonamortizing intangible assets as of January 28, 2017 and January 30, 2016 consisted of a tradename. Entities have an option to perform a qualitative assessment to determine whether further impairment testing of nonamortizing intangible assets is necessary. Specifically, an entity has the option to first assess qualitative factors to determine whether it is necessary to perform a quantitative test. The Company performs the quantitative impairment test using the discounted cash flow method based on management’s projections to determine the fair value of the asset. The carrying amount of the asset is then compared to the fair value. If the carrying amount is greater than fair value, an impairment loss is recorded for the amount that fair value is less than the carrying amount. If an entity believes, as a result of its qualitative assessment, that it is more likely than not that the fair value is less than its carrying amount, the quantitative impairment test is required. Otherwise, no further testing is required. For fiscal years 2016, 2015 and 2014, the Company completed a qualitative impairment test. Based upon the procedures described above, no impairment of the tradename existed.
Intangible assets with determinable useful lives are amortized over their estimated useful lives and reviewed for impairment whenever events or changes in circumstances indicate that its carrying amount may not be recoverable.
| (k) | Impairment of Long-Lived Assets |
Long-lived assets, such as property and equipment, are reviewed for impairment whenever events or changes in circumstances indicate that the carrying amount of an asset may not be recoverable. If circumstances require a long-lived asset or asset group be tested for possible impairment, the Company first compares undiscounted cash flows expected to be generated by that asset or asset group to its carrying value. If the carrying value of the long-lived asset or asset group is not recoverable on an undiscounted cash flow basis, impairment is recognized to the extent that the carrying value exceeds its fair value. Fair value is determined through various valuation techniques including discounted cash flow models, quoted market values and third-party independent appraisals, as considered necessary.
| (l) | Stock-Based Compensation |
The Company measures the cost of employee services received in exchange for share-based compensation based on the grant date fair value of the employee stock award. For stock option awards, the Company estimates grant date fair value using the Black-Scholes option pricing model. For restricted stock unit awards, grant date fair value is determined based upon the closing trading value of the Company’s stock on the date of grant. In both cases, stock-based compensation is recorded on a straight-line basis over the vesting period for the entire award. Excess tax benefits related to stock option exercises were reflected as financing cash inflows in fiscal years 2016, 2015 and 2014.
55
OLLIE’S BARGAIN OUTLET HOLDINGS, INC. AND SUBSIDIARIES
Notes to Consolidated Financial Statements
| (m) | Revenue Recognition |
Ollie’s recognizes retail sales in its stores when merchandise is sold and the customer takes possession of merchandise. Net sales are presented net of returns and sales tax. The Company provides an allowance for estimated retail merchandise returns based on prior experience. The following table provides a reconciliation of the activity related to the Company’s sales returns allowance (in thousands):
Fiscal year ended |
|||||||||
January 28, 2017 |
January 30, 2016 |
January 31, 2015 |
|||||||
Beginning balance |
$ | 247 | $ | 247 | $ | 207 | |||
Provisions |
34,995 | 30,835 | 27,292 | ||||||
Sales returns |
(34,903 | ) |
(30,835 | ) |
(27,252 | ) |
|||
Ending balance |
$ | 339 | $ | 247 | $ | 247 | |||
| (n) | Cost of Sales |
Cost of sales includes merchandise cost, transportation costs, inventory markdowns, shrink, and distribution, warehousing, and storage costs.
| (o) | Selling, General and Administrative Expenses |
Selling, general and administrative expenses are comprised of payroll and benefits for stores, field support, and support center employees. Selling, general and administrative expenses also include marketing and advertising expense, occupancy costs for stores and the store support center, insurance, corporate infrastructure and other selling, general and administrative expenses.
| (p) | Advertising Costs |
Advertising costs primarily consist of newspaper circulars, email campaigns, media broadcasts and prominent advertising at professional and collegiate sporting events and are charged to expense the first time the advertising occurs. Advertising expense for fiscal years 2016, 2015 and 2014 was $28.0 million, $25.8 million and $23.1 million, respectively.
| (q) | Operating Leases |
Other than one store location, which is owned, the Company leases its store locations, distribution centers and office facilities. Many of the lease agreements contain rent holidays, rent escalation clauses and contingent rent provisions – or some combination of these items. For leases of store locations and the store support center, the Company recognizes rent expense in selling, general and administrative expenses. For leases of distribution centers, the Company recognizes rent expense within cost of sales. All rent expense is recorded on a straight-line basis over the accounting lease term, which includes lease renewals determined to be reasonably assured. Additionally, the commencement date of the accounting lease term reflects the earlier of the date the Company becomes legally obligated for the lease payments or the date the Company takes possession of the building for initial construction and setup. The excess rent expense over the actual cash paid for rent is accounted for as deferred rent. Leasehold improvement allowances received from landlords and other lease incentives are recorded as deferred rent liabilities and are recognized in selling, general and administrative expenses on a straight-line basis over the accounting lease term.
| (r) | Pre-Opening Costs |
Pre-opening costs (costs of opening new stores and distribution facilities, including grand opening promotions, payroll, travel, training, and store setup costs, as well as store closing costs) are expensed as incurred.
56
OLLIE’S BARGAIN OUTLET HOLDINGS, INC. AND SUBSIDIARIES
Notes to Consolidated Financial Statements
| (s) | Debt Issuance Costs and Original Issue Discount |
Debt issuance costs and original issue discount are amortized to interest expense using the effective interest method, over the life of the related debt. As of January 28, 2017 and January 30, 2016, debt issuance costs, net of accumulated amortization, were $2.8 million and $3.6 million, respectively, and original issue discount, net of accumulated amortization, was $0.1 million for both periods. The amortization expense for debt issuance costs was $0.7 million, $1.3 million and $1.5 million, respectively, and the amortization expense for the original issue discount was $25,000, $0.4 million and $0.6 million, respectively, for fiscal years 2016, 2015 and 2014. The write off of unamortized debt issuance and original issue discount costs recorded in loss on extinguishment of debt on the consolidated statements of income totaled $0.0 million, $6.7 million and $0.7 million, respectively, for fiscal years 2016, 2015, and 2014.
| (t) | Self-Insurance Liabilities |
Under a number of the Company's insurance programs, which include the Company's employee health insurance program, its workers' compensation and general liability insurance programs, the Company is liable for a portion of its losses. Ollie’s is self-insured for certain losses related to the company sponsored employee health insurance program. The Company estimates the accrued liabilities for its self-insurance programs using historical claims experience and loss reserves. To limit the Company’s exposure to losses, a stop-loss coverage is maintained through third-party insurers.
| (u) | Income Taxes |
Income taxes are accounted for under the asset and liability method. Deferred tax assets and liabilities are recognized for the future tax consequences attributable to differences between the financial statement carrying amounts of existing assets and liabilities and their respective tax bases and operating losses and tax credit carryforwards. Deferred tax assets and liabilities are measured using enacted tax rates expected to apply to taxable income in the years in which those temporary differences are expected to be recovered or settled. The Company recognizes the effect of income tax positions only if those positions are more likely than not of being sustained. Recognized income tax positions are measured at the largest amount that is greater than 50% likely of being realized.
Ollie’s files consolidated federal and state income tax returns. For years before 2012, the Company is no longer subject to U.S. federal income tax examinations. State income tax returns are filed in various state tax jurisdictions, as appropriate, with varying statutes of limitation and remain subject to examination for varying periods up to three to four years depending on the state.
| (v) | Earnings per Common Share |
Basic earnings per common share is computed by dividing net income by the weighted average number of common shares outstanding. Diluted earnings per common share is computed by dividing net income by the weighted average number of common shares outstanding, after giving effect to the potential dilution, if applicable, from the assumed exercise of stock options into shares of common stock as if those stock options were exercised and the assumed lapse of restrictions on restricted stock units.
57
OLLIE’S BARGAIN OUTLET HOLDINGS, INC. AND SUBSIDIARIES
Notes to Consolidated Financial Statements
The following table summarizes those effects for the diluted earnings per common share calculation (in thousands, except per share amounts):
Fiscal year ended |
|||||||||
January 28, 2017 |
January 30, 2016 |
January 31, 2015 |
|||||||
Net income |
$ | 59,764 | $ | 35,839 | $ | 26,915 | |||
Weighted average number of common shares outstanding – Basic |
60,160 | 53,835 | 48,202 | ||||||
Incremental shares from the assumed exercise of outstanding stock options and vesting of restricted stock units |
2,255 | 1,961 | 407 | ||||||
Weighted average number of common shares outstanding - Diluted |
62,415 | 55,796 | 48,609 | ||||||
Earnings per common share – Basic |
$ | 0.99 | $ | 0.67 | $ | 0.56 | |||
Earnings per common share - Diluted |
$ | 0.96 | $ | 0.64 | $ | 0.55 | |||
Weighted average stock option shares totaling 81,616, 651,400 and 2,971,140 as of January 28, 2017, January 30, 2016, and January 31, 2015, respectively, were excluded from the calculation of diluted weighted average common shares outstanding because the effect would have been antidilutive.
| (w) | Recent Accounting Pronouncements |
Revenue
In May 2014, the Financial Accounting Standards Board (“FASB”) issued Accounting Standards Update (“ASU”) 2014-09, Revenue from Contracts with Customers, which requires an entity to recognize the amount of revenue to which it expects to be entitled for the transfer of promised goods or services to customers. ASU 2014-09 will replace most existing revenue recognition guidance in GAAP when it becomes effective. The amendments in ASU 2014-09 were originally effective for reporting periods beginning after December 15, 2016, including interim periods within that reporting period, with early application not permitted. In July 2015, the FASB deferred the effective date of ASU 2014-09 for one year, while also permitting early application. With these changes, ASU 2014-09 will become effective for annual reporting periods (including interim periods within those periods) beginning after December 15, 2017, with adoption permitted as of the original effective date. ASU 2014-09 permits the use of either the retrospective or cumulative effect transition method. While the Company is still evaluating ASU 2014-09, at this time it is not expected that the adoption of ASU 2014-09 will have a material impact on the Company’s consolidated financial statements.
Leases
In February 2016, the FASB issued ASU 2016-02, Leases. ASU 2016-02 requires that lease arrangements longer than 12 months result in an entity recognizing a right-of-use asset and lease liability. The updated guidance is effective for interim and annual periods beginning after December 15, 2018, and early adoption is permitted. Substantially all of the Company’s store locations and distribution centers are subject to operating lease arrangements. Information under existing lease guidance with respect to rent required under non-cancelable operating leases, including option renewal periods that are reasonably assured, that have an initial or remaining lease term in excess of one year is included in Note 7. The Company is currently evaluating the impact of the adoption of this new standard on its consolidated financial statements and related disclosures, and anticipates it will result in significant right-of-use assets and related liabilities on its consolidated balance sheets.
58
OLLIE’S BARGAIN OUTLET HOLDINGS, INC. AND SUBSIDIARIES
Notes to Consolidated Financial Statements
Stock Compensation
In March 2016, the FASB issued ASU 2016-09, Stock Compensation, which is intended to simplify the accounting for share-based payment award transactions. The new standard will modify several aspects of the accounting and reporting for employee share-based payments and related tax accounting impacts, including the presentation in the statements of operations and cash flows of certain tax benefits or deficiencies and employee tax withholdings, as well as the accounting for award forfeitures over the vesting period. The guidance is effective for fiscal years beginning after December 15, 2016, including interim periods within that year, and will be adopted by the Company in the first quarter of fiscal 2017. The Company anticipates the new standard will result in an increase in the number of shares used in the calculation of diluted earnings per share and will add volatility to the Company’s effective tax rate and income tax expense. The magnitude of such impacts will depend in part on whether significant employee stock option exercises occur.
| (x) | Reclassification |
Certain prior-year amounts have been reclassified to conform to current-year presentation.
| (2) | Property and Equipment |
Property and equipment consists of the following (in thousands):
January 28, 2017 |
January 30, 2016 |
|||||
Land |
$ | 1,601 | $ | — | ||
Building |
1,225 | — | ||||
Furniture, fixtures, and equipment |
71,621 | 58,713 | ||||
Leasehold improvements |
8,641 | 7,530 | ||||
Automobiles |
1,638 | 1,319 | ||||
84,726 | 67,562 | |||||
Less accumulated depreciation |
(38,393 | ) |
(28,270 | ) |
||
$ | 46,333 | $ | 39,292 | |||
Depreciation and amortization expense of property and equipment was $10.3 million, $8.9 million, and $8.1 million for fiscal years 2016, 2015, and 2014, respectively, of which $8.4 million, $7.2 million, and $7.0 million, respectively, is included in the depreciation and amortization expenses on the consolidated statements of income. The remainder, as it relates to the Company’s distribution centers, is included within cost of sales on the consolidated statements of income.
| (3) | Goodwill and Other Intangible Assets |
Goodwill and other intangible assets consist of the following (in thousands):
January 28, 2017 |
January 30, 2016 |
|||||
Non-amortizing intangible assets: |
||||||
Goodwill |
$ | 444,850 | $ | 444,850 | ||
Tradename |
230,559 | 230,559 | ||||
Amortizing intangible assets: |
||||||
Favorable leases |
4,054 | 4,054 | ||||
Accumulated amortization: |
||||||
Favorable leases |
(1,636 | ) |
(1,259 | ) |
||
$ | 677,827 | $ | 678,204 | |||
59
OLLIE’S BARGAIN OUTLET HOLDINGS, INC. AND SUBSIDIARIES
Notes to Consolidated Financial Statements
Amortization expense for fiscal years 2016 and 2015 was $0.4 million, which was charged to rent expense for favorable leases. Amortization expense for fiscal year 2014 was $0.7 million, which included amortization for favorable leases and the customer database. Estimated amortization expense of intangible assets during the next five fiscal years and thereafter is shown below (in thousands):
Fiscal year ending: |
|||
February 3, 2018 |
$ | 338 | |
February 2, 2019 |
335 | ||
February 1, 2020 |
310 | ||
January 30, 2021 |
281 | ||
January 29, 2022 |
237 | ||
Thereafter |
917 | ||
Total remaining amortization |
$ | 2,418 |
Favorable lease intangible assets are being amortized on a straight-line basis over their respective lease terms plus assumed option renewal periods (weighted average remaining life of approximately 8.7 and 9.4 years as of January 28, 2017 and January 30, 2016, respectively).
| (4) | Accrued Expenses |
Accrued expenses consist of the following (in thousands):
January 28, 2017 |
January 30, 2016 |
|||||
Compensation and benefits |
$ | 12,136 | $ | 10,775 | ||
Advertising |
5,594 | 3,519 | ||||
Freight |
5,429 | 3,620 | ||||
Real estate related |
3,464 | 2,659 | ||||
Insurance |
3,418 | 2,605 | ||||
Sales and use taxes |
2,564 | 2,278 | ||||
Other |
12,143 | 10,117 | ||||
$ | 44,748 | $ | 35,573 | |||
| (5) | Debt Obligations and Financing Arrangements |
Long-term debt consists of the following (in thousands):
January 28, 2017 |
January 30, 2016 |
|||||
Term loan |
$ | 193,740 | $ | 198,385 | ||
Capital lease |
260 | 66 | ||||
Total debt |
194,000 | 198,451 | ||||
Less: current portion |
(5,077 | ) |
(5,018 | ) |
||
Long-term debt |
$ | 188,923 | $ | 193,433 | ||
As of January 28, 2017, the scheduled principal payments of debt are as follows (in thousands):
Fiscal year ending: |
|||
February 3, 2018 |
$ | 5,077 | |
February 2, 2019 |
10,091 | ||
February 1, 2020 |
10,091 | ||
January 30, 2021 |
170,000 | ||
Total cash principal payments |
195,259 | ||
Less: Unamortized original issue discount |
(87 | ) |
|
Less: Unamortized term loan deferred financing fees |
(1,172 | ) |
|
Total cash principal payments, net |
$ | 194,000 |
60
OLLIE’S BARGAIN OUTLET HOLDINGS, INC. AND SUBSIDIARIES
Notes to Consolidated Financial Statements
On September 28, 2012, the Company entered into two credit agreements with a total value of $300.0 million. The $300.0 million was comprised of a $75.0 million revolving credit facility (“Revolving Credit Facility”) and a $225.0 million term loan (“Term Loan”). On February 26, 2013, the Company entered into a First Amendment to the Term Loan which allowed the Company to borrow an additional principal amount of $50.0 million.
On April 11, 2014, the Company entered into a Second Amendment to the Term Loan (“Amended Term Loan”) which allowed the Company to borrow an additional principal amount of $60.0 million. The primary purpose of the additional term loan borrowing was to distribute $58.0 million as a cash dividend to common shareholders as consented by the original Term Loan lenders. The total dividend amount was recorded as a reduction of retained earnings of $23.6 million to reduce the retained earnings balance as of the dividend date to zero and the additional $34.4 million was recorded as a reduction of additional paid-in capital. The proceeds received were net of $2.0 million, of which $1.3 million was recognized as deferred financing fees, $0.4 million was recorded as additional original issue discount, and $0.3 million was recognized as selling, general and administrative expenses. In connection with this amendment, $0.4 million of debt issuance cost and $0.2 million of original issue discount were accelerated on the date of the amendment and included in loss on extinguishment of debt.
On May 27, 2015, the Company amended the Term Loan and Revolving Credit Facility (collectively the “Senior Secured Credit Facilities”) to, among other things, increase the size of the Revolving Credit Facility from $75.0 million to $125.0 million and to permit a dividend to holders of the Company’s outstanding common stock. On May 27, 2015, the Company borrowed $50.0 million under the Revolving Credit Facility and the proceeds were used to pay an aggregate cash dividend of $48.8 million to holders of outstanding common stock. The total dividend amount was recorded as a reduction of retained earnings of $33.9 million to reduce the retained earnings balance as of the dividend date to zero and the additional $14.9 million was recorded as a reduction of additional paid-in capital.
In July 2015, the Company repaid $50.0 million on the Revolving Credit Facility and $103.1 million of principal on the Amended Term Loan using proceeds from the initial public offering (“IPO”). In connection with this repayment of debt, $1.5 million of debt issuance costs and $0.8 million of original issue discount were written off and included in loss on extinguishment of debt.
On January 29, 2016, the Company completed a transaction in which it refinanced the Senior Secured Credit Facilities with the proceeds from a new credit facility (“New Credit Facilites”). The New Credit Facilities consist of the $200.0 million term loan (“New Term Loan Facility”) and the $100.0 million new revolving credit facility (“New Revolving Credit Facility”), which includes a $25.0 million sub-facility for letters of credit and a $25.0 million sub-facility for swingline loans. The proceeds of the New Term Loan Facility together with cash on hand were used to repay the existing Senior Secured Credit Facilities. The Company incurred various arrangement fees and legal fees totaling $2.1 million, of which $2.0 million was recognized as deferred financing fees and $0.1 million was recognized as selling, general and administrative expenses. In connection with the termination of the Senior Secured Credit Facilities, $2.9 million of debt issuance cost and $1.4 million of original issue discount were accelerated on the date of the amendment and included in loss on extinguishment of debt. Loans under the New Credit Facilities mature on January 29, 2021.
The interest rates for the New Credit Facilities are not subject to a floor and are calculated as the higher of the Prime Rate, the Federal Funds Effective Rate plus 0.50% or the Eurodollar Rate plus 1.0%, plus the Applicable Margin, or, for Eurodollar Loans, the Eurodollar Rate plus the Applicable Margin. The Applicable Margin will vary from 0.75% to 1.25% for a Base Rate Loan and 1.75% to 2.25% for a Eurodollar Loan, based on reference to the total leverage ratio (total debt to Adjusted EBITDA, as defined in the agreement). As of January 28, 2017, the interest rate on the outstanding borrowings under the New Term Loan Facility was 1.75% plus the 30-day Eurodollar Rate, or 2.53%.
The New Term Loan Facility is subject to amortization with principal payable in quarterly installments of $1.25 million, to be made on the last business day of each fiscal quarter prior to maturity, which commenced on April 29, 2016. The quarterly installment payments increase after fiscal year ending February 3, 2018 to $2.5 million. The remaining initial aggregate advances under the New Term Loan Facility are payable at maturity.
61
OLLIE’S BARGAIN OUTLET HOLDINGS, INC. AND SUBSIDIARIES
Notes to Consolidated Financial Statements
As of January 28, 2017 and January 30, 2016, the amounts outstanding under the New Term Loan Facility are net of unamortized original issue discount of $0.1 million and deferred financing fees of $1.2 million and $1.5 million, respectively.
Under the terms of the New Revolving Credit Facility, as of January 28, 2017, the Company could borrow up to 90.0% of the most recent appraised value (valued at cost, discounted for the current net orderly liquidation value) of its eligible inventory, as defined, up to $100.0 million.
As of January 28, 2017, Ollie’s had $195.0 million of outstanding borrowings on the New Term Loan Facility and no outstanding borrowings under the New Revolving Credit Facility, with $98.8 million of borrowing availability, letter of credit commitments of $1.0 million and $0.2 million of rent reserves. The New Revolving Credit Facility also contains a variable unused line fee ranging from 0.250% to 0.375% per annum. The Company incurred unused line fees of $0.3 million, $0.4 million and $0.2 million for fiscal years 2016, 2015 and 2014, respectively.
The New Credit Facilities are collateralized by the Company’s assets and equity and contain financial covenants, as well as certain business covenants, including restrictions on dividend payments, which the Company must comply with during the term of the agreements. The financial covenants include a consolidated fixed charge coverage ratio test of at least 1.1 to 1.0 and total leverage ratio test of 3.50 to 1.0. The Company was in compliance with all terms of the New Credit Facilities during and as of the fiscal year ended January 28, 2017.
The provisions of the New Credit Facilities restrict all of the net assets of the Company’s consolidated subsidiaries, which constitutes all of the net assets on the Company’s consolidated balance sheet as of January 28, 2017, from being used to pay any dividends or make other restricted payments to the Company without prior written consent from the financial institutions party to the Company’s New Credit Facilities, subject to certain exceptions.
| (6) | Income Taxes |
The components of income tax provision (benefit) are as follows (in thousands):
Fiscal year ended |
|||||||||
January 28, 2017 |
January 30, 2016 |
January 31, 2015 |
|||||||
Current: |
|||||||||
Federal |
$ | 29,280 | $ | 19,625 | $ | 16,760 | |||
State |
5,348 | 3,713 | 3,422 | ||||||
34,628 | 23,338 | 20,182 | |||||||
Deferred: |
|||||||||
Federal |
1,829 | (849 | ) |
(2,114 | ) |
||||
State |
38 | (882 | ) |
(1,305 | ) |
||||
1,867 | (1,731 | ) |
(3,419 | ) |
|||||
Income tax expense |
$ | 36,495 | $ | 21,607 | $ | 16,763 | |||
A reconciliation of the statutory federal income tax rate to the Company’s effective income tax rate is as follows:
Fiscal year ended |
|||||||||
January 28, 2017 |
January 30, 2016 |
January 31, 2015 |
|||||||
Statutory federal rate |
35.0 | % |
35.0 | % |
35.0 | % |
|||
State taxes, net of federal benefit |
3.6 | 3.2 | 3.2 | ||||||
Other |
(0.7 | ) |
(0.6 | ) |
0.2 | ||||
37.9 | % |
37.6 | % |
38.4 | % |
||||
62
OLLIE’S BARGAIN OUTLET HOLDINGS, INC. AND SUBSIDIARIES
Notes to Consolidated Financial Statements
Deferred income taxes reflect the effect of temporary differences between the carrying amounts of the assets and liabilities for financial reporting purposes and the carrying amounts used for income tax reporting purposes. Significant components of deferred tax assets and liabilities are as follows (in thousands):
January 28, 2017 |
January 30, 2016 |
|||||
Deferred tax assets: |
||||||
Inventory reserves |
$ | 1,378 | $ | 1,236 | ||
Deferred rent |
2,343 | 1,815 | ||||
Stock-based compensation |
4,783 | 4,753 | ||||
Other |
2,048 | 3,918 | ||||
Total deferred tax assets |
10,552 | 11,722 | ||||
Deferred tax liabilities: |
||||||
Tradename |
(89,520 | ) |
(89,669 | ) |
||
Depreciation |
(9,345 | ) |
(8,217 | ) |
||
Leases |
(911 | ) |
(1,007 | ) |
||
Total deferred tax liabilities |
(99,776 | ) |
(98,893 | ) |
||
Net deferred tax liabilities |
$ | (89,224 | ) |
$ | (87,171 | ) |
In assessing the realizability of deferred tax assets, management considers whether it is more likely than not that some portion or all of the deferred tax assets will not be realized. The ultimate realization of deferred tax assets is dependent upon the generation of future taxable income during the periods in which those temporary differences become deductible. Management considers the scheduled reversal of deferred tax liabilities (including the impact of available carryback and carryforward periods), projected future taxable income, and tax-planning strategies in making this assessment. Based upon the level of historical taxable income and projections for future taxable income and the scheduled reversal of deferred liabilities over the periods in which the deferred tax assets are deductible, management believes it is more likely than not that the Company will realize the benefits of these deductible differences as of January 28, 2017 and January 30, 2016.
Ollie’s has no material accrual for uncertain tax positions or interest or penalties related to income taxes on the Company’s consolidated balance sheets as of January 28, 2017 or January 30, 2016, and has not recognized any material uncertain tax positions or interest or penalties related to income taxes in the consolidated statements of income for fiscal years 2016, 2015, or 2014.
| (7) | Commitments and Contingencies |
Other than one store location, which is owned, Ollie’s leases its stores, office, and distribution facilities under operating leases that expire at various dates through 2031. These leases generally provide for fixed annual rentals; however, several provide for minimum annual rentals plus contingent rentals based on a percentage of annual sales. A majority of the Company’s leases also require a payment for all or a portion of insurance, real estate taxes, water and sewer costs, and repairs, the cost of which is charged to the related expense category rather than being accounted for as rent expense. Most of the leases contain multiple renewal options, under which Ollie’s may extend the lease terms for five years. Minimum rents on operating leases, including agreements with step rents, are charged to expense on a straight-line basis over the lease term.
Rent expense on all operating leases consisted of the following (in thousands):
Fiscal year ended |
|||||||||
January 28, 2017 |
January 30, 2016 |
January 31, 2015 |
|||||||
Minimum annual rentals |
$ | 36,970 | $ | 32,263 | $ | 28,707 | |||
Contingent rentals |
110 | 123 | 78 | ||||||
$ | 37,080 | $ | 32,386 | $ | 28,785 | ||||
63
OLLIE’S BARGAIN OUTLET HOLDINGS, INC. AND SUBSIDIARIES
Notes to Consolidated Financial Statements
The following is a schedule by year of future minimum rental payments required under non-cancelable operating leases, including option renewal periods that are reasonably assured, that have initial or remaining lease terms in excess of one year as of January 28, 2017 (in thousands):
Fiscal year ending: |
|||
February 3, 2018 |
$ | 44,664 | |
February 2, 2019 |
42,741 | ||
February 1, 2020 |
38,209 | ||
January 30, 2021 |
32,489 | ||
January 29, 2022 |
25,226 | ||
Thereafter |
55,008 | ||
Total minimum lease payments |
$ | 238,337 |
Ollie’s is subject to litigation in the normal course of business. The Company does not believe such actions, either individually or collectively, will have a significant impact on Ollie’s financial position or results of operations.
| (8) | Equity Incentive Plan |
During 2012, Ollie’s established an equity incentive plan (the “2012 Plan”), under which stock options were granted to executive officers and key employees as deemed appropriate under the provisions of the 2012 Plan, with an exercise price at the fair value of the underlying stock on the date of grant. The vesting period for options granted under the 2012 Plan is five years (20% ratably per year). Options granted under the 2012 Plan are subject to employment for vesting, expire 10 years from the date of grant, and are not transferable other than upon death. As of July 15, 2015, the date of the pricing of the IPO (see Note 10), no additional equity grants will be made under the 2012 Plan.
In connection with the IPO, the Company adopted the 2015 equity incentive plan (the “2015 Plan”) pursuant to which the Company’s Board of Directors may grant stock options, restricted shares or other awards to employees, directors and consultants. The 2015 Plan allows for the issuance of up to 5,250,000 shares. Awards will be made pursuant to agreements and may be subject to vesting and other restrictions as determined by the Board of Directors or the Compensation Committee. The Company uses authorized and unissued shares to satisfy share award exercises. As of January 28, 2017, there were 4,146,545 shares available for grant under the 2015 Plan.
Stock Options
The exercise price for stock options is determined at the fair value on the underlying stock on the date of grant. The vesting period for awards granted under the 2015 Plan is generally set at four years (25% ratably per year). Awards are subject to employment for vesting, expire 10 years from the date of grant, and are not transferable other than upon death.
64
OLLIE’S BARGAIN OUTLET HOLDINGS, INC. AND SUBSIDIARIES
Notes to Consolidated Financial Statements
A summary of the Company’s stock option activity and related information follows for fiscal years 2014, 2015 and 2016 (in thousands, except share and per share amounts):
Number of options |
Weighted average exercise price |
Weighted average remaining contractual term (years) |
Aggregate intrinsic value |
|||||||||
Outstanding at February 1, 2014 |
5,279,075 | $ | 6.48 | |||||||||
Granted |
920,000 | 7.68 | ||||||||||
Forfeited |
(188,600 | ) |
6.57 | |||||||||
Outstanding at January 31, 2015 |
6,010,475 | 6.66 | ||||||||||
Granted |
1,403,500 | 13.61 | ||||||||||
Forfeited |
(82,500 | ) |
7.91 | |||||||||
Exercised |
(339,650 | ) |
6.69 | |||||||||
Outstanding at January 30, 2016 |
6,991,825 | 8.04 | ||||||||||
Granted |
518,277 | 20.37 | ||||||||||
Forfeited |
(135,390 | ) |
9.09 | |||||||||
Exercised |
(1,948,752 | ) |
6.83 | |||||||||
Outstanding at January 28, 2017 |
5,425,960 | 9.62 | 6.8 | $ | 107,028 | |||||||
Exercisable at January 28, 2017 |
2,924,654 | 7.32 | 6.1 | $ | 64,442 | |||||||
The intrinsic value of stock options exercised for fiscal years 2016 and 2015 was $43.9 million and $5.3 million, respectively.
The Company uses the Black-Scholes option pricing model to value its stock option awards. The assumptions used in calculating the fair value of stock-based awards represent management’s best estimates and involve inherent uncertainties and the application of management’s judgment. As a result, if factors change and management uses different assumptions, stock-based compensation expense could be materially different for future awards.
The expected life of stock options is estimated using the “simplified method,” as the Company has no historical information to develop reasonable expectations about future exercise patterns and post-vesting employment termination behavior for its stock option grants. The simplified method is based on the average of the vesting tranches and the contractual life of each grant. For stock price volatility, the Company uses comparable public companies as a basis for its expected volatility to calculate the fair value of option grants. The risk-free interest rate is based on U.S. Treasury notes with a term approximating the expected life of the option.
The weighted average grant date fair value per option for options granted during fiscal years 2016, 2015 and 2014 was $6.47, $5.05 and $3.57, respectively. The fair value of each option award is estimated on the date of grant using the Black-Scholes option-pricing model that used the weighted average assumptions in the following table:
Fiscal Year Ended |
|||||||||
January 28, 2017 |
January 30, 2016 |
January 31, 2015 |
|||||||
Risk-free interest rate |
1.72 | % |
1.99 | % |
2.22 | % |
|||
Expected dividend yield |
— | — | — | ||||||
Expected life (years) |
6.25 years |
6.25 years |
6.5 years |
||||||
Expected volatility |
28.52 | % |
31.56 | % |
34.80 | % |
|||
65
OLLIE’S BARGAIN OUTLET HOLDINGS, INC. AND SUBSIDIARIES
Notes to Consolidated Financial Statements
Restricted Stock Units (“RSUs”)
RSUs are issued at a value not less than the fair market value of the common stock on the date of the grant. RSUs granted to date vest ratably over three or four years or cliff vest in four years. Awards are subject to employment for vesting and are not transferable other than upon death.
A summary of the Company’s RSU activity and related information for fiscal year 2016 is as follows:
Number of shares |
Weighted average grant date fair value |
|||||
Nonvested balance at January 30, 2016 |
— | $ | — | |||
Granted |
137,458 | 20.36 | ||||
Forfeited |
(740 | ) |
20.26 | |||
Nonvested balance at January 28, 2017 |
136,718 | 20.36 | ||||
Stock Based Compensation Expense
The compensation cost for stock options and RSUs which has been recorded within selling, general and administrative expenses related to the Company’s equity incentive plans was $6.7 million, $5.0 million and $3.8 million for fiscal years 2016, 2015 and 2014, respectively. The Company recognized $2.5 million, $1.9 million and $1.4 million in income tax benefit for fiscal years 2016, 2015 and 2014, respectively, in the consolidated statements of income for share-based award compensation.
As of January 28, 2017, there was $12.6 million of total unrecognized compensation cost related to non-vested stock-based compensation arrangements. That cost is expected to be recognized over a weighted average period of 2.4 years. Compensation costs related to awards are recognized using the straight-line method.
| (9) | Employee Benefit Plans |
Ollie’s sponsors a defined contribution plan (“the Plan”), qualified under Internal Revenue Code (IRC) Section 401(k), for the benefit of employees. An employee becomes eligible to participate in the Plan upon attaining at least 21 years of age and completing three months of full-time employment. An employee may elect to contribute annual compensation up to the maximum allowable under the IRC. The Company assumes all administrative costs of the Plan and matches the employee’s contribution up to 25% of the first 6% of their annual compensation. The portion that the Company matches is vested ratably over six years. The employer matching contributions to the Plan were $0.2 million for fiscal years 2016, 2015 and 2014.
In addition to the regular matching contribution, the Company may elect to make a discretionary matching contribution. Discretionary contributions shall be allocated as a percentage of compensation of eligible participants for the Plan year. There were no discretionary contributions for fiscal years 2016 and 2015. Discretionary contributions were $0.3 million for fiscal year 2014.
| (10) | Common Stock |
Stockholders Agreement
The Company and its shareholders have entered into a Stockholders Agreement dated September 28, 2012, which provides for, among others, certain covenants and conditions, information, first refusal, take along, come along and rights of participation.
Initial Public Offering
In connection with the Company’s July 15, 2015 IPO, the Company amended its existing Stockholders Agreement, in which a number of provisions, including provisions relating to the election of directors and certain transfer restrictions, were automatically terminated. Immediately prior to the IPO, the Company amended and restated its certificate of incorporation to reflect the conversion of all Class B common stock to
66
OLLIE’S BARGAIN OUTLET HOLDINGS, INC. AND SUBSIDIARIES
Notes to Consolidated Financial Statements
Class A common stock. In addition, all shares of Class A common stock were recapitalized into a single class of common stock. As part of the IPO, the Company increased its authorized common stock shares to 500,000,000 at $0.001 par value per share and authorized 50,000,000 shares of preferred stock at $0.001 par value per share.
The Company issued 8,925,000 shares of its common stock in connection with its IPO. In addition, on July 17, 2015, the underwriters of the IPO exercised their option to purchase an additional 1,338,750 shares of common stock from the Company. As a result, 10,263,750 shares of common stock were issued and sold by the Company at a price of $16.00 per share.
As a result of the IPO, the Company received net proceeds of $153.1 million, after deducting the underwriting fees of $11.1 million. The Company used the net proceeds from the IPO to pay off outstanding borrowings under the Revolving Credit Facility and a portion of the outstanding principal balance of the Term Loan. See Note 5, “Debt Obligations and Financing Arrangements.”
Secondary Offerings
On February 18, 2016, the Company completed a secondary offering of 7,873,063 shares of common stock, of which 1,152,500 shares were sold by certain directors, officers and employees upon the exercise of stock options in connection with the offering. In addition, on February 19, 2016, the underwriters exercised their option to purchase an additional 1,180,959 shares of the Company’s common stock from certain selling stockholders. As a result, 9,054,022 shares of common stock were sold by certain selling stockholders at a price of $19.75 per share in this secondary offering. The Company did not sell any shares in or receive any proceeds from this secondary offering, except for $7.5 million of proceeds from the exercise of stock options. The Company incurred expenses of $0.6 million related to legal, accounting and other fees in connection with the secondary offering, which are included in selling, general and administrative expenses in the consolidated statement of income for fiscal year 2016.
On June 6, 2016, the Company completed a secondary offering of 12,152,800 shares of common stock. In addition, on June 10, 2016, the underwriters exercised their option to purchase an additional 1,822,920 shares of the Company’s common stock from certain selling stockholders. As a result, 13,975,720 shares of common stock were sold by certain selling stockholders at a price of $25.00 per share in this secondary offering. The Company did not sell any shares in or receive any proceeds from this secondary offering. The Company incurred expenses of $0.6 million related to legal, accounting and other fees in connection with this secondary offering, which are included in selling, general and administrative expenses in the consolidated statement of income for fiscal year 2016.
On September 6, 2016, the Company completed a secondary offering of 13,725,798 shares of common stock. The shares were sold by certain selling stockholders at a price of $26.07 per share in this secondary offering. The Company did not sell any shares in or receive any proceeds from this secondary offering. The Company incurred expenses of $0.6 million related to legal, accounting and other fees in connection with this secondary offering, which are included in selling, general and administrative expenses in the consolidated statement of income for fiscal year 2016.
Treasury Shares
During fiscal years 2015 and 2014, the Company repurchased 5,750 and 2,875 Class A common stock shares, respectively, from shareholders for $9.99 per share. The Company records the value of its common stock held in treasury at cost. There were no additional shares purchased during fiscal year 2016.
| (11) | Transactions with Affiliates and Related Parties |
The Company has entered into five non-cancelable operating leases with related parties for office and store locations that expire at various dates through 2023. The annual lease payments are $1.3 million for the next five years and the total remaining payments after the next five years are $3.2 million.
During fiscal years 2016, 2015 and 2014, the Company paid $0.1 million, $0.2 million and $0.2 million, respectively, for the use of an airplane owned by a related party.
67
OLLIE’S BARGAIN OUTLET HOLDINGS, INC. AND SUBSIDIARIES
Notes to Consolidated Financial Statements
| (12) | Segment Reporting |
For purposes of the disclosure requirements for segments of a business enterprise, it has been determined that the Company is comprised of one operating segment.
The following table summarizes the percentage of net sales by merchandise category for each year presented:
Fiscal Year Ended |
|||||||||
January 28, 2017 |
January 30, 2016 |
January 31, 2015 |
|||||||
Sales by merchandise category: |
|||||||||
Housewares |
12.7 | % |
13.1 | % |
14.7 | % |
|||
Food |
12.7 | 13.2 | 12.5 | ||||||
Books and stationery |
10.6 | 11.5 | 10.9 | ||||||
Bed and bath |
10.1 | 10.1 | 10.1 | ||||||
Floor coverings |
8.0 | 8.6 | 9.6 | ||||||
Electronics |
6.7 | 5.6 | 4.5 | ||||||
Toys |
5.2 | 4.9 | 5.1 | ||||||
Other |
34.0 | 33.0 | 32.6 | ||||||
100.0 | % |
100.0 | % |
100.0 | % |
||||
| (13) | Quarterly Results of Operations and Seasonality (Unaudited) |
Quarterly financial results for fiscal years 2016 and 2015 were as follows (in thousands, except for per share data):
Fiscal Year 2016 (1) |
Fiscal Year 2015 (1) |
|||||||||||||||||||||||
Fourth Quarter |
Third Quarter |
Second Quarter |
First Quarter |
Fourth Quarter |
Third Quarter |
Second Quarter |
First Quarter |
|||||||||||||||||
Net sales |
$ | 283,355 | $ | 201,985 | $ | 211,256 | $ | 193,719 | $ | 243,402 | $ | 174,565 | $ | 181,933 | $ | 162,470 | ||||||||
Gross profit |
113,392 | 84,190 | 83,814 | 79,015 | 98,839 | 69,924 | 70,058 | 64,043 | ||||||||||||||||
Net income |
24,420 | 10,461 | 13,135 | 11,748 | 16,064 | 6,762 | 6,352 | 6,661 | ||||||||||||||||
Basic earnings per common share |
$ | 0.40 | $ | 0.17 | $ | 0.22 | $ | 0.20 | $ | 0.27 | $ | 0.12 | $ | 0.13 | $ | 0.14 | ||||||||
Diluted earnings per common share |
$ | 0.39 | $ | 0.17 | $ | 0.21 | $ | 0.19 | $ | 0.26 | $ | 0.11 | $ | 0.12 | $ | 0.13 | ||||||||
| (1) | The sum of the quarterly per share amounts may not equal per share amounts reported for the fiscal year end due to rounding. |
The Company’s business is seasonal in nature and demand is generally the highest in the fourth fiscal quarter due to the holiday sales season. To prepare for the holiday sales season, Ollie’s must order and keep in stock more merchandise than is carried during other times of the year and generally engage in additional marketing efforts. The Company expects inventory levels, along with accounts payable and accrued expenses, to reach their highest levels in the third and fourth fiscal quarters in anticipation of increased net sales during the holiday sales season. As a result of this seasonality, and generally because of variation in consumer spending habits, the Company experiences fluctuations in net sales and working capital requirements during the year.
| (14) | Subsequent Event |
On March 23, 2017, the Company paid down $40.0 million on its New Term Loan Facility using existing cash.
68
Schedule I - Condensed Financial Information of Registrant
Ollie’s Bargain Outlet Holdings, Inc. (parent company only)
Condensed Balance Sheets
(In thousands)
January 28, 2017 |
January 30, 2016 |
|||||
Assets |
||||||
Total current assets |
$ | — | $ | — | ||
Long-term assets: |
||||||
Investment in subsidiaries |
651,261 | 561,949 | ||||
Total assets |
$ | 651,261 | $ | 561,949 | ||
Liabilities and stockholders’ equity |
||||||
Total current liabilities |
$ | — | $ | — | ||
Total long-term liabilities |
— | — | ||||
Total liabilities |
— | — | ||||
Stockholders’ equity: |
||||||
Common stock |
61 | 59 | ||||
Additional paid-in capital |
565,861 | 536,315 | ||||
Retained earnings |
85,425 | 25,661 | ||||
Treasury stock, at cost |
(86 | ) |
(86 | ) |
||
Total stockholders’ equity |
651,261 | 561,949 | ||||
Total liabilities and stockholders’ equity |
$ | 651,261 | $ | 561,949 | ||
See accompanying notes.
69
Schedule I - Condensed Financial Information of Registrant
Ollie’s Bargain Outlet Holdings, Inc. (parent company only)
Condensed Statements of Income
(In thousands)
Fiscal year ended |
|||||||||
January 28, 2017 |
January 30, 2016 |
January 31, 2015 |
|||||||
Net sales |
$ | — | $ | — | $ | — | |||
Cost of sales |
— | — | — | ||||||
Gross profit |
— | — | — | ||||||
Selling, general and administrative expenses |
— | — | — | ||||||
Depreciation and amortization expenses |
— | — | — | ||||||
Pre-opening expenses |
— | — | — | ||||||
Operating income |
— | — | — | ||||||
Interest expense, net |
— | — | — | ||||||
Income before income taxes and equity in net income of subsidiaries |
— | — | — | ||||||
Income tax expense |
— | — | — | ||||||
Income before equity in net income of subsidiaries |
— | — | — | ||||||
Net income of subsidiaries |
59,764 | 35,839 | 26,915 | ||||||
Net income |
$ | 59,764 | $ | 35,839 | $ | 26,915 | |||
See accompanying notes.
70
Schedule I - Condensed Financial Information of Registrant
Ollie’s Bargain Outlet Holdings, Inc. (parent company only)
Notes to Condensed Financial Statements
1. Basis of presentation
In the parent-company-only financial statements, Ollie’s Bargain Outlet Holdings, Inc.’s (the Company) investment in subsidiaries is stated at cost plus equity in undistributed earnings of subsidiaries since the date of acquisition. The parent-company-only financial statements should be read in conjunction with the Company’s consolidated financial statements. A condensed statement of cash flows was not presented because Ollie’s Bargain Outlet Holdings, Inc. had no cash flow activities during fiscal years 2016, 2015, or 2014.
2. Guarantees and restrictions
Ollie’s Bargain Outlet, Inc., a subsidiary of the Company, had $195.0 million outstanding under the New Term Loan Facility as of January 28, 2017. Under the terms of the New Term Loan Facility, Bargain Parent, Inc. has guaranteed the payment of all principal and interest. In the event of a default under the New Term Loan Facility, Bargain Parent, Inc. will be directly liable to the debt holders. The New Term Loan Facility matures on January 29, 2021.
As of January 28, 2017, Ollie’s Bargain Outlet, Inc. also had $98.8 million available for borrowing under the New Revolving Credit Facility. Bargain Parent, Inc. has guaranteed all obligations under the New Revolving Credit Facility. In the event of default under the New Revolving Credit Facility, Bargain Parent, Inc. will be directly liable to the debt holders. The New Revolving Credit Facility matures on January 29, 2021.
The New Credit Facilities are collateralized by the Company’s assets and equity and contain financial covenants, as well as certain business covenants, including restrictions on dividend payments, which the Company must comply with during the term of such agreements. The Company was in compliance with all terms of such agreements during and as of the fiscal year ended January 28, 2017.
The provisions of the New Credit Facilities restrict all of the net assets of the Company’s consolidated subsidiaries, which constitutes all of the net assets on the Company’s consolidated balance sheet as of January 28, 2017, from being used to pay any dividends or make other restricted payments without prior written consent from the lenders under the New Credit Facilities, subject to certain exceptions.
71
| Item 9. | Changes in and Disagreements with Accountants on Accounting and Financial Disclosure |
None.
| Item 9A. | Controls and Procedures |
Changes in Internal Control over Financial Reporting
There were no changes in our internal controls over financial reporting that occurred during the quarterly period ended January 28, 2017 that have materially affected, or are reasonably likely to materially affect our internal control over financial reporting.
Evaluation of Disclosure Controls and Procedures
We maintain a system of disclosure controls and procedures (as defined in Rules 13a-15(e) and 15d-15(e) under the Security Exchange Act of 1934, as amended (the “Exchange Act”)) designed to ensure that the information required to be disclosed by us in the reports that we file or submit under the Exchange Act is recorded, processed, summarized and reported within the time periods specified in the rules and forms of the Securities and Exchange Commission (“SEC”), and is accumulated and communicated to our management, including our Chief Executive Officer (our principal executive officer), our Chief Financial Officer (our principal financial officer) and our Chief Accounting Officer (our principal accounting officer), as appropriate, to allow timely decisions regarding required disclosure.
Our management, with the participation of our Chief Executive Officer, Chief Financial Officer and Chief Accounting Officer, has evaluated the effectiveness of our disclosure controls and procedures under the Exchange Act as of January 28, 2017, the end of the period covered by this Annual Report on Form 10-K. Based upon that evaluation, our Chief Executive Officer, Chief Financial Officer and Chief Accounting Officer concluded that, as of January 28, 2017, our disclosure controls and procedures are effective.
Management's Annual Report on Internal Control Over Financial Reporting
Management is responsible for establishing and maintaining adequate internal control over financial reporting as defined in Rules 13a-15(f) and 15d-15(f) under the Exchange Act. The Company’s internal control over financial reporting is a process designed to provide reasonable assurance regarding the reliability of financial reporting and the preparation of financial statements for external purposes in accordance with accounting principles generally accepted in the United States of America.
Because of its inherent limitations, internal control over financial reporting may not prevent or detect misstatements. Projections of any evaluation of effectiveness to future periods are subject to the risk that controls may become inadequate because of changes in conditions, or that the degree of compliance with policies or procedures may deteriorate.
Management, including the Chief Executive Officer, Chief Financial Officer and Chief Accounting Officer, assessed the effectiveness of internal control over financial reporting as of January 28, 2017. Management based this assessment on criteria for effective internal control over financial reporting described in Internal Control - Integrated Framework (2013) issued by the Committee of Sponsoring Organizations of the Treadway Commission (COSO). Based on this assessment, management determined that, as of January 28, 2017, the Company maintained effective internal control over financial reporting at a reasonable assurance level.
The effectiveness of the Company’s internal control over financial reporting as of January 28, 2017 has been audited by KPMG LLP, our independent registered public accounting firm, as stated in their report dated March 29, 2017 that appears below.
72
Report of Independent Registered Public Accounting Firm
The Board of Directors and Shareholders
Ollie’s Bargain Outlet Holdings, Inc.:
We have audited Ollie’s Bargain Outlet Holdings, Inc.’s internal control over financial reporting as of January 28, 2017, based on criteria established in Internal Control – Integrated Framework (2013) issued by the Committee of Sponsoring Organizations of the Treadway Commission (COSO). Ollie’s Bargain Outlet Holdings, Inc.’s management is responsible for maintaining effective internal control over financial reporting and for its assessment of the effectiveness of internal control over financial reporting, included in the accompanying Management’s Annual Report on Internal Control over Financial Reporting presented above. Our responsibility is to express an opinion on the Company’s internal control over financial reporting based on our audit.
We conducted our audit in accordance with the standards of the Public Company Accounting Oversight Board (United States). Those standards require that we plan and perform the audit to obtain reasonable assurance about whether effective internal control over financial reporting was maintained in all material respects. Our audit included obtaining an understanding of internal control over financial reporting, assessing the risk that a material weakness exists, and testing and evaluating the design and operating effectiveness of internal control based on the assessed risk. Our audit also included performing such other procedures as we considered necessary in the circumstances. We believe that our audit provides a reasonable basis for our opinion.
A company‘s internal control over financial reporting is a process designed to provide reasonable assurance regarding the reliability of financial reporting and the preparation of financial statements for external purposes in accordance with generally accepted accounting principles. A company’s internal control over financial reporting includes those policies and procedures that (1) pertain to the maintenance of records that, in reasonable detail, accurately and fairly reflect the transactions and dispositions of the assets of the company; (2) provide reasonable assurance that transactions are recorded as necessary to permit preparation of financial statements in accordance with generally accepted accounting principles, and that receipts and expenditures of the company are being made only in accordance with authorizations of management and directors of the company; and (3) provide reasonable assurance regarding prevention or timely detection of unauthorized acquisition, use, or disposition of the company’s assets that could have a material effect on the financial statements.
Because of its inherent limitations, internal control over financial reporting may not prevent or detect misstatements. Also, projections of any evaluation of effectiveness to future periods are subject to the risk that controls may become inadequate because of changes in conditions, or that the degree of compliance with the policies or procedures may deteriorate.
In our opinion, Ollie’s Bargain Outlet Holdings, Inc. maintained, in all material respects, effective internal control over financial reporting as of January 28, 2017, based on criteria established in Internal Control – Integrated Framework (2013) issued by the Committee of Sponsoring Organizations of the Treadway Commission (COSO).
We also have audited in accordance with the standards of the Public Company Accounting Oversight Board (United States), the consolidated balance sheets of Ollie’s Bargain Outlet Holdings, Inc. and subsidiaries as of January 28, 2017 and January 30, 2016, and the related consolidated statements of income, stockholders’ equity, and cash flows for each of the fiscal years in the three-year period ended January 28, 2017, and the related financial statement schedule, and our report dated March 29, 2017 expressed an unqualified opinion on those consolidated financial statements.
/s/ KPMG LLP
Philadelphia, Pennsylvania
March 29, 2017
| Item 9B. | Other Information |
None.
73
PART III
| Item 10. | Directors, Executive Officers and Corporate Governance |
The information required by this item will be contained in our definitive proxy statement in connection with our 2017 Annual Meeting of Stockholders (the “Proxy Statement”), which is expected to be filed with the SEC not later than 120 days after the end of our fiscal year ended January 28, 2017, and is incorporated herein by reference.
In addition, our Board of Directors has adopted a Code of Business Ethics that applies to all of our directors, employees and officers, including our Chief Executive Officer, Chief Financial Officer and Chief Accounting Officer. The current version of the Code of Business Ethics is available on our website under the Investor Relations section at www.ollies.us. In accordance with the rules adopted by the SEC and the NASDAQ, we intend to promptly disclose any amendments to certain provisions of the Code of Business Ethics, or waivers of such provisions granted to executive officers and directors, on our website under the Investor Relations section at www.ollies.us. The information contained on or accessible through our website is not incorporated by reference into this Annual Report on Form 10-K.
| Item 11. | Executive Compensation |
The information required by this Item will be set forth in the Proxy Statement and is incorporated herein by reference.
| Item 12. | Security Ownership of Certain Beneficial Owners and Management and Related Stockholder Matters |
The information required by this Item will be set forth in the Proxy Statement and is incorporated herein by reference.
| Item 13. | Certain Relationships and Related Transactions, and Director Independence |
The information required by this Item will be set forth in the Proxy Statement and is incorporated herein by reference.
| Item 14. | Principal Accountant Fees and Services |
The information required by this Item will be set forth in the Proxy Statement and is incorporated herein by reference.
PART IV
| Item 15. | Exhibits and Financial Statement Schedules |
Financial Statements and Financial Statement Schedules
See “-Index to Consolidated Financial Statements” in Item 8 of this Annual Report on Form 10-K. Financial statement schedules have been omitted because they are not required or are not applicable or because the information required in those schedules either is not material or is included in the consolidated financial statements or the accompanying notes.
| Item 16. | Form 10-K Summary |
Not applicable.
Exhibits
The exhibits listed in the accompanying index to exhibits are filed or incorporated by reference as part of this Annual Report on Form 10-K.
74
SIGNATURES
Pursuant to the requirements of Section 13 or 15(d) of the Securities Exchange Act of 1934, as amended, the Registrant has duly caused this Report to be signed on behalf by the undersigned, thereunto duly authorized.
|
|
OLLIE’S BARGAIN OUTLET HOLDINGS, INC.
|
|
|
|
|
|
|
Date: March 29, 2017
|
By:
|
/s/ John Swygert
|
|
|
|
Name: John Swygert
|
|
|
|
Title: Executive Vice President and Chief
Financial Officer |
|
|
|
(Principal Financial Officer)
|
POWER OF ATTORNEY
KNOW ALL PERSONS BY THESE PRESENTS, that each person whose signature appears below constitutes and appoints Mark Butler, John Swygert and Kenneth R. Bertram each or any one of them, his true and lawful attorney-in-fact and agent, with full power of substitution and resubstitution, for him and in his name, place and stead, in any and all capacities, to sign any and all amendments to this Annual Report on Form 10-K, and to file the same, with all exhibits thereto, and other documents in connection therewith, with the United States Securities and Exchange Commission, granting unto said attorneys-in-fact and agents, and each of them, full power and authority to do and perform each and every act and thing requisite and necessary to be done in connection therewith, as fully to all intents and purposes as he might or could do in person, hereby ratifying and confirming all that said attorneys-in-fact and agents, or any of them, or their or his substitutes or substitute, may lawfully do or cause to be done by virtue hereof.
Pursuant to the requirements of the Securities Exchange Act of 1934, as amended, this Annual Report on Form 10-K has been signed below by the following persons on behalf of the Registrant in the capacities and on the dates indicated.
|
Signature
|
Title
|
|
|
|
|
/s/ Mark Butler
|
President, Chief Executive Officer
and Chairman of the Board (Principal Executive Officer) |
|
Mark Butler
|
|
|
|
|
|
/s/ John Swygert
|
Executive Vice President
and Chief Financial Officer (Principal Financial Officer) |
|
John Swygert
|
|
|
|
|
|
/s/ Jay Stasz
|
Senior Vice President of Finance
and Chief Accounting Officer (Principal Accounting Officer) |
|
Jay Stasz
|
|
|
|
|
|
/s/ Richard Zannino
|
Director
|
|
Richard Zannino
|
|
|
|
|
|
/s/ Stephen White
|
Director
|
|
Stephen White
|
|
|
|
|
|
/s/ Stanley Fleishman
|
Director
|
|
Stanley Fleishman
|
|
|
|
|
|
/s/ Thomas Hendrickson
|
Director
|
|
Thomas Hendrickson
|
|
|
|
|
|
/s/ Robert Fisch
|
Director
|
|
Robert Fisch
|
75
|
Exhibit no.
|
Description
|
|
3.1†
|
Second Amended and Restated Certificate of Incorporation of Ollie’s Bargain Outlet Holdings, Inc. (incorporated by reference to Exhibit 3.1 to the Current Report filed on Form 8-K by the Company on July 21, 2015 (No. 001-37501)).
|
|
|
|
|
3.2†
|
Second Amended and Restated Bylaws of Ollie’s Bargain Outlet Holdings, Inc. (incorporated by reference to Exhibit 3.2 to the Current Report filed on Form 8-K by the Company on July 21, 2015 (No. 001-37501)).
|
|
|
|
|
4.1†
|
Form of Certificate of Common Stock (incorporated by reference to Exhibit 4.1 to Amendment No. 3 to the Form S-1 Registration Statement filed by the Company on July 8, 2015 (No. 333-204942)).
|
|
|
|
|
4.2†
|
Amended and Restated Stockholders Agreement, by and among Bargain Holdings, Inc. and certain stockholders named therein (incorporated by reference to Exhibit 4.1 to the Current Report filed on Form 8-K by the Company on July 21, 2015 (No. 001-37501)).
|
|
|
|
|
10.1†
|
Credit Agreement, dated as of September 28, 2012, among Ollie’s Holdings, Inc. and Ollie’s Bargain Outlet, Inc. as Borrowers, Bargain Parent, Inc., as Parent, the Lenders party thereto, Manufacturers and Traders Trust Company as Administrative Agent and KeyBank National Association and Jefferies Finance LLC as Co-Syndication Agents (incorporated by reference to Exhibit 10.1 to the Form S-1 Registration Statement filed by the Company on June 15, 2015 (No. 333-204942)).
|
|
|
|
|
10.2†
|
Guarantee and Collateral Agreement, dated September 28, 2012, among Bargain Parent, Inc., Ollie’s Holdings, Inc., certain Subsidiaries of Ollie’s Holdings, Inc. and Manufacturers and Traders Trust Company, as Administrative Agent (incorporated by reference to Exhibit 10.2 to the Form S-1 Registration Statement filed by the Company on June 15, 2015 (No. 333-204942)).
|
|
|
|
|
10.3†
|
First Amendment to Credit Agreement and First Amendment to Collateral Agreement, dated February 26, 2013, to Credit Agreement, dated as of September 28, 2012, among Ollie’s Holdings, Inc. and Ollie’s Bargain Outlet, Inc. as Borrowers, Bargain Parent, Inc., as Parent, the Lenders party thereto, Manufacturers and Traders Trust Company as Administrative Agent and KeyBank National Association and Jefferies Finance LLC as Co-Syndication Agents (incorporated by reference to Exhibit 10.3 to the Form S-1 Registration Statement filed by the Company on June 15, 2015 (No. 333-204942)).
|
|
|
|
|
10.4†
|
Second Amendment, dated April 11, 2014, to Credit Agreement, dated as of September 28, 2012, among Ollie’s Holdings, Inc. and Ollie’s Bargain Outlet, Inc. as Borrowers, Bargain Parent, Inc., as Parent, the Lenders party thereto, Manufacturers and Traders Trust Company as Administrative Agent and KeyBank National Association and Jefferies Finance LLC as Co-Syndication Agents (incorporated by reference to Exhibit 10.4 to the Form S-1 Registration Statement filed by the Company on June 15, 2015 (No. 333-204942)).
|
|
|
|
|
10.5†
|
Credit Agreement, dated September 28, 2012, among Ollie’s Holdings, Inc. and Ollie’s Bargain Outlet, Inc. as Borrowers, Bargain Parent, Inc., as Parent, the Lenders party thereto, Jefferies Finance LLC as Administrative Agent and Manufacturers and Traders Trust Company and KeyBank National Association and as Co-Syndication Agents (incorporated by reference to Exhibit 10.5 to the Form S-1 Registration Statement filed by the Company on June 15, 2015 (No. 333-204942)).
|
76
|
Exhibit no.
|
Description
|
|
10.6†
|
Guarantee and Collateral Agreement, dated September 28, 2012, among Bargain Parent, Inc., Ollie’s Holdings, Inc., certain Subsidiaries of Ollie’s Holdings, Inc. and Jefferies Finance LLC, as Administrative Agent (incorporated by reference to Exhibit 10.6 to the Form S-1 Registration Statement filed by the Company on June 15, 2015 (No. 333-204942)).
|
|
|
|
|
10.7†
|
First Amendment to Credit Agreement and First Amendment to Collateral Agreement, dated February 26, 2013, to Credit Agreement, dated as of September 28, 2012, among Ollie’s Holdings, Inc. and Ollie’s Bargain Outlet, Inc. as Borrowers, Bargain Parent, Inc., as Parent, the Lenders party thereto, Jefferies Finance LLC as Administrative Agent and Manufacturers and Traders Trust Company and KeyBank National Association and as Co-Syndication Agents (incorporated by reference to Exhibit 10.7 to the Form S-1 Registration Statement filed by the Company on June 15, 2015 (No. 333-204942)).
|
|
|
|
|
10.8†
|
Second Amendment and Consent, dated April 11, 2014, to Credit Agreement, dated September 28, 2012, among Ollie’s Holdings, Inc. and Ollie’s Bargain Outlet, Inc. as Borrowers, Bargain Parent, Inc., as Parent, the Lenders party thereto, Jefferies Finance LLC as Administrative Agent and Manufacturers and Traders Trust Company and KeyBank National Association and as Co-Syndication Agents (incorporated by reference to Exhibit 10.8 to the Form S-1 Registration Statement filed by the Company on June 15, 2015 (No. 333-204942)).
|
|
|
|
|
10.9†
|
Credit Agreement, dated as of January 29, 2016, by and among Ollie’s Holdings, Inc., a Delaware corporation, Ollie’s Bargain Outlet, Inc., a Pennsylvania corporation, and any subsidiary loan party that becomes a Borrower pursuant to the terms thereto, as borrowers, Bargain Parent, Inc., a Delaware corporation, as parent, Manufacturers and Traders Trust Company, as administrative agent, the other agents party thereto and the lenders party thereto (incorporated by reference to Exhibit 10.1 to the Current Report filed on Form 8-K by the Company on February 2, 2016 (No. 001-37501)).
|
|
|
|
|
10.10†
|
Guarantee and Collateral Agreement, dated as of January 29, 2016, by and among Bargain Parent, Inc., Ollie’s Holdings, Inc. and certain Subsidiaries of Ollie’s Holdings, Inc. in favor of Manufacturers and Traders Trust Company, as Administrative Agent (incorporated by reference to Exhibit 10.2 to the Current Report filed on Form 8-K by the Company on February 2, 2016 (No. 001-37501)).
|
|
|
|
|
10.11†
|
Form of Director and Officer Indemnification Agreement (incorporated by reference to Exhibit 10.9.1 to Amendment No. 3 to the Form S-1 Registration Statement filed by the Company on July 8, 2015 (No. 333-204942)).
|
|
|
|
|
10.12†
|
Form of Sponsor Director Indemnification Agreement (incorporated by reference to Exhibit 10.9.2 to Amendment No. 3 to the Form S-1 Registration Statement filed by the Company on July 8, 2015 (No. 333-204942)).
|
|
|
|
|
10.13†
|
Employment Agreement, dated September 28, 2012, by and between Ollie’s Bargain Outlet, Inc. and Mark Butler (incorporated by reference to Exhibit 10.10 to the Form S-1 Registration Statement filed by the Company on June 15, 2015 (No. 333-204942)).
|
|
|
|
|
10.14†
|
Employment Agreement, dated September 28, 2012, by and between Ollie’s Bargain Outlet, Inc. and John W. Swygert, Jr. (incorporated by reference to Exhibit 10.11 to the Form S-1 Registration Statement filed by the Company on June 15, 2015 (No. 333-204942)).
|
77
|
Exhibit no.
|
Description
|
|
10.15†
|
Employment Agreement, dated January 6, 2014, by and between Ollie’s Bargain Outlet, Inc. and Omar Segura (incorporated by reference to Exhibit 10.12 to the Form S-1 Registration Statement filed by the Company on June 15, 2015 (No. 333-204942)).
|
|
|
|
|
10.16†
|
Employment Agreement, dated May 12, 2014, by and between Ollie’s Bargain Outlet, Inc. and Kevin McLain (incorporated by reference to Exhibit 10.13 to the Form S-1 Registration Statement filed by the Company on June 15, 2015 (No. 333-204942)).
|
|
|
|
|
10.17†
|
Employment Agreement, dated September 28, 2012, by and between Ollie’s Bargain Outlet, Inc. and Howard Freedman (incorporated by reference to Exhibit 10.14 to the Form S-1 Registration Statement filed by the Company on June 15, 2015 (No. 333-204942)).
|
|
|
|
|
10.18†
|
Employment Agreement, dated April 16, 2014, by and between Ollie’s Bargain Outlet, Inc. and Robert Bertram (incorporated by reference to Exhibit 10.15 to the Form S-1 Registration Statement filed by the Company on June 15, 2015 (No. 333-204942)).
|
|
|
|
|
10.19†
|
Employment Agreement, dated November 18, 2015, by and between Ollie’s Bargain Outlet, Inc. and Jay Stasz (incorporated by reference to Exhibit 10.1 to the Quarterly Report filed on Form 10-Q by the Company on December 10, 2015 (No. 001-37501)).
|
|
|
|
|
10.20†
|
Bargain Holdings Inc. 2012 Equity Incentive Plan (incorporated by reference to Exhibit 10.16 to the Form S-1 Registration Statement filed by the Company on June 15, 2015 (No. 333-204942)).
|
|
|
|
|
10.21†
|
Form of Stock Option Agreement under Bargain Holdings, Inc. 2012 Equity Incentive Plan (incorporated by reference to Exhibit 10.17 to the Form S-1 Registration Statement filed by the Company on June 15, 2015 (No. 333-204942)).
|
|
|
|
|
10.22†
|
2015 Equity Incentive Plan (incorporated by reference to Exhibit 4.1 to the Form S-8 Registration Statement filed by the Company on July 15, 2015 (No. 333-204942)).
|
|
|
|
|
10.23†
|
Form of Stock Option Agreement under 2015 Equity Incentive Plan (incorporated by reference to Exhibit 10.23 to Amendment No. 2 to the Form S-1 Registration Statement filed by the Company on July 6, 2015 (No. 333- 204942)).
|
|
|
|
|
10.24†
|
Amendment to Employment Agreement, dated July 15, 2015, by and between Ollie’s Bargain Outlet, Inc. and Mark Butler (incorporated by reference to Exhibit 10.23 to the Form S-1 Registration Statement filed by the Company on February 8, 2016 (No. 333-209420)).
|
|
|
|
|
10.25†
|
Amendment to Employment Agreement, dated July 15, 2015, by and between Ollie’s Bargain Outlet, Inc. and John W. Swygert, Jr (incorporated by reference to Exhibit 10.24 to the Form S-1 Registration Statement filed by the Company on February 8, 2016 (No. 333-209420)).
|
|
|
|
|
10.26†
|
Amendment to Employment Agreement, dated July 15, 2015, by and between Ollie’s Bargain Outlet, Inc. and Omar Segura (incorporated by reference to Exhibit 10.25 to the Form S-1 Registration Statement filed by the Company on February 8, 2016 (No. 333-209420)).
|
|
|
|
|
10.27†
|
Amendment to Employment Agreement, dated July 15, 2015, by and between Ollie’s Bargain Outlet, Inc. and Kevin McLain (incorporated by reference to Exhibit 10.26 to the Form S-1 Registration Statement filed by the Company on February 8, 2016 (No. 333-209420)).
|
78
|
Exhibit no.
|
Description
|
|
10.28†
|
Amendment to Employment Agreement, dated July 15, 2015, by and between Ollie’s Bargain Outlet, Inc. and Howard Freedman (incorporated by reference to Exhibit 10.27 to the Form S-1 Registration Statement filed by the Company on February 8, 2016 (No. 333-209420)).
|
|
|
|
|
10.29†
|
Amendment to Employment Agreement, dated July 15, 2015, by and between Ollie’s Bargain Outlet, Inc. and Kenneth Robert Bertram (incorporated by reference to Exhibit 10.28 to the Form S-1 Registration Statement filed by the Company on February 8, 2016 (No. 333-209420)).
|
|
|
|
|
21.1*
|
List of subsidiaries
|
|
|
|
|
23.1*
|
Consent of KPMG LLP
|
|
|
|
|
24.1*
|
Power of Attorney (included on the signature pages herein).
|
|
|
|
|
31.1*
|
Certification of Chief Executive Officer pursuant to Rule 13a-14(a) or 15d-14(a) of the Securities Exchange Act of 1934, as amended, as adopted pursuant to Section 302 of the Sarbanes-Oxley Act of 2002.
|
|
|
|
|
31.2*
|
Certification of Chief Financial Officer pursuant to Rule 13a-14(a) or 15d-14(a) of the Securities Exchange Act of 1934, as amended, as adopted pursuant to Section 302 of the Sarbanes-Oxley Act of 2002.
|
|
|
|
|
32.1*
|
Certification of Chief Executive Officer Pursuant to 18 U.S.C. Section 1350 as adopted pursuant to Section 906 of the Sarbanes-Oxley Act of 2002.
|
|
|
|
|
32.2*
|
Certification of Chief Financial Officer Pursuant to 18 U.S.C. Section 1350 as adopted pursuant to Section 906 of the Sarbanes-Oxley Act of 2002.
|
|
|
|
|
101.INS*
|
XBRL Instance Document
|
|
|
|
|
101.SCH*
|
XBRL Taxonomy Extension Schema Document
|
|
|
|
|
101.CAL*
|
XBRL Taxonomy Extension Calculation Linkbase Document
|
|
|
|
|
101.DEF*
|
XBRL Taxonomy Extension Definition Linkbase Document
|
|
|
|
|
101.LAB*
|
XBRL Taxonomy Extension Label Linkbase Document
|
|
|
|
|
101.PRE*
|
XBRL Taxonomy Extension Presentation Linkbase Document
|
| * | Filed herewith. |
| † | Previously filed. |
79