Attached files
| file | filename |
|---|---|
| 8-K - 8-K - Jack Cooper Holdings Corp. | jchc_currentfolio8k.htm |
Exhibit 99.1
|
|
7 Jack Cooper Holdings Corp. 2016 Earnings Call March 29, 2017 0 0 |
|
|
Safe Harbor Statement This presentation has been prepared by Jack Cooper Holdings Corp. (“JCHC” or the “Company”) and no representation or warranty, either express or implied, is being made by JCHC or any person acting on its behalf as to the accuracy or completeness of the information which is furnished to you in connection with JCHC’s presentation, whether orally or in writing, and no liability to JCHC or its affiliates shall result from the use of the information or any inaccuracies or errors therein or omissions therefrom; and nothing related to JCHC’s presentation may be relied upon as a promise or representation, whether as to the past or the future. The statements in this presentation that relate to future plans, events or performance are “forward-looking statements” within the meaning of the Private Securities Litigation Reform Act of 1995. Forward-looking statements include without limitation any statements regarding our expected future financial position, results of operations, cash flows, financing plans, business strategy, products and services, competitive positions, growth opportunities, plans and objectives of management for future operations, as well as statements that include words such as "anticipate," "if," "believe," "plan," "estimate," "expect," "intend," "may," “should” and other similar expressions. All forward-looking statements involve risks, uncertainties and contingencies which may cause actual results, performance, or achievements to differ materially from anticipated results, performance, or achievements. Although the Company believes that the assumptions underlying the forward-looking statements are reasonable, we caution you that any of these assumptions may be inaccurate and, therefore, the Company’s actual results could differ materially from those contained herein. Additional detailed information concerning a number of factors that could cause actual results to differ from the information that management may give you is detailed in the Company’s annual report and quarterly report, which are available on our investor website. Forward-looking statements speak only as of today’s date and we do not undertake any obligation to update publicly any such statement. Non-GAAP Financial Measures EBITDA, adjusted EBITDA and margins thereon are “non-GAAP financial measures” presented as supplemental measures of the Company’s performance. They are not presented in accordance with accounting principles generally accepted in the United States, or GAAP. The Company believes these measures provide additional meaningful information in evaluating its performance over time. However, EBITDA, adjusted EBITDA and margins thereon have limitations as analytical tools, and you should not consider them in isolation, or as substitutes for analysis of the Company’s results as reported under GAAP. In addition, in evaluating EBITDA, adjusted EBITDA and margins thereon, you should be aware that the adjustments may vary from period to period. The Company’s presentation of these measures should not be construed as an inference that future results will be unaffected by unusual or nonrecurring items. This presentation provides a reconciliation of net loss to EBITDA and adjusted EBITDA, the most directly comparable GAAP performance measure. 1 |
|
|
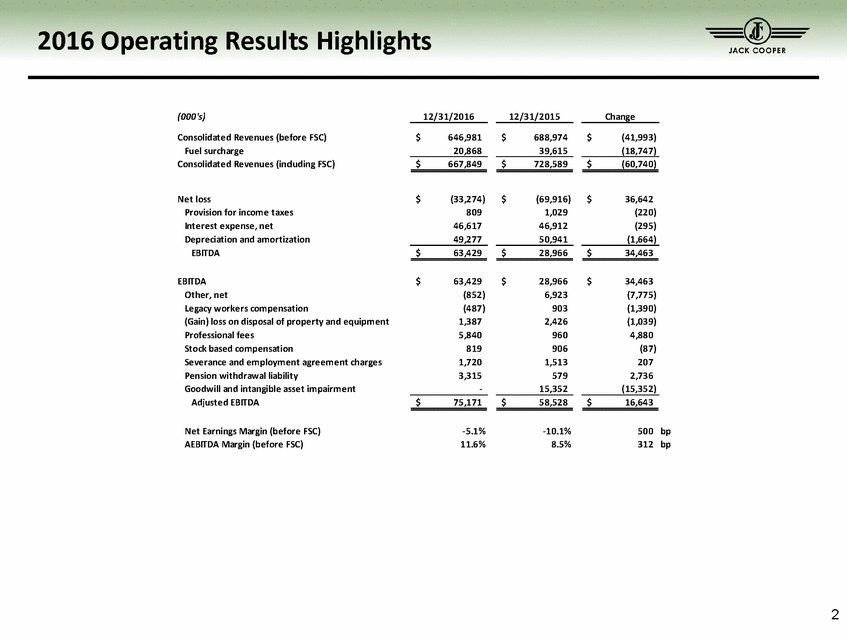
2016 Operating Results Highlights (000's) Consolidated Revenues (before FSC) Fuel surcharge Consolidated Revenues (including FSC) 12/31/2016 12/31/2015 Change $ 646,981 $ 688,974 $ (41,993) 20,868 39,615 (18,747) $ 667,849 $ 728,589 $ (60,740) Net loss Provision for income taxes Interest expense, net Depreciation and amortization EBITDA $ (33,274) 809 46,617 $ (69,916) 1,029 46,912 $ 36,642 (220) (295) 49,277 50,941 (1,664) $ 63,429 $ 28,966 $ 34,463 EBITDA Other, net Legacy workers compensation (Gain) loss on disposal of property and equipment Professional fees Stock based compensation Severance and employment agreement charges Pension withdrawal liability Goodwill and intangible asset impairment Adjusted EBITDA $ 63,429 (852) (487) 1,387 5,840 819 1,720 3,315 $ 28,966 6,923 903 2,426 960 906 1,513 579 $ 34,463 (7,775) (1,390) (1,039) 4,880 (87) 207 2,736 - 15,352 (15,352) $ 75,171 $ 58,528 $ 16,643 Net Earnings Margin (before FSC) AEBITDA Margin (before FSC) -5.1% 11.6% -10.1% 8.5% 500 312 bp bp 2 |
|
|
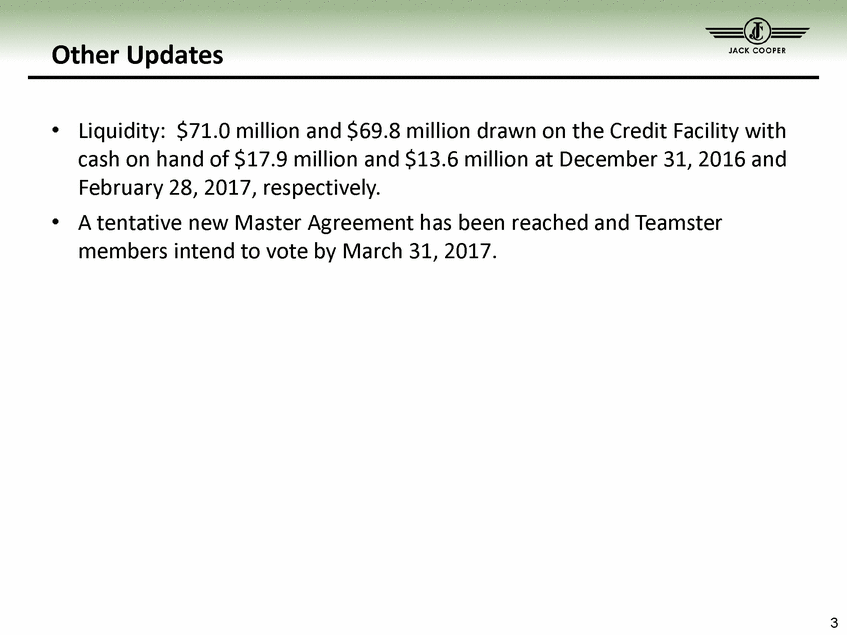
Other Updates • Liquidity: $71.0 million and $69.8 million drawn on the Credit Facility with cash on hand of $17.9 million and $13.6 million at December 31, 2016 and February 28, 2017, respectively. A tentative new Master Agreement has been reached and Teamster members intend to vote by March 31, 2017. • 3 |


