Attached files
| file | filename |
|---|---|
| EX-32.1 - EX-32.1 - EVERSPIN TECHNOLOGIES INC | mram-20161231ex321d530df.htm |
| EX-31.2 - EX-31.2 - EVERSPIN TECHNOLOGIES INC | mram-20161231ex312d7fbd7.htm |
| EX-31.1 - EX-31.1 - EVERSPIN TECHNOLOGIES INC | mram-20161231ex3111a502e.htm |
| EX-23.1 - EX-23.1 - EVERSPIN TECHNOLOGIES INC | mram-20161231ex231961062.htm |
| EX-10.25 - EX-10.25 - EVERSPIN TECHNOLOGIES INC | mram-20161231ex1025abf4d.htm |
UNITED STATES
SECURITIES AND EXCHANGE COMMISSION
Washington, D.C. 20549
FORM 10‑K
(Mark One)
|
☒ |
ANNUAL REPORT PURSUANT TO SECTION 13 OR 15(d) OF THE SECURITIES EXCHANGE ACT OF 1934 |
For the fiscal year ended December 31, 2016
OR
|
◻ |
TRANSITION REPORT PURSUANT TO SECTION 13 OR 15(d) OF THE SECURITIES EXCHANGE ACT OF 1934 FOR THE TRANSITION PERIOD FROM TO |
Commission File Number 001‑37900
Everspin Technologies, Inc.
(Exact name of Registrant as specified in its Charter)
|
Delaware |
26‑2640654 |
|
(State or other jurisdiction |
(I.R.S. Employer |
1347 N. Alma School Road, Suite 220
Chandler, Arizona 85224
(Address of principal executive offices including zip code)
Registrant’s telephone number, including area code: (480) 347‑1111
Securities registered pursuant to Section 12(b) of the Act: Common Stock, Par Value $0.0001 Per Share; Common stock traded on the NASDAQ Stock Market
Securities registered pursuant to Section 12(g) of the Act: None
Indicate by check mark if the Registrant is a well-known seasoned issuer, as defined in Rule 405 of the Securities Act. YES ☐ NO ☒
Indicate by check mark if the Registrant is not required to file reports pursuant to Section 13 or 15(d) of the Act. YES ☐ NO ☒
Indicate by check mark whether the Registrant: (1) has filed all reports required to be filed by Section 13 or 15(d) of the Securities Exchange Act of 1934 during the preceding 12 months (or for such shorter period that the Registrant was required to file such reports), and (2) has been subject to such filing requirements for the past 90 days. YES ☒ NO ☐
Indicate by check mark whether the Registrant has submitted electronically and posted on its corporate Web site, if any, every Interactive Data File required to be submitted and posted pursuant to Rule 405 of Regulation S-T (§232.405 of this chapter) during the preceding 12 months (or for such shorter period that the Registrant was required to submit and post such files). YES ☒ NO ☐
Indicate by check mark if disclosure of delinquent filers pursuant to Item 405 of Regulation S-K (§229.405) is not contained herein, and will not be contained, to the best of Registrant’s knowledge, in definitive proxy or information statements incorporated by reference in Part III of this Form 10‑K or any amendment to this Form 10‑K. ☒
Indicate by check mark whether the Registrant is a large accelerated filer, an accelerated filer, a non-accelerated filer, or a smaller reporting company. See the definition of “large accelerated filer”, “accelerated filer”, and “smaller reporting company” in Rule 12b‑2 of the Exchange Act. (Check one):
|
Large accelerated filer |
|
☐ |
|
Accelerated filer |
|
☐ |
|
|
|
|
|
|||
|
Non-accelerated filer |
|
☒ (Do not check if a small reporting company) |
|
Small reporting company |
|
☐ |
Indicate by check mark whether the Registrant is a shell company (as defined in Rule 12b‑2 of the Exchange Act). YES ◻ NO ☒
The registrant’s common stock was not publicly traded as of the last business day of the registrant’s most recently completed second fiscal quarter. The number of shares of Registrant’s Common Stock outstanding as of March 23, 2017 was 12,500,178.
Portions of the Registrant’s Definitive Proxy Statement relating to the Annual Meeting of Shareholders, which will be filed with the Securities and Exchange Commission within 120 days after the end of the Registrant’s fiscal year ended December 31, 2016, are incorporated by reference into Part III of this Report.
2
Forward-Looking Statements
This Annual Report on Form 10‑K contains forward-looking statements concerning our business, operations and financial performance and condition, as well as our plans, objectives and expectations for our business operations and financial performance and condition. Any statements contained herein that are not statements of historical facts may be deemed to be forward-looking statements. In some cases, you can identify forward-looking statements by terminology such as “aim,” “anticipate,” “assume,” “believe,” “continue,” “could,” “due,” “estimate,” “expect,” “goal,” “intend,” “may,” “objective,” “plan,” “predict,” “potential,” “positioned,” “seek,” “should,” “will,” “would,” and other similar expressions that are predictions of or indicate future events and future trends, or the negative of these terms or other comparable terminology, although not all forward-looking statements contain these words. These forward-looking statements include, but are not limited to, statements about:
|
· |
estimates of our future revenue, expenses, capital requirements and our needs for additional financing; |
|
· |
the implementation of our business model and strategic plans for our products, technologies and businesses; |
|
· |
competitive companies and technologies and our industry; |
|
· |
our ability to manage and grow our business by expanding our sales to existing customers or introducing our products to new customers; |
|
· |
our ability to establish and maintain intellectual property protection for our products or avoid claims of infringement; |
|
· |
our ability to hire and retain key personnel; |
|
· |
our financial performance; |
|
· |
our estimates of the MRAM market opportunity; and |
|
· |
the volatility of our share price. |
Forward-looking statements are based on management’s current expectations, estimates, forecasts, and projections about our business and the industry in which we operate, and management’s beliefs and assumptions are not guarantees of future performance or development and involve known and unknown risks, uncertainties, and other factors that are in some cases beyond our control. As a result, any or all of our forward-looking statements in this report may turn out to be inaccurate. Furthermore, if the forward-looking statements prove to be inaccurate, the inaccuracy may be material. In light of the significant uncertainties in these forward-looking statements, you should not regard these statements as a representation or warranty by us or any other person that we will achieve our objectives and plans in any specified time frame, or at all. Factors that may cause actual results to differ materially from current expectations include, among other things, those listed under “Risk Factors” and elsewhere in this report. These statements, like all statements in this report, speak only as of their date, and we undertake no obligation to update or revise these statements in light of future developments. We caution investors that our business and financial performance are subject to substantial risks and uncertainties. Except as required by law, we assume no obligation to update or revise these forward-looking statements for any reason, even if new information becomes available in the future.
3
Overview
We are the leading provider of magnetoresistive random access memory (MRAM) products. Our MRAM products offer the persistence of non-volatile memory, a type of memory that retains information even in the absence of power, with the speed and endurance of random access memory (RAM), and enable the protection of mission critical data particularly in the event of power interruption or failure. Our MRAM products allow our customers in the industrial, automotive and transportation, and enterprise storage markets to design high performance, power efficient and reliable systems without the need for bulky batteries or capacitors. We are the only provider of commercially available MRAM solutions, and over the past eight years we have shipped over 60 million MRAM units.
Our MRAM technology, unlike traditional semiconductor memory technologies, stores data as a magnetic state rather than an electrical charge, and is offered as either a discrete or embedded solution. Our products read and write data at speeds on par with most dynamic RAM (DRAM) and static RAM (SRAM). Our products offer the non-volatility of flash memory but with significantly superior endurance. We offer our MRAM products with different densities and interfaces to address the various needs of our customers. Our lower-density MRAM products, which we define as having bit densities from 128kb to 16Mb, offer write-speeds on par with SRAM, with virtually unlimited endurance. Our higher density products, which we define as having bit densities at or greater than 64Mb, offer write-speeds on par with DRAM and have superior endurance compared to most other non-volatile memory technologies.
Our lower-density products are optimized for use in industrial, and automotive and transportation applications, while our higher-density products are optimized for use in enterprise storage applications. In the enterprise storage market, we collaborate with industry-leading memory controller companies to enable compatibility of their controllers with our MRAM products, facilitating the adoption of our solutions into our customers’ existing end products. We have over 600 customers worldwide, including Honeywell, ifm, Nikkiso and Siemens in the industrial market, Airbus and Hyundai Mobis in the automotive and transportation market, and Broadcom, Dell, IBM and Lenovo in the enterprise storage market. We sell our products directly and through our established distribution channel to industry-leading original equipment manufacturers (OEMs) and original design manufacturers (ODMs)
We leverage both internal and outsourced manufacturing capabilities to produce our MRAM products. We purchase industry-standard complementary metal-oxide semiconductor (CMOS) wafers from semiconductor foundries and complete the processing of our products by inserting our magnetic-bit technology at our 200mm fabrication facility in Chandler, Arizona. We have entered into a manufacturing agreement with GLOBALFOUNDRIES for 300mm high-volume production of our higher-density products. We believe our strategic relationship with GLOBALFOUNDRIES accelerates the development of our MRAM solutions, provides us with leading-edge outsourced manufacturing capabilities, and enables us to operate a variable cost financial model. In addition, GLOBALFOUNDRIES has the ability to embed our technology in its products for sale to its customers, from which we would earn licensing or royalty revenue.
For the years ended December 31, 2016, 2015, and 2014 we recorded revenue of $27.1 million, $26.5 million, $24.9 million, gross margin of 54.3%, 52.7%, and 52.6%, and a net loss of $16.7 million, $18.2 million, and $10.2 million, respectively. As of December 31, 2016, we had 90 employees, more than half of whom are engaged in research and development. Our headquarters are located in Chandler, Arizona. Our principal design center is in Austin, Texas, and we have additional sales operations in the Americas, Europe and Asia-Pacific regions.
4
The Opportunity for Fast, Persistent MemoryMRAM
Traditional memory technologies have either fast write-speeds or are non-volatile, but not both. MRAM combines both features into a single solution, making it an ideal memory to protect data in the event of power interruption or failure, and to store data that is frequently written and accessed. We believe customers that employ MRAM in their systems are better able to design higher performance, lower power, more reliable and simpler systems than they would be able to design using other existing memory technologies. The following attributes make MRAM an increasingly important application specific memory solution for system architectures that require non-volatile memory with the speed and endurance of RAM:
Non-volatile. MRAM can retain data in the event of power interruption or failure, which enables end-system designers to create products without costly power-loss protection systems, such as batteries and capacitors.
Fast Write- Speeds. MRAM offers write-speeds that are on par with the fastest available volatile memory technologies, including most DRAM and SRAM and is significantly faster than other non-volatile memories used today. For example, MRAM writes a block over 100,000 times faster than NAND flash, a type of non-volatile flash memory.
Superior Write- Cycle Endurance. MRAM offers superior write-cycle endurance to existing non-volatile solutions, enabling end-systems designers to offer products that are not limited by memory wear-out. For example, MRAM write-cycle endurance is nearly 10 million times greater than NAND flash.
Scalable to Greater Densities and Smaller Process Geometries. MRAM’s write-speed and endurance are scalable with increasing bit densities and smaller geometries, which we believe will allow system designers to employ MRAM in applications that require more memory and smaller form factors.
Proven to be Manufacturable at High Volumes. MRAM can be manufactured in high volumes and in advanced nodes, and is compatible with standard CMOS.
Low Energy Requirement. MRAM utilizes energy efficiently over the duration of its write and read cycles. It has the ability to be completely powered down, consuming no energy while still retaining data, which data can be accessed quickly once power is restored.
These attributes enable MRAM to be used as a true Storage Class Memory, by which we mean a form of memory that has non-volatility that is similar to storage but with performance that is similar to DRAM or SRAM. MRAM has already proven its commercial viability as a discrete and embedded solution in application-specific memory markets and we believe it will become a mainstream memory technology in the future.
Discrete MRAM Market Opportunity
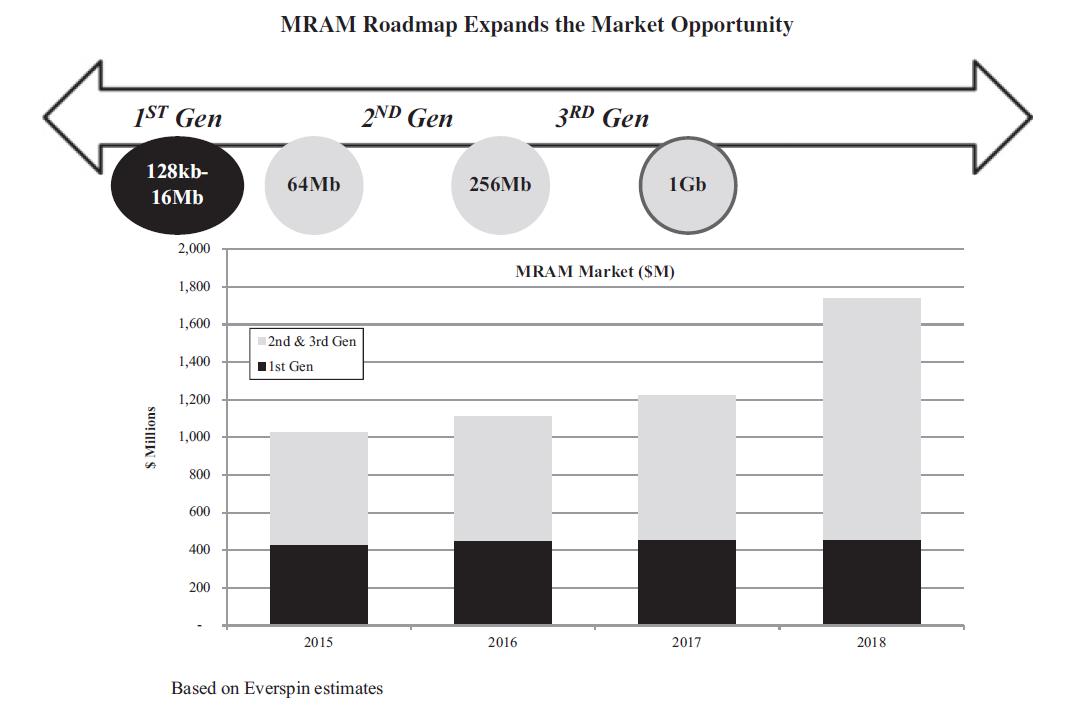
We estimate the market opportunity for application specific MRAM products to be approximately $1.8 billion by 2018, growing approximately at a 19% compound annual growth rate (CAGR) from approximately $1 billion in 2015. We expect the introduction of increasingly higher density MRAM solutions will result in greater adoption of MRAM technology into a wider range of applications and end markets.
We expect our first generation MRAM solutions, which have lower bit densities ranging from 128kb to 16Mb, to continue to serve customers in the industrial, automotive and transportation end markets, where products tend to have long product life cycles. As MRAM bit densities increase, we believe MRAM solutions will be well-suited to address a wider range of large and growing markets, such as server and storage, increasing the overall market opportunity for MRAM. We believe our second and third generation MRAM solutions, which are designed to have bit densities at or greater than 64Mb, will drive the rapid adoption of our products into enterprise storage applications. We believe the introduction of MRAM solutions with bit densities greater than 1Gb will extend the opportunity for MRAM into additional adjacent markets such as server and mobile computing.
5
Embedded MRAM Technology
In addition to use as a discrete product, MRAM can serve as embedded memory in a variety of CMOS technologies. Memory accounts for a significant portion of the area of System-on-a-Chips (SoCs), application-specific integrated circuits (ASICs), application-specific standard products, microcontrollers, baseband processors, storage controllers, application processors and field-programmable gate arrays. Memory that is integrated in these products is called embedded memory and offers similar performance to its discrete counterparts.
Today’s embedded memory solutions include embedded SRAM (eSRAM), embedded Flash (eFlash), and embedded DRAM (eDRAM). We believe these technologies have difficulties scaling to advanced CMOS processing nodes. Embedded MRAM’s (eMRAM) compatibility with CMOS processes, combined with its lower leakage, byte addressability and high write-cycle endurance make it well-suited as a replacement for eSRAM, eFlash and eDRAM. We believe the use of eMRAM will be more cost effective for foundries by maintaining compatibility with standard CMOS, thus improving manufacturing efficiency.
eSRAM, which uses six transistors (6‑T) to construct a memory bit, requires more silicon area and additional power due to leakage current from its multiple-transistor architecture. Embedded MRAM, which uses a single transistor architecture, results in less leakage current and requires a smaller area on an integrated circuit to achieve equivalent or better performance than eSRAM.
eFlash requires relatively high voltage and area overhead to program the memory bits, which is contrary to the trend of scaling down the CMOS process for lower power and less chip area. eFlash also has a limited number of write cycles, which can render it ineffective as working memory on the chip. Compared to eFlash,
eMRAM requires lower voltage to program bits, which results in greater power efficiency and it has higher write-cycle endurance. eMRAM is byte-addressable and has symmetric read and write timing, which makes it suitable as working memory. eFlash must be erased and programmed in pages, which is less efficient for intensive writing applications.
eDRAM is a volatile memory that does not retain data when power is off. eDRAM manufacturing requires additional process steps and costs to build a capacitor to store the data. This manufacturing process could diminish the functionality of the memory or logic components in the integrated circuit. eMRAM, however, can be added towards the end of the manufacturing process, which does not impact the overall performance of the integrated circuit.
6
The versatility of eMRAM can simplify the design and architecture of the overall integrated circuit by providing the ability to have one memory type serve as both working memory and code storage memory.
Our Solutions
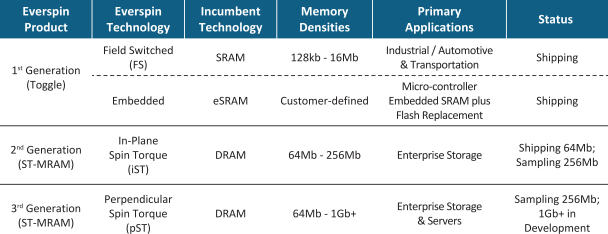
We are the only commercial provider of MRAM products. We have a strong track record of innovation in MRAM technology, as demonstrated by our successive introduction of MRAM products that address an increasingly broad spectrum of applications. Our three generations of MRAM discrete solutions are set forth in the following table.
First Generation
Our first generation products, which we have been shipping since 2008, are primarily designed to address applications in the industrial, automotive and transportation markets. Our customers in these markets require memory technology that is non-volatile, writes continuously at high speeds to limit data loss, operates in harsh environments, and maintains endurance over long product lifecycles. To address these requirements, we designed our first generation of MRAM products to offer the persistence of non-volatile memory, speeds comparable to SRAM, reliability across a wide temperature range, and virtually unlimited write-cycles. We have designed our first generation products to be compatible with industry standard interfaces, including standard SRAM, SPI (Serial Peripheral Interface) and QSPI (Quad SPI) interfaces, enabling our customers to replace incumbent memory solutions with our first generation MRAM solutions. We believe this has been important for the initial success and early adoption of our first generation products.
Second Generation
Our second generation products, which began shipping in 2014, are principally designed to address the requirements of the enterprise storage market, which includes high performance Solid-State Drives (SSDs), Redundant array of independent disks (RAID) systems and servers. Our customers require low latency, protection of data against power interruption and failure, high density and reliability. Our second generation products offer performance comparable to DRAM, and are up to five orders of magnitude faster than flash block writes, non-volatile to protect against power loss, four times the density of our largest first generation product, and offer endurance superior to flash. We have designed our second generation products to be compatible with industry standard DDR3 interfaces, enabling our customers to realize the benefits of higher performance and power efficiency as compared to traditional memory products requiring batteries or super capacitors.
Third Generation
Our third generation products, which are currently in development, are initially targeted for enterprise-class storage and server applications. We use our Perpendicular Magnetic Tunnel Junction (PMTJ) technology to deliver further bit density and power efficiency increases to create a true Storage Class Memory solution. Our third generation products are designed to be compatible with standard DDR3, DDR4, SPI, and QSPI interfaces, which we believe will facilitate market adoption of our products in the enterprise storage and server markets.
7
Embedded MRAM
We offer embedded MRAM (eMRAM) to our customers for integration in their SoC solutions. We also enable GLOBALFOUNDRIES to offer eMRAM in the solutions they manufacture for their customers. Our embedded memory solutions offer high performance, low cost and low power and can be manufactured using standard CMOS. eMRAM offers significant advantages over existing embedded memory solutions, particularly in endurance, bandwidth, energy and area requirements, leakage and persistence. We believe our eMRAM solutions offer the performance benefits and process compatibility to become the embedded memory of choice for our current and future foundry partners.
Sensors
We have developed and are currently shipping a high performance, high-reliability magnetic sensor, which is based on our Magnetic Tunnel Junction (MTJ) technology, which is at the core of our memory technology. Our magnetic sensor offers three-axis orientation in a single die, and is integrated into consumer electronics applications as an electronic compass. We believe our magnetic sensor technology can be used for additional power management applications in the industrial, and automotive and transportation, end markets. We currently license our magnetic sensor technology to third parties for their commercial use and plan to continue this strategy.
Aerospace
Aerospace and satellite electronic systems require memory that is able to withstand exposure to the levels of radiation encountered in avionics and space applications. MRAM is not susceptible to radiation induced errors because data is stored as a magnetic state rather than as an electrical charge. Aerospace and satellite equipment manufacturers license our technology for use in their electronic systems. Through license agreements, we provide manufacturing service and technology access to certain of our customers, and we sell products to value added subcontractors.
Our Technology
Memory Architecture
Our MRAM solutions are based on our MTJ technology, which writes data by establishing a stable magnetic state, and reads data by measuring the resistance of the MTJ. MTJ devices are multilayered structures, including thin metal and dielectric layers, which are fabricated with methods commonly used in semiconductor manufacturing. The resistance is determined by the orientation of the magnetic field in the free layer relative to the fixed layer.
First Generation MRAM Technology
Our first generation MRAM technology uses a magnetic field to program, or write, bits. A significant advantage of this “field switching” is virtually unlimited write endurance, as reversing the free-layer magnetization with a magnetic field does not have any wear-out mechanism. Field Switched MRAM products are currently in production at the 180nm and 130nm nodes.
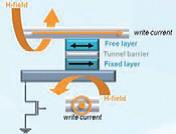
Field Switched MRAM bit cell. Each bit cell comprises an MTJ connected in series with a select transistor.
Second and Third Generation MRAM Technology
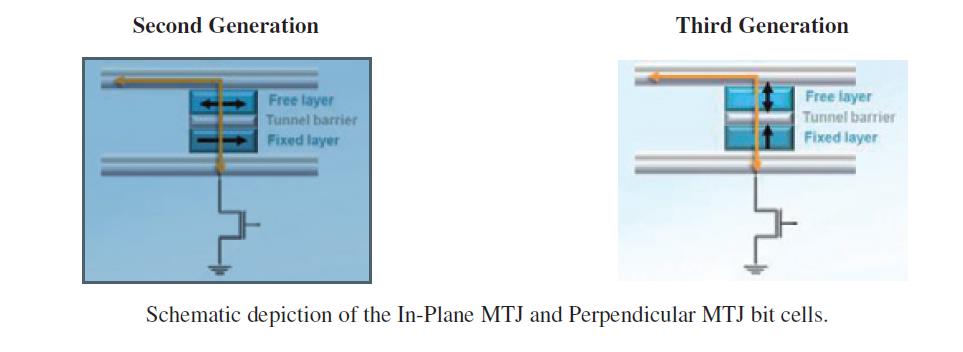
Our second and third generations of MRAM technologies use the spin-torque transfer property, which is the manipulation of the spin of electrons with a polarizing current, to establish the desired magnetic state of the free layer to program, or write, the bits in the memory array. Spin-torque MRAM, or ST-MRAM, provides a significant reduction in
8
switching energy compared to Field-switched MRAM, and is highly scalable, enabling higher density memory products. Our second generation MRAM technology uses an In-Plane MTJ structure, while our third generation uses a Perpendicular MTJ. We have developed materials and Perpendicular MTJ stack designs with high perpendicular magnetic anisotropy, which provides long data retention, small cell size, greater density, high endurance and low power.
Embedded MRAM Technology
MRAM technology is more easily embedded than most other memory technologies, due to the way the MRAM module is integrated in standard CMOS. Since the MRAM module is inserted between metal layers in the back-end-of-line part of the fabrication process, above the transistor layers, it does not disturb the CMOS fabrication process. Integrating MRAM in standard CMOS for SoC applications does not impact the performance of the integrated circuit.
Customers
Our MRAM products are used by industry-leading customers in the industrial, automotive and transportation, and enterprise storage markets. Representative customers using our discrete products in these end markets include:
|
Industrial |
|
Automotive and Transportation |
|
Enterprise Storage |
|
Honeywell |
|
Airbus |
|
Broadcom |
|
ifm |
|
Hyundai Mobis |
|
Dell |
|
Nikkiso |
|
|
|
IBM |
|
Siemens |
|
|
|
Lenovo |
We sell our products through our direct sales force and through a network of distributors and contract manufacturers. Direct, distributor and contract manufacturer customers purchase our solutions on an individual purchase order basis, rather than pursuant to long-term agreements.
We consider our customer to be the end customer purchasing either directly from a distributor, a contract manufacturer or us. An end customer purchasing through a contract manufacturer typically instructs the contract manufacturer to obtain our products and to incorporate our products with other components for sale by the contract manufacturer to the end customer. Although we actually sell the products to, and are paid by, the distributors and contract manufacturers, we refer to the end customer as our customer.
During the year ended December 31, 2016, more than 600 end customers purchased our products. No end customers accounted for more than 10% of our revenue during 2016. Sales to NXP Semiconductors N.V. (NXP) and Avago Technologies Ltd. (Broadcom) whether directly by us or through distributors or contract manufacturers, each accounted for 13% of our revenue for the year ended December 31, 2015. No other end customers accounted for more than 10% of our revenue during 2015. Sales to NXP and Dell accounted for 12% and 10%, respectively, of our revenue for the year ended December 31, 2014. NXP is a customer for our embedded and sensor solutions. Broadcom and Dell are customers for our Gen 1 MRAM products.
9
Sales and Marketing
We sell our products through a direct sales channel and a network of representatives and distributors. The majority of our customers, and their associated contract manufacturers, buy our products through our distributors. We maintain sales, supply chain and logistics operations and have distributors in Asia to service the production needs of contract manufacturers such as us Flextronics, Foxconn, Inventec and Sanmina. We also maintain direct selling relationships with several strategic customers. Our direct sales representatives are located in North America, the United Kingdom, Germany, Hong Kong, and Taiwan.
Our typical sales cycle consists of a sales and development process in which our field engineers and sales personnel work closely with our customers’ design engineers. This process can take from three to 12 months to complete, and a successful sales cycle culminates in a design win. Once we establish a relationship with a customer, we continue a sales process to maintain our position and to secure subsequent new design wins at the customer. Each customer lead, whether new or existing, is tracked through our CRM tool and followed in stages of prospect, design in, design win and production. This tracking results in a design win pipeline that provides a measure of the future business potential of the opportunities.
Our technical support personnel have expertise in hardware and software, and have access to our development team to ensure proper service and support for our OEM customers. Our field application and engineering team provides technical training and design support to our customers.
Manufacturing
We rely on third-party suppliers for most phases of the manufacturing process, including initial fabrication and assembly.
Wafer Manufacturing
We manufacture our first generation and second generation MRAM discrete products, and provide foundry services for embedded MRAM, licensed MRAM products and MTJ-based sensors in our 200mm manufacturing facility. Our facility is in an ISO‑4 clean room and is qualified for the production of automotive grade products. We actively manage inventory, including automated process flows, process controls and recipe management, and we use standard equipment to manufacture our products.
For our second generation products, GLOBALFOUNDRIES will manufacture our 256Mb in-plane MTJ discrete memory on 40nm CMOS on 300mm wafers. Our third generation of ST-MRAM, based on perpendicular MTJ, is in development in our 200mm fabrication facility and at GLOBALFOUNDRIES. Volume production of our third generation of ST-MRAM products is planned to be at more advanced process nodes at GLOBALFOUNDRIES on 300mm wafers.
Assembly and Test
We have designed test protocols to maximize yields at assembly and final test, reduce manufacturing costs and improve quality. Our design and product engineering teams have developed and implemented wafer-level test programs to characterize the behavior of our MRAM devices. We create predictive models and test each of our parts to assure the reliability of the products in the field. We also add unique electronic part identification numbers to provide material traceability.
To protect the MRAM devices from stray magnetic fields, we developed packaging solutions, which we have qualified at independent, industry-leading sub-contractors, including Amkor, ASE and UTAC. We have successfully qualified our MRAM devices in various packages at temperatures ranging from commercial to automotive grade. As part of our commitment to quality, our quality management system has been certified to ISO 9001:2000 standards. Our foundry vendors and sub-contractors are also ISO 9001 certified.
10
ST-MRAM Joint Development Agreement
On October 17, 2014, we entered into a joint development agreement with GLOBALFOUNDRIES Inc., a semiconductor foundry, for the joint development of our ST-MRAM technology. The term of the agreement is the later of four years from the effective date or until the completion, termination, or expiration of the last statement of work entered into pursuant to the joint development agreement.
The joint development agreement also states that the specific terms and conditions for the production and supply of the developed MRAM technology would be pursuant to a separate manufacturing agreement entered into between the parties. See “—ST-MRAM Manufacturing Agreement” below.
Under the joint development agreement, each party granted licenses to its relevant intellectual property to the other party. For certain jointly developed works, the parties have agreed to follow an invention allocation procedure to determine ownership. In addition, GLOBALFOUNDRIES possesses the exclusive right to manufacture our discrete and embedded spin torque MRAM devices developed pursuant to the agreement until the earlier of three years after the qualification of the MRAM device for a particular technology node or four years after the completion of the relevant statement of work under which the device was developed. For the same exclusivity period associated with the relevant device, GLOBALFOUNDRIES agreed not to license intellectual property developed in connection with the agreement to named competitors of ours.
Generally, unless otherwise specified in the agreement or a statement of work, we and GLOBALFOUNDRIES share defined project costs equally under the joint development agreement. If GLOBALFOUNDRIES manufactures, sells or transfers wafers containing production qualified MRAM devices that utilized certain Everspin design information to its customers, GLOBALFOUNDRIES will pay royalties to us for each such wafer transferred or sold to a customer.
Except for breaches of confidentiality provisions and each party’s indemnification obligations to one another under the agreement, liability under the agreement is capped at a range depending on project costs and royalty amounts. Either party may terminate the agreement if the other party materially breaches a term of the agreement, and fails to remedy the breach after receiving notice from the non-breaching party. If a party terminates the manufacturing agreement for material breach in accordance with its terms, that party may also terminate the joint development agreement.
On May 27, 2016, we entered into an amendment to the joint development agreement to modify the payment schedule and to clarify our payment obligations for certain past project costs. Under the amendment, GLOBALFOUNDRIES may terminate the joint development agreement with us if we materially breach a term of the agreement, such as, but not limited to, by our failing to pay any undisputed sum which has been outstanding for 45 or more days from the date of invoice, and fail to remedy the breach within 60 days after receiving notice from GLOBALFOUNDRIES. See “Risk Factors” for further discussion of our agreements with GLOBALFOUNDRIES.
ST-MRAM Manufacturing Agreement
On October 23, 2014, we entered into a manufacturing agreement with GLOBALFOUNDRIES Singapore Pte. Ltd. that sets forth the specific terms and conditions for the production and supply of wafers manufactured using our spin torque MRAM technology developed under the joint development agreement with GLOBALFOUNDRIES. Pursuant to that joint development agreement, GLOBALFOUNDRIES possesses certain exclusive rights to manufacture such wafers for our discrete and embedded spin torque MRAM devices. Our manufacturing agreement with GLOBALFOUNDRIES includes a customary forecast and ordering mechanism for the supply of certain of our wafers, and we are obligated to order and pay for, and GLOBALFOUNDRIES is obligated to supply, wafers consistent with the binding portion of our forecast. GLOBALFOUNDRIES also has the ability to discontinue its manufacture of any of our wafers upon due notice and completion of the notice period. The initial term of the manufacturing agreement is for three years, which automatically renews for successive one year periods thereafter unless either party provides sufficient advance notice of non-renewal.
Except for breaches of confidentiality provisions and each party’s indemnification obligations to one another under the agreement, liability under the agreement is capped at the lesser of a set amount or the total purchase price received by GLOBALFOUNDRIES from us in the twelve months immediately preceding the claim for the specific product that caused the damages. Either party may terminate the agreement if the other party materially breaches a term of the
11
agreement, and fails to remedy the breach after receiving notice from the non-breaching party. GLOBALFOUNDRIES may terminate the agreement if we fail to pay any undisputed sum which has been outstanding for sixty or more days from the date of invoice.
Backlog
As of December 31, 2016, our backlog was $7.4 million and includes all purchase orders scheduled for delivery within the subsequent 12 months. Our business and, to a large extent, that of the entire semiconductor industry, is characterized by short-term orders and shipment schedules. Orders constituting our current backlog are subject to changes in delivery schedules, or to cancellation at the customer's option without significant penalty. Thus, while backlog is useful for scheduling production, backlog as of any particular date may not be a reliable measure of sales for any future period.
Competition
Our products, all of which offer the persistence of non-volatile memory with the speed and endurance of random access memory, enable the protection of mission critical data particularly in the event of power interruption or failure. Our solutions are designed for use in applications in the industrial, automotive and transportation, and enterprise storage markets where the combination of high write-cycle endurance and fast write-speeds are of critical importance.
Our principal competitors to our first generation Field Switched MRAM products, which are tailored primarily for the industrial, automotive and transportation, and enterprise storage markets, include companies that offer nonvolatile SRAM (NVSRAM), SRAM, and ferroelectric RAM (FRAM) products, such as Cypress, Fujitsu, Integrated Silicon Solution (ISSI), Macronix, Microchip, Micron, Renesas, Samsung and Toshiba. Our second and third generation STMRAM products are designed primarily for the enterprise storage market, which includes high performance SSDs, RAID systems and servers. Our second and third generation ST-MRAM products are intended to replace DRAM-based solutions, which comprised DRAM and additional back-up power supply components, such as super capacitors and batteries that are required to make DRAM persistent. Customers typically purchase DRAM and super capacitors and batteries from separate vendors, and pair them together in order to create a DRAM-based solution capable of protecting data against power interruption or loss. Companies that offer DRAM devices include Hynix, Micron, Samsung, and several other smaller companies. In the future we may also face competition from companies developing MRAM technologies, such as Avalanche, Spin Transfer Technologies, Samsung and other larger and smaller semiconductor companies.
Our sensor products compete with giant magnetoresistive (GMR), anisotropic magnetoresistive (AMR) and Hall effect sensors supplied by Alps, Asahi Kasei Microdevices, Crocus, Fairchild, Invensys (now Schneider), Kionix and Micronix.
Our ability to compete successfully in the market for our products is based on a number of factors, including:
|
· |
our product attributes and specifications; |
|
· |
successful customer engagements from throughout the product life cycle; |
|
· |
high quality and reliability as measured by our customers; |
|
· |
the ease of implementation of our products by customers; |
|
· |
preferred supplier status at numerous customers and ODMs |
|
· |
manufacturing expertise and strength; |
|
· |
reputation and strength of customer relationships; |
|
· |
competitive pricing in the market against the competition while maintaining our gross margin profile; |
and
|
· |
our success in meeting the needs of future customer requirements through continued development of new products. |
12
We believe we compete favorably with respect to each of these factors.
Intellectual Property
Our success depends, in part, on our ability to protect our products and technologies from unauthorized third-party copying and use. To accomplish this, we rely on a combination of intellectual property rights, including patents, trade secrets, copyrights and trademarks, as well as customary contractual protections. As of December 31, 2016, we held 341 issued patents that expire at various times between December 31, 2016 and September 2034, and had 157 patent applications pending. Included in our issued patents and pending applications are patents/applications in the United States, China, Europe, France, Germany, Japan, the Republic of Korea, Italy, Singapore, Taiwan, and the United Kingdom.
We seek to file for patents that have broad application in the semiconductor industry and that would be helpful in the magnetoresistive memory and sensor markets. However, there can be no assurance that our pending patent applications or any future applications will be approved, that any issued patents will provide us with competitive advantages or will not be challenged by third parties, or that the patents or applications of others will not have an adverse effect on our ability to do business. In addition, there can be no assurance that others will not independently develop substantially equivalent intellectual property or otherwise gain access to our trade secrets or intellectual property, or disclose such intellectual property or trade secrets, or that we can effectively protect our intellectual property.
We generally control access to and use of our confidential information through employing internal and external controls, including contractual protections with employees, contractors and customers. We rely in part on U.S. and international copyright laws to protect our mask work. All employees and consultants are required to execute confidentiality agreements in connection with their employment and consulting relationships with us. We also require them to agree to disclose and assign to us all inventions conceived or made in connection with the employment or consulting relationship.
Environmental Regulation
We must comply with many different federal, state, local and foreign governmental regulations related to the use, storage, discharge and disposal of certain chemicals and gases used in our manufacturing processes. Our facilities have been designed to comply with these regulations and we believe that our activities are conducted in material compliance with such regulations. Any changes in such regulations or in their enforcement could require us to acquire costly equipment or to incur other significant expenses to comply with environmental regulations. Any failure by us to adequately control the storage, use, discharge and disposal of regulated substances could result in significant future liabilities.
Increasing public attention has been focused on the environmental impact of electronic manufacturing operations. While we have not experienced any materially adverse effects on our operations from recently adopted environmental regulations, our business and results of operations could suffer if for any reason we fail to control the storage or use of, or to adequately restrict the discharge or disposal of, hazardous substances under present or future environmental regulations.
Employees
At December 31, 2016, we had 90 employees in the United States and 19 full time equivalent contractors and consultants in Singapore, China, Taiwan, the United Kingdom, the United States and Germany. None of our employees are either represented by a labor union or subject to a collective bargaining agreement. We have not experienced any work stoppages, and we consider our relations with our employees to be good.
Financial Information
Revenue from customers is designated based on the geographic region or country to which the product is delivered or licensee is located are set forth in Note 10 to our financial statements, which information is incorporated by reference
13
here. All of our assets are located in the United States. Our research and development expenses were $19.2 million, $21.1 million and $12.7 million for the years ended December 31, 2016, 2015 and 2014, respectively.
Corporate Information
We were incorporated in Delaware in May 2008. In June 2008, Freescale Semiconductor, Inc. (now a wholly-owned subsidiary of NXP Semiconductors N.V.), spun-out its MRAM business as Everspin. Our offices are located at 1347 N. Alma School Road, Suite 220, Chandler, Arizona 85224. Our telephone number is (480) 347-1111. Our corporate website is at www.Everspin.com. Our annual report on Form 10-K, quarterly reports on Form 10-Q, current reports on Form 8-K, and amendments to those reports filed or furnished pursuant to Section 13(a) or 15(d) of the Exchange Act are available free of charge on our website. The information contained on or that can be accessed through our website is not incorporated by reference into this report, and you should not consider information on our website to be part of this report.
The following are important factors that could cause actual results or events to differ materially from those contained in any forward-looking statements made by us or on our behalf. The risks and uncertainties described below are not the only ones we face. Additional risks and uncertainties not presently known to us or that we deem immaterial also may impair our business operations. If any of the following risks or such other risks actually occurs, our business could be harmed.
Risk Factors Related to Our Business and Our Industry
We have a history of losses which may continue in the future, and we cannot be certain that we will achieve or sustain profitability.
We have incurred net losses since our inception. We incurred net losses of $16.7 million, $18.2 million and $10.2 million for the years ended December 31, 2016, 2015 and 2014, respectively. As of December 31, 2016, we had an accumulated deficit of $96.4 million. We expect to incur significant expenses related to the continued development and expansion of our business, including in connection with our efforts to develop and improve upon our products and technology, maintain and enhance our research and development and sales and marketing activities and hire additional personnel. Our ability to generate sufficient revenue and to transition to profitability and generate consistent positive cash flows is uncertain. In addition, as a public company, we will incur significant additional legal, accounting and other expenses that we did not incur as a private company. We do not know whether our revenue will grow rapidly enough to absorb these costs, and our limited operating history makes it difficult to assess the extent of these expenses, or their impact on our results of operations.
Further, our revenue may not increase or may decline for a number of possible reasons, many of which are outside our control, including a decline in demand for our products, increased competition, business conditions that adversely affect the semiconductor memory industry, including reduced demand for products in the end markets that we serve, or our failure to capitalize on growth opportunities. If we fail to generate sufficient revenue to support our operations, we may not be able to achieve or sustain profitability.
Our limited operating history makes it difficult to evaluate our current business and future prospects.
We have been in existence as a stand-alone company since 2008, when Freescale Semiconductor, Inc. spun-out its MRAM business as Everspin. We have been shipping magnetoresistive random access memory (MRAM) products since our incorporation in 2008, and we have experienced a high rate of growth for our products. However, we may not be able to sustain the growth rate for sales of these products and our revenue could decline. We have also been developing our next-generation of Spin-Torque MRAM (ST-MRAM) products. Adoption of these products is important to the future growth of our business, but revenue associated with these products has not been material to date.
Our limited operating history and limited experience selling products, combined with the rapidly evolving and competitive nature of our market, makes it difficult to evaluate our current business and future prospects. In addition, we have limited insight into emerging trends that may adversely affect our business, financial condition, results of
14
operations and prospects. We have encountered and will continue to encounter risks and difficulties frequently experienced by growing companies in rapidly changing industries, including unpredictable and volatile revenue and increased expenses as we continue to grow our business. The viability and demand for our products may be affected by many factors outside of our control, such as the factors affecting the growth of the industrial, automotive and transportation, and enterprise storage industries and changes in macroeconomic conditions. If we do not manage these risks and overcome these difficulties successfully, our business will suffer.
We may be unable to match production with customer demand for a variety of reasons including our inability to accurately forecast customer demand or the capacity constraints of our suppliers, which could adversely affect our operating results.
We make planning and spending decisions, including determining production levels, production schedules, component procurement commitments, personnel needs and other resource requirements, based on our estimates of product demand and customer requirements. Our products are typically purchased pursuant to individual purchase orders. While our customers may provide us with their demand forecasts, they are not contractually committed to buy any quantity of products beyond purchase orders. Furthermore, many of our customers may increase, decrease, cancel or delay purchase orders already in place without significant penalty. The short-term nature of commitments by our customers and the possibility of unexpected changes in demand for their products reduce our ability to accurately estimate future customer requirements. On occasion, customers may require rapid increases in production, which can strain our resources, necessitate more onerous procurement commitments and reduce our gross margin. If we overestimate customer demand, we may purchase products that we may not be able to sell, which could result in decreases in our prices or write-downs of unsold inventory. Conversely, if we underestimate customer demand or if sufficient manufacturing capacity is unavailable, we could lose sales opportunities and could lose market share or damage our customer relationships. We manufacture MRAM products at our 200mm facility we lease in Chandler, Arizona and use a single foundry, GLOBALFOUNDRIES Singapore Pte. Ltd., for production of higher density products on advanced technology nodes, which may not have sufficient capacity to meet customer demand. The rapid pace of innovation in our industry could also render significant portions of our inventory obsolete. Excess or obsolete inventory levels could result in unexpected expenses or write-downs of inventory values that could adversely affect our business, operating results and financial condition.
We may require additional capital to fund our business, which may not be available to us on favorable terms or at all.
We believe that our existing cash and cash equivalents as of December 31, 2016, together with the additional borrowings available under our credit facility, will be sufficient to meet our anticipated cash requirements through March 31, 2018. Our ability to access the revolving loan under our credit facility depends upon levels of our accounts receivable and, therefore, the full amount may not be available to us at any specific time. Our future capital requirements will depend on many factors, including our growth rate, the timing and extent of our spending to support research and development activities, the timing and cost of establishing additional sales and marketing capabilities, and the introduction of new products. We may be required to seek additional equity or debt financing, and we cannot assure you that any such additional financing will be available to us on acceptable terms or at all. If we are unable to raise additional capital or generate sufficient cash from operations to adequately fund our operations, we will need to curtail planned activities to reduce costs. Doing so will likely harm our ability to execute on our business plan.
If we raise additional funds through issuances of equity, convertible debt securities or other securities convertible into equity, our existing stockholders could suffer significant dilution in their percentage ownership of our company, and any new equity securities we issue could have rights, preferences and privileges senior to those of holders of our common stock. If we are unable to obtain adequate financing or financing on terms satisfactory to us, when we require it, our ability to continue to grow or support our business and to respond to business challenges could be significantly limited.
The audit report from our independent registered public accounting firm for the year ended December 31, 2015, states that our recurring losses raise substantial doubt about our ability to continue as a going concern. This report does not take into account the net proceeds received in our initial public offering and the concurrent private placement or our ability to draw down amounts under our line of credit. If we are unable to grow our revenue substantially to achieve and sustain profitability, we may not be able to continue as a going concern.
15
As we expand into new potential markets, we expect to face intense competition, including from our customers and potential customers, and may not be able to compete effectively, which could harm our business.
We expect that our new and future generation MRAM products will be applicable to markets in which we are not currently operating. Selling into these markets, including higher density memory markets and the module business could put us into direct competition with our current or potential customers or other competitors with substantially more resources and experience than us. The markets in which we operate and may operate in the future are extremely competitive and are characterized by rapid technological change, continuous evolving customer requirements and declining average selling prices. We may not be able to compete successfully against current or potential competitors, which include our current or potential customers as they seek to internally develop solutions competitive with ours or as we develop products potentially competitive with their existing products. If we do not compete successfully, our market share and revenue may decline. We compete with large semiconductor manufacturers and designers and others, and our current and potential competitors have longer operating histories, significantly greater resources and name recognition and a larger base of customers than we do. This may allow them to respond more quickly than we can to new or emerging technologies or changes in customer requirements. In addition, these competitors may have greater credibility with our existing and potential customers. Some of our current and potential customers with their own internally developed solutions may choose not to purchase products from third-party suppliers like us.
We rely on third parties to manufacture, package, assemble and test our products, which exposes us to a number of risks, including reduced control over manufacturing and delivery timing and potential exposure to price fluctuations, which could result in a loss of revenue or reduced profitability.
Although we operate an integrated magnetic fabrication line located in Chandler, Arizona, we purchase wafers from third parties and outsource the manufacturing, packaging, assembly and testing of our products to third-party foundries and assembly and testing service providers. We use a single foundry, GLOBALFOUNDRIES Singapore Pte. Ltd., for production of higher density products on advanced technology nodes. Our primary product package and test operations are located in China, Taiwan and other Asian countries. We also use standard CMOS wafers from third-party foundries, which we process at our Chandler, Arizona, facility.
Relying on third-party manufacturing, assembly, packaging and testing presents a number of risks, including but not limited to:
|
· |
capacity and materials shortages during periods of high demand; |
|
· |
reduced control over delivery schedules, inventories and quality; |
|
· |
the unavailability of, or potential delays in obtaining access to, key process technologies; |
|
· |
the inability to achieve required production or test capacity and acceptable yields on a timely basis; |
|
· |
misappropriation of our intellectual property; |
|
· |
the third party’s ability to perform its obligations due to bankruptcy or other financial constraints; |
|
· |
limited warranties on wafers or products supplied to us; and |
|
· |
potential increases in prices. |
We currently do not have long-term supply contracts with our third-party contract manufacturers for our MRAM products, including NXP, United Microelectronics Corporation, Taiwan Semiconductor Manufacturing Company, Limited (TSMC), United Test and Assembly Center (UTAC), Advanced Semiconductor Engineering (ASE), and Amkor, and we typically negotiate pricing on a per-purchase order basis and in some cases on an annual basis. Therefore, they are not obligated to perform services or supply components to us for any specific period, in any specific quantities, or at any specific price, except as may be provided in a particular purchase order. During periods of high demand and tight inventories, our third-party foundries and packaging, assembly and testing contractors may allocate capacity to the production of other companies’ products while reducing deliveries to us, or significantly raise their prices. In particular, they may allocate capacity to other customers that are larger and better financed than us or that have long-term agreements, decreasing the capacity available to us. Shortages of capacity available to us may be caused by the actions of their other, large customers that may be difficult to predict, such as major product launches.
16
Our manufacturing agreement with GLOBALFOUNDRIES includes a customary forecast and ordering mechanism for the supply of certain of our wafers, and we are obligated to order and pay for, and GLOBALFOUNDRIES is obligated to supply, wafers consistent with the binding portion of our forecast. However, our manufacturing arrangement is also subject to both a minimum and maximum order quantity that while we believe currently addresses our projected foundry capacity needs, may not address our maximum foundry capacity requirements in the future. We may also be obligated to pay for unused capacity if our demand decreases in the future, or if our estimates prove inaccurate. GLOBALFOUNDRIES also has the ability to discontinue its manufacture of any of our wafers upon due notice and completion of the notice period. This could cause us to have to find another foundry to manufacture those wafers or redesign our core technology and would mean that we may not have products to sell until such time. Any time spent engaging a new manufacturer or redesigning our core technology could be costly and time consuming and may allow potential competitors to take opportunities in the market place. Moreover, if we are unable to find another foundry to manufacture our products or if we have to redesign our core technology, this could cause material harm to our business and operating results.
If we need other foundries or packaging, assembly and testing contractors, or if we are unable to obtain timely and adequate deliveries from our providers, we might not be able to cost-effectively and quickly retain other vendors to satisfy our requirements. Because the lead-time needed to establish a relationship with a new third-party supplier could be several quarters, there is no readily available alternative source of supply for any specific component. In addition, the time and expense to qualify a new foundry could result in additional expense, diversion of resources or lost sales, any of which would negatively impact our financial results.
If any of our current or future foundries or packaging, assembly and testing subcontractors significantly increases the costs of wafers or other materials or services, interrupts or reduces our supply, including for reasons outside of their control, or if any of our relationships with our suppliers is terminated, our operating results could be adversely affected. Such occurrences could also damage our customer relationships, result in lost revenue, cause a loss in market share or damage our reputation.
Our joint development agreement and strategic relationships involve numerous risks.
We have entered into strategic relationships to manufacture products and develop new manufacturing process technologies and products. These relationships include our joint development agreement with GLOBALFOUNDRIES to develop advanced MTJ technology and ST-MRAM. These relationships are subject to various risks that could adversely affect the value of our investments and our results of operations. These risks include the following:
|
· |
our interests could diverge from those of our foundries, or we may not be able to agree with them on ongoing development, manufacturing and operational activities, or on the amount, timing, or nature of further investments in our joint development; |
|
· |
we may experience difficulties in transferring technology to a foundry; |
|
· |
we may experience difficulties and delays in getting to and/or ramping production at foundries; |
|
· |
our control over the operations of foundries is limited; |
|
· |
due to financial constraints, our joint development collaborators may be unable to meet their commitments to us and may pose credit risks for our transactions with them; |
|
· |
due to differing business models or long-term business goals, our collaborators may decide not to join us in funding capital investment, which may result in higher levels of cash expenditures by us; |
|
· |
our cash flows may be inadequate to fund increased capital requirements; |
|
· |
we may experience difficulties or delays in collecting amounts due to us from our collaborators; |
|
· |
the terms of our arrangements may turn out to be unfavorable; |
|
· |
we are migrating toward a fabless model as 300mm production becomes required and this increases risks related to less control over our critical production processes; and |
|
· |
changes in tax, legal, or regulatory requirements may necessitate changes in our agreements. |
17
Further, GLOBALFOUNDRIES may terminate the joint development agreement with us if we materially breach a term of the agreement, such as, but not limited to, by our failing to pay any undisputed sum which has been outstanding for 45 or more days from the date of invoice, and fail to remedy the breach within 60 days after receiving notice from GLOBALFOUNDRIES. If GLOBALFOUNDRIES terminates the joint development agreement, our ability to continue to develop our MRAM technology will be significantly impaired.
If our strategic relationships are unsuccessful, our business, results of operations, or financial condition may be materially adversely affected.
The market for semiconductor memory products is characterized by declines in average selling prices, which we expect to continue, and which could negatively affect our revenue and margins.
Our customers expect the average selling price of our products to decrease year-over-year and we expect this trend to continue. When such pricing declines occur, we may not be able to mitigate the effects by selling more or higher margin units, or by reducing our manufacturing costs. In such circumstances, our operating results could be materially and adversely affected. Our stand-alone and embedded MRAM products have experienced declining average selling prices over their life cycle. The rate of decline may be affected by a number of factors, including relative supply and demand, the level of competition, production costs and technological changes. As a result of the decreasing average selling prices of our products following their launch, our ability to increase or maintain our margins depends on our ability to introduce new or enhanced products with higher average selling prices and to reduce our per-unit cost of sales and our operating costs. We may not be able to reduce our costs as rapidly as companies that operate their own manufacturing, assembly and testing facilities, and our costs may even increase because we rely in part on third parties to manufacture, assemble and test our products, which could also reduce our gross margins. In addition, our new or enhanced products may not be as successful or enjoy as high margins as we expect. If we are unable to offset any reductions in average selling prices by introducing new products with higher average selling prices or reducing our costs, our revenue and margins will be negatively affected and may decrease.
The semiconductor memory market is highly cyclical and has experienced severe downturns in the past, generally as a result of wide fluctuations in supply and demand, constant and rapid technological change, continuous new product introductions and price erosion. During downturns, periods of intense competition, or the presence of oversupply in the industry, the selling prices for our products may decline at a high rate over relatively short time periods as compared to historical rates of decline. We are unable to predict selling prices for any future periods and may experience unanticipated, sharp declines in selling prices for our products.
Unfavorable economic and market conditions, domestically and internationally, may adversely affect our business, financial condition, results of operations and cash flows.
We have significant customer sales both in the U.S. and internationally. We also rely on domestic and international suppliers, manufacturing partners and distributors. We are therefore susceptible to adverse U.S. and international economic and market conditions. If any of our manufacturing partners, customers, distributors or suppliers experience serious financial difficulties or cease operations, our business will be adversely affected. In addition, the adverse impact of an unfavorable economy may adversely impact customer spending, which may adversely impact demand for our products.
We must continuously develop new and enhanced products, and if we are unable to successfully market our new and enhanced products for which we incur significant expenses to develop, our results of operations and financial condition will be materially adversely affected.
To compete effectively in our markets, we must continually design, develop and introduce new and improved products with improved features in a cost-effective manner in response to changing technologies and market demand. This requires us to devote substantial financial and other resources to research and development. We are developing next-generation products, which we expect to be one of the drivers of our revenue growth in the future. However, we may not succeed in developing and marketing these new and enhanced products. We also face the risk that customers may not value or be willing to bear the cost of incorporating our new and enhanced products into their products, particularly if they believe their customers are satisfied with current solutions. Regardless of the improved features or superior performance of our new and enhanced products, customers may be unwilling to adopt our solutions due to design or pricing constraints, or because they do not want to rely on a single or limited supply source. Because of the
18
extensive time and resources that we invest in developing new and enhanced products, if we are unable to sell customers new generations of our products, our revenue could decline and our business, financial condition, results of operations and cash flows would be negatively affected. For example, we generated limited revenue from sales of our ST-MRAM products to date. While we expect revenue from our ST-MRAM products to increase, if we are unable to scale MRAM to gigabit densities to address applications currently served by DRAM, we may not be able to materially increase our revenue. If we are unable to successfully develop and market our new and enhanced products that we have incurred significant expenses developing, our results of operations and financial condition will be materially and adversely affected.
Our success and future revenue depend on our ability to secure design wins and on our customers’ ability to successfully sell the products that incorporate our solutions. Securing design wins is a lengthy, expensive and competitive process, and may not result in actual orders and sales, which could cause our revenue to decline.
We sell to customers that incorporate MRAM into their products. A design win occurs after a customer has tested our product, verified that it meets the customer’s requirements and qualified our solutions for their products. We believe we are dependent on the adoption of our 256Mb and 1Gb MRAM products by our customers to secure design wins. Our customers may need several months to years to test, evaluate and adopt our product and additional time to begin volume production of the product that incorporates our solution. Due to this generally lengthy design cycle, we may experience significant delays from the time we increase our operating expenses and make investments in our products to the time that we generate revenue from sales of these products. Moreover, even if a customer selects our solution, we cannot guarantee that this will result in any sales of our products, as the customer may ultimately change or cancel its product plans, or efforts by our customer to market and sell its product may not be successful. We may not generate any revenue from design wins after incurring the associated costs, which would cause our business and operating results to suffer. Any delay in the development of our 256Mb and 1Gb MRAM products, or failure of our customers to adopt our 256Mb and 1Gb MRAM products, could inhibit revenue growth or cause declines, which would significantly harm our business and prevent us from becoming profitable.
If a current or prospective customer designs a competitor’s solution into its product, it becomes significantly more difficult for us to sell our solutions to that customer because changing suppliers involves significant time, cost, effort and risk for the customer even if our solutions are superior to other solutions and remain compatible with their product design. Our ability to compete successfully depends on customers viewing us as a stable and reliable supplier to mission critical customer applications when we have less production capacity and less financial resources compared to most of our larger competitors. If current or prospective customers do not include our solutions in their products and we fail to achieve a sufficient number of design wins, our results of operations and business may be harmed.
We rely on our relationships with OEMs and ODMs to enhance our solutions and market position, and our failure to continue to develop or maintain such relationships in the future would harm our ability to remain competitive.
We develop our products for leading OEMs and ODMs that serve a variety of end markets and are developing devices for automotive, transportation, industrial and storage applications. For each application, manufacturers create products that incorporate specialized semiconductor technology, which makers of memory products use as the basis for their products. These manufacturers set the specifications for many of the key components to be used on each generation of their products and, in the case of memory components, generally qualify only a few vendors to provide memory components for their products. As each new generation of their products is released, vendors are validated in a similar fashion. We must work closely with OEMs and ODMs to ensure our products become qualified for use in their products. As a result, maintaining close relationships with leading OEMs and ODMs that are developing devices for automotive, transportation, industrial and storage applications is crucial to the long-term success of our business. We could lose these relationships for a variety of reasons, including our failure to qualify as a vendor, our failure to demonstrate the value of our new solutions, declines in product quality, or if OEMs or ODMs seek to work with vendors with broader product suites, greater production capacity or greater financial resources. If our relationships with key industry participants were to deteriorate or if our solutions were not qualified by our customers, our market position and revenue could be materially and adversely affected.
19
The loss of one or several of our customers or reduced orders or pricing from existing customers may have a significant adverse effect on our operations and financial results.
We have derived and expect to continue to derive a significant portion of our revenues from a small group of customers during any particular period due in part to the concentration of market share in the semiconductor industry. Our four largest end customers together accounted for 32% of our total revenue for the year ended December 31, 2016, but none of these customers individually accounted for more than 10% of our total revenue during the period. Our four largest end customers together accounted for 41% of our total revenue for the year ended December 31, 2015, and two customers each accounted for more than 10% of our total revenue during the period. Our four largest end customers together accounted for 37% of our total revenue for the year ended December 31, 2014, and two customers each accounted for more than 10% of our total revenue during the period. The loss of a significant customer, a business combination among our customers, a reduction in orders or decrease in price from a significant customer or disruption in any of our commercial or distributor arrangements may result in a significant decline in our revenues and could have a material adverse effect on our business, liquidity, results of operations, financial condition and cash flows.
Our results of operations can fluctuate from period to period, which could cause our share price to fluctuate.
Our results of operations have fluctuated in the past and may fluctuate from period to period in the future due to a variety of factors, many of which are beyond our control. Factors relating to our business that may contribute to these fluctuations include the following factors, as well as other factors described elsewhere in this report:
|
· |
the receipt, reduction, delay or cancellation of orders by large customers; |
|
· |
the gain or loss of significant customers or distributors; |
|
· |
the timing and success of our launch of new or enhanced products and those of our competitors; |
|
· |
market acceptance of our products and our customers’ products; |
|
· |
the level of growth or decline in the industrial, automotive and transportation, enterprise storage and other markets; |
|
· |
the timing and extent of research and development and sales and marketing expenditures; |
|
· |
the amount and timing of operating expenses related to the maintenance and expansion of our business, operations and infrastructure; |
|
· |
changes in our product mix; |
|
· |
our ability to reduce the manufacturing costs of our products; |
|
· |
competitive pressures resulting in lower than expected average selling prices; |
|
· |
fluctuations in sales by and inventory levels of OEMs and ODMs that incorporate our memory products in their products; |
|
· |
cyclical and seasonal fluctuations in our markets; |
|
· |
fluctuations in the manufacturing yields of our third-party manufacturers; |
|
· |
quality issues that arise from manufacturing issues at our third-party manufacturers; |
|
· |
events that impact the availability of production capacity at our third-party subcontractors and other interruptions in the supply chain including due to geopolitical events, natural disasters, materials shortages, bankruptcy or other causes; |
|
· |
supply constraints for and changes in the cost of the other components incorporated into our customers’ products; |
|
· |
the timing of expenses related to the acquisition of technologies or businesses; |
|
· |
product rates of return or price concessions in excess of those expected or forecasted; |
|
· |
costs associated with the repair and replacement of defective products; |
|
· |
unexpected inventory write-downs or write-offs; |
20
|
· |
costs associated with litigation over intellectual property rights and other litigation; |
|
· |
the length and unpredictability of the purchasing and budgeting cycles of our customers; |
|
· |
loss of key personnel or the inability to attract qualified engineers; and |
|
· |
geopolitical events, such as war, threat of war or terrorist actions, or the occurrence of natural disasters. |
The semiconductor memory industry is highly cyclical and our markets may experience significant cyclical fluctuations in demand as a result of changing economic conditions, budgeting and buying patterns of customers and others factors. As a result of these and other factors affecting demand for our products and our results of operations in any given period, the results of any prior quarterly or annual periods should not be relied upon as indicative of our future revenue or operating performance. Fluctuations in our revenue and operating results could also cause our stock price to decline.
If sales of our customers’ products decline or if their products do not achieve market acceptance, our business and operating results could be adversely affected.
Our revenue depends on our customers’ ability to commercialize their products successfully. The markets for our customers’ products are extremely competitive and are characterized by rapid technological change. Competition in our customers’ markets is based on a variety of factors including price, performance, product quality, marketing and distribution capability, customer support, name recognition and financial strength. As a result of rapid technological change, the markets for our customers’ products are characterized by frequent product introductions, short product life cycles, fluctuating demand and increasing product capabilities. As a result, our customers’ products may not achieve market success or may become obsolete. We cannot assure you that our customers will dedicate the resources necessary to promote and commercialize their products, successfully execute their business strategies for such products, or be able to manufacture such products in quantities sufficient to meet demand or cost-effectively manufacture products at a high volume. Our customers do not have contracts with us that require them to manufacture, distribute or sell any products. Moreover, our customers may develop internally, or in collaboration with our competitors, technology that they may utilize instead of the technology available to them through us. Our customers’ failure to achieve market success for their products, including as a result of general declines in our customers’ markets or industries, could negatively affect their willingness to utilize our products, which may result in a decrease in our revenue and negatively affect our business and operating results.
Our revenue also depends on the timely introduction, quality and market acceptance of our customers’ products that incorporate our solutions. Our customers’ products are often very complex and subject to design complexities that may result in design flaws, as well as potential defects, errors and bugs. We incur significant design and development costs in connection with designing our solutions for customers’ products. If our customers discover design flaws, defects, errors or bugs in their products, or if they experience changing market requirements, failed evaluations or field trials, or issues with other vendors, they may delay, change or cancel a project. If we have already incurred significant development costs, we may not be able to recoup those costs, which in turn would adversely affect our business and financial results.
We face competition and expect competition to increase in the future. If we fail to compete effectively, our revenue growth and results of operations will be materially and adversely affected.
The global semiconductor market in general, and the semiconductor memory market in particular, are highly competitive. We expect competition to increase and intensify as other semiconductor companies enter our markets, many of which have greater financial and other resources with which to pursue technology development, product design, manufacturing, marketing and sales and distribution of their products. Increased competition could result in price pressure, reduced profitability and loss of market share, any of which could materially and adversely affect our business, revenue and operating results. Currently, our competitors range from large, international companies offering a wide range of traditional memory technologies to companies specializing in other alternative, specialized emerging memory technologies. Our primary memory competitors include Cypress, Fujitsu, Integrated Silicon Solution, Macronix, Microchip, Micron, Renesas, Samsung, and Toshiba. The main competition for sensor products includes AMR, Crocus, GMR and Hall Effect. These technologies directly compete with our products and are supplied by Alps, Asahi Kasei Microdevices, Fairchild, Invensys (now Schneider), Kionix and Micronas. In addition, as the MRAM market opportunity grows, we expect new entrants such as Avalanche will enter this market and existing competitors, including leading
21
semiconductor companies, may make significant investments to compete more effectively against our products. These competitors could develop technologies or architectures that make our products or technologies obsolete.
Our ability to compete successfully depends on factors both within and outside of our control, including:
|
· |
the functionality and performance of our products and those of our competitors; |
|
· |
our relationships with our customers and other industry participants; |
|
· |
prices of our products and prices of our competitors’ products; |
|
· |
our ability to develop innovative products; |
|
· |
our competitors’ greater resources to make acquisitions; |
|
· |
our ability to obtain adequate capital to finance operations; |
|
· |
our ability to retain high-level talent, including our management team and engineers; and |
|
· |
the actions of our competitors, including merger and acquisition activity, launches of new products and other actions that could change the competitive landscape. |
Competition could result in pricing pressure, reduced revenue and loss of market share, any of which could materially and adversely affect our business, results of operations and prospects. In the event of a market downturn, competition in the markets in which we operate may intensify as our customers reduce their purchase orders. Our competitors that are significantly larger and have greater financial, technical, marketing, distribution, customer support and other resources or more established market recognition than us may be better positioned to accept lower prices and withstand adverse economic or market conditions.
Our customers require our products and our third-party contractors to undergo a lengthy and expensive qualification process. If we are unsuccessful or delayed in qualifying any of our products with a customer, our business and operating results would suffer.
Prior to selecting and purchasing our products, our customers typically require that our products undergo extensive qualification processes, which involve testing of our products in the customers’ systems, as well as testing for reliability. This qualification process may continue for several months or years. However, obtaining the requisite qualifications for a memory product does not assure any sales of the product. Even after successful qualification and sales of a product to a customer, a subsequent revision in our third-party contractors’ manufacturing process or our selection of a new contract manufacturer may require a new qualification process, which may result in delays and excess or obsolete inventory. After our products are qualified and selected, it can and often does take several months or more before the customer commences volume production of systems that incorporate our products. Despite these uncertainties, we devote substantial resources, including design, engineering, sales, marketing and management efforts, to qualify our products with customers in anticipation of sales. If we are unsuccessful or delayed in qualifying any of our products with a customer, sales of those products may be precluded or delayed, which may impede our growth and harm our business.
Our costs may increase substantially if we or our third-party manufacturing contractors do not achieve satisfactory product yields or quality.
The fabrication process is extremely complicated and small changes in design, specifications or materials can result in material decreases in product yields or even the suspension of production. From time to time, we and/or the third-party foundries that we contract to manufacture our products may experience manufacturing defects and reduced manufacturing yields. In some cases, we and/or our third-party foundries may not be able to detect these defects early in the fabrication process or determine the cause of such defects in a timely manner. There may be a higher risk of product yield issues in newer ST-MRAM products.
Generally, in pricing our products, we assume that manufacturing yields will continue to improve, even as the complexity of our products increases. Once our products are initially qualified either internally or with our third-party foundries, minimum acceptable yields are established. We are responsible for the costs of the units if the actual yield is above the minimum set with our third-party foundries. If actual yields are below the minimum we are not required to purchase the units. Typically, minimum acceptable yields for our new products are generally lower at first and gradually
22
improve as we achieve full production, but yield issues can occur even in mature processes due to break downs in mechanical systems, equipment failures or calibration errors. Unacceptably low product yields or other product manufacturing problems could substantially increase overall production time and costs and adversely impact our operating results. Product yield losses will increase our costs and reduce our gross margin. For example, cost of sales increased in the third and fourth quarters of 2015 due to product yield issues in our fabrication line. In addition to significantly harming our results of operations and cash flow, poor yields may delay shipment of our products and harm our relationships with existing and potential customers.
The complexity of our products may lead to defects, which could negatively impact our reputation with customers and result in liability.
Products as complex as ours may contain defects when first introduced to customers or as new versions are released. Delivery of products with production defects or reliability, quality or compatibility problems could significantly delay or hinder market acceptance of the products or result in a costly recall and could damage our reputation and adversely affect our ability to retain existing customers and attract new customers. Defects could cause problems with the functionality of our products, resulting in interruptions, delays or cessation of sales of these products to our customers. We may also be required to make significant expenditures of capital and resources to resolve such problems. We cannot assure you that problems will not be found in new products, both before and after commencement of commercial production, despite testing by us, our suppliers or our customers. Any such problems could result in:
|
· |
delays in development, manufacture and roll-out of new products; |
|
· |
additional development costs; |
|
· |
loss of, or delays in, market acceptance; |
|
· |
diversion of technical and other resources from our other development efforts; |
|
· |
claims for damages by our customers or others against us; and |
|
· |
loss of credibility with our current and prospective customers. |
Any such event could have a material adverse effect on our business, financial condition and results of operations.
We may experience difficulties in transitioning to new wafer fabrication process technologies or in achieving higher levels of design integration, which may result in reduced manufacturing yields, delays in product deliveries and increased expenses.
We aim to use the most advanced manufacturing process technology appropriate for our solutions that is available from our third-party foundries. As a result, we periodically evaluate the benefits of migrating our solutions to other technologies to improve performance and reduce costs. These ongoing efforts require us from time to time to modify the manufacturing processes for our products and to redesign some products, which in turn may result in delays in product deliveries. We may face difficulties, delays and increased expense as we transition our products to new processes, and potentially to new foundries. We will depend on our third-party foundries as we transition to new processes. We cannot assure you that our third-party foundries will be able to effectively manage such transitions or that we will be able to maintain our relationship with our third-party foundries or develop relationships with new third-party foundries. If we or any of our third-party foundries experience significant delays in transitioning to new processes or fail to efficiently implement transitions, we could experience reduced manufacturing yields, delays in product deliveries and increased expenses, any of which could harm our relationships with our customers and our operating results.
As smaller line width geometry manufacturing processes become more prevalent, we intend to move our future products to increasingly smaller geometries to reduce costs while integrating greater levels of functionality into our products. This transition will require us and our third-party foundries to migrate to new designs and manufacturing processes for smaller geometry products. We may not be able to achieve smaller geometries with higher levels of design integration or to deliver new integrated products on a timely basis. We periodically evaluate the benefits, on a product-by-product basis, of migrating to smaller geometry process technologies to reduce our costs and increase performance. We are dependent on our relationships with our third-party foundries to transition to smaller geometry processes successfully. We cannot assure you that our third-party foundries will be able to effectively manage any such transition. If we or our third-party foundries experience significant delays in any such transition or fail to implement a transition, our business, financial condition and results of operations could be materially harmed.
23
Changes to industry standards and technical requirements relevant to our products and markets could adversely affect our business, results of operations and prospects.
Our products are only a part of larger electronic systems. All products incorporated into these systems must comply with various industry standards and technical requirements created by regulatory bodies or industry participants to operate efficiently together. Industry standards and technical requirements in our markets are evolving and may change significantly over time. For our products, the industry standards are developed by the Joint Electron Device Engineering Council, an industry trade organization. In addition, large industry-leading semiconductor and electronics companies play a significant role in developing standards and technical requirements for the product ecosystems within which our products can be used. Our customers also may design certain specifications and other technical requirements specific to their products and solutions. These technical requirements may change as the customer introduces new or enhanced products and solutions.
Our ability to compete in the future will depend on our ability to identify and comply with evolving industry standards and technical requirements. The emergence of new industry standards and technical requirements could render our products incompatible with products developed by other suppliers or make it difficult for our products to meet the requirements of certain of our customers in automotive, transportation, industrial, storage and other markets. As a result, we could be required to invest significant time and effort and to incur significant expense to redesign our products to ensure compliance with relevant standards and requirements. If our products are not in compliance with prevailing industry standards and technical requirements for a significant period of time, we could miss opportunities to achieve crucial design wins, our revenue may decline and we may incur significant expenses to redesign our products to meet the relevant standards, which could adversely affect our business, results of operations and prospects.
Failure to protect our intellectual property could substantially harm our business.
Our success and ability to compete depend in part upon our ability to protect our intellectual property. We rely on a combination of intellectual property rights, including patents, mask work protection, copyrights, trademarks, trade secrets and know-how, in the United States and other jurisdictions. The steps we take to protect our intellectual property rights may not be adequate, particularly in foreign jurisdictions such as China. Any patents we hold may not adequately protect our intellectual property rights or our products against competitors, and third parties may challenge the scope, validity or enforceability of our issued patents, which third parties may have significantly more financial resources with which to litigate their claims than we have to defend against them. In addition, other parties may independently develop similar or competing technologies designed around any patents or patent applications that we hold. Some of our products and technologies are not covered by any patent or patent application, as we do not believe patent protection of these products and technologies is critical to our business strategy at this time. A failure to timely seek patent protection on products or technologies generally precludes us from seeking future patent protection on these products or technologies.
In addition to patents, we also rely on contractual protections with our customers, suppliers, distributors, employees and consultants, and we implement security measures designed to protect our trade secrets and know-how. However, we cannot assure you that these contractual protections and security measures will not be breached, that we will have adequate remedies for any such breach or that our customers, suppliers, distributors, employees or consultants will not assert rights to intellectual property or damages arising out of such contracts.
We may initiate claims against third parties to protect our intellectual property rights if we are unable to resolve matters satisfactorily through negotiation. Litigation brought to protect and enforce our intellectual property rights could be costly, time-consuming and distracting to management. It could also result in the impairment or loss of portions of our intellectual property, as an adverse decision could limit our ability to assert our intellectual property rights, limit the value of our technology or otherwise negatively impact our business, financial condition and results of operations. Additionally, any enforcement of our patents or other intellectual property may provoke third parties to assert counterclaims against us. Our failure to secure, protect and enforce our intellectual property rights could materially harm our business.
24
We may face claims of intellectual property infringement, which could be time-consuming, costly to defend or settle, result in the loss of significant rights, harm our relationships with our customers and distributors, or otherwise materially adversely affect our business, financial condition and results of operations.
The semiconductor memory industry is characterized by companies that hold patents and other intellectual property rights and that vigorously pursue, protect and enforce intellectual property rights. These companies include patent holding companies or other adverse patent owners who have no relevant product revenue and against whom our own patents may provide little or no deterrence. From time to time, third parties may assert against us and our customers’ patent and other intellectual property rights to technologies that are important to our business. We have in the past, and may in the future, face such claims.
Claims that our products, processes or technology infringe third-party intellectual property rights, regardless of their merit or resolution, could be costly to defend or settle and could divert the efforts and attention of our management and technical personnel. We may also be obligated to indemnify our customers or business partners in connection with any such litigation, which could result in increased costs. Infringement claims also could harm our relationships with our customers or distributors and might deter future customers from doing business with us. If any such proceedings result in an adverse outcome, we could be required to:
|
· |
cease the manufacture, use or sale of the infringing products, processes or technology; |
|
· |
pay substantial damages for infringement; |
|
· |
expend significant resources to develop non-infringing products, processes or technology, which may not be successful; |
|
· |
license technology from the third-party claiming infringement, which license may not be available on commercially reasonable terms, or at all; |
|
· |
cross-license our technology to a competitor to resolve an infringement claim, which could weaken our ability to compete with that competitor; or |
|
· |
pay substantial damages to our customers to discontinue their use of or to replace infringing technology sold to them with non-infringing technology, if available. |
Any of the foregoing results could have a material adverse effect on our business, financial condition and results of operations. Furthermore, our exposure to the foregoing risks may also be increased if we acquire other companies or technologies. For example, we may have a lower level of visibility into the development process with respect to intellectual property or the care taken to safeguard against infringement risks with respect to the acquired company or technology. In addition, third parties may make infringement and similar or related claims after we have acquired technology that had not been asserted prior to the acquisition.
We make significant investments in new technologies and products that may not achieve technological feasibility or profitability or that may limit our revenue growth.
We have made and will continue to make significant investments in research and development of new technologies and products, including new and more technically advanced versions of our MRAM technology.
Investments in new technologies are speculative and technological feasibility may not be achieved. Commercial success depends on many factors including demand for innovative technology, availability of materials and equipment, selling price the market is willing to bear, competition and effective licensing or product sales. We may not achieve significant revenue from new product investments for a number of years, if at all. Moreover, new technologies and products may not be profitable, and even if they are profitable, operating margins for new products and businesses may not be as high as the margins we have experienced historically or originally anticipated. Our inability to capitalize on or realize substantial revenue from our significant investments in research and development could harm our operating results and distract management, harming our business.
25
Our success depends on our ability to attract and retain key employees, and our failure to do so could harm our ability to grow our business and execute our business strategies.
Our success depends on our ability to attract and retain our key employees, including our management team and experienced engineers. Competition for personnel in the semiconductor memory technology field, and in the MRAM space in particular, is intense, and the availability of suitable and qualified candidates is limited. We compete to attract and retain qualified research and development personnel with other semiconductor companies, universities and research institutions. Given our experience as an early entrant in the MRAM space, our employees are frequently contacted by MRAM startups and MRAM groups within larger companies seeking to employ them. The members of our management and key employees are at-will employees and although we recently issued refresh equity awards to our personnel in connection with our initial public offering, and recently repriced options in mid-December 2016 to reflect our then current stock price, there can be no assurance that these awards will be effective to retain our key employees. If we lose the services of any key senior management member or employee, we may not be able to locate suitable or qualified replacements, and may incur additional expenses to recruit and train new personnel, which could severely impact our business and prospects. The loss of the services of one or more of our key employees, especially our key engineers, or our inability to attract and retain qualified engineers, could harm our business, financial condition and results of operations.
We may not be able to effectively manage our growth, and we may need to incur significant expenditures to address the additional operational and control requirements of our growth, either of which could harm our business and operating results.
As we continue to expand our business, we expect our headcount and overall size of our operations to grow significantly. To effectively manage our growth, we must continue to expand our operational, engineering and financial systems, procedures and controls and to improve our accounting and other internal management systems, such as our new ERP system that we have recently implemented. This may require substantial managerial and financial resources, and our efforts in this regard may not be successful. Our current systems, procedures and controls may not be adequate to support our future operations. If we fail to adequately manage our growth, or to improve our operational, financial and management information systems, or fail to effectively motivate or manage our new and future employees, the quality of our products and the management of our operations could suffer, which could adversely affect our operating results.
We may engage in acquisitions of, or investments in, other companies, each of which may divert our management’s attention, result in additional dilution to stockholders or use resources that are necessary to operate our business.
We may in the future seek to acquire or invest in businesses, products or technologies that we believe could complement or expand our business, enhance our technical capabilities or otherwise offer growth opportunities. However, our term loan and revolving credit facility prohibits our ability to merge with or acquire any other entity. Even if we were allowed to pursue such acquisitions or investments, they could create risks for us, including:
|
· |
difficulties in assimilating acquired personnel, operations and technologies or realizing synergies expected in connection with an acquisition, particularly with acquisitions of companies with large and widespread operations, complex products or that operate in markets in which we historically have had limited experience; |
|
· |
unanticipated costs or liabilities, including possible litigation, associated with the acquisition; |
|
· |
incurrence of acquisition-related costs; |
|
· |
diversion of management’s attention from other business concerns; |
|
· |
use of resources that are needed in other parts of our business; and |
|
· |
use of substantial portions of our available cash to consummate an acquisition. |
A significant portion of the purchase price of companies we acquire may be allocated to acquired goodwill, which must be assessed for impairment at least annually. If such acquisitions do not yield expected returns, we may be required to take charges to our earnings based on this impairment assessment process, which could harm our results of operations.
We may be unable to complete acquisitions at all or on commercially reasonable terms, which could limit our future growth. Acquisitions could also result in dilutive issuances of equity securities or the incurrence of additional debt, which could adversely affect our operating results and result in a decline in our stock price and further restrict our
26
ability to pursue business opportunities, including potential acquisitions. In addition, if an acquired business fails to meet our expectations, our operating results may suffer.
We maintain operations outside of the United States and intend to expand our international operations, which exposes us to significant risks.
We have limited operations in Europe and Asia. We intend to expand our operations internationally. The success of our business depends, in large part, on our ability to operate successfully from geographically disparate locations and to further expand our international operations and sales. Operating in international markets requires significant resources and management attention and subjects us to regulatory, economic and political risks that are different from those we face in the United States. We cannot be sure that further international expansion will be successful. In addition, we face risks in doing business internationally that could expose us to reduced demand for our products, lower prices for our products or other adverse effects on our operating results. Among the risks we believe are most likely to affect us are:
|
· |
difficulties, inefficiencies and costs associated with staffing and managing foreign operations; |
|
· |
longer and more difficult customer qualification and credit checks; |
|
· |
greater difficulty collecting accounts receivable and longer payment cycles; |
|
· |
the need for various local approvals to operate in some countries; |
|
· |
difficulties in entering some foreign markets without larger-scale local operations; |
|
· |
compliance with local laws and regulations; |
|
· |
unexpected changes in regulatory requirements, including the elimination of tax holidays; |
|
· |
reduced protection for intellectual property rights in some countries; |
|
· |
adverse tax consequences as a result of repatriating cash generated from foreign operations to the United States; |
|
· |
adverse tax consequences, including potential additional tax exposure if we are deemed to have established a permanent establishment outside of the United States; |
|
· |
the effectiveness of our policies and procedures designed to ensure compliance with the Foreign Corrupt Practices Act of 1977 and similar regulations; |
|
· |
fluctuations in currency exchange rates, which could increase the prices of our products to customers outside of the United States, increase the expenses of our international operations by reducing the purchasing power of the U.S. dollar and expose us to foreign currency exchange rate risk if, in the future, we denominate our international sales in currencies other than the U.S. dollar; |
|
· |
new and different sources of competition; and |
|
· |
political and economic instability, and terrorism. |
Our failure to manage any of these risks successfully could harm our operations and reduce our revenue.
To comply with environmental laws and regulations, we may need to modify our activities or incur substantial costs, and if we fail to comply with environmental regulations we could be subject to substantial fines or be required to have our suppliers alter their processes.
The semiconductor memory industry is subject to a variety of international, federal, state and local governmental regulations directed at preventing or mitigating environmental harm, as well as to the storage, discharge, handling, generation, disposal and labeling of toxic or other hazardous substances. Failure to comply with environmental regulations could subject us to civil or criminal sanctions and property damage or personal injury claims. Compliance with current or future environmental laws and regulations could restrict our ability to expand our business or require us to modify processes or incur other substantial expenses which could harm our business. In response to environmental concerns, some customers and government agencies impose requirements for the elimination of hazardous substances, such as lead (which is widely used in soldering connections in the process of semiconductor packaging and assembly), from electronic equipment. For example, the European Union adopted its Restriction on Hazardous Substance Directive
27
which prohibits, with specified exceptions, the sale in the EU market of new electrical and electronic equipment containing more than agreed levels of lead or other hazardous materials and China has enacted similar regulations. Environmental laws and regulations such as these could become more stringent over time, causing a need to redesign technologies, imposing greater compliance costs and increasing risks and penalties associated with violations, which could seriously harm our business.
Some of the facilities of our suppliers are located near known earthquake fault zones, and the occurrence of an earthquake or other catastrophic disaster could damage our facilities, which could cause us to curtail our operations.
Some of our foundries and suppliers’ facilities in Asia are located near known earthquake fault zones and, therefore, are vulnerable to damage from earthquakes. We are also vulnerable to damage from other types of disasters, such as power loss, fire, floods and similar events. If any such disaster were to occur, our ability to operate our business could be seriously impaired. In addition, we may not have adequate insurance to cover our losses resulting from disasters or other similar significant business interruptions. Any significant losses that are not recoverable under our insurance policies could seriously impair our business and financial condition.
Provisions of our credit facility may restrict our ability to pursue our business strategies.
Borrowings under our existing credit facility are secured by substantially all of our assets. Our term loan facility prohibits our ability to, among other things:
|
· |
dispose of or sell assets; |
|
· |
consolidate or merge with other entities; |
|
· |
incur additional indebtedness; |
|
· |
create liens on our assets; |
|
· |
pay dividends; |
|
· |
make investments; |
|
· |
enter into transactions with affiliates; and |
|
· |
redeem subordinated indebtedness. |
These restrictions are subject to certain exceptions. The operating restrictions and covenants in the term loan facility, as well as any future financing agreements that we may enter into, may restrict our ability to finance our operations, engage in business activities or expand or fully pursue our business strategies. Our ability to comply with these covenants may be affected by events beyond our control, and we may not be able to meet those covenants. A breach of any of these covenants could result in a default under the credit facility, which could cause all of the outstanding indebtedness thereunder to either become immediately due and payable or increase by five percent of the interest rate charged during the period of the unremedied breach.
Our ability to use net operating losses to offset future taxable income may be subject to certain limitations.
In general, under Section 382 of the U.S. Internal Revenue Code of 1986, as amended, or the Code, a corporation that undergoes an “ownership change” is subject to limitations on its ability to utilize its pre-change net operating losses, or NOLs, to offset future taxable income, and tax credits to offset tax. We may experience an ownership change in the future, and our ability to utilize our NOLs and tax credits could be further limited by Section 382 of the Code. Future changes in our stock ownership, many of which are outside of our control, could result in an ownership change under Section 382 of the Code. Our net operating losses and tax credits could also be impaired under state laws. As a result, we might not be able to utilize a material portion of our state NOLs and tax credits.
We will incur significantly increased costs and devote substantial management time as a result of operating as a public company.
As a public company since October 2016, we are incurring significant legal, accounting and other expenses that we did not incur as a private company. For example, we are subject to the reporting requirements of the Securities Exchange
28
Act of 1934, as amended, or the Exchange Act, and are required to comply with the applicable requirements of the Sarbanes-Oxley Act, and the Dodd-Frank Wall Street Reform and Consumer Protection Act of 2010, or the Dodd-Frank Act, as well as rules and regulations subsequently implemented by the SEC and the NASDAQ Stock Market, including the establishment and maintenance of effective disclosure and internal controls and the establishment corporate governance practices. Compliance with these requirements has increased our legal and financial compliance costs and is making some activities more time consuming and costly.
If we fail to hire additional finance personnel and strengthen our financial reporting systems and infrastructure, we may not be able to timely and accurately report our financial results or comply with the requirements of being a public company, including compliance with the Sarbanes-Oxley Act and SEC reporting requirements.
We intend to hire additional accounting and finance staff with technical accounting, SEC reporting and Sarbanes-Oxley Act compliance expertise. Any inability to recruit and retain such personnel would have an adverse impact on our ability to accurately and timely prepare our financial statements. We may be unable to locate and hire qualified professionals with requisite technical and public company experience when and as needed. In addition, new employees will require time and training to learn our business and operating processes and procedures. If our finance and accounting organization is unable for any reason to respond adequately to the increased demands as a result of being a public company, the quality and timeliness of our financial reporting may suffer, which could result in the identification of material weaknesses in our internal controls. Any consequences resulting from inaccuracies or delays in our reported financial statements could cause the trading price of our common stock to decline and could harm our business, operating results and financial condition.
If we fail to strengthen our financial reporting systems, infrastructure and internal control over financial reporting to meet the demands placed upon us as a public company, including the requirements of the Sarbanes-Oxley Act, we may be unable to report our financial results timely and accurately and prevent fraud. We expect to incur significant expense and devote substantial management effort toward ensuring compliance with Section 404.
Interruptions in our information technology systems could adversely affect our business.
We rely on the efficient and uninterrupted operation of complex information technology systems and networks to operate our business. Any significant disruption to our systems or networks, including, but not limited to, new system implementations, computer viruses, security breaches, facility issues, natural disasters, terrorism, war, telecommunication failures or energy blackouts, could have a material adverse impact on our operations, sales and financial results. Such disruption could result in a loss of our intellectual property or the release of sensitive competitive information or supplier, customer or employee personal data. Any loss of such information could harm our competitive position, result in a loss of customer confidence, and cause us to incur significant costs to remedy the damages caused by any such disruptions or security breaches. Additionally, any failure to properly manage the collection, handling, transfer or disposal of personal data of employees and customers may result in regulatory penalties, enforcement actions, remediation obligations, litigation, fines and other sanctions.
We may experience attacks on our data, attempts to breach our security and attempts to introduce malicious software into our IT systems. If attacks are successful, we may be unaware of the incident, its magnitude, or its effects until significant harm is done. Any such attack or disruption could result in additional costs related to rebuilding of our internal systems, defending litigation, responding to regulatory actions, or paying damages. Such attacks or disruptions could have a material adverse impact on our business, operations and financial results.
Third-party service providers, such as wafer foundries, assembly and test contractors, distributors and other vendors have access to certain portions of our and our customers’ sensitive data. In the event that these service providers do not properly safeguard the data that they hold, security breaches and loss of data could result. Any such loss of data by our third-party service providers could negatively impact our business, operations and financial results, as well as our relationship with our customers.
29
If we fail to remediate material weaknesses in our internal control over financial reporting, or experience any additional material weaknesses in the future or otherwise fail to maintain an effective system of internal controls in the future, we may not be able to accurately report our financial condition or results of operations which may adversely affect investor confidence in us and, as a result, the value of our common stock.
As a result of being a public company, we will be required, under Section 404 of the Sarbanes-Oxley Act to furnish a report by management on, among other things, the effectiveness of our internal control over financial reporting beginning with our Annual Report on Form 10‑K for the year ended December 31, 2017. This assessment will need to include disclosure of any material weaknesses identified by our management in our internal control over financial reporting. A material weakness is a deficiency or combination of deficiencies in internal control over financial reporting, such that there is a reasonable possibility that a material misstatement of our annual and interim financial statements will not be detected or prevented on a timely basis.
In connection with the audit of our financial statements as of and for the years ended December 31, 2016, 2015 and 2014, we identified material weaknesses in our internal control over financial reporting, as defined in the standards established by the Public Company Accounting Oversight Board of the United States. Our management has determined that we had a material weakness in our internal control over financial reporting as of December 31, 2014 and 2015, relating to the design and operation of our financial reporting processes. We have concluded that this material weakness was due to the fact that we did not yet have the appropriate resources with the appropriate level of experience and technical expertise to oversee our closing and financial reporting processes. Our management also determined that we had an additional material weakness in our internal control over financial reporting as of December 31, 2016, relating to information technology general and application controls. We have concluded that this material weakness is due to the current configuration of our ERP system, which is scheduled for additional integration in 2017.
We are enhancing our internal controls, processes and related documentation necessary to remediate our material weakness and to perform the evaluation needed to comply with Section 404. We may not be able to complete our remediation, evaluation and testing in a timely fashion. During the evaluation and testing process, if we identify one or more material weaknesses in our internal control over financial reporting, such as the one we identified as described above, we will be unable to conclude that our internal controls are effective. The effectiveness of our controls and procedures may be limited by a variety of factors, including:
|
· |
faulty human judgment and simple errors, omissions or mistakes; |
|
· |
fraudulent action of an individual or collusion of two or more people; |
|
· |
inappropriate management override of procedures; and |
|
· |
the possibility that any enhancements to controls and procedures may still not be adequate to assure timely and accurate financial control. |
When we cease to be an “emerging growth company” under the federal securities laws, our auditors will be required to express an opinion on the effectiveness of our internal controls. If we are unable to confirm that our internal control over financial reporting is effective, or if our auditors are unable to express an opinion on the effectiveness of our internal controls, we could lose investor confidence in the accuracy and completeness of our financial reports, which could cause the price of our common stock to decline.
The issuance of new accounting standards or future interpretations of existing accounting standards could adversely affect our operating results.
We prepare our financial statements in accordance with accounting principles generally accepted in the United States of America, or GAAP. A change in those principles could have a significant effect on our reported results and might affect our reporting of transactions completed before a change is announced. GAAP is issued and subject to interpretation by the Financial Accounting Standards Board, the SEC and various other bodies formed to promulgate and interpret accounting principles. A change in these principles or interpretations could have a significant effect on our reported financial results, and could affect the reporting of transactions completed before the announcement of a change. The issuance of new accounting standards or future interpretations of existing accounting standards, or changes in our business practices or estimates, could result in future changes in our revenue recognition or other accounting policies that could have a material adverse effect on our results of operations.
30
Regulations related to “conflict minerals” may force us to incur additional expenses, may make our supply chain more complex and may result in damage to our reputation with customers.
Pursuant to the Dodd-Frank Act, the SEC has adopted requirements for companies that use certain minerals and metals, known as conflict minerals, in their products, whether or not these products are manufactured by third parties. These requirements will require companies to perform diligence and disclose and report whether or not such minerals originate from the Democratic Republic of Congo and adjoining countries. The implementation of these requirements could adversely affect the sourcing, availability and pricing of minerals used in the manufacture of our products, and affect our costs and relationships with customers, distributors and suppliers as we must obtain additional information from them to ensure our compliance with the disclosure requirement. In addition, we will incur additional costs to comply with the disclosure requirements, including costs related to determining the source of any of the relevant minerals and metals used in our products. Since our supply chain is complex, we may not be able to sufficiently verify the origins for these minerals and metals used in our products through the due diligence procedures that we implement, which may harm our reputation. In such event, we may also face difficulties in satisfying customers who require that all of the components of our products are certified as conflict mineral free and these customers may discontinue, or materially reduce, purchases of our products, which could result in a material adverse effect on our results of operations and our financial condition may be adversely affected.
Risks Related to Our Common Stock
An active trading market may not be sustained.
Prior to the initial public offering of our common stock in October 2016, there was no public market for our common stock. Although our stock is currently traded on the NASDAQ Stock Market, an active trading market may not be sustained. The lack of an active market may impair the value of your shares and your ability to sell your shares at the time you wish to sell them. An inactive market may also impair our ability to both raise capital by selling shares and acquire other complementary products, technologies or businesses by using our shares as consideration.
We expect that the price of our common stock will fluctuate substantially.
The market price of our common stock is likely to be highly volatile and may fluctuate substantially due to many factors, including:
|
· |
the introduction of new products or product enhancements by us or others in our industry; |
|
· |
disputes or other developments with respect to our or others’ intellectual property rights; |
|
· |
product liability claims or other litigation; |
|
· |
quarterly variations in our results of operations or those of others in our industry; |
|
· |
sales of large blocks of our common stock, including sales by our executive officers and directors; |
|
· |
changes in earnings estimates or recommendations by securities analysts; and |
|
· |
general market conditions and other factors, including factors unrelated to our operating performance or the operating performance of our competitors. |
In recent years, the stock markets generally have experienced extreme price and volume fluctuations that have often been unrelated or disproportionate to the operating performance of those companies. Broad market and industry factors may significantly affect the market price of our common stock, regardless of our actual operating performance. These fluctuations may be even more pronounced in the trading market for our common stock.
In addition, in the past, class action litigation has often been instituted against companies whose securities have experienced periods of volatility in market price. Securities litigation brought against us following volatility in our stock price, regardless of the merit or ultimate results of such litigation, could result in substantial costs, which would hurt our financial condition and operating results and divert management’s attention and resources from our business.
These and other factors may make the price of our stock volatile and subject to unexpected fluctuation.
31
Securities analysts may not publish favorable research or reports about our business or may publish no information at all, which could cause our stock price or trading volume to decline.
The trading market for our common stock will be influenced to some extent by the research and reports that industry or financial analysts publish about us and our business. We do not control these analysts. As a newly public company, we may be slow to attract research coverage and the analysts who publish information about our common stock will have had relatively little experience with our company or industry, which could affect their ability to accurately forecast our results and could make it more likely that we fail to meet their estimates. In the event we obtain securities or industry analyst coverage, if any of the analysts who cover us provide inaccurate or unfavorable research or issue an adverse opinion regarding our stock price, our stock price could decline. If one or more of these analysts cease coverage of our company or fail to publish reports covering us regularly, we could lose visibility in the market, which in turn could cause our stock price or trading volume to decline.
We are an “emerging growth company” and we cannot be certain if the reduced disclosure requirements applicable to “emerging growth companies” will make our common stock less attractive to investors.
We are an “emerging growth company,” as defined in the JOBS Act, and we may take advantage of certain exemptions and relief from various reporting requirements that are applicable to other public companies that are not “emerging growth companies.” In particular, while we are an “emerging growth company” (1) we will not be required to comply with the auditor attestation requirements of Section 404(b) of the Sarbanes-Oxley Act, (2) we will be exempt from any rules that may be adopted by the Public Company Accounting Oversight Board requiring mandatory audit firm rotations or a supplement to the auditor’s report on financial statements, (3) we will be subject to reduced disclosure obligations regarding executive compensation in our periodic reports and proxy statements, and (4) we will not be required to hold nonbinding advisory votes on executive compensation or stockholder approval of any golden parachute payments not previously approved.
We may remain an “emerging growth company” until as late as December 31, 2021, the fiscal year-end following the fifth anniversary of the completion of our initial public offering, though we may cease to be an “emerging growth company” earlier under certain circumstances, including (1) if the market value of our common stock that is held by nonaffiliates exceeds $700 million as of any June 30, in which case we would cease to be an “emerging growth company” as of the following December 31, or (2) if our gross revenue exceeds $1.0 billion in any fiscal year.
Investors may find our common stock less attractive if we rely on the exemptions and relief granted by the JOBS Act. If some investors find our common stock less attractive as a result, there may be a less active trading market for our common stock and our stock price may decline or become more volatile.
Sales of a substantial number of shares of our common stock in the public market by our existing stockholders could cause our stock price to fall.
Sales of a substantial number of shares of our common stock in the public market, or the perception that these sales might occur, could depress the market price of our common stock and could impair our ability to raise capital through the sale of additional equity securities. We are unable to predict the effect that sales may have on the prevailing market price of our common stock.
Our directors, officers and principal stockholders have significant voting power and may take actions that may not be in the best interests of our other stockholders.
Our officers, directors and principal stockholders each holding more than 5% of our common stock, collectively, control a significant percentage of our outstanding common stock. As a result, these stockholders, if they act together, will be able to control the management and affairs of our company and most matters requiring stockholder approval, including the election of directors and approval of significant corporate transactions. This concentration of ownership may have the effect of delaying or preventing a change of control and might adversely affect the market price of our common stock. This concentration of ownership may not be in the best interests of our other stockholders.
32
Our disclosure controls and procedures may not prevent or detect all errors or acts of fraud.
We are subject to the periodic reporting requirements of the Exchange Act. We have designed our disclosure controls and procedures to provide reasonable assurance that information we must disclose in reports we file or submit under the Exchange Act is accumulated and communicated to management, and recorded, processed, summarized and reported within the time periods specified in the rules and forms of the SEC. We believe that any disclosure controls and procedures, no matter how well-conceived and operated, can provide only reasonable, not absolute, assurance that the objectives of the control system are met.
These inherent limitations include the realities that judgments in decision-making can be faulty, and that breakdowns can occur because of simple error or mistake. Additionally, controls can be circumvented by the individual acts of some persons, by collusion of two or more people or by an unauthorized override of the controls. Accordingly, because of the inherent limitations in our control system, misstatements due to error or fraud may occur and not be detected.
Provisions in our corporate charter documents and under Delaware law could make an acquisition of us more difficult and may prevent attempts by our stockholders to replace or remove our current management.
Provisions in our amended and restated certificate of incorporation and our amended and restated bylaws may discourage, delay or prevent a merger, acquisition or other change in control of us that stockholders may consider favorable, including transactions in which stockholders might otherwise receive a premium for their shares. These provisions could also limit the price that investors might be willing to pay in the future for shares of our common stock, thereby depressing the market price of our common stock. In addition, these provisions may frustrate or prevent any attempts by our stockholders to replace or remove our current management by making it more difficult for stockholders to replace members of our board of directors. Because our board of directors is responsible for appointing the members of our management team, these provisions could in turn affect any attempt by our stockholders to replace current members of our management team. Among others, these provisions include that:
|
· |
our board of directors has the right to expand the size of our board of directors and to elect directors to fill a vacancy created by the expansion of the board of directors or the resignation, death or removal of a director, which prevents stockholders from being able to fill vacancies on our board of directors; |
|
· |
our stockholders may not act by written consent or call special stockholders’ meetings; as a result, a holder, or holders, controlling a majority of our capital stock would not be able to take certain actions other than at annual stockholders’ meetings or special stockholders’ meetings called by the board of directors, the chairman of the board, the chief executive officer or the president; |
|
· |
our certificate of incorporation prohibits cumulative voting in the election of directors, which limits the ability of minority stockholders to elect director candidates; |
|
· |
the affirmative vote of holders of at least 66‑2/3% of the voting power of all of the then outstanding shares of voting stock, voting as a single class, will be required (a) to amend certain provisions of our certificate of incorporation, including provisions relating to the size of the board, removal of directors, special meetings, actions by written consent and cumulative voting and (b) to amend or repeal our bylaws, although our bylaws may be amended by a simple majority vote of our board of directors; |
|
· |
stockholders must provide advance notice and additional disclosures to nominate individuals for election to the board of directors or to propose matters that can be acted upon at a stockholders’ meeting, which may discourage or deter a potential acquiror from conducting a solicitation of proxies to elect the acquiror’s own slate of directors or otherwise attempting to obtain control of our company; and |
|
· |
our board of directors may issue, without stockholder approval, shares of undesignated preferred stock; the ability to issue undesignated preferred stock makes it possible for our board of directors to issue preferred stock with voting or other rights or preferences that could impede the success of any attempt to acquire us. |
Moreover, because we are incorporated in Delaware, we are governed by the provisions of Section 203 of the Delaware General Corporation Law, which prohibits a person who owns in excess of 15% of our outstanding voting stock from merging or combining with us for a period of three years after the date of the transaction in which the person acquired in excess of 15% of our outstanding voting stock, unless the merger or combination is approved in a prescribed manner.
33
Item 1B Unresolved Staff Comments.
None.
We lease office space for our corporate headquarters located in Chandler, Arizona and for our design facility located in Austin, Texas. The leases expire in October 2018 and January 2022, respectively.
We have an operating lease for our Arizona manufacturing facility, as amended, for certain of the fabrication, laboratory and office premises of Freescale, a related party. This lease is cancellable upon 24 months’ notice by either of the parties. In the first quarter of 2017, we extended the lease through January 28, 2019 and amended the premises covered to remove laboratory space, decrease fabrication space and expand office space. In the first quarter of 2017, we entered into a five-year operating lease with Freescale for 10,023 square feet of office and laboratory space.
We believe our existing facilities are well maintained and in good operating condition and they are adequate for our foreseeable business needs.
From time to time, we may become involved in legal proceedings arising from the ordinary course of our business. Management is currently not aware of any matters that will have a material adverse effect on our financial position, results of operations or cash flows.
Item 4. Mine Safety Disclosures
Not applicable.
34
Item 5. Market for Registrant’s Common Equity, Related Stockholder Matters and Issuer Purchases of Equity Securities.
Market Price of Common Stock
Our common stock has been listed on the NASDAQ Global Select Market under the symbol “MRAM” since October 7, 2016. Prior to that date, there was no public trading market for our common stock. The following table sets forth for the period indicated the high and low sales prices per share of our common stock as reported on the NASDAQ Global Select Market:
|
|
|
Prices |
||||
|
|
|
High |
|
Low |
||
|
2016 |
|
|
|
|
|
|
|
Quarter ended December 31, 2016 (from October 7, 2016) |
|
$ |
9.99 |
|
$ |
6.15 |
Holders of Record
As of March 23, 2017, we had 52 holders of record of our common stock. The actual number of stockholders is greater than this number of record holders, and includes stockholders who are beneficial owners, but whose shares are held in street name by brokers and other nominees. This number of holders of record also does not include stockholders whose shares may be held in trust by other entities.
Dividend Policy
We have never declared or paid cash dividends on our capital stock. We intend to retain all available funds and any future earnings, if any, to fund the development and expansion of our business and we do not anticipate paying any cash dividends in the foreseeable future. Any future determination related to dividend policy will be made at the discretion of our board of directors.
Stock Performance Graph
This performance graph shall not be deemed “soliciting material” or to be “filed” with the SEC for purposes of Section 18 of the Securities Exchange Act of 1934, as amended (Exchange Act), or otherwise subject to the liabilities under that Section, and shall not be deemed to be incorporated by reference into any of our filings under the Securities Act of 1933, as amended, or the Exchange Act.
The graph below shows the cumulative total stockholder return for Everspin Technologies, Inc., the NASDAQ Composite Index and the PHLX Semiconductor Index, assuming the investment of $100.00 in our common stock on the date specified. The comparisons in the graph are required by the Securities and Exchange Commission and are not intended to forecast or be indicative of future performance of our common stock.
35
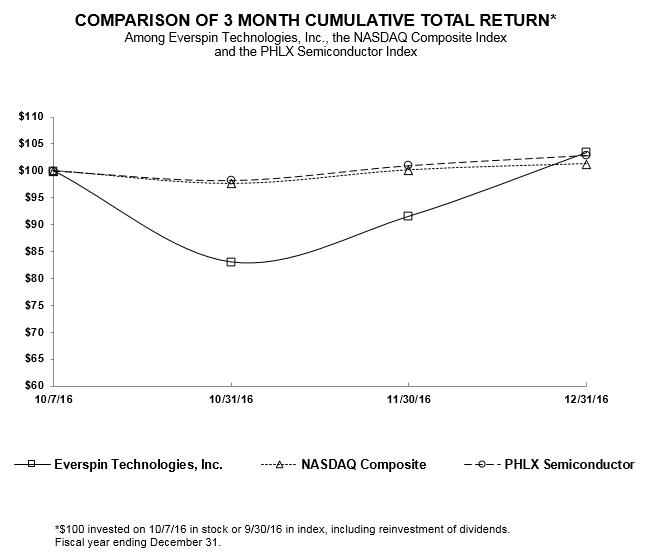
Recent Sales of Unregistered Securities
None.
Use of Proceeds from our Public Offering of Common Stock
On October 7, 2016, our registration statement on Form S‑1 (File No. 333‑213569) relating to our initial public offering (IPO) of common stock became effective. The IPO closed on October 13, 2016 at which time we issued 5,000,000 shares of our common stock at an initial offering price of $8.00 per share for gross proceeds of $40.0 million. We received net proceeds from the IPO of $33.9 million, after deducting the underwriting discount and other offering-related expenses paid by us.
There has been no material change in the planned use of proceeds from the IPO from that described in the prospectus filed with the SEC pursuant to Rule 424(b)(4) under the Securities Act on October 7, 2016. As of December 31, 2016, we had used approximately $14.1 million of the proceeds from our IPO.
Repurchases of Shares or of Company Equity Securities
None.
36
Item 6. Selected Financial Data.
The information set forth below should be read together with "Item 7. Management’s Discussion and Analysis of Financial Condition and Results of Operations" and our financial statements and related notes included elsewhere in this report. The selected balance sheet data at December 31, 2016 and 2015, and the selected statements of operations data for each of the years ended December 31, 2016, 2015, and 2014, have been derived from our audited financial statements that are included elsewhere in this report. The selected balance sheet data at December 31, 2014 has been derived from our audited financial statements not included in this report. Historical results are not necessarily indicative of results to be expected in any future period.
|
|
|
Year Ended December 31, |
|||||||
|
Statement of Operations Data: |
|
2016 |
|
2015 |
|
2014 |
|||
|
|
|
(In thousands, except share and per share amounts) |
|||||||
|
Product sales |
|
$ |
26,611 |
|
$ |
25,875 |
|
$ |
23,071 |
|
Licensing and royalty revenue |
|
|
483 |
|
|
671 |
|
|
1,825 |
|
Total revenue |
|
|
27,094 |
|
|
26,546 |
|
|
24,896 |
|
Cost of sales |
|
|
12,395 |
|
|
12,568 |
|
|
11,806 |
|
Gross profit |
|
|
14,699 |
|
|
13,978 |
|
|
13,090 |
|
Operating expenses: |
|
|
|
|
|
|
|
|
|
|
Research and development(1) |
|
|
19,233 |
|
|
21,126 |
|
|
12,664 |
|
General and administrative(1) |
|
|
7,281 |
|
|
6,565 |
|
|
7,085 |
|
Sales and marketing(1) |
|
|
3,706 |
|
|
3,823 |
|
|
3,259 |
|
Total operating expenses |
|
|
30,220 |
|
|
31,514 |
|
|
23,008 |
|
Loss from operations |
|
|
(15,521) |
|
|
(17,536) |
|
|
(9,918) |
|
Interest expense |
|
|
(2,347) |
|
|
(653) |
|
|
(263) |
|
Other income (expense), net |
|
|
1,160 |
|
|
6 |
|
|
(2) |
|
Net loss |
|
$ |
(16,708) |
|
$ |
(18,183) |
|
$ |
(10,183) |
|
Net loss per common share, basic and diluted |
|
$ |
(3.53) |
|
$ |
(7.12) |
|
$ |
(4.00) |
|
Shares used to compute net loss per common share, basic and diluted |
|
|
4,738,496 |
|
|
2,552,205 |
|
|
2,544,578 |
|
Other Financial Data: |
|
|
|
|
|
|
|
|
|
|
Adjusted EBITDA(2) |
|
$ |
(11,429) |
|
$ |
(14,013) |
|
$ |
(7,497) |
|
(1) |
Includes stock-based compensation as follows: |
|
|
|
Year Ended December 31, |
|||||||
|
2016 |
2015 |
2014 |
|||||||
|
|
|
(In thousands) |
|||||||
|
Research and development |
|
$ |
403 |
|
$ |
169 |
|
$ |
304 |
|
General and administrative |
|
|
637 |
|
|
190 |
|
|
392 |
|
Sales and marketing |
|
|
101 |
|
|
57 |
|
|
103 |
|
Total |
|
$ |
1,141 |
|
$ |
416 |
|
$ |
799 |
|
(2) |
We define Adjusted EBITDA as net income or loss adjusted for depreciation and amortization, stock-based compensation expense, compensation expense related to the vesting of common stock held by GLOBALFOUNDRIES resulting from our joint development agreement and interest expense. We use Adjusted EBITDA in conjunction with traditional GAAP operating performance measures to understand and evaluate our operating performance and trends, to prepare and approve our annual budget and to develop short-term and long-term operating and financing plans. Accordingly, we believe that Adjusted EBITDA provides useful information for investors in understanding and evaluating our operating results in the same manner as our management and our board of directors. |
Adjusted EBITDA has limitations as a financial measure and should not be considered a substitute for other measures of financial performance reported in accordance with GAAP. These limitations include the following:
|
· |
Adjusted EBITDA does not reflect changes in, or cash requirements for, our working capital needs; |
37
|
· |
Adjusted EBITDA does not reflect tax payments that may represent a reduction in cash available to us or the impact of deferred income tax; |
|
· |
Adjusted EBITDA does not reflect cash expenditure requirements for replacements or for new capital expenditures; |
|
· |
Adjusted EBITDA excludes some recurring costs, such as the dilutive impact of non-cash stock-based compensation and depreciation and amortization; and |
|
· |
other companies, including companies in our industry, may calculate Adjusted EBITDA differently from how we calculate this measure or not at all, which reduces its usefulness as a comparative measure. |
Because of these limitations, you should consider Adjusted EBITDA alongside other financial performance measures, including net loss and our financial results presented in accordance with GAAP. The following table presents a reconciliation of net loss, the most directly comparable GAAP measure, to Adjusted EBITDA for each of the periods indicated:
|
|
|
Year Ended December 31, |
|||||||
|
|
|
2016 |
|
2015 |
|
2014 |
|||
|
|
|
(In thousands) |
|||||||
|
Adjusted EBITDA reconciliation: |
|
|
|
|
|
|
|
|
|
|
Net loss |
|
$ |
(16,708) |
|
$ |
(18,183) |
|
$ |
(10,183) |
|
Depreciation and amortization |
|
|
826 |
|
|
1,340 |
|
|
1,517 |
|
Stock-based compensation expense |
|
|
1,141 |
|
|
416 |
|
|
799 |
|
Compensation expense related to vesting of GLOBALFOUNDRIES common stock |
|
|
965 |
|
|
1,761 |
|
|
107 |
|
Interest expense |
|
|
2,347 |
|
|
653 |
|
|
263 |
|
Adjusted EBITDA |
|
$ |
(11,429) |
|
$ |
(14,013) |
|
$ |
(7,497) |
|
|
|
As of December 31, |
|||||||
|
2016 |
2015 |
2014 |
|||||||
|
|
|
(In thousands) |
|||||||
|
Balance Sheet Data: |
|
|
|
|
|
|
|
|
|
|
Cash and cash equivalents |
|
$ |
29,727 |
|
$ |
2,307 |
|
$ |
9,624 |
|
Working capital (deficit) |
|
|
29,119 |
|
|
(198) |
|
|
8,940 |
|
Total assets |
|
|
41,472 |
|
|
10,961 |
|
|
17,775 |
|
Total long-term debt, current and non-current |
|
|
8,102 |
|
|
7,914 |
|
|
2,874 |
|
Redeemable convertible preferred stock warrant liability |
|
|
— |
|
|
437 |
|
|
145 |
|
Redeemable convertible preferred stock |
|
|
— |
|
|
64,642 |
|
|
64,642 |
|
Total stockholders’ equity (deficit) |
|
|
26,871 |
|
|
(70,430) |
|
|
(54,428) |
38
Item 7. Management’s Discussion and Analysis of Financial Condition and Results of Operations.
You should read the following discussion and analysis of our financial condition and results of operations together with the “Selected Financial Data” and our audited financial statements and related notes included elsewhere in this report. This discussion and other parts of this report contain forward-looking statements that involve risk and uncertainties, such as statements of our plans, objectives, expectations and intentions. As a result of many factors, including those factors set forth in the “Risk Factors” section of this report, our actual results could differ materially from the results described in or implied by the forward-looking statements contained in the following discussion and analysis.
Overview
We are the leading provider of MRAM products. Our MRAM products offer the persistence of non-volatile memory, a type of memory that retains information even in the absence of power, with the speed and endurance of random access memory (RAM), and enable the protection of mission critical data particularly in the event of power interruption or failure. Our MRAM products allow our customers in the industrial, automotive and transportation, and enterprise storage markets to design high performance, power efficient and reliable systems without the need for bulky batteries or capacitors. We are the only provider of commercially available MRAM solutions, and over the past eight years we have shipped over 60 million MRAM units.
Our revenue is derived from the sale of our MRAM-based products in discrete unit form, as embedded technology, and through licensing and royalties of our MRAM technology.
We work directly with our customers to have our MRAM devices designed into and qualified for their products. Although we maintain direct sales, support, and development relationships with our customers, once our products are designed into a customer’s product, we sell a majority of our products to those customers through distributors. We generated 79%, 66%, and 71% of our revenue from products sold through distributors for the years ended December 31, 2016, 2015 and 2014, respectively.
We maintain a direct selling relationship, for strategic purposes, with several key customer accounts. Our direct sales personnel and representatives are organized into three primary regions: North America; Europe, Middle East and Africa (EMEA); and Asia-Pacific (APAC). In North America, our revenue was $5.7 million, $6.1 million and $7.0 million for the years ended December 31, 2016, 2015, and 2014, respectively. Our revenue in North America decreased for the years ended December 31, 2016 and 2015, compared to the same period in 2014 primarily due to our licensing revenue decreasing each year as a result of more subscription type licensing in 2016 and a non-recurring engineering payment of $1.0 million in 2014 from one of our customers related to a technology transfer agreement. In EMEA, our revenue was $5.1 million, $4.3 million, and $3.5 million for the years ended December 31, 2016, 2015, and 2014, respectively. In APAC, our revenue was $16.3 million, $16.1 million, and $14.5 million for the years ended December 31, 2016, 2015, and 2014, respectively. We recognize revenue by geography based on the region in which our products are sold, and not to where the end products are shipped.
We leverage both internal and outsourced capabilities to manufacture our MRAM products. We purchase industry-standard complementary metal-oxide semiconductor (CMOS) wafers from semiconductor foundries and complete the fabrication by inserting our magnetic-bit technology at our 200mm fabrication facility in Chandler, Arizona. We believe this allows us to streamline research and development, rapidly prototype new products, and bring new products to market quickly and cost effectively. This strategy significantly reduces the capital investment that would otherwise be required to operate manufacturing facilities of our own. We intend to utilize leading semiconductor foundries, including GLOBALFOUNDRIES, to support high-volume production of our high density MRAM products on 300mm wafers at advanced process nodes.
During the years ended December 31, 2016, 2015 and 2014, we continued to invest in research and development to support the development and production of our second generation of MRAM technology. We believe our continued investment will allow us to continue to develop and deploy products based on our Spin-Torque MRAM (ST-MRAM) technology. For the years ended December 31, 2016, 2015, and 2014, our research and development expenses were $19.2 million, $21.1 million, and $12.7 million, respectively. We expect that our research and development expenses will increase in the future as we continue to develop our MRAM technology internally and through our joint development agreement with GLOBALFOUNDRIES.
39
Our principal executive offices are located in Chandler, Arizona. The facility accommodates our principal sales, marketing and research and development. Also in Chandler, we lease office space, clean room space, and laboratory space for our 200mm production and research and development functions. Our primary product design personnel are located in our office in Austin, Texas.
For the years ended December 31, 2016, 2015, and 2014, we recorded revenue of $27.1 million, $26.5, million, and $24.9 million, gross margin of 54.3%, 52.7%, and 52.6%, and a net loss of $16.7 million, $18.2 million, and $10.2 million, respectively. In the fourth quarter of 2016 we had a gross margin of 45.8%, which differs from gross margin as previously reported of 50.7% due to the additional recognition of cost of goods sold in the fourth quarter that we had previously identified as recognizable in the first quarter of 2017.
Key Metrics
We monitor a variety of key financial metrics to help us evaluate growth trends, establish budgets, measure the effectiveness of our business strategies and assess operational efficiencies. These financial metrics include revenue, gross margin, operating expenses and operating income determined in accordance with GAAP. Additionally, we monitor and project cash flow to determine our sources and uses for working capital to fund our operations. We also monitor Adjusted EBITDA, a non-GAAP financial measure.
Our management and board of directors use Adjusted EBITDA to understand and evaluate our operating performance and trends, to prepare and approve our annual budget and to develop short-term and long-term operating and financing plans. Accordingly, we believe that Adjusted EBITDA provides useful information for investors in understanding and evaluating our operating results in the same manner as our management and our board of directors. Adjusted EBITDA was $(11.4) million, $(14.0) million, and $(7.5) million in 2016, 2015, and 2014, respectively. The changes were primarily a result of increased personnel-related costs, excluding stock-based compensation, contract labor and expenses resulting from our joint development agreement with GLOBALFOUNDRIES. Personnel-related costs and contract labor costs increased from $12.4 million in 2014 to $15.2 million in 2015, and to $15.8 million in 2016. Expenses from our joint development agreement were $0 in 2014, $3.6 million in 2015, and $2.9 million in 2016. The increase in personnel-related and contract labor is consistent with our strategy to expand our operations and develop our MRAM technologies and products to support future growth.
See “Selected Financial Data” for more information and reconciliation of Adjusted EBITDA to net loss, the most directly comparable financial measure calculated in accordance with GAAP.
Factors Affecting Our Results of Operations
Design wins. In order to continue to grow our revenue, we must continue to achieve design wins for our MRAM products. We consider a design win to occur when an original equipment manufacturer (OEM) or contract manufacturer notifies us that it has selected one of our products to be incorporated into a product or system under development. We believe we are dependent on the adoption of our 256Mb and 1Gb MRAM products by our customers to secure design wins. Because the life cycles for our customers’ products can last for several years, if these products have successful commercial introductions, we expect to continue to generate revenues over an extended period of time for each successful design win. Any delay in the development of our 256Mb and 1Gb MRAM products, or failure of our customers to adopt our 256Mb and 1Gb MRAM products, could inhibit revenue growth or cause declines, which would significantly harm our business and prevent us from becoming profitable.
Customer acceptance of our technology and customer product success. In order for our customers to use our products, they may have to redesign certain components of their existing designs. We have established relationships with several controller companies, including Broadcom (formerly LSI and Avago) and Microsemi (formerly PMC-Sierra), and IP core companies, including Cadence, Northwest Logic and Altera (now part of Intel), to accelerate the implementation of our MRAM solutions into our customers’ end products. Delays in our customers’ design cycles may have adverse effects on the demand, and therefore sales, of our products.
40
Customer concentration. A relatively small number of end customers have historically accounted for a significant percentage of our revenue. Revenue, including through distributors, from Broadcom, NXP, STMicroelectronics, and Dell, collectively, accounted for 32%, 41%, and 37% of our total revenue in 2016, 2015, and 2014, respectively. Two of these customers accounted for more than 10% of our revenue in 2015 and 2014. None of these customers individually accounted for more than 10% of our total revenue in 2016. It would be difficult to replace lost revenue resulting from the loss, reduction, cancellation or delay in purchase orders by any one of these customers. Consolidation among our customers may further concentrate our customer base and expose us to increased risks relating to increased customer concentration. In addition, any significant pricing pressure exerted by a significant customer could adversely affect our operating results.
Pricing, product cost and gross margins of our products. Our gross margin has been, and will continue to be, affected by a variety of factors, including the timing of changes in pricing, shipment volumes, new product introductions, changes in product mix, changes in our purchase price of fabricated wafers, assembly and test service expenses, manufacturing yields and inventory write downs, if any. In general, newly introduced products, and products with higher densities and performance, tend to be priced higher than older, more mature products. Average selling prices in the semiconductor industry typically decline as products mature. Consistent with this historical trend, we expect that the average selling prices of our products will decline as they mature. In the normal course of business, we seek to offset the effect of declining average selling prices on existing products by reducing manufacturing costs and introducing newer, higher value-added products. If we are unable to maintain overall average selling prices or to offset any declines in average selling prices with savings on product costs, our gross margin will decline.
Gross margin impact of licensing revenue. Our licensing revenue, which we collect as licensing fees and royalty payments, generates significantly higher gross margin than product revenue. Due to the high gross margin profile of this revenue stream, fluctuations in licensing revenue may have a greater impact on gross margin than a corresponding change in the demand for our products. Therefore, as licensing revenue fluctuates, we may see significant variations in gross margin.
Technology, process, and product development investment. We invest heavily to develop our MRAM technology, including the core MRAM technology, the joint development agreement with GLOBALFOUNDRIES, and the design of new and innovative products based on MRAM, to provide solutions to our current and future customers. We anticipate that we will continue to invest in our research and development to achieve our technology and product roadmaps. Our product development is targeted to specific segments of the market where we believe the densities and performance of our products can provide the most benefit. We believe our close coordination with our customers regarding their future product requirements enhances the efficiency of our research and development expenditures.
Components of Results of Operations
Revenue
We derive our revenue from the sale of our MRAM-based products in discrete unit form, as embedded technology, and through licensing of and royalties on our MRAM technology. For sales through distributors, we defer recognition of revenue and the related expenses of our discrete MRAM products until the distributor has sold the products to its end customer. We recognize license fees when the applicable development milestones have been met in accordance with the terms of the licensing agreement. Our licensing revenue is largely dependent on a small number of transactions during a given year. We recognize revenue for royalties resulting from our licensing agreements in accordance with the terms of the licensing agreement.
Cost of Sales and Gross Margin
Cost of sales primarily includes the cost of our products including costs to purchase wafers, costs paid for wafer fabrication, costs associated with the assembly and testing of our products, shipping costs and costs of our manufacturing personnel. Cost of sales also includes indirect costs, such as warranty, inventory valuation reserves and overhead costs.
Gross profit is revenue less cost of sales. Gross margin is gross profit expressed as a percentage of total revenue. We expect that our gross margin may fluctuate from period to period, primarily as a result of changes in average selling price, revenue mix among our products, product yields and manufacturing costs. In addition, we may reserve against the value at which we carry our inventory based upon the product’s life cycle and conditions in the markets in which we sell.
41
Declines in average selling prices may be paired with improvements in our cost of sales, which may offset some of the gross margin reduction that could result from lower selling prices.
Operating Expenses
Our operating expenses consist of research and development, general and administrative and sales and marketing expenses. Personnel-related expenses, including salaries, benefits, bonuses and stock-based compensation, are the most significant component of each of our operating expense categories. In addition, we expect to increase research and development expenditures, hire additional personnel necessary to support our growth, and incur additional expenses associated with being a public company.
Research and Development Expenses
Our research and development expenses consist primarily of personnel-related expenses for the design and development of our products and technologies, test wafers required to characterize our technology, and expenses associated with our joint development agreement with GLOBALFOUNDRIES. Research and development expenses also include consulting services, circuit design costs, materials and laboratory supplies, fabrication and new packaging technology, compensation charges related to the vesting of the shares of common stock issued to GLOBALFOUNDRIES, and an allocation of related facilities and equipment costs. We expect our research and development expenses to increase as we hire additional personnel to develop new products and product enhancements. We recognize research and development expenses as they are incurred.
General and Administrative Expenses
Our general and administrative expenses consist primarily of personnel expenses, allocated facilities costs, expenses for outside professional services, and expenses for personnel and consultants engaged in executive, finance, legal, information technology and administrative activities. We expect our general and administrative expenses will increase as a result of operating as a public company following our IPO in October 2016, including expenses related to compliance with the rules and regulations of the Securities and Exchange Commission, or SEC, and those of the NASDAQ Global Select Market exchange, additional insurance expenses, investor relations activities and other administrative and professional services.
Sales and Marketing Expenses
Our sales and marketing expenses consist primarily of compensation for our sales, marketing, and business development personnel, including bonuses and commissions for our sales representatives. We expect our sales and marketing expenses to increase as we hire additional sales personnel and representatives and increase our marketing activities.
Interest Expense
Interest expense consists of cash and non-cash components. The non-cash component consists of interest expense recognized from the amortization of debt discounts derived from the issuance of warrants and debt issuance costs capitalized on our balance sheets as a reduction of the debt balance. The non-cash component also includes interest expense on our convertible promissory notes as well as the amortization of debt discounts from the bifurcation of an embedded derivative related to the notes. These notes were converted into shares of our common stock upon the completion of our IPO in October 2016.The cash component of interest expense is attributable to our borrowings under our loan agreements.
Other Income (Expense), Net
Other income (expense), net consists primarily of the change in fair value of our convertible preferred stock warrant liability. Prior to the completion of our IPO, our convertible preferred stock warrants were exercisable into shares that were contingently redeemable. As such, these warrants were classified as a liability on our balance sheets at their estimated fair value and were marked to market at each reporting period. We continued to record adjustments to the estimated fair values of the convertible preferred stock warrants until they converted into common stock warrants upon the closing of the IPO.
42
Results of Operations
The following table sets forth our results of operations for the periods indicated:
|
|
|
Year Ended December 31, |
|||||||
|
|
|
2016 |
|
2015 |
|
2014 |
|||
|
|
|
(In thousands) |
|||||||
|
Product sales |
|
$ |
26,611 |
|
$ |
25,875 |
|
$ |
23,071 |
|
Licensing and royalty revenue |
|
|
483 |
|
|
671 |
|
|
1,825 |
|
Total revenue |
|
|
27,094 |
|
|
26,546 |
|
|
24,896 |
|
Cost of sales |
|
|
12,395 |
|
|
12,568 |
|
|
11,806 |
|
Gross profit |
|
|
14,699 |
|
|
13,978 |
|
|
13,090 |
|
Operating expenses: |
|
|
|
|
|
|
|
|
|
|
Research and development |
|
|
19,233 |
|
|
21,126 |
|
|
12,664 |
|
General and administrative |
|
|
7,281 |
|
|
6,565 |
|
|
7,085 |
|
Sales and marketing |
|
|
3,706 |
|
|
3,823 |
|
|
3,259 |
|
Total operating expenses |
|
|
30,220 |
|
|
31,514 |
|
|
23,008 |
|
Loss from operations |
|
|
(15,521) |
|
|
(17,536) |
|
|
(9,918) |
|
Interest expense |
|
|
(2,347) |
|
|
(653) |
|
|
(263) |
|
Other income (expense), net |
|
|
1,160 |
|
|
6 |
|
|
(2) |
|
Net loss |
|
$ |
(16,708) |
|
$ |
(18,183) |
|
$ |
(10,183) |
The following table set forth the statements of operations data for each of the periods presented as a percentage of revenue:
|
|
|
Year Ended December 31, |
|
||||
|
|
|
2016 |
|
2015 |
|
2014 |
|
|
Total revenue |
|
100 |
% |
100 |
% |
100 |
% |
|
Cost of sales |
|
46 |
|
47 |
|
47 |
|
|
Gross profit |
|
54 |
|
53 |
|
53 |
|
|
Operating expenses: |
|
|
|
|
|
|
|
|
Research and development |
|
71 |
|
80 |
|
51 |
|
|
General and administrative |
|
27 |
|
25 |
|
28 |
|
|
Sales and marketing |
|
14 |
|
14 |
|
13 |
|
|
Total operating expenses |
|
112 |
|
119 |
|
92 |
|
|
Loss from operations |
|
(58) |
|
(66) |
|
(40) |
|
|
Interest expense |
|
(9) |
|
(2) |
|
(1) |
|
|
Other income (expense), net |
|
4 |
|
0 |
|
(0) |
|
|
Net loss |
|
(63) |
% |
(68) |
% |
(41) |
% |
Comparison of the Years Ended December 31, 2016 and 2015
Revenue
|
|
|
Year Ended December 31, |
|
Change |
|
|||||||
|
|
|
2016 |
|
2015 |
|
Amount |
|
% |
|
|||
|
|
|
(Dollars in thousands) |
|
|||||||||
|
Product sales |
|
$ |
26,611 |
|
$ |
25,875 |
|
$ |
736 |
|
2.8 |
% |
|
Licensing and royalty revenue |
|
|
483 |
|
|
671 |
|
|
(188) |
|
(28.0) |
% |
|
Total revenue |
|
$ |
27,094 |
|
$ |
26,546 |
|
$ |
548 |
|
2.1 |
% |
Total revenue increased by $0.6 million, or 2.1%, from $26.5 million for the year ended December 31, 2015, to $27.1 million during the year ended December 31, 2016. Product sales increased by $0.7 million or 2.8% from $25.9 million, to $26.6 million. The increase in product sales was primarily due to increased sales volume in our Gen1 MRAM products resulting in $1.4 million in additional sales, partially offset by a decrease of $0.7 million in legacy product sales.
43
Licensing and royalty revenue is a highly variable revenue item characterized by a small number of transactions annually with revenues based on size and terms of each transaction. Licensing and royalty revenue decreased by $0.2 million due to the change in the type of licensing activity. In 2015 we received primarily one time, lump sum payments for the transfer of IP while 2016 licensing royalty revenue has been from subscription type licensing and royalty payments.
Cost of Sales and Gross Margin
|
|
|
Year Ended December 31, |
|
Change |
|
|||||||
|
2016 |
2015 |
Amount |
% |
|||||||||
|
(Dollars in thousands) |
||||||||||||
|
Cost of sales |
$ |
12,395 |
$ |
12,568 |
$ |
(173) | (1.4) |
% |
||||
|
Gross margin |
|
|
54.3 |
% |
|
52.7 |
% |
|
* |
|
* |
|
*Not meaningful.
Cost of sales decreased by $0.2 million, or 1.4%, from $12.6 million during the year ended December 31, 2015, to $12.4 million during the year ended December 31, 2016. The decrease was primarily due to the decreased volume in our legacy products and favorable pricing on Gen 1 MRAM raw materials.
Gross margin increased from 52.7% during the year ended December 31, 2015, to 54.3% during the year ended December 31, 2016. The increase was primarily due to increased sales volume related to our Gen1 MRAM products and the benefit of favorable pricing on raw materials.
Operating Expenses
|
|
|
Year Ended December 31, |
|
Change |
|
|||||||
|
2016 |
2015 |
Amount |
% |
|||||||||
|
(Dollars in thousands) |
||||||||||||
|
Research and development |
$ |
19,233 |
$ |
21,126 |
$ |
(1,893) | (9.0) |
% |
||||
|
General and administrative |
7,281 | 6,565 | 716 | 10.9 |
% |
|||||||
|
Sales and marketing |
3,706 | 3,823 | (117) | (3.1) |
% |
|||||||
|
Total operating expenses |
$ |
30,220 |
$ |
31,514 |
$ |
(1,294) | (4.1) |
% |
||||
Research and Development. Research and development expenses decreased by $1.9 million, or 9.0%, from $21.1 million during the year ended December 31, 2015, to $19.2 million during the year ended December 31, 2016. The decrease was primarily due to a $1.9 million decrease in direct materials for technology development, a decrease of $0.8 million in the amount attributable to the vesting of shares of common stock issued to GLOBALFOUNDRIES, $0.7 million in lower expenses incurred in our joint development agreement with GLOBALFOUNDRIES and a $0.6 million decrease in equipment maintenance. These decreases were partially offset by an increase of $1.9 million in personnel-related expenses and contract labor due to an increase in headcount and redeployment of personnel from general and administrative operations
General and Administrative. General and administrative expenses increased by $0.7 million, or 10.9%, from $6.6 million during the year ended December 31, 2015, to $7.3 million during the year ended December 31, 2016. The increase was primarily attributable to an increase of $0.9 million in professional services incurred due to becoming a publicly traded company such as accounting services, insurance, legal and investor relations, partially offset by a net decrease of $0.4 million in personnel-related and contract labor due to the redeployment of existing general and administrative operations personnel to research and development.
Sales and Marketing. Sales and marketing expenses decreased by $0.1 million, or 3.1%, from $3.8 million during the year ended December 31, 2015, to $3.7 million during the year ended December 31, 2016. The decrease was primarily attributable to a decrease in personnel-related expenses as a result of lower headcount.
44
Interest Expense
|
|
|
Year Ended December 31, |
|
Change |
|
|||||||
|
|
|
2016 |
|
2015 |
|
Amount |
|
% |
|
|||
|
|
|
(Dollars in thousands) |
|
|||||||||
|
Interest expense |
|
$ |
2,347 |
|
$ |
653 |
|
$ |
1,694 |
|
259.4 |
% |
Interest expense increased by $1.7 million, from $0.7 million during the year ended December 31, 2015, to $2.3 million during the year ended December 31, 2016. The increase was primarily due to the increase in our outstanding debt balance during 2016 and amortization of debt discounts.
Other Income (Expense), Net
|
|
|
Year Ended December 31, |
|
Change |
|
||||||||||
|
|
|
2016 |
|
2015 |
|
Amount |
|
% |
|
||||||
|
|
|
(Dollars in thousands) |
|
||||||||||||
|
Other income (expense), net |
|
$ |
1,160 |
|
$ |
6 |
|
$ |
1,154 |
|
* |
|
|||
*Not meaningful.
Other income (expense), net increased by $1.2 million, from $6,000 during the year ended December 31, 2015 to $1.2 million during the year ended December 31, 2016. The increase was primarily due to the gain related to fair value measurement of our warrant liabilities at each balance sheet date and the fair value remeasurement of our derivative liability, which was initially recognized in the first quarter of 2016.
Comparison of the Years Ended December 31, 2015 and 2014
Revenue
|
|
|
Year Ended December 31, |
|
Change |
|
|||||||
|
|
|
2015 |
|
2014 |
|
Amount |
|
% |
|
|||
|
|
|
(Dollars in thousands) |
|
|||||||||
|
Product sales |
|
$ |
25,875 |
|
$ |
23,071 |
|
$ |
2,804 |
|
12.2 |
% |
|
Licensing and royalty revenue |
|
|
671 |
|
|
1,825 |
|
|
(1,154) |
|
(63.2) |
% |
|
Total revenue |
|
$ |
26,546 |
|
$ |
24,896 |
|
$ |
1,650 |
|
6.6 |
% |
Total revenue increased by $1.7 million, or 6.6%, from $24.9 million during the year ended December 31, 2014 to $26.5 million during the year ended December 31, 2015. The increase was attributable to increased customer adoption of discrete MRAM products, partially offset by a decrease in licensing and royalty revenue primarily related to the timing of milestone payments under existing or new licensing arrangements.
Cost of Sales and Gross Margin
|
|
|
Year Ended December 31, |
|
Change |
|
|||||||
|
|
|
2015 |
|
2014 |
|
Amount |
|
% |
|
|||
|
|
|
|
(Dollars in thousands) |
|
||||||||
|
Cost of sales |
|
$ |
12,568 |
|
$ |
11,806 |
|
$ |
762 |
|
6.5 |
% |
|
Gross margin |
|
|
52.7 |
% |
|
52.6 |
% |
|
* |
|
* |
|
*Not meaningful.
Cost of sales increased by $0.8 million, or 6.5%, from $11.8 million during the year ended December 31, 2014, to $12.6 million during the year ended December 31, 2015. The increase was primarily due to an increase in the volume of products produced and sold.
Gross margin increased from 52.6% during the year ended December 31, 2014, to 52.7% during the year ended December 31, 2015. The increase was not material in comparing the results of 2014 to 2015.
45
Operating Expenses
|
|
|
Year Ended December 31, |
|
Change |
|
|||||||
|
|
|
2015 |
|
2014 |
|
Amount |
|
% |
|
|||
|
|
|
(Dollars in thousands) |
|
|||||||||
|
Research and development |
|
$ |
21,126 |
|
$ |
12,664 |
|
$ |
8,462 |
|
66.8 |
% |
|
General and administrative |
|
|
6,565 |
|
|
7,085 |
|
|
(520) |
|
(7.3) |
% |
|
Sales and marketing |
|
|
3,823 |
|
|
3,259 |
|
|
564 |
|
17.3 |
% |
|
Total operating expenses |
|
$ |
31,514 |
|
$ |
23,008 |
|
$ |
8,506 |
|
37.0 |
% |
Research and Development. Research and development expenses increased $8.5 million, or 66.8%, from $12.7 million for the year ended December 31, 2014, to $21.1 million during the year ended December 31, 2015. The increase was primarily attributable to spending to develop ST-MRAM technology, including $5.3 million in support of the joint development agreement with GLOBALFOUNDRIES, which included a non-cash charge of $1.8 million related to the vesting of common stock issued to GLOBALFOUNDRIES, and $2.8 million of additional payroll, contract labor, and direct materials for technology, process, design and systems development.
General and Administrative. General and administrative expenses decreased $0.5 million, or 7.3%, from $7.1 million during the year ended December 31, 2014, to $6.6 million during the year ended December 31, 2015. The decrease was primarily attributable to the redeployment of existing general and administrative operations headcount to research and development functions.
Sales and Marketing. Sales and marketing expenses increased $0.6 million, or 17.3%, from $3.3 million for the year ended December 31, 2014, to $3.8 million during the year ended December 31, 2015. The increase was attributable to additional payroll expense due to increased headcount and increased commissions to sales representatives.
Interest Expense
|
|
|
Year Ended December 31, |
|
Change |
|
|||||||
|
|
|
2015 |
|
2014 |
|
Amount |
|
% |
|
|||
|
|
|
(Dollars in thousands) |
|
|||||||||
|
Interest expense |
|
$ |
653 |
|
$ |
263 |
|
$ |
390 |
|
* |
|
Interest expense increased $0.4 million from $0.3 million for the year ended December 31, 2014 to $0.7 million during the year ended December 31, 2015. The increase was attributable to the increase in our outstanding debt balance year over year.
Other Income (Expense), Net
|
|
|
Year Ended December 31, |
|
Change |
|||||||
|
|
|
2015 |
|
2014 |
|
Amount |
|
% |
|||
|
|
|
(Dollars in thousands) |
|||||||||
|
Other income (expense), net |
|
$ |
6 |
|
$ |
(2) |
|
$ |
8 |
|
* |
*Not meaningful.
Other income (expense), net was expense of $2,000 during the year ended December 31, 2014, compared to income of $6,000 during the year ended December 31, 2015. The change was primarily related to the fair value remeasurement of our warrant liabilities at each balance sheet date.
Liquidity and Capital Resources
We have generated significant losses since our inception and had an accumulated deficit of $96.4 million as of December 31, 2016. We have financed our operations primarily through the sale of our common stock in our initial public offering, (“IPO”), sales of our redeemable convertible preferred stock, debt financing and the sale of our products. As of December 31, 2016, we had $29.7 million of cash and cash equivalents, compared to $2.3 million as of December 31, 2015.
46
In October 2016 we completed our IPO in which we sold 5,000,000 shares at a price of $8.00 per share for net proceeds of $33.9 million, net of underwriting discounts and commissions, and offering costs. Concurrent with the IPO, we issued 625,000 shares of our common stock in a private placement for net proceeds of $4.7 million, after deducting the placement agent fee.
In June 2015, we refinanced our existing indebtedness and entered into a loan and security agreement with Ares Venture Finance (the 2015 Credit Facility) for a term loan of $8.0 million and a $4.0 million revolving loan, which increased our borrowing costs and extended the maturity of our debt to June 2019 for the term loan and June 2017 for the revolving loan. The facility is collateralized by substantially all of our assets and contains various covenants as described in “—Contractual Obligations—2015 Credit Facility” below. We were in compliance with the financial covenants at December 31, 2016. Our ability to access the revolving loan depends upon levels of our accounts receivable and, therefore, the full amount may not be available to us at any specific time.
We believe that our existing cash and cash equivalents as of December 31, 2016, together with the additional borrowings available under our 2015 Credit Facility, will be sufficient to meet our anticipated cash requirements through March 31, 2018. Our future capital requirements will depend on many factors, including our growth rate, the timing and extent of our spending to support research and development activities, the timing and cost of establishing additional sales and marketing capabilities, and the introduction of new products. If we need to raise additional capital to fund our operations, we may be required to seek additional equity or debt financing, and such additional financing may not be available to us on acceptable terms or at all. If we are unable to raise additional capital or generate sufficient cash from operations to adequately fund our operations, we will need to curtail planned activities to reduce costs and extend the time period over which our current resources will be able to fund operations. Doing so will likely harm our ability to execute on our business plan.
The following table summarizes our cash flows for the periods indicated:
|
|
|
Year Ended December 31, |
|||||||
|
|
|
2016 |
|
2015 |
|
2014 |
|||
|
|
|
(In thousands) |
|||||||
|
Cash used in operating activities |
|
$ |
(18,539) |
|
$ |
(10,670) |
|
$ |
(7,938) |
|
Cash used in investing activities |
|
|
(1,040) |
|
|
(1,295) |
|
|
(525) |
|
Cash provided by financing activities |
|
|
46,999 |
|
|
4,648 |
|
|
13,712 |
Cash Used in Operating Activities
During the year ended December 31, 2016, cash used in operating activities was $18.5 million, which consisted of a net loss of $16.7 million, adjusted by non-cash charges of $3.0 million and a change of $4.8 million in our net operating assets and liabilities. The non-cash charges primarily consisted of non-cash interest expense of $1.2 million, stock-based compensation of $1.1 million, compensation expense related to vesting of common stock issued to GLOBALFOUNDRIES under our joint development agreement of $1.0 million, and depreciation and amortization of $0.8 million partially offset by a change from the remeasurement to fair value of our warrant and derivative liabilities of $1.2 million. The change in our net operating assets and liabilities was primarily due to payments of $2.5 million associated with the joint development agreement, an increase in inventory of $0.9 million to meet demands of future sales and growing backlog, an increase of $1.3 million in accounts receivable due to the timing of cash receipts for outstanding balances, and an increase in prepaid and other current assets of $0.9 million for advances made for the purchase of wafers. These were partially offset by an increase in accounts payable of $0.4 million due to the timing of payments.
During the year ended December 31, 2015, cash used in operating activities was $10.7 million, which consisted of a net loss of $18.2 million, adjusted by non-cash charges of $3.7 million and a change of $3.8 million in our net operating assets and liabilities. The non-cash charges primarily consisted of compensation expense related to vesting of common stock issued to GLOBALFOUNDRIES under our joint development agreement of $1.8 million, depreciation and amortization of $1.3 million, stock-based compensation of $0.4 million and non-cash interest expense of $0.2 million. The change in our net operating assets and liabilities was primarily due to $3.3 million in accrued expenses associated with the joint development agreement.
47
During the year ended December 31, 2014, cash used in operating activities was $7.9 million, which consisted of a net loss of $10.2 million, adjusted by non-cash charges of $2.5 million and a change of $0.3 million in our net operating assets and liabilities. The non-cash charges primarily consisted of depreciation and amortization of $1.5 million, stock-based compensation of $0.8 million, compensation expense related to vesting of common stock issued to GLOBALFOUNDRIES of $0.1 million and non-cash interest expense of $0.1 million. The change in our net operating assets and liabilities was primarily due to an increase in trade and related parties receivables resulting from an increase in our revenue in 2014.
Cash Used in Investing Activities
Cash used in investing activities during the years ended December 31, 2016, 2015, and 2014 was $1.0 million, $1.3 million, and $0.5 million, respectively, which consisted of capital expenditures primarily for the purchase of manufacturing equipment, and purchased software.
Cash Provided by Financing Activities
During the year ended December 31, 2016, cash provided by financing activities was $47.0 million consisting of $38.5 million of net proceeds from our IPO and concurrent private placement, and $10.0 million from borrowings under our long-term debt facility, partially offset by $1.5 million in payments on long-term debt and capital lease obligations.
During the year ended December 31, 2015, cash provided by financing activities was $4.6 million consisting of proceeds of $8.0 million from borrowings under our long-term debt facility partially offset by $3.2 million in payments on long-term debt and capital lease obligations.
During the year ended December 31, 2014, cash provided by financing activities was $13.7 million consisting primarily of net proceeds of $10.0 million from the issuance of redeemable convertible preferred stock and proceeds of $4.0 million from borrowing under our debt facility.
Off-Balance Sheet Arrangements
We have not entered into any off-balance sheet arrangements and do not have any holdings in variable interest entities.
Contractual Obligations
The following table summarizes our contractual obligations as of December 31, 2016 (in thousands):
|
|
|
Payments Due by Period |
|||||||||||||
|
|
|
Less Than |
|
1 to 3 |
|
3 to 5 |
|
More Than |
|
|
|
||||
|
|
|
1 Year |
|
Years |
|
Years |
|
5 Years |
|
Total |
|||||
|
|
|
(In thousands) |
|||||||||||||
|
Long-term debt, current and non-current, including interest(1) |
|
$ |
4,611 |
|
$ |
4,580 |
|
$ |
— |
|
$ |
— |
|
$ |
9,191 |
|
Capital lease obligation |
|
|
7 |
|
|
— |
|
|
— |
|
|
— |
|
|
7 |
|
Operating leases |
|
|
1,511 |
|
|
2,897 |
|
|
933 |
|
|
— |
|
|
5,341 |
|
|
|
$ |
6,129 |
|
$ |
7,477 |
|
$ |
933 |
|
$ |
— |
|
$ |
14,539 |
|
(1) |
The interest charges have been calculated using a rate of 8.75%, which was the rate in effect for 2016. The debt bears interest at a variable rate and interest charges in future periods may be higher. |
2015 Credit Facility
In June 2015, we entered into a loan and security agreement with Ares Venture Finance for a term loan of $8.0 million and a $4.0 million revolving loan for working capital purposes and to repay our existing debt to another lender. The term loan bears interest at a floating rate equal to the greater of (i) 8.75% or (ii) LIBOR plus 7.75%, and matures in June 2019. The revolving loan bears interest at a floating rate equal to the prime rate plus 3.75% and matures on June 5, 2017. The outstanding balance on our revolving loan is limited to the lesser of $4.0 million or 85% of the outstanding balance of our receivables. Our obligations under the 2015 Credit Facility are secured by substantially all of our assets.
48
The 2015 Credit Facility contains customary covenants restricting our activities, including limitations on our ability to sell assets, engage in mergers and acquisitions, enter into transactions involving related parties, incur indebtedness or grant liens or negative pledges on our assets, make loans or make other investments. Under these covenants, we are prohibited from paying dividends with respect to our capital stock. We were in compliance with all covenants at December 31, 2016.
Critical Accounting Policies and Estimates
Our financial statements and related notes have been prepared in accordance with generally accepted accounting principles in the United States, or U.S. GAAP. The preparation of these financial statements requires our management to make judgments and estimates that affect the reported amounts of assets and liabilities and the disclosure of contingent assets and liabilities at the date of the financial statements, as well as the reported revenue generated and expenses incurred during the reporting periods. Our estimates are based on our historical experience and on various other factors that we believe are reasonable under the circumstances, the results of which form the basis for making judgments about the carrying value of assets and liabilities that are not readily apparent from other sources. Actual results may differ from these judgments and estimates under different assumptions or conditions and any such differences may be material. We believe that the accounting policies discussed below are critical to understanding our historical and future performance, as these policies relate to the more significant areas involving management’s judgments and estimates.
Revenue Recognition—Distributors
We sell the majority of our products to our distributors at a uniform list price. Price protection rights grant distributors the right to a credit in the event of declines in the price of our products. Distributors are provided with price concessions subsequent to delivery of product to them depending on their end customer and sales price. These concessions are based on a variety of factors, including customer, product, quantity, geography and competitive differentiation. We defer revenue on shipments to distributors as the price is not fixed or determinable until delivery has been made by the distributor to its customer and the final sales price has been established. At the time of shipment to distributors, we record a trade receivable for the selling price as there is a legally enforceable obligation of the distributor to pay for the product delivered, we relieve inventory for the carrying value of goods shipped, and the net of these amounts, the gross profit, we record as deferred income on shipments to distributors on the balance sheet. The amount of gross profit that will be ultimately recognized in our statements of operations on such sales could be lower than the deferred income recorded on our balance sheet as a result of (a) credits granted to distributors on specifically identified products and customers to allow the distributors to earn a competitive gross profit on the sale of our products to the end customer and (b) price protection concessions related to market pricing conditions. We are unable to estimate the credits to the distributors due to the wide variability of negotiated price concessions granted to them. Therefore, we record the price concessions against deferred income at the time the distributor sells the product to its customers. The recognition of revenue from deferred income on shipments to distributors is ultimately contingent upon delivery of product to the distributor’s customer, at which point the price is fixed or determinable.
At December 31, 2016, we had $2.9 million of deferred revenue and $1.1 million of deferred cost of sales, resulting in the recognition of $1.8 million of deferred income on shipments to distributors. At December 31, 2015, we had $2.6 million of deferred revenue and $1.2 million of deferred cost of sales, resulting in the recognition of $1.4 million of deferred income on shipments to distributors.
Products returned by distributors and subsequently scrapped have historically been immaterial to our results of operations. We routinely evaluate the risk of impairment of the deferred cost of sales component of deferred income on shipments to distributors. Because of the historically immaterial amounts of inventory that have been scrapped, and historically rare instances where discounts given to a distributor result in a price less than our cost, we believe the deferred costs are recorded at their approximate carrying values.
Inventory
We record inventories at the lower of cost, determined on a first-in, first-out basis or specific identification method, or market. We routinely evaluate quantities and values of inventory on hand and inventory that may be returned from distributors in light of current market conditions and market trends, and record provisions for inventories in excess of demand and subject to obsolescence. This evaluation may take into consideration expected demand, the effect new products may have on the sale of existing products, technological obsolescence and other factors. We record inventory
49
write-downs for the valuation of inventory when required based on the analysis of the information immediately above and inventory balances are not readjusted until sold. Unanticipated changes in technology or customer demand could result in a decrease in demand for our products, which may require additional inventory write-downs that could materially affect our results of operations.
Derivative Liability
Our convertible promissory notes payable contained certain redemption features that meet the definition of a derivative. We estimated the fair value of the derivative liability using a with-and without-model and the probability-weighted expected return method, which estimates a discounted value based upon an analysis of various future outcomes. The with-and without-model calculates the value of our convertible debt with features being evaluated for separate accounting, and an identical instrument without those features. The outcomes of each scenario in the probability-weighted expected return method are based on a market multiple approach. The derivative liability is subject to re-measurement at each balance sheet date and the change in fair value, if any, was recognized as other income (expense), net in the statements of operations. We adjusted the liability for changes in fair value until the completion of our IPO in October 2016 at which time the convertible promissory notes payable were converted into shares of our common stock.
Stock-based Compensation
We recognize compensation costs related to stock options granted to employees and directors based on the estimated fair value of the awards on the date of grant, net of estimated forfeitures. We estimate the grant date fair value and the resulting stock-based compensation expense using the Black-Scholes option-pricing model. We expense the grant date fair value of stock-based awards on a straight-line basis over the period during which the employee is required to provide service in exchange for the award (generally the vesting period).
We estimate the fair value of our stock-based awards using the Black-Scholes option-pricing model, which requires the input of highly subjective assumptions. Our assumptions are as follows:
Expected Term. The expected term represents the period we expect the stock-based awards to be outstanding. We use the simplified method to determine the expected term, which is calculated as the average of the time to vesting and the contractual life of the options.
Expected Volatility. Since we do not have a long trading history for our common stock, we derive the expected volatility from the average historical volatilities of publicly traded companies within our industry that we consider to be comparable to our business over a period approximately equal to the expected term for employees’ options and the remaining contractual life for non-employees’ options. We will continue to apply this process until a sufficient amount of historical information regarding the volatility of our own stock price becomes available.
Risk-free Interest Rate. We base the risk-free interest rate on the U.S. Treasury yield with a maturity equal to the expected term of the option in effect at the time of grant.
Dividend Yield. We assume the expected dividend to be zero as we have never paid dividends and have no current plans to pay any dividends on our common stock.
In addition to the assumptions used in the Black-Scholes option-pricing model, we also estimate a forfeiture rate to calculate the stock-based compensation for our equity awards. We will continue to use judgment in evaluating the expected volatility, expected terms and forfeiture rates utilized for our stock-based compensation calculations on a prospective basis.
We recorded stock-based compensation expense of $1.1 million, $0.4 million, and $0.8 million, for the years ended December 31, 2016, 2015, and 2014, respectively.
Historically, for all periods prior to the IPO, the fair value of the shares of common stock underlying our stock-based awards was estimated on each grant date by our board of directors. In order to determine the fair value of our common stock underlying option grants, our board of directors considered, among other things, contemporaneous valuations of our common stock prepared by an unrelated third-party valuation firm in accordance with the guidance provided by the American Institute of Certified Public Accountants Practice Guide, Valuation of Privately-Held-Company Equity Securities Issued as Compensation. Given the absence of a public trading market for our common
50
stock, our board of directors exercised reasonable judgment and considered a number of objective and subjective factors to determine the best estimate of the fair value of our common stock, including: the rights, preferences and privileges of our preferred stock relative to those of our common stock; our operating results and financial condition; our levels of available capital resources; equity market conditions affecting comparable public companies; general U.S. market conditions; and the lack of marketability of our common stock.
After the completion of the IPO, our board of directors determined the fair value of each share of underlying common stock based on the closing price of our common stock as reported on the date of grant.
JOBS Act Accounting Election
We are an “emerging growth company” as defined in the Jumpstart Our Business Startups Act, or the JOBS Act, and therefore we may take advantage of certain exemptions from various public company reporting requirements, including not being required to have our internal control over financial reporting audited by our independent registered public accounting firm pursuant to Section 404 of the Sarbanes-Oxley Act of 2002, or the Sarbanes-Oxley Act, reduced disclosure obligations regarding executive compensation in our periodic reports and proxy statements and exemptions from the requirements of holding a nonbinding advisory vote on executive compensation and any golden parachute payments. We may take advantage of these exemptions until we are no longer an “emerging growth company.” We may remain an “emerging growth company” for up to five years. We will cease to be an “emerging growth company” upon the earliest of: (1) December 31, 2021, (2) the last day of the first fiscal year in which our annual gross revenues are $1.0 billion or more, (3) the date on which we have, during the previous rolling three-year period, issued more than $1.0 billion in non-convertible debt securities, and (4) the date on which we are deemed to be a “large accelerated filer” as defined in the Securities Exchange Act of 1934, as amended, or the Exchange Act. We have chosen to irrevocably opt out of the extended transition periods available under the JOBS Act for complying with new or revised accounting standards.
Recent Accounting Pronouncements
In May 2014, the Financial Accounting Standards Board (FASB) issued Accounting Standards Update (ASU) No. 2014‑09, Revenue from Contracts with Customers. Areas of revenue recognition that will be affected include, but are not limited to, transfer of control, variable consideration, allocation of transfer pricing, licenses, time value of money, contract costs and disclosures. The new standard permits adoption either by using (i) a full retrospective approach for all periods presented in the period of adoption or (ii) a modified retrospective approach with the cumulative effect of initially applying the new standard recognized at the date of initial application and providing certain additional disclosures. The new standard is effective for annual reporting periods beginning after December 15, 2017, with early adoption permitted for annual reporting periods beginning after December 15, 2016. As described in our significant accounting policies, we currently defer the revenue and cost of sales on shipments to distributors until the distributor sells the product to their end customer. Upon adoption of ASU 2014-09, and subsequent improvements including ASU 2015-14, Deferral of Effective Date, ASU 2016-08, Principal versus Agent Considerations, ASU 2016-10, Identifying Performance Obligations and Licensing, and ASU 2016-12, Narrow Scope Improvements and Practical Expedients, we will no longer defer revenue until sale by the distributor to the end customer, but rather, we will be required to estimate the effects of returns and allowances provided to distributors and record revenue at the time of sale to the distributor. We plan on adopting this standard on January 1, 2018 and are currently evaluating the impact that the adoption of the standard will have on our financial statements. We have not yet elected a transition method.
In July 2015, the FASB issued ASU No. 2015‑11, Simplifying the Measurement of Inventory, which requires an entity to measure in scope inventory at the lower of cost and net realizable value. Net realizable value is the estimated selling price in the ordinary course of business, less reasonably predictable costs of completion, disposal and transportation. This ASU is effective for fiscal years and interim periods within those years beginning after December 15, 2016. We do not expect the adoption of this ASU to have a material impact on our financial statements and related disclosures.
In November 2015, FASB issued ASU No. 2015‑17, Balance Sheet Classification of Deferred Taxes, which is intended to simplify and improve how deferred taxes are classified on the balance sheet. The guidance in this ASU eliminates the current requirement to present deferred tax assets and liabilities as current and noncurrent in a classified balance sheet and now requires entities to classify all deferred tax assets and liabilities as noncurrent. The guidance is effective for annual periods beginning after December 15, 2016, and for interim periods within those annual periods.
51
Early adoption is permitted. We do not expect the adoption of this standard to have a material impact on our financial statements and related disclosures.
In February 2016, the FASB issued ASU No. 2016‑02, Leases, which establishes a comprehensive new lease accounting model. The new standard: (a) clarifies the definition of a lease; (b) requires a dual approach to lease classification similar to current lease classifications; and (c) causes lessees to recognize leases on the balance sheet as a lease liability with a corresponding right-of-use asset for leases with a lease-term of more than twelve months. This ASU is effective for fiscal years and interim periods within those years beginning after December 15, 2018. We are currently evaluating the impact that the adoption of ASU 2016‑02 will have on our financial statements and related disclosures.
In March 2016, the FASB issued ASU No. 2016‑09, Compensation-Stock Compensation (Topic 718) Improvements to Employee Share-Based Payment Accounting, which is intended to simplify several aspects of the accounting for employee share-based payment transactions, including the income tax consequences, the determination of forfeiture rates, classification of awards as either equity or liabilities, and classification on the statement of cash flows. This ASU is effective for fiscal years and interim periods within those years beginning after December 15, 2016, and early adoption is permitted. We are currently evaluating the impact that the adoption of ASU 2016‑09 will have on our financial statements and related disclosures.
In June 2016, the FASB issued ASU No. 2016‑13, Financial Instruments – Credit Losses (Topic 326), which is intended to provide financial statement users with more useful information about expected credit losses on financial assets held by a reporting entity at each reporting date. The new standard replaces the existing incurred loss impairment methodology with a methodology that requires consideration of a broader range of reasonable and supportable forward-looking information to estimate all expected credit losses. The amended guidance is effective for fiscal years and interim periods within those years beginning after December 15, 2019, and early adoption is permitted. We are currently evaluating the impact that the adoption of ASU 2016‑13 will have on our financial statements and related disclosures.
In August 2016, the FASB issued ASU No. 2016-15, Statement of Cash Flows (Topic 230): Classification of Certain Cash Receipts and Cash Payments. ASU 2016-15 identifies how certain cash receipts and cash payments are presented and classified in the Statement of Cash Flows. The standard is effective for fiscal years and interim periods beginning after December 15, 2017. The standard should be applied retrospectively and early adoption is permitted, including adoption in an interim period. We are currently in the process of evaluating the impact that the standard will have on our financial statements and related disclosures.
Item 7A. Quantitative and Qualitative Disclosures About Market Risk.
We are exposed to market risks in the ordinary course of our business, including the effects of interest rate changes and foreign currency fluctuations. Information relating to quantitative and qualitative disclosures about these markets risks is described below.
Interest Rate Risk
We are primarily exposed to interest rate risk from variable rate borrowings under our 2015 Credit Facility, and to a lesser extent, from our cash position. We do not enter into investments for trading or speculative purposes and have not used any derivative financial instruments to manage our interest rate risk exposure. We have not been exposed to, nor do we anticipate being exposed to, material risks due to changes in interest rates. A hypothetical 10% increase in our borrowing rates would not have a material impact on interest expense on our principal balances as of December 31, 2016 and 2015.
Foreign Currency Risk
Our results of operations and cash flows are subject to fluctuations due to changes in foreign currency exchange rates. Substantially all of our revenue is denominated in United States dollars. Our expenses are generally denominated in United States dollars; however, we do incur expenses in the currencies of our subcontracted manufacturing suppliers, which are located in Europe and in Asia. Our results of operations and cash flows are, therefore, subject to fluctuations due to changes in foreign currency exchange rates and may be adversely affected in the future due to changes in foreign exchange rates. The effect of a hypothetical 10% change in foreign currency exchanges rates applicable to our business would not have a material impact on our historical financial statements.
52
We have not hedged exposures denominated in foreign currencies or used any other derivative financial instruments. Although we transact the substantial majority of our business in U.S. dollars, future fluctuations in the value of the U.S. dollar may affect the competitiveness of our products and thus may impact our results of operations and cash flows.
53
Item 8. Financial Statements and Supplementary Data.
EVERSPIN TECHNOLOGIES, INC
INDEX TO FINANCIAL STATEMENTS
|
|
Page |
| 55 | |
|
Financial Statements: |
|
| 56 | |
| 57 | |
|
Statements of Redeemable Convertible Preferred Stock and Stockholders’ Equity (Deficit) |
58 |
| 59 | |
| 60 |
54
REPORT OF INDEPENDENT REGISTERED PUBLIC ACCOUNTING FIRM
To the Board of Directors and Stockholders of
Everspin Technologies, Inc.
We have audited the accompanying balance sheets of Everspin Technologies, Inc. as of December 31, 2016 and 2015, and the related statements of operations and comprehensive loss, redeemable convertible preferred stock and stockholders’ equity (deficit) and cash flows for each of the three years in the period ended December 31, 2016. These financial statements are the responsibility of the Company’s management. Our responsibility is to express an opinion on these financial statements based on our audits.
We conducted our audits in accordance with the standards of the Public Company Accounting Oversight Board (United States). Those standards require that we plan and perform the audit to obtain reasonable assurance about whether the financial statements are free of material misstatement. We were not engaged to perform an audit of the Company’s internal control over financial reporting. Our audits included consideration of internal control over financial reporting as a basis for designing audit procedures that are appropriate in the circumstances, but not for the purpose of expressing an opinion on the effectiveness of the Company’s internal control over financial reporting. Accordingly, we express no such opinion. An audit also includes examining, on a test basis, evidence supporting the amounts and disclosures in the financial statements, assessing the accounting principles used and significant estimates made by management, and evaluating the overall financial statement presentation. We believe that our audits provide a reasonable basis for our opinion.
In our opinion, the financial statements referred to above present fairly, in all material respects, the financial position of Everspin Technologies, Inc. as of December 31, 2016 and 2015, and the results of its operations and its cash flows for each of the three years in the period ended December 31, 2016, in conformity with U.S. generally accounting principles.
/s/ ERNST & YOUNG LLP
Phoenix, Arizona
March 29, 2017
55
EVERSPIN TECHNOLOGIES, INC.
(In thousands, except share and per share amounts)
|
|
|
December 31, |
||||
|
|
|
2016 |
|
2015 |
||
|
Assets |
|
|
|
|
|
|
|
Current assets: |
|
|
|
|
|
|
|
Cash and cash equivalents |
|
$ |
29,727 |
|
$ |
2,307 |
|
Accounts receivable, net |
|
|
3,170 |
|
|
1,909 |
|
Amounts due from related parties |
|
|
486 |
|
|
564 |
|
Inventory |
|
|
5,069 |
|
|
4,176 |
|
Prepaid expenses and other current assets |
|
|
1,050 |
|
|
190 |
|
Total current assets |
|
|
39,502 |
|
|
9,146 |
|
Property and equipment, net |
|
|
1,920 |
|
|
1,654 |
|
Intangible assets, net |
|
|
— |
|
|
132 |
|
Other assets |
|
|
50 |
|
|
29 |
|
Total assets |
|
$ |
41,472 |
|
$ |
10,961 |
|
|
|
|
|
|
|
|
|
Liabilities, Redeemable Convertible Preferred Stock and Stockholders’ Equity (Deficit) |
|
|
|
|
|
|
|
Current liabilities: |
|
|
|
|
|
|
|
Accounts payable |
|
$ |
1,502 |
|
$ |
1,162 |
|
Accrued liabilities |
|
|
1,811 |
|
|
1,755 |
|
Amounts due to related parties |
|
|
1,359 |
|
|
3,812 |
|
Deferred income on shipments to distributors |
|
|
1,827 |
|
|
1,440 |
|
Current portion of long-term debt |
|
|
3,884 |
|
|
1,175 |
|
Total current liabilities |
|
|
10,383 |
|
|
9,344 |
|
Redeemable convertible preferred stock warrant liability |
|
|
— |
|
|
437 |
|
Deferred revenue |
|
|
— |
|
|
229 |
|
Long-term debt, net of current portion |
|
|
4,218 |
|
|
6,739 |
|
Total liabilities |
|
|
14,601 |
|
|
16,749 |
|
Commitments and contingencies |
|
|
|
|
|
|
|
Redeemable convertible preferred stock, $0.0001 par value per share; zero and 68,080,000 shares authorized as of December 31, 2016 and 2015; zero and 2,486,199 shares issued and outstanding as of December 31, 2016 and 2015 |
|
|
— |
|
|
64,642 |
|
Stockholders’ equity (deficit): |
|
|
|
|
|
|
|
Preferred stock, $0.0001 par value per share; 5,000,000 and zero shares authorized as of December 31, 2016 and 2015; zero shares issued and outstanding as of December 31, 2016 and 2015 |
|
|
— |
|
|
— |
|
Common stock, $0.0001 par value per share; 100,000,000 and 175,000,000 shares authorized as of December 31, 2016 and 2015; 12,498,128 and 3,015,281 shares issued and outstanding as of December 31, 2016 and 2015 |
|
|
1 |
|
|
— |
|
Additional paid-in capital |
|
|
123,309 |
|
|
9,301 |
|
Accumulated deficit |
|
|
(96,439) |
|
|
(79,731) |
|
Total stockholders’ equity (deficit) |
|
|
26,871 |
|
|
(70,430) |
|
Total liabilities, redeemable convertible preferred stock and stockholders’ equity (deficit) |
|
$ |
41,472 |
|
$ |
10,961 |
The accompanying notes are an integral part of these financial statements.
56
EVERSPIN TECHNOLOGIES, INC.
Statements of Operations and Comprehensive Loss
(In thousands, except share and per share amounts)
|
|
|
Year Ended December 31, |
|||||||
|
|
|
2016 |
|
2015 |
|
2014 |
|||
|
Product sales (including related party sales of $2,378, $3,472 and $3,191 for the years ended December 31, 2016, 2015 and 2014) |
|
$ |
26,611 |
|
$ |
25,875 |
|
$ |
23,071 |
|
Licensing and royalty revenue |
|
|
483 |
|
|
671 |
|
|
1,825 |
|
Total revenue |
|
|
27,094 |
|
|
26,546 |
|
|
24,896 |
|
Cost of sales |
|
|
12,395 |
|
|
12,568 |
|
|
11,806 |
|
Gross profit |
|
|
14,699 |
|
|
13,978 |
|
|
13,090 |
|
Operating expenses: |
|
|
|
|
|
|
|
|
|
|
Research and development |
|
|
19,233 |
|
|
21,126 |
|
|
12,664 |
|
General and administrative |
|
|
7,281 |
|
|
6,565 |
|
|
7,085 |
|
Sales and marketing |
|
|
3,706 |
|
|
3,823 |
|
|
3,259 |
|
Total operating expenses |
|
|
30,220 |
|
|
31,514 |
|
|
23,008 |
|
Loss from operations |
|
|
(15,521) |
|
|
(17,536) |
|
|
(9,918) |
|
Interest expense |
|
|
(2,347) |
|
|
(653) |
|
|
(263) |
|
Other income (expense), net |
|
|
1,160 |
|
|
6 |
|
|
(2) |
|
Net loss and comprehensive loss |
|
$ |
(16,708) |
|
$ |
(18,183) |
|
$ |
(10,183) |
|
Net loss per common share, basic and diluted |
|
$ |
(3.53) |
|
$ |
(7.12) |
|
$ |
(4.00) |
|
Weighted-average shares used to compute net loss per common share, basic and diluted |
|
|
4,738,496 |
|
|
2,552,205 |
|
|
2,544,578 |
The accompanying notes are an integral part of these financial statements.
57
EVERSPIN TECHNOLOGIES, INC
Statements of Redeemable Convertible Preferred Stock and Stockholders’ Equity (Deficit)
(In thousands, except share amounts)
|
|
|
Redeemable |
|
|
|
|
|
|
|
Additional |
|
|
|
|
Total |
|||||
|
|
|
Convertible Preferred Stock |
|
|
Common Stock |
|
Paid-In |
|
Accumulated |
|
Stockholders’ |
|||||||||
|
|
|
Shares |
|
Amount |
|
|
Shares |
|
Amount |
|
Capital |
|
Deficit |
|
Equity (Deficit) |
|||||
|
Balance at December 31, 2013 |
|
2,023,040 |
|
$ |
52,599 |
|
|
2,542,337 |
|
$ |
— |
|
$ |
6,172 |
|
$ |
(51,365) |
|
$ |
(45,193) |
|
Issuance of Series B redeemable convertible stock |
|
385,641 |
|
|
10,027 |
|
|
— |
|
|
— |
|
|
— |
|
|
— |
|
|
— |
|
Conversion of convertible promissory notes |
|
77,518 |
|
|
2,016 |
|
|
— |
|
|
— |
|
|
— |
|
|
— |
|
|
— |
|
Issuance of shares to GLOBALFOUNDRIES subject to vesting provisions |
|
— |
|
|
— |
|
|
461,538 |
|
|
— |
|
|
1 |
|
|
— |
|
|
1 |
|
Issuance of common stock upon exercise of stock options |
|
— |
|
|
— |
|
|
9,848 |
|
|
— |
|
|
41 |
|
|
— |
|
|
41 |
|
Compensation expense related to vesting of common stock issued to GLOBALFOUNDRIES |
|
— |
|
|
— |
|
|
— |
|
|
— |
|
|
107 |
|
|
— |
|
|
107 |
|
Stock-based compensation expense |
|
— |
|
|
— |
|
|
— |
|
|
— |
|
|
799 |
|
|
— |
|
|
799 |
|
Net loss |
|
— |
|
|
— |
|
|
— |
|
|
— |
|
|
— |
|
|
(10,183) |
|
|
(10,183) |
|
Balance at December 31, 2014 |
|
2,486,199 |
|
|
64,642 |
|
|
3,013,723 |
|
|
— |
|
|
7,120 |
|
|
(61,548) |
|
|
(54,428) |
|
Issuance of common stock upon exercise of stock options |
|
— |
|
|
— |
|
|
1,558 |
|
|
— |
|
|
4 |
|
|
— |
|
|
4 |
|
Compensation expense related to vesting of common stock issued to GLOBALFOUNDRIES |
|
— |
|
|
— |
|
|
— |
|
|
— |
|
|
1,761 |
|
|
— |
|
|
1,761 |
|
Stock-based compensation expense |
|
— |
|
|
— |
|
|
— |
|
|
— |
|
|
416 |
|
|
— |
|
|
416 |
|
Net loss |
|
— |
|
|
— |
|
|
— |
|
|
— |
|
|
— |
|
|
(18,183) |
|
|
(18,183) |
|
Balance at December 31, 2015 |
|
2,486,199 |
|
|
64,642 |
|
|
3,015,281 |
|
|
— |
|
|
9,301 |
|
|
(79,731) |
|
|
(70,430) |
|
Conversion of redeemable convertible preferred stock to common stock |
|
(2,486,199) |
|
|
(64,642) |
|
|
2,486,199 |
|
|
— |
|
|
64,642 |
|
|
— |
|
|
64,642 |
|
Conversion of convertible promissory notes to common stock |
|
— |
|
|
— |
|
|
1,361,009 |
|
|
— |
|
|
8,634 |
|
|
— |
|
|
8,634 |
|
Reclassification of redeemable convertible preferred stock warrant liability to additional paid in capital |
|
— |
|
|
— |
|
|
— |
|
|
— |
|
|
65 |
|
|
— |
|
|
65 |
|
Issuance of common stock in initial public offering |
|
— |
|
|
— |
|
|
5,000,000 |
|
|
1 |
|
|
33,863 |
|
|
— |
|
|
33,864 |
|
Issuance of common stock in private placement |
|
— |
|
|
— |
|
|
625,000 |
|
|
— |
|
|
4,650 |
|
|
— |
|
|
4,650 |
|
Issuance of common stock upon exercise of stock options |
|
— |
|
|
— |
|
|
10,639 |
|
|
— |
|
|
48 |
|
|
— |
|
|
48 |
|
Compensation expense related to vesting of common stock issued to GLOBALFOUNDRIES |
|
— |
|
|
— |
|
|
— |
|
|
— |
|
|
965 |
|
|
— |
|
|
965 |
|
Stock-based compensation expense |
|
— |
|
|
— |
|
|
— |
|
|
— |
|
|
1,141 |
|
|
— |
|
|
1,141 |
|
Net loss |
|
— |
|
|
— |
|
|
— |
|
|
— |
|
|
— |
|
|
(16,708) |
|
|
(16,708) |
|
Balance at December 31, 2016 |
|
— |
|
$ |
— |
|
|
12,498,128 |
|
$ |
1 |
|
$ |
123,309 |
|
$ |
(96,439) |
|
$ |
26,871 |
The accompanying notes are an integral part of these financial statements.
58
EVERSPIN TECHNOLOGIES, INC.
(In thousands)
|
|
|
Year Ended December 31, |
|||||||
|
|
|
2016 |
|
2015 |
|
2014 |
|||
|
Cash flows from operating activities |
|
|
|
|
|
|
|
|
|
|
Net loss |
|
$ |
(16,708) |
|
$ |
(18,183) |
|
$ |
(10,183) |
|
Adjustments to reconcile net loss to net cash used in operating activities: |
|
|
|
|
|
|
|
|
|
|
Depreciation and amortization |
|
|
826 |
|
|
1,340 |
|
|
1,517 |
|
Loss on disposal of property and equipment |
|
|
80 |
|
|
— |
|
|
— |
|
Stock-based compensation |
|
|
1,141 |
|
|
416 |
|
|
799 |
|
Change in fair value of redeemable convertible preferred stock warrant liability |
|
|
(372) |
|
|
(15) |
|
|
(6) |
|
Change in fair value of derivative liability |
|
|
(798) |
|
|
— |
|
|
— |
|
Non-cash interest expense |
|
|
1,183 |
|
|
232 |
|
|
98 |
|
Compensation expense related to vesting of common stock to GLOBALFOUNDRIES |
|
|
965 |
|
|
1,761 |
|
|
107 |
|
Changes in operating assets and liabilities: |
|
|
|
|
|
|
|
|
|
|
Accounts receivable |
|
|
(1,261) |
|
|
339 |
|
|
(579) |
|
Amounts due from related parties |
|
|
78 |
|
|
102 |
|
|
(455) |
|
Prepaid expenses and other current assets |
|
|
(860) |
|
|
(77) |
|
|
52 |
|
Inventory |
|
|
(893) |
|
|
(431) |
|
|
(297) |
|
Other assets |
|
|
(21) |
|
|
(10) |
|
|
63 |
|
Accounts payable |
|
|
340 |
|
|
233 |
|
|
514 |
|
Accrued liabilities |
|
|
56 |
|
|
428 |
|
|
73 |
|
Amounts due to related parties |
|
|
(2,453) |
|
|
3,328 |
|
|
(142) |
|
Deferred income on shipments to distributors |
|
|
387 |
|
|
(362) |
|
|
501 |
|
Deferred revenue |
|
|
(229) |
|
|
229 |
|
|
— |
|
Net cash used in operating activities |
|
|
(18,539) |
|
|
(10,670) |
|
|
(7,938) |
|
Cash flows from investing activities |
|
|
|
|
|
|
|
|
|
|
Purchases of property and equipment |
|
|
(1,040) |
|
|
(1,295) |
|
|
(525) |
|
Net cash used in investing activities |
|
|
(1,040) |
|
|
(1,295) |
|
|
(525) |
|
Cash flows from financing activities |
|
|
|
|
|
|
|
|
|
|
Proceeds from convertible promissory notes-related party |
|
|
8,500 |
|
|
— |
|
|
— |
|
Proceeds from debt |
|
|
1,500 |
|
|
8,000 |
|
|
4,000 |
|
Payments on debt |
|
|
(1,325) |
|
|
(3,000) |
|
|
(281) |
|
Payments of debt issuance costs |
|
|
(40) |
|
|
(130) |
|
|
(76) |
|
Payments on capital lease obligation |
|
|
(198) |
|
|
(226) |
|
|
— |
|
Proceeds from issuance of convertible preferred stock |
|
|
— |
|
|
— |
|
|
10,027 |
|
Proceeds from exercise of stock options |
|
|
48 |
|
|
4 |
|
|
41 |
|
Proceeds from issuance of common stock |
|
|
— |
|
|
— |
|
|
1 |
|
Proceeds from issuance of common stock in connection with initial public offering, net of offering costs |
|
|
33,864 |
|
|
— |
|
|
— |
|
Proceeds from issuance of common stock in private placement, net of issuance costs |
|
|
4,650 |
|
|
— |
|
|
— |
|
Net cash provided by financing activities |
|
|
46,999 |
|
|
4,648 |
|
|
13,712 |
|
Net increase (decrease) in cash and cash equivalents |
|
|
27,420 |
|
|
(7,317) |
|
|
5,249 |
|
Cash and cash equivalents at beginning of period |
|
|
2,307 |
|
|
9,624 |
|
|
4,375 |
|
Cash and cash equivalents at end of period |
|
$ |
29,727 |
|
$ |
2,307 |
|
$ |
9,624 |
|
Supplementary cash flow information: |
|
|
|
|
|
|
|
|
|
|
Interest paid |
|
$ |
806 |
|
$ |
421 |
|
$ |
165 |
|
Interest paid to related party |
|
$ |
359 |
|
$ |
— |
|
$ |
— |
|
Non-cash investing and financing activities: |
|
|
|
|
|
|
|
|
|
|
Purchase of property and equipment under capital lease obligations |
|
$ |
— |
|
$ |
431 |
|
$ |
— |
|
Conversion of convertible promissory notes into common stock |
|
$ |
8,634 |
|
$ |
— |
|
$ |
2,016 |
|
Issuance of warrants with debt |
|
$ |
— |
|
$ |
307 |
|
$ |
106 |
|
Conversion of redeemable convertible preferred stock into common stock |
|
$ |
64,642 |
|
$ |
— |
|
$ |
— |
|
Reclassification of warrant liability to additional paid-in capital |
|
$ |
65 |
|
$ |
— |
|
$ |
— |
The accompanying notes are an integral part of these financial statements.
59
EVERSPIN TECHNOLOGIES, INC
1. Organization and Operations
Everspin Technologies, Inc. (the “Company”) was incorporated in Delaware on May 16, 2008. The Company’s magnetoresistive random access memory (MRAM) solutions offer the persistence of non-volatile memory with the speed and endurance of random access memory (RAM) and enable the protection of mission critical data particularly in the event of power interruption or failure. The Company’s MRAM products allow its customers in the industrial, automotive and transportation, and enterprise storage markets to design high performance, power efficient and reliable systems without the need for bulky batteries or capacitors.
Reverse Stock Split
In September 2016, the Company effected a 1-for-26 reverse stock split of all outstanding shares of the Company’s capital stock, including common stock and redeemable convertible preferred stock. All share, option, convertible promissory notes, warrant, and per share information presented in the financial statements has been adjusted to reflect the stock split on a retroactive basis for all periods presented and all share information is rounded down to the nearest whole share after reflecting the stock split.
Initial Public Offering and Concurrent Private Placement
On October 7, 2016, the Company’s Registration Statement on Form S‑1 (File No. 333‑213569) relating to the initial public offering, (“IPO”), of its common stock was declared effective by the Securities and Exchange Commission (“SEC”). Pursuant to such Registration Statement, the Company sold 5,000,000 shares at an initial public offering price of $8.00 per share for net proceeds of $33.9 million to the Company, net of underwriting discounts and commissions, and offering costs. Concurrent with the IPO, the Company issued 625,000 shares of its common stock in a private placement for net proceeds of $4.7 million, after deducting the placement agent fee.
In connection with the IPO, the following events occurred:
|
· |
An aggregate of 2,486,199 shares of the Company’s common stock were issued to the holders of the redeemable convertible preferred stock upon the conversion of all shares of redeemable convertible preferred stock into common stock immediately prior to the closing of the IPO. |
|
· |
The outstanding balance of the convertible promissory notes payable including accrued interest was converted into 1,361,009 shares of common stock. |
|
· |
All of the outstanding redeemable convertible preferred stock warrants converted to warrants to purchase shares of common stock upon the closing of the IPO. |
Ability to continue as a going concern
The Company believes that its existing cash and cash equivalents as of December 31, 2016, together with the additional borrowings available under its credit facility, will be sufficient to meet its anticipated cash requirements through March 31, 2018. The Company’s ability to access the revolving loan under its credit facility depends upon levels of its accounts receivable and, therefore, the full amount may not be available at any specific time. The Company’s future capital requirements beyond March 2018 will depend on many factors, including its growth rate, the timing and extent of its spending to support research and development activities, the timing and cost of establishing additional sales and marketing capabilities, and the introduction of new products. The Company may be required to seek additional equity or debt financing, and such additional financing may not be available on acceptable terms or at all. If the Company is unable to raise additional capital or generate sufficient cash from operations to adequately fund its operations, it will need to curtail planned activities to reduce costs. Doing so will likely harm its ability to execute on its business plan.
60
If the Company raises additional funds through issuances of equity, convertible debt securities or other securities convertible into equity, its existing stockholders could suffer significant dilution in their percentage ownership of the Company, and any new equity securities issued could have rights, preferences and privileges senior to those of holders of common stock. If the Company is unable to obtain adequate financing or financing on satisfactory terms, when required, its ability to continue to grow or support its business and to respond to business challenges could be significantly limited.
2. Summary of Significant Accounting Policies
Use of Estimates
The accompanying financial statements have been prepared in accordance with accounting principles generally accepted in the United States of America (“U.S. GAAP”). The preparation of the financial statements in conformity with U.S. GAAP requires management to make estimates and assumptions that affect the reported amounts of assets and liabilities and disclosure of contingent assets and liabilities as of the date of the financial statements and the reported amounts of revenues and expenses during the reporting period. On an ongoing basis, management evaluates its estimates, including those related to revenue recognition, fair value of assets and liabilities, inventory, income taxes, redeemable convertible preferred stock and related warrants, common stock, and stock-based compensation. Actual results could differ from those estimates and assumptions.
Segments
The Company’s chief operating decision maker is its Chief Executive Officer. The Company operates its business as one operating segment for purposes of assessing performance and making operating decisions. All of the Company’s assets are maintained in the United States. The Company derives its revenue from domestic and international markets, based on the billing address of the customer.
Cash and Cash Equivalents
The Company considers all highly liquid, short-term investments with maturity dates of three months or less at the date of purchase to be cash equivalents. The Company’s cash equivalents consist of money market funds.
Accounts Receivable
Accounts receivable are recorded at the invoiced amount and do not bear interest. The Company generally does not require collateral or other security in support of accounts receivable. Allowances are provided for individual accounts receivable when the Company becomes aware of a customer’s inability to meet its financial obligations, such as in the case of bankruptcy, deterioration in the customer’s operating results or change in financial position. If circumstances related to customers change, estimates of the recoverability of receivables would be further adjusted. The Company also considers a number of factors in evaluating the sufficiency of its allowance for doubtful accounts, including the length of time receivables are past due, significant one-time events, creditworthiness of customers and historical experience. Account balances are charged off against the allowance after all means of collection have been exhausted and the potential for recovery is considered remote. At December 31, 2016 and 2015, there was no allowance for doubtful accounts.
The Company also establishes an allowance for product returns. The Company analyzes historical returns, current economic trends and changes in customer demand and acceptance of products when evaluating the adequacy of sales returns. As the returns are processed as credits on future purchases, the allowance is recorded against the balance of trade accounts receivable. The allowance was $188,000 and $344,000 at December 31, 2016 and 2015, respectively.
Concentration of Credit Risk
Financial instruments that potentially expose the Company to a concentration of credit risk consist principally of cash and cash equivalents that are held by a financial institution in the United States and accounts receivable. Amounts on deposit with a financial institution may at times exceed federally insured limits. The Company maintains its cash accounts with high credit quality financial institutions and accordingly, minimal credit risk exists with respect to the financial institutions.
61
Significant customers are those which represent more than 10% of the Company’s total revenue or gross accounts receivable balance at each respective balance sheet date. For the purposes of this disclosure, we define “customer” as the entity that is purchasing the products directly from the Company, which includes the distributors of our products in addition to end customers that we sell to directly. For each significant customer, revenue as a percentage of total revenue and accounts receivable as a percentage of total accounts receivable, net are as follows:
|
|
|
Revenue |
|
Accounts Receivable |
|
||||||
|
|
|
Year Ended December 31, |
|
December 31, |
|
||||||
|
Customers |
|
2016 |
|
2015 |
|
2014 |
|
2016 |
|
2015 |
|
|
Customer A |
|
22 |
% |
26 |
% |
26 |
% |
12 |
% |
28 |
% |
|
Customer B |
|
* |
|
13 |
|
13 |
|
13 |
|
23 |
|
|
Customer C |
|
* |
|
* |
|
15 |
|
* |
|
* |
|
|
Customer D |
|
* |
|
* |
|
* |
|
10 |
|
* |
|
|
Customer E |
|
12 |
|
* |
|
* |
|
18 |
|
* |
|
*Less than 10%
Inventory
Inventory is valued at the lower of cost, using the first-in, first-out or specific identification method, or market. The carrying value of inventory is adjusted for excess and obsolete inventory based on inventory age, shipment history and the forecast of demand over a specific future period. At the point of loss recognition, a new lower cost basis for that inventory is established and subsequent changes in facts and circumstances do not result in the restoration or increase in that new cost basis.
Fair Value of Financial Instruments
The Company discloses and recognizes the fair value of its assets and liabilities using a hierarchy that prioritizes the inputs to valuation techniques used to measure fair value. Fair value is defined as the price that would be received to sell an asset or paid to transfer a liability (an exit price) in an orderly transaction between market participants at the reporting date. The hierarchy gives the highest priority to valuations based upon unadjusted quoted prices in active markets for identical assets or liabilities (Level 1 measurements) and the lowest priority to valuations based upon unobservable inputs that are significant to the valuation (Level 3 measurements). The guidance establishes three levels of the fair value hierarchy as follows:
Level 1—Inputs are unadjusted quoted prices in active markets for identical assets or liabilities at the measurement date.
Level 2—Inputs (other than quoted market prices included in Level 1) are either directly or indirectly observable for the asset or liability through correlation with market data at the measurement date and for the duration of the instrument’s anticipated life.
Level 3—Inputs reflect management’s best estimate of what market participants would use in pricing the asset or liability at the measurement date. Consideration is given to the risk inherent in the valuation technique and the risk inherent in the inputs to the model.
The carrying value of accounts receivable, accounts payable, and other accruals readily convertible into cash approximate fair value because of the short-term nature of the instruments. The carrying value of the Company’s variable interest rate debt, excluding unamortized debt issuance costs, approximates fair value. The Company’s financial instruments consist of Level 1 assets and Level 3 liabilities. Where quoted prices are available in an active market, securities are classified as Level 1. Level 1 assets consist primarily of highly liquid money market funds that are included in cash equivalents. Level 3 liabilities consist of the redeemable convertible preferred stock warrant liability and derivative liability. Generally, increases or decreases in the fair value of the underlying redeemable convertible preferred stock would result in a directionally similar impact in the fair value measurement of the warrant liability.
62
The following table sets forth the fair value of the Company’s financial assets and liabilities measured at fair value on a recurring basis based on the three-tier fair value hierarchy (in thousands):
|
|
|
December 31, 2016 |
||||||||||
|
|
|
Level 1 |
|
Level 2 |
|
Level 3 |
|
|
Total |
|||
|
Assets: |
|
|
|
|
|
|
|
|
|
|
|
|
|
Money market funds |
|
$ |
29,869 |
|
$ |
— |
|
$ |
— |
|
$ |
29,869 |
|
Total assets measured at fair value |
|
$ |
29,869 |
|
$ |
— |
|
$ |
— |
|
$ |
29,869 |
|
|
|
December 31, 2015 |
||||||||||
|
|
|
Level 1 |
|
Level 2 |
|
Level 3 |
|
|
Total |
|||
|
Assets: |
|
|
|
|
|
|
|
|
|
|
|
|
|
Money market funds |
|
$ |
2,354 |
|
$ |
— |
|
$ |
— |
|
$ |
2,354 |
|
Total assets measured at fair value |
|
$ |
2,354 |
|
$ |
— |
|
$ |
— |
|
$ |
2,354 |
|
|
|
|
|
|
|
|
|
|
|
|
|
|
|
Liabilities: |
|
|
|
|
|
|
|
|
|
|
|
|
|
Redeemable convertible preferred stock warrant liability |
|
$ |
— |
|
$ |
— |
|
$ |
437 |
|
$ |
437 |
|
Total liabilities measured at fair value |
|
$ |
— |
|
$ |
— |
|
$ |
437 |
|
$ |
437 |
The following table sets forth a summary of the changes in the fair value of the redeemable convertible preferred stock warrant liability, a Level 3 financial liability, which is measured on a recurring basis (in thousands):
|
|
|
December 31, |
|||||||
|
|
|
2016 |
|
2015 |
|
2014 |
|||
|
Beginning balance |
|
$ |
437 |
|
$ |
145 |
|
$ |
45 |
|
Issuance of redeemable convertible preferred stock warrants |
|
|
— |
|
|
307 |
|
|
106 |
|
Change in fair value recorded in other income (expense), net |
|
|
(372) |
|
|
(15) |
|
|
(6) |
|
Reclassification to additional paid-in capital |
|
|
(65) |
|
|
— |
|
|
— |
|
Ending balance |
|
$ |
— |
|
$ |
437 |
|
$ |
145 |
The key assumptions used in the Black-Scholes option-pricing model for the valuation of the redeemable convertible preferred stock warrants were:
|
|
|
Year Ended December 31, |
||||||||
|
|
|
2016 |
|
2015 |
|
2014 |
|
|||
|
Expected volatility |
|
|
42.4 – 52.0 |
% |
|
43.6 – 52.9 |
% |
|
52.8 - 53.8 |
% |
|
Risk-free interest rate |
|
|
1.22 – 1.86 |
% |
|
1.76 – 2.27 |
% |
|
1.81 – 2.17 |
% |
|
Expected term (in years) |
|
|
4 – 9 |
|
|
5 – 10 |
|
|
6 – 10 |
|
|
Exercise price |
|
$ |
26.00 |
|
$ |
26.00 |
|
$ |
26.00 |
|
|
Dividend yield |
|
|
— |
% |
|
— |
% |
|
— |
% |
The following table sets forth a summary of the changes in the fair value of the derivative liability, a Level 3 financial liability, which is measured on a recurring basis (in thousands):
|
Balance at December 31, 2015 |
|
$ |
— |
|
Issuance of derivative liability |
|
|
918 |
|
Change in fair value recorded in other income (expense), net |
|
|
(798) |
|
Reclassification to additional paid-in capital |
|
|
(120) |
|
Balance at December 31, 2016 |
|
$ |
— |
The Company estimates the fair value of the derivative liability using a with- and without-model and the probability-weighted expected return method, which estimates a discounted value based upon analyses of various future outcomes, such as an equity financing with proceeds greater than $5.0 million, an IPO, a merger or sale, and staying private. The with- and without-model calculates the value of the Company’s convertible debt with the features being evaluated for separate accounting, and an identical instrument without those features. The outcomes of each scenario in the probability-weighted expected return method are based upon a market multiple approach, that involves various
63
market multiples and projected financial information, as well as option-pricing models, to reflect optionality within features of the convertible debt instrument. The change in fair value is recognized as a gain or loss in the other income (expense), net line on the statements of operations and comprehensive loss. See Note 9 for additional information regarding the derivative liability in connection with the convertible promissory notes.
Property and Equipment
Property and equipment are stated at cost, less accumulated depreciation and amortization. Depreciation begins at the time the asset is placed in service. Maintenance and repairs are charged to operations as incurred. Depreciation is computed using the straight-line method over the following estimated useful lives of the assets:
|
|
Useful Lives |
|
|
Computer and network equipment |
|
2 years |
|
Manufacturing equipment |
|
2 – 7 years |
|
Furniture and fixtures |
|
7 years |
|
Software |
|
3 years |
Leasehold improvements are amortized over the shorter of the lease term or useful life. Upon sale or retirement of assets, the cost and related accumulated depreciation are removed from the balance sheet and the resulting gain or loss is reflected in operations. Amortization expense of assets acquired through capital leases is included in the statements of operations and comprehensive loss.
Impairment of Long-lived Assets
The Company evaluates its long-lived assets, including property and equipment, for impairment whenever events or changes in circumstances indicate that the carrying value of these assets may not be recoverable. Recoverability of these assets is measured by comparison of the carrying amount of each asset to the future undiscounted cash flows the asset is expected to generate over its remaining life. If the asset is considered to be impaired, the amount of any impairment is measured as the difference between the carrying value and the fair value of the impaired asset. There have been no impairments of the Company’s long-lived assets during any of the periods presented.
Intangible Assets
Intangible assets consist of the cost of acquired technology for use in research and development activities. Costs associated with patent applications, patent prosecution, patent defense and maintenance of patents are charged to expense as incurred. Intangible assets were fully amortized as of December 31, 2016.
Redeemable Convertible Preferred Stock Warrant Liability
Warrants for shares that were contingently redeemable were classified as liabilities on the balance sheet at their estimated fair value because the shares underlying the warrants may have obligated the Company to transfer assets to the holders at a future date under certain circumstances such as a deemed liquidation event. The warrants were subject to re-measurement at each balance sheet date and the change in fair value, if any, was recognized as other income (expense), net in the statements of operations. The Company adjusted the liability for changes in fair value until the completion of the IPO in October 2016, at which time all redeemable convertible preferred stock warrants were converted into warrants to purchase common stock and the liability was reclassified to additional paid-in capital and no longer subject to remeasurement.
Revenue Recognition
The Company recognizes revenue when the following criteria are met: persuasive evidence of an arrangement exists; the price is fixed or determinable; delivery has occurred and title passed; and collectibility is reasonably assured. For sales to original equipment manufacturers (OEMs) and contract manufacturers, this occurs generally upon shipment. Provisions for product returns and allowances are recorded in the same period as related revenues. The Company analyzes historical returns, current economic trends and changes in customer demand and acceptance of product when evaluating the adequacy of sales returns and other allowances, which are netted against accounts receivable, as these are processed as credits against future purchases or balances outstanding.
64
The Company sells the majority of its products to its distributors at a uniform list price. However, distributors resell the Company’s products to end customers at a very broad range of individually negotiated price points. Distributors are provided with price concessions subsequent to delivery of product to them depending on their end customer and sales price. These concessions are based on a variety of factors, including customer, product, quantity, geography and competitive differentiation. Price protection rights grant distributors the right to a credit in the event of declines in the price of the Company’s products. Under these circumstances, the Company remits back to the distributor a portion of their original purchase price after the resale transaction is completed in the form of a credit against the distributors’ outstanding accounts receivable balance. The credits are on a per unit basis and are not given to the distributor until the distributor provides information regarding the sale to their end customer. Revenue on shipments to distributors is deferred as the price is not fixed or determinable until delivery has been made by the distributor to its customer and the final sales price has been established.
At the time of shipment to distributors, the Company records a trade receivable for the selling price as there is a legally enforceable obligation of the distributor to pay for the product delivered, inventory is reduced by the carrying value of goods shipped, and the net of these amounts, the gross profit, is recorded as deferred income on shipments to distributors on the balance sheet. The amount of gross profit that will be ultimately recognized in the statements of operations on such sales could be lower than the deferred income recorded on the balance sheets as a result of credits granted to distributors from the price protection rights. The Company is unable to estimate the credits to the distributors due to the wide variability of negotiated price concessions granted to them.
Thus, a portion of the “deferred income on shipments to distributors” balance represents the amount of distributors’ original purchase price that will be credited back to the distributor in the future. The wide range and variability of negotiated price concessions granted to distributors does not allow the Company to accurately estimate the portion of the balance in the deferred income on shipments to distributor accounts that will be credited back to the distributor. Therefore, the Company does not reduce deferred income on shipments to distributors or accounts receivable by anticipated future price concessions rather, price concessions are recorded against deferred income on shipments to distributors when incurred, which is generally at the time the distributor sells the product.
At December 31, 2016, the Company had $2.9 million of deferred revenue and $1.1 million of deferred cost of sales recognized as $1.8 million of deferred income on shipments to distributors. At December 31, 2015, the Company had $2.6 million of deferred revenue and $1.2 million of deferred cost of sales recognized as $1.4 million of deferred income on shipments to distributors.
Products returned by distributors and subsequently scrapped have historically been immaterial to the Company’s results of operations. The Company routinely evaluates the risk of impairment of the deferred cost of sales component of the deferred income on shipments to distributors account. Because of the historically immaterial amounts of inventory that have been scrapped, and historically rare instances where discounts given to a distributor result in a price less than our cost, the Company believes the deferred costs are recorded at their approximate carrying values.
For licenses of technology, recognition of revenue is dependent upon whether the Company delivered rights to the technology, and whether there are future performance obligations. In some instances, the license agreements call for future milestones to be met for amounts to be due from the customer. In such scenarios, revenue is recognized using the milestone method, whereby revenue is recognized upon the completion of substantive milestones once the customers acknowledge the milestones have been met and the collection of the amounts are reasonably assured. Royalties received are recognized when reported to the Company, which generally coincides with the receipt of payment.
Product Warranty
The Company generally sells products with a limited warranty of product quality and a limited indemnification of customers against intellectual property infringement claims related to the Company’s products. The Company accrues for known warranty and indemnification issues if a loss is probable and can be reasonably estimated, and accrues for estimated losses incurred for unidentified issues based on historical experience. A warranty liability was not recorded at December 31, 2016 and 2015, as the estimated future warranty costs were insignificant based on the Company’s historical experience.
65
Research and Development
Research and development expenses are incurred in support of internal development programs or as part of our joint development agreement with GLOBALFOUNDRIES (see Note 9). Research and development expenses include personnel-related costs (including stock-based compensation), circuit design costs, purchases of materials and laboratory supplies, fabrication and packaging of experimental integrated circuit products, depreciation of research and development related capital equipment and overhead, and are expensed as incurred.
Stock-based Compensation
The Company measures its stock-based awards made to employees based on the estimated fair value of the awards as of the grant date using the Black-Scholes option-pricing model. Stock-based compensation expense is recognized over the requisite service period using the straight-line method and is based on the value of the portion of stock-based payment awards that is ultimately expected to vest. As such, the Company’s stock-based compensation is reduced for the estimated forfeitures at the date of grant and revised, if necessary, in subsequent periods if actual forfeitures differ from those estimates.
Stock-based compensation expense for options granted to non-employees as consideration for services received is measured on the date of performance at the fair value of the consideration received or the fair value of the equity instruments issued, using the Black-Scholes option-pricing model, whichever can be more reliably measured. Compensation expense for options granted to non-employees is periodically remeasured as the underlying options vest.
Income Taxes
The Company uses the liability method of accounting for income taxes. Under this method, deferred tax assets and liabilities are determined based on the differences between the financial reporting and the tax bases of assets and liabilities and are measured using the enacted tax rates and laws that will be in effect when the differences are expected to reverse. The Company must then assess the likelihood that the resulting deferred tax assets will be realized. A valuation allowance is provided when it is more likely than not that some portion or all of a deferred tax asset will not be realized. Due to the Company’s lack of earnings history, the net deferred tax assets have been fully offset by a valuation allowance.
The Company recognizes benefits of uncertain tax positions if it is more likely than not that such positions will be sustained upon examination based solely on their technical merits, as the largest amount of benefit that is more likely than not to be realized upon the ultimate settlement. The Company’s policy is to recognize interest and penalties related to the underpayment of income taxes as a component of income tax expense or benefit. To date, there have been no interest or penalties charged in relation to the unrecognized tax benefits.
Comprehensive Loss
Comprehensive loss represents all changes in stockholders’ equity (deficit) except those resulting from and distributions to stockholders. The Company’s comprehensive loss was equal to its net loss for all periods presented.
Net Loss per Common Share
Basic net loss per common share is calculated by dividing the net loss by the weighted-average number of shares of common stock outstanding for the period less shares subject to repurchase, without consideration of potentially dilutive securities. Diluted net loss per common share is the same as basic net loss per common share since the effect of potentially dilutive securities is anti-dilutive.
66
Recent Accounting Pronouncements
In May 2014, the Financial Accounting Standards Board (FASB) issued Accounting Standards Update (ASU) No. 2014‑09, Revenue from Contracts with Customers. Areas of revenue recognition that will be affected include, but are not limited to, transfer of control, variable consideration, allocation of transfer pricing, licenses, time value of money, contract costs and disclosures. The new standard permits adoption either by using (i) a full retrospective approach for all periods presented in the period of adoption or (ii) a modified retrospective approach with the cumulative effect of initially applying the new standard recognized at the date of initial application and providing certain additional disclosures. The new standard is effective for annual reporting periods beginning after December 15, 2017, with early adoption permitted for annual reporting periods beginning after December 15, 2016. As described in the Company's significant accounting policies, the Company currently defers the revenue and cost of sales on shipments to distributors until the distributor sells the product to their end customer. Upon adoption of ASU 2014-09, and subsequent improvements including ASU 2015-14, Deferral of Effective Date, ASU 2016-08, Principal versus Agent Considerations, ASU 2016-10, Identifying Performance Obligations and Licensing, and ASU 2016-12, Narrow Scope Improvements and Practical Expedients, the Company will no longer defer revenue until sale by the distributor to the end customer, but rather, will be required to estimate the effects of returns and allowances provided to distributors and record revenue at the time of sale to the distributor. The Company plans on adopting this standard on January 1, 2018 and is currently evaluating the impact that the adoption of the standard will have on its financial statements. The Company has not yet elected a transition method.
In July 2015, the FASB issued ASU No. 2015‑11, Simplifying the Measurement of Inventory, which requires an entity to measure in scope inventory at the lower of cost and net realizable value. Net realizable value is the estimated selling price in the ordinary course of business, less reasonably predictable costs of completion, disposal and transportation. This ASU is effective for fiscal years and interim periods within those years beginning after December 15, 2016. The adoption of this standard is not expected to have a material impact on the Company’s financial statements.
In November 2015, FASB issued ASU No. 2015‑17, Balance Sheet Classification of Deferred Taxes, which is intended to simplify and improve how deferred taxes are classified on the balance sheet. The guidance in this ASU eliminates the current requirement to present deferred tax assets and liabilities as current and noncurrent in a classified balance sheet and now requires entities to classify all deferred tax assets and liabilities as noncurrent. The guidance is effective for annual periods beginning after December 15, 2016, and for interim periods within those annual periods. Early adoption is permitted. The adoption of this standard is not expected to have a material impact on the Company’s financial statements.
In February 2016, the FASB issued ASU No. 2016‑02, Leases, which establishes a comprehensive new lease accounting model. The new standard: (a) clarifies the definition of a lease; (b) requires a dual approach to lease classification similar to current lease classifications; and (c) causes lessees to recognize leases on the balance sheet as a lease liability with a corresponding right-of-use asset for leases with a lease-term of more than twelve months. This ASU is effective for fiscal years and interim periods within those years beginning after December 15, 2018. The Company is currently evaluating the impact that the adoption of ASU 2016‑02 will have on its financial statements and related disclosures.
In March 2016, the FASB issued ASU No. 2016‑09, Compensation-Stock Compensation (Topic 718) Improvements to Employee Share-Based Payment Accounting, which is intended to simplify several aspects of the accounting for employee share-based payment transactions, including the income tax consequences, the determination of forfeiture rates, classification of awards as either equity or liabilities, and classification on the statement of cash flows. This ASU is effective for fiscal years and interim periods within those years beginning after December 15, 2016, and early adoption is permitted. The Company is currently evaluating the impact that the adoption of ASU 2016‑09 will have on its financial statements and related disclosures.
In June 2016, the FASB issued ASU No. 2016‑13, Financial Instruments – Credit Losses (Topic 326), which is intended to provide financial statement users with more useful information about expected credit losses on financial assets held by a reporting entity at each reporting date. The new standard replaces the existing incurred loss impairment methodology with a methodology that requires consideration of a broader range of reasonable and supportable forward-looking information to estimate all expected credit losses. The amended guidance is effective for fiscal years and interim periods within those years beginning after December 15, 2019, and early adoption is permitted. The Company is
67
currently evaluating the impact that the adoption of ASU 2016‑13 will have on its financial statements and related disclosures.
In August 2016, the FASB issued ASU No. 2016-15, Statement of Cash Flows (Topic 230): Classification of Certain Cash Receipts and Cash Payments. ASU 2016-15 identifies how certain cash receipts and cash payments are presented and classified in the Statement of Cash Flows. The standard is effective for fiscal years and interim periods beginning after December 15, 2017. The standard should be applied retrospectively and early adoption is permitted, including adoption in an interim period. The Company is currently in the process of evaluating the impact that the standard will have on its financial statements.
3. Balance Sheet Components
Inventory
Inventory consisted of the following (in thousands):
|
|
|
December 31, |
||||
|
|
|
2016 |
|
2015 |
||
|
Raw materials |
|
$ |
853 |
|
$ |
361 |
|
Work-in-process |
|
|
3,152 |
|
|
2,205 |
|
Finished goods |
|
|
1,064 |
|
|
1,610 |
|
Total inventory |
|
$ |
5,069 |
|
$ |
4,176 |
Property and Equipment, Net
Property and equipment, net consisted of the following (in thousands):
|
|
|
December 31, |
||||
|
|
|
2016 |
|
2015 |
||
|
Manufacturing equipment |
|
$ |
8,983 |
|
$ |
8,256 |
|
Computer and network equipment |
|
|
588 |
|
|
546 |
|
Furniture and fixtures |
|
|
188 |
|
|
184 |
|
Software |
|
|
333 |
|
|
227 |
|
Leasehold improvements |
|
|
13 |
|
|
13 |
|
Total property and equipment, gross |
|
|
10,105 |
|
|
9,226 |
|
Less: accumulated depreciation |
|
|
(8,185) |
|
|
(7,572) |
|
Total property and equipment, net |
|
$ |
1,920 |
|
$ |
1,654 |
Depreciation and amortization expense during the years ended December 31, 2016, 2015 and 2014 was $0.7 million, $1.2 million and $1.3 million, respectively.
Intangible Assets, Net
In 2008, the Company spun-out of Freescale Semiconductor, Inc. (“Freescale,” a wholly-owned subsidiary of NXP Semiconductors N.V.) and acquired certain intellectual property assets and related licenses used in the MRAM business of Freescale. The value assigned to these acquired intangible assets was $910,000. Intangible assets, net consisted of the following (in thousands):
|
|
|
December 31, |
|||||
|
|
|
2016 |
|
2015 |
|||
|
Acquired technology |
|
$ |
910 |
|
$ |
910 | |
|
Less: accumulated amortization |
|
|
(910) |
|
|
(778) | |
|
Total intangible assets, net |
|
$ |
— |
|
$ |
132 | |
Amortization expense was $132,000, $150,000 and $182,000 for the years ended December 31, 2016, 2015 and 2014, respectively.
68
Accrued Liabilities
Accrued liabilities consisted of the following (in thousands):
|
|
|
December 31, |
||||
|
|
|
2016 |
|
2015 |
||
|
Accrued payroll-related expenses |
|
$ |
1,045 |
|
$ |
636 |
|
Accrued manufacturing-related costs |
|
|
— |
|
|
339 |
|
Deferred licensing revenue |
|
|
229 |
|
|
250 |
|
Deferred rent |
|
|
248 |
|
|
220 |
|
Accrued sales commissions payable to sales representatives |
|
|
193 |
|
|
165 |
|
Other |
|
|
96 |
|
|
145 |
|
Total accrued liabilities |
|
$ |
1,811 |
|
$ |
1,755 |
4. Commitments and Contingencies
Operating Leases
The Company leases office space for its corporate headquarters located in Chandler, Arizona and for its design facility located in Austin, Texas. The leases expire in October 2018 and January 2022, respectively. Rent expense is recognized on a straight-line basis over the term of the leases and accordingly, the Company records the difference between cash rent payments and the recognition of rent expense as a deferred rent liability.
The Company has an operating lease for its Arizona manufacturing facility lease, as amended, for certain of the fabrication, laboratory and office premises of Freescale, a related party. This lease is cancellable upon 24 months’ notice by either of the parties. In 2017, the Company extended the lease through January 28, 2019 and amended the premises covered to remove laboratory space, decrease fabrication space and expand office space.
The following is a schedule of minimum rental commitments under the Company’s operating leases at December 31, 2016 (in thousands):
|
Year Ending December 31, |
|
Amount |
|
|
2017 |
|
$ |
1,511 |
|
2018 |
|
|
1,525 |
|
2019 |
|
|
1,372 |
|
2020 |
|
|
709 |
|
2021 |
|
|
224 |
|
Total minimum lease payments |
|
$ |
5,341 |
Total rent expense was $1.5 million, $1.4 million and $1.3 million for the years ended December 31, 2016, 2015 and 2014, respectively.
Legal Proceedings
From time to time, the Company may become involved in legal proceedings arising from the ordinary course of its business. Management is currently not aware of any matters that will have a material adverse effect on the financial position, results of operations or cash flows of the Company.
Indemnifications
In the ordinary course of business, the Company enters into agreements that may include indemnification provisions. Pursuant to such agreements, the Company may indemnify, hold harmless and defend an indemnified party for losses suffered or incurred by the indemnified party. Some of the provisions will limit losses to those arising from third party actions. In some cases, the indemnification will continue after the termination of the agreement. The maximum potential amount of future payments the Company could be required to make under these provisions is not determinable. The Company has never incurred material costs to defend lawsuits or settle claims related to these indemnification provisions. The Company has also entered into indemnification agreements with its directors and
69
officers that may require the Company to indemnify its directors and officers against liabilities that may arise by reason of their status or service as directors or officers to the fullest extent permitted by Delaware corporate law. The Company currently has directors’ and officers’ insurance.
5. Debt and Related Warrants
Prior Facilities
In December 2010, the Company executed a Loan and Security Agreement with Silicon Valley Bank (“SVB Credit Facility”). The SVB Credit Facility included a $2.0 million term loan and a $2.0 million revolving line of credit. The term loan had a term of four years and the line of credit had a term of two years.
In connection with the SVB Credit Facility, the Company issued to Silicon Valley Bank a warrant to purchase 3,076 shares of the Company’s Series A redeemable convertible preferred stock at an exercise price of $26.00 per share. The warrant could be exercised at any time and would expire, if not exercised, on December 14, 2019. At the date of issuance, the Company recorded the warrant as a debt discount of $63,000 and as a liability on the balance sheet at its fair value. At the date of the IPO of the Company’s common stock, the warrant was converted into a warrant to purchase 3,076 shares of the Company’s common stock. The warrant was remeasured to its fair value of $1,600 and the carrying value of the warrant of $1,600 was reclassified to additional paid in capital during the year ended December 31, 2016.
In February 2014, the Company executed an Amended and Restated Loan and Security Agreement (“Amended SVB Credit Facility”). The Amended SVB Credit Facility included a $4.0 million term loan and a $4.0 million revolving line of credit. The term loan provided for interest at a floating rate equal to the greater of (a) 5% or (b) the prime rate plus 3.75%, and had a term of four years. The revolving line of credit loan provided for interest at a floating rate equal to the greater of (a) 5% or (b) the prime rate plus 1.75% and had a term of two years.
In connection with the Amended SVB Credit Facility, the Company issued to Silicon Valley Bank a warrant to purchase 6,153 shares of the Company’s Series B redeemable convertible preferred stock at an exercise price of $26.00 per share. The warrant can be exercised at any time and expires 10 years after the date of issuance. The Company recorded the warrant as a debt discount and as a liability on the balance sheet at its fair value of $106,000 on the date of issuance using the Black-Scholes option-pricing model. At the date of the IPO of the Company’s common stock, the warrant was converted into a warrant to purchase 6,153 shares of the Company’s common stock. The warrant was remeasured to its fair value of $14,900 and carrying value of the warrant of $14,900 was reclassified to additional paid in capital during the year ended December 31, 2016.
In June 2015, the outstanding principal balance on the Amended SVB Credit Facility of $2.8 million was repaid, at which time the unamortized balance of the debt discount of $114,000 and a prepayment penalty of $20,000 were recognized as interest expense.
2015 Credit Facility
In June 2015, the Company executed a Loan and Security Agreement with Ares Venture Finance (“2015 Credit Facility”) comprising an $8.0 million term loan and a $4.0 million revolving loan. The term loan provides for interest at a floating rate equal to the greater of (a) 8.75% or (b) LIBOR plus 7.75% and has a term of four years. The term loan is payable in 15 monthly installments of interest only and 33 payments of principal and interest with an end-of-term fee of $180,000 due upon maturity. The revolving loan provides for interest at a floating rate equal to the prime rate plus 3.75% and has a term of two years. The Company may draw upon the loan facility for working capital purposes as required depending upon accounts receivable balances and other required conditions. In January 2016, the Company borrowed $1.5 million from the revolving loan. A portion of the proceeds was used to pay off the outstanding balance on the Amended SVB 2014 Credit Facility.
Security for the 2015 Credit Facility includes all of the Company’s assets except for leased equipment. The 2015 Credit Facility contains customary covenants restricting the Company’s activities, including limitations on its ability to sell assets, engage in mergers and acquisitions, enter into transactions involving related parties, incur indebtedness or grant liens or negative pledges on its assets, make loans or make other investments. Under these covenants, the Company is prohibited from paying dividends with respect to its capital stock. The Company was in compliance with all covenants at December 31, 2016 and 2015.
70
In connection with the 2015 Credit Facility, the Company issued to Ares Venture Finance a warrant to purchase 18,461 shares of the Company’s Series B redeemable convertible preferred stock at an exercise price of $26.00 per share. The warrant can be exercised at any time and expires 10 years after the date of issuance. The Company recorded the warrant as a debt discount and as a liability on the balance sheet at its fair value of $307,000 on the date of issuance using the Black-Scholes option-pricing model. The fair value of the warrant was $307,000 at December 31, 2015. At the date of the IPO of the Company’s common stock, the warrant was converted into a warrant to purchase 18,461 shares of the Company’s common stock. The warrant was remeasured to its fair value of $48,900 and the carrying value of the warrant of $48,900 was reclassified to additional paid-in capital during the year ended December 31, 2016.
The carrying value of the Company’s 2015 Credit Facility at December 31, 2016, was as follows (in thousands):
|
|
|
Current |
|
Long-Term |
|
|
|
||
|
|
|
Portion |
|
debt |
|
Total |
|||
|
Debt, including end of term fee |
|
$ |
4,054 |
|
$ |
4,301 |
|
$ |
8,355 |
|
Less: |
|
|
|
|
|
|
|
|
|
|
Discount attributable to warrants, end of term fee and debt issuance costs |
|
|
(177) |
|
|
(83) |
|
|
(260) |
|
Net carrying value of debt |
|
$ |
3,877 |
|
$ |
4,218 |
|
$ |
8,095 |
The carrying value of the Company’s 2015 Credit Facility at December 31, 2015, was as follows (in thousands):
|
|
|
Current |
|
Long-Term |
|
|
|
||
|
|
|
Portion |
|
debt |
|
Total |
|||
|
Debt, including end of term fee |
|
$ |
970 |
|
$ |
7,210 |
|
$ |
8,180 |
|
Less: |
|
|
|
|
|
|
|
|
|
|
Discount attributable to warrants, end of term fee and debt issuance cost |
|
|
— |
|
|
(471) |
|
|
(471) |
|
Net carrying value of debt |
|
$ |
970 |
|
$ |
6,739 |
|
$ |
7,709 |
The table below shows the principal repayments due under the 2015 Credit Facility as of December 31, 2016 (in thousands):
|
|
|
Principal Repayment |
|
|
|
|
as of December 31, |
|
|
2017 |
|
$ |
4,054 |
|
2018 |
|
|
2,909 |
|
2019 |
|
|
1,392 |
|
Total principal repayments |
|
$ |
8,355 |
Capital Lease Obligations
The Company leases certain equipment under capital lease obligations expiring in March 2017. The balance of the capital lease obligations was $7,000 and $205,000 at December 31, 2016 and 2015, respectively.
Property and equipment under capital leases amounted to $440,000 and $431,000 at December 31, 2016 and 2015, respectively. Accumulated depreciation and amortization on these assets was $433,000 and $256,000 at December 31, 2016 and 2015, respectively.
6. Redeemable Convertible Preferred Stock and Stockholders’ Equity (Deficit)
In October 2016, the Company’s Board of Directors and stockholders approved the Certificate of Amendment of Amended and Restated Certificate of Incorporation which revised the authorized capital stock of the Company to a total of 105,000,000 shares, consisting of 100,000,000 shares of common stock, par value $0.0001, and 5,000,000 shares of preferred stock, par value $0.0001.
71
Redeemable Convertible Preferred Stock
There were no outstanding shares of redeemable convertible preferred stock at December 31, 2016 as the shares had all converted into common stock as part of the IPO in October 2016. At December 31, 2015, redeemable convertible preferred stock consisted of the following (in thousands, except share amounts):
|
|
|
|
|
Shares |
|
|
|
|
|
|
|
|
|
Shares |
|
Issued and |
|
Carrying |
|
Liquidation |
||
|
|
|
Authorized |
|
Outstanding |
|
Value |
|
Preference |
||
|
Series A |
|
35,580,000 |
|
1,365,379 |
|
$ |
35,500 |
|
$ |
35,500 |
|
Series B |
|
32,500,000 |
|
1,120,820 |
|
|
29,142 |
|
|
29,142 |
|
Total |
|
68,080,000 |
|
2,486,199 |
|
$ |
64,642 |
|
$ |
64,642 |
Classification
The Company had classified the redeemable convertible preferred stock as mezzanine equity on the balance sheet as of December 31, 2015 as the shares could have been redeemed by the Company after receipt by the Company, at any time on or after July 17, 2018, of written notice requesting redemption of such stock by the holders. The carrying values of the redeemable convertible preferred stock had been adjusted to their redemption value.
Common Stock
Common stockholders are entitled to dividends if and when declared by the board of directors subject to the prior rights of the preferred stockholders. As of December 31, 2016, no dividends on common stock had been declared by the board of directors.
The Company had reserved shares of common stock for future issuance as follows:
|
|
|
December 31, |
||
|
|
|
2016 |
|
2015 |
|
Redeemable convertible preferred stock |
|
— |
|
2,486,199 |
|
Options issued and outstanding |
|
1,414,730 |
|
927,175 |
|
Shares available for future option grants |
|
342,500 |
|
55,330 |
|
Redeemable convertible preferred stock warrants |
|
— |
|
27,690 |
|
Common stock warrants |
|
27,690 |
|
— |
|
Total |
|
1,784,920 |
|
3,496,394 |
7. Stock-Based Compensation
2016 Employee Incentive Plan
The Company’s board of directors adopted the 2016 Equity Incentive Plan (the “2016 Plan”) on April 25, 2016, which was subsequently approved on September 20, 2016 by the Company’s stockholders. The 2016 Plan became effective on October 7, 2016, the date the Company’s registration statement was declared effective by the SEC. No further grants will be made under the Company’s 2008 Equity Incentive Plan (the “2008 Plan”). However, any outstanding stock awards granted under the 2008 Plan will remain outstanding, subject to the terms of the Company’s 2008 Plan and the applicable stock award agreements, until such outstanding stock awards that are stock options are exercised or until they terminate or expire by their terms, or until such stock awards are fully settled, terminated or forfeited. At December 31, 2016, 1,257,230 options under the 2008 Plan remained outstanding.
The Company’s 2016 Plan provides for the grant of incentive stock options (“ISOs”), nonstatutory stock options, stock appreciation rights, restricted stock awards, restricted stock unit awards, performance-based stock awards, and other forms of equity compensation to employees, directors and consultants. In addition, the Company’s 2016 Plan provides for the grant of performance cash awards to employees, directors and consultants.
72
The maximum number of shares of common stock that may be issued under the Company’s 2016 Plan is 500,000. The number of shares of common stock reserved for issuance under the Company’s 2016 Plan will automatically increase on January 1 of each year, beginning on January 1, 2017, and continuing through and including January 1, 2026, by 3% of the total number of shares of capital stock outstanding on December 31 of the preceding calendar year, or a lesser number of shares determined by the Company’s board of directors. The maximum number of shares that may be issued upon the exercise of ISOs under the Company’s 2016 Plan is 500,000.
2008 Employee Incentive Plan
The 2008 Plan provides for the issuance of incentive stock options (“ISO”), nonqualified stock options, and other stock compensation awards. Under the terms of the 2008 Plan, the exercise price of an ISO shall be not less than 100% of the fair value of the stock at the date of grant, as determined by the board of directors, or in the case of certain ISOs, at 110% of the fair market value at the date of grant.
The term and vesting periods for options granted under the 2008 Plan were determined by the Company’s board of directors. Options granted generally vest over four years. Options must be exercised within a 10‑year period or sooner if so specified within the option agreement.
Summary of Stock Option Activity
The following table summarizes the stock option activity for all grants under the 2008 Plan and 2016 Plan:
|
|
|
|
|
Options Outstanding |
||||||||
|
|
|
|
|
|
|
Weighted- |
|
Weighted- |
|
|
|
|
|
|
|
|
|
|
|
Average |
|
Average |
|
|
|
|
|
|
|
Options |
|
|
|
Exercise |
|
Remaining |
|
Aggregate |
||
|
|
|
Available for |
|
Number of |
|
Price Per |
|
Contractual |
|
Intrinsic |
||
|
|
|
Grant |
|
Options |
|
Share |
|
Life (years) |
|
Value |
||
|
|
|
|
|
|
|
|
|
|
|
|
(In thousands) |
|
|
Balance—December 31, 2014 |
|
106,468 |
|
852,639 |
|
$ |
4.42 |
|
8.0 |
|
$ |
- |
|
Options authorized |
|
24,956 |
|
— |
|
|
|
|
|
|
|
|
|
Options granted |
|
(123,830) |
|
123,830 |
|
|
4.50 |
|
|
|
|
|
|
Options exercised |
|
— |
|
(1,558) |
|
|
4.42 |
|
|
|
$ |
11 |
|
Options cancelled/forfeited |
|
47,736 |
|
(47,736) |
|
|
4.42 |
|
|
|
|
|
|
Balance—December 31, 2015 |
|
55,330 |
|
927,175 |
|
|
4.43 |
|
7.3 |
|
$ |
6,500 |
|
Options authorized |
|
785,364 |
|
— |
|
|
|
|
|
|
|
|
|
Options granted |
|
(563,523) |
|
563,523 |
|
|
13.20 |
|
|
|
|
|
|
Options exercised |
|
— |
|
(10,639) |
|
|
4.43 |
|
|
|
$ |
114 |
|
Options cancelled/forfeited |
|
65,329 |
|
(65,329) |
|
|
4.71 |
|
|
|
|
|
|
Balance—December 31, 2016 |
|
342,500 |
|
1,414,730 |
|
|
5.28 |
|
7.6 |
|
$ |
4,267 |
|
Options exercisable—December 31, 2016 |
|
|
|
729,746 |
|
|
4.52 |
|
6.1 |
|
$ |
2,752 |
|
Options vested and expected to vest—December 31, 2016 |
|
|
|
1,414,732 |
|
|
5.28 |
|
7.6 |
|
$ |
4,267 |
During the years ended December 31, 2016, 2015, and, 2014, the Company granted options with a weighted-average grant date fair value of $4.52, $4.42 and $1.82 per share, respectively.
The total fair value of options vested during the year was $622,000, $353,000, and $332,000 for the years ended December 31, 2016, 2015, and, 2014, respectively.
73
2016 Employee Stock Purchase Plan
The Company’s board of directors adopted the 2016 Employee Stock Purchase Plan (the “ESPP”) on April 25, 2016, which was subsequently approved on September 20, 2016 by the Company’s stockholders. The purpose of the ESPP is to secure the services of new employees, to retain the services of existing employees and to provide incentives for such individuals to exert maximum efforts toward the Company’s success and that of the Company’s affiliates. The ESPP is intended to qualify as an “employee stock purchase plan” within the meaning of Section 423 of the Code. The board of directors, or a duly authorized committee thereof, will administer the Company’s ESPP.
The maximum aggregate number of shares of common stock that may be issued pursuant to the exercise of purchase rights under the Company’s ESPP that are granted to employees or to employees of any of the Company’s designated affiliates is 96,153 shares. Additionally, the number of shares of common stock reserved for issuance under the Company’s ESPP will increase automatically each year, beginning on January 1, 2017, and continuing through and including January 1, 2026, by 1% of the total number of shares of common stock outstanding on December 31 of the preceding calendar year, or a lesser number as determined by the board of directors. Shares subject to purchase rights granted under the Company’s ESPP that terminate without having been exercised in full will not reduce the number of shares available for issuance under the Company’s ESPP. The first offering period (“First Offering”) under the ESPP began on October 7, 2016 and will end on October 12, 2017. Each offering under the ESPP will consist of two purchase periods of approximately six months in duration. The first purchase period in the First Offering will end on April 12, 2017. There was no employee participation in the First Offering during 2016.
Stock-based Compensation Expense
The Company recognized stock-based compensation expense as follows (in thousands):
|
|
|
Year Ended December 31, |
|||||||
|
|
|
2016 |
|
2015 |
|
2014 |
|||
|
Research and development |
|
$ |
403 |
|
$ |
169 |
|
$ |
304 |
|
General and administrative |
|
|
637 |
|
|
190 |
|
|
392 |
|
Sales and marketing |
|
|
101 |
|
|
57 |
|
|
103 |
|
Total |
|
$ |
1,141 |
|
$ |
416 |
|
$ |
799 |
As of December 31, 2016, there was $3.4 million of total unrecognized compensation expense related to unvested options which the Company expects recognize over a weighted-average period of 3.1 years.
Employee Stock-based Compensation
Stock-based compensation expense for employees was $1.1 million, $407,000, and $776,000 for the years ended December 31, 2016, 2015, and 2014, respectively. In May 2014, the Company modified the terms of 333,774 vested and unvested stock option awards, affecting 75 employees, by reducing their exercise price from $7.54 and $13.52 per share to $4.42 per share. There was no change in any of the other terms of the option awards. The modification resulted in an incremental value of $939,000 being allocated to the options, of which $207,000 was recognized to expense immediately based on options that were vested at the time of the modification. The remaining incremental value of $732,000 attributable to unvested options is being recognized over their remaining vesting term.
In December 2016, the Company modified the terms of 396,028 vested and unvested stock option awards, affecting 77 employees, by reducing their exercise price from $15.86 per share to $6.63 per share. There was no change to any of the other terms of the option awards. The modification resulted in an incremental value of $629,000 being allocated to the options, of which $140,000 was recognized to expense immediately based on options that were vested at the time of the modification. The remaining incremental value of $489,000 attributable to unvested options is being recognized over their remaining vesting term.
74
The Company estimated the fair value of each option grant using the Black-Scholes option-pricing model. The fair value of employee stock options is being amortized on a straight-line basis over the requisite service period of the awards. The fair value of employee stock options was estimated using the assumptions below. Each of these inputs is subjective and its determination generally requires significant judgment.
|
|
|
Year Ended December 31, |
|
||||
|
|
|
2016 |
|
2015 |
|
2014 |
|
|
Expected volatility |
|
42.6 – 45.3 |
% |
44.1 – 48.9 |
% |
36.4 – 53.2 |
% |
|
Risk-free interest rate |
|
1.12 – 2.26 |
% |
1.51 – 1.79 |
% |
0.43 – 2.04 |
% |
|
Expected term (in years) |
|
4.8 – 6.1 |
|
5.6 – 6.1 |
|
2.1 – 6.1 |
|
|
Dividend yield |
|
— |
% |
— |
% |
— |
% |
Expected term. The expected term represents the period that the stock-based awards are expected to be outstanding. The Company used the simplified method to determine the expected term, which is calculated as the average of the time to vesting and the contractual life of the options.
Expected volatility. Since the Company does not have a long trading history for its common stock, the expected volatility was derived from the average historical volatilities of publicly traded companies within a similar industry that are considered to be comparable to the Company’s business over a period approximately equal to the expected term for employees’ options.
Risk-free interest rate. The risk-free interest rate is based on the U.S. Treasury yield with a maturity equal to the expected term of the option in effect at the time of grant.
Dividend yield. The Company has never paid dividends on its common stock and is prohibited from paying dividends on its common stock. Therefore, the Company used an expected dividend yield of zero.
Non-employee Stock-based Compensation
Stock-based compensation expense related to stock options granted to non-employees is recognized as the stock options vest. During the year ended December 31, 2016, the Company granted options to purchase 8,073 shares of common stock to non-employees with a weighted-average exercise price of $7.51 per share. During the year ended December 31, 2015, the Company did not grant any options to non-employees. During the year ended December 31, 2014, the Company granted options to purchase 23,606 shares of common stock to non-employees with a weighted-average exercise price of $4.42 per share.
Options to purchase 31,990 shares, 15,498 shares and 15,498 shares of common stock were outstanding with a weighted-average exercise price of $5.26, $4.42 and $4.42 per share as of December 31, 2016, 2015 and 2014, respectively. Stock-based compensation expense for non-employees was $23,000, $9,000, and 23,000 for the years ended December 31, 2016, 2015, and 2014, respectively.
The Company believes that the fair value of the stock options is more reliably measurable than the fair value of services received. The fair value of the stock options granted is calculated at each reporting date using the Black-Scholes option pricing model with the following assumptions:
|
|
|
Year Ended December 31, |
|
||||
|
|
|
2016 |
|
2015 |
|
2014 |
|
|
Expected volatility |
|
52.3 - 52.7 |
% |
51.6 - 52.9 |
% |
52.8 - 53.8 |
% |
|
Risk-free interest rate |
|
1.94 - 2.41 |
% |
1.72 - 2.02 |
% |
2.17 - 2.48 |
% |
|
Expected term (in years) |
|
9.5 - 9.8 |
|
6.6 - 9.1 |
|
7.3 - 9.8 |
|
|
Dividend yield |
|
— |
% |
— |
% |
— |
% |
75
8. 401(k) Plan
The Company has a defined contribution employee benefit plan pursuant to Section 401(k) of the Internal Revenue Code. The plan allows eligible employees to defer a portion of their annual compensation up to certain statutory limits. At the election of the Board of Directors, the Company may elect to match employee contributions but has not done so to date.
9. Related Party Transactions
Convertible Promissory Notes
In August 2014, the Company entered into a Note Purchase Agreement with several of its stockholders for the issuance of convertible promissory notes (the “2014 Notes”) for an aggregate amount of $2.0 million. On October 21, 2014, contemporaneously with the Series B redeemable convertible preferred stock issuance, the outstanding principal balance of the 2014 Notes, including accrued interest of $2.0 million, was converted into 77,518 shares of Series B redeemable convertible preferred stock.
In January 2016, the Company entered into a Note Purchase Agreement with several of its stockholders for the issuance of convertible promissory notes (the “2016 Notes”) for an aggregate amount of $5.0 million. The 2016 Notes bear interest at 5.0% per annum and have a maturity date of December 15, 2016, extended from the original maturity date of September 30, 2016. The outstanding principal amount and accrued interest on the 2016 Notes were convertible into shares of Series B redeemable convertible preferred stock, at any time, upon written election of the holders of at least a majority of the outstanding principal balance of the 2016 Notes. In the event of an equity financing with proceeds in excess of $5.0 million (“Qualified Financing”) prior to the maturity of the 2016 Notes, the outstanding principal and accrued interest convert into shares of stock issued in the equity financing based on a price per share equal to the price per share paid by investors in said financing. In the event of an IPO, the outstanding principal and accrued interest convert into shares of common stock at a price per share equal to 80% of the per share price of the common stock issued in the IPO. In the event of a deemed liquidation event occurring before the maturity date, the 2016 Notes will be repaid in cash in an amount equal to three times the outstanding principal amount. The redemption of the 2016 Notes upon a deemed liquidation event and in the event of an IPO were contingent redemption features that are not clearly and closely related to the debt instrument and thus were bifurcated and recognized as a derivative liability on the balance sheet at the date of issuance. The compound derivative was recorded as a debt discount at fair value of $653,000 on the issuance date of the 2016 Notes and was being amortized over the term of the 2016 Notes using the effective interest method. Upon the completion of the IPO, the outstanding principal balance of the 2016 Notes, including accrued interest of $176,000, was converted into 808,747 shares of common stock. Accordingly, the outstanding balance of the 2016 Notes of $5.2 million, the unamortized debt discount of $74,000 and the derivative liability of $70,000 were reclassified to additional paid-in capital. No gain or loss from the extinguishment of the debt was recognized in the statement of the operations as the holders of the 2016 Notes are related parties.
In August 2016, the Company entered into a Note Purchase Agreement with existing stockholders for the issuance of subordinated convertible promissory notes (the “2016 Bridge Notes”) for an aggregate principal amount of $3.5 million. The 2016 Bridge Notes bear interest at 5.0% per annum and have a maturity date of December 15, 2016, extended from the original maturity date of September 30, 2016. In the event of an equity financing with proceeds in excess of $5.0 million (“Qualified Financing”) prior to the maturity of the 2016 Bridge Notes, the outstanding principal and accrued interest convert into shares of stock issued in the Qualified Financing based on a price per share equal to the price per share paid by investors in such financing. In the event of an IPO, the outstanding principal and accrued interest convert into shares of common stock at a price per share equal to 80% of the per share price of the common stock issued in the IPO. In the event of a deemed liquidation event occurring before the maturity date, the 2016 Bridge Notes will be repaid in cash in an amount equal to three times the outstanding principal amount. The Company may not prepay the 2016 Bridge Notes without the consent of the Company and the majority holders of the outstanding balance of the promissory notes. The redemption of the 2016 Bridge Notes upon a deemed liquidation event and in the event of an IPO are contingent redemption features that are not clearly and closely related to the debt instrument and thus were bifurcated and recognized as a derivative liability on the balance sheet at the date of issuance. The compound derivative was recorded as a debt discount at fair value of $264,000 on the issuance date of the 2016 Bridge Notes and was being amortized over the term of the 2016 Bridge Notes using the effective interest method. Upon completion of the IPO, the outstanding principal balance of the 2016 Bridge Notes, including accrued interest of $35,000, was converted into 552,262 shares of common stock. Accordingly, the carrying value of the 2016 Bridge Notes of $3.5 million, the
76
unamortized debt discount of $122,000 and the derivative liability of $50,000 were reclassified to additional paid-in capital. No gain or loss from the extinguishment of the debt was recognized in the statement of the operations as the holders of the 2016 Bridge Notes are related parties.
Joint Development Agreement—GLOBALFOUNDRIES
On October 17, 2014, the Company entered into a Joint Development Agreement (“JDA”) with GLOBALFOUNDRIES, Inc. (“GF”), a related party due to its equity ownership in the Company, for the joint development of the Company’s Spin Torque MRAM (“ST-MRAM”) technology. The term of the agreement is the later of four years from the effective date or until the completion, termination or expiration of the last statement of work entered into pursuant to the JDA. The JDA also states that the specific terms and conditions for the production and supply of the developed ST-MRAM technology would be pursuant to a separate manufacturing agreement entered into between the parties.
Under the JDA, each party licenses its relevant intellectual property to the other party. For certain jointly developed works, the parties have agreed to follow an invention allocation procedure to determine ownership. In addition, GF possesses the exclusive right to manufacture the Company’s discrete and embedded ST-MRAM devices developed pursuant to the agreement until the earlier of three years after the qualification of the MRAM device for a particular technology node or four years after the completion of the relevant statement of work under which the device was developed. For the same exclusivity period associated with the relevant device, GF agreed not to license intellectual property developed in connection with the JDA to named competitors of the Company.
Generally, unless otherwise specified in the agreement or a statement of work, the Company and GF share project costs, which do not include personnel or production qualification costs, equally under the JDA. If GF manufactures, sells or transfers to customers wafers containing production quantified ST-MRAM devices that utilize certain design information, GF will be required to pay the Company a royalty. The term of the agreement is four years and is extended until the completion of any development work, if later.
In May 2016, the Company entered into an amendment to the JDA to modify the payment schedule and clarify its payment obligations for certain past project costs. Under the amendment, GF had the right to terminate the JDA if the Company did not pay the past project costs, with interest, by December 15, 2016. Such project costs were paid in December 2016.
As of December 31, 2016 and 2015, $979,000 and $3.5 million, respectively, were payable to GF for the Company’s share of the project costs under the JDA. The Company incurred project costs, recognized as research and development expense, of $2.9 million, $3.6 million, and $0 during the years ended December 31, 2016, 2015, and 2014, respectively.
On October 21, 2014, GF participated, along with other investors, in the Company’s Series B redeemable convertible preferred stock financing and purchased 192,307 shares at $26.00 per share. Contemporaneously, the Company sold 461,538 shares of its common stock to GF at a discounted price of $0.00026 per share. The common shares vest upon the achievement of a goal as set forth in the Statement of Work #1 (the “SOW”) under the JDA. The unvested common shares are subject to repurchase by the Company, if the JDA is terminated for any reason, for a one-year period after such termination, at a price that is the lower of the original price paid by GF or the fair value of the Company’s common stock as of the date of repurchase. The Company has determined that the issuance of these shares of common stock to GF represents compensation for services to be provided under the JDA. Accordingly, the shares are accounted for similar to a stock award granted to a non-employee of the Company and are remeasured to their fair value as they vest. Although the shares issued do not commence vesting until the achievement of the product qualification (the “Initial Measurement Date”), the Company has deemed it probable that the qualification requirement will be met and compensation expense related to the shares issued is being recognized prior to the Initial Measurement Date. Due to the vesting conditions, there will be multiple measurement dates, occurring on the Initial Measurement Date and at the end of each month thereafter. The fair value of vesting shares is effectively fixed at each measurement date while the fair value of the remaining unvested shares will be remeasured each subsequent measurement date until the shares are fully vested. During the year ended December 31, 2016, GF achieved the product qualification as set forth under the SOW. As such, a total of 211,538 shares of common stock became vested on August 21, 2016, the designated Initial Measurement Date. Subsequent to the Initial Measurement Date through December 31, 2016, an additional 38,462 shares of common stock became vested. As of December 31, 2016, there were 211,538 shares unvested that were subject to repurchase.
77
During the years ended December 31, 2016, 2015, and 2014, the Company recognized non-cash compensation expense of $965,000, $1.8 million, and $107,000, respectively, in research and development expense, related to the vesting of the shares of common stock. The Company recognizes compensation expense based on the fair value of the common stock at each reporting period, which was $8.29, $13.52, and $4.68 per share as of December 31, 2016, 2015, and 2014, respectively. The decrease in the fair value of the common stock during the year ended December 31, 2016 resulted in a reversal of compensation expense previously recognized on the unvested shares.
Transactions with Freescale
The Company has entered into various transactions with Freescale (a wholly-owned subsidiary of NXP), a related party due to its equity ownership in the Company. The Company leases its manufacturing facility in Chandler, Arizona, from Freescale and total rent payments made during the years ended December 31, 2016, 2015, and 2014 were $1.1 million, $1.0 million, and $1.0 million, respectively. Freescale also performs processing of the Company’s products in its facility which are capitalized as part of the cost of inventory. The total processing costs incurred by the Company were $2.5 million, $3.9 million, and $3.3 million, for the years ended December 31, 2016, 2015, and 2014, respectively. In addition, Freescale is one of the Company’s largest customers for the sale of embedded wafers, and total revenue from Freescale was $2.4 million, $3.5 million, and $3.2 million for the years ended December 31, 2016, 2015, and 2014, respectively. Amounts due from Freescale were $486,000 and $564,000 at December 31, 2016 and 2015, respectively. Amounts due to Freescale were $380,000 and $207,000 at December 31, 2016 and 2015, respectively.
10. Geographic Information
Revenue from customers is designated based on the geographic region or country to which the product is delivered or licensee is located. Revenue by country was as follows (in thousands):
|
|
|
Year Ended December 31, |
|||||||
|
|
|
2016 |
|
2015 |
|
2014 |
|||
|
United States |
|
$ |
4,321 |
|
$ |
5,362 |
|
$ |
6,055 |
|
Singapore |
|
|
5,467 |
|
|
4,614 |
|
|
3,399 |
|
Japan |
|
|
3,285 |
|
|
2,280 |
|
|
4,408 |
|
Germany |
|
|
3,013 |
|
|
3,546 |
|
|
2,933 |
|
Taiwan |
|
|
2,161 |
|
|
3,759 |
|
|
3,097 |
|
Hong Kong |
|
|
2,122 |
|
|
2,744 |
|
|
3,133 |
|
All other |
|
|
6,725 |
|
|
4,241 |
|
|
1,871 |
|
Total revenue |
|
$ |
27,094 |
|
$ |
26,546 |
|
$ |
24,896 |
11. Income Taxes
For the years ended December 31, 2016, 2015 and 2014, the Company recorded no provision for income taxes primarily due to losses incurred. The Company has incurred net operating losses for all the periods presented. The Company has not reflected any benefit of the net operating loss carryforwards in the accompanying financial statements. The Company has established a full valuation allowance against its deferred tax assets due to the uncertainty surrounding the realization of such assets.
The reconciliation of the statutory federal income tax rate to the Company’s effective tax rate is as follows:
|
|
|
Year Ended December 31, |
|
||||
|
|
|
2016 |
|
2015 |
|
2014 |
|
|
Tax at statutory federal rate |
|
(34.0) |
% |
(34.0) |
% |
(34.0) |
% |
|
State taxes, net of federal benefit |
|
(1.5) |
|
(1.9) |
|
(2.7) |
|
|
Stock-based compensation |
|
1.3 |
|
0.8 |
|
2.8 |
|
|
Nondeductible fair value adjustment |
|
(2.5) |
|
— |
|
— |
|
|
Nondeductible interest |
|
2.0 |
|
— |
|
— |
|
|
Change in valuation allowance |
|
33.3 |
|
34.3 |
|
37.9 |
|
|
Other |
|
1.4 |
|
0.8 |
|
(4.0) |
|
|
Provision for income taxes |
|
(0.0) |
% |
(0.0) |
% |
(0.0) |
% |
78
The tax effects of temporary differences and carryforwards that give rise to significant portions of the deferred tax assets are as follows (in thousands):
|
|
|
December 31, |
||||
|
|
|
2016 |
|
2015 |
||
|
Deferred tax assets: |
|
|
|
|
|
|
|
Net operating loss carryforwards |
|
$ |
29,469 |
|
$ |
23,526 |
|
Inventory |
|
|
1,187 |
|
|
1,309 |
|
Accruals |
|
|
902 |
|
|
1,693 |
|
Depreciation and amortization |
|
|
105 |
|
|
290 |
|
Other |
|
|
1,312 |
|
|
752 |
|
Gross deferred tax assets |
|
|
32,975 |
|
|
27,570 |
|
Valuation allowance |
|
|
(32,850) |
|
|
(27,554) |
|
Deferred tax assets |
|
|
125 |
|
|
16 |
|
Deferred tax liabilities: |
|
|
|
|
|
|
|
Prepaid expenses |
|
|
(125) |
|
|
(16) |
|
Deferred tax liabilities |
|
|
(125) |
|
|
(16) |
|
Net deferred tax assets |
|
$ |
— |
|
$ |
— |
The Company is required to reduce its deferred tax assets by a valuation allowance if it is more likely than not that some or all of its deferred tax assets will not be realized. Management must use judgment in assessing the potential need for a valuation allowance, which requires an evaluation of both negative and positive evidence. The weight given to the potential effect of negative and positive evidence should be commensurate with the extent to which it can be objectively verified. In determining the need for and amount of the valuation allowance, if any, the Company assesses the likelihood that it will be able to recover its deferred tax assets using historical levels of income, estimates of future income and tax planning strategies. As a result of historical cumulative losses, the Company determined that, based on all available evidence, there was substantial uncertainty as to whether it will recover recorded net deferred taxes in future periods. Accordingly, the Company recorded a valuation allowance against all of its net deferred tax assets as of December 31, 2016 and 2015. The net valuation allowance increased by $5.3 million and $6.2 million in 2016 and 2015, respectively.
As of December 31, 2016, the Company had federal net operating loss carryforwards of approximately $83.5 million which will begin to expire in the year of 2028 if not utilized. In addition, the Company had state net operating loss carryforwards of approximately $32.5 million, which will begin to expire in 2023 if not utilized.
The Tax Reform Act of 1986 (the “Act”) provides for a limitation on the annual use of net operating loss and research and development tax credit carryforwards following certain ownership changes (as defined by the Act) that could limit the Company’s ability to utilize these carryforwards.
The Company files income tax returns in the U.S. federal and various state jurisdictions. The Company is subject to U.S. federal and state income tax examinations by authorities for all tax years due to the accumulated net operating losses that are being carried forward for tax purposes.
The Company has not identified any unrecognized tax benefits as of December 31, 2016 and 2015. As the Company has a full valuation allowance on its deferred tax assets, any unrecognized tax benefits would reduce the deferred tax assets and the valuation allowance in the same amount. The Company does not expect the amount of unrecognized tax benefits to materially change in the next twelve months.
79
12. Net Loss Per Share
The following table sets forth the computation of basic and diluted net loss per share (in thousands, except share and per share amounts):
|
|
|
Year Ended December 31, |
|||||||
|
|
|
2016 |
|
2015 |
|
2014 |
|||
|
Numerator: |
|
|
|
|
|
|
|
|
|
|
Net loss |
|
$ |
(16,708) |
|
$ |
(18,183) |
|
$ |
(10,183) |
|
Denominator: |
|
|
|
|
|
|
|
|
|
|
Weighted-average common shares outstanding |
|
|
5,117,226 |
|
|
3,013,743 |
|
|
2,635,621 |
|
Less: weighted-average unvested common shares subjected to repurchase |
|
|
(378,730) |
|
|
(461,538) |
|
|
(91,043) |
|
Weighted-average common shares outstanding used to calculate net loss per common share, basic and diluted |
|
|
4,738,496 |
|
|
2,552,205 |
|
|
2,544,578 |
|
Net loss per common share, basic and diluted |
|
$ |
(3.53) |
|
$ |
(7.12) |
|
$ |
(4.00) |
The following outstanding shares of potentially dilutive securities have been excluded from diluted net loss per common share for the periods presented, because their inclusion would be anti-dilutive:
|
|
|
Year Ended December 31, |
||||
|
|
|
2016 |
|
2015 |
|
2014 |
|
Redeemable convertible preferred stock on an as-converted basis |
|
— |
|
2,486,199 |
|
2,486,199 |
|
Options to purchase common stock |
|
1,414,730 |
|
927,175 |
|
852,639 |
|
Common stock subject to repurchase |
|
211,538 |
|
461,538 |
|
461,538 |
|
Redeemable convertible preferred stock warrants on an as-converted basis |
|
— |
|
27,690 |
|
9,229 |
|
Common stock warrants |
|
27,690 |
|
— |
|
— |
|
Total |
|
1,653,958 |
|
3,902,602 |
|
3,809,605 |
13. Selected Quarterly Financial Data (Unaudited)
Selected quarterly financial results from operations for the years ended December 31, 2016 and 2015 were as follows (in thousands, except per share amounts):
|
|
|
Quarter Ended |
||||||||||
|
|
|
March 31, |
|
June 30, |
|
September 30, |
|
December 31, |
||||
|
|
|
2016 |
|
2016 |
|
2016 |
|
2016 |
||||
|
Total revenue |
|
$ |
6,207 |
|
$ |
6,659 |
|
$ |
7,164 |
|
$ |
7,064 |
|
Gross profit |
|
|
3,662 |
|
|
3,500 |
|
|
4,305 |
|
|
3,232 |
|
Net loss |
|
|
(4,540) |
|
|
(5,416) |
|
|
(1,444) |
|
|
(5,308) |
|
Net loss per common share, basic and diluted |
|
|
(1.78) |
|
|
(2.12) |
|
|
(0.54) |
|
|
(0.48) |
|
|
|
|
|
|
|
|
|
|
|
|
|
|
|
|
|
Quarter Ended |
||||||||||
|
|
|
March 31, |
|
June 30, |
|
September 30, |
|
December 31, |
||||
|
|
|
2015 |
|
2015 |
|
2015 |
|
2015 |
||||
|
Total revenue |
|
$ |
6,305 |
|
$ |
6,349 |
|
$ |
7,092 |
|
$ |
6,800 |
|
Gross profit |
|
|
3,792 |
|
|
3,631 |
|
|
3,634 |
|
|
2,921 |
|
Net loss |
|
|
(4,153) |
|
|
(3,268) |
|
|
(4,509) |
|
|
(6,253) |
|
Net loss per common share, basic and diluted |
|
|
(1.63) |
|
|
(1.28) |
|
|
(1.77) |
|
|
(2.45) |
80
14. Subsequent Events
In January 2017, the Company entered into a five-year sublease agreement with Freescale to rent 6,560 square feet of office and laboratory space in Chandler, Arizona, and in March 2017, the Company amended the lease to increase the space to 10,023 square feet. The aggregate rent expense under the lease is $871,000.
In March 2017, the Company amended its lease agreement with Freescale to extend the lease term through January 2019, to remove laboratory space, decrease fabrication space and expand office space from the premises covered under the lease. The aggregate rent expense under the amendment is $1.8 million.
81
Item 9. Changes in and Disagreements with Accountants on Accounting and Financial Disclosure.
None
Item 9A. Controls and Procedures.
Evaluation of disclosure controls and procedures.
Our management, with the participation of our Chief Executive Officer and our Chief Financial Officer, have evaluated our disclosure controls and procedures (as defined in Rules 13a‑15(e) and 15d‑15(e) under the Securities Exchange Act of 1934, as amended) as of December 31, 2016. Based on that evaluation, our Chief Executive Officer and our Chief Financial Officer have concluded that, as of December 31, 2016, our disclosure controls and procedures were effective at the reasonable assurance level. Additionally, our management has concluded that the financial statements included elsewhere in this report present fairly, in all material respects, our financial position, results of operations and cash flows in conformity with GAAP.
Exemption from management’s report on internal control over financial reporting for the fiscal year ended December 31, 2016.
This Annual Report on Form 10‑K does not include a report of management’s assessment regarding internal control over financial reporting or an attestation report of our independent registered public accounting firm due to a transition period established by the rules of the SEC for newly public companies.
Material weaknesses in internal control over financial reporting.
In connection with the audit of our financial statements as of and for the years ended December 31, 2016, 2015 and 2014, we identified material weaknesses in our internal control over financial reporting, as defined in the standards established by the Public Company Accounting Oversight Board of the United States. Our management has determined that we had a material weakness in our internal control over financial reporting as of December 31, 2014 and 2015, relating to the design and operation of our financial reporting processes. We have concluded that this material weakness was due to the fact that we did not yet have the appropriate resources with the appropriate level of experience and technical expertise to oversee our closing and financial reporting processes. Our management also determined that we had an additional material weakness in our internal control over financial reporting as of December 31, 2016, relating to information technology general and application controls. We have concluded that this material weakness is due to the current configuration of our ERP system, which is scheduled for additional integration in 2017.
Our management implemented a plan that contains the following elements to remediate the identified weaknesses:
|
· |
We have hired additional accounting and finance staff members to augment our current staff and to improve the effectiveness of our closing and financial reporting processes; |
|
· |
We have completed the transition of our financials to SAP to facilitate the integration with other company data and systems; |
|
· |
In May of 2016, we added an independent board member with significant semiconductor CFO experience to chair our audit committee; |
|
· |
We have engaged external consultants to assist us with preparation of the financial statements; and |
|
· |
We are formalizing our accounting policies and internal controls, including the I.T. general controls, and strengthening supervisory reviews by our management; |
We expect to complete the last noted measure above as soon as practicable and will continue to implement measures to remedy our internal control deficiencies in order to meet the deadline imposed by Section 404 of the Sarbanes-Oxley Act of 2002, until such time the material weakness identified in the prior year remains outstanding. Our independent registered public accounting firm has not assessed the effectiveness of our internal control over financial reporting and, under the JOBS Act, will not be required to provide an attestation report on the effectiveness of our internal control over financial reporting so long as we qualify as an “emerging growth company”.
82
Changes in internal control over financial reporting.
Other than the changes intended to remediate the material weakness noted above, there were no changes in our internal control over financial reporting during the year ended December 31, 2016, that have materially affected, or are reasonably likely to materially affect, our internal control over financial reporting.
Inherent limitation on the effectiveness of internal control.
The effectiveness of any system of internal control over financial reporting, including ours, is subject to inherent limitations, including the exercise of judgment in designing, implementing, operating, and evaluating the controls and procedures, and the inability to eliminate misconduct completely. Accordingly, any system of internal control over financial reporting, including ours, no matter how well designed and operated, can only provide reasonable, not absolute assurances. In addition, projections of any evaluation of effectiveness to future periods are subject to the risk that controls may become inadequate because of changes in conditions, or that the degree of compliance with the policies or procedures may deteriorate. We intend to continue to monitor and upgrade our internal controls as necessary or appropriate for our business, but cannot assure you that such improvements will be sufficient to provide us with effective internal control over financial reporting.
None.
83
Item 10. Directors, Executive Officers and Corporate Governance.
Information required by this item will be contained in our definitive proxy statement to be filed with the Securities and Exchange Commission on Schedule 14A in connection with our 2017 Annual Meeting of Stockholders, or the Proxy Statement, which will be filed not later than 120 days after the end of our fiscal year ended December 31, 2016, under the headings “Management,” “Proposal 1 - Election of Directors,” “Board Committees and Meetings,” and “Section 16(a) Beneficial Ownership Reporting Compliance,” and is incorporated herein by reference.
We have adopted a Code of Business Conduct and Ethics that applies to our officers, directors and employees which is available on our website at www.everspin.com. The Code of Business Conduct and Ethics is intended to qualify as a “code of ethics” within the meaning of Section 406 of the Sarbanes-Oxley Act of 2002 and Item 406 of Regulation S-K. In addition, we intend to promptly disclose (1) the nature of any substantive amendment to our Code of Business Conduct and Ethics that applies to our principal executive officer, principal financial officer, principal accounting officer or controller or persons performing similar functions and (2) the nature of any waiver, including an implicit waiver, from a provision of our code of ethics that is granted to one of these specified officers, the name of such person who is granted the waiver and the date of the waiver, on our website in the future.
Item 11. Executive Compensation.
The information required by this item regarding executive compensation will be incorporated by reference to the information set forth in the sections titled “Executive Compensation” and “Compensation of Non-Employee Board Members” in our Proxy Statement.
Item 12. Security Ownership of Certain Beneficial Owners and Management and Related Stockholder Matters.
The information required by this item regarding security ownership of certain beneficial owners and management will be incorporated by reference to the information set forth in the sections titled “Security Ownership of Certain Beneficial Owners and Management” and “Securities Authorized for Issuance Under Equity Compensation Plans” in our Proxy Statement.
Item 13. Certain Relationships and Related Transactions, and Director Independence.
The information required by this item regarding certain relationships and related transactions and director independence will be incorporated by reference to the information set forth in the sections titled “Certain Relationships and Related Party Transactions” and “Proposal 1 - Election of Directors”, respectively, in our Proxy Statement.
Item 14. Principal Accounting Fees and Services.
The information required by this item regarding principal accountant fees and services will be incorporated by reference to the information set forth in the section titled “Principal Accountant Fees and Services” in our Proxy Statement.
84
Item 15. Exhibits, Financial Statement Schedules.
(a) The following documents are filed as part of this report:
1. Financial Statements
Information in response to this Item is included in Part II, Item 8 of this Annual Report on Form 10‑K.
2. Financial Statement Schedules
All schedules are omitted because they are not applicable or the required information is shown in the financial statements or notes thereto.
3. Exhibits
See Item 15(b) below.
(b) We have filed, or incorporated into this Annual Report on Form 10‑K by reference, the exhibits listed on the Exhibit Index immediately following the Signatures page of this Annual Report on Form 10‑K.
(c) See Item 15(a)2 above.
None.
85
Pursuant to the requirements of Section 13 or 15(d) of the Securities Exchange Act of 1934, as amended, the Registrant has duly caused this Report to be signed on its behalf by the undersigned, thereunto duly authorized, in Chandler, Arizona, on March 29, 2017.
|
|
Everspin Technologies, Inc. |
|
|
|
|
|
|
|
By: |
/s/ Phillip LoPresti |
|
|
|
Phillip LoPresti |
|
|
|
President and Chief Executive Officer |
|
|
|
(Principal Executive Officer) and Director |
|
|
|
|
|
|
|
|
|
|
By: |
/s/ Jeffrey Winzeler |
|
|
|
Jeffrey Winzeler |
|
|
|
Chief Financial Officer |
|
|
|
(Principal Financial and Accounting Officer) |
86
KNOW ALL PERSONS BY THESE PRESENTS, that each person whose signature appears below constitutes and appoints Phillip LoPresti and Jeffrey Winzeler, and each of them, as his true and lawful attorneys-in-fact and agents, each with the full power of substitution, for him and in his name, place or stead, in any and all capacities, to sign any and all amendments to this Annual Report on Form 10‑K, and to file the same, with all exhibits thereto and other documents in connection therewith, with the Securities and Exchange Commission, granting unto said attorneys-in-fact and agents, and each of them, full power and authority to do and perform each and every act and thing requisite and necessary to be done in and about the premises, as fully to all intents and purposes as he might or could do in person, hereby ratifying and confirming all that said attorneys-in-fact and agents, or their or his substitute or substitutes, may lawfully do or cause to be done by virtue hereof.
Pursuant to the requirements of the Securities Exchange Act of 1934, as amended, this Report has been signed below by the following persons on behalf of the Registrant in the capacities and on the dates indicated.
|
Signature |
|
Title |
|
Date |
|
|
|
|
|
|
|
/s/ Phillip LoPresti |
|
President and Chief Executive Officer |
|
March 29, 2017 |
|
Phillip LoPresti |
|
(Principal Executive Officer) and Director |
|
|
|
|
|
|
|
|
|
/s/ Jeffrey Winzeler |
|
Chief Financial Officer |
|
March 29, 2017 |
|
Jeffrey Winzeler |
|
(Principal Accounting Officer) |
|
|
|
|
|
|
|
|
|
/s/ Robert W. England |
|
Director |
|
March 29, 2017 |
|
Robert W. England |
|
|
|
|
|
|
|
|
|
|
|
/s/ Lawrence G. Finch |
|
Director |
|
March 29, 2017 |
|
Lawrence G. Finch |
|
|
|
|
|
|
|
|
|
|
|
/s/ Ronald C. Foster |
|
Director |
|
March 29, 2017 |
|
Ronald C. Foster |
|
|
|
|
|
|
|
|
|
|
|
/s/ Stephen J. Socolof |
|
Director |
|
March 29, 2017 |
|
Stephen J. Socolof |
|
|
|
|
|
|
|
|
|
|
|
/s/ Peter Hébert |
|
Director |
|
March 29, 2017 |
|
Peter Hébert |
|
|
|
|
|
|
|
|
|
|
|
/s/ Geoffrey R. Tate |
|
Director |
|
March 29, 2017 |
|
Geoffrey R. Tate |
|
|
|
|
|
|
|
|
|
|
|
/s/ Kevin Conley |
|
Director |
|
March 29, 2017 |
|
Kevin Conley |
|
|
|
|
|
|
|
|
|
|
|
/s/ Mike Gustafson |
|
Director |
|
March 29, 2017 |
|
Mike Gustafson |
|
|
|
|
87
EXHIBIT INDEX
|
|
|
|
|
Incorporation By Reference |
|
|
||||
|
Exhibit |
|
Description |
|
Form |
|
SEC File No. |
|
Exhibit |
|
Filing Date |
|
|
|
|
|
|
|
|
|
|
|
|
|
3.1 |
|
Amended and Restated Certificate of Incorporation. |
|
8‑K |
|
001‑37900 |
|
3.1 |
|
10/13/2016 |
|
|
|
|
|
|
|
|
|
|
|
|
|
3.2 |
|
Bylaws. |
|
S‑1 |
|
333‑213569 |
|
3.6 |
|
9/09/2016 |
|
|
|
|
|
|
|
|
|
|
|
|
|
4.1 |
|
Form of Common Stock Certificate of the Company. |
|
S‑1 |
|
333‑213569 |
|
4.1 |
|
9/09/2016 |
|
|
|
|
|
|
|
|
|
|
|
|
|
4.2 |
|
Reference is made to Exhibits 3.1 and 3.2. |
|
|
|
|
|
|
|
|
|
|
|
|
|
|
|
|
|
|
|
|
|
10.1† |
|
Form of Indemnity Agreement between the registrant and its directors and officers. |
|
S‑1 |
|
333‑213569 |
|
10.1 |
|
9/09/2016 |
|
|
|
|
|
|
|
|
|
|
|
|
|
10.2† |
|
2008 Equity Incentive Plan, as amended, and Form of Stock Option Grant Notice, Option Agreement and Form of Notice of Exercise. |
|
S-1/A |
|
333‑213569 |
|
10.2 |
|
9/26/2016 |
|
|
|
|
|
|
|
|
|
|
|
|
|
10.3† |
|
2016 Equity Incentive Plan and Form of Stock Option Grant Notice, Option Agreement and Form of Notice of Exercise. |
|
S-1/A |
|
333‑213569 |
|
10.3 |
|
9/26/2016 |
|
|
|
|
|
|
|
|
|
|
|
|
|
10.4† |
|
2016 Employee Stock Purchase Plan. |
|
S-1/A |
|
333‑213569 |
|
10.4 |
|
9/26/2016 |
|
|
|
|
|
|
|
|
|
|
|
|
|
10.5 |
|
Lease, dated as of June 5, 2008, by and between the registrant and Freescale Semiconductor, Inc. |
|
S-1 |
|
333‑213569 |
|
10.5 |
|
9/09/2016 |
|
|
|
|
|
|
|
|
|
|
|
|
|
10.6 |
|
Amendment No. 1 to Lease, dated as of February 2, 2009, by and between the registrant and Freescale Semiconductor, Inc. |
|
S-1 |
|
333‑213569 |
|
10.6 |
|
9/09/2016 |
|
|
|
|
|
|
|
|
|
|
|
|
|
10.7 |
|
Amendment No. 2 to Lease, dated as of March 1, 2010, by and between the registrant and Freescale Semiconductor, Inc. |
|
S-1 |
|
333‑213569 |
|
10.7 |
|
9/09/2016 |
|
|
|
|
|
|
|
|
|
|
|
|
|
10.8 |
|
Amendment No. 3 to Lease, dated as of July 20, 2011, by and between the registrant and Freescale Semiconductor, Inc. |
|
S-1 |
|
333‑213569 |
|
10.8 |
|
9/09/2016 |
|
|
|
|
|
|
|
|
|
|
|
|
|
10.9 |
|
Amendment No. 4 to Lease, dated as of June, 2014 by and between the registrant and Freescale Semiconductor, Inc. |
|
S-1 |
|
333‑213569 |
|
10.9 |
|
9/09/2016 |
|
|
|
|
|
|
|
|
|
|
|
|
|
10.10 |
|
Loan and Security Agreement, dated as of June 6, 2015 by and between the registrant and Ares Venture Finance, L.P. |
|
S-1 |
|
333‑213569 |
|
10.10 |
|
9/09/2016 |
|
|
|
|
|
|
|
|
|
|
|
|
|
10.11 |
|
Amendment to Loan and Security Agreement, dated as of January 29, 2016, by and between the registrant and Ares Venture Finance, L.P. |
|
S-1 |
|
333‑213569 |
|
10.11 |
|
9/09/2016 |
|
|
|
|
|
|
|
|
|
|
|
|
|
10.12 |
|
Second Amendment to Loan and Security Agreement, dated as of August 1, 2016, by and between the registrant and Ares Venture Finance, L.P. |
|
S-1 |
|
333‑213569 |
|
10.12 |
|
9/09/2016 |
|
|
|
|
|
|
|
|
|
|
|
|
|
10.13† |
|
Executive Employment Agreement, dated as of April 25, 2016, by and between registrant and Terry Hulett. |
|
S-1 |
|
333‑213569 |
|
10.13 |
|
9/09/2016 |
|
|
|
|
|
|
|
|
|
|
|
|
|
10.14† |
|
Executive Employment Agreement, dated as of April 25, 2016, by and between registrant and Phillip LoPresti. |
|
S-1 |
|
333‑213569 |
|
10.14 |
|
9/09/2016 |
|
|
|
|
|
|
|
|
|
|
|
|
88
|
10.15† |
|
Executive Employment Agreement, dated as of April 25, 2016, by and between registrant and Scott Sewell. |
|
S-1 |
|
333‑213569 |
|
10.15 |
|
9/09/2016 |
|
|
|
|
|
|
|
|
|
|
|
|
|
10.16 |
|
Office Lease Agreement, dated as of January 7, 2011, by and between the registrant and Jutland 4141 Investments, Ltd dba Chandler Office Center. |
|
S-1 |
|
333‑213569 |
|
10.16 |
|
9/09/2016 |
|
|
|
|
|
|
|
|
|
|
|
|
|
10.17 |
|
Commercial Industrial Lease Agreement, dated as of May 18, 2012, by and between the registrant and Principal Life Insurance Company. |
|
S-1 |
|
333‑213569 |
|
10.17 |
|
9/09/2016 |
|
|
|
|
|
|
|
|
|
|
|
|
|
10.18+ |
|
STT-MRAM Joint Development Agreement, dated as of October 17, 2014, by and between registrant and GLOBALFOUNDRIES Inc. |
|
S-1 |
|
333‑213569 |
|
10.18 |
|
9/09/2016 |
|
|
|
|
|
|
|
|
|
|
|
|
|
10.19+ |
|
Amendment No. 1 to the STT-MRAM Joint Development Agreement, dated as of May 27, 2016, by and between registrant and GLOBALFOUNDRIES Inc. |
|
S-1 |
|
333‑213569 |
|
10.19 |
|
9/09/2016 |
|
|
|
|
|
|
|
|
|
|
|
|
|
10.20+ |
|
Manufacturing Agreement, dated as of October 23, 2014, by and between the registrant and GLOBALFOUNDRIES Singapore Pte. Ltd. |
|
S-1 |
|
333‑213569 |
|
10.20 |
|
9/09/2016 |
|
|
|
|
|
|
|
|
|
|
|
|
|
10.21 |
|
Restricted Stock Purchase Agreement, by and between the registrant and GLOBALFOUNDRIES Inc. |
|
S-1 |
|
333‑213569 |
|
10.21 |
|
9/09/2016 |
|
|
|
|
|
|
|
|
|
|
|
|
|
10.22 |
|
Amendment No. 1 to Commercial Industrial Lease Agreement, dated August 12, 2016, by and between the registrant and Legacy Stonelake JV-T, LLC, successor in interest to Principal Life Insurance Company. |
|
S-1 |
|
333‑213569 |
|
10.22 |
|
9/09/2016 |
|
|
|
|
|
|
|
|
|
|
|
|
|
10.23 |
|
Common Stock Purchase Agreement by and between the registrant and GigaDevice (HK) Limited, dated September 23, 2016. |
|
S-1/A |
|
333‑213569 |
|
10.23 |
|
9/26/2016 |
|
|
|
|
|
|
|
|
|
|
|
|
|
10.24 |
|
Non-employee Director Compensation |
|
10-Q |
|
001‑37900 |
|
10.4 |
|
11/18/2016 |
|
|
|
|
|
|
|
|
|
|
|
|
|
10.25†* |
|
Executive Employment Agreement, dated as of April 25, 2016, by and between registrant and Jon Slaughter, Ph.D. |
|
|
|
|
|
|
|
|
|
|
|
|
|
|
|
|
|
|
|
|
|
23.1* |
|
Consent of Ernst & Young LLP, Independent Registered Public Accounting Firm |
|
|
|
|
|
|
|
|
|
|
|
|
|
|
|
|
|
|
|
|
|
31.1* |
|
Certification of Principal Executive Officer Pursuant to Rules 13a‑14(a) and 15d‑14(a) under the Securities Exchange Act of 1934, as amended. |
|
|
|
|
|
|
|
|
|
|
|
|
|
|
|
|
|
|
|
|
|
31.2* |
|
Certification of Principal Financial Officer Pursuant to Rules 13a‑14(a) and 15d‑14(a) under the Securities Exchange Act of 1934, as amended. |
|
|
|
|
|
|
|
|
|
|
|
|
|
|
|
|
|
|
|
|
|
32.1** |
|
Certification of Principal Executive Officer and Principal Financial Officer Pursuant to 18 U.S.C. Section 1350, as Adopted Pursuant to Section 906 of the Sarbanes-Oxley Act of 2002. |
|
|
|
|
|
|
|
|
|
|
|
|
|
|
|
|
|
|
|
|
|
101.INS |
|
XBRL Instance Document |
|
|
|
|
|
|
|
|
89
|
|
|
|
|
|
|
|
|
|
|
|
|
101.SCH |
|
XBRL Taxonomy Extension Schema Document |
|
|
|
|
|
|
|
|
|
|
|
|
|
|
|
|
|
|
|
|
|
101.CAL |
|
XBRL Taxonomy Extension Calculation Linkbase Document |
|
|
|
|
|
|
|
|
|
|
|
|
|
|
|
|
|
|
|
|
|
101.DEF |
|
XBRL Taxonomy Extension Definition Linkbase Document |
|
|
|
|
|
|
|
|
|
|
|
|
|
|
|
|
|
|
|
|
|
101.LAB |
|
XBRL Taxonomy Extension Label Linkbase Document |
|
|
|
|
|
|
|
|
|
|
|
|
|
|
|
|
|
|
|
|
|
101.PRE |
|
XBRL Taxonomy Extension Presentation Linkbase Document |
|
|
|
|
|
|
|
|
*Filed herewith.
**Furnished herewith. Exhibit 32.1 is being furnished and shall not be deemed to be “filed” for purposes of Section 18 of the Securities Exchange Act of 1934, as amended (the “Exchange Act”), or otherwise subject to the liability of that section, nor shall such exhibit be deemed to be incorporated by reference in any registration statement or other document filed under the Securities Act of 1933, as amended, or the Exchange Act, except as otherwise specifically stated in such filing.
+Confidential treatment has been granted for certain portions of this exhibit.
†Indicates a management contract or compensatory plan.
90