Attached files
| file | filename |
|---|---|
| EX-31.4 - EXHIBIT 31.4 - Liberty Global plc | amendedlg-20161231xex_312.htm |
| EX-31.3 - EXHIBIT 31.3 - Liberty Global plc | amendedlg-20161231xex_311.htm |
UNITED STATES SECURITIES AND EXCHANGE COMMISSION
WASHINGTON, D.C. 20549
Form 10-K/A
(Amendment No. 1)
þ | ANNUAL REPORT PURSUANT TO SECTION 13 OR 15(d) OF THE SECURITIES EXCHANGE ACT OF 1934 | |
For the fiscal year ended December 31, 2016 | ||
OR
Commission file number 001-35961
¨ | TRANSITION REPORT PURSUANT TO SECTION 13 OR 15(d) OF THE SECURITIES EXCHANGE ACT OF 1934 |
For the transition period from to | |

Liberty Global plc
(Exact name of Registrant as specified in its charter)
England and Wales | 98-1112770 | |
(State or other jurisdiction of incorporation or organization) | (I.R.S. Employer Identification No.) | |
Griffin House, 161 Hammersmith Rd, London, United Kingdom | W6 8BS | |
(Address of principal executive offices) | (Zip Code) | |
Registrant’s telephone number, including area code: +44.208.483.6449 or 303.220.6600
Securities registered pursuant to Section 12(b) of the Act:
Title of Each Class | Name of Each Exchange on Which Registered | |
Liberty Global Class A Ordinary Share, nominal value $0.01 per share | NASDAQ Global Select Market | |
Liberty Global Class B Ordinary Shares, nominal value $0.01 per share | NASDAQ Global Select Market | |
Liberty Global Class C Ordinary Shares, nominal value $0.01 per share | NASDAQ Global Select Market | |
LiLAC Class A Ordinary Share, nominal value $0.01 per share | NASDAQ Global Select Market | |
LiLAC Class B Ordinary Shares, nominal value $0.01 per share | OTC Link | |
LiLAC Class C Ordinary Shares, nominal value $0.01 per share | NASDAQ Global Select Market | |
Securities registered pursuant to Section 12(g) of the Act: none
Indicate by check mark if the Registrant is a well-known seasoned issuer, as defined in Rule 405 of the Securities Act. Yes þ No ¨
Indicate by check mark if the Registrant is not required to file reports pursuant to Section 13 or Section 15(d) of the Act. Yes ¨ No þ
Indicate by check mark whether the Registrant (1) has filed all reports required to be filed by Section 13 or 15(d) of the Securities Exchange Act of 1934 during the preceding 12 months and (2) has been subject to such filing requirements for the past 90 days. Yes þ No ¨
Indicate by check mark whether the Registrant has submitted electronically and posted on its corporate website, if any, every Interactive Data File required to be submitted and posted pursuant to Rule 405 of Regulation S-T during the preceding 12 months. Yes þ No ¨
Indicate by check mark if disclosure of delinquent filers pursuant to Item 405 of Regulation S-K is not contained herein, and will not be contained, to the best of registrant’s knowledge, in definitive proxy or information statements incorporated by reference in Part III of this Form 10-K or any amendment to this Form 10-K. ¨
Indicate by check mark whether the Registrant is a large accelerated filer, an accelerated filer, a non-accelerated filer or a smaller reporting company. See definition of “large accelerated filer, accelerated filer” and “smaller reporting company” in Rule 12b-2 of the Exchange Act. Check one:
Large Accelerated Filer þ | Accelerated Filer ¨ | Non-Accelerated Filer ¨ | Smaller Reporting Company ¨ | |||
Indicate by check mark whether the registrant is a shell company as defined in Rule 12b-2 of the Exchange Act. Yes ¨ No þ
State the aggregate market value of the voting and non-voting common equity held by non-affiliates, computed by reference to the price at which the common equity was last sold, or the average bid and ask price of such common equity, as of the last business day of the registrant’s most recently completed second fiscal quarter: $27.6 billion.
The number of outstanding ordinary shares of Liberty Global plc as of February 10, 2017 was:
Class A | Class B | Class C | ||||||
Liberty Global ordinary shares | 253,429,669 | 10,805,850 | 630,706,163 | |||||
LiLAC ordinary shares | 50,199,758 | 1,888,323 | 120,649,072 | |||||
DOCUMENTS INCORPORATED BY REFERENCE
Portions of the definitive proxy statement for the Registrant’s 2017 Annual General Meeting of Shareholders are incorporated by reference in Part III of this Form 10-K.
EXPLANATORY NOTE
We are filing this Amendment No. 1 on Form 10-K/A to our Annual Report on Form 10-K for the year ended December 31, 2016 to revise the number of premises added to the network of our wholly-owned subsidiary, Virgin Media Inc. (Virgin Media), as part of Virgin Media’s Project Lightning new build initiative. In this regard, we previously disclosed that (i) during 2015 and 2016, we connected approximately 715,000 homes and commercial premises to Virgin Media’s two-way network (including technical upgrades in the United Kingdom (U.K.)) (the Virgin Media Added Homes) and (ii) during 2017, we expect to connect approximately 1.4 million additional homes and commercial premises (excluding upgrades) to our two-way networks attributed to the Liberty Global Group (the 2017 Liberty Global Group Added Homes), which includes Virgin Media’s two-way network. We are revising (a) the Virgin Media Added Homes amount from approximately 715,000 to 567,000 homes and commercial premises and (b) the 2017 Liberty Global Group Added Homes amount from approximately 1.4 million to a range of 1.3 million to 1.4 million additional homes and commercial premises (excluding upgrades). Accordingly, we hereby amend and replace in their entirety Part I, Item 1, Part II, Item 7 and Part IV, Item 15 of our Annual Report on Form 10-K for the year ended December 31, 2016. For additional information regarding our revision, see each of our Current Reports on Form 8-K/A furnished to the Securities and Exchange Commission on March 28, 2017. The foregoing Current Reports on Form 8-K/A shall not be deemed incorporated by reference into this Annual Report on Form 10-K/A.
Except as described above, this amendment does not update or modify in any way the disclosures in the Registrant’s Annual Report on Form 10-K for the fiscal year ended December 31, 2016, and does not purport to reflect any information or events subsequent to the filing thereof.
LIBERTY GLOBAL PLC
AMENDMENT NO. 1 TO 2016 ANNUAL REPORT ON FORM 10-K/A
TABLE OF CONTENTS
Page Number | ||
PART I | ||
Item 1. | I-1 | |
PART II | ||
Item 7. | II-8 | |
PART IV | ||
Item 15. | IV-1 | |
PART I
Item 1. BUSINESS
Who We Are
We are Liberty Global plc (Liberty Global), the world's largest international television and broadband company—investing, innovating and empowering our customers to be a part of the digital revolution. We are investing in the communication highways of our age. These investments include acquisitions, network extensions and expansion, technology upgrades and our initiatives to engage our people, our customers and the communities in which we operate. Our investments put us at the center of the digital revolution and allow us to drive global innovation through new products, opportunities and applications. We are innovating through technology by building a strong convergence of fixed and mobile communication opportunities reaching gigabit speeds. It is through our operations that we bring the benefits of our global innovation to life. We empower our customers with quality services and products that give them the freedom to connect, converse, work and be entertained anytime, anywhere they choose. We believe our enhanced digital products and services will deliver customer satisfaction, enhance our revenue streams and generate cost savings—the goals of our “Liberty GO” program. For further information on Liberty GO, see Item 7. Management’s Discussion and Analysis of Financial Condition and Results of Operations-Overview included in Part II of this Annual Report.
Liberty Global has operations in more than 30 countries serving 24.7 million customers at December 31, 2016. We consolidate these operations listed below, with the exception of VodafoneZiggo (defined below).
Brand | Entity | Location | Ownership | |||
 | Virgin Media | United Kingdom & Ireland | 100.0% | |||
 | Unitymedia | Germany | 100.0% | |||
 | Telenet | Belgium | 57.4% | |||
 | UPC Holding | Switzerland, Austria, Poland, Hungary, Romania, Czech Republic, Slovakia | 100.0% | |||
 | VodafoneZiggo | Netherlands | 50.0% | |||
 | VTR | Chile | 100.0% | |||
 | CWC | Caribbean, Latin America & Seychelles | 100.0%* | |||
 | Liberty Puerto Rico | Puerto Rico | 60.0% | |||
* CWC’s operations are provided through various consolidated subsidiaries, including the following subsidiaries where we own less than 100%: Cable & Wireless Panama, SA (a 49.0%-owned entity that owns most of our operations in Panama), The Bahamas Telecommunications Company Limited (a 49.0%-owned entity that owns all of our operations in the Bahamas), Cable & Wireless Jamaica Limited (an 82.0%-owned entity that owns the majority of our operations in Jamaica) and Cable & Wireless Barbados Limited (an 81.1%-owned entity that owns the majority of our operations in Barbados).
I-1
General Development of Business
As a result of a series of mergers that were completed on June 7, 2013, Liberty Global became the publicly-held parent company of the successors by merger of Liberty Global, Inc. (the predecessor to Liberty Global) and Virgin Media Inc. (Virgin Media). In the following text, the terms “we”, “our”, “our company” and “us” may refer, as the context requires, to Liberty Global (or its predecessor) or collectively to Liberty Global (or its predecessor) and its subsidiaries. Unless otherwise indicated, convenience translations into United States (U.S.) dollars are calculated as of December 31, 2016, and operational data, including subscriber statistics and ownership percentages, are as of December 31, 2016.
On December 31, 2016, our company and Vodafone Group Plc (Vodafone) formed a 50:50 joint venture, called VodafoneZiggo Group Holding B.V. (VodafoneZiggo). VodafoneZiggo combined our subsidiary VodafoneZiggo Holding B.V., formerly known as Ziggo Group Holding B.V. (Ziggo Group Holding), with Vodafone’s mobile business in the Netherlands to create a national unified communications provider in the Netherlands with complementary strengths across video, broadband, mobile and business services. As a result of the formation of VodafoneZiggo, effective December 31, 2016, we treat VodafoneZiggo as an equity method investment and no longer consolidate Ziggo Group Holding. For additional information on this transaction, see note 5 to our consolidated financial statements included in Part II of this Annual Report on Form 10-K.
Expansion and Acquisitions
We have expanded our broadband footprint through new build projects and strategically selected acquisitions. Our new build projects consist of network extension programs pursuant to which we connect additional homes and businesses to our broadband communications network (Network Extensions). Our investment in Network Extensions is critical not only for our business to grow, but also for the countries and communities in which we operate. The Network Extensions, together with upgrades to our existing networks and next generation customer premises equipment, provide our customers the means to enter the gigaworld society. During 2016, we initiated Network Extensions in the Germany, Chile, Central and Eastern Europe and certain other markets. During 2015 and 2016, we connected 567,000 homes and commercial premises to Virgin Media’s two-way network (including technical upgrades in the United Kingdom (U.K.)). During 2016, we connected approximately 1.0 million homes and commercial premises (including upgrades in Germany and Chile) to our two-way networks in the other markets mentioned above. Pursuant to Network Extensions, in 2017, we expect to (1) connect 1.3 million to 1.4 million additional homes and commercial premises (excluding upgrades) to our two-way networks attributed to the “Liberty Global Group” (as defined and described below) and (2) connect or upgrade approximately 450,000 additional homes and commercial premises to our two-way networks attributed to the “LiLAC Group” (as defined and described below). Depending on a variety of factors, however, including the financial and operations results of the earlier phases of our new build programs, any Network Extensions may be continued, modified or cancelled at our discretion. For further information on Network Extensions, see Item 7. Management’s Discussion and Analysis of Financial Condition and Results of Operations-Overview included in Part II of this Annual Report.
Over the past decade, we have also completed several strategic acquisitions both in Europe and in Latin America. We made these acquisitions in order to deliver the scale that allows us to innovate effectively and invest in great content and the best products. This enables us to deliver quality services to our customers. Our significant acquisitions include:
• | On May 16, 2016, we acquired Cable & Wireless Communications Limited (CWC), a provider of telecommunication services, including mobile and high-speed broadband, focused in Latin America and the Caribbean (the CWC Acquisition). |
• | On February 11, 2016, Telenet Group Holding N.V. (Telenet) acquired BASE Company N.V. (BASE), the third-largest mobile network operator in Belgium. |
• | On June 3, 2015, we acquired, together with investment funds affiliated with Searchlight Capital Partners, L.P. (Searchlight), Choice Cable TV (Choice), a cable and broadband services provider in Puerto Rico, which was integrated into our Liberty Cablevision of Puerto Rico LLC (Liberty Puerto Rico) operations. |
• | In November 2014, we gained control of Ziggo Holding B.V. (Ziggo), a provider of video, broadband internet, fixed-line telephony and mobile services in the Netherlands, and integrated Ziggo into our Netherlands broadband operations. This business was contributed to form VodafoneZiggo, a 50:50 joint venture, on December 31, 2016. |
• | On November 8, 2012, we completed a series of transactions with Searchlight through which we acquired San Juan Cable LLC, dba OneLink Communications, a broadband communications operator in Puerto Rico. |
I-2
• | On December 15, 2011, we acquired all of the outstanding shares of Kabel BW Musketeer GmbH, Germany’s third largest cable television operator based on number of subscribers, and integrated it into our Unitymedia GmbH (Unitymedia) operations. |
• | On September 16, 2011, we acquired Aster Sp. Z.o.o., a broadband communications provider in Poland. |
• | On January 28, 2010, we acquired Unitymedia, the second largest cable television provider in Germany based on the number of subscribers. |
For additional information on our more recent acquisitions, including related financings, see notes 4 and 10 to our consolidated financial statements included in Part II of this Annual Report on Form 10-K. In addition, we have completed various other smaller acquisitions in the normal course of business.
Pending Acquisitions
Recently, we announced two additional acquisitions related to our operations in Europe:
• | In December 2016, Telenet reached an agreement to acquire from Coditel Brabant sprl, operating under the brand SFR and a subsidiary of Altice S.A., its broadband operations in Belgium and Luxembourg. Subject to customary closing conditions, including regulatory approvals, closing is expected during the second half of 2017. |
• | In October 2016, through a subsidiary of UPC Holding B.V. (UPC Holding), we entered into an agreement to acquire the cable business of Multimedia Polska S.A., a broadband communications provider in Poland. Subject to customary closing conditions, including regulatory approvals, closing is expected in late 2017 or early 2018. |
For additional information on the above proposed acquisitions, see note 4 to our consolidated financial statements included in Part II of this Annual Report on Form 10-K.
Dispositions
In addition to the contribution of Ziggo Group Holding and its subsidiaries to VodafoneZiggo, we completed the following dispositions:
• | On January 31, 2014, we sold substantially all of our programming interest held through Chellomedia B.V. |
• | On July 11, 2011, we sold Austar United Communications Limited, a leading direct-to-home satellite (DTH) provider to regional and rural Australia and the capital cities of Hobart and Darwin. |
• | On February 18, 2010, we sold our ownership interest in Jupiter Telecommunications Co. Ltd., dba J:COM, a leading broadband provider and the largest multiple-system operator in Japan based on homes passed and subscribers. |
For additional information on the Chellomedia B.V. disposition, see note 5 to our consolidated financial statements included in Part II of this Annual Report on Form 10-K. We have also completed various other smaller dispositions in the normal course of business and as required by regulatory authorities in connection with approving the BASE and Ziggo acquisitions.
Tracking Shares
On July 1, 2015, we completed the approved steps of the “LiLAC Transaction” whereby we (1) reclassified our then outstanding Class A, Class B and Class C Liberty Global ordinary shares (collectively, the Old Liberty Global Shares) into corresponding classes of new Liberty Global ordinary shares (collectively, the Liberty Global Shares) and (2) capitalized a portion of our share premium account and distributed as a dividend (or a “bonus issue” under U.K. law) our LiLAC Class A, Class B and Class C ordinary shares (collectively, the LiLAC Shares). Pursuant to the LiLAC Transaction, each holder of Class A, Class B and Class C Old Liberty Global Shares remained a holder of the same amount and class of Liberty Global Shares and received one share of the corresponding class of LiLAC Shares for each 20 Old Liberty Global Shares held as of the record date for such distribution and cash was issued in lieu of fractional LiLAC Shares.
The Liberty Global Shares and the LiLAC Shares are tracking shares. Tracking shares are intended by the issuing company to reflect or “track” the economic performance of a particular business or “group,” rather than the economic performance of the company as a whole. The Liberty Global Shares and the LiLAC Shares are intended to track the economic performance of the Liberty Global Group and the LiLAC Group, respectively (each as defined and described below). While
I-3
the Liberty Global Group and the LiLAC Group have separate collections of businesses, assets and liabilities attributed to them, neither group is a separate legal entity and therefore cannot own assets, issue securities or enter into legally binding agreements. Holders of tracking shares have no direct claim to the group’s assets and are not represented by separate boards of directors. Instead, holders of tracking shares are shareholders of the parent corporation, with a single board of directors, and are subject to all of the risks and liabilities of the parent corporation. We and our subsidiaries each continue to be responsible for our respective liabilities. Holders of Liberty Global Shares, LiLAC Shares and any other of our capital shares designated as ordinary shares from time to time will continue to be subject to risks associated with an investment in our company as a whole, even if a holder does not own both Liberty Global Shares and LiLAC Shares.
The LiLAC Group comprises our businesses, assets and liabilities in Latin America and the Caribbean and has attributed to it (1) LGE Coral Holdco Limited and its subsidiaries, which include CWC, (2) VTR Finance B.V. (VTR Finance) and its subsidiaries, which include VTR.com SpA (VTR), (3) Lila Chile Holding B.V., which is the parent entity of VTR Finance, (4) LiLAC Communications Inc., formerly known as LiLAC Holdings Inc. (LiLAC Communications), and its subsidiaries, which include Liberty Puerto Rico, and (5) prior to July 1, 2015, the costs associated with certain corporate employees of Liberty Global that are exclusively focused on the management of the LiLAC Group. Effective July 1, 2015, these corporate employees were transferred to LiLAC Communications. The Liberty Global Group comprises our businesses, assets and liabilities not attributed to the LiLAC Group, including Virgin Media, Unitymedia, Telenet and UPC Holding, including our DTH satellite operations based in Luxembourg, our corporate entities (excluding LiLAC Communications), our 50% interest in VodafoneZiggo and certain other less significant entities.
Equity Transactions
From time to time our board of directors authorize various shares repurchase programs. Under these programs, we receive authorization to acquire up to the specified amount of our ordinary shares or other authorized securities from time to time through open market or privately negotiated transactions, which may include derivative transactions. The timing of the repurchase of shares or other securities pursuant to our equity repurchase programs, which may be suspended or discontinued at any time, is dependent on a variety of factors, including market conditions. Pursuant to our share repurchase programs, during 2016, we repurchased:
Title of Shares | Number of Shares | Weighted Average Price | Aggregate Purchase Price* | ||||||||
in millions | |||||||||||
Liberty Global Class A | 32,387,722 | $ | 32.26 | $ | 1,044.8 | ||||||
Liberty Global Class C | 31,557,089 | $ | 32.43 | $ | 1,023.2 | ||||||
LiLAC Class A | 720,800 | $ | 20.65 | $ | 14.8 | ||||||
LiLAC Class C | 313,647 | $ | 21.19 | $ | 6.7 | ||||||
_______________
* Includes direct acquisition costs and the effects of derivative instruments.
At December 31, 2016, the remaining amount authorized for repurchases of Liberty Global Shares and LiLAC Shares was $1,943.4 million and $278.6 million, respectively. Subsequent to December 31, 2016, our board of directors increased the amount authorized under the share repurchase program for our Liberty Global Shares by $1.0 billion. For a further description of our share repurchases, see note 12 to our consolidated financial statements included in Part II of this Annual Report on Form 10-K.
Financial Information About Operating Segments
Financial information about our reportable segments is provided in note 18 to our consolidated financial statements included in Part II of this Annual Report on Form 10-K.
I-4
Forward Looking Statements
Certain statements in this Annual Report constitute forward-looking statements within the meaning of the Private Securities Litigation Reform Act of 1995. To the extent that statements in this Annual Report are not recitations of historical fact, such statements constitute forward-looking statements, which, by definition, involve risks and uncertainties that could cause actual results to differ materially from those expressed or implied by such statements. In particular, statements under Item 1. Business, Item 1A. Risk Factors, Item 2. Properties, Item 7. Management’s Discussion and Analysis of Financial Condition and Results of Operations and Item 7A. Quantitative and Qualitative Disclosures About Market Risk may contain forward-looking statements, including statements regarding our business, product, foreign currency and finance strategies in 2017, our property and equipment additions in 2017 (including with respect to Network Extensions), subscriber growth and retention rates, competitive, regulatory and economic factors, the timing and impacts of proposed transactions, the maturity of our markets, the anticipated impacts of new legislation (or changes to existing rules and regulations), anticipated changes in our revenue, costs or growth rates, our liquidity, credit risks, foreign currency risks, target leverage levels, our future projected contractual commitments and cash flows and other information and statements that are not historical fact. Where, in any forward-looking statement, we express an expectation or belief as to future results or events, such expectation or belief is expressed in good faith and believed to have a reasonable basis, but there can be no assurance that the expectation or belief will result or be achieved or accomplished. In evaluating these statements, you should consider the risks and uncertainties discussed under Item 1A. Risk Factors and Item 7A. Quantitative and Qualitative Disclosures About Market Risk, as well as the following list of some but not all of the factors that could cause actual results or events to differ materially from anticipated results or events:
• | economic and business conditions and industry trends in the countries in which we operate; |
• | the competitive environment in the industries in the countries in which we operate, including competitor responses to our products and services; |
• | fluctuations in currency exchange rates and interest rates; |
• | instability in global financial markets, including sovereign debt issues and related fiscal reforms; |
• | consumer disposable income and spending levels, including the availability and amount of individual consumer debt; |
• | changes in consumer television viewing preferences and habits; |
• | consumer acceptance of our existing service offerings, including our cable television, broadband internet, fixed-line telephony, mobile and business service offerings, and of new technology, programming alternatives and other products and services that we may offer in the future; |
• | our ability to manage rapid technological changes; |
• | our ability to maintain or increase the number of subscriptions to our cable television, broadband internet, fixed-line telephony and mobile service offerings and our average revenue per household; |
• | our ability to provide satisfactory customer service, including support for new and evolving products and services; |
• | our ability to maintain or increase rates to our subscribers or to pass through increased costs to our subscribers; |
• | the impact of our future financial performance, or market conditions generally, on the availability, terms and deployment of capital; |
• | changes in, or failure or inability to comply with, government regulations in the countries in which we operate and adverse outcomes from regulatory proceedings; |
• | government intervention that requires opening our broadband distribution networks to competitors, such as the obligations imposed in Belgium; |
• | our ability to obtain regulatory approval and satisfy other conditions necessary to close acquisitions and dispositions and the impact of conditions imposed by competition and other regulatory authorities in connection with acquisitions; |
• | our ability to successfully acquire new businesses and, if acquired, to integrate, realize anticipated efficiencies from, and implement our business plan with respect to, the businesses we have acquired, such as Choice, BASE and CWC, or that we expect to acquire; |
I-5
• | changes in laws or treaties relating to taxation, or the interpretation thereof, in the U.K., the U.S. or in other countries in which we operate; |
• | changes in laws and government regulations that may impact the availability and cost of capital and the derivative instruments that hedge certain of our financial risks; |
• | the ability of suppliers and vendors (including our third-party wireless network providers under our mobile virtual network operator (MVNO) arrangements) to timely deliver quality products, equipment, software, services and access; |
• | the availability of attractive programming for our video services and the costs associated with such programming, including retransmission and copyright fees payable to public and private broadcasters; |
• | uncertainties inherent in the development and integration of new business lines and business strategies; |
• | our ability to adequately forecast and plan future network requirements, including the costs and benefits associated with the planned Network Extensions; |
• | the availability of capital for the acquisition and/or development of telecommunications networks and services; |
• | problems we may discover post-closing with the operations, including the internal controls and financial reporting process, of businesses we acquire; |
• | the leakage of sensitive customer data; |
• | the outcome of any pending or threatened litigation; |
• | the loss of key employees and the availability of qualified personnel; |
• | changes in the nature of key strategic relationships with partners and joint venturers; |
• | our equity capital structure; and |
• | events that are outside of our control, such as political unrest in international markets, terrorist attacks, malicious human acts, natural disasters, pandemics and other similar events. |
The broadband distribution and mobile service industries are changing rapidly and, therefore, the forward-looking statements of expectations, plans and intent in this Annual Report are subject to a significant degree of risk. These forward-looking statements and the above-described risks, uncertainties and other factors speak only as of the date of this Annual Report, and we expressly disclaim any obligation or undertaking to disseminate any updates or revisions to any forward-looking statement contained herein, to reflect any change in our expectations with regard thereto, or any other change in events, conditions or circumstances on which any such statement is based. Readers are cautioned not to place undue reliance on any forward-looking statement.
I-6
Narrative Description of Business
We are a leading international telecommunications company with a commitment to providing our customers the “best in class” communications and entertainment services. These services are delivered to our residential and business customers over our networks and include video, broadband internet, telephony and mobile services. We also deliver mobile services through third-party networks as MVNOs. We design these services to enable our customers to access the digital world on their own terms and at their own pace. In most of our footprint, the core of our offer is “triple-play”, which we use to describe bundled services of digital video, internet and telephony in one subscription. We are enhancing this offer by expanding our services to include mobile services for a “quad-play” or fixed-mobile convergence service in most of our markets. Available service offerings depend on the bandwidth capacity of a particular system and whether it has been upgraded for two-way communications. In certain markets, we also offer video services through DTH and fiber-to-the-home and digital subscriber line (DSL) networks. In addition, in the Caribbean and certain markets in Latin America, we provide wholesale services over our sub-sea and terrestrial fiber optic cable networks.
Our operations are attributed to either our Liberty Global Group or our LiLAC Group. The Liberty Global Group includes our operations in the U.K., Ireland, Germany, Belgium, Switzerland, Austria and Central and Eastern Europe. In terms of video subscribers, we operate the largest cable network in each of Austria, Belgium, the Czech Republic, Hungary, Ireland, Poland, Slovakia, Switzerland and the U.K. and the second largest cable network in each of Germany and Romania. The Liberty Global Group also includes our investment in VodafoneZiggo, which operates the largest cable network in the Netherlands, and in various content businesses.
The LiLAC Group includes our operations in Chile and Puerto Rico and our CWC operations primarily in the Caribbean and Latin America, including sub-sea and terrestrial fiber optic cable networks connecting over 30 markets throughout the region. In terms of video subscribers, we operate the largest fixed network capable of delivering video services in each of Chile, Puerto Rico, Jamaica, Barbados, Trinidad and Tobago and five other Caribbean markets. In terms of fixed-line telephony subscribers, we operate the largest telephony network in each of Panama, Jamaica, Barbados, Bahamas and in almost all of our other Caribbean countries where we provide retail services.
In connecting our customers through our telecommunication services, we recognize that we are a global corporate citizen—that we play a role in addressing the environmental impacts generated through our business. By seeking to address these issues, we strengthen our company and positively influence the communities in which we operate. This includes enhancing the energy efficiency of all our operations, with a focus on energy use, carbon emissions and management of electronic waste. We also recognize that coding skills are essential to our industry and other technology-based jobs of the future. As a result, we have partnered with the CoderDojo Foundation, a global community of free coding clubs for children age 7-17. Our support for CoderDojo is enabling the next generation of creators, improving their long-term career prospects. Corporate responsibility is a key part of our business strategy.
I-7
Liberty Global Group Statistics
The following tables present certain operating data as of December 31, 2016, with respect to the networks of our consolidated subsidiaries attributed to the Liberty Global Group. The following tables reflect 100% of the data applicable to each of our subsidiaries regardless of our ownership percentage. Percentages are rounded to the nearest whole number.
Consolidated Operating Data - December 31, 2016
Homes Passed (1) | Two-way Homes Passed (2) | Customer Relationships (3) | Total RGUs (4) | Video | |||||||||||||||||||||||||||||
Basic Video Subscribers (5) | Enhanced Video Subscribers (6) | DTH Subscribers (7) | Total Video | Internet Subscribers (8) | Telephony Subscribers (9) | Mobile Subscribers (10) | |||||||||||||||||||||||||||
Liberty Global Group: | |||||||||||||||||||||||||||||||||
United Kingdom | 13,459,200 | 13,446,400 | 5,284,000 | 13,035,900 | — | 3,729,100 | — | 3,729,100 | 4,916,700 | 4,390,100 | 3,022,300 | ||||||||||||||||||||||
Germany | 12,894,500 | 12,767,100 | 7,162,200 | 12,839,000 | 4,822,900 | 1,582,800 | — | 6,405,700 | 3,325,600 | 3,107,700 | 353,100 | ||||||||||||||||||||||
Belgium | 2,987,600 | 2,987,600 | 2,149,300 | 4,874,600 | 284,600 | 1,732,900 | — | 2,017,500 | 1,601,700 | 1,255,400 | 2,991,900 | ||||||||||||||||||||||
Switzerland (11) | 2,236,800 | 2,236,800 | 1,294,700 | 2,513,400 | 576,500 | 675,200 | — | 1,251,700 | 749,800 | 511,900 | 80,300 | ||||||||||||||||||||||
Austria | 1,391,400 | 1,391,400 | 654,000 | 1,411,300 | 115,700 | 367,300 | — | 483,000 | 502,800 | 425,500 | 30,500 | ||||||||||||||||||||||
Ireland | 852,300 | 807,500 | 454,700 | 1,020,700 | 29,700 | 275,100 | — | 304,800 | 363,500 | 352,400 | 17,900 | ||||||||||||||||||||||
Total Western Europe | 33,821,800 | 33,636,800 | 16,998,900 | 35,694,900 | 5,829,400 | 8,362,400 | — | 14,191,800 | 11,460,100 | 10,043,000 | 6,496,000 | ||||||||||||||||||||||
Poland | 3,157,600 | 3,094,900 | 1,439,200 | 2,954,100 | 209,600 | 1,004,900 | — | 1,214,500 | 1,105,100 | 634,500 | 5,300 | ||||||||||||||||||||||
Hungary | 1,731,400 | 1,713,900 | 1,112,700 | 2,167,300 | 131,200 | 532,200 | 292,000 | 955,400 | 632,100 | 579,800 | 62,500 | ||||||||||||||||||||||
Romania | 2,887,700 | 2,838,400 | 1,296,000 | 2,273,600 | 263,400 | 640,400 | 363,500 | 1,267,300 | 535,400 | 470,900 | — | ||||||||||||||||||||||
Czech Republic | 1,480,000 | 1,446,700 | 714,000 | 1,233,000 | 143,400 | 354,800 | 111,500 | 609,700 | 473,900 | 149,400 | — | ||||||||||||||||||||||
Slovakia | 587,800 | 564,800 | 274,500 | 458,400 | 28,500 | 143,800 | 72,800 | 245,100 | 128,000 | 85,300 | — | ||||||||||||||||||||||
Total Central and Eastern Europe | 9,844,500 | 9,658,700 | 4,836,400 | 9,086,400 | 776,100 | 2,676,100 | 839,800 | 4,292,000 | 2,874,500 | 1,919,900 | 67,800 | ||||||||||||||||||||||
Total Liberty Global Group | 43,666,300 | 43,295,500 | 21,835,300 | 44,781,300 | 6,605,500 | 11,038,500 | 839,800 | 18,483,800 | 14,334,600 | 11,962,900 | 6,563,800 | ||||||||||||||||||||||
I-8
__________________
(1) | Homes Passed are homes, residential multiple dwelling units or commercial units that can be connected to our networks without materially extending the distribution plant, except for DTH homes. Our Homes Passed counts are based on census data that can change based on either revisions to the data or from new census results. We do not count homes passed for DTH. Due to the fact that we do not own the partner networks (defined below) used in Switzerland (see note 11 below), we do not report homes passed for Switzerland’s partner networks. |
(2) | Two-way Homes Passed are Homes Passed by those sections of our networks that are technologically capable of providing two-way services, including video, internet and telephony services. |
(3) | Customer Relationships are the number of customers who receive at least one of our video, internet or telephony services that we count as Revenue Generating Units (RGUs), without regard to which or to how many services they subscribe. To the extent that RGU counts include equivalent billing unit (EBU) adjustments, we reflect corresponding adjustments to our Customer Relationship counts. For further information regarding our EBU calculation, see Additional General Notes to Tables below. Customer Relationships generally are counted on a unique premises basis. Accordingly, if an individual receives our services in two premises (e.g., a primary home and a vacation home), that individual generally will count as two Customer Relationships. We exclude mobile-only customers from Customer Relationships. |
(4) | RGU is separately a Basic Video Subscriber, Enhanced Video Subscriber, DTH Subscriber, Internet Subscriber or Telephony Subscriber (each as defined and described below). A home, residential multiple dwelling unit, or commercial unit may contain one or more RGUs. For example, if a residential customer in our Austrian market subscribed to our enhanced video service, fixed-line telephony service and broadband internet service, the customer would constitute three RGUs. Total RGUs is the sum of Basic Video, Enhanced Video, DTH, Internet and Telephony Subscribers. RGUs generally are counted on a unique premises basis such that a given premises does not count as more than one RGU for any given service. On the other hand, if an individual receives one of our services in two premises (e.g., a primary home and a vacation home), that individual will count as two RGUs for that service. Each bundled cable, internet or telephony service is counted as a separate RGU regardless of the nature of any bundling discount or promotion. Non-paying subscribers are counted as subscribers during their free promotional service period. Some of these subscribers may choose to disconnect after their free service period. Services offered without charge on a long-term basis (e.g., VIP subscribers, free service to employees) generally are not counted as RGUs. We do not include subscriptions to mobile services in our externally reported RGU counts. In this regard, our December 31, 2016 RGU counts exclude our separately reported postpaid and prepaid mobile subscribers. |
(5) | Basic Video Subscriber is a home, residential multiple dwelling unit or commercial unit that receives our video service over our broadband network either via an analog video signal or via a digital video signal without subscribing to any recurring monthly service that requires the use of encryption-enabling technology. Encryption-enabling technology includes conditional access security cards or “smart cards”, or other integrated or virtual technologies that we use to provide our enhanced service offerings. With the exception of RGUs that we count on an EBU basis, we count RGUs on a unique premises basis. In other words, a subscriber with multiple outlets in one premises is counted as one RGU and a subscriber with two homes and a subscription to our video service at each home is counted as two RGUs. In Europe, we have approximately 164,900 “lifeline” customers that are counted on a per connection basis, representing the least expensive regulated tier of video cable service, with only a few channels. |
(6) | Enhanced Video Subscriber is a home, residential multiple dwelling unit or commercial unit that receives our video service over our broadband network or through a partner network via a digital video signal while subscribing to any recurring monthly service that requires the use of encryption-enabling technology. Enhanced Video Subscribers that are not counted on an EBU basis are counted on a unique premises basis. For example, a subscriber with one or more set-top boxes that receives our video service in one premises is generally counted as just one subscriber. An Enhanced Video Subscriber is not counted as a Basic Video Subscriber. As we migrate customers from basic to enhanced video services, we report a decrease in our Basic Video Subscribers equal to the increase in our Enhanced Video Subscribers. Subscribers to enhanced video services provided by our operations in Switzerland over partner networks receive basic video services from the partner networks as opposed to our operations. |
(7) | DTH Subscriber is a home, residential multiple dwelling unit or commercial unit that receives our video programming broadcast directly via a geosynchronous satellite. |
(8) | Internet Subscriber is a home, residential multiple dwelling unit or commercial unit that receives internet services over our networks, or that we service through a partner network. Our Internet Subscribers exclude 45,700 and 45,600 DSL subscribers within Belgium and Austria, respectively, who are not serviced over our networks. Our Internet Subscribers do not include customers that receive services from dial-up connections. In Switzerland, we offer a 2 Mbps internet service to our Basic and Enhanced Video Subscribers without an incremental recurring fee. Our Internet Subscribers in Switzerland include 97,400 subscribers who have requested and received this service. |
(9) | Telephony Subscriber is a home, residential multiple dwelling unit or commercial unit that receives voice services over our networks, or that we service through a partner network. Telephony Subscribers exclude mobile telephony subscribers. Our Telephony Subscribers exclude 34,900 subscribers within Austria that are not serviced over our networks. In Switzerland, we offer a basic phone service to our Basic and Enhanced Video Subscribers without an incremental recurring fee. Our Telephony Subscribers in Switzerland include 88,900 subscribers who have requested and received this service. |
I-9
(10) | Mobile Subscriber is an active subscriber identification module (SIM) card in service rather than services provided. For example, if a Mobile Subscriber has both a data and voice plan on a smartphone this would equate to one Mobile Subscriber. Alternatively, a subscriber who has a voice and data plan for a mobile handset and a data plan for a laptop (via a dongle) would be counted as two Mobile Subscribers. Customers who do not pay a recurring monthly fee are excluded from our Mobile Subscriber counts after periods of inactivity ranging from 30 to 90 days, based on industry standards within the respective country. |
(11) | Pursuant to service agreements, Switzerland offers enhanced video, broadband internet and telephony services over networks owned by third-party cable operators (partner networks). A partner network RGU is only recognized if there is a direct billing relationship with the customer. At December 31, 2016, Switzerland’s partner networks account for 138,600 Customer Relationships, 290,900 RGUs, 106,300 Enhanced Video Subscribers, 108,500 Internet Subscribers and 76,100 Telephony Subscribers. |
Additional General Notes to Table:
As a result of our decision to discontinue our Multi-channel Multipoint Distribution System (MMDS) service in Ireland, we have excluded subscribers to our MMDS service from our externally reported operating statistics effective January 1, 2016, which resulted in a reduction to Homes Passed, RGUs and Customer Relationships in Ireland and Slovakia of 22,000 and 500, respectively.
Most of our broadband communications subsidiaries provide telephony, broadband internet, data, video or other business services. Certain of our business service revenue is derived from small or home office (SOHO) subscribers that pay a premium price to receive enhanced service levels along with video, internet or fixed-line telephony services that are the same or similar to the mass marketed products offered to our residential subscribers. All mass marketed products provided to SOHOs, whether or not accompanied by enhanced service levels and/or premium prices, are included in the respective RGU and customer counts of our broadband communications operations, with only those services provided at premium prices considered to be “SOHO RGUs” or “SOHO customers”. With the exception of our business SOHO subscribers, we generally do not count customers of business services as customers or RGUs for external reporting purposes.
Certain of our residential and commercial RGUs are counted on an EBU basis, including certain commercial and residential multiple dwelling units in Europe (with the exception of Germany and Belgium, where we do not count any RGUs on an EBU basis). Our EBUs are generally calculated by dividing the bulk price charged to accounts in an area by the most prevalent price charged to non-bulk residential customers in that market for the comparable tier of service. As such, we may experience variances in our EBU counts solely as a result of changes in rates. In Germany, homes passed reflect the footprint, and two-way homes passed reflect the technological capability of our network up to the street cabinet, with drops from the street cabinet to the building generally added, and in-home wiring generally upgraded, on an as needed or success-based basis. In Belgium, Telenet leases a portion of its network under a long-term capital lease arrangement. These tables include operating statistics for Telenet’s owned and leased networks.
While we take appropriate steps to ensure that subscriber statistics are presented on a consistent and accurate basis at any given balance sheet date, the variability from country to country in (1) the nature and pricing of products and services, (2) the distribution platform, (3) billing systems, (4) bad debt collection experience and (5) other factors add complexity to the subscriber counting process. We periodically review our subscriber counting policies and underlying systems to improve the accuracy and consistency of the data reported on a prospective basis. Accordingly, we may from time to time make appropriate adjustments to our subscriber statistics based on those reviews.
Subscriber information for acquired entities is preliminary and subject to adjustment until we have completed our review of such information and determined that it is presented in accordance with our policies.
I-10
Network & Product Penetration Data (%) - December 31, 2016
U.K. | Germany | Belgium | Switzerland | Austria | Ireland | Poland | Hungary | Romania | Czech Republic | Slovakia | |||||||||||
Liberty Global Group Network Data: | |||||||||||||||||||||
Two-way homes passed percentage (1) | 100 | 99 | 100 | 100 | 100 | 95 | 98 | 99 | 98 | 98 | 96 | ||||||||||
Digital video availability percentage (2) | 100 | 100(9) | 99 | 100(9) | 95 | 98 | 99 | 98 | 98 | 98 | 91 | ||||||||||
Broadband internet availability percentage (2) | 100 | 99(9) | 99 | 100(9) | 100 | 95 | 98 | 99 | 98 | 98 | 88 | ||||||||||
Fixed-line telephony availability percentage (2) | 100 | 99(9) | 99 | 100(9) | 100 | 94 | 98 | 99 | 98 | 98 | 88 | ||||||||||
Bandwidth percentage (3): | |||||||||||||||||||||
at least 860 MHz | 25 | 99 | 21 | 100 | 86 | 63 | 100 | 43 | 97 | 99 | 97 | ||||||||||
750 MHz to 859 MHz | 71 | — | — | — | — | 35 | --(10) | 51 | --(10) | --(10) | — | ||||||||||
less than 750 MHz | 4 | 1 | 79 | — | 14 | 2 | --(10) | 6 | 3 | 1 | 3 | ||||||||||
Liberty Global Group Product Penetration: | |||||||||||||||||||||
Cable television penetration (4) | 27 | 50 | 68 | 56 | 35 | 36 | 38 | 38 | 31 | 34 | 29 | ||||||||||
Enhanced Video penetration (5) | 100 | 25 | 86 | 54 | 76 | 90 | 83 | 80 | 71 | 71 | 83 | ||||||||||
Broadband internet penetration (6) | 36 | 26 | 54 | 34 | 36 | 45 | 36 | 37 | 19 | 33 | 23 | ||||||||||
Fixed telephony penetration (6) | 32 | 24 | 42 | 23 | 31 | 44 | 21 | 34 | 17 | 10 | 15 | ||||||||||
Double-play penetration (7) | 20 | 12 | 21 | 18 | 21 | 34 | 27 | 11 | 11 | 45 | 14 | ||||||||||
Triple-play penetration (7) | 64 | 34 | 53 | 38 | 48 | 45 | 39 | 42 | 32 | 14 | 27 | ||||||||||
Fixed-Mobile Convergence penetration (8) | 20 | 6 | 38 | 8 | 3 | 3 | --(11) | --(11) | — | — | — | ||||||||||
I-11
__________________
(1) | Percentage of total homes passed that are two-way homes passed. |
(2) | Percentage of total homes passed to which digital video, broadband internet or fixed-line telephony services, as applicable, are made available. |
(3) | Percentage of total homes passed served by a network with the indicated bandwidth. |
(4) | Percentage of total homes passed that subscribe to cable television services (Basic Video or Enhanced Video). |
(5) | Percentage of cable television subscribers (Basic Video and Enhanced Video Subscribers) that are Enhanced Video Subscribers. |
(6) | Percentage of two-way homes passed that subscribe to broadband internet or fixed-line telephony services, as applicable. |
(7) | Percentage of total customers that subscribe to two services (double-play customers) or three services (triple-play customers) offered by our operations (video, broadband internet and fixed-line telephony). |
(8) | Fixed-Mobile Convergence penetration represents the number of customers who subscribe to both our internet service and our postpaid mobile service, divided by the number of customers who subscribe to our internet service. |
(9) | Assuming the contractual right to serve the building exists in the case of multiple dwelling units. |
(10) | Less than 1%. |
(11) | Fixed-Mobile Convergence penetration in these Central and Eastern Europe countries is 2% in the aggregate. |
I-12
Video, Broadband Internet, Fixed-Line Telephony and Mobile Services - December 31, 2016
U.K. | Germany | Belgium | Switzerland | Austria | Ireland | Poland | Hungary | Czech Republic | Romania | Slovakia | ||||||||||||
Liberty Global Group: | ||||||||||||||||||||||
Video services (excluding DTH): | ||||||||||||||||||||||
Next Generation Video Platform | TiVo | Horizon | Digital TV(5) | Horizon | Horizon | Horizon | Horizon | Horizon Lite(5) | Horizon/Horizon Lite(5) | Horizon Lite(5) | Horizon Lite(5) | |||||||||||
Number of Next Generation Video percentage(1) | 85 | 9 | 86 | 28 | 4 | 51 | 22 | 9 | 47 | 2 | 44 | |||||||||||
Number of out-of-home channels available (second screen) | 119 | 116 | 91 | 123 | 50 | 67 | 94 | 107 | 127 | 95 | 84 | |||||||||||
Availability of Replay TV | — | — | X | X | — | X | — | X | X | X | X | |||||||||||
Number of channels in basic digital tier | 78 | 92 | 85 | 90 | 110 | 72 | 105 | 107 | 105 | 117 | 110 | |||||||||||
Broadband internet service: | ||||||||||||||||||||||
Maximum download speed offered (Mbps) | 200(3) | 400 | 200(3) | 500 | 250 | 360(3) | 250(3)(6) | 500 | 400 | 500 | 500 | |||||||||||
Fixed-line telephony and mobile services: | ||||||||||||||||||||||
VoIP Fixed-line | (4) | X | X | X | X | X | X | X | X | X | X | |||||||||||
Number of Mobile SIM cards (in 000’s)(2) | 3,022 | 353 | 2,992 | 80 | 31 | 18 | 5(7) | 63 | — | — | — | |||||||||||
Prepaid | 638 | — | 881 | — | — | — | — | — | — | — | — | |||||||||||
Postpaid | 2,384 | 353 | 2,111 | 80 | 31 | 18 | 5 | 63 | — | — | — | |||||||||||
I-13
__________________
(1) | Percentage of total cable television subscribers that have next generation video. |
(2) | Represents the number of active SIM cards in service. See note 10 to Consolidated Operating Data table above for how these are counted. |
(3) | For business customers, speeds of up to: 300 Mbps in the U.K., 240 Mbps in Belgium, 400 Mbps in Ireland and 600 Mbps in Poland, are available. |
(4) | VoIP services are available only to business customers. |
(5) | Refers to an upgraded set-top box system that provides several features of Horizon TV (defined below) in the home. |
(6) | Speeds of up to 600 Mbps available in limited areas. |
(7) | Limited to legacy subscribers. |
I-14
Liberty Global Group Products and Services
Video Services
Our video service is, and continues to be, one of the key foundations of our product offerings in our European markets. Our cable operations offer multiple tiers of digital video programming and audio services starting with a basic video service. Subscribers to our basic video service pay a fixed monthly fee and generally receive at least 60 digital or analog video channels (including a limited number of high definition (HD) channels) and several digital and analog radio channels. This service also includes video-on-demand (VoD) access and an electronic programming guide. In our markets where our basic digital service is unencrypted (Germany, Austria, Poland, Hungary, the Czech Republic and Romania), the cost of our digital service is the same cost as the monthly fee of our analog service. In the markets where we encrypt our basic digital service, our digital service is generally offered at an incremental cost equal to or slightly higher than the monthly fee for our basic analog service. We tailor our video services in each country of operation based on programming preferences, culture, demographics and local regulatory requirements. Our channel offerings include general entertainment, sports, movies, documentaries, lifestyles, news, adult, children and ethnic and foreign channels.
We also offer a variety of premium channel packages to meet the special interests of our subscribers. For an additional monthly charge, a subscriber may upgrade to one of our extended digital tier services and receive an increased number of video and radio channels, including the channels in the basic tier service and additional HD channels. Digital subscribers may also subscribe to one or more packages of premium channels for an additional monthly charge.
Subscribers to our digital services also receive the channels available through our analog service. We offer limited analog services in all of our broadband markets, except in the U.K. and Switzerland. In all of our broadband operations, we continue to upgrade our systems to expand our digital services and encourage our analog subscribers to convert to a digital or premium digital service.
Discounts to our monthly service fees are available to any subscriber who selects a bundle of two or more of our services (bundled services): video, internet, fixed-line telephony and, in certain markets, mobile services. Bundled services consist of double-play for two services, triple-play for three services and, where available, quad-play for four services.
To meet customer demands, we have enhanced our video services with various products that enable our customers to control when, where and how they watch their programming. These products range from digital video recorders (DVRs) to multimedia home gateway systems such as "Horizon TV", as well as various mobile applications (apps). Horizon TV is a next generation multimedia home gateway (decoder box) based on a digital television platform that is capable of distributing video, voice and data content throughout the home and to multiple devices. It has a sophisticated user interface that enables customers to view and share, across multiple devices, linear channels, VoD programming and personal media content and to pause, replay and record programming. The Horizon TV gateway can act as an internet router that allows access to digital video content available on the television via other devices, such as laptops, smart phones and tablets.
For our Horizon TV subscribers, we offer various features and functionalities, including over 330 television apps for various online services (such as YouTube, Netflix, social platforms, sports experience, music, news and games). In almost all of our operations, we also offer an online mobile app for viewing on a second screen called “Horizon Go”. Horizon Go is available on mobile devices (iOS, Android and Windows) and via an internet portal and allows video customers to view linear channels and VoD, with a substantial part of this content available outside of the home. For Horizon TV customers, when in the home the second screen device can act as a remote control. Through Horizon Go, customers have the ability to remotely schedule the recording of a television program on their Horizon TV box at home.
We offer Horizon TV in Germany, Switzerland, Austria, Ireland, Poland and the Czech Republic. In several of our other European operations, we provide a Horizon TV-like experience through a remote upgrade of the software on the customer’s set-top box. After the upgrade, these boxes offer several features of the Horizon TV product. We refer to this upgrade as “Horizon Lite”, although it is locally marketed as Horizon TV, except in Belgium where it is marketed as “Digital TV”. Some of the Horizon TV features are not available on our Horizon Lite systems, such as recommendation-based content and the ability to access video content on other devices in the home. We intend to (1) expand the availability of Horizon TV to other markets within our footprint and (2) continue to improve the Horizon TV user experience with new functionality and software updates.
In the U.K., we offer a multimedia home gateway based on the TiVo platform under a strategic partnership agreement with TiVo Inc. The TiVo set-top boxes provide television and broadband internet capabilities. In late 2016, we launched a new set-top box in the U.K. called the Virgin Media V6 box. This device combines ultra high-definition 4K video with improved streaming functionalities and more processing power. The Virgin Media V6 box allows customers to record six channels simultaneously while watching a seventh. Customers can also start watching programming on one television and pick up where they left off on
I-15
other TiVo boxes in another room or through an app on their smart phones and tablets. A similar box will be rolled out in other markets in our footprint, where it will carry the next generation Horizon TV user interface and will be marketed under the respective local brand. In addition to the video service on their TiVo gateway device, our customers in the U.K. also have access to a comprehensive internet streaming video service called “Virgin TV Anywhere”. This service, which is available via a mobile app or an internet portal, allows our video customers to stream real-time TV channels and watch VoD content anywhere they have a broadband connection.
In Belgium, the digital video product offered by Telenet is based on system marketed as Digital TV platform. It functions similar to our Horizon Lite service and is available to Telenet's enhanced video subscribers for no additional charge. Digital TV set-top boxes offer a Horizon-like user interface that allows Telenet's enhanced video customers to remotely manage their DVR, view programs remotely (up to seven days after the original broadcast) and access VoD with a laptop, smart phone or tablet in or out of the home. Telenet also offers customers access to live TV streaming and various other content sources such as VoD via the “Yelo Play” app, which is available via iOS, Android and Windows smart phones and tablets.
One of our key video services is “Replay TV”. Replay TV records virtually all programs across numerous linear channels in the countries where this service is available. The recordings are available up to seven days after the original broadcast. This allows our customers to catch up on their favorite television shows without having to set their DVR or browse separate menus on their set-top boxes. Instead, customers can open the electronic programing guide, scroll back and replay linear programming instantly. Replay TV also allows our customers to replay a television program from the start even while the live broadcast is in progress. Replay TV is accessible in Switzerland, Belgium, Ireland, the Czech Republic, Hungary, Romania and Slovakia through Horizon TV or Horizon Lite, and in some of our European markets also via Horizon Go. At the 2016 Content Innovation Awards, Liberty Global, together with its former subsidiary Ziggo Group Holding (now part of VodafoneZiggo), received the Pay TV Initiative for the Year Award for its Replay TV service.
In most of our markets, we offer pay-per-view programming through VoD giving subscribers access to thousands of movies and television series. In several of our European markets, our subscription VoD service “MyPrime” is available for an additional fee with our basic video services and is included in our enhanced video services accessed through the Horizon TV platform. MyPrime is tailored to the specific market based on available content, consumer preferences and competitive offers. In Germany, subscription VoD is available through a partnership with Maxdome GmbH, and in Belgium, the service is marketed under “Play” and “Play More”. We continue to develop our VoD services to provide a growing collection of programming from local and international suppliers, such as ABC/Disney, A+E Networks, NBC/Universal, CBS/Paramount, the BBC, Warner TV and Sony, among others.
Our VoD services, including catch-up TV, are available on a subscription basis or a transaction basis, depending on the tier of enhanced video service selected by the subscriber. Customers who subscribe to an extended digital tier generally receive a VoD enabled set-top box without an additional monthly charge. The subscription-based VoD service includes various programming, such as music, kids, documentaries, adult, sports and television series.
Subscribers access our enhanced video service by renting a set-top box with a smart card from our operators, or without a set-top box if a subscriber is only using our basic video service. Where Horizon TV is available, a subscriber to our enhanced video services has the option, for an incremental monthly charge, to upgrade the standard digital set-top box to a Horizon TV box (which has HD DVR capabilities and other additional features). No set-top box or smart card, however, is required to receive our basic digital services in our unencrypted footprints. In addition, expanded channel packages and premium channels and services are available for an incremental monthly fee in all of our markets.
WiFi and Internet Services
Connectivity is a building block for vibrant communities. As the largest international cable company, our fiber-rich broadband network is the backbone of our business and the basis of our connectivity strategy. To meet our customers’ expectations to be seamlessly connected, we are investing in the expansion of our broadband network, mobile and WiFi solutions and customer premises equipment.
Internet speed is of crucial importance to our customers, as they spend more time streaming video and other bandwidth-heavy services on multiple devices. Our extensive broadband network enables us to deliver ultra high-speed internet service across our markets. Our residential subscribers in Europe access the internet via cable modems connected to their internet capable devices, or wirelessly via a WiFi gateway device. We offer multiple tiers of broadband internet service ranging from a basic service of 10 Mbps in Germany to an ultra high-speed internet service of 500 Mbps in Switzerland, Hungary, Romania and Slovakia. The speed of service depends on the location and the tier of service selected. In addition, by leveraging our existing fiber-rich broadband networks and our Network Extension programs, we are well positioned to deliver gigabit services in our European markets. To
I-16
this end, by deploying the next generation DOCSIS 3.1 technology, we have the potential to extend our download speeds to at least 1 Gbps when fully deployed. DOCSIS technology is an international standard that defines the requirements for data transmission over a cable system. Currently, our ultra high-speed internet service is based primarily on DOCSIS 3.0 technology.
Our internet service generally includes email, address book and parental controls. We offer value-added broadband services in certain of our markets for an incremental charge. These services include security (e.g., anti-virus, anti-spyware, firewall and spam protection) and online storage solutions and web spaces. In many of our markets, we offer mobile broadband services with internet access as described below. Subscribers to our internet service pay a monthly fee based on the tier of service selected. In addition to the monthly fee, customers pay an activation service fee upon subscribing to an internet service. This one-time fee may be waived for promotional reasons. We determine pricing for each different tier of internet service through an analysis of speed, market conditions and other factors.
In late 2015, we introduced the "Connect Box", a dedicated connectivity device that delivers superior in-home WiFi coverage. The Connect Box is our next generation WiFi and telephony gateway that enables us to maximize the impact of our ultrafast broadband networks by providing reliable wireless connectivity anywhere in the home. It has an automatic WiFi optimization function, which selects the best possible wireless frequency at any given time. This gateway can be self-installed and allows customers to customize their home WiFi service. Our Connect Box is available in all our European markets. Robust wireless connectivity is increasingly important with our customers spending more and more time using bandwidth-heavy services on multiple devices.
In almost all of our European markets, we have deployed community WiFi via routers in the home (the Community WiFi), which provides a secure access to the internet for our customers. Community WiFi is enabled by a cable modem WiFi access point (WiFi modem) in the Connect Box, the set-top box or the Horizon TV box of our internet customers. The Community WiFi is created through the sharing of access to the public channel of our customers’ home wireless routers. Use of the Community WiFi does not affect the internet speeds of our customers. The public channel is a separate network from the secure private network used by the customer within the home and is automatically enabled when the WiFi modem is installed. Access is free for our internet customers. At December 31, 2016, we had 5.3 million WiFi access points in our Liberty Global Group footprint. In addition, our internet customers continue to have access to the Community WiFi in the Netherlands. We continue to expand our Community WiFi service throughout our European markets.
In the U.K., Virgin Media’s customers have access to an extensive network of public WiFi access points, including in the London underground train stations. Public WiFi access points (covering train stations, hotels, bars, restaurants and other public places) are also available to Unitymedia customers in Germany and to Telenet customers in Belgium. In Switzerland, Belgium, Hungary, Poland, Ireland and Romania, we are expanding our Community WiFi through access points covering public places. Our Community WiFi is branded as “Wi-Free” in most of our markets. Through an agreement with Comcast Corporation, our internet customers will also have access to millions of WiFi access points in the U.S. and across various European countries for no additional cost.
Mobile Services
Mobile services are another key building block for us to provide customers with seamless connectivity. We offer mobile services as an MVNO over third-party networks in the U.K., Germany, Belgium, Switzerland, Austria, Ireland and Hungary. Following the February 2016 acquisition of BASE, Telenet became a mobile network provider in Belgium and plans to migrate its current and future mobile subscribers to the BASE network prior to the termination of its MVNO agreement with a third-party provider at the end of 2018. We plan to add MVNO arrangements and, where appropriate, acquire or partner with mobile service providers with their own networks in all our broadband communication markets.
In Switzerland, Austria, Ireland, Hungary and, through 2018, Belgium, we provide our mobile telephony services as full MVNOs through partnerships with a third-party mobile network operator in their respective footprints of our country operations. All of these operations lease the third-party’s radio access network and own the core network, including switching, backbone and interconnections. These arrangements permit us to offer our customers in these markets mobile services without having to build and operate a cellular radio tower network. Beginning in 2017, our mobile operations in the U.K. will move from a light MVNO to a full MVNO arrangement due to a revised agreement with the third-party network provider. In Germany, we provide mobile telephony as a light MVNO. In this case, we lease the core network as well as the radio access network from a mobile network operator. This arrangement permits our German customers to have access to the third-party mobile communications services while we maintain the customer relationship.
Where mobile services are available subscribers pay varying monthly fees depending on whether the mobile service is combined with our fixed-line telephony service or includes mobile data services via mobile phones, tablets or laptops. We offer our customers
I-17
the option to purchase mobile handsets and, in the U.K., Belgium, Switzerland, Austria, Ireland and Hungary, make such purchase pursuant to a contract independent of their mobile services contract. We refer to these arrangements as split contracts.
We typically charge a one-time activation fee to our customers for each SIM card. Our mobile services typically include voice, short message service (or SMS) and internet access. Calls, both within and out of network, incur a charge or are covered under a postpaid monthly service plan. Our mobile services are primarily on a postpaid basis with customers subscribing to services for periods ranging from activation for a SIM-only contract to up to 24 months, with the latter often taken with a subsidized mobile handset. In Belgium, Switzerland and Austria, however, our postpaid service is offered without a minimum contract term. In the U.K. and Belgium, we also offer a prepaid service, where the customers pay in advance for a pre-determined amount of airtime or data and generally have no minimum contract term. In almost all of our markets, subscribers to a double-or triple-play bundle receive a discount on their mobile service fee.
Telephony Services
Multi-feature telephony services are available through voice-over-internet-protocol (VoIP) technology in most of our broadband communication markets. In the U.K. and Hungary, we also provide traditional circuit-switched telephony services. We pay interconnect fees to other telephony and internet providers when calls by our subscribers terminate on another network and receive similar fees from providers when calls by their users terminate on our network through interconnection points.
Our telephony service may be selected in several of our markets on a standalone basis and in all of our markets in combination with one or more of our other services. Our telephony service includes a basic fixed-line telephony product for line rental and various calling plans, which may consist of any of the following: unlimited network, national or international calling, unlimited off-peak calling and minute packages, including calls to fixed and mobile phones. We also offer value added services, such as a personal call manager, unified messaging and a second or third phone line at an incremental cost.
Multiple Dwelling Units and Partner Networks
Almost two-thirds of Unitymedia’s video customers are in multiple dwelling units where Unitymedia has the billing relationship with the landlord or housing association or with a third-party (Professional Operator) that operates and administers the in-building network on behalf of housing associations. Many of these agreements allow Unitymedia to offer its digital video, broadband internet and fixed-line telephony services directly to the end customer. Professional Operators may procure the basic video signals from Unitymedia at volume-based discounts and will generally resell them to housing associations with whom the operator maintains the customer relationship. Unitymedia has entered into agreements with Professional Operators, such as Tele Columbus Multimedia GmbH, that allow Unitymedia to market its digital video, broadband internet and fixed-line telephony services directly to the Professional Operator’s subscriber base.
Pursuant to an agreement executed on June 28, 2008 (the PICs Agreement) with four associations of municipalities in Belgium (the pure intercommunales or PICs), Telenet leases the PICs broadband communications network and, accordingly, makes its services available to all of the homes passed by the cable network owned by the PICs. Telenet has a direct customer relationship with the basic and enhanced video subscribers on the PICs network. Pursuant to the PICs Agreement, Telenet has full rights to use substantially all of the PICs network under a long-term capital lease. Unless extended, the PICs Agreement will expire on September 23, 2046, and cannot be terminated earlier (except in the case of non-payment or bankruptcy of Telenet). For additional information on the PICs Agreement, see note 17 to our consolidated financial statements included in Part II of this Annual Report on Form 10-K.
For approximately two-thirds of the basic video subscribers in UPC Holding’s Switzerland operations (UPC Switzerland), UPC Switzerland maintains billing relationships with landlords or housing associations and provides basic video service to the tenants. The landlord or housing association administers the billing for the basic video service with their tenants and manages service terminations for their rental units. When tenants select triple-play bundles with or without mobile service from UPC Switzerland, they then migrate to a direct billing relationship with us.
UPC Switzerland offers enhanced video, broadband internet and telephony services directly to the video cable subscribers of those partner networks that enter into service operating contracts with UPC Switzerland. UPC Switzerland has the direct customer billing relationship with these subscribers. By permitting UPC Switzerland to offer some or all of its enhanced video, broadband internet and telephony products directly to those partner network subscribers, UPC Switzerland’s service operating contracts have expanded the addressable markets for UPC Switzerland’s digital products. In exchange for the right to provide digital products directly to the partner network subscribers, UPC Switzerland pays to the partner network a share of the revenue generated from those subscribers. UPC Switzerland also provides network maintenance services and engineering and construction services to its partner networks.
I-18
Business Services
In addition to our residential services, we offer business services in all of our European operations. For business and public sector organizations, we provide a range of voice, advanced data, video, wireless and cloud-based services, as well as mobile and converged fixed-mobile services. Our business customers include SOHO (generally up to five employees), small business and medium and large enterprises. We also provide business services on a wholesale basis to other operators.
Our business services are designed to meet the specific demands of our business customers with a wide range of services, including increased data transmission speeds and virtual private networks. These services fall into five broad categories:
• | VoIP and circuit-switch telephony, hosted private branch exchange solutions and conferencing options; |
• | data services for internet access, virtual private networks and high capacity point-to-point services; |
• | wireless services for mobile voice and data, as well as managed WiFi networks; |
• | video programming packages and select channel lineups for targeted industries; and |
• | value added services, including webhosting, managed security systems and storage and cloud enabled software. |
Our intermediate to long-term strategy is to enhance our capabilities and offerings in the business sector so we become a preferred provider in the business market. To execute this strategy, customer experience and strategic marketing play a key role.
Our business services are provided to customers at contractually established prices based on the size of the business, type of services received and the volume and duration of the service agreement. SOHO and small business customers pay business market prices on a monthly subscription basis to receive enhanced service levels and business features that support their needs. For more advanced business services, these customers generally enter into a service agreement. For medium to large business customers, we enter into individual agreements that address their needs. These agreements are generally for a period of at least one year.
Investments—VodafoneZiggo
We own a 50% interest in VodafoneZiggo, which has a nationwide integrated broadband and mobile network in the Netherlands. In connection with the formation of VodafoneZiggo, we entered into a shareholders agreement with Vodafone providing for the governance of VodafoneZiggo, including decision-making process, information access, dividend policy and non-compete provisions. It also provides for restrictions on transfer of interests in VodafoneZiggo and exit arrangements. Under the dividend policy, VodafoneZiggo is required to distribute all unrestricted cash to Vodafone and us, subject to minimum cash requirements and financing arrangements. We also entered into a framework agreement with VodafoneZiggo to provide access to each partner’s expertise in the telecommunications business. For additional information on the above agreements, see note 6 to our consolidated financial statements included in Part II of this Annual Report on Form 10-K.
The fiber-rich broadband network of VodafoneZiggo passes 7.1 million homes. VodafoneZiggo also offers nationwide mobile coverage. At December 31, 2016, VodafoneZiggo had nearly 14.8 million subscribers of which 4.0 million were video, 3.2 million were high-speed broadband, 2.5 million were fixed-line telephony and 5.1 million were mobile. In addition to its residential services, VodafoneZiggo offers extensive business services throughout the Netherlands. The operations of VodafoneZiggo are subject to various regulations, which are described below under Regulatory Matters--Europe--The Netherlands.
VodafoneZiggo customers continue to have access to Ziggo Group Holding’s Horizon TV and its functionalities (marketed as Ziggo TV), including Replay TV, 300 Mbps nationwide broadband internet and an extensive WiFi Community network. They also have access to Vodafone’s nationwide long-term evolution wireless service, also called “4G” (referred to herein as LTE) services, under either a prepaid or postpaid service plan. With its mobile services, VodafoneZiggo is able to offer its customers quad-play bundles and plans to market converged services in 2017 to residential and business customers.
Digital subscribers of VodafoneZiggo may subscribe to premium channels and VoD services, including catch-up television, on a subscription or transaction basis. Its premium channels include sports channels from Ziggo Sport Totaal. It also owns the Ziggo Sport channel, which is available exclusively to VodafoneZiggo customers. In addition to Horizon TV, VodafoneZiggo also offers its customers a cloud-based interactive television service using existing set-top boxes. By combining IP protocol with the standard set-top box, devices without built-in hardware functionality for interactivity can make use of interactive services through the VodafoneZiggo cable network.
VodafoneZiggo offers multiple tiers of broadband internet service ranging from a basic service of 40 Mbps to an ultra high-speed internet service of either 150 Mbps or 300 Mbps. The speed of service depends on the tier of service selected. Its internet service generally includes email, address book and parental controls. It also offers value-added broadband services, which include security (e.g., anti-virus, anti-spyware, firewall and spam protection) and online storage solutions and web spaces. VodafoneZiggo
I-19
also offers mobile broadband services. Its customers have access to the Community WiFi in the Netherlands and in our European footprint.
VodafoneZiggo also offers multi-feature telephony services. This service includes a basic fixed-line telephony product for line rental and various calling plans, which may consist of any of the following: unlimited network, national or international calling, unlimited off-peak calling and minute packages, including calls to fixed and mobile phones. In addition, value added services, such as a personal call manager, unified messaging and a second or third phone line, are available.
For all its services, VodafoneZiggo competes primarily with the provision of similar services from the incumbent telecommunications operator Koninklijke KPN N.V. (KPN). KPN offers (1) internet protocol television (IPTV) over fiber optic lines where the fiber is to the home, cabinet, or building or to the node networks (fiber-to-the-home/-cabinet/-building/-node is referred to herein as FTTx) networks and through broadband internet connections using DSL or very high-speed DSL technology (VDSL) or an enhancement to VDSL called “vectoring”, (2) digital terrestrial television (DTT), and (3) LTE services. Where KPN has enhanced its VDSL system, it offers broadband internet with download speeds of 100 Mbps or 200 Mbps and on its FTTx networks, it offers download speeds of up to 500 Mbps. Its ability to offer a bundled triple-play of video, broadband internet and telephony services and fixed-mobile convergence services, creates significant competitive pressure on VodafoneZiggo’s operations, including the pricing and bundling of its video products. KPN’s video services include many of the interactive features VodafoneZiggo offers its subscribers and KPN is currently testing a new set-top box that is expected to enhance the video experience for its customers. In addition, KPN has its own over-the-top (OTT) video service. Portions of VodafoneZiggo’s network have been overbuilt by KPN’s and other providers’ FTTx networks and expansion of these networks is expected to continue.
I-20
LiLAC Group Statistics
The following tables present certain operating data as of December 31, 2016, with respect to the networks of our consolidated subsidiaries attributed to the LiLAC Group. The following tables reflect 100% of the data applicable to each of our subsidiaries regardless of our ownership percentage. Percentages are rounded to the nearest whole number.
Consolidated Operating Data - December 31, 2016
Homes Passed (1) | Two-way Homes Passed (2) | Customer Relationships (3) | Total RGUs (4) | Video | |||||||||||||||||||||||||||||
Basic Video Subscribers (5) | Enhanced Video Subscribers (6) | DTH Subscribers (7) | Total Video | Internet Subscribers (8) | Telephony Subscribers (9) | Mobile Subscribers (10) | |||||||||||||||||||||||||||
LiLAC Group: | |||||||||||||||||||||||||||||||||
Chile | 3,216,600 | 2,710,500 | 1,328,900 | 2,795,500 | 79,500 | 967,800 | — | 1,047,300 | 1,091,200 | 657,000 | 166,200 | ||||||||||||||||||||||
CWC: | |||||||||||||||||||||||||||||||||
Panama | 527,800 | 416,300 | 336,000 | 453,400 | — | 42,800 | 39,700 | 82,500 | 95,700 | 275,200 | 1,736,300 | ||||||||||||||||||||||
Jamaica | 424,300 | 424,300 | 295,900 | 496,000 | — | 102,500 | — | 102,500 | 172,300 | 221,200 | 944,800 | ||||||||||||||||||||||
Trinidad & Tobago | 310,500 | 310,500 | 166,400 | 271,400 | — | 117,200 | — | 117,200 | 123,500 | 30,700 | — | ||||||||||||||||||||||
Barbados | 121,800 | 121,800 | 92,200 | 162,500 | — | 18,400 | — | 18,400 | 62,500 | 81,600 | 131,500 | ||||||||||||||||||||||
Bahamas | 155,000 | 155,000 | 55,200 | 83,100 | — | 1,600 | — | 1,600 | 26,400 | 55,100 | 315,200 | ||||||||||||||||||||||
Other | 354,300 | 334,500 | 211,800 | 317,400 | 10,100 | 73,400 | — | 83,500 | 122,300 | 111,600 | 399,000 | ||||||||||||||||||||||
Total CWC | 1,893,700 | 1,762,400 | 1,157,500 | 1,783,800 | 10,100 | 355,900 | 39,700 | 405,700 | 602,700 | 775,400 | 3,526,800 | ||||||||||||||||||||||
Puerto Rico | 1,092,300 | 1,092,300 | 403,700 | 799,100 | — | 261,300 | — | 261,300 | 329,000 | 208,800 | — | ||||||||||||||||||||||
Total LiLAC Group | 6,202,600 | 5,565,200 | 2,890,100 | 5,378,400 | 89,600 | 1,585,000 | 39,700 | 1,714,300 | 2,022,900 | 1,641,200 | 3,693,000 | ||||||||||||||||||||||
I-21
__________________
(1) | Homes Passed are homes, residential multiple dwelling units or commercial units that can be connected to our networks without materially extending the distribution plant, except for DTH homes. Our Homes Passed counts are based on census data that can change based on either revisions to the data or from new census results. We do not count home passed for DTH. |
(2) | Two-way Homes Passed are Homes Passed by those sections of our networks that are technologically capable of providing two-way services, including video, internet and telephony services. |
(3) | Customer Relationships are the number of customers who receive at least one of our video, internet or telephony services that we count as RGUs, without regard to which or to how many services they subscribe. To the extent that RGU counts include EBU adjustments, we reflect corresponding adjustments to our Customer Relationship counts. For further information regarding our EBU calculation, see Additional General Notes to Tables below. Customer Relationships generally are counted on a unique premises basis. Accordingly, if an individual receives our services in two premises (e.g., a primary home and a vacation home), that individual generally will count as two Customer Relationships. We exclude mobile-only customers from Customer Relationships. |
(4) | RGU is separately a Basic Video Subscriber, Enhanced Video Subscriber, DTH Subscriber, Internet Subscriber or Telephony Subscriber (each as defined and described below). A home, residential multiple dwelling unit, or commercial unit may contain one or more RGUs. For example, if a residential customer in our Chilean market subscribed to our enhanced video service, fixed-line telephony service and broadband internet service, the customer would constitute three RGUs. Total RGUs is the sum of Basic Video, Enhanced Video, DTH, Internet and Telephony Subscribers. RGUs generally are counted on a unique premises basis such that a given premises does not count as more than one RGU for any given service. On the other hand, if an individual receives one of our services in two premises (e.g., a primary home and a vacation home), that individual will count as two RGUs for that service. Each bundled cable, internet or telephony service is counted as a separate RGU regardless of the nature of any bundling discount or promotion. Non-paying subscribers are counted as subscribers during their free promotional service period. Some of these subscribers may choose to disconnect after their free service period. Services offered without charge on a long-term basis (e.g., VIP subscribers, free service to employees) generally are not counted as RGUs. We do not include subscriptions to mobile services in our externally reported RGU counts. In this regard, our December 31, 2016 RGU counts exclude our separately reported postpaid and prepaid mobile subscribers. |
(5) | Basic Video Subscriber is a home, residential multiple dwelling unit or commercial unit that receives our video service over our broadband network either via an analog video signal or via a digital video signal without subscribing to any recurring monthly service that requires the use of encryption-enabling technology. Encryption-enabling technology includes smart cards, or other integrated or virtual technologies that we use to provide our enhanced service offerings. With the exception of RGUs that we count on an EBU basis, we count RGUs on a unique premises basis. In other words, a subscriber with multiple outlets in one premises is counted as one RGU and a subscriber with two homes and a subscription to our video service at each home is counted as two RGUs. |
(6) | Enhanced Video Subscriber is a home, residential multiple dwelling unit or commercial unit that receives our video service over our broadband network via a digital video signal while subscribing to any recurring monthly service that requires the use of encryption-enabling technology. Enhanced Video Subscribers that are not counted on an EBU basis are counted on a unique premises basis. For example, a subscriber with one or more set-top boxes that receives our video service in one premises is generally counted as just one subscriber. An Enhanced Video Subscriber is not counted as a Basic Video Subscriber. As we migrate customers from basic to enhanced video services, we report a decrease in our Basic Video Subscribers equal to the increase in our Enhanced Video Subscribers. |
(7) | DTH Subscriber is a home, residential multiple dwelling unit or commercial unit that receives our video programming broadcast directly via a geosynchronous satellite. |
(8) | Internet Subscriber is a home, residential multiple dwelling unit or commercial unit that receives internet services over our networks. Our Internet Subscribers do not include customers that receive services from dial-up connections. |
(9) | Telephony Subscriber is a home, residential multiple dwelling unit or commercial unit that receives voice services over our networks. Telephony Subscribers exclude mobile telephony subscribers. |
(10) | Mobile Subscriber is an active SIM card in service rather than services provided. For example, if a Mobile Subscriber has both a data and voice plan on a smartphone this would equate to one Mobile Subscriber. Alternatively, a subscriber who has a voice and data plan for a mobile handset and a data plan for a laptop (via a dongle) would be counted as two Mobile Subscribers. Customers who do not pay a recurring monthly fee are excluded from our Mobile Subscriber counts after periods of inactivity ranging from 30 to 90 days, based on industry standards within the respective country. |
Additional General Notes to Table:
Most of our broadband communications subsidiaries provide telephony, broadband internet, data, video or other business services. Certain of our business service revenue is derived from SOHO subscribers that pay a premium price to receive enhanced service levels along with video, internet or telephony services that are the same or similar to the mass marketed products offered to our residential subscribers. All mass marketed products provided to SOHOs, whether or not accompanied by enhanced service levels and/or premium prices, are included in the respective RGU and customer counts of our broadband communications operations, with only those services provided at premium prices considered to be “SOHO RGUs” or “SOHO customers”. SOHO customers of CWC are not included in our
I-22
respective RGU and customer counts as of December 31, 2016. With the exception of our business SOHO subscribers, we generally do not count customers of business services as customers or RGUs for external reporting purposes.
Certain of our residential and commercial RGUs are counted on an EBU basis, including residential multiple dwelling units and commercial establishments, such as bars, hotels and hospitals, in Chile and Puerto Rico. Our EBUs are generally calculated by dividing the bulk price charged to accounts in an area by the most prevalent price charged to non-bulk residential customers in that market for the comparable tier of service. As such, we may experience variances in our EBU counts solely as a result of changes in rates.
While we take appropriate steps to ensure that subscriber statistics are presented on a consistent and accurate basis at any given balance sheet date, the variability from country to country in (1) the nature and pricing of products and services, (2) the distribution platform, (3) billing systems, (4) bad debt collection experience and (5) other factors add complexity to the subscriber counting process. We periodically review our subscriber counting policies and underlying systems to improve the accuracy and consistency of the data reported on a prospective basis. Accordingly, we may from time to time make appropriate adjustments to our subscriber statistics based on those reviews.
Subscriber information for acquired entities, including CWC, is preliminary and subject to adjustment until we have completed our review of such information and determined that it is presented in accordance with our policies.
I-23
Network & Product Penetration Data (%) - December 31, 2016
Chile | Panama | Puerto Rico | Jamaica | Trinidad & Tobago | Barbados | Bahamas | Other CWC | |||||||||
LiLAC Group Network Data: | ||||||||||||||||
Two-way homes passed percentage (1) | 84 | 79 | 100 | 100 | 100 | 100 | 100 | 93 | ||||||||
Homes passed percentage—Cable (2) | 100 | 42 | 100 | 64 | 100 | — | — | 52 | ||||||||
Homes passed percentage—FTTx (2) | — | — | — | — | — | 100 | 17 | 5 | ||||||||
Homes passed percentage—(V)DSL (2) | — | 58 | — | 36 | — | — | 83 | 43 | ||||||||
Digital video availability percentage (3) | 91 | 54 | 100 | 71 | 57 | 61 | 78 | 70 | ||||||||
Broadband internet availability percentage (3) | 84 | 48 | 100 | 31 | 72 | 87 | 88 | 70 | ||||||||
Fixed-line telephony availability percentage (3) | 84 | 53 | 100 | 43 | 65 | 99 | 92 | 80 | ||||||||
LiLAC Group Product Penetration: | ||||||||||||||||
Cable television penetration (4) | 33 | 8 | 24 | 24 | 38 | 15 | 1 | 24 | ||||||||
Enhanced video penetration (5) | 92 | 100 | 100 | 100 | 100 | 100 | 100 | 88 | ||||||||
Broadband internet penetration (6) | 40 | 23 | 30 | 41 | 40 | 51 | 17 | 37 | ||||||||
Fixed telephony penetration (6) | 24 | 66 | 19 | 52 | 10 | 67 | 36 | 33 | ||||||||
Double-play penetration (7) | 27 | 17 | 14 | 37 | 33 | 46 | 44 | 41 | ||||||||
Triple-play penetration (7) | 42 | 9 | 42 | 15 | 15 | 15 | 3 | 4 | ||||||||
I-24
__________________
(1) | Percentage of total homes passed that are two-way homes passed. |
(2) | Percentage of total homes passed served by a cable, FTTx or DSL network. |
(3) | Percentage of total homes passed to which digital video, broadband internet or fixed-line telephony services, as applicable, are made available. |
(4) | Percentage of total homes passed that subscribe to cable television services (Basic Video or Enhanced Video). |
(5) | Percentage of cable television subscribers (Basic Video and Enhanced Video Subscribers) that are Enhanced Video Subscribers. |
(6) | Percentage of two-way homes passed that subscribe to broadband internet or fixed-line telephony services, as applicable. |
(7) | Percentage of total customers that subscribe to two services (double-play customers) or three services (triple-play customers) offered by our operations (video, broadband internet and fixed-line telephony). |
I-25
Video, Broadband Internet & Fixed-Line Telephony and Mobile Services - December 31, 2016
Chile | Panama | Puerto Rico | Jamaica | Trinidad & Tobago | Barbados | Bahamas | Other CWC | ||||||||||
LiLAC Group: | |||||||||||||||||
Video services: | |||||||||||||||||
Network System (1) | HFC | (V)DSL/HFC | HFC | (V)DSL/HFC | HFC | (V)DSL/FTTx | (V)DSL/FTTx | HFC/ (V)DSL/FTTx | |||||||||
Broadband internet service: | |||||||||||||||||
Maximum download speed offered (Mbps) | 160 | 300 | 300(3) | 100 | 240(4) | 1,000 | 100 | 480(5) | |||||||||
Mobile systems: | |||||||||||||||||
Number of Mobile SIM cards (in 000’s)(2) | 166 | 1,736 | 945 | 132 | 315 | 399 | |||||||||||
Prepaid | 8 | 1,566 | 922 | 102 | 282 | 343 | |||||||||||
Postpaid | 158 | 170 | 23 | 30 | 33 | 56 | |||||||||||
_________________
(1) | These are the primary systems used for delivery of services in the countries indicated. “HFC” refers hybrid fiber coaxial cable networks. “(V)DSL” refers to both our |
DSL and VDSL networks.
(2) | Represents the number of active SIM cards in service. See note 10 to Consolidated Operating Data table above for how these are counted. |
(3) | In certain areas, speeds of up to 400 Mbps are available. |
(4) | Speeds of up to 1 Gbps available in limited areas. |
(5) | The majority of the “Other CWC” operations offer speeds of up to 100 Mbps. |
I-26
LiLAC Group Products and Services
Our LiLAC Group has broadband operations predominately in Latin America and the Caribbean serving residential and business customers. Our sub-sea network, together with our fixed-line networks and mobile platforms, allow us to offer end-to-end communications to customers. In Puerto Rico, our network includes a fiber ring around the island that is over 400 miles long, which provides enhanced interconnectivity points to the island’s other local and international telecommunications companies. These communication networks enable us to offer business services and wholesale services throughout the Caribbean and in parts of Latin America. These networks also support our offers of video, broadband internet, fixed-line telephony and mobile in our residential markets. Our services are provided through VTR in Chile, Liberty Puerto Rico in Puerto Rico and CWC in the Caribbean and parts of Latin America and the Seychelles. The operations of CWC are provided through various consolidated subsidiaries, including the following subsidiaries where we own less than 100%: Cable & Wireless Panama, SA (a 49.0%-owned entity that owns most of our operations in Panama), the Bahamas Telecommunications Company Limited (a 49.0%-owned entity that owns all of our operations in the Bahamas), Cable & Wireless Jamaica Limited (an 82.0%-owned entity that owns the majority of our operations in Jamaica) and Cable & Wireless Barbados Limited (an 81.1%-owned entity that owns the majority of our operations in Barbados).
Residential Services
For our residential customers, we offer a comprehensive set of converged consumer mobile, fixed-line telephony, broadband and video services primarily across the Caribbean and Latin America regions as summarized in the table below:
Mobile | Internet | Video | Telephony | ||||
Chile | X | X | X | X | |||
Panama | X | X | X | X | |||
Puerto Rico | X | X | X | ||||
Jamaica | X | X | X | X | |||
Trinidad & Tobago | X | X | X | ||||
Barbados | X | X | X | X | |||
The Bahamas | X | X | X | X | |||
Anguilla | X | X | X | X | |||
Antigua & Barbuda | X | X | X | ||||
British Virgin Islands | X | X | X | ||||
Cayman Islands | X | X | X | X | |||
Curaçao | X | X | X | ||||
Dominica | X | X | X | ||||
Grenada | X | X | X | X | |||
Montserrat | X | X | X | ||||
Seychelles | X | X | X | X | |||
St Kitts & Nevis | X | X | X | ||||
St Lucia | X | X | X | X | |||
St Vincent & the Grenadines | X | X | X | X | |||
Turks & Caicos | X | X | X | X | |||
We offer mobile services throughout most of our Latin America and Caribbean footprint and in the Seychelles. We are a mobile network provider in Panama and most of our Caribbean markets, including the Bahamas and Jamaica. As a mobile network provider, we are able to offer a full range of voice and data services, including value-added services such as SMS, mobile internet and email access. This also provides us with the basis to offer our customers extensive converged products where we also offer video, internet and fixed-line telephony giving customers connectivity in and out of the home. For these mobile services we hold spectrum licenses with terms ranging from 10 to 15 years. In Chile we provide mobile services as an MVNO where VTR leases a third-party's radio access network. This arrangement permits us to offer our customers in Chile mobile services without having to own and operate a cellular radio tower network.
I-27
Subscribers to our mobile services pay varying monthly fees depending on whether the mobile service is included with one of our other services or includes mobile data services via mobile phones, tablets or laptops. Our mobile services are available on a postpaid or prepaid basis with most customers purchasing a prepaid plan. We offer our customers the option to purchase mobile handsets with purchase terms typically related to whether the customer selects a prepaid or postpaid plan. Customers selecting a prepaid plan or service pay in advance for a pre-determined amount of airtime or data and generally do not enter into a minimum contract term. Customers subscribing to a postpaid plan generally enter into contracts ranging from 12 to 24 months. The long-term contracts are often taken with a subsidized mobile handset. For each SIM card, we typically charge a one-time activation fee to our prepaid customers. Calls within and out of network incur a separate charge if not covered within a prepaid plan or under a postpaid monthly service plan. Our mobile services include voice, SMS and internet access.
CWC is the incumbent fixed-line telephony service provider in many of its Caribbean markets and in certain markets the sole fixed-line provider. CWC offers multi-feature telephony service over its various fixed networks, including cable, DSL, FTTx and copper networks. Depending on location, these services are provided via either circuit-switched telephony or VoIP technology. As the need arises, we are replacing obsolete switches with VoIP technology and older copper networks with modern fiber optics. In addition, we continue to develop and invest in new technologies that will enhance our customers’ experiences. These digital telephony services range from usage-based to unlimited international, local and domestic services.
We offer video services in Chile, Puerto Rico, and in most of our CWC residential markets, including Panama, Jamaica, Trinidad and Tobago, Barbados and the Bahamas. To meet the demands of our customers, we have enhanced our video services with next generation, market leading digital television platforms that enable our customers to control when and where they watch their programming. These advanced services are delivered over our FTTx and hybrid fiber coaxial cable networks and include an advanced electronic programming guide, DVRs and VoD. In certain of our markets, customers can pause their programming even while the live broadcast is in progress.
In most of our markets, customers have access to VoD, which offers thousands of movies and other video content, such as kids, documentaries, adult, sports and television series, as well as music channels. Our VoD service is available on a transaction basis with certain VoD content available only through premium packages for an additional monthly charge. Customers who subscribe to our video service receive a VoD enabled set-top box without an additional monthly charge. We tailor our VoD services to the specific market based on available content, consumer preferences and competitive offers. We continue to develop our VoD services to provide a growing collection of programming from local and international suppliers, such as ABC/Disney, A+E Networks, NBC/Universal, Discovery and Turner Broadcasting, among others.
In Chile, we recently launched Horizon TV through an advanced, cloud-based platform. For customers who take Horizon TV, we offer over 20 apps for various online services (such as YouTube, social platforms and games). In several of our Caribbean markets, we offer a comprehensive internet streaming video service (marketed as “Flow ToGo”) that allows our video customers to stream over 50 real-time video channels anywhere they have a broadband connection in and out of the home and on multiple devices. A video streaming service is also available in Puerto Rico where our video customers can stream over 45 real-time video channels.
Our operations offer multiple tiers of digital video programming and audio services starting with a basic video service. All digital video services are encrypted and require a set-top box provided by us. Subscribers to our basic video service pay a fixed monthly fee and generally receive at least 70 video channels, including a limited number of HD channels, and several digital and analog radio channels. This service includes VoD access and an electronic programming guide. We also offer a variety of premium channel packages, including HD channels, to meet the special interest of our subscribers. For an additional monthly charge, a subscriber may upgrade to one of our extended digital tier services and receive an increased number of video and radio channels, including channels in the basic tier of service and additional HD channels. Digital subscribers may also subscribe to one or more packages of premium channels for an additional monthly charge. In markets where our analog service is available, subscribers to such video service typically receive fewer channels than subscribers to our basic video service, with the number of channels dependent on their location. Subscribers to our digital services also receive the channels available through our analog service.
We tailor our video services in each country of operation based on the programing preferences, culture, demographics and local regulatory requirements. Our channel offerings include general entertainment, sports, movies, documentaries, life styles, news, adult, children, ethnic and foreign channels. In all of our broadband operations, we continue to upgrade our systems to expand our digital services and encourage our analog subscribers to convert to a digital or premium digital service. Discounts to our monthly service fees are available to any subscriber who selects a bundled service of at least any two of the following: video, internet, fixed-line telephony and mobile. In Chile, we do not bundle our mobile services due to regulatory constraints.
Our customers are increasingly using online communications. To support our customers’ expectations for seamless connectivity, we are expanding our networks to make ultrafast broadband available to more people. This includes investment in
I-28
the convergence of our fixed and mobile data systems and making wireless systems available in the home. In 2016, we improved the connectivity of over 350,000 homes in Chile, Puerto Rico, Panama and other CWC markets through network extensions and upgrade projects. In 2017, we intend to improve connectivity to approximately 450,000 homes through network extensions and upgrades, including migrating customers from legacy copper networks to cable or fiber networks. In addition, in 2016, we deployed the Connect Box to our subscribers in Chile and Puerto Rico. Connect Box is a dedicated connectivity device that delivers superior in-home WiFi coverage. We plan to expand the availability of this WiFi and telephony gateway to our CWC markets beginning in 2017.
The internet speeds we offer is one of our differentiators, as customers spend more time streaming video and other bandwidth-heavy services on multiple devices. As a result, we are continuing to invest in additional bandwidth and technologies to increase internet speeds throughout our Latin America and Caribbean footprint. In 2016, we increased the top tier internet speed for our customers in Chile to 160 Mbps and in Puerto Rico to 300 Mbps. In certain areas of Puerto Rico, download speeds of up to 400 Mbps are available. We also increased our broadband internet speeds in the CWC footprint following the deployment of FTTx in Barbados and upgrades to our networks in Panama and Jamaica. As stated above, we plan to continue the upgrade and expansion of our fixed networks so that we can deploy high-speed internet service to additional customers in the coming years.
Our residential subscribers access the internet via DSL over our fixed-line telephony networks or via cable modems connected to their internet capable devices, including personal computers, or wirelessly via the Connect Box. In each of our markets, we offer multiple tiers of internet service. The speed of service depends on location and the tier of service selected by our subscriber. For example, our tiers of service range from 4 Mbps to 300 Mbps in Panama and from 20 Mbps to 100 Mbps in Jamaica and several of our other Caribbean markets. Higher speeds are available in certain other markets, including up to 1 Gbps in Barbados and in limited areas of Trinidad & Tobago.
Our internet service generally includes email, address book and parental controls with value-added services available for additional incremental charges. Our value-added services include security measures and online storage. Mobile broadband internet services are also available through our mobile services described above. Subscribers to our internet service pay a monthly fee based on the tier of service selected. In addition to the monthly fee, customers pay an activation service fee upon subscribing to an internet service. This one-time fee may be waived for promotional reasons. We determine pricing for each different tier of internet service through an analysis of speed, market conditions and other factors.
Business Services
Our business services represent a significant portion of CWC’s revenue, where it is one of the largest business service providers in the markets in which it operates. We also are one of the largest business service providers in Puerto Rico. We offer connectivity and wholesale solutions to carriers and businesses throughout the Caribbean and in parts of Latin America. Our sub-sea and terrestrial fiber optic cable networks include long-haul terrestrial backbone and metro fiber networks that provide access to major commercial zones, wireless carrier cell sites and customers in key markets within our operating footprint.
I-29
Below is a map of our sub-sea fiber network.
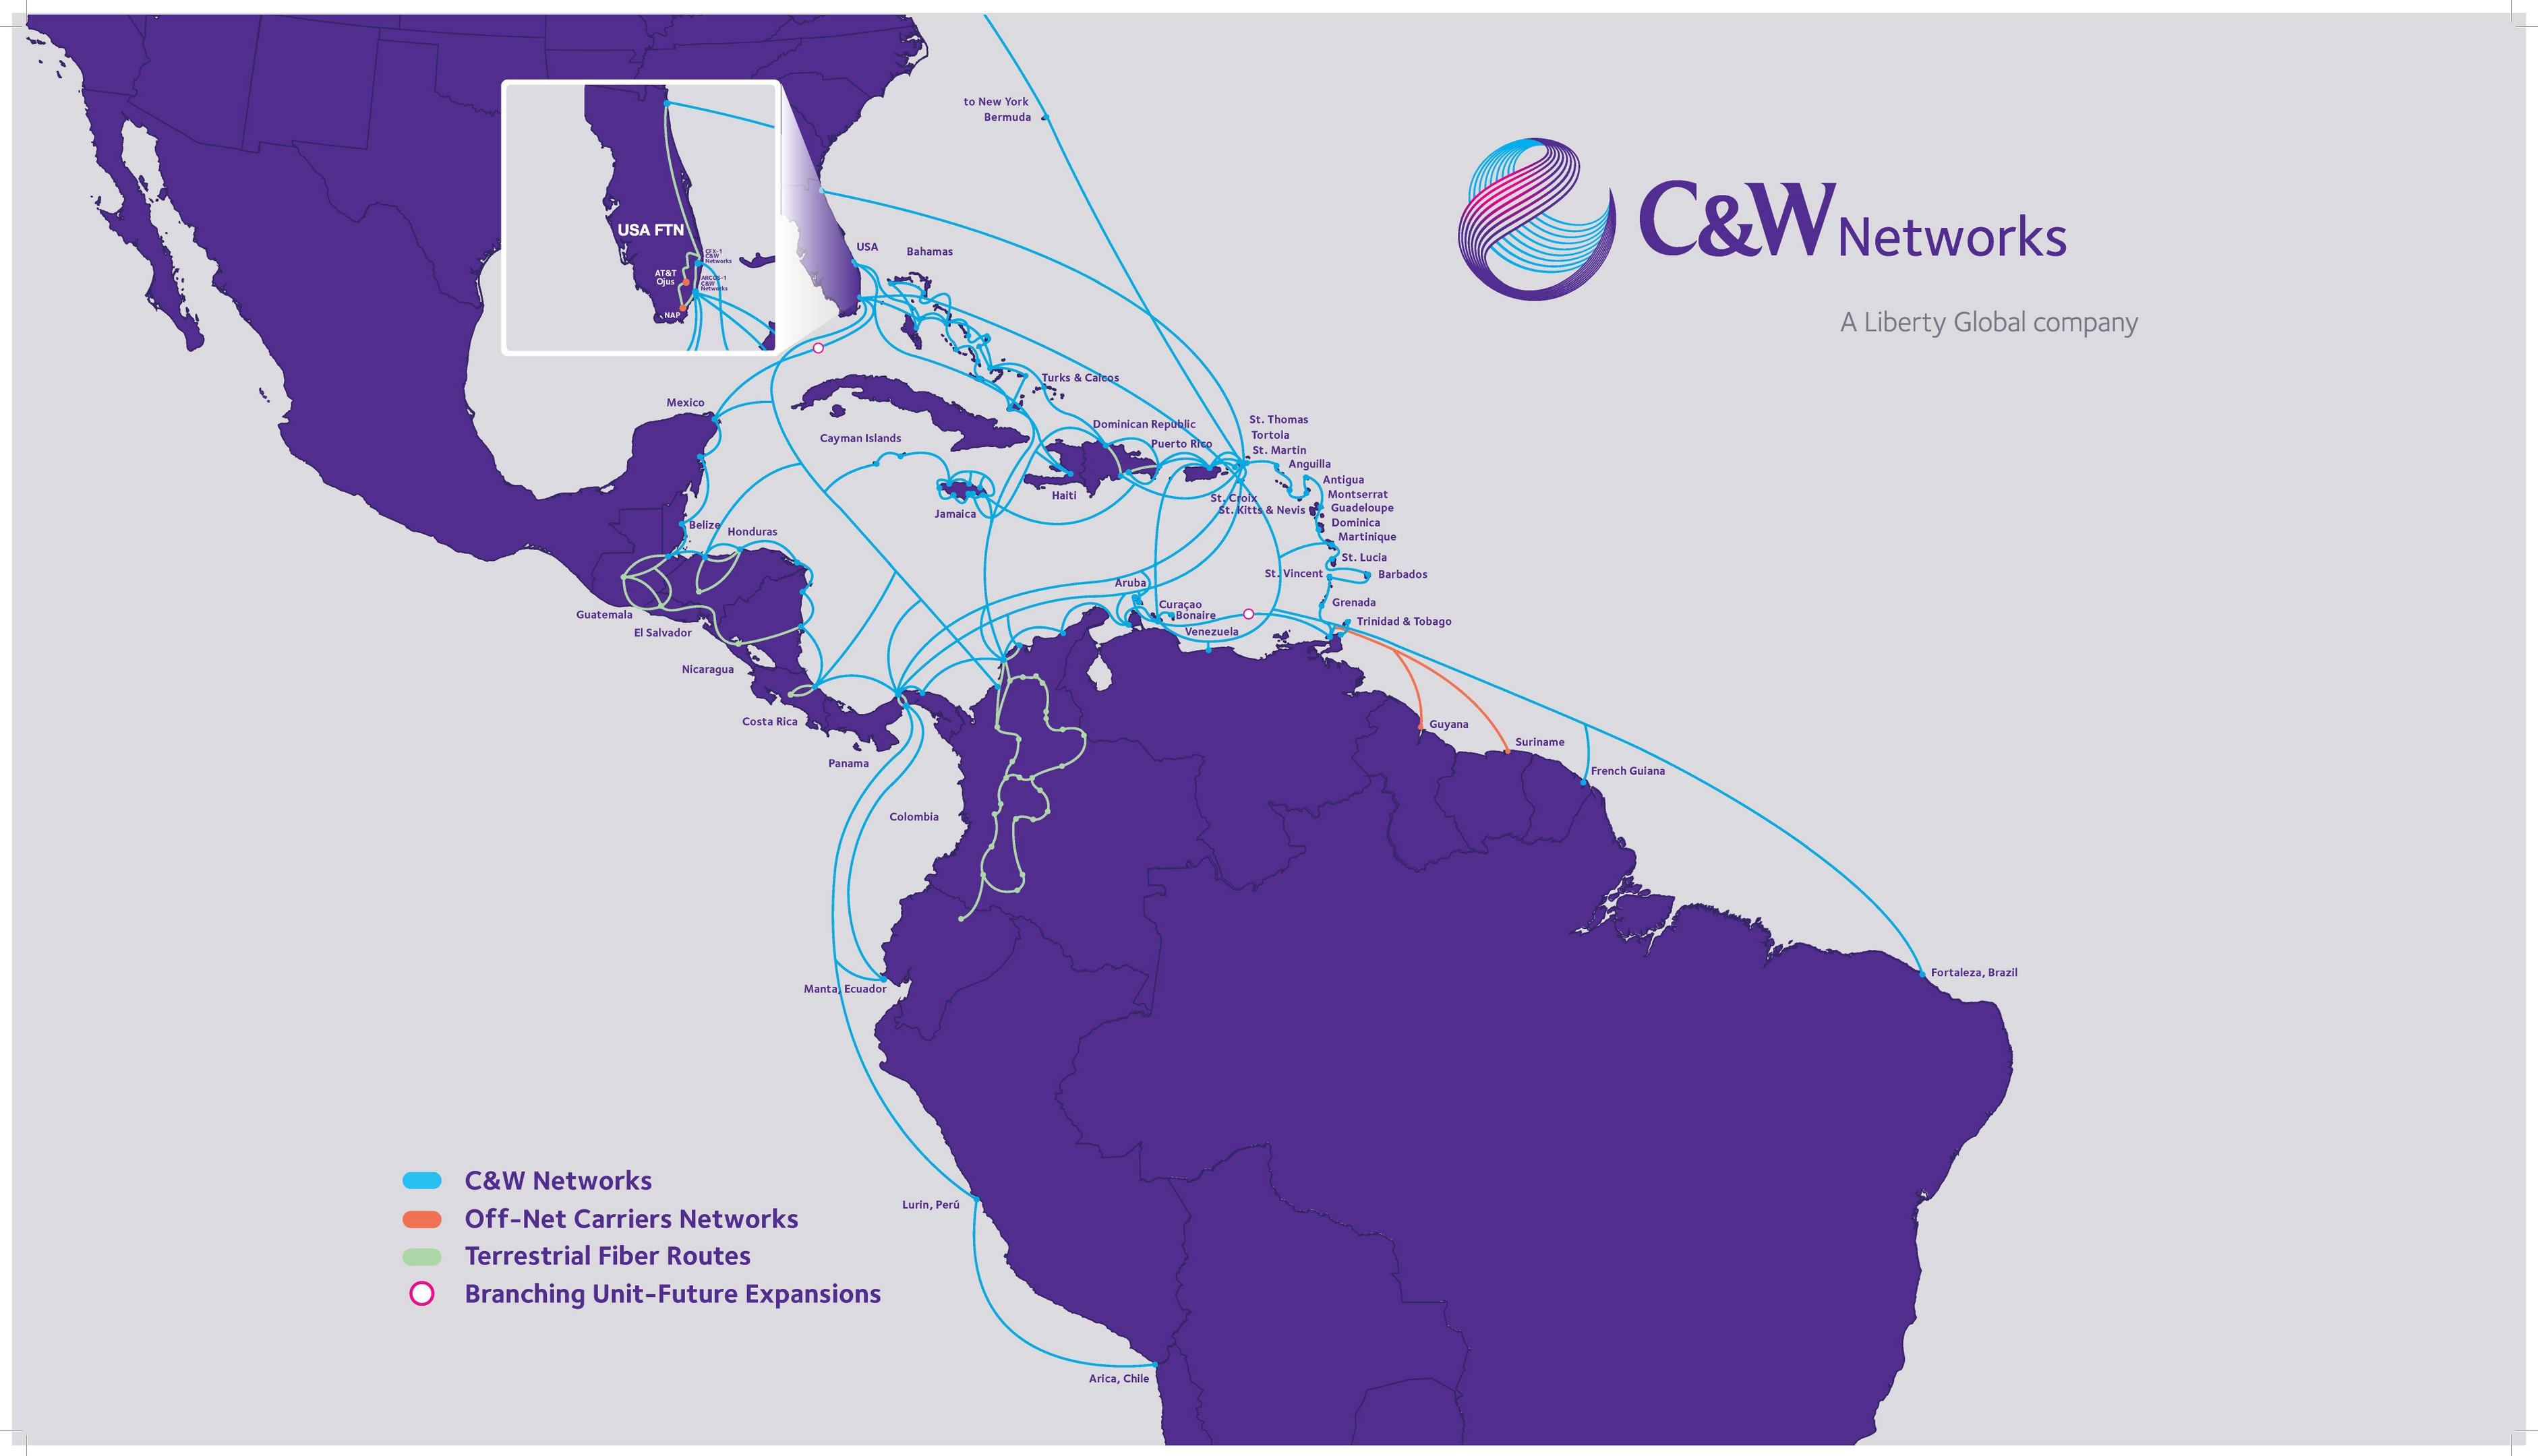
With over 48,000 km of fiber optic cable, and a current capacity of 2.0 Tbps (terabytes per second), CWC is able to carry large volumes of voice and data traffic on behalf of its customers, businesses and carriers. The networks also allow CWC to provide point-to-point, clear channel wholesale broadband capacity services, superior switching and routing capabilities and local network services to telecommunications carriers, internet service providers (ISPs) and large corporations. In case of outages on portions of the cable systems, the network provides inbuilt resiliency due to the capability of re-routing traffic. CWC is highly regarded for its wholesale services. In 2016, it was recognized for its innovation and excellence in wholesale services at the 2016 Global Carrier Awards where it received the Best Caribbean Wholesale Carrier Award for the fourth consecutive year. At the 2016 MEF Excellence Awards, CWC received the Wholesale Service Provider of the Year Award and the Service Innovation of the Year Award.
Our business operations focus on sales to small, medium and international companies and governmental agencies. Within the business community, we target specific industry segments, such as financial institutions, the hospitality sector, healthcare facilities, education institutions and government offices. We offer tailored solutions that combine our standard services with value added features, such as dedicated customer care and enhanced service performance monitoring. Our business products and services include voice, broadband, enterprise-grade connectivity, data center, hosting and managed solutions, as well as IT solutions. We also offer a range of data, voice and internet services to carriers, ISPs and mobile operators. Our extensive fiber optic cable networks allow us to deliver redundant, end-to-end connectivity. It also allows us to provide business customers our services over dedicated fiber lines and local networks; thereby, seamlessly connecting businesses anywhere in the region.
Our business services fall into five broad categories:
• | VoIP and circuit-switch telephony, hosted private branch exchange solutions and conferencing options; |
• | data services for internet access, virtual private networks and high capacity point-to-point services; |
• | wireless services for mobile voice and data, as well as WiFi networks; |
• | video programming packages and select channel lineups for targeted industries; and |
• | value added services, including webhosting, managed security systems and storage and cloud enabled software. |
I-30
We offer a comprehensive range of information and communication technology solutions to businesses and governmental agencies, including a full suite of cloud-based services, as well as a suite of commercial grade triple-play services. Our telephony and telecommunication services include flexible call handling, teleconferencing, voice mail and other premium calling features, as well as security, surveillance and backup services.
We work with businesses to customize their IT services based on the needs of the business. For these tailored services we enter into individual long-term agreements. For SOHO and small business customers, we generally enter into standard service agreements with contractually established prices based on the size of the business, the services received and the volume and duration of the services. We also have agreements to provide our services to our business customers over dedicated fiber lines and third-party fiber networks. Our intermediate to long-term strategy is to enhance our capabilities and offerings in the business sector so we become a preferred provider in the business market. To execute this strategy successfully, customer care is a key driver.
I-31
Additional Business Information
Technology
In most of our markets, our video, broadband internet and fixed-line telephony services are transmitted over a hybrid fiber coaxial cable network. This network is composed primarily of national and regional fiber networks, which are connected to the home over the last few hundred meters by coaxial cable. In several of our Caribbean markets, these services are transmitted over a fixed network consisting of FTTx, DSL or copper lines. Approximately 98% of our network allows for two-way communications and is flexible enough to support our current services as well as new services.
We closely monitor our network capacity and customer usage. Where necessary, we increase our capacity incrementally, for instance by splitting nodes in our cable network. We also continue to explore improvements to our services and new technologies that will enhance our customer’s connected entertainment experience. These actions include:
• | recapturing bandwidth and optimizing our networks by: |
◦ | increasing the number of nodes in our markets; |
◦ | increasing the bandwidth of our hybrid fiber coaxial cable network to 1 GHz; |
◦ | converting analog channels to digital; |
◦ | bonding additional DOCSIS 3.0 channels; |
◦ | deploying VDSL over our fixed telephony network; |
◦ | replacing copper lines with modern optic fibers; and |
◦ | using digital compression technologies. |
• | freeing spectrum for high-speed internet, VoD and other services by encouraging customers to move from analog to digital services; |
• | increasing the efficiency of our networks by moving headend functions (encoding, transcoding and multiplexing) to cloud storage systems; |
• | enhancing our network to accommodate business services; |
• | using wireless technologies to extend our services outside of the home; |
• | offering remote access to our video services through laptops, smart phones and tablets; |
• | expanding the availability of Horizon TV and related products and developing and introducing online media sharing and streaming or cloud-based video; and |
• | testing new technologies. |
As stated under General Development of Business—Expansion and Acquisitions above, we are expanding our hybrid fiber coaxial cable network through our Network Extension programs. For our mobile network operations in the Caribbean and Latin America, we are acquiring additional spectrum, enabling us to expand our LTE service in the region. In addition, we are seeking mobile service opportunities where we have established cable networks and expanding our fixed-line networks where we have a strong mobile offering. This will allow us to offer converged fixed-line and mobile services to our customers.
We deliver high-speed data and fixed-line telephony over our broadband network in our European markets and most of our Latin America and Caribbean markets. The cable networks of our operations in Europe are connected to our “Aorta” backbone. The Aorta backbone is recognized as a Tier 1 Carrier, which permits us to serve our customers through settlement free collaboration with other carriers without the cost of using a third-party network. For our operations in Latin America and the Caribbean, we deliver our high-speed data and fixed-line telephony over our various fixed networks, including cable, DSL, FTTx and copper networks. These networks are further connected via our sub-sea and terrestrial fiber optic cable network that provide connectivity within and outside the region.
In support of our connectivity strategy, we are moving our customers into a gigabit society. A majority of our broadband networks are already capable of supporting the next generation of ultra high-speed internet service at gigabit speeds. To provide these speeds to our subscribers, we are launching our next generation gateways that will enable DOCSIS 3.1 technology throughout our footprint. The launch of DOCSIS 3.1 technology will allow us to offer faster speeds, in-home WiFi and better services. Our Unitymedia operations have already demonstrated that download speeds of 2 Gbps can be achieved on our network. The new gateways and the continued upgrades to our network in the coming years will allow us to maximize high-speed connectivity over
I-32
our broadband networks and deliver gigabit services in a cost-effective manner. It will also allow us to meet the expectations of our customers for high-speed internet access both in cities and rural areas of our footprint.
Supply Sources
Content. With telecommunication companies increasingly offering similar services, content is one of the deciding factors for customers in selecting a video services provider. Therefore, in addition to providing services that allow our customers to view programming when and where they want, we are investing in content that customers want. Our content strategy is based on:
• | proposition (exceeding our customers' entertainment desires and expectations); |
• | product (delivering the best content available); |
• | procurement (investment in the best brands, shows and sports); and |
• | partnering (strategic alignment, acquisitions and growth opportunities). |
We license almost all of our programming and on-demand offerings from content providers and third-party rights holders, including broadcasters and cable programming networks. For such licenses, we generally pay a monthly fee on a per channel or per subscriber basis, with minimum pay guarantees in certain cases. We generally enter into long-term programming licenses with volume discounts and marketing support. For on-demand programming and streaming services, we generally enter into shorter-term agreements. For our distribution agreements, we seek to include the rights to offer the licensed programming to our customers through multiple delivery platforms and through our apps for smart phones and tablets.
In seeking licenses for content, our primary focus is on partnering with leading international providers, such as Disney, Time Warner (including HBO), Fox, the BBC and Discovery. We also seek to carry in each of our markets key public and private broadcasters and in some markets we acquire local premium programing through select relationships with companies such as Sky plc (Sky) (U.K., Ireland, Germany and Austria) and British Telecom (BT). For our VoD services, we license a variety of programming, including box sets of television series, movies, music, kids and documentaries. In addition, we have entered into a multi-year revenue sharing arrangement with Netflix Inc. (Netflix) to provide our customers with premium OTT services. The partnership will result in Netflix's content being available via set-top boxes to our video customers across all of our markets in Europe, Latin America and the Caribbean. The Netflix app is already available to our customers in the U.K., Ireland and Switzerland and we plan to deploy the service in the rest of our operations via Horizon TV over the course of 2017 and 2018. It is also available to VodafoneZiggo customers.
Exclusive content is another element of our content strategy. To support this approach, we are investing in content assets. We have invested in various content companies, including ITV plc, All3Media Ltd., LionsGate Entertainment, TV3 Group (Ireland) and De Vijver Media. We are also investing in sports, both as a broadcaster and as a rights owner. In addition, we operate the leading Caribbean sports network Flow Sports, which provides exclusive full coverage of the English Premier League and other leading sporting events. We have also launched our own exclusive sports channels, Play Sports in Belgium, and announced the launch of MySports in Switzerland in 2017.
In addition, we are commissioning our own dramas. We created the Swiss sitcom Fassler-Kunz, the Swiss series Im Heimatland and the original Belgium series Chaussee d'Amour. In August 2016, we announced that we are teaming up with All3Media, which we own jointly with Discovery Communications, Inc., to co-produce four high-end drama series over the next two years. This exclusive content will be available on demand to our customers.
Customer Premises Equipment. We purchase each type of customer premises equipment from a number of different suppliers with at least two or more suppliers providing our high-volume products. Customer premises equipment includes set-top boxes, modems, WiFi routers, DVRs, tuners and similar devices. For each type of equipment, we retain specialists to provide customer support. For our broadband services, we use a variety of suppliers for our network equipment and the various services we offer. Similarly, we use a variety of suppliers for mobile handsets to offer our customers mobile services.
Software Licenses. We license software products, including email and security software, and content, such as news feeds, from several suppliers for our internet services. The agreements for these products require us to pay a per subscriber fee for software licenses and a share of advertising revenue for content licenses. For our TiVo service in the U.K., we have a partnership arrangement where TiVo is the exclusive provider of the user interface software for our next generation set-top boxes, which provides converged television and broadband internet capabilities, and we are the exclusive distributor of the TiVo services and technology in the U.K. For our mobile network operations and our fixed-line telephony services, we license software products, such as voicemail, text messaging and caller ID, from a variety of suppliers. For these licenses we seek to enter into long-term contracts, which generally require us to pay based on usage of the services.
I-33
Access Arrangements. Through Unitymedia, we have entered into various long-term agreements with the incumbent telecommunications operator, Deutsche Telekom AG (Deutsche Telekom), for the lease of cable duct space and hubs, as well as use of fiber optic transmission systems, towers and facility space. In addition, Unitymedia purchases a portion of the electricity required for the operation of its networks through Deutsche Telekom under such agreements. Unitymedia’s ability to offer its broadband communications services to customers is dependent on the agreements with Deutsche Telekom. These agreements are long-term and may only be terminated under certain limited exceptions. Any termination, however, would have a material adverse effect on the operations of Unitymedia. For information on a legal action that Unitymedia commenced against Deutsche Telekom in December 2012 regarding these agreements, see note 17 to our consolidated financial statements included in Part II of this Annual Report on Form 10-K.
For our mobile services provided through MVNO arrangements, we are dependent on third-party wireless network providers. Each of our MVNO operations has an agreement with such a provider to carry the mobile communications traffic of our customers. We seek to enter into medium to long-term arrangements for these services. Any termination of these arrangements could significantly impact our mobile services.
Competition
All of our businesses operate in highly competitive and rapidly evolving markets. Technological advances and product innovations have increased and are likely to continue to increase giving customers several options for the provision of their telecommunications services. Our customers want access to high quality telecommunication services that allow for seamless connectivity. Accordingly, our ability to offer converged services (video, internet, fixed telephony and mobile) is a key component of our strategy. In many of our markets, we compete with companies that provide fixed-mobile convergence bundles, as well as companies that are established in one or more communication products and services. Consequently, our businesses face significant competition. In all markets, we seek to differentiate our telecommunication services by focusing on customer service, competitive pricing and offering quality high-speed internet. In this section, we begin with an overview on the competitive nature of the video, broadband internet, and mobile and fixed-line telephony services in our markets, and then provide more detail on the competitive landscape in our more material markets.
Video Distribution
Our video services compete primarily with traditional free-to-air (FTA) broadcast television services, DTH satellite service providers and other fixed-line telecommunications carriers and broadband providers, including incumbent telephony operations offering (1) DTH satellite services, (2) IPTV over broadband internet connections using asymmetric DSL or VDSL or an enhancement to VDSL called "vectoring", (3) IPTV over FTTx networks, or (4) LTE Services. Many of these competitors have a national footprint and offer features, pricing and video services individually and in bundles comparable to what we offer. In certain markets, we also compete with other cable providers who have overbuilt portions of our systems.
OTT video content aggregators utilizing our or our competitors' high-speed internet connections are also a significant competitive factor as are other video service providers that overlap our service areas. The OTT video aggregators (such as HBO Go, Amazon Prime and Netflix) offer VoD service for television series and movies, catch-up television and linear channels from broadcasters. In some cases, these OTT services are provided free-of-charge. The content library of such services are offered on an unlimited basis for a monthly fee. Typically these services are available on multiple devices in and out of the home. To enhance our competitive position, we provide our subscribers with TV everywhere products and premium OTT video services through MyPrime or our arrangement with Netflix. Our businesses also compete to varying degrees with other sources of information and entertainment, such as online entertainment, newspapers, magazines, books, live entertainment/concerts and sporting events.
We believe that our deep-fiber access provides us with several competitive advantages. For instance, our cable networks allow us to concurrently deliver internet access, together with real-time television and VoD content, without impairing our high-speed internet service. In addition, our cable infrastructure allows us to provide triple-play bundled services of broadband internet, television and fixed-line telephony services without relying on a third-party service provider or network. Where mobile is available, our mobile networks, together with our fixed fiber-rich networks, allow us to provide a comprehensive set of converged mobile and fixed-line services. Our capacity is designed to support peak consumer demand. In serving the business market, many aspects of the network can be leveraged at very low incremental costs given that business demand peaks at a time when consumer demand is low, and peaks at lower levels than consumer demand. In response to the continued growth in OTT viewing, we have launched a number of innovative video services, including Horizon Go, MyPrime and Replay TV in our European markets, Play More in Belgium and Flow ToGo in several of the CWC markets, as well as access to Netflix content.
I-34
Our ability to continue to attract and retain customers depends on our continued ability to acquire appealing content and services on acceptable terms and to have such content available on multiple devices and outside the home. Some competitors, such as Swisscom AG (Swisscom) in Switzerland, have obtained long-term exclusive contracts for certain sports programs, which limits the opportunities for other providers to offer such programs. Other competitors also have obtained long-term exclusive contracts for programs, but our operations have limited access to certain of such programming through select contracts with these companies, including Sky Deutschland AG, a subsidiary of Sky, in Germany and Austria and Sky and BT in the U.K. and Ireland. If exclusive content offerings increase through other providers, programming options could be a deciding factor for subscribers on selecting a video service.
Liberty Global Group
In the European countries in which we operate, our principal competition in the provision of video services is from traditional FTA broadcasters; DTH satellite providers in many markets, such as the U.K., Germany, Austria, Ireland, Poland, the Czech Republic and Slovakia, where we compete with long-established satellite platforms; incumbent telecommunications providers using fiber technology; and cable operators where portions of our systems have been overbuilt. In addition, in Belgium we are experiencing competition on our own network as a result of the Belgian Regulatory Authorities granting third-party operators (including the incumbent telephony operator) access to cable operators’ networks. See Regulatory Matters—Liberty Global Group—Belgium. Mobile broadband has gained a noticeable share of subscribers, which is another competitive factor.
Similar to our technological advances to enhance our video services, our competitors are also improving their video platforms with next generation set-top boxes, TV everywhere products and other interactive services. Similarly, VDSL, which is either provided directly by the owner of the network or by a third-party, is a significant part of the competitive environment in many of our markets as are FTTx networks. In all of our European markets, competitive video services are offered by the incumbent telecommunications operator, whose video strategies include IPTV over DSL, VDSL and FTTx networks and, in some cases, DTH and DTT. The ability of incumbent operators to offer the triple-play of video, broadband internet and fixed-line telephony services and, in most countries, a quad-play with mobile services, is exerting competitive pressure on our operations, including the pricing and bundling of our video products. In order to gain video market share, the incumbent operators and alternative service providers in a number of our larger European markets are pricing their DTT, VDSL or DTH video packages at a discount to the retail price of the comparable digital cable service and, in some cases, including DVRs as a standard feature.
Overall, we are experiencing increased convergence as customers look to receive all their media and communication services from one provider. In our largest European video markets, our key competitors for the the provision of converged services are: BT (U.K.), Deutsche Telekom (Germany), Proximus NV/SA (Proximus) (Belgium) and Swisscom (Switzerland). Each of these competitors have extensive resources allowing them to offer competitively priced bundled services. As a result, our ability to offer triple-play or quad-play bundles and fixed-mobile convergence bundles is one of our key strategies to attract and retain customers. In each of these markets, we seek to distinguish ourselves through our multimedia gateway services, interactive services (such as Replay TV and MyPrime) and our download speeds.
Portions of our European systems have been overbuilt by FTTx networks and other cable operations. These systems are a significant competitive factor primarily for our Central and Eastern Europe operations. Based on research of various telecommunication publications, including by the Organization for Economic Cooperation and Development (OECD) and internal estimates, parts of our Central and Eastern Europe operations are overbuilt by FTTx networks, including almost all of our operations in Romania. Other cable operators have also overbuilt approximately half of our cable networks in Hungary and Poland. Although we have extensive FTTx overbuild in Switzerland, connectivity to the FTTx network is not available at all locations. In addition, government and quasi-government entities in certain of the countries in which we operate in Europe continue to invest in FTTx networks, creating another source of competition. In order to achieve download speeds of up to 100 Mbps or greater for customers, incumbent telecommunications operators are adopting VDSL with vectoring and bonding technologies as a more cost efficient solution compared to FTTx initiatives. Our primary competitor in Germany, Deutsche Telekom, has implemented this technology in almost all of our footprint in Germany. Swisscom is also implementing vectoring in Switzerland. Vectoring is a transmission method that coordinates line signals to reduce crosstalk levels and improve performance. Bonding is a method of taking channels on either DSL or cable plant and bonding those channels together for a higher bandwidth throughput.
In most of our Central and Eastern European markets, we face intense competition from DTH services. These DTH companies offer aggressively-priced packages of video content and in some cases offer triple-play packages. FTA broadcasters are also significant competitors in the Central and Eastern Europe markets. To stay competitive, UPC Holding’s DTH operations offer advanced services and functionality, including DVR and premium content, in most of our Central and Eastern European markets. It has also expanded these services to include a triple-play offer in Hungary. Our cable operations stay competitive by offering enhanced digital services, such as HD channel offerings, MyPrime, Horizon Go and expanded VoD services. These operations have also increased broadband internet speeds in their triple-play bundles ranging from up to 250 Mbps in Poland to up to 500 Mbps in Hungary, Romania and Slovakia. Promotional discounts are available, particularly on bundled options.
I-35
We compete on value by offering advanced digital services, such as DVR functionality, HD, VoD, catch-up television, Replay TV, multiscreen services and multimedia gateways. We also compete by accelerating the migration of our customers from analog to digital services, offering advanced digital features and attractive content packages, as well as bundled services, at reasonable prices. In each of the countries in which we operate, we also tailor our packages to include attractive channel offerings and offer recurring discounts for bundled services and loyalty contracts. In addition, from time to time, we modify our digital channel offerings to improve the quality of our programming. Where mobile voice and data are available, we focus on our converged service offerings at attractive prices. In our other operations, we use the triple-play bundle as a means of driving video, as well as other products where convenience and price can be leveraged across the portfolio of services. We also continue to enhance our Horizon TV product to meet our customers desire to view programming anytime and anywhere, such as new applications and expanding its availability in our markets.
• | Virgin Media. Virgin Media’s digital television services compete primarily with FTA television and with Sky, the primary pay satellite television provider. Sky offers competitively priced triple-play and quad-play services in the U.K. and Ireland. Other significant competitors are BT and TalkTalk Telecom Group plc (TalkTalk) in the U.K. and Eircom Limited in Ireland, each of which offer triple-play services, as well as IPTV video services. Each of these competitors have multimedia home gateways. |
Sky owns the U.K. rights to various entertainment, sports and movie programming content and channels. Sky is both a principal competitor in the pay-television market and an important supplier of content to us. Various Sky channels, including Sky Sports, are available over Sky’s satellite system and our cable networks, as well as via Sky’s apps and online players and other television platforms, and some of the channels are available on BT and TalkTalk platforms. Virgin Media distributes several basic and premium video channels supplied by Sky. BT is also both a principal competitor and an important supplier of content to us. BT owns premium BT Sport channels, providing a range of sports content, including football (soccer) from the English Premier League and exclusive rights to the UEFA Champions League and the UEFA Europa League. The BT Sport channels are available on our cable network as well as our competitors’ networks.
In this competitive market, Virgin Media is expanding its broadband network and recently launched its new 4K enabled Virgin Media V6 set-top box in the UK. In Ireland it offers Horizon TV and its functionalities (marketed as Virgin TV). The on-line streaming service Virgin TV Anywhere is available throughout the Virgin Media footprint. In addition, Virgin Media’s ability to include mobile for its U.K. and Ireland customers for a low incremental fee creating a fixed-mobile convergence bundle is a key market offer.
• | Unitymedia. Unitymedia’s primary competition is from FTA television received via satellite. Unitymedia’s primary competitor for pay TV services is the IPTV services over VDSL and FTTx and DTH of the incumbent telecommunications operator, Deutsche Telekom. Deutsche Telekom has announced plans to cover approximately 80% of German homes with its VDSL network by 2018. Within its VDSL footprint, Deutsche Telekom is implementing vectoring technology to enhance maximum broadband speeds to up to 100 Mbps from the current speeds of up to 50 Mbps. Deutsche Telekom further announced its ambition to implement super vectoring technology across all cable network areas by 2018, enhancing broadband speeds in these areas to up to 250 Mbps. |
Deutsche Telekom offers competitively-priced bundles, including fixed-mobile convergence, and recently became more aggressive on price by launching double-play and triple-play promotional offers. In addition, Vodafone, also a competitor in Germany, bundles its IPTV service with its broadband offerings through Deutsche Telekom’s DSL network under a resell agreement making it a significant competitor in the double-play and triple-play market in our footprint. It also has expanded its bundle offers to include mobile products. These converged offerings may enable Deutsche Telekom and Vodafone to reduce churn and attract new customers.
Deutsche Telekom and Professional Operators compete with Unitymedia for housing association contracts. Professional Operators typically procure the broadcast signals they distribute from Unitymedia or from FTA television received via satellite. Certain Professional Operators may also use such opportunities to build their own distribution networks or to install their own head-ends for receiving satellite signals.
To enhance its competitive position, Unitymedia offers Horizon TV and the Horizon family of products, including Horizon Go. It also makes mobile available creating converged bundles. Mobile customers receive a discount when they also subscribe to certain bundles.
• | Telenet. Telenet’s principal competitor is Proximus, the incumbent telecommunications operator, which has interactive digital television, replay television, VoD and HD service as part of its video offer, as well as a remote access service. Proximus offers competitively-priced bundles, including fixed-mobile convergence. Its IPTV services are delivered over its DSL and VDSL networks. Also, Telenet and other Belgian cable operators must give alternative providers access to |
I-36
their cable networks. Consequently, Telenet faces increased competition from other providers of video services who may be able to offer triple- and quad-play services. For more information, see Regulatory Matters—Liberty Global Group—Belgium.
In order to compete effectively against alternative providers, Telenet leverages its extensive cable network, the broad acceptance of its basic cable television services and Yelo Play and its additional features, such as HD and DVR functionality, VoD offerings and its Play Sports channel. It is also using mobile services to drive its other products through its all-in-one converged offering “WIGO”. In addition, Telenet continues to enhance its Yelo Play app and programming, including extending its rights to the English Premier League through 2019 and the addition of other sports rights. Further, with its pending acquisition of certain broadband operations from Coditel Brabant sprl, Telenet will extend its services to additional parts of Belgium and Luxembourg.
• | UPC Switzerland. Our main competitor in Switzerland is Swisscom, the incumbent telecommunications operator, which provides IPTV services over DSL, VDSL and FTTx networks. Swisscom offers VoD services, DVR and replay functionality and HD channels, as well as the functionality to allow remote access to its video services, and has exclusive rights to distribute certain sports programming. Swisscom’s internet speeds include up to 100 Mbps on its VDSL network and up to either 300 Mbps or 1 Gbps in areas served by its FTTx network. Swisscom continues to expand its FTTx network to Switzerland households in our footprint, as well as in our partner network footprints. It has built its fiber-to-the-home network in several cities in cooperation with municipality-owned utility companies and, where no cooperation agreement has been reached, Swisscom is building its own fiber-to-the-home network. With respect to subscribers on partner networks, UPC Switzerland competes with other service providers for the contracts to serve these subscribers. |
To compete effectively in Switzerland, UPC Switzerland promotes Horizon TV and its family of products together with Replay TV and MyPrime, giving subscribers the ability to personalize their programming and viewing preferences. It also uses its high-speed internet of up to 200, 400 or 500 Mbps to promote its extended digital tier bundles.
LiLAC Group
In Latin America and the Caribbean, our primary competition in the provision of video services, depending on the market, is from traditional FTA broadcasters, DTH satellite providers, other pay television providers using fiber technology or cable operators whose networks overlap our systems. OTT viewing is also a significant competitive factor. To enhance our video offerings in this region, we are developing cloud-based, next generation user interfaces based on advanced technologies. This is demonstrated by our recent launch of Horizon TV in Chile and an advanced set-top box in most of CWC’s markets. Our competitors, however, are also improving their video services with interactive services and wireless connectivity. Many of our competitors offer competitively-priced packages of video content and, in some cases, offer double- and triple-play packages.
In this competitive environment, we enhance our offers with advanced digital services, such as DVR functionality, HD channels, VoD and multiscreen services. In addition, we offer attractive content packages tailored to the particular market and discounts for bundled services. To improve the quality of the programming in our packages, our operations periodically modify their digital channel offerings. Where mobile is available, we are focusing on our converged service offerings at attractive prices. We use these services, as well as bundles of our fixed-line services, as a means of driving video and other products where convenience and price can be leveraged across the portfolio of services.
• | VTR. VTR competes primarily with DTH service providers, including the incumbent Chilean telecommunications operator Compañia de Telecomunicaciones de Chile SA using the brand name Movistar (Movistar), Claro Chile S.A., a subsidiary of América Móvil, S.A.B. de C.V. (Claro), and DIRECTV Latin America Holdings, Inc. (DirecTV). Movistar offers double-play and triple-play packages using DTH for video and DSL for internet and fixed-line telephony and offers mobile services. On a smaller scale, Movistar also offers IPTV services over FTTx networks in Chile. Claro offers triple-play packages using DTH and, in most major cities in Chile, through a hybrid fiber coaxial cable network. It also offers mobile services. To a lesser extent, VTR also competes with video services offered by or over networks of fixed-line telecommunication providers using DSL technology. To compete effectively, VTR focuses on enhancing its subscribers viewing options in and out of the home. It offers VoD, catch-up television, DVR functionality, Horizon TV and a variety of premium channels. These services and its variety of bundled options, including internet and telephony, enhance VTR’s competitive position. |
• | CWC. CWC competes with a variety of pay TV service providers in its various markets. Several of these competitors offer double-play and triple-play packages. Fixed-mobile convergence services are not yet a significant factor in most of CWC’s residential markets. In Panama, CWC competes primarily with Cable Onda S.A., which offers video, internet and fixed-line telephony over its cable network. The DTH services of Claro are also a competitive factor. In several of CWC’s other markets, including Jamaica, Trinidad & Tobago and Barbados, we are the largest or one of the largest video |
I-37
service providers. In these markets, CWC’s primary competition is from DTH providers, such as DirecTV, and operators of IPTV services over VDSL and FTTx, such as Digicel Group Ltd. (Digicel). To compete effectively, CWC invests in leading mobile and fixed networks, and in content, where the Premier League is a main attraction for Flow Sports.
• | Liberty Puerto Rico. Liberty Puerto Rico is the third largest provider of video services in Puerto Rico. Liberty Puerto Rico’s primary competition for video customers is from DTH satellite providers DirecTV and Dish Network Corporation (Dish Network). Dish Network is an aggressive competitor, offering low introductory offers, free HD channels and, in its top tier packages, a multi-room DVR service for free. DirecTV is also a significant competitor offering similar programming in Puerto Rico compared to Dish Network. In order to compete, Liberty Puerto Rico focuses on offering video packages with attractive programming, including HD and Spanish language channels. It also offers a specialty video package of Spanish-only channels that is gaining popularity. In addition, Liberty Puerto Rico uses its bundled offers that include high-speed internet with download speeds of up to 300 Mbps to drive its video services. |
Internet
With respect to broadband internet services and online content, our businesses face competition in a rapidly evolving marketplace from incumbent and non-incumbent telecommunications companies, mobile operators and cable-based ISPs, many of which have substantial resources. The internet services offered by these competitors include both fixed-line broadband internet services using cable, DSL or FTTx networks and wireless broadband internet services. These competitors have a range of product offerings with varying speeds and pricing, as well as interactive services, data and other non-video services offered to homes and businesses. With the demand for mobile internet services increasing, competition from wireless services using various advanced technologies is a competitive factor. In several of our markets, competitors offer high-speed mobile data via LTE wireless networks. In addition, other wireless technologies, such as WiFi, are available in almost all of our markets. In this intense competitive environment, speed and pricing are key drivers for customers.
Our strategy is speed leadership. Our focus is on increasing the maximum speed of our connections as well as offering varying tiers of service, prices and a variety of bundled product offerings and a range of value added services. We update our bundles and packages on an ongoing basis to meet the needs of our customers. Our top download internet speeds in Europe range from up to 200 Mbps to speeds of up to 500 Mbps available in Switzerland, Hungary, Romania and Slovakia. Our top download speeds for our Latin American and Caribbean operations generally range from up to 100 Mbps to speeds of up to 350 Mbps. In Barbados, we also have speeds of up to 1 Gbps available and in Anguilla, we have speeds of up to 480 Mbps. In many of our LiLAC Group markets, we offer the highest download speeds available via our cable and FTTx networks. The focus is on high-end internet products to safeguard our high-end customer base and allow us to become more aggressive at the low- and medium-end of the internet market. By fully utilizing the technical capabilities of DOCSIS 3.0 technology on our cable systems, we can compete with local FTTx initiatives and create a competitive advantage compared to DSL infrastructures and LTE initiatives on a national level. With the commercial deployment of our next generation gateways that will enable DOCSIS 3.1 on our cable networks, we plan to further increase our high-speed internet offers.
Liberty Global Group
Across Europe, our key competition in this product market is from the offering of broadband internet products using various DSL-based technologies by the incumbent phone companies and third parties. The introduction of cheaper and ever faster fixed-line broadband offerings is further increasing the competitive pressure in this market. Wireless broadband services, such as LTE, are also significant competitors using high-speed mobile networks. We are expanding our ultra high-speed services and increasing our download speeds. In most of our markets, we offer our internet service on a standalone basis or through bundled offerings that include video, fixed-line telephony and mobile services. Mobile data is also increasingly important and we are addressing this through our wide range of mobile products, including expanding our LTE service area and offering SIM-only mobile products, as well as expanding our Community WiFi network.
• | Virgin Media. In the U.K., we have a number of significant competitors in the market for broadband internet services, including fixed-line incumbent telecommunications providers. Of these broadband internet providers, BT is the largest, which provides broadband internet access services over its own VDSL network. BT has announced its intention to rollout ultrafast speeds of up to 300 Mbps to 500 Mbps by the end of 2020 to up to 10.0 million premises using G-fast technology, a DSL standard designed for local loops less than 250 meters. This technology is also expected to eventually support a rollout of 1 Gbps service. |
Operators such as Sky and TalkTalk deploy their own network access equipment in BT exchanges via a process known as local loop unbundling (LLU). This allows an operator to reduce the recurring operating costs charged by BT by reducing the proportion of traffic that must travel directly over BT’s network. LLU deployment requires a substantial capital investment to implement and requires a large customer base to deliver a return on investment. In addition to the competition
I-38
and pricing pressure in the broadband market arising from LLU, competition from mobile broadband developments, such as LTE mobile services and WiFi services, is significant. Mobile providers continue to gain market share from fixed-line providers. These providers offer a range of mobile services.
• | Unitymedia. In Germany, the competition for broadband internet services is particularly intense. For broadband internet access, DSL is the dominant technology and Deutsche Telekom is the primary provider. Other major competitors to our services are resellers of Deutsche Telekom’s DSL and VDSL services. We also face increased competition from mobile broadband operators, including Deutsche Telekom, and other network providers, many of which offer mobile services through LTE wireless systems and are increasing their coverage areas. Deutsche Telekom is upgrading its VDSL network with vectoring technology to increase its speeds to up to 100 Mbps. It plans to have 80% of German households connected to this network by 2018. With its (vectored) VDSL expansion plan, competition from Deutsche Telekom will increase. |
• | Telenet. In the Flanders region of Belgium, Telenet is the leading provider of residential broadband internet services. Telenet’s primary competitor is the DSL service provider Proximus. Proximus is a well-established competitor offering quad-play bundles. Proximus’ DSL and VDSL service provide download speeds up to 100 Mbps. Mobile internet use is increasing as well. Similar to its video services, Telenet faces competition in the provision of internet services from other providers who have access to Telenet’s cable network. In this competitive market, Telenet is using its fixed-mobile converged offer “WIGO” to promote its internet and other services. |
• | UPC Switzerland. In Switzerland, Swisscom is the largest provider of broadband internet services, and is our primary competitor. Swisscom internet customers have access to its basic video content free of charge through its internet portal. It is also expanding its FTTx network and rolling out G.fast technology. At year end 2016, it had 2.5 million new connections through these technologies. Swisscom offers download speeds ranging from 20 Mbps to up to 1 Gbps. |
LiLAC Group
In several of our CWC markets, we are the incumbent phone company offering broadband internet products using various DSL-based technologies. In these markets and our other Latin American markets, our key competition for internet services is from cable and IPTV operators and mobile data service providers. Wireless broadband services are a significant competitor with their high-speed mobile networks. To compete effectively, we are expanding our LTE service areas and increasing our download speeds. In most of our markets, we offer our internet service through bundled offerings that include video and fixed-line telephony. We also offer a wide range of mobile products either on a prepaid or postpaid basis.
• | VTR. In Chile, VTR faces competition primarily from non-cable-based ISPs, such as Movistar, and from other cable-based providers, such as Claro. Competition is particularly intense with each of these companies offering competitively priced services, including bundled offers with ultra high-speed internet services. Mobile broadband competition is significant as well. Both Movistar and Claro have launched an LTE network for high-speed mobile data. To compete effectively, VTR is expanding its two-way coverage and offering attractive bundling with fixed-line telephony and digital video service. In response to the availability of mobile data in Chile, VTR offers our high-speed internet with download speeds of up to 160 Mbps. |
• | CWC. CWC competes primarily with mobile broadband providers in the provision of internet services. Where CWC is the incumbent telecommunications provider, it also competes with cable operators, the largest of which is Cable Onda in Panama and Cable Bahamas in the Bahamas. To a lesser extent, CWC experiences competition from Digicel in certain of its markets. To distinguish itself from these competitors, CWC uses its bundled offers with video and telephony to promote its broadband internet services. |
• | Liberty Puerto Rico. In Puerto Rico, Liberty Puerto Rico competes primarily with mobile broadband providers. Most of these providers, including the incumbent telecommunications company, offer these services over their LTE networks. To compete with mobile broadband, Liberty Puerto Rico offers its high-speed internet with download speeds of up to 300 Mbps. Liberty Puerto Rico also competes with the DSL services of Claro in providing fixed-line internet services. |
I-39
Mobile and Telephony Services
Consumers are increasingly moving to mobile services. In almost all of our Latin America and Caribbean markets we are either the leading or one of the leading mobile providers, except in Chile and certain other markets where we are a relatively new entrant in the provision of mobile services. In Belgium, we are one of the top three mobile providers and in the U.K., we are the fourth largest provider, in each case based on number of SIM cards. In our other European markets, however, we currently have minimal mobile presence. In the markets where we are one of the top mobile providers, we continue to seek additional bandwidth to deliver our wide range of services to our customers and increase our LTE services. Where we are a small mobile provider, we face significant competition from other mobile telephony providers, many of whom offer LTE services and are making significant advances in obtaining customers. In all of our markets competition is intense. We also offer various calling plans, such as unlimited network, national or international calling, unlimited off-peak calling and minute packages, including calls to fixed and mobile phones. In addition, we use our bundled offers with our video and ultra high-speed internet services to gain mobile subscribers. Our ability to offer fixed-mobile convergence services is a key driver. In several of our markets we provide converged services, including mobile, fixed-line, broadband and video. We are also exploring opportunities to offer mobile services in our other markets and mobility applications to our other services.
The market for fixed-line telephony services is mature in almost all of our markets. Changes in market share are driven by the combination of price and quality of services provided and the inclusion of telephony services in bundled offerings. In several of our CWC markets, we are the incumbent telecommunications provider with long established customer relationships. In our other markets, our fixed-line telephony services compete against the incumbent telecommunications operator in the applicable market. In these markets, the operators have substantially more experience in providing fixed-line telephony and mobile services, greater resources to devote to the provision of fixed-line telephony services and long-standing customer relationships. In all of our markets, we also compete with other VoIP operators offering service across broadband lines. OTT telephony is also a competitive factor. In many countries, our businesses also face competition from other cable telephony providers, FTTx-based providers or other indirect access providers.
Competition in both the residential and business fixed-line telephony markets is extremely competitive due to market trends, the offering of carrier pre-select services, number portability, the replacement of fixed-line with mobile telephony and the growth of VoIP services, as well as continued deregulation of telephony markets and other regulatory action, such as general price competition. Carrier pre-select allows the end user to choose the voice services of operators other than the incumbent while using the incumbent’s network. Our fixed-line telephony strategy is focused around value leadership, and we position our services as “anytime” or “any destination”. Our portfolio of calling plans include a variety of innovative calling options designed to meet the needs of our subscribers. In many of our markets, we provide product innovation, such as telephone apps that allow customers to make and receive calls from their fixed-line call packages on smart phones. In addition, we offer varying plans to meet customer needs and, similar to our mobile services, we use our telephony bundle options with our digital video and internet services to help promote our telephony services and flat rate offers are standard.
Liberty Global Group
Across Europe, our fixed-line and mobile telephony businesses are generally small compared to the existing business of the incumbent telephone companies. The incumbent telecommunication companies remain our key competitors but mobile operators and other VoIP operators, including ISPs, offering service across broadband lines are also significant competitors in these markets. Generally, we expect telephony markets to remain extremely competitive.
Due to the maturity of the telephony market, competition is particularly intense in all our markets with price often the deciding factor. To maintain or increase market share, we and our competitors focus on bundling telephony services with quality broadband offerings and other services. In each of our markets, we face competition with a dominant fixed-line telephony provider, most of which also have competitive mobile offers based on LTE services. In our largest markets, the key dominant telephony providers are BT (UK), Deutsche Telekom (Germany), Proximus (Belgium) and Swisscom (Switzerland). These telephony competitors are also the largest mobile operators in these markets based on number of SIM cards, except in Germany where Telefonica O2 is the largest.
LiLAC Group
In our Latin American and Caribbean markets, competition in the telephony and mobile services markets is also intense. In Chile, VTR faces competition from the incumbent telecommunications operator, Movistar, and other telecommunications operators. Movistar has substantial experience in providing telephony services, resources to devote to the provision of telephony services and long-standing customer relationships. Price is a key factor as are bundles with quality services. We distinguish our services by delivering reliable market leading internet access speeds with attractive bundled offers.
I-40
Movistar, Claro and Entel PCS Telecommunications SA are the primary companies that offer mobile telephony in Chile. In mid-2015, WOM S.A. entered the mobile services market through its acquisition of the Nextel Chile network. WOM S.A. is exerting significant competitive pressure in the mobile market with its very aggressive price offer. Such pricing is driving down sales and increasing churn in the mobile market. As an MVNO, VTR offers its mobile services on a standalone basis. To attract and retain customers, VTR focuses on its triple-play customer base, offering them postpaid mobile accounts at an attractive price.
With respect to mobile services, we face competition from Digicel in most of our CWC residential markets and Movistar and Claro in Panama. In addition, in the Bahamas, where CWC had previously been the only provider of mobile services, competition has increased significantly due to the commercial launch of mobile services by a competitor during the fourth quarter of 2016. We also face competition in the provision of broadband services from Cable Onda in Panama, Digicel in our Caribbean markets and Cable Bahamas in the Bahamas. These companies all have competitive pricing on similar services and Digicel is also able to offer fixed-mobile convergence with its video, internet, mobile and telephony services. To attract and retain customers, CWC focuses on providing quality services and premium content, as well as converged services where customers can access content in and out-of-the home.
Regulatory Matters
Overview
Video distribution, broadband internet, fixed-line telephony and mobile businesses are regulated in each of the countries in which we operate. The scope of regulation varies from country to country, although in some significant respects regulation in European markets is harmonized under the regulatory structure of the European Union (E.U.).
Adverse regulatory developments could subject our businesses to a number of risks. Regulation, including conditions imposed on us by competition or other authorities as a requirement to close acquisitions or dispositions, could limit growth, revenue and the number and type of services offered and could lead to increased operating costs and property and equipment additions. In addition, regulation may restrict our operations and subject them to further competitive pressure, including pricing restrictions, interconnect and other access obligations, and restrictions or controls on content, including content provided by third parties. Failure to comply with current or future regulation could expose our businesses to various penalties.
Liberty Global Group
Austria, Belgium, Bulgaria, Croatia, Cyprus, the Czech Republic, Denmark, Estonia, Finland, France, Germany, Greece, Hungary, Ireland, Italy, Latvia, Lithuania, Luxembourg, Malta, the Netherlands, Poland, Portugal, Romania, Slovakia, Slovenia, Spain, Sweden and the U.K. are the Member States of the E.U. As such, these countries are required to harmonize certain of their laws with certain E.U. rules. In addition, other types of E.U. rules are directly enforceable in those countries without any implementation at the national level. Certain E.U. rules are also applicable across the European Economic Area, whose Member States are the E.U. Member States (excluding Croatia) as well as Iceland, Liechtenstein and Norway.
On June 23, 2016, the U.K. held a referendum in which voters approved, on an advisory basis, an exit from the E.U. commonly referred to as “Brexit”. The terms of any withdrawal are subject to a negotiation period that could last at least two years after the British government formally initiates a withdrawal process pursuant to Article 50 of the Treaty on Europe. The British government has indicated that it plans to trigger Article 50 and commence negotiations to determine the terms of the U.K.’s withdrawal from the E.U. by the end of March 2017. A withdrawal could, among other outcomes, disrupt the free movement of goods, services and people and capital between the U.K. and the E.U., undermine bilateral cooperation in key geographic areas and significantly disrupt trade between the U.K. and the E.U. or other nations (including the U.S.) as the U.K. pursues independent trade relations. The initial impact of the announcement of Brexit caused significant volatility in global stock markets, including in the prices of our shares, as well as significant currency fluctuations that resulted in the strengthening of the U.S. dollar (our reporting currency) against foreign currencies in which we conduct business, namely the British pound sterling and the euro. The effects of Brexit could adversely affect our business, results of operations and financial condition.
In the broadcasting and communications sectors, there has been extensive E.U.-level legislative action. As a result, most of the markets in Europe in which our businesses operate have been significantly affected by the regulatory framework that has been developed by the E.U. Regulation in Switzerland, which is not a Member State of the E.U. and is not part of the European Economic Area, is discussed separately below, as well as regulation in certain Member States in which we face regulatory issues that may have a material impact on our business.
I-41
E.U. Communications Regulation
The body of E.U. law that deals with communications regulation consists of a variety of legal instruments and policies (collectively, the Regulatory Framework). The key elements of the Regulatory Framework are various legal measures and directives that require Member States to harmonize their laws, as well as certain other instruments and regulations that have direct effect without any specific adoption at the national level.
The Regulatory Framework primarily seeks open communication services in markets within Europe. It harmonizes the rules within the E.U. for the establishment and operation of electronic communication networks, including cable television and traditional telephony networks, and the offer of electronic communication services, such as telephony, internet and, to some degree, television services.
On December 18, 2009, the Official Journal of the E.U. published revisions to the Regulatory Framework. These revisions should have been transposed into the laws of the Member States before May 25, 2011, although in practice, this process is still ongoing in certain Member States.
Certain key provisions included in the current Regulatory Framework (including additional revisions since adoption) are set forth below. This description is not intended to be a comprehensive description of all regulation in this area.
• | Licensing and Exclusivity. The Regulatory Framework requires Member States to abolish exclusivities on communication networks and services in their territory and allow operators into their markets based on a simple registration. The Regulatory Framework sets forth an exhaustive list of conditions that may be imposed on communication networks and services. Possible obligations include, among other things, financial charges for universal service or for the costs of regulation, environmental requirements, data privacy and other consumer protection rules, “must carry” obligations, provision of customer information to law enforcement agencies and access obligations. |
• | Significant Market Power. Certain of the obligations allowed by the Regulatory Framework apply only to operators or service providers with “Significant Market Power” (defined below) in a relevant market. For example, the provisions of the Access Directive allow the National Regulatory Authority (NRA) in E.U. Member States to mandate certain access obligations only for those operators and service providers that are deemed to have Significant Market Power. For purposes of the Regulatory Framework, an operator or service provider will be deemed to have Significant Market Power where, either individually or jointly with others, it enjoys a position of significant economic strength affording it the power to behave to an appreciable extent independently of competitors, customers and consumers. |
As part of the implementation of certain provisions of the Regulatory Framework, each Member State’s NRA is required to analyze certain markets predefined by the E.U. Commission to determine if any operator or service provider has Significant Market Power. Initially starting with 18 predefined markets, the E.U. Commission has currently recommended that there be four such predefined markets, which are subject to periodic review. NRAs may, however, continue to maintain their analysis of some of the markets from the previous list or perform analysis of markets not listed in the recommendation, which requires the NRA to prove that additional requirements, the so called three-criteria test, are met.
NRAs might seek to define us as having Significant Market Power in any of these predefined markets or they may define and analyze additional markets. In the event that we are found to have Significant Market Power in any particular market, an NRA could impose certain conditions on us. Under the Regulatory Framework, the E.U. Commission has the power to veto a finding by an NRA of Significant Market Power (or the absence thereof), which power also applies with respect to market definition, in any market, regardless of whether it is a market predefined by the E.U. Commission or an additional market defined by an NRA. We have been found to have Significant Market Power in certain markets in which we operate and further findings of Significant Market Power are possible. In particular, we have been found to have Significant Market Power in the market for termination of calls on our network.
• | Video Services. The regulation of distribution, but not the content, of television services to the public is harmonized by the Regulatory Framework. Member States are allowed to impose on certain operators under their jurisdiction reasonable must carry obligations for the transmission of specified radio and television broadcast channels. Such obligations are required to be based on clearly defined general interest objectives, be proportionate and be transparent and subject to periodic review. We are subject to must carry regulations in all European markets in which we operate. Must carry regulations are significantly different among Member States. In some cases, these obligations go beyond what we believe is allowable under the Regulatory Framework. To date, however, the E.U. Commission has taken very limited steps to enforce E.U. law in this area, leaving must carry obligations intact in certain Member States. We do not expect the E.U. Commission or the Member States to curtail such obligations in the foreseeable future. |
I-42
• | Net Neutrality/Traffic Management. In October 2015, the European Parliament adopted the regulation on the first E.U.-wide net neutrality regime. The regulation, which is directly applicable in all Member States, permits the provision of specialized services, optimized for specific content and subjects operators to reasonable traffic management requirements. The regulation also abolishes roaming tariffs beginning in June 2017. |
On August 30, 2016, the Body of European Regulators for Electronic Communications (BEREC) issued guidelines for implementation of the regulation. Although the guidelines are non-binding, they represent the official base on which NRAs may interpret the regulation.
Regarding roaming, in order to ensure a smooth transition of the abolition of roaming surcharges in 2017, the regulation provided for a transition period beginning April 2016. During the transition period, surcharges are not to exceed the regulated maximum wholesale charges. In a simultaneous legislative process the E.U. Commission is expected to review the regulation on wholesale roaming charges in the first quarter of 2017.
On May 6, 2015, the E.U. Commission published its Digital Single Market strategy document. The strategy is an aggregation of many different policy areas with the purpose of creating a digital single market to expand jobs and stimulate growth. The strategy includes policy review in the areas of E.U. communications regulation, broadcasting law, copyright reform and anti-competitive geo-blocking practices.
On September 14, 2016, the E.U. Commission published a proposal for the European Electronic Communications Code, which would replace the Regulatory Framework. The proposal recognizes the need for greater incentives to boost private sector investment in very high capacity networks. The proposal maintains the key elements of the Regulatory Framework, notably market analysis with remedies only being imposed on operators with Significant Market Power. The proposal captures all types of services that are relevant to consumers, not only the traditional electronic communication services as captured under the Regulatory Framework but also OTT services. The proposal brings greater harmonization to the timetables for spectrum licensing and renewal that will encourage investment in mobile networks and will result in more advanced services. The adoption of the proposal for the European Electronic Communications Code and its implementation in to national laws by Member States is not expected before the third quarter of 2018.
Broadcasting Law
Although the distribution of video channels by a cable operator is within the scope of the Regulatory Framework, the activities of a broadcaster are harmonized by other elements of E.U. law, in particular the Audiovisual Media Services Directive (AVMS). Generally, broadcasts originating in and intended for reception within an E.U. Member State must respect the laws of that Member State. Pursuant to AVMS, however, E.U. Member States are required to allow broadcast signals of broadcasters established in another E.U. Member State to be freely transmitted within their territory, so long as the broadcaster complies with the law of their home state. This is referred to as the country of origin principle. Under AVMS, the country of origin principle applies also to non-linear services, such as VoD. Accordingly, we should be able, if we so elect, to offer our own VoD services across the European Economic Area based on the regulation of the country of origin. As a result, we could structure our business to have a single regulatory regime for all of our VoD services offered in Europe. In addition, when we offer third-party VoD services on our network, it should be the business of the third-party, in its capacity as provider of the services, and not us as the local distributor, that is regulated in respect of these services.
Although Member States were obligated to transpose the requirements of AVMS into national law, and this has generally been completed, the practical effect is still not clear. Uncertainty still remains about the proper treatment of VoD from a practical perspective. Thus, there can be no assurance that the requirements for VoD will operate in the manner described above in any individual Member State. As a result, we may face inconsistent and uncertain regulation of our VoD service in Europe.
AVMS also establishes quotas for the transmission of European-produced programming and programs made by European producers who are independent of broadcasters.
As part of its Digital Single Market strategy, on May 25, 2016 the E.U. Commission published a proposal for the revision of the AVMS. The proposal maintains the key elements of AVMS - notably the country of origin principle and European works quota. The adoption of the proposal for the revision of the AVMS is expected in the second half of 2017. Once adopted, its implementation into national laws by Member States is proposed to take place no later than 12 months thereafter.
Under the Digital Single Market strategy, in December 2015, the E.U. Commission published a proposal for a regulation addressing the portability of online audiovisual content services. Under the proposal, providers of online audiovisual content services must allow subscribers who are temporarily present in any E.U. Member State to access and use those services. The intention of the proposed regulation is for subscribers to be able to enjoy the same out-of-home service in another Member State.
I-43
The adoption of the proposed regulation is not expected until the second half of 2017, and would become effective within 9 to12 months after adoption.
Other European Level Regulation
In addition to the industry-specific regimes discussed above, our European operating companies must comply with both specific and general legislation concerning, among other matters, data retention and electronic commerce. In December 2015, the E.U. approved the E.U. General Data Protection Regulation (GDPR) with respect to data protection and retention. The GDPR enhanced existing legal requirements through several new rules and includes stiff penalties for organizations that fail to comply. The GDPR will be directly applicable in all Member States commencing in 2018. In addition, following the adoption of the GDPR, the E.U. Commission published on January 11, 2017 a proposal for an e-Privacy regulation, replacing today’s e-Privacy Directive that regulates privacy related issues in the electronic communications sector. The adoption of this proposal is not expected before June 2018.
Our European operating companies are also subject to both national and European level regulations on competition and on consumer protection, which are broadly harmonized at the E.U. level. For example, while our operating companies may offer their services in bundled packages in European markets, they are sometimes not permitted to make a subscription to one service, such as cable television, conditional upon a subscription to another service, such as telephony. They may also face restrictions on the degree to which they may discount certain products included in the bundled packages.
The E.U. Commission is imposing more mandatory requirements and encouraging voluntary solutions regarding energy consumption of the telecommunications equipment we provide our customers. We have been participating in discussions and studies regarding energy consumption with the E.U. Commission and with experts working on their behalf. In addition, we are working with suppliers of our digital set-top boxes to lower power consumption, as well as looking at possibilities through software to lower the power consumption of the existing fleet of digital set-top boxes. We also worked with a large group of companies to create a voluntary agreement on set-top box power consumption as an alternative to regulation, which has been formally recognized by the E.U. Commission. Nevertheless, legislation in this area may be adopted that could adversely affect the cost and/or the functionality of equipment we deploy to customers.
Pursuant to a Regulation on standby power effective January 7, 2010 (the Standby Regulation), many devices are required to have either a low power standby mode or off mode, unless it is inappropriate to have either such mode on the device. For this purpose, our set-top boxes and certain other equipment are equipped with an off switch. Beginning in January 2013, the Standby Regulation imposed further requirements on power management on certain devices we purchase and/or develop. These devices, namely the Horizon TV set-top box and any future set-top boxes, must comply with such requirements, unless it can be argued such further requirements are inappropriate. These additional requirements have necessitated additional software developments for our equipment and reduces the functionality of our equipment, assuming the equipment’s default setting is maintained.
Furthermore in August 2013, the E.U. Commission issued an amendment to the Standby Regulation called Networked Standby (No 801/2013), which became effective as of January 1, 2015, with the aim of regulating, among others, the maximum power consumption of networked consumer equipment while in the so-called Networked Standby mode. These additional requirements may have an impact on our costs and the customer experience.
As part of the E.U.’s Radio Spectrum Policy Program, spectrum made available through the switch off of analog television has been approved for mobile broadband use beginning January 1, 2013. This spectrum, known as the “digital dividend”, is in the 700 - 862 MHz band. The terms under which this spectrum will become available will vary among the European countries in which we operate. Certain uses of this spectrum may interfere with services carried on our cable networks. If this occurs, we may need to: (1) avoid using certain frequencies on our cable networks for certain or all of our services, (2) make some changes to our networks, or (3) change the equipment that we deploy. In approving mobile broadband, however, the Radio Spectrum Policy Program states that the new mobile services must co-exist with existing services, such as cable and DTT, to avoid harmful interference. As a result, we are in ongoing discussions with relevant Member States and the E.U. Commission to be included in LTE mobile trials in order to develop mitigation techniques and to engage NRAs to launch regulatory dialog with equipment manufacturers and mobile operators to develop co-existing networks. We have also requested Member States and the E.U. Commission to prepare comprehensive national impact assessments when spectrum conditions are changed to ensure that the costs to prevent interference between the various services are balanced.
I-44
United Kingdom
In the U.K., the Regulatory Framework is implemented through (1) the Communications Act 2003, which regulates all forms of communications technology, whether used for telecommunications or broadcasting, and (2) the Wireless Telegraphy Act 2006, which regulates radio communications in the U.K. (including spectrum, licensing arrangements, usage conditions and charges, license bidding and trading and enforcement and penalties). In addition, the Privacy and Electronic Communications Regulations 2003, as amended, implemented E.U. Directive 2002/58, which regulates the processing of personal data and the protection of privacy in the electronic communications sector.
Telecommunications companies in the U.K., including Virgin Media, are also subject to regulation under the U.K. Broadcasting Acts 1990 and 1996 and other U.K. statutes and subordinate legislation, including the Competition Act 1998 and the Enterprise Act 2002. The U.K. Office of Communications (Ofcom) regulates both linear and on-demand programming, which is derived from the E.U. Audiovisual Media Services Directive.
Ofcom is the key regulatory authority for the communications sector in which Virgin Media operates in the U.K. It is responsible for furthering the interests of citizens in relation to communications matters and furthering the interests of consumers in relevant markets where appropriate by promoting competition. From 2017, Ofcom will also assume the responsibilities of regulating the BBC, a role currently undertaken by the BBC Trust. The Competition and Markets Authority also has jurisdiction with respect to competition matters.
Broadband Expansion. The U.K. government is attempting to drive the provision of super-fast broadband to at least 95% of the U.K. population by the end of 2017. To stimulate private investment in this endeavor, the U.K. government is using money from the publicly funded BBC license fee, under-spend from the Analogue TV Switch-Off Project and other sources of public investment. The state aid measure permitting this subsidy was renewed (and amended) in 2016 and is expected to result in up to an additional 1%-2% superfast coverage.
In the 2016 Autumn Statement, the U.K. government announced proposals for further funding, and other measures, targeted at supporting market rollout of full fiber and 5G services. Proposed measures include public funding for the creation of a match-funded “full fiber deployment” fund (indicative £400.0 million), business rate relief for the deployment of new full fiber networks from 2017 and public funding for a strategic program of full fiber and 5G trials (indicative £740.0 million). Little detail has been provided to date, but the government issued, on December 29, 2016, a call for input, seeking suggestions on how best to stimulate full fiber deployments, including, where appropriate, with the use of public funds.
In November 2015, the U.K. government announced that everyone will, by 2020, have a legal right to request a broadband connection of at least 10 Mbps regardless of where they live. The government intends to achieve this by introducing a broadband Universal Service Obligation (USO). The USO is aimed, in particular, at addressing the final 5% of the population in the U.K. without access to a broadband connection of a reasonable speed. The Department for Culture, Media & Sport commissioned Ofcom to undertake a detailed analysis of the key factors that will help inform the design of the USO. A report was issued to the U.K. government to this end on December 16, 2016. The U.K. government is considering the Ofcom report and is expected to set out its decision on the final USO structure and adopt legislation to implement the necessary legislation, in 2017.
Television and VoD Services. In the U.K., Virgin Media is required to hold individual licenses under the Broadcasting Acts 1990 and 1996 for any television channels (including barker channels and any electronic programme guides), which Virgin Media owns or operates and for the provision of certain other services on its cable television platform, such as electronic program guides. These television licensable content service (TLCS) licenses are granted and administered by Ofcom. Under these licenses, each covered service must comply with a number of Ofcom codes, including the Broadcasting Code, and with all directions issued by Ofcom. Breach of any of the terms of a TLCS license may result in the imposition of fines on the license holder and, ultimately, the license being revoked.
As a provider of an on-demand program service (ODPS), Virgin Media must comply with a number of statutory obligations in relation to “editorial content” and notify Ofcom of its intention to provide an ODPS. Failure to notify Ofcom or comply with the relevant statutory obligations may result in the imposition of fines or, ultimately, the prohibition on providing an ODPS.
Following a review by Ofcom, Sky’s wholesale must offer obligation, which regulates terms of the wholesale supply of Sky Sports 1 and 2 in standard definition and HD, was removed. The removal of this obligation was appealed by BT and on December 21, 2016, the Competition Appeal Tribunal issued a judgment denying BT’s appeal.
Strategic Review of Digital Communications. In March 2015, Ofcom launched a strategic review of U.K. digital communications. A discussion document was published in July 2015, inviting stakeholder comment and input. Key focus areas for Ofcom were stated to be: investment and innovation, delivering widespread availability of services; sustainable competition;
I-45
empowering consumers; and, targeted regulation where necessary, deregulation elsewhere. Virgin Media responded to the discussion document emphasizing the importance of investment for competition, innovation and consumer interest. A key area of consideration is the future regulatory treatment of BT, in particular whether BT should be fully (structurally) separated, with the Openreach network division becoming a separate, independent company. Openreach is the operator of the backbone of Britain’s broadband internet network.
An “emerging thinking” document was published on February 25, 2016, setting out conclusions and Ofcom’s proposed policy position relating to a number of aspects of the U.K. regulatory regime. Key conclusions included: no structural separation of BT at the present time; an intention to improve quality of service across all providers; a requirement for BT to enhance its wholesale duct and pole access product; and an intention to advance further consumer protection measures. Later on July 26, 2016, Ofcom proposed a legal but not structural separation of Openreach. On November 29, 2016, Ofcom stated that it is proceeding with a formal notification to the E.U. Commission to require the legal separation of Openreach from BT. We expect this notification, preceded by a consultation, to be made in early 2017, unless Ofcom and BT otherwise reach agreement.
Regulation of Broadband Markets. In 2017, Ofcom will commence its next triennial review of the Fixed Access markets, including the Wholesale Local Access market (incorporating physical or passive network access via methods such as LLU and duct access) and the Wholesale Broadband Access market (virtual or active network access via methods such as provision of wholesale managed service products). A key area of focus will be the regulation of BT’s FTTx based wholesale products (specifically the pricing thereof) and improving the existing physical infrastructure access (allowing third parties access to BT’s duct and pole estate). To this end, on December 6, 2016, Ofcom issued a consultation on making the physical infrastructure access more effective.
Ofcom Review of Business Connectivity Markets. Ofcom concluded its latest review of the U.K. business connectivity markets (leased lines and dedicated business connections, among others) in the spring of 2016. Ofcom found BT held Significant Market Power in certain markets and proposed consequential regulatory remedies. These remedies included an obligation on BT to provide access to its dark fiber. BT, CityFibre and TalkTalk have appealed Ofcom’s decision. Virgin Media has intervened in the appeal. This matter remains ongoing and a hearing is expected in 2017.
Mobile Service. As an MVNO, Virgin Media is subject to E.U. regulations relating to retail prices for roaming services. These regulations: set limits on certain wholesale and retail tariffs for international mobile voice roaming, SMS tariffs and data roaming within the E.U.; provide for greater levels of transparency of retail pricing information; impose measures to guard against bill shock in respect of data roaming; and set maximum roaming rates within the E.U. A new regulation, effective June 2017, abolishes roaming tariffs in the E.U. (subject to addressing inconsistencies in underlying wholesale charges). Until then, roaming surcharges have been reduced significantly since April 2016.
Mobile termination charges applied by mobile network operators are regulated by Ofcom under a Significant Market Power charge control condition. Under Virgin Media’s MVNO agreement, these changes in mobile termination charges are passed on to Virgin Media. Ofcom has set mobile termination charges for the period of 2015-2018, with rates reducing to approximately half of their starting levels by the end of this period. As a result, Virgin Media has experienced a reduction in revenue from such charges, although with some off-setting reductions in cost.
Fixed voice termination. Virgin Media has been designated as a provider with Significant Market Power on fixed voice termination. As a result, the rates that it charges other providers for termination on its network are subject to regulation. This requires, amongst other things, the provision of termination on fair and reasonable terms, conditions and charges - which must be no higher than BT’s regulated charges, unless certain conditions are met.
Germany
Germany has incorporated the E.U. laws into national laws, although under the German legal system competency is split between the Federal State (telecommunication law) and the German federal states (Bundesländer) (media law). The German Telecommunications Act broadly implemented the Regulatory Framework and covers the distribution of any signal by telecommunications networks encompassing television signals, internet data and telephony. The 2009 revisions to the Regulatory Framework by the E.U. were implemented by Germany in May 2012. The German Federal Network Agency (Bundesnetzagentur) is responsible inter alia for the regulation of the German telecommunications market. The Federal Cartel Office (the FCO), the national competition authority (Bundeskartellamt), plays an important role with respect to infrastructure and media regulation. The FCO has powers to address competition issues in all markets, although in some cases, competition issues will be addressed by the German Federal Network Agency.
Regulation of the media falls within the authority of the German federal states (Bundesländer). The media laws of all 16 federal states have been partially harmonized by the State Broadcasting Treaty (Rundfunkstaatsvertrag). The State Broadcasting Treaty establishes the main framework of the German regulation of broadcast. Nearly every German state has established its own
I-46
independent regulatory body, the state media authority (Landesmedienanstalt) for the regulation of the private broadcasting sector. The state media authorities are primarily responsible for licensing and supervision of commercial broadcasters and the allocation of transmission capacities for radio and television channels. They also have authority with respect to the regulation of channel carriage fees, conditional access systems, interfaces, the bundling of programs and price regulation.
The allocation and use of analog cable transmission capacities for both radio and television channels in Germany is governed by the must carry rules of the respective German federal states. The allocation of digital transmission capacities for digital television and radio channels is primarily governed by the must carry rules of the State Broadcasting Treaty. The media law in the states of Baden-Württemberg, North Rhine-Westphalia and Hesse where Unitymedia operates, require Unitymedia to carry at least 13, 23 and 24 analog channels, respectively, and also limits Unitymedia’s ability to convert these analog cable channels into digital channels.
The operation of conditional access systems for television services is governed by both the State Broadcasting Treaty and the German Telecommunications Act. Generally, operators must not unfairly obstruct or discriminate against broadcasters and other content providers through conditional access systems.
Unitymedia has been declared an operator with Significant Market Power on the market for call termination on an individual fixed public telephone network. Since November 2013, reciprocal termination rates for exchanging calls via Unitymedia’s IP-interface have been imposed, which results in Unitymedia, like every other telecommunications provider in Germany, charging the interconnection rate of the incumbent telecommunications operator, Deutsche Telekom. The wholesale tariffs for call termination on the fixed public telephone networks is set at 0.0024 euro/minute, which rate expired on December 31, 2016. On December 7, 2016, the German Federal Network Agency published a draft decision regarding the wholesale tariffs for call termination on the public telephone network provided at a fixed location reducing such termination rates for Deutsche Telekom to 0.001 euro/minute effective January 1, 2017. Although Unitymedia is not regulated for interconnection via the SS7 interface, we expect the new level of termination rates will be applicable to Unitymedia in 2017 with respect to calls terminating on its NGN interface.
The Netherlands
The Netherlands’ electronic communications law broadly implements the Regulatory Framework. Pursuant to the electronic communications law, the Autoriteit Consument & Markt (ACM), the Netherlands NRA, performed a market analysis to determine which, if any, operator or service provider has Significant Market Power. In December 2011, ACM completed its analysis of the television market and concluded that there were no grounds for regulation of that market. As a result, no new regulations relating to the television market may be proposed without a new analysis.
On August 5, 2013, ACM published its latest market analysis decision on call termination, which combines both the fixed termination market and the mobile termination market. The new tariffs became effective September 1, 2013. The decision was appealed by various operators, including Ziggo, and on August 27, 2013, the Dutch Supreme Administrative Court decided in a preliminary decision that the decrease of cap charges should be less steep than ACM had initially determined. These revised tariffs apply until the Dutch Supreme Administrative Court arrives at a final decision in the appeal proceedings on the merits. The Dutch Supreme Administrative Court ruled on October 15, 2014 to pose prejudicial questions to the European Court of Justice. After an Advocate General opinion, the European Court of Justice ruled on September 15, 2016 that deviation from the European Commission’s 2009 Recommendation on Termination Rates is only possible if justified by national circumstances. The hearing at the Dutch Supreme Administrative Court was held on January 11, 2017, and we expect the ruling in the next few months.
On January 1, 2014, the revised must carry obligations became effective. The revised must carry obligations do not only apply to cable operators, as was previously the case, but also apply to all providers of analog and digital program packages based on the principle of technology neutrality. Providers of digital program packages with 100,000 or more subscribers are subject to the obligation to provide at least 30 television channels, including six public television broadcasting channels as a must carry obligation, a limited amount of regional and local television broadcasting channels and a number of digital radio broadcasting channels. In addition, all providers of analog program packages with 100,000 or more subscribers must include at least 15 television channels, including five public broadcasting channels as a must carry obligation, a limited amount of regional and local television broadcasting channels and some analog radio broadcasting channels. The Dutch Media Authority can grant a (conditional) exemption from the obligation if the must carry obligations listed above give rise to disproportionate costs for the network operator, an impediment to innovation or other unreasonable outcomes.
There is no regulated financing mechanism in place between network operators and broadcasters. Commercial and public program providers must negotiate with network operators regarding transmission fees.
In July 2015, the Dutch incumbent telecommunications operator filed an appeal against the E.U. Commission regarding its decision to approve the acquisition of Ziggo, which we completed in November 2014. We are not a party to the appeal and we do
I-47
not expect that the filing of this appeal to have any impact on the development of our operations in the Netherlands, including our contribution of Ziggo Group Holding and its subsidiaries to VodafoneZiggo.
Following the E.U. Commission’s clearance of our acquisition of Ziggo, on October 31, 2014, ACM published as part of the fourth round of market analysis a draft of market analysis decision on LLU. Initially, ACM found a risk of joint dominance by KPN and Ziggo in the related retail broadband market. Later, after notification to the E.U. Commission and further consultations, ACM published its final decision on December 17, 2015. In the final decision, ACM no longer found a risk of joint dominance for KPN and Ziggo at the retail level but still concluded that there is a risk of consumer harm due to prices being set above the competitive equilibrium. At the wholesale level, ACM concluded that KPN is dominant on the wholesale market and imposed obligations on KPN. ACM concluded that Ziggo is not part of the relevant LLU market and that KPN is dominant on that market. As a result, ACM imposed obligations on KPN only. ACM has indicated that as a result of the formation of VodafoneZiggo, it will start working on a new analysis of the LLU market in 2017.
Belgium
Belgium has broadly transposed the Regulatory Framework into law. According to the electronic communications law of June 13, 2005, the Belgisch Instituut voor Post en Telecommunicate (the BIPT), the Belgian NRA, should perform a market analysis to determine which, if any, operator or service provider has Significant Market Power. In addition, the Federal Parliament prepared legislation to transpose the 2009 revisions to the Regulatory Framework, which became effective as of August 4, 2012.
Telenet has been declared an operator with Significant Market Power on the market for call termination on an individual fixed public telephone network. Since April 1, 2012, reciprocal termination rates have been imposed, which results in Telenet charging the interconnection rate of the incumbent telecommunications operator, Proximus. On August 30, 2016, the BIPT published its final decision regarding the wholesale tariffs for call termination on the public telephone network provided at a fixed location. As of November 1, 2016, the wholesale tariffs for call termination on the fixed public telephone networks is set at 0,092 eurocent/minute. This decision has been appealed before the Court of Appeal in Brussels by Proximus and 3StarsNet and a judgment is expected during the first half of 2017.
Although no determination has been made on whether Telenet as an MVNO has Significant Market Power on the market for call termination on individual mobile networks, its rates have been affected by rate limitations implemented by BIPT. In June 2010, BIPT imposed a steep rate reduction that resulted in (1) an initial 45% decline effective August 1, 2010, over the then average rate and (2) a further decline in January 2013 that was approximately 79% less than the average rate implemented on August 1, 2010. As of January 1, 2013, mobile termination rates have been set by BIPT at €1.08 cents per minute, and to date, 2015 rates have not been set. On September 14, 2015, BIPT published its draft decision on the relevant market for “call termination on individual mobile networks”. Telenet, as an MVNO, has been designated in the draft decision as having Significant Market Power. Following its acquisition of BASE, Telenet will be designated as having a Significant Market Power by BIPT. In the draft decision, BIPT adopts a bottom-up long run incremental cost model to calculate tariffs for call termination on individual mobile networks, resulting in a nominal value of €0.81 per minute in 2015 and a declining glide path up and until 2020. BIPT organized public consultation on this draft decision, which was open until November 14, 2015. This draft decision has not yet been submitted to the E.U. Commission for notification. A final decision is expected during the first half of 2017.
In December 2010, BIPT and the regional regulators for the media sectors (together, the Belgium Regulatory Authorities) published their respective draft decisions reflecting the results of their joint analysis of the broadcasting market in Belgium. The Belgium Regulatory Authorities adopted a final decision on July 1, 2011 (the July 2011 Decision) with some minor revisions. The regulatory obligations imposed by the July 2011 Decision include (1) an obligation to make a resale offer at “retail minus’’ of the cable analog package available to third-party operators (including Proximus), (2) an obligation to grant third-party operators (except Proximus) access to digital television platforms (including the basic digital video package) at “retail minus”, and (3) an obligation to make a resale offer at “retail minus’’ of broadband internet access available to beneficiaries of the digital television access obligation that wish to offer bundles of digital video and broadband internet services to their customers (except Proximus).
In February 2012, Telenet submitted draft reference offers regarding the obligations described above, and the Belgium Regulatory Authorities published the final decision on September 9, 2013. Telenet has implemented the access obligations as described in its reference offers and, as of March 1, 2016, Orange Belgium NV (Orange Belgium), formerly known as Mobistar SA, launched a commercial offer combining a cable TV package and broadband internet access for certain of their mobile customers. In addition, as a result of the November 2014 decision by the Brussels Court of Appeal described below, on November 14, 2014, Proximus submitted a request to Telenet to commence access negotiations. Telenet contests this request and has asked the Belgium Regulatory Authorities to assess the reasonableness of the Proximus request. The timing for a decision regarding this assessment by the Belgium Regulatory Authorities is not known.
I-48
On December 14, 2015, the Belgium Regulatory Authorities published a draft decision, which amended previously-issued decisions, and sets forth the “retail minus” tariffs of minus 26% for basic television (basic analog and digital video package) and minus 18% for the bundle of basic television and broadband internet services during an initial two-year period. Following this two-year period, the tariffs would change to minus 15% and 7%, respectively. The draft decision was notified to the E.U. Commission and a final decision was adopted on February 19, 2016. A “retail minus” method of pricing involves a wholesale tariff calculated as the retail price for the offered service by Telenet, excluding value added tax (VAT) and copyrights, and further deducting the retail costs avoided by offering the wholesale service (such as costs for billing, franchise, consumer service, marketing and sales).
Telenet filed an appeal against the July 2011 Decision with the Brussels Court of Appeal. On November 12, 2014, the Brussels Court of Appeal rejected Telenet’s appeal and accepted Proximus’s claim that Proximus should be allowed access to Telenet’s, among other operators, digital television platform and the resale of bundles of digital video and broadband internet services. On November 30, 2015, Telenet filed an appeal of this decision with the Belgian Supreme Court. In 2014, Telenet and wireless operator Orange Belgium each filed an appeal with the Brussels Court of Appeal against the initial retail minus decision. These appeals are still pending. On April 25, 2016, Telenet also filed an appeal with the Brussels Court of Appeals challenging the February 19, 2016 retail minus decision. There can be no certainty that Telenet’s appeals will be successful.
The July 2011 Decision aims to, and in its application may, strengthen Telenet’s competitors by granting them resale access to Telenet’s network to offer competing products and services notwithstanding Telenet’s substantial historical financial outlays in developing the infrastructure. In addition, any resale access granted to competitors could (1) limit the bandwidth available to Telenet to provide new or expanded products and services to the customers served by its network and (2) adversely impact Telenet’s ability to maintain or increase its revenue and cash flows. The extent of any such adverse impacts ultimately will be dependent on the extent that competitors take advantage of the resale access ultimately afforded to Telenet’s network and other competitive factors or market developments.
Switzerland
Switzerland has a regulatory system that partially reflects the principles of the E.U., but otherwise is distinct from the European regulatory system of telecommunications. The Telecommunications Act (Fernmeldegesetz) regulates, in general, the transmission of information, including the transmission of radio and television signals. Most aspects of the distribution of radio and television, however, are regulated under the Radio and Television Act (Bundesgesetz über Radio und Fernsehen). In addition, the Competition Act, the Date Protection Act and the Act on the Surveillance of Post and Telecommunications are potentially relevant to our business. With respect to energy consumption of electronic home devices, the Energy Act and the revised Energy Ordinance are applicable to set-top boxes as described below.
Under the Telecommunications Act, any provider of telecommunication services needs to register with the Federal Office of Communications. Dominant providers have to grant access to third parties, including LLU access; however, it is restricted to the copper wire network of the incumbent, Swisscom. Therefore, such unbundling obligations do not apply to our business in Switzerland and other cable operators. Also, any dominant provider has to grant access to its ducts, subject to sufficient capacity being available in the relevant duct. At this time, only Swisscom has been determined to be dominant in this regard. Dominant operators are obliged to provide interconnection and all providers of services forming part of the universal service in Switzerland have to ensure interoperability of services.
In regards to call termination as part of interconnection agreements, Swisscom as market dominant provider, must offer these services at cost-oriented prices and disclose the conditions and prices for their individual access services. In interconnection agreements with Swisscom, reciprocal termination rates are imposed. The Federal Council has suggested that the current Telecommunications Act be revised. The Federal Council plans to introduce measures to allow for easier access to the incumbent’s network, better consumer protection (decreasing roaming fees, unbundling of products, measures to prevent spoofing) and a change to the regulatory regime giving the Federal Communications Commission partial ex officio rights to impose obligations on market dominant providers. Further, the Federal Council will implement consumer and youth protection measures. The topic of regulated net neutrality may be introduced in the revision. In addition, it is expected that the conditions for a national broadband rollout will be improved by introducing access obligations to the ducts of local utilities. The proposal is expected by September 2017, but would not be legally binding prior to 2020.
Under the Radio and Television Act and the corresponding ordinance, cable network operators are obliged to distribute certain programs that contribute in a particular manner to media diversity. The Federal Government and the Federal Office of Communications can select up to 25 programs that have to be distributed without the cable operator being entitled to compensation. Since January 1, 2015, those programs must no longer be broadcasted in analog.
I-49
Effective August 1, 2016, the Federal Council adapted its regulation on imposing power thresholds for set-top boxes to E.U.-levels. As a result, Switzerland will have the same power thresholds as member countries of the E.U.
In regards to lawful interception, the Federal Act on the Surveillance of Post and Telecommunications was finished in Swiss Parliament’s Spring Session 2016. Changes in the respective ordinance will be discussed in Parliament in Spring 2017. Relevant issues for us are automated information disclosure and identification of all clients by ID as this would mean mandatory changes of our ordering processes.
In September 2016, the Intelligence Agencies Act was approved by the Swiss population. For Telecommunications service providers, the Intelligence Agencies Act contemplates new obligations regulating cable traffic. The respective ordinance containing details of the implementation will be under consultation during the first quarter of 2017.
A revised version of the Data Protection Act is currently under public consultation until April 2017. The revised version foresees more transparency regarding the processing of data, for example by reinforcing the information duties when processing personal data. Furthermore, the new version follows the developments in the E.U.
LiLAC Group
CWC
The video, broadband and telephony services provided by CWC are subject to regulation and enforcement by various governmental entities in each of the jurisdictions such services are provided. The scope and reach of these regulations are distinct in each market. Generally, CWC provides services in accordance with licenses and concessions granted by national authorities pursuant to national telecommunication legislation and associated regulations. Certain of these regulatory requirements are summarized below.
As the incumbent telecommunications provider in many of its jurisdictions, CWC is subject to significant regulatory oversight with respect to the provision of fixed-line and mobile telephony services. Generally, in these markets, CWC operates under a government issued license or concession that enables it to own and operate its telecommunication networks, including the establishment of wireless networks and the use of spectrum. These licenses and concessions are typically non-exclusive and have renewable multi-year terms that include competitive, qualitative and rate regulation. Licenses and concessions are scheduled to expire over the next two years in Jamaica, Cayman Islands and Barbados.
Rate regulation of CWC’s telephony services typically includes price caps that set the maximum rates CWC may charge to customers, or legislation that requires consent from a regulator prior to any price increases. In addition, all regulators determine and set the rates that may be charged by all telephony operators, including CWC, for interconnect charges, access charges between operators for calls originating on one network that are completed through connections with one or more networks of other providers, and charges for network unbundling services. In addition, in certain markets, regulators set, or are seeking to set, mobile roaming rates.
In recent years, a number of markets in which CWC operates have demonstrated an increased interest in regulating various aspects of broadband internet services due to the increasing importance and availability of high speed broadband. As broadband internet access has become a national priority for many of CWC’s markets, national regulators have demonstrated an increased focus on the issues of network resilience, broadband affordability and penetration, quality of services and consumer rights. Certain regulators are also seeking to mandate third-party access to CWC’s network infrastructure, including dark fibre and landing stations, as well as to regulate wholesale services and prices.
As an example, the Eastern Caribbean Telecommunications Authority (ECTEL), the regulatory body for telecommunications in five Eastern Caribbean States (Commonwealth of Dominica, Grenada, St. Kitts and Nevis, Saint Lucia, St. Vincent and the Grenadines), has adopted an Electronic Communications Bill that may have a material adverse impact on CWC’s operations in the ECTEL member states. The proposed Electronic Communications Bill includes provisions relating to:
• | net neutrality principles mandating equal access to all content and applications regardless of the source and without favoring, degrading, interrupting, intercepting, blocking access or throttling speeds; |
• | subscription television rate regulation; |
• | regulations implementing market dominance rules; |
• | network unbundling at regulated rates; and |
I-50
• | mandated unbundled access to all landing station network elements at cost-based rates. |
We currently cannot determine the impact these provisions will have on our operations because national regulators are required to conduct extensive market reviews before adopting specific measures. Moreover, while we expect the legislation will be enacted during 2017, the bill will not become law in any individual ECTEL state until implementing legislation has been adopted by that state. As such, the timing and ultimate effect of the bill is unclear.
In Panama, as a result of a public consultation process, we expect the regulator to issue new guidelines for the Internet Public Service, establishing new quality goals for this service.
In addition to rate regulation, several markets in which CWC operates have imposed, or are considering imposing, regulation designed to further encourage competition, including introducing requirements related to unbundling, network access to third parties, and local number portability (LNP). LNP has been implemented in Panama, the Cayman Islands and Jamaica and is currently being contemplated or implemented in other jurisdictions, including Barbados, the Bahamas and Trinidad and Tobago.
The pay television service provided in certain CWC markets is subject to, among other things, subscriber privacy regulations and must-carry and retransmission consent rights of broadcast stations.
CWC is subject to universal service obligations in a number of markets. These obligations vary in specificity and extent, but they are generally related to ensuring widespread geographic coverage of networks and that the populations of CWC’s individual markets have access to basic telecommunication services at minimum quality standards. In a number of cases, CWC is required to support universal access/service goals through contributions to universal service funds or participate in universal service related projects.
In addition to the industry-specific regimes discussed above, CWC’s operating companies must comply with both specific and general legislation concerning, among other matters, data retention, consumer protection and electronic commerce. These operating companies are also subject to national level regulations on competition and on consumer protection.
The CWC Acquisition triggered regulatory approval requirements in certain jurisdictions in which CWC operates. The regulatory authorities in certain of these jurisdictions, including the Bahamas, Jamaica, Trinidad and Tobago, the Seychelles and the Cayman Islands, have not completed their review of the CWC Acquisition or granted their approval. While we expect to receive all outstanding approvals, such approvals may include binding conditions or requirements that could have an adverse impact on CWC’s operations and financial condition.
In Trinidad and Tobago, CWC was required by Telecommunications Authority of Trinidad and Tobago (TATT), in connection with TATT’s approval of CWC’s acquisition of Columbus International, to dispose of its 49% shareholding in the Telecommunications Services of Trinidad and Tobago Limited (TSTT). The disposal of CWC’s stake in TSTT is not complete and the deadline set by TATT for such completion has been extended until the end of March 2017. We may not be able to complete the sale of TSTT or realize the full value of TSTT from our divestiture due to the circumstances of the sale. The stake in TSTT is currently held for sale.
Chile
VTR is subject to regulation and enforcement by various governmental entities in Chile including the Chilean Antitrust Authority, the Ministry of Transportation and Telecommunications (the Ministry) through the Chilean Undersecretary of Telecommunications (SubTel), the National Television Council (CNTV) and the National Consumer Service (Sernac).
In addition to the specific regulations described below, VTR is subject to certain regulatory conditions which were imposed by the Chilean Antitrust Authority in connection with VTR’s combination with Metrópolis Intercom SA in April 2005. These conditions are indefinite and include, among others, (1) prohibiting VTR and its control group from participating, directly or indirectly through a related person, in Chilean satellite or microwave television businesses, (2) prohibiting VTR from obtaining exclusive broadcast rights, except for specific events, and (3) requiring VTR to offer its broadband capacity for resale of internet services on a wholesale basis.
Video. The provision of pay television services requires a permit issued by the Ministry. Cable pay television permits are granted for an indefinite term and are non-exclusive. As such permits do not involve radio electric spectrum, they are granted without ongoing duties or royalties. VTR has permits to provide cable pay television services in the major cities, including Santiago, and in most of the medium-sized markets in Chile.
I-51
Cable television service providers in Chile are free to define the channels and content included in their services and are not required to carry any specific programming, except as described below. However, CNTV may impose sanctions on providers who are found to have run programming containing excessive violence, pornography or other objectionable content. Pay television operators are directly responsible for violation of such prohibitions. Additionally, the Television Act requires pay television operators to offer a certain quota of cultural content and to distribute public interest campaigns.
The Television Act establishes a retransmission consent regime between broadcast television concessionaires and pay television operators. This regime provides that once a broadcast operator achieves digital coverage of 85% of the population within its concession areas, the broadcast operator may require that pay television operators enter into an agreement for the retransmission of its digital signal. In addition, the Television Act requires that the technical or commercial conditions imposed by broadcast operators not discriminate among pay television operators. Also, the Television Act establishes a must carry regime requiring pay television operators to distribute up to four local broadcast television channels in each operating area. The channels that must be carried by any particular pay television operator are to be selected by CNTV. The full implementation of the retransmission and must carry regimes are still pending.
VTR’s ability to change its channel lineup is restricted by an agreement reached with Sernac in July 2012 and the general regulation established by SubTel in February 2014 (by the Telecommunication Services General Rulemaking). This framework allows VTR to change one or more channels from its lineup after a 60-day notice period to its subscribers. In such cases, VTR shall offer a channel of similar content and quality or a proportional compensation. Despite this, after certain channel adjustments were applied in July 2016, the excluded programmers as well as social media have questioned VTR’s ability to unilaterally modify its channel grid, arguing that content and quality of new channels should be identical to the excluded channels. A final position on this issue is pending.
Internet. A law on internet neutrality prohibits “arbitrary blockings” of legal content, applications or services and the provision of differentiated service conditions according to the origin or ownership of the content or service provided through the internet. Additionally, the law authorizes ISPs to take measures to ensure the privacy of their users and provide virus protection and safety processes over their network, as long as these measures do not infringe antitrust laws. Additional measures have been implemented, including obligations related to consumer information, traffic management policies, internet quality of service requirements and notices required by law concerning the effective maximum and minimum traffic speeds offered under internet access plans.
In order to protect the constitutional rights of privacy and safety of communications, ISPs are prohibited from undertaking surveillance measures over data content on their networks. Also, special summary proceedings have been created in order to safeguard intellectual property rights against violations committed through networks or digital systems. These proceedings include measures designed to withdraw, disqualify or block infringing content in the ISP’s network or systems. The law also provides for the right of intellectual property owners to judicially request from ISPs the delivery of necessary information to identify the provider of infringing content.
A bill is being discussed in the Congress, which would, if enacted, impose on fixed and mobile ISPs an obligation to guarantee a minimum broadband throughput based on the offered speed. The proposed bill would also require ISPs to provide its subscribers a certified measurement tool allowing them to verify this minimum service level and subject the ISPs to fines of penalties if the service level is not fulfilled. We expect this bill will be passed during the second quarter of 2017.
Fixed-Line Telephony and Mobile Services. The provision of fixed-line telephony and mobile services requires a public telecommunications service concession. With respect to mobile services, in 2009, SubTel awarded VTR a license for 30 MHz of spectrum in the 1700/2100 MHz frequency band for the provision of wireless telephony services. The license has a 30-year renewable term. In 2012, VTR transferred this license to its affiliate VTR Wireless SpA (VTR Wireless), which is now a subsidiary of VTR known as VTR Comunicaciones SpA. On January 15, 2014, SubTel initiated a proceeding against VTR Wireless based on having allegedly “altered an essential element of its concession, particularly the type of service”. In this proceeding, SubTel asserted that VTR Wireless is not in compliance with the terms of such wireless license. SubTel alleged that the terms of the wireless license require VTR Wireless to comply with certain minimum network coverage and traffic levels. VTR disagreed with SubTel’s assertions regarding the terms of the wireless license and contested such assertions vigorously. The maximum possible sanctions include “the termination of the concession”. The final ruling regarding this case is still pending.
VTR has concessions to provide fixed-line telephony in most major and medium-sized markets in Chile. Telephony concessions are non-exclusive and have renewable 30-year terms. The original term of VTR’s fixed-line telephony concessions expires in November 2025. Long distance telephony services are considered intermediate telecommunications services and, as such, are also regulated by the Ministry. VTR has concessions to provide this service, which is non-exclusive, for a 30-year renewable term expiring in September 2025.
I-52
There are no universal service obligations in Chile. However, local service concessionaires are obligated to provide telephony service to all customers that are within their service area or are willing to pay for an extension to receive service. All local service providers, including VTR, must give long distance telephony service providers equal access to their network connections at regulated prices and must interconnect with all other public service concessionaires whose systems are technically compatible.
As a general rule, fixed-line telephony service providers are free to establish the rates directly charged to their customers, unless the Chilean Antitrust Authority concludes that due to a lack of sufficient competition in the market, rates should be fixed by SubTel. However, SubTel sets the maximum rates that may be charged by each operator for interconnect charges, access charges between operators for calls originating on one network that are completed through connections with one or more networks of other providers, and charges for network unbundling services. Rate regulation on interconnection charges is applicable to all fixed-line and mobile telephony companies, including VTR. The determination of the maximum rates that may be charged by operators for their fixed-line or mobile services are made on a case-by-case basis by SubTel and are effective for five years. The next VTR tariff setting is in process, which will define some of VTR’s tariffs from June 2017 to June 2022.
Other Chilean Regulation
• | Price Increase. The Consumer Rights Protection Law contains provisions that require that any raise in rates exceeding inflation must be previously accepted and agreed to by subscribers. Although VTR disagrees with this interpretation, in July 2012, VTR reached an agreement with Sernac that permits VTR to make adjustments to its published prices twice per year to adjust for inflation, except those services that are subject to rate regulation. VTR is generally prohibited from increasing the rates over the inflation adjustment. VTR may, however, cancel a subscriber’s contract after 12 months and propose a new contract with new rate provisions. Once a year VTR may propose to its existing subscribers additional changes to their rates, which must be accepted by the subscriber for the rates to go into effect. |
• | Bundling. On December 18, 2012, the Chilean Antitrust Authority issued its regulation governing the on-net/off-net pricing practice in the mobile industry and the offering of bundled telecommunication services. Pursuant to the terms of this regulation, as revised by the Chilean Supreme Court, mobile services may be sold jointly with fixed-line services. However, promotional discounts were not permitted for these double-play offers. As for traditional bundling over the same platform (e.g., bundled fixed-line services such as our double- and triple-play packages, or bundled mobile services), this regulation provides that such services may be bundled, subject to certain price limitations. These limitations require that the total price for a bundle must be greater than the standalone price for the most expensive service included in the bundle. Also, when three or more services are bundled, the price for the bundle must be greater than the sum of the standalone prices for each service in the bundle, excluding the lowest priced service. |
• | Telecommunication Services Proposal. In February 2014, SubTel published a General Telecommunication Services Ruling that regulates the offer of telecommunication services, including voice, internet access, and pay television, either alone or in bundles, from a consumer protection point of view. The regulation introduced service billing, significant changes in contracts with customers, requirements regarding compensation in case of service failure, and rules regarding treatment of customers’ personal information. |
• | Minimum Standards on Quality of Service and Operation. From August 5 to September 4, 2013, SubTel submitted for public comment a draft of the Technical Fundamental Plan on Maintenance and Public Service Telecommunications Network Managing. This draft seeks to impose minimum standards on quality of service and operation of telecommunications networks, in general, and in some particular services: voice services; text and multimedia messages services; data transmission services; minimum coverage for mobile services; and digital terrestrial television minimum coverage. We are uncertain when SubTel will publish the final version of the plan. |
• | Consumer’s Rights Protection Law Amendment. A bill is being discussed at Congress assigning significant new powers to Sernac, including a material increase of fines and compensations. The current law acknowledges that legal regulations imposed on specific business activities (such as the Telecommunications Act) must prevail over the Consumer’s Rights Protection law. However, it is still uncertain how or whether Sernac and SubTel will redefine their respective scope. |
Puerto Rico
We are subject to regulation in Puerto Rico by various governmental entities at the Puerto Rico and the U.S. federal level, including the Federal Communications Commission (FCC). The Puerto Rico Telecommunications Regulatory Board (TRB), which was established in 1996, has primary regulatory jurisdiction in Puerto Rico at the local level and is responsible for awarding franchises to cable operators for the provision of cable service in Puerto Rico and regulating cable television and telecommunications services.
I-53
Our business in Puerto Rico is subject to comprehensive regulation under the United States Communications Act of 1934, as amended (the Communications Act), which regulates communication, telecommunication and cable television services. The Communications Act also provides the general legal framework for, among other things, the provision of telephone services, services related to interconnection between telephone carriers, and television, radio, cable television and direct broadcast satellite services.
The FCC and/or the TRB have the authority to impose sanctions, including warnings, fines, license revocations and, in certain specific cases, termination of the franchise, although license revocation and franchise termination are rare. The Communications Act specifies causes for the termination of FCC licenses, including, for example, the failure to comply with license requirements and conditions or to pay fines or fees in a timely manner. Such sanctions by the TRB and/or FCC can be appealed to, and reviewed by, Puerto Rican courts and U.S. federal courts.
In Puerto Rico, antitrust regulation is governed by the U.S. Sherman Act, other federal antitrust legislation, and the Puerto Rico Anti-Monopoly Law. In particular, the Sherman Act seeks to prevent anti-competitive practices in the marketplace and requires governmental review of certain business combinations, among other things. See note 17 to our consolidated financial statements included in Part II of this Annual Report on Form 10-K. The Puerto Rico Anti-Monopoly Law substantially parallels the Sherman Act and authorizes the Puerto Rico Department of Justice to investigate and impose competition-related conditions on transactions.
Puerto Rico Law 5 of 1973, as amended, created the Puerto Rico Department of Consumer Affairs, which regulates marketing campaigns, publicity, and breach of service contracts, and prohibits false advertising. The Puerto Rico Telecommunications Act of 1996 (Law 213), which created the TRB, requires that rates for telecommunication services be cost-based, forbids cross-subsidies and focuses on encouraging, preserving and enforcing competition in the cable and telecommunications markets. Although Law 213 does not require us to obtain any approval of rate increases for cable television or telecommunication services, any such increases must be in compliance with Law 213’s requirements, including prior notification to the TRB before such increases take effect.
The video, internet and fixed-line telephony services that we provide are all subject to regulation:
• | Video. The provision of cable television services requires a franchise issued by the TRB. Franchises are subject to termination proceedings in the event of a material breach or failure to comply with certain material provisions set forth in the franchise agreement governing a franchisee’s system operations, although such terminations are rare. In addition, franchises require payment of a franchise fee as a requirement to the grant of authority. Franchises establish comprehensive facilities and service requirements, as well as specific customer service standards and monetary penalties for non-compliance. Franchises are generally granted for fixed terms of up to ten years and must be periodically renewed. |
Our pay television service is subject to, among other things, subscriber privacy regulations and must-carry and retransmission consent rights of broadcast stations. The Communications Act and FCC rules govern aspects of the carriage relationship between broadcast television stations and cable companies. To ensure that every qualifying local television station can be received in its local market without requiring a cable subscriber to switch between cable and off-air signals, the FCC allows every qualifying full-power television broadcast station to require that all local cable systems transmit that station’s primary digital channel to their subscribers within the station’s market (the “must-carry” rule) pursuant to the Cable Television Consumer Protection and Competition Act of 1992. Alternatively, a station may elect every three years to forego its must carry rights and seek a negotiated agreement to establish the terms of its carriage by a local cable system, referred to as retransmission consent.
• | Internet. We offer high-speed internet access throughout our entire footprint. In March 2015, the FCC issued an order classifying mass-market broadband internet access service as a “telecommunications service”, changing its long-standing treatment of this offering as an “information service”, which the FCC traditionally has subjected to limited regulation. The rules adopted by the FCC prohibit, among other things, broadband providers from: (1) blocking access to lawful content, applications, services or non-harmful devices; (2) impairing or degrading lawful internet traffic on the basis of content, applications, services or non-harmful devices; and (3) favoring some lawful internet traffic over other lawful internet traffic in exchange for consideration. In addition, the FCC prohibited broadband providers from unreasonably interfering with users’ ability to access lawful content or use devices that do not harm the network, or with edge providers’ ability to disseminate their content. The FCC also imposed more detailed disclosure obligations on broadband providers than were previously in place, which were approved by the Office of Management and Budget in late 2015. The FCC’s rules are in effect, and were upheld by the United States Court of Appeals for the District of Columbia Circuit. The impact of these revised rules on our business is unclear. |
• | Fixed-Line Telephony Services. We offer fixed-line telephony services, including both circuit-switched telephony and VoIP. Our circuit-switched telephony services are subject to FCC and local regulations regarding the quality and technical |
I-54
aspects of service. All local telecommunications providers, including us, are obligated to provide telephony service to all customers within the service area, subject to certain exceptions under FCC regulations, and must give long distance telephony service providers equal access to their network. Under the Communications Act, competitive local exchange carriers (CLECs), like us, may require interconnection with the incumbent local exchange carrier (ILEC), and the ILEC must negotiate a reasonable and nondiscriminatory interconnection agreement with the CLEC. Such arrangement requires the ILEC to interconnect with the CLEC at any technically feasible point within the ILEC’s network, provide access to unbundled network elements of the ILEC’s network, offer for resale at wholesale rates any telecommunication services the ILEC provides to its own retail clients, and allow physical collocation of the CLEC’s equipment in the ILEC’s facilities to permit interconnection or access to unbundled network element services. Therefore, we have the right to interconnect with the incumbent local exchange carrier (PRT). We have negotiated an interconnection agreement with PRT, and the physical interconnection between both companies has been activated.
All of our circuit-switched telephony and VoIP services are subject to a charge for the Federal Universal Service Fund (USF), which is a fund created under the Communications Act to subsidize telecommunication services in high-cost areas, to provide telecommunications services for low-income consumers, and to provide certain subsidies for schools, libraries and rural healthcare facilities. The FCC has redirected the focus of USF to support broadband deployment in high-cost areas. In addition, our circuit-switched telephony and VoIP services are subject to a charge for a local Puerto Rico Universal Service Fund, which was created by law to subsidize telecommunications services for low-income families under the Federal USF Lifeline and Link-Up programs.
The FCC has adopted other regulations for VoIP services, including the requirement that interconnected VoIP providers and facilities-based broadband internet access providers must comply with the Communications Assistance for Law Enforcement Act, which requires carriers to provide certain assistance to federal law enforcement authorities. VoIP providers are also required to offer basic and enhanced 911 emergency calling services, which requires disclosure to all VoIP customers. VoIP providers are also subject to federal customer proprietary network information rules related to customer privacy.
Employees
As of December 31, 2016, we, including our consolidated subsidiaries, had an aggregate of approximately 41,000 full-time equivalent employees, certain of whom belong to organized unions and works councils, and includes contractors and temporary employees. We believe that our employee relations are good.
Financial Information About Geographic Areas
Financial information related to the geographic areas in which we do business appears in note18 to our consolidated financial statements included in Part II of this Annual Report on Form 10-K.
Available Information
All our filings with the SEC as well as amendments to such filings are available on our internet website free of charge generally within 24 hours after we file such material with the SEC. Our website address is www.libertyglobal.com. The information on our website is not part of this Annual Report and is not incorporated by reference herein.
I-55
PART II
Item 7. | MANAGEMENT’S DISCUSSION AND ANALYSIS OF FINANCIAL CONDITION AND RESULTS OF OPERATIONS |
The following discussion and analysis, which should be read in conjunction with our consolidated financial statements, is intended to assist in providing an understanding of our results of operations and financial condition and is organized as follows:
• | Overview. This section provides a general description of our business and recent events. |
• | Results of Operations. This section provides an analysis of our results of operations for the years ended December 31, 2016, 2015 and 2014. |
• | Liquidity and Capital Resources. This section provides an analysis of our corporate and subsidiary liquidity, consolidated statements of cash flows and contractual commitments. |
• | Critical Accounting Policies, Judgments and Estimates. This section discusses those material accounting policies that involve uncertainties and require significant judgment in their application. |
• | Quantitative and Qualitative Disclosures about Market Risk. This section provides discussion and analysis of the foreign currency, interest rate and other market risk that our company faces. |
Unless otherwise indicated, convenience translations into U.S. dollars are calculated, and operational data (including subscriber statistics) is presented, as of December 31, 2016.
Overview
General
We are an international provider of video, broadband internet, fixed-line telephony and mobile services, with consolidated operations at December 31, 2016 in more than 30 countries. We provide residential and B2B services in (i) the U.K. and Ireland through Virgin Media, (ii) Germany through Unitymedia, (iii) Belgium through Telenet and (iv) seven other European countries through UPC Holding. In addition, through the December 31, 2016 completion of the Dutch JV Transaction, we provided residential and B2B services in the Netherlands through Ziggo Group Holding. The operations of Virgin Media, Unitymedia, Telenet, UPC Holding and, through December 31, 2016, Ziggo Group Holding are collectively referred to herein as the “European Division.” In addition, we provide residential and B2B services in (a) 18 countries, predominantly in Latin America and the Caribbean, through CWC, (b) Chile through VTR and (c) Puerto Rico through Liberty Puerto Rico. CWC also provides (1) B2B services in certain other countries in Latin America and the Caribbean and (2) wholesale services over its sub-sea and terrestrial networks that connect over 30 markets in that region. The operations of CWC, VTR and Liberty Puerto Rico are collectively referred to herein as the “LiLAC Division.” In the following discussion and analysis, the term “LiLAC Group” refers to our operations in Latin American and the Caribbean, and the term “Liberty Global Group” refers to our operations not attributed to the LiLAC Group. For additional information regarding the Liberty Global Group and the LiLAC Group, see note 1 to our consolidated financial statements.
Operations
At December 31, 2016, we owned and operated networks that passed 49,868,900 homes and served 50,159,700 revenue generating units (RGUs), consisting of 20,198,100 video subscribers, 16,357,500 broadband internet subscribers and 13,604,100 fixed-line telephony subscribers. In addition, at December 31, 2016, we served 10,256,800 mobile subscribers.
II-8
The following table provides details of our organic RGU and mobile subscriber changes for the years indicated. The subscriber data provided below excludes the effect of acquisitions (RGUs and mobile subscribers added on the acquisition date) and other non-organic adjustments, but includes post-acquisition date RGU and mobile subscriber additions or losses.
Year ended December 31, | |||||||||
2016 (a) | 2015 | 2014 | |||||||
Organic RGU additions (losses): | |||||||||
Video: | |||||||||
Basic | (511,600 | ) | (606,100 | ) | (674,100 | ) | |||
Enhanced | 233,000 | 175,700 | 454,600 | ||||||
DTH | 13,300 | 46,100 | 4,400 | ||||||
Total video | (265,300 | ) | (384,300 | ) | (215,100 | ) | |||
Broadband internet | 821,800 | 734,000 | 905,000 | ||||||
Fixed-line telephony | 483,600 | 528,300 | 597,300 | ||||||
Total organic RGU additions | 1,040,100 | 878,000 | 1,287,200 | ||||||
Organic mobile subscriber additions (losses): | |||||||||
Prepaid | (230,900 | ) | 464,300 | (173,700 | ) | ||||
Postpaid | 435,200 | (196,700 | ) | 510,200 | |||||
Total organic mobile subscriber additions | 204,300 | 267,600 | 336,500 | ||||||
_______________
(a) | Includes organic changes of Ziggo Group Holding through the December 31, 2016 completion of the Dutch JV Transaction. |
Video services. We provide video services in most of our residential markets and, for most of our customers, we have enhanced our video offerings with various products that enable such customers to control when they watch their programming. These products range from digital video recorders to multimedia home gateway systems capable of distributing video, voice and data content throughout the home and to multiple devices.
Broadband internet services. In all of our broadband communications markets, we offer multiple tiers of broadband internet service with available maximum download speeds as high as 500 Mbps or more depending on location. We continue to invest in new technologies that allow us to increase the internet speeds we offer to our customers.
Fixed-line telephony services. We offer fixed-line telephony services in substantially all of our broadband communications markets, via either voice-over-internet-protocol or “VoIP” technology or circuit-switched telephony, depending on location.
Mobile services. We offer voice and data mobile services through MVNO networks or our own networks in most of our broadband communications markets. We offer mobile services as an MVNO over third-party networks in the U.K., Germany, Belgium, Switzerland, Austria, Ireland, Hungary and Chile. Following the February 2016 acquisition of BASE, Telenet became a mobile network provider in Belgium and plans to migrate its mobile subscribers to the BASE network prior to the termination of its MVNO agreement at the end of 2018. We are a mobile network provider in Panama and many Caribbean markets, including the Bahamas and Jamaica.
B2B services. Most of our operations also provide B2B services, including voice, broadband internet, data, video, wireless and cloud services.
For additional information regarding the details of our products and services, see Item 1. Business included in Part I of this Annual Report on Form 10-K.
Strategy and management focus
From a strategic perspective, we are seeking to build broadband communications and mobile businesses that have strong prospects for future growth. As discussed further under Liquidity and Capital Resources — Capitalization below, we also seek to maintain our debt at levels that provide for attractive equity returns without assuming undue risk.
II-9
We strive to achieve organic revenue and customer growth in our operations by developing and marketing bundled entertainment and information and communications services, and extending and upgrading the quality of our networks where appropriate. As we use the term, organic growth excludes foreign currency translation effects (FX) and the estimated impact of acquisitions. While we seek to increase our customer base, we also seek to maximize the average revenue we receive from each household by increasing the penetration of our digital video, broadband internet, fixed-line telephony and mobile services with existing customers through product bundling and upselling.
During 2015, we initiated a network extension program in the U.K., which was subsequently expanded to include Ireland. During 2016, we initiated network extension programs in Central and Eastern Europe, Germany, Chile and certain other markets. We collectively refer to these network extension programs as the “Network Extensions.” The Network Extensions will be completed in phases with priority given to the most accretive expansion opportunities. During 2015 and 2016, we connected 567,000 homes and commercial premises to Virgin Media’s two-way network (including technical upgrades in the U.K.). During 2016, we connected approximately one million homes and commercial premises (including upgrades in Germany and Chile) to our two-way networks in the other markets mentioned above. Pursuant to the Network Extensions, we expect in 2017 to (i) connect 1.3 million to 1.4 million additional homes and commercial premises (excluding upgrades) to our two-way networks attributed to the Liberty Global Group and (ii) connect or upgrade approximately 450,000 additional homes and commercial premises to our two-way networks attributed to the LiLAC Group. Depending on a variety of factors, including the financial and operational results of the programs, the Network Extensions may be continued, modified or cancelled at our discretion.
The capital costs associated with the Network Extensions, which include the costs to build out the networks and the purchase and installation of related customer premises equipment, are expected to be significant. For information regarding our expectations with regard to the percentage of revenue represented by the property and equipment additions of the Liberty Global Group and the LiLAC Group during 2017, see Liquidity and Capital Resources — Consolidated Statements of Cash Flows below.
During 2015, we initiated our “Liberty Go” program, which is a comprehensive plan to drive top-line growth while maintaining tight cost controls. The Liberty Go program seeks to capitalize on revenue opportunities associated with the Network Extensions, mobile and B2B, together with the realization of greater efficiencies by leveraging our scale more effectively. Underpinning this program is a commitment to customer centricity, which we believe is key to succeeding in an ever more demanding consumer market. We expect this program to continue through 2018 and that the successful implementation of Liberty Go will lead to consolidated organic growth rates for revenue and Adjusted OIBDA that are meaningfully higher than our recent consolidated organic growth rates.
Our assessment of the impacts of the Liberty Go program and the Network Extensions are subject to competitive, economic, regulatory and other factors outside of our control and no assurance can be given that we will be successful in delivering growth rates that are meaningfully higher than our recent consolidated organic growth rates for revenue and Adjusted OIBDA.
Competition and other external factors
We are experiencing significant competition from incumbent telecommunications operators, DTH operators and/or other providers in all of our markets. In the Bahamas, where CWC previously was the only provider of mobile services, competition has increased significantly due to the commercial launch of mobile services by a competitor during the fourth quarter of 2016. In addition, two new fixed-line competitors have entered the market in Trinidad and Tobago. In certain of its markets, CWC is also experiencing increased regulatory intervention that would, if implemented, facilitate increased competition. For additional information regarding the competition we face, see Item 1. Business - Competition and - Regulatory Matters included in Part I of this Annual Report on Form 10-K. This significant competition, together with macroeconomic factors, has adversely impacted our revenue, RGUs and/or average monthly subscription revenue per average cable RGU or mobile subscriber, as applicable (ARPU), particularly in the Netherlands, Barbados, the Bahamas and Trinidad and Tobago. For additional information regarding the revenue impact of changes in the RGUs and ARPU of our reportable segments, see Discussion and Analysis of our Reportable Segments below.
In addition to competition, our operations are subject to macroeconomic, political and other risks that are outside of our control. On June 23, 2016, the U.K. held a referendum in which U.K. citizens voted in favor of, on an advisory basis, an exit from the E.U. commonly referred to as “Brexit.” The terms of any withdrawal are subject to a negotiation period that could last at least two years after the British government formally initiates a withdrawal process pursuant to Article 50 of the Treaty on Europe. The British government has indicated that it plans to commence negotiations to determine the terms of the U.K.’s withdrawal from the E.U. by the end of March 2017. A withdrawal could, among other outcomes, disrupt the free movement of goods, services, people and capital between the U.K. and the E.U., undermine bilateral cooperation in key geographic areas and significantly disrupt trade between the U.K. and the E.U. or other nations (including the U.S.) as the U.K. pursues independent trade relations. The initial impact of the announcement of Brexit caused significant volatility in global stock markets, including in the prices of our
II-10
shares. In addition, the U.S. dollar has significantly strengthened against the British pound sterling during the period following Brexit. The effects of Brexit could adversely affect our business, results of operations, financial condition and liquidity.
In early October 2016, our fixed-line and mobile networks in the Bahamas suffered extensive damage as a result of Hurricane Matthew. Although many of our customers experienced significant outages as a result of Hurricane Matthew, service to the majority of our fixed-line and mobile subscribers has now been restored. We estimate that Hurricane Matthew resulted in reductions to our revenue and Adjusted OIBDA in the Bahamas during the fourth quarter of 2016 of $2 million and $4 million, respectively. In addition, we estimate that property and equipment additions required to repair our fixed-line and mobile networks in the Bahamas will aggregate up to $40 million, of which $22 million was incurred during the fourth quarter of 2016. Although we expect the adverse impacts on our revenue and Adjusted OIBDA from Hurricane Matthew to continue during 2017, we expect these impacts to progressively decline over the course of the year. Although we have property and business interruption insurance that we expect will cover a significant portion of our Hurricane Matthew losses, no assurance can be given as to the amount and timing of the insurance proceeds that we will ultimately recover.
We are facing a challenging economic environment in Puerto Rico due in part to the government’s liquidity issues. In this regard, the Puerto Rico government failed to make significant portions of its scheduled debt payments during 2016. Although the Puerto Rico government has implemented tax increases and other measures to improve its solvency and the U.S. has implemented legislation designed to help manage Puerto Rico’s debt crisis, it remains possible, if not likely, that Puerto Rico will be required to restructure its debt obligations. If the fiscal and economic conditions in Puerto Rico were to worsen, the population of Puerto Rico could continue to decline and the demand and ability of customers to pay for Liberty Puerto Rico’s services could be impaired, both of which could have a negative impact on Liberty Puerto Rico’s results of operations, cash flows and financial condition.
In addition, high levels of sovereign debt in the U.S. and several countries in which we operate, combined with weak growth and high unemployment, could potentially lead to fiscal reforms (including austerity measures), tax increases, sovereign debt restructurings, currency instability, increased counterparty credit risk, high levels of volatility and disruptions in the credit and equity markets, as well as other outcomes that might adversely impact our company. The occurrence of any of these events, especially within the eurozone countries given our significant exposure to the euro and pound sterling, could have an adverse impact on, among other matters, our liquidity and cash flows.
Results of Operations
We have completed a number of transactions that impact the comparability of our 2016, 2015 and 2014 results of operations, including the CWC Acquisition on May 16, 2016, the BASE Acquisition on February 11, 2016, the Choice Acquisition on June 3, 2015, the Ziggo Acquisition on November 11, 2014 and a number of less significant acquisitions during 2016, 2015 and 2014.
On December 31, 2016, we completed the Dutch JV Transaction, whereby we contributed Ziggo Group Holding and its subsidiaries (including Ziggo Sport) to the Dutch JV. Accordingly, our results of operations include the operations of Ziggo Group Holding and its subsidiaries for all periods presented while our December 31, 2016 consolidated balance sheet excludes such entities. In our segment presentation, Ziggo Group Holding (exclusive of Ziggo Sport, which became a subsidiary of Ziggo Group Holding in October 2016) is separately reported as “The Netherlands” and Ziggo Sport is included in our “Corporate and Other” category. For additional information regarding the Dutch JV Transaction, see note 5 to our consolidated financial statements.
For further information regarding our pending and completed acquisitions, see note 4 to our consolidated financial statements.
In the following discussion, we quantify the estimated impact of acquisitions (the Acquisition Impact) on our operating results. The Acquisition Impact represents our estimate of the difference between the operating results of the periods under comparison that is attributable to an acquisition. In general, we base our estimate of the Acquisition Impact on an acquired entity’s operating results during the first three to six months following the acquisition date, as adjusted to remove integration costs and any other material unusual or nonoperational items, such that changes from those operating results in subsequent periods are considered to be organic changes. Accordingly, in the following discussion, (i) variances attributed to an acquired entity during the first 12 months following the acquisition date represent differences between the Acquisition Impact and the actual results and (ii) the calculation of our organic growth percentages includes the organic growth of an acquired entity relative to the Acquisition Impact of such entity. During 2016, we changed how we calculate our organic growth percentages to include the Acquisition Impact in the denominator of the calculation, as this methodology takes into account the size of the acquired entity's operations relative to our existing operations. This change has been reflected retroactively for all periods presented herein. Notwithstanding the above and due largely to the fact that CWC represents a new reportable segment, we have excluded all of CWC’s operating results (excluding $9.9 million of integration costs that are included in the organic change for SG&A expenses and Adjusted OIBDA) for the period from the May 16, 2016 acquisition date through December 31, 2016 from the calculation of organic growth.
II-11
Changes in foreign currency exchange rates have a significant impact on our reported operating results as all of our operating segments, except for CWC and Puerto Rico, have functional currencies other than the U.S. dollar. Our primary exposure to FX risk during the three months ended December 31, 2016 was to the euro and British pound sterling as 43.2% and 27.5% of our reported revenue during the period was derived from subsidiaries whose functional currencies are the euro and British pound sterling, respectively. In addition, our reported operating results are impacted by changes in the exchange rates for other local currencies in Europe, the Caribbean and Latin America. The portions of the changes in the various components of our results of operations that are attributable to changes in FX are highlighted under Discussion and Analysis of our Reportable Segments and Discussion and Analysis of our Consolidated Operating Results below. For information concerning our foreign currency risks and the applicable foreign currency exchange rates in effect for the periods covered by this Annual Report on Form 10-K, see Quantitative and Qualitative Disclosures about Market Risk — Foreign Currency Risk below.
The amounts presented and discussed below represent 100% of each reportable segment’s revenue and Adjusted OIBDA. As we have the ability to control Telenet, Liberty Puerto Rico and certain subsidiaries of CWC that are not wholly owned, we consolidate 100% of the revenue and expenses of these entities in our consolidated statements of operations despite the fact that third parties own significant interests in these entities. The noncontrolling owners’ interests in the operating results of Telenet, Liberty Puerto Rico, certain subsidiaries of CWC and other less significant majority-owned subsidiaries are reflected in net earnings or loss attributable to noncontrolling interests in our consolidated statements of operations.
II-12
Discussion and Analysis of our Reportable Segments
General
All of the reportable segments set forth below derive their revenue primarily from (i) broadband communications services, including video, broadband internet and fixed-line telephony services, (ii) B2B services and (iii) with the exception of Puerto Rico, mobile services. For detailed information regarding the composition of our reportable segments, see note 18 to our consolidated financial statements.
The tables presented below in this section provide a separate analysis of each of the line items that comprise Adjusted OIBDA, as further discussed in note 18 to our consolidated financial statements, as well as an analysis of Adjusted OIBDA by reportable segment for (i) 2016, as compared to 2015, and (ii) 2015, as compared to 2014. These tables present (a) the amounts reported by each of our reportable segments for the current and comparative periods, (b) the reported U.S. dollar change and percentage change from period to period and (c) the organic U.S. dollar change and percentage change from period to period (percentage change after removing FX and the estimated impacts of acquisitions and dispositions). The comparisons that exclude FX assume that exchange rates remained constant at the prior year rate during the comparative periods that are included in each table. As discussed under Quantitative and Qualitative Disclosures about Market Risk — Foreign Currency Risk below, we have significant exposure to movements in foreign currency exchange rates. We also provide a table showing the Adjusted OIBDA margins of our reportable segments for 2016, 2015 and 2014 at the end of this section.
The revenue of our reportable segments includes revenue earned from (i) subscribers to our broadband communication and other fixed-line and DTH services (collectively referred to herein as “cable subscription revenue”) and our mobile services and (ii) B2B services, interconnect fees, mobile handset sales, channel carriage fees, installation fees, late fees and advertising revenue. Consistent with the presentation of our revenue categories in note 18 to our consolidated financial statements, we use the term “subscription revenue” in the following discussion to refer to amounts received from subscribers for ongoing services, excluding installation fees and late fees. In the following tables, mobile subscription revenue excludes the related interconnect revenue.
Most of our revenue is derived from jurisdictions that administer VAT or similar revenue-based taxes. Any increases in these taxes could have an adverse impact on our ability to maintain or increase our revenue to the extent that we are unable to pass such tax increases on to our customers. In the case of revenue-based taxes for which we are the ultimate taxpayer, we will also experience increases in our operating costs and expenses and corresponding declines in our Adjusted OIBDA and Adjusted OIBDA margins to the extent of any such tax increases.
We pay interconnection fees to other telephony providers when calls or text messages from our subscribers terminate on another network, and we receive similar fees from such providers when calls or text messages from their customers terminate on our networks or networks that we access through MVNO or other arrangements. The amounts we charge and incur with respect to fixed-line telephony and mobile interconnection fees are subject to regulatory oversight in many of our markets. To the extent that regulatory authorities introduce fixed-line or mobile termination rate changes, we would experience prospective changes and, in very limited cases, we could experience retroactive changes in our interconnect revenue and/or costs. The ultimate impact of any such changes in termination rates on our Adjusted OIBDA would be dependent on the call or text messaging patterns that are subject to the changed termination rates.
II-13
Revenue of our Reportable Segments
Revenue — 2016 compared to 2015
Year ended December 31, | Increase (decrease) | Organic increase (decrease) | |||||||||||||||||||
2016 | 2015 | $ | % | $ | % | ||||||||||||||||
in millions, except percentages | |||||||||||||||||||||
Liberty Global Group: | |||||||||||||||||||||
European Division: | |||||||||||||||||||||
U.K./Ireland | $ | 6,508.8 | $ | 7,058.7 | $ | (549.9 | ) | (7.8 | ) | $ | 195.5 | 2.8 | |||||||||
Belgium (a) | 2,691.1 | 2,021.0 | 670.1 | 33.2 | 97.8 | 3.8 | |||||||||||||||
The Netherlands | 2,690.8 | 2,745.3 | (54.5 | ) | (2.0 | ) | (45.9 | ) | (1.7 | ) | |||||||||||
Germany | 2,539.7 | 2,399.5 | 140.2 | 5.8 | 148.4 | 6.2 | |||||||||||||||
Switzerland/Austria | 1,755.6 | 1,758.2 | (2.6 | ) | (0.1 | ) | 29.1 | 1.7 | |||||||||||||
Total Western Europe | 16,186.0 | 15,982.7 | 203.3 | 1.3 | 424.9 | 2.6 | |||||||||||||||
Central and Eastern Europe | 1,088.4 | 1,066.6 | 21.8 | 2.0 | 40.2 | 3.8 | |||||||||||||||
Central and other | (8.0 | ) | (5.4 | ) | (2.6 | ) | (48.1 | ) | (2.9 | ) | (53.4 | ) | |||||||||
Total European Division | 17,266.4 | 17,043.9 | 222.5 | 1.3 | 462.2 | 2.6 | |||||||||||||||
Corporate and other | 66.7 | 42.3 | 24.4 | N.M. | 36.9 | N.M. | |||||||||||||||
Intersegment eliminations | (48.1 | ) | (23.5 | ) | (24.6 | ) | N.M. | (24.8 | ) | N.M. | |||||||||||
Total Liberty Global Group | 17,285.0 | 17,062.7 | 222.3 | 1.3 | 474.3 | 2.7 | |||||||||||||||
LiLAC Group: | |||||||||||||||||||||
LiLAC Division: | |||||||||||||||||||||
CWC (b) | 1,444.8 | — | 1,444.8 | N.M. | — | — | |||||||||||||||
Chile | 859.5 | 838.1 | 21.4 | 2.6 | 50.6 | 6.0 | |||||||||||||||
Puerto Rico (c) | 420.8 | 379.2 | 41.6 | 11.0 | 4.0 | 1.0 | |||||||||||||||
Total LiLAC Division | 2,725.1 | 1,217.3 | 1,507.8 | 123.9 | 54.6 | 2.0 | |||||||||||||||
Intersegment eliminations | (1.3 | ) | — | (1.3 | ) | N.M. | (1.3 | ) | N.M. | ||||||||||||
Total LiLAC Group | 2,723.8 | 1,217.3 | 1,506.5 | 123.8 | 53.3 | 2.0 | |||||||||||||||
Total | $ | 20,008.8 | $ | 18,280.0 | $ | 1,728.8 | 9.5 | $ | 527.6 | 2.6 | |||||||||||
_______________
(a) | The amount presented for 2016 includes the post-acquisition revenue of BASE, which was acquired on February 11, 2016. |
(b) | The amount presented for 2016 reflects the post-acquisition revenue of CWC, which was acquired on May 16, 2016. |
(c) | The amount presented for 2015 excludes the pre-acquisition revenue of Choice, which was acquired on June 3, 2015. |
N.M. — Not Meaningful.
General. While not specifically discussed in the below explanations of the changes in the revenue of our reportable segments, we are experiencing significant competition in all of our markets. This competition has an adverse impact on our ability to increase or maintain our RGUs and/or ARPU.
Variances in the subscription revenue that we receive from our customers are a function of (i) changes in the number of RGUs or mobile subscribers outstanding during the period and (ii) changes in ARPU. Changes in ARPU can be attributable to (a) changes in prices, (b) changes in bundling or promotional discounts, (c) changes in the tier of services selected, (d) variances in subscriber usage patterns and (e) the overall mix of cable and mobile products during the period. In the following discussion, we discuss ARPU changes in terms of the net impact of the above factors on the ARPU that is derived from our video, broadband internet, fixed-line telephony and mobile products.
II-14
U.K./Ireland. The decrease in U.K./Ireland’s revenue during 2016, as compared to 2015, includes (i) an organic increase of $195.5 million or 2.8%, (ii) the impact of acquisitions, (iii) the impact of disposals and (iv) the impact of FX, as set forth below:
Subscription revenue | Non-subscription revenue | Total | |||||||||
in millions | |||||||||||
Increase in cable subscription revenue due to change in: | |||||||||||
Average number of RGUs (a) | $ | 105.0 | $ | — | $ | 105.0 | |||||
ARPU (b) | 70.0 | — | 70.0 | ||||||||
Total increase in cable subscription revenue | 175.0 | — | 175.0 | ||||||||
Decrease in mobile subscription revenue (c) | (68.0 | ) | — | (68.0 | ) | ||||||
Total increase in subscription revenue | 107.0 | — | 107.0 | ||||||||
Increase in B2B revenue (d) | — | 16.4 | 16.4 | ||||||||
Increase in other revenue (e) | — | 72.1 | 72.1 | ||||||||
Total organic increase | 107.0 | 88.5 | 195.5 | ||||||||
Impact of acquisitions | — | 50.6 | 50.6 | ||||||||
Impact of disposals (f) | (11.8 | ) | (5.8 | ) | (17.6 | ) | |||||
Impact of FX | (616.7 | ) | (161.7 | ) | (778.4 | ) | |||||
Total | $ | (521.5 | ) | $ | (28.4 | ) | $ | (549.9 | ) | ||
_______________
(a) | The increase in cable subscription revenue related to a change in the average number of RGUs is attributable to the net effect of (i) an increase in the average number of broadband internet RGUs in the U.K., (ii) an increase in the average number of fixed-line telephony RGUs and (iii) declines in the average number of enhanced video RGUs and, to a much lesser extent, the average number of basic video RGUs in Ireland. |
(b) | The increase in cable subscription revenue related to a change in ARPU is primarily attributable to the net effect of (i) a net increase primarily due to (a) higher ARPU from broadband internet services, (b) lower ARPU from fixed-line telephony services in the U.K., (c) lower ARPU resulting from the impact of a change in the regulations governing payment handling fees that Virgin Media charges to its customers in the U.K., which reduced revenue by $29.4 million, and (d) higher ARPU from video services, as an increase in the U.K. was only partially offset by a decrease in Ireland, and (ii) an adverse change in RGU mix. |
(c) | The decrease in mobile subscription revenue relates to the net effect of (i) lower ARPU in the U.K., including a decline of $105.3 million in postpaid mobile services revenue associated with the U.K. Split-contract Program, (ii) an increase in the average number of mobile subscribers, as an increase in the average number of postpaid mobile subscribers more than offset the decrease in the average number of prepaid mobile subscribers in the U.K., and (iii) a decrease in revenue due to the impact of a $4.2 million favorable adjustment to VAT recorded during the fourth quarter of 2015. For additional information regarding Split-contract Programs, see note 3 to our consolidated financial statements. |
(d) | The increase in B2B revenue is primarily due to the net effect of (i) an increase in data revenue, primarily attributable to (a) higher volumes and (b) an increase of $13.1 million in the U.K.’s amortization of deferred upfront fees on B2B contracts, (ii) lower voice revenue in the U.K., primarily attributable to (1) a decrease in revenue due to the impact of a $17.4 million favorable adjustment recorded during the fourth quarter of 2015 related to the settlement of disputes with mobile operators over amounts charged for voice traffic, including $15.6 million related to years prior to 2015, (2) a decline in usage and (3) lower wholesale revenue, and (iii) an increase in low-margin equipment sales in the U.K. |
(e) | The increase in other revenue is primarily due to the net effect of (i) an increase in mobile handset sales, primarily attributable to an increase of $63.5 million associated with the U.K. Split-contract Program, (ii) a decrease in interconnect revenue in the U.K. of $17.0 million, primarily due to (a) a decline in mobile short message service (SMS) termination volumes and (b) lower fixed-line telephony termination volumes, (iii) an increase in broadcasting revenue in Ireland and (iv) an increase in installation revenue in the U.K. The increase in revenue from the U.K. Split-contract Program is due to the net effect of (1) increased volume and (2) lower average revenue per handset sold. |
II-15
(f) | Represents the estimated impact of (i) the multi-channel multi-point (microwave) distribution system subscribers in Ireland that have disconnected since we announced the switch-off of this service effective April 2016 and (ii) the non-cable subscribers in the U.K. that we sold in the fourth quarter of 2014 (the U.K. Non-Cable Disposal). The non-cable subscribers were migrated to a third party during the first nine months of 2015. |
For information concerning certain regulatory developments that could have an adverse impact on our revenue in the U.K., see note 17 to our consolidated financial statements.
Belgium. The increase in Belgium’s revenue during 2016, as compared to 2015, includes (i) an organic increase of $97.8 million or 3.8%, (ii) the impact of the BASE Acquisition and (iii) the impact of FX, as set forth below:
Subscription revenue | Non-subscription revenue | Total | |||||||||
in millions | |||||||||||
Increase in cable subscription revenue due to change in: | |||||||||||
Average number of RGUs (a) | $ | 19.5 | $ | — | $ | 19.5 | |||||
ARPU (b) | 44.1 | — | 44.1 | ||||||||
Total increase in cable subscription revenue | 63.6 | — | 63.6 | ||||||||
Increase in mobile subscription revenue (c) | 14.4 | — | 14.4 | ||||||||
Total increase in subscription revenue | 78.0 | — | 78.0 | ||||||||
Increase in B2B revenue (d) | — | 6.7 | 6.7 | ||||||||
Increase in other revenue (e) | — | 13.1 | 13.1 | ||||||||
Total organic increase | 78.0 | 19.8 | 97.8 | ||||||||
Impact of the BASE Acquisition | 348.8 | 230.7 | 579.5 | ||||||||
Impact of FX | (5.6 | ) | (1.6 | ) | (7.2 | ) | |||||
Total | $ | 421.2 | $ | 248.9 | $ | 670.1 | |||||
_______________
(a) | The increase in cable subscription revenue related to a change in the average number of RGUs is attributable to increases in the average numbers of fixed-line telephony, broadband internet and enhanced video RGUs that were only partially offset by a decline in the average number of basic video RGUs. |
(b) | The increase in cable subscription revenue related to a change in ARPU is attributable to (i) higher ARPU from video, broadband internet and fixed-line telephony services and (ii) an improvement in RGU mix. |
(c) | The increase in mobile subscription revenue is due to the net effect of (i) an increase in the average number of postpaid mobile subscribers and (ii) lower ARPU, primarily due to (a) a decline of $12.4 million in mobile services revenue due to the June 2015 introduction of a Split-contract Program and (b) a decline in usage. |
(d) | The increase in B2B revenue is largely due to the net impact of (i) higher revenue from information technology security services and related equipment sales, (ii) lower revenue from mobile services and (iii) higher revenue from data services. |
(e) | The increase in other revenue is primarily due to (i) an increase of $6.5 million in mobile handset sales, (ii) an increase in set-top box sales, (iii) an increase in tablet sales and (iv) an increase in mobile interconnect revenue due to the net effect of (a) growth in mobile call volumes and (b) lower SMS usage. The increase in Belgium’s mobile handset sales, which typically generate relatively low or negative margins, include the net impact of (1) an increase of $11.4 million in non-subsidized handset sales, including an increase of $5.3 million associated with the June 2015 introduction of a Split-contract Program, and (2) a net decrease of $4.9 million in other handset sales. |
Certain recent governmental actions in Belgium require that purchasers of prepaid mobile cards identify themselves. This requirement may have an adverse impact on our prepaid mobile subscriber base and revenue in Belgium. For information concerning another regulatory development that could have an adverse impact on our revenue in Belgium, see note 17 to our consolidated financial statements.
II-16
The Netherlands. The decrease in the Netherlands’ revenue during 2016, as compared to 2015, includes (i) an organic decrease of $45.9 million or 1.7% and (ii) the impact of FX, as set forth below:
Subscription revenue | Non-subscription revenue | Total | |||||||||
in millions | |||||||||||
Decrease in cable subscription revenue due to change in: | |||||||||||
Average number of RGUs (a) | $ | (35.6 | ) | $ | — | $ | (35.6 | ) | |||
ARPU (b) | (14.7 | ) | — | (14.7 | ) | ||||||
Total decrease in cable subscription revenue | (50.3 | ) | — | (50.3 | ) | ||||||
Increase in mobile subscription revenue (c) | 3.7 | — | 3.7 | ||||||||
Total decrease in subscription revenue | (46.6 | ) | — | (46.6 | ) | ||||||
Decrease in B2B revenue (d) | — | (1.0 | ) | (1.0 | ) | ||||||
Increase in other revenue (e) | — | 1.7 | 1.7 | ||||||||
Total organic increase (decrease) | (46.6 | ) | 0.7 | (45.9 | ) | ||||||
Impact of FX | (8.0 | ) | (0.6 | ) | (8.6 | ) | |||||
Total | $ | (54.6 | ) | $ | 0.1 | $ | (54.5 | ) | |||
_______________
(a) | The decrease in cable subscription revenue related to a change in the average number of RGUs is attributable to declines in the average numbers of basic video, enhanced video and fixed-line telephony RGUs that were only partially offset by an increase in the average number of broadband internet RGUs. |
(b) | The decrease in cable subscription revenue related to a change in ARPU is attributable to the net effect of (i) a net decrease due to (a) lower ARPU from fixed-line telephony and broadband internet services and (b) higher ARPU from video services and (ii) an improvement in RGU mix. |
(c) | The increase in mobile subscription revenue is due to the net effect of (i) an increase in the average number of mobile subscribers and (ii) lower ARPU. |
(d) | The decrease in B2B revenue is primarily due to the net effect of (i) lower revenue from voice services and (ii) higher revenue from data services. |
(e) | The increase in other revenue includes the net effect of (i) a $3.3 million increase due to the favorable settlement of prior period amounts that were recorded during the first quarter of 2016 and (ii) a decrease in revenue of $1.6 million resulting from the termination of a partner network agreement in the Netherlands shortly after the November 2014 acquisition of Ziggo. |
II-17
Germany. The increase in Germany’s revenue during 2016, as compared to 2015, includes (i) an organic increase of $148.4 million or 6.2% and (ii) the impact of FX, as set forth below:
Subscription revenue (a) | Non-subscription revenue | Total | |||||||||
in millions | |||||||||||
Increase in cable subscription revenue due to change in: | |||||||||||
Average number of RGUs (b) | $ | 58.2 | $ | — | $ | 58.2 | |||||
ARPU (c) | 75.9 | — | 75.9 | ||||||||
Total increase in cable subscription revenue | 134.1 | — | 134.1 | ||||||||
Increase in mobile subscription revenue | 1.7 | — | 1.7 | ||||||||
Total increase in subscription revenue | 135.8 | — | 135.8 | ||||||||
Increase in B2B revenue | — | 3.3 | 3.3 | ||||||||
Increase in other revenue (d) (e) | — | 9.3 | 9.3 | ||||||||
Total organic increase | 135.8 | 12.6 | 148.4 | ||||||||
Impact of FX | (6.7 | ) | (1.5 | ) | (8.2 | ) | |||||
Total | $ | 129.1 | $ | 11.1 | $ | 140.2 | |||||
_______________
(a) | Subscription revenue includes revenue from multi-year bulk agreements with landlords or housing associations or with third parties that operate and administer the in-building networks on behalf of housing associations. These bulk agreements, which generally allow for the procurement of the basic video signals at volume-based discounts, provide access to approximately two-thirds of Germany’s video subscribers. Germany’s bulk agreements are, to a significant extent, medium- and long-term contracts. As of December 31, 2016, bulk agreements covering approximately 31% of the video subscribers that Germany serves expire by the end of 2017 or are terminable on 30-days notice. During the three months ended December 31, 2016, Germany’s 20 largest bulk agreement accounts generated approximately 8% of its total revenue (including estimated amounts billed directly to the building occupants for digital video, broadband internet and fixed-line telephony services). No assurance can be given that Germany’s bulk agreements will be renewed or extended on financially equivalent terms, or at all. |
(b) | The increase in cable subscription revenue related to a change in the average number of RGUs is attributable to increases in the average numbers of broadband internet, fixed-line telephony and enhanced video RGUs that were only partially offset by a decline in the average number of basic video RGUs. |
(c) | The increase in cable subscription revenue related to a change in ARPU is attributable to (i) a net increase due to (a) higher ARPU from broadband internet and video services and (b) lower ARPU from fixed-line telephony services and (ii) an improvement in RGU mix. |
(d) | Other revenue includes fees received for the carriage of certain channels included in Germany’s basic and enhanced video offerings. This channel carriage fee revenue is subject to contracts that expire or are otherwise terminable by either party on various dates ranging from 2017 through 2020. The aggregate amount of revenue related to these channel carriage contracts represented approximately 4% of Germany’s total revenue during the three months ended December 31, 2016. No assurance can be given that these contracts will be renewed or extended on financially equivalent terms, or at all. In June 2017, we plan to discontinue our analog video service in Germany. We estimate that the discontinuance of this service will reduce Germany’s channel carriage revenue and operating income by approximately €30 million ($32 million) annually. |
(e) | The increase in other revenue is primarily due to the net effect of (i) an increase of $11.5 million in mobile handset sales, which typically generate relatively low or no margins, associated with the October 2016 launch of a wholesale handset program, (ii) an increase in installation revenue and (iii) a decrease due to legislative developments that have reduced the fees Germany can charge late-paying customers. |
II-18
Switzerland/Austria. The decrease in Switzerland/Austria’s revenue during 2016, as compared to 2015, includes (i) an organic increase of $29.1 million or 1.7%, (ii) the impact of an acquisition and (iii) the impact of FX, as set forth below:
Subscription revenue | Non-subscription revenue | Total | |||||||||
in millions | |||||||||||
Increase (decrease) in cable subscription revenue due to change in: | |||||||||||
Average number of RGUs (a) | $ | (6.4 | ) | $ | — | $ | (6.4 | ) | |||
ARPU (b) | 9.4 | — | 9.4 | ||||||||
Total increase in cable subscription revenue | 3.0 | — | 3.0 | ||||||||
Increase in mobile subscription revenue (c) | 16.7 | — | 16.7 | ||||||||
Total increase in subscription revenue | 19.7 | — | 19.7 | ||||||||
Increase in B2B revenue | — | 4.5 | 4.5 | ||||||||
Increase in other revenue (d) | — | 4.9 | 4.9 | ||||||||
Total organic increase | 19.7 | 9.4 | 29.1 | ||||||||
Impact of an acquisition | — | 1.6 | 1.6 | ||||||||
Impact of FX | (27.8 | ) | (5.5 | ) | (33.3 | ) | |||||
Total | $ | (8.1 | ) | $ | 5.5 | $ | (2.6 | ) | |||
_______________
(a) | The decrease in cable subscription revenue related to a change in the average number of RGUs is primarily attributable to declines in the average numbers of basic video RGUs and, to a much lesser extent, enhanced video RGUs in Switzerland that were mostly offset by increases in the average numbers of fixed-line telephony and broadband internet RGUs. |
(b) | The increase in cable subscription revenue related to a change in ARPU is attributable to the net effect of (i) a net increase due to (a) higher ARPU from video and broadband internet services and (b) lower ARPU from fixed-line telephony services and (ii) a slight adverse change in RGU mix, as an adverse change in Austria was mostly offset by an improvement in Switzerland. |
(c) | The increase in mobile subscription revenue is due to the net effect of (i) an increase in the average number of mobile subscribers and (ii) lower ARPU primarily due to a decline of $1.6 million in mobile services revenue due to the September 2015 introduction of a Split-contract Program in Switzerland. |
(d) | The increase in other revenue is due to the net effect of (i) an increase of $7.5 million in mobile handset sales, which typically generate relatively low or no margins, including an increase of $1.7 million associated with the September 2015 introduction of a Split-contract Program in Switzerland, (ii) an increase in mobile interconnect revenue and (iii) a net decrease resulting from individually insignificant changes in other non-subscription revenue categories. |
II-19
Central and Eastern Europe. The increase in Central and Eastern Europe’s revenue during 2016, as compared to 2015, includes (i) an organic increase of $40.2 million or 3.8%, (ii) the impact of an acquisition and (iii) the impact of FX, as set forth below:
Subscription revenue | Non-subscription revenue | Total | |||||||||
in millions | |||||||||||
Increase (decrease) in cable subscription revenue due to change in: | |||||||||||
Average number of RGUs (a) | $ | 49.1 | $ | — | $ | 49.1 | |||||
ARPU (b) | (22.3 | ) | — | (22.3 | ) | ||||||
Total increase in cable subscription revenue | 26.8 | — | 26.8 | ||||||||
Increase in mobile subscription revenue | 4.1 | — | 4.1 | ||||||||
Total increase in subscription revenue | 30.9 | — | 30.9 | ||||||||
Increase in B2B revenue | — | 4.3 | 4.3 | ||||||||
Increase in other revenue | — | 5.0 | 5.0 | ||||||||
Total organic increase | 30.9 | 9.3 | 40.2 | ||||||||
Impact of an acquisition | 3.1 | 0.3 | 3.4 | ||||||||
Impact of FX | (19.5 | ) | (2.3 | ) | (21.8 | ) | |||||
Total | $ | 14.5 | $ | 7.3 | $ | 21.8 | |||||
_______________
(a) | The increase in cable subscription revenue related to a change in the average number of RGUs is primarily attributable to the net effect of (i) increases in the average numbers of fixed-line telephony, broadband internet and enhanced video RGUs in Romania, Hungary, Poland and Slovakia, (ii) a decline in the average number of basic video RGUs in Hungary, Poland, Romania and Slovakia, (iii) increases in the average numbers of basic video and broadband internet RGUs in the Czech Republic, (iv) an increase in the average number of DTH RGUs and (v) declines in the average numbers of fixed-line telephony and enhanced video RGUs in the Czech Republic. |
(b) | The decrease in cable subscription revenue related to a change in ARPU is attributable to (i) a net decrease due to (a) lower ARPU from fixed-line telephony and broadband internet services and (b) higher ARPU from video services, primarily in Poland, and (ii) an adverse change in RGU mix, as adverse changes in Romania and the Czech Republic were largely offset by an improvement in Hungary. |
CWC. The increase in CWC’s revenue during 2016, as compared to 2015, is entirely attributable to the May 16, 2016 CWC Acquisition. Accordingly, we do not separately discuss the changes in the revenue for the CWC segment. As further discussed under Overview above, CWC is experiencing significant competition in all of its markets.
Effective April 1, 2016, CWC began recognizing revenue on a cash, rather than accrual, basis with respect to two of its more significant B2B customers due primarily to unfavorable collection experience and unfavorable macroeconomic factors. The aggregate amount billed, but not recognized, with respect to these customers during the nine months ended December 31, 2016 was $11.0 million.
II-20
Chile. The increase in Chile’s revenue during 2016, as compared to 2015, includes (i) an organic increase of $50.6 million or 6.0% and (ii) the impact of FX, as set forth below:
Subscription revenue | Non-subscription revenue | Total | |||||||||
in millions | |||||||||||
Increase in cable subscription revenue due to change in: | |||||||||||
Average number of RGUs (a) | $ | 21.0 | $ | — | $ | 21.0 | |||||
ARPU (b) | 24.4 | — | 24.4 | ||||||||
Total increase in cable subscription revenue | 45.4 | — | 45.4 | ||||||||
Increase in mobile subscription revenue (c) | 6.8 | — | 6.8 | ||||||||
Total increase in subscription revenue | 52.2 | — | 52.2 | ||||||||
Decrease in other revenue (d) | — | (1.6 | ) | (1.6 | ) | ||||||
Total organic increase (decrease) | 52.2 | (1.6 | ) | 50.6 | |||||||
Impact of FX | (27.6 | ) | (1.6 | ) | (29.2 | ) | |||||
Total | $ | 24.6 | $ | (3.2 | ) | $ | 21.4 | ||||
_______________
(a) | The increase in cable subscription revenue related to a change in the average number of RGUs is attributable to increases in the average numbers of broadband internet and enhanced video RGUs that were only partially offset by declines in the average numbers of fixed-line telephony and basic video RGUs. |
(b) | The increase in cable subscription revenue related to a change in ARPU is attributable to (i) a net increase due to (a) higher ARPU from video and broadband internet services and (b) lower ARPU from fixed-line telephony services and (ii) an improvement in RGU mix. In addition, the increase in Chile’s cable subscription revenue includes adjustments to reflect the retroactive application of a tariff on ancillary services provided directly to customers for the period from July 2013 through February 2014, including (1) a decrease of $4.2 million due to the impact of unfavorable adjustments recorded during the first and second quarters of 2016 and (2) an increase of $2.2 million due to the impact of an unfavorable adjustment recorded during the first quarter of 2015. |
(c) | The increase in mobile subscription revenue is due to (i) an increase in the average number of mobile subscribers, as an increase in the average number of postpaid mobile subscribers more than offset the decrease in the average number of prepaid mobile subscribers, and (ii) higher ARPU primarily due to a higher proportion of mobile subscribers on postpaid plans, which generate higher ARPU than prepaid plans. |
(d) | The decrease in other revenue is primarily due to the net effect of (i) a decrease in advertising revenue and (ii) an increase of $2.7 million in interconnect revenue due to the impacts of unfavorable adjustments recorded during the first and third quarters of 2015 to reflect the retroactive application of a tariff reduction to June 2012. |
II-21
Puerto Rico. The increase in Puerto Rico’s revenue during 2016, as compared to 2015, includes (i) an organic increase of $4.0 million or 1.0% and (ii) the impact of the Choice Acquisition, as set forth below:
Subscription revenue | Non-subscription revenue | Total | |||||||||
in millions | |||||||||||
Increase (decrease) in cable subscription revenue due to change in: | |||||||||||
Average number of RGUs (a) | $ | 2.7 | $ | — | $ | 2.7 | |||||
ARPU (b) | (3.8 | ) | — | (3.8 | ) | ||||||
Total decrease in cable subscription revenue | (1.1 | ) | — | (1.1 | ) | ||||||
Increase in B2B revenue (c) | — | 5.5 | 5.5 | ||||||||
Decrease in other revenue | — | (0.4 | ) | (0.4 | ) | ||||||
Total organic increase (decrease) | (1.1 | ) | 5.1 | 4.0 | |||||||
Impact of the Choice Acquisition | 33.7 | 3.9 | 37.6 | ||||||||
Total | $ | 32.6 | $ | 9.0 | $ | 41.6 | |||||
_______________
(a) | The increase in cable subscription revenue related to a change in the average number of RGUs is attributable to increases in the average numbers of fixed-line telephony and broadband internet RGUs that were only partially offset by a decline in the average number of enhanced video RGUs. |
(b) | The decrease in cable subscription revenue related to a change in ARPU is attributable to the net effect of (i) an adverse change in RGU mix and (ii) a net increase due to (a) higher ARPU from broadband internet services and (b) lower ARPU from fixed-line telephony and video services. |
(c) | The increase in B2B revenue is largely due to higher revenue from data services. |
II-22
Revenue — 2015 compared to 2014
Year ended December 31, | Increase (decrease) | Organic increase (decrease) | |||||||||||||||||||
2015 | 2014 | $ | % | $ | % | ||||||||||||||||
in millions, except percentages | |||||||||||||||||||||
Liberty Global Group: | |||||||||||||||||||||
European Division: | |||||||||||||||||||||
U.K./Ireland | $ | 7,058.7 | $ | 7,409.9 | $ | (351.2 | ) | (4.7 | ) | $ | 287.9 | 3.9 | |||||||||
Belgium | 2,021.0 | 2,279.4 | (258.4 | ) | (11.3 | ) | 138.7 | 6.1 | |||||||||||||
The Netherlands (a) | 2,745.3 | 1,498.5 | 1,246.8 | 83.2 | (69.1 | ) | (2.1 | ) | |||||||||||||
Germany | 2,399.5 | 2,711.5 | (312.0 | ) | (11.5 | ) | 159.4 | 5.9 | |||||||||||||
Switzerland/Austria | 1,758.2 | 1,846.1 | (87.9 | ) | (4.8 | ) | 52.3 | 2.8 | |||||||||||||
Total Western Europe | 15,982.7 | 15,745.4 | 237.3 | 1.5 | 569.2 | 3.2 | |||||||||||||||
Central and Eastern Europe | 1,066.6 | 1,259.5 | (192.9 | ) | (15.3 | ) | 16.1 | 1.3 | |||||||||||||
Central and other | (5.4 | ) | (7.1 | ) | 1.7 | (23.9 | ) | (2.0 | ) | (27.6 | ) | ||||||||||
Total European Division | 17,043.9 | 16,997.8 | 46.1 | 0.3 | 583.3 | 3.1 | |||||||||||||||
Corporate and other | 42.3 | 70.8 | (28.5 | ) | (40.3 | ) | (7.5 | ) | (13.0 | ) | |||||||||||
Intersegment eliminations | (23.5 | ) | (24.9 | ) | 1.4 | N.M. | 0.7 | N.M. | |||||||||||||
Total Liberty Global Group | 17,062.7 | 17,043.7 | 19.0 | 0.1 | 576.5 | 3.1 | |||||||||||||||
LiLAC Group: | |||||||||||||||||||||
Chile | 838.1 | 898.5 | (60.4 | ) | (6.7 | ) | 61.5 | 6.9 | |||||||||||||
Puerto Rico (b) | 379.2 | 306.1 | 73.1 | 23.9 | 20.5 | 5.7 | |||||||||||||||
Total LiLAC Group | 1,217.3 | 1,204.6 | 12.7 | 1.1 | 82.0 | 6.5 | |||||||||||||||
Total | $ | 18,280.0 | $ | 18,248.3 | $ | 31.7 | 0.2 | $ | 658.5 | 3.3 | |||||||||||
_______________
(a) | The amount presented for 2014 excludes the pre-acquisition revenue of Ziggo, which was acquired on November 11, 2014. |
(b) | The amount presented for 2015 includes the post-acquisition revenue of Choice, which was acquired on June 3, 2015. |
N.M. — Not Meaningful.
II-23
U.K./Ireland. The decrease in U.K./Ireland’s revenue during 2015, as compared to 2014, includes (i) an organic increase of $287.9 million or 3.9%, (ii) the impact of acquisitions, (iii) the impact of a disposal and (iv) the impact of FX, as set forth below:
Subscription revenue | Non-subscription revenue | Total | |||||||||
in millions | |||||||||||
Increase in cable subscription revenue due to change in: | |||||||||||
Average number of RGUs (a) | $ | 84.1 | $ | — | $ | 84.1 | |||||
ARPU (b) | 57.7 | — | 57.7 | ||||||||
Total increase in cable subscription revenue | 141.8 | — | 141.8 | ||||||||
Decrease in mobile subscription revenue (c) | (24.4 | ) | — | (24.4 | ) | ||||||
Total increase in subscription revenue | 117.4 | — | 117.4 | ||||||||
Increase in B2B revenue (d) | — | 64.7 | 64.7 | ||||||||
Increase in other revenue (e) | — | 105.8 | 105.8 | ||||||||
Total organic increase | 117.4 | 170.5 | 287.9 | ||||||||
Impact of acquisitions | 0.4 | 8.6 | 9.0 | ||||||||
Impact of a disposal (f) | — | (50.0 | ) | (50.0 | ) | ||||||
Impact of FX | (483.7 | ) | (114.4 | ) | (598.1 | ) | |||||
Total | $ | (365.9 | ) | $ | 14.7 | $ | (351.2 | ) | |||
_______________
(a) | The increase in cable subscription revenue related to a change in the average number of RGUs is attributable to increases in the average numbers of broadband internet and fixed-line telephony RGUs that were only partially offset by declines in (i) the average number of enhanced video RGUs and (ii) the average number of basic and multi-channel multi-point (microwave) distribution system video RGUs in Ireland. |
(b) | The increase in cable subscription revenue related to a change in ARPU is primarily attributable to the net effect of (i) a net increase primarily due to (a) higher ARPU from broadband internet services in the U.K., (b) lower ARPU from fixed-line telephony services and (c) higher ARPU from video services and (ii) an adverse change in RGU mix in Ireland. In addition, the growth in ARPU was partially offset by (1) the impact of a January 1, 2015 change in how VAT is applied to certain components of our U.K. operations, which reduced revenue by $49.9 million, and (2) a May 1, 2014 change in legislation in the U.K. with respect to the charging of VAT in connection with prompt payment discounts, as discussed below, which reduced revenue by $24.0 million. |
(c) | The decrease in mobile subscription revenue relates to the U.K. and is due to (i) lower ARPU, including the net impact of (a) a decline of $41.6 million in postpaid mobile services revenue due to the November 2014 introduction of a Split-contract Program, (b) a decrease of $11.2 million related to the above-described January 1, 2015 change in how VAT is applied and (c) an increase in revenue due to the favorable impact of a $4.4 million adjustment to VAT recorded during the fourth quarter of 2015, and (ii) a decrease in the average number of subscribers, as a decrease in the average number of prepaid subscribers more than offset the increase in the average number of postpaid subscribers. |
(d) | The increase in B2B revenue is primarily due to (i) an increase in data revenue, primarily attributable to (a) higher volumes and (b) an increase of $22.7 million in the U.K.’s amortization of deferred upfront fees on B2B contracts, (ii) an increase in low-margin equipment sales in the U.K. and (iii) an increase in voice revenue, largely attributable to the net effect of (1) an $18.2 million increase recorded in the U.K. during the fourth quarter of 2015 related to the settlement of disputes with mobile operators over amounts charged for voice traffic, including $16.3 million related to years prior to 2015, and (2) a decline in usage. |
(e) | The increase in other revenue is primarily due to the net effect of (i) an increase in mobile handset sales, primarily attributable to a $144.6 million increase associated with the November 2014 introduction of a Split-contract Program, (ii) a decrease in interconnect revenue of $23.4 million, primarily due to a decline in SMS termination volumes in the U.K., and (iii) a decrease in installation revenue of $12.6 million. |
(f) | Represents the estimated impact of the U.K. Non-Cable Disposal. These non-cable subscribers were migrated to a third party during the first nine months of 2015. |
II-24
On March 19, 2014, the U.K. government announced a change in legislation with respect to the charging of VAT in connection with prompt payment discounts such as those that Virgin Media offers to its fixed-line telephony customers. This change, which took effect on May 1, 2014, impacted Virgin Media and some of its competitors. For additional information regarding a challenge
from the U.K. government regarding Virgin Media’s application of the prompt payment discount rules prior to the May 1, 2014
change in legislation, see note 17 to our consolidated financial statements.
Belgium. The decrease in Belgium’s revenue during 2015, as compared to 2014, includes (i) an organic increase of $138.7 million or 6.1% and (ii) the impact of FX, as set forth below:
Subscription revenue | Non-subscription revenue | Total | |||||||||
in millions | |||||||||||
Increase in cable subscription revenue due to change in: | |||||||||||
Average number of RGUs (a) | $ | 38.1 | $ | — | $ | 38.1 | |||||
ARPU (b) | 37.7 | — | 37.7 | ||||||||
Total increase in cable subscription revenue | 75.8 | — | 75.8 | ||||||||
Increase in mobile subscription revenue (c) | 29.6 | — | 29.6 | ||||||||
Total increase in subscription revenue | 105.4 | — | 105.4 | ||||||||
Increase in B2B revenue (d) | — | 16.7 | 16.7 | ||||||||
Increase in other revenue (e) | — | 16.6 | 16.6 | ||||||||
Total organic increase | 105.4 | 33.3 | 138.7 | ||||||||
Impact of FX | (333.6 | ) | (63.5 | ) | (397.1 | ) | |||||
Total | $ | (228.2 | ) | $ | (30.2 | ) | $ | (258.4 | ) | ||
_______________
(a) | The increase in cable subscription revenue related to a change in the average number of RGUs is attributable to increases in the average numbers of fixed-line telephony, broadband internet and enhanced video RGUs that were only partially offset by a decline in the average number of basic video RGUs. |
(b) | The increase in cable subscription revenue related to a change in ARPU is attributable to (i) higher ARPU from broadband internet, video and fixed-line telephony services and (ii) an improvement in RGU mix. |
(c) | The increase in mobile subscription revenue is due to the net effect of (i) an increase in the average number of mobile subscribers and (ii) lower ARPU. |
(d) | The increase in B2B revenue is primarily due to higher revenue from (i) information technology security services and related equipment sales, (ii) data services and (iii) voice services. |
(e) | The increase in other revenue is primarily due to the net effect of (i) an increase in mobile handset sales of $11.6 million, (ii) an increase in interconnect revenue of $9.2 million, primarily attributable to the net effect of (a) growth in mobile call volumes and (b) lower SMS usage, and (iii) a decrease in set-top box sales of $7.4 million, primarily due to a digital cable migration completed during the third quarter of 2014. The increase in Belgium’s mobile handset sales, which typically generate relatively low margins, is primarily due to the net effect of (1) an increase of $12.5 million associated with the June 2015 introduction of a Split-contract Program, (2) a decrease in subsidized handset sales and (3) higher revenue from contract termination fees applicable to subsidized handsets. |
The Netherlands. The increase in the Netherlands’ revenue during 2015, as compared to 2014, is primarily due to the Ziggo Acquisition. Due to the size of the Ziggo Acquisition and the resulting impact on the organic growth rate of the Netherlands, the below discussion and analysis of the Netherlands’ revenue is presented on a pro forma basis as if the results of Ziggo were included along with those of Ziggo Services B.V. (Ziggo Services) for 2014. The pro forma revenue amount for Ziggo is based on Ziggo’s publicly-reported results for 2014, as adjusted to (i) convert Ziggo’s publicly-reported results from International Financial Reporting Standards, as adopted by the E.U., to U.S. GAAP, (ii) conform one of Ziggo’s accounting policies to the corresponding Liberty Global accounting policy and (iii) reflect the impact of the acquisition accounting applied to the Ziggo Acquisition. We believe this pro forma revenue analysis provides the most meaningful comparison of the Netherlands’ revenue.
II-25
On a pro forma basis, the Netherlands’ revenue decreased $618.1 million or 18.4% during 2015, as compared to 2014. This decrease includes (i) a pro forma organic decrease of $82.7 million or 2.5% and (ii) the impact of FX, as set forth below:
Subscription revenue | Non-subscription revenue | Total | |||||||||
in millions | |||||||||||
Pro forma decrease in cable subscription revenue due to change in: | |||||||||||
Average number of RGUs (a) | $ | (36.4 | ) | $ | — | $ | (36.4 | ) | |||
ARPU (b) | (7.9 | ) | — | (7.9 | ) | ||||||
Total pro forma decrease in cable subscription revenue | (44.3 | ) | — | (44.3 | ) | ||||||
Pro forma increase in mobile subscription revenue (c) | 18.7 | — | 18.7 | ||||||||
Total pro forma decrease in subscription revenue | (25.6 | ) | — | (25.6 | ) | ||||||
Pro forma decrease in B2B revenue | — | (4.8 | ) | (4.8 | ) | ||||||
Pro forma decrease in other revenue (d) | — | (52.3 | ) | (52.3 | ) | ||||||
Total pro forma organic decrease | (25.6 | ) | (57.1 | ) | (82.7 | ) | |||||
Pro forma impact of FX | (491.8 | ) | (43.6 | ) | (535.4 | ) | |||||
Total | $ | (517.4 | ) | $ | (100.7 | ) | $ | (618.1 | ) | ||
_______________
(a) | The pro forma decrease in cable subscription revenue related to a change in the average number of RGUs is attributable to declines in the average numbers of basic video, enhanced video and fixed-line telephony RGUs that were only partially offset by an increase in the average number of broadband internet RGUs. |
(b) | The pro forma decrease in cable subscription revenue related to a change in ARPU is attributable to the net effect of (i) a net decrease due to (a) lower ARPU from video and fixed-line telephony services and (b) higher ARPU from broadband internet services and (ii) an improvement in RGU mix. |
(c) | The pro forma increase in mobile subscription revenue is primarily due to an increase in the average number of mobile subscribers. |
(d) | The pro forma decrease in other revenue is primarily due to (i) a decrease in revenue of $26.9 million resulting from the termination of a Ziggo partner network agreement shortly after the Ziggo Acquisition, (ii) a decrease in installation revenue and (iii) lower revenue from set-top box sales due to the fact that we stopped selling set-top boxes in the Netherlands during the first quarter of 2015. |
II-26
Germany. The decrease in Germany’s revenue during 2015, as compared to 2014, includes (i) an organic increase of $159.4 million or 5.9% and (ii) the impact of FX, as set forth below:
Subscription revenue | Non-subscription revenue | Total | |||||||||
in millions | |||||||||||
Increase in cable subscription revenue due to change in: | |||||||||||
Average number of RGUs (a) | $ | 82.5 | $ | — | $ | 82.5 | |||||
ARPU (b) | 95.9 | — | 95.9 | ||||||||
Total increase in cable subscription revenue | 178.4 | — | 178.4 | ||||||||
Decrease in mobile subscription revenue | (0.8 | ) | — | (0.8 | ) | ||||||
Total increase in subscription revenue | 177.6 | — | 177.6 | ||||||||
Increase in B2B revenue (c) | — | 6.3 | 6.3 | ||||||||
Decrease in other revenue (d) | — | (24.5 | ) | (24.5 | ) | ||||||
Total organic increase (decrease) | 177.6 | (18.2 | ) | 159.4 | |||||||
Impact of FX | (432.0 | ) | (39.4 | ) | (471.4 | ) | |||||
Total | $ | (254.4 | ) | $ | (57.6 | ) | $ | (312.0 | ) | ||
_______________
(a) | The increase in cable subscription revenue related to a change in the average number of RGUs is attributable to increases in the average numbers of broadband internet, fixed-line telephony and enhanced video RGUs that were only partially offset by a decline in the average number of basic video RGUs. |
(b) | The increase in cable subscription revenue related to a change in ARPU is attributable to (i) higher ARPU from broadband internet, video and fixed-line telephony services and (ii) an improvement in RGU mix. |
(c) | The increase in B2B revenue is due to higher revenue from data and voice services. |
(d) | The decrease in other revenue is primarily due to (i) a decrease from the unfavorable impact of $11.9 million of network usage revenue that Germany recorded during the first quarter of 2014 following the settlement of prior period amounts, (ii) a decrease in channel carriage fee revenue of $4.9 million and (iii) a decrease in interconnect revenue of $4.8 million. |
Switzerland/Austria. The decrease in Switzerland/Austria’s revenue during 2015, as compared to 2014, includes (i) an organic increase of $52.3 million or 2.8%, (ii) the impact of an acquisition and (iii) the impact of FX, as set forth below:
Subscription revenue | Non-subscription revenue | Total | |||||||||
in millions | |||||||||||
Increase in cable subscription revenue due to change in: | |||||||||||
Average number of RGUs (a) | $ | 7.5 | $ | — | $ | 7.5 | |||||
ARPU (b) | 17.0 | — | 17.0 | ||||||||
Total increase in cable subscription revenue | 24.5 | — | 24.5 | ||||||||
Increase in mobile subscription revenue (c) | 8.8 | — | 8.8 | ||||||||
Total increase in subscription revenue | 33.3 | — | 33.3 | ||||||||
Increase in B2B revenue (d) | — | 9.6 | 9.6 | ||||||||
Increase in other revenue (e) | — | 9.4 | 9.4 | ||||||||
Total organic increase | 33.3 | 19.0 | 52.3 | ||||||||
Impact of an acquisition | 5.7 | (0.4 | ) | 5.3 | |||||||
Impact of FX | (117.5 | ) | (28.0 | ) | (145.5 | ) | |||||
Total | $ | (78.5 | ) | $ | (9.4 | ) | $ | (87.9 | ) | ||
II-27
_______________
(a) | The increase in cable subscription revenue related to a change in the average number of RGUs is attributable to increases in the average numbers of broadband internet, fixed-line telephony and enhanced video RGUs that were primarily offset by a decline in the average number of basic video RGUs. |
(b) | The increase in cable subscription revenue related to a change in ARPU is due to an increase in both Switzerland and Austria. The increase in ARPU in Switzerland is attributable to (i) an improvement in RGU mix and (ii) a net increase due to (a) higher ARPU from video services and (b) lower ARPU from fixed-line telephony and broadband internet services. The increase in ARPU in Austria is attributable to the net effect of (1) a net increase due to (I) higher ARPU from video and broadband internet services and (II) lower ARPU from fixed-line telephony services and (2) an adverse change in RGU mix. |
(c) | The increase in mobile subscription revenue is primarily due to an increase in the average number of mobile subscribers in Switzerland. Switzerland’s mobile services were launched during the second quarter of 2014. |
(d) | The increase in B2B revenue is primarily due to a net increase in Switzerland from (i) higher revenue from voice and data services and (ii) lower revenue from construction services and equipment sales. |
(e) | The increase in other revenue is due to the net effect of (i) an increase in mobile handset sales, which typically generate relatively low margins, (ii) a decrease in revenue from Austria’s non-cable subscriber base and (iii) a net increase resulting from individually insignificant changes in other non-subscription revenue categories. |
Central and Eastern Europe. The decrease in Central and Eastern Europe’s revenue during 2015, as compared to 2014, includes (i) an organic increase of $16.1 million or 1.3% and (ii) the impact of FX, as set forth below:
Subscription revenue | Non-subscription revenue | Total | |||||||||
in millions | |||||||||||
Increase (decrease) in cable subscription revenue due to change in: | |||||||||||
Average number of RGUs (a) | $ | 37.5 | $ | — | $ | 37.5 | |||||
ARPU (b) | (28.7 | ) | — | (28.7 | ) | ||||||
Total increase in cable subscription revenue | 8.8 | — | 8.8 | ||||||||
Increase in mobile subscription revenue | 2.0 | — | 2.0 | ||||||||
Total increase in subscription revenue | 10.8 | — | 10.8 | ||||||||
Increase in B2B revenue | — | 4.2 | 4.2 | ||||||||
Increase in other revenue | — | 1.1 | 1.1 | ||||||||
Total organic increase | 10.8 | 5.3 | 16.1 | ||||||||
Impact of FX | (191.1 | ) | (17.9 | ) | (209.0 | ) | |||||
Total | $ | (180.3 | ) | $ | (12.6 | ) | $ | (192.9 | ) | ||
_______________
(a) | The increase in cable subscription revenue related to a change in the average number of RGUs is attributable to the net effect of (i) increases in the average numbers of enhanced video, broadband internet and fixed-line telephony RGUs in Romania, Poland, Hungary and Slovakia, (ii) a decline in the average number of basic video RGUs in Poland, Hungary, Romania and Slovakia, (iii) an increase in the average number of DTH RGUs, (iv) declines in the average numbers of fixed-line telephony and enhanced video RGUs in the Czech Republic and (v) increases in the average numbers of basic video and broadband internet RGUs in the Czech Republic. |
(b) | The decrease in cable subscription revenue related to a change in ARPU is attributable to the net effect of (i) a net decrease due to (a) lower ARPU from fixed-line telephony services, (b) lower ARPU from broadband internet services, primarily in Poland, and (c) higher ARPU from video services, primarily in Poland and Romania, and (ii) an improvement in RGU mix. In addition, the decline in ARPU includes the impact of a January 1, 2015 change in how VAT is calculated for UPC DTH’s operations in Hungary, the Czech Republic and Slovakia, which reduced UPC DTH’s revenue by $16.4 million. |
II-28
Chile. The decrease in Chile’s revenue during 2015, as compared to 2014, includes (i) an organic increase of $61.5 million or 6.9% and (ii) the impact of FX, as set forth below:
Subscription revenue | Non-subscription revenue | Total | |||||||||
in millions | |||||||||||
Increase in cable subscription revenue due to change in: | |||||||||||
Average number of RGUs (a) | $ | 23.0 | $ | — | $ | 23.0 | |||||
ARPU (b) | 20.4 | — | 20.4 | ||||||||
Total increase in cable subscription revenue | 43.4 | — | 43.4 | ||||||||
Increase in mobile subscription revenue (c) | 16.3 | — | 16.3 | ||||||||
Total increase in subscription revenue | 59.7 | — | 59.7 | ||||||||
Increase in other revenue (d) | — | 1.8 | 1.8 | ||||||||
Total organic increase | 59.7 | 1.8 | 61.5 | ||||||||
Impact of FX | (114.4 | ) | (7.5 | ) | (121.9 | ) | |||||
Total | $ | (54.7 | ) | $ | (5.7 | ) | $ | (60.4 | ) | ||
_______________
(a) | The increase in cable subscription revenue related to a change in the average number of RGUs is attributable to increases in the average numbers of broadband internet and enhanced video RGUs that were only partially offset by declines in the average numbers of basic video and fixed-line telephony RGUs. |
(b) | The increase in cable subscription revenue related to a change in ARPU is attributable to (i) a net increase due to (a) higher ARPU from video and broadband internet services and (b) lower ARPU from fixed-line telephony services and (ii) an improvement in RGU mix. In addition, the growth in ARPU was partially offset by a decrease in revenue due to the impact of a $2.5 million adjustment recorded during the first quarter of 2015 to reflect the retroactive application of a proposed tariff on ancillary services provided directly to customers for the period from July 2013 through February 2014. |
(c) | The increase in mobile subscription revenue is due to (i) an increase in the average number of subscribers, as an increase in the average number of postpaid subscribers more than offset the decrease in the average number of prepaid subscribers, and (ii) higher ARPU, primarily due to a higher proportion of mobile subscribers on postpaid plans, which generate higher ARPU than prepaid plans. |
(d) | The increase in other revenue is due to the net effect of (i) a decrease in interconnect revenue, (ii) an increase in installation revenue, (iii) an increase in advertising revenue and (iv) a net increase resulting from individually insignificant changes in other non-subscription revenue categories. The decrease in interconnect revenue is primarily due to (a) lower rates and (b) a decrease of $3.0 million related to the impact of adjustments recorded during the first and third quarters of 2015 to reflect the retroactive application of a tariff reduction to June 2012. |
II-29
Puerto Rico. The increase in Puerto Rico’s revenue during 2015, as compared to 2014, includes (i) an organic increase of $20.5 million or 5.7% and (ii) the impact of the Choice Acquisition, as set forth below:
Subscription revenue | Non-subscription revenue | Total | |||||||||
in millions | |||||||||||
Increase (decrease) in cable subscription revenue due to change in: | |||||||||||
Average number of RGUs (a) | $ | 20.8 | $ | — | $ | 20.8 | |||||
ARPU (b) | (5.7 | ) | — | (5.7 | ) | ||||||
Total increase in cable subscription revenue | 15.1 | — | 15.1 | ||||||||
Increase in B2B revenue | — | 4.6 | 4.6 | ||||||||
Increase in other revenue | — | 0.8 | 0.8 | ||||||||
Total organic increase | 15.1 | 5.4 | 20.5 | ||||||||
Impact of the Choice Acquisition | 47.2 | 5.4 | 52.6 | ||||||||
Total | $ | 62.3 | $ | 10.8 | $ | 73.1 | |||||
_______________
(a) | The increase in cable subscription revenue related to a change in the average number of RGUs is attributable to increases in the average numbers of fixed-line telephony, broadband internet and enhanced video RGUs. |
(b) | The decrease in cable subscription revenue related to a change in ARPU is primarily due to an adverse change in RGU mix. Excluding the impact of RGU mix, ARPU was relatively unchanged due to the net effect of (i) higher ARPU from video and broadband internet services and (ii) lower ARPU from fixed-line telephony services. |
II-30
Programming and Other Direct Costs of Services of our Reportable Segments
Programming and other direct costs of services — 2016 compared to 2015
General. Programming and other direct costs of services include programming and copyright costs, mobile access and interconnect costs, mobile handset and other equipment cost of goods sold and other direct costs related to our operations. Programming and copyright costs, which represent a significant portion of our operating costs, are expected to rise in future periods as a result of (i) higher costs associated with the expansion of our digital video content, including rights associated with ancillary product offerings and rights that provide for the broadcast of live sporting events, (ii) rate increases and (iii) growth in the number of our enhanced video subscribers. In addition, we are subject to inflationary pressures with respect to certain costs and foreign currency exchange risk with respect to costs and expenses that are denominated in currencies other than the respective functional currencies of our operating segments (non-functional currency expenses). Any cost increases that we are not able to pass on to our subscribers through rate increases would result in increased pressure on our operating margins. For additional information concerning our foreign currency exchange risks see Quantitative and Qualitative Disclosures about Market Risk — Foreign Currency Risk below.
Year ended December 31, | Increase (decrease) | Organic increase (decrease) | |||||||||||||||||||
2016 | 2015 | $ | % | $ | % | ||||||||||||||||
in millions, except percentages | |||||||||||||||||||||
Liberty Global Group: | |||||||||||||||||||||
European Division: | |||||||||||||||||||||
U.K./Ireland | $ | 1,946.4 | $ | 2,070.7 | $ | (124.3 | ) | (6.0 | ) | $ | 86.1 | 4.1 | |||||||||
Belgium (a) | 734.9 | 526.8 | 208.1 | 39.5 | 4.0 | 0.5 | |||||||||||||||
The Netherlands | 509.1 | 468.6 | 40.5 | 8.6 | 42.3 | 9.0 | |||||||||||||||
Germany | 228.7 | 203.5 | 25.2 | 12.4 | 25.9 | 12.7 | |||||||||||||||
Switzerland/Austria | 245.4 | 236.9 | 8.5 | 3.6 | 12.8 | 5.4 | |||||||||||||||
Total Western Europe | 3,664.5 | 3,506.5 | 158.0 | 4.5 | 171.1 | 4.6 | |||||||||||||||
Central and Eastern Europe | 254.8 | 234.1 | 20.7 | 8.8 | 24.8 | 10.5 | |||||||||||||||
Central and other | (6.1 | ) | (2.4 | ) | (3.7 | ) | N.M. | (3.8 | ) | N.M. | |||||||||||
Total European Division | 3,913.2 | 3,738.2 | 175.0 | 4.7 | 192.1 | 4.8 | |||||||||||||||
Corporate and other | 64.1 | 51.3 | 12.8 | 25.0 | 26.6 | 70.4 | |||||||||||||||
Intersegment eliminations | (48.3 | ) | (23.2 | ) | (25.1 | ) | N.M. | (24.6 | ) | N.M. | |||||||||||
Total Liberty Global Group | 3,929.0 | 3,766.3 | 162.7 | 4.3 | 194.1 | 4.9 | |||||||||||||||
LiLAC Group: | |||||||||||||||||||||
LiLAC Division: | |||||||||||||||||||||
CWC (b) | 327.6 | — | 327.6 | N.M. | — | — | |||||||||||||||
Chile | 237.6 | 227.9 | 9.7 | 4.3 | 17.7 | 7.8 | |||||||||||||||
Puerto Rico (c) | 113.3 | 110.3 | 3.0 | 2.7 | (7.4 | ) | (6.1 | ) | |||||||||||||
Total LiLAC Division | 678.5 | 338.2 | 340.3 | 100.6 | 10.3 | 1.5 | |||||||||||||||
Intersegment eliminations | (1.3 | ) | (0.5 | ) | (0.8 | ) | N.M. | (0.8 | ) | N.M. | |||||||||||
Total LiLAC Group | 677.2 | 337.7 | 339.5 | 100.5 | 9.5 | 1.4 | |||||||||||||||
Total | $ | 4,606.2 | $ | 4,104.0 | $ | 502.2 | 12.2 | $ | 203.5 | 4.4 | |||||||||||
_______________
(a) | The amount presented for 2016 includes the post-acquisition programming and other direct costs of services of BASE, which was acquired on February 11, 2016. |
(b) | The amount presented for 2016 reflects the post-acquisition programming and other direct costs of services of CWC, which was acquired on May 16, 2016. |
II-31
(c) | The amount presented for 2015 excludes the pre-acquisition programming and other direct costs of services of Choice, which was acquired on June 3, 2015. |
N.M. — Not Meaningful.
European Division. The European Division’s programming and other direct costs of services increased $175.0 million or 4.7% during 2016, as compared to 2015. This increase includes (i) an increase of $241.1 million attributable to the impact of the BASE Acquisition and other less significant acquisitions and (ii) a decrease of $8.1 million attributable to the U.K. Non-Cable Disposal and another less significant disposition. Excluding the effects of acquisitions, dispositions and FX, the European Division’s programming and other direct costs of services increased $192.1 million or 4.8%. This increase includes the following factors:
• | An increase in programming and copyright costs of $207.5 million or 9.9%, primarily due to increases in U.K./Ireland and the Netherlands and, to a lesser extent, Belgium and Germany. These increases are primarily attributable to higher costs for certain premium and/or basic content, including increases of (i) $55.1 million associated with a sports programming contract entered into in August 2015 in U.K./Ireland and (ii) $19.2 million associated with a new Europe-wide programming contract that was entered into in June 2016 with retrospective impact to January 1, 2016. The increase in programming and copyright costs also includes the net effect of (a) an increase of $5.6 million in the Netherlands resulting from adjustments related to the settlement of operational contingencies recorded during the third and fourth quarters of 2015 and (b) a decrease of $3.5 million in U.K./Ireland associated with the reassessment of an accrual during the fourth quarter of 2016. In addition, growth in the number of enhanced video subscribers contributed to the increases in Germany and Belgium; |
• | A decrease in mobile access and interconnect costs of $53.1 million or 4.8%, primarily due to the net effect of (i) a decline resulting from lower rates, primarily in U.K./Ireland, (ii) lower fixed-line telephony call volumes in U.K./Ireland and, to a lesser extent, the Netherlands, Belgium and Germany, (iii) higher mobile usage in U.K./Ireland and, to a lesser extent, Switzerland/Austria and Belgium, (iv) a $6.6 million decrease in Belgium due to the release of an accrual during the second quarter of 2016 as a result of the settlement of an operational contingency, (v) a decrease of $4.2 million in U.K./Ireland related to the settlement of disputes with mobile operators over amounts charged for voice traffic during the fourth quarter of 2015 and (vi) an increase of $3.9 million in Switzerland/Austria related to the settlement of an operational contingency during the third quarter of 2015; and |
• | An increase in mobile handset costs of $11.3 million, primarily due to the net effect of (i) higher mobile handset sales volumes, as increases in U.K./Ireland and, to a lesser extent, Germany and Switzerland/Austria were only partially offset by lower handset sales in Belgium and (ii) a lower average cost per handset sold in U.K./Ireland. The lower number of handsets sold in Belgium is primarily attributable to a reduction in subsidized handset promotions. |
LiLAC Division. The LiLAC Division’s programming and other direct costs of services increased $340.3 million or 100.6% during 2016, as compared to 2015. This increase includes an increase of $337.9 million attributable to the impact of the CWC Acquisition and the Choice Acquisition. Excluding the effects of acquisitions and FX, the LiLAC Division’s programming and other direct costs of services increased $10.3 million or 1.5%. This increase includes the following factors:
• | An increase in programming and copyright costs of $10.9 million or 4.4%, primarily associated with the net effect of (i) growth in the number of enhanced video subscribers in Chile, (ii) decreased costs for certain premium content in Puerto Rico and (iii) an increase arising from foreign currency exchange rate fluctuations, after giving effect to derivative instruments that hedge the currency exposure associated with Chile’s U.S. dollar denominated programming contracts. A significant portion of Chile’s programming contracts are denominated in U.S. dollars. During 2016, CWC began broadcasting live Premier League games in a number of its markets pursuant to a new multi-year agreement. The cost of the rights to broadcast these games, which are excluded from the calculation of organic growth, will continue to result in significant increases to CWC’s programming costs; |
• | An increase in mobile handset costs of $3.7 million, primarily due to higher mobile handset sales in Chile; and |
• | A decrease in mobile access and interconnect costs of $1.7 million or 5.1%, primarily attributable to the net effect of (i) lower mobile access charges and, to a lesser extent, lower mobile usage in Chile and (ii) a $2.3 million increase in Chile related to an adjustment that was recorded in the first quarter of 2015 to reflect a February 2015 tariff decline that was retroactive to May 2014. |
II-32
Programming and other direct costs of services — 2015 compared to 2014
Year ended December 31, | Increase (decrease) | Organic increase (decrease) | |||||||||||||||||||
2015 | 2014 | $ | % | $ | % | ||||||||||||||||
in millions, except percentages | |||||||||||||||||||||
Liberty Global Group: | |||||||||||||||||||||
European Division: | |||||||||||||||||||||
U.K./Ireland | $ | 2,070.7 | $ | 2,109.8 | $ | (39.1 | ) | (1.9 | ) | $ | 167.3 | 8.1 | |||||||||
Belgium | 526.8 | 586.7 | (59.9 | ) | (10.2 | ) | 41.0 | 7.0 | |||||||||||||
The Netherlands (a) | 468.6 | 256.2 | 212.4 | 82.9 | (41.3 | ) | (6.9 | ) | |||||||||||||
Germany | 203.5 | 237.3 | (33.8 | ) | (14.2 | ) | 6.2 | 2.6 | |||||||||||||
Switzerland/Austria | 236.9 | 246.7 | (9.8 | ) | (4.0 | ) | 9.6 | 3.9 | |||||||||||||
Total Western Europe | 3,506.5 | 3,436.7 | 69.8 | 2.0 | 182.8 | 4.9 | |||||||||||||||
Central and Eastern Europe | 234.1 | 251.7 | (17.6 | ) | (7.0 | ) | 27.7 | 11.0 | |||||||||||||
Central and other | (2.4 | ) | (1.3 | ) | (1.1 | ) | N.M. | (1.5 | ) | N.M. | |||||||||||
Total European Division | 3,738.2 | 3,687.1 | 51.1 | 1.4 | 209.0 | 5.2 | |||||||||||||||
Corporate and other | 51.3 | 60.3 | (9.0 | ) | (14.9 | ) | 12.6 | 26.4 | |||||||||||||
Intersegment eliminations | (23.2 | ) | (28.6 | ) | 5.4 | N.M. | 0.3 | N.M. | |||||||||||||
Total Liberty Global Group | 3,766.3 | 3,718.8 | 47.5 | 1.3 | 221.9 | 5.5 | |||||||||||||||
LiLAC Group: | |||||||||||||||||||||
Chile | 227.9 | 233.7 | (5.8 | ) | (2.5 | ) | 27.6 | 11.8 | |||||||||||||
Puerto Rico (b) | 110.3 | 90.6 | 19.7 | 21.7 | 5.2 | 4.9 | |||||||||||||||
Total LiLAC Division | 338.2 | 324.3 | 13.9 | 4.3 | 32.8 | 9.7 | |||||||||||||||
Corporate | (0.5 | ) | — | (0.5 | ) | N.M. | (0.5 | ) | N.M. | ||||||||||||
Total LiLAC Group | 337.7 | 324.3 | 13.4 | 4.1 | 32.3 | 9.5 | |||||||||||||||
Total | $ | 4,104.0 | $ | 4,043.1 | $ | 60.9 | 1.5 | $ | 254.2 | 5.8 | |||||||||||
_______________
(a) | The amount presented for 2014 excludes the pre-acquisition programming and other direct costs of services of Ziggo, which was acquired on November 11, 2014. |
(b) | The amount presented for 2015 includes the post-acquisition programming and other direct costs of services of Choice, which was acquired on June 3, 2015. |
N.M. — Not Meaningful.
European Division. The European Division’s programming and other direct costs of services increased $51.1 million or 1.4% during 2015, as compared to 2014. This increase includes (i) an increase of $342.4 million attributable to the impact of the Ziggo Acquisition and other less significant acquisitions and (ii) a decrease of $38.1 million attributable to the U.K. Non-Cable Disposal. Excluding the effects of acquisitions, the U.K. Non-Cable Disposal and FX, the European Division’s programming and other direct costs of services increased $209.0 million or 5.2%. This increase includes the following factors:
• | An increase in programming and copyright costs of $193.7 million or 9.9%, primarily due to increases in U.K./Ireland and, to a lesser extent, Belgium. The increased costs in (i) U.K./Ireland are primarily due to higher costs for certain premium and basic content, due in part to a new sports programming contract entered into in August 2015, and (ii) Belgium are primarily due to (a) higher costs for certain premium content and (b) growth in the number of enhanced video subscribers. The increase in programming and copyright costs also includes a $29.4 million net increase resulting from the impact of certain adjustments related to the settlement or reassessment of operational contingencies. The adjustments recorded during 2015 resulted in lower costs of $10.4 million, including a $6.5 million benefit in the Netherlands that we recorded during the third and fourth quarters of 2015 and a $3.9 million benefit in Germany that we recorded during the fourth quarter of 2015. The adjustments recorded during 2014 resulted in lower costs of $39.8 million, including (1) |
II-33
a $17.5 million benefit in Belgium and a $7.3 million benefit in Poland that we recorded during the first quarter of 2014 and (2) an $11.6 million benefit in U.K./Ireland that we recorded during the second quarter of 2014;
• | An increase in mobile handset costs of $42.1 million, largely due to the net impact of (i) an increase in the proportion of higher-value handsets sold in U.K./Ireland and, to a lesser extent, increased mobile handset costs in Belgium, due in part to the impact of a Split-contract Program implemented in the U.K. in November 2014 and in Belgium in June 2015, (ii) a decrease in costs as a result of continued growth of subscriber identification module or “SIM”-only contracts in U.K./Ireland and (iii) a decrease in costs associated with the impact of subscriber promotions involving free or heavily-discounted handsets that were offered in Belgium during 2014; and |
• | An increase in mobile access and interconnect costs of $1.7 million or 0.1%, primarily due to the net effect of (i) increased costs, primarily in U.K./Ireland and Belgium, attributable to higher mobile usage and, in the case of Belgium, mobile subscriber growth, (ii) a decline resulting from lower rates, primarily in U.K./Ireland and Germany, (iii) lower fixed-line telephony call volumes, primarily related to the net impact of declines in U.K./Ireland and the Netherlands and increases in Switzerland/Austria, (iv) increased costs associated with B2B services in U.K./Ireland, (v) an increase of $4.4 million in U.K./Ireland related to the settlement of disputes with mobile operators over amounts charged for voice traffic during the fourth quarter of 2015 and (vi) a decrease of $4.2 million in Switzerland/Austria related to the settlement of an operational contingency during the third quarter of 2015. |
LiLAC Division. The LiLAC Division’s programming and other direct costs of services increased $13.9 million or 4.3% during 2015, as compared to 2014. This increase includes an increase of $14.5 million attributable to the impact of the Choice Acquisition. Excluding the effects of this acquisition and FX, the LiLAC Division’s programming and other direct costs of services increased $32.8 million or 9.7%. This increase includes the following factors:
• | An increase in programming and copyright costs of $24.9 million or 10.7%, primarily associated with (i) increases in Chile and, to a lesser extent, Puerto Rico, due to growth in the numbers of enhanced video subscribers and, in the case of Puerto Rico, increased costs for certain content, and (ii) an increase of $5.6 million arising from foreign currency exchange rate fluctuations with respect to Chile’s U.S. dollar denominated programming contracts. A significant portion of Chile’s programming contracts are denominated in U.S. dollars; and |
• | An increase in mobile access and interconnect costs of $6.1 million or 8.1%, primarily attributable to the net effect of (i) an increase in Chile related to (a) higher roaming costs due to the impact of increased volumes and (b) higher interconnect costs resulting from the net effect of increased call volumes and lower rates, (ii) a decrease of $5.1 million in mobile access charges in Chile due to a February 2015 tariff decline that was retroactive to May 2014, including a decrease of $2.5 million related to 2014 access charges, and (iii) an increase in Puerto Rico related to additional capacity agreements with third-party internet providers. |
II-34
Other Operating Expenses of our Reportable Segments
Other operating expenses — 2016 compared to 2015
General. Other operating expenses include network operations, customer operations, customer care, share-based compensation and other costs related to our operations. We do not include share-based compensation in the following discussion and analysis of the other operating expenses of our reportable segments as share-based compensation expense is not included in the performance measures of our reportable segments. Share-based compensation expense is discussed under Discussion and Analysis of our Consolidated Operating Results below. We are subject to inflationary pressures with respect to our labor and certain other costs and foreign currency exchange risk with respect to non-functional currency expenses. Any cost increases that we are not able to pass on to our subscribers through rate increases would result in increased pressure on our operating margins. For additional information concerning our foreign currency exchange risks see Quantitative and Qualitative Disclosures about Market Risk — Foreign Currency Risk below.
Year ended December 31, | Increase (decrease) | Organic increase (decrease) | |||||||||||||||||||
2016 | 2015 | $ | % | $ | % | ||||||||||||||||
in millions, except percentages | |||||||||||||||||||||
Liberty Global Group: | |||||||||||||||||||||
European Division: | |||||||||||||||||||||
U.K./Ireland | $ | 836.9 | $ | 961.7 | $ | (124.8 | ) | (13.0 | ) | $ | (39.1 | ) | (4.0 | ) | |||||||
Belgium (a) | 360.4 | 244.3 | 116.1 | 47.5 | 18.9 | 5.5 | |||||||||||||||
The Netherlands | 346.9 | 373.9 | (27.0 | ) | (7.2 | ) | (26.2 | ) | (7.0 | ) | |||||||||||
Germany | 342.5 | 339.6 | 2.9 | 0.9 | 4.6 | 1.4 | |||||||||||||||
Switzerland/Austria | 225.1 | 252.8 | (27.7 | ) | (11.0 | ) | (24.2 | ) | (9.6 | ) | |||||||||||
Total Western Europe | 2,111.8 | 2,172.3 | (60.5 | ) | (2.8 | ) | (66.0 | ) | (2.9 | ) | |||||||||||
Central and Eastern Europe | 195.5 | 195.6 | (0.1 | ) | (0.1 | ) | 2.5 | 1.3 | |||||||||||||
Central and other | 130.6 | 99.6 | 31.0 | 31.1 | 31.1 | 31.2 | |||||||||||||||
Total European Division | 2,437.9 | 2,467.5 | (29.6 | ) | (1.2 | ) | (32.4 | ) | (1.3 | ) | |||||||||||
Corporate and other | 4.3 | 0.8 | 3.5 | N.M. | 3.6 | N.M. | |||||||||||||||
Intersegment eliminations | 0.6 | (0.7 | ) | 1.3 | N.M. | 0.8 | N.M. | ||||||||||||||
Total Liberty Global Group | 2,442.8 | 2,467.6 | (24.8 | ) | (1.0 | ) | (28.0 | ) | (1.1 | ) | |||||||||||
LiLAC Group: | |||||||||||||||||||||
LiLAC Division: | |||||||||||||||||||||
CWC (b) | 249.6 | — | 249.6 | N.M. | — | — | |||||||||||||||
Chile | 129.5 | 128.4 | 1.1 | 0.9 | 6.2 | 4.8 | |||||||||||||||
Puerto Rico (c) | 58.3 | 55.3 | 3.0 | 5.4 | (3.3 | ) | (5.4 | ) | |||||||||||||
Total LiLAC Division | 437.4 | 183.7 | 253.7 | 138.1 | 2.9 | 0.7 | |||||||||||||||
Intersegment eliminations | (0.1 | ) | 0.5 | (0.6 | ) | N.M. | (0.6 | ) | N.M. | ||||||||||||
Total LiLAC Group | 437.3 | 184.2 | 253.1 | 137.4 | 2.3 | 0.5 | |||||||||||||||
Total other operating expenses excluding share-based compensation expense | 2,880.1 | 2,651.8 | 228.3 | 8.6 | $ | (25.7 | ) | (0.9 | ) | ||||||||||||
Share-based compensation expense | 4.7 | 3.4 | 1.3 | 38.2 | |||||||||||||||||
Total | $ | 2,884.8 | $ | 2,655.2 | $ | 229.6 | 8.6 | ||||||||||||||
_______________
(a) | The amount presented for 2016 includes the post-acquisition other operating expenses of BASE, which was acquired on February 11, 2016. |
(b) | The amount presented for 2016 reflects the post-acquisition other operating expenses of CWC, which was acquired on May 16, 2016. |
II-35
(c) | The amount presented for 2015 excludes the pre-acquisition other operating expenses of Choice, which was acquired on June 3, 2015. |
N.M. — Not Meaningful.
European Division. The European Division’s other operating expenses (exclusive of share-based compensation expense) decreased $29.6 million or 1.2% during 2016, as compared to 2015. This decrease includes (i) an increase of $109.6 million attributable to the impact of the BASE Acquisition and other less significant acquisitions and (ii) a decrease of $1.0 million attributable to the U.K. Non-Cable Disposal and another less significant disposition. Excluding the effects of acquisitions, dispositions and FX, the European Division’s other operating expenses decreased $32.4 million or 1.3%. This decrease includes the following factors:
• | A decrease in personnel costs of $29.0 million or 3.2%, due primarily to the net effect of (i) decreased staffing levels, as decreases in U.K./Ireland, Switzerland/Austria and the Netherlands were only partially offset by increases in the European Division’s central operations and Belgium, (ii) annual wage increases, (iii) decreased costs in U.K./Ireland resulting from higher proportions of capitalized labor costs associated with the Network Extensions, (iv) lower costs related to certain employee benefits in U.K./Ireland and the European Division’s central operations and (v) lower incentive compensation costs, primarily in U.K./Ireland; |
• | An increase in network-related expenses of $15.5 million or 2.2%. This increase is primarily due to the net effect of (i) an $18.1 million increase resulting from retroactive adjustments recorded during the first and second quarters of 2015 to reflect lower local authority charges for certain elements of network infrastructure in the U.K., (ii) higher network maintenance costs, as increases in Belgium, U.K./Ireland, Hungary and Poland were only partially offset by decreases in the Netherlands and Switzerland/Austria, (iii) lower outsourced labor costs primarily associated with customer-facing activities in Germany and U.K./Ireland, (iv) a $6.2 million decrease in U.K./Ireland associated with the settlement of an operational contingency during the first quarter of 2016, (v) higher energy costs, as increases in Belgium, the Netherlands and Germany were only partially offset by lower costs in U.K./Ireland, (vi) a net decrease of $5.5 million in Germany associated with certain reassessments of an accrual during 2016 and 2015 and (vii) a decrease of $2.5 million as a result of costs incurred during the first half of 2015 associated with network harmonization activities following the Ziggo Acquisition. For information regarding increased charges for network infrastructure in the U.K. that are expected to become effective April 1, 2017, see note 17 to our consolidated financial statements; |
• | A decrease in bad debt and collection expenses of $11.2 million or 8.3%, primarily related to declines in U.K./Ireland, the Netherlands, Hungary and Switzerland/Austria that were only partially offset by increases in Germany and Poland; |
• | An increase in outsourced labor and professional fees of $10.5 million or 2.9%, primarily due to (i) an increase in call center costs, as higher costs in U.K./Ireland were only partially offset by lower costs in Switzerland/Austria and the Netherlands and (ii) higher consulting costs, as increases in the European Division’s central operations, Switzerland/Austria and the Netherlands were only partially offset by decreases in Belgium and U.K./Ireland. The lower call center costs in the Netherlands are attributable to a decrease of $12.7 million associated with third-party costs related to network and product harmonization activities and certain other third-party customer care costs following the Ziggo Acquisition; |
• | An increase in information technology-related expenses of $9.0 million or 9.6%, as higher software and other information technology-related service and maintenance costs in the European Division’s central operations, Germany and the Netherlands were only partially offset by a decrease in U.K./Ireland; |
• | A decrease in facilities expenses of $7.5 million or 12.7%, primarily due to lower costs in U.K./Ireland and the Netherlands; |
• | A decrease in vehicle expenses of $4.8 million or 10.7%, primarily related to lower costs for company vehicles in U.K./Ireland, the Netherlands, Switzerland/Austria and Hungary due largely to fewer vehicles and the impact of the conversion of certain operating leases to capital leases; and |
• | A net decrease resulting from individually insignificant changes in other operating expense categories. |
During the fourth quarter of 2016, we settled certain pylon tax disputes between BASE and certain local authorities in Belgium. In connection with this settlement, we reversed $8.1 million of the pylon tax provisions that BASE had recorded since we acquired BASE in February 2016. The effect of the originally recorded provisions and the reversal is included in our acquisition effect for BASE and accordingly does not impact the organic changes in Telenet's other operating expenses.
II-36
LiLAC Division. The LiLAC Division’s other operating expenses (exclusive of share-based compensation expense) increased $253.7 million or 138.1% during 2016, as compared to 2015. This increase includes an increase of $255.8 million attributable to the impact of the CWC Acquisition and the Choice Acquisition. Excluding the effects of acquisitions and FX, the LiLAC Division’s other operating expenses increased $2.9 million or 0.7%. This increase includes the following factors:
• | An increase in outsourced labor and professional fees of $4.6 million or 14.1%, primarily due to higher call center costs in Chile; |
• | A decrease in personnel costs of $2.0 million or 10.7%, primarily due to (i) annual wage decreases in Chile and (ii) lower staffing levels in Puerto Rico; |
• | A decrease in bad debt and collection expenses of $1.2 million or 2.9%, predominantly in Puerto Rico; |
• | An increase in network-related expenses of $1.0 million or 2.1%, primarily due to the net effect of (i) higher energy costs in Chile and (ii) lower outsourced labor costs associated with customer-facing activities in Puerto Rico; and |
• | An increase resulting from individually insignificant changes in other operating expense categories. |
II-37
Other operating expenses — 2015 compared to 2014
Year ended December 31, | Increase (decrease) | Organic increase (decrease) | |||||||||||||||||||
2015 | 2014 | $ | % | $ | % | ||||||||||||||||
in millions, except percentages | |||||||||||||||||||||
Liberty Global Group: | |||||||||||||||||||||
European Division: | |||||||||||||||||||||
U.K./Ireland | $ | 961.7 | $ | 1,112.7 | $ | (151.0 | ) | (13.6 | ) | $ | (65.1 | ) | (5.9 | ) | |||||||
Belgium | 244.3 | 279.8 | (35.5 | ) | (12.7 | ) | 12.7 | 4.5 | |||||||||||||
The Netherlands (a) | 373.9 | 188.7 | 185.2 | 98.1 | 18.7 | 4.4 | |||||||||||||||
Germany | 339.6 | 377.7 | (38.1 | ) | (10.1 | ) | 28.7 | 7.6 | |||||||||||||
Switzerland/Austria | 252.8 | 292.9 | (40.1 | ) | (13.7 | ) | (17.8 | ) | (6.1 | ) | |||||||||||
Total Western Europe | 2,172.3 | 2,251.8 | (79.5 | ) | (3.5 | ) | (22.8 | ) | (0.9 | ) | |||||||||||
Central and Eastern Europe | 195.6 | 248.3 | (52.7 | ) | (21.2 | ) | (14.2 | ) | (5.7 | ) | |||||||||||
Central and other | 99.6 | 78.5 | 21.1 | 26.9 | 37.7 | 48.0 | |||||||||||||||
Total European Division | 2,467.5 | 2,578.6 | (111.1 | ) | (4.3 | ) | 0.7 | — | |||||||||||||
Corporate and other | 0.8 | 1.3 | (0.5 | ) | N.M. | 0.8 | N.M. | ||||||||||||||
Intersegment eliminations | (0.7 | ) | — | (0.7 | ) | N.M. | — | N.M. | |||||||||||||
Total Liberty Global Group | 2,467.6 | 2,579.9 | (112.3 | ) | (4.4 | ) | 1.5 | 0.1 | |||||||||||||
LiLAC Group: | |||||||||||||||||||||
Chile | 128.4 | 143.6 | (15.2 | ) | (10.6 | ) | 3.3 | 2.3 | |||||||||||||
Puerto Rico (b) | 55.3 | 44.7 | 10.6 | 23.7 | 1.7 | 3.2 | |||||||||||||||
Total LiLAC Division | 183.7 | 188.3 | (4.6 | ) | (2.4 | ) | 5.0 | 2.5 | |||||||||||||
Corporate | 0.5 | — | 0.5 | N.M. | 0.5 | N.M. | |||||||||||||||
Total LiLAC Group | 184.2 | 188.3 | (4.1 | ) | (2.2 | ) | 5.5 | 2.8 | |||||||||||||
Total other operating expenses excluding share-based compensation expense | 2,651.8 | 2,768.2 | (116.4 | ) | (4.2 | ) | $ | 7.0 | 0.2 | ||||||||||||
Share-based compensation expense | 3.4 | 7.6 | (4.2 | ) | (55.3 | ) | |||||||||||||||
Total | $ | 2,655.2 | $ | 2,775.8 | $ | (120.6 | ) | (4.3 | ) | ||||||||||||
_______________
(a) | The amount presented for 2014 excludes the pre-acquisition other operating expenses of Ziggo, which was acquired on November 11, 2014. |
(b) | The amount presented for 2015 includes the post-acquisition other operating expenses of Choice, which was acquired on June 3, 2015. |
N.M. — Not Meaningful.
II-38
European Division. The European Division’s other operating expenses (exclusive of share-based compensation expense) decreased $111.1 million or 4.3% during 2015, as compared to 2014. This decrease includes (i) an increase of $236.1 million attributable to the impact of the Ziggo Acquisition and other less significant acquisitions and (ii) a decrease of $3.6 million attributable to the U.K. Non-Cable Disposal. Excluding the effects of acquisitions, the U.K. Non-Cable Disposal and FX, the European Division’s other operating expenses increased $0.7 million or 0.0%. This increase includes the following factors:
• | An increase in information technology-related expenses of $29.1 million or 40.2%, primarily due to higher software and other information technology-related service and maintenance costs, primarily in U.K./Ireland, the European Division’s central operations and Belgium; |
• | A decrease in personnel costs of $17.6 million or 1.9%, due primarily to the net effect of (i) lower incentive compensation costs, predominantly in U.K./Ireland, (ii) increased staffing levels, primarily in the European Division’s central operations, (iii) decreased costs in U.K./Ireland due to higher capitalized labor costs associated with the Network Extensions, (iv) annual wage increases, largely in U.K./Ireland, and (v) lower costs related to certain employee benefits in the Netherlands; |
• | An increase in outsourced labor and professional fees of $15.8 million or 4.4%, primarily due to the net effect of (i) higher call center costs in the Netherlands and U.K./Ireland and (ii) lower consulting costs, as a decrease in the European Division’s central operations was only partially offset by increases in Belgium and the Netherlands. The higher call center costs in the Netherlands represent third-party costs that are primarily related to network and product harmonization activities following the Ziggo Acquisition that, together with certain other third-party customer care costs, accounted for an increase of $17.3 million; and |
• | A decrease in network-related expenses of $9.6 million or 1.2%. This decrease includes (i) lower outsourced labor costs associated with customer-facing activities in U.K./Ireland, (ii) lower costs of $8.6 million in U.K./Ireland associated with the reassessment of accruals or operational contingencies in 2015, (iii) an increase in third-party costs incurred in the Netherlands of $2.8 million related to the harmonization of the Ziggo and Ziggo Services networks following the Ziggo Acquisition and (iv) a decrease in network maintenance costs, as decreases in U.K./Ireland and Switzerland/Austria were largely offset by increases in the Netherlands, Germany and Belgium. The decrease in network-related expense also includes the impact of reductions in local authority charges for certain elements of network infrastructure in the U.K. arising from successful appeals during the last half of 2014 and the first half of 2015. As compared to 2014, these reductions in local authority charges resulted in an increase in U.K./Ireland’s network-related expenses of $8.6 million. |
LiLAC Division. The LiLAC Division’s other operating expenses (exclusive of share-based compensation expense) decreased $4.6 million or 2.4% during 2015, as compared to 2014. This decrease includes an increase of $8.9 million attributable to the impact of the Choice Acquisition. Excluding the effects of this acquisition and FX, the LiLAC Division’s other operating expenses increased $5.0 million or 2.5%. This increase includes the following factors:
• | A decrease in personnel costs of $7.1 million or 12.7%, largely due to (i) lower incentive compensation costs in Chile and (ii) decreased costs related to higher proportions of employees devoted to the development of new billing and customer care systems and other capitalizable activities in Chile; |
• | An increase in network-related expenses of $4.4 million or 10.3%, primarily due to an increase in network maintenance costs in Chile; |
• | An increase of $4.1 million due to the impact of favorable adjustments recorded in Chile during the fourth quarter of 2014 related to the reassessment of certain accrued liabilities; and |
• | An increase in outsourced labor and professional fees of $3.2 million or 9.5%, primarily due to higher call center costs in Chile. |
II-39
SG&A Expenses of our Reportable Segments
SG&A expenses — 2016 compared to 2015
General. SG&A expenses include human resources, information technology, general services, management, finance, legal, external sales and marketing costs, share-based compensation and other general expenses. We do not include share-based compensation in the following discussion and analysis of the SG&A expenses of our reportable segments as share-based compensation expense is not included in the performance measures of our reportable segments. Share-based compensation expense is discussed under Discussion and Analysis of our Consolidated Operating Results below. We are subject to inflationary pressures with respect to our labor and certain other costs and foreign currency exchange risk with respect to non-functional currency expenses. For additional information concerning our foreign currency exchange risks see Quantitative and Qualitative Disclosures about Market Risk — Foreign Currency Risk below.
Year ended December 31, | Increase (decrease) | Organic increase (decrease) | |||||||||||||||||||
2016 | 2015 | $ | % | $ | % | ||||||||||||||||
in millions, except percentages | |||||||||||||||||||||
Liberty Global Group: | |||||||||||||||||||||
European Division: | |||||||||||||||||||||
U.K./Ireland | $ | 794.6 | $ | 864.2 | $ | (69.6 | ) | (8.1 | ) | $ | 10.0 | 1.1 | |||||||||
Belgium (a) | 422.4 | 259.6 | 162.8 | 62.7 | 25.6 | 6.4 | |||||||||||||||
The Netherlands | 362.1 | 383.3 | (21.2 | ) | (5.5 | ) | (19.9 | ) | (5.2 | ) | |||||||||||
Germany | 382.1 | 354.3 | 27.8 | 7.8 | 28.9 | 8.2 | |||||||||||||||
Switzerland/Austria | 215.8 | 228.4 | (12.6 | ) | (5.5 | ) | (9.5 | ) | (4.2 | ) | |||||||||||
Total Western Europe | 2,177.0 | 2,089.8 | 87.2 | 4.2 | 35.1 | 1.6 | |||||||||||||||
Central and Eastern Europe | 166.6 | 162.9 | 3.7 | 2.3 | 6.2 | 3.8 | |||||||||||||||
Central and other | 194.7 | 186.6 | 8.1 | 4.3 | 8.1 | 4.3 | |||||||||||||||
Total European Division | 2,538.3 | 2,439.3 | 99.0 | 4.1 | 49.4 | 1.9 | |||||||||||||||
Corporate and other | 211.6 | 212.8 | (1.2 | ) | (0.6 | ) | 3.6 | 1.7 | |||||||||||||
Intersegment eliminations | (0.4 | ) | 0.4 | (0.8 | ) | N.M. | — | N.M. | |||||||||||||
Total Liberty Global Group | 2,749.5 | 2,652.5 | 97.0 | 3.7 | 53.0 | 1.9 | |||||||||||||||
LiLAC Group: | |||||||||||||||||||||
LiLAC Division: | |||||||||||||||||||||
CWC (b) | 325.7 | — | 325.7 | N.M. | 9.9 | 3.1 | |||||||||||||||
Chile | 153.1 | 153.7 | (0.6 | ) | (0.4 | ) | 4.4 | 2.9 | |||||||||||||
Puerto Rico (c) | 37.4 | 46.4 | (9.0 | ) | (19.4 | ) | (14.6 | ) | (28.1 | ) | |||||||||||
Total LiLAC Division | 516.2 | 200.1 | 316.1 | 158.0 | (0.3 | ) | — | ||||||||||||||
Corporate | 8.9 | 4.3 | 4.6 | N.M. | 4.6 | N.M. | |||||||||||||||
Intersegment eliminations | 0.1 | — | 0.1 | N.M. | 0.1 | N.M. | |||||||||||||||
Total LiLAC Group | 525.2 | 204.4 | 320.8 | 156.9 | 4.4 | 0.8 | |||||||||||||||
Total SG&A expenses excluding share-based compensation expense | 3,274.7 | 2,856.9 | 417.8 | 14.6 | $ | 57.4 | 1.7 | ||||||||||||||
Share-based compensation expense | 292.2 | 314.8 | (22.6 | ) | (7.2 | ) | |||||||||||||||
Total | $ | 3,566.9 | $ | 3,171.7 | $ | 395.2 | 12.5 | ||||||||||||||
______________
(a) | The amount presented for 2016 includes the post-acquisition SG&A expenses of BASE, which was acquired on February 11, 2016. |
(b) | The amount presented for 2016 reflects the post-acquisition SG&A expenses of CWC, which was acquired on May 16, 2016. |
II-40
(c) | The amount presented for 2015 excludes the pre-acquisition SG&A expenses of Choice, which was acquired on June 3, 2015. |
N.M. — Not Meaningful.
Supplemental SG&A expense information:
Year ended December 31, | Increase (decrease) | Organic increase (decrease) | |||||||||||||||||||
2016 | 2015 | $ | % | $ | % | ||||||||||||||||
in millions, except percentages | |||||||||||||||||||||
Liberty Global Group: | |||||||||||||||||||||
General and administrative (a) | $ | 1,932.1 | $ | 1,808.4 | $ | 123.7 | 6.8 | $ | 70.3 | 3.6 | |||||||||||
External sales and marketing | 817.4 | 844.1 | (26.7 | ) | (3.2 | ) | (17.3 | ) | (2.0 | ) | |||||||||||
2,749.5 | 2,652.5 | 97.0 | 3.7 | 53.0 | 1.9 | ||||||||||||||||
LiLAC Group: | |||||||||||||||||||||
General and administrative (a) | 430.4 | 147.4 | 283.0 | 192.0 | 3.0 | 0.7 | |||||||||||||||
External sales and marketing | 94.8 | 57.0 | 37.8 | 66.3 | 1.4 | 1.5 | |||||||||||||||
525.2 | 204.4 | 320.8 | 156.9 | 4.4 | 0.8 | ||||||||||||||||
Total: | |||||||||||||||||||||
General and administrative (a) | 2,362.5 | 1,955.8 | 406.7 | 20.8 | 73.3 | 3.1 | |||||||||||||||
External sales and marketing | 912.2 | 901.1 | 11.1 | 1.2 | (15.9 | ) | (1.6 | ) | |||||||||||||
Total | $ | 3,274.7 | $ | 2,856.9 | $ | 417.8 | 14.6 | $ | 57.4 | 1.7 | |||||||||||
______________
(a) | General and administrative expenses include all personnel-related costs within our SG&A expenses, including personnel-related costs associated with our sales and marketing function. |
European Division. The European Division’s SG&A expenses (exclusive of share-based compensation expense) increased $99.0 million or 4.1% during 2016, as compared to 2015. This increase includes $152.7 million attributable to the impact of the BASE Acquisition and other less significant acquisitions. Excluding the effects of acquisitions and FX, the European Division’s SG&A expenses increased $49.4 million or 1.9%. This increase includes the following factors:
• | An increase in personnel costs of $49.6 million or 5.0%, primarily due to (i) increased staffing levels, as increases in U.K./Ireland, the European Division’s central operations, Germany and, to a lesser extent, Switzerland/Austria, were only partially offset by decreased staffing levels in the Netherlands and (ii) annual wage increases; |
• | A decrease in external sales and marketing costs of $15.1 million or 1.8%, primarily due to the net effect of (i) lower costs associated with advertising campaigns, as decreases in U.K./Ireland, the Netherlands and Switzerland/Austria were only partially offset by higher costs in Belgium, (ii) higher third-party sales commissions, as increases in Germany and U.K./Ireland were only partially offset by a decline in the Netherlands, (iii) lower third-party costs in the Netherlands of $4.0 million related to the impact of rebranding costs incurred during the 2015 period following the Ziggo Acquisition and (iv) a net increase of $0.3 million in Germany, as the reassessments of accruals led to offsetting reductions of $3.7 million and $4.0 million during 2016 and 2015, respectively; |
• | An increase in facilities expenses of $9.3 million or 4.6%, primarily due to higher rent and other facilities-related expenses in the European Division’s central operations, Germany, Belgium, the Netherlands and U.K./Ireland; |
• | An increase of $8.4 million due to the impact of an accrual release during the second quarter of 2015 related to the resolution of a contingency associated with universal service obligations in Belgium; |
• | A decrease in outsourced labor and professional fees of $5.2 million or 3.1%, due to the net effect of (i) increased legal costs in the European Division’s central operations and Belgium, (ii) a decrease in consulting costs, as decreases in the European Division’s central operations and U.K./Ireland were only partially offset by increases in Belgium and the Netherlands, and (iii) a net decrease resulting from other individually insignificant changes. The decrease in consulting |
II-41
costs includes (a) a decrease of $4.8 million associated with integration costs incurred in connection with the Ziggo Acquisition, (b) a $3.5 million decrease in integration costs in Belgium as the costs incurred in 2015 to prepare for the integration of BASE into Telenet’s operations exceeded the integration costs incurred in 2016 and (c) a decrease of $2.6 million in U.K./Ireland associated with consulting fees incurred during the fourth quarter of 2015 in connection with the settlement of disputes with mobile operators over amounts charged for voice traffic;
• | An increase in outsourced call center expenses of $5.1 million of 12.3%, primarily due to increases in the Netherlands and U.K./Ireland; and |
• | An increase in information technology-related expenses of $2.6 million or 2.4%, primarily due to higher software and other information technology-related maintenance costs in the European Division’s central operations and Belgium that were only partially offset by a decrease in these costs in the Netherlands. |
LiLAC Division. The LiLAC Division’s SG&A expenses (exclusive of share-based compensation expense) increased $316.1 million or 158.0% during 2016, as compared to 2015. This increase includes an increase of $321.3 million attributable to the impact of the CWC Acquisition and the Choice Acquisition. Excluding the effects of acquisitions and FX, the LiLAC Division’s SG&A expenses decreased $0.3 million or 0.0%. This decrease includes the following factors:
• | A $12.6 million decrease associated with the effective settlement of the PRTC Claim including (i) a $5.1 million reduction that represents the net impact of the reversal of the provision and related indemnification asset associated with the PRTC Claim that were originally recorded in connection with the OneLink Acquisition and (ii) the receipt of $7.5 million of indemnification proceeds from the former owners of OneLink. For additional information, see note 17 to our consolidated financial statements; |
• | An increase of $9.9 million associated with integration costs incurred during 2016 to integrate Columbus (acquired by CWC on March 31, 2015) with CWC’s operations and CWC’s operations with Liberty Global and the LiLAC Division. These costs are excluded from the Acquisition Impact for CWC and, accordingly, are included in the calculation of organic growth; |
• | An increase in personnel costs of $2.3 million or 3.5%, primarily in Chile, as increases in staffing levels and higher incentive compensation costs were only partially offset by lower severance costs; and |
• | A decrease in facilities expenses of $2.2 million or 6.2%, primarily due to lower facilities maintenance and utility costs in Chile. |
II-42
SG&A expenses — 2015 compared to 2014
Year ended December 31, | Increase (decrease) | Organic increase (decrease) | |||||||||||||||||||
2015 | 2014 | $ | % | $ | % | ||||||||||||||||
in millions, except percentages | |||||||||||||||||||||
Liberty Global Group: | |||||||||||||||||||||
European Division: | |||||||||||||||||||||
U.K./Ireland | $ | 864.2 | $ | 951.7 | $ | (87.5 | ) | (9.2 | ) | $ | (14.3 | ) | (1.5 | ) | |||||||
Belgium | 259.6 | 287.9 | (28.3 | ) | (9.8 | ) | 22.4 | 7.8 | |||||||||||||
The Netherlands (a) | 383.3 | 195.7 | 187.6 | 95.9 | (29.3 | ) | (6.1 | ) | |||||||||||||
Germany | 354.3 | 418.3 | (64.0 | ) | (15.3 | ) | 5.0 | 1.2 | |||||||||||||
Switzerland/Austria | 228.4 | 250.1 | (21.7 | ) | (8.7 | ) | (2.8 | ) | (1.1 | ) | |||||||||||
Total Western Europe | 2,089.8 | 2,103.7 | (13.9 | ) | (0.7 | ) | (19.0 | ) | (0.8 | ) | |||||||||||
Central and Eastern Europe | 162.9 | 176.5 | (13.6 | ) | (7.7 | ) | 18.2 | 10.3 | |||||||||||||
Central and other | 186.6 | 198.4 | (11.8 | ) | (5.9 | ) | 25.5 | 12.9 | |||||||||||||
Total European Division | 2,439.3 | 2,478.6 | (39.3 | ) | (1.6 | ) | 24.7 | 0.9 | |||||||||||||
Corporate and other | 212.8 | 221.2 | (8.4 | ) | (3.8 | ) | 4.5 | 2.0 | |||||||||||||
Intersegment eliminations | 0.4 | (0.3 | ) | 0.7 | N.M. | 0.3 | N.M. | ||||||||||||||
Total Liberty Global Group | 2,652.5 | 2,699.5 | (47.0 | ) | (1.7 | ) | 29.5 | 1.0 | |||||||||||||
LiLAC Group: | |||||||||||||||||||||
LiLAC Division: | |||||||||||||||||||||
Chile | 153.7 | 170.2 | (16.5 | ) | (9.7 | ) | 6.2 | 3.6 | |||||||||||||
Puerto Rico (b) | 46.4 | 41.9 | 4.5 | 10.7 | (3.2 | ) | (6.6 | ) | |||||||||||||
Total LiLAC Division | 200.1 | 212.1 | (12.0 | ) | (5.7 | ) | 3.0 | 1.4 | |||||||||||||
Corporate | 4.3 | 3.1 | 1.2 | 38.7 | 1.2 | 38.7 | |||||||||||||||
Total LiLAC Group | 204.4 | 215.2 | (10.8 | ) | (5.0 | ) | 4.2 | 1.9 | |||||||||||||
Total SG&A expenses excluding share-based compensation expense | 2,856.9 | 2,914.7 | (57.8 | ) | (2.0 | ) | $ | 33.7 | 1.1 | ||||||||||||
Share-based compensation expense | 314.8 | 249.6 | 65.2 | 26.1 | |||||||||||||||||
Total | $ | 3,171.7 | $ | 3,164.3 | $ | 7.4 | 0.2 | ||||||||||||||
______________
(a) | The amount presented for 2014 excludes the pre-acquisition SG&A expenses of Ziggo, which was acquired on November 11, 2014. |
(b) | The amount presented for 2015 includes the post-acquisition SG&A expenses of Choice, which was acquired on June 3, 2015. |
N.M. — Not Meaningful.
II-43
Supplemental SG&A expense information:
Year ended December 31, | Decrease | Organic increase (decrease) | |||||||||||||||||||
2015 | 2014 | $ | % | $ | % | ||||||||||||||||
in millions, except percentages | |||||||||||||||||||||
Liberty Global Group: | |||||||||||||||||||||
General and administrative (a) | $ | 1,808.4 | $ | 1,828.0 | $ | (19.6 | ) | (1.1 | ) | $ | 35.1 | 1.7 | |||||||||
External sales and marketing | 844.1 | 871.5 | (27.4 | ) | (3.1 | ) | (5.6 | ) | (0.6 | ) | |||||||||||
2,652.5 | 2,699.5 | (47.0 | ) | (1.7 | ) | 29.5 | 1.0 | ||||||||||||||
LiLAC Group: | |||||||||||||||||||||
General and administrative (a) | 147.4 | 155.9 | (8.5 | ) | (5.5 | ) | (0.2 | ) | (0.1 | ) | |||||||||||
External sales and marketing | 57.0 | 59.3 | (2.3 | ) | (3.9 | ) | 4.4 | 7.4 | |||||||||||||
204.4 | 215.2 | (10.8 | ) | (5.0 | ) | 4.2 | 1.9 | ||||||||||||||
Total: | |||||||||||||||||||||
General and administrative (a) | 1,955.8 | 1,983.9 | (28.1 | ) | (1.4 | ) | 34.9 | 1.6 | |||||||||||||
External sales and marketing | 901.1 | 930.8 | (29.7 | ) | (3.2 | ) | (1.2 | ) | (0.1 | ) | |||||||||||
Total | $ | 2,856.9 | $ | 2,914.7 | $ | (57.8 | ) | (2.0 | ) | $ | 33.7 | 1.1 | |||||||||
______________
(a) | General and administrative expenses include all personnel-related costs within our SG&A expenses, including personnel-related costs associated with our sales and marketing function. |
European Division. The European Division’s SG&A expenses (exclusive of share-based compensation expense) decreased $39.3 million or 1.6% during 2015, as compared to 2014. This decrease includes $286.7 million attributable to the impact of the Ziggo Acquisition and other less significant acquisitions. Excluding the effects of acquisitions and FX, the European Division’s SG&A expenses increased $24.7 million or 0.9%. This increase includes the following factors:
• | An increase in outsourced labor and professional fees of $22.4 million or 13.5%, primarily due to the net effect of (i) increased consulting costs associated with (a) strategic initiatives in U.K./Ireland and (b) scale initiatives in the areas of information technology and finance in the European Division’s central operations, (ii) the positive impact of a $7.8 million increase associated with consulting fees incurred during the third quarter of 2014 in connection with the reduction in local authority charges for certain elements of network infrastructure in the U.K., as discussed under Other Operating Expenses of our Reportable Segments above, (iii) increased consulting costs related to integration activities in (1) Belgium of $9.0 million and (2) the Netherlands and the European Division’s central operations of $1.6 million, (iv) decreased consulting costs related to strategic initiatives in Germany, (v) decreased legal costs in U.K./Ireland and (vi) an increase of $2.7 million in U.K./Ireland associated with consulting fees incurred during the fourth quarter of 2015 in connection with the settlement of disputes with mobile operators over amounts charged for voice traffic; |
• | An increase in personnel costs of $16.9 million or 1.7%, primarily due to the net effect of (i) increased staffing levels, primarily in the European Division’s central operations, Germany and U.K./Ireland, (ii) lower incentive compensation costs, as decreases in U.K./Ireland and the Netherlands were only partially offset by an increase in Belgium, (iii) annual wage increases, largely in U.K./Ireland, (iv) lower costs related to certain employee benefits in the Netherlands, (v) decreased costs in U.K./Ireland due to higher capitalized labor costs associated with the Network Extensions, (vi) a $3.2 million increase in the European Division’s central operations due to the impact of an accrual release recorded in the fourth quarter of 2014 associated with the settlement of an operational contingency and (vii) higher temporary personnel costs in the Netherlands of $2.0 million related to integration activities in connection with the Ziggo Acquisition; |
• | A decrease of $10.4 million due to an accrual release recorded during the second quarter of 2015 related to the resolution of a contingency associated with universal service obligations in Belgium; |
• | A decrease in external sales and marketing costs of $9.2 million or 1.1%, primarily due to the net effect of (i) higher third-party sales commissions, as an increase in Germany was only partially offset by a decline in U.K./Ireland, (ii) lower costs associated with advertising campaigns, as decreases in the Netherlands, Germany and U.K./Ireland were only partially offset by an increase in Belgium, (iii) a decrease of $4.7 million in Germany due to the impact of accrual releases |
II-44
in the third and fourth quarters of 2015 associated with the reassessment of an accrual and (iv) a $3.8 million increase in third-party costs in the Netherlands and the European Division’s central operations related to rebranding activities following the Ziggo Acquisition; and
• | A decrease in information technology-related expenses of $1.6 million or 1.5%, primarily due to lower software and information technology-related maintenance costs, as decreases in Germany and U.K./Ireland were only partially offset higher costs in the European Division’s central operations. |
LiLAC Division. The LiLAC Division’s SG&A expenses (exclusive of share-based compensation expense) decreased $12.0 million or 5.7%, during 2015, as compared to 2014. This decrease includes an increase of $7.8 million attributable to the impact of the Choice Acquisition. Excluding the effects of this acquisition and FX, the LiLAC Division’s SG&A expenses increased $3.0 million or 1.4%. This increase includes the following factors:
• | An increase in external sales and marketing costs of $4.4 million or 7.4%, primarily due to higher third-party sales commissions in Chile; |
• | A decrease of $2.2 million, due to lower costs associated with the national gross receipts tax that was implemented in Puerto Rico in July 2014. In 2015, it was determined that the tax would not be continued beyond 2014; |
• | An increase in facilities expenses of $2.0 million or 7.7%, primarily due to higher rental and utility costs in Chile; |
• | A decrease in outsourced labor and professional fees of $1.8 million or 13.5%, primarily due to lower fees associated with legal proceedings in Puerto Rico; |
• | An increase of $1.6 million due to the impact of favorable adjustments that were recorded in Chile during the fourth quarter of 2014 related to the reassessment of certain accrued liabilities; |
• | A decrease in personnel costs of $1.3 million or 1.8%, primarily due to the net effect of (i) a decrease in Chile due to lower incentive compensation and severance costs and (ii) annual wage increases; and |
• | A net increase resulting from individually insignificant changes in other SG&A expense categories. |
II-45
Adjusted OIBDA of our Reportable Segments
Adjusted OIBDA is the primary measure used by our chief operating decision maker to evaluate segment operating performance. For the definition of this performance measure and for a reconciliation of total segment Adjusted OIBDA to our earnings (loss) from continuing operations before income taxes, see note 18 to our consolidated financial statements.
Adjusted OIBDA — 2016 compared to 2015
Year ended December 31, | Increase (decrease) | Organic increase (decrease) | |||||||||||||||||||
2016 | 2015 | $ | % | $ | % | ||||||||||||||||
in millions, except percentages | |||||||||||||||||||||
Liberty Global Group: | |||||||||||||||||||||
European Division: | |||||||||||||||||||||
U.K./Ireland | $ | 2,930.9 | $ | 3,162.1 | $ | (231.2 | ) | (7.3 | ) | $ | 138.5 | 4.4 | |||||||||
Belgium (a) | 1,173.4 | 990.3 | 183.1 | 18.5 | 49.3 | 4.4 | |||||||||||||||
The Netherlands | 1,472.7 | 1,519.5 | (46.8 | ) | (3.1 | ) | (42.1 | ) | (2.8 | ) | |||||||||||
Germany | 1,586.4 | 1,502.1 | 84.3 | 5.6 | 89.0 | 5.9 | |||||||||||||||
Switzerland/Austria | 1,069.3 | 1,040.1 | 29.2 | 2.8 | 50.0 | 4.8 | |||||||||||||||
Total Western Europe | 8,232.7 | 8,214.1 | 18.6 | 0.2 | 284.7 | 3.4 | |||||||||||||||
Central and Eastern Europe | 471.5 | 474.0 | (2.5 | ) | (0.5 | ) | 6.7 | 1.4 | |||||||||||||
Central and other | (327.2 | ) | (289.2 | ) | (38.0 | ) | (13.1 | ) | (38.3 | ) | (13.2 | ) | |||||||||
Total European Division | 8,377.0 | 8,398.9 | (21.9 | ) | (0.3 | ) | 253.1 | 3.0 | |||||||||||||
Corporate and other | (213.3 | ) | (222.6 | ) | 9.3 | 4.2 | 3.1 | 1.4 | |||||||||||||
Total Liberty Global Group | 8,163.7 | 8,176.3 | (12.6 | ) | (0.2 | ) | 256.2 | 3.1 | |||||||||||||
LiLAC Group: | |||||||||||||||||||||
LiLAC Division: | |||||||||||||||||||||
CWC (b) | 541.9 | — | 541.9 | N.M. | (9.9 | ) | (1.8 | ) | |||||||||||||
Chile | 339.3 | 328.1 | 11.2 | 3.4 | 22.3 | 6.8 | |||||||||||||||
Puerto Rico (c) | 211.8 | 167.2 | 44.6 | 26.7 | 29.3 | 16.1 | |||||||||||||||
Total LiLAC Division | 1,093.0 | 495.3 | 597.7 | 120.7 | 41.7 | 3.9 | |||||||||||||||
Corporate | (8.9 | ) | (4.3 | ) | (4.6 | ) | N.M. | (4.6 | ) | N.M. | |||||||||||
Total LiLAC Group | 1,084.1 | 491.0 | 593.1 | 120.8 | 37.1 | 3.5 | |||||||||||||||
Total | $ | 9,247.8 | $ | 8,667.3 | $ | 580.5 | 6.7 | $ | 293.3 | 3.1 | |||||||||||
______________
(a) | The amount presented for 2016 includes the post-acquisition Adjusted OIBDA of BASE, which was acquired on February 11, 2016. |
(b) | The amount presented for 2016 reflects the post-acquisition Adjusted OIBDA of CWC, which was acquired on May 16, 2016. |
(c) | The amount presented for 2015 excludes the pre-acquisition Adjusted OIBDA of Choice, which was acquired on June 3, 2015. |
N.M. — Not Meaningful.
II-46
Adjusted OIBDA — 2015 compared to 2014
Year ended December 31, | Increase (decrease) | Organic increase (decrease) | |||||||||||||||||||
2015 | 2014 | $ | % | $ | % | ||||||||||||||||
in millions, except percentages | |||||||||||||||||||||
Liberty Global Group: | |||||||||||||||||||||
European Division: | |||||||||||||||||||||
U.K./Ireland | $ | 3,162.1 | $ | 3,235.7 | $ | (73.6 | ) | (2.3 | ) | $ | 200.0 | 6.2 | |||||||||
Belgium | 990.3 | 1,125.0 | (134.7 | ) | (12.0 | ) | 62.6 | 5.6 | |||||||||||||
The Netherlands (a) | 1,519.5 | 857.9 | 661.6 | 77.1 | (17.2 | ) | (0.9 | ) | |||||||||||||
Germany | 1,502.1 | 1,678.2 | (176.1 | ) | (10.5 | ) | 119.5 | 7.1 | |||||||||||||
Switzerland/Austria | 1,040.1 | 1,056.4 | (16.3 | ) | (1.5 | ) | 63.3 | 6.0 | |||||||||||||
Total Western Europe | 8,214.1 | 7,953.2 | 260.9 | 3.3 | 428.2 | 4.8 | |||||||||||||||
Central and Eastern Europe | 474.0 | 583.0 | (109.0 | ) | (18.7 | ) | (15.6 | ) | (2.7 | ) | |||||||||||
Central and other | (289.2 | ) | (282.7 | ) | (6.5 | ) | (2.3 | ) | (63.7 | ) | (22.5 | ) | |||||||||
Total European Division | 8,398.9 | 8,253.5 | 145.4 | 1.8 | 348.9 | 3.8 | |||||||||||||||
Corporate and other | (222.6 | ) | (212.0 | ) | (10.6 | ) | (5.0 | ) | (25.4 | ) | (12.0 | ) | |||||||||
Intersegment eliminations | — | 4.0 | (4.0 | ) | N.M. | 0.1 | N.M. | ||||||||||||||
Total Liberty Global Group | 8,176.3 | 8,045.5 | 130.8 | 1.6 | 323.6 | 3.6 | |||||||||||||||
LiLAC Group: | |||||||||||||||||||||
LiLAC Division: | |||||||||||||||||||||
Chile | 328.1 | 351.0 | (22.9 | ) | (6.5 | ) | 24.4 | 7.0 | |||||||||||||
Puerto Rico (b) | 167.2 | 128.9 | 38.3 | 29.7 | 16.8 | 11.2 | |||||||||||||||
Total LiLAC Division | 495.3 | 479.9 | 15.4 | 3.2 | 41.2 | 8.2 | |||||||||||||||
Corporate | (4.3 | ) | (3.1 | ) | (1.2 | ) | (38.7 | ) | (1.2 | ) | (38.7 | ) | |||||||||
Total LiLAC Group | 491.0 | 476.8 | 14.2 | 3.0 | 40.0 | 8.0 | |||||||||||||||
Total | $ | 8,667.3 | $ | 8,522.3 | $ | 145.0 | 1.7 | $ | 363.6 | 3.8 | |||||||||||
_______________
(a) | The amount presented for 2014 excludes the pre-acquisition Adjusted OIBDA of Ziggo, which was acquired on November 11, 2014. |
(b) | The amount presented for 2015 includes the post-acquisition Adjusted OIBDA of Choice, which was acquired on June 3, 2015. |
N.M. — Not Meaningful.
II-47
Adjusted OIBDA Margin — 2016, 2015 and 2014
The following table sets forth the Adjusted OIBDA margins (Adjusted OIBDA divided by revenue) of each of our reportable segments:
Year ended December 31, | |||||
2016 | 2015 | 2014 | |||
% | |||||
Liberty Global Group: | |||||
European Division: | |||||
U.K./Ireland | 45.0 | 44.8 | 43.7 | ||
Belgium | 43.6 | 49.0 | 49.4 | ||
The Netherlands | 54.7 | 55.3 | 57.3 | ||
Germany | 62.5 | 62.6 | 61.9 | ||
Switzerland/Austria | 60.9 | 59.2 | 57.2 | ||
Total Western Europe | 50.9 | 51.4 | 50.5 | ||
Central and Eastern Europe | 43.3 | 44.4 | 46.3 | ||
Total European Division | 48.5 | 49.3 | 48.6 | ||
LiLAC Group: | |||||
LiLAC Division: | |||||
CWC | 37.5 | N.M. | N.M. | ||
Chile | 39.5 | 39.1 | 39.1 | ||
Puerto Rico | 50.3 | 44.1 | 42.1 | ||
Total LiLAC Division | 40.1 | 40.7 | 39.8 | ||
_______________
N.M. — Not Meaningful.
In addition to organic changes in the revenue, programming and other direct costs of services, other operating expenses and SG&A expenses of our reportable segments, the Adjusted OIBDA margins presented above include the impact of acquisitions, the most significant of which are the CWC Acquisition, the BASE Acquisition, the Choice Acquisition and the Ziggo Acquisition. In this regard, the Adjusted OIBDA margin of Belgium during 2016 was adversely impacted by the inclusion of BASE, while the 2016 Adjusted OIBDA margin of Puerto Rico was positively impacted by the realized synergies with respect to the Choice Acquisition. During 2015, as compared to 2014, the Adjusted OIBDA margins of the Netherlands and Puerto Rico were adversely impacted by the inclusion of Ziggo and Choice, respectively, each of which generated relatively lower Adjusted OIBDA margins than the respective legacy operations. For discussion of the factors contributing to other changes in the Adjusted OIBDA margins of our reportable segments, see the above analyses of the revenue and expenses of our reportable segments.
II-48
Discussion and Analysis of our Consolidated Operating Results
General
For more detailed explanations of the changes in our revenue and operating (including direct costs of services and other operating costs) and SG&A expenses, see Discussion and Analysis of our Reportable Segments above.
2016 compared to 2015
Revenue
Our revenue by major category is set forth below:
Year ended December 31, | Increase (decrease) | Organic increase (decrease) | |||||||||||||||||||
2016 | 2015 | $ | % | $ | % | ||||||||||||||||
in millions, except percentages | |||||||||||||||||||||
Subscription revenue (a): | |||||||||||||||||||||
Video | $ | 6,378.0 | $ | 6,380.1 | $ | (2.1 | ) | — | $ | 103.7 | 1.6 | ||||||||||
Broadband internet | 5,309.4 | 5,073.4 | 236.0 | 4.7 | 345.9 | 6.6 | |||||||||||||||
Fixed-line telephony | 3,018.6 | 3,160.9 | (142.3 | ) | (4.5 | ) | (53.4 | ) | (1.6 | ) | |||||||||||
Cable subscription revenue | 14,706.0 | 14,614.4 | 91.6 | 0.6 | 396.2 | 2.7 | |||||||||||||||
Mobile (b) | 1,706.4 | 1,037.3 | 669.1 | 64.5 | (20.9 | ) | (1.2 | ) | |||||||||||||
Total subscription revenue | 16,412.4 | 15,651.7 | 760.7 | 4.9 | 375.3 | 2.2 | |||||||||||||||
B2B revenue (c) | 2,156.3 | 1,580.2 | 576.1 | 36.5 | 39.8 | 1.8 | |||||||||||||||
Other revenue (b) (d) | 1,440.1 | 1,048.1 | 392.0 | 37.4 | 112.5 | 8.2 | |||||||||||||||
Total | $ | 20,008.8 | $ | 18,280.0 | $ | 1,728.8 | 9.5 | $ | 527.6 | 2.6 | |||||||||||
_______________
(a) | Subscription revenue includes amounts received from subscribers for ongoing services, excluding installation fees and late fees. Subscription revenue from subscribers who purchase bundled services at a discounted rate is generally allocated proportionally to each service based on the standalone price for each individual service. As a result, changes in the standalone pricing of our cable and mobile products or the composition of bundles can contribute to changes in our product revenue categories from period to period. |
(b) | Mobile subscription revenue excludes mobile interconnect revenue of $313.4 million and $212.7 million during 2016 and 2015, respectively. Mobile interconnect revenue and revenue from mobile handset sales are included in other revenue. |
(c) | B2B revenue includes revenue from business broadband internet, video, voice, mobile and data services offered to medium to large enterprises and, on a wholesale basis, to other operators. We also provide services to certain SOHO subscribers. SOHO subscribers pay a premium price to receive expanded service levels along with video, broadband internet, fixed-line telephony or mobile services that are the same or similar to the mass marketed products offered to our residential subscribers. Revenue from SOHO subscribers, which is included in subscription revenue, aggregated $491.8 million and $319.2 million during 2016 and 2015, respectively. On an organic basis, our total B2B revenue, including revenue from SOHO subscribers, increased 5.4% during 2016, as compared to 2015. A portion of the increase in our SOHO revenue is attributable to the conversion of our residential subscribers to SOHO subscribers. |
(d) | Other revenue includes, among other items, interconnect fees, mobile handset sales, channel carriage fees and installation fees. |
Total revenue. Our consolidated revenue increased $1,728.8 million during 2016, as compared to 2015. This increase includes (i) an increase of $2,117.4 million attributable to the impact of acquisitions and (ii) a decrease of $29.5 million attributable to the impact of dispositions. Excluding the effects of acquisitions, dispositions and FX, our consolidated revenue increased $527.6 million or 2.6%.
II-49
Subscription revenue. The details of the change in our consolidated subscription revenue for 2016, as compared to 2015, are as follows (in millions):
Increase in cable subscription revenue due to change in: | |||
Average number of RGUs | $ | 266.9 | |
ARPU | 129.3 | ||
Total increase in cable subscription revenue | 396.2 | ||
Decrease in mobile subscription revenue | (20.9 | ) | |
Total organic increase in subscription revenue | 375.3 | ||
Impact of acquisitions | 1,109.3 | ||
Impact of a disposal | (11.8 | ) | |
Impact of FX | (712.1 | ) | |
Total | $ | 760.7 | |
Excluding the effects of acquisitions, dispositions and FX, our consolidated cable subscription revenue increased $396.2 million or 2.7% during 2016, as compared to 2015. This increase is due to the net effect of (i) an increase from broadband internet services of $345.9 million or 6.6%, attributable to an increase in the average number of broadband internet RGUs and higher ARPU from broadband internet services, (ii) an increase from video services of $103.7 million or 1.6%, attributable to the net effect of (a) higher ARPU from video services and (b) a decline in the average number of video RGUs, and (iii) a decrease from fixed-line telephony services of $53.4 million or 1.6%, attributable to the net effect of (1) lower ARPU from fixed-line telephony services and (2) an increase in the average number of fixed-line telephony RGUs.
Excluding the effects of acquisitions and FX, our consolidated mobile subscription revenue decreased $20.9 million or 1.2% during 2016, as compared to 2015. This decrease is largely due to the net effect of (i) a decline in the U.K., largely associated with the U.K. Split-contract Program, and (ii) increases in Belgium, Switzerland and Chile.
B2B revenue. Excluding the effects of acquisitions and FX, our consolidated B2B revenue increased $39.8 million or 1.8% during 2016, as compared to 2015. This increase is largely due to increases in the U.K. and Belgium.
Other revenue. Excluding the effects of acquisitions, dispositions and FX, our consolidated other revenue increased $112.5 million or 8.2% during 2016, as compared to 2015. This increase is primarily attributable to an increase in mobile handset sales, mainly associated with Split-contract Programs, primarily in the U.K.
For additional information concerning the changes in our subscription, B2B and other revenue, see Discussion and Analysis of our Reportable Segments — Revenue — 2016 compared to 2015 above. For information regarding the competitive environment in certain of our markets, see Overview above.
II-50
Supplemental revenue information
Our revenue by major category for the Liberty Global Group is set forth below:
Year ended December 31, | Increase (decrease) | Organic increase (decrease) | |||||||||||||||||||
2016 | 2015 | $ | % | $ | % | ||||||||||||||||
in millions, except percentages | |||||||||||||||||||||
Liberty Global Group: | |||||||||||||||||||||
Subscription revenue: | |||||||||||||||||||||
Video | $ | 5,730.4 | $ | 5,853.8 | $ | (123.4 | ) | (2.1 | ) | $ | 88.1 | 1.5 | |||||||||
Broadband internet | 4,731.2 | 4,669.9 | 61.3 | 1.3 | 303.6 | 6.5 | |||||||||||||||
Fixed-line telephony | 2,790.4 | 2,996.0 | (205.6 | ) | (6.9 | ) | (39.8 | ) | (1.3 | ) | |||||||||||
Cable subscription revenue | 13,252.0 | 13,519.7 | (267.7 | ) | (2.0 | ) | 351.9 | 2.6 | |||||||||||||
Mobile (a) | 1,249.3 | 1,001.7 | 247.6 | 24.7 | (27.5 | ) | (2.0 | ) | |||||||||||||
Total subscription revenue | 14,501.3 | 14,521.4 | (20.1 | ) | (0.1 | ) | 324.4 | 2.2 | |||||||||||||
B2B revenue (b) | 1,538.8 | 1,564.6 | (25.8 | ) | (1.6 | ) | 34.3 | 2.1 | |||||||||||||
Other revenue | 1,244.9 | 976.7 | 268.2 | 27.5 | 115.6 | 9.8 | |||||||||||||||
Total Liberty Global Group | $ | 17,285.0 | $ | 17,062.7 | $ | 222.3 | 1.3 | $ | 474.3 | 2.7 | |||||||||||
(a) | Mobile subscription revenue excludes mobile interconnect revenue of $281.9 million and $209.2 million during 2016 and 2015, respectively. Mobile interconnect revenue and revenue from mobile handset sales are included in other revenue. |
(b) | Revenue from SOHO subscribers, which is included in subscription revenue, aggregated $466.0 million and $298.6 million during 2016 and 2015, respectively. On an organic basis, the Liberty Global Group’s total B2B revenue, including revenue from SOHO subscribers, increased 6.7% during 2016, as compared to 2015. |
Our revenue by major category for the LiLAC Group is set forth below:
Year ended December 31, | Increase | Organic increase (decrease) | ||||||||||||||||||
2016 | 2015 | $ | % | $ | % | |||||||||||||||
in millions, except percentages | ||||||||||||||||||||
LiLAC Group: | ||||||||||||||||||||
Subscription revenue: | ||||||||||||||||||||
Video | $ | 647.6 | $ | 526.3 | $ | 121.3 | 23.0 | $ | 15.6 | 2.4 | ||||||||||
Broadband internet | 578.2 | 403.5 | 174.7 | 43.3 | 42.3 | 7.7 | ||||||||||||||
Fixed-line telephony | 228.2 | 164.9 | 63.3 | 38.4 | (13.6 | ) | (5.5 | ) | ||||||||||||
Cable subscription revenue | 1,454.0 | 1,094.7 | 359.3 | 32.8 | 44.3 | 3.1 | ||||||||||||||
Mobile (a) | 457.1 | 35.6 | 421.5 | 1,184.0 | 6.6 | 1.5 | ||||||||||||||
Total subscription revenue | 1,911.1 | 1,130.3 | 780.8 | 69.1 | 50.9 | 2.7 | ||||||||||||||
B2B revenue (b) | 617.5 | 15.6 | 601.9 | 3,858.3 | 5.5 | 0.9 | ||||||||||||||
Other revenue | 195.2 | 71.4 | 123.8 | 173.4 | (3.1 | ) | (1.5 | ) | ||||||||||||
Total LiLAC Group | $ | 2,723.8 | $ | 1,217.3 | $ | 1,506.5 | 123.8 | $ | 53.3 | 2.0 | ||||||||||
(a) | Mobile subscription revenue excludes mobile interconnect revenue of $31.5 million and $3.5 million during 2016 and 2015, respectively. Mobile interconnect revenue and revenue from mobile handset sales are included in other revenue. |
(b) | Revenue from SOHO subscribers, which is included in subscription revenue, aggregated $25.8 million and $20.6 million during 2016 and 2015, respectively. On an organic basis, the LiLAC Group’s total B2B revenue, including revenue from SOHO subscribers, increased 1.3% during 2016, as compared to 2015. |
II-51
Programming and other direct costs of services
Our programming and other direct costs of services increased $502.2 million during 2016, as compared to 2015. This increase includes (i) an increase of $579.0 million attributable to the impact of the CWC Acquisition, the BASE Acquisition, the Choice Acquisition and other less significant acquisitions and (ii) a decrease of $21.6 million attributable to the U.K. Non-Cable Disposal and other less significant dispositions. Excluding the effects of acquisitions, dispositions and FX, our programming and other direct costs of services increased $203.5 million or 4.4% during 2016, as compared to 2015. This increase is primarily attributable to the net effect of (a) an increase in programming and copyright costs, (b) a decrease in mobile access and interconnect costs and (c) an increase in mobile handset costs. For additional information regarding the changes in our programming and other direct costs of services, see Discussion and Analysis of our Reportable Segments — Programming and Other Direct Costs of Services of our Reportable Segments above.
Other operating expenses
Our other operating expenses increased $229.6 million during 2016, as compared to 2015. This increase includes (i) an increase of $365.6 million attributable to the impact of the CWC Acquisition, the BASE Acquisition, the Choice Acquisition and other less significant acquisitions and (ii) a decrease of $2.2 million attributable to the U.K. Non-Cable Disposal and other less significant dispositions. Our other operating expenses include share-based compensation expense, which increased $1.3 million during 2016. For additional information, see the discussion under Share-based compensation expense below. Excluding the effects of acquisitions, dispositions, FX and share-based compensation expense, our other operating expenses decreased $25.7 million or 0.9% during 2016, as compared to 2015. This decrease is primarily attributable to the net effect of (a) a decrease in personnel costs, (b) an increase in network-related expenses, (c) an increase in outsourced labor and professional fees, (d) an increase in information technology-related costs and (e) a decrease in bad debt and collection expenses. Certain of these changes include an aggregate decrease in integration-related costs in the Netherlands of $15.2 million. For additional information regarding the changes in our operating expenses, see Discussion and Analysis of our Reportable Segments — Other Operating Expenses of our Reportable Segments above.
SG&A expenses
Our SG&A expenses increased $395.2 million during 2016, as compared to 2015. This increase includes $474.0 million attributable to the impact of the CWC Acquisition, the BASE Acquisition, the Choice Acquisition and other less significant acquisitions. Our SG&A expenses include share-based compensation expense, which decreased $22.6 million during 2016. For additional information, see the discussion under Share-based compensation expense below. Excluding the effects of acquisitions, FX and share-based compensation expense, our SG&A expenses increased $57.4 million or 1.7% during 2016, as compared to 2015. This increase is primarily due to the net effect of (i) an increase in personnel costs, (ii) a decrease in external sales and marketing costs, (iii) an increase in outsourced labor and professional fees, (iv) an increase in outsourced call center costs and (v) an increase in facilities expenses. Certain of these changes include (a) an aggregate decrease in integration-related costs in the Netherlands of $10.9 million, (b) an aggregate decrease in integration-related costs in Belgium of $3.7 million and (c) an aggregate increase in integration-related costs related to CWC of $13.3 million, including $9.9 million incurred by CWC in connection with the integration of Columbus with CWC’s operations and CWC’s operations with Liberty Global and the LiLAC Division. For additional information regarding the changes in our SG&A expenses, see Discussion and Analysis of our Reportable Segments — SG&A Expenses of our Reportable Segments above.
II-52
Share-based compensation expense (included in other operating and SG&A expenses)
Our share-based compensation expense primarily relates to the share-based incentive awards issued by Liberty Global to its employees and employees of its subsidiaries. A summary of the aggregate share-based compensation expense that is included in our other operating and SG&A expenses is set forth below:
Year ended December 31, | |||||||
2016 | 2015 | ||||||
in millions | |||||||
Liberty Global shares: | |||||||
Performance-based incentive awards (a) | $ | 162.7 | $ | 157.1 | |||
Other share-based incentive awards | 114.9 | 149.6 | |||||
Total Liberty Global shares (b) | 277.6 | 306.7 | |||||
Telenet share-based incentive awards (c) | 12.2 | 9.2 | |||||
Other | 7.1 | 2.3 | |||||
Total | $ | 296.9 | $ | 318.2 | |||
Included in: | |||||||
Other operating expense: | |||||||
Liberty Global Group | $ | 3.3 | $ | 3.1 | |||
LiLAC Group | 1.4 | 0.3 | |||||
Total other operating expense | 4.7 | 3.4 | |||||
SG&A expense: | |||||||
Liberty Global Group | 278.2 | 312.7 | |||||
LiLAC Group | 14.0 | 2.1 | |||||
Total SG&A expense | 292.2 | 314.8 | |||||
Total | $ | 296.9 | $ | 318.2 | |||
_______________
(a) | Includes share-based compensation expense related to (i) Liberty Global PSUs, (ii) the Challenge Performance Awards and (iii) the PGUs. |
(b) | In connection with the LiLAC Transaction, our compensation committee approved the 2015 Award Modifications (as defined and described in note 13 to our consolidated financial statements) in accordance with the underlying share-based incentive plans. As a result of the 2015 Award Modifications, we recognized $16.1 million and $69.3 million of incremental expense during 2016 and 2015, respectively. |
(c) | Represents the share-based compensation expense associated with Telenet’s share-based incentive awards, which, at December 31, 2016, included (i) warrants and employee stock options (2,473,404 awards outstanding at a weighted average exercise price of €43.70 ($46.09)), (ii) performance-based specific stock option plans for the Chief Executive Officer (745,000 awards outstanding at a weighted average exercise price of €40.60 ($42.82)), (iii) performance-based share awards (173,640 awards outstanding) and (iv) performance-based specific stock option plans for employees (18,750 awards outstanding at a weighted average exercise price of €48.83 ($51.50)). |
For additional information concerning our share-based compensation, see note 13 to our consolidated financial statements.
II-53
Depreciation and amortization expense
The details of our depreciation and amortization expense are as follows:
Year ended December 31, | Increase (decrease) | |||||||||||||
2016 | 2015 | $ | % | |||||||||||
in millions | ||||||||||||||
Liberty Global Group | $ | 5,213.8 | $ | 5,609.4 | $ | (395.6 | ) | (7.1 | ) | |||||
LiLAC Group | 587.3 | 216.4 | 370.9 | 171.4 | ||||||||||
Total | $ | 5,801.1 | $ | 5,825.8 | $ | (24.7 | ) | (0.4 | ) | |||||
Excluding the effects of FX, depreciation and amortization expense increased $277.3 million or 4.8% during 2016, as compared to 2015. This increase is primarily due to the net effect of (i) an increase associated with property and equipment additions related to the installation of customer premises equipment, the expansion and upgrade of our networks and other capital initiatives, (ii) a decrease associated with certain assets becoming fully depreciated, primarily in U.K./Ireland, the Netherlands and, to a lesser extent, Chile, Switzerland/Austria, Belgium and Germany, (iii) an increase associated with acquisitions, primarily as a result of the CWC Acquisition and BASE Acquisition, and (iv) a decrease in the Netherlands as a result of the held-for-sale presentation of Ziggo Group Holding and Ziggo Sport from August 3, 2016 through the December 31, 2016 completion of the Dutch JV Transaction.
Impairment, restructuring and other operating items, net
The details of our impairment, restructuring and other operating items, net, are as follows:
Year ended December 31, | |||||||
2016 | 2015 | ||||||
in millions | |||||||
Liberty Global Group | $ | 194.7 | $ | 154.3 | |||
LiLAC Group | 153.8 | 19.8 | |||||
Total | $ | 348.5 | $ | 174.1 | |||
The total for 2016 includes (i) direct acquisition costs of $164.0 million, primarily related to the CWC Acquisition and, to a lesser extent, the Dutch JV Transaction and the BASE Acquisition, and (ii) restructuring charges of $189.1 million, including (a) $144.4 million of employee severance and termination costs related to certain reorganization activities, primarily in Germany, U.K./Ireland, the European Division’s central operations, Chile and the Netherlands, and (b) $41.3 million of contract termination and other costs related to (1) contract termination charges, primarily in the European Division’s central operations, the corporate and other category and Chile, and (2) the write-off of a prepaid indefeasible right of use for telecommunications capacity by Liberty Puerto Rico due to the abandonment of this capacity in favor of capacity on CWC’s network. The direct acquisition costs incurred during 2016 include transfer and stamp taxes as well as investment banking and other advisory fees.
Based on the results of our October 1, 2016 goodwill impairment test, a hypothetical decline of 20% or more in the fair value of any of CWC’s reporting units could result in the need to record a goodwill impairment charge. At December 31, 2016, the aggregate goodwill associated with the CWC reporting units was $5.5 billion. If, among other factors, (i) the equity values of the LiLAC Group were to remain depressed or decline further or (ii) the adverse impacts of economic, competitive, regulatory or other factors were to cause our results of operations or cash flows to be worse than anticipated, we could conclude in future periods that impairment charges are required in order to reduce the carrying values of our goodwill and, to a lesser extent, other long-lived assets. Any such impairment charges could be significant.
The total for 2015 includes (i) restructuring charges of $103.8 million, including (a) $102.3 million of employee severance and termination costs related to certain reorganization activities, primarily in the Netherlands, U.K./Ireland, Germany, Switzerland/Austria and Puerto Rico, (b) contract termination charges of $19.3 million, primarily in Belgium, Chile and Puerto Rico, and (c) a credit of $17.0 million recorded by Telenet during the fourth quarter following the settlement of its DTT capacity contract obligations, the fair value of which were originally recorded during 2014 when Telenet discontinued the provision of DTT services, (ii) direct acquisition costs of $49.8 million, primarily related to our acquisition of CWC, Telenet’s acquisition of BASE, our acquisition of additional shares of ITV, the Choice Acquisition and the Ziggo Acquisition, (iii) impairment charges of $24.8 million,
II-54
primarily in U.K./Ireland, the Netherlands and Switzerland/Austria, and (iv) a $23.1 million loss on the divestiture of our Film1 channels.
For information regarding our acquisitions, see note 4 to our consolidated financial statements. For information regarding the Dutch JV Transaction, see note 5 to our consolidated financial statements.
For additional information regarding our restructuring charges, see note 14 to our consolidated financial statements. For additional information regarding our impairments, see Critical Accounting Policies, Judgments and Estimates — Impairment of Property and Equipment and Intangible Assets below.
Interest expense
The details of our interest expense are as follows:
Year ended December 31, | Increase | ||||||||||||
2016 | 2015 | $ | % | ||||||||||
in millions | |||||||||||||
Liberty Global Group | $ | 2,324.4 | $ | 2,284.1 | $ | 40.3 | 1.8 | ||||||
LiLAC Group | 314.4 | 157.9 | 156.5 | 99.1 | |||||||||
Inter-group eliminations | (0.4 | ) | (0.6 | ) | 0.2 | N.M. | |||||||
Total | $ | 2,638.4 | $ | 2,441.4 | $ | 197.0 | 8.1 | ||||||
_______________
N.M. — Not Meaningful.
Excluding the effects of FX, interest expense increased $145.6 million or 6.0% during 2016, as compared to 2015. This increase is primarily attributable to the net effect of (i) higher average outstanding debt balances, largely due to debt incurred in connection with the CWC Acquisition, the BASE Acquisition and debt issued by Ziggo Group Holding in advance of the closing of the Dutch JV Transaction and (ii) lower weighted average interest rates related to the completion of certain financing transactions that resulted in extended maturities and decreases to certain of our interest rates. For additional information regarding our outstanding indebtedness, see note 10 to our consolidated financial statements.
It is possible that the interest rates on (i) any new borrowings could be higher than the current interest rates on our existing indebtedness and (ii) our variable-rate indebtedness could increase in future periods. As further discussed in note 7 to our consolidated financial statements and under Qualitative and Quantitative Disclosures about Market Risk below, we use derivative instruments to manage our interest rate risks.
II-55
Realized and unrealized gains on derivative instruments, net
Our realized and unrealized gains or losses on derivative instruments include (i) unrealized changes in the fair values of our derivative instruments that are non-cash in nature until such time as the derivative contracts are fully or partially settled and (ii) realized gains or losses upon the full or partial settlement of the derivative contracts. The details of our realized and unrealized gains on derivative instruments, net, are as follows:
Year ended December 31, | |||||||
2016 | 2015 | ||||||
in millions | |||||||
Cross-currency and interest rate derivative contracts: | |||||||
Liberty Global Group | $ | 716.2 | $ | 855.7 | |||
LiLAC Group | (216.8 | ) | 217.0 | ||||
Total cross-currency and interest rate derivative contracts (a) | 499.4 | 1,072.7 | |||||
Equity-related derivative instruments - Liberty Global Group: | |||||||
ITV Collar | 351.5 | (222.6 | ) | ||||
Sumitomo Collar | (25.6 | ) | (20.3 | ) | |||
Lionsgate Forward | 10.1 | 14.5 | |||||
Other | 1.6 | 0.7 | |||||
Total equity-related derivative instruments (b) | 337.6 | (227.7 | ) | ||||
Foreign currency forward and option contracts: | |||||||
Liberty Global Group | 18.1 | (9.0 | ) | ||||
LiLAC Group | (9.1 | ) | 10.3 | ||||
Total foreign currency forward contracts | 9.0 | 1.3 | |||||
Other - Liberty Global Group | (0.9 | ) | 0.9 | ||||
Total Liberty Global Group | 1,071.0 | 619.9 | |||||
Total LiLAC Group | (225.9 | ) | 227.3 | ||||
Total | $ | 845.1 | $ | 847.2 | |||
_______________
(a) | The gain during 2016 is primarily attributable to the net effect of (i) gains associated with decreases in the values of the British pound sterling and euro relative to the U.S. dollar, (ii) losses associated with decreases in market interest rates in the British pound sterling, euro and Chilean peso markets, (iii) losses associated with increases in market interest rates in the U.S. dollar market, (iv) losses associated with an increase in the value of the Chilean peso relative to the U.S. dollar, and (v) gains associated with increases in market interest rates in the Swiss franc and Polish zloty markets. In addition, the gain during 2016 includes a net loss of $16.4 million resulting from changes in our credit risk valuation adjustments. The gain during 2015 is primarily attributable to the net effect of (a) gains associated with decreases in the values of the euro, British pound sterling and Chilean peso relative to the U.S. dollar, (b) losses associated with an increase in the value of the Swiss franc relative to the euro and (c) gains associated with increases in market interest rates in the Chilean peso market. In addition, the gain during 2015 includes a net loss of $9.3 million resulting from changes in our credit risk valuation adjustments. |
(b) | For information concerning the factors that impact the valuations of our equity-related derivative instruments, see note 8 to our consolidated financial statements. |
For additional information concerning our derivative instruments, see notes 7 and 8 to our consolidated financial statements and Quantitative and Qualitative Disclosures about Market Risk below.
II-56
Foreign currency transaction losses, net
Our foreign currency transaction gains or losses primarily result from the remeasurement of monetary assets and liabilities that are denominated in currencies other than the underlying functional currency of the applicable entity. Unrealized foreign currency transaction gains or losses are computed based on period-end exchange rates and are non-cash in nature until such time as the amounts are settled. The details of our foreign currency transaction losses, net, are as follows:
Year ended December 31, | |||||||
2016 | 2015 | ||||||
in millions | |||||||
Liberty Global Group: | |||||||
U.S. dollar denominated debt issued by British pound sterling functional currency entities | $ | (954.4 | ) | $ | (210.0 | ) | |
Intercompany payables and receivables denominated in a currency other than the entity’s functional currency (a) | 731.6 | (98.4 | ) | ||||
U.S. dollar denominated debt issued by euro functional currency entities | (481.6 | ) | (715.7 | ) | |||
British pound sterling denominated debt issued by a U.S. dollar functional currency entity | 251.2 | 89.6 | |||||
Cash and restricted cash denominated in a currency other than the entity’s functional currency | 203.5 | 22.9 | |||||
Euro denominated debt issued by British pound sterling functional currency entities | (75.7 | ) | 8.1 | ||||
Yen denominated debt issued by a U.S. dollar functional currency entity | (40.3 | ) | 2.0 | ||||
Other | (34.4 | ) | (24.3 | ) | |||
Total Liberty Global Group | (400.1 | ) | (925.8 | ) | |||
LiLAC Group: | |||||||
U.S. dollar denominated debt issued by a Chilean peso functional currency entity | 82.8 | (215.8 | ) | ||||
British pound sterling denominated debt issued by a U.S. dollar functional currency entity | 32.1 | — | |||||
Other | (4.8 | ) | (7.6 | ) | |||
Total LiLAC Group | 110.1 | (223.4 | ) | ||||
Total | $ | (290.0 | ) | $ | (1,149.2 | ) | |
_______________
(a) | Amounts primarily relate to (i) loans between certain of our non-operating and operating subsidiaries in Europe, which generally are denominated in the currency of the applicable operating subsidiary, and (ii) loans between certain of our non-operating subsidiaries in the U.S. and Europe. |
For information regarding how we manage our exposure to foreign currency risk, see Quantitative and Qualitative Disclosures about Market Risk — Foreign Currency Risk below.
II-57
Realized and unrealized gains (losses) due to changes in fair values of certain investments and debt, net
Our realized and unrealized gains or losses due to changes in fair values of certain investments and debt include unrealized gains or losses associated with changes in fair values that are non-cash in nature until such time as these gains or losses are realized through cash transactions. For additional information regarding our investments, fair value measurements and debt, see notes 6, 8 and 10, respectively, to our consolidated financial statements. All of our investments and debt that we account for using the fair value method are attributed to the Liberty Global Group. The details of our realized and unrealized gains (losses) due to changes in fair values of certain investments and debt, net, are as follows:
Year ended December 31, | |||||||
2016 | 2015 | ||||||
in millions | |||||||
Investments: | |||||||
ITV | $ | (608.6 | ) | $ | 165.6 | ||
Sumitomo | 67.2 | (2.0 | ) | ||||
Lionsgate | (33.4 | ) | (33.2 | ) | |||
ITI Neovision | 16.0 | (17.0 | ) | ||||
Other, net (a) | 119.9 | 11.1 | |||||
Total investments | (438.9 | ) | 124.5 | ||||
Debt | (22.6 | ) | — | ||||
Total | $ | (461.5 | ) | $ | 124.5 | ||
_______________
(a) | The amount for 2016 includes a gain of $84.4 million related to an investment that was sold during the third quarter of 2016. |
Losses on debt modification and extinguishment, net
The details of our net losses on debt modification and extinguishment are as follows:
Year ended December 31, | |||||||
2016 | 2015 | ||||||
in millions | |||||||
Liberty Global Group | $ | (238.1 | ) | $ | (388.0 | ) | |
LiLAC Group | 0.9 | — | |||||
Total | $ | (237.2 | ) | $ | (388.0 | ) | |
The net loss during 2016 is attributable to (i) the payment of $150.3 million of redemption premiums, (ii) the write-off of $82.0 million of deferred financing costs, (iii) a loss of $9.6 million related to the settlement of portions of the Sumitomo Collar and the Sumitomo Collar Loan and (iv) the write-off of $4.7 million of net unamortized premiums.
The loss during 2015 is attributable to (i) the payment of $310.8 million of redemption premiums, (ii) the write-off of $66.1 million of deferred financing costs, (iii) the write-off of $10.3 million of net unamortized discounts and (iv) the payment of $0.8 million of third-party costs.
For additional information concerning our losses on debt modification and extinguishment, net, see note 10 to our consolidated financial statements.
Gain on Dutch JV Transaction
In connection with the Dutch JV Transaction, we recognized a pre-tax gain of $520.8 million, net of the recognition of a cumulative foreign currency translation loss of $714.5 million. For additional information, see note 5 to our consolidated financial statements.
II-58
Other income (expense), net
The details of our other income (expense), net are as follows:
Year ended December 31, | |||||||
2016 | 2015 | ||||||
in millions | |||||||
Liberty Global Group | $ | (2.4 | ) | $ | (24.5 | ) | |
LiLAC Group | 12.1 | (1.8 | ) | ||||
Inter-group eliminations | (0.4 | ) | (0.6 | ) | |||
Total | $ | 9.3 | $ | (26.9 | ) | ||
The total 2016 and 2015 amounts include (i) expense of $111.2 million and $56.8 million, respectively, representing our share of the results of affiliates and (ii) interest and dividend income of $46.9 million and $35.9 million, respectively. In addition, the 2016 amount includes income of $69.8 million, representing our share of the settlement of certain litigation. For additional information regarding our equity method investments, see note 6 to our consolidated financial statements.
Income tax benefit (expense)
The details of our income tax benefit (expense) are as follows:
Year ended December 31, | |||||||
2016 | 2015 | ||||||
in millions | |||||||
Liberty Global Group | $ | 1,347.0 | $ | (324.3 | ) | ||
LiLAC Group | (129.1 | ) | (40.6 | ) | |||
Total | $ | 1,217.9 | $ | (364.9 | ) | ||
The income tax benefit during 2016 differs from the expected income tax expense of $109.9 million (based on the U.K. statutory income tax rate of 20.0%), primarily due to the net positive impact of (i) a decrease in valuation allowances, including tax benefits of $1.1 billion recognized in the Netherlands upon the release of valuation allowances in the fourth quarter of 2016, (ii) the recognition of previously unrecognized tax benefits, (iii) non-deductible or non-taxable foreign currency exchange results, (iv) the tax effect of intercompany financing and (v) statutory tax rates in certain jurisdictions in which we operate that are different than the U.K. statutory income tax rate. The release of valuation allowances in the Netherlands is attributable to a significant improvement in our forecast of taxable income in the Netherlands, due to, among other factors, the impacts of contributing Ziggo Group Holding to the Dutch JV on December 31, 2016, as further described in note 5 to our consolidated financial statements. The net positive impact of these items was partially offset by the net negative impact of (a) certain permanent differences between the financial and tax accounting treatment of interest and other items and (b) a reduction in net deferred tax assets in the U.K. and other countries due to enacted changes in tax law.
The income tax expense during 2015 differs from the expected income tax benefit of $136.9 million (based on the U.K. statutory income tax rate of 20.0%) primarily due to the net negative impact of (i) an increase in valuation allowances, (ii) a reduction in net deferred tax assets in the U.K. due to enacted changes in tax law and (iii) certain permanent differences between the financial and tax accounting treatment of items associated with investments in subsidiaries and affiliates. The net negative impact of these items was partially offset by the net positive impact of (a) the tax effect of intercompany financing and (b) statutory tax rates in certain jurisdictions in which we operate that are different than the U.K. statutory income tax rate.
For additional information concerning our income taxes, see note 11 to our consolidated financial statements.
II-59
Earnings (loss) from continuing operations
The details of our earnings (loss) from continuing operations is as follows:
Year ended December 31, | |||||||
2016 | 2015 | ||||||
in millions | |||||||
Liberty Global Group | $ | 1,994.5 | $ | (1,101.2 | ) | ||
LiLAC Group | (227.2 | ) | 51.7 | ||||
Total | $ | 1,767.3 | $ | (1,049.5 | ) | ||
Our earnings (loss) from continuing operations consists of (i) operating income of $2,801.3 million and $2,349.2 million, respectively, (ii) net non-operating expense of $2,251.9 million and $3,033.8 million, respectively, and (iii) income tax benefit (expense) of $1,217.9 million and ($364.9 million), respectively.
Gains or losses associated with (i) changes in the fair values of derivative instruments, (ii) movements in foreign currency exchange rates and (iii) the disposition of assets and changes in ownership are subject to a high degree of volatility and, as such, any gains from these sources do not represent a reliable source of income. In the absence of significant gains in the future from these sources or from other non-operating items, our ability to achieve earnings from continuing operations is largely dependent on our ability to increase our aggregate Adjusted OIBDA to a level that more than offsets the aggregate amount of our (a) share-based compensation expense, (b) depreciation and amortization, (c) impairment, restructuring and other operating items, (d) interest expense, (e) other non-operating expenses and (f) income tax expenses.
Due largely to the fact that we seek to maintain our debt at levels that provide for attractive equity returns, as discussed under Liquidity and Capital Resources — Capitalization below, we expect that we will continue to report significant levels of interest expense for the foreseeable future. For information concerning our expectations with respect to trends that may affect certain aspects of our operating results in future periods, see the discussion under Overview above. For information concerning the reasons for changes in specific line items in our consolidated statements of operations, see the discussion under Discussion and Analysis of our Reportable Segments and Discussion and Analysis of our Consolidated Operating Results above.
Net earnings attributable to noncontrolling interests
The details of our net earnings attributable to noncontrolling interests are as follows:
Year ended December 31, | |||||||||||
2016 | 2015 | Increase (decrease) | |||||||||
in millions | |||||||||||
Liberty Global Group | $ | 33.7 | $ | 95.2 | $ | (61.5 | ) | ||||
LiLAC Group | 28.3 | 7.8 | 20.5 | ||||||||
Total | $ | 62.0 | $ | 103.0 | $ | (41.0 | ) | ||||
The decrease in net earnings attributable to noncontrolling interests during 2016, as compared to 2015, is primarily attributable to the results of operations of (i) Telenet, (ii) certain CWC subsidiaries following the CWC Acquisition and (iii) Liberty Puerto Rico.
II-60
2015 compared to 2014
Revenue
Our revenue by major category is set forth below:
Year ended December 31, | Increase (decrease) | Organic increase (decrease) | |||||||||||||||||||
2015 | 2014 | $ | % | $ | % | ||||||||||||||||
in millions, except percentages | |||||||||||||||||||||
Subscription revenue (a): | |||||||||||||||||||||
Video | $ | 6,380.1 | $ | 6,535.7 | $ | (155.6 | ) | (2.4 | ) | $ | 27.4 | 0.4 | |||||||||
Broadband internet | 5,073.4 | 4,713.6 | 359.8 | 7.6 | 441.2 | 8.3 | |||||||||||||||
Fixed-line telephony | 3,160.9 | 3,258.9 | (98.0 | ) | (3.0 | ) | (25.9 | ) | (0.7 | ) | |||||||||||
Cable subscription revenue | 14,614.4 | 14,508.2 | 106.2 | 0.7 | 442.7 | 2.7 | |||||||||||||||
Mobile (b) | 1,037.3 | 1,085.6 | (48.3 | ) | (4.4 | ) | 39.5 | 3.6 | |||||||||||||
Total subscription revenue | 15,651.7 | 15,593.8 | 57.9 | 0.4 | 482.2 | 2.8 | |||||||||||||||
B2B revenue (c) | 1,580.2 | 1,515.9 | 64.3 | 4.2 | 101.4 | 6.2 | |||||||||||||||
Other revenue (b) (d) | 1,048.1 | 1,138.6 | (90.5 | ) | (7.9 | ) | 74.9 | 6.7 | |||||||||||||
Total | $ | 18,280.0 | $ | 18,248.3 | $ | 31.7 | 0.2 | $ | 658.5 | 3.3 | |||||||||||
_________________
(a) | Subscription revenue includes amounts received from subscribers for ongoing services, excluding installation fees and late fees. Subscription revenue from subscribers who purchase bundled services at a discounted rate is generally allocated proportionally to each service based on the standalone price for each individual service. As a result, changes in the standalone pricing of our cable and mobile products or the composition of bundles can contribute to changes in our product revenue categories from period to period. |
(b) | Mobile subscription revenue excludes mobile interconnect revenue of $212.7 million and $245.0 million during 2015 and 2014, respectively. Mobile interconnect revenue and revenue from mobile handset sales are included in other revenue. |
(c) | B2B revenue includes revenue from business broadband internet, video, voice, mobile and data services offered to medium to large enterprises and, on a wholesale basis, to other operators. We also provide services to certain SOHO subscribers. SOHO subscribers pay a premium price to receive expanded service levels along with video, broadband internet, fixed-line telephony or mobile services that are the same or similar to the mass marketed products offered to our residential subscribers. Revenue from SOHO subscribers, which is included in subscription revenue, aggregated $319.2 million and $216.5 million during 2015 and 2014, respectively. On an organic basis, our total B2B revenue, including revenue from SOHO subscribers, increased 10.7% during 2015, as compared to 2014. A portion of the increase in our SOHO revenue is attributable to the conversion of our residential subscribers to SOHO subscribers. |
(d) | Other revenue includes, among other items, interconnect, mobile handset sales, channel carriage fee and installation revenue. |
Total revenue. Our consolidated revenue increased $31.7 million during 2015, as compared to 2014. This increase includes (i) an increase of $1,879.4 million attributable to the impact of acquisitions and (ii) a decrease of $63.2 million attributable to the U.K. Non-Cable Disposal and another less significant disposition. Excluding the effects of acquisitions, dispositions and FX, our consolidated revenue increased $658.5 million or 3.3%.
II-61
Subscription revenue. The details of the change in our consolidated subscription revenue for 2015, as compared to 2014, are as follows (in millions):
Increase in cable subscription revenue due to change in: | |||
Average number of RGUs | $ | 234.5 | |
ARPU | 208.2 | ||
Total increase in cable subscription revenue | 442.7 | ||
Increase in mobile subscription revenue | 39.5 | ||
Total organic increase in subscription revenue | 482.2 | ||
Impact of acquisitions | 1,701.2 | ||
Impact of FX | (2,125.5 | ) | |
Total | $ | 57.9 | |
Excluding the effects of acquisitions and FX, our consolidated cable subscription revenue increased $442.7 million or 2.7% during 2015, as compared to 2014. This increase is due to the net effect of (i) an increase from broadband internet services of $441.2 million or 8.3%, attributable to an increase in the average number of broadband internet RGUs and higher ARPU from broadband internet services, (ii) an increase from video services of $27.4 million or 0.4%, attributable to the net effect of (a) higher ARPU from video services and (b) a decline in the average number of video RGUs, and (iii) a decrease from fixed-line telephony services of $25.9 million or 0.7%, attributable to the net effect of (1) lower ARPU from fixed-line telephony services and (2) an increase in the average number of fixed-line telephony RGUs.
Excluding the effects of acquisitions and FX, our consolidated mobile subscription revenue increased $39.5 million or 3.6% during 2015, as compared to 2014. This increase is primarily due to the net effect of (i) increases in Belgium, Chile, Switzerland and the Netherlands and (ii) a decline in the U.K.
B2B revenue. Excluding the effects of acquisitions and FX, our consolidated B2B revenue increased $101.4 million or 6.2% during 2015, as compared to 2014. This increase is primarily due to the net effect of (i) increases in the U.K., Switzerland, Belgium, Germany and Poland and (ii) a decrease in the Netherlands.
Other revenue. Excluding the effects of acquisitions, dispositions and FX, our consolidated other revenue increased $74.9 million or 6.7% during 2015, as compared to 2014. This increase is primarily attributable to the net effect of (i) an increase in mobile handset sales, primarily associated with the introduction of Split-contract Programs in the U.K. and Belgium, (ii) a decrease in fixed-line interconnect revenue, primarily in Chile, Germany and the U.K., (iii) a decrease in installation revenue, primarily in the U.K. and the Netherlands, and (iv) a decrease in set-top box sales, primarily in Belgium and the Netherlands.
For additional information concerning the changes in our subscription, B2B and other revenue, see Discussion and Analysis of our Reportable Segments — Revenue — 2015 compared to 2014 above.
II-62
Supplemental revenue information
Our revenue by major category for the Liberty Global Group is set forth below:
Year ended December 31, | Increase (decrease) | Organic increase (decrease) | |||||||||||||||||||
2015 | 2014 | $ | % | $ | % | ||||||||||||||||
in millions, except percentages | |||||||||||||||||||||
Liberty Global Group: | |||||||||||||||||||||
Subscription revenue: | |||||||||||||||||||||
Video | $ | 5,853.8 | $ | 6,005.8 | $ | (152.0 | ) | (2.5 | ) | $ | (1.6 | ) | — | ||||||||
Broadband internet | 4,669.9 | 4,333.5 | 336.4 | 7.8 | 405.7 | 8.3 | |||||||||||||||
Fixed-line telephony | 2,996.0 | 3,070.5 | (74.5 | ) | (2.4 | ) | (19.8 | ) | (0.6 | ) | |||||||||||
Cable subscription revenue | 13,519.7 | 13,409.8 | 109.9 | 0.8 | 384.3 | 2.6 | |||||||||||||||
Mobile (a) | 1,001.7 | 1,061.2 | (59.5 | ) | (5.6 | ) | 23.2 | 2.1 | |||||||||||||
Total subscription revenue | 14,521.4 | 14,471.0 | 50.4 | 0.3 | 407.5 | 2.5 | |||||||||||||||
B2B revenue (b) | 1,564.6 | 1,506.2 | 58.4 | 3.9 | 96.8 | 5.9 | |||||||||||||||
Other revenue | 976.7 | 1,066.5 | (89.8 | ) | (8.4 | ) | 72.2 | 6.9 | |||||||||||||
Total Liberty Global Group | $ | 17,062.7 | $ | 17,043.7 | $ | 19.0 | 0.1 | $ | 576.5 | 3.1 | |||||||||||
(a) | Mobile subscription revenue excludes mobile interconnect revenue of $209.2 million and $242.2 million during 2015 and 2014, respectively. Mobile interconnect revenue and revenue from mobile handset sales are included in other revenue. |
(b) | Revenue from SOHO subscribers, which is included in subscription revenue, aggregated $298.6 million and $199.2 million during 2015 and 2014, respectively. On an organic basis, the Liberty Global Group’s total B2B revenue, including revenue from SOHO subscribers, increased 10.6% during 2015, as compared to 2014. |
Our revenue by major category for the LiLAC Group is set forth below:
Year ended December 31, | Increase (decrease) | Organic increase (decrease) | |||||||||||||||||||
2015 | 2014 | $ | % | $ | % | ||||||||||||||||
in millions, except percentages | |||||||||||||||||||||
LiLAC Group: | |||||||||||||||||||||
Subscription revenue: | |||||||||||||||||||||
Video | $ | 526.3 | $ | 529.9 | $ | (3.6 | ) | (0.7 | ) | $ | 29.0 | 5.3 | |||||||||
Broadband internet | 403.5 | 380.1 | 23.4 | 6.2 | 35.5 | 8.7 | |||||||||||||||
Fixed-line telephony | 164.9 | 188.4 | (23.5 | ) | (12.5 | ) | (6.1 | ) | (3.2 | ) | |||||||||||
Cable subscription revenue | 1,094.7 | 1,098.4 | (3.7 | ) | (0.3 | ) | 58.4 | 5.1 | |||||||||||||
Mobile (a) | 35.6 | 24.4 | 11.2 | 45.9 | 16.3 | 66.6 | |||||||||||||||
Total subscription revenue | 1,130.3 | 1,122.8 | 7.5 | 0.7 | 74.7 | 6.4 | |||||||||||||||
B2B revenue (b) | 15.6 | 9.7 | 5.9 | 60.8 | 4.6 | 41.6 | |||||||||||||||
Other revenue | 71.4 | 72.1 | (0.7 | ) | (1.0 | ) | 2.7 | 3.5 | |||||||||||||
Total LiLAC Group | $ | 1,217.3 | $ | 1,204.6 | $ | 12.7 | 1.1 | $ | 82.0 | 6.5 | |||||||||||
(a) | Mobile subscription revenue excludes mobile interconnect revenue of $3.5 million and $2.8 million during 2015 and 2014, respectively. Mobile interconnect revenue and revenue from mobile handset sales are included in other revenue. |
(b) | Revenue from SOHO subscribers, which is included in subscription revenue, aggregated $20.6 million and $17.3 million during 2015 and 2014, respectively. On an organic basis, the LiLAC Group’s total B2B revenue, including revenue from SOHO subscribers, increased 16.1% during 2015, as compared to 2014. |
II-63
Programming and other direct costs of services
Our programming and other direct costs of services increased $60.9 million during 2015, as compared to 2014. This increase includes (i) an increase of $356.9 million attributable to the impact of the Ziggo Acquisition, the Choice Acquisition and other less significant acquisitions and (ii) a decrease of $50.5 million attributable to the U.K. Non-Cable Disposal and another less significant disposition. Excluding the effects of acquisitions, dispositions and FX, our programming and other direct costs of services increased $254.2 million or 5.8% during 2015, as compared to 2014. This increase is primarily attributable to increases in (a) programming and copyright costs, (b) mobile handset costs and (c) mobile access and interconnect costs. For additional information regarding the changes in our programming and other direct costs of services, see Discussion and Analysis of our Reportable Segments — Programming and Other Direct Costs of Services of our Reportable Segments above.
Other operating expenses
Our other operating expenses decreased $120.6 million during 2015, as compared to 2014. This decrease includes (i) an increase of $245.0 million attributable to the impact of the Ziggo Acquisition, the Choice Acquisition and other less significant acquisitions and (ii) a decrease of $4.8 million attributable to the U.K. Non-Cable Disposal and another less significant disposition. Our other operating expenses include share-based compensation expense, which decreased $4.2 million during 2015 as compared to 2014. For additional information, see the discussion under Share-based compensation expense below. Excluding the effects of acquisitions, dispositions, FX and share-based compensation expense, our other operating expenses increased $7.0 million or 0.2% during 2015, as compared to 2014. This increase is primarily attributable to the net effect of (a) an increase in information technology-related costs, (b) a decrease in personnel costs, (c) an increase in outsourced labor and professional fees and (d) a decrease in network-related expenses. Certain of these changes include the impact of a $20.1 million increase in integration-related costs in the Netherlands. For additional information regarding the changes in our other operating expenses, see Discussion and Analysis of our Reportable Segments — Other Operating Expenses of our Reportable Segments above.
SG&A expenses
Our SG&A expenses increased $7.4 million during 2015, as compared to 2014. This increase includes $294.5 million attributable to the impact of the Ziggo Acquisition, the Choice Acquisition and other less significant acquisitions. Our SG&A expenses include share-based compensation expense, which increased $65.2 million during 2015 as compared to 2014. For additional information, see the discussion under Share-based compensation expense below. Excluding the effects of acquisitions, FX and share-based compensation expense, our SG&A expenses increased $33.7 million or 1.1% during 2015, as compared to 2014. This increase is primarily due to the net effect of (i) an increase in outsourced labor and professional fees, including an increase in corporate costs of $19.9 million associated with the Liberty 3.0 initiative, (ii) an increase in personnel costs, (iii) a decrease in external sales and marketing costs and (iv) a decrease in information technology-related expenses. Certain of these changes include the impact of a $9.6 million increase in integration-related costs, primarily in the Netherlands and Belgium. For additional information regarding the changes in our SG&A expenses, see Discussion and Analysis of our Reportable Segments — SG&A Expenses of our Reportable Segments above.
II-64
Share-based compensation expense (included in other operating and SG&A expenses)
A summary of our aggregate share-based compensation expense is set forth below:
Year ended December 31, | |||||||
2015 | 2014 | ||||||
in millions | |||||||
Liberty Global shares: | |||||||
Performance-based incentive awards (a) | $ | 157.1 | $ | 129.9 | |||
Other share-based incentive awards | 149.6 | 99.7 | |||||
Total Liberty Global shares (b) | 306.7 | 229.6 | |||||
Telenet share-based incentive awards (c) | 9.2 | 14.6 | |||||
Other | 2.3 | 13.0 | |||||
Total | $ | 318.2 | $ | 257.2 | |||
Included in: | |||||||
Other operating expense: | |||||||
Liberty Global Group | $ | 3.1 | $ | 4.8 | |||
LiLAC Group | 0.3 | 2.8 | |||||
Total other operating expense | 3.4 | 7.6 | |||||
SG&A expense: | |||||||
Liberty Global Group | 312.7 | 240.8 | |||||
LiLAC Group (b) (d) | 2.1 | 8.8 | |||||
Total SG&A expense | 314.8 | 249.6 | |||||
Total | $ | 318.2 | $ | 257.2 | |||
________________
(a) | Includes share-based compensation expense related to (i) Liberty Global PSUs, (ii) the Challenge Performance Awards and (iii) the PGUs. |
(b) | In connection with the LiLAC Transaction, our compensation committee approved the 2015 Award Modifications (as defined and described in note 13 to our consolidated financial statements) in accordance with the underlying share-based incentive plans. As a result of the 2015 Award Modifications, we recognized $69.3 million of incremental expense during 2015. |
(c) | Represents the share-based compensation expense associated with Telenet’s share-based incentive awards. |
(d) | The amount for 2015 includes the reversal of $1.8 million of share-based compensation expense, primarily related to forfeitures of unvested PSUs during the first quarter of 2015. |
For additional information concerning our share-based compensation, see note 13 to our consolidated financial statements.
Depreciation and amortization expense
The details of our depreciation and amortization expense are as follows:
Year ended December 31, | Increase (decrease) | |||||||||||||
2015 | 2014 | $ | % | |||||||||||
in millions | ||||||||||||||
Liberty Global Group | $ | 5,609.4 | $ | 5,283.4 | $ | 326.0 | 6.2 | |||||||
LiLAC Group | 216.4 | 216.7 | (0.3 | ) | (0.1 | ) | ||||||||
Total | $ | 5,825.8 | $ | 5,500.1 | $ | 325.7 | 5.9 | |||||||
II-65
Excluding the effects of FX, depreciation and amortization expense increased $1,117.8 million or 20.3% during 2015, as compared to 2014. This increase is primarily due to the impact of the Ziggo Acquisition. In addition, a net increase resulted from (i) an increase associated with property and equipment additions related to the installation of customer premises equipment, the expansion and upgrade of our networks and other capital initiatives and (ii) a decrease associated with certain assets becoming fully depreciated, primarily in U.K./Ireland and, to a lesser extent, the Netherlands, Belgium, Germany, Chile and Switzerland/Austria.
Impairment, restructuring and other operating items, net
The details of our impairment, restructuring and other operating items, net, are as follows:
Year ended December 31, | |||||||
2015 | 2014 | ||||||
in millions | |||||||
Liberty Global Group | $ | 154.3 | $ | 516.7 | |||
LiLAC Group | 19.8 | 20.1 | |||||
Total | $ | 174.1 | $ | 536.8 | |||
The total for 2015 includes (i) restructuring charges of $103.8 million, including (a) $102.3 million of employee severance and termination costs related to certain reorganization activities, primarily in the Netherlands, U.K./Ireland, Germany, Switzerland/Austria and Puerto Rico, (b) contract termination charges of $19.3 million, primarily in Belgium, Chile and Puerto Rico, and (c) a credit of $17.0 million recorded by Telenet during the fourth quarter following the settlement of its DTT capacity contract obligations, the fair value of which were originally recorded during 2014 when Telenet discontinued the provision of DTT services, (ii) direct acquisition costs of $49.8 million, primarily related to our acquisition of CWC, Telenet’s acquisition of BASE, our acquisition of additional shares of ITV, the Choice Acquisition and the Ziggo Acquisition, (iii) impairment charges of $24.8 million, primarily in U.K./Ireland, the Netherlands and Switzerland/Austria, and (iv) a $23.1 million loss on the divestiture of our Film1 channels.
The total for 2014 includes (i) direct acquisition costs of $331.3 million, including (a) $222.0 million that was accrued during the fourth quarter in connection with the settlement of certain third-party appeals of the German competition authority’s 2011 decision to approve our acquisition of KBW and (b) $84.1 million associated with the Ziggo Acquisition, (ii) restructuring charges of $166.9 million, including (1) an $86.1 million charge to record the fair value of Telenet’s obligations under certain DTT capacity contracts following Telenet’s decision to discontinue the provision of DTT services on March 31, 2014 and (2) $60.4 million of employee severance and termination costs related to certain reorganization activities, primarily in U.K./Ireland, the Netherlands, Germany, Chile and the European Division’s central operations, and (iii) an impairment charge of $68.7 million that was recorded by Ziggo during the fourth quarter of 2014 to reduce the carrying amount of certain of Ziggo’s internal-use software assets to zero following our determination that these assets would have no future service potential for our combined operations in the Netherlands.
For additional information regarding our restructuring charges, see note 14 to our consolidated financial statements.
Interest expense
The details of our interest expense are as follows:
Year ended December 31, | Increase (decrease) | |||||||||||||
2015 | 2014 | $ | % | |||||||||||
in millions | ||||||||||||||
Liberty Global Group | $ | 2,284.1 | $ | 2,405.1 | $ | (121.0 | ) | (5.0 | ) | |||||
LiLAC Group | 157.9 | 140.4 | 17.5 | 12.5 | ||||||||||
Inter-group eliminations | (0.6 | ) | (0.8 | ) | 0.2 | N.M. | ||||||||
Total | $ | 2,441.4 | $ | 2,544.7 | $ | (103.3 | ) | (4.1 | ) | |||||
_______________
N.M. — Not Meaningful.
II-66
Excluding the effects of FX, interest expense increased $228.5 million or 9.0% during 2015, as compared to 2014. This increase is primarily attributable to the net effect of (i) higher average outstanding debt balances, largely due to debt incurred in connection with the Ziggo Acquisition, and (ii) lower weighted average interest rates related to the completion of certain financing transactions that resulted in extended maturities and net decreases to certain of our interest rates. For additional information regarding our outstanding indebtedness, see note 10 to our consolidated financial statements.
Realized and unrealized gains on derivative instruments, net
The details of our realized and unrealized gains on derivative instruments, net, are as follows:
Year ended December 31, | |||||||
2015 | 2014 | ||||||
in millions | |||||||
Cross-currency and interest rate derivative contracts: | |||||||
Liberty Global Group | $ | 855.7 | $ | 252.5 | |||
LiLAC Group | 217.0 | 41.1 | |||||
Total cross-currency and interest rate derivative contracts (a) | 1,072.7 | 293.6 | |||||
Equity-related derivative instruments - Liberty Global Group: | |||||||
ITV Collar | (222.6 | ) | (77.4 | ) | |||
Sumitomo Collar | (20.3 | ) | (46.0 | ) | |||
Lionsgate Forward | 14.5 | — | |||||
Ziggo Collar (b) | — | (113.3 | ) | ||||
Other | 0.7 | 0.4 | |||||
Total equity-related derivative instruments (c) | (227.7 | ) | (236.3 | ) | |||
Foreign currency forward contracts: | |||||||
Liberty Global Group | (9.0 | ) | 29.0 | ||||
LiLAC Group | 10.3 | 2.6 | |||||
Total foreign currency forward contracts | 1.3 | 31.6 | |||||
Other - Liberty Global Group | 0.9 | (0.1 | ) | ||||
Total Liberty Global Group | 619.9 | 45.1 | |||||
Total LiLAC Group | 227.3 | 43.7 | |||||
Total | $ | 847.2 | $ | 88.8 | |||
_______________
(a) | The gain during 2015 is primarily attributable to the net effect of (i) gains associated with decreases in the values of the euro, British pound sterling and Chilean peso relative to the U.S. dollar, (ii) losses associated with an increase in the value of the Swiss franc relative to the euro and (iii) gains associated with increases in market interest rates in the Chilean peso market. In addition, the gain during 2015 includes a net loss of $9.3 million resulting from changes in our credit risk valuation adjustments. The gain during 2014 is primarily attributable to the net effect of (a) gains associated with decreases in the values of the euro, British pound sterling, Chilean peso and Swiss franc relative to the U.S. dollar, (b) losses associated with decreases in market interest rates in the euro, British pound sterling, Swiss franc and Chilean peso markets and (c) gains associated with decreases in the values of the Hungarian forint and Polish zloty relative to the euro. In addition, the gain during 2014 includes a net loss of $120.9 million resulting from changes in our credit risk valuation adjustments. |
(b) | Upon completion of the Ziggo Acquisition, the Ziggo Collar was terminated. |
(c) | For information concerning the factors that impact the valuations of our equity-related derivative instruments, see note 8 to our consolidated financial statements. |
For additional information concerning our derivative instruments, see notes 7 and 8 to our consolidated financial statements and Quantitative and Qualitative Disclosures about Market Risk below.
II-67
Foreign currency transaction losses, net
The details of our foreign currency transaction losses, net, are as follows:
Year ended December 31, | |||||||
2015 | 2014 | ||||||
in millions | |||||||
Liberty Global Group: | |||||||
U.S. dollar denominated debt issued by euro functional currency entities | $ | (715.7 | ) | $ | (481.5 | ) | |
U.S. dollar denominated debt issued by a British pound sterling functional currency entity | (210.0 | ) | (175.1 | ) | |||
British pound sterling denominated debt issued by a U.S. dollar functional currency entity | 89.6 | 59.6 | |||||
Intercompany payables and receivables denominated in a currency other than the entity’s functional currency (a) | (98.4 | ) | (358.8 | ) | |||
Euro denominated debt issued by a British pound sterling functional currency entity | 8.1 | — | |||||
Cash and restricted cash denominated in a currency other than the entity’s functional currency | 22.9 | 27.5 | |||||
Yen denominated debt issued by a U.S. dollar functional currency entity | 2.0 | 109.2 | |||||
Euro denominated debt issued by a U.S. dollar functional currency entity | — | 72.2 | |||||
Other | (24.3 | ) | 8.3 | ||||
Total Liberty Global Group | (925.8 | ) | (738.6 | ) | |||
LiLAC Group: | |||||||
U.S. dollar denominated debt issued by a Chilean peso functional currency entity | (215.8 | ) | (137.1 | ) | |||
Intercompany payables and receivables denominated in a currency other than the entity’s functional currency (b) | 0.9 | 47.2 | |||||
Other | (8.5 | ) | (8.0 | ) | |||
Total LiLAC Group | (223.4 | ) | (97.9 | ) | |||
Total | $ | (1,149.2 | ) | $ | (836.5 | ) | |
_______________
(a) | Amounts primarily relate to (i) loans between certain of our non-operating and operating subsidiaries in Europe, which generally are denominated in the currency of the applicable operating subsidiary, and (ii) loans between certain of our non-operating subsidiaries in the U.S. and Europe. |
(b) | Amounts primarily relate to loans between certain of our subsidiaries in Europe and Chile. |
For information regarding how we manage our exposure to foreign currency risk, see Quantitative and Qualitative Disclosures about Market Risk — Foreign Currency Risk below.
Realized and unrealized gains (losses) due to changes in fair values of certain investments and debt, net
All of our investments that we account for using the fair value method are attributed to the Liberty Global Group. The details of our realized and unrealized gains (losses) due to changes in fair values of certain investments and debt, net, are as follows:
Year ended December 31, | |||||||
2015 | 2014 | ||||||
in millions | |||||||
Investments (a): | |||||||
ITV | $ | 165.6 | $ | 54.9 | |||
Lionsgate | (33.2 | ) | — | ||||
ITI Neovision | (17.0 | ) | 20.5 | ||||
Sumitomo | (2.0 | ) | (99.8 | ) | |||
Ziggo | — | 224.0 | |||||
Other, net | 11.1 | 5.6 | |||||
Total | $ | 124.5 | $ | 205.2 | |||
II-68
_______________
(a) | For additional information regarding our investments and fair value measurements, see notes 6 and 8, respectively, to our consolidated financial statements. |
Losses on debt modification and extinguishment, net
The details of our losses on debt modification and extinguishment are as follows:
Year ended December 31, | |||||||
2015 | 2014 | ||||||
in millions | |||||||
Liberty Global Group | $ | (388.0 | ) | $ | (174.4 | ) | |
LiLAC Group | — | (11.8 | ) | ||||
Total | $ | (388.0 | ) | $ | (186.2 | ) | |
The loss during 2015 is attributable to (i) the payment of $310.8 million of redemption premiums, (ii) the write-off of $66.1 million of deferred financing costs, (iii) the write-off of $10.3 million of net unamortized discounts and (iv) the payment of $0.8 million of third-party costs.
The loss during 2014 is attributable to (i) the payment of $265.6 million of redemption premiums, (ii) the write-off of $146.9 million of net unamortized premiums, (iii) the write-off of $60.4 million of deferred financing costs and (iv) the payment of $7.1 million of third-party costs.
For additional information concerning our losses on debt modification and extinguishment, net, see note 10 to our consolidated financial statements.
Other income (expense), net
The details of our other income (expense), net are as follows:
Year ended December 31, | |||||||
2015 | 2014 | ||||||
in millions | |||||||
Liberty Global Group | $ | (24.5 | ) | $ | (12.0 | ) | |
LiLAC Group | (1.8 | ) | 2.1 | ||||
Inter-group eliminations | (0.6 | ) | (0.8 | ) | |||
Total | $ | (26.9 | ) | $ | (10.7 | ) | |
The total 2015 and 2014 amounts include (i) expense of $56.8 million and $28.1 million, respectively, representing our share of the results of affiliates and (ii) interest and dividend income of $35.9 million and $31.7 million, respectively. For additional information regarding our equity method investments, see note 6 to our consolidated financial statements.
Income tax benefit (expense)
The details of our income tax benefit (expense) are as follows:
Year ended December 31, | |||||||
2015 | 2014 | ||||||
in millions | |||||||
Liberty Global Group | $ | (324.3 | ) | $ | 89.4 | ||
LiLAC Group | (40.6 | ) | (14.4 | ) | |||
Total | $ | (364.9 | ) | $ | 75.0 | ||
II-69
The income tax expense during 2015 differs from the expected income tax benefit of $136.9 million (based on the U.K. statutory income tax rate of 20.0%) primarily due to the net negative impact of (i) an increase in valuation allowances, (ii) a reduction in net deferred tax assets in the U.K. due to enacted changes in tax law and (iii) certain permanent differences between the financial and tax accounting treatment of items associated with investments in subsidiaries and affiliates. The net negative impact of these items was partially offset by the net positive impact of (a) the tax effect of intercompany financing and (b) statutory tax rates in certain jurisdictions in which we operate that are different than the U.K. statutory income tax rate.
The income tax benefit during 2014 differs from the expected income tax benefit of $221.7 million (based on the U.K. statutory income tax rate of 21.0%) primarily due to the net negative impact of (i) an increase in valuation allowances, (ii) certain permanent differences between the financial and tax accounting treatment of interest and other items and (iii) certain permanent differences between the financial and tax accounting treatment of items associated with investments in subsidiaries. The net negative impact of these items was partially offset by the net positive impact of (a) statutory tax rates in certain jurisdictions in which we operate that are different than the U.K. statutory income tax rate, (b) the tax effect of intercompany financing, (c) non-deductible or non-taxable foreign currency exchange results and (d) the recognition of previously unrecognized tax benefits.
For additional information concerning our income taxes, see note 11 to our consolidated financial statements.
Earnings (loss) from continuing operations
The details of our earnings (loss) from continuing operations are as follows:
Year ended December 31, | |||||||
2015 | 2014 | ||||||
in millions | |||||||
Liberty Global Group | $ | (1,101.2 | ) | $ | (990.6 | ) | |
LiLAC Group | 51.7 | 9.7 | |||||
Total | $ | (1,049.5 | ) | $ | (980.9 | ) | |
Our earnings (loss) from continuing operations consists of (i) operating income of $2,349.2 million and $2,228.2 million, respectively, (ii) net non-operating expense of $3,033.8 million and $3,284.1 million, respectively, and (iii) income tax benefit (expense) of ($364.9 million) and $75.0 million, respectively.
Discontinued operation
Our earnings from discontinued operation, net of taxes, of $0.8 million during 2014 relate to the operations of the Chellomedia Disposal Group. In addition, we recognized an after-tax gain on the disposal of a discontinued operation of $332.7 million related to the January 31, 2014 completion of the Chellomedia Transaction. For additional information, see note 5 to our consolidated financial statements.
Net earnings attributable to noncontrolling interests
The details of our net earnings attributable to noncontrolling interests are as follows:
Year ended December 31, | |||||||||||
2015 | 2014 | Increase | |||||||||
in millions | |||||||||||
Liberty Global Group | $ | 95.2 | $ | 49.9 | $ | 45.3 | |||||
LiLAC Group | 7.8 | (2.3 | ) | 10.1 | |||||||
Total | $ | 103.0 | $ | 47.6 | $ | 55.4 | |||||
The increase in net earnings attributable to noncontrolling interests during 2015, as compared to 2014, is primarily attributable to the results of operations of Telenet.
II-70
Liquidity and Capital Resources
Sources and Uses of Cash
We are a holding company that is dependent on the capital resources of our subsidiaries to satisfy our liquidity requirements at the corporate level. Each of our significant operating subsidiaries is included within one of our seven primary subsidiary “borrowing groups.” These borrowing groups include the respective restricted parent and subsidiary entities within Virgin Media, Unitymedia, UPC Holding, Telenet, CWC, VTR Finance and Liberty Puerto Rico. Our borrowing groups, which typically generate cash from operating activities, accounted for a significant portion of our consolidated cash and cash equivalents at December 31, 2016. The terms of the instruments governing the indebtedness of these borrowing groups may restrict our ability to access the liquidity of these subsidiaries. In addition, our ability to access the liquidity of these and other subsidiaries may be limited by tax and legal considerations, the presence of noncontrolling interests, foreign currency exchange restrictions with respect to certain CWC subsidiaries and other factors.
Cash and cash equivalents
The details of the U.S. dollar equivalent balances of our consolidated cash and cash equivalents at December 31, 2016 are set forth in the following table (in millions):
Cash and cash equivalents held by: | |||
Liberty Global and unrestricted subsidiaries: | |||
Liberty Global (a) | $ | 58.9 | |
Unrestricted subsidiaries: | |||
Liberty Global Group (b) (c) | 854.9 | ||
LiLAC Group (d) | 77.9 | ||
Total Liberty Global and unrestricted subsidiaries | 991.7 | ||
Borrowing groups (e): | |||
CWC (f) | 271.2 | ||
VTR Finance | 125.0 | ||
Telenet | 104.6 | ||
Liberty Puerto Rico | 78.5 | ||
UPC Holding | 28.2 | ||
Virgin Media (c) | 27.1 | ||
Unitymedia | 2.9 | ||
Total borrowing groups | 637.5 | ||
Total cash and cash equivalents | $ | 1,629.2 | |
Liberty Global Group | $ | 1,076.6 | |
LiLAC Group | 552.6 | ||
Total cash and cash equivalents | $ | 1,629.2 | |
_______________
(a) | Represents the amount held by Liberty Global on a standalone basis, which is attributed to the Liberty Global Group. |
(b) | Represents the aggregate amount held by subsidiaries attributed to the Liberty Global Group that are outside of our borrowing groups. |
(c) | The Virgin Media borrowing group includes certain subsidiaries of Virgin Media, but excludes Virgin Media. The $0.2 million of cash and cash equivalents held by Virgin Media is included in the amount shown for the Liberty Global Group’s unrestricted subsidiaries. |
(d) | Represents the aggregate amount held by subsidiaries attributed to the LiLAC Group that are outside of our borrowing groups. |
II-71
(e) | Except as otherwise noted, represents the aggregate amounts held by the parent entity and restricted subsidiaries of our borrowing groups. |
(f) | CWC's subsidiaries hold substantially all of CWC's consolidated cash. The ability of certain of these subsidiaries to loan or distribute their cash to CWC is limited by foreign exchange restrictions, the existence of noncontrolling interests, tax considerations and restrictions contained within the debt agreements of certain CWC subsidiaries. As a result, a significant portion of the cash held by CWC subsidiaries is not considered to be an immediate source of corporate liquidity for CWC. |
Liquidity of Liberty Global and its unrestricted subsidiaries
The $58.9 million of cash and cash equivalents held by Liberty Global and, subject to certain tax and legal considerations, the $932.8 million of aggregate cash and cash equivalents held by the unrestricted subsidiaries attributed to the Liberty Global Group and the LiLAC Group, represented available liquidity at the corporate level at December 31, 2016. Our remaining cash and cash equivalents of $637.5 million at December 31, 2016 were held by our borrowing groups as set forth in the table above. As noted above, various factors may limit our ability to access the cash of our borrowing groups. For information regarding certain limitations imposed by our subsidiaries’ debt instruments at December 31, 2016, see note 10 to our consolidated financial statements.
Our current sources of corporate liquidity include (i) cash and cash equivalents held by Liberty Global and, subject to certain tax and legal considerations, Liberty Global’s unrestricted subsidiaries, and (ii) interest and dividend income received on our and, subject to certain tax and legal considerations, our unrestricted subsidiaries’ cash and cash equivalents and investments. In addition, our parent entity’s short-term liquidity is supplemented by interest payments that it receives on a note receivable from one of our unrestricted subsidiaries (outstanding principal of $9.6 billion at December 31, 2016, all outstanding principal due in 2021).
From time to time, Liberty Global and its unrestricted subsidiaries may also receive (i) proceeds in the form of distributions or loan repayments from Liberty Global’s borrowing groups or affiliates (including amounts from the Dutch JV beginning in 2017) upon (a) the completion of recapitalizations, refinancings, asset sales or similar transactions by these entities or (b) the accumulation of excess cash from operations or other means, (ii) proceeds upon the disposition of investments and other assets of Liberty Global and its unrestricted subsidiaries and (iii) proceeds in connection with the incurrence of debt by Liberty Global or its unrestricted subsidiaries or the issuance of equity securities by Liberty Global, including equity securities issued to satisfy subsidiary obligations. No assurance can be given that any external funding would be available to Liberty Global or its unrestricted subsidiaries on favorable terms, or at all. On January 4, 2017, in connection with the completion of the Dutch JV Transaction, our company received cash of €2.2 billion ($2.3 billion at the transaction date). For additional information, see note 5 to our consolidated financial statements.
The amount of cash we receive from our subsidiaries to satisfy U.S. dollar-denominated liquidity requirements is impacted by fluctuations in exchange rates, particularly with regard to the translation of British pounds sterling and euros into U.S. dollars. In this regard, the strengthening (weakening) of the U.S. dollar against these currencies will result in decreases (increases) in the U.S. dollars received from the applicable subsidiaries to fund the repurchase of our equity securities and other U.S. dollar-denominated liquidity requirements. The U.S. dollar has significantly strengthened against the British pound sterling during the period following Brexit.
At December 31, 2016, our consolidated cash and cash equivalents balance includes $1,548.1 million held by entities that are domiciled outside of the U.K. Based on our assessment of our ability to access the liquidity of our subsidiaries on a tax efficient basis and our expectations with respect to our corporate liquidity requirements, we do not anticipate that tax considerations will adversely impact our corporate liquidity over the next 12 months. Our ability to access the liquidity of our subsidiaries on a tax efficient basis is a consideration in assessing the extent of our share repurchase programs.
Our corporate liquidity requirements include (i) corporate general and administrative expenses, (ii) interest payments on the Sumitomo Collar Loan and Sumitomo Share Loan and (iii) principal payments on the ITV Collar Loan, the Sumitomo Collar Loan, the Sumitomo Share Loan and the Lionsgate Loan to the extent not settled through the delivery of the underlying shares. Liberty Global and its unrestricted subsidiaries may also require cash in connection with (a) the repayment of third-party and intercompany debt, (b) the satisfaction of contingent liabilities, (c) acquisitions, (d) the repurchase of equity and debt securities, (e) other investment opportunities or (f) income tax payments. In addition, our parent entity uses available liquidity to make interest and principal payments on notes payable to certain of our unrestricted subsidiaries (aggregate outstanding principal of $5,764.6 million at December 31, 2016 and no stated maturity). For information regarding our commitments and contingencies, see note 17 to our consolidated financial statements.
II-72
As a U.K. incorporated company, we may only elect to repurchase shares or pay dividends to the extent of our “Distributable Reserves.” Distributable Reserves, which are not linked to a U.S. GAAP reported amount, may be created through the earnings of the U.K. parent company and, among other methods, through a reduction in share premium approved by the English Companies Court. Based on the amounts set forth in our 2015 U.K. Companies Act Report dated April 25, 2016, which are our most recent “Relevant Accounts” for the purposes of determining our Distributable Reserves under U.K. law, our Distributable Reserves were $27.9 billion as of December 31, 2015. This amount does not reflect earnings, share repurchases or other activity that occurred in 2016, each of which impacts the amount of our Distributable Reserves.
During 2016, we repurchased Liberty Global Shares and LiLAC Shares for an aggregate purchase price of $2,068.0 million and $21.5 million, respectively, including direct acquisition costs and the effects of derivative instruments. At December 31, 2016, the remaining amount authorized for repurchases of Liberty Global Shares and LiLAC Shares was $1,943.4 million and $278.6 million, respectively. Purchases of Liberty Global Shares and LiLAC Shares will be funded by the respective liquidity of the Liberty Global Group and the LiLAC Group. Subsequent to December 31, 2016, our board of directors increased the amount authorized under the share repurchase program for our Liberty Global Shares by $1.0 billion. For additional information regarding our share repurchase programs, see note 12 to our consolidated financial statements.
Liquidity of borrowing groups
The cash and cash equivalents of our borrowing groups are detailed in the table above. In addition to cash and cash equivalents, the primary sources of liquidity of our borrowing groups are cash provided by operations and borrowing availability under their respective debt instruments. For the details of the borrowing availability of such entities at December 31, 2016, see note 10 to our consolidated financial statements. The aforementioned sources of liquidity may be supplemented in certain cases by contributions and/or loans from Liberty Global and its unrestricted subsidiaries. The liquidity of our borrowing groups generally is used to fund property and equipment additions, debt service requirements and income tax payments. From time to time, our borrowing groups may also require liquidity in connection with (i) acquisitions and other investment opportunities, (ii) loans to Liberty Global, (iii) capital distributions to Liberty Global and other equity owners or (iv) the satisfaction of contingent liabilities. No assurance can be given that any external funding would be available to our borrowing groups on favorable terms, or at all. For information regarding our borrowing groups’ commitments and contingencies, see note 17 to our consolidated financial statements.
For additional information regarding our consolidated cash flows, see the discussion under Consolidated Statements of Cash Flows below.
Capitalization
We seek to maintain our debt at levels that provide for attractive equity returns without assuming undue risk. In this regard, we generally seek to cause our operating subsidiaries to maintain their debt at levels that result in a consolidated debt balance (excluding the ITV Collar Loan, Sumitomo Collar Loan, the Sumitomo Share Loan and the Lionsgate Loan and measured using subsidiary debt figures at swapped foreign currency exchange rates, consistent with the covenant calculation requirements of our subsidiary debt agreements) that is between four and five times our consolidated Adjusted OIBDA, although it should be noted that the timing of our acquisitions and financing transactions and the interplay of average and spot foreign currency rates may impact this ratio. The ratio of our December 31, 2016 consolidated debt to our annualized consolidated Adjusted OIBDA for the quarter ended December 31, 2016 was 4.8x. In addition, the ratio of our December 31, 2016 consolidated net debt (debt, as defined above, less cash and cash equivalents) to our annualized consolidated Adjusted OIBDA for the quarter ended December 31, 2016 was 4.6x. As adjusted for the cash we received on January 4, 2017 in connection with the completion of the Dutch JV Transaction, our consolidated net debt to our annualized consolidated Adjusted OIBDA for the quarter ended December 31, 2016 would be 4.3x. The leverage ratios provided in this paragraph exclude the Adjusted OIBDA of Ziggo Group Holding, as our December 31, 2016 consolidated debt does not include the debt associated with this entity. For information on the formation of the Dutch JV, see note 5.
When it is cost effective, we generally seek to match the denomination of the borrowings of our subsidiaries with the functional currency of the operations that support the respective borrowings. As further discussed under Quantitative and Qualitative Disclosures about Market Risk below and in note 7 to our consolidated financial statements, we also use derivative instruments to mitigate foreign currency and interest rate risk associated with our debt instruments.
Our ability to service or refinance our debt and to maintain compliance with the leverage covenants in the credit agreements and indentures of our borrowing groups is dependent primarily on our ability to maintain or increase the Adjusted OIBDA of our operating subsidiaries and to achieve adequate returns on our property and equipment additions and acquisitions. In addition, our ability to obtain additional debt financing is limited by the leverage covenants contained in the various debt instruments of our borrowing groups. For example, if the Adjusted OIBDA of UPC Broadband Holding were to decline, we could be required to
II-73
partially repay or limit our borrowings under the UPC Broadband Holding Bank Facility in order to maintain compliance with applicable covenants. No assurance can be given that we would have sufficient sources of liquidity, or that any external funding would be available on favorable terms, or at all, to fund any such required repayment. At December 31, 2016, each of our borrowing groups was in compliance with its debt covenants. In addition, we do not anticipate any instances of non-compliance with respect to the debt covenants of our borrowing groups that would have a material adverse impact on our liquidity during the next 12 months.
At December 31, 2016, the outstanding principal amount of our consolidated debt, together with our capital lease obligations, aggregated $43.6 billion, including $2,775.1 million that is classified as current in our consolidated balance sheet and $38.5 billion that is not due until 2021 or thereafter. For additional information concerning our debt maturities, see note 10 to our consolidated financial statements.
Notwithstanding our negative working capital position at December 31, 2016, we believe that we have sufficient resources to repay or refinance the current portion of our debt and capital lease obligations and to fund our foreseeable liquidity requirements during the next 12 months. However, as our maturing debt grows in later years, we anticipate that we will seek to refinance or otherwise extend our debt maturities. No assurance can be given that we will be able to complete these refinancing transactions or otherwise extend our debt maturities. In this regard, it is not possible to predict how political and economic conditions, sovereign debt concerns or any adverse regulatory developments could impact the credit and equity markets we access and, accordingly, our future liquidity and financial position. Our ability to access debt financing on favorable terms, or at all, could be adversely impacted by (i) the financial failure of any of our counterparties which could (a) reduce amounts available under committed credit facilities and (b) adversely impact our ability to access cash deposited with any failed financial institution and (ii) tightening of the credit markets. In addition, any weakness in the equity markets could make it less attractive to use our shares to satisfy contingent or other obligations, and sustained or increased competition, particularly in combination with adverse economic or regulatory developments, could have an unfavorable impact on our cash flows and liquidity.
All of our consolidated debt and capital lease obligations have been borrowed or incurred by our subsidiaries at December 31, 2016.
For additional information concerning our debt and capital lease obligations, see note 10 to our consolidated financial statements.
Consolidated Statements of Cash Flows
General. Our cash flows are subject to significant variations due to FX. See related discussion under Quantitative and Qualitative Disclosures about Market Risk — Foreign Currency Risk below.
Consolidated Statements of Cash Flows — 2016 compared to 2015
Summary. Our consolidated statements of cash flows for 2016 and 2015 are summarized as follows:
Year ended December 31, | |||||||||||
2016 | 2015 | Change | |||||||||
in millions | |||||||||||
Net cash provided by operating activities | $ | 5,935.5 | $ | 5,705.8 | $ | 229.7 | |||||
Net cash used by investing activities | (3,917.7 | ) | (3,829.4 | ) | (88.3 | ) | |||||
Net cash used by financing activities | (1,385.7 | ) | (2,037.8 | ) | 652.1 | ||||||
Effect of exchange rate changes on cash | 15.0 | (15.0 | ) | 30.0 | |||||||
Net increase (decrease) in cash and cash equivalents | $ | 647.1 | $ | (176.4 | ) | $ | 823.5 | ||||
II-74
Operating Activities. Our net cash flows from operating activities are as follows:
Year ended December 31, | |||||||||||
2016 | 2015 | Change | |||||||||
in millions | |||||||||||
Net cash provided by operating activities: | |||||||||||
Liberty Global Group | $ | 5,467.3 | $ | 5,399.3 | $ | 68.0 | |||||
LiLAC Group | 468.2 | 306.5 | 161.7 | ||||||||
Total | $ | 5,935.5 | $ | 5,705.8 | $ | 229.7 | |||||
The increase in total net cash provided by our operating activities is primarily attributable to the net effect of (i) an increase in the cash provided by our Adjusted OIBDA and related working capital items, primarily due to the impact of the CWC Acquisition, (ii) a decrease in cash provided due to higher payments of interest, (iii) an increase in cash provided due to higher cash receipts related to derivative instruments and (iv) a decrease in cash provided due to higher payments for taxes.
Investing Activities. Our net cash flows from investing activities are as follows:
Year ended December 31, | |||||||||||
2016 | 2015 | Change | |||||||||
in millions | |||||||||||
Net cash used by investing activities: | |||||||||||
Liberty Global Group | $ | (3,475.2 | ) | $ | (3,429.0 | ) | $ | (46.2 | ) | ||
LiLAC Group | (441.1 | ) | (490.6 | ) | 49.5 | ||||||
Inter-group eliminations | (1.4 | ) | 90.2 | (91.6 | ) | ||||||
Total | $ | (3,917.7 | ) | $ | (3,829.4 | ) | $ | (88.3 | ) | ||
The increase in total net cash used by our investing activities is primarily attributable to the net effect of (i) an increase in cash used of $998.7 million associated with higher cash paid in connection with acquisitions, (ii) a decrease in cash used of $858.7 million associated with lower cash paid related to investments in and loans to affiliates and others, (iii) $147.3 million of cash proceeds received from the sale of investments and (iv) an increase in cash used of $144.8 million due to higher capital expenditures. Capital expenditures increased from $2,499.5 million during 2015 to $2,644.3 million during 2016 due to the net effect of (a) an increase resulting from acquisitions, (b) a decrease resulting from FX and (c) a net increase in the local currency capital expenditures of our subsidiaries, including a decrease associated with higher capital-related vendor financing.
II-75
The capital expenditures that we report in our consolidated statements of cash flows do not include amounts that are financed under capital-related vendor financing or capital lease arrangements. Instead, these amounts are reflected as non-cash additions to our property and equipment when the underlying assets are delivered and as repayments of debt when the principal is repaid. In this discussion, we refer to (i) our capital expenditures as reported in our consolidated statements of cash flows, which exclude amounts financed under capital-related vendor financing or capital lease arrangements, and (ii) our total property and equipment additions, which include our capital expenditures on an accrual basis and amounts financed under capital-related vendor financing or capital lease arrangements. For further details regarding our property and equipment additions, see note 18 to our consolidated financial statements. A reconciliation of our consolidated property and equipment additions to our consolidated capital expenditures, as reported in our consolidated statements of cash flows, is set forth below:
Year ended December 31, | |||||||||||||||||||||||
2016 | 2015 | ||||||||||||||||||||||
Liberty Global Group | LiLAC Group | Total | Liberty Global Group | LiLAC Group | Total | ||||||||||||||||||
in millions | |||||||||||||||||||||||
Property and equipment additions | $ | 4,638.6 | $ | 568.2 | $ | 5,206.8 | $ | 3,910.2 | $ | 227.1 | $ | 4,137.3 | |||||||||||
Assets acquired under capital-related vendor financing arrangements | (2,018.7 | ) | (45.5 | ) | (2,064.2 | ) | (1,481.5 | ) | — | (1,481.5 | ) | ||||||||||||
Assets acquired under capital leases | (104.2 | ) | (7.4 | ) | (111.6 | ) | (106.1 | ) | — | (106.1 | ) | ||||||||||||
Changes in current liabilities related to capital expenditures | (361.8 | ) | (24.9 | ) | (386.7 | ) | (50.3 | ) | 0.1 | (50.2 | ) | ||||||||||||
Capital expenditures | $ | 2,153.9 | $ | 490.4 | $ | 2,644.3 | $ | 2,272.3 | $ | 227.2 | $ | 2,499.5 | |||||||||||
The property and equipment additions attributable to the Liberty Global Group are primarily related to the European Division, which accounted for $4,619.1 million and $3,844.3 million of Liberty Global Group’s property and equipment additions during 2016 and 2015, respectively. The increase in the European Division’s property and equipment additions is due to the net effect of (i) an increase in expenditures for new build and upgrade projects, (ii) an increase in expenditures for support capital, such as information technology upgrades and general support systems, (iii) a decrease due to FX, (iv) an increase due to the impact of the BASE Acquisition and (v) an increase in expenditures for the purchase and installation of customer premises equipment. During 2016 and 2015, the European Division’s property and equipment additions represented 26.8% and 22.6% of its revenue, respectively.
Property and equipment additions attributable to the LiLAC Group increased during 2016 as compared to 2015, primarily due to the net effect of (i) an increase due to the impact of the CWC Acquisition, (ii) an increase in expenditures for the purchase and installation of customer premises equipment, (iii) an increase in expenditures for new build and upgrade projects, (iv) an increase in expenditures for support capital, such as information technology upgrades and general support systems, and (v) a decrease due to FX. During 2016 and 2015, the LiLAC Group’s property and equipment additions represented 20.9% and 18.7% of its revenue, respectively.
We expect the percentage of revenue represented by our aggregate 2017 property and equipment additions to range from 29% to 31% for the Liberty Global Group and 21% to 23% for the LiLAC Group. The increases in these percentages, as compared to the corresponding 2016 percentages, are primarily attributable to anticipated increases in expenditures associated with the Network Extensions. For additional information regarding the Network Extensions, see Overview above. The actual amount of the 2017 property and equipment additions of the Liberty Global Group and the LiLAC Group may vary from expected amounts for a variety of reasons, including (a) changes in (1) the competitive or regulatory environment, (2) business plans, (3) our expected future operating results or (4) foreign currency exchange rates and (b) the availability of sufficient capital. Accordingly, no assurance can be given that our actual property and equipment additions will not vary materially from our expectations.
II-76
Financing Activities. Our net cash flows from financing activities are as follows:
Year ended December 31, | |||||||||||
2016 | 2015 | Change | |||||||||
in millions | |||||||||||
Net cash used by financing activities: | |||||||||||
Liberty Global Group | $ | (1,634.4 | ) | $ | (2,311.3 | ) | $ | 676.9 | |||
LiLAC Group | 247.3 | 363.7 | (116.4 | ) | |||||||
Inter-group eliminations | 1.4 | (90.2 | ) | 91.6 | |||||||
Total | $ | (1,385.7 | ) | $ | (2,037.8 | ) | $ | 652.1 | |||
The decrease in total net cash used by our financing activities is primarily attributable to the net effect of (i) a decrease in cash used of $352.2 million due to lower cash payments associated with the repurchase of Liberty Global ordinary shares, (ii) an increase in cash used of $212.6 million related to lower net borrowings of debt, (iii) a decrease in cash used of $169.4 million due to lower payments for financing costs, debt premiums and exchange offer consideration, (iv) a decrease in cash used of $162.4 million due to changes in cash collateral, (v) a decrease in cash used of $142.4 million related to lower purchases of additional shares of our subsidiaries and (vi) a decrease in cash used of $87.5 million associated with call option contracts on Liberty Global ordinary shares.
Consolidated Statements of Cash Flows — 2015 compared to 2014
All of the cash flows discussed below are those of our continuing operations.
Summary. Our consolidated statements of cash flows for 2015 and 2014 are summarized as follows:
Year ended December 31, | |||||||||||
2015 | 2014 | Change | |||||||||
in millions | |||||||||||
Net cash provided by operating activities | $ | 5,705.8 | $ | 5,612.8 | $ | 93.0 | |||||
Net cash used by investing activities | (3,829.4 | ) | (2,799.6 | ) | (1,029.8 | ) | |||||
Net cash used by financing activities | (2,037.8 | ) | (4,260.1 | ) | 2,222.3 | ||||||
Effect of exchange rate changes on cash | (15.0 | ) | (81.9 | ) | 66.9 | ||||||
Net decrease in cash and cash equivalents | $ | (176.4 | ) | $ | (1,528.8 | ) | $ | 1,352.4 | |||
Operating Activities. Our net cash flows from operating activities are as follows:
Year ended December 31, | |||||||||||
2015 | 2014 | Change | |||||||||
in millions | |||||||||||
Net cash provided by operating activities: | |||||||||||
Liberty Global Group | $ | 5,399.3 | $ | 5,323.8 | $ | 75.5 | |||||
LiLAC Group | 306.5 | 289.0 | 17.5 | ||||||||
Total | $ | 5,705.8 | $ | 5,612.8 | $ | 93.0 | |||||
The increase in total net cash provided by our operating activities is primarily attributable to the net effect of (i) an increase in the cash provided by our Adjusted OIBDA and related working capital items, largely due to the impact of the Ziggo Acquisition, (ii) a decrease in the reported net cash provided by operating activities due to FX, (iii) a decrease in cash provided due to higher cash payments for taxes, (iv) an increase in cash provided due to lower cash payments related to derivative instruments and (v) a decrease in cash provided due to higher cash payments for interest.
II-77
Investing Activities. Our net cash flows from investing activities are as follows:
Year ended December 31, | |||||||||||
2015 | 2014 | Change | |||||||||
in millions | |||||||||||
Net cash used by investing activities: | |||||||||||
Liberty Global Group | $ | (3,429.0 | ) | $ | (2,134.7 | ) | $ | (1,294.3 | ) | ||
LiLAC Group | (490.6 | ) | (232.2 | ) | (258.4 | ) | |||||
Inter-group eliminations | 90.2 | (432.7 | ) | 522.9 | |||||||
Total | $ | (3,829.4 | ) | $ | (2,799.6 | ) | $ | (1,029.8 | ) | ||
The increase in total net cash used by our investing activities is primarily attributable to the net effect of (i) a decrease in cash of $988.5 million associated with cash proceeds received during 2014 in connection with the Chellomedia Transaction, (ii) an increase in cash used of $312.5 million associated with higher cash paid in connection with acquisitions and (iii) a decrease in cash used of $184.9 million due to lower capital expenditures. Capital expenditures decreased from $2,684.4 million during 2014 to $2,499.5 million during 2015 due to the net effect of (a) an increase related to the Ziggo Acquisition, (b) a decrease due to FX and (c) a net decrease in the local currency capital expenditures of our subsidiaries, primarily due to an increase in capital-related vendor financing during 2015 as compared to 2014.
A reconciliation of our consolidated property and equipment additions to our consolidated capital expenditures as reported in our consolidated statements of cash flows is set forth below:
Year ended December 31, | |||||||||||||||||||||||
2015 | 2014 | ||||||||||||||||||||||
Liberty Global Group | LiLAC Group | Total | Liberty Global Group | LiLAC Group | Total | ||||||||||||||||||
in millions | |||||||||||||||||||||||
Property and equipment additions | $ | 3,910.2 | $ | 227.1 | $ | 4,137.3 | $ | 3,653.0 | $ | 256.2 | $ | 3,909.2 | |||||||||||
Assets acquired under capital-related vendor financing arrangements | (1,481.5 | ) | — | (1,481.5 | ) | (975.3 | ) | — | (975.3 | ) | |||||||||||||
Assets acquired under capital leases | (106.1 | ) | — | (106.1 | ) | (127.2 | ) | — | (127.2 | ) | |||||||||||||
Changes in current liabilities related to capital expenditures | (50.3 | ) | 0.1 | (50.2 | ) | (89.2 | ) | (33.1 | ) | (122.3 | ) | ||||||||||||
Capital expenditures | $ | 2,272.3 | $ | 227.2 | $ | 2,499.5 | $ | 2,461.3 | $ | 223.1 | $ | 2,684.4 | |||||||||||
The property and equipment additions attributable to the Liberty Global Group are primarily related to the European Division, which accounted for $3,844.3 million and $3,648.0 million of the Liberty Global Group’s property and equipment additions during 2015 and 2014, respectively. The increase in the European Division’s property and equipment additions is due to the net effect of (i) a decrease due to FX, (ii) an increase due to the impact of the Ziggo Acquisition, (iii) an increase in expenditures for new build and upgrade projects to expand service, (iv) an increase in expenditures for support capital, such as information technology upgrades and general support systems, and (v) a decrease in expenditures for the purchase and installation of customer premises equipment. During 2015 and 2014, the European Division’s property and equipment additions represented 22.6% and 21.5% of its revenue, respectively.
Property and equipment additions attributable to the LiLAC Group decreased during 2015, as compared to 2014, primarily due to the net effect of (i) a decrease due to FX, (ii) an increase due to the impact of the Choice Acquisition, (iii) a decrease in expenditures for support capital, such as information technology upgrades and general support systems, (iv) a decrease in expenditures for new build and upgrade projects to expand service and (v) a decrease in expenditures for the purchase and installation of customer premises equipment. During 2015 and 2014, the LiLAC Group’s property and equipment additions represented 18.7% and 21.3% of its revenue, respectively.
II-78
Financing Activities. Our net cash flows from financing activities are as follows:
Year ended December 31, | |||||||||||
2015 | 2014 | Change | |||||||||
in millions | |||||||||||
Net cash used by financing activities: | |||||||||||
Liberty Global Group | $ | (2,311.3 | ) | $ | (4,574.8 | ) | $ | 2,263.5 | |||
LiLAC Group | 363.7 | (118.0 | ) | 481.7 | |||||||
Inter-group eliminations | (90.2 | ) | 432.7 | (522.9 | ) | ||||||
Total | $ | (2,037.8 | ) | $ | (4,260.1 | ) | $ | 2,222.3 | |||
The decrease in total net cash used by our financing activities is primarily attributable to the net effect of (i) a decrease in cash used of $3,092.7 million related to higher net borrowings of debt, (ii) an increase in cash used of $735.6 million due to higher cash payments associated with the repurchase of Liberty Global ordinary shares, (iii) a decrease in cash used of $118.3 million related to a decrease in purchases of additional shares of our subsidiaries, (iv) an increase in cash used of $80.2 million due to higher cash paid related to derivative instruments, (v) an increase in cash used of $43.5 million due to higher payments for financing costs, debt premiums and exchange offer consideration and (vi) an increase in cash used of $36.6 million associated with call option contracts on Liberty Global ordinary shares.
Adjusted Free Cash Flow
We define adjusted free cash flow as net cash provided by our operating activities, plus (i) excess tax benefits related to the exercise of share-based incentive awards, (ii) cash payments for third-party costs directly associated with successful and unsuccessful acquisitions and dispositions and (iii) expenses financed by an intermediary, less (a) capital expenditures, as reported in our consolidated statements of cash flows, (b) principal payments on amounts financed by vendors and intermediaries and (c) principal payments on capital leases (exclusive of the portions of the network lease in Belgium and the duct leases in Germany that we assumed in connection with certain acquisitions), with each item excluding any cash provided or used by our discontinued operations. We believe that our presentation of adjusted free cash flow provides useful information to our investors because this measure can be used to gauge our ability to service debt and fund new investment opportunities. Adjusted free cash flow should not be understood to represent our ability to fund discretionary amounts, as we have various mandatory and contractual obligations, including debt repayments, which are not deducted to arrive at this amount. Investors should view adjusted free cash flow as a supplement to, and not a substitute for, U.S. GAAP measures of liquidity included in our consolidated statements of cash flows.
II-79
The following table provides the details of our adjusted free cash flow:
Year ended December 31, | |||||||||||||||||||||||||||||||||||
2016 | 2015 | 2014 | |||||||||||||||||||||||||||||||||
Liberty Global Group | LiLAC Group | Total | Liberty Global Group | LiLAC Group | Total | Liberty Global Group | LiLAC Group | Total | |||||||||||||||||||||||||||
in millions | |||||||||||||||||||||||||||||||||||
Net cash provided by operating activities of our continuing operations | $ | 5,467.3 | $ | 468.2 | $ | 5,935.5 | $ | 5,399.3 | $ | 306.5 | $ | 5,705.8 | $ | 5,323.8 | $ | 289.0 | $ | 5,612.8 | |||||||||||||||||
Excess tax benefits from share-based compensation (a) | 4.4 | — | 4.4 | 23.0 | 3.7 | 26.7 | 6.9 | 0.1 | 7.0 | ||||||||||||||||||||||||||
Cash payments (receipts) for direct acquisition and disposition costs | 29.3 | 86.0 | 115.3 | 259.3 | 4.9 | 264.2 | 75.3 | 4.4 | 79.7 | ||||||||||||||||||||||||||
Expenses financed by an intermediary (b) | 812.0 | 3.0 | 815.0 | 294.2 | — | 294.2 | 27.5 | — | 27.5 | ||||||||||||||||||||||||||
Capital expenditures | (2,153.9 | ) | (490.4 | ) | (2,644.3 | ) | (2,272.3 | ) | (227.2 | ) | (2,499.5 | ) | (2,461.3 | ) | (223.1 | ) | (2,684.4 | ) | |||||||||||||||||
Principal payments on amounts financed by vendors and intermediaries | (2,074.7 | ) | — | (2,074.7 | ) | (1,125.4 | ) | — | (1,125.4 | ) | (686.9 | ) | — | (686.9 | ) | ||||||||||||||||||||
Principal payments on certain capital leases | (105.5 | ) | (5.2 | ) | (110.7 | ) | (146.0 | ) | (0.8 | ) | (146.8 | ) | (182.5 | ) | (0.8 | ) | (183.3 | ) | |||||||||||||||||
Adjusted free cash flow | $ | 1,978.9 | $ | 61.6 | $ | 2,040.5 | $ | 2,432.1 | $ | 87.1 | $ | 2,519.2 | $ | 2,102.8 | $ | 69.6 | $ | 2,172.4 | |||||||||||||||||
_______________
(a) | Excess tax benefits from share-based compensation represent the excess of tax deductions over the related financial reporting share-based compensation expense. The hypothetical cash flows associated with these excess tax benefits are reported as an increase to cash flows from financing activities and a corresponding decrease to cash flows from operating activities in our consolidated statements of cash flows. |
(b) | For purposes of our consolidated statements of cash flows, expenses financed by an intermediary are treated as hypothetical operating cash outflows and hypothetical financing cash inflows when the expenses are incurred. When we pay the financing intermediary, we record financing cash outflows in our consolidated statements of cash flows. For purposes of our adjusted free cash flow definition, we add back the hypothetical operating cash outflow when these financed expenses are incurred and deduct the financing cash outflows when we pay the financing intermediary. |
II-80
Contractual Commitments
The following table sets forth the U.S. dollar equivalents of our commitments as of December 31, 2016:
Payments due during: | |||||||||||||||||||||||||||
2017 | 2018 | 2019 | 2020 | 2021 | Thereafter | Total | |||||||||||||||||||||
in millions | |||||||||||||||||||||||||||
Debt (excluding interest) | $ | 2,969.4 | $ | 1,169.5 | $ | 556.0 | $ | 201.4 | $ | 3,530.9 | $ | 34,105.0 | $ | 42,532.2 | |||||||||||||
Capital leases (excluding interest) | 133.4 | 113.7 | 87.4 | 80.1 | 79.3 | 748.9 | 1,242.8 | ||||||||||||||||||||
Network and connectivity commitments | 738.8 | 386.9 | 308.9 | 257.4 | 240.6 | 868.2 | 2,800.8 | ||||||||||||||||||||
Programming commitments | 1,041.2 | 900.5 | 457.2 | 183.5 | 62.1 | 93.1 | 2,737.6 | ||||||||||||||||||||
Purchase commitments | 1,236.9 | 212.6 | 145.9 | 102.6 | 21.0 | 70.3 | 1,789.3 | ||||||||||||||||||||
Operating leases | 133.5 | 113.2 | 94.0 | 73.8 | 60.7 | 249.0 | 724.2 | ||||||||||||||||||||
Other commitments | 46.7 | 15.0 | 12.2 | 8.5 | 7.4 | 14.4 | 104.2 | ||||||||||||||||||||
Total (a) | $ | 6,299.9 | $ | 2,911.4 | $ | 1,661.6 | $ | 907.3 | $ | 4,002.0 | $ | 36,148.9 | $ | 51,931.1 | |||||||||||||
Projected cash interest payments on debt and capital lease obligations (b): | |||||||||||||||||||||||||||
Liberty Global Group | $ | 1,749.5 | $ | 1,673.5 | $ | 1,659.8 | $ | 1,654.8 | $ | 1,585.6 | $ | 4,895.5 | $ | 13,218.7 | |||||||||||||
LiLAC Group | 385.9 | 380.6 | 377.8 | 359.0 | 309.8 | 389.1 | 2,202.2 | ||||||||||||||||||||
Total | $ | 2,135.4 | $ | 2,054.1 | $ | 2,037.6 | $ | 2,013.8 | $ | 1,895.4 | $ | 5,284.6 | $ | 15,420.9 | |||||||||||||
_______________
(a) | The commitments included in this table do not reflect any liabilities that are included in our December 31, 2016 consolidated balance sheet other than debt and capital lease obligations. Our liability for uncertain tax positions in the various jurisdictions in which we operate ($358.9 million at December 31, 2016) has been excluded from the table as the amount and timing of any related payments are not subject to reasonable estimation. |
(b) | Amounts are based on interest rates, interest payment dates, commitment fees and contractual maturities in effect as of December 31, 2016. These amounts are presented for illustrative purposes only and will likely differ from the actual cash payments required in future periods. In addition, the amounts presented do not include the impact of our interest rate derivative contracts, deferred financing costs, original issue premiums or discounts. |
For information concerning our debt and capital lease obligations, see note 10 to our consolidated financial statements. For information concerning our commitments, see note 17 to our consolidated financial statements.
In addition to the commitments set forth in the table above, we have significant commitments under (i) derivative instruments and (ii) defined benefit plans and similar agreements, pursuant to which we expect to make payments in future periods. For information regarding projected cash flows associated with these derivative instruments, see Quantitative and Qualitative Disclosures about Market Risk — Projected Cash Flows Associated with Derivatives below. For information regarding our derivative instruments, including the net cash paid or received in connection with these instruments during 2016, 2015 and 2014, see note 7 to our consolidated financial statements. For information concerning our defined benefit plans, see note 15 to our consolidated financial statements.
II-81
Critical Accounting Policies, Judgments and Estimates
In connection with the preparation of our consolidated financial statements, we make estimates and assumptions that affect the reported amounts of assets and liabilities, revenue and expenses and related disclosure of contingent assets and liabilities. Critical accounting policies are defined as those policies that are reflective of significant judgments, estimates and uncertainties, which would potentially result in materially different results under different assumptions and conditions. We believe the following accounting policies are critical in the preparation of our consolidated financial statements because of the judgment necessary to account for these matters and the significant estimates involved, which are susceptible to change:
• | Impairment of property and equipment and intangible assets (including goodwill); |
• | Costs associated with construction and installation activities; |
• | Useful lives of long-lived assets; |
• | Fair value measurements; and |
• | Income tax accounting. |
We have discussed the selection of the aforementioned critical accounting policies with the audit committee of our board of directors. For additional information concerning our significant accounting policies, see note 3 to our consolidated financial statements.
Impairment of Property and Equipment and Intangible Assets
Carrying Value. The aggregate carrying value of our property and equipment and intangible assets (including goodwill) that was held for use comprised 71.0% of our total assets at December 31, 2016.
When circumstances warrant, we review the carrying amounts of our property and equipment and our intangible assets (other than goodwill and other indefinite-lived intangible assets) to determine whether such carrying amounts continue to be recoverable. Such changes in circumstance may include (i) an expectation of a sale or disposal of a long-lived asset or asset group, (ii) adverse changes in market or competitive conditions, (iii) an adverse change in legal factors or business climate in the markets in which we operate and (iv) operating or cash flow losses. For purposes of impairment testing, long-lived assets are grouped at the lowest level for which cash flows are largely independent of other assets and liabilities, generally at or below the reporting unit level (see below). If the carrying amount of the asset or asset group is greater than the expected undiscounted cash flows to be generated by such asset or asset group, an impairment adjustment is recognized. Such adjustment is measured by the amount that the carrying value of such asset or asset group exceeds its fair value. We generally measure fair value by considering (a) sale prices for similar assets, (b) discounted estimated future cash flows using an appropriate discount rate and/or (c) estimated replacement cost. Assets to be disposed of are recorded at the lower of their carrying amount or fair value less costs to sell.
We evaluate goodwill and other indefinite-lived intangible assets (primarily cable television franchise rights) for impairment at least annually on October 1 and whenever facts and circumstances indicate that their carrying amounts may not be recoverable. For impairment evaluations with respect to both goodwill and other indefinite-lived intangibles, we first make a qualitative assessment to determine if the goodwill or other indefinite-lived intangible may be impaired. In the case of goodwill, if it is more-likely-than-not that a reporting unit’s fair value is less than its carrying value, we then compare the fair value of the reporting unit to its respective carrying amount. A reporting unit is an operating segment or one level below an operating segment (referred to as a “component”). If the carrying value of a reporting unit were to exceed its fair value, we would then compare the implied fair value of the reporting unit’s goodwill to its carrying amount, and any excess of the carrying amount over the fair value would be charged to operations as an impairment loss. With respect to other indefinite-lived intangible assets, if it is more-likely-than-not that the fair value of an indefinite-lived intangible asset is less than its carrying value, we then estimate its fair value and any excess of the carrying value over the fair value is also charged to operations as an impairment loss.
When required, considerable management judgment is necessary to estimate the fair value of reporting units and underlying long-lived and indefinite-lived assets. The equity of one of our reporting units, Telenet, is publicly traded in an active market. For this reporting unit, our fair value determination is based on quoted market prices. For other reporting units, we typically determine fair value using an income-based approach (discounted cash flows) based on assumptions in our long-range business plans and, in some cases, a combination of an income-based approach and a market-based approach. With respect to our discounted cash flow analysis used in the income-based approach, the timing and amount of future cash flows under these business plans require estimates of, among other items, subscriber growth and retention rates, rates charged per product, expected gross margins and Adjusted OIBDA margins and expected property and equipment additions. The development of these cash flows, and the discount rate applied to the cash flows, is subject to inherent uncertainties, and actual results could vary significantly from such estimates.
II-82
Our determination of the discount rate is based on a weighted average cost of capital approach, which uses a market participant’s cost of equity and after-tax cost of debt and reflects the risks inherent in the cash flows. Based on the results of our 2016 qualitative assessment of our reporting unit carrying values, we determined that it was more-likely-than-not that fair value exceeded carrying value for all of our reporting units.
During the three years ended December 31, 2016, the most significant impairment charge that we recorded with respect to our property and equipment and intangible assets was the $68.7 million impairment charge that we recorded during the fourth quarter of 2014 to reduce the carrying amount of certain of Ziggo’s internal-use software assets. For additional information, see note 9 to our consolidated financial statements.
Based on the results of our October 1, 2016 goodwill impairment test, a hypothetical decline of 20% or more in the fair value of any of CWC’s reporting units could result in the need to record a goodwill impairment charge. At December 31, 2016, the aggregate goodwill associated with the CWC reporting units was $5.5 billion. If, among other factors, (i) the equity values of the LiLAC Group were to remain depressed or decline further or (ii) the adverse impacts of economic, competitive, regulatory or other factors were to cause our results of operations or cash flows to be worse than anticipated, we could conclude in future periods that impairment charges are required in order to reduce the carrying values of our goodwill and, to a lesser extent, other long-lived assets. Any such impairment charges could be significant.
Costs Associated with Construction and Installation Activities
We capitalize costs associated with the construction of new cable and mobile transmission and distribution facilities and the installation of new cable services. Installation activities that are capitalized include (i) the initial connection (or drop) from our cable system to a customer location, (ii) the replacement of a drop and (iii) the installation of equipment for additional services, such as digital cable, telephone or broadband internet service. The costs of other customer-facing activities, such as reconnecting customer locations where a drop already exists, disconnecting customer locations and repairing or maintaining drops, are expensed as incurred.
The nature and amount of labor and other costs to be capitalized with respect to construction and installation activities involves significant judgment. In addition to direct external and internal labor and materials, we also capitalize other costs directly attributable to our construction and installation activities, including dispatch costs, quality-control costs, vehicle-related costs and certain warehouse-related costs. The capitalization of these costs is based on time sheets, time studies, standard costs, call tracking systems and other verifiable means that directly link the costs incurred with the applicable capitalizable activity. We continuously monitor the appropriateness of our capitalization policies and update the policies when necessary to respond to changes in facts and circumstances, such as the development of new products and services and changes in the manner that installations or construction activities are performed.
Useful Lives of Long-Lived Assets
We depreciate our property and equipment on a straight-line basis over the estimated useful lives of the assets. The determination of the useful lives of property and equipment requires significant management judgment, based on factors such as the estimated physical lives of the assets, technological changes, changes in anticipated use, legal and economic factors, rebuild and equipment swap-out plans, and other factors. Our intangible assets with finite lives primarily consist of customer relationships. Customer relationship intangible assets are amortized on a straight-line basis over the estimated weighted average life of the customer relationships. The determination of the estimated useful life of customer relationship intangible assets requires significant management judgment and is primarily based on historical and forecasted subscriber disconnect rates, adjusted when necessary for risk associated with demand, competition, technological changes and other economic factors. We regularly review whether changes to estimated useful lives are required in order to accurately reflect the economic use of our property and equipment and intangible assets with finite lives. Any changes to estimated useful lives are reflected prospectively. Our depreciation and amortization expense during 2016, 2015 and 2014 was $5,801.1 million, $5,825.8 million and $5,500.1 million, respectively. A 10% increase in the aggregate amount of our depreciation and amortization expense during 2016 would have resulted in a $580.1 million or 20.7% decrease in our 2016 operating income.
Fair Value Measurements
U.S. GAAP provides guidance with respect to the recurring and nonrecurring fair value measurements and for a fair value hierarchy that prioritizes the inputs to valuation techniques used to measure fair value into three broad levels. Level 1 inputs are quoted market prices in active markets for identical assets or liabilities that the reporting entity has the ability to access at the measurement date. Level 2 inputs are inputs other than quoted market prices included within Level 1 that are observable for the asset or liability, either directly or indirectly. Level 3 inputs are unobservable inputs for the asset or liability.
II-83
Recurring Valuations. We perform recurring fair value measurements with respect to our derivative instruments, our fair value method investments and certain instruments that we classify as debt, each of which are carried at fair value. We use (i) cash flow valuation models to determine the fair values of our interest rate and foreign currency derivative instruments and (ii) a binomial option pricing model to determine the fair values of our equity-related derivative instruments. We use quoted market prices when available and, when not available, we use a combination of an income approach (discounted cash flows) and a market approach (market multiples of similar businesses) to determine the fair value of our fair value method investments. For a detailed discussion of the inputs we use to determine the fair value of our derivative instruments and fair value method investments, see note 8 to our consolidated financial statements. See also notes 6 and 7 to our consolidated financial statements for information concerning our fair value method investments and derivative instruments, respectively.
Changes in the fair values of our derivative instruments, fair value method investments and certain instruments that we classify as debt have had, and we believe will continue to have, a significant and volatile impact on our results of operations. During 2016, 2015 and 2014, we recognized net gains of $383.6 million, $971.7 million and $294.0 million, respectively, attributable to changes in the fair values of these items.
As further described in note 8 to our consolidated financial statements, actual amounts received or paid upon the settlement or disposition of these investments and instruments may differ materially from the recorded fair values at December 31, 2016.
For information concerning the sensitivity of the fair value of certain of our more significant derivative instruments to changes in market conditions, see Quantitative and Qualitative Disclosures About Market Risk — Sensitivity Information below.
Nonrecurring Valuations. Our nonrecurring valuations are primarily associated with (i) the application of acquisition accounting and (ii) impairment assessments, both of which require that we make fair value determinations as of the applicable valuation date. In making these determinations, we are required to make estimates and assumptions that affect the recorded amounts, including, but not limited to, expected future cash flows, market comparables and discount rates, remaining useful lives of long-lived assets, replacement or reproduction costs of property and equipment and the amounts to be recovered in future periods from acquired net operating losses and other deferred tax assets. To assist us in making these fair value determinations, we may engage third-party valuation specialists. Our estimates in this area impact, among other items, the amount of depreciation and amortization, impairment charges and income tax expense or benefit that we report. Our estimates of fair value are based upon assumptions we believe to be reasonable, but which are inherently uncertain. A significant portion of our long-lived assets were initially recorded through the application of acquisition accounting and all of our long-lived assets are subject to impairment assessments. For additional information, including the specific weighted average discount rates that we used to complete certain nonrecurring valuations, see note 8 to our consolidated financial statements. For information regarding our acquisitions and long-lived assets, see notes 4 and 9 to our consolidated financial statements, respectively.
Income Tax Accounting
We are required to estimate the amount of tax payable or refundable for the current year and the deferred tax assets and liabilities for the future tax consequences attributable to differences between the financial statement carrying amounts and income tax basis of assets and liabilities and the expected benefits of utilizing net operating loss and tax credit carryforwards, using enacted tax rates in effect for each taxing jurisdiction in which we operate for the year in which those temporary differences are expected to be recovered or settled. This process requires our management to make assessments regarding the timing and probability of the ultimate tax impact of such items.
Net deferred tax assets are reduced by a valuation allowance if we believe it more-likely-than-not such net deferred tax assets will not be realized. Establishing or reducing a tax valuation allowance requires us to make assessments about the timing of future events, including the probability of expected future taxable income and available tax planning strategies. At December 31, 2016, the aggregate valuation allowance provided against deferred tax assets was $6,015.4 million. The actual amount of deferred income tax benefits realized in future periods will likely differ from the net deferred tax assets reflected in our December 31, 2016 consolidated balance sheet due to, among other factors, possible future changes in income tax law or interpretations thereof in the jurisdictions in which we operate and differences between estimated and actual future taxable income. Any such factors could have a material effect on our current and deferred tax positions as reported in our consolidated financial statements. A high degree of judgment is required to assess the impact of possible future outcomes on our current and deferred tax positions.
Tax laws in jurisdictions in which we have a presence are subject to varied interpretation, and many tax positions we take are subject to significant uncertainty regarding whether the position will be ultimately sustained after review by the relevant tax authority. We recognize the financial statement effects of a tax position when it is more-likely-than-not, based on technical merits, that the position will be sustained upon examination. The determination of whether the tax position meets the more-likely-than-not threshold requires a facts-based judgment using all information available. In a number of cases, we have concluded that the
II-84
more-likely-than-not threshold is not met and, accordingly, the amount of tax benefit recognized in our consolidated financial statements is different than the amount taken or expected to be taken in our tax returns. As of December 31, 2016, the amount of unrecognized tax benefits for financial reporting purposes, but taken or expected to be taken in our tax returns, was $501.1 million, of which $438.3 million would have a favorable impact on our effective income tax rate if ultimately recognized, after considering amounts that we would expect to be offset by valuation allowances.
We are required to continually assess our tax positions, and the results of tax examinations or changes in judgment can result in substantial changes to our unrecognized tax benefits.
We have taxable outside basis differences on certain investments in non-U.S. subsidiaries. We do not recognize the deferred tax liabilities associated with these outside basis differences when the difference is considered essentially permanent in duration. In order to be considered essentially permanent in duration, sufficient evidence must indicate that the foreign subsidiary has invested or will invest its undistributed earnings indefinitely, or that earnings will be remitted in a tax-free liquidation. If circumstances change and it becomes apparent that some or all of the undistributed earnings will be remitted on a taxable basis in the foreseeable future, a net deferred tax liability must be recorded for some or all of the outside basis difference. The assessment of whether these outside basis differences are considered permanent in nature requires significant judgment and is based on management’s intentions to reinvest the earnings of a foreign subsidiary indefinitely in light of anticipated liquidity requirements and other relevant factors. At December 31, 2016, income and withholding taxes for which a net deferred tax liability might otherwise be required have not been provided on an estimated $6.9 billion of cumulative temporary differences on non-U.S. entities, including cumulative translation adjustments. If our plans or intentions change in the future due to liquidity or other relevant considerations, we could decide that it would be prudent to repatriate significant funds or other assets from one or more of our subsidiaries, even though we would incur a tax liability in connection with any such repatriation. If our plans or intentions were to change in this manner, the recognition of all or a part of these outside basis differences could have an adverse impact on our consolidated results of operations.
For additional information concerning our income taxes, see note 11 to our consolidated financial statements.
II-85
PART IV
Item 15. | EXHIBITS, FINANCIAL STATEMENT SCHEDULES |
(a) (1) FINANCIAL STATEMENT
The financial statements required under this Item begin on page II-96 of our Annual Report on Form 10-K dated February 15, 2017.
(a) (2) FINANCIAL STATEMENT SCHEDULES
The financial statement schedules required under this Item are as follows:
Schedule I - Condensed Financial Information of Registrant (Parent Company Information): | |
Liberty Global plc Condensed Balance Sheets as of December 31, 2016 and 2015 (Parent Company Only) | IV-9 |
Liberty Global plc Condensed Statements of Operations for the years ended December 31, 2016, 2015 and 2014 (Parent Company Only) | IV-11 |
Liberty Global plc Condensed Statements of Cash Flows for the years ended December 31, 2016, 2015, and 2014 (Parent Company Only) | IV-12 |
Schedule II - Valuation and Qualifying Accounts | IV-13 |
(a) (3) EXHIBITS
Listed below are the exhibits filed as part of this Annual Report on Form 10-K/A (according to the number assigned to them in Item 601 of Regulation S-K):
2 -- Plan of acquisition, reorganization, arrangement, liquidation or succession: | ||
2.1 | Rule 2.7 Announcement, dated November 16, 2015. (incorporated by reference to Exhibit 2.1 to the Registrant’s Current Report on Form 8-K/A filed November 18, 2015 (File No. 001-35961) (the November 2015 8-K/A)). | |
2.2 | Co-operation Agreement, dated November 16, 2015, between Liberty Global plc and Cable & Wireless Communications plc (incorporated by reference to Exhibit 2.2 to the November 2015 8-K/A). | |
3 -- Articles of Incorporation and Bylaws: | ||
3.1 | Articles of Association of Liberty Global plc, effective as of July 1, 2015 (incorporated by reference to Exhibit 3.1 to the Registrant’s Registration Statement on Form 8-A filed June 19, 2015 (File No. 001-35961)). | |
4 -- Instruments Defining the Rights of Securities Holders, including Indentures: | ||
4.1 | Senior Secured Credit Facility Agreement originally dated January 16, 2004, as amended and restated on December 19, 2016, among UPC Broadband Holding B.V. (UPC Broadband Holding) and UPC Financing Partnership (UPC Financing) as Borrowers, The Bank of Nova Scotia, as Facility Agent,the Guarantors listed therein, the Security Agent and the bank and financial institutions acceding thereto from time to time (the UPC Broadband Holding Bank Facility) (incorporated by reference to Exhibit 4.1 to the Registrant's Current Report on Form 8-K filed December 23, 2016 (File No. 001-35961)). | |
4.2 | Additional Facility AC Accession Agreement, dated November 16, 2011, among UPC Financing, as Borrower, UPC Broadband Holding, The Bank of Nova Scotia, as Facility Agent and Security Agent, and UPCB Finance V Limited, as an Additional Facility AC Lender, under the UPC Broadband Holding Bank Facility (incorporated by reference to Exhibit 4.47 to Liberty Global Inc.’s (LGI) Annual Report on Form 10-K filed February 22, 2012 (File No. 000-51360) (the LGI 2011 10-K)). | |
4.3 | Additional Facility AD Accession Agreement, dated February 7, 2012, among UPC Financing, as Borrower, UPC Broadband Holding, The Bank of Nova Scotia, as Facility Agent and Security Agent, and UPCB Finance VI Limited, as an Additional Facility AD Lender, under the UPC Broadband Holding Bank Facility (incorporated by reference to Exhibit 4.48 to the LGI 2011 10-K). | |
4.4 | Indenture dated April 15, 2015, among UPCB Finance IV Limited, The Bank of New York Mellon, London Branch as Trustee, Principal Paying Agent, Transfer Agent and Security Agent, The Bank of New York Mellon as New York Paying Agent, New York Transfer Agent and Dollar Notes Registrar and The Bank of New York Mellon (Luxembourg) S.A. as Euro Notes Registrar and Transfer Agent (incorporated by reference to Exhibit 4.1 to the Registrant’s Current Report on Form 8-K/A filed April 21, 2015 (File No. 001-35961) (the April 2015 8-K/A)). | |
4.5 | Additional Facility AK Accession Agreement, dated April 15, 2015, among UPC Financing as Borrower, The Bank of Nova Scotia as Facility Agent and Security Agent, UPC Broadband Holding and UPCB Finance IV Limited as Additional Facility AK Lender, under the UPC Broadband Holding Bank Facility (incorporated by reference to Exhibit 4.2 to the April 2015 8-K/A). | |
IV-1
4.6 | Additional Facility AL Accession Agreement, dated April 15, 2015, among UPC Financing as Borrower, The Bank of Nova Scotia as Facility Agent and Security Agent, UPC Broadband Holding and UPCB Finance IV Limited as Additional Facility AL Lender, under the UPC Broadband Holding Bank Facility (incorporated by reference to Exhibit 4.3 to the April 2015 8-K/A). | |
4.7 | Additional Facility AL2 Accession Agreement, dated May 20, 2015, among UPC Financing as Borrower, The Bank of New York Nova Scotia as Facility Agent and Security Agent, UPC Broadband Holding and UPCB Finance IV Limited as Additional Facility AL2 Lender, under the UPC Broadband Holding Bank Facility (incorporated by reference to Exhibit 4.1 to the Registrant’s Current Report on Form 8-K/A filed May 21, 2015 (File No. 001-35961)). | |
4.8 | Additional Facility AM Accession Agreement, dated August 3, 2015, among UPC Financing as Borrower, The Bank of Nova Scotia as Facility Agent and Security Agent and the financial institutions listed therein as Additional Facility AM Lenders, under the UPC Broadband Holding Bank Facility (incorporated by reference to Exhibit 4.1 to the Registrant’s Current Report on Form 8-K filed August 6, 2015 (File No. 001-35961)). | |
4.9 | Additional Facility AN Accession Agreement dated August 3, 2016, between, among others, UPC Financing as Borrower and The Bank of Nova Scotia as Facility Agent and Security Agent and the financial institutions listed therein as Additional Facility AN Lenders under the UPC Broadband Holding Bank Facility (incorporated by reference to Exhibit 4.1 to the Registrant’s Current Report on Form 8-K filed August 3, 2016 (File No. 001-35961)). | |
4.10 | Additional Facility AO Accession Agreement dated November 23, 2016, between, among others, UPC Financing as Borrower, UPC Broadband Holding, The Bank of Nova Scotia as Facility Agent and Security Agent and the financial institutions listed therein as Additional Facility AO Lenders, under the UPC Broadband Holding Bank Facility (incorporated by reference to Exhibit 4.1 to the Registrant’s Current Report on Form 8-K filed November 30, 2016 (File No. 001-35961)). | |
4.11 | Additional Facility AP Accession Agreement dated February 2, 2017, between, among others, UPC Financing as the Borrower, UPC Broadband Holding and The Bank of Nova Scotia as the Facility Agent and Security Agent under the UPC Broadband Holding Bank Facility (incorporated by reference to Exhibit 4.2 to the Registrant’s Current Report on Form 8-K filed February 7, 2017 (File No. 001-35961)). | |
4.12 | €2,300,000,000 Credit Agreement, originally dated August 1, 2007, and as amended and restated by supplemental agreements dated August 22, 2007, September 11, 2007, October 8, 2007, June 23, 2009, August 25, 2009, October 4, 2010 and as further amended and restated on November 2, 2015 among Telenet N.V. as Borrower, The Bank of Nova Scotia N.V. as Facility Agent, the parties listed therein as Original Guarantors, ABN AMRO Bank N.V., BNP Paribas S.A. and J.P. Morgan PLC as Mandated Lead Arrangers, KBC Bank N.V. as Security Agent, and the financial institutions listed therein as Initial Original Lenders (the Telenet Credit Facility) (incorporated by reference to Exhibit 4.1 to the Registrant’s Current Report on Form 8-K filed November 6, 2015 (File No. 000-35961)). | |
4.13 | Telenet Additional Facility U Accession Agreement, dated August 16, 2012, among, inter alia, Telenet International Finance S.a.r.l (Telenet International) as Borrower, Telenet N.V. and Telenet International as Guarantors, The Bank of Nova Scotia as Facility Agent, KBC Bank N.V. as Security Agent and the financial institutions listed therein as additional Facility U Lenders, under the Telenet Credit Facility (incorporated by reference to Exhibit 4.2 to LGI’s Quarterly Report on Form 10-Q filed November 5, 2012 (File No. 000-51360) (the LGI November 5, 2012 10-Q)). | |
4.14 | Telenet Additional Facility V Accession Agreement, dated August 16, 2012, among, inter alia, Telenet International as Borrower, Telenet N.V. and Telenet International as Guarantors, The Bank of Nova Scotia as Facility Agent, KBC Bank N.V. as Security Agent and the financial institutions listed therein as additional Facility V Lenders, under the Telenet Credit Facility (incorporated by reference to Exhibit 4.3 to the LGI November 5, 2012 10-Q). | |
4.15 | Telenet Additional Facility X Accession Agreement, dated April 11, 2014, among, inter alia, Telenet International as Borrower, Telenet N.V. and Telenet International as Guarantors, The Bank of Nova Scotia as Facility Agent, KBC Bank N.V. as Security Agent and the financial institutions listed therein as Additional Facility X Lenders, under the Telenet Credit Facility (incorporated by reference to Exhibit 4.3 to the Registrant’s Current Report on Form 8-K filed April 15, 2014 (File No. 001-35961)). | |
4.16 | Additional Facility Z Accession Agreement, dated May 7, 2015, between, among others, Telenet International as Borrower, Telenet N.V., The Bank of Nova Scotia as Facility Agent, KBC Bank N.V. Security Agent and The Royal Bank of Scotland PLC, Societe Generale, London Branch, Deutsche Bank AG, London Branch, Credit Suisse AG, London Branch, ScotiaBank Europe PLC and Goldman Sachs Bank USA as Additional Facility Z Lenders, under the Telenet Credit Facility (incorporated by reference to Exhibit 4.1 to the Registrant’s Current Report on Form 8-K filed May 13, 2015 (File No. 001-35961)). | |
4.17 | Telenet Additional Facility X2 Accession Agreement, dated July 1, 2015, among inter alia, Telenet International as Borrower, Telenet N.V. and Telenet International as Guarantors, The Bank of Nova Scotia as Facility Agent, KBC Bank N.V. as Security Agent and the financial institutions listed therein as Additional Facility X2 Lenders, under the Telenet Credit Facility (incorporated by reference to Exhibit 4.1 to the Registrant’s Current Report on Form 8-K filed July 8, 2015 (File No. 001-35961)). | |
4.18 | Telenet Additional Facility AB Accession Agreement, dated July 24, 2015, among, inter alia, Telenet International as Borrower, Telenet N.V. and Telenet International as Guarantors, and the other parties thereto, under the Telenet Credit Facility (incorporated by reference to Exhibit 4.1 to the Registrant's Current Report on Form 8-K filed July 30, 2015 (File No. 001-35061)). | |
IV-2
4.19 | Telenet Additional Facility AE Accession Agreement dated November 3, 2016, among, inter alia, Telenet International as Borrower, The Bank of Nova Scotia as Facility Agent, KBC Bank N.V. as Security Agent and the financial institutions listed therein as Additional Facility AE Lenders, under the Telenet Credit Facility (incorporated by reference to Exhibit 4.1 to the Registrant’s Current Report on Form 8-K filed November 10, 2016 (File No. 001-35961) (the November 2016 8-K)). | |
4.20 | Telenet Additional Facility AF Accession Agreement dated November 3, 2016 among, inter alia, Telenet Financing USD LLC, The Bank of Nova Scotia as Facility Agent, KBC Bank N.V. as Security Agent and the financial institutions listed therein as Additional Facility AF Lenders, under the Telenet Credit Facility (incorporated by reference to Exhibit 4.2 to the November 2016 8-K). | |
4.21 | Telenet Additional Facility AG Accession Agreement dated November 22, 2016, among, inter alia, Telenet International, The Bank of Nova Scotia as Facility Agent, KBC Bank N.V. as Security Agent and the financial institutions listed therein as Additional Facility AG Lenders, under the Telenet Credit Facility (incorporated by reference to Exhibit 4.1 to the Registrant’s Current Report on Form 8-K filed November 29, 2016 (File No. 001-35961)). | |
4.22 | Indenture dated December 14, 2012, between Unitymedia Hessen GmbH & Co. KG, Unitymedia NRW GmbH, The Bank of New York Mellon, London Branch, as Trustee, Transfer Agent and Principal Paying Agent, The Bank of New York Mellon as Paying Agent in New York, The Bank of New York Mellon (Luxembourg) S.A. as Registrar and Credit Suisse AG, London Branch, as Security Trustee (incorporated by reference to Exhibit 4.1 to the Registrant's Current Report on Form 8-K filed December 20, 2012 (File No. 000-51360)). | |
4.23 | Indenture dated December 17, 2014, between Unitymedia Hessen GmbH & Co. KG, Unitymedia NRW GmbH, The Bank of New York Mellon, London Branch, as Trustee, Transfer Agent and Principal Paying Agent, The Bank of New York Mellon as New York Paying Agent and New York Transfer Agent, The Bank of New York Mellon (Luxembourg) S.A. as Registrar and Credit Suisse AG, London Branch, as Security Trustee (incorporated by reference to Exhibit 4.1 to the Registrant's Current Report on Form 8-K/A filed December 18, 2014 (File No. 001-35961)). | |
4.24 | Indenture, dated as of March 3, 2011, among Virgin Media Secured Finance PLC, the Guarantors party thereto, The Bank of New York Mellon as Trustee and Paying Agent and The Bank of New York Mellon (Luxembourg) S.A. as Luxembourg Paying Agent (incorporated by reference to Exhibit 4.1 to Virgin Media Inc.’s (Virgin Media) Current Report on Form 8-K filed on March 3, 2011 (File No. 000-50886). | |
4.25 | Indenture dated February 22, 2013, between, among others, Lynx I Corp., as Issuer, The Bank of New York Mellon, London Branch, as Trustee, Transfer Agent and Principal Paying Agent and The Bank of New York Mellon, as Paying Agent and Newco Security Trustee (incorporated by reference to Exhibit 4.1 to LGI’s Current Report on Form 8-K/A filed February 27, 2013 (File No. 000-51360) (the LGI February 2013 8-K/A). | |
4.26 | Indenture, dated as of February 22, 2013, among Lynx II Corp., as Issuer, The Bank of New York Mellon, London Branch, as trustee, Transfer Agent and Principal Paying Agent and The Bank of New York Mellon, as Paying Agent and Newco Security Trustee (incorporated by reference to Exhibit 4.2 to the LGI February 2013 8-K/A). | |
4.27 | First Supplemental Indenture, dated as of June 7, 2013, between, among others, Virgin Media Secured Finance PLC, Virgin Media Inc. (Virgin Media) and The Bank of New York Mellon as Trustee, to the Indenture dated as of March 3, 2011 for Virgin Media 5.25% Senior Secured Notes and 5.50% Senior Secured Notes each due 2021 (incorporated by reference to Exhibit 4.12 to the Registrant’s Current Report on Form 8-K filed June 12, 2013 (File No. 001-35961)(the June 2013 8-K)). | |
4.28 | Accession Agreement, dated as of June 7, 2013, among Virgin Media Secured Finance PLC as Acceding Issuer, Lynx I Corp. and The Bank of New York Mellon, as Trustee (incorporated by reference to Exhibit 4.13 to the June 2013 8-K). | |
4.29 | First Supplemental Indenture, dated as of June 7, 2013, between, among others, Virgin Media Secured Finance PLC and The Bank of New York Mellon as Trustee, to the Indenture dated as of February 22, 2013 for Lynx I Corp. 5⅜% Senior Secured Notes and 6.00% Senior Secured Notes each due 2021 (incorporated by reference to Exhibit 4.15 to the June 2013 8-K). | |
4.30 | Accession Agreement, dated as of June 7, 2013, among Lynx II Corp., Virgin Media Finance PLC and The Bank of New York Mellon as Trustee and Paying Agent (incorporated by reference to Exhibit 4.16 to the June 2013 8-K). | |
4.31 | First Supplemental Indenture, dated June 7, 2013, between, among others, Virgin Media Finance PLC, Virgin Media and The Bank of New York Mellon, as Trustee and Paying Agent, to the Indenture dated as of February 22, 2013 Lynx II Corp. 6⅜% Senior Notes and 7.00% Senior Notes each due 2023 (incorporated by reference to Exhibit 4.18 to the June 2013 8-K). | |
4.32 | Amendment dated June 14, 2013, to the Senior Facilities Agreement, between, and among others, Virgin Media Investment Holdings Limited, certain other subsidiaries of Virgin Media and the lenders thereto (incorporated by reference to Exhibit 4.1 to the Registrant’s Current Report on Form 8-K filed June 21, 2013 (File No. 001-35961)). | |
4.33 | Senior Facilities Agreement, dated as of June 7, 2013, as amended on June 14, 2013 and as amended and restated on July 30 2015, among, inter alia, Virgin Media Finance PLC, certain other subsidiaries of Virgin Media and the lenders thereto (the VMF Senior Facilities Agreement) (incorporated by reference to Exhibit 4.13 to the Registrant’s Quarterly Report on Form 10-Q filed August 4, 2015 (File No. 001-35061)). | |
4.34 | Indenture dated March 28, 2014 between Virgin Media Secured Finance PLC, The Bank of New York Mellon, London Branch, as Trustee, Transfer Agent and Principal Paying Agent, The Bank of New York Mellon as Paying Agent, and The Bank of New York Mellon (Luxembourg) S.A., as Registrar (incorporated by reference to Exhibit 4.1 to the Registrant’s Current Report on Form 8-K/A filed April 3, 2014 (File No. 001-35961)). | |
IV-3
4.35 | Virgin Additional Facility E Accession Agreement, dated April 17, 2014, among, inter alia, Virgin Media SFA Finance Limited as Borrower, certain other subsidiaries of Virgin Media, The Bank of Nova Scotia as Facility Agent and the financial institutions listed therein as Additional Facility E Lenders, under the VMF Senior Facilities Agreement (incorporated by reference to Exhibit 4.2 to the Registrant’s Current Report on Form 8-K filed April 23, 2014 (File No. 001-35961)). | |
4.36 | Indenture dated January 28, 2015 between Virgin Media Secured Finance PLC, The Bank of New York Mellon, London Branch, as Trustee and Paying Agent and The Bank of New York Mellon (Luxembourg) S.A., as Registrar and Transfer Agent (incorporated by reference to Exhibit 4.1 to the Registrant’s Current Report on Form 8-K/A filed February 3, 2015 (File No. 001-35961) (the February 2015 8-K/A)). | |
4.37 | Indenture dated January 28, 2015 between Virgin Media Finance PLC, The Bank of New York Mellon, London Branch, as Trustee and Principal Paying Agent, The Bank of Mellon as Paying Agent and Dollar Notes Transfer Agent and Registrar and The Bank of New York Mellon (Luxembourg) S.A., as Euro Notes Registrar and Transfer Agent (incorporated by reference to Exhibit 4.2 to the February 2015 8-K/A). | |
4.38 | Additional I Facility Accession Deed dated December 16, 2016, among Virgin Media Investment Holdings Limited, Virgin Media Bristol LLC as Borrower, The Bank of Nova Scotia as Facility Agent, and The Bank of Nova Scotia as Additional I Facility Lender, under the VMF Senior Facilities Agreement (incorporated by reference to Exhibit 4.1 to the Registrant’s Current Report on Form 8-K filed December 22, 2016 (File No. 001-35961)(the December 2016 8-K)). | |
4.39 | Amendment letter dated December 16, 2016, between Virgin Media Investment Holdings Limited and The Bank of Nova Scotia as the Facility Agent, amending the VMF Senior Facilities Agreement (incorporated by reference to Exhibit 4.2 to the December 2016 8-K). | |
4.40 | Additional J Facility Accession Deed dated February 2, 2017, between Virgin Media Investment Holdings Limited as the Company, Virgin Media SFA Finance Limited as the Borrower, The Bank of Nova Scotia as the Facility Agent and The Bank of Nova Scotia as Additional J Facility Lender under the VMF Senior Facilities Agreement (incorporated by reference to Exhibit 4.1 to the Registrant’s Current Report on Form 8-K filed February 7, 2017 (File No. 001-35961)). | |
4.41 | Indenture dated January 24, 2014, between VTR Finance B.V., The Bank of New York Mellon, London Branch, as Trustee and Security Agent, and The Bank of New York Mellon as Paying Agent, Registrar and Transfer Agent (incorporated by reference to Exhibit 4.1 to the Registrant’s Current Report on Form 8-K filed January 24, 2014 (File No. 001-35961)). | |
4.42 | Credit Agreement, dated May 16, 2016, among LGE Coral Holdco Limited, Sable International Finance Limited and Coral-US Co-Borrower LLC as Initial Borrowers, The Bank of Nova Scotia as Administrative Agent, L/C Issuer and Swing Line Lender and FirstCaribbean International Bank (Bahamas) Limited, BNP Paribas Fortis SA/NV and Royal Bank of Canada as Alternative L/C Issuers, the other lenders a party thereto from time to time (the Coral Credit Agreement)(incorporated by reference to Exhibit 4.1 to the Registrant’s Current Report on Form 8-K filed May 20, 2016 (File No. 001-35961)(the May 2016 8-K)). | |
4.43 | Indenture dated March 31, 2014, among Columbus International Inc., each of the Guarantors a party thereto, The Bank of New York Mellon as Trustee and The Bank of New York Mellon (Luxembourg) S.A. as Luxembourg Transfer Agent and Paying Agent (incorporated be reference to Exhibit 4.2 to the May 2016 8-K). | |
4.44 | Indenture dated August 5, 2015, among Sable International Finance Limited as Issuer, each of the Guarantors a party thereto, Deutsche Bank Trust Company Americas as Trustee, Principal Paying Agent, Registrar and Transfer Agent and Deutsche Bank Luxembourg, S.A. as Luxembourg Paying Agent and (Regulation S) Transfer Agent (incorporated by reference to Exhibit 4.3 to the May 2016 8-K). | |
4.45 | First Supplemental Indenture dated November 23, 2015, among Sable International Finance Limited as Issuer, each of the Guarantors a party thereto, and Deutsche Bank Trust Company Americas as Trustee, Principal Paying Agent, Registrar and Transfer Agent (incorporated by reference to Exhibit 4.4 to the May 2016 8-K). | |
4.46 | First Supplemental Indenture dated March 10, 2015, among Columbus International Inc. as Issuer, each of the Guarantors a party thereto, and The Bank of New York Mellon as Trustee (incorporated by reference to Exhibit 4.5 to the May 2016 8-K). | |
4.47 | Joinder Agreement dated October 7, 2016, among Sable International Finance Limited and Coral-US Co-Borrower LLC as Borrowers, the other Guarantors party thereto, The Bank of Nova Scotia as Administrative Agent and Security Trustee, and the financial institutions party thereto as Revolving Credit Lenders (incorporated by reference to Exhibit 4.1 to the Registrant’s Current Report on Form 8-K filed October 13, 2016 (File No. 001-35961)). | |
4.48 | Joinder Agreement, dated November 18, 2016, among Sable International Finance Limited and Coral US Co-Borrower LLC as Borrowers, the other Guarantors party thereto, The Bank of Nova Scotia, as Administrative Agent and Security Trustee, and the financial institutions party thereto as Additional Term B-1B Facility Lenders (as defined therein) under the Coral Credit Agreement (incorporated by reference to Exhibit 4.1 to the Registrant’s Current Report on Form 8-K filed November 23, 2016 (File No. 001-35961)). | |
4.49 | Amended and Restated First Lien Credit Agreement dated as of July 7, 2014, among Liberty Cablevision of Puerto Rico LLC (Liberty Puerto Rico), the Guarantors party thereto from time to time, The Bank of Nova Scotia, as Administrative Agent, each lender form time to time party thereto and Scotiabank de Puerto Rico as L/C Issuer and Swing Line Lender (incorporated by reference to Exhibit 4.1 to the Registrant’s Current Report on Form 8-K filed July 2, 2015 (File No. 001-35961) (the July 2015 8-K)). | |
IV-4
4.50 | Amended and Restated Second Lien Credit Agreement dated as of July 7, 2014, among Liberty Puerto Rico, the Guarantors party thereto from time to time, The Bank of Nova Scotia as Administrative Agent, and each lender from time to time party thereto (incorporated by reference to Exhibit 4.2 to the July 2015 8-K). | |
4.51 | Additional Term B-1 Facility Joinder Agreement dated as of June 1, 2015, among Liberty Puerto Rico, The Bank of Nova Scotia as Administrative Agent and Collateral Agent and the Additional Term B-1 Facility Lenders party thereto (incorporated by reference to Exhibit 4.3 to the July 2015 8-K). | |
4.52 | Additional Term B-2 Facility Joinder Agreement dated as of June 1, 2015, among Liberty Puerto Rico, The Bank of Nova Scotia as Administrative Agent and Collateral Agent and the Additional Term B-2 Facility Lenders party thereto (incorporated by reference to Exhibit 4.4 to the July 2015 8-K). | |
The Registrant undertakes to furnish to the Securities and Exchange Commission, upon request, a copy of all instruments with respect to long-term debt not filed herewith. | ||
10 -- Material Contracts: | ||
10.1 | Deed of Assumption of Liberty Global plc, dated June 7, 2013 (incorporated by reference to Exhibit 10.1 to the Registrant’s Current Report on Form 8-K filed June 7, 2013 (File No. 001-35961)(the June 7, 2013 8-K)). | |
10.2 | Liberty Global 2014 Incentive Plan Effective March 1, 2014 as amended and restated February 24, 2015 (the Incentive Plan) (incorporated by reference to Exhibit 10.1 to the Registrant’s Quarterly Report on Form 10-Q filed May 7, 2015 (File No. 001-35961)). | |
10.3 | Liberty Global 2014 Nonemployee Director Incentive Plan Effective March 1, 2014 (the Director Plan) (incorporated by reference to Appendix B to the Registrant’s Proxy Statement on Schedule 14A filed December 19, 2013 (File No. 001-35961)). | |
10.4 | Form of Performance Share Units Agreement under the Incentive Plan (incorporated by reference to Exhibit 10.6 to the Registrant’s Quarterly Report on Form 10-Q filed May 6, 2014 (File No. 001-35961)). | |
10.5 | Form of Performance Share Units Agreement under the Incentive Plan (incorporated by reference to Exhibit 10.1 to the Registrant’s Quarterly Report on Form 10-Q filed August 4, 2015 (File No. 001-35961)). | |
10.6 | Form of Non-Qualified Share Option Agreement under the Director Plan (incorporated by reference to Exhibit 10.3 to the Registrant’s Quarterly Report on Form 10-Q filed August 5, 2014 (File No. 001-35961) (the August 5, 2014 10-Q)). | |
10.7 | Form of Restricted Share Units Agreement under the Director Plan (incorporated by reference to Exhibit 10.4 to the August 5, 2014 10-Q). | |
10.8 | Form of Share Appreciation Rights Agreement under the Incentive Plan (incorporated by reference to Exhibit 10.5 to the August 5, 2014 10-Q). | |
10.9 | Form of Restricted Share Units Agreement under the Incentive Plan (incorporated by reference to Exhibit 10.6 to the August 5, 2014 10-Q). | |
10.10 | Liberty Global, Inc. 2005 Incentive Plan (as amended and restated effective June 7, 2013) (the 2005 Incentive Plan) (incorporated by reference to Exhibit 10.2 to the June 7, 2013 8-K). | |
10.11 | Liberty Global, Inc. 2005 Nonemployee Director Incentive Plan (as amended and restated effective June 7, 2013) (the 2005 Director Plan) (incorporated by reference to Exhibit 10.3 to the June 7, 2013 8-K). | |
10.12 | Virgin Media 2010 Stock Incentive Plan (as amended and restated effective June 7, 2013) (incorporated by reference to Exhibit 10.4 to the June 7, 2013 8-K). | |
10.13 | Form of Non-Qualified Share Option Agreement under the 2005 Director Plan (incorporated by reference to Exhibit 10.6 to the Registrant’s Quarterly Report on Form 10-Q filed August 1, 2013 (File No. 001-35961)). | |
10.14 | Liberty Global Compensation Policy for Nonemployee Directors effective June 26, 2014 (incorporated by reference to Appendix A to the Registrant’s Proxy Statement on Schedule 14A filed April 30, 2014 (File No. 001-35961)). | |
10.15 | Form of Deed of Indemnity between Liberty Global and its Directors and Executive Officers (incorporated by reference to Exhibit 10.10 to the June 7, 2013 8-K). | |
10.16 | Form of Stock Appreciation Rights Agreement under the 2005 Incentive Plan (incorporated by reference to Exhibit 10.3 to LGI’s Quarterly Report on Form 10-Q filed May 7, 2008 (File No. 000-51360) (the LGI May 7, 2008 10-Q)). | |
10.17 | Liberty Global 2015 Annual Cash Performance Award Program for executive officers under the Incentive Plan (description of said program is incorporated by reference to the description thereof included in Item 5.02(e) of the Registrant’s Current Report on Form 8-K filed March 25, 2015 (File No. 001-35961) (the March 2015 8-K)). | |
10.18 | Liberty Global 2015 Performance Incentive Plan for executive officers under the Incentive Plan (a description of said plan is incorporated by reference to the description thereof included in Item 5.02(e) of the March 2015 8-K). | |
10.19 | Liberty Global 2016 Annual Cash Performance Award Program for executive officers under the Incentive Plan (description of said program is incorporated by reference to the description thereof included in Item 5.02(e) of the Registrant’s Current Report on Form 8-K filed March 14, 2016 (File No. 001-35961)). | |
10.20 | Liberty Global 2016 Performance Incentive Plan for executive officers under the Incentive Plan (a description of said plan is incorporated by reference to the description thereof included in Item 5.02(e) of the Registrant’s Current Report on Form 8-K filed February 9, 2016 (File No. 001-35961)). | |
10.21 | Form of Performance Share Units Agreement for executive officers under the Incentive Plan (incorporated by reference to Exhibit 10.4 to the Registrant’s Quarterly Report on Form 10-Q filed May 9, 2016 (File No. 000-51360)). | |
IV-5
10.22 | Deferred Compensation Plan (adopted effective December 15, 2008; Amended and Restated as of October 26, 2015)(incorporated by reference to Exhibit 10.29 to the Registrant’s Annual Report on Form 10-K filed February 12, 2016 (File No. 001-35961)(the 2016 10-K)). | |
10.23 | Nonemployee Director Deferred Compensation Plan (As Amended and Restated Effective December 11, 2015)(incorporated by reference to Exhibit 10.30 to the 2016 10-K)). | |
10.24 | Personal Usage of Aircraft Policy, restated June 7, 2013 (incorporated by reference to Exhibit 10.31 to the 2016 10-K). | |
10.25 | Form of Aircraft Time Sharing Agreement (900EX) (incorporated by reference to Exhibit 10.29 to LGI Annual Report on Form 10-K filed February 13, 2013 (File No. 000-51360)(the LGI 2012 10-K)). | |
10.26 | Form of Aircraft Time Sharing Agreement (7X) (incorporated by reference to Exhibit 10.30 to the LGI 2012 10-K). | |
10.27 | Employment Agreement dated as of April 30, 2014, by and among the Registrant, LGI and Michael T. Fries (incorporated by reference to Exhibit 10.7 to the Registrant’s Quarterly Report on Form 10-Q filed May 6, 2014 (File No. 001-35961)(the May 6, 2014 10-Q)). | |
10.28 | Form of Performance Grant Award Agreement under the Incentive Plan dated as of April 30, 2014, between the Registrant and Michael T. Fries (incorporated by reference to Exhibit 10.8 to the May 6, 2014 10-Q). | |
10.29 | Form of Performance Share Units Agreement between the Registrant and our Chief Executive Officer under the Incentive Plan (incorporated by reference to Exhibit 10.1 to the Registrant’s Quarterly Report on Form 10-Q filed August 4, 2016 (File No. 001-35961)(the August 4, 2016 10-Q)). | |
10.30 | Form of Share Appreciation Rights Agreement between the Registrant and our Chief Executive Officer under the Incentive Plan (incorporated by reference to Exhibit 10.2 to the August 4, 2016 10-Q). | |
10.31 | Executive Service Agreement, dated December 15, 2004, between UPC Services Limited and Charles Bracken (incorporated by reference to Exhibit 10.36 to LGI’s Annual Report on Form 10-K filed February 24, 2010 (File No. 000-51360)). | |
10.32 | Executive Services Agreement effective January 1, 2011, between Liberty Global Europe B.V. and Diederik Karsten (incorporated by reference to Exhibit 10.45 to LGI’s Annual Report on Form 10-K filed February 24, 2011 (File No. 000-51360)). | |
10.33 | Letter Agreement dated December 12, 2016 between LGI and Bernard G. Dvorak (incorporated by reference to Exhibit 10.1 to the Registrant’s Current Report on Form 8-K filed December 14, 2016 (File No. 001-51360)). | |
10.34 | Trade Mark Licence, dated as of April 3, 2006, between Virgin Enterprises Limited and NTL Group Limited (incorporated by reference to Exhibit 10.2 to Virgin Media’s Quarterly Report on Form 10-Q filed on August 9, 2006 (File No. 000-50886)). | |
10.35 | Amendment Letter No. 1, dated February 8, 2007, to the Trade Mark Licence between Virgin Enterprises Limited and Virgin Media Limited dated April 3, 2006 (incorporated by reference to Exhibit 10.5 to Virgin Media’s Quarterly Report on Form 10-Q filed on August 8, 2007 (File No. 000-50886)). | |
10.36 | Amendment Letter No. 2, dated October 1, 2007, to the Trade Mark Licence between Virgin Enterprises Limited and Virgin Media Limited dated April 3, 2006 (incorporated by reference to Exhibit 10.6 to Virgin Media’s Quarterly Report on Form 10-Q filed on November 8, 2007 (File No. 000-50886)). | |
10.37 | Trade Mark Licence between Virgin Enterprises Limited and Virgin Media Limited dated December 16, 2009 (incorporated by reference to Exhibit 10.83 to Virgin Media’s Annual Report on Form 10-K filed on February 26, 2010 (File No. 000-50886)). | |
10.38 | Amended and Restated Contribution and Transfer Agreement, dated July 21, 2016, as amended and restated December 31, 2016, by and among, Liberty Global Europe Holding B.V., the Registrant, Vodafone International Holdings B.V., Vodafone Group Plc and Lynx Global Europe II B.V. (incorporated by reference to Exhibit 10.1 to the Registrant’s Current Report on Form 8-K filed January 6, 2017 (File No. 001-35961)(the January 2017 8-K)). | |
10.39 | Shareholders' Agreement, dated December 31, 2016, by and among, Vodafone International Holdings B.V., Vodafone Group Plc, Liberty Global Europe Holding B.V., the Registrant and Lynx Global Europe II B.V. (incorporated by reference to Exhibit 10.2 to the January 2017 8-K). | |
21 -- List of Subsidiaries* | ||
23 -- Consent of Experts and Counsel: | ||
23.1 | Consent of KPMG LLP* | |
31 -- Rule 13a-14(a)/15d-14(a) Certification: | ||
31.1 | Certification of President and Chief Executive Officer* | |
31.2 | Certification of Executive Vice President and Chief Financial Officer (Principal Financial Officer)* | |
31.3 | Certification of President and Chief Executive Officer** | |
31.4 | Certification of Executive Vice President and Chief Financial Officer (Principal Financial Officer)** | |
32 -- Section 1350 Certification† | ||
101.SCH | XBRL Taxonomy Extension Schema Document* | |
101.CAL | XBRL Taxonomy Extension Calculation Linkbase Document* | |
IV-6
101.DEF | XBRL Taxonomy Extension Definition Linkbase* | |
101.LAB | XBRL Taxonomy Extension Label Linkbase Document* | |
101.PRE | XBRL Taxonomy Extension Presentation Linkbase Document* | |
_______________
* Filed with Registrant’s Form 10-K dated February 15, 2017
** Filed herewith
† Furnished with Registrant’s Form 10-K dated February 15, 2017
IV-7
SIGNATURES
Pursuant to the requirements of Section 13 or 15(d) of the Securities Exchange Act of 1934, the Registrant has duly caused this Amendment No. 1 to be signed on its behalf by the undersigned, thereunto duly authorized.
LIBERTY GLOBAL PLC | |||
Dated: | March 28, 2017 | /s/ BRYAN H. HALL | |
Bryan H. Hall Executive Vice President, General Counsel and Secretary | |||
IV-8
LIBERTY GLOBAL PLC
SCHEDULE I
(Parent Company Information - See Notes to Consolidated Financial Statements)
CONDENSED BALANCE SHEETS
(Parent Company Only)
December 31, | |||||||
2016 | 2015 | ||||||
in millions | |||||||
ASSETS | |||||||
Current assets: | |||||||
Cash and cash equivalents | $ | 58.9 | $ | 24.6 | |||
Interest receivables — related-party | 451.5 | 446.2 | |||||
Other receivables — related-party | 338.8 | 248.6 | |||||
Other current assets | 7.3 | 10.8 | |||||
Total current assets | 856.5 | 730.2 | |||||
Long-term notes receivable — related-party | 10,537.0 | 9,727.1 | |||||
Investments in consolidated subsidiaries, including intercompany balances | 9,460.3 | 3,851.9 | |||||
Other assets, net | 16.4 | 10.6 | |||||
Total assets | $ | 20,870.2 | $ | 14,319.8 | |||
IV-9
LIBERTY GLOBAL PLC
SCHEDULE I
(Parent Company Information - See Notes to Consolidated Financial Statements)
CONDENSED BALANCE SHEETS — (Continued)
(Parent Company Only)
December 31, | |||||||
2016 | 2015 | ||||||
in millions | |||||||
LIABILITIES AND SHAREHOLDERS’ EQUITY | |||||||
Current liabilities: | |||||||
Accounts payable | $ | 34.0 | $ | 20.7 | |||
Other payables — related-party | 299.1 | 198.2 | |||||
Current portion of notes payable — related-party | 1,851.7 | 1,121.7 | |||||
Accrued liabilities and other | 17.5 | 13.5 | |||||
Total current liabilities | 2,202.3 | 1,354.1 | |||||
Long-term notes payable — related-party | 3,912.9 | 1,336.9 | |||||
Other long-term liabilities — related-party | 991.6 | 974.3 | |||||
Other long-term liabilities | 2.1 | 2.1 | |||||
Total liabilities | 7,108.9 | 3,667.4 | |||||
Commitments and contingencies | |||||||
Shareholders’ equity: | |||||||
Liberty Global Shares — Class A, $0.01 nominal value. Issued and outstanding 253,827,604 and 252,766,455 shares, respectively | 2.5 | 2.5 | |||||
Liberty Global Shares — Class B, $0.01 nominal value. Issued and outstanding 10,805,850 and 10,472,517 shares, respectively | 0.1 | 0.1 | |||||
Liberty Global Shares — Class C, $0.01 nominal value. Issued and outstanding 634,391,072 and 584,044,394 shares, respectively | 6.3 | 5.9 | |||||
LiLAC Shares — Class A, $0.01 nominal value. Issued and outstanding 50,317,930 and 12,630,580 shares, respectively | 0.5 | 0.1 | |||||
LiLAC Shares — Class B, $0.01 nominal value. Issued and outstanding 1,888,323 and 523,423 shares, respectively | — | — | |||||
LiLAC Shares — Class C, $0.01 nominal value. Issued and outstanding 120,889,034 and 30,772,874 shares, respectively | 1.2 | 0.3 | |||||
Additional paid-in capital | 17,578.2 | 14,908.1 | |||||
Accumulated deficit | (3,454.8 | ) | (5,160.1 | ) | |||
Accumulated other comprehensive earnings (loss), net of taxes | (372.4 | ) | 895.9 | ||||
Treasury shares, at cost | (0.3 | ) | (0.4 | ) | |||
Total shareholders’ equity | 13,761.3 | 10,652.4 | |||||
Total liabilities and shareholders’ equity | $ | 20,870.2 | $ | 14,319.8 | |||
IV-10
LIBERTY GLOBAL PLC
SCHEDULE I
(Parent Company Information - See Notes to Consolidated Financial Statements)
CONDENSED STATEMENTS OF OPERATIONS
(Parent Company Only)
Year ended December 31, | |||||||||||
2016 | 2015 | 2014 | |||||||||
in millions | |||||||||||
Operating costs and expenses: | |||||||||||
Selling, general and administrative (including share-based compensation) | $ | 52.9 | $ | 83.2 | $ | 43.0 | |||||
Related-party fees and allocations | 66.3 | 62.7 | 151.8 | ||||||||
Depreciation and amortization | 0.8 | 0.2 | — | ||||||||
Other operating expenses | 0.7 | 14.0 | 3.5 | ||||||||
Operating loss | (120.7 | ) | (160.1 | ) | (198.3 | ) | |||||
Non-operating income (expense): | |||||||||||
Interest expense — related-party | (162.3 | ) | (71.2 | ) | (9.6 | ) | |||||
Interest income — related-party | 781.0 | 787.3 | 821.7 | ||||||||
Realized and unrealized gains on derivative instruments, net | — | — | 13.7 | ||||||||
Foreign currency transaction gains (losses), net | 45.8 | (29.8 | ) | (58.2 | ) | ||||||
Other expense, net | (1.3 | ) | (2.5 | ) | (8.1 | ) | |||||
663.2 | 683.8 | 759.5 | |||||||||
Earnings before income taxes and equity in earnings (losses) of consolidated subsidiaries, net | 542.5 | 523.7 | 561.2 | ||||||||
Equity in earnings (losses) of consolidated subsidiaries, net | 1,279.7 | (1,574.7 | ) | (1,120.8 | ) | ||||||
Income tax expense | (116.9 | ) | (101.5 | ) | (135.4 | ) | |||||
Net earnings (loss) | $ | 1,705.3 | $ | (1,152.5 | ) | $ | (695.0 | ) | |||
IV-11
LIBERTY GLOBAL PLC
SCHEDULE I
(Parent Company Information - See Notes to Consolidated Financial Statements)
CONDENSED STATEMENTS OF CASH FLOWS
(Parent Company Only)
Year ended December 31, | |||||||||||
2016 | 2015 | 2014 | |||||||||
in millions | |||||||||||
Cash flows from operating activities: | |||||||||||
Net earnings (loss) | $ | 1,705.3 | $ | (1,152.5 | ) | $ | (695.0 | ) | |||
Adjustments to reconcile net earnings (loss) to net cash provided by operating activities: | |||||||||||
Equity in losses (earnings) of consolidated subsidiaries, net | (1,279.7 | ) | 1,574.7 | 1,120.8 | |||||||
Share-based compensation expense | 29.0 | 34.6 | 20.2 | ||||||||
Related-party fees and allocations | 66.3 | 62.7 | 151.8 | ||||||||
Depreciation and amortization | 0.8 | 0.2 | — | ||||||||
Other operating expenses | 0.7 | 14.0 | 3.5 | ||||||||
Realized and unrealized gains on derivative instruments, net | — | — | (13.7 | ) | |||||||
Foreign currency transaction losses (gains), net | (45.8 | ) | 29.8 | 58.2 | |||||||
Deferred income tax benefit | (1.7 | ) | (5.8 | ) | (3.6 | ) | |||||
Changes in operating assets and liabilities: | |||||||||||
Receivables and other operating assets | 116.8 | 146.4 | 0.2 | ||||||||
Payables and accruals | 29.0 | (34.3 | ) | (65.3 | ) | ||||||
Net cash provided by operating activities | 620.7 | 669.8 | 577.1 | ||||||||
Cash flows from investing activities: | |||||||||||
Distribution and repayments from (investments in and advances to) consolidated subsidiaries, net | (133.6 | ) | 36.4 | (368.3 | ) | ||||||
Other investing activities, net | 0.3 | (2.5 | ) | 1.8 | |||||||
Net cash provided (used) by investing activities | (133.3 | ) | 33.9 | (366.5 | ) | ||||||
Cash flows from financing activities: | |||||||||||
Borrowings of related-party debt | 5,249.8 | 11,241.9 | 1,221.5 | ||||||||
Repayments of related-party debt | (3,751.5 | ) | (9,590.7 | ) | (542.3 | ) | |||||
Repurchase of Liberty Global ordinary shares | (1,968.3 | ) | (2,320.5 | ) | (1,584.9 | ) | |||||
Proceeds (payments) associated with call option contracts, net | 9.2 | (78.3 | ) | (41.7 | ) | ||||||
Proceeds from issuance of Liberty Global shares upon exercise of options | 17.4 | 40.5 | 54.8 | ||||||||
Proceeds received from subsidiaries in connection with the issuance of Liberty Global ordinary shares | — | — | 435.1 | ||||||||
Other financing activities, net | (9.4 | ) | (9.6 | ) | (6.6 | ) | |||||
Net cash used by financing activities | (452.8 | ) | (716.7 | ) | (464.1 | ) | |||||
Effect of exchange rate changes on cash | (0.3 | ) | 0.9 | (0.5 | ) | ||||||
Net increase (decrease) in cash and cash equivalents | 34.3 | (12.1 | ) | (254.0 | ) | ||||||
Cash and cash equivalents: | |||||||||||
Beginning of period | 24.6 | 36.7 | 290.7 | ||||||||
End of period | $ | 58.9 | $ | 24.6 | $ | 36.7 | |||||
IV-12
LIBERTY GLOBAL PLC
SCHEDULE II
VALUATION AND QUALIFYING ACCOUNTS
Allowance for doubtful accounts — Trade receivables | ||||||||||||||||||||||
Balance at beginning of period | Additions to costs and expenses | Acquisitions | Impact of Dutch JV Transaction | Deductions or write-offs | Foreign currency translation adjustments | Balance at end of period | ||||||||||||||||
in millions | ||||||||||||||||||||||
Year ended December 31: | ||||||||||||||||||||||
2014 | $ | 122.6 | 119.1 | 7.9 | — | (120.5 | ) | (13.0 | ) | $ | 116.1 | |||||||||||
2015 | $ | 116.1 | 104.1 | 1.1 | — | (95.4 | ) | (10.2 | ) | $ | 115.7 | |||||||||||
2016 | $ | 115.7 | 116.2 | 86.5 | (13.0 | ) | (104.9 | ) | (7.1 | ) | $ | 193.4 | ||||||||||
IV-13
EXHIBIT INDEX
2 -- Plan of acquisition, reorganization, arrangement, liquidation or succession: | ||
2.1 | Rule 2.7 Announcement, dated November 16, 2015. (incorporated by reference to Exhibit 2.1 to the Registrant’s Current Report on Form 8-K/A filed November 18, 2015 (File No. 001-35961) (the November 2015 8-K/A)). | |
2.2 | Co-operation Agreement, dated November 16, 2015, between Liberty Global plc and Cable & Wireless Communications plc (incorporated by reference to Exhibit 2.2 to the November 2015 8-K/A). | |
3 -- Articles of Incorporation and Bylaws: | ||
3.1 | Articles of Association of Liberty Global plc, effective as of July 1, 2015 (incorporated by reference to Exhibit 3.1 to the Registrant’s Registration Statement on Form 8-A filed June 19, 2015 (File No. 001-35961)). | |
4 -- Instruments Defining the Rights of Securities Holders, including Indentures: | ||
4.1 | Senior Secured Credit Facility Agreement originally dated January 16, 2004, as amended and restated on December 19, 2016, among UPC Broadband Holding B.V. (UPC Broadband Holding) and UPC Financing Partnership (UPC Financing) as Borrowers, The Bank of Nova Scotia, as Facility Agent,the Guarantors listed therein, the Security Agent and the bank and financial institutions acceding thereto from time to time (the UPC Broadband Holding Bank Facility) (incorporated by reference to Exhibit 4.1 to the Registrant's Current Report on Form 8-K filed December 23, 2016 (File No. 001-35961)). | |
4.2 | Additional Facility AC Accession Agreement, dated November 16, 2011, among UPC Financing, as Borrower, UPC Broadband Holding, The Bank of Nova Scotia, as Facility Agent and Security Agent, and UPCB Finance V Limited, as an Additional Facility AC Lender, under the UPC Broadband Holding Bank Facility (incorporated by reference to Exhibit 4.47 to Liberty Global Inc.’s (LGI) Annual Report on Form 10-K filed February 22, 2012 (File No. 000-51360) (the LGI 2011 10-K)). | |
4.3 | Additional Facility AD Accession Agreement, dated February 7, 2012, among UPC Financing, as Borrower, UPC Broadband Holding, The Bank of Nova Scotia, as Facility Agent and Security Agent, and UPCB Finance VI Limited, as an Additional Facility AD Lender, under the UPC Broadband Holding Bank Facility (incorporated by reference to Exhibit 4.48 to the LGI 2011 10-K). | |
4.4 | Indenture dated April 15, 2015, among UPCB Finance IV Limited, The Bank of New York Mellon, London Branch as Trustee, Principal Paying Agent, Transfer Agent and Security Agent, The Bank of New York Mellon as New York Paying Agent, New York Transfer Agent and Dollar Notes Registrar and The Bank of New York Mellon (Luxembourg) S.A. as Euro Notes Registrar and Transfer Agent (incorporated by reference to Exhibit 4.1 to the Registrant’s Current Report on Form 8-K/A filed April 21, 2015 (File No. 001-35961) (the April 2015 8-K/A)). | |
4.5 | Additional Facility AK Accession Agreement, dated April 15, 2015, among UPC Financing as Borrower, The Bank of Nova Scotia as Facility Agent and Security Agent, UPC Broadband Holding and UPCB Finance IV Limited as Additional Facility AK Lender, under the UPC Broadband Holding Bank Facility (incorporated by reference to Exhibit 4.2 to the April 2015 8-K/A). | |
4.6 | Additional Facility AL Accession Agreement, dated April 15, 2015, among UPC Financing as Borrower, The Bank of Nova Scotia as Facility Agent and Security Agent, UPC Broadband Holding and UPCB Finance IV Limited as Additional Facility AL Lender, under the UPC Broadband Holding Bank Facility (incorporated by reference to Exhibit 4.3 to the April 2015 8-K/A). | |
4.7 | Additional Facility AL2 Accession Agreement, dated May 20, 2015, among UPC Financing as Borrower, The Bank of New York Nova Scotia as Facility Agent and Security Agent, UPC Broadband Holding and UPCB Finance IV Limited as Additional Facility AL2 Lender, under the UPC Broadband Holding Bank Facility (incorporated by reference to Exhibit 4.1 to the Registrant’s Current Report on Form 8-K/A filed May 21, 2015 (File No. 001-35961)). | |
4.8 | Additional Facility AM Accession Agreement, dated August 3, 2015, among UPC Financing as Borrower, The Bank of Nova Scotia as Facility Agent and Security Agent and the financial institutions listed therein as Additional Facility AM Lenders, under the UPC Broadband Holding Bank Facility (incorporated by reference to Exhibit 4.1 to the Registrant’s Current Report on Form 8-K filed August 6, 2015 (File No. 001-35961)). | |
4.9 | Additional Facility AN Accession Agreement dated August 3, 2016, between, among others, UPC Financing as Borrower and The Bank of Nova Scotia as Facility Agent and Security Agent and the financial institutions listed therein as Additional Facility AN Lenders under the UPC Broadband Holding Bank Facility (incorporated by reference to Exhibit 4.1 to the Registrant’s Current Report on Form 8-K filed August 3, 2016 (File No. 001-35961)). | |
4.10 | Additional Facility AO Accession Agreement dated November 23, 2016, between, among others, UPC Financing as Borrower, UPC Broadband Holding, The Bank of Nova Scotia as Facility Agent and Security Agent and the financial institutions listed therein as Additional Facility AO Lenders, under the UPC Broadband Holding Bank Facility (incorporated by reference to Exhibit 4.1 to the Registrant’s Current Report on Form 8-K filed November 30, 2016 (File No. 001-35961)). | |
4.11 | Additional Facility AP Accession Agreement dated February 2, 2017, between, among others, UPC Financing as the Borrower, UPC Broadband Holding and The Bank of Nova Scotia as the Facility Agent and Security Agent under the UPC Broadband Holding Bank Facility (incorporated by reference to Exhibit 4.2 to the Registrant’s Current Report on Form 8-K filed February 7, 2017 (File No. 001-35961)). | |
4.12 | €2,300,000,000 Credit Agreement, originally dated August 1, 2007, and as amended and restated by supplemental agreements dated August 22, 2007, September 11, 2007, October 8, 2007, June 23, 2009, August 25, 2009, October 4, 2010 and as further amended and restated on November 2, 2015 among Telenet N.V. as Borrower, The Bank of Nova Scotia N.V. as Facility Agent, the parties listed therein as Original Guarantors, ABN AMRO Bank N.V., BNP Paribas S.A. and J.P. Morgan PLC as Mandated Lead Arrangers, KBC Bank N.V. as Security Agent, and the financial institutions listed therein as Initial Original Lenders (the Telenet Credit Facility) (incorporated by reference to Exhibit 4.1 to the Registrant’s Current Report on Form 8-K filed November 6, 2015 (File No. 000-35961)). | |
4.13 | Telenet Additional Facility U Accession Agreement, dated August 16, 2012, among, inter alia, Telenet International Finance S.a.r.l (Telenet International) as Borrower, Telenet N.V. and Telenet International as Guarantors, The Bank of Nova Scotia as Facility Agent, KBC Bank N.V. as Security Agent and the financial institutions listed therein as additional Facility U Lenders, under the Telenet Credit Facility (incorporated by reference to Exhibit 4.2 to LGI’s Quarterly Report on Form 10-Q filed November 5, 2012 (File No. 000-51360) (the LGI November 5, 2012 10-Q)). | |
4.14 | Telenet Additional Facility V Accession Agreement, dated August 16, 2012, among, inter alia, Telenet International as Borrower, Telenet N.V. and Telenet International as Guarantors, The Bank of Nova Scotia as Facility Agent, KBC Bank N.V. as Security Agent and the financial institutions listed therein as additional Facility V Lenders, under the Telenet Credit Facility (incorporated by reference to Exhibit 4.3 to the LGI November 5, 2012 10-Q). | |
4.15 | Telenet Additional Facility X Accession Agreement, dated April 11, 2014, among, inter alia, Telenet International as Borrower, Telenet N.V. and Telenet International as Guarantors, The Bank of Nova Scotia as Facility Agent, KBC Bank N.V. as Security Agent and the financial institutions listed therein as Additional Facility X Lenders, under the Telenet Credit Facility (incorporated by reference to Exhibit 4.3 to the Registrant’s Current Report on Form 8-K filed April 15, 2014 (File No. 001-35961)). | |
4.16 | Additional Facility Z Accession Agreement, dated May 7, 2015, between, among others, Telenet International as Borrower, Telenet N.V., The Bank of Nova Scotia as Facility Agent, KBC Bank N.V. Security Agent and The Royal Bank of Scotland PLC, Societe Generale, London Branch, Deutsche Bank AG, London Branch, Credit Suisse AG, London Branch, ScotiaBank Europe PLC and Goldman Sachs Bank USA as Additional Facility Z Lenders, under the Telenet Credit Facility (incorporated by reference to Exhibit 4.1 to the Registrant’s Current Report on Form 8-K filed May 13, 2015 (File No. 001-35961)). | |
4.17 | Telenet Additional Facility X2 Accession Agreement, dated July 1, 2015, among inter alia, Telenet International as Borrower, Telenet N.V. and Telenet International as Guarantors, The Bank of Nova Scotia as Facility Agent, KBC Bank N.V. as Security Agent and the financial institutions listed therein as Additional Facility X2 Lenders, under the Telenet Credit Facility (incorporated by reference to Exhibit 4.1 to the Registrant’s Current Report on Form 8-K filed July 8, 2015 (File No. 001-35961)). | |
4.18 | Telenet Additional Facility AB Accession Agreement, dated July 24, 2015, among, inter alia, Telenet International as Borrower, Telenet N.V. and Telenet International as Guarantors, and the other parties thereto, under the Telenet Credit Facility (incorporated by reference to Exhibit 4.1 to the Registrant's Current Report on Form 8-K filed July 30, 2015 (File No. 001-35061)). | |
4.19 | Telenet Additional Facility AE Accession Agreement dated November 3, 2016, among, inter alia, Telenet International as Borrower, The Bank of Nova Scotia as Facility Agent, KBC Bank N.V. as Security Agent and the financial institutions listed therein as Additional Facility AE Lenders, under the Telenet Credit Facility (incorporated by reference to Exhibit 4.1 to the Registrant’s Current Report on Form 8-K filed November 10, 2016 (File No. 001-35961) (the November 2016 8-K)). | |
4.20 | Telenet Additional Facility AF Accession Agreement dated November 3, 2016 among, inter alia, Telenet Financing USD LLC, The Bank of Nova Scotia as Facility Agent, KBC Bank N.V. as Security Agent and the financial institutions listed therein as Additional Facility AF Lenders, under the Telenet Credit Facility (incorporated by reference to Exhibit 4.2 to the November 2016 8-K). | |
4.21 | Telenet Additional Facility AG Accession Agreement dated November 22, 2016, among, inter alia, Telenet International, The Bank of Nova Scotia as Facility Agent, KBC Bank N.V. as Security Agent and the financial institutions listed therein as Additional Facility AG Lenders, under the Telenet Credit Facility (incorporated by reference to Exhibit 4.1 to the Registrant’s Current Report on Form 8-K filed November 29, 2016 (File No. 001-35961)). | |
4.22 | Indenture dated December 14, 2012, between Unitymedia Hessen GmbH & Co. KG, Unitymedia NRW GmbH, The Bank of New York Mellon, London Branch, as Trustee, Transfer Agent and Principal Paying Agent, The Bank of New York Mellon as Paying Agent in New York, The Bank of New York Mellon (Luxembourg) S.A. as Registrar and Credit Suisse AG, London Branch, as Security Trustee (incorporated by reference to Exhibit 4.1 to the Registrant's Current Report on Form 8-K filed December 20, 2012 (File No. 000-51360)). | |
4.23 | Indenture dated December 17, 2014, between Unitymedia Hessen GmbH & Co. KG, Unitymedia NRW GmbH, The Bank of New York Mellon, London Branch, as Trustee, Transfer Agent and Principal Paying Agent, The Bank of New York Mellon as New York Paying Agent and New York Transfer Agent, The Bank of New York Mellon (Luxembourg) S.A. as Registrar and Credit Suisse AG, London Branch, as Security Trustee (incorporated by reference to Exhibit 4.1 to the Registrant's Current Report on Form 8-K/A filed December 18, 2014 (File No. 001-35961)). | |
4.24 | Indenture, dated as of March 3, 2011, among Virgin Media Secured Finance PLC, the Guarantors party thereto, The Bank of New York Mellon as Trustee and Paying Agent and The Bank of New York Mellon (Luxembourg) S.A. as Luxembourg Paying Agent (incorporated by reference to Exhibit 4.1 to Virgin Media Inc.’s (Virgin Media) Current Report on Form 8-K filed on March 3, 2011 (File No. 000-50886). | |
4.25 | Indenture dated February 22, 2013, between, among others, Lynx I Corp., as Issuer, The Bank of New York Mellon, London Branch, as Trustee, Transfer Agent and Principal Paying Agent and The Bank of New York Mellon, as Paying Agent and Newco Security Trustee (incorporated by reference to Exhibit 4.1 to LGI’s Current Report on Form 8-K/A filed February 27, 2013 (File No. 000-51360) (the LGI February 2013 8-K/A). | |
4.26 | Indenture, dated as of February 22, 2013, among Lynx II Corp., as Issuer, The Bank of New York Mellon, London Branch, as trustee, Transfer Agent and Principal Paying Agent and The Bank of New York Mellon, as Paying Agent and Newco Security Trustee (incorporated by reference to Exhibit 4.2 to the LGI February 2013 8-K/A). | |
4.27 | First Supplemental Indenture, dated as of June 7, 2013, between, among others, Virgin Media Secured Finance PLC, Virgin Media Inc. (Virgin Media) and The Bank of New York Mellon as Trustee, to the Indenture dated as of March 3, 2011 for Virgin Media 5.25% Senior Secured Notes and 5.50% Senior Secured Notes each due 2021 (incorporated by reference to Exhibit 4.12 to the Registrant’s Current Report on Form 8-K filed June 12, 2013 (File No. 001-35961)(the June 2013 8-K)). | |
4.28 | Accession Agreement, dated as of June 7, 2013, among Virgin Media Secured Finance PLC as Acceding Issuer, Lynx I Corp. and The Bank of New York Mellon, as Trustee (incorporated by reference to Exhibit 4.13 to the June 2013 8-K). | |
4.29 | First Supplemental Indenture, dated as of June 7, 2013, between, among others, Virgin Media Secured Finance PLC and The Bank of New York Mellon as Trustee, to the Indenture dated as of February 22, 2013 for Lynx I Corp. 5⅜% Senior Secured Notes and 6.00% Senior Secured Notes each due 2021 (incorporated by reference to Exhibit 4.15 to the June 2013 8-K). | |
4.30 | Accession Agreement, dated as of June 7, 2013, among Lynx II Corp., Virgin Media Finance PLC and The Bank of New York Mellon as Trustee and Paying Agent (incorporated by reference to Exhibit 4.16 to the June 2013 8-K). | |
4.31 | First Supplemental Indenture, dated June 7, 2013, between, among others, Virgin Media Finance PLC, Virgin Media and The Bank of New York Mellon, as Trustee and Paying Agent, to the Indenture dated as of February 22, 2013 Lynx II Corp. 6⅜% Senior Notes and 7.00% Senior Notes each due 2023 (incorporated by reference to Exhibit 4.18 to the June 2013 8-K). | |
4.32 | Amendment dated June 14, 2013, to the Senior Facilities Agreement, between, and among others, Virgin Media Investment Holdings Limited, certain other subsidiaries of Virgin Media and the lenders thereto (incorporated by reference to Exhibit 4.1 to the Registrant’s Current Report on Form 8-K filed June 21, 2013 (File No. 001-35961)). | |
4.33 | Senior Facilities Agreement, dated as of June 7, 2013, as amended on June 14, 2013 and as amended and restated on July 30 2015, among, inter alia, Virgin Media Finance PLC, certain other subsidiaries of Virgin Media and the lenders thereto (the VMF Senior Facilities Agreement) (incorporated by reference to Exhibit 4.13 to the Registrant’s Quarterly Report on Form 10-Q filed August 4, 2015 (File No. 001-35061)). | |
4.34 | Indenture dated March 28, 2014 between Virgin Media Secured Finance PLC, The Bank of New York Mellon, London Branch, as Trustee, Transfer Agent and Principal Paying Agent, The Bank of New York Mellon as Paying Agent, and The Bank of New York Mellon (Luxembourg) S.A., as Registrar (incorporated by reference to Exhibit 4.1 to the Registrant’s Current Report on Form 8-K/A filed April 3, 2014 (File No. 001-35961)). | |
4.35 | Virgin Additional Facility E Accession Agreement, dated April 17, 2014, among, inter alia, Virgin Media SFA Finance Limited as Borrower, certain other subsidiaries of Virgin Media, The Bank of Nova Scotia as Facility Agent and the financial institutions listed therein as Additional Facility E Lenders, under the VMF Senior Facilities Agreement (incorporated by reference to Exhibit 4.2 to the Registrant’s Current Report on Form 8-K filed April 23, 2014 (File No. 001-35961)). | |
4.36 | Indenture dated January 28, 2015 between Virgin Media Secured Finance PLC, The Bank of New York Mellon, London Branch, as Trustee and Paying Agent and The Bank of New York Mellon (Luxembourg) S.A., as Registrar and Transfer Agent (incorporated by reference to Exhibit 4.1 to the Registrant’s Current Report on Form 8-K/A filed February 3, 2015 (File No. 001-35961) (the February 2015 8-K/A)). | |
4.37 | Indenture dated January 28, 2015 between Virgin Media Finance PLC, The Bank of New York Mellon, London Branch, as Trustee and Principal Paying Agent, The Bank of Mellon as Paying Agent and Dollar Notes Transfer Agent and Registrar and The Bank of New York Mellon (Luxembourg) S.A., as Euro Notes Registrar and Transfer Agent (incorporated by reference to Exhibit 4.2 to the February 2015 8-K/A). | |
4.38 | Additional I Facility Accession Deed dated December 16, 2016, among Virgin Media Investment Holdings Limited, Virgin Media Bristol LLC as Borrower, The Bank of Nova Scotia as Facility Agent, and The Bank of Nova Scotia as Additional I Facility Lender, under the VMF Senior Facilities Agreement (incorporated by reference to Exhibit 4.1 to the Registrant’s Current Report on Form 8-K filed December 22, 2016 (File No. 001-35961)(the December 2016 8-K)). | |
4.39 | Amendment letter dated December 16, 2016, between Virgin Media Investment Holdings Limited and The Bank of Nova Scotia as the Facility Agent, amending the VMF Senior Facilities Agreement (incorporated by reference to Exhibit 4.2 to the December 2016 8-K). | |
4.40 | Additional J Facility Accession Deed dated February 2, 2017, between Virgin Media Investment Holdings Limited as the Company, Virgin Media SFA Finance Limited as the Borrower, The Bank of Nova Scotia as the Facility Agent and The Bank of Nova Scotia as Additional J Facility Lender under the VMF Senior Facilities Agreement (incorporated by reference to Exhibit 4.1 to the Registrant’s Current Report on Form 8-K filed February 7, 2017 (File No. 001-35961)). | |
4.41 | Indenture dated January 24, 2014, between VTR Finance B.V., The Bank of New York Mellon, London Branch, as Trustee and Security Agent, and The Bank of New York Mellon as Paying Agent, Registrar and Transfer Agent (incorporated by reference to Exhibit 4.1 to the Registrant’s Current Report on Form 8-K filed January 24, 2014 (File No. 001-35961)). | |
4.42 | Credit Agreement, dated May 16, 2016, among LGE Coral Holdco Limited, Sable International Finance Limited and Coral-US Co-Borrower LLC as Initial Borrowers, The Bank of Nova Scotia as Administrative Agent, L/C Issuer and Swing Line Lender and FirstCaribbean International Bank (Bahamas) Limited, BNP Paribas Fortis SA/NV and Royal Bank of Canada as Alternative L/C Issuers, the other lenders a party thereto from time to time (the Coral Credit Agreement)(incorporated by reference to Exhibit 4.1 to the Registrant’s Current Report on Form 8-K filed May 20, 2016 (File No. 001-35961)(the May 2016 8-K)). | |
4.43 | Indenture dated March 31, 2014, among Columbus International Inc., each of the Guarantors a party thereto, The Bank of New York Mellon as Trustee and The Bank of New York Mellon (Luxembourg) S.A. as Luxembourg Transfer Agent and Paying Agent (incorporated be reference to Exhibit 4.2 to the May 2016 8-K). | |
4.44 | Indenture dated August 5, 2015, among Sable International Finance Limited as Issuer, each of the Guarantors a party thereto, Deutsche Bank Trust Company Americas as Trustee, Principal Paying Agent, Registrar and Transfer Agent and Deutsche Bank Luxembourg, S.A. as Luxembourg Paying Agent and (Regulation S) Transfer Agent (incorporated by reference to Exhibit 4.3 to the May 2016 8-K). | |
4.45 | First Supplemental Indenture dated November 23, 2015, among Sable International Finance Limited as Issuer, each of the Guarantors a party thereto, and Deutsche Bank Trust Company Americas as Trustee, Principal Paying Agent, Registrar and Transfer Agent (incorporated by reference to Exhibit 4.4 to the May 2016 8-K). | |
4.46 | First Supplemental Indenture dated March 10, 2015, among Columbus International Inc. as Issuer, each of the Guarantors a party thereto, and The Bank of New York Mellon as Trustee (incorporated by reference to Exhibit 4.5 to the May 2016 8-K). | |
4.47 | Joinder Agreement dated October 7, 2016, among Sable International Finance Limited and Coral-US Co-Borrower LLC as Borrowers, the other Guarantors party thereto, The Bank of Nova Scotia as Administrative Agent and Security Trustee, and the financial institutions party thereto as Revolving Credit Lenders (incorporated by reference to Exhibit 4.1 to the Registrant’s Current Report on Form 8-K filed October 13, 2016 (File No. 001-35961)). | |
4.48 | Joinder Agreement, dated November 18, 2016, among Sable International Finance Limited and Coral US Co-Borrower LLC as Borrowers, the other Guarantors party thereto, The Bank of Nova Scotia, as Administrative Agent and Security Trustee, and the financial institutions party thereto as Additional Term B-1B Facility Lenders (as defined therein) under the Coral Credit Agreement (incorporated by reference to Exhibit 4.1 to the Registrant’s Current Report on Form 8-K filed November 23, 2016 (File No. 001-35961)). | |
4.49 | Amended and Restated First Lien Credit Agreement dated as of July 7, 2014, among Liberty Cablevision of Puerto Rico LLC (Liberty Puerto Rico), the Guarantors party thereto from time to time, The Bank of Nova Scotia, as Administrative Agent, each lender form time to time party thereto and Scotiabank de Puerto Rico as L/C Issuer and Swing Line Lender (incorporated by reference to Exhibit 4.1 to the Registrant’s Current Report on Form 8-K filed July 2, 2015 (File No. 001-35961) (the July 2015 8-K)). | |
4.50 | Amended and Restated Second Lien Credit Agreement dated as of July 7, 2014, among Liberty Puerto Rico, the Guarantors party thereto from time to time, The Bank of Nova Scotia as Administrative Agent, and each lender from time to time party thereto (incorporated by reference to Exhibit 4.2 to the July 2015 8-K). | |
4.51 | Additional Term B-1 Facility Joinder Agreement dated as of June 1, 2015, among Liberty Puerto Rico, The Bank of Nova Scotia as Administrative Agent and Collateral Agent and the Additional Term B-1 Facility Lenders party thereto (incorporated by reference to Exhibit 4.3 to the July 2015 8-K). | |
4.52 | Additional Term B-2 Facility Joinder Agreement dated as of June 1, 2015, among Liberty Puerto Rico, The Bank of Nova Scotia as Administrative Agent and Collateral Agent and the Additional Term B-2 Facility Lenders party thereto (incorporated by reference to Exhibit 4.4 to the July 2015 8-K). | |
The Registrant undertakes to furnish to the Securities and Exchange Commission, upon request, a copy of all instruments with respect to long-term debt not filed herewith. | ||
10 -- Material Contracts: | ||
10.1 | Deed of Assumption of Liberty Global plc, dated June 7, 2013 (incorporated by reference to Exhibit 10.1 to the Registrant’s Current Report on Form 8-K filed June 7, 2013 (File No. 001-35961)(the June 7, 2013 8-K)). | |
10.2 | Liberty Global 2014 Incentive Plan Effective March 1, 2014 as amended and restated February 24, 2015 (the Incentive Plan) (incorporated by reference to Exhibit 10.1 to the Registrant’s Quarterly Report on Form 10-Q filed May 7, 2015 (File No. 001-35961)). | |
10.3 | Liberty Global 2014 Nonemployee Director Incentive Plan Effective March 1, 2014 (the Director Plan) (incorporated by reference to Appendix B to the Registrant’s Proxy Statement on Schedule 14A filed December 19, 2013 (File No. 001-35961)). | |
10.4 | Form of Performance Share Units Agreement under the Incentive Plan (incorporated by reference to Exhibit 10.6 to the Registrant’s Quarterly Report on Form 10-Q filed May 6, 2014 (File No. 001-35961)). | |
10.5 | Form of Performance Share Units Agreement under the Incentive Plan (incorporated by reference to Exhibit 10.1 to the Registrant’s Quarterly Report on Form 10-Q filed August 4, 2015 (File No. 001-35961)). | |
10.6 | Form of Non-Qualified Share Option Agreement under the Director Plan (incorporated by reference to Exhibit 10.3 to the Registrant’s Quarterly Report on Form 10-Q filed August 5, 2014 (File No. 001-35961) (the August 5, 2014 10-Q)). | |
10.7 | Form of Restricted Share Units Agreement under the Director Plan (incorporated by reference to Exhibit 10.4 to the August 5, 2014 10-Q). | |
10.8 | Form of Share Appreciation Rights Agreement under the Incentive Plan (incorporated by reference to Exhibit 10.5 to the August 5, 2014 10-Q). | |
10.9 | Form of Restricted Share Units Agreement under the Incentive Plan (incorporated by reference to Exhibit 10.6 to the August 5, 2014 10-Q). | |
10.10 | Liberty Global, Inc. 2005 Incentive Plan (as amended and restated effective June 7, 2013) (the 2005 Incentive Plan) (incorporated by reference to Exhibit 10.2 to the June 7, 2013 8-K). | |
10.11 | Liberty Global, Inc. 2005 Nonemployee Director Incentive Plan (as amended and restated effective June 7, 2013) (the 2005 Director Plan) (incorporated by reference to Exhibit 10.3 to the June 7, 2013 8-K). | |
10.12 | Virgin Media 2010 Stock Incentive Plan (as amended and restated effective June 7, 2013) (incorporated by reference to Exhibit 10.4 to the June 7, 2013 8-K). | |
10.13 | Form of Non-Qualified Share Option Agreement under the 2005 Director Plan (incorporated by reference to Exhibit 10.6 to the Registrant’s Quarterly Report on Form 10-Q filed August 1, 2013 (File No. 001-35961)). | |
10.14 | Liberty Global Compensation Policy for Nonemployee Directors effective June 26, 2014 (incorporated by reference to Appendix A to the Registrant’s Proxy Statement on Schedule 14A filed April 30, 2014 (File No. 001-35961)). | |
10.15 | Form of Deed of Indemnity between Liberty Global and its Directors and Executive Officers (incorporated by reference to Exhibit 10.10 to the June 7, 2013 8-K). | |
10.16 | Form of Stock Appreciation Rights Agreement under the 2005 Incentive Plan (incorporated by reference to Exhibit 10.3 to LGI’s Quarterly Report on Form 10-Q filed May 7, 2008 (File No. 000-51360) (the LGI May 7, 2008 10-Q)). | |
10.17 | Liberty Global 2015 Annual Cash Performance Award Program for executive officers under the Incentive Plan (description of said program is incorporated by reference to the description thereof included in Item 5.02(e) of the Registrant’s Current Report on Form 8-K filed March 25, 2015 (File No. 001-35961) (the March 2015 8-K)). | |
10.18 | Liberty Global 2015 Performance Incentive Plan for executive officers under the Incentive Plan (a description of said plan is incorporated by reference to the description thereof included in Item 5.02(e) of the March 2015 8-K). | |
10.19 | Liberty Global 2016 Annual Cash Performance Award Program for executive officers under the Incentive Plan (description of said program is incorporated by reference to the description thereof included in Item 5.02(e) of the Registrant’s Current Report on Form 8-K filed March 14, 2016 (File No. 001-35961)). | |
10.20 | Liberty Global 2016 Performance Incentive Plan for executive officers under the Incentive Plan (a description of said plan is incorporated by reference to the description thereof included in Item 5.02(e) of the Registrant’s Current Report on Form 8-K filed February 9, 2016 (File No. 001-35961)). | |
10.21 | Form of Performance Share Units Agreement for executive officers under the Incentive Plan (incorporated by reference to Exhibit 10.4 to the Registrant’s Quarterly Report on Form 10-Q filed May 9, 2016 (File No. 000-51360)). | |
10.22 | Deferred Compensation Plan (adopted effective December 15, 2008; Amended and Restated as of October 26, 2015)(incorporated by reference to Exhibit 10.29 to the Registrant’s Annual Report on Form 10-K filed February 12, 2016 (File No. 001-35961)(the 2016 10-K)). | |
10.23 | Nonemployee Director Deferred Compensation Plan (As Amended and Restated Effective December 11, 2015)(incorporated by reference to Exhibit 10.30 to the 2016 10-K)). | |
10.24 | Personal Usage of Aircraft Policy, restated June 7, 2013 (incorporated by reference to Exhibit 10.31 to the 2016 10-K). | |
10.25 | Form of Aircraft Time Sharing Agreement (900EX) (incorporated by reference to Exhibit 10.29 to LGI Annual Report on Form 10-K filed February 13, 2013 (File No. 000-51360)(the LGI 2012 10-K)). | |
10.26 | Form of Aircraft Time Sharing Agreement (7X) (incorporated by reference to Exhibit 10.30 to the LGI 2012 10-K). | |
10.27 | Employment Agreement dated as of April 30, 2014, by and among the Registrant, LGI and Michael T. Fries (incorporated by reference to Exhibit 10.7 to the Registrant’s Quarterly Report on Form 10-Q filed May 6, 2014 (File No. 001-35961)(the May 6, 2014 10-Q)). | |
10.28 | Form of Performance Grant Award Agreement under the Incentive Plan dated as of April 30, 2014, between the Registrant and Michael T. Fries (incorporated by reference to Exhibit 10.8 to the May 6, 2014 10-Q). | |
10.29 | Form of Performance Share Units Agreement between the Registrant and our Chief Executive Officer under the Incentive Plan (incorporated by reference to Exhibit 10.1 to the Registrant’s Quarterly Report on Form 10-Q filed August 4, 2016 (File No. 001-35961)(the August 4, 2016 10-Q)). | |
10.30 | Form of Share Appreciation Rights Agreement between the Registrant and our Chief Executive Officer under the Incentive Plan (incorporated by reference to Exhibit 10.2 to the August 4, 2016 10-Q). | |
10.31 | Executive Service Agreement, dated December 15, 2004, between UPC Services Limited and Charles Bracken (incorporated by reference to Exhibit 10.36 to LGI’s Annual Report on Form 10-K filed February 24, 2010 (File No. 000-51360)). | |
10.32 | Executive Services Agreement effective January 1, 2011, between Liberty Global Europe B.V. and Diederik Karsten (incorporated by reference to Exhibit 10.45 to LGI’s Annual Report on Form 10-K filed February 24, 2011 (File No. 000-51360)). | |
10.33 | Letter Agreement dated December 12, 2016 between LGI and Bernard G. Dvorak (incorporated by reference to Exhibit 10.1 to the Registrant’s Current Report on Form 8-K filed December 14, 2016 (File No. 001-51360)). | |
10.34 | Trade Mark Licence, dated as of April 3, 2006, between Virgin Enterprises Limited and NTL Group Limited (incorporated by reference to Exhibit 10.2 to Virgin Media’s Quarterly Report on Form 10-Q filed on August 9, 2006 (File No. 000-50886)). | |
10.35 | Amendment Letter No. 1, dated February 8, 2007, to the Trade Mark Licence between Virgin Enterprises Limited and Virgin Media Limited dated April 3, 2006 (incorporated by reference to Exhibit 10.5 to Virgin Media’s Quarterly Report on Form 10-Q filed on August 8, 2007 (File No. 000-50886)). | |
10.36 | Amendment Letter No. 2, dated October 1, 2007, to the Trade Mark Licence between Virgin Enterprises Limited and Virgin Media Limited dated April 3, 2006 (incorporated by reference to Exhibit 10.6 to Virgin Media’s Quarterly Report on Form 10-Q filed on November 8, 2007 (File No. 000-50886)). | |
10.37 | Trade Mark Licence between Virgin Enterprises Limited and Virgin Media Limited dated December 16, 2009 (incorporated by reference to Exhibit 10.83 to Virgin Media’s Annual Report on Form 10-K filed on February 26, 2010 (File No. 000-50886)). | |
10.38 | Amended and Restated Contribution and Transfer Agreement, dated July 21, 2016, as amended and restated December 31, 2016, by and among, Liberty Global Europe Holding B.V., the Registrant, Vodafone International Holdings B.V., Vodafone Group Plc and Lynx Global Europe II B.V. (incorporated by reference to Exhibit 10.1 to the Registrant’s Current Report on Form 8-K filed January 6, 2017 (File No. 001-35961)(the January 2017 8-K)). | |
10.39 | Shareholders' Agreement, dated December 31, 2016, by and among, Vodafone International Holdings B.V., Vodafone Group Plc, Liberty Global Europe Holding B.V., the Registrant and Lynx Global Europe II B.V. (incorporated by reference to Exhibit 10.2 to the January 2017 8-K). | |
21 -- List of Subsidiaries* | ||
23 -- Consent of Experts and Counsel: | ||
23.1 | Consent of KPMG LLP* | |
31 -- Rule 13a-14(a)/15d-14(a) Certification: | ||
31.1 | Certification of President and Chief Executive Officer* | |
31.2 | Certification of Executive Vice President and Chief Financial Officer (Principal Financial Officer)* | |
31.3 | Certification of President and Chief Executive Officer** | |
31.4 | Certification of Executive Vice President and Chief Financial Officer (Principal Financial Officer)** | |
32 -- Section 1350 Certification† | ||
101.SCH | XBRL Taxonomy Extension Schema Document* | |
101.CAL | XBRL Taxonomy Extension Calculation Linkbase Document* | |
101.DEF | XBRL Taxonomy Extension Definition Linkbase* | |
101.LAB | XBRL Taxonomy Extension Label Linkbase Document* | |
101.PRE | XBRL Taxonomy Extension Presentation Linkbase Document* | |
_______________
* Filed with Registrant’s Form 10-K dated February 15, 2017
** Filed herewith
† Furnished with Registrant’s Form 10-K dated February 15, 2017