Attached files
| file | filename |
|---|---|
| 8-K - Genie Energy Ltd. | f8k_genieenergy.htm |
Exhibit 99.1

Genie Energy Ltd (NYSE: GNE) Investor Presentation March 2017

2 2 2 Safe Harbor Statement This presentation contains forward - looking statements. Statements that are not historical facts are forward - looking statements and such forward - looking statements are statements made pursuant to the Safe Harbor Provisions of the Private Securities Litigation Reform Act of 1995. Examples of forward - looking statements include: • statements about Genie’s and its divisions’ future performance; • projections of Genie’s and its divisions’ results of operations or financial condition; • statements regarding Genie’s plans, objectives or goals, including those relating to its strategies, initiatives, competition, acquisitions, dispositions and/or its products; and • expectations concerning the permitting, timing and development of Genie’s shale oil projects. Words such as "believe," "anticipate," "plan," "expect," "intend," "target," "estimate," "project," "predict," "forecast," "g uid eline," "aim," "will," "should," “likely,” "continue" and similar expressions are intended to identify forward - looking statements but ar e not the exclusive means of identifying such statements. Readers are cautioned not to place undue reliance on these forward - looking statements and all such forward - looking statements are qualified in their entirety by reference to the following cautionary statements. Forward - looking statements are based on Genie’s current expectations, estimates and assumptions and because forward - looking statements address future results, events and conditions, they, by their very nature, involve inherent risks and uncertainties, many of which are unforeseeable and beyond the Genie’s control. Such known and unknown risks, uncertainties and other factors may cause Genie’s actual results, performance or other achievements to differ materially from the anticipat ed results, performance or achievements expressed, projected or implied by these forward - looking statements. These factors include those discussed under the headings "Risk Factors" and “Management’s Discussion and Analysis of Financial Condition and Results of Operations in Genie’s periodic filings made with the Securities and Exchange Commission. Genie cautions that such factors are not exhaustive and that other risks and uncertainties may cause actual results to differ materially from those in forward - looking statements. Forward - looking statements speak only as of the date they are made and are statements of Genie’s current expectations concerning future results, events and conditions and Genie is under no obligation to update any of the forward - looking statements, whether as a result of new information, future events or otherwise. See “Cautionary Statements Regarding Oil and Gas Quantities” on page 3. 2

3 3 3 Cautionary Statements Regarding Oil and Gas Quantities The Securities and Exchange Commission (“SEC”) permits oil and gas companies, in their filings with the SEC, to disclose only proved, probable and possible reserves that meet the SEC’s definitions for such terms, and price and cost sensitivities for s uch reserves, and prohibits disclosure of resources that do not constitute such reserves. The Company uses the terms reserve or resource “potential,” “upside,” “oil and gas in place” or “OGIP,” “OIP” or “GIP,” and other descriptions of volumes of reserves potentially recoverable through additional drilling or recovery techniques that the SEC’s rules may prohibit the Company from including in filings with the SEC. These estimates are by their nature more speculative than estimates of proved, probable and possible reserves and accordingly are subject to substantially greater risk of being actually realized b y the Company. 3

4 4 4 Genie Energy: At a Glance 4 Genie Energy Ltd. (NYSE:GNE) Genie Retail Energy Afek Oil & Gas Genie Energy Common Stock Symbol NYSE: GNE Stock Price* $6.18 Shares Outstanding 24.7 million Dividend Yield 4.9% Market Capitalization $152 million Genie Energy Series 2012-A Preferred Stock Symbol NYSE: GNEPRA Stock Price* $7.50 Shares Outstanding 2.3 million Dividend Yield 8.5% Cash** $47.1 million Debt $0.0 Revenue (TTM)*** $212.1 million Loss from operations (TTM)*** $(30.5) million Adjusted EBITDA (TTM)*** $14.7 million Full time employees 240 *Market data as of 3/27/2017 ** Includes cash, cash equivalents and restricted cash as of 12/31/2016 ***TTM - Twelve months ended 12/31/2016

5 Genie Retail Energy is a leading retail energy provider (REP) • Founded in 2004, now among the largest independent residential REPs • Growing multiple - brand strategy, expanding into new geographic markets • History of strong and consistent financial performance Value proposition • Purchases electricity and natural gas in wholesale markets for resale • Delivery remains responsibility of incumbent utility • Customers: Power of choice, value added services and potential savings • Utilities: Removes load - based risk, fees for services Managed - risk model • Residential and small business customers • Focus on markets with REP - favorable regulatory environments • Asset – light business model minimizes capital - at - risk Genie Retail Energy - Overview

6 In November 2016, acquired Town Square Energy: • All cash deal - $9.5 million plus $1.6 million for net working capital • Introduced a strong, well - regarded new brand into the GRE portfolio • Provided 43,000 electric meters and 47,000 RCEs • Significantly expanded footprint to four new states (MA, NH, CN, RI) and new utility territories in OH • Strategic competency in meter acquisition through digital marketing channels Key Recent Developments

7 7 7 Meter and RCE Performance METERS RESIDENTIAL CUSTOMER EQUIVALENTS (RCEs) COMMENTARY • 2014: First half Polar Vortex increases churn. Second half stabilization • 2015 - 2016: Strong sequential electric meter, RCE growth and new territories • 2016: Acquired Town Square Energy in fourth quarter • 2017: Returning to healthy organic meter growth 7

8 8 8 Customer Portfolio RESIDENTIAL CUSTOMER EQUIVALENTS (RCEs) as of 12/31/16 8

9 9 9 Genie Retail Energy Markets 9

10 10 10 GRE Results of Operations 10 COMMENTARY • Strong financial performance with three consecutive years of significant improvements in Adjusted EBITDA • All customer acquisition and marketing costs expensed in the period incurred • Diminimus CAPEX and D&A expense • Seasonality: Q2 and Q4 shoulder periods between peak heating and cooling seasons (USD in millions) 1Q15 2Q15 3Q15 4Q15 1Q16 2Q16 3Q16 4Q16 2014 2015 2016 Revenue $75.2 $40.3 $53.0 $44.6 $58.9 $44.6 $57.2 $51.5 $281.0 $213.1$212.1 Gross Profit 16.5 13.4 21.2 15.5 24.0 18.1 20.2 14.6 49.4 66.6 76.9 SG&A 13.7 13.9 13.3 14.6 13.4 12.9 12.3 11.8 44.8 55.6 50.4 Income (Loss) from Operations 2.8 (0.5) 7.9 0.9 10.7 5.2 7.9 2.7 1.0 11.1 26.5 Adjusted EBITDA 2.9 (0.2) 8.1 1.0 10.9 5.3 8.0 3.1 4.9 11.8 27.3

11 11 11 Afek Oil & Gas 11 396 km 2 • In April 2013, Afek was awarded an exclusive exploration license covering 396.5 in the southern portion of Israel’s Golan Heights • Analysis of previously drilled well and geophysical surveys indicated the potential for substantial volumes of oil in place • Over the course of 2015 - 2016, drilled five exploration wells and conducted two well flow tests

12 12 12 Afek Oil & Gas 12 • Afek is preparing to drill a sixth well (Ness 10) in the Northern portion of its license area • Reprocessed seismic and other data indicate the potential for a significant discovery: • Source rock identified in the southern portion of the license area is present • Deeper deposit indicative of higher maturation • Subsurface structures provide the potential for reservoir trapping

13 13 13 Genie Energy – Investment Thesis REP business with excellent growth prospects • Abundant organic meter growth opportunities through geographic expansion, deeper market penetration and strategic acquisitions • Strong balance sheet available to support additional expansion with minimal dilution Upside potential from Oil and Gas Exploration in Israel • Afek Oil and Gas has identified a potential resource in its exclusive license area • Exploratory drilling program ongoing • High capital investment phase of project nearing completion Attractive dividend • Supported by cash generation of a proven REP and strong, liquid balance sheet • Recently increased common dividend - yield currently ~5 % 13

14 14 14 Genie Energy P&L 14 (USD in millions) 1Q15 2Q15 3Q15 4Q15 1Q16 2Q16 3Q16 4Q16 2014 2015 2016 Revenue $75.2 $40.3 $53.0 $44.6 $58.9 $44.6 $57.2 $51.5 $281.0$213.1$212.1 Gross Profit 16.5 13.4 21.2 15.5 24.0 18.1 20.2 14.6 49.4 66.6 76.9 SG&A 16.6 16.5 15.9 17.0 16.0 15.9 14.9 14.7 61.4 66.0 61.6 Exploration and R&D 1.6 1.3 1.5 2.2 1.7 1.4 1.3 1.6 0.0 6.6 6.1 Equity in the Loss of AMSO,LLC --- --- (0.1) (0.3) (0.2) --- --- --- 0.0 (0.4) (0.2) Income (Loss) from Operations (2.4) (4.9) 3.3 (4.2) 6.0 1.9 (37.1) (1.3) (28.2) (8.3) (30.5) Adjusted EBITDA (1.1) (3.2) 4.6 (3.0) 7.3 1.9 5.2 0.3 (13.9) (2.7) 14.7

Reconciliation of Non - GAAP Financials Reconciliation of Non - GAAP Financial Measures In addition to including financial results that are determined in accordance with generally accepted accounting principles in th e United States of America (GAAP), Genie Energy ’ s investor presentation included Adjusted EBITDA, which is a non - GAAP financial measure. Generally, a non - GAAP financial measure is a numerical measure of a company ’ s performance, financial position, or cash flows that either excludes or includes amounts that are not normally excluded or i ncl uded in the most directly comparable measure calculated and presented in accordance with GAAP. Genie ’ s measure of Adjusted EBITDA consists of gross profit less selling, general and administrative expense and research and devel opm ent expense. Another way of calculating Adjusted EBITDA is to start with income (loss) from operations and add (1) depreciation and amortization, (2) sev erance and other charges (3) Non - cash compensation. These additions and deductions are non - cash and/or non - routine items in the relevant 2016, 2014, and 2013 per iods. Management believes that Genie ’ s Adjusted EBITDA measure provides useful information to both management and investors by excluding certain expenses and non - routine gains or losses that may not be indicative of Genie ’ s or the relevant segment ’ s core operating results. Management uses Adjusted EBITDA, among other measures, as a relevant indicator of core operational strengths in its financial and operational decision making. In addition , m anagement uses Adjusted EBITDA to evaluate operating performance in relation to Genie ’ s competitors. Disclosure of this financial measure may be useful to investors in evaluating performance and allows for greater transparency to the underlying supplemental information used by management in its financial and operationa l d ecision - making. Adjusted EBITDA may also be an indicator of the strength and performance of Genie ’ s and the segment ’ s ongoing business operations, including the ability to fund capital expenditures, and meet working capital needs from current operations (as opposed to cash resources), and to incur and service de bt. Management refers to Adjusted EBITDA, as well as the GAAP measures gross profit and income (loss) from operations, on a segme nt and/or consolidated level to facilitate internal and external comparisons to the segments ’ and Genie's historical operating results, in making operating decisions, for budget and planning purposes, and to form the basis upon which management is compensated. Severance and other charges are also excluded in the calculation of Adjusted EBITDA. Severance and other charges are reflecti ve of decisions made by management in each period regarding the aspects of Genie ’ s and its segments ’ businesses to be focused on in light of changing market realities and other factors. In addition, severance and other charges have substantially decreased and are expected to remain at reduced levels for the foreseeable fut ure . While there may be similar charges in other periods, the nature and magnitude of these charges can fluctuate markedly and do not reflect the performance of Geni e ’ s core and continuing operations. The other calculation of Adjusted EBITDA consists of gross profit less selling, general and administrative expense, and resea rch and development expense. As the other excluded items are not reflected in this calculation, they are excluded automatically and there is no need to make addi tio nal adjustments. This calculation results in the same Adjusted EBITDA amount and its utility and significance is as explained above. Adjusted EBITDA should be considered in addition to, not as a substitute for, or superior to, gross profit, income (loss) fro m o perations, cash flow from operating activities, net income (loss) or other measures of liquidity and financial performance prepared in accordance with GAAP. In a ddi tion, Genie ’ s measurement of Adjusted EBITDA may not be comparable to similarly titled measures reported by other companies. Following are reconciliations of Adjusted EBITDA to the most directly comparable GAAP measure for both Genie Energy and the Genie Retail Energy segment. 15
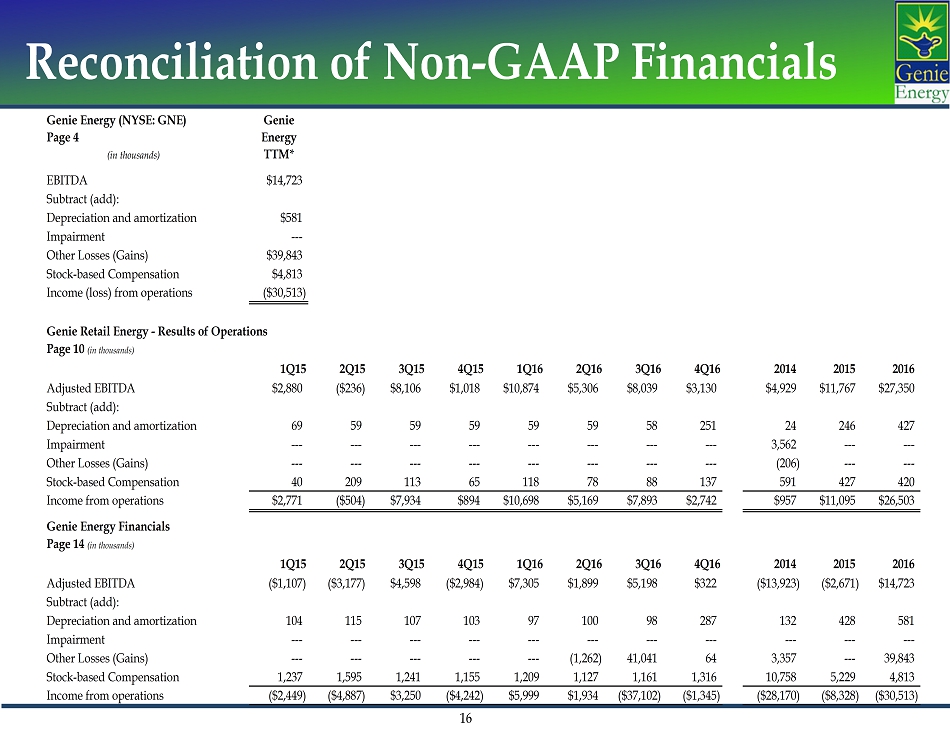
Reconciliation of Non - GAAP Financials 16 Genie Energy (NYSE: GNE) Genie Page 4 Energy (in thousands) TTM* EBITDA $14,723 Subtract (add): Depreciation and amortization $581 Impairment --- Other Losses (Gains) $39,843 Stock-based Compensation $4,813 Income (loss) from operations ($30,513) Genie Retail Energy - Results of Operations Page 10 (in thousands) 1Q15 2Q15 3Q15 4Q15 1Q16 2Q16 3Q16 4Q16 2014 2015 2016 Adjusted EBITDA $2,880 ($236) $8,106 $1,018 $10,874 $5,306 $8,039 $3,130 $4,929 $11,767 $27,350 Subtract (add): Depreciation and amortization 69 59 59 59 59 59 58 251 24 246 427 Impairment --- --- --- --- --- --- --- --- 3,562 --- --- Other Losses (Gains) --- --- --- --- --- --- --- --- (206) --- --- Stock-based Compensation 40 209 113 65 118 78 88 137 591 427 420 Income from operations $2,771 ($504) $7,934 $894 $10,698 $5,169 $7,893 $2,742 $957 $11,095 $26,503 Genie Energy Financials Page 14 (in thousands) 1Q15 2Q15 3Q15 4Q15 1Q16 2Q16 3Q16 4Q16 2014 2015 2016 Adjusted EBITDA ($1,107) ($3,177) $4,598 ($2,984) $7,305 $1,899 $5,198 $322 ($13,923) ($2,671) $14,723 Subtract (add): Depreciation and amortization 104 115 107 103 97 100 98 287 132 428 581 Impairment --- --- --- --- --- --- --- --- --- --- --- Other Losses (Gains) --- --- --- --- --- (1,262) 41,041 64 3,357 --- 39,843 Stock-based Compensation 1,237 1,595 1,241 1,155 1,209 1,127 1,161 1,316 10,758 5,229 4,813 Income from operations ($2,449) ($4,887) $3,250 ($4,242) $5,999 $1,934 ($37,102) ($1,345) ($28,170) ($8,328) ($30,513)

Avi Goldin Chief Financial Officer agoldin@genie.com Michael Stein Chief Operating Officer CEO, Genie Retail Energy mstein@genie.com