Attached files
| file | filename |
|---|---|
| 8-K - 8-K - EQT Corp | a17-9864_18k.htm |
Exhibit 99.1
Analyst Presentation March 27, 2017
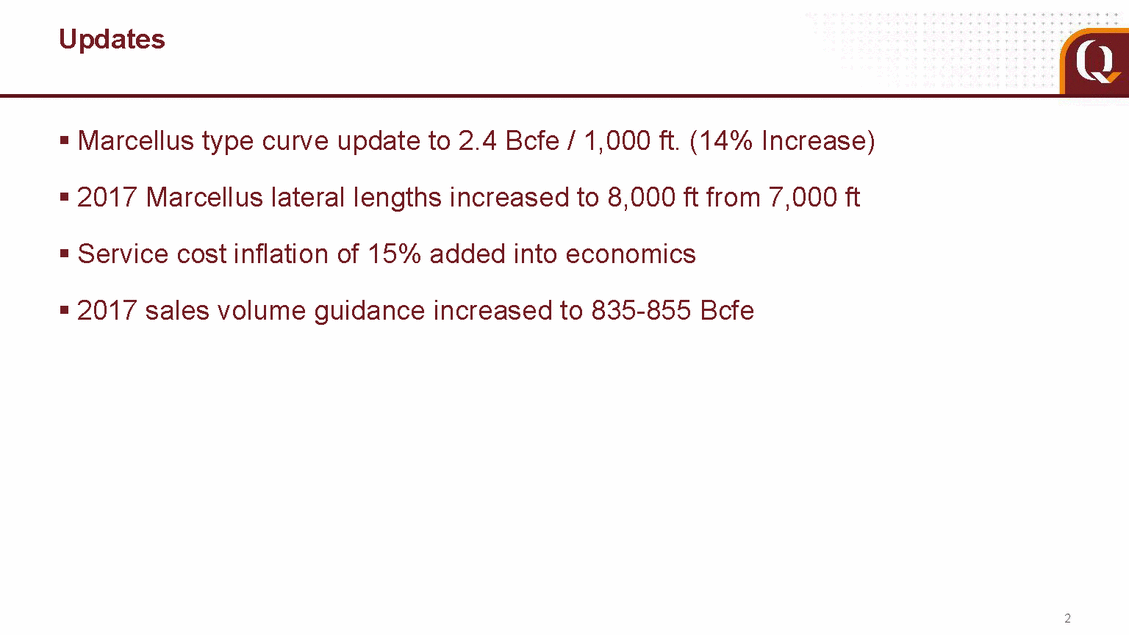
Updates Marcellus type curve update to 2.4 Bcfe / 1,000 ft. (14% Increase) 2017 Marcellus lateral lengths increased to 8,000 ft from 7,000 ft Service cost inflation of 15% added into economics 2017 sales volume guidance increased to 835-855 Bcfe 2
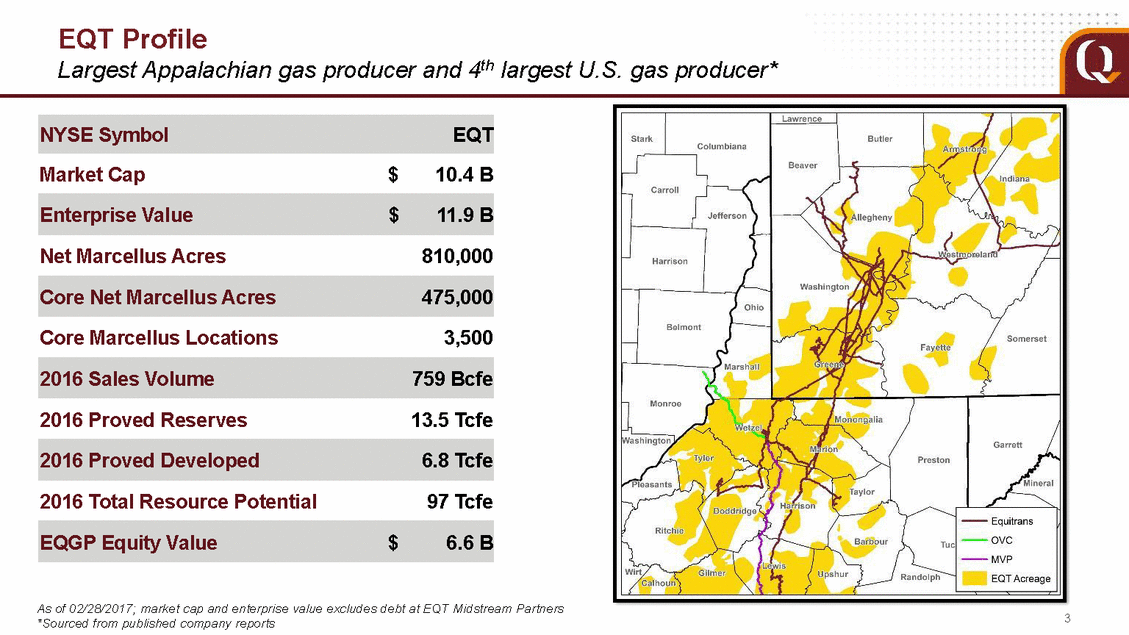
EQT Profile Largest Appalachian 4th gas producer and largest U.S. gas producer* Market Cap $ 10.4 B Net Marcellus Acres 810,000 Core Marcellus Locations 3,500 2016 Proved Reserves 13.5 Tcfe 2016 Total Resource Potential 97 Tcfe As of 02/28/2017; market cap and enterprise value excludes debt at EQT Midstream Partners *Sourced from published company reports 3 EQGP Equity Value$6.6 B 2016 Proved Developed6.8 Tcfe 2016 Sales Volume759 Bcfe Core Net Marcellus Acres475,000 Enterprise Value$11.9 B NYSE SymbolEQT
Key Investment Highlights Sustainable growth while delivering returns through full cycle Focus on development of Marcellus 12% projected production sales volume growth in 2017 2017 drilling sets up projected growth of 15-20% for 2018-2020+ Industry leading cost structure Consolidation improves returns Increasing lateral lengths through consolidation EQM opportunities for further growth Pipeline capacity portfolio assures market access and improved Strong balance sheet Cash flows from EQGP to double over next three years Delineating Utica position – significant potential upside Strong balance sheet and liquidity basis 4
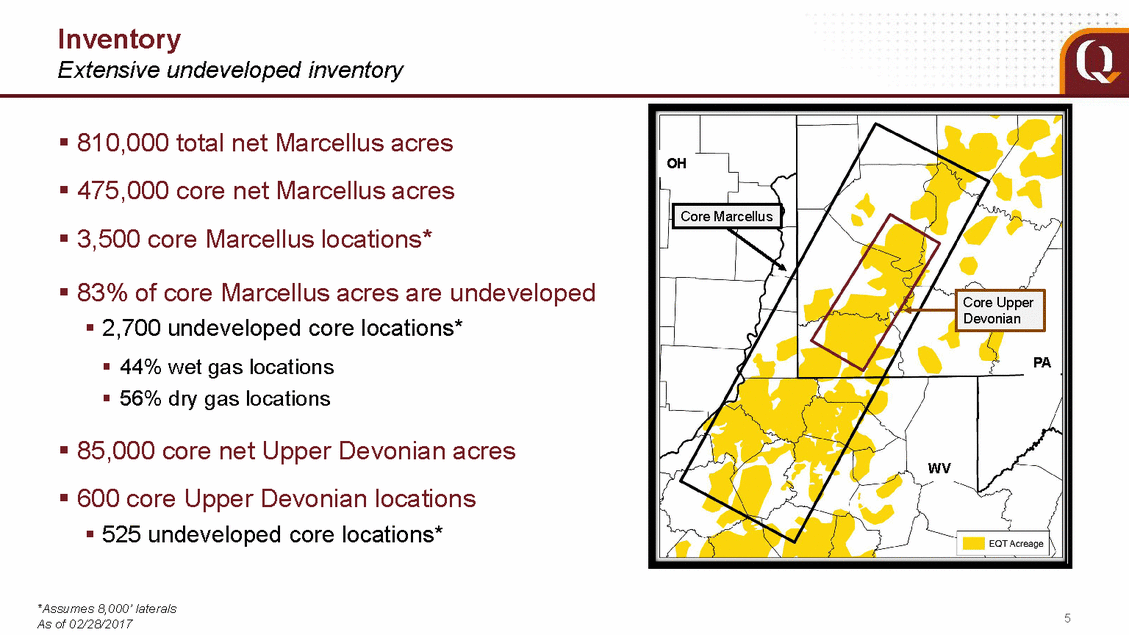
Inventory Extensive undeveloped inventory 810,000 total net Marcellus acres 475,000 core net Marcellus acres 3,500 core Marcellus locations* OH 83% of core Marcellus acres are undeveloped 2,700 undeveloped core locations* 44% wet gas locations 56% dry gas locations PA 85,000 core net Upper Devonian acres 600 core Upper Devonian locations 525 undeveloped core locations* WV *Assumes 8,000’ laterals As of 02/28/2017 5 Core Upper Devonian Core Marcellus
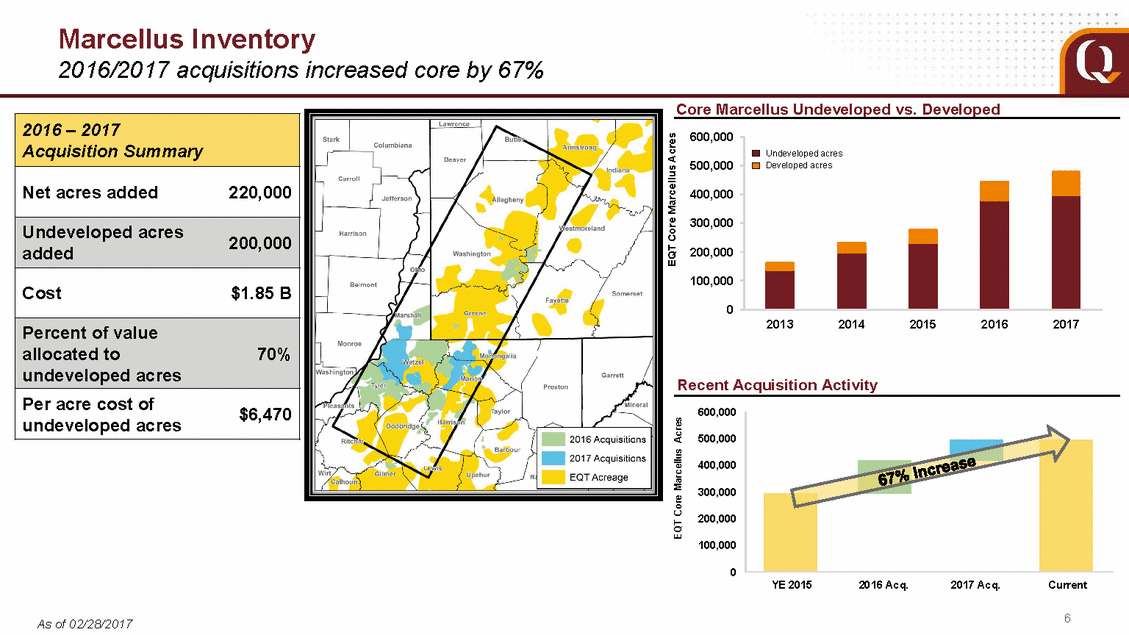
Marcellus Inventory 2016/2017 acquisitions increased core by 67% Core Marcellus Undeveloped vs. Developed 600,000 500,000 400,000 300,000 200,000 100,000 0 2013 2014 2015 2016 2017 Recent Acquisition Activity $6,470 600,000 undeveloped acres 500,000 400,000 300,000 200,000 100,000 0 YE 2015 2016 Acq. 2017 Acq. Current 6 As of 02/28/2017 EQT Core Marcellus Acres EQT Core Marcellus Acres Undeveloped acres Developed acres 2016 – 2017 Acquisition Summary Net acres added220,000 Undeveloped acres added200,000 Cost$1.85 B Percent of value allocated to70% undeveloped acres Per acre cost of
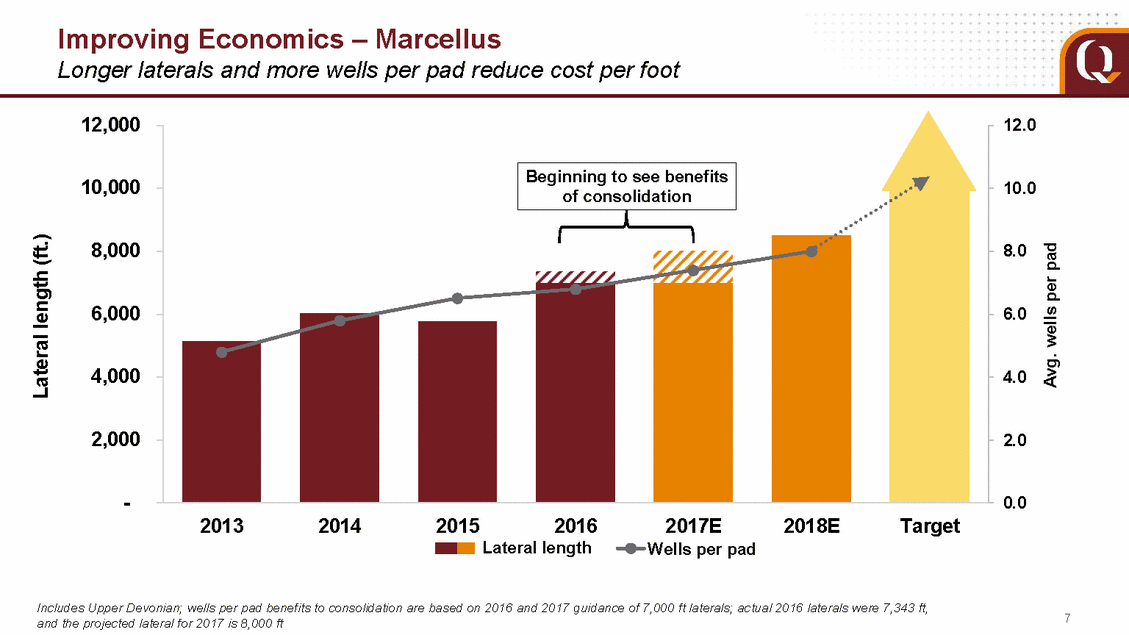
Improving Economics – Marcellus Longer laterals and more wells per pad reduce cost per foot 12,000 12.0 10,000 10.0 8,000 8.0 6,000 6.0 4,000 4.0 2,000 2.0 - 0.0 2013 2014 2015 2016 Lateral length 2017E Wells per pad 2018E Target Includes Upper Devonian; wells per pad benefits to consolidation are based on 2016 and 2017 guidance of 7,000 ft laterals; actual 2016 laterals were 7,343 ft, and the projected lateral for 2017 is 8,000 ft 7 Lateral length (ft.) Avg. wells per pad Beginning to see benefits of consolidation
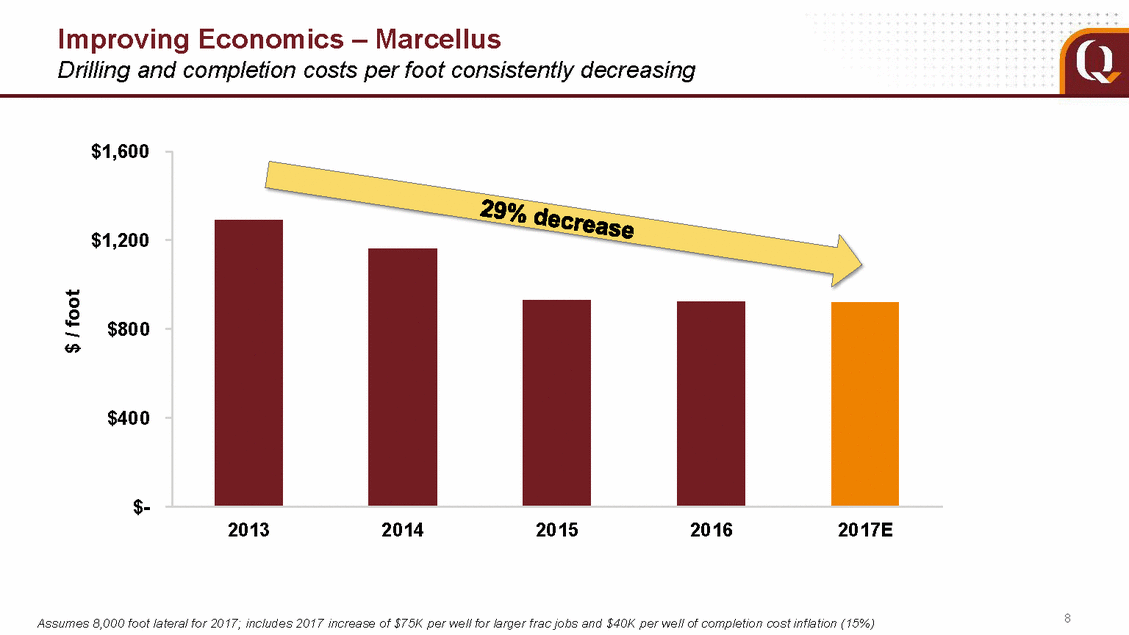
Improving Economics – Marcellus Drilling and completion costs per foot consistently decreasing $1,600 $1,200 $800 $400 $-2013 2014 2015 2016 2017E 8 Assumes 8,000 foot lateral for 2017; includes 2017 increase of $75K per well for larger frac jobs and $40K per well of completion cost inflation (15%) $ / foot
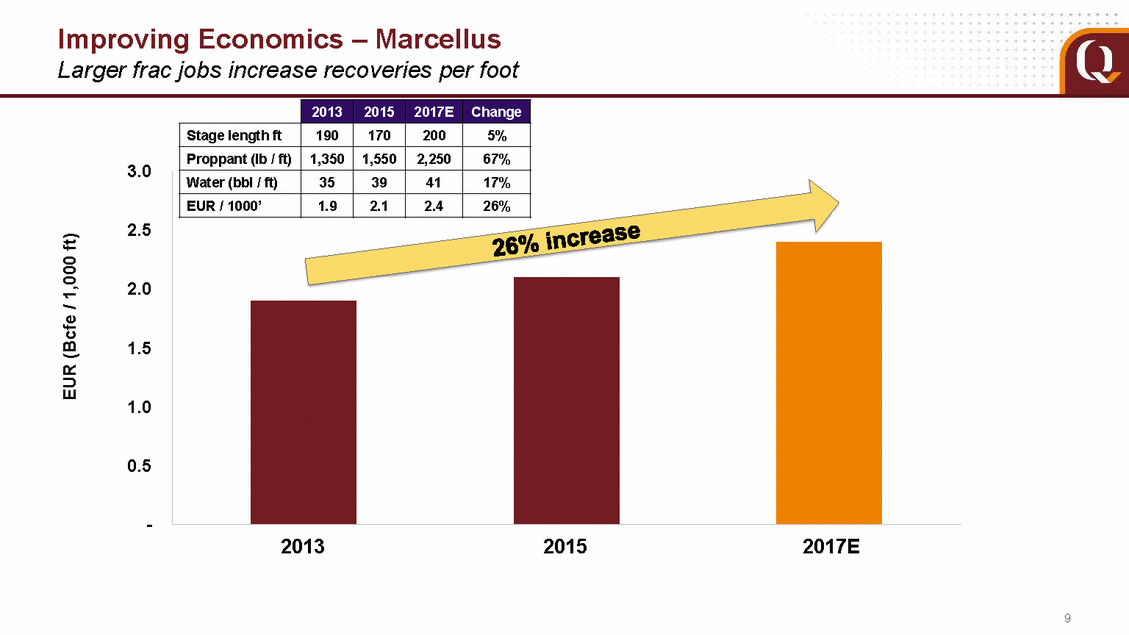
Improving Economics – Marcellus Larger frac jobs increase recoveries per foot 3.0 2.5 2.0 1.5 1.0 0.5 - 2013 2015 2017E 9 EUR (Bcfe / 1,000 ft) 2013 2015 2017E Change Stage length ft 190 170 200 5% Proppant (lb / ft) 1,350 1,550 2,250 67% Water (bbl / ft) 35 39 41 17% EUR / 1000’ 1.9 2.1 2.4 26%
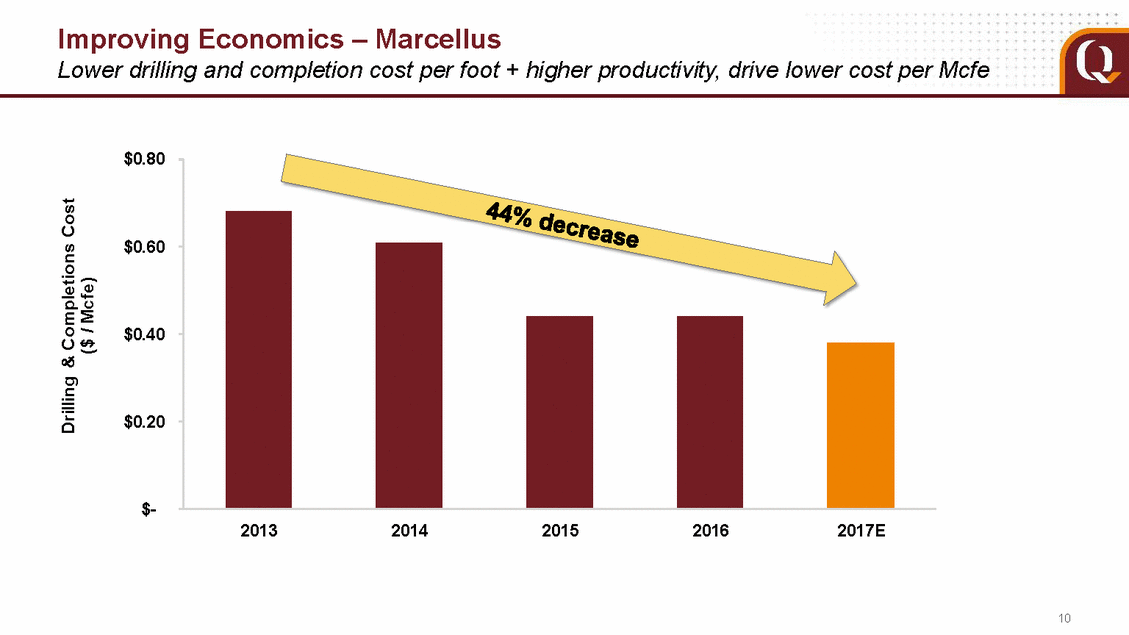
Improving Economics – Marcellus Lower drilling and completion cost per foot + higher productivity, drive lower cost per Mcfe $0.80 $0.60 $0.40 $0.20 $-2013 2014 2015 2016 2017E 10 Drilling & Completions Cost ($ / Mcfe)
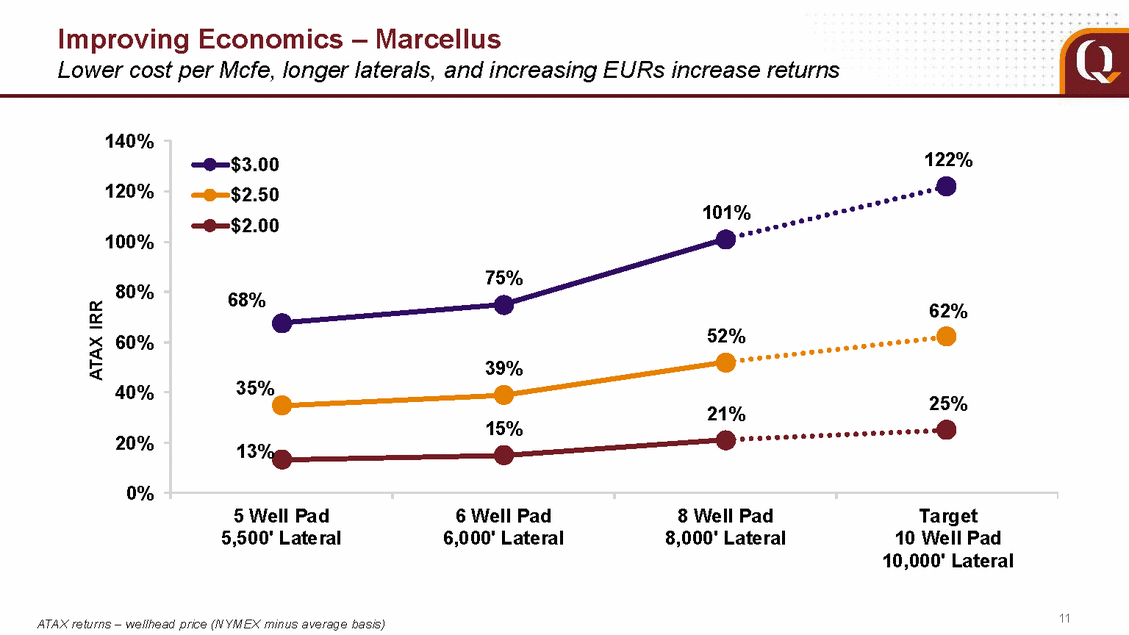
Improving Economics – Marcellus Lower cost per Mcfe, longer laterals, and increasing EURs increase returns 140% 120% 101% 100% 80% 60% 40% 25% 21% 20% 0% 5 Well Pad 5,500' Lateral 6 Well Pad 6,000' Lateral 8 Well Pad 8,000' Lateral Target 10 Well Pad 10,000' Lateral 11 ATAX returns – wellhead price (NYMEX minus average basis) ATAX IRR $3.00122% $2.50 $2.00 75% 68%62% 52% 39% 35% 15% 13%
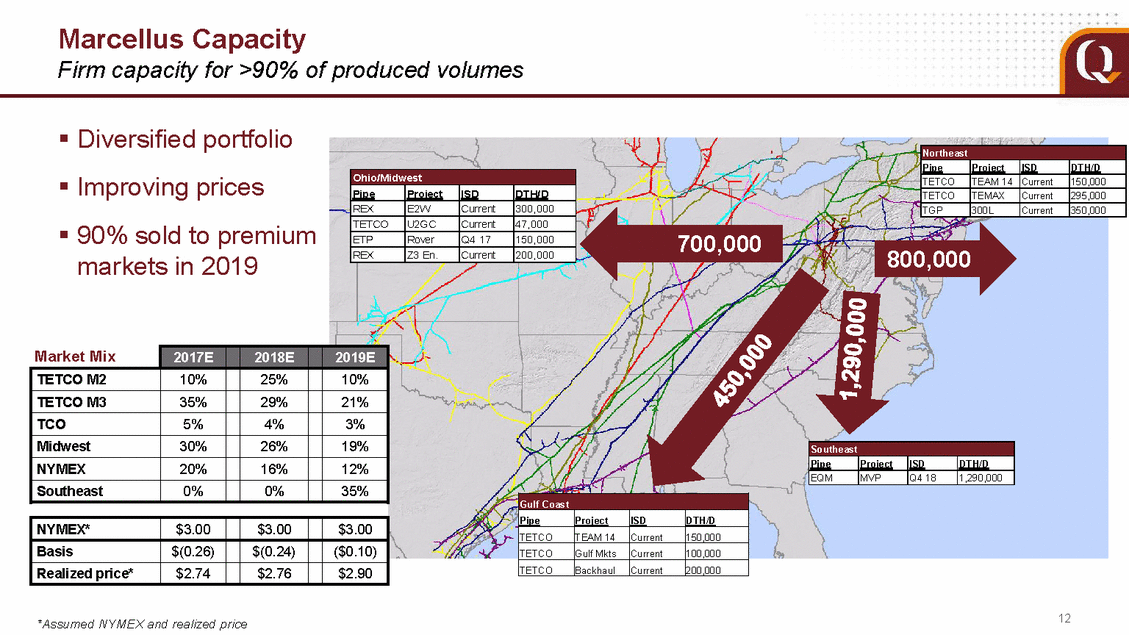
Marcellus Capacity Firm capacity for >90% of produced volumes Diversified portfolio Improving prices 90% sold to premium 700,000 800,000 markets in 2019 12 *Assumed NYMEX and realized price NYMEX* $3.00 $3.00 $3.00 Basis $(0.26) $(0.24) ($0.10) Realized price* $2.74 $2.76 $2.90 Gulf Coast Pipe Project ISD DTH/D TETCO TEAM 14 Current 150,000 TETCO Gulf Mkts Current 100,000 TETCO Backhaul Current 200,000 Southeast Pipe Project ISD DTH/D EQM MVP Q4 18 1,290,000 Market Mix 2017E 2018E 2019E TETCO M2 10% 25% 10% TETCO M3 35% 29% 21% TCO 5% 4% 3% Midwest 30% 26% 19% NYMEX 20% 16% 12% Southeast 0% 0% 35% Ohio/Midwest Pipe Project ISD DTH/D REX E2W Current 300,000 TETCO U2GC Current 47,000 ETP Rover Q4 17 150,000 REX Z3 En. Current 200,000 Northeast Pipe Project ISD DTH/D TETCO TEAM 14 Current 150,000 TETCO TEMAX Current 295,000 TGP 300L Current 350,000
2017 Capital and Development Plan Focus on core Marcellus development OH 2017 capital investments of $1.5 B* $1.3 B for well development 207 wells in 2017 Average laterals of 8,000 ft Funding with operating cash cash-on-hand** PA flow of $1.3 billion, plus Focus on Marcellus Co-develop Upper Devonian Average 13 wells per pad in 2017 WV De-risk Utica Target returns equal to or greater than core Marcellus *Excludes EQT Midstream Partners 13 **See slide 23 for important disclosures regarding adjusted operating cash flow attributable to EQT, a non-GAAP financial measure Development wells Spuds PA Marcellus 76 WV Marcellus 43 PA Upper Devonian 81 Total Marcellus/Upper Devonian 200 Test wells Utica 7 Total 2017 207 Core Upper Devonian Core Marcellus
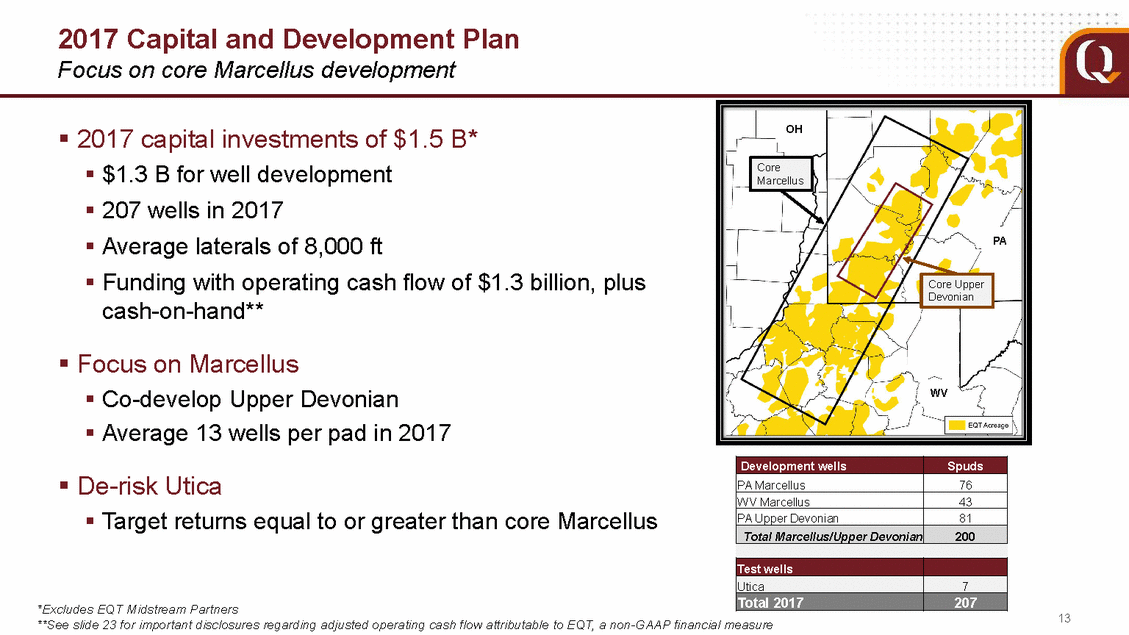
Proven and Sustainable Growth 15-20% growth 2018 through 2020+ 1,600 1,400 1,200 1,000 800 600 400 200 - 2013 2014 2015 2016 2017P 2018F 2019F 2020F 14 26% CAGR for years 2013-2016; 18% CAGR 2017P-2020F Bcfe
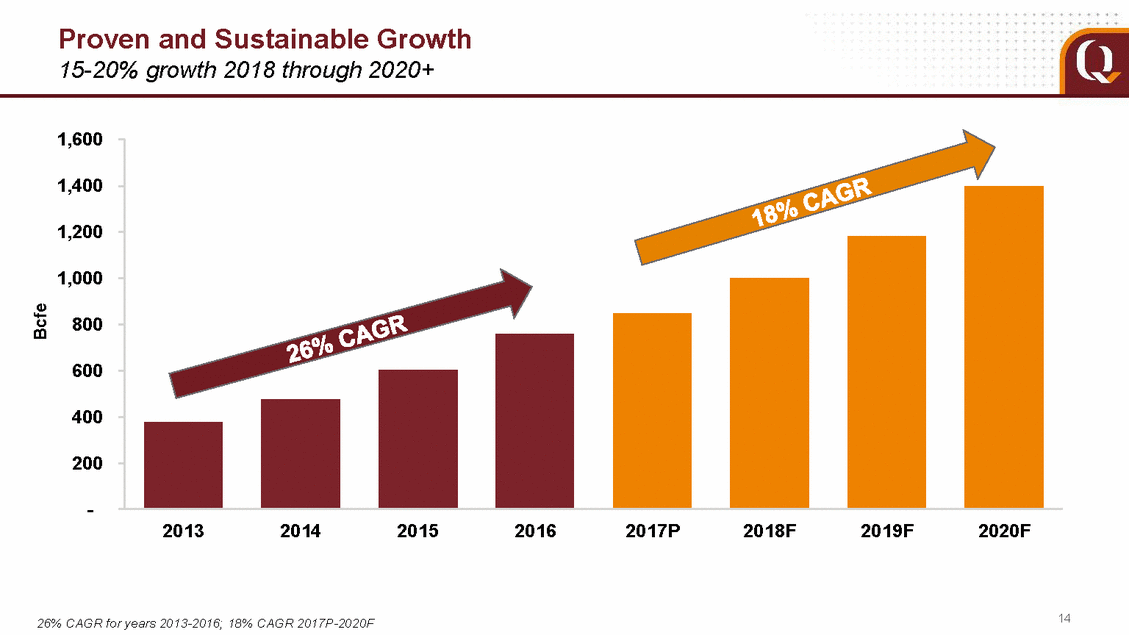
Utica Upside Possibility Improve EUR to 3.0 – 3.5 Bcfe per 1,000 feet in 2017 500,000 EQT net acres 3,000 locations 6 wells online 6 – 8 wells in 2017 30 Tcfe total resource potential* Goal EUR of 3.0-3.5 Bcfe per match Marcellus returns $12-$14 MM cost per well** 1,000 feet to *As of 12/31/2016 **Target costs for 5,400 foot lateral 15 Utica 2016 wells 2017 wells
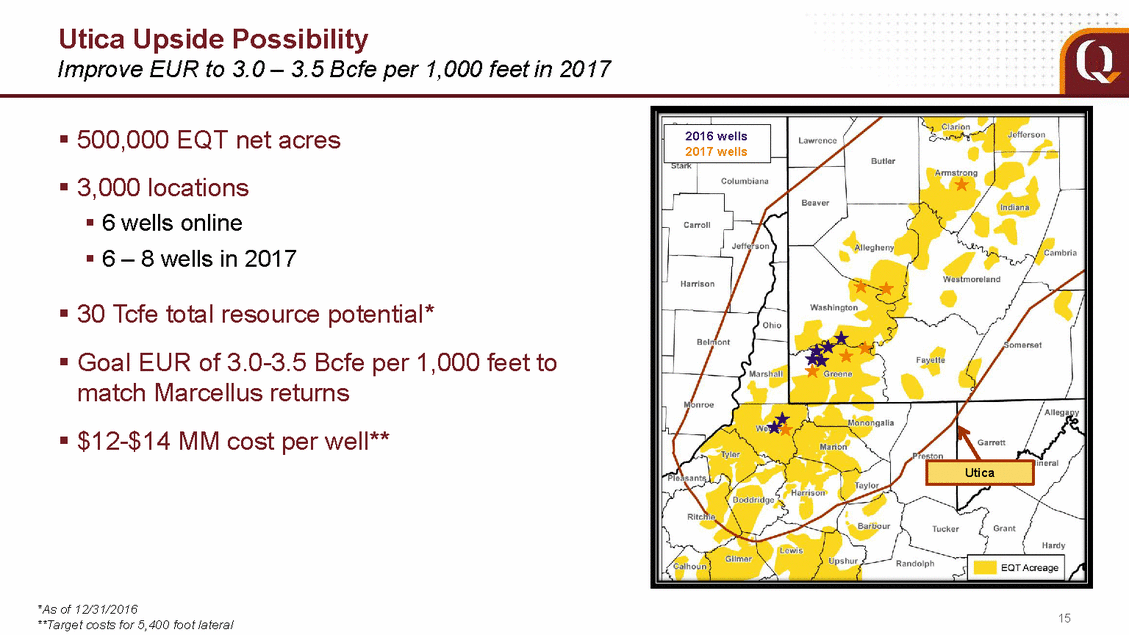
Balance Sheet Strength Strength in the numbers Benefits of investment grade Strong liquidity Supports consolidation strategy Assures operational flexibility through Minimizes counterparty letter of credit requirements $1.5 billion undrawn revolver $774 million cash* cycles $750 million undrawn revolver at EQM Enables EQM to fund organic projects / joint ventures (MVP) with lower-cost capital Investment Grade Rating (S&P) – EQT vs. Marcellus Peers Strong Balance Sheet* BBB + EQT Peer 1 Peer 2 Peer 3 Peer 4 Peer 5 Peer 6 *Includes cash equivalents and trading securities; debt excludes EQM Peers: AR, CNX, GPOR, RICE, RRC, SWN 16 Investment Grade BB+Sub-Investment Grade BB BB-B+B+B ($B) 02/28/17 Long-term debt $ 2.3 Short-term debt - Cash (0.8) Net debt (total debt minus cash)$1.5
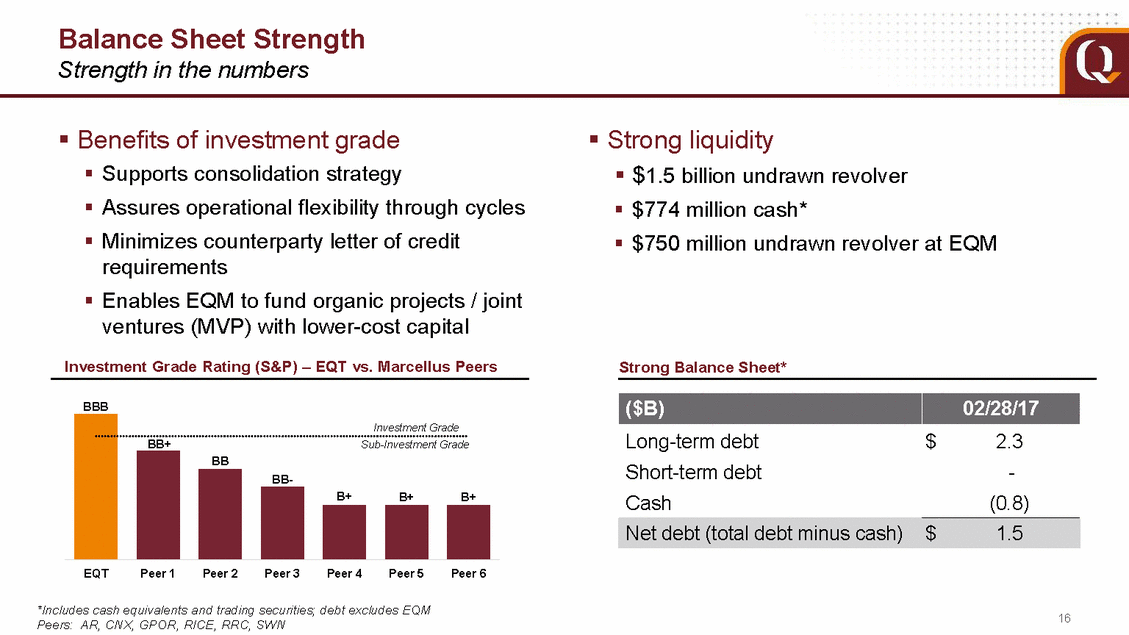
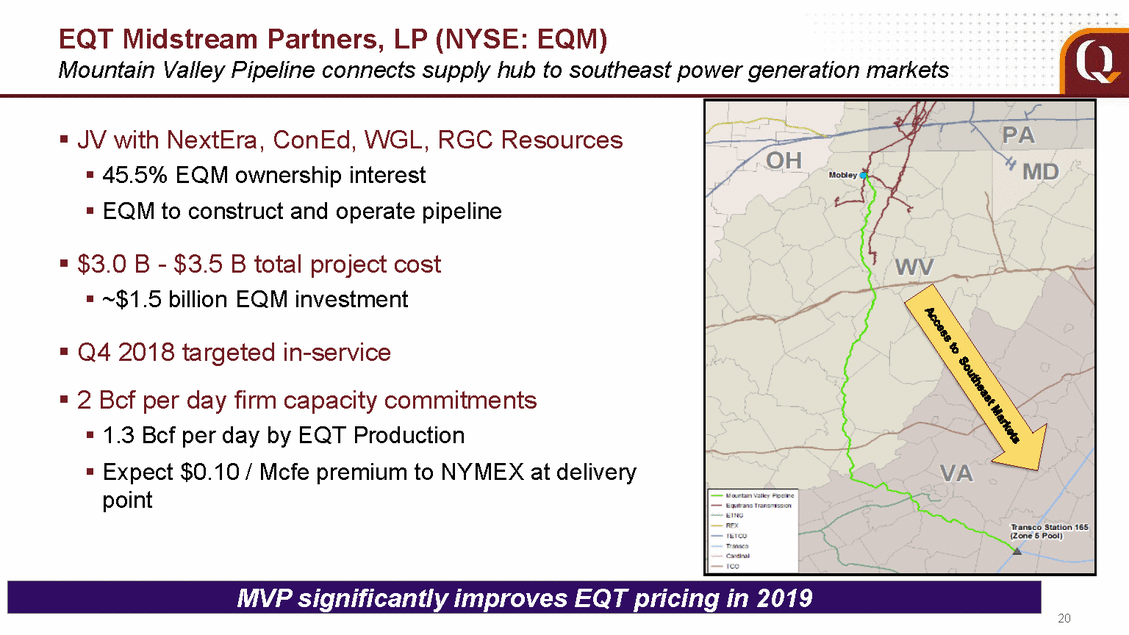
Benefits from Midstream Ownership EQT owns 90% interest in EQT GP Holdings, LP (NYSE: EQGP) Significant cash flow growth from EQGP ownership Midstream cash flows to double over next three years 2017 EQT distribution equates to $0.24 / Mcfe Publicly traded security highlights EQT shareholders EQGP ownership in EQM: value to EQGP Public Unitholders 100% of the Incentive Distribution 48% incremental MLP distributions 26.6% LP interest 1.8% GP interest Rights 26.5 million EQGP Common Units Partner Interest Control when, where, how midstream designed, constructed, and operated is EQM Public Unitholders 58.8 million EQM Common Units EQM benefits from strong sponsor and EQT consolidation 17 EQT Production EQT 239.7 million EQGP Common Units EQGP Non-economic GP Non-economic General Partner Interest 90% Limited Partner Interest EQGP 21.8 million EQM Common Units EQM GP + IDRs 10% Limited 1.8% General Partner Interest & IDRs 26.6% Limited Partner Interest EQM 80.6 million Common Units 71.6% Limited Partner Interest
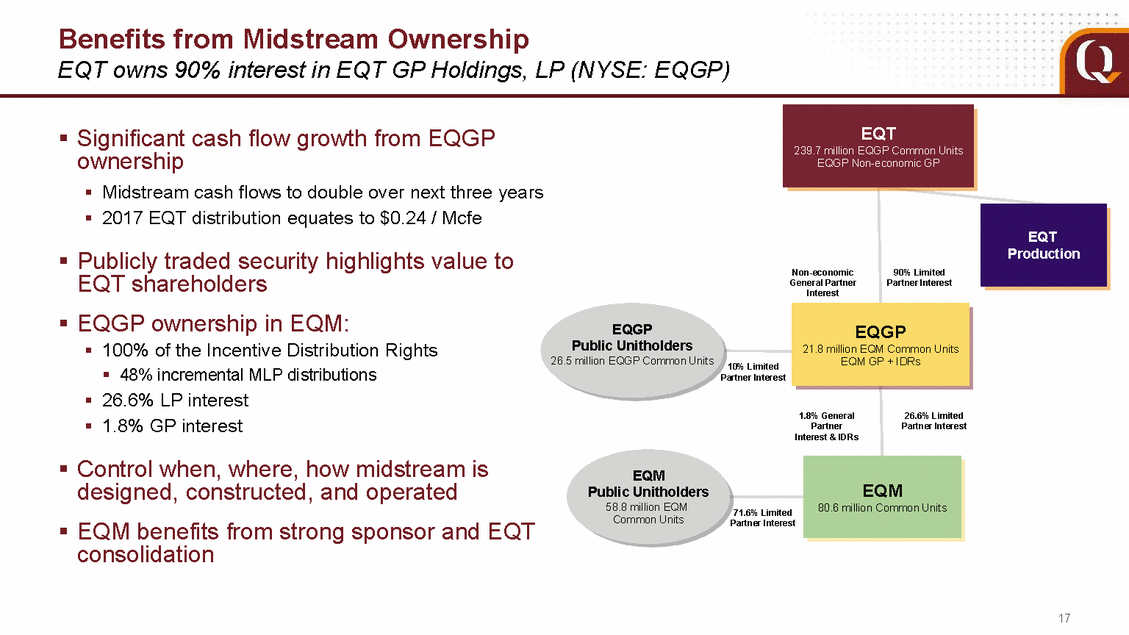
Benefits from Midstream Ownership accelerating Cash flows to EQT from EQGP $500 $400 $300 $200 $100 $-2014 2015 2016 2017F 2018F 2019F 2020F 18 20% EQM distribution growth in 2017; and EQM long-term forecast 15-20% for 2018-2020 $MM EQGP price per unit Value of EQGP units held by EQT ($B) Value per EQT share $26 $6.2 $36 $28 $6.7 $39 $30 $7.2 $42 $32 $7.7 $44
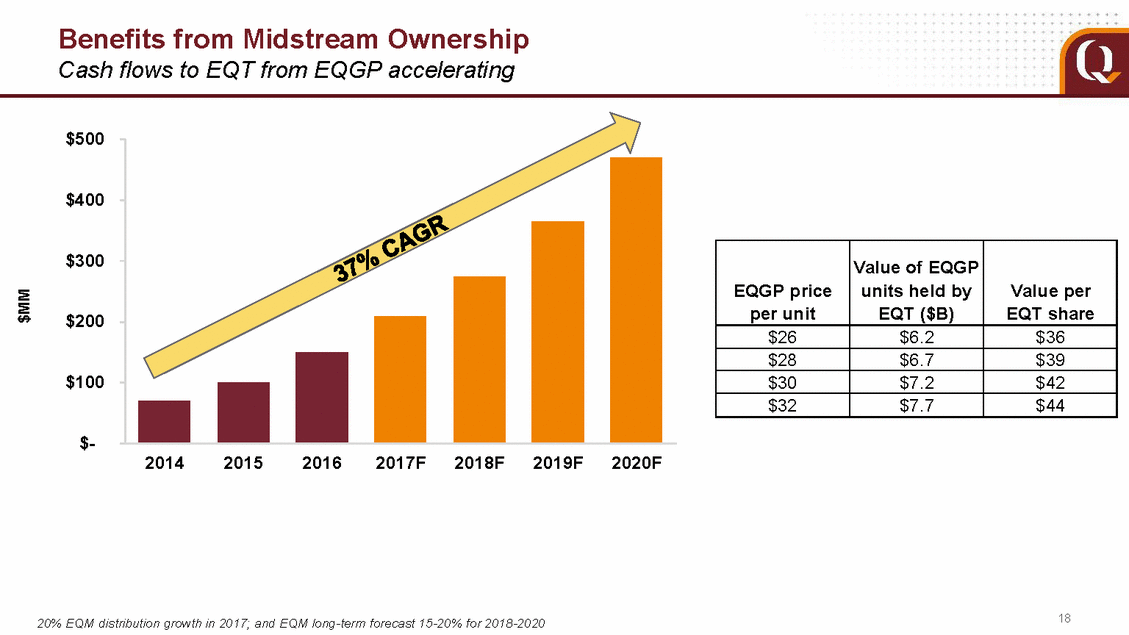
EQT Midstream Partners, LP (NYSE: EQM) Appalachian Hub – connecting supply to demand markets Marcellus Gathering 1.8 Bcf per day firm capacity 600 MMcf per day high pressure header pipeline for Range Resources expected Q2 2017 in-service 10-year fixed-fee contracts Equitrans Transmission & Storage 4.4 Bcf per day current capacity 950-mile, FERC-regulated interstate pipeline Fixed-fee contracts with an average remaining term of 16 years Provides connectivity to six interstate pipelines Asset statistics as of 12/31/2016 and transmission capacity includes 0.85 Bcf/d of certificated capacity on the Ohio Valley Connector Interstate pipelines: Texas Eastern, Dominion Transmission, Columbia Gas Transmission, Tennessee Gas Pipeline Company, Rockies Express Pipeline LLC, and National Fuel Gas Supply Corporation 19
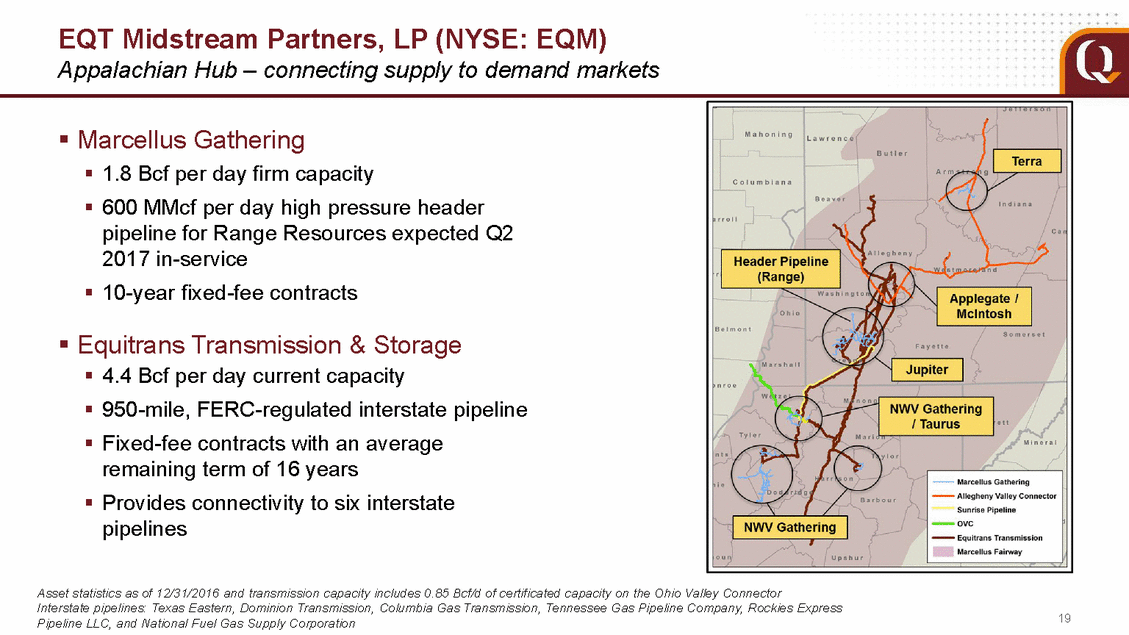
EQT Midstream Partners, LP (NYSE: EQM) Mountain Valley Pipeline connects supply hub to southeast power generation markets JV with NextEra, ConEd, WGL, RGC Resources 45.5% EQM ownership interest EQM to construct and operate pipeline $3.0 B - $3.5 B total project cost ~$1.5 billion EQM investment Q4 2018 targeted in-service 2 Bcf per day firm capacity commitments 1.3 Bcf per day by EQT Production Expect $0.10 / Mcfe premium to NYMEX at point delivery 20 MVP significantly improves EQT pricing in 2019
Why EQT? 4th Largest natural gas producer 15-20% sales volume growth Accelerating midstream cash in Appalachian Basin; 2018 through 2020+ flows largest in U.S.* Basin consolidation drives best-in-class economics Regional pipeline hub with access to premium markets Continue to improve returns Longer laterals Increase productivity per foot = 14% increase in type curves Lower operational costs Access to premium markets improves realized price De-risk Utica for development in 2018 21 *Sourced from published company reports
Cautionary Statements EQT Corporation (NYSE: EQT) EQT Plaza 625 Liberty Avenue, Suite 1700 Pittsburgh, PA 15222 Pat Kane - Chief Investor Relations Officer (412) 553-7833 The Securities and Exchange Commission (SEC) permits oil and gas companies, in their filings with the SEC, to disclose only proved, probable and possible reserves that a company anticipates as of a given date to be economically and legally producible and deliverable by application of development projects to known accumulations. We use certain terms in this presentation, such as “EUR” (estimated ultimate recovery) and total resource potential, that the SEC’s rules strictly prohibit us from including in filings with the SEC. We caution you that the SEC views such estimates as inherently unreliable and these estimates may be misleading to investors unless the investor is an expert in the natural gas industry. We also note that the SEC strictly prohibits from aggregating proved, probable and possible (3P) reserves on filings with the SEC due to the different levels of certainty associated with each reserve category. Disclosures in this presentation contain certain forward-looking statements within the meaning of Section 21E of the Securities Exchange Act of 1934, as amended, and Section 27A of the Securities Act of 1933, as amended. Statements that do not relate strictly to historical or current facts are forward-looking. Without limiting the generality of the foregoing, forward-looking statements contained in this presentation specifically include the expectations of plans, strategies, objectives and growth and anticipated financial and operational performance of EQT Corporation and its subsidiaries (EQT), including guidance regarding EQT’s strategy to develop its reserves; drilling plans and programs (including the number, type, depth, lateral lengths, and locations of wells to be drilled and number of rigs); projected natural gas prices, liquids price impact, basis, premium and average differential; total resource potential, reserves and EUR; projected EQT and third party production sales volumes and growth rates (including liquids sales volume and growth rates); internal rate of return (IRR), compound annual growth rate (CAGR) and expected after-tax returns per well; technology (including drilling and completion techniques); projected drilling and completions (D&C) costs, other well costs and unit costs; projected frac stage lengths, proppant per foot and water per foot; projected market mix; projected gathering and transmission volume, service cost inflation and growth rates; EQT’s access to, and timing of, capacity on pipelines; infrastructure programs (including the timing, cost and capacity of expected gathering and transmission expansion projects); the timing, cost, capacity and expected interconnects with facilities and pipelines of the Mountain Valley Pipeline (MVP) project; the ultimate terms, partners, and structure of the MVP joint venture; acquisition transactions; monetization transactions, including asset sales, joint ventures or other transactions involving EQT’s assets; dividend and distribution amounts and rates; the projected cash flows resulting from EQT’s limited partner interests in EQT GP Holdings, LP (EQGP) and related growth rates; projected adjusted operating cash flows attributable to EQT, total production EBITDA, net income attributable to noncontrolling interests, and net marketing services revenues; projected capital contributions and capital expenditures; liquidity and financing requirements, including funding sources and availability; changes in EQT’s or EQT Midstream Partners, LP’s (EQM) credit ratings; potential future impairments of EQT’s assets; hedging strategy; the effects of government regulation and litigation; and tax position. These forward-looking statements involve risks and uncertainties that could cause actual results to differ materially from projected results. Accordingly, investors should not place undue reliance on forward-looking statements as a prediction of actual results. EQT has based these forward-looking statements on current expectations and assumptions about future events. While EQT considers these expectations and assumptions to be reasonable, they are inherently subject to significant business, economic, competitive, regulatory and other risks and uncertainties, many of which are difficult to predict and beyond EQT’s control. The risks and uncertainties that may affect the operations, performance and results of EQT’s business and forward-looking statements include, but are not limited to, those set forth under Item 1A, “Risk Factors,” of EQT’s Form 10-K for the year ended December 31, 2016, as filed with the SEC and as updated by any subsequent Form 10-Qs. Any forward-looking statement speaks only as of the date on which such statement is made and EQT does not intend to correct or update any forward-looking statement, whether as a result of new information, future events or otherwise. Information in this presentation regarding EQGP and its subsidiaries, including EQM, is derived from publicly available information published by EQGP and EQM. 22
Non-GAAP Financial Measures Adjusted Operating Cash Flow Attributable to EQT Adjusted operating cash flow attributable to EQT is a non-GAAP supplemental financial measure that is presented as an indicator of an oil and gas exploration and production company’s ability to internally fund exploration and development activities and to service or incur additional debt. EQT includes this information in the presentation because management believes that changes in operating assets and liabilities relate to the timing of cash receipts and disbursements and therefore may not relate to the period in which the operating activities occurred. Adjusted operating cash flow attributable to EQT excludes the noncontrolling interest portion of EQT Midstream Partners adjusted EBITDA (a non-GAAP supplemental financial measure summarized below). Management believes that removing the impact on operating cash flows of the public unitholders of EQGP and EQM that is otherwise required to be consolidated in EQT’s results provides useful information to an EQT investor. Adjusted operating cash flow attributable to EQT should not be considered as an alternative to net cash provided by operating activities presented in accordance with GAAP. EQT has not provided projected net cash provided by operating activities or a reconciliation of projected adjusted operating cash flow attributable to EQT to projected net cash provided by operating activities, the most comparable financial measure calculated in accordance with GAAP. EQT is unable to project net cash provided by operating activities because this metric includes the impact of changes in operating assets and liabilities related to the timing of cash receipts and disbursements that may not relate to the period in which the operating activities occurred. EQT is unable to project these timing differences with any reasonable degree of accuracy without unreasonable efforts such as predicting the timing of its and customers’ payments, with accuracy to a specific day, three or more months in advance. Furthermore, EQT does not provide guidance with respect to its average realized price or income taxes, among other items, that are reconciling items between net cash provided by operating activities and adjusted operating cash flow attributable to EQT. Natural gas prices are volatile and out of EQT’s control, and the timing of transactions and the income tax effects of future transactions and other items are difficult to accurately predict. Therefore, EQT is unable to provide projected net cash provided by operating activities, or the related reconciliation of projected adjusted operating cash flow attributable to EQT to projected net cash provided by operating activities, without unreasonable effort. 23
Non-GAAP Financial Measures EQT Midstream Partners Adjusted EBITDA EQT Midstream Partners adjusted EBITDA means EQM’s net income plus EQM’s net interest expense, depreciation and amortization expense, income tax expense (if applicable), preferred interest payments received post-conversion, and non-cash long-term compensation expense (if applicable) less EQM’s equity income, AFUDC-equity, capital lease payments, and adjusted EBITDA for assets prior to acquisition dates. EQT Midstream Partners adjusted EBITDA is a non-GAAP supplemental financial measure that management and external users of EQT’s consolidated financial statements, such as industry analysts, investors, lenders and rating agencies, use to assess the effects of the noncontrolling interests in relation to: EQT's operating performance as compared to other companies in its industry; the ability of EQT's assets to generate sufficient cash flow to make distributions to its investors; EQT's ability to incur and service debt and fund capital expenditures; and the viability of acquisitions and other capital expenditure projects and the returns on investment of various investment opportunities. EQT believes that EQT Midstream Partners adjusted EBITDA provides useful information to investors in assessing EQT's financial condition and results of operations. EQT Midstream Partners adjusted EBITDA should not be considered as an alternative to EQM’s net income, operating income, or any other measure of financial performance or liquidity presented in accordance with GAAP. EQT Midstream Partners adjusted EBITDA has important limitations as an analytical tool because it excludes some, but not all, items that affect EQM's net income. Additionally, because EQT Midstream Partners adjusted EBITDA may be defined differently by other companies in EQT's or EQM's industries, the definition of EQT Midstream Partners adjusted EBITDA may not be comparable to similarly titled measures of other companies, thereby diminishing the utility of the measure. 24
Non-GAAP Financial Measures Total Production EBITDA Total production EBITDA is defined as earnings before interest, taxes, depreciation and amortization expense adjusted for non-cash derivative gains and losses. Total production EBITDA is not a financial measure calculated in accordance with GAAP. Total production EBITDA is a non-GAAP supplemental financial measure that EQT’s management and external users of EQT’s financial statements, such as industry analysts, investors, lenders, and rating agencies, may use to assess: (i) EQT’s performance versus prior periods; (ii) EQT’s operating performance as compared to other companies in its industry; (iii) the ability of EQT’s assets to generate sufficient cash flow to make distributions to its investors; (iv) EQT’s ability to incur and service debt and fund capital expenditures; and (v) the viability of acquisitions and other capital expenditure projects and the returns on investment of various investment opportunities. EQT has not provided projected net (loss) income or a reconciliation of projected total production EBITDA to projected net (loss) income, the most comparable financial measure calculated in accordance with GAAP. EQT does not provide guidance with respect to its average realized price or income taxes, among other items, that are reconciling items between total production EBITDA and net (loss) income. Natural gas prices are volatile and out of EQT’s control, and the timing of transactions and the income tax effects of future transactions and other items are difficult to accurately predict. Further, management believes a reliable forecasted effective tax rate is not available because small fluctuations in estimated “ordinary” income would result in significant changes in the estimated annual effective tax rate for 2017. Consequently, EQT is not able to provide a projected net (loss) income that would be useful to investors. Therefore, projected net (loss) income and production EBITDA to projected net (loss) income are not available without unreasonable effort. a reconciliation of projected total 25
Appendix
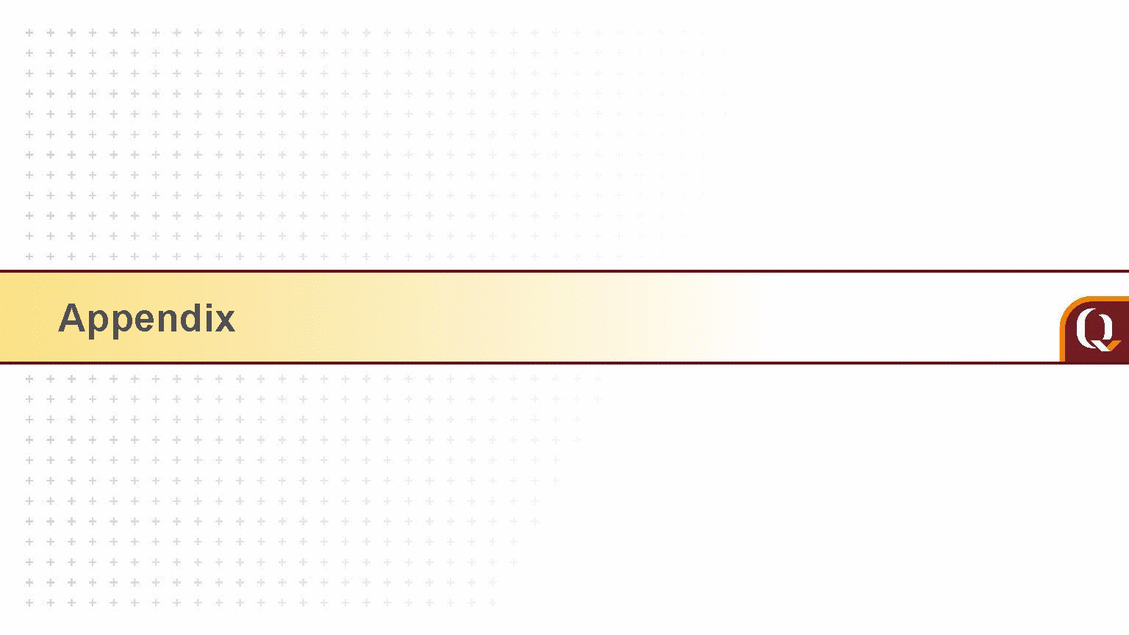
Co-development Improves returns per acre Fracs Grow Toward Low Pressure Co-development Benefits of co-development of Marcellus and Upper Devonian Co-development increases value per acre by 36% Shared infrastructure improves IRR per well Upper Devonian: use-it or lose-it investment D&C Costs Are Low Upper Devonian Economics Marcellus Only Marcellus + UD Number of wells Lateral length Pad EUR (Bcfe) Total costs ($MM) Price Pad NVP10 ($MM) Pad ATAX IRR 8 8,000’ 154 59 2.50 44 57% 16 8,000’ 250 109 2.50 60 41% $ $ $ $ $ $ 27
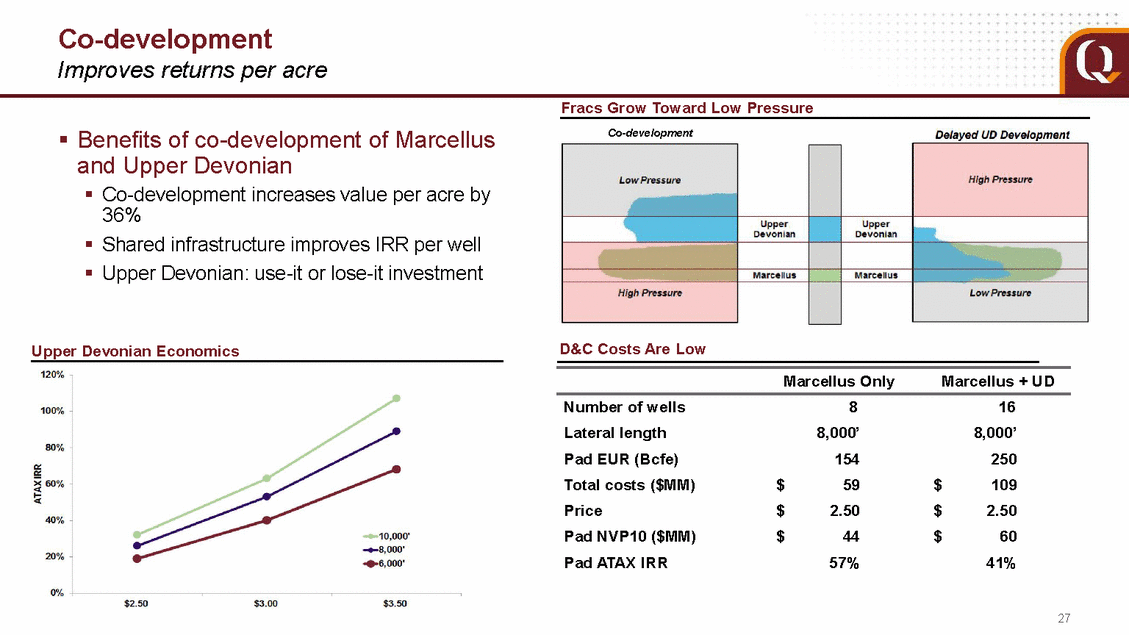
Risk Management Hedge position as of March 21, 2017 400 $3.50 $3.44 350 $3.40 300 $3.30 250 $3.20 200 $3.10 150 $3.00 100 $2.90 50 $2.80 - $2.70 2017 2018 Average Hedge Price 2019 NYMEX Price Hedged Volume • The Company also sold calendar 2017 and 2018 calls for approximately 32 and 16 Bcf at a strike price of $3.53 and $3.48 per Mcf, respectively • For 2017 and 2018 the Company sold puts for approximately 3 Bcf at a strike price of $2.63 per Mcf • The average price is based on a conversion rate of 1.05 MMBtu/Mcf 28 Bcf $ / Mcf 2017 2018 NYMEX Price ($/Mcf) as of 3/21/2017$3.44$3.20 NYMEX Swaps Total Volume (Bcf)346169 Average Price per Mcf (NYMEX)$3.34$3.16 Collars Total Volume (Bcf)207 Average Floor Price per Mcf (NYMEX$3.05$3.16 Average Cap Price per Mcf (NYMEX)$3.93$3.59 2019 $3.01 19 $3.12 - $0.00 $0.00 $3.35 366 $3.20 $3.12 $3.17 177 $3.01 19
Liquids Volume growth and Marcellus impact Marcellus Liquids Price Impact Liquids Volume Growth (1200 Btu Gas) 16,000 $6.00 14,000 $5.00 12,000 10,000 $4.00 8,000 $0.14 $3.00 6,000 $2.00 4,000 $1.00 2,000 $0.00 - Not Processed Processed 2012 2013 2014 2015 2016 2017F Pricing is as of 3/21/2017 and is the one-year forward NYMEX and Mount Belvieu for Propane $0.60, Iso-Butane $0.81, Normal Butane $0.76, and Pentanes $1.09. Includes natural gas liquids, ethane, and oil 29 Mbbls $/Mcf NGLs (1.6 Gal/Mcf) Btu Premium NYMEX $3.83$3.96 $0.63 $0.64 $3.19 $3.19
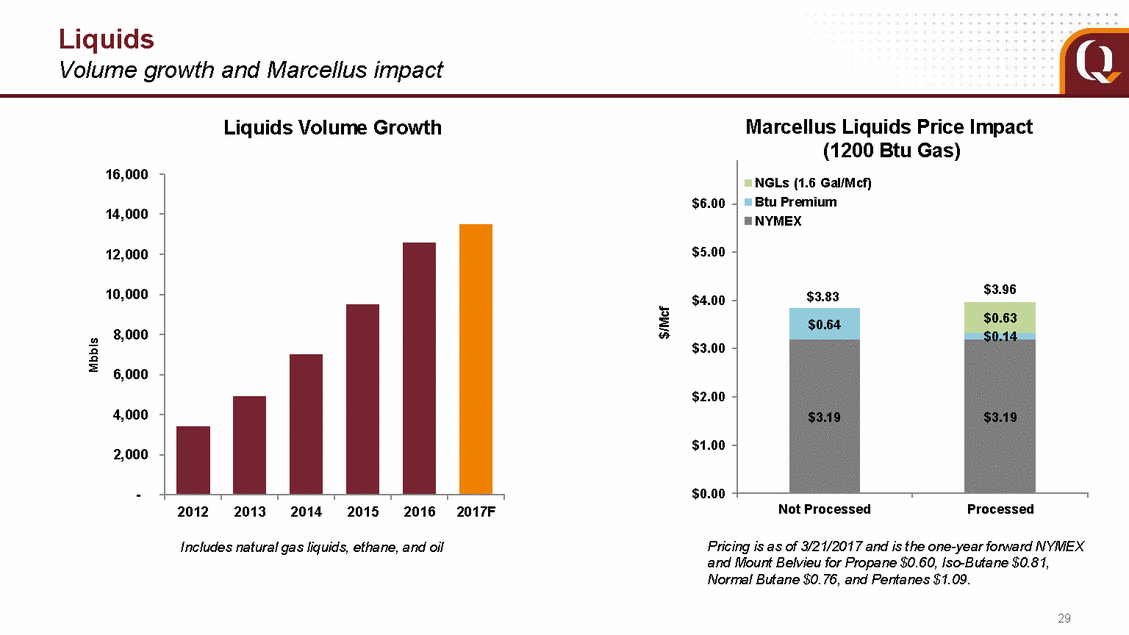
Marcellus Capacity Pricing details 30 Market Mix 2017E 2018E 2019E TETCO M2 10% 25% 10% TETCO M3 35% 29% 21% TCO 5% 4% 3% Midwest 30% 26% 19% NYMEX 20% 16% 12% Southeast 0% 0% 35% Basis 2017E 2018E 2019E TETCO M2 $(0.60) $(0.46) $(0.56) TETCO M3 $(0.20) $0.09 $0.01 TCO $(0.21) $(0.29) $(0.37) Midwest $(0.17) $(0.29) $(0.35) NYMEX $0.00 $0.00 $0.00 Southeast $0.02 $0.21 $0.10 Basis $(0.26) $(0.24) ($0.10)
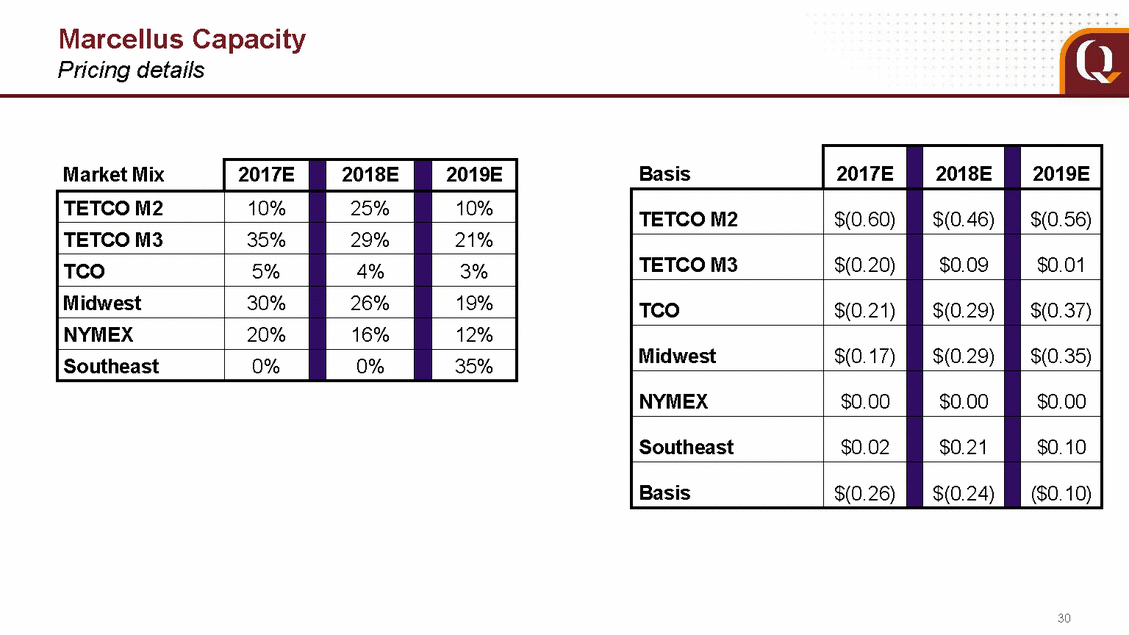
2017 Guidance Q1 2017 2017 PRODUCTION Total Production Sales Volume (Bcfe) Liquids Sales Volume, excluding Ethane (Mbbls) Ethane Sales Volume (Mbbls) Total Liquids Sales Volume (Mbbls) Unit Cost ($/Mcfe) Gathering to EQT Gathering Transmission to EQT Transmission Third-party gathering and transmission Processing LOE, excluding production taxes Production taxes SG&A DD&A Average differential ($ / Mcf) Pipeline and Net Marketing Services ($MM) FINANCIAL ($MM) Net income attributable to noncontrolling interest Total Production EBITDA Adjusted Operating Cash Flow Attributable to EQT* 190 3,150 1,155 4,305 - - - - 195 3,170 1,165 4,335 835 13,050 4,925 17,975 - - - - 855 13,450 5,125 18,575 $0.46 $0.20 $0.40 $0.15 $0.13 $0.07 $0.17 $1.06 ($0.45) $35 - - - - - - - - - - $0.48 $0.22 $0.42 $0.17 $0.15 $0.09 $0.19 $1.08 ($0.30) $45 ($0.35) $5 - - ($0.25) $15 $81 - $83 $335 $1,180 - - $345 $1,200 $1,300 *Includes approximately $200 million from EQT’s interest in EQT GP Holdings, LP (NYSE: EQGP) 31
+ + + .. + + + + + + ... + + ... + + + ... + + + + + + + + + + + + + Where energy meets innovation. + + + + +
