Attached files
| file | filename |
|---|---|
| EX-23.1 - EX-23.1 - e.l.f. Beauty, Inc. | d364548dex231.htm |
| EX-5.1 - EX-5.1 - e.l.f. Beauty, Inc. | d364548dex51.htm |
| EX-1.1 - EX-1.1 - e.l.f. Beauty, Inc. | d364548dex11.htm |
Table of Contents
As filed with the Securities and Exchange Commission on March 24, 2017.
Registration No. 333-216720
UNITED STATES
SECURITIES AND EXCHANGE COMMISSION
Washington, D.C. 20549
AMENDMENT NO. 1
TO
FORM S-1
REGISTRATION STATEMENT
UNDER
THE SECURITIES ACT OF 1933
e.l.f. Beauty, Inc.
(Exact name of Registrant as specified in its charter)
| Delaware | 2844 | 46-4464131 | ||
| (State or other jurisdiction of incorporation or organization) |
(Primary Standard Industrial Classification Code Number) |
(I.R.S. Employer Identification Number) |
570 10th Street
Oakland, CA 94607
(510) 778-7787
(Address, including zip code, and telephone number, including area code, of Registrant’s principal executive offices)
Tarang P. Amin
Chairman and Chief Executive Officer
e.l.f. Beauty, Inc.
570 10th Street
Oakland, CA 94607
(510) 778-7787
(Name, address, including zip code, and telephone number, including area code, of agent for service)
Copies to:
| Tad J. Freese, Esq. Kathleen M. Wells, Esq. Latham & Watkins LLP 140 Scott Drive Menlo Park, CA 94025 Telephone: (650) 328-4600 Facsimile: (650) 463-2600 |
Thomas Holden, Esq. Ropes & Gray LLP Three Embarcadero Center San Francisco, CA 94111 Telephone: (415) 315-6300 Facsimile: (415) 315-6350 |
Approximate date of commencement of proposed sale to the public: As soon as practicable after the effective date of this Registration Statement.
If any of the securities being registered on this Form are to be offered on a delayed or continuous basis pursuant to Rule 415 under the Securities Act of 1933, check the following box. ☐
If this Form is filed to register additional securities for an offering pursuant to Rule 462(b) under the Securities Act, please check the following box and list the Securities Act registration statement number of the earlier effective registration statement for the same offering. ☐
If this Form is a post-effective amendment filed pursuant to Rule 462(c) under the Securities Act, check the following box and list the Securities Act registration statement number of the earlier effective registration statement for the same offering. ☐
If this Form is a post-effective amendment filed pursuant to Rule 462(d) under the Securities Act, check the following box and list the Securities Act registration statement number of the earlier effective registration statement for the same offering. ☐
Indicate by check mark whether the registrant is a large accelerated filer, an accelerated filer, a non-accelerated filer, or a smaller reporting company. See the definitions of “large accelerated filer,” “accelerated filer” and “smaller reporting company” in Rule 12b-2 of the Exchange Act. ☐
| Large accelerated filer | ☐ | Accelerated filer | ☐ | |||||
| Non-accelerated filer | ☒ | (Do not check if a smaller reporting company) | Smaller reporting company | ☐ |
The Registrant hereby amends this Registration Statement on such date or dates as may be necessary to delay its effective date until the Registrant shall file a further amendment which specifically states that this Registration Statement shall thereafter become effective in accordance with Section 8(a) of the Securities Act of 1933 or until the Registration Statement shall become effective on such date as the Commission, acting pursuant to said Section 8(a), may determine.
Table of Contents
CALCULATION OF REGISTRATION FEE
|
| ||||||
| Title of Securities to be Registered |
Amount to be Registered (1) |
Proposed Maximum Aggregate Offering Price (2) |
Amount of Registration Fee (3) | |||
| Common Stock, $0.01 par value |
8,050,000 | $208,495,000 | $24,164.58 | |||
|
| ||||||
|
| ||||||
| (1) | Includes 1,050,000 shares of common stock that may be purchased from certain selling stockholders by the underwriters’ pursuant to an option to purchase additional shares. |
| (2) | Estimated solely for the purpose of calculating the registration fee pursuant to Rule 457(a) under the Securities Act of 1933, as amended. In accordance with Rule 457(c) of the Securities Act of 1933, as amended, the price shown is the average of the high and low prices for the registrant’s common stock on March 22, 2017. |
| (3) | A filing fee of $20,282.50 was previously paid in connection with the filing of this Registration Statement on March 15, 2017. The aggregate filing fee of $24,164.58 is being offset by the $20,282.50 payment previously made in connection with the prior filings of this Registration Statement. |
The Registrant hereby amends this Registration Statement on such date or dates as may be necessary to delay its effective date until the Registrant shall file a further amendment which specifically states that this Registration Statement shall thereafter become effective in accordance with Section 8(a) of the Securities Act of 1933 or until the Registration Statement shall become effective on such date as the Commission, acting pursuant to said Section 8(a), may determine.
Table of Contents
The information in this preliminary prospectus is not complete and may be changed. These securities may not be sold until the registration statement filed with the Securities and Exchange Commission is effective. This preliminary prospectus is not an offer to sell these securities nor does it seek an offer to buy these securities in any jurisdiction where the offer or sale is not permitted.
Subject to completion, dated March 24, 2017
Preliminary prospectus

e.l.f. Beauty, Inc.
7,000,000 Shares
The selling stockholders named in this prospectus, which include certain members of our board of directors and management, are offering all of the shares offered hereby and will receive all of the proceeds from this offering. We will not receive any proceeds from the sale of shares by the selling stockholders. On March 23, 2017, the last reported sale price of our common stock on the New York Stock Exchange was $26.16 per share.
Our common stock is listed on the New York Stock Exchange under the symbol “ELF.”
We are an “emerging growth company” as defined by the Jumpstart Our Business Startups Act of 2012, and we have elected to comply with certain reduced public company reporting requirements.
| Per share | Total | |||||||
| Public offering price |
$ | $ | ||||||
| Underwriting discounts and commissions(1) |
$ | $ | ||||||
| Proceeds to selling stockholders, before expenses |
$ | $ | ||||||
|
|
||||||||
| (1) | See “Underwriting” for additional information regarding underwriting compensation. |
The underwriters may also purchase up to an additional 1,050,000 shares from certain selling stockholders, at the public offering price, less the underwriting discount for 30 days from the date of this prospectus.
Investing in our common stock involves a high degree of risk. See “Risk factors” beginning on page 11.
Neither the Securities and Exchange Commission nor any state securities commission has approved or disapproved of these securities or determined if this prospectus is truthful or complete. Any representation to the contrary is a criminal offense.
The underwriters expect to deliver the shares to purchasers on or about , 2017.
| J.P. Morgan | Morgan Stanley |
| Piper Jaffray | Wells Fargo Securities |
The date of this prospectus is , 2017.
Table of Contents

Table of Contents

Table of Contents

Table of Contents

e.l.f.
Our Mission
We make luxurious beauty accessible for all women to play beautifully®.
Table of Contents

Table of Contents
| Page | ||||
| ii | ||||
| 1 | ||||
| 7 | ||||
| 8 | ||||
| 11 | ||||
| 38 | ||||
| 39 | ||||
| 40 | ||||
| 40 | ||||
| 41 | ||||
| 42 | ||||
| 43 | ||||
| Management’s discussion and analysis of financial condition and results of operations |
46 | |||
| 59 | ||||
| 80 | ||||
| 86 | ||||
| 92 | ||||
| 95 | ||||
| 98 | ||||
| 103 | ||||
| 106 | ||||
| Material U.S. federal income tax consequences to non-U.S. holders |
108 | |||
| 111 | ||||
| 114 | ||||
| 114 | ||||
| 114 | ||||
| F-1 | ||||
You should rely only on the information contained in this prospectus or in any free writing prospectus we may authorize to be delivered or made available to you. Neither we, the selling stockholders nor the underwriters have authorized anyone to provide you with different information. The information in this prospectus is accurate only as of the date of this prospectus, regardless of the time of delivery of this prospectus, or any free writing prospectus, as the case may be, or any sale of shares of our common stock.
For investors outside the United States, the selling stockholders and the underwriters are offering to sell, and seeking offers to buy, shares of our common stock only in jurisdictions where offers and sales are permitted. Neither we, the selling stockholders nor the underwriters have done anything that would permit this offering or possession or distribution of this prospectus in any jurisdiction where action for that purpose is required, other than in the United States. Persons outside the United States who come into possession of this prospectus must inform themselves about, and observe any restrictions relating to, the offering of the shares of common stock and the distribution of this prospectus outside the United States.
Numerical figures included in this prospectus have been subject to rounding adjustments. Accordingly, numerical figures shown as totals in various tables may not be arithmetic aggregations of the figures that precede them.
i
Table of Contents
Certain of the market data and other statistical information contained in this prospectus, such as the size, growth and share of the cosmetics industry and its constituent market segments, are based on information from independent industry organizations and other third-party sources, industry publications, surveys and forecasts. Some market data and statistical information contained in this prospectus are also based on management’s estimates and calculations, which are derived from our review and interpretation of the independent sources, our internal market and brand research and our knowledge of the cosmetics industry. Information that is based on estimates, forecasts, projections or similar methodologies is inherently subject to uncertainties, and actual events or circumstances may differ materially from events and circumstances that are assumed in this information.
References to e.l.f.’s share of the U.S. mass cosmetics market and top 10 U.S. cosmetics brands and the size and growth rates of the global and U.S. cosmetics category, segment, product and channel and skin care categories refer to retail sales in absolute dollar terms as tracked by Euromonitor International Limited’s Beauty and Personal Care 2016 edition system, published in March 2016 as part of its annual multi-client Passport research program, which includes food, drug and mass (“FDM”), department stores, direct and specialty channels; data reflects current prices and 2015 exchange rates fixed by Euromonitor. References to our retail sales from products launched in the last three years refer to U.S. retail sales across categories as tracked by Nielsen’s XAOC, including C-store database for the 52 weeks ended January 2, 2016 and prior years downloaded in April 2016, which includes the FDM channel. Other statements in this prospectus regarding market data, unless otherwise noted, are based on studies conducted by Calimesa Consulting Partners, LLC and MetrixLab, which we commissioned. These studies were based on surveys of a broad sampling of cosmetics consumers.
For the purposes of this prospectus:
| • | “aided awareness” is a measure of the number of people who express knowledge of a brand or product when prompted; |
| • | “cosmetics” market segment refers to the market segment defined as Color Cosmetics by Euromonitor International Limited and consists of face makeup, eye makeup, lip products, nail products and color cosmetics sets/kits; |
| • | “e-commerce” channel refers to the channel defined as Internet Retailing by Euromonitor International Limited; and FDM and specialty channels are per Company definitions based on Euromonitor International Limited data; |
| • | “heaviest” purchasers or users refers to consumers who identified themselves as professional, expert or enthusiast in the study conducted by MetrixLab; |
| • | “incremental sales” refer to consumers buying e.l.f. products as additional cosmetics purchases at retail stores as opposed to diverting sales from another brand; |
| • | “prestige” market segment refers to the market segment defined as Premium by Euromonitor International Limited; |
| • | “retail sales” refers to the purchase price paid by the end consumer; |
| • | “share” refers to e.l.f.’s market share based on e.l.f.’s net sales in comparison to retail sales in absolute dollar terms; and |
| • | “unaided awareness” is a measure of the number of people who express knowledge of a brand or product without prompting. |
ii
Table of Contents
This summary highlights selected information contained elsewhere in this prospectus. This summary does not contain all the information that you should consider before deciding to invest in our common stock. You should read the entire prospectus carefully, including “Risk factors” and our consolidated financial statements and related notes included elsewhere in this prospectus, before making an investment decision. In this prospectus, the terms “e.l.f.,” “we,” “us,” “our” and the “Company” refer to e.l.f. Beauty, Inc. and its consolidated subsidiaries. This prospectus includes industry data for the year ended December 31, 2015, since data for the year ended December 31, 2016 is not yet available. As a result, we have included certain financial and other figures relating to the Company and its operations for the year ended December 31, 2015 within this prospectus, where the lack of current industry data precludes us from updating.
e.l.f.: Changing the face of beauty
We are one of the fastest growing, most innovative cosmetics companies in the United States. Driven by our mission to make luxurious beauty accessible for all women to play beautifully®, we have challenged the traditional belief that quality cosmetics are only available at high prices in select channels. e.l.f. offers high-quality, prestige-inspired beauty products for eyes, lips and face at extraordinary value, with the majority of our items retailing for $6 or less. Our price points encourage trial and experimentation, while our commitment to quality and a differentiated consumer engagement model engender loyalty among a passionate and vocal group of consumers.
We believe our success is rooted in our innovation process and ability to build direct consumer relationships. Born as an e-commerce company over a decade ago, we have created a modern consumer engagement and responsive innovation model that keeps our products on-trend and our consumers engaged as brand ambassadors. Our consumers provide us with real-time feedback through reviews and social media, which enables us to refine and augment our product portfolio in response to their needs. We leverage our fast-cycle product development and asset-light supply chain to launch high-quality products in as few as 20 weeks from concept, and 27 weeks on average. Our products are first launched on elfcosmetics.com, and distribution is generally only broadened to our retail customers after we receive strong consumer validation online. We believe this has led to our consistently strong retail sales per linear foot of shelf space, which we refer to as “productivity.”
Our brand appeals to some of the most sought after consumers in the category. We believe the combination of our affordable price points and on-trend, innovative product assortment encourages trial, offers a strong value proposition and appeals to a broad base of consumers. Relative to the overall cosmetics category, our brand over-indexes with Millennials, multi-cultural consumers and some of the heaviest users in the category. This attractive and loyal consumer base supports high sales per linear foot and higher category sales for our retail customers. By combining our strong relationships with leading retailers with integrated consumer engagement across our e.l.f. stores, e-commerce and social media, we are a true multi-channel brand.
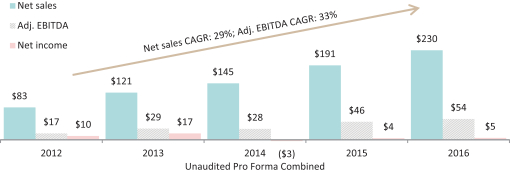
Our net sales growth in the United States from 2012 to 2015 was 20 times that of the mass cosmetics category on average. Our net sales still only represented 2.3% of the $8 billion U.S. mass cosmetics category in 2015. Our net sales grew from $191.4 million in the year ended December 31, 2015 to $229.6 million in the year ended December 31, 2016, and, over the same period, our Adjusted EBITDA grew from $46.2 million to $53.8 million, representing an increase of 20% and 16%, respectively. Over the same period, net income grew from $4.4 million to $5.3 million. In 2016, our Adjusted EBITDA margin was 23% and our net income margin was 2%.1
| 1 | Adjusted EBITDA and Adjusted EBITDA margin are not measurements of financial performance under generally accepted accounting principles in the United States (“GAAP”). See “Summary consolidated financial data” for a discussion of Adjusted EBITDA, Adjusted EBITDA margin and their respective limitations and reconciliations to GAAP measures. |
1
Table of Contents
The cosmetics industry is large and attractive
We believe that the cosmetics category is highly attractive given its scale, growth dynamics and consumer demand trends. The U.S. and global cosmetics markets generated $14 billion and $57 billion, respectively, of retail sales in 2015. The cosmetics category primarily consists of face makeup, eye makeup, lip products, nail products and cosmetics sets/kits and excludes beauty tools and accessories such as brushes and applicators. The cosmetics category has experienced strong growth both in the United States and globally. In the United States, retail sales increased from $11 billion in 2010 to $14 billion in 2015, representing a compound annual growth rate (“CAGR”) of 5% with each product category driving growth. Globally, retail sales increased from $43 billion in 2010 to $57 billion in 2015, representing a CAGR of 5%. Drivers of growth include innovation and new product launches, which span from new formulations that enhance performance, feel and fragrance, to new colors, delivery forms and packaging.
In the United States, the cosmetics category traditionally has been separated into two discrete segments—prestige and mass. Prestige products, which accounted for 42% of U.S. cosmetics retail sales in 2015, are characterized by higher price points and are typically sold in department stores and in high-end specialty stores such as Sephora. They have historically been at the forefront of quality and innovation in the category but remain too expensive for many consumers in the United States, where the average disposable personal income is less than $15,000. Mass products, which generated 58% of 2015 U.S. cosmetics retail sales, are more affordable than their prestige counterparts but generally have not delivered the same level of quality or innovation. They are more broadly available than prestige products given their presence in the food, drug and mass (“FDM”) channel. As observed in recent years, consumers are increasingly purchasing both prestige and mass cosmetics products, and consistent with many other consumer categories, are purchasing online. e-commerce accounted for 10% of U.S. cosmetics retail sales in 2015 and grew at three times the rate of the broader category from 2010 to 2015.
We believe that a paradigm shift has occurred in cosmetics: today’s cosmetics consumer is increasingly connected and informed, and purchasing decisions are often influenced by friends, beauty bloggers, social media and other online content. These sources provide consumers easy access to a breadth and depth of information formerly only available from beauty experts in assisted sales environments.
While most women regularly use cosmetics, the heaviest purchasers drive the category. These consumers represent 36% of cosmetics purchasers, yet accounted for 54% of U.S. cosmetics sales in 2014. For these women, cosmetics is a passion. They enjoy learning about and trying new products, and shopping for and wearing makeup. The entire experience is fun and an integral part of their lifestyle. We seek to fulfill their needs by delighting them with the quality and innovation they desire at prices they can afford.
Our strategic differentiation: how e.l.f. helps women to play beautifully
We are driven by what today’s consumer wants—an assortment of high-quality, prestige-inspired cosmetics at extraordinary value. We do not define ourselves as strictly mass or prestige, or limit our product availability to select channels. Through our modern consumer engagement and responsive innovation model, we interact with our consumers instead of broadcasting at them. This allows us to stay in tune with their needs and build trust and loyalty. Our business model has multiple areas of competitive advantage:
Authentic brand that attracts some of the best consumers in the category. e.l.f. was founded to fill the gap between high-priced prestige beauty products and less innovative mass products. For over a decade, we have prioritized getting to know our consumers, and they in turn have provided us with valuable feedback, enabling us to address this gap and build e.l.f. into an authentic and trusted brand. By providing a comprehensive experience—from integrated engagement online, through social media and in our stores to our differentiated product offerings—we have drawn a strong following among the most sought after and heaviest users of cosmetic products. We also have strong appeal with Millennials and Hispanics, two of the fastest growing demographic groups in the United States. Our consumers have also been our best advocates, growing the e.l.f. brand virally through strong word of mouth.
High-quality cosmetics at an extraordinary value enabled by flexible, asset-light operations. e.l.f. consumers recognize our ability to provide a broad assortment of high-quality products at an extraordinary value. The majority of our items retail for $6 or less, providing a low-risk way for consumers to try new products. Examples of our high-quality and extraordinary value innovations include e.l.f. Mineral Infused Face Primer at $6 versus a prestige primer at $36, e.l.f. Mad for Matte Eyeshadow Palette at $10 versus a prestige palette at $36, the e.l.f. Contouring Brush at $6 versus a similar type of brush at
2
Table of Contents
$35 and e.l.f. Lip Exfoliator at $3 versus a similar type of lip treatment at $24. Our low price points are supported by our ability to source low cost, high-quality cosmetics quickly. As of December 31, 2016, we had 53 e.l.f. professionals involved in sourcing, quality and innovation. We have longtime relationships with strategic vendors that pair a strong quality orientation with the ability to execute rapidly. Our supply chain is built for growth with asset-light operations, ample capacity and low capital requirements. This capability and commitment to an agile supply chain allows us to introduce a stream of on-trend innovation. Our consumers’ love of our high-quality, innovative products is shown through the online reviews posted on elfcosmetics.com, where a majority of 2016 reviews were five stars, the highest rating.
Fast-cycle innovation and validation model. We believe innovation is key to our success and that we are a leader in the industry in speed and new product introductions. We have built an innovation capability that can progress a new, high-quality e.l.f. product to online launch in as few as 20 weeks from concept, and 27 weeks on average. In 2016, we introduced over 90 new items across eyes, lips, face, tools, kits and skin care, and in 2015 40% of our retail sales came from products launched from 2012 to 2015 (based on data from Nielsen). With over 25 million visits per year and over 100,000 online reviews, elfcosmetics.com is a vehicle for refining products and determining best sellers. We are able to analyze sales results, reviews and feedback through social media to provide a quick indication of a product’s performance. Not only does this fast, high-output testing methodology result in leading performance in retail, it also contributes to building our consumer relationships. We believe our active dialogue with our consumers provides us with a highly differentiated perspective on innovation and informs the continuous launch, validation and refinement of our products.
True multi-channel brand blurs the lines between mass and prestige. We are a true multi-channel brand with strength across e-commerce, national retailers and our e.l.f. stores. Our ability to engage our consumers across multiple touch points differentiates e.l.f. from traditional mass brands, which typically focus on one channel. We also leverage insights gained from each channel to drive performance across the business.
| • | e-commerce. elfcosmetics.com has the highest revenue, traffic, time spent on-site and units per transaction of any mass cosmetics brand website based on data from the Internet Retailer eCommerce 500 report and Alexa Internet, Inc. Our e-commerce business serves as a strong source of sales and an important component of our engagement and innovation model. We have nurtured a loyal, highly active online community for over a decade. |
| • | National retailers. We currently sell our products in approximately 19,000 retail stores in the United States across mass, drug store, food and specialty retail channels. At Target, our longest-standing national retail customer and a key beauty destination for many consumers, we achieved double digit growth in retail sales from 2014 to 2015. We have also continued to expand with Walmart, the world’s largest retailer and an e.l.f. customer since 2012. We introduced e.l.f. at Old Navy in 2014 and at CVS in 2015 and expect to continue to grow distribution due to our compelling retailer value proposition. |
| • | e.l.f. stores. We were the first mass cosmetics brand with our own stores, which we believe serve as one of our most effective and efficient vehicles for marketing and consumer engagement. e.l.f. stores showcase a broad assortment of e.l.f. products, create an environment dedicated to play beautifully, and allow us to test and validate new products. As of December 31, 2016, we had 16 e.l.f. stores in the New York metro area and three e.l.f. stores in Southern California. |
High-performance team and culture. Our CEO Tarang Amin joined us in January 2014, and under his leadership we have assembled a world-class management team that possesses an excellent track record of results and has successfully worked together for many years. During the team’s prior tenure at Schiff Nutrition International, Inc. (New York Stock Exchange: SHF) (“Schiff Nutrition”), the company grew in enterprise value from $190 million to $1.5 billion in less than two years and was acquired by Reckitt Benckiser (London Stock Exchange: RB). With strong backgrounds from The Clorox Company, The Procter & Gamble Company, L’Oreal S.A., Mary Kay Inc., TPG Global, LLC (together with its affiliates, “TPG”) and other leading companies, our team has demonstrated skills in building brands, leading innovation, expanding distribution, making acquisitions and driving world-class operations. We operate with a high-performance team culture. We communicate with great candor and transparency in the spirit of helping the team succeed, make quick decisions and drive executional excellence. The combination of a talented team, strong culture and values and disciplined execution forms the foundation of our success.
3
Table of Contents
The e.l.f. growth strategy
We believe e.l.f. is one of the most disruptive brands in the cosmetics industry. We are in the early stages of development, with significant room to grow by converting more consumers to the brand, making e.l.f. products more widely available and offering more innovative products to our consumers. We expect the United States to be the largest source of our growth over the next few years and also see an opportunity to expand in select international markets. We also believe we have an opportunity to improve our margins through greater operating leverage and efficiency.
We have made substantial investments over the past three years and believe we are well positioned for continued growth driven by four strategies.
| 1. | Build a great brand |
Draw new consumers to the brand. We have a loyal consumer following, as illustrated by our repeat purchase rates which are among the highest in the industry: according to a marketing study conducted in October 2015, 58% of our consumers purchase one or more additional products within 12 months of initial purchase. We believe we can significantly grow this following of passionate consumers from current levels. Increasing brand awareness is a major growth driver for our company, as it has historically led to strong trial and high repeat purchase rates. e.l.f. is still unknown to many women, with only 13% unaided and 70% aided awareness as of December 2016. In contrast, some traditional brands have unaided awareness over 45% and aided awareness over 90%. We plan to continue to drive awareness and draw consumers to the brand.
Encourage current consumers to use more e.l.f. products. Our consumers’ loyalty to the e.l.f. brand drives growth through increased usage of our products across categories and advocacy of our brand to other potential consumers. Many of our consumers regularly visit elfcosmetics.com, where in 2016 they bought approximately nine units per transaction on average. We have designed our product assortment to encourage cross-category purchases across eyes, lips, face, tools and skin care. We find that consumers often enter the brand through one of our lower priced items and then purchase other e.l.f. products across categories once they understand our extraordinary value proposition. Our consumers also seek out our innovation, buying new products both online and in stores. We believe that through sustained innovation and efficient marketing, we will increase the number of e.l.f. items our consumers purchase.
| 2. | Lead innovation |
Use innovation to drive sales and margin. We have a track record of bringing prestige-inspired innovation quickly to the mass channel. We expect to continue to leverage our rapid innovation and flexible supply chain to introduce new products across the eyes, lips, face and tools categories. We believe our innovation has also led consumers to purchase products at higher price points while still delivering an extraordinary value. Many consumers who first tried a $1 item have now migrated to $3 to $8 items, which often have higher margins than our less expensive products.
Expand into skin care and relevant adjacencies. We have successfully brought a prestige-like approach to mass cosmetics at extraordinary value. We believe there are opportunities to use this same approach in other beauty categories, leveraging our brand equity and relationship with e.l.f. enthusiasts to extend our brand into adjacent segments. One such category is skin care, which generated $16 billion in retail sales in the United States and $110 billion globally in 2015. We have introduced a high-quality skin care line retailing for just $3 to $14 per product, a fraction of the price of prestige brands. We plan to capitalize on our innovation expertise to develop new products in other adjacent categories.
| 3. | Expand brand penetration |
Grow space allocation with our existing national retailers. We have significant potential upside in deepening distribution with our existing retailers by continuing to leverage our productivity, innovation and growth to win more shelf space. Even at our largest customers, e.l.f. has historically been in less than 6% of the space allocated to cosmetics despite having among the highest productivity in the category. While certain legacy cosmetics brands have an average of 15 to 18 feet of inline space in major retailers, e.l.f.’s average is approximately five feet. We believe that our strong performance will enable our shelf presence in our current retailers to become larger over time.
Increase number of new customers. We are one of the fastest growing cosmetics brands at Target and Walmart, and our growth rates and productivity are among the highest in the industry. We have major distribution whitespace, as we are currently in only approximately 19,000 national retail stores in the United States and believe there are thousands of additional stores available to us.
4
Table of Contents
Grow our direct-to-consumer business. We plan to grow elfcosmetics.com by driving traffic and conversion. In addition, our e.l.f. stores have been highly productive and profitable. As of December 31, 2016, we operated 16 stores in the New York metro area and three stores in Southern California. We plan to selectively open more e.l.f. stores nationally in high-traffic areas.
Expand internationally. We operate in a number of countries outside the United States, which accounted for 8% of our net sales in 2016. Given the portability of the e.l.f. brand, we believe that we have a significant opportunity in international markets over the long term.
| 4. | Drive world-class operations |
Leverage high-performance team culture and execution capability. We have made significant investments in our business over the past three years by hiring top talent and building functional capabilities. Our management team comes from leading consumer packaged goods companies and has experience implementing growth strategies and driving operational improvements. We believe what differentiates us from many traditional cosmetics companies is our ability to make fast decisions and execute with excellence. We believe we have a major speed-to-market advantage over many other companies and are highly responsive to retail customer and consumer needs. We will continue to leverage our executional excellence as we seek to become the preferred partner of our key customers.
Drive operating margins and efficiencies. We have built a low-cost, quality-oriented supply chain with ample capacity to support future growth. We intend to grow our margins by pursuing additional cost savings opportunities and enhancing our product mix through innovation. We also expect to benefit from operating leverage as we scale the business.
Risks associated with our business
Investing in our stock involves a high degree of risk. You should carefully consider the risks described in “Risk factors” before making a decision to invest in our common stock. If any of these risks actually occurs, our business, financial condition and results of operations would likely be materially adversely affected. In such case, the trading price of our common stock would likely decline and you may lose part or all of your investment. Below is a summary of some of the principal risks we face:
| • | The cosmetics industry is highly competitive, and if we are unable to compete effectively our results will suffer. |
| • | Our new product introductions may not be as successful as we anticipate. |
| • | We depend on a limited number of retailers for a large portion of our net sales, and the loss of one or more of these retailers, or business challenges at one or more of these retailers, could adversely affect our results of operations. |
| • | Our success depends, in part, on the quality, performance and safety of our products. |
| • | We may not be able to successfully implement our growth strategy. |
| • | Our growth and profitability are dependent on trends that may change or not continue, and our historical growth may not be indicative of our future growth. |
| • | We may be unable to manage our growth effectively, which would harm our business, financial condition and results of operations. |
| • | Any damage to our reputation or brand may materially and adversely affect our business, financial condition and results of operations. |
| • | A disruption in our operations could materially and adversely affect our business. |
| • | We are dependent on third-party suppliers, manufacturers, distributors and other vendors. |
| • | We may not be able to adequately protect intellectual property and other proprietary rights in our products and may be subject to claims that we infringe or misappropriate the rights of others. |
5
Table of Contents
| • | We have significant operations in China, which exposes us to risks inherent in doing business there. |
| • | We are not required to comply with certain provisions of the Sarbanes-Oxley Act of 2002 (the “Sarbanes-Oxley Act”) for as long as we remain an “emerging growth company.” |
Our sponsor
TPG Growth II Management, LLC (“TPG Growth” or our “Sponsor”) has been our principal financial backer since its acquisition of the Company in January 2014. TPG Growth is the middle market and growth equity investment platform of TPG, a leading global private investment firm founded in 1992 with approximately $72 billion of assets under management as of December 31, 2016. With more than $8 billion in assets under management and committed capital, TPG Growth targets investments in a broad range of industries and geographies, with a significant focus on the United States and large, emerging markets such as China, India, Brazil, Turkey, Africa and Southeast Asia.
Our corporate information
We were incorporated in Delaware on December 20, 2013 under the name J.A. Cosmetics Holdings, Inc. In April 2016, we changed our name to e.l.f. Beauty, Inc. Our principal offices are located at 570 10th Street, Oakland, California 94607. Our telephone number is (510) 778-7787. We maintain a website at www.elfcosmetics.com. The reference to our website is intended to be an inactive textual reference only. The information contained on, or that can be accessed through, our website is not part of this prospectus.
6
Table of Contents
| Issuer |
e.l.f. Beauty, Inc. |
| Common stock offered by the selling stockholders |
7,000,000 shares. |
| Common stock to be outstanding after this offering |
45,667,437 shares. |
| Underwriters’ option to purchase additional shares |
1,050,000 shares. |
| Use of proceeds |
The selling stockholders, including certain members of our board of directors and management, will receive all of the proceeds from this offering and we will not receive any proceeds from the sale of shares in this offering. Any proceeds received by us in connection with the exercise of options to purchase shares of our common stock by the selling stockholders in connection with this offering will be used for working capital and general corporate purposes. See “Use of proceeds” on page 40 for a more complete description of the intended use of proceeds from this offering. For more information on the selling stockholders, see “Principal and selling stockholders” on page 95. |
| Risk factors |
Investing in shares of our common stock involves a high degree of risk. See “Risk factors” beginning on page 11 of this prospectus for a discussion of factors you should carefully consider before investing in shares of our common stock. |
| Trading symbol |
“ELF.” |
In this prospectus, the number of shares of our common stock to be outstanding after this offering is based on 45,655,937 shares outstanding as of March 1, 2017, plus 11,500 shares of common stock subject to an outstanding option being exercised by a selling stockholder for the purpose of selling shares in this offering, and excludes:
| • | 5,984,749 shares of common stock issuable upon exercise of stock options outstanding as of March 1, 2017 at a weighted-average exercise price of $8.00 per share (including 11,500 shares of common stock that will be issued upon the exercise of an option at an exercise price of $1.84 per share by a selling stockholder and sold in this offering) (as adjusted for the special dividend declared on June 7, 2016 as described under “Dividend policy”); |
| • | 1,027,324 shares of common stock issuable upon vesting of outstanding restricted stock units as of March 1, 2017; |
| • | 7,321,085 shares of common stock reserved for issuance pursuant to future awards under our 2016 Equity Incentive Award Plan (the “2016 Plan”) as of March 1, 2017, as well as any additional automatic increases in the number of shares of our common stock reserved for future issuance under this plan; |
| • | 1,357,876 shares of common stock reserved for issuance pursuant to future awards under our 2016 Employee Stock Purchase Plan (the “ESPP”) as of March 1, 2017, as well as any additional automatic increases in the number of shares of our common stock reserved for future issuance under this plan; and |
| • | 220,800 shares of common stock reserved for issuance pursuant to the settlement of phantom shares issued pursuant to our 2014 Phantom Equity Plan in shares of our common stock. |
Unless otherwise indicated, this prospectus reflects and assumes:
| • | no exercise by the underwriters of their option to purchase additional shares of common stock from certain selling stockholders; and |
| • | no exercise of options outstanding after March 1, 2017 (other than the exercise of an option with respect to 11,500 shares of common stock that will be issued upon the exercise of an option by a selling stockholder and sold in this offering). |
7
Table of Contents
Summary consolidated financial data
The following table presents our summary consolidated financial data for the periods and as of the dates indicated. The periods prior to and including January 31, 2014 include all of the accounts of e.l.f. Cosmetics, Inc. (formerly known as J.A. Cosmetics US, Inc.) and its subsidiaries and are referred to in the following table as “Predecessor,” and all periods after January 31, 2014 include all of the accounts of e.l.f. Beauty, Inc. and its subsidiaries and are referred to in the following table as “Successor.” The summary consolidated financial data as of December 31, 2014, 2015 and 2016, and for the period from January 1, 2014 through January 31, 2014, the period from February 1, 2014 through December 31, 2014 and the years ended December 31, 2015 and 2016 (other than the balance sheet data for the year ended December 31, 2014), has been derived from the audited consolidated financial statements included elsewhere in this prospectus.
The summary consolidated financial data for the years ended December 31, 2012 and 2013 have been derived from the Predecessor’s audited consolidated financial statements which are not included in this prospectus and is presented in order to provide a reconciliation from net income to Adjusted EBITDA for these periods.
You should read the following financial information together with the information under “Capitalization,” “Selected consolidated financial data” and “Management’s discussion and analysis of financial condition and results of operations,” and our consolidated financial statements and the related notes included elsewhere in this prospectus.
| Predecessor | Successor | Unaudited pro forma combined(1) |
Successor | |||||||||||||||||
| (dollars in thousands, except share and per share amounts) |
Period from January 1, 2014 through January 31, 2014 |
Period from February 1, 2014 through December 31, 2014 |
Year ended December 31, 2014 |
Year ended December 31, 2015 |
Year ended December 31, 2016 |
|||||||||||||||
| Statement of operations data: |
||||||||||||||||||||
| Net sales |
$ | 9,810 | $ | 135,134 | $ | 144,944 | $ | 191,413 | $ | 229,567 | ||||||||||
| Gross profit |
4,772 | 61,450 | 67,496 | 100,329 | 132,235 | |||||||||||||||
| Operating income |
1,727 | 5,347 | 16,119 | 25,571 | 23,079 | |||||||||||||||
| Other income (expense), net |
36 | (6,633 | ) | (6,597 | ) | (4,172 | ) | 3,016 | ||||||||||||
| Interest expense |
(128 | ) | (11,545 | ) | (12,546 | ) | (12,721 | ) | (16,283 | ) | ||||||||||
| Income (loss) before provision for income taxes |
1,635 | (12,831 | ) | (3,024 | ) | 8,678 | 9,812 | |||||||||||||
| (Provision) benefit for income taxes |
(542 | ) | 3,545 | 143 | (4,321 | ) | (4,499 | ) | ||||||||||||
| Net income (loss) |
$ | 1,093 | $ | (9,286 | ) | $ | (2,881 | ) | $ | 4,357 | $ | 5,313 | ||||||||
| Net income (loss) per share—basic |
$ | 1,093 | $ | (709 | ) | $ | (512 | ) | $ | (1,560 | ) | $ | (39 | ) | ||||||
| Net income (loss) per share—diluted |
$ | 1,088 | $ | (709 | ) | $ | (512 | ) | $ | (1,560 | ) | $ | (39 | ) | ||||||
| Weighted average number of shares outstanding—basic |
1,000 | 27,593 | 27,593 | 30,523 | 12,606,529 | |||||||||||||||
| Weighted average number of shares outstanding—diluted |
1,005 | 27,593 | 27,593 | 30,523 | 12,606,529 | |||||||||||||||
| Other data: |
||||||||||||||||||||
| EBITDA(2) |
1,804 | 6,658 | 18,190 | 31,688 | 39,247 | |||||||||||||||
| Adjusted EBITDA(2) |
2,087 | 26,013 | 28,100 | 46,178 | 53,772 | |||||||||||||||
| Adjusted EBITDA margin |
21.3% | 19.2% | 19.4% | 24.1% | 23.4% | |||||||||||||||
| Depreciation and |
41 | 7,944 | 8,668 | 10,289 | 13,152 | |||||||||||||||
| Capital expenditures |
19 | 1,597 | 1,616 | 10,242 | 9,223 | |||||||||||||||
|
|
||||||||||||||||||||
| (1) | For the purpose of performing a comparison to the Successor’s year ended December 31, 2015, we prepared Unaudited Pro Forma Combined Supplemental Financial Information for the year ended December 31, 2014, which gives effect to the acquisition of 100% of the outstanding shares of capital stock of the Predecessor by the Successor, as if it had occurred on January 1, 2014 (the “Unaudited Pro Forma Combined 2014 Period”). The Unaudited Pro Forma Combined 2014 Period is being discussed herein for informational purposes only and does not reflect any operating efficiencies or potential cost savings that may result from the consolidation of operations. The amounts in the Predecessor and Successor columns do not total to the amounts in the unaudited pro forma combined column due to the adjustments made in preparing the Unaudited |
8
Table of Contents
| Pro Forma Combined 2014 Period, which are described in “Management’s discussion and analysis of financial conditions and results of operations—Recent transactions and basis of presentation.” |
| (2) | EBITDA represents net income (loss) plus interest expense, income tax benefit (provision) and depreciation and amortization. Adjusted EBITDA represents EBITDA further adjusted to exclude the impact of other items that management does not believe are reflective of the Company’s ongoing operations (comprising transaction-related expenses incurred in connection with the acquisition of the Predecessor, the restructuring of our operations, including warehouse transition and reorganization of our operations in China, and the preparation for our initial public offering), stock-based compensation expense, management fees paid to our Sponsor, costs associated with e.l.f. stores incurred prior to the store opening (including legal-related costs, rent and occupancy expenses, marketing and other store operating supply expenses), costs associated with securing additional distribution space (including slotting expense, freight and certain costs related to installation of fixtures), costs related to the evaluation of an acquisition in 2014, certain non-cash losses and write-offs, and gains and losses on our foreign currency contracts as reflected in the reconciliation below. |
We present EBITDA and Adjusted EBITDA because our management uses these as supplemental measures in assessing our operating performance, and we believe they are helpful to investors, securities analysts and other interested parties in evaluating the performance of companies in our industry. We also believe EBITDA and Adjusted EBITDA are useful to management and investors, securities analysts and other interested parties as measures of our comparative operating performance from period to period. EBITDA and Adjusted EBITDA are not measurements of financial performance under GAAP. They should not be considered as alternatives to cash flow from operating activities, as measures of liquidity, or as alternatives to net income as a measure of our operating performance or any other measures of performance derived in accordance with GAAP. In addition, EBITDA and Adjusted EBITDA should not be construed as an inference that our future results will be unaffected by unusual or non-recurring items. EBITDA and Adjusted EBITDA have limitations as analytical tools, and you should not consider such measures either in isolation or as substitutes for analyzing our results as reported under GAAP. Our definitions and calculations of EBITDA and Adjusted EBITDA are not necessarily comparable to other similarly titled measures used by other companies due to different methods of calculation.
The following table provides a reconciliation of EBITDA and Adjusted EBITDA to net income (loss):
| Predecessor | Successor | Unaudited pro forma combined |
Successor | |||||||||||||||||||||||||||||
| (dollars in thousands) | Year ended December 31, 2012 |
Year ended December 31, 2013 |
Period from January 1, 2014 through January 31, 2014 |
Period from February 1, 2014 through December 31, 2014 |
Year ended December 31, 2014 |
Year ended December 31, 2015 |
Year ended December 31, 2016 |
|||||||||||||||||||||||||
| Net income (loss) |
$ | 9,897 | $ | 16,555 | $ | 1,093 | $ | (9,286 | ) | $ | (2,881 | ) | $ | 4,357 | $ | 5,313 | ||||||||||||||||
| Interest expense |
610 | 1,637 | 128 | 11,545 | 12,546 | 12,721 | 16,283 | |||||||||||||||||||||||||
| Income tax benefit (provision) |
6,275 | 9,211 | 542 | (3,545 | ) | (143 | ) | 4,321 | 4,499 | |||||||||||||||||||||||
| Depreciation and amortization |
395 | 538 | 41 | 7,944 | 8,668 | 10,289 | 13,152 | |||||||||||||||||||||||||
|
|
|
|
|
|||||||||||||||||||||||||||||
| EBITDA |
$ | 17,177 | $ | 27,941 | $ | 1,804 | $ | 6,658 | $ | 18,190 | $ | 31,688 | $ | 39,247 | ||||||||||||||||||
| Transaction-related expenses(a) |
— | 194 | 63 | 9,759 | 94 | 705 | — | |||||||||||||||||||||||||
| Cost related to “restructuring” of operations(b) |
— | — | — | 370 | 370 | 1,595 | 4,701 | |||||||||||||||||||||||||
| Initial public offering preparation costs |
— | — | — | — | — | 1,144 | 945 | |||||||||||||||||||||||||
| Stock-based compensation |
— | 26 | — | 287 | 287 | 503 | 7,149 | |||||||||||||||||||||||||
| Management fee(c) |
233 | 250 | — | 775 | 775 | 854 | 875 | |||||||||||||||||||||||||
| Pre-opening costs(d) |
— | 118 | 15 | 180 | 195 | 64 | 1,231 | |||||||||||||||||||||||||
| Customer expansion costs(e) |
— | — | — | — | — | 1,191 | 721 | |||||||||||||||||||||||||
| Other non-cash and non-recurring costs |
— | — | — | 1,104 | 1,104 | 530 | — | |||||||||||||||||||||||||
| Unrealized losses (gains) on foreign currency contracts(f) |
— | — | 205 | 6,880 | 7,085 | 7,904 | (1,097 | ) | ||||||||||||||||||||||||
|
|
|
|
|
|||||||||||||||||||||||||||||
| Adjusted EBITDA |
$ | 17,410 | $ | 28,529 | $ | 2,087 | $ | 26,013 | $ | 28,100 | $ | 46,178 | $ | 53,772 | ||||||||||||||||||
| (a) | Represents transaction-related expenses related to the acquisition of the Predecessor. |
| (b) | Represents costs associated with the restructuring of our operations, including the transition of our New Jersey warehouse and distribution center in 2016 and the reorganization of our operations in China in 2015. |
| (c) | Represents management fees paid to our Sponsor. |
| (d) | Represents costs associated with e.l.f. stores incurred prior to the store opening, including legal-related costs, rent and occupancy expenses, marketing and other store operating supply expenses. |
| (e) | Represents costs associated with securing additional distribution space, including slotting expense, freight and certain costs related to installation of fixtures. |
| (f) | Represents non-cash (gains) / losses on our foreign currency contracts. |
9
Table of Contents
| Successor | ||||||||||||
| As of December 31, | ||||||||||||
| (dollars in thousands) | 2014 | 2015 | 2016 | |||||||||
| Balance sheet data: |
||||||||||||
| Cash and cash equivalents |
$ | 4,668 | $ | 14,004 | $ | 15,295 | ||||||
| Net working capital(3) |
23,218 | 10,860 | 29,339 | |||||||||
| Property and equipment, net |
2,125 | 9,854 | 17,151 | |||||||||
| Total assets |
354,178 | 361,072 | 414,729 | |||||||||
| Capital leases |
— | — | 2,766 | |||||||||
| Debt, including current maturities(4) |
148,424 | 144,919 | 162,061 | |||||||||
| Total liabilities |
222,656 | 224,175 | 273,867 | |||||||||
| Convertible preferred stock |
145,328 | 197,295 | — | |||||||||
| Total stockholders’ equity (deficit) |
(13,806 | ) | (60,398 | ) | 140,862 | |||||||
|
|
||||||||||||
| (3) | Net working capital is defined as current assets, excluding cash and cash equivalents, minus current liabilities. |
| (4) | Total bank debt, including current maturities, is net of $4.3 million, $3.2 million and $0.6 million of debt issuance costs as of December 31, 2014, 2015 and 2016, respectively. |
10
Table of Contents
Investing in our common stock involves a high degree of risk. You should carefully consider each of the following risk factors, as well as the other information in this prospectus, including our consolidated financial statements and the related notes, before deciding whether to invest in shares of our common stock. If any of the following risks actually occurs, our business, results of operations and financial condition may be materially and adversely affected. In that event, the trading price of our common stock could decline and you could lose all or part of your investment. Please also see the “Special note regarding forward-looking statements.”
Risks related to our business
The cosmetics industry is highly competitive, and if we are unable to compete effectively our results will suffer.
We face vigorous competition from companies throughout the world, including large multinational consumer products companies that have many cosmetics brands under ownership and standalone cosmetics brands, including those that may target the latest trends or specific distribution channels. Competition in the cosmetics industry is based on the introduction of new products, pricing of products, quality of products and packaging, brand awareness, perceived value and quality, innovation, in-store presence and visibility, promotional activities, advertising, editorials, e-commerce and mobile-commerce initiatives and other activities. We must compete with a high volume of new product introductions and existing products by diverse companies across several different distribution channels.
Many multinational consumer companies have greater financial, technical or marketing resources, longer operating histories, greater brand recognition or larger customer bases than we do and may be able to respond more effectively to changing business and economic conditions than we can. Many of these competitors’ products are sold in a wider selection or greater number of retail stores and possess a larger presence in these stores, typically having significantly more inline shelf space than we do. Given the finite space allocated to cosmetic products by retail stores, our ability to grow the number of retail stores in which our products are sold, and expand our space allocation once in these retail stores, may require the removal or reduction of the shelf space of these competitors. We may be unsuccessful in our growth strategy in the event retailers do not reallocate shelf space from our competitors to us. Our competitors may attempt to gain market share by offering products at prices at or below the prices at which our products are typically offered, including through the use of large percentage discounts and “buy one and get one free” offers. Competitive pricing may require us to reduce our prices, which would decrease our profitability or result in lost sales. Our competitors, many of whom have greater resources than we do, may be better able to withstand these price reductions and lost sales.
It is difficult for us to predict the timing and scale of our competitors’ activities in these areas or whether new competitors will emerge in the cosmetics business. In addition, further technological breakthroughs, including new and enhanced technologies which increase competition in the online retail market, new product offerings by competitors and the strength and success of our competitors’ marketing programs may impede our growth and the implementation of our business strategy.
Our ability to compete also depends on the continued strength of our brand and products, the success of our marketing, innovation and execution strategies, the continued diversity of our product offerings, the successful management of new product introductions and innovations, strong operational execution, including in order fulfillment, and our success in entering new markets and expanding our business in existing geographies. If we are unable to continue to compete effectively, it could have a material adverse effect on our business, results of operations and financial condition.
Our new product introductions may not be as successful as we anticipate.
The cosmetics industry is driven in part by fashion and beauty trends, which may shift quickly. Our continued success depends on our ability to anticipate, gauge and react in a timely and cost-effective manner to changes in consumer preferences for cosmetic products, consumer attitudes toward our industry and brand and where and how consumers shop for those products. We must continually work to develop, produce and market new products, maintain and enhance the recognition of our brand, maintain a favorable mix of products and develop our approach as to how and where we market and sell our products.
11
Table of Contents
We have an established process for the development, evaluation and validation of our new product concepts. Nonetheless, each new product launch online, through our e.l.f. stores and through our retail customers involves risks, as well as the possibility of unexpected consequences. For example, the acceptance of new product launches and sales to our retail customers may not be as high as we anticipate, due to lack of acceptance of the products themselves or their price, or limited effectiveness of our marketing strategies. In addition, our ability to launch new products may be limited by delays or difficulties affecting the ability of our suppliers or manufacturers to timely manufacture, distribute and ship new products or displays for new products. Sales of new products may be affected by inventory management by our retail customers, and we may experience product shortages or limitations in retail display space by our retail customers. We may also experience a decrease in sales of certain existing products as a result of newly-launched products, the impact of which could be exacerbated by shelf space limitations or any shelf space loss. Any of these occurrences could delay or impede our ability to achieve our sales objectives, which could have a material adverse effect on our business, financial condition and results of operations.
As part of our ongoing business strategy we expect we will need to continue to introduce new products in our traditional product categories of eyes, lips, face and tools, while also expanding our product launches into adjacent categories in which we may have little to no operating experience. For example, we recently introduced a high-quality skin care assortment. The success of product launches in adjacent product categories could be hampered by our relative inexperience operating in such categories, the strength of our competitors or any of the other risks referred to above. Furthermore, any expansion into new product categories may prove to be an operational and financial constraint which inhibits our ability to successfully accomplish such expansion. Our inability to introduce successful products in our traditional categories or in adjacent categories could limit our future growth and have a material adverse effect on our business, financial condition and results of operations.
We depend on a limited number of retailers for a large portion of our net sales, and the loss of one or more of these retailers, or business challenges at one or more of these retailers, could adversely affect our results of operations.
A limited number of our retail customers account for a large percentage of our net sales. Walmart and Target, accounted for 30% and 28%, respectively, of our net sales in 2016. We expect a small number of retailers will, in the aggregate, continue to account for the majority of our net sales for foreseeable future periods. Any changes in the policies or our ability to meet the demands of our retail customers relating to service levels, inventory de-stocking, pricing and promotional strategies or limitations on access to display space could have a material adverse effect on our business, financial condition and results of operations.
As is typical in our industry, our business with retailers is based primarily upon discrete sales orders, and we do not have contracts requiring retailers to make firm purchases from us. Accordingly, retailers could reduce their purchasing levels or cease buying products from us at any time and for any reason. If we lose a significant retail customer or if sales of our products to a significant retailer materially decrease, it could have a material adverse effect on our business, financial condition and results of operations.
Because a high percentage of our sales are made through our retail customers, our results are subject to risks relating to the general business performance of our key retail customers. Factors that adversely affect our retail customers’ businesses may also have a material adverse effect on our business, financial condition and results of operations. These factors may include:
| • | any reduction in consumer traffic and demand at our retail customers as a result of economic downturns, changes in consumer preferences or reputational damage as a result of, among other developments, data privacy breaches, regulatory investigations or employee misconduct; |
| • | any credit risks associated with the financial condition of our retail customers; |
| • | the effect of consolidation or weakness in the retail industry or at certain retail customers, including store closures and the resulting uncertainty; and |
| • | inventory reduction initiatives and other factors affecting retail customer buying patterns, including any reduction in retail space committed to cosmetics and retailer practices used to control inventory shrinkage. |
12
Table of Contents
Our success depends, in part, on the quality, performance and safety of our products.
Any loss of confidence on the part of consumers in the ingredients used in our products, whether related to product contamination or product safety or quality failures, actual or perceived, or inclusion of prohibited ingredients, could tarnish the image of our brand and could cause consumers to choose other products. Allegations of contamination or other adverse effects on product safety or suitability for use by a particular consumer, even if untrue, may require us to expend significant time and resources responding to such allegations and could, from time to time, result in a recall of a product from any or all of the markets in which the affected product was distributed. Any such issues or recalls could negatively affect our profitability and brand image.
If our products are found to be, or perceived to be, defective or unsafe, or if they otherwise fail to meet our consumers’ expectations, our relationships with consumers could suffer, the appeal of our brand could be diminished, we may need to recall some of our products and/or become subject to regulatory action, and we could lose sales or market share or become subject to boycotts or liability claims. In addition, safety or other defects in our competitors’ products could reduce consumer demand for our own products if consumers view them to be similar. Any of these outcomes could result in a material adverse effect on our business, financial condition and results of operations.
We may not be able to successfully implement our growth strategy.
Our future growth, profitability and cash flows depend upon our ability to successfully implement our business strategy, which, in turn, is dependent upon a number of factors, including our ability to:
| • | build a great brand by attracting new consumers and encouraging our current consumers to use more e.l.f. products; |
| • | continue to use innovation to drive sales and margin and expand into relevant adjacencies; |
| • | expand brand penetration by growing our space allocations with our existing national retail customers, increasing the number of our retail customers, growing our direct-to-consumer business and expanding internationally; and |
| • | leverage our high-performance team culture and executional capability to drive operating margins and efficiencies. |
There can be no assurance that we can successfully achieve any or all of the above initiatives in the manner or time period that we expect. Further, achieving these objectives will require investments which may result in short-term costs without generating any current net sales and therefore may be dilutive to our earnings. We cannot provide any assurance that we will realize, in full or in part, the anticipated benefits we expect our strategy will achieve. The failure to realize those benefits could have a material adverse effect on our business, financial condition and results of operations.
Our growth and profitability are dependent on a number of factors, and our historical growth may not be indicative of our future growth.
Although our net sales and profitability have grown rapidly from 2014 through 2016, this should not be considered as indicative of our future performance. We may not be successful in executing our growth strategy, and even if we achieve our strategic plan, we may not be able to sustain profitability. In future periods, our revenue could decline or grow more slowly than we expect. We also may incur significant losses in the future for a number of reasons, including the following risks and the other risks described in this prospectus, and we may encounter unforeseen expenses, difficulties, complications, delays and other unknown factors:
| • | we may lose one or more significant retail customers, or sales of our products through these retail customers may decrease; |
| • | the ability of our third-party suppliers and manufacturers to produce our products and of our distributors to distribute our products could be disrupted; |
| • | because all of our products are sourced and manufactured in China, our operations are susceptible to risks inherent in doing business there; |
| • | our products may be the subject of regulatory actions, including but not limited to actions by the Food and Drug Administration (the “FDA”), the Federal Trade Commission (the “FTC”) and the Consumer Product Safety Commission (the “CPSC”) in the United States; |
13
Table of Contents
| • | we may be unable to introduce new products that appeal to consumers or otherwise successfully compete with our competitors in the cosmetics industry; |
| • | we may be unsuccessful in enhancing the recognition and reputation of our brand, and our brand may be damaged as a result of, among other reasons, our failure, or alleged failure, to comply with applicable ethical, social, product, labor or environmental standards; |
| • | we may experience service interruptions, data corruption, cyber-based attacks or network security breaches which result in the disruption of our operating systems or the loss of confidential information of our consumers; |
| • | we may be unable to retain key members of our senior management team or attract and retain other qualified personnel; and |
| • | we may be affected by any adverse economic conditions in the United States or internationally. |
We may be unable to manage our growth effectively, which would harm our business, financial condition and results of operations.
We have grown rapidly, with our net sales increasing from $144.9 million in the Unaudited Pro Forma Combined 2014 Period to $229.6 million in the year ended December 31, 2016. Our growth has placed, and will continue to place, a strain on our management team, financial and information systems, supply chain and distribution capacity and other resources. To manage growth effectively, we must continue to enhance our operational, financial and management systems, including our warehouse management, inventory control and in-store point-of-sale systems; maintain and improve our internal controls and disclosure controls and procedures; maintain and improve our information technology systems and procedures; and expand, train and manage our employee base.
We may not be able to effectively manage this expansion in any one or more of these areas, and any failure to do so could significantly harm our business, financial condition and results of operations. Our rapid growth also makes it difficult for us to adequately predict the expenditures we will need to make in the future. If we do not make the necessary overhead expenditures to accommodate our future growth, we may not be successful in executing our growth strategy, and our results of operations would suffer.
Any damage to our reputation or brand may materially and adversely affect our business, financial condition and results of operations.
We believe that developing and maintaining our brand is critical and that our financial success is directly dependent on consumer perception of our brand. Furthermore, the importance of our brand recognition may become even greater as competitors offer more products similar to ours.
We have relatively low brand awareness among consumers when compared to other cosmetic brands, and maintaining and enhancing the recognition and reputation of our brand is critical to our business and future growth. Many factors, some of which are beyond our control, are important to maintaining our reputation and brand. These factors include our ability to comply with ethical, social, product, labor and environmental standards. Any actual or perceived failure in compliance with such standards could damage our reputation and brand.
The growth of our brand depends largely on our ability to provide a high-quality consumer experience, which in turn depends on our ability to bring innovative products to the market at competitive prices that respond to consumer demands and preferences. Additional factors affecting our consumer experience include our ability to provide appealing store sets in retail stores, the maintenance and stocking of those sets by our retail customers, the overall shopping experience provided by our retail customers, a reliable and user-friendly website interface and mobile applications for our consumers to browse and purchase products on elfcosmetics.com and an engaging environment in our e.l.f. stores. If we are unable to preserve our reputation, enhance our brand recognition or increase positive awareness of our products and in-store and Internet platforms, it may be difficult for us to maintain and grow our consumer base, and our business, financial condition and results of operations may be materially and adversely affected.
The success of our brand may also suffer if our marketing plans or product initiatives do not have the desired impact on our brand’s image or its ability to attract consumers. Further, our brand value could diminish significantly due to a number of factors, including consumer perception that we have acted in an irresponsible manner, adverse publicity about our products, our failure to maintain the quality of our products, product contamination, the failure of our products to deliver consistently positive consumer experiences, or the products becoming unavailable to consumers.
14
Table of Contents
A disruption in our operations could materially and adversely affect our business.
As a company engaged in distribution on a global scale, our operations, including those of our third-party manufacturers, suppliers and delivery service providers, are subject to the risks inherent in such activities, including industrial accidents, environmental events, strikes and other labor disputes, disruptions in information systems, product quality control, safety, licensing requirements and other regulatory issues, as well as natural disasters, pandemics, border disputes, acts of terrorism and other external factors over which we and our third-party manufacturers, suppliers and delivery service providers have no control. The loss of, or damage to, the manufacturing facilities or distribution centers of our third-party manufacturers, suppliers and delivery service providers could have a material adverse effect on our business, financial condition and results of operations.
We depend heavily on ocean container delivery to receive shipments of our products from our third-party manufacturers located in China and contracted third-party delivery service providers to deliver our products to a single distribution facility located in Ontario, California, and from there to our retail customers. Further, we rely on postal and parcel carriers for the delivery of products sold directly to consumers through elfcosmetics.com. Interruptions to or failures in these delivery services could prevent the timely or successful delivery of our products. These interruptions or failures may be due to unforeseen events that are beyond our control or the control of our third-party delivery service providers, such as inclement weather, natural disasters or labor unrest. For example, in the fall of 2014, longshoreman work stoppages created a significant backlog of cargo containers at ports. We experienced delays in the shipment of our products as a result of this backlog and were unable to meet our planned inventory allocations for a limited period of time. As another example, in December 2015, a parcel carrier returned five pallets of holiday shipments to us based on their service backlog, causing significant delays in our holiday shipments. If our products are not delivered on time or are delivered in a damaged state, retail customers and consumers may refuse to accept our products and have less confidence in our services. Furthermore, the delivery personnel of contracted third-party delivery service providers act on our behalf and interact with our consumers personally. Any failure to provide high-quality delivery services to our consumers may negatively affect the shopping experience of our consumers, damage our reputation and cause us to lose consumers.
Our ability to meet the needs of our consumers, retail customers and our e.l.f. stores depends on the proper operation of our Ontario, California distribution facility, where most of our inventory that is not in transit is housed. Although we currently insure our inventory, our insurance coverage may not be sufficient to cover the full extent of any loss or damage to our inventory or distribution facility, and any loss, damage or disruption of this facility, or loss or damage of the inventory stored there, could materially and adversely affect our business, financial condition and results of operations.
We rely on third-party suppliers, manufacturers, distributors and other vendors, and they may not continue to produce products or provide services that are consistent with our standards or applicable regulatory requirements, which could harm our brand, cause consumer dissatisfaction, and require us to find alternative suppliers of our products or services.
We do not own or operate any manufacturing facilities. We use multiple third-party suppliers and manufacturers based in China to source and manufacture all of our products. We engage our third-party suppliers and manufacturers on a purchase order basis and are not party to long-term contracts with any of them. The ability of these third parties to supply and manufacture our products may be affected by competing orders placed by other customers and the demands of those customers. If we experience significant increases in demand, or need to replace a significant number of existing suppliers or manufacturers, there can be no assurance that additional supply and manufacturing capacity will be available when required on terms that are acceptable to us, or at all, or that any supplier or manufacturer will allocate sufficient capacity to us in order to meet our requirements.
In addition, quality control problems, such as the use of ingredients and delivery of products that do not meet our quality control standards and specifications or comply with applicable laws or regulations, could harm our business. These quality control problems could result in regulatory action, such as restrictions on importation, products of inferior quality or product stock outages or shortages, harming our sales and creating inventory write-downs for unusable products.
We have also outsourced significant portions of our distribution process, as well as certain technology-related functions, to third-party service providers. Specifically, we rely on third-party distributors to sell our products in a number of foreign countries, our sole warehouse and distribution center in California is managed and staffed by a third-party service provider, we are dependent on a single third-party vendor for credit card processing and we utilize a third-party hosting and networking provider to host our web services, including elfcosmetics.com. The failure of one or more of these entities to
15
Table of Contents
provide the expected services on a timely basis, or at all, or at the prices we expect, or the costs and disruption incurred in changing these outsourced functions to being performed under our management and direct control or that of a third-party, may have a material adverse effect on our business, financial condition and results of operations. We are not party to long-term contracts with some of our distributors, and upon expiration of these existing agreements, we may not be able to renegotiate the terms on a commercially reasonable basis, or at all.
Further, our third-party manufacturers, suppliers and distributors may:
| • | have economic or business interests or goals that are inconsistent with ours; |
| • | take actions contrary to our instructions, requests, policies or objectives; |
| • | be unable or unwilling to fulfill their obligations under relevant purchase orders, including obligations to meet our production deadlines, quality standards, pricing guidelines and product specifications, and to comply with applicable regulations, including those regarding the safety and quality of products and ingredients; |
| • | have financial difficulties; |
| • | encounter raw material or labor shortages; |
| • | encounter increases in raw material or labor costs which may affect our procurement costs; |
| • | disclose our confidential information or intellectual property to competitors or third parties; |
| • | engage in activities or employ practices that may harm our reputation; and |
| • | work with, be acquired by, or come under control of, our competitors. |
The occurrence of any of these events, alone or together, could have a material adverse effect on our business, financial condition and results of operations. In addition, such problems may require us to find new third-party suppliers, manufacturers or distributors, and there can be no assurance that we would be successful in finding third-party suppliers, manufacturers or distributors meeting our standards of innovation and quality.
The management and oversight of the engagement and activities of our third-party suppliers, manufacturers and distributors requires substantial time, effort and expense of our employees, and we may be unable to successfully manage and oversee the activities of our third-party manufacturers, suppliers and distributors. If we experience any supply chain disruptions caused by our manufacturing process or by our inability to locate suitable third-party manufacturers or suppliers, or if our manufacturers or raw material suppliers experience problems with product quality or disruptions or delays in the manufacturing process or delivery of the finished products or the raw materials or components used to make such products, our business, financial condition and results of operations could be materially and adversely affected.
If we fail to manage our inventory effectively, our results of operations, financial condition and liquidity may be materially and adversely affected.
Our business requires us to manage a large volume of inventory effectively. We depend on our forecasts of demand for, and popularity of, various products to make purchase decisions and to manage our inventory of stock-keeping units (“SKUs”). Demand for products, however, can change significantly between the time inventory or components are ordered and the date of sale. Demand may be affected by seasonality, new product launches, rapid changes in product cycles and pricing, product defects, promotions, changes in consumer spending patterns, changes in consumer tastes with respect to our products and other factors, and our consumers may not purchase products in the quantities that we expect. It may be difficult to accurately forecast demand and determine appropriate levels of product or componentry. We generally do not have the right to return unsold products to our suppliers. If we fail to manage our inventory effectively or negotiate favorable credit terms with third-party suppliers, we may be subject to a heightened risk of inventory obsolescence, a decline in inventory values, and significant inventory write-downs or write-offs. In addition, if we are required to lower sale prices in order to reduce inventory level or to pay higher prices to our suppliers, our profit margins might be negatively affected. Any of the above may materially and adversely affect our business, financial condition and results of operations. See also “—Our quarterly results of operations fluctuate due to seasonality, order patterns from key retail customers and other factors, and we may not have sufficient liquidity to meet our seasonal working capital requirements.”
16
Table of Contents
Our substantial indebtedness may have a material adverse effect on our business, financial condition and results of operations.
As of December 31, 2016, we had a total of $165.4 million of indebtedness, consisting of amounts outstanding under our credit facilities and capital lease obligations, and a total availability of $34.5 million under our Revolving Credit Facility (as defined in “Management’s discussion and analysis of financial condition and results of operations” included elsewhere in this prospectus under the heading “Description of indebtedness”). Our indebtedness could have significant consequences, including:
| • | requiring a substantial portion of our cash flows to be dedicated to debt service payments instead of funding growth, working capital, capital expenditures, investments or other cash requirements; |
| • | reducing our flexibility to adjust to changing business conditions or obtain additional financing; |
| • | exposing us to the risk of increased interest rates as our borrowings are at variable rates; |
| • | making it more difficult for us to make payments on our indebtedness; |
| • | subjecting us to restrictive covenants that may limit our flexibility in operating our business, including our ability to take certain actions with respect to indebtedness, liens, sales of assets, consolidations and mergers, affiliate transactions, dividends and other distributions and changes of control; |
| • | subjecting us to maintenance covenants which require us to maintain specific financial ratios; and |
| • | limiting our ability to obtain additional financing for working capital, capital expenditures, debt service requirements and general corporate or other purposes. |
Our quarterly results of operations fluctuate due to seasonality, order patterns from key retail customers and other factors, and we may not have sufficient liquidity to meet our seasonal working capital requirements.
We generate a significant portion of our net sales in the third and fourth quarters of our fiscal year as a result of higher sales during the holiday season, and adverse events that occur during the third or fourth quarter could have a disproportionate effect on our results of operations for the entire fiscal year. As a result of higher sales during the third and fourth quarters, our working capital needs are greater during the second and third quarters of the fiscal year. In addition to holiday seasonality, we may experience variability in net sales and net income throughout the year as a result of the size and timing of orders from our retail customers. Because a limited number of our retail customers account for a large percentage of our net sales, a change in the order pattern of one or more of our large retail customers could cause a significant fluctuation of our quarterly results or reduce our liquidity. Furthermore, product orders from our large retail customers may vary over time due to changes in their inventory or out-of-stock policies. If we were to experience a significant shortfall in sales or profitability or internally generated funds, we may not have sufficient liquidity to fund our business. As a result of quarterly fluctuations caused by these and other factors, comparisons of our operating results across different fiscal quarters may not be accurate indicators of our future performance. Any quarterly fluctuations that we report in the future may differ from the expectations of market analysts and investors, which could cause the price of our common stock to fluctuate significantly.
We are increasingly dependent on information technology, and if we are unable to protect against service interruptions, data corruption, cyber-based attacks or network security breaches, our operations could be disrupted.
We rely on information technology networks and systems to market and sell our products, to process, transmit and store electronic and financial information, to manage a variety of business processes and activities and to comply with regulatory, legal and tax requirements. We are increasingly dependent on a variety of information systems to effectively process retail customer orders, manage the operations of our e.l.f. store base and fulfill consumer orders from our e-commerce business. We depend on our information technology infrastructure for digital marketing activities and for electronic communications among our e.l.f. stores, personnel, retail customers, consumers, manufacturers and suppliers around the world. These information technology systems, some of which are managed by third parties, may be susceptible to damage, disruptions or shutdowns due to failures during the process of upgrading or replacing software, databases or components, power outages, hardware failures, computer viruses, attacks by computer hackers, telecommunication failures, user errors or catastrophic events. Any material disruption of our systems, or the systems of our third-party service providers, could disrupt our ability
17
Table of Contents
to track, record and analyze the products that we sell and could negatively impact our operations, shipment of goods, ability to process financial information and transactions, and our ability to receive and process retail customers and e-commerce orders or engage in normal business activities. If our information technology systems suffer damage, disruption or shutdown and we do not effectively resolve the issues in a timely manner, our business, financial condition and results of operations may be materially and adversely affected, and we could experience delays in reporting our financial results.
Our e-commerce operations are important to our business. Our website serves as an effective extension of our marketing strategies by exposing potential new consumers to our brand, product offerings and enhanced content. Due to the importance of our website and e-commerce operations, we are vulnerable to website downtime and other technical failures. Our failure to successfully respond to these risks could reduce e-commerce sales and damage our brand’s reputation.
We must successfully maintain and upgrade our information technology systems, and our failure to do so could have a material adverse effect on our business, financial condition and results of operations.
We have identified the need to significantly expand and improve our information technology systems and personnel to support recent and expected future growth. As such, we are in process of implementing, and will continue to invest in and implement, significant modifications and upgrades to our information technology systems and procedures, including replacing legacy systems with successor systems, making changes to legacy systems or acquiring new systems with new functionality, hiring employees with information technology expertise and building new policies, procedures, training programs and monitoring tools. These types of activities subject us to inherent costs and risks associated with replacing and changing these systems, including impairment of our ability to leverage our e-commerce channels, fulfill customer orders, potential disruption of our internal control structure, substantial capital expenditures, additional administration and operating expenses, acquisition and retention of sufficiently skilled personnel to implement and operate the new systems, demands on management time and other risks and costs of delays or difficulties in transitioning to or integrating new systems into our current systems. These implementations, modifications and upgrades may not result in productivity improvements at a level that outweighs the costs of implementation, or at all. In addition, difficulties with implementing new technology systems, delays in our timeline for planned improvements, significant system failures, or our inability to successfully modify our information systems to respond to changes in our business needs may cause disruptions in our business operations and have a material adverse effect on our business, financial condition and results of operations.
If we fail to adopt new technologies or adapt our website and systems to changing consumer requirements or emerging industry standards, our business may be materially and adversely affected.
To remain competitive, we must continue to enhance and improve the responsiveness, functionality and features of our Internet platform, including our e-commerce website and mobile applications. Our competitors are continually developing innovations and introducing new products to increase their consumer base and enhance user experience. As a result, in order to attract and retain consumers and compete against our competitors, we must continue to invest resources to enhance our information technology and improve our existing products and services for our consumers. The Internet and the online retail industry are characterized by rapid technological evolution, changes in consumer requirements and preferences, frequent introductions of new products and services embodying new technologies and the emergence of new industry standards and practices, any of which could render our existing technologies and systems obsolete. Our success will depend, in part, on our ability to identify, develop, acquire or license leading technologies useful in our business, and respond to technological advances and emerging industry standards and practices in a cost-effective and timely way. The development of our website and other proprietary technology entails significant technical and business risks. There can be no assurance that we will be able to properly implement or use new technologies effectively or adapt our website and systems to meet consumer requirements or emerging industry standards. If we are unable to adapt in a cost-effective and timely manner in response to changing market conditions or consumer requirements, whether for technical, legal, financial or other reasons, our business, financial condition and results of operations may be materially and adversely affected.
Failure to protect sensitive information of our consumers and information technology systems against security breaches could damage our reputation and brand and substantially harm our business, financial condition and results of operations.
We collect, maintain, transmit and store data about our consumers, suppliers and others, including personally identifiable information and financial information, as well as other confidential and proprietary information. We also employ third-party service providers that collect, store, process and transmit proprietary, personal and confidential information, including credit card information, on our behalf.
18
Table of Contents
Advances in technology, the expertise of criminals, new discoveries in the field of cryptography, acts or omissions by our employees, contractors or service providers or other events or developments could result in a compromise or breach in the security of confidential or sensitive information. We and our service providers may not be able to prevent third parties, including criminals, competitors or others, from breaking into or altering our systems, conducting denial-of-service attacks, attempting to gain access to our systems, information or monetary funds through phishing or social engineering campaigns, installing viruses or malicious software on our website or devices used by our employees or contractors, or carrying out other activity intended to disrupt our systems or gain access to confidential or sensitive information in our or our service providers’ systems. Furthermore, such third parties may further engage in various other illegal activities using such information, including credit card fraud, which may cause additional harm to us, our consumers and our brand. We also may be vulnerable to error or malfeasance by our own employees or other insiders. Third parties may attempt to fraudulently induce our or our service providers’ employees to misdirect funds or to disclose information in order to gain access to personal data we maintain about our consumers or website users. In addition, we have limited control or influence over the security policies or measures adopted by third-party providers of online payment services through which some of our consumers may elect to make payment for purchases at our website. Contracted third-party delivery service providers may also violate their confidentiality obligations and disclose or use information about our consumers inadvertently or illegally.
If any breach of information security were to occur, our reputation and brand could be damaged, our business may suffer, we could be required to expend significant capital and other resources to alleviate problems caused by such breaches, and we could be exposed to a risk of loss, litigation or regulatory action and possible liability. Actual or anticipated attacks may cause us to incur increasing costs, including costs to deploy additional personnel and protection technologies, train employees and engage third-party experts and consultants. In addition, any party who is able to illicitly obtain a subscriber’s password could access the subscriber’s financial, transaction or personal information. Any compromise or breach of our security measures, or those of our third-party service providers, may violate applicable privacy, data security and other laws, and cause significant legal and financial exposure, adverse publicity and a loss of confidence in our security measures, which could have a material adverse effect on our business, financial condition and results of operations. Although we maintain privacy, data breach and network security liability insurance, we cannot be certain that our coverage will be adequate for liabilities actually incurred or that insurance will continue to be available to us on economically reasonable terms, or at all. We may need to devote significant resources to protect against security breaches or to address problems caused by breaches, diverting resources from the growth and expansion of our business.
Payment methods used on our Internet platform subject us to third-party payment processing-related risks.
We accept payments from our consumers using a variety of methods, including online payments with credit cards and debit cards issued by major banks in the United States, payments made with gift cards processed by third-party providers, and payment through third-party online payment platforms such as PayPal. We also rely on third parties to provide payment processing services. For certain payment methods, including credit and debit cards, we pay interchange and other fees, which may increase over time and raise our operating costs and lower our profit margins. We may also be subject to fraud and other illegal activities in connection with the various payment methods we offer, including online payment options and gift cards. For online consumers, these are card-not-present transactions, so they present a greater risk of fraud. Criminals are using increasingly sophisticated methods to engage in illegal activities such as unauthorized use of credit or debit cards and bank account information. To the extent we are an online seller, requirements relating to consumer authentication and fraud detection are more complex. We may ultimately be held liable for the unauthorized use of a cardholder’s card number in an illegal activity and be required by card issuers to pay charge-back fees. Charge-backs result not only in our loss of fees earned with respect to the payment, but also leave us liable for the underlying money transfer amount. If our charge-back rate becomes excessive, card associations also may require us to pay fines or refuse to process our transactions. In addition, we may be subject to additional fraud risk if third-party service providers or our employees fraudulently use consumer information for their own gain or facilitate the fraudulent use of such information. Overall, we may have little recourse if we process a criminally fraudulent transaction.
We are subject to payment card association operating rules, certification requirements and various rules, regulations and requirements governing electronic funds transfers, which could change or be reinterpreted to make it difficult or impossible for us to comply. As our business changes we may also be subject to different rules under existing standards, which may require new assessments that involve costs above what we currently pay for compliance. If we fail to comply with the rules or requirements of any provider of a payment method we accept, or if the volume of fraud in our transactions limits or terminates our rights to use payment methods we currently accept, or if a data breach occurs relating to our payment systems, among other things, we may be subject to fines and higher transaction fees and lose our ability to accept credit and
19
Table of Contents
debit card payments from our consumers, process electronic funds transfers or facilitate other types of online payments, and our reputation and our business, financial condition and results of operations could be materially and adversely affected.
We have significant operations in China, which exposes us to risks inherent in doing business there.
We currently source and manufacture all of our products from third-party suppliers and manufacturers in China. As of December 31, 2016, we had a team of 56 employees in China to manage our supply chain. With the rapid development of the Chinese economy, the cost of labor has increased and may continue to increase in the future. Our results of operations will be materially and adversely affected if our labor costs, or the labor costs of our suppliers and manufacturers, increase significantly. In addition, we and our manufacturers and suppliers may not be able to find a sufficient number of qualified workers due to the intensely competitive and fluid market for skilled labor in China. Furthermore, pursuant to Chinese labor laws, employers in China are subject to various requirements when signing labor contracts, paying remuneration, determining the term of employees’ probation and unilaterally terminating labor contracts. These labor laws and related regulations impose liabilities on employers and may significantly increase the costs of workforce reductions. If we decide to change or reduce our workforce, these labor laws could limit or restrict our ability to make such changes in a timely, favorable and effective manner. Any of these events may materially and adversely affect our business, financial condition and results of operations. See also “—Changes in tax law and other developments resulting from the new presidential administration in the United States may have a material adverse effect on our business, financial condition and results of operations.”
Operating in China exposes us to political, legal and economic risks. In particular, the political, legal and economic climate in China, both nationally and regionally, is fluid and unpredictable. Our ability to operate in China may be adversely affected by changes in U.S. and Chinese laws and regulations such as those related to, among other things, taxation, import and export tariffs, environmental regulations, land use rights, intellectual property, currency controls, network security, employee benefits and other matters. In addition, we may not obtain or retain the requisite legal permits to continue to operate in China, and costs or operational limitations may be imposed in connection with obtaining and complying with such permits. In addition, Chinese trade regulations are in a state of flux, and we may become subject to other forms of taxation, tariffs and duties in China. Furthermore, the third parties we rely on in China may disclose our confidential information or intellectual property to competitors or third parties, which could result in the illegal distribution and sale of counterfeit versions of our products. If any of these events occur, our business, financial condition and results of operations could be materially and adversely affected.
Changes in tax law and other developments resulting from the new presidential administration in the United States may have a material adverse effect on our business, financial condition and results of operations.
Changes in laws and policy relating to taxes or trade resulting from the 2016 U.S. presidential and congressional elections may have an adverse effect on our business, financial condition and results of operations. Potential tax reforms in the United States may result in significant changes to current U.S. tax rules and regulations. These changes could have a material adverse effect on our business, results of operations and liquidity as a result of the fact, among others, that we currently source and manufacture all of our products from third-party suppliers and manufacturers in China.
Although we are unable to predict what, if any, changes will occur, the 2016 U.S. presidential election introduced a great deal of uncertainty regarding current tax and trade law, regulation and government policy, and, if implemented, some proposals discussed before and after the election have the potential to adversely affect trade between the United States and China. Changes in U.S.-China trade relations and changes to U.S. tax or other laws (including new or changes in regulations promulgated by the U.S. Internal Revenue Service and the U.S. Department of the Treasury) as well as changes in Chinese laws and regulations, such as the imposition of or increase in tariffs or other trade barriers, could materially and adversely impact our effective tax rate, increase our costs and reduce the competitiveness of our products in the U.S. market.
If our cash from operations is not sufficient to meet our current or future operating needs, expenditures and debt service obligations, our business, financial condition and results of operations may be materially and adversely affected.
We may require additional cash resources due to changed business conditions or other future developments, including any marketing initiatives, investments or acquisitions we may decide to pursue. To the extent we are unable to generate sufficient cash flow, we may be forced to cancel, reduce or delay these activities. Alternatively, if our sources of funding are insufficient to satisfy our cash requirements, we may seek to obtain an additional credit facility or sell equity or debt
20
Table of Contents
securities. The sale of equity securities would result in dilution of our existing stockholders. The incurrence of additional indebtedness would result in increased debt service obligations and operating and financing covenants that could restrict our operations.
Our ability to generate cash to meet our operating needs, expenditures and debt service obligations will depend on our future performance and financial condition, which will be affected by financial, business, economic, legislative, regulatory and other factors, including potential changes in costs, pricing, the success of product innovation and marketing, competitive pressure and consumer preferences. If our cash flows and capital resources are insufficient to fund our debt service obligations and other cash needs, we could face substantial liquidity problems and could be forced to reduce or delay investments and capital expenditures or to dispose of material assets or operations, seek additional debt or equity capital or restructure or refinance our indebtedness. Our credit facilities may restrict our ability to take these actions, and we may not be able to affect any such alternative measures on commercially reasonable terms, or at all. If we cannot make scheduled payments on our debt, the lenders under our Senior Secured Credit Facility (as defined in “Management’s discussion and analysis of financial condition and results of operations” included elsewhere in this prospectus under the heading “Description of indebtedness”) can terminate their commitments to loan money under our Revolving Credit Facility, and our lenders under our Senior Secured Credit Facility can declare all outstanding principal and interest to be due and payable and foreclose against the assets securing their borrowings, and we could be forced into bankruptcy or liquidation.
Furthermore, it is uncertain whether financing will be available in amounts or on terms acceptable to us, if at all, which could have a material adverse effect on our business, financial condition and results of operations.
Our success depends, in part, on our retention of key members of our senior management team and ability to attract and retain qualified personnel.
Our success depends, in part, on our ability to retain our key employees, including our executive officers, senior management team and development, operations, finance, sales and marketing personnel. We are a small company that relies on a few key employees, any one of whom would be difficult to replace, and because we are a small company, we believe that the loss of key employees may be more disruptive to us than it would be to a large, international company. Our success also depends, in part, on our continuing ability to identify, hire, train and retain other highly qualified personnel. In addition, we may be unable to effectively plan for the succession of senior management, including our chief executive officer. The loss of key personnel or the failure to attract and retain qualified personnel may have a material adverse effect on our business, financial condition and results of operations.
Increasing the number of e.l.f. stores may not be successful and will subject us to risks associated with long-term non-cancelable leases and increased capital requirements that may adversely affect our business, financial condition and results of operations.
Our growth strategy is dependent in part on our ability to open and operate new brick-and-mortar e.l.f. stores in high-traffic areas in the United States. The success of this strategy is dependent upon, among other factors, the identification of suitable markets and sites for store locations, the negotiation of acceptable lease terms, the hiring, training and retention of competent sales personnel, the successful integration of these stores into our existing operations and information technology systems and making capital expenditures for these stores.
As a result of our limited experience in operating direct-to-consumer retail stores, e.l.f. stores may be less successful than we expect. Our current strategy includes pursuing continued expansion of e.l.f. stores in the United States at a steady or increased pace. The effect of these stores, particularly in growing numbers, on our business and results of operations is uncertain and dependent on various factors. Falling short in our pursuit of expansion could potentially lead to a negative impact on our growth plan while incurring significant financial costs, expenses and investments.
All of our e.l.f. stores are located on leased premises, and we expect that any new e.l.f. stores will also be located on leased premises. The leases for our stores generally have initial terms of 10 years and typically provide for a single renewal option in five-year increments as well as for rent escalations. We generally cannot terminate these leases before the end of the initial lease term and our ability to assign or sublease is subject to certain conditions. Additional sites that we lease are likely to be subject to similar long-term, non-terminable leases. If we close a store, we nonetheless may be obligated to perform our monetary obligations under the applicable lease, including, among other things, payment of the base rent for the balance of the lease term. In addition, if we fail to negotiate renewals, either on commercially acceptable terms or at all, as each of our leases expires we could be forced to close stores in desirable locations.
21
Table of Contents
We depend on cash flows from operations to pay our lease expenses and to fulfill our other cash needs. If our business does not generate sufficient cash flow from operating activities, and sufficient funds are not otherwise available to us from borrowings under our Revolving Credit Facility or other sources, we may not be able to service our lease expenses or fund our other liquidity and capital needs, which would materially affect our business.
We plan to make capital expenditures to open additional e.l.f. stores. Furthermore, the commitments associated with any expansion will increase our operating expenses and may be costly to terminate if we decide to close a store or change our strategy. We are likely to incur costs associated with these investments earlier than some of the anticipated financial and other benefits, and the return on these investments may be lower, or may develop more slowly, than we expect. As a result, the carrying value of the related assets may be subject to an impairment charge, which could materially and adversely affect our results of operations.
Adverse U.S. or international economic conditions could negatively affect our business, financial condition and results of operations.
Consumer spending on cosmetic products is influenced by general economic conditions and the availability of discretionary income. Adverse U.S. or international economic conditions or periods of inflation or high energy prices may contribute to higher unemployment levels, decreased consumer spending, reduced credit availability and declining consumer confidence and demand, each of which poses a risk to our business. A decrease in consumer spending or in retailer and consumer confidence and demand for our products could have a significant negative impact on our net sales and profitability, including our operating margins and return on invested capital. These economic conditions could cause some of our retail customers or suppliers to experience cash flow or credit problems and impair their financial condition, which could disrupt our business and adversely affect product orders, payment patterns and default rates and increase our bad debt expense.
The results of the United Kingdom’s referendum on withdrawal from the European Union may have a negative effect on global economic conditions, financial markets and our business.
In June 2016, a majority of voters in the United Kingdom elected to withdraw from the European Union in a national referendum. The referendum was advisory, and the terms of any withdrawal are subject to a negotiation period that could last at least two years after the government of the United Kingdom formally initiates a withdrawal process. Nevertheless, the referendum has created significant uncertainty about the future relationship between the United Kingdom and the European Union, including with respect to the laws and regulations that will apply as the United Kingdom determines which European Union laws to replace or replicate in the event of a withdrawal. The referendum has also given rise to calls for the governments of other European Union member states to consider withdrawal. These developments, or the perception that any of them could occur, have had and may continue to have a material adverse effect on global economic conditions and the stability of global financial markets, and may significantly reduce global market liquidity and restrict the ability of key market participants to operate in certain financial markets. Any of these factors could depress economic activity and restrict our access to capital, which could have a material adverse effect on our business, financial condition and results of operations.
We are subject to international business uncertainties.
We sell our products to customers located outside the United States. In addition, our third-party suppliers and manufacturers are located in China. We intend to continue to sell to customers outside the United States and maintain our relationships in China. Further, we may establish additional relationships in other countries to grow our operations. The substantial up-front investment required, the lack of consumer awareness of our products in jurisdictions outside of the United States, differences in consumer preferences and trends between the United States and other jurisdictions, the risk of inadequate intellectual property protections and differences in packaging, labeling, cosmetics and related laws, rules and regulations are all substantial matters that need to be evaluated prior to doing business in new territories. We cannot be assured that our international efforts will be successful. International sales and increased international operations may be subject to risks such as:
| • | difficulties in staffing and managing foreign operations; |
| • | burdens of complying with a wide variety of laws and regulations, including more stringent regulations relating to data privacy and security, particularly in the European Union; |
| • | adverse tax effects and foreign exchange controls making it difficult to repatriate earnings and cash; |
22
Table of Contents
| • | political and economic instability; |
| • | terrorist activities and natural disasters; |
| • | trade restrictions; |
| • | differing employment practices and laws and labor disruptions; |
| • | the imposition of government controls; |
| • | an inability to use or to obtain adequate intellectual property protection for our key brands and products; |
| • | tariffs and customs duties and the classifications of our goods by applicable governmental bodies; |
| • | a legal system subject to undue influence or corruption; |
| • | a business culture in which illegal sales practices may be prevalent; |
| • | logistics and sourcing; |
| • | military conflicts; and |
| • | acts of terrorism. |
The occurrence of any of these risks could negatively affect our international business and consequently our overall business, financial condition and results of operations.
New laws, regulations, enforcement trends or changes in existing regulations governing the introduction, marketing and sale of our products to consumers could harm our business.
There has been an increase in regulatory activity and activism in the United States and abroad, and the regulatory landscape is becoming more complex with increasingly strict requirements. If this trend continues, we may find it necessary to alter some of the ways we have traditionally manufactured and marketed our products in order to stay in compliance with a changing regulatory landscape, and this could add to the costs of our operations and have an adverse impact on our business. To the extent federal, state, local or foreign regulatory changes regarding consumer protection, or the ingredients, claims or safety of our products occur in the future, they could require us to reformulate or discontinue certain of our products, revise the product packaging or labeling, or adjust operations and systems, any of which could result in, among other things, increased costs, delays in product launches, product returns or recalls and lower net sales, and therefore could have a material adverse effect on our business, financial condition and results of operations. Noncompliance with applicable regulations could result in enforcement action by the FDA or other regulatory authorities within or outside the United States, including but not limited to product seizures, injunctions, product recalls, and criminal or civil monetary penalties, all of which could have a material adverse effect on our business, financial condition and results of operations.
In the United States, the FDA does not currently require pre-market approval for products intended to be sold as cosmetics. However, the FDA may in the future require pre-market approval, clearance or registration/notification of cosmetic products, establishments or manufacturing facilities. Moreover, such products could also be regulated as both drugs and cosmetics simultaneously, as the categories are not mutually exclusive. The statutory and regulatory requirements applicable to drugs are extensive and require significant resources and time to ensure compliance. For example, if any of our products intended to be sold as cosmetics were to be regulated as drugs, we might be required to conduct, among other things, clinical trials to demonstrate the safety and efficacy of these products. We may not have sufficient resources to conduct any required clinical trials or to ensure compliance with the manufacturing requirements applicable to drugs. If the FDA determines that any of our products intended to be sold as cosmetics should be classified and regulated as drug products and we are unable to comply with applicable drug requirements, we may be unable to continue to market those products. Any inquiry into the regulatory status of our cosmetics and any related interruption in the marketing and sale of these products could damage our reputation and image in the marketplace.
23
Table of Contents
In recent years, the FDA has issued warning letters to several cosmetic companies alleging improper claims regarding their cosmetic products. If the FDA determines that we have disseminated inappropriate drug claims for our products intended to be sold as cosmetics, we could receive a warning or untitled letter, be required to modify our product claims or take other actions to satisfy the FDA. In addition, plaintiffs’ lawyers have filed class action lawsuits against cosmetic companies after receipt of these types of FDA warning letters. There can be no assurance that we will not be subject to state and federal government actions or class action lawsuits, which could harm our business, financial condition and results of operations.
Additional state and federal requirements may be imposed on consumer products as well as cosmetics, cosmetic ingredients, or the labeling and packaging of products intended for use as cosmetics. For example, several lawmakers are currently focused on giving the FDA additional authority to regulate cosmetics and their ingredients. This increased authority could require the FDA to impose increased testing and manufacturing requirements on cosmetic manufacturers or cosmetics or their ingredients before they may be marketed. We are unable to ascertain what, if any, impact any increased statutory or regulatory requirements may have on our business.
We sell a number of products as over the counter (“OTC”) drug products, which are subject to the FDA OTC drug regulatory requirements because they are intended to be used as sunscreen or to treat acne. The FDA regulates the formulation, manufacturing, packaging and labeling of OTC drug products. Our sunscreen and acne drug products are regulated pursuant to FDA OTC drug monographs that specify acceptable active drug ingredients and acceptable product claims that are generally recognized as safe and effective for particular uses. If any of these products that are marketed as OTC drugs are not in compliance with the applicable FDA monograph, we may be required to reformulate the product, stop making claims relating to such product or stop selling the product until we are able to obtain costly and time-consuming FDA approvals. We are also required to submit adverse event reports to the FDA for our OTC drug products, and failure to comply with this requirement may subject us to FDA regulatory action.
We also sell a number of consumer products, which are subject to regulation by the CPSC in the United States under the provisions of the Consumer Product Safety Act, as amended by the Consumer Product Safety Improvement Act of 2008. These statutes and the related regulations ban from the market consumer products that fail to comply with applicable product safety laws, regulations, and standards. The CPSC has the authority to require the recall, repair, replacement or refund of any such banned products or products that otherwise create a substantial risk of injury and may seek penalties for regulatory noncompliance under certain circumstances. The CPSC also requires manufacturers of consumer products to report certain types of information to the CPSC regarding products that fail to comply with applicable regulations. Certain state laws also address the safety of consumer products, and mandate reporting requirements, and noncompliance may result in penalties or other regulatory action.
Our products are also subject to state laws and regulations, such as the California Safe Drinking Water and Toxic Enforcement Act, also known as “Prop 65,” and failure to comply with such laws may also result in lawsuits and regulatory enforcement that could have a material adverse effect on our business, financial condition and results of operations.
Our facilities and those of our third-party manufacturers are subject to regulation under the FDCA and FDA implementing regulations.
Our facilities and those of our third-party manufacturers are subject to regulation under the FDCA and FDA implementing regulations. The FDA may inspect all of our facilities and those of our third-party manufacturers periodically to determine if we and our third-party manufacturers are complying with provisions of the FDCA and FDA regulations. In addition, third-party manufacturer’s facilities for manufacturing OTC drug products must comply with the FDA’s current drug good manufacturing practices (“GMP”) requirements that require us and our manufacturers to maintain, among other things, good manufacturing processes, including stringent vendor qualifications, ingredient identification, manufacturing controls and record keeping.
Our operations could be harmed if regulatory authorities make determinations that we, or our vendors, are not in compliance with these regulations. If the FDA finds a violation of GMPs, it may enjoin our manufacturer’s operations, seize product, and impose administrative, civil or criminal penalties. If we or our third-party manufacturers fail to comply with applicable regulatory requirements, we could be required to take costly corrective actions, including suspending manufacturing operations, changing product formulations, suspending sales, or initiating product recalls. In addition, compliance with these regulations has increased and may further increase the cost of manufacturing certain of our products as we work with our vendors to assure they are qualified and in compliance. Any of these outcomes could have a material adverse effect on our business, financial condition and results of operations.
24
Table of Contents
Government regulations and private party actions relating to the marketing and advertising of our products and services may restrict, inhibit or delay our ability to sell our products and harm our business, financial condition and results of operations.
Government authorities regulate advertising and product claims regarding the performance and benefits of our products. These regulatory authorities typically require a reasonable basis to support any marketing claims. What constitutes a reasonable basis for substantiation can vary widely from market to market, and there is no assurance that the efforts that we undertake to support our claims will be deemed adequate for any particular product or claim. The most significant area of risk for such activities relates to improper or unsubstantiated claims about our products and their use or safety. If we are unable to show adequate substantiation for our product claims, or our promotional materials make claims that exceed the scope of allowed claims for the classification of the specific product, whether cosmetics, OTC drug products or other consumer products that we offer, the FDA, the FTC or other regulatory authorities could take enforcement action or impose penalties, such as monetary consumer redress, requiring us to revise our marketing materials, amend our claims or stop selling certain products, all of which could harm our business, financial condition and results of operations. Any regulatory action or penalty could lead to private party actions, which could further harm our business, financial condition and results of operations.
Our business is subject to complex and evolving U.S. and foreign laws and regulations regarding privacy, data protection and other matters. Many of these laws and regulations are subject to change and uncertain interpretation, and could result in claims, changes to our business practices, monetary penalties, increased costs of operations or otherwise harm our business, financial condition and results of operations.
We are subject to a variety of laws and regulations in the United States and abroad that involve matters central to our business, including privacy and data protection, intellectual property, advertising, marketing, distribution, consumer protection and online payment services. The sale of products outside the United States, the introduction of new products or expansion of our activities in certain jurisdictions may subject us to additional laws and regulations. These U.S. federal and state and foreign laws and regulations, which can be enforced by private parties or government entities, are constantly evolving and can be subject to significant change. For example, in 2015, the European Union Court of Justice invalidated the U.S.-EU Safe Harbor Agreement regarding the transfer of personal information between the United States and the European Union. European and U.S. negotiators agreed in February 2016 on a new framework, the Privacy Shield, which replaced the Safe Harbor framework from August 2016 onwards. However, there is currently litigation against this framework and it is uncertain whether the Privacy Shield framework will be similarly invalidated by the EU court. It is not known whether the European Commission will accept the new, stricter requirements as adequate. Although we sell our products on a UK website, we do not have personnel or operations based in the European Union. We have not historically relied on the former Safe Harbor framework to justify the collection, storage and processing of European consumer data on our servers in the United States. If we were to in the future it is already clear that under the new framework, companies which rely on the new Privacy Shield framework will face more stringent obligations and the sanctions for non-compliance with the principles of the framework will be more robust. In addition, the European Union is significantly amending its data protection laws in ways that may limit our ability to collect or use information or increase our potential liability for misuse, loss or a breach of security in data of EU residents. In particular, if our privacy or data security measures fail to comply with applicable future laws and regulations, we may be subject to litigation, regulatory investigations, enforcement notices requiring us to change the way we use personal data or our marketing practices, fines of up to 20,000,000 Euros or up to 4% of the total worldwide annual turnover of the preceding financial year (whichever is higher) or other liabilities, as well as negative publicity and a potential loss of business. The application, interpretation and enforcement of these laws and regulations may be uncertain, and may be interpreted and applied inconsistently from jurisdiction to jurisdiction and inconsistently with our current policies and practices. Moreover, consumer data privacy remains a matter of interest to lawmakers and regulators, and a number of other proposals are pending before federal, state and foreign legislative and regulatory bodies that could significantly affect our business. These existing and proposed laws and regulations can be costly to comply with and can delay or impede our ability to market and sell our products, result in negative publicity, increase our operating costs, require significant management time and attention, and subject us to inquiries or investigations, claims or other remedies, including fines or demands that we modify or cease existing business practices.
Furthermore, foreign data protection, privacy and other laws and regulations are often more restrictive than those in the United States. The European Union, for example, traditionally has imposed stricter obligations under its laws and regulations relating to privacy, data protection and consumer protection than the United States. Under the present regime, individual EU member countries have discretion with respect to their interpretation and implementation of these laws and
25
Table of Contents
the penalties for breach and have their own regulators with differing attitudes towards enforcement, which results in varying privacy standards and enforcement risks from jurisdiction to jurisdiction. Legislation and regulation in the European Union and some EU member states require companies to give specific types of notice and in some cases seek consent from consumers before using their data for certain purposes, including some marketing activities. In the majority of EU member countries, consent must be obtained prior to setting cookies or other tracking technologies. In addition, new rules are expected to come into force which alter rules on third-party cookies, web beacons and similar technology for online behavioral advertising and impose stricter requirements on companies using these tools, which may significantly affect the success of our current marketing strategies, and non-compliance may lead to considerable fines. Outside of the European Union, there are many countries with data protections laws, and new countries are adopting data protection legislation with increasing frequency. Many of these laws also require consent from consumers for the collection and use of data for various purposes, including marketing, which may reduce the ability to market our products. In particular, these laws may have an impact on our ability to conduct business through websites we and our partners may operate outside the United States. There is no harmonized approach to these laws and regulations globally although several frameworks exist. Consequently, the potential risk of non-compliance with applicable foreign data protection laws and regulations will increase as we continue our international expansion. We may need to change and limit the way we use consumer information in operating our business and may have difficulty maintaining a single operating model that is compliant. Compliance with such laws and regulations will result in additional costs and may necessitate changes to our business practices and divergent operating models, which may adversely affect our business, financial condition and results of operations.
We are involved, and may become involved in the future, in disputes and other legal or regulatory proceedings that, if adversely decided or settled, could materially and adversely affect our business, financial condition and results of operations.
We are, and may in the future become, party to litigation, regulatory proceedings or other disputes. In general, claims made by or against us in disputes and other legal or regulatory proceedings can be expensive and time consuming to bring or defend against, requiring us to expend significant resources and divert the efforts and attention of our management and other personnel from our business operations. These potential claims include but are not limited to personal injury and class action lawsuits and regulatory investigations relating to the advertising and promotional claims about our products. Any adverse determination against us in these proceedings, or even the allegations contained in the claims, regardless of whether they are ultimately found to be without merit, may also result in settlements, injunctions or damages that could have a material adverse effect on our business, financial condition and results of operations.
We may be required to recall products and may face product liability claims, either of which could result in unexpected costs and damage our reputation.
We sell products for human use. Our products intended for use as cosmetics are not generally subject to pre-market approval or registration processes, so we cannot rely upon a government safety panel to qualify or approve our products for use. A product may be safe for the general population when used as directed but could cause an adverse reaction for a person who has a health condition or allergies, or who is taking a prescription medication. While we include what we believe are adequate instructions and warnings and we have historically had low numbers of reported adverse reactions, previously unknown adverse reactions could occur. If we discover that any of our products are causing adverse reactions, we could suffer further adverse publicity or regulatory/government sanctions.
Potential product liability risks may arise from the testing, manufacture and sale of our products, including that the products fail to meet quality or manufacturing specifications, contain contaminants, include inadequate instructions as to their proper use, include inadequate warnings concerning side effects and interactions with other substances or for persons with health conditions or allergies, or cause adverse reactions or side effects. Product liability claims could increase our costs, and adversely affect our business, financial condition and results of operations. As we continue to offer an increasing number of new products, our product liability risk may increase. It may be necessary for us to recall products that do not meet approved specifications or because of the side effects resulting from the use of our products, which would result in adverse publicity, potentially significant costs in connection with the recall and could have a material adverse effect on our business, financial condition and results of operations.
In addition, plaintiffs in the past have received substantial damage awards from other cosmetic and drug companies based upon claims for injuries allegedly caused by the use of their products. Although we currently maintain general liability insurance, any claims brought against us may exceed our existing or future insurance policy coverage or limits. Any judgment against us that is in excess of our policy coverage or limits would have to be paid from our cash reserves, which
26
Table of Contents
would reduce our capital resources. In addition, we may be required to pay higher premiums and accept higher deductibles in order to secure adequate insurance coverage in the future. Further, we may not have sufficient capital resources to pay a judgment, in which case our creditors could levy against our assets. Any product liability claim or series of claims brought against us could harm our business significantly, particularly if a claim were to result in adverse publicity or damage awards outside or in excess of our insurance policy limits.
If we are unable to protect our intellectual property the value of our brand and other intangible assets may be diminished, and our business may be adversely affected.
We rely on trademark, copyright, trade secret, patent and other laws protecting proprietary rights, nondisclosure and confidentiality agreements and other practices, to protect our brands and proprietary information, technologies and processes. Our principal intellectual property assets include the registered trademarks “e.l.f.,” “eyes lips face” and “play beautifully.” Our trademarks are valuable assets that support our brand and consumers’ perception of our products. Although we have existing and pending trademark registrations for our brands in the United States and in many of the foreign countries in which we operate, we may not be successful in asserting trademark or trade name protection in all jurisdictions. We also have not applied for trademark protection in all relevant foreign jurisdictions and cannot assure you that our pending trademark applications will be approved. Third parties may also oppose our trademark applications domestically or abroad, or otherwise challenge our use of the trademarks. In the event that our trademarks are successfully challenged, we could be forced to rebrand our products in some parts of the world, which could result in the loss of brand recognition and could require us to devote resources to advertising and marketing new brands.
We have limited patent protection, and currently own a United States design patent and have several United States utility and design patent applications pending. We may in the future pursue other patent protection. Limited patent protection for our products limits our ability to protect our products from competition. We primarily rely on know-how to protect our products. It is possible that others will independently develop the same or similar know-how, which may allow them to sell products similar to ours. If others obtain access to our know-how, our confidentiality agreements may not effectively prevent disclosure of our proprietary information, technologies and processes and may not provide an adequate remedy in the event of unauthorized use of such information, which could harm our competitive position.
The efforts we have taken to protect our proprietary rights may not be sufficient or effective. In addition, effective trademark, copyright, patent and trade secret protection may be unavailable or limited for certain of our intellectual property in some foreign countries. Other parties may infringe our intellectual property rights and may dilute our brands in the marketplace. We may need to engage in litigation or other activities to enforce our intellectual property rights, to protect our trade secrets or to determine the validity and scope of proprietary rights of others. Any such activities could require us to expend significant resources and divert the efforts and attention of our management and other personnel from our business operations. If we fail to protect our intellectual property or other proprietary rights, our business, financial condition and results of operations may be materially and adversely affected.
Our success depends on our ability to operate our business without infringing, misappropriating or otherwise violating the trademarks, patents, copyrights and other proprietary rights of third parties.
Our commercial success depends in part on our ability to operate without infringing, misappropriating or otherwise violating the trademarks, patents, copyrights, trade secrets and other proprietary rights of others. We cannot be certain that the conduct of our business does not and will not infringe, misappropriate or otherwise violate such rights. In addition, third parties may involve us in intellectual property disputes as part of a business model or strategy to gain competitive advantage. While we are not involved in any currently active intellectual property litigation, from time to time we receive allegations of trademark or patent infringement and third parties have filed claims against us with allegations of intellectual property infringement.
To the extent we gain greater visibility and market exposure as a public company or otherwise, we may also face a greater risk of being the subject of such claims and litigation. For these and other reasons, third parties may allege that our products or activities infringe, misappropriate, dilute or otherwise violate their trademark, patent, copyright or other proprietary rights. Defending against allegations and litigation could be expensive, occupy significant amounts of time, divert management’s attention from other business concerns and have an adverse impact on our ability to bring products to market. In addition, if we are found to infringe, misappropriate, dilute or otherwise violate third-party trademark, patent, copyright or other proprietary rights, our ability to use brands to the fullest extent we plan may be limited, we may need to obtain a license, which may not be available on commercially reasonable terms, or at all, or we may need to redesign or
27
Table of Contents
rebrand our marketing strategies or products, which may not be possible. We may also be required to pay substantial damages or be subject to an order prohibiting us and our retail customers from importing or selling certain products or engaging in certain activities. Our inability to operate our business without infringing, misappropriating or otherwise violating the trademarks, patents, copyrights and proprietary rights of others could have a material adverse effect on our business, financial condition and results of operations.
Use of social media may materially and adversely affect our reputation or subject us to fines or other penalties.
We rely to a large extent on our online presence to reach consumers, and we offer consumers the opportunity to rate and comment on our products on our website. Negative commentary regarding us or our products may be posted on our website or social media platforms and may be adverse to our reputation or business. Our target consumers often value readily available information and often act on such information without further investigation and without regard to its accuracy. The harm may be immediate without affording us an opportunity for redress or correction. In addition, we may face claims relating to information that is published or made available through the interactive features of our website. For example, we may receive third-party complaints that the comments or other content posted by users on our platforms infringe third-party intellectual property rights or otherwise infringe the legal rights of others. While the Communications Decency Act (CDA) and Digital Millennium Copyright Act (DMCA) generally protect online service providers from claims of copyright infringement or other legal liability for the self-directed activities of its users, if it were determined that we did not meet the relevant safe harbor requirements under either law, we could be exposed to claims related to advertising practices, defamation, intellectual property rights, rights of publicity and privacy, and personal injury torts. We could incur significant costs investigating and defending such claims and, if we are found liable, significant damages. If any of these events occur, our business, financial condition and results of operations could be materially and adversely affected.
We also use third-party social media platforms as marketing tools. For example, we maintain Snapchat, Facebook, Twitter, Pinterest, Instagram, YouTube and Google+ accounts. As e-commerce and social media platforms continue to rapidly evolve, we must continue to maintain a presence on these platforms and establish presences on new or emerging popular social media platforms. If we are unable to cost-effectively use social media platforms as marketing tools, our ability to acquire new consumers and our financial condition may suffer. Furthermore, as laws and regulations rapidly evolve to govern the use of these platforms and devices, the failure by us, our employees or third parties acting at our direction to abide by applicable laws and regulations in the use of these platforms and devices could subject us to regulatory investigations, class action lawsuits, liability, fines or other penalties and have a material adverse effect on our business, financial condition and result of operations.
In addition, an increase in the use of social media for product promotion and marketing may cause an increase in the burden on us to monitor compliance of such materials, and increase the risk that such materials could contain problematic product or marketing claims in violation of applicable regulations.
Volatility in the financial markets could have a material adverse effect on our business.
While we currently generate significant cash flows from our ongoing operations and have had access to credit markets through our various financing activities, credit markets may experience significant disruptions. Deterioration in global financial markets could make future financing difficult or more expensive. If any financial institution party to our credit facilities or other financing arrangements were to declare bankruptcy or become insolvent, they may be unable to perform under their agreements with us. This could leave us with reduced borrowing capacity, which could have a material adverse effect on our business, financial condition and results of operations.
Fluctuations in currency exchange rates may negatively affect our financial condition and results of operations.
Exchange rate fluctuations may affect the costs that we incur in our operations. The main currencies to which we are exposed are the Chinese renminbi, the British pound and the Canadian dollar. The exchange rates between these currencies and the U.S. dollar in recent years have fluctuated significantly and may continue to do so in the future. A depreciation of these currencies against the U.S. dollar will decrease the U.S. dollar equivalent of the amounts derived from foreign operations reported in our consolidated financial statements, and an appreciation of these currencies will result in a corresponding increase in such amounts. The cost of certain items, such as raw materials, manufacturing, employee salaries and transportation and freight, required by our operations may be affected by changes in the value of the relevant currencies. To the extent that we are required to pay for goods or services in foreign currencies, the appreciation of such currencies against the U.S. dollar will tend to negatively affect our business. There can be no assurance that foreign currency fluctuations will not have a material adverse effect on our business, financial condition and results of operations.
28
Table of Contents
Future acquisitions or investments could disrupt our business and harm our financial condition.
In the future we may pursue acquisitions or investments that we believe will help us achieve our strategic objectives. The process of integrating an acquired business, product or technology can create unforeseen operating difficulties, expenditures and other challenges such as:
| • | potentially increased regulatory and compliance requirements; |
| • | implementation or remediation of controls, procedures and policies at the acquired company; |
| • | diversion of management time and focus from operation of our then-existing business to acquisition integration challenges; |
| • | coordination of product, sales, marketing and program and systems management functions; |
| • | transition of the acquired company’s users and customers onto our systems; |
| • | retention of employees from the acquired company; |
| • | integration of employees from the acquired company into our organization; |
| • | integration of the acquired company’s accounting, information management, human resources and other administrative systems and operations into our systems and operations; |
| • | liability for activities of the acquired company prior to the acquisition, including violations of law, commercial disputes and tax and other known and unknown liabilities; and |
| • | litigation or other claims in connection with the acquired company, including claims brought by terminated employees, customers, former stockholders or other third parties. |
If we are unable to address these difficulties and challenges or other problems encountered in connection with any future acquisition or investment, we might not realize the anticipated benefits of that acquisition or investment and we might incur unanticipated liabilities or otherwise suffer harm to our business generally.
To the extent that we pay the consideration for any future acquisitions or investments in cash, it would reduce the amount of cash available to us for other purposes. Future acquisitions or investments could also result in dilutive issuances of our equity securities or the incurrence of debt, contingent liabilities, amortization expenses, increased interest expenses or impairment charges against goodwill on our consolidated balance sheet, any of which could have a material adverse effect on our business, results of operations and financial condition.
If we are unable to maintain effective internal controls, we may not be able to produce timely and accurate financial statements, and we or our independent registered public accounting firm may conclude that our internal control over financial reporting is not effective, which could adversely impact our investors’ confidence and our stock price.
Prior to our initial public offering, we were a private company and were not required to test our internal controls on a systematic basis. As an “emerging growth company” under the JOBS Act, our management will be required to report upon the effectiveness of our internal control over financial reporting under Section 404 of the Sarbanes-Oxley Act of 2002 (the “Sarbanes-Oxley Act”) beginning with the annual report for our fiscal year ending December 31, 2017. Our independent registered public accounting firm is not required to formally attest to the effectiveness of our internal control over financial reporting until the date we are no longer an “emerging growth company” and reach accelerated filer status.
We are in the process of designing and implementing the system of internal control over financial reporting required to comply with our future obligations and to strengthen our overall control environment. This initiative is time consuming, costly, and might place significant demands on our financial and operational resources, as well as our information technology systems.
29
Table of Contents
Our current efforts to design and implement an effective control environment may not be sufficient to remediate or prevent material weaknesses or significant deficiencies from occurring in the future. A control system, no matter how well designed and operated, can provide only reasonable assurance that the control system’s objectives will be met. Moreover, any such changes do not guarantee that we will be effective in maintaining the adequacy of our internal controls, and any failure to maintain that adequacy, or consequent inability to produce accurate financial statements on a timely basis, could increase our operating costs and harm our business. Furthermore, investors’ perceptions that our internal controls are inadequate or that we are unable to produce accurate financial statements on a timely basis may harm our stock price.
Failure to comply with the U.S. Foreign Corrupt Practices Act, other applicable anti-corruption and anti-bribery laws, and applicable trade control laws could subject us to penalties and other adverse consequences.
We currently manufacture our products in China and sell our products in several countries outside of the United States. Our operations are subject to the U.S. Foreign Corrupt Practices Act (the “FCPA”), as well as the anti-corruption and anti-bribery laws in the countries where we do business. The FCPA prohibits covered parties from offering, promising, authorizing or giving anything of value, directly or indirectly, to a “foreign government official” with the intent of improperly influencing the official’s act or decision, inducing the official to act or refrain from acting in violation of lawful duty, or obtaining or retaining an improper business advantage. The FCPA also requires publicly traded companies to maintain records that accurately and fairly represent their transactions, and to have an adequate system of internal accounting controls. In addition, other applicable anti-corruption laws prohibit bribery of domestic government officials, and some laws that may apply to our operations prohibit commercial bribery, including giving or receiving improper payments to or from non-government parties, as well as so-called “facilitation” payments. In addition, we are subject to U.S. and other applicable trade control regulations that restrict with whom we may transact business, including the trade sanctions enforced by the U.S. Treasury, Office of Foreign Assets Control (OFAC).
While we have implemented policies, internal controls and other measures reasonably designed to promote compliance with applicable anti-corruption and anti-bribery laws and regulations, and certain safeguards designed to ensure compliance with U.S. trade control laws, our employees or agents may engage in improper conduct for which we might be held responsible. Any violations of these anti-corruption or trade controls laws, or even allegations of such violations, can lead to an investigation and/or enforcement action, which could disrupt our operations, involve significant management distraction, and lead to significant costs and expenses, including legal fees. If we, or our employees or agents acting on our behalf, are found to have engaged in practices that violate these laws and regulations, we could suffer severe fines and penalties, profit disgorgement, injunctions on future conduct, securities litigation, bans on transacting government business, delisting from securities exchanges and other consequences that may have a material adverse effect on our business, financial condition and results of operations. In addition, our brand and reputation, our sales activities or our stock price could be adversely affected if we become the subject of any negative publicity related to actual or potential violations of anti-corruption, anti-bribery or trade control laws and regulations.
Government regulation of the Internet and e-commerce is evolving, and unfavorable changes or failure by us to comply with these regulations could substantially harm our business, financial condition and results of operations.
We are subject to general business regulations and laws as well as regulations and laws specifically governing the Internet and e-commerce. Existing and future regulations and laws could impede the growth of the Internet, e-commerce or mobile commerce. These regulations and laws may involve taxes, tariffs, privacy and data security, anti-spam, content protection, electronic contracts and communications, consumer protection, social media marketing, third-party cookies, web beacons and similar technology for online behavioral advertising and gift cards. It is not clear how existing laws governing issues such as property ownership, sales and other taxes and consumer privacy apply to the Internet as the vast majority of these laws were adopted prior to the advent of the Internet and do not contemplate or address the unique issues raised by the Internet or e-commerce. It is possible that general business regulations and laws, or those specifically governing the Internet or e-commerce, may be interpreted and applied in a manner that is inconsistent from one jurisdiction to another and may conflict with other rules or our practices. We cannot be sure that our practices have complied, comply or will comply fully with all such laws and regulations. Any failure, or perceived failure, by us to comply with any of these laws or regulations could result in damage to our reputation, a loss in business and proceedings or actions against us by governmental entities or others. Any such proceeding or action could hurt our reputation, force us to spend significant amounts in defense of these proceedings, distract our management, increase our costs of doing business and decrease the
30
Table of Contents
use of our sites by consumers and suppliers and may result in the imposition of monetary liability. We may also be contractually liable to indemnify and hold harmless third parties from the costs or consequences of non-compliance with any such laws or regulations. In addition, it is possible that governments of one or more countries may seek to censor content available on our sites or may even attempt to completely block access to our sites. Adverse legal or regulatory developments could substantially harm our business. In particular, in the event that we are restricted, in whole or in part, from operating in one or more countries, our ability to retain or increase our consumer base may be adversely affected, and we may not be able to maintain or grow our net sales and expand our business as anticipated.
Our business relies heavily on email and other messaging services, and any restrictions on the sending of emails or messages or an inability to timely deliver such communications could materially adversely affect our net revenue and business.
Our business is highly dependent upon email and other messaging services for promoting our brand, products and e-commerce platforms. We provide emails and “push” communications to inform consumers of new products, shipping specials and other promotions. We believe these messages are an important part of our consumer experience. If we are unable to successfully deliver emails or other messages to our subscribers, or if subscribers decline to open or read our messages, our net revenue and profitability would be materially adversely affected. Changes in how web and mail services block, organize and prioritize email may reduce the number of subscribers who receive or open our emails. For example, Google’s Gmail service has a feature that organizes incoming emails into categories (for example, primary, social and promotions). Such categorization or similar inbox organizational features may result in our emails being delivered in a less prominent location in a subscriber’s inbox or viewed as “spam” by our subscribers and may reduce the likelihood of that subscriber reading our emails. Actions by third parties to block, impose restrictions on or charge for the delivery of emails or other messages could also adversely impact our business. From time to time, Internet service providers or other third parties may block bulk email transmissions or otherwise experience technical difficulties that result in our inability to successfully deliver emails or other messages to consumers. Changes in the laws or regulations that limit our ability to send such communications or impose additional requirements upon us in connection with sending such communications would also materially adversely impact our business. Our use of email and other messaging services to send communications to consumers may also result in legal claims against us, which may cause us increased expenses, and if successful might result in fines and orders with costly reporting and compliance obligations or might limit or prohibit our ability to send emails or other messages. We also rely on social networking messaging services to send communications and to encourage consumers to send communications. Changes to the terms of these social networking services to limit promotional communications, any restrictions that would limit our ability or our consumers’ ability to send communications through their services, disruptions or downtime experienced by these social networking services or decline in the use of or engagement with social networking services by consumers could materially adversely affect our business, financial condition and operating results.
Risks related to this offering and ownership of our common stock
Our Sponsor and J.A. Cosmetics Corp. will continue to have significant influence over us after this offering, including control over decisions that require the approval of stockholders, which could limit the ability of our other stockholders to influence matters requiring stockholder approval and could adversely affect our other stockholders.
Under our Stockholders Agreement (as defined in “Certain relationships and related party transactions—Stockholders Agreement”), our Sponsor has the right to designate up to three members of our board of directors so long as it holds at least 30% of our outstanding common stock, two members of our board of directors so long as it holds less than 30% but greater than or equal to 20% of our outstanding common stock, and one member of our board of directors so long as it holds less than 20% but greater than or equal to 5% of our outstanding common stock. Our Sponsor’s designees currently comprise three of the seven members of our board of directors. In addition, our Sponsor will hold approximately 33% of our common stock and may be deemed to beneficially own approximately 60% of our common stock and J.A. Cosmetics Corp. will hold approximately 11% of our common stock after the completion of this offering (assuming no exercise of the underwriters’ option to purchase additional shares). Accordingly, our Sponsor and J.A. Cosmetics Corp. will continue to exert a significant degree of influence or actual control over our management, business policies and affairs and over matters requiring stockholder approval.
31
Table of Contents
In addition, the Stockholders Agreement provides that for as long as our Sponsor owns or holds, directly or indirectly, at least 30% of the shares of our outstanding common stock, we must obtain the consent of our Sponsor before we or our subsidiaries are permitted to take any of the following actions:
| • | authorize, issue or enter into any agreement providing for the issuance (contingent or otherwise) of (x) any notes or debt securities with options, warrants or other rights to acquire equity securities or otherwise containing profit participation features or (y) any equity securities other than equity securities issued to employees, directors, consultants or advisors pursuant to a plan, agreement or arrangement approved by our board of directors; |
| • | liquidate, dissolve or effect a recapitalization or reorganization in any form of transaction or series of transactions; |
| • | incur any indebtedness in an aggregate amount in excess of $50.0 million (other than indebtedness under the terms and provisions of the Senior Secured Credit Facility, as defined in “Description of certain indebtedness—Senior Secured Credit Facility”); and |
| • | increase or decrease the size of our board of directors. |
Until such time as our Sponsor and J.A. Cosmetics Corp. cease collectively to beneficially own more than 50% of the outstanding shares of common stock, our Sponsor will have the ability to call a special stockholder meeting, and our Sponsor and J.A. Cosmetics Corp. will have the ability to take stockholder action by written consent without calling a stockholder meeting.
Furthermore, for so long as they continue to collectively hold a majority of the outstanding voting power, our Sponsor and J.A. Cosmetics Corp. will have the ability to approve amendments to our amended and restated certificate of incorporation and bylaws and to take other actions without the vote of any other stockholder. Investors in this offering will not be able to affect the outcome of any stockholder vote during such time. As a result, our Sponsor and J.A. Cosmetics Corp. will have the ability to control all such matters affecting us, including:
| • | the composition of our board of directors and, through our board of directors, any determination with respect to our business plans and policies; |
| • | any determinations with respect to mergers, acquisitions and other business combinations; |
| • | our acquisition or disposition of assets; |
| • | our financing activities, including the issuance of additional equity securities; |
| • | determinations with respect to the enforcement of rights we may have against third parties; |
| • | the payment of dividends on our common stock; and |
| • | the number of shares available for issuance under our stock plans for our existing and prospective employees. |
This concentrated control limits the ability of other stockholders to influence corporate matters and, as a result, we may take actions that our other stockholders do not view as beneficial. Our Sponsor and J.A. Cosmetics Corp.’s combined voting control may also discourage or block transactions involving a change of control of our company, including transactions in which you as a holder of our common stock might otherwise receive a premium for your shares over the then-current market price. For example, this concentration of ownership could have the effect of delaying or preventing a change in control or otherwise discouraging a potential acquirer from attempting to obtain control of us, which in turn could cause the market price of our common stock to decline or prevent our stockholders from realizing a premium over the market price for their common stock.
In addition, our amended and restated certificate of incorporation provides that, until such time as our Sponsor and J.A. Cosmetics Corp. cease collectively to beneficially own more than 50% of the outstanding shares of common stock, we will not be subject to Section 203 of the Delaware General Corporation Law (the “DGCL”), which prohibits persons deemed to be interested stockholders from engaging in a business combination with a publicly-held Delaware corporation for three years following the date these persons become interested stockholders unless the business combination is, or the transaction in which the person became an interested stockholder was, approved in a prescribed manner or another prescribed exception applies. Generally, an interested stockholder is a person who, together with affiliates and associates, owns, or within three years prior to the determination of interested stockholder status did own, 15% or more of a corporation’s voting stock. Because we have elected to opt out of Section 203 of the DGCL until such time as our Sponsor and J.A. Cosmetics Corp. cease
32
Table of Contents
collectively to beneficially own more than 50% of the outstanding shares of common stock, generally any business combination transaction between our company and either our Sponsor or J.A. Cosmetics Corp. will not be subject to the statutory protection otherwise afforded under Section 203 of the DGCL subject to prescribed exceptions.
Moreover, our Sponsor and J.A. Cosmetics Corp. are not prohibited from selling a controlling interest in us to a third party and may do so without your approval and without providing for a purchase of your shares of common stock. Accordingly, your shares of common stock may be worth less than they would be if our Sponsor and J.A. Cosmetics Corp. did not maintain voting control over us.
For additional information about our relationships with our Sponsor and J.A. Cosmetics Corp., please see “Certain relationships and related party transactions” elsewhere in this prospectus.
Our amended and restated certificate of incorporation contains provisions renouncing our interest and expectation to participate in certain corporate opportunities identified by, or presented to, our Sponsor.
Our Sponsor and its affiliates may engage in activities similar to our lines of business or have an interest in the same areas of corporate opportunities as we do. Our amended and restated certificate of incorporation provides that our Sponsor and its affiliates will not have any duty to refrain from (i) engaging, directly or indirectly, in the same or similar business activities or lines of business as us, including those business activities or lines of business deemed to be competing with us or (ii) doing business with any of our clients, customers or vendors. In the event that our Sponsor or any of its affiliates acquires knowledge of a potential business opportunity which may be a corporate opportunity for us, they will have no duty to communicate or offer such corporate opportunity to us. Our amended and restated certificate of incorporation also provides that, to the fullest extent permitted by law, neither our Sponsor nor any of its affiliates will be liable to us, for breach of any fiduciary duty or otherwise, by reason of the fact that our Sponsor or any of its affiliates direct such corporate opportunity to another person, or otherwise does not communicate information regarding such corporate opportunity to us, and we have waived and renounced any claim that such business opportunity constituted a corporate opportunity that should have been presented to us. In addition, any member of our board of directors designated by our Sponsor pursuant to the Stockholders Agreement may consider both the interests of our Sponsor and our Sponsor’s obligations under the Stockholders Agreement in exercising such board member’s powers, rights and duties as a director of our company. The Stockholders Agreement contains similar provisions with respect to corporate opportunities as the provisions in our amended and restated certificate of incorporation described above. These potential conflicts of interest could have a material adverse effect on our business, results of operations, financial condition and prospects if attractive business opportunities are allocated by our Sponsor to itself, its affiliates or third parties instead of to us. See “Description of capital stock—Corporate opportunities.”
We have incurred and will continue to incur increased costs and are subject to additional regulations and requirements as a result of becoming a newly public company, and our management is required to devote substantial time to new compliance matters.
As a newly public company, we have incurred and will continue to incur significant legal, accounting and other expenses that we did not incur as a private company. We are now subject to the reporting requirements of the Securities Exchange Act of 1934, as amended (the “Exchange Act”), which require, among other things, that we file with the SEC annual, quarterly and current reports with respect to our business and financial condition. In addition, the Sarbanes-Oxley Act, as well as rules subsequently adopted by the SEC and the New York Stock Exchange (“NYSE”) to implement provisions of the Sarbanes-Oxley Act, impose significant requirements on public companies, including requiring establishment and maintenance of effective disclosure and financial controls and changes in corporate governance practices. Further, pursuant to the Dodd-Frank Wall Street Reform and Consumer Protection Act of 2010, the SEC has adopted additional rules and regulations in these areas, such as mandatory “say-on-pay” voting requirements that will apply to us when we cease to be an emerging growth company. Stockholder activism, the current political environment and the current high level of government intervention and regulatory reform may lead to substantial new regulations and disclosure obligations, which may lead to additional compliance costs and impact the manner in which we operate our business in ways we cannot currently anticipate.
The rules and regulations applicable to public companies will continue to substantially increase our legal and financial compliance costs and to make some activities more time-consuming and costly. If these requirements divert the attention of our management and personnel from other business concerns, they could have a material adverse effect on our business, financial condition and results of operations. The increased costs will decrease our net income or increase our net loss, and may require us to reduce costs in other areas of our business or increase the prices of our products or services. We cannot
33
Table of Contents
predict or estimate the amount or timing of additional costs we may incur to respond to these requirements. The impact of these requirements could also make it more difficult for us to attract and retain qualified persons to serve on our board of directors, our board committees or as executive officers. Furthermore, if we are unable to satisfy our obligations as a public company, we could be subject to delisting of our common stock, fines, sanctions and other regulatory action and potentially civil litigation.
An active trading market for our common stock may not develop or be sustained, and the market price of shares of our common stock may be volatile, which could cause the value of your investment to decline.
Prior to our initial public offering in September 2016, there was no public trading market for shares of our common stock. Although our common stock is now listed on the NYSE, the trading volume of our common stock has been limited, and there can be no assurances that an active trading market for our common stock will develop or be sustained. In addition, we cannot provide any guarantee as to the liquidity of any such market that may develop. In the absence of an active trading market for our common stock, stockholders may not be able to sell their common stock at the time or price they would like to sell.
Even if an active trading market develops and is sustained, the market price of our common stock may be highly volatile and could be subject to wide fluctuations. Securities markets often experience significant price and volume fluctuations. This market volatility, as well as general economic, market or political conditions, could reduce the market price of shares of our common stock in spite of our operating performance. In addition, our results of operations could be below the expectations of public market analysts and investors due to a number of potential factors, including variations in our quarterly results of operations, additions or departures of key management personnel, changes in consumer preferences or cosmetic trends, announcements of new products or significant price reductions by our competitors, failure to meet analysts’ earnings estimates, publication of research reports about our industry, litigation and government investigations, changes or proposed changes in laws or regulations or differing interpretations or enforcement thereof affecting our business, adverse market reaction to any indebtedness we may incur or securities we may issue in the future, changes in market valuations of similar companies or speculation in the press or investment community, announcements by our competitors of significant contracts, acquisitions, dispositions, strategic partnerships, joint ventures or capital commitments, adverse publicity about our industry, the level of success of releases of new products and the number of stores we open, close or convert in any period, and in response the market price of shares of our common stock could decrease significantly.
In the past, following periods of volatility in the overall market and the market price of a company’s securities, securities class action litigation has often been instituted against these companies. This litigation, if instituted against us, could result in substantial costs and a diversion of our management’s attention and resources. You may therefore be unable to resell your shares of common stock at or above the public offering price in this offering.
Because we have no current plans to pay cash dividends on our common stock, you may not receive any return on investment unless you sell your common stock for a price greater than that which you paid for it.
We have no current plans to pay cash dividends on our common stock. The declaration, amount and payment of any future dividends will be at the sole discretion of our board of directors. Our board of directors may take into account general and economic conditions, our financial condition and results of operations, our available cash and current and anticipated cash needs, capital requirements, contractual, legal, tax and regulatory restrictions and implications on the payment of dividends by us to our stockholders or by our subsidiaries to us, including restrictions under the Senior Secured Credit Facility and other indebtedness we may incur, and such other factors as our board of directors may deem relevant.
Stockholders may be diluted by the future issuance of additional common stock in connection with our incentive plans, acquisitions or otherwise.
We had approximately 204.3 million shares of common stock authorized but unissued as of March 1, 2017. Our amended and restated certificate of incorporation authorizes us to issue these shares of common stock and stock options exercisable for common stock (and other equity awards) for the consideration and on the terms and conditions established by our board of directors in its sole discretion, whether in connection with acquisitions or otherwise. Any common stock that we issue, including under our existing equity incentive plans or any additional equity incentive plans that we may adopt in the future, would dilute the percentage ownership held by existing investors.
34
Table of Contents
Future sales, or the perception of future sales, by us or our stockholders in the public market could cause the market price for our common stock to decline.
The sale of substantial amounts of shares of our common stock in the public market, or the perception that such sales could occur, including sales by our Sponsor, could harm the prevailing market price of shares of our common stock. These sales, or the possibility that these sales may occur, also might make it more difficult for us to sell equity securities in the future at a time and at a price that we deem appropriate. As of March 1, 2017, we had a total of 45,655,937 shares of common stock outstanding.
After giving effect to this offering, the holders of 28,283,924 shares of our common stock, or approximately 62% of our outstanding common stock based on shares outstanding as of March 1, 2017, are entitled to rights with respect to registration of such shares under the Securities Act of 1933, as amended (the “Securities Act”), pursuant to a registration rights agreement (assuming no exercise of the underwriters’ option to purchase additional shares). In addition, each of our Sponsor, J.A. Cosmetics Corp. and certain family trusts of our Chief Executive Officer, Tarang Amin, have the right, subject to certain conditions, to require us to file registration statements covering its or their shares or to include its or their shares in registration statements that we may file. Please see “Certain relationships and related party transactions—Registration rights.”
In addition, we have filed registration statements on Form S-8 under the Securities Act covering an aggregate of 12,940,811 shares of our common stock or securities convertible into or exchangeable for shares of our common stock issued pursuant to our equity incentive plans. We intend to file one or more registration statements on Form S-8 to cover additional shares of our common stock or securities convertible into or exchangeable for shares of our common stock pursuant to automatic increases in the number of shares reserved under our 2016 Equity Incentive Award Plan and our 2016 Employee Stock Purchase Plan. Accordingly, shares registered under these registration statements on Form S-8 will be available for sale in the open market.
As restrictions on resale end, the market price of shares of our common stock could drop significantly if the holders of these restricted shares sell them or are perceived by the market as intending to sell them. These factors could also make it more difficult for us to raise additional funds through future offerings of shares of our common stock or other securities.
Anti-takeover provisions in our organizational documents and Delaware law might discourage or delay acquisition attempts for us that you might consider favorable.
Our amended and restated certificate of incorporation and amended and restated bylaws contain provisions that may make the acquisition of our company more difficult without the approval of our board of directors. Among other things:
| • | although we do not have a stockholder rights plan, these provisions allow us to authorize the issuance of undesignated preferred stock in connection with a stockholder rights plan or otherwise, the terms of which may be established and the shares of which may be issued without stockholder approval, and which may include super voting, special approval, dividend or other rights or preferences superior to the rights of the holders of common stock; |
| • | these provisions provide for a classified board of directors with staggered three-year terms; |
| • | these provisions require advance notice for nominations of directors by stockholders, subject to the Stockholders Agreement, and for stockholders to include matters to be considered at our annual meetings; |
| • | these provisions prohibit stockholder action by written consent after such time as our Sponsor and J.A. Cosmetics Corp. cease collectively to beneficially own (directly or indirectly) more than 50% of the voting power of the outstanding shares of our common stock (the “Trigger Event”); |
| • | these provisions provide for the removal of directors only for cause and only upon affirmative vote of holders of at least 75% of the shares of common stock entitled to vote generally in the election of directors from and after the Trigger Event; and |
| • | these provisions require the amendment of certain provisions only by the affirmative vote of at least 75% of the shares of common stock entitled to vote generally in the election of directors from and after the Trigger Event. |
35
Table of Contents
Further, as a Delaware corporation, we are also subject to provisions of Delaware law, which may impair a takeover attempt that our stockholders may find beneficial, provided that we will not be subject to Section 203 of the DGCL until after such time as the Trigger Event occurs. See “Description of capital stock—Delaware antitakeover statute.” These anti-takeover provisions and other provisions under Delaware law could discourage, delay or prevent a transaction involving a change in control of our company, including actions that our stockholders may deem advantageous, or negatively affect the trading price of our common stock. These provisions could also discourage proxy contests and make it more difficult for you and other stockholders to elect directors of your choosing and to cause us to take other corporate actions you desire.
We are an emerging growth company, and we cannot be certain if the reduced disclosure requirements applicable to emerging growth companies will make our common stock less attractive to investors.
We qualify as an emerging growth company as defined in the JOBS Act. As a result, we are permitted to, and do, rely on exemptions from certain disclosure requirements that are applicable to other companies that are not emerging growth companies. Accordingly, for so long as we are an emerging growth company, we will not be required to:
| • | engage an independent registered public accounting firm to report on our internal controls over financial reporting pursuant to Section 404(b) of the Sarbanes-Oxley Act; |
| • | comply with any requirement that may be adopted by the PCAOB, regarding mandatory audit firm rotation or a supplement to the independent registered public accounting firm’s report providing additional information about the audit and the financial statements (i.e., an auditor discussion and analysis); |
| • | submit certain executive compensation matters to stockholder advisory votes, such as “say-on-pay,” “say-on-frequency” and “say-on-golden parachutes;” or |
| • | disclose certain executive compensation related items such as the correlation between executive compensation and performance and comparisons of the chief executive officer’s compensation to median employee compensation. |
We may remain an emerging growth company until the fiscal year-end following the fifth anniversary of the completion of our initial public offering, though we may cease to be an emerging growth company earlier under certain circumstances, including (i) if we become a large accelerated filer, (ii) if our gross revenue exceeds $1.0 billion in any fiscal year or (iii) if we issue more than $1.0 billion in non-convertible notes in any three-year period.
The exact implications of the JOBS Act are still subject to interpretations and guidance by the SEC and other regulatory agencies, and we cannot provide any assurances that we will be able to take advantage of all of the benefits of the JOBS Act. In addition, investors may find our common stock less attractive if we rely on the exemptions and relief granted by the JOBS Act. If some investors find our common stock less attractive as a result, there may be a less active trading market for our common stock and our stock price may decline and/or become more volatile.
Our board of directors is authorized to issue and designate shares of our preferred stock in additional series without stockholder approval.
Our amended and restated certificate of incorporation authorizes our board of directors, without the approval of our stockholders, to issue 30 million shares of our preferred stock, subject to limitations prescribed by applicable law, rules and regulations and the provisions of our amended and restated certificate of incorporation, as shares of preferred stock in series, to establish from time to time the number of shares to be included in each such series and to fix the designation, powers, preferences and rights of the shares of each such series and the qualifications, limitations or restrictions thereof. The powers, preferences and rights of these additional series of preferred stock may be senior to or on parity with our common stock, which may reduce its value.
If securities analysts do not publish research or publish inaccurate or unfavorable research about our business, our stock price and trading volume could decline.
The trading market for our common stock depends in part on the research and reports that securities or industry analysts publish about us or our business. If one or more of the analysts who cover us downgrade our stock or publish inaccurate or unfavorable research about our business, our stock price would likely decline. If one or more of these analysts cease coverage of our company or fail to publish reports on us regularly, demand for our stock could decrease, which might cause our stock price and trading volume to decline.
36
Table of Contents
Our amended and restated certificate of incorporation and amended and restated bylaws provide that the Court of Chancery of the State of Delaware will be the exclusive forum for substantially all disputes between us and our stockholders, which could limit our stockholders’ ability to obtain a favorable judicial forum for disputes with us or our directors, officers or employees.
Our amended and restated certificate of incorporation and amended and restated bylaws provide that the Court of Chancery of the State of Delaware is the exclusive forum for any derivative action or proceeding brought on our behalf, any action asserting a breach of fiduciary duty, any action asserting a claim against us arising pursuant to the Delaware General Corporation Law, our amended and restated certificate of incorporation or our amended and restated bylaws, or any action asserting a claim against us that is governed by the internal affairs doctrine. This provision may limit a stockholder’s ability to bring a claim in a judicial forum that it finds favorable for disputes with us or our directors, officers or other employees, which may discourage such lawsuits against us and our directors, officers and other employees. Alternatively, if a court were to find this provision in our amended and restated certificate of incorporation and amended and restated bylaws to be inapplicable or unenforceable in an action, we may incur additional costs associated with resolving such action in other jurisdictions, which could adversely affect our business, financial condition and results of operations.
37
Table of Contents
Special note regarding forward-looking statements
This prospectus includes forward-looking statements that reflect our current views with respect to, among other things, our operations and financial performance. These forward-looking statements are included throughout this prospectus, including in the sections entitled “Prospectus summary,” “Risk factors,” “Management’s discussion and analysis of financial condition and results of operations” and “Business” and relate to matters such as our industry, business strategy, goals and expectations concerning our market position, future operations, margins, profitability, capital expenditures, liquidity and capital resources and other financial and operating information. We have used the words “anticipate,” “assume,” “believe,” “continue,” “could,” “estimate,” “expect,” “foreseeable,” “future,” “intend,” “may,” “plan,” “potential,” “predict,” “project,” “seek,” “will” and similar terms and phrases to identify forward-looking statements in this prospectus.
The forward-looking statements contained in this prospectus are based on management’s current expectations and are subject to uncertainty and changes in circumstances. We cannot assure you that future developments affecting us will be those that we have anticipated. Actual results may differ materially from these expectations due to changes in global, regional or local economic, business, competitive, market, regulatory and other factors, many of which are beyond our control. We believe that these factors include but are not limited to those described under “Risk factors.” These factors should not be construed as exhaustive and should be read in conjunction with the other cautionary statements that are included in this prospectus. Should one or more of these risks or uncertainties materialize, or should any of our assumptions prove incorrect, our actual results may vary in material respects from those projected in these forward-looking statements.
Any forward-looking statement made by us in this prospectus speaks only as of the date of this prospectus. Factors or events that could cause our actual results to differ may emerge from time to time, and it is not possible for us to predict all of them. We may not actually achieve the plans, intentions or expectations disclosed in our forward-looking statements, and you should not place undue reliance on our forward-looking statements. Our forward-looking statements do not reflect the potential impact of any future acquisitions, mergers, dispositions, joint ventures, investments or other strategic transactions we may make. We undertake no obligation to publicly update or review any forward-looking statement, whether as a result of new information, future developments or otherwise, except as may be required by any applicable securities laws.
38
Table of Contents
Trademarks, trade names and service marks
This prospectus includes our trademarks, trade names and service marks, such as “e.l.f.,” “eyes lips face” and “play beautifully,” as well as the e.l.f. logo, which are protected under applicable intellectual property laws and are our property. This prospectus also contains trademarks, trade names and service marks of other companies, which are the property of their respective owners. Solely for convenience, trademarks, trade names and service marks referred to in this prospectus may appear without the ®, TM or SM symbols, but such references are not intended to indicate, in any way, that we will not assert, to the fullest extent under applicable law, our rights or the right of the applicable licensor to these trademarks, trade names and service marks. We do not intend our use or display of other parties’ trademarks, trade names or service marks to imply, and such use or display should not be construed to imply, a relationship with, or endorsement or sponsorship of us by, these other parties.
39
Table of Contents
The selling stockholders, including certain members of our board of directors and management, will receive all of the proceeds from this offering, and we will not receive any proceeds from the sale of shares in this offering. See “Principal and selling stockholders.” Any proceeds received by us in connection with the exercise of options to purchase shares of our common stock by the selling stockholders in connection with this offering will be used for working capital and general corporate purposes.
Our common stock has been publicly traded on the NYSE under the symbol “ELF” since our initial public offering in September 2016, which was completed at a price to the public of $17.00 per share. Prior to that time, there was no public market for our common stock. The following table sets forth the high and low sale prices per share for our common stock on the NYSE for the periods indicated:
| Market Price | ||||||||
| Year ended December 31, 2016 | High | Low | ||||||
| Third quarter (beginning September 22, 2016) |
$ | 28.92 | $ | 23.73 | ||||
| Fourth quarter |
$ | 32.54 | $ | 25.00 | ||||
| Year ending December 31, 2017 |
||||||||
| First quarter (through March 23, 2017) |
$ | 31.10 | $ | 24.03 | ||||
|
|
||||||||
On March 23, 2017, the last reported sale price of our common stock on the NYSE was $26.16 per share. As of March 1, 2017, the approximate number of common stockholders of record was 35. This number does not include beneficial owners whose shares are held by nominees in street name.
40
Table of Contents
On June 7, 2016, our board of directors declared a special dividend to our preferred stockholders participating on an as-converted basis and our common stockholders in an amount equal to $1.79 per share of common stock (approximately $72.0 million in the aggregate). Holders of restricted common stock received a dividend of $4.1 million, which offset outstanding employee notes receivable. Prior to this dividend, we had never declared or paid cash dividends on our capital stock.
We intend to retain all available funds and any future earnings, if any, to fund the development and expansion of our business and we do not anticipate paying any additional cash dividends in the foreseeable future. In addition, our Senior Secured Credit Facility limits our ability to pay dividends to our stockholders.
Any future determination related to dividend policy will be made at the discretion of our board of directors and will depend on a number of factors, including future earnings, capital requirements, financial conditions, future prospects, contractual restrictions and covenants and other factors that our board of directors may deem relevant.
41
Table of Contents
The following table sets forth our cash and cash equivalents and capitalization as of December 31, 2016.
You should read this table together with “Prospectus summary—Summary consolidated financial data,” “Selected consolidated financial data,” “Management’s discussion and analysis of financial condition and results of operations,” “Underwriting” and our audited consolidated financial statements and the related notes included elsewhere in this prospectus.
| Successor | ||||
| As of December 31, 2016 | ||||
| (dollars in thousands, except share and per share amounts) | ||||
| Balance sheet data: |
||||
| Cash and cash equivalents |
$ | 15,295 | ||
|
|
|
|||
| Capital lease obligations (1) |
2,766 | |||
| Bank debt, including current portion: |
||||
| Senior Secured Credit Facility (2) |
162,627 | |||
| Less: debt issuance costs |
(566 | ) | ||
|
|
|
|||
| Total bank debt (3) |
162,061 | |||
|
|
|
|||
| Total debt, net of issuance costs |
164,827 | |||
|
|
|
|||
| Stockholders’ equity |
||||
| Preferred stock, par value of $0.01 per share; 30,000,000 shares authorized, no shares issued and outstanding as of December 31, 2016 |
— | |||
| Common stock, par value of $0.01 per share; 250,000,000 shares authorized, 45,276,137 shares issued and outstanding as of December 31, 2016 |
438 | |||
| Additional paid-in capital |
700,871 | |||
| Accumulated deficit |
(560,447 | ) | ||
|
|
|
|||
| Total stockholders’ equity |
140,862 | |||
|
|
|
|||
| Total capitalization |
$ | 305,689 | ||
|
|
|
|
||
| (1) | In connection with the transition of a warehouse and distribution center from New Jersey to California, we entered into certain capital leases during the year ended December 31, 2016. The capital leases are primarily related to equipment and fixtures required to prepare the new facility for use. |
| (2) | As of December 31, 2016, the Senior Secured Credit Facility consisted of a $165.0 million term loan and a $35.0 million revolving line of credit. As of December 31, 2016, there were undrawn letters of credit of $0.5 million outstanding under the revolving line of credit. |
| (3) | Total bank debt is presented net of debt issuance costs, which have been recorded as a reduction to the gross carrying amount on the consolidated balance sheets. |
42
Table of Contents
Selected consolidated financial data
The following table presents our selected consolidated financial data for the periods and as of the dates indicated. The periods prior to and including January 31, 2014 include all of the accounts of e.l.f. Cosmetics, Inc. (formerly known as J.A. Cosmetics US, Inc.) and its subsidiaries and are referred to in the following table as “Predecessor,” and all periods after January 31, 2014 include all of the accounts of e.l.f. Beauty, Inc. and its subsidiaries and are referred to in the following table as “Successor.” The selected consolidated financial data as of December 31, 2014, 2015 and 2016, and for the period from January 1, 2014 through January 31, 2014, the period from February 1, 2014 through December 31, 2014 and the years ended December 31, 2015 and 2016, has been derived from the audited consolidated financial statements included elsewhere in this prospectus.
The selected consolidated financial data for the years ended December 31, 2012 and 2013 have been derived from the Predecessor’s audited consolidated financial statements which are not included in this prospectus and is presented in order to provide a reconciliation from net income to Adjusted EBITDA for these periods.
You should read the following financial information together with the information under “Capitalization” and “Management’s discussion and analysis of financial condition and results of operations” and our consolidated financial statements and the related notes included elsewhere in this prospectus.
| Predecessor | Successor | Unaudited pro forma combined(1) |
Successor | |||||||||||||||||
| (dollars in thousands, except share and per share amounts) |
Period from January 1, 2014 through January 31, 2014 |
Period from February 1, 2014 through December 31, 2014 |
Year ended December 31, 2014 |
Year ended December 31, 2015 |
Year ended December 31, 2016 |
|||||||||||||||
| Statement of operations data: |
||||||||||||||||||||
| Net sales |
$ | 9,810 | $ | 135,134 | $ | 144,944 | $ | 191,413 | $ | 229,567 | ||||||||||
| Gross profit |
4,772 | 61,450 | 67,496 | 100,329 | 132,235 | |||||||||||||||
| Operating income |
1,727 | 5,347 | 16,119 | 25,571 | 23,079 | |||||||||||||||
| Other income (expense), net |
36 | (6,633 | ) | (6,597 | ) | (4,172 | ) | 3,016 | ||||||||||||
| Interest expense |
(128 | ) | (11,545 | ) | (12,546 | ) | (12,721 | ) | (16,283 | ) | ||||||||||
| Income (loss) before provision for income taxes |
1,635 | (12,831 | ) | (3,024 | ) | 8,678 | 9,812 | |||||||||||||
| Benefit (provision) for income tax |
(542 | ) | 3,545 | 143 | (4,321 | ) | (4,499 | ) | ||||||||||||
| Net income (loss) |
$ | 1,093 | $ | (9,286 | ) | $ | (2,881 | ) | $ | 4,357 | $ | 5,313 | ||||||||
| Net income (loss) per share—basic |
$ | 1,093 | $ | (709 | ) | $ | (512 | ) | $ | (1,560 | ) | $ | (39 | ) | ||||||
| Net income (loss) per share—diluted |
$ | 1,088 | $ | (709 | ) | $ | (512 | ) | $ | (1,560 | ) | $ | (39 | ) | ||||||
| Weighted average number of shares outstanding—basic |
1,000 | 27,593 | 27,593 | 30,523 | 12,606,529 | |||||||||||||||
| Weighted average number of shares outstanding—diluted |
1,005 | 27,593 | 27,593 | 30,523 | 12,606,529 | |||||||||||||||
| Other data: |
||||||||||||||||||||
| EBITDA(2) |
1,804 | 6,658 | 18,190 | 31,688 | 39,247 | |||||||||||||||
| Adjusted EBITDA(2) |
2,087 | 26,013 | 28,100 | 46,178 | 53,772 | |||||||||||||||
| Adjusted EBITDA margin |
21.3% | 19.2% | 19.4% | 24.1% | 23.4% | |||||||||||||||
| Depreciation and amortization |
41 | 7,944 | 8,668 | 10,289 | 13,152 | |||||||||||||||
| Capital expenditures |
19 | 1,597 | 1,616 | 10,242 | 9,223 | |||||||||||||||
|
|
|
|
|
|
|
|
|
|
|
|
||||||||||
| (1) | For the purpose of performing a comparison to the Successor’s year ended December 31, 2015, we prepared Unaudited Pro Forma Combined Supplemental Financial Information for the year ended December 31, 2014, which gives effect to the acquisition of 100% of the outstanding shares of capital stock of the Predecessor by the Successor, as if it had occurred on January 1, 2014. The Unaudited Pro Forma Combined 2014 Period is being discussed herein for informational purposes only and does not reflect any operating efficiencies or potential cost savings that may result from the consolidation of operations. See “Management’s discussion and analysis of financial conditions and results of operations—Recent transactions and basis of presentation” for a description of the adjustments made in preparing the Unaudited Pro Forma Combined 2014 Period. |
| (2) | EBITDA represents net income (loss) plus interest expense, income tax benefit (provision) and depreciation and amortization. Adjusted EBITDA represents EBITDA further adjusted to exclude the impact of other items that management does not believe are reflective of the Company’s ongoing operations (comprising transaction-related expenses incurred in connection with the acquisition of the Predecessor, the restructuring |
43
Table of Contents
| of our operations, including warehouse transition and reorganization of our operations in China, and the preparation for our initial public offering), stock-based compensation expense, management fees paid to our Sponsor, costs associated with e.l.f. stores incurred prior to the store opening (including legal-related costs, rent and occupancy expenses, marketing and other store operating supply expenses), costs associated with securing additional distribution space (including slotting expense, freight and certain costs related to installation of fixtures), costs related to the evaluation of an acquisition in 2014, certain non-cash losses and write-offs, and gains and losses on our foreign currency contracts as reflected in the reconciliation below. |
We present EBITDA and Adjusted EBITDA because our management uses these as supplemental measures in assessing our operating performance, and we believe they are helpful to investors, securities analysts and other interested parties in evaluating the performance of companies in our industry. We also believe EBITDA and Adjusted EBITDA are useful to management and investors, securities analysts and other interested parties as measures of our comparative operating performance from period to period. EBITDA and Adjusted EBITDA are not measurements of financial performance under GAAP. They should not be considered as alternatives to cash flow from operating activities, as measures of liquidity, or as alternatives to net income as a measure of our operating performance or any other measures of performance derived in accordance with GAAP. In addition, EBITDA and Adjusted EBITDA should not be construed as an inference that our future results will be unaffected by unusual or non-recurring items. EBITDA and Adjusted EBITDA have limitations as analytical tools, and you should not consider such measures either in isolation or as substitutes for analyzing our results as reported under GAAP. Our definitions and calculations of EBITDA and Adjusted EBITDA are not necessarily comparable to other similarly titled measures used by other companies due to different methods of calculation.
The following table provides a reconciliation of EBITDA and Adjusted EBITDA to net income (loss):
| Predecessor | Successor | Unaudited pro forma combined |
Successor | |||||||||||||||||||||||||||||||||
| (dollars in thousands) | Year ended December 31, 2012 |
Year ended December 31, 2013 |
Period from January 1, 2014 through January 31, 2014 |
Period from February 1, 2014 through December 31, 2014 |
Year ended December 31, 2014 |
Year ended December 31, 2015 |
Year ended December 31, 2016 |
|||||||||||||||||||||||||||||
|
|
||||||||||||||||||||||||||||||||||||
| Net income (loss) |
$ | 9,897 | $ | 16,555 | $ | 1,093 | $ | (9,286 | ) | $ | (2,881 | ) | $ | 4,357 | $ | 5,313 | ||||||||||||||||||||
| Interest expense |
610 | 1,637 | 128 | 11,545 | 12,546 | 12,721 | 16,283 | |||||||||||||||||||||||||||||
| Income tax benefit (provision |
6,275 | 9,211 | 542 | (3,545 | ) | (143 | ) | 4,321 | 4,499 | |||||||||||||||||||||||||||
| Depreciation and amortization |
395 | 538 | 41 | 7,944 | 8,668 | 10,289 | 13,152 | |||||||||||||||||||||||||||||
|
|
|
|
|
|||||||||||||||||||||||||||||||||
| EBITDA |
$ | 17,177 | $ | 27,941 | $ | 1,804 | $ | 6,658 | $ | 18,190 | $ | 31,688 | $ | 39,247 | ||||||||||||||||||||||
| Transaction-related expenses(a) |
— | 194 | 63 | 9,759 | 94 | 705 | — | |||||||||||||||||||||||||||||
| Cost related to “restructuring” of operations(b) |
— | — | — | 370 | 370 | 1,595 | 4,701 | |||||||||||||||||||||||||||||
| Initial public offering preparation costs |
— | — | — | — | — | 1,144 | 945 | |||||||||||||||||||||||||||||
| Stock-based compensation |
— | 26 | — | 287 | 287 | 503 | 7,149 | |||||||||||||||||||||||||||||
| Management fee(c) |
233 | 250 | — | 775 | 775 | 854 | 875 | |||||||||||||||||||||||||||||
| Pre-opening costs(d) |
— | 118 | 15 | 180 | 195 | 64 | 1,231 | |||||||||||||||||||||||||||||
| Customer expansion costs(e) |
— | — | — | — | — | 1,191 | 721 | |||||||||||||||||||||||||||||
| Other non-cash and non-recurring costs |
— | — | — | 1,104 | 1,104 | 530 | — | |||||||||||||||||||||||||||||
| Unrealized losses (gains) on foreign currency contracts(f) |
— | — | 205 | 6,880 | 7,085 | 7,904 | (1,097 | ) | ||||||||||||||||||||||||||||
|
|
|
|
|
|||||||||||||||||||||||||||||||||
| Adjusted EBITDA |
$ | 17,410 | $ | 28,529 | $ | 2,087 | $ | 26,013 | $ | 28,100 | $ | 46,178 | $ | 53,772 | ||||||||||||||||||||||
|
|
||||||||||||||||||||||||||||||||||||
| (a) | Represents transaction-related expenses related to the acquisition of the Predecessor. |
| (b) | Represents costs associated with the restructuring of our operations, including warehouse transition and reorganization of our operations in China. |
| (c) | Represents management fees paid to our Sponsor. |
| (d) | Represents costs associated with e.l.f. stores incurred prior to the store opening, including legal-related costs, rent and occupancy expenses, marketing and other store operating supply expenses. |
| (e) | Represents costs associated with securing additional distribution space, including slotting expense, freight and certain costs related to installation of fixtures. |
| (f) | Represents non-cash (gains) / losses on our foreign currency contracts. |
44
Table of Contents
| Successor | ||||||||||||
| As of December 31, | ||||||||||||
| (dollars in thousands) | 2014 | 2015 | 2016 | |||||||||
| Balance sheet data: |
||||||||||||
| Cash and cash equivalents |
$ | 4,668 | $ | 14,004 | $ | 15,295 | ||||||
| Net working capital(3) |
23,218 | 10,860 | 29,339 | |||||||||
| Property and equipment, net |
2,125 | 9,854 | 17,151 | |||||||||
| Total assets |
354,178 | 361,072 | 414,729 | |||||||||
| Total bank debt, including current maturities(4) |
148,424 | 144,919 | 162,061 | |||||||||
| Total liabilities |
222,656 | 224,175 | 273,867 | |||||||||
| Convertible preferred stock |
145,328 | 197,295 | — | |||||||||
| Total stockholders’ equity (deficit) |
(13,806 | ) | (60,398 | ) | 140,862 | |||||||
|
|
|
|
|
|
|
|
||||||
| (3) | Net working capital is defined as current assets, excluding cash and cash equivalents, minus current liabilities. |
| (4) | Total bank debt, including current maturities is net of $4.3 million, $3.2 million and $0.6 million of debt issuance costs as of December 31, 2014, 2015 and 2016, respectively. |
45
Table of Contents
Management’s discussion and analysis of financial condition and results of operations
You should read the following discussion and analysis of our financial condition and results of operations together with “Selected consolidated financial data” and our consolidated financial statements and related notes included elsewhere in this prospectus. This discussion and analysis and other parts of this prospectus contain forward-looking statements that reflect our current plans, expectations, estimates and beliefs that involve risks, uncertainties and assumptions, such as statements regarding our plans, objectives, expectations, intentions and projections. Our actual results and the timing of selected events may differ materially from those discussed in these forward-looking statements. You should carefully read the “Risk factors” section of this prospectus to gain an understanding of the important factors that could cause actual results to differ materially from our forward-looking statements. Please also see the sections entitled “Special note regarding forward-looking statements” and “Industry and market data.”
Overview
We are one of the fastest growing, most innovative cosmetics companies in the United States. Driven by our mission to make luxurious beauty accessible for all women to play beautifully, we have challenged the traditional belief that quality cosmetics are only available at high prices in select channels. We are a true multi-channel brand with strength across e-commerce, national retailers and our e.l.f. stores. Our ability to engage our consumers across multiple touch points differentiates e.l.f. from traditional mass brands, which typically focus on one channel. We also leverage insights gained from each channel to drive performance across the business.
We sell our products in national and international retailers (with international primarily serviced by distributors) and direct-to-consumer channels, which include e-commerce and e.l.f. stores. Our largest customers, Walmart and Target, accounted for 30% and 28%, respectively, of our net sales in 2016. National and international retailers comprised 88% of our net sales in 2016. The remaining 12% came from our direct-to-consumer channels, the substantial majority of which was from e-commerce, with the balance from e.l.f. stores. We believe the combination of our affordable price points and on-trend, innovative product assortment encourages trial, offers a strong value proposition and appeals to a broad base of consumers. By combining our strong relationships with leading retailers with integrated consumer engagement across our e.l.f. stores, e-commerce and social media, we are a true multi-channel brand.
The primary market for our products is the United States, which accounted for 92% of our net sales in 2016. The remaining 8% was attributable to international markets, including Canada, the United Kingdom and Mexico.
Components of our results of operations and trends affecting our business
Net sales
We develop, market and sell cosmetic products under the e.l.f. brand through national retailers, e-commerce and our e.l.f. stores. Our net sales are derived from sales of cosmetic products, net of provisions for sales discounts and allowances, product returns, markdowns and price adjustments.
Our growth in net sales is driven by a number of trends, including the broader economic environment, levels of consumer spending, and increasing awareness of and demand for our products. Within our existing national retailers, we are able to drive growth by growing space allocation and increasing sales per linear foot, supported by our continued innovation, including our ability to introduce new first-to-mass products in our existing categories and new products in adjacent categories such as skin care. While we have distribution with a number of key retail accounts, we expect to continue to grow through increased penetration into additional stores within existing accounts as well as the addition of new retail customers and retail stores.
These factors have fueled our growth at a faster rate than the overall cosmetics industry. However, our results of operations and business face challenges and uncertainties, including our ability to introduce new products that will appeal to a broad consumer base, our ability to service demand, the ability of our major retail customers to keep products in stock, our ability to continue to grow our customer base and competitive threats from other cosmetics companies.
Gross profit
Gross profit is our net sales less cost of sales. Cost of sales reflects the aggregate costs to procure our products, including the amounts invoiced by our third-party contractors for finished goods as well as costs related to transportation to our
46
Table of Contents
distribution center, customs and duties. Cost of sales also includes the effect of changes in the balance of reserves for excess and obsolete inventory and the write-off of inventory not previously reserved. Gross margin measures our gross profit as a percentage of net sales.
We have an extensive network of third-party manufacturers in China where we purchase finished goods. Over the past three years, we have worked to evolve our supply chain to increase capacity and technical capabilities while maintaining or reducing overall costs as a percentage of sales.
Over the past year, we have improved our gross margin largely through changes in pricing, our product mix, purchasing efficiencies and cost reductions in our supply chain, and expect to continue leveraging our innovation and sourcing capabilities to drive increased margin in future periods.
Selling, general and administrative
Our selling, general and administrative (“SG&A”) expenses primarily consist of personnel-related expenses, including salaries, bonuses, fringe benefits and stock-based compensation. See “Critical accounting policies and estimates—Stock-based compensation” below for more detail regarding stock-based compensation. Other significant SG&A expenses include warehousing, freight, advertising, professional fees for accounting, auditing, consulting and legal services, travel and overhead expenses, depreciation of property and equipment and amortization of intangible assets.
SG&A expenses have increased over the past year, primarily due to investments in headcount and investment in our corporate infrastructure to support our continued scale and growth, partially offset by leveraging the balance of our general overhead expenses at a slower pace than net sales.
In the near term, we expect SG&A expense to increase as we invest to support our growth initiatives, including investments in the e.l.f. brand and infrastructure as well as the expansion of our e.l.f. store and international footprints. Additionally, there will also be an increase in our SG&A expenses compared to prior periods due to the reporting and compliance costs associated with being a public company. Over time, we expect our SG&A expenses to grow at a slower rate than our net sales growth as we leverage our past investments.
Interest expense, net
Interest expense primarily consists of cash interest and fees on our outstanding indebtedness. See “Financial condition, liquidity and capital resources” below and a description of our indebtedness in Note 9 to the Notes to consolidated financial statements included elsewhere in this prospectus.
Other income (expense)
Our purchases are largely in Chinese renminbi (“RMB”), and, as such, we are exposed to periodic fluctuations in that currency. While we do not have an active hedging program, we had a number of legacy exchange rate forward contracts that matured during the year ended December 31, 2016. We do not follow hedge accounting, and therefore the periodic impact of these legacy hedging activities is calculated on a mark-to-market basis. Other income (expense) is primarily a result of changes in the notional value of exchange rate forward contracts outstanding, as well as fluctuations in the exchange rate in the RMB to the U.S. dollar.
Provision for income taxes
The provision for income taxes represents federal, foreign, state and local income taxes. The effective rate differs from statutory rates due to the effect of state and local income taxes, tax rates in foreign jurisdictions and certain permanent tax adjustments. Our effective tax rate will change from quarter to quarter based on recurring and nonrecurring factors including, but not limited to, the geographical mix of earnings, enacted tax legislation, state and local income taxes, the impact of permanent tax adjustments, tax audit settlements and the interaction of various tax strategies.
Net income (loss)
Our net income (loss) for future periods will be affected by the various factors described above.
47
Table of Contents
Recent transactions and basis of presentation
On January 31, 2014, e.l.f. Beauty, Inc. (the “Successor”) acquired 100% of the outstanding shares of capital stock of e.l.f. Cosmetics, Inc. (the “Predecessor,” formerly known as J.A. Cosmetics US, Inc.) (the “Acquisition”). Accordingly, the accompanying consolidated financial statements presented elsewhere in this prospectus as of and for the years ended December 31, 2014, 2015 and 2016 reflect periods both prior and subsequent to the Acquisition. The consolidated financial statements for December 31, 2014, 2015 and 2016 are presented separately for the Predecessor period from January 1, 2014 through January 31, 2014 (the “Predecessor 2014 Period”), the Successor period from February 1, 2014 through December 31, 2014 (the “Successor 2014 Period”), the year ended December 31, 2015 and the year ended December 31, 2016, with the periods prior to the Acquisition being labeled as Predecessor and the periods subsequent to the Acquisition labeled as Successor. The financial position and results of the Successor reflect the application of purchase accounting in accordance with Financial Accounting Standards Board (“FASB”) Accounting Standards Codification (“ASC”) Topic 805, Business Combinations (“ASC 805”).
For the purpose of performing a comparison to the year ended December 31, 2015, the Unaudited Pro Forma Combined Period, which corresponds to the year ended December 31, 2014, gives effect to the Acquisition as if it had occurred on January 1, 2014 (the “Unaudited Pro Forma Combined 2014 Period”). The Unaudited Pro Forma Combined 2014 Period discussed herein has been prepared in accordance with Article 11 of Regulation S-X, does not purport to represent what our actual consolidated results of operations would have been had the Acquisition actually occurred on January 1, 2014, nor is it necessarily indicative of future consolidated results of operations. The Unaudited Pro Forma Combined 2014 Period is being discussed herein for informational purposes only and does not reflect any operating efficiencies or potential cost savings that may result from the consolidation of operations.
In preparing the Unaudited Pro Forma Combined 2014 Period, we combined the Predecessor 2014 Period and Successor 2014 Period and adjusted the historical results within these periods to give effect to pro forma events that are (i) directly attributable to the Acquisition; (ii) factually supportable; and (iii) expected to have a continuing impact on the combined financial results. The pro forma adjustments made to give effect to the Acquisition, as if it had occurred on January 1, 2014, are summarized in the table below:
| Predecessor | Successor | Unaudited pro forma combined |
||||||||||||||||||||||
| Period from January 1, 2014 through January 31, 2014 |
Period from February 1, 2014 through December 31, 2014 |
Pro forma adjustments |
Year ended December 31, 2014 |
|||||||||||||||||||||
| Net sales |
$ | 9,810 | $ | 135,134 | $ | — | $ | 144,944 | ||||||||||||||||
| Cost of sales |
5,038 | 73,684 | (1,274 | )(a) | 77,448 | |||||||||||||||||||
|
|
|
|
|
|
|
|
|
|
|
|
|
|||||||||||||
| Gross profit |
4,772 | 61,450 | 1,274 | 67,496 | ||||||||||||||||||||
| Selling, general, and administrative expenses |
3,045 | 56,103 | (7,771 | )(b)(c) | 51,377 | |||||||||||||||||||
|
|
|
|
|
|
|
|
|
|
|
|
|
|||||||||||||
| Operating income |
1,727 | 5,347 | 9,045 | 16,119 | ||||||||||||||||||||
| Other income (expense), net |
36 | (6,633 | ) | — | (6,597 | ) | ||||||||||||||||||
| Interest expense, net |
(128 | ) | (11,545 | ) | (873 | )(d) | (12,546 | ) | ||||||||||||||||
|
|
|
|
|
|
|
|
|
|
|
|
|
|||||||||||||
| Income (loss) before provision for income taxes |
1,635 | (12,831 | ) | 8,172 | (3,024 | ) | ||||||||||||||||||
| Income tax benefit (provision) |
(542 | ) | 3,545 | (2,860 | )(e) | 143 | ||||||||||||||||||
|
|
|
|
|
|
|
|
|
|
|
|
|
|||||||||||||
| Net income (loss) |
$ | 1,093 | $ | (9,286 | ) | $ | 5,312 | $ | (2,881 | ) | ||||||||||||||
|
|
|
|
|
|
|
|
|
|
|
|
|
|
||||||||||||
| (a) | Represents the exclusion of $1.3 million in non-recurring charges recorded in cost of sales from the fair value step-up on inventory related to the Acquisition. |
| (b) | Represents $0.7 million in incremental amortization expense within SG&A related to intangible assets recorded at the time of the Acquisition. |
| (c) | Represents the exclusion of non-recurring items that were directly related to the Acquisition and did not have a continuing impact on the combined pro forma results, including $5.4 million in compensation expense recorded within SG&A associated with a change in control payment to a former employee and $3.1 million in transaction costs recorded within SG&A, including professional fees. |
| (d) | Represents $0.9 million in incremental net interest expense related to new financing facilities. |
| (e) | Represents $2.9 million in incremental tax expense based on statutory rates and associated with the pro forma adjustments. |
48
Table of Contents
As the Predecessor and Successor have the same accounting policies, no conforming accounting policy adjustments were necessary. Similarly, no reclassifications were necessary to conform the Predecessor’s historical financial statements presentation to that of the Successor.
Seasonality
Our results of operations are subject to seasonal fluctuations, with net sales in the third and fourth fiscal quarters typically being higher than in the first and second fiscal quarters. The higher net sales in our third and fourth fiscal quarters are largely attributable to the increased levels of purchasing by retailers for the holiday season, and adverse events that occur during the third or fourth quarter could have a disproportionate effect on our results of operations for the entire fiscal year. As a result of higher sales during the third and fourth quarters, our working capital needs are greater during the second and third quarters of the fiscal year. Fluctuations throughout the year are also driven by the timing of product restocking or rearrangement by our major customers as well as our expansion into new customers. Because a limited number of our retail customers account for a large percentage of our net sales, a change in the order pattern of one or more of our large retail customers could cause a significant fluctuation of our quarterly results or reduce our liquidity.
Results of operations
The following table sets forth our consolidated statements of operations data in dollars and as a percentage of net sales for the periods presented:
| Predecessor |
|
|
Successor | Unaudited pro forma combined |
Successor | |||||||||||||||||||||||
| (in thousands) | Period from 2014 through 2014 |
Period from 2014 through 2014 |
Year ended December 31, 2014 |
Year ended December 31, 2015 |
Year ended December 31, 2016 |
|||||||||||||||||||||||
| Net sales |
$ | 9,810 | $ | 135,134 | $ | 144,944 | $ | 191,413 | $ | 229,567 | ||||||||||||||||||
| Cost of sales |
5,038 | 73,684 | 77,448 | 91,084 | 97,332 | |||||||||||||||||||||||
|
|
|
|
|
|
|
|
|
|
|
|
|
|
|
|||||||||||||||
| Gross profit |
4,772 | 61,450 | 67,496 | 100,329 | 132,235 | |||||||||||||||||||||||
| Selling, general, and administrative expenses |
3,045 | 56,103 | 51,377 | 74,758 | 109,156 | |||||||||||||||||||||||
|
|
|
|
|
|
|
|
|
|
|
|
|
|
|
|||||||||||||||
| Operating income |
1,727 | 5,347 | 16,119 | 25,571 | 23,079 | |||||||||||||||||||||||
| Other income (expense), net |
36 | (6,633 | ) | (6,597 | ) | (4,172 | ) | 3,016 | ||||||||||||||||||||
| Interest expense, net |
(128 | ) | (11,545 | ) | (12,546 | ) | (12,721 | ) | (16,283 | ) | ||||||||||||||||||
|
|
|
|
|
|
|
|
|
|
|
|
|
|
|
|||||||||||||||
| Income (loss) before provision for income taxes |
1,635 | (12,831 | ) | (3,024 | ) | 8,678 | 9,812 | |||||||||||||||||||||
| Income tax benefit (provision) |
(542 | ) | 3,545 | 143 | (4,321 | ) | (4,499 | ) | ||||||||||||||||||||
|
|
|
|
|
|
|
|
|
|
|
|
|
|
|
|||||||||||||||
| Net income (loss) |
$ | 1,093 | $ | (9,286 | ) | $ | (2,881 | ) | $ | 4,357 | $ | 5,313 | ||||||||||||||||
|
|
|
|
|
|
|
|
|
|
|
|
|
|
|
|
||||||||||||||
49
Table of Contents
| Predecessor |
|
|
Successor | Unaudited pro forma combined |
Successor | |||||||||||||||||||||||
| (percentage of net sales) | Period from 2014 through 2014 |
Period from February 1, 2014 through December 31, 2014 |
Year ended 2014 |
Year ended 2015 |
Year ended 2016 |
|||||||||||||||||||||||
| Net sales |
100% | 100% | 100% | 100% | 100% | |||||||||||||||||||||||
| Cost of sales |
51% | 55% | 53% | 48% | 42% | |||||||||||||||||||||||
|
|
|
|
|
|
|
|
|
|
|
|
|
|
|
|||||||||||||||
| Gross profit |
49% | 45% | 47% | 52% | 58% | |||||||||||||||||||||||
| Selling, general, and administrative expenses |
31% | 42% | 35% | 39% | 48% | |||||||||||||||||||||||
|
|
|
|
|
|
|
|
|
|
|
|
|
|
|
|||||||||||||||
| Operating income |
18% | 4% | 11% | 13% | 10% | |||||||||||||||||||||||
| Other income (expense), net |
0% | (5% | ) | (5% | ) | (2% | ) | 1% | ||||||||||||||||||||
| Interest expense, net |
(1% | ) | (9% | ) | (9% | ) | (7% | ) | (7% | ) | ||||||||||||||||||
|
|
|
|
|
|
|
|
|
|
|
|
|
|
|
|||||||||||||||
| Income (loss) before provision for income taxes |
17% | (9% | ) | (2% | ) | 5% | 4% | |||||||||||||||||||||
| Income tax benefit (provision) |
(6% | ) | 3% | 0% | (2% | ) | (2% | ) | ||||||||||||||||||||
|
|
|
|
|
|
|
|
|
|
|
|
|
|
|
|||||||||||||||
| Net income (loss) |
11% | (7% | ) | (2% | ) | 2% | 2% | |||||||||||||||||||||
|
|
|
|
|
|
|
|
|
|
|
|
|
|
|
|
||||||||||||||
Comparison of the year ended December 31, 2016 to the year ended December 31, 2015
Net sales
Net sales increased $38.2 million, or 20%, to $229.6 million in the year ended December 31, 2016, from $191.4 million in the year ended December 31, 2015. The increase was primarily driven by growth in leading national retailers due to incremental increases in shelf space and increased productivity. The year ended December 31, 2015 included the initial sales to establish distribution for a new national retail customer that positively impacted revenue in that period.
Gross profit
Gross profit increased $31.9 million, or 32%, to $132.2 million in the year ended December 31, 2016, from $100.3 million in the year ended December 31, 2015. Increased volume accounted for $20.0 million of the increase in gross profit, with the remaining $11.9 million primarily attributable to margin accretive innovation. Gross margin improved from 52% in the year ended December 31, 2015 to 58% in the year ended December 31, 2016, primarily as a result of margin accretive innovation.
Selling, general and administrative expenses
SG&A expenses increased $34.4 million, or 46%, to $109.2 million in the year ended December 31, 2016, from $74.8 million in the year ended December 31, 2015. SG&A expenses as a percentage of net sales increased to 48% for the year ended December 31, 2016 from 39% in the year ended December 31, 2015. The increase was primarily a result of stock-based compensation expense charges triggered by our initial public offering, warehouse and distribution costs due to the relocation of our distribution center from New Jersey to California and related start-up costs, investments in sales and marketing to support growth, and higher information technology costs to support infrastructure improvements.
Other income (expense), net
Other income (expense) increased $7.2 million to income of $3.0 million in the year ended December 31, 2016 from expense of $4.2 million in the year ended December 31, 2015. The increase was primarily due to favorable currency movements and the maturity of all of our remaining legacy exchange rate forward contracts during 2016.
Interest expense, net
Interest expense increased $3.6 million, or 28%, to $16.3 million in the year ended December 31, 2016, compared to $12.7 million in the year ended December 31, 2015. The increase was primarily due to incremental borrowings under our Term Loan Facility (as defined in “Management’s discussion and analysis of financial condition and results of operations” included elsewhere in this prospectus under the heading “Description of indebtedness”) related to the June 2016 dividend recapitalization transaction, a prepayment penalty and the write-off of unamortized deferred financing fees associated with
50
Table of Contents
the paydown of our Second Lien Term Loan (as defined in Note 1 to the Notes to consolidated financial statements included elsewhere in this prospectus) in conjunction with our initial public offering, and debt extinguishment costs associated with the refinancing of our Senior Secured Credit Facility in December 2016. This was partially offset by a reduction in interest expense driven by the paydown of our Second Lien Term Loan.
Income taxes
The provision for income taxes increased to $4.5 million, or an effective tax rate of 45.9%, for the year ended December 31, 2016 from $4.3 million, or an effective tax rate of 49.8%, for the year ended December 31, 2015. The change was driven primarily by a $1.1 million increase in pre-tax net income from $8.7 million to $9.8 million, as well as certain discrete items including a benefit from income taxes generated by stock option exercises of $1.6 million and additional tax expense related to deferred tax rate changes of $1.8 million.
Comparison of the year ended December 31, 2015 to the Successor 2014 Period, the Predecessor 2014 Period and the Unaudited Pro Forma Combined Period for the year ended December 31, 2014
The results of operations discussion herein focuses on the comparison of the year ended December 31, 2015 to the Successor 2014 Period, the Predecessor 2014 Period and the Unaudited Pro Forma Combined 2014 Period.
We believe that a discussion of results of operations for the Predecessor 2014 Period and the Successor 2014 Period on a standalone basis is not meaningful as the Acquisition was accounted for as a business combination in accordance with ASC 805, and the resulting new basis of accounting is reflected in the Company’s consolidated financial statements for all periods beginning on or after January 31, 2014, and therefore, the two periods are not comparable. Except for the specific pro forma adjustments made to arrive at the Unaudited Pro Forma Combined 2014 Period, the underlying drivers for the change in 2015 compared to 2014, both actual 2014 results and the Unaudited Pro Forma Combined 2014 Period results, are the same. We believe that the comparison of the year ended December 31, 2015 to the Unaudited Pro Forma Combined 2014 Period provides for a more meaningful discussion of the 2015 and 2014 results of operations for potential investors and users of the financial statements.
Net sales
Net sales were $191.4 million for the year ended December 31, 2015, compared to $135.1 million for the Successor 2014 Period and $9.8 million for the Predecessor 2014 Period. This represents a 32% increase compared to the Unaudited Pro Forma Combined 2014 Period. This increase was fairly evenly attributable to expanding space allocation within our existing national retailers and the establishment of additional distribution space resulting from new retailer relationships.
Gross profit
Gross profit increased $32.8 million, or 49%, to $100.3 million for the year ended December 31, 2015 compared to $67.5 million for the Unaudited Pro Forma Combined Period. Increased volume accounted for $21.6 million of the increase in gross profit, with the remaining $11.2 million primarily attributable to favorable sales mix changes. Gross margin improved from 47% for the Unaudited Pro Forma Combined 2014 Period to 52% for the year ended December 31, 2015, primarily as a result of favorable sales mix changes in sales to national retailers.
Selling, general and administrative expenses
SG&A expenses were $74.8 million for the year ended December 31, 2015, compared to $56.1 million for the Successor 2014 Period and $3.0 million for the Predecessor 2014 Period. SG&A expenses increased $23.4 million, or 46%, compared to the Unaudited Pro Forma Combined 2014 Period. As a percentage of net sales, SG&A expenses increased from 35% in the Unaudited Pro Forma Combined 2014 Period to 39% in 2015. The increase was primarily driven by additions to our headcount and bonus incentives, increased warehouse and distribution costs to support revenue growth and incremental marketing and e-commerce costs primarily related to expenditures to support incremental traffic to our e-commerce site.
Other income (expense), net
Other income (expense) was $(4.2 million) for the year ended December 31, 2015, compared to $(6.6 million) for the Successor 2014 Period and $36,000 for the Predecessor 2014 Period. The decrease in expense was primarily due to a $2.8 million reduction in unrealized losses on forward currency contracts and a $3.3 million decrease in transaction losses
51
Table of Contents
on foreign currency denominated payables, offset by a $3.7 million increase in realized losses related to settlement of forward currency contracts. These fluctuations are the result of the volatility in the currency exchange market for the RMB as the U.S. dollar strengthened versus the RMB in the respective periods, particularly in the third and fourth quarters of 2015.
Interest expense, net
Interest expense was $12.7 million for the year ended December 31, 2015, compared to $11.5 million for the Successor 2014 Period and $0.1 million for the Predecessor 2014 Period. This increase was due to the new credit facilities entered into as of January 31, 2014 as well as additional borrowings under our Revolving Credit Facility during the year ended December 31, 2015 compared to the Successor 2014 Period.
Income taxes
The effective tax rate changed from 33.1% in the Predecessor 2014 Period to 27.6% in the Successor 2014 Period and 49.8% in the year ended December 31, 2015. The Company realized a benefit from income taxes in the Successor 2014 Period, as a result of a loss before income taxes of $12.8 million. The benefit was reduced by approximately $0.8 million as a result of certain nondeductible transaction-related costs. For the year ended December 31, 2015, the Company recorded a provision for income taxes and the effective tax rate was negatively impacted by an increase in uncertain tax positions of $0.5 million.
Financial condition, liquidity and capital resources
Overview
As of December 31, 2016, we held $15.3 million of cash and cash equivalents. In addition, as of December 31, 2016, we had borrowing capacity of $34.5 million under our Revolving Credit Facility.
Our primary cash needs are for capital expenditures and working capital. Capital expenditures typically vary depending on strategic initiatives selected for the fiscal year, including investments in infrastructure, expansion into new national retailer doors and expansion of our e.l.f. store base. We expect to fund ongoing capital expenditures from cash generated from operations and, if necessary, draws on our Revolving Credit Facility.
Our primary working capital requirements are for product and product-related costs, the payment of payroll, rent, distribution costs and advertising and marketing. Fluctuations in working capital are primarily caused by the timing of when a retailer rearranges or restocks its products, expansion of space within our existing retailer base, expansion into new retail stores and the general seasonality of our business. As of December 31, 2016, we had working capital, excluding cash, of $29.3 million, compared to $10.9 million as of December 31, 2015. Working capital, excluding cash and debt, was $38.0 million and $21.2 million as of December 31, 2016 and December 31, 2015, respectively.
We believe that our operating cash flow and cash on hand will be adequate to meet our operating, investing and financing needs for the next 12 months. If necessary, we may borrow funds under our Revolving Credit Facility to finance our liquidity requirements, subject to customary borrowing conditions. To the extent additional funds are necessary to meet our long-term liquidity needs as we continue to execute our business strategy, we anticipate that they will be obtained through the incurrence of additional indebtedness, equity financings or a combination of these potential sources of funds; however, such financing may not be available on favorable terms, or at all. Our ability to meet our operating, investing and financing needs depends to a significant extent on our future financial performance, which will be subject in part to general economic, competitive, financial, regulatory and other factors that are beyond our control, including those described elsewhere in “Risk Factors”. In addition to these general economic and industry factors, the principal factors in determining whether our cash flows will be sufficient to meet our liquidity requirements will be our ability to provide innovative products to our customers and consumers and manage production and our supply chain.
52
Table of Contents
Cash flows
|
Predecessor |
Successor |
|||||||||||||||||||||||
| Period from January 1, 2014 through January 31, 2014 |
Period from February 1, 2014 through December 31, 2014 |
Year ended December 31, | ||||||||||||||||||||||
| (in thousands) | 2015 | 2016 | ||||||||||||||||||||||
| Net cash provided by (used in): |
||||||||||||||||||||||||
| Operating activities |
$ | 908 | $ | (8,415 | ) | $ | 24,519 | $ | 2,120 | |||||||||||||||
| Investing activities |
(19 | ) | (239,488 | ) | (10,242 | ) | (9,139 | ) | ||||||||||||||||
| Financing activities |
— | 252,571 | (4,941 | ) | 8,310 | |||||||||||||||||||
|
|
|
|
|
|
|
|
|
|||||||||||||||||
| Net increase in cash: |
$ | 889 | $ | 4,668 | $ | 9,336 | $ | 1,291 | ||||||||||||||||
|
|
||||||||||||||||||||||||
Operating activities
For the year ended December 31, 2016, net cash provided by operating activities was $2.1 million. This included net income, before deducting depreciation, amortization and other non-cash items, of $11.6 million offset by increases in net working capital of $9.5 million during the period. The increases in net working capital were largely driven by a $38.0 million increase in inventory to support growth in the business and a $15.4 million increase in accounts receivable driven by growth in revenue, partially offset by a $43.1 million increase in accounts payable and accrued expenses due to the increase in inventory purchases and the overall growth in the business.
For the year ended December 31, 2015, net cash provided by operating activities was $24.5 million. This included net income, before deducting depreciation, amortization and other non-cash items, of $18.1 million as well as decreases in net working capital of $6.4 million during this period. The favorable reductions in net working capital were largely driven from an increased focus on working capital optimization and were primarily attributable to a decrease of $4.4 million in accounts receivable, a $0.9 million increase in prepaid expenses and a $4.3 million increase in accounts payable and accrued expenses and other liabilities being only partially offset by a $2.1 million increase in inventories and a $1.1 million decrease in due to related parties during the period.
For the Successor 2014 Period, net cash used in operating activities was $8.4 million. Net income before deducting depreciation, amortization and other non-cash items generated cash of $7.4 million. This was offset by a net increase in working capital of $15.8 million. The net increase in working capital was primarily the result of an $11.0 million increase in accounts receivable, a $4.8 million increase in inventory and a $2.1 million increase in prepaid expenses and other assets. These increases were primarily due to net sales and inventory builds to support ongoing operational demands as the business scaled during this period. The net increase in working capital was partially offset by a $2.1 million aggregate increase in accounts payable, accrued expenses and other liabilities during the period.
For the Predecessor 2014 Period, net cash provided by operating activities was $0.9 million. Net income before deducting depreciation, amortization and other non-cash items generated cash of $3.1 million. This was partially offset by a net increase in working capital of $2.2 million. The most significant drivers of the net increase in working capital were a $5.5 million decrease in accounts receivable being offset by a $1.5 million increase in inventory, a $0.2 million increase in prepaid expenses and other assets and a $6.0 million decrease in accounts payable and accrued expenses during the period.
Investing activities
For the year ended December 31, 2016, net cash used in investing activities was $9.1 million, consisting primarily of purchases of property and equipment related to the build-out of new e.l.f. stores that opened in 2016, as well as fixtures to support new distribution at national retailers.
For the year ended December 31, 2015, net cash used in investing activities was $10.2 million, consisting primarily of purchases of property and equipment to support the continued scaling of our business infrastructure during this period.
For the Successor 2014 Period, net cash used in investing activities was $239.5 million, consisting of $237.9 million used for our Acquisition of the Predecessor and $1.6 million used for purchases of property and equipment during this period.
53
Table of Contents
Financing activities
For the year ended December 31, 2016, net cash provided by financing activities was $8.3 million, primarily driven by $64.1 million of proceeds from the issuance of common stock, including from our initial public offering, and proceeds of $21.2 million from the issuance of additional debt, net of repayments on both our 2014 Term Loan Facility (as defined in Note 1 to the Notes to consolidated financial statements included elsewhere in this prospectus) and Second Lien Credit Facility, which was repaid in full. This was partially offset by a $68.0 million cash dividend paid to stockholders and $7.7 million of net repayments under our 2014 Revolving Credit Facility (as defined in Note 1 to the Notes to consolidated financial statements included elsewhere in this prospectus).
For the year ended December 31, 2015, net cash used in financing activities was $4.9 million, primarily driven by net repayments under our 2014 Revolving Credit Facility and our 2014 Term Loan Facility.
For the Successor 2014 Period, net cash provided by financing activities was $252.6 million, consisting of $149.4 million in net proceeds, after issuance costs, from borrowings on our 2014 Senior Secured Credit Facility (as defined in Note 1 to the Notes to consolidated financial statements included elsewhere in this prospectus), $105.1 million in proceeds from the issuance of our common and preferred stock and a $2.0 million repayment on our long-term debt. The proceeds from the 2014 Senior Secured Credit Facility and the issuance of the common and preferred stock were utilized to finance the Acquisition of the Predecessor during this period.
Description of indebtedness
Senior secured credit facility
On December 23, 2016, we entered into a new five-year, $200.0 million senior secured credit facility with a syndicate consisting of several large financial institutions. The facility consists of a $35.0 million revolving line of credit (the “Revolving Credit Facility”) and a $165.0 million term loan (the “Term Loan Facility”).
All amounts under the Revolving Credit Facility are available for draw until the maturity date on December 23, 2021. The Revolving Credit Facility is collateralized by substantially all of our assets and requires payment of an unused fee ranging from 0.35% to 0.25% (based on our consolidated total net leverage ratio) times the average daily amount of unutilized commitments under the Revolving Credit Facility. The Revolving Credit Facility also provides for sub-facilities in the form of a $7.0 million letter of credit and a $5.0 million swing line loan; however, all amounts under the Revolving Credit Facility cannot exceed $35.0 million. The unused balance of the Revolving Credit Facility as of December 31, 2016 was $34.5 million.
The Term Loan Facility maturity date is also December 23, 2021, and is collateralized by substantially all of our assets. Amortization installment payments on the Term Loan Facility are required to be made in quarterly installments of (i) $2,062,500 for fiscal quarters ending March 31, 2017 through December 31, 2018, (ii) $2,475,000 for fiscal quarters ending March 31, 2019 through December 31, 2019, (iii) $3,093,750 for fiscal quarters ending March 31, 2020 through December 31, 2020 and (iv) $4,125,000 for fiscal quarters ending March 31, 2021 through September 30, 2021. The remaining Term Loan Facility balance is due upon the maturity date. The Term Loan Facility can be prepaid at any time without penalty and is subject to mandatory prepayments when there is (i) excess cash flow, which is defined as EBITDA less certain customary deductions, (ii) non-ordinary course asset dispositions that result in net proceeds in excess of $2.5 million during a year, unless reinvested within twelve months, or (iii) issuance of additional debt.
Both the Revolving Credit Facility and the Term Loan Facility bear interest, at the Company’s option, at either a rate per annum equal to (i) the greater of (x) 3.00% and (y) an adjusted LIBOR rate determined by reference to the cost of funds for U.S. dollar deposits for the applicable interest period plus an applicable margin ranging from 2.00% to 3.50% based on our consolidated total net leverage ratio or (ii) the greater of (x) 2.00% and (y) a floating base rate plus an applicable margin ranging from 1.00% to 2.50% based on our consolidated total net leverage ratio. The interest rate on both the Revolving Credit Facility and the Term Loan was 4.5% per annum as of December 31, 2016.
We incurred costs directly related to the Senior Secured Credit Facility of $2.3 million, consisting primarily of lender fees of $2.1 million and third-party fees of $0.2 million. These fees were allocated between the Revolving Credit Facility and the Term Loan Facility, with the portion attributable to the Term Loan Facility recorded as a reduction of the carrying amount of the debt and the portion attributable to the Revolving Credit Facility recorded as a noncurrent asset.
The Senior Secured Credit Facility contains a number of covenants that, among other things, restrict our ability to (subject to certain exceptions) pay dividends and distributions or repurchase our capital stock, incur additional indebtedness, create liens on assets, engage in mergers or consolidations and sell or otherwise dispose of assets. The Senior Secured Credit
54
Table of Contents
Facility also includes reporting, financial and maintenance covenants that require us to, among other things, comply with certain consolidated total net leverage ratios and consolidated fixed charge coverage ratios. As of December 31, 2015 and 2016, we were in compliance with all financial covenants.
Contractual obligations and commitments
The following table summarizes our contractual obligations as of December 31, 2016 (in thousands):
| Payments Due by Period | ||||||||||||||||||||
| Total | Less than 1 Year |
1-3 Years | 3-5 Years | More than 5 years |
||||||||||||||||
| Bank debt(1) |
$ | 165,000 | $ | 8,250 | $ | 30,525 | $ | 126,225 | $ | — | ||||||||||
| Interest on bank debt(2) |
32,489 | 7,386 | 19,742 | 5,361 | — | |||||||||||||||
| Operating lease obligations |
31,736 | 4,789 | 13,551 | 5,659 | 7,737 | |||||||||||||||
| Capital lease obligations(3) |
3,356 | 568 | 1,506 | 905 | 377 | |||||||||||||||
|
|
|
|
|
|
|
|
|
|
|
|||||||||||
| Total contractual obligations(4) |
$ | 232,581 | $ | 20,993 | $ | 65,324 | $ | 138,150 | $ | 8,114 | ||||||||||
|
|
|
|
|
|
|
|
|
|
|
|
||||||||||
| (1) | Long-term debt payments include scheduled principal payments only. |
| (2) | Assumes an annual interest rate of 4.50% on the Senior Secured Credit Facility over the term of the loan. |
| (3) | Includes a $0.3 million residual value guarantee. |
| (4) | We have excluded our liability for uncertain tax positions from the table above because we are unable to make a reasonably reliable estimate of the timing of payments. |
Off-balance sheet arrangements
We are not party to any off-balance sheet arrangements.
Critical accounting policies and estimates
Our consolidated financial statements included elsewhere in this prospectus have been prepared in accordance with U.S. generally accepted accounting principles. The preparation of our financial statements requires us to make estimates and judgments that affect the reported amounts of assets, liabilities, revenues and expenses. We base our estimates on historical experience and on various other assumptions that we believe are reasonable under the circumstances. Actual results may differ from these estimates under different assumptions or conditions. While our significant accounting policies are more fully described in the Notes to consolidated financial statements included elsewhere in this prospectus, we believe that the following accounting policies and estimates are critical to our business operations and understanding of our financial results.
Revenue recognition
We recognize revenues when persuasive evidence of an arrangement exists, the product has been shipped, when title passes, when all risks and rewards of ownership have transferred, the sales price is fixed or determinable, and collectability is reasonably assured. Delivery is considered to have occurred at the time the title and risk of loss passes to the customer.
In the normal course of business, we offer various incentives to customers. We maintain a provision for sales discounts, markdowns, shortages and price adjustments, which are reflected as reductions to our net sales. The provision for these reductions is established based on our best estimate at the time of sale. We regularly review and revise, when deemed necessary, our estimates of sales incentives and other required reserves based primarily upon the historical rate of realization. These revenue reductions are reflected on the consolidated balance sheet as a sales allowance against accounts receivable.
Business combinations
We allocate the purchase price of acquired companies to the tangible and intangible assets acquired and liabilities assumed based on their estimated fair values. The valuation methodologies used are based on the nature of the asset or liability.
55
Table of Contents
For purposes of our acquisition of the Predecessor, the fair value of the trade name is estimated using the relief from royalty method, an income approach to valuation, which includes projecting net sales and other estimates. Customer relationships are valued based on an estimate of future revenues and costs related to the respective contracts over the remaining expected lives. Favorable leases are recorded based on differences between contractual rents under the respective lease agreements and prevailing market rents at the lease acquisition date.
Determining an acquired intangible asset’s useful life requires management judgment and is based on an evaluation of a number of factors, including the expected use of the asset, consumer awareness, trade name history and future expansion expectations, as well as any contractual provisions that could limit or extend an asset’s useful life. We estimate the useful lives of the intangible assets based on the expected period over which we anticipate generating economic benefit from the asset. We consider the trade name that we acquired to have an indefinite useful life, based upon its history of strong revenue and cash flow performance, and the intent and our ability to support the trade name with marketplace spending for the foreseeable future.
There were no business combinations in 2016 or 2015.
Impairment of long-lived assets, including goodwill and intangible assets
We assess potential impairments to our long-lived assets, which include property and equipment and amortizable intangible assets, whenever events or circumstances indicate that the carrying amount of an asset may not be recoverable. Recoverability of an asset is measured by a comparison of the carrying amount of an asset group to the estimated undiscounted future cash flows expected to be generated by the asset. If the carrying amount of the asset group exceeds its estimated undiscounted future cash flows, an impairment charge is recognized as the amount by which the carrying amount of the asset exceeds the fair value of the asset. There were no impairment charges recorded on long-lived assets during the Predecessor 2014 Period, the Successor 2014 Period or the years ended December 31, 2015 or 2016.
Goodwill and indefinite-lived intangibles have been assigned to our reporting units for purposes of impairment testing. Historically we had a single reporting unit for the purpose of performing our goodwill impairment test. During the third quarter of 2015, we made structural and reporting changes to our internal organization. This reorganization aligned the internal management and functional support around our primary sales channels, which report into the chief operating decision maker. These changes resulted in the identification of three reporting units that met the definition in ASC 350, Intangibles—Goodwill and Other, of components of the Company’s one operating segment: (i) retail customers; (ii) e.l.f. stores; and (iii) e-commerce. In accordance with ASC 350, on October 1, 2015, we reallocated the goodwill to the three reporting units using a relative fair value approach. As a result of the internal reorganization, we performed a quantitative goodwill impairment test immediately before and a quantitative goodwill impairment test immediately after this change in reporting units and noted no indication of impairment.
The goodwill impairment test consists of a comparison of each reporting unit’s fair value to its carrying value. The fair value of a reporting unit is an estimate of the amount for which the unit as a whole could be sold in a current transaction between willing parties. If the carrying value of a reporting unit exceeds its fair value, goodwill is written down to its implied fair value. Fair value of a reporting unit is estimated based on a combination of comparative market multiples and discounted cash flow valuation approaches. We are also permitted to make a qualitative assessment of whether it is more likely than not that the fair value of a reporting unit is less than its carrying value prior to applying the quantitative assessment. If based on our qualitative assessment it is more likely than not that the carrying value of the reporting unit is less than its fair value, then a quantitative assessment may be required.
We evaluate our indefinite-lived intangible asset to determine whether current events and circumstances continue to support an indefinite useful life. In addition, our indefinite-lived intangible asset is tested for impairment annually. The indefinite-lived intangible asset impairment test consists of a comparison of the fair value of each asset with its carrying value, with any excess of carrying value over fair value being recognized as an impairment loss. We are also permitted to make a qualitative assessment of whether it is more likely than not that an indefinite-lived intangible asset’s fair value is less than its carrying value prior to applying the quantitative assessment. If based on our qualitative assessment it is more likely than not that the carrying value of the asset is less than its fair value, then a quantitative assessment may be required.
We have selected October 1 as the date on which to perform our annual impairment tests for goodwill. We also test for impairment whenever events or circumstances indicate that the fair value of such indefinite-lived intangible asset has been impaired. No impairment of goodwill or our indefinite-lived intangible asset was recorded during the Predecessor 2014 Period, the Successor 2014 Period or the years ended December 31, 2015 or 2016 and the fair value of each reporting unit is substantially in excess of its carrying value.
56
Table of Contents
Stock-based compensation
Stock-based compensation cost is measured at grant date, based on the fair value of the award, and is recognized on a straight-line method over the requisite service period for all awards that vest. We estimate the fair value of employee stock-based payment awards subject to only a service condition on the date of grant using the Black-Scholes valuation model. The Black-Scholes model requires the use of highly subjective and complex assumptions, including the option’s expected term and the price volatility of the underlying stock. We estimate the fair value of employee stock-based payment awards subject to both a market condition and the occurrence of a performance condition on the date of grant using a Monte Carlo simulation model that assumes the performance criteria will be met and the target payout levels will be achieved.
Forfeitures were previously estimated at the time of grant and revised, if necessary, in subsequent periods if actual forfeitures differed from those estimates. We early adopted Accounting Standards Update (“ASU”) 2016-09, Improvements to Employee Share-Based Payment Accounting and, effective January 1, 2016, we now account for forfeitures as they occur. We recorded a cumulative-effect adjustment to retained earnings, which was not material, upon early adoption.
We recognize compensation expense for awards with only a service condition on a straight-line basis over the requisite service period, which is generally the award’s vesting period. Vesting of these awards was accelerated for certain employees upon the closing of our initial public offering. Compensation expense for employee stock-based awards whose vesting is subject to the fulfillment of both a market condition and the occurrence of a performance condition is recognized on a graded-vesting basis at the time the achievement of the performance condition becomes probable.
The expected stock price volatility for the common stock was estimated by taking the average historic price volatility for industry peers based on daily price observations over a period equivalent to the expected term of the stock option grants. Industry peers consist of several public companies in our industry which are of similar size, complexity and stage of development. The risk-free interest rate for the expected term of the option is based on the U.S. Treasury implied yield at the date of grant. The weighted-average expected term is determined with reference to historical exercise and post-vesting cancellation experience and the vesting period and contractual term of the awards.
Prior to our initial public offering, the fair value of shares of common stock underlying the stock options was determined by our board of directors, with input from management. Because there was no public market for our common stock, the board of directors determined the fair value of common stock at the time of grant by considering a number of objective and subjective factors including independent third-party valuations of our common stock, operating and financial performance, the lack of liquidity of our capital stock and general and industry specific economic outlook, among other factors. For awards granted after our initial public offering, the fair value of our common stock is based on the closing price of our common stock as reported on the date of grant.
Certain management-level employees and directors are permitted to exercise unvested options prior to vesting (“early exercise”). In the event of termination of the option holder’s employment or directorship, all unvested shares issued upon the early exercise, so long as they remain unvested, are subject to repurchase by the Company at the lower of the original exercise price or the fair market value of a share of common stock on the date of termination. Early exercises are not considered substantive exercises for accounting purposes. Cash received for the exercise of unvested options is recorded as a liability, which is released to additional paid-in capital at each reporting date as the shares vest.
We have no current plans to pay a regular dividend.
New accounting pronouncements
See Note 2 to the Notes to consolidated financial statements included elsewhere in this prospectus for information regarding new accounting pronouncements.
JOBS Act
We qualify as an emerging growth company pursuant to the provisions of the JOBS Act. Section 107 of the JOBS Act provides that an emerging growth company can take advantage of the extended transition period provided in Section 7(a)(2)(B) of the Securities Act for complying with new or revised accounting standards. We have opted out of the extended transition period with respect to new or revised accounting standards and, as a result, we comply with any such new or revised accounting standards on the relevant dates on which adoption of such standards is required for non-emerging growth companies.
57
Table of Contents
Quantitative and qualitative disclosures about market risk
We are exposed to certain market risks arising from transactions in the normal course of our business. Such risk is principally associated with interest rates and foreign exchange.
Interest rate risk
We are exposed to changes in interest rates because the indebtedness incurred under our Senior Secured Credit Facility is variable rate debt. Interest rate changes generally do not affect the market value of our Senior Secured Credit Facility; however, they do affect the amount of our interest payments and, therefore, our future earnings and cash flows. As of December 31, 2016, we had variable rate debt of $162.6 million under our Senior Secured Credit Facility. A hypothetical interest rate increase of 1% would result in an approximately $1.7 million increase in interest expense on an annualized basis.
Foreign exchange risk
We are exposed to foreign exchange risk as we have contracts with suppliers in China for future purchases of inventories denominated in RMB. We do not have an active hedging program, and all of our legacy exchange rate forward contracts matured in 2016. We neither used these foreign currency forward contracts for trading purposes nor did we follow hedge accounting, and therefore the periodic impact of these legacy hedging activities was calculated on a mark-to-market basis. Accordingly, the foreign currency forward contracts were carried at their fair value either as an asset or liability on the consolidated balance sheet with changes in fair value being recorded in other income (expense), net in our consolidated statements of operations.
Foreign currency translation exposure from a 10% movement of currency exchange rates would have a material impact on our reported cost of sales and net income. Based on a hypothetical 10% adverse movement in RMB, our cost of sales and net income would be adversely affected by approximately $10.1 million (excluding any offsetting positive impact from our historical hedging programs), although the actual effects may differ materially from the hypothetical analysis.
58
Table of Contents

e.l.f.: Changing the face of beauty
We are one of the fastest growing, most innovative cosmetics companies in the United States. Driven by our mission to make luxurious beauty accessible for all women to play beautifully, we have challenged the traditional belief that quality cosmetics are only available at high prices in select channels. e.l.f. offers high-quality, prestige-inspired beauty products for eyes, lips and face at extraordinary value, with the majority of our items retailing for $6 or less. Our price points encourage trial and experimentation, while our commitment to quality and a differentiated consumer engagement model engender loyalty among a passionate and vocal group of consumers.
We believe our success is rooted in our innovation process and ability to build direct consumer relationships. Born as an e-commerce company over a decade ago, we have created a modern consumer engagement and responsive innovation model that keeps our products on-trend and our consumers engaged as brand ambassadors. Our consumers provide us with real-time feedback through reviews and social media, which enables us to refine and augment our product portfolio in response to their needs. We leverage our fast-cycle product development and asset-light supply chain to launch high-quality products in as few as 20 weeks from concept, and 27 weeks on average. Our products are first launched on elfcosmetics.com, and distribution is generally only broadened to our retail customers after we receive strong consumer validation online. We believe this has led to our consistently strong productivity. We are one of the fastest growing brands at Target and Walmart.
Our brand appeals to some of the most sought after consumers in the category. We believe the combination of our affordable price points and on-trend, innovative product assortment encourages trial, offers a strong value proposition and appeals to a broad base of consumers. Relative to the overall cosmetics category, our brand over-indexes with Millennials, multi-cultural consumers and some of the heaviest users in the category. This attractive and loyal consumer base supports high sales per linear foot and higher category sales for our retail customers. By combining our strong relationships with leading retailers with integrated consumer engagement across our e.l.f. stores, e-commerce and social media, we are a true multi-channel brand.
Our net sales growth in the United States from 2012 to 2015 was 20 times that of the mass cosmetics category on average. Our net sales still only represented 2.3% of the $8 billion U.S. mass cosmetics category in 2015. Our net sales grew from $191.4 million in the year ended December 31, 2015 to $229.6 million in the year ended December 31, 2016, and, over the same period, our Adjusted EBITDA grew from $46.2 million to $53.8 million, representing an increase of 20% and 16%, respectively. Over the same period, net income grew from $4.4 million to $5.3 million. In 2016, our Adjusted EBITDA margin was 23% and our net income margin was 2%.2
59
Table of Contents
| 2 | Adjusted EBITDA and Adjusted EBITDA margin are not measurements of financial performance under GAAP. See “Summary consolidated financial data” for a discussion of Adjusted EBITDA, Adjusted EBITDA margin and their respective limitations and reconciliations to GAAP measures. |
Our history
We were founded in 2004 by father-son entrepreneurs Alan and Joey Shamah. Having spent over 30 collective years in the apparel business, they noted the changes being driven by the advent of “fast-fashion” players. They believed that a similar opportunity existed in cosmetics, where the traditional beauty model of high prices, long product cycles and traditional advertising was out of touch with changing consumer behavior. Utilizing sourcing relationships in China, they rapidly created prestige-inspired products at an affordable price. Bypassing traditional channels, they connected directly with consumers and launched elfcosmetics.com, where the first products sold for $1 each.
From those early days onward, we sought to delight our consumers with luxurious beauty at an extraordinary value. Our affordable, on-trend offering coupled with our direct approach resonated with young, diverse makeup enthusiasts, who became loyal e.l.f. consumers and helped build the brand through digital engagement and strong word of mouth. We spent the first few years nurturing this small and loyal consumer base. We grew virally and by 2006 found ourselves with a few hundred thousand orders and a vibrant community that valued our quality, affordable prices and honest approach.
Consumers told us what they did and did not like, as well as what other products they wanted to see from the brand. And we listened. We established deep, genuine connections with our consumers as they informed, inspired and motivated us. We broadened our assortment and expanded our price range up to $6 while staying true to our promise to provide extraordinary value relative to comparable prestige products. e.l.f. brought a degree of sophistication that was not present at these price points, and the industry took note—we won our first Allure Best of Beauty award in 2008 for our Shimmering Facial Whip, building credibility behind our promise of affordable, luxurious beauty.
In 2008, Target, a key beauty destination for many consumers, decided to test e.l.f. in its stores. Once at Target, we brought incremental sales to Target’s cosmetic category and the highest sales per linear foot across the entire cosmetics department. We believe the Target guest appreciated not having to choose between quality and affordable prices, and the e.l.f. cosmetics brand has exhibited strong sales growth in this account ever since. Over the next several years, we nurtured our vibrant community and expanded our distribution to other leading retailers such as Walmart. We gained chain-wide distribution in Target stores in 2013 and in that same year, we opened our first e.l.f. store to add another dimension to the brand experience and further bring our mission of accessible beauty to life.
In January 2014, TPG Growth, a leading global private equity firm, acquired a controlling interest in e.l.f. to further scale and transform the company. Concurrent with the acquisition, Tarang Amin was appointed as CEO. The objective was to grow the business by enhancing the management team, building the e.l.f. brand, driving industry-leading innovation, expanding distribution and improving operational efficiency.
Over the past three years, we have made significant investments in our business by adding top talent and building our functional capabilities. We have developed strong consumer relationships and a new brand strategy behind play beautifully; accelerated our first-to-mass innovation capability, including our first category adjacency in skin care; expanded our distribution to approximately 19,000 retail stores, including Walmart, CVS and Old Navy; and significantly strengthened our operations, including transforming our China team and supplier base to deliver even higher quality. Our efforts have made
60
Table of Contents
e.l.f. one of the fastest-growing cosmetics companies in the United States. Women’s Wear Daily, a leading beauty industry publication, awarded e.l.f. Mass Brand of the Year in 2014 in recognition of our strong growth and impact on the overall cosmetics industry.
We are proud of the progress we have made to date and believe that we are in the early stages of brand development with significant room to grow. Many of the traditional brands in cosmetics have been in business 50 to 100 years. We are still building our brand and customer base and will continue to seek to shift industry paradigms. We aim to make the world a place where women can play beautifully every day.
Our mission

Every word of this mission is meaningful to us. We believe that women should not have to choose between quality and price, so we take great pride in making prestige-inspired cosmetics accessible to all women. We understand our consumers and their desire to do more than look good. We share in their joy of makeup and strive to deliver them the beauty experience they desire. Our mission to play beautifully fosters a deep, authentic connection with our consumer.
Play beautifully is more than a trademarked slogan. It is an invitation to celebrate our consumer’s love of makeup, passion to explore new products and techniques, and desire to look and feel beautiful every day. From natural to classic to bold, e.l.f. gives our consumers endless possibilities so that they can have fun creating the looks they want.
The cosmetics industry is large and attractive
We believe that the cosmetics category is highly attractive given its scale, growth dynamics and consumer demand trends. The U.S. and global cosmetics markets generated $14 billion and $57 billion, respectively, of retail sales in 2015. The cosmetics category primarily consists of face makeup, eye makeup, lip products, nail products and cosmetics sets/kits and excludes beauty tools and accessories such as brushes and applicators.
| • | Face makeup. Face makeup products include BB/CC creams, blush, bronzer and highlighter, foundation, concealer and powder. Estimated U.S. retail sales of face makeup were $5 billion in 2015. |
61
Table of Contents
| • | Eye makeup. Eye makeup products include eyeliner/pencil, eye shadow and mascara. Estimated U.S. retail sales of eye makeup were $4 billion in 2015. |
| • | Lip products. Lip products include lip gloss, lip liner/pencil and lipstick. Estimated U.S. retail sales of lip products were $3 billion in 2015. |
| • | Nail products. Nail products include nail polish, nail treatments/strengthener and nail polish remover. Estimated U.S. retail sales of nail products were $1 billion in 2015. |
| • | Cosmetics sets/kits. Cosmetics sets/kits include multiple cosmetics items of the same brand line packaged together in a set and priced at an advantageous price compared to purchasing the items separately. Estimated U.S. retail sales of cosmetics sets/kits were $1 billion in 2015. |
The following chart illustrates cosmetics sales in the United States by product type in 2015:
U.S. Cosmetics Retail Sales by Product 2015
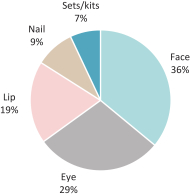
Source: Euromonitor International Limited
The cosmetics category has experienced strong growth both in the United States and globally. In the United States, retail sales increased from $11 billion in 2010 to $14 billion in 2015, representing a CAGR of 5%, with each product category driving growth. Globally, retail sales increased from $43 billion in 2010 to $57 billion in 2015, representing a CAGR of 5%. Drivers of growth include innovation and new product launches, which span from new formulations that enhance performance, feel and fragrance, to new colors, delivery forms and packaging.
Cosmetics appeal broadly to women of all ages and ethnic groups, with penetration reaching 82% of U.S. women in 2014. Given the importance of cosmetics in a woman’s daily regimen and the availability of products across price points, the category has demonstrated resiliency through economic cycles. For example, during the most recent recessionary period of 2008 to 2009, the cosmetics category remained stable while broader gross domestic product declined 3%. We expect cosmetics to continue to be among the fastest growing and most consistent consumer categories.
Channels
Cosmetics are broadly sold through food, drug and mass channels, which accounted for 46% of U.S. cosmetics retail sales in 2015. Cosmetics are also distributed through department stores and direct and specialty channels accounting for 27%, 20% and 7% of retail sales, respectively, in 2015. The following chart illustrates cosmetics retail sales in the United States by channel in 2015:
62
Table of Contents
U.S. Cosmetics Retail Sales by Channel 2015
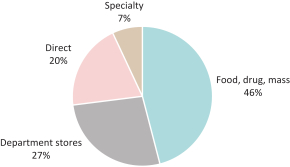
Source: Euromonitor International Limited data, Company channel definitions
FDM stores are typically considered to be the mass channel and include a diverse set of retailers, including grocery retailers such as Kroger, drug retailers such as CVS and mass merchandisers such as Target and Walmart. This channel is a key beauty destination for many consumers that seek affordable cosmetics and find that the large store footprints and multi-category offerings provide added convenience. From 2010 to 2015, cosmetics retail sales in FDM stores grew at a 4% CAGR.
Department stores typically utilize an assisted sales model for selling prestige cosmetics: products are stored in locked cabinets and consumers must ask a store associate to hand them products they would like to purchase. In this channel, store associates are able to provide beauty advice, product recommendations and facilitate product trial. From 2010 to 2015, cosmetics retail sales in department stores grew at a 7% CAGR.
The specialty channel includes multi-brand beauty retailers such as Sephora and Ulta. The cosmetics specialty channel also includes mono-brand beauty retailers such as e.l.f., Benefit Cosmetics and MAC Cosmetics. While beauty specialty retailers utilize an open sell model in which consumers are able to directly select product from shelves, stores are also staffed by sales associates who are able to provide advice, recommendations and promote product trial. In addition, many also offer salon services such as brow bars and spa services such as facials. Some specialty retailers in apparel and other segments, such as Old Navy, also offer cosmetics. From 2010 to 2015, cosmetics retail sales in specialty channels grew at a 3% CAGR.
The direct channel includes e-commerce, home shopping and direct selling. e-commerce sales accounted for 10% of the U.S. cosmetics market in 2015. From 2010 to 2015, while retail sales in the direct channel grew at a 6% CAGR, e-commerce sales grew at a 15% CAGR, three times the rate of the broader cosmetics category. We believe that beauty bloggers, social media and other online content enable consumers to be educated about cosmetics online and that growth rates in this channel will continue to outpace the broader category.
e.l.f. participates in the FDM, specialty and direct channels and has a strong track record of delivering above category average growth.
Market segments
In the United States, the cosmetics category traditionally has been separated into two discrete segments—prestige and mass—which generally represent higher and lower price points and are associated with certain channels. The following chart illustrates cosmetics sales in the United States by market segment in 2015:
U.S. Cosmetics Retail Sales by Segment 2015
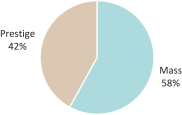
Source: Euromonitor International Limited
63
Table of Contents
Prestige products, which accounted for 42% of U.S. cosmetics retail sales in 2015, are characterized by higher price points and are typically sold in department stores and in high-end specialty stores such as Sephora. They have historically been at the forefront of quality and innovation in the category but remain too expensive for many consumers in the United States, where the average disposable personal income is less than $15,000. From 2010 to 2015, retail sales in the prestige segment grew at a 9% CAGR.
Mass products, which generated 58% of 2015 U.S. cosmetics retail sales, are more affordable than their prestige counterparts but generally have not delivered the same level of quality or innovation. They are more broadly available than prestige products given their presence in FDM and direct channels. From 2010 to 2015, retail sales in the mass segment grew at a 3% CAGR.
We believe that a paradigm shift has occurred in cosmetics: today’s cosmetics consumer is increasingly connected and informed, and purchasing decisions are often influenced by friends, beauty bloggers, social media and other online content. These sources provide consumers easy access to a breadth and depth of information formerly only available from beauty experts in assisted sales environments. The growth of specialty retailers like Ulta that carry both mass and prestige products has blurred the lines between segments and influenced consumers’ perceptions of each. As a result, consumers have shown a propensity to seek the most innovative products across prestige and mass to maximize their experience and budget.
Competitive landscape
The cosmetics industry is relatively concentrated. In 2015, over 60% of cosmetics retail sales in the United States were generated by brands owned by L’Oreal S.A., The Estee Lauder Companies Inc., The Procter & Gamble Company, Revlon Inc., and Shiseido Company, Limited. These large multinational companies own many brands across mass and prestige cosmetics. Of the nearly 30 cosmetics brands with retail sales exceeding $100 million in the United States in 2015, e.l.f. is one of only four that are independent. In addition to the traditional brands against which we compete, small independent companies continue to enter the market with new brands and customized product offerings. At less than 1% of total cosmetics retail sales based on 2015 industry data, there is low private-label penetration in this highly branded category.
Among other areas, we believe that we compete against other cosmetics brands on price, quality of products and packaging, perceived value, innovation, in-store presence and visibility, and e-commerce and mobile commerce initiatives. e.l.f.’s share of the U.S. mass cosmetics market was 2.3% in 2015, ranking us as the eighth largest mass cosmetics brand in the United States excluding brands primarily focused on nails.
In 2015, e.l.f.’s retail sales grew at 43%, which is almost five times faster than the next fastest top-10 mass cosmetics brand based on size, excluding brands primarily focused on nails, as illustrated by the chart below:
2015 Sales Growth for Top 10 U.S. Mass Cosmetics Brands Based on Size(1)
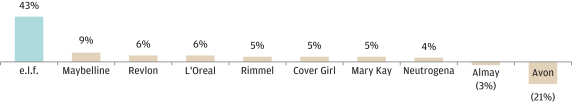
Source: e.l.f. retail sales growth rate per Nielsen and e.l.f. internal data; other brands retail sales growth rates per Euromonitor
| (1) | Excludes Sally Hansen, which is primarily a nail brand. |
Our strategic differentiation: how e.l.f. helps women to play beautifully
We are driven by what today’s cosmetics consumer wants—an assortment of high-quality, prestige-inspired cosmetics at extraordinary value. We do not define ourselves as strictly mass or prestige, or limit our product availability to select channels. Through our modern consumer engagement and responsive innovation model, we interact with our consumers instead of broadcasting at them. This allows us to stay in tune with their needs and build trust and loyalty. Our business model has multiple areas of competitive advantage:
64
Table of Contents

Authentic brand that attracts some of the best consumers in the category
e.l.f. was founded to fill the gap between high-priced prestige beauty products and less innovative mass products. For over a decade, we have prioritized getting to know our consumers, and they in turn have provided us with valuable feedback, enabling us to address this gap and build e.l.f. into an authentic and trusted brand. By providing a comprehensive experience—from integrated engagement online, through social media and in our stores to our differentiated product offerings—we have drawn a strong following among the most sought after and heaviest users of cosmetic products.
One of our greatest strengths is the consumer that we attract. We appeal to a broad base of beauty consumers from experts to novices who enjoy experimenting with makeup. Many traditional brands have rapidly aging user bases. In contrast, we have strong appeal with Millennials and Hispanics, two of the fastest growing demographic groups in the United States.
Cosmetics Industry Consumers* – Age and Ethnicity
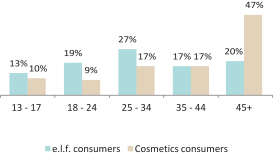
|
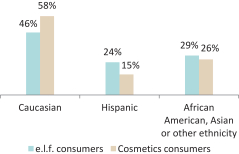
| |
| Source: Calimesa Consulting Partners, LLC (2015); MetrixLab (2015) | Source: Third-party study commissioned by our Sponsor (2013) | |
| * Includes mass and prestige cosmetics | ||
Consumer-centric and efficient marketing model
We believe that modern cosmetics consumers are fundamentally different than generations of women before them and are not as engaged by the broad-scale marketing and advertising tactics used by many traditional beauty companies. In 2014, over $2 billion was spent on U.S. beauty advertising according to Nielsen, including many print media and TV campaigns highlighting celebrities and supermodels as brand advocates. In contrast, e.l.f. has deployed a low-cost, consumer-centric marketing model. Total expenses for advertising and promotions in 2016 were $5.6 million, less than 3% of our net sales. This compares to an average of over 20% of net sales for the top five global cosmetics companies from both the mass and prestige segments by net sales in their last fiscal year according to their public filings with the SEC or equivalent international regulatory agency.
65
Table of Contents
Our consumers have been our best advocates, growing the e.l.f. brand virally through strong word of mouth. Many are very active in social media, write reviews of our products online and generate content on YouTube and other social media outlets. We have the #1 mass cosmetics brand e-commerce site with over 25 million visitors a year and possess a social media following on Instagram, Facebook and YouTube that rivals the larger cosmetics brands. elfcosmetics.com reflects our passionate consumer base with over 100,000 ratings. Over the past three years, we have received 18 times more reviews than the industry average. Consumers also love our high-quality, innovative products, with a majority of 2016 reviews being 5 stars, the highest rating. Our digital content—including images, text, and video—inspires our fans with looks and products they love and avoids common industry messaging that beauty is about perfection. We feature e.l.f. consumers as our stars, and reinforce our promise to make luxurious beauty accessible.
High-quality cosmetics at an extraordinary value enabled by flexible, asset-light operations
e.l.f. consumers recognize our ability to provide a broad assortment of high-quality products at an extraordinary value. The majority of our items retail for $6 or less, providing a low-risk way for consumers to try new products. Examples of our high-quality and extraordinary value innovations include e.l.f. Mineral Infused Face Primer at $6 versus a prestige primer at $36, e.l.f. Mad for Matte Eyeshadow Palette Trio at $10 versus a prestige eyeshadow at $36, the e.l.f. Contouring Brush at $6 versus a similar type of brush at $35 and e.l.f. Lip Exfoliator at $3 versus a similar type of lip treatment at $24. From formulation to package design, our products deliver quality and innovation at a fraction of prestige prices, facilitating frequent consumer purchasing and experimentation without the guilt of overspending.
Our low price points are supported by our ability to source low cost, high-quality cosmetics quickly. As of December 31, 2016, we had 53 e.l.f. professionals involved in sourcing, quality and innovation. We have longtime relationships with strategic vendors that pair a strong quality orientation with the ability to execute rapidly. Our supply chain is built for growth with asset-light operations, ample capacity and low capital requirements. This capability and commitment to an agile supply chain allows us to introduce a stream of on-trend innovation.
All e.l.f. products are hypoallergenic and non-comedogenic. We do not test on animals or endorse such practices, nor do we use ingredients that are tested on animals. We have been designated as being a “cruelty-free” company by People for the Ethical Treatment of Animals.
Our portfolio spans the eyes, lips, face, kits, tools and skin care categories. Our largest product categories, face makeup and eye makeup, accounted for 45% and 31%, respectively, of our sales of cosmetics in 2016, which excludes tools and skin care. Face makeup and eye makeup accounted for 36% and 29%, respectively, of the U.S. cosmetics category retail sales in 2015.

Eye makeup. Eye makeup accounted for 31% of our sales in 2016, excluding tools and skin care. Eye makeup is a segment where our consumers truly have an opportunity to play and experiment. Our breadth of accessible, high-quality eye makeup includes eyeshadow, eyeliner, mascara and eyelashes, and eyebrow grooming products. We offer everything from the basics to must-have items for capturing the season’s latest looks. Our top-rated eye cosmetic products include our best-selling Mad for Matte Eyeshadow Palette with 10 matte shades that consumers can use to customize a multitude of looks, our e.l.f. Eyebrow Kit and e.l.f. Intense Ink Eyeliner. We currently offer eye makeup products with retail prices from $1 to $10.
66
Table of Contents

Lip makeup. Lip makeup accounted for 14% of our sales in 2016, excluding tools and skin care. We offer a wide assortment of color and non-color lip products that delight our consumers. Our lip colors are made with nourishing ingredients in a range of finishes and forms, including lipsticks, glosses and liners. Our Matte Lip Color and Moisturizing Lipsticks offer deep, pigmented color for $3 and are consistent top sellers. We also offer lip care products like our e.l.f. Lip Exfoliator that gently exfoliates lips prior to makeup application. Overall, our lip products have retail prices from $1 to $8.

Face makeup. Face makeup accounted for 45% of our sales in 2016, excluding tools and skin care. Our consumers use a variety of products to achieve their desired look. Their multi-step regimen often involves products from a base primer layer to finishing and highlighting powders. Our high-quality face makeup line includes a breadth of complexion essentials our consumers can use to prime their skin, conceal imperfections and smooth, sculpt, highlight and define a look. We currently offer foundation, primer, blush, powder, concealer, bronzer, tinted moisturizer, shimmer, bronzers and luminizers that retail from $1 to $10. Consumer favorites include the top-rated e.l.f. Blush Palette and e.l.f. Mineral Infused Face Primer.
67
Table of Contents

Kits. Kits accounted for 10% of our sales in 2016, excluding tools and skin care. In addition to purchasing our products individually, our consumers may opt to try our sets, kits and palettes, which encourage them to try a complete look and provide greater variety at exceptional value. We also provide special kits during the holiday season that enable consumers to gift their favorite e.l.f. products. These kits also give national retailers an opportunity to prominently display e.l.f.

Beauty tools. We sell a broad range of prestige-inspired makeup brushes, tools and accessories that enable our consumers to perfect the technique and look they desire. Within tools, many of our brushes are top sellers, including our e.l.f. 11 Piece Brush Collection for $30 and our e.l.f. Contouring Brush for $6. Our tools are highly complementary to our eye, lip and face makeup and round out what our consumers need to play beautifully. We currently offer beauty tools, including brush sets, with retail prices ranging from $1 to $50.
68
Table of Contents

Skin care. In late 2015, we launched our skin care line. Inspired by global and prestige trends, e.l.f. skin care provides the consumer with a luxurious beauty experience – high-quality formulas with prestige-like componentry and packaging, all at an extraordinary value. Our skin care assortment offers a regimen of hydration-focused products and includes moisturizers, cleansers, eye and night creams, masks, an exfoliating scrub and a serum. Leveraging our historical success with tools, we also offer skin care-specific brushes. Within the first year of our skin care launch, the e.l.f. Daily Hydration Moisturizer received an Allure Best of Beauty award. Our skin care products have a retail price range between $3 and $14.

Fast-cycle innovation and validation model
We believe innovation is key to our success and that we are a leader in the industry in speed and new product introductions. We have built an innovation capability that can progress a new e.l.f. beauty product from concept to online launch in as few as 20 weeks from concept, and 27 weeks on average. In 2016, this capability allowed us to introduce over 90 new items across eyes, lips, face, tools, kits and skin care, and in 2015 40% of our retail sales came from products launched from 2012 to 2015 based on data from Nielsen.
69
Table of Contents
We leverage multiple sources of inspiration to develop our new product ideas, including global trend assessments, supplier and industry research, strategic customer input and consumer feedback and insights. Our innovation strategy is underpinned by three key pillars to delight consumers:
| • | First-to-mass. “First-to-mass” products are inspired by trends in prestige beauty that we bring to the mass market. As consumers are increasingly savvy and knowledgeable about trends in the prestige market, they look for how they can achieve on-trend looks, but at an accessible price. In the past ten years, we have introduced over 90 first to mass items. Examples include the e.l.f. Mineral Infused Face Primer at $6 versus a prestige primer at $36, e.l.f. Mad for Matte Eyeshadow Palette at $10 versus a prestige eyeshadow palette at $36, the e.l.f. Contouring Brush at $6 versus a similar type of brush at $35 and the e.l.f. Lip Exfoliator at $3 versus a similar type of lip treatment at $24. |
| • | Core expansion. Core expansion items are those trend-inspired products across eyes, lips, face and tools that augment our assortment and deliver extraordinary value across price points. We consistently evaluate our core eyes, lips, face and tools offerings and develop new items based on category trends, consumer feedback and other market intelligence. We had over 60 new core item launches in 2016, including Day to Night Lipstick Duo at $5, Shimmer Highlighting Powder at $6, Nude Rose Gold Eyeshadow Palette at $10 and Highlighting Brush at $3. |
| • | Adjacencies. We believe that we can reapply our model to launch products into adjacent categories. We recently entered the skin care category with a high-quality skin care product assortment priced at just $3 to $14. Inspired by global and prestige trends, e.l.f. skin care provides the consumer with a luxurious beauty experience – high-quality formulas with prestige-like componentry and packaging, all at an extraordinary value. |
When we launch a new e.l.f. beauty product online, we leverage our unique community of digitally engaged consumers. With over 25 million visits per year and over 100,000 online reviews, elfcosmetics.com is a vehicle for refining products and determining best sellers. We are able to analyze sales results, reviews and feedback through social media to provide a quick indication of a product’s performance. We use this valuable data to introduce validated, best-selling products to retail, which drives leading performance relative to others in the category. Not only does this fast, high-output, testing methodology result in leading performance in retail, it also contributes to building our consumer relationships. Our consumers are part of the process, and know that their feedback is valuable and impacts the brand. We believe our active dialogue with our consumers provides us with a highly differentiated perspective on innovation and informs the launch, validation and refinement of our products.
Unlike many cosmetics companies that launch products in concert with the timing of when retailers rearrange or restock products, we leverage our multi-channel model to launch products throughout the year and test them online and in e.l.f. stores. Distribution is generally only broadened to our retail customers after we receive strong consumer validation in those channels, leading to strong productivity and year-over-year comparable store sales growth. This focus on best sellers allows us to present retail customers with a broad portfolio of highly productive products with focused color assortments, which contrasts starkly with most cosmetics companies’ broad color assortments spread over fewer items.

70
Table of Contents
True multi-channel brand blurs the lines between mass and prestige
We are a true multi-channel brand with strength across e-commerce, national retailers and our e.l.f. stores. Our ability to engage our consumers across multiple touch points differentiates e.l.f. from traditional mass brands, which typically focus on one channel. We also leverage insights gained from each channel to drive performance across the business.
e-commerce. We have the #1 mass cosmetics brand e-commerce site with over 25 million visitors per year and 4 million cumulative transactions representing over 50 million units. elfcosmetics.com also has the highest revenue, traffic, time spent on-site and units per transaction of any mass cosmetics brand website. Our e-commerce business serves as a strong source of sales and an important component of our engagement and innovation model. We have nurtured a loyal, highly active online community for over a decade. Our foundation as an e-commerce company and our digital engagement model drive high conversion on elfcosmetics.com, where we sell our full product offering of over 1,000 SKUs. Offering a dynamic platform for consumers to play beautifully, elfcosmetics.com reflects our passionate consumer base with its more than 100,000 ratings. Over the past three years, we have received 18 times more reviews than the industry average.
National retailers. We currently sell our products in approximately 19,000 retail stores in the United States in the mass, drug store, food, and specialty retail channels. We are one of the fastest growing cosmetics brands at Target and Walmart. e.l.f. offers retailers a compelling retailer value proposition driven by four key factors:
| • | Highly sought after consumers. One of our greatest strengths is the consumer that we attract. We appeal to a broad base of beauty consumers—from experts to novices who enjoy experimenting with makeup—and have drawn a strong following among the most sought after and heaviest users of cosmetic products. Many traditional brands have rapidly aging user bases. In contrast, we have strong appeal with Millennials and Hispanics, two of the fastest growing demographic groups in the United States. |
| • | Innovation. The key drivers of growth in the cosmetics industry are innovation and new product launches, and we have a track record of bringing prestige-inspired innovation quickly to the mass channel. We have built an innovation capability that can progress a new e.l.f. beauty product from concept to online launch in as few as 20 weeks and 27 weeks on average. Our new on-trend products attract consumers to our retail customers’ stores and drive increased sales from consumers wanting to experience these trending products. |
| • | Highly incremental sales. Most new brands entering a category capture the majority of their sales from existing brands instead of adding new sales to the category. By contrast, e.l.f. has proven its ability to deliver incremental category sales across a range of retail formats. A controlled store test at a national retailer completed in February 2015 highlighted that over 50% of e.l.f.’s sales were incremental to the key product categories upon introduction of e.l.f. products at the retailer, as opposed to diverting sales from another brand on the shelf. |
71
Table of Contents
% of e.l.f. Sales Incremental to Select Cosmetics Product Categories
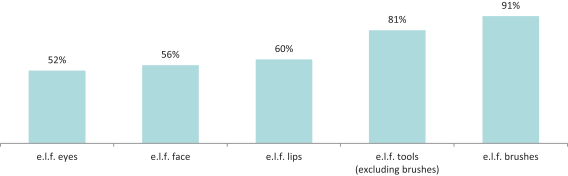
Source: e.l.f. point of sale data from a national retailer’s internal data from November 2014 to February 2015
| • | High productivity. From a productivity standpoint, we stand out in comparison to other brands in the category on both a dollar sales and unit sales basis. The chart below illustrates our productivity at one of our largest retail customers. |
Brand Productivity Per Linear Foot Per Week at a National Retailer
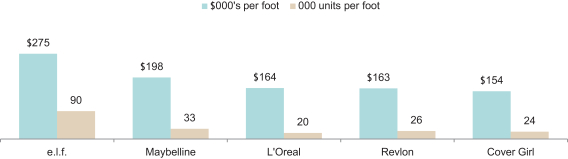
Source: U.S. cosmetics retail sales per Nielsen XAOC including C-Stores database for a national retailer for the 52 weeks ended February 19, 2016 and linear feet per Retail Merchandising Services, Inc. data
Our top 10 retail customers represented 72% of our net sales in 2016. Our largest retail customers, Walmart and Target, accounted for 30% and 28%, respectively, of our net sales in 2016.
Target is our longest-standing national retail customer and a key beauty destination for many consumers. At Target, we achieved double digit growth in retail sales from 2014 to 2015. e.l.f. is Target’s most productive cosmetics brand measured in sales per linear foot, and we have had full chain distribution in the United States since 2013. We have been steadily growing shelf space at Target and secured an increase in space in 2017.
At Walmart, the world’s largest retailer, we have outpaced cosmetics category growth and continue to earn additional space. Cosmetics is an important category for Walmart, with sales of over $2 billion in the United States in 2014. Similar to our experience at Target, we have been able to grow Walmart’s cosmetics category through incremental consumer purchases and strong productivity. As of December 31, 2016, e.l.f. products were sold in approximately 85% of Walmart’s U.S. stores. Given our strong productivity, we believe we have the opportunity to expand distribution to more stores as well as gain additional shelf space.
In the drug channel, CVS, the largest drug store chain in the United States, undertook a national roll-out of e.l.f. in 2015 based on strong test results. We are still in the early stages of both CVS and broader drug channel expansion. In the specialty channel, we have full chain distribution at Old Navy, and the brand continues to earn incremental space as a result of strong productivity.
e.l.f. stores. We were the first mass cosmetics brand with our own stores, a format historically limited to prestige brands. We believe our stores serve as one of our most effective and efficient vehicles for marketing and consumer engagement. e.l.f. stores showcase a broad assortment of e.l.f. products, create an environment dedicated to play beautifully, and allow us to test and validate new products. As of December 31, 2016, we had 16 e.l.f. stores in the New York metro area and three e.l.f. stores in Southern California.
72
Table of Contents
International. e.l.f. products are sold in a number of international markets. Similar to how we started in the United States, we believe we can introduce e.l.f. via an e-commerce platform to test new markets and expand our distribution based on the market-specific learnings we gather online. This approach, coupled with our rapid, low-cost innovation, provides flexibility and a strong foundation for growth in new and established markets abroad. We are focused on growing sales in three priority international markets: Canada, the United Kingdom and Mexico. We have also identified other attractive markets where we believe the e.l.f. brand can succeed, including Australia, Chile, France and Vietnam, among others. International sales accounted for 8% of net sales in 2016.
High-performance team and culture
Our CEO Tarang Amin joined us in January 2014, and under his leadership we have assembled a world-class management team that possesses an excellent track record of results and has successfully worked together for many years. During the team’s prior tenure at Schiff Nutrition (NYSE: SHF), the company grew in enterprise value from $190 million to $1.5 billion in less than two years and was acquired by Reckitt Benckiser (London Stock Exchange: RB). With strong backgrounds from The Clorox Company, The Procter & Gamble Company, L’Oreal S.A., Mary Kay Inc., TPG and other leading companies, our team has demonstrated skills in building brands, leading innovation, expanding distribution, making acquisitions and driving world-class operations. We operate with a high-performance team culture. We communicate with great candor and transparency in the spirit of helping the team succeed, make quick decisions and drive executional excellence. The combination of a talented team, strong culture and values and disciplined execution forms the foundation of our success.
Our values guide our behavior and set the tone for our high-performance team culture:

The e.l.f. growth strategy
We believe e.l.f. is one of the most disruptive brands in the cosmetics industry. We are in the early stages of development, with significant room to grow by converting more consumers to the brand, making e.l.f. products more widely available and offering more innovative products to our consumers. We expect the United States to be the largest source of our growth over the next few years and also see an opportunity to expand in select international markets. We also believe we have an opportunity to improve our margins through greater operating leverage and efficiency.
73
Table of Contents
We have made substantial investments over the last three years and believe we are well positioned for continued growth driven by four strategies:
| • | Build a great brand |
Draw new consumers to the brand. We have a loyal consumer following, as illustrated by our repeat purchase rates which are among the highest in the industry: according to a marketing study conducted in October 2015, 58% of our consumers purchase one or more additional products within 12 months of initial purchase. We believe we can significantly grow this following of passionate consumers from current levels. Increasing brand awareness is a major growth driver for our company, as it has historically led to strong trial and high repeat purchase rates. e.l.f. is still unknown to many women, with only 13% unaided and 70% aided awareness as of December 2016. In contrast, some traditional brands have unaided awareness over 45% and aided awareness over 90%. We plan to continue to drive awareness and draw consumers to the brand.
Encourage current consumers to use more e.l.f. products. Our consumers’ loyalty to the e.l.f. brand drives growth through increased usage of our products across categories and advocacy of our brand to other potential consumers. Many of our consumers regularly visit elfcosmetics.com, where in 2016 they bought approximately nine units per transaction on average. We have designed our product assortment to encourage cross-category purchases across eyes, lips, face, tools and skin care. We find that consumers often enter the brand through one of our lower priced items and then purchase other e.l.f. products across categories once they understand our extraordinary value proposition. Our consumers also seek out our innovation, buying new products both online and in stores. We believe that through sustained innovation and efficient marketing, we will increase the number of e.l.f. items our consumers purchase.
| • | Lead innovation |
Use innovation to drive sales and margin. We have a track record of bringing prestige-inspired innovation quickly to the mass channel. We expect to continue to leverage our rapid innovation and flexible supply chain to introduce new products across the eyes, lips, face and tools categories. We believe our innovation has also led consumers to purchase products at higher price points while still delivering an extraordinary value. Many consumers who first tried a $1 item have now migrated to $3 to $8 items, which often have higher margins than our less expensive products.
Expand into skin care and relevant adjacencies. We have successfully brought a prestige-like approach to mass cosmetics at extraordinary value. We believe there are opportunities to use this same approach in other beauty categories, leveraging our brand equity and relationship with e.l.f. enthusiasts to extend our brand into adjacent segments. One such category is skin care, which generated $16 billion in retail sales in the United States and $110 billion globally in 2015. We recently introduced a high-quality skin care line retailing for just $2 to $14 per product, a fraction of the price of prestige brands. We plan to capitalize on our innovation expertise to develop new products in other adjacent categories.
| • | Expand brand penetration |
Grow space allocation with our existing national retailers. We have significant potential upside in deepening distribution with our existing retailers by continuing to leverage our productivity, innovation and growth to win more shelf space. Even at our largest customers, e.l.f. has historically been in less than 6% of the space allocated to cosmetics despite having among the highest productivity in the category. While certain legacy cosmetics brands have an average of 15 to 18 feet of inline space in major retailers, e.l.f.’s average is approximately five feet. We believe that our strong performance will enable our shelf presence in our current retailers to become larger over time.
Increase number of new customers. We are one of the fastest growing cosmetics brands at Target and Walmart, and our growth rates and productivity are among the highest in the industry. We have major distribution whitespace, as we are currently in only approximately 19,000 national retail stores in the United States and believe there are thousands of additional stores available to us.
Grow our direct-to-consumer business. We plan to grow elfcosmetics.com by driving traffic and conversion. In addition, our e.l.f. stores have been highly productive and profitable. As of December 31, 2016, we operated 16 stores in the New York metro area and three stores in Southern California. We plan to selectively open more e.l.f. stores nationally in high-traffic areas.
Expand internationally. We operate in a number of countries outside the United States, which accounted for 8% of our net sales in 2016. Given the portability of the e.l.f. brand, we believe that we have a significant opportunity in international markets over the long term.
74
Table of Contents
| • | Drive world-class operations |
Leverage high-performance team culture and execution capability. We have made significant investments in our business over the past two years by hiring top talent and building functional capabilities. Our management team comes from leading consumer packaged goods companies and has experience implementing growth strategies and driving operational improvements. We believe what differentiates us from many traditional cosmetics companies is our ability to make fast decisions and execute with excellence. We believe we have a major speed-to-market advantage over many other companies and are highly responsive to retail customer and consumer needs. We will continue to leverage our executional excellence as we seek to become the preferred partner of our key customers.
Drive operating margins and efficiencies. We have built a low-cost, quality-oriented supply chain with ample capacity to support future growth. We intend to grow our margins by pursuing additional cost savings opportunities and enhancing our product mix through innovation. We also expect to benefit from operating leverage as we scale the business.
Operations
We have developed a scalable, asset-light supply chain centered on speed to market and high-quality at low costs. Our China-based sourcing, quality and innovation teams work with their U.S.-based counterparts to deliver ongoing product quality, innovation and cost savings.
Manufacturing process
Our manufacturing process centers on close collaboration with a network of third-party manufacturers in China. We believe what differentiates us is our ability to drive speed, quality and efficient production. We leverage high annual unit volumes with our suppliers to have them quickly produce small quantities of a new product so that we can launch online in as few as 20 weeks from concept and 27 weeks on average. These early sales provide us with validation data to determine which products to introduce at our national retail customers. Based on what we decide to scale up, we can provide higher, more reliable, longer-term volumes to our manufacturers. We find this process more efficient than making assumptions about what products will sell and being burdened with high levels of working capital.
Over the past three years, we have transformed our China team and supply network to drive even higher quality, while keeping our flexible and low cost structure. We have ample manufacturing capacity as well as back-up capability in the event that one or more suppliers cannot meet our needs. Our broad supply base gives us the ability to fulfill our product requirements and remain cost competitive.
Innovation
Leading innovation is one of our core strategies and is supported by strong research and development capabilities. We have built a team of both internal and external personnel that focuses on a broad range of innovation capabilities including product development, materials science, quality assurance and packaging. Our team delivers dozens of new products every year as well as improvements to our core line.
Our innovation approach is consumer driven. Our product development team works closely with marketing to identify consumer needs, trends and market opportunities. We use these insights to quickly develop and screen prototypes. We utilize elfcosmetics.com to validate our innovation through sales data and direct consumer feedback. This leads to a nimble process that delivers rapid output.
We are passionate about delivering high-quality products. Our in-house quality control, quality assurance and regulatory staff define product specifications and formulas. We partner with a network of third-party manufacturers for production. Product quality and performance is achieved by applying industry standard processes for ingredient integrity and manufacturing compliance. We supplement these processes with both internal and external stability and microbiological testing to monitor compliance with industry and country-specific regulations and standards.
Ingredients and packaging
We work closely with our suppliers on new product innovation and quality. Our innovation team creates our formulas and our suppliers produce to our specifications. We are not overly dependent on any single formula raw material. These raw materials are broadly available and have regular quality testing for ingredient integrity.
75
Table of Contents
e.l.f. team members create our component and secondary packaging specifications and source their production. We have multiple component and packaging suppliers in place with ample back-up capacity. Our co-packers purchase from our packaging suppliers at our pre-negotiated specifications and rates. This allows us to efficiently manage our packaging quality, capacity and cost.
Quality control
We have a comprehensive quality assurance program that gives us visibility into the quality of our products during the sourcing and production cycle. Our innovation team approves product samples and is on-site for initial production runs of new products. Our China-based quality team provides oversight through on-site inspections and audits of our third-party manufacturers as well as component and packaging suppliers. We periodically conduct comprehensive audits of all our suppliers and have an on-site scheduled presence at our primary suppliers, where we inspect and monitor finished and semi-finished product, raw materials, batch records and testing records. We also validate our manufacturers’ finished product testing results with third-party laboratory testing. In the spirit of continual improvement, we have frequent dialogue with our suppliers on quality assurance enhancements.
Warehousing, distribution and logistics
In early 2016, we opened a new distribution center in Ontario, California, to replace our previous distribution center in New Jersey. This facility supports multi-channel shipping, with the ability to pick and ship directly to e-commerce consumers, e.l.f. stores, national retail customers and international customers. We have also invested capital in scanning and conveying technology. Our facility is operated by a leading third-party logistics provider.
Seasonality
Our results of operations are subject to seasonal fluctuations, with net sales in the third and fourth fiscal quarters typically being higher than in the first and second fiscal quarters. The higher net sales in our third and fourth fiscal quarters are largely attributable to the increased levels of purchasing by retailers for the holiday season, and adverse events that occur during the third or fourth quarter could have a disproportionate effect on our results of operations for the entire fiscal year. As a result of higher sales during the third and fourth quarters, our working capital needs are greater during the second and third quarters of the fiscal year. For more information regarding our working capital requirements see “Management’s discussion and analysis of financial condition and results of operations” under the heading “Financial condition, liquidity and capital resources.” Fluctuations throughout the year are also driven by the timing of product restocking or rearrangement by our major customers as well as our expansion into new customers. Because a limited number of our retail customers account for a large percentage of our net sales, a change in the order pattern of one or more of our large retail customers could cause a significant fluctuation of our quarterly results or reduce our liquidity.
Management information systems
We use our information systems to manage our national retailers, e.l.f. stores, e-commerce and corporate operations. These management information systems provide business process support and intelligence across our multi-channel operations.
Our information system infrastructure employs a comprehensive enterprise resource planning (“ERP”) platform provided and supported by a leading global software partner. This system covers order entry, customer service, accounts payable, accounts receivable, purchasing, asset management and manufacturing.
Our order management process is automated via electronic data interchange with the vast majority of our retail customers feeding orders directly to our ERP platform. From time to time, we enhance and complement the system with additional software. We have an integrated warehouse management system managed by our third-party logistics provider, which allows us to improve real-time tracking and management of inventory. We are also implementing computerized point-of-sale systems in our e.l.f. stores to enable real-time reporting and analytics.
Trademarks and other intellectual property
We believe that our intellectual property has substantial value and has contributed significantly to the success of our business. Our primary trademarks include “e.l.f.,” “eyes lips face” and “play beautifully,” all of which are registered with the U.S. Patent and Trademark Office for our goods and services of primary interest. These trademarks are also registered or have a registration pending in Australia, Brazil, Canada, China, the European Union, India, Mexico, Russia and approximately
76
Table of Contents
20 other countries or registries. We also have numerous other trademark registrations and pending applications for product names and tag lines. Our trademarks are valuable assets that reinforce the distinctiveness of our brand and our consumers’ favorable perception of our products. The current registrations of these trademarks in the United States and foreign countries are effective for consecutive terms of 10 to 15 years and due for periodic renewals, presently scheduled between 2017 and 2028, provided that we comply with all applicable renewal requirements including, where necessary, the continued use of trademarks in connection with the listed goods. In addition to trademark protection, we own numerous URL designations, including elfcosmetics.com. We also rely on and use reasonable business activities to protect unpatented proprietary expertise and product formulations, continuing innovation and other know-how to develop and maintain our competitive position.
Employees
As of December 31, 2016, we had approximately 249 full-time employees and an additional 102 part-time employees. As of December 31, 2016, we had 193 and 56 full-time employees in the United States and China, respectively. The majority of our part-time employees worked in our e.l.f. stores. None of our employees are currently covered by a collective bargaining agreement, and we have experienced no work stoppages. We consider our relationship with our employees to be good.
Government regulation
We and our products are subject to regulation by the Food and Drug Administration (the “FDA”), the Consumer Product Safety Commission (the “CPSC”) and the Federal Trade Commission (the “FTC”) as well as various other federal, state, local and foreign regulatory authorities. These laws and regulations principally relate to the ingredients, proper labeling, advertising, packaging, marketing, manufacture, safety, shipment and disposal of our products.
Under the Federal Food, Drug and Cosmetic Act (the “FDCA”), cosmetics are defined as articles or components of articles that are applied to the human body and intended to cleanse, beautify or alter its appearance, with the exception of soap. The labeling of cosmetic products is also subject to the requirements of the FDCA, the Fair Packaging and Labeling Act, the Poison Prevention Packaging Act and other FDA regulations. Cosmetics are not subject to pre-market approval by the FDA, however certain ingredients, such as color additives, must be pre-authorized. If safety of the products or ingredients has not been adequately substantiated, a specific warning label is required. Other warnings may also be mandated pursuant to FDA regulations. The FDA monitors compliance of cosmetic products through market surveillance and inspection of cosmetic manufacturers and distributors to ensure that the products neither contain false nor misleading labeling and that they are not manufactured under unsanitary conditions. Inspections also may arise from consumer or competitor complaints filed with the FDA. In the event the FDA identifies false or misleading labeling or unsanitary conditions or otherwise a failure to comply with FDA requirements, we may be required by a regulatory authority or we may independently decide to conduct a recall or market withdrawal of our product or to make changes to our manufacturing processes or product formulations or labels, which could result in an insufficient amount of our products in the market and harm our reputation.
The FDA evaluates the “intended use” of a product to determine whether it is a drug, cosmetic product, or both. If a product is intended for use in the diagnosis, cure, mitigation, treatment or prevention of a disease condition or to affect the structure or function of the human body, the FDA will regulate the product as a drug. Drug products will then be subject to applicable requirements under the FDCA. The FDA may also consider labeling claims in determining the intended use of a product. If the FDA considers label claims for our cosmetic products to be claims affecting the structure or function of the human body, or intended for a disease condition, those products may be regulated as “new” drugs. If such products were regulated as “new” drugs by the FDA, it would be necessary to obtain pre-market approval, which includes, among other things, conducting clinical trials to demonstrate safety and efficacy of our products in order to continue marketing those products. However, we may not have sufficient resources to conduct any required clinical studies and because clinical trial outcomes are uncertain we may not be able to demonstrate sufficient efficacy or safety data to resume future marketing of those products.
Our current products that are intended to treat acne and used as sunscreen, including skin care products with SPF, are considered over-the-counter (“OTC”) drug products by the FDA. Our OTC products are subject to regulation through the FDA’s “monograph” system which specifies, among other things, permitted active drug ingredients and their concentrations. The FDA’s monograph system also provides the permissible product claims and certain product labeling requirements, based on the intended use of the product. Our OTC drug products must be manufactured consistent with the FDA’s current drug good manufacturing practices (“GMP”) requirements, and the failure to maintain compliance with these requirements could require us to conduct recalls, market withdrawal, or make changes to our manufacturing practices. Any of these actions could result in harm to our reputation or affect our ability to provide sufficient product to the market.
77
Table of Contents
The FDA may change the regulations as to any product category, requiring a change in labeling, product formulation or analytical testing. However, we may not have sufficient resources to conduct any required analytical testing, reformulate the product or make required label changes, possibly resulting in an inability to continue or resume marketing these products. Any inquiries or investigations from the FDA, FTC or other foreign regulatory authorities into the regulatory status of our cosmetic products and any subsequent interruption in the marketing and sale of those products could severely damage our brand and company reputation in the marketplace.
We are subject to regulation by the CPSC under the Consumer Product Safety Act, as amended by the Consumer Product Safety Improvement Act of 2008. These statutes and the related regulations ban from the market consumer products that fail to comply with applicable product safety laws, regulations and standards. The CPSC has the authority to require the recall, repair, replacement or refund of any such banned products or products that otherwise create a substantial risk of injury and may seek penalties for regulatory noncompliance under certain circumstances. CPSC regulations also require manufacturers of consumer products to report to the CPSC certain types of information regarding products that fail to comply with applicable regulations. Certain state laws also address the safety of consumer products and mandate reporting requirements, and noncompliance may result in penalties or other regulatory action.
The FTC, FDA and other government authorities also regulate advertising and product claims regarding the safety, performance and benefits of our products. These regulatory authorities typically require a safety assessment of the product and reasonable basis to support any marketing claims. What constitutes a reasonable basis for substantiation can vary widely from market to market, and there is no assurance that our efforts to support our claims will be considered sufficient. The most significant area of risk for such activities relates to improper or unsubstantiated claims about the use and safety of our products. If we cannot adequately support safety or substantiate our product claims, or if our promotional materials make claims that exceed the scope of allowed claims for the classification of the specific product, the FDA, FTC or other regulatory authority could take enforcement action or impose penalties, such as monetary consumer redress, requiring us to revise our marketing materials, amend our claims or stop selling certain products, all of which could harm our business, financial condition and results of operations.
We are also subject to a number of U.S. federal and state and foreign laws and regulations that affect companies conducting business on the Internet, including consumer protection regulations that regulate retailers and govern the promotion and sale of merchandise. Many of these laws and regulations are still evolving and being tested in courts, and could be interpreted in ways that could harm our business. These may involve user privacy, data protection, content, intellectual property, distribution, electronic contracts and other communications, competition, protection of minors, consumer protection, telecommunications, product liability, taxation, economic or other trade prohibitions or sanctions and online payment services. In particular, we are subject to federal, state and foreign laws regarding privacy and protection of people’s data. Foreign data protection, privacy and other laws and regulations can be more restrictive than those in the United States. U.S. federal and state and foreign laws and regulations are constantly evolving and can be subject to significant change. In addition, the application, interpretation and enforcement of these laws and regulations are often uncertain, and may be interpreted and applied inconsistently from country to country and inconsistently with our current policies and practices. There are also a number of legislative proposals pending before the U.S. Congress, various state legislative bodies and foreign governments concerning privacy and data protection which could affect us. For example, in the European Union, the current data protection laws will be replaced by the new General Data Protection Regulation (“GDPR”), which was adopted May 2016 and will become effective in May 2018. The GDPR will implement more stringent operational requirements for controllers of personal data such as us, including, for example, expanded disclosures about how personal information is to be used, limitations on retention of information, increased requirements to erase an individual’s information upon request, mandatory data breach notification requirements and higher standards for data controllers to demonstrate that they have obtained valid consent for certain data processing activities. The GDPR also significantly increases penalties for non-compliance. If our privacy or data security measures fail to comply with applicable current or future laws and regulations, we may be subject to litigation, regulatory investigations, enforcement notices requiring us to change the way we use personal data or our marketing practices, fines of up to 20,000,000 Euros or up to 4% of the total worldwide annual turnover of the preceding financial year (whichever is higher) or other liabilities, as well as negative publicity and a potential loss of business. Furthermore, a draft of the new ePrivacy Regulation was announced in January 2017, which is scheduled to become effective in May 2018 (alongside the GDPR) and will replace the current European electronic e-privacy and marketing rules. When implemented, the ePrivacy Regulation is expected to alter rules on direct marketing, and technology for online behavioral advertising and to impose stricter requirements on companies using these tools. The interpretation and application of both the GDPR and the ePrivacy Regulation will remain uncertain until both have become effective and regulators begin issuing guidance and enforcing the new rules.
78
Table of Contents
Environmental, health and safety
We are subject to numerous foreign, federal, provincial, state, municipal and local environmental, health and safety laws and regulations relating to, among other matters, safe working conditions, product stewardship and environmental protection, including those relating to emissions to the air, discharges to land and surface waters, generation, handling, storage, transportation, treatment and disposal of hazardous substances and waste materials, and the registration and evaluation of chemicals. We maintain policies and procedures to monitor and control environmental, health and safety risks, and to monitor compliance with applicable environmental, health and safety requirements. Compliance with such laws and regulations pertaining to the discharge of materials into the environment, or otherwise relating to the protection of the environment, has not had a material effect upon our capital expenditures, earnings or competitive position. However, environmental laws and regulations have tended to become increasingly stringent and, to the extent regulatory changes occur in the future, they could result in, among other things, increased costs to our company. For example, certain states such as California and the U.S. Congress have proposed legislation relating to chemical disclosure and other requirements related to the content of our products.
Segments
We operate our business as a single operating and reportable segment. For more information regarding segment reporting, see Note 2 to our consolidated financial statements under the caption “Segment reporting” included elsewhere in this prospectus.
Geographic information
For information regarding the geographic source of our net sales and the location of our long-lived assets, see Note 2 to our consolidated financial statements under the heading “Segment Data” included elsewhere in this prospectus. For information regarding the risks related to our non-U.S. operations, see the section titled “Risk Factors” elsewhere in this prospectus under the captions, “We are subject to international business uncertainties” and “We have significant operations in China, which exposes us to risks inherent in doing business there.”
Description of property
Our principal executive offices are located in Oakland, California. We also have offices located in New York, New York and Shanghai, China, and a distribution center located in Ontario, California. Our California, New York and China offices total an aggregate of approximately 31,550 square feet of commercial space, and approximately 212,668 square feet of commercial space for our distribution center.
In addition, we operated 16 e.l.f. stores in the New York metro area and three e.l.f. stores in Southern California as of December 31, 2016. All of our properties are leased. The leases expire at various times through 2026, subject to renewal options. We consider our properties to be generally in good condition and believe that our existing facilities are adequate to support our existing operations.
Legal proceedings
We are from time to time subject to, and are presently involved in, litigation and other proceedings. We believe that there are no pending lawsuits or claims that, individually or in the aggregate, may have a material adverse effect on our business, financial condition or results of operations.
79
Table of Contents
Executive officers and directors
Below is a list of our executive officers and directors and their respective ages and a brief account of the business experience of each of them as of March 1, 2017.
| Name | Age | Position | ||||
| Executive Officers |
||||||
| Tarang P. Amin | 52 | Chairman, Chief Executive Officer and Director | ||||
| John P. Bailey | 36 | President and Chief Financial Officer | ||||
| Richard F. Baruch, Jr. | 49 | Senior Vice President and Chief Commercial Officer | ||||
| Jonathan T. Fieldman | 47 | Senior Vice President, Operations | ||||
| Scott K. Milsten | 47 | Senior Vice President, General Counsel, Corporate Secretary & Chief People Officer | ||||
| Non-Employee Directors | ||||||
| Lauren Cooks Levitan | 51 | Director | ||||
| William E. McGlashan, Jr. | 53 | Director | ||||
| Kirk L. Perry | 50 | Director | ||||
| Sabrina L. Simmons | 53 | Director | ||||
| Maureen C. Watson | 49 | Director | ||||
| Richard G. Wolford | 72 | Director | ||||
|
|
|
|
| |||
Executive officers and employee directors
Tarang P. Amin. Mr. Amin has served as our Chief Executive Officer and Director since January 2014, and has served as our Chairman since August 2015. Mr. Amin has more than 25 years of consumer products experience, as well as a demonstrated record of driving profitable growth at the companies he leads. Previously, he served as President, Chief Executive Officer and Director of Schiff Nutrition, a manufacturer of nutritional supplements, from March 2011 to January 2013. Under his leadership, Schiff, with leading brands Airborne, MegaRed, Digestive Advantage and Move Free, grew enterprise value from $190 million to $1.5 billion. Prior to that, Mr. Amin worked for The Clorox Company, a multinational manufacturer and marketer of consumer products, from December 2002 to March 2011. He served as Vice President, General Manager of The Clorox Company’s $1.7 billion Litter, Food and Charcoal Strategic Business Units, taking Kingsford, Hidden Valley and Fresh Step to new records. He also served in senior management roles that helped to double the sales of the global Clorox franchise to $1.5 billion. Prior to Clorox, Mr. Amin held management positions at Procter & Gamble, a multinational consumer goods company, where he helped grow Pantene’s sales from $50 million to $2 billion, as well as helped increase sales of Bounty by $300 million. Mr. Amin earned his B.A. in international policy and M.B.A. from Duke University. We believe Mr. Amin’s executive leadership skills and considerable experience in consumer products provide him with the qualifications and skills to serve as a member of our board of directors.
John P. Bailey. Mr. Bailey has served as our President and Chief Financial Officer since August 2015. Previously, from July 2010 to August 2015, Mr. Bailey served as Partner with TPG, a global investment firm, where he was responsible for leading the consumer sector for TPG Growth, LLC, the middle market and growth equity platform of TPG and an affiliate of the Company. While at TPG, Mr. Bailey served as a member of the board of directors of the Company, as well as a number of portfolio companies including Angie’s Artisan Treats, Beautycounter, Fender and Ride and provided significant contributions to the board of directors of Schiff Nutrition. Prior to joining TPG, Mr. Bailey was with Greenwich, Connecticut-based North Castle Partners, a consumer private equity firm focused in the healthy, active and sustainable living sectors, focusing on consumer and retail investments in the personal care, food and beverage, fitness and recreation, vitamin minerals, and supplements and OTC health sectors. During that time, Mr. Bailey served on the boards of directors of Cascade Sports, Octane Fitness and Red Door Spas, and worked closely with a number of other portfolio companies. Prior to North Castle, Mr. Bailey was in the investment banking division of Credit Suisse First Boston. Mr. Bailey earned his B.B.A. at the University of Michigan Business School.
80
Table of Contents
Richard F. Baruch, Jr. Mr. Baruch has served as our Senior Vice President and Chief Commercial Officer since February 2014. Mr. Baruch most recently served as Senior Vice President and Chief Commercial Officer at Schiff Nutrition from July 2012 to January 2013. From December 2010 to June 2012, he was Vice President, Category Advisory Services at Coca-Cola Refreshments, a division of The Coca-Cola Company, a leading global beverage company, where he led an initiative to build a new organization and bring a new set of capabilities to Coca-Cola’s North American business. From January 2009 to December 2012, Mr. Baruch was President and Chief Operating Officer of Cotn’Wash, Inc., a laundry products company. Prior to that, Mr. Baruch spent 14 years at The Clorox Company in a number of leadership roles, with the most recent as Vice President and General Manager of the Home Care business. He began his career at Procter & Gamble in various sales management roles. Mr. Baruch holds a B.A. in English from the University of Pennsylvania.
Jonathan T. Fieldman. Mr. Fieldman has served as our Senior Vice President, Operations since July 2016. Prior to that, Mr. Fieldman served as Senior Vice President, Operations at Angie’s Boom Chicka Pop, a snack food company, from January 2015 to July 2016. From January 2014 to January 2015, Mr. Fieldman served as Chief Supply Officer for Shaklee Corporation, a natural nutrition company. Previously, Mr. Fieldman worked for Schiff Nutrition, where he served as Senior Vice President, Operations from May 2011 to February 2013. Prior to Schiff Nutrition, Mr. Fieldman spent 12 years at The Clorox Company in various supply chain roles, including Planning Director, Sourcing Director and Plant Manager, with the most recent as Vice President, Specialty Supply Chain. Prior to that, Mr. Fieldman worked for General Mills, Inc., a multinational manufacturer and marketer of branded consumer foods, for eight years in a variety of manufacturing roles. Mr. Fieldman holds a B.S. in Industrial Engineering and Engineering Management from Stanford University.
Scott K. Milsten. Mr. Milsten has served as our Senior Vice President, General Counsel and Corporate Secretary since January 2014 and, in addition, as our Chief People Officer since August 2016. Previously, Mr. Milsten served as Senior Vice President, General Counsel and Corporate Secretary at Schiff Nutrition from July 2011 to January 2013. Prior to that, Mr. Milsten was Senior Vice President, General Counsel and Corporate Secretary of Celera Corporation, a healthcare diagnostics company, from August 2009 until Celera’s sale to Quest Diagnostics Incorporated in June 2011. He also served as Vice President, General Counsel and Corporate Secretary of Celera from November 2008 to August 2009. Mr. Milsten began his career practicing corporate law with the law firm of Latham & Watkins LLP. Mr. Milsten holds a J.D. from the University of Pennsylvania Law School and a B.A. in English from Duke University.
Non-employee directors
Lauren Cooks Levitan. Ms. Levitan has served as a member of our board of directors since June 2016. Ms. Levitan currently serves as Chief Financial Officer of Fanatics, Inc., a retailer of licensed sports apparel and merchandise, a position she has held since June 2015. Previously, from January 2009 to May 2015, Ms. Levitan was Co-Founder and Managing Partner at Moxie Capital LLC, a private equity firm, where she provided capital investment and advisory services to branded, consumer-facing businesses that operated in wholesale, retail, e-commerce and direct sales. Prior to that, she served as Managing Director and Senior Research Analyst at Cowen & Company, an investment bank, and as Managing Director at Robertson Stephens, an investment bank, and worked in various capacities in the retail industry at Crate & Barrel and the Gymboree Corporation and in equity capital markets and investment banking at Goldman Sachs. She received her B.A. in Political Science from Duke University and received her M.B.A. from Stanford University Graduate School of Business. We believe Ms. Levitan’s operational, financial and strategic experience across a variety of retail businesses provide her with the qualifications and skills to serve as a member of our board of directors.
William E. McGlashan, Jr. Mr. McGlashan has served as a member of our board of directors since August 2015 and has been designated to serve as a member of our board of directors by TPG Growth. Mr. McGlashan is the Managing Partner of TPG Growth and a member of the TPG Executive Committee. Mr. McGlashan currently serves on the boards of directors of several private companies. Mr. McGlashan served as a director of SuccessFactors, Inc. from 2005 to 2012, where he served on the audit committee, nominating and governance committee and mergers & acquisition committee from 2007 to 2012. Mr. McGlashan also served as a director of Schiff Nutrition from 2010 to 2012, where he served on the compensation committee from 2010 to 2012. From December 2001 to March 2004, Mr. McGlashan served as Chairman of the board of directors and Chief Executive Officer of Critical Path, Inc., a digital communications software company. Mr. McGlashan holds a B.A. in History from Yale University and an M.B.A. from Stanford University Graduate School of Business. We believe Mr. McGlashan’s significant corporate governance experience and operational expertise provide him with the qualifications and skills to serve as a member of our board of directors.
Kirk L. Perry. Mr. Perry has served as a member of our board of directors since September 2016. Mr. Perry currently
serves as President, Brand Solutions at Google Inc., a technology company, a position he has held since December 2013, and
is responsible for driving Google’s revenue with the world’s largest advertisers and advertising agencies. Prior to this role,
81
Table of Contents
Mr. Perry was President, Global Family Care at Procter & Gamble from May 2011 to December 2013. He held numerous positions of increasing responsibility with Procter & Gamble beginning in 1990 in marketing and general management roles, including General Manager Northeast Asia Baby & Family Care from 2001 to 2003 (Mr. Perry was based in Korea and Japan from 1997 to 2003), Vice President North America Baby Care from 2003 to 2008 and Vice President, North America Marketing and U.S. Operations from 2008 to 2011. Mr. Perry served as a member of the board of the Hillerich & Bradsby Co. (Louisville Slugger), a sporting goods manufacturer, from September 2013 to August 2016. Other volunteer board affiliations have included the Ronald McDonald House, The CityLink Foundation, The United Way Campaign Cabinet, The March of Dimes National and Regional boards, the University of Cincinnati Foundation and the University of Cincinnati Bicentennial Commission. Mr. Perry graduated with a B.B.A. in Marketing and Finance from the University of Cincinnati. We believe Mr. Perry’s extensive operational experience in marketing, operations, general management, consumer products, technology and digital media provide him with the qualifications and skills to serve as a member of our board of directors.
Sabrina L. Simmons. Ms. Simmons has served as a member of our board of directors since March 2016. Ms. Simmons served as Executive Vice President and Chief Financial Officer of The Gap, Inc., a clothing company, from January 2008 until February 2017. Previously, Ms. Simmons also served in the following positions at Gap: Executive Vice President, Corporate Finance from September 2007 to January 2008, Senior Vice President, Corporate Finance and Treasurer from March 2003 to September 2007, and Vice President and Treasurer from September 2001 to March 2003. Prior to that, Ms. Simmons served as Chief Financial Officer and an executive member of the board of directors of Sygen International PLC, a British genetics company. Prior to that, Ms. Simmons was Assistant Treasurer at Levi Strauss & Co., a clothing company. Ms. Simmons currently serves as a member of the board of directors of Williams-Sonoma, Inc., a consumer retail company, where she is a member of the audit and finance committee. Ms. Simmons currently also serves on the Haas School of Business Advisory Board. Ms. Simmons received her B.S. in Business from the University of California, Berkeley and received her M.B.A. from the Anderson School at the University of California, Los Angeles. Ms. Simmons is a certified public accountant (inactive status). We believe Ms. Simmons’ significant financial and accounting experience provide her with the qualifications and skills to serve as a member of our board of directors.
Maureen C. Watson. Ms. Watson has served as a member of our board of directors since August 2015 and has been designated to serve as a member of our board of directors by TPG Growth. Ms. Watson currently serves as Chief Product Officer of Madison Reed, Inc., a hair care company, a position she has held since August 2015. Previously, she served at Sephora USA, Inc., a cosmetics company, as Senior Vice President, Merchandising from March 2013 to March 2015. Prior to that, she served as Senior Vice President, Global Sales and Merchandising of Lucky Brand Jeans (Lucky Brand, Inc.), a clothing company, from September 2010 to September 2011. Prior to that, Ms. Watson served in various leadership roles at The Gap, Inc. Ms. Watson earned a B.A. in Political Science and French from Middlebury College. We believe Ms. Watson’s extensive consumer products and cosmetics experience provide her with the qualifications and skills to serve as a member of our board of directors.
Richard G. Wolford. Mr. Wolford has served as a member of our board of directors since September 2014 and has been designated to serve as a member of our board of directors by TPG Growth. Mr. Wolford served as interim President and Chief Executive Officer of Diamond Foods, Inc., an American packaged food company, from February 2012 until May 2012. Mr. Wolford served as Chief Executive Officer and a director of Del Monte Foods Company, a North American food production and distribution company, from April 1997 until March 2011. He was elected President of Del Monte in February 1998 and Chairman of the board of directors in May 2000. From 1988 to 1996, Mr. Wolford was Chief Executive Officer of HK Acquisition Corp., where he developed food industry investments with venture capital investors. From 1967 to 1987, he held a variety of positions at Dole Foods, an agricultural multinational corporation, including President of Dole Packaged Foods from 1982 to 1987. Mr. Wolford was a member of the board of directors of Diamond Foods, Inc. from April 2011 until May 2012. Mr. Wolford served on the board of directors of Schiff Nutrition from September 2011 to January 2013. Mr. Wolford served as a member of the board of directors of Pulte Homes, Inc., a homebuilding company, from May 2008 to August 2009. In addition, Mr. Wolford served as Chairman of the board of directors of the Grocery Manufacturers Association (“GMA”), from January 2010 to March 2011, resigning upon the sale of Del Monte. As Chairman of GMA, Mr. Wolford also served on the board of directors of Consumer Goods Forum, a global association of consumer packaged goods companies, retailers and manufacturers. Prior to that, Mr. Wolford served as Vice Chairman of GMA from January 2008 to January 2010, and chaired GMA’s Industry Affairs Council from June 2005 to January 2010. In 2011, Mr. Wolford was the recipient of the GMA Hall of Achievement award honoring extraordinary leadership and commitment to the consumer packaged goods industry. Mr. Wolford holds a B.A. in Economics from Harvard University. We believe Mr. Wolford’s extensive public company management, reporting, finance and corporate governance experience, as well as deep knowledge of the consumer products industry, provide him with the qualifications and skills to serve as a member of our board of directors.
82
Table of Contents
Composition of the board of directors
Director independence
Our board of directors currently consists of seven members. Our board of directors has determined that each of Mses. Levitan, Simmons and Watson and Messrs. McGlashan, Perry and Wolford qualify as independent directors in accordance with the NYSE listing requirements. Mr. Amin is not considered independent because he is an employee of the Company. Amy G. Shenkan and Joseph A. Shamah are no longer members of our board of directors; however, both served on our board of directors during the year ended December 31, 2016 and until their resignations in April 2016 and March 2017, respectively. Our board of directors previously determined that Ms. Shenkan qualified as an “independent” director under the NYSE listing standards, while Mr. Shamah did not qualify as an “independent” director under the NYSE listing standards because he was an employee of the Company until December 2015. NYSE’s independent director definition includes a series of objective tests, including that the director is not, and has not been within the last three years, one of our employees and that neither the director nor any of his or her family members has engaged in various types of business dealings with us. In addition, as required by NYSE rules, our board of directors has made an affirmative determination as to each independent director that he or she has no material relationship with the Company (either directly or as a partner, stockholder or officer of an organization that has a relationship with us). In making these determinations, our board of directors considered ownership of our stock and reviewed and discussed information provided by the directors and us with regard to each director’s business and personal activities and relationships as they may relate to us and our management. There are no family relationships among any of our directors or executive officers.
Classified board of directors
In accordance with our amended and restated certificate of incorporation, our board of directors is divided into three classes with staggered, three-year terms. At each annual meeting of stockholders, the successors to directors whose terms then expire will be elected to serve from the time of election and qualification until the third annual meeting following election. Our directors are divided among the three classes as follows:
| • | the Class I directors are Mr. Perry and Mses. Simmons and Watson, and their terms expire at the annual meeting of stockholders to be held in 2017; |
| • | the Class II directors are Ms. Levitan and Mr. Wolford, and their terms expire at the annual meeting of stockholders to be held in 2018; and |
| • | the Class III directors are Messrs. Amin and McGlashan, and their terms expire at the annual meeting of stockholders to be held in 2019. |
Our amended and restated certificate of incorporation provides that the authorized number of directors may be changed only by resolution of the board of directors. Any additional directorships resulting from an increase in the number of directors will be distributed among the three classes so that, as nearly as possible, each class will consist of one-third of the directors. The division of our board of directors into three classes with staggered three-year terms may delay or prevent a change of our management or a change in control of our company.
For so long as our Sponsor has the right to designate at least one director for nomination under the Stockholders Agreement, the number of directors serving on our board of directors will not exceed nine; provided, that the number of directors may be increased if necessary to satisfy the requirements of applicable laws and stock exchange regulations.
Board composition arrangements
The composition of our board of directors is governed by the Stockholders Agreement and the related provisions of our amended and restated certificate of incorporation. Pursuant to the terms of the Stockholders Agreement, our Sponsor has the right to designate up to three members of our board of directors so long as it holds at least 30% of our outstanding common stock, two members of our board of directors so long as it holds less than 30% but greater than or equal to 20% of our outstanding common stock, and one member of our board of directors so long as it holds less than 20% but greater than or equal to 5% of our outstanding common stock. In addition, subject to applicable laws and stock exchange regulations, our Sponsor has the right to have a representative appointed to serve on each committee of our board of directors other than the audit committee for so long as our Sponsor has the right to designate at least one director for election to our board.
83
Table of Contents
Messrs. McGlashan and Wolford and Ms. Watson were designated to serve on our board of directors by our Sponsor. To the extent not inconsistent with Section 141(k) of the DGCL and our amended and restated certificate of incorporation, any director who is nominated by our Sponsor may only be removed by our Sponsor and if our Sponsor provides notice of its desire to remove one of its nominated directors, our board of directors and the other parties to the Stockholders Agreement shall take all reasonable action necessary to effect such removal.
Board leadership structure and the board’s role in risk oversight
Committees of the board of directors
The standing committees of our board of directors consists of an audit committee, a compensation committee and a nominating and corporate governance committee. Our board of directors may also establish from time to time any other committees that it deems necessary or desirable. Under our Stockholders Agreement, subject to applicable laws and stock exchange regulations, our Sponsor has the right to have a representative appointed to serve on each committee of our board of directors other than the audit committee for so long as our Sponsor has the right to designate at least one director for election to our board.
Our chief executive officer and other executive officers will regularly report to the non-employee directors and the audit, compensation and nominating and corporate governance committees to ensure effective and efficient oversight of our activities and to assist in proper risk management and the ongoing evaluation of management controls.
Audit committee
The audit committee consists of Ms. Simmons, who serves as the Chair, and Ms. Levitan and Mr. Wolford. Each of the members of our audit committee qualifies as an independent director under NYSE corporate governance standards and the independence requirements of Rule 10A-3 of the Exchange Act. Our board of directors has determined that Ms. Simmons qualifies as an “audit committee financial expert” as such term is defined in Item 407(d)(5) of Regulation S-K.
The purpose of the audit committee is to assist the board of directors in its oversight of: (i) the integrity of our financial statements; (ii) our compliance with legal and regulatory requirements; (iii) the independent auditor’s qualifications and independence; (iv) the performance of our independent auditor; and (v) the design and implementation of our internal audit function, and the performance of the internal audit function after it has been established.
Our board of directors has adopted a written charter for the audit committee, which is available on our website.
Compensation committee
The compensation committee consists of Mr. McGlashan, who serves as the Chair, and Mr. Wolford. Each of the members of our compensation committee is an independent director under the applicable rules and regulations of the NYSE relating to compensation committee independence.
The purpose of the compensation committee is to assist our board of directors in discharging its responsibilities relating to (i) setting our compensation program and compensation of our executive officers, directors and key personnel, (ii) monitoring our incentive-compensation and equity-based compensation plans, (iii) succession planning for our executive officers, directors and key personnel and (iv) preparing the compensation committee report required to be included in our proxy statement under the rules and regulations of the SEC.
Our board of directors has adopted a written charter for the compensation committee, which is available on our website.
Nominating and corporate governance committee
The nominating and corporate governance committee consists of Ms. Watson, who serves as the Chair, and Ms. Levitan. Each of the members of our nominating and corporate governance committee is an independent director under the applicable rules and regulations of the NYSE relating to nominating and corporate governance committee independence.
The nominating and corporate governance committee is responsible for making recommendations to our board of directors regarding candidates for directorships and the size and composition of our board of directors. In addition, the nominating and corporate governance committee is responsible for overseeing our corporate governance policies and reporting and making recommendations to our board of directors concerning governance matters.
Our board of directors has adopted a written charter for the nominating and corporate governance committee, which is available on our website.
84
Table of Contents
Compensation committee interlocks and insider participation
None of the members of our compensation committee has at any time been one of our executive officers or employees. None of our executive officers currently serves, or has served during the last completed fiscal year, on the compensation committee or board of directors of any other entity that has one or more executive officers serving as a member of our board of directors or compensation committee.
Board diversity
Our nominating and corporate governance committee is responsible for reviewing with the board of directors, on an annual basis, the appropriate characteristics, skills and experience required for the board of directors as a whole and its individual members. In evaluating the suitability of individual candidates (both new candidates and current members), the nominating and corporate governance committee, in recommending candidates for election, and the board of directors, in approving (and, in the case of vacancies, appointing) such candidates, may take into account many factors, including but not limited to the following:
| • | personal and professional integrity; |
| • | ethics and values; |
| • | experience in corporate management, such as serving as an officer or former officer of a publicly held company; |
| • | experience in the industries in which we compete; |
| • | experience as a board member or executive officer of another publicly held company; |
| • | diversity of expertise and experience in substantive matters pertaining to our business relative to other board members; |
| • | conflicts of interest; and |
| • | practical and mature business judgment. |
Our board of directors evaluates each individual in the context of the board of directors as a whole, with the objective of assembling a group that can best maximize the success of our business and represent stockholder interests through the exercise of sound judgment using its diversity of experience in these various areas.
Code of ethics and business conduct
We have adopted a Code of Ethics and Business Conduct that applies to all of our directors, officers and employees, including our principal executive officer and principal financial and accounting officer. Our Code of Ethics and Business Conduct is available on our website. Our Code of Ethics and Business Conduct is a “code of ethics,” as defined in Item 406(b) of Regulation S-K. We will make any legally required disclosures regarding amendments to, or waivers of, provisions of our code of ethics on our website.
85
Table of Contents
Overview
This compensation discussion provides an overview of our executive compensation program and compensation for our named executive officers (“NEOs”) for the year ended December 31, 2016. As an “emerging growth company” as defined in the Jumpstart Our Business Startups Act of 2012, we are not required to include a Compensation Discussion and Analysis section and have elected to comply with the scaled disclosure requirements applicable to emerging growth companies. In addition, as an emerging growth company, we are not required to hold an advisory vote to approve the compensation of our named executive officers, or “say-on-pay” vote. All share amounts and prices provided in this section give effect to our 2.76:1 forward stock split of our common stock in September 2016.
Our NEOs for 2016 were:
| • | Tarang P. Amin, Chairman, Chief Executive Officer and Director; |
| • | John P. Bailey, President and Chief Financial Officer; and |
| • | Scott K. Milsten, Senior Vice President, General Counsel, Corporate Secretary & Chief People Officer. |
2016 Summary Compensation Table
The following table sets forth information regarding compensation awarded to, earned by or paid to our NEOs during the years ended December 31, 2016 and 2015.
| Name and Principal Position | Year | Salary ($) |
Stock ($)(1) |
Option Awards ($)(1) |
Non-Equity Incentive Plan Compensation ($)(2) |
All Other Compensation ($) |
Total ($) |
|||||||||||||||||||||
| Tarang P. Amin |
2016 | 475,000 | 2,491,537 | 2,748,985 | 950,000 | 20,000 | (3) | 6,685,522 | ||||||||||||||||||||
|
|
|
|||||||||||||||||||||||||||
| Chairman, Chief Executive Officer and Director |
2015 | 475,000 | — | — | 950,000 | 32,065 | 1,457,065 | |||||||||||||||||||||
|
|
|
|||||||||||||||||||||||||||
| John P. Bailey |
2016 | 425,000 | 1,132,506 | 1,309,407 | 637,500 | — | 3,504,413 | |||||||||||||||||||||
|
|
|
|||||||||||||||||||||||||||
| President and Chief Financial Officer(4) |
2015 | 163,462 | — | 490,269 | 637,500 | — | 1,291,231 | |||||||||||||||||||||
|
|
|
|||||||||||||||||||||||||||
| Scott K. Milsten(5) |
2016 | 325,000 | 566,270 | 625,486 | 260,000 | 4,000 | (6) | 1,794,756 | ||||||||||||||||||||
|
|
|
|||||||||||||||||||||||||||
| Senior Vice President, General Counsel, Corporate Secretary & Chief People Officer |
2015 | 325,000 | — | — | 260,000 | — | 585,000 | |||||||||||||||||||||
|
|
||||||||||||||||||||||||||||
| (1) | Amounts represent the grant date fair value of stock options granted under the 2014 Equity Plan and the 2016 Equity Incentive Award Plan (the “2016 Plan”) and restricted stock units granted under the 2016 Plan in the year indicated, calculated in accordance with the FASB Topic 718, disregarding the effects of estimated forfeitures. For option awards, the amounts also include the incremental fair value of an adjustment to the exercise prices of outstanding options held by our NEOs, which was approved in June 2016 in connection with a special dividend, totaling $26,927, $72,102 and $6,837 for Mr. Amin, Mr. Bailey and Mr. Milsten, respectively. As a result of the adjustment, the exercise price of each outstanding option as of June 7, 2016 was reduced by $1.79, the amount of the per share dividend declared on June 7, 2016. For a discussion of the assumptions used to calculate the grant date value of our stock options and restricted stock units, see Note 13 of Notes to Consolidated Financial Statements included elsewhere in this prospectus. |
| (2) | Amounts for 2016 represent the actual bonus earned for 2016 and paid in February 2017 based on our achievement of Adjusted EBITDA as discussed in more detail below under “Bonuses.” The bonuses are subject to the terms of the 2016 Plan and the NEO’s employment agreement. Amounts for 2015 represent the actual bonus earned for 2015 and paid in February 2016. |
| (3) | Amount reflects reimbursement to Mr. Amin paid in 2017 for expenses incurred by him for 2016 relating to financial planning and tax preparation assistance per the terms of his employment agreement. |
| (4) | Mr. Bailey commenced employment with us in August 2015. |
86
Table of Contents
| (5) | Mr. Milsten was appointed as Chief People Officer in August 2016, having served as our Senior Vice President, General Counsel and Corporate Secretary since January 2014. |
| (6) | Amount reflects Company matching contributions to Mr. Milsten’s 401(k) plan account. |
Employment Agreements
We and our operating subsidiary, e.l.f. Cosmetics, Inc., have entered into employment agreements with each of our current NEOs. These agreements set forth the terms and conditions of employment of each NEO, including base salary, initial stock option grants and standard employee benefit plan participation. Our Board or the Compensation Committee reviews each NEO’s compensation from time to time to ensure that it adequately reflects the NEO’s qualifications, experience, role and responsibilities.
Initial term
Each employment agreement provides that the respective NEO will continue to serve in his stated capacity until the fifth anniversary of his date of hire (the “Initial Term”). The Initial Term will be automatically extended for successive one-year periods (the “Extension Period”), unless either we or the NEO provide written notice of intent to terminate at least 60 days prior to the end of the Initial Term or any Extension Period.
Severance
Each NEO’s employment agreement provides that if his employment is terminated by us for reasons other than death, disability or “cause,” or at the election of the NEO “for good reason,” prior to the end of the Initial Term, then, in addition to any accrued but unpaid base salary and vacation time and such employee benefits, if any, to which the NEO or his dependents may be entitled under our employee benefit plans or programs, and reimbursement for reasonable business expenses, each as would have been payable through the date of termination and any unpaid annual bonus earned for a previously completed fiscal year, he will be entitled to receive severance payments of (i) an amount equal to his base salary, payable monthly for a period of 12 months following the date of termination (except that Mr. Amin will be entitled to two times his base salary); (ii) continued COBRA coverage for such NEO and his eligible dependents for a period of up to 18 months; and (iii) a pro-rated bonus based on actual performance for the fiscal year in which termination occurs, provided that the NEO has been employed with us for at least six months of such fiscal year. All such severance payments are contingent upon each NEO’s compliance with certain non-compete, confidentiality and other provisions as set forth in his respective employment agreement, and the execution of a general release of claims against the Company.
Pursuant to each employment agreement, “cause” is defined as the NEO’s (i) material nonperformance of his obligations to the Company, subject to certain notice and opportunity to cure provisions; (ii) commission of an act of fraud, embezzlement, misappropriation, willful misconduct against or breach of his fiduciary duty to the Company; (iii) material breach of certain non-compete, non-solicitation, confidentiality and other restrictive covenants; (iv) conviction, plea of no contest or nolo contendere, deferred adjudication or unadjudicated probation for any felony or any crime involving moral turpitude; (v) failure to carry out, or comply with, in any material respect, any lawful directive of the board of directors, subject to certain notice and opportunity to cure provisions; or (vi) unlawful use or possession of illegal drugs.
Pursuant to each employment agreement, “good reason” is defined as (i) a material default in the performance of the Company’s obligations under the applicable employment agreement; (ii) a significant diminution of the NEO’s duties, responsibilities or authority, or a material diminution of his base compensation, unless such diminution is mutually agreed between the NEO and the Company; or (iii) the Company’s relocation of the NEO’s principal office without his consent to a location in excess of 50 miles from San Francisco, California, in each case subject to certain notice and opportunity to cure provisions.
Base Salaries
We provide a base salary to our NEOs and other employees to compensate them for services rendered during the year. Base salaries are intended to provide a level of compensation sufficient to attract and retain an effective management team when considered in combination with the other components of our executive compensation program. The relative levels of base salary for our NEOs are designed to reflect each such NEO’s scope of responsibility and accountability to us. For 2016, the base salaries of Messrs. Amin, Bailey and Milsten were $475,000, $425,000 and $325,000, respectively. See the “Salary” column in the 2016 Summary Compensation Table.
87
Table of Contents
Bonuses
Pursuant to their respective employment agreements, Messrs. Amin, Bailey and Milsten are entitled to an annual cash bonus targeted at 100%, 75% and 40% of their respective base salaries, in each case subject to the attainment of certain financial goals as determined by the Board. For 2016, our Board established an Adjusted EBITDA goal for the annual cash bonus program and provided for bonuses to be payable at up to 200% of each NEO’s annual cash bonus target for performance based on predetermined Adjusted EBITDA levels of achievement. No bonus would be payable if performance was less than 94% of the Adjusted EBITDA goal, and the bonus amount was capped at 200% of each NEO’s annual cash bonus target. Each bonus would also be subject to the terms of the 2016 Plan.
In February 2017, our Compensation Committee determined that, based on our Adjusted EBITDA performance for 2016, each NEO was entitled to receive 200% of his annual cash bonus target. Messrs. Amin, Bailey and Milsten received annual cash bonuses in the amounts of $950,000, $637,500 and $260,000, respectively. See the “Non-Equity Incentive Plan Compensation” column in the 2016 Summary Compensation Table.
Equity Compensation
Stock options awarded to our senior executives prior to 2016 have typically been subject to both (i) time-based and (ii) performance-based vesting. The time-based portion of such options became vested and exercisable immediately prior to our initial public offering. The performance-based portion of such options would vest if our equityholders, including TPG Growth, who are party to the Stockholders Agreement (as defined in “Certain Relationships and Related Party Transactions—Stockholders Agreement”) and their permitted transferees, receive cash distributions in respect of their investment in us, including proceeds received in connection with our initial public offering, combined with the market value of their remaining holdings that exceeded certain investment return multiples. These awards vested in March 2017 based on the achievement of the performance requirements.
Generally, in the event of an NEO’s termination of employment by reason of death or disability, by the Company without “cause” or by the executive for “good reason” (as such terms are defined in his employment agreement), with respect to stock options granted prior to 2016, (i) the time-based portion of any option which would have vested within 12 months (or 24 months if such termination occurs without cause or for good reason within 12 months of the executive’s date of hire or the grant date of the option as set forth in the applicable award agreement) following the termination will become immediately vested and exercisable and (ii) the executive will vest in the performance-based portion of such option in the event the performance goal is achieved within six months following the date of termination.
In 2016, in connection with the pricing of our initial public offering, we adopted the 2016 Plan and our NEOs were each granted a time-based stock option and restricted stock units under the 2016 Plan. Messrs. Amin, Bailey and Milsten were granted a stock option exercisable for 428,037, 194,563 and 97,281 shares of our common stock, respectively, and an award of 146,561, 66,618 and 33,310 restricted stock units, respectively. Each stock option has an exercise price per share of $17.00, which is equal to the initial public offering price for our common stock, and each stock option and restricted stock unit award vests in substantially equal installments on each of the first four anniversaries of the date of the grant, generally subject to continued service through the applicable vesting date. In the event an NEO’s employment, other than Mr. Amin, is terminated by the Company without “cause” or by the NEO for “good reason” (each as defined in the applicable award agreement), in each case, within 12 months following a change in control, each equity award held by the NEO will vest in full. For Mr. Amin, unless otherwise determined by the Compensation Committee before an award is granted, all equity awards granted to him under the 2016 Plan will vest in full immediately prior to a change in control, subject to his continuing to provide services to the company through the change in control date. In March 2017, Mr. Amin consented to, and our Compensation Committee approved, an extension of the vesting schedule of the first tranche of this award, such that the award will vest as to 1/4th of the total number of shares underlying the award on the earliest of (i) November 30, 2017, (ii) a termination of Mr. Amin’s service that occurs on or after September 21, 2017, and (iii) a change in control, and as to 1/4th of the total number of shares on each anniversary of the grant date thereafter, generally subject to Mr. Amin’s continued service through each applicable vesting date.
Other Elements of Compensation
Retirement Plans
We also maintain a 401(k) retirement savings plan through e.l.f. Cosmetics, Inc. for the benefit of our employees, including our NEOs, who satisfy certain eligibility requirements. Under the 401(k) plan, eligible employees may elect to defer a portion of their compensation, within the limits prescribed by the Internal Revenue Code of 1986, as amended (the “Code”), on a pre-tax or after-tax (Roth) basis through contributions to the 401(k) plan. We also generally make matching contributions based on the percentage of each employee’s elective deferrals, subject to a pre-determined maximum. We believe that
88
Table of Contents
providing a vehicle for tax-deferred retirement savings through our 401(k) plan adds to the overall desirability of our executive compensation package and further incentivizes our employees in accordance with our compensation policies. We made matching contributions to Mr. Milsten’s 401(k) plan account in the amount of $4,000 during 2016. Messrs. Amin and Bailey do not participate in our 401(k) plan.
Employee Benefits and Perquisites
All of our full-time employees, including our NEOs, are eligible to participate in our health and welfare plans, including medical, dental and vision benefits, medical flexible spending accounts, short-term and long-term disability insurance and life insurance.
In addition, pursuant to his employment agreement, we offer Mr. Amin reimbursement of up to $20,000 per year for expenses incurred by him in connection with financial planning and tax preparation assistance. Please see the “All Other Compensation” column in the 2016 Summary Compensation Table for information relating to amounts reimbursed to Mr. Amin during 2016. Except as noted above with respect to Mr. Amin, we do not provide our NEOs with perquisites or other personal benefits other than those which apply uniformly to all of our employees.
2016 Employee Stock Purchase Plan
In connection with our initial public offering, we adopted the 2016 Employee Stock Purchase Plan, which is designed to allow our eligible employees to purchase shares of our common stock with accumulated payroll deductions.
2016 Outstanding Equity Awards at Fiscal Year-End
The following table sets forth information regarding the outstanding equity awards held by the NEOs as of December 31, 2016.
| Option Awards | Stock Awards | |||||||||||||||||||||||||||||||||||||||||||
| Name | Grant Date | Number of Securities Underlying Unexercised Options (#) Exercisable |
Number of Securities Underlying Unexercised Options (#) Unexercisable |
Equity Incentive Plan Awards: Number of Securities Underlying Unexercised Unearned Options |
Option Exercise Price |
Option Expiration Date |
Number Shares or Units Not |
Market Value of Shares or Units That Have Not Vested(1) |
Equity That Have Vested |
Equity Plan Awards: Value of Units or Other Rights That |
||||||||||||||||||||||||||||||||||
| Tarang P. Amin |
1/31/2014 | (2) | — | — | 476,888 | $ | 1.84 | (3) | 1/31/2024 | 1,415,186 | (4) | $ | 40,955,483 | |||||||||||||||||||||||||||||||
|
|
|
|
||||||||||||||||||||||||||||||||||||||||||
| 9/21/2016 | (5)(7) | 428,037 | $ | 17.00 | 9/21/2026 | |||||||||||||||||||||||||||||||||||||||
|
|
|
|
||||||||||||||||||||||||||||||||||||||||||
| 9/21/2016 | (6)(7) | 146,561 | $ | 4,241,475 | ||||||||||||||||||||||||||||||||||||||||
|
|
|
|
||||||||||||||||||||||||||||||||||||||||||
| John P. Bailey |
8/12/2015 | (2) | — | 714,275 | $ | 1.84 | (3) | 8/12/2025 | ||||||||||||||||||||||||||||||||||||
|
|
|
|
||||||||||||||||||||||||||||||||||||||||||
| 9/21/2016 | (5) | 194,563 | $ | 17.00 | 9/21/2026 | |||||||||||||||||||||||||||||||||||||||
|
|
|
|
||||||||||||||||||||||||||||||||||||||||||
| 9/21/2016 | (6) | 66,618 | $ | 1,927,925 | ||||||||||||||||||||||||||||||||||||||||
|
|
|
|
||||||||||||||||||||||||||||||||||||||||||
| Scott K. Milsten |
1/31/2014 | (2) | — | — | 55,200 | $ | 1.84 | (3) | 1/31/2024 | 52,440 | (4) | $ | 1,517,614 | |||||||||||||||||||||||||||||||
|
|
|
|
||||||||||||||||||||||||||||||||||||||||||
| 8/12/2015 | (2) | — | — | 209,939 | $ | 1.84 | (3) | 8/12/2025 | ||||||||||||||||||||||||||||||||||||
|
|
|
|
||||||||||||||||||||||||||||||||||||||||||
| 9/21/2016 | (5) | 97,281 | $ | 17.00 | 9/21/2026 | |||||||||||||||||||||||||||||||||||||||
|
|
|
|
||||||||||||||||||||||||||||||||||||||||||
| 9/21/2016 | (6) | 33,310 | $ | 963,991 | ||||||||||||||||||||||||||||||||||||||||
|
|
||||||||||||||||||||||||||||||||||||||||||||
| (1) | The market value of the restricted stock units is calculated by multiplying the closing market price of the Company’s stock on December 30, 2016, $28.94, by the number of shares subject to the award. |
| (2) | These options are immediately exercisable, provided that any shares acquired upon exercise prior to vesting are subject to the Company’s right to repurchase, which lapses in accordance with the applicable vesting schedule. Generally subject to each NEO’s continued employment, (i) the time-based portion of each option granted under the 2014 Equity Plan became fully vested immediately prior to our initial public offering; and (ii) the performance-based portion of each option will become vested if our equityholders who are party to the Stockholders Agreement, and their permitted transferees, receive cash distributions in respect of their investment in us, including proceeds received in connection with the initial public offering, that exceed certain investment return multiples. |
89
Table of Contents
| (3) | On June 7, 2016, the Compensation Committee approved an adjustment to the option exercise prices in connection with a special dividend declared on June 7, 2016. The exercise price of each outstanding option as of June 7, 2016 was reduced by $1.79, the amount of the per share dividend. The exercise price of any options exercised prior to June 7, 2016 were not adjusted as a result of the special dividend. |
| (4) | Represents restricted stock acquired pursuant to the early exercise of stock options. |
| (5) | These time-based stock options vest in four substantially equal installments on the first four anniversaries of the date of the grant, generally subject to continued service through the applicable vesting date. |
| (6) | These time-based restricted stock units vest in four substantially equal installments on the first four anniversaries of the date of the grant, generally subject to continued service through the applicable vesting date. |
| (7) | In March 2017, Mr. Amin consented to, and our Compensation Committee approved, a change in the vesting schedule to this award, such it will vest as to 1/4th of the total number of shares underlying the award on the earliest of (i) November 30, 2017, (ii) a termination of Mr. Amin’s service that occurs on or after September 21, 2017, and (iii) a change in control, and as to 1/4th of the total number of shares on each anniversary of the grant date thereafter, generally subject to Mr. Amin’s continued service through each applicable vesting date. |
Compensation Risk Assessment
Consistent with the SEC’s disclosure requirements, we have assessed our compensation programs for all employees. We have concluded that our compensation policies and practices do not create risks that are reasonably likely to have a material adverse effect on us. Management has evaluated our executive and employee compensation and benefits programs to determine if these programs’ provisions and operations create undesired or unintentional risk of a material nature. The risk assessment process includes a review of program policies and practices; analysis to identify risks and risk controls related to our compensation programs; and determinations as to the sufficiency of risk identification, the balance of potential risk to potential reward, the effectiveness of our risk controls and the impacts of our compensation programs and their risks to our strategy. Although we periodically review all compensation programs, we focus on the programs with variability of payout, as well as those with the ability of a participant to directly affect payout; we also focus on the controls on participant action and payout. In relation to this, we believe that our incentive compensation arrangements provide incentives that do not encourage risk taking beyond our ability to effectively identify and manage significant risks and are compatible with effective internal controls and our risk management practices.
The Compensation Committee monitors our compensation programs on an annual basis and expects to make modifications as necessary to address any changes in our business or risk profile.
Director compensation
We implemented a Director Compensation Program that became effective as to our non-employee directors effective upon the closing of our initial public offering. Under the Director Compensation Program, our non-employee directors receive cash compensation, paid quarterly in arrears, as set forth below; provided, that each non-employee director may elect to receive his or her annual compensation in the form of restricted stock units that vest in full on the earlier of the first anniversary of the date of grant, or immediately prior to the next annual meeting of our stockholders occurring after such award is granted, subject to certain limitations. All of our non-employee directors, with the exception of Mr. McGlashan, are eligible to receive compensation for their service on our Board.
Cash Fees
The following annual cash retainers are paid under the Director Compensation Program:
| • | Each non-employee director receives an annual cash retainer in the amount of $45,000; |
| • | The Audit Committee chairperson receives additional annual compensation in the amount of $15,000 and each non-chairperson member of the Audit Committee receives additional annual cash compensation in the amount of $7,500; |
| • | The Compensation Committee chairperson receives additional annual compensation in the amount of $10,000 and each non-chairperson member of the Compensation Committee receives additional annual cash compensation in the amount of $5,000; and |
| • | The Nominating and Corporate Governance Committee chairperson receives additional annual compensation in the amount of $6,000 and each non-chairperson member of the Nominating and Corporate Governance Committee receives additional annual cash compensation in the amount of $3,000. |
For the year ended December 31, 2016, the annual cash retainers were pro-rated for the period from September 22, 2016, the date our shares commenced trading on the NYSE, to December 31, 2016.
90
Table of Contents
Initial and Annual Director Equity Awards
Each non-employee director who is elected or appointed to serve on our Board after the initial public offering will be granted restricted stock units in an amount equal to (i) $140,000 divided by (ii) the fair market value of a share of our common stock as of the date of the appointment or election, pro-rated for such director’s service until the next annual meeting of our stockholders (the “Initial Award”). In addition, each non-employee director who continues to serve on our Board immediately following any annual meeting of our stockholders will be granted, on the date of the annual meeting, that number of restricted stock units calculated by dividing (i) $140,000 by (ii) the fair market value of a share of our common stock as of such date (the “Annual Award”). In each case, the fair market value will be determined pursuant to the terms of the 2016 Plan, or any other applicable equity incentive plan that we maintain at such time.
Each Initial Award will vest in full upon the earlier of the date of the first annual meeting of our stockholders occurring after the Initial Award is granted or the first anniversary of the annual meeting of our stockholders immediately preceding the date on which the Initial Award is granted. Each Annual Award will vest in full on the earlier of the first anniversary of the date of grant, or immediately prior to the next annual meeting of our stockholders occurring after the Annual Award is granted. In each case, vesting will be subject to the non-employee director continuing to provide services to us through the applicable vesting date.
Under the Director Compensation Program, all Initial Awards and Annual Awards, and any other stock options or other equity-based awards then held by a non-employee director, will vest and, if applicable, become exercisable in full immediately prior to the occurrence of a change in control (as defined in the 2016 Plan).
2016 Director Compensation Table
The following table summarizes the cash and equity compensation received by our non-employee directors who served for all or a portion of the year ended December 31, 2016. We do not offer our non-employee directors any perquisites or other forms of compensation. However, we do reimburse all directors for their reasonable expenses incurred in connection with their activities as directors.
| Name |
Fees Earned or ($)(1) |
Option Awards ($)(2) |
Total ($) |
|||||||||
| Lauren Cooks Levitan(3) |
13,875.00 | 89,449.90 | 103,324.90 | |||||||||
|
|
||||||||||||
| William E. McGlashan, Jr. |
— | — | — | |||||||||
|
|
||||||||||||
| Kirk L. Perry(4) |
11,250.00 | 219,399.30 | $ | 230,649.30 | ||||||||
|
|
||||||||||||
| Joseph A. Shamah(5) |
— | — | — | |||||||||
|
|
||||||||||||
| Amy Shenkan(6) |
— | — | — | |||||||||
|
|
||||||||||||
| Sabrina L. Simmons(7) |
14,134.62 | 119,000.90 | 133,135.52 | |||||||||
|
|
||||||||||||
| Maureen C. Watson |
12,750.00 | 46,875.00 | 59,625.00 | |||||||||
|
|
||||||||||||
| Richard G. Wolford |
15,240.38 | 48,125.00 | 63,365.38 | |||||||||
|
|
||||||||||||
| (1) | Amount reflects the compensation paid as annual cash retainers. For the year ended December 31, 2016, annual cash retainers were pro-rated for the period from September 22, 2016, the date our shares commenced trading on the NYSE, to December 31, 2016. |
| (2) | Amounts represent (i) the grant date fair values of stock options granted to Mses. Levitan and Simmons under our 2014 Equity Incentive Plan (the “2014 Equity Plan”) and to Mr. Perry under the 2016 Plan, each calculated in accordance with FASB Topic 718, disregarding the effects of estimated forfeitures and (ii) the incremental fair value of an adjustment to the exercise prices of outstanding options, which was approved in June 2016 in connection with a special dividend, totaling $36,125, $46,875, and $48,125 for Mses. Simmons and Watson and Mr. Wolford, respectively. As a result of the adjustment, the exercise price of each outstanding option as of June 7, 2016 was reduced by $1.79, the amount of the per share dividend declared on June 7, 2016. For a discussion of the assumptions used to calculate the value of our stock options, see Note 13 of Notes to Consolidated Financial Statements included elsewhere in this prospectus. As of December 31, 2016, Mses. Levitan, Simmons and Watson and Messrs. Perry and Wolford each held a stock option exercisable for 34,500 shares of our common stock. |
| (3) | Ms. Levitan was appointed to our Board effective as of June 23, 2016. |
| (4) | Mr. Perry was appointed to our Board effective as of September 7, 2016. |
| (5) | Mr. Shamah resigned from our Board effective March 1, 2017. |
| (6) | Ms. Shenkan resigned from our Board effective April 20, 2016. |
| (7) | Ms. Simmons was appointed to our Board effective as of March 17, 2016. |
91
Table of Contents
Certain relationships and related party transactions
The following is a description of transactions since January 1, 2014 in which the amount involved exceeds $120,000, and in which any of our directors, executive officers or owners of more than 5% of our capital stock, or an affiliate or immediate family member thereof, had or will have a direct or indirect material interest.
Registration rights
We entered into a registration rights agreement (the “Registration Rights Agreement”) on January 31, 2014 with our Sponsor and certain stockholders. The Registration Rights Agreement provides that all stockholders party to the agreement are entitled to participate in certain offerings of the Company’s securities registered under the Securities Act, subject to certain exceptions, and provides for “demand” and “piggyback” registration rights. The Registration Rights Agreement also provides that we will pay certain expenses of these stockholders relating to such registrations and indemnify them against certain liabilities that may arise under the Securities Act.
Stockholders Agreement
We entered into a stockholders agreement on January 31, 2014 with TPG Growth, J.A. Cosmetics Corp. and certain other stockholders, as amended and restated in connection with our initial public offering by that certain amended and restated stockholders agreement, dated as of September 21, 2016, as amended by that certain amendment thereto, dated as of December 23, 2016. On March 3, 2017, we entered into a second amended and restated stockholders agreement with TPG Growth, J.A. Cosmetics Corp., Joseph Shamah, our executive officers and certain other equity holders (the “Stockholders Agreement”), which contains provisions related to the composition of our board of directors, the committees of our board of directors and our corporate governance. Our board of directors is currently comprised of seven directors, (i) three of whom have been designated by TPG Growth, (ii) one of whom is the Chief Executive Officer and (iii) three of whom meet the independence criteria set forth in Rule 10A-3 under the Exchange Act. Pursuant to the terms of the Stockholders Agreement, TPG Growth has the right to designate up to three members of our board of directors so long as it holds at least 30% of our outstanding common stock, two members of our board of directors so long as it holds less than 30% but greater than or equal to 20% of our outstanding common stock, and one member of our board of directors so long as it holds less than 20% but greater than or equal to 5% of our outstanding common stock. In addition, subject to applicable laws and stock exchange regulations, TPG Growth has the right to have a representative appointed to serve on each committee of our board of directors other than the audit committee for so long as TPG Growth has the right to designate at least one director for election to our board of directors. Pursuant to the Stockholders Agreement, after giving effect to this offering (and assuming no exercise of the underwriters’ option to purchase additional shares), the holders of approximately 60% of our outstanding common stock have agreed to vote their shares in favor of individuals designated to serve on our board of directors by TPG Growth, and the holders of approximately 27% of our outstanding common stock have granted an irrevocable proxy to TPG Growth that gives it sole voting power with respect to matters relating to the composition of our board of directors and the right of TPG Growth to appoint members of our board of directors, for so long as TPG Growth has the right to designate at least one member of our board of directors. To the extent not inconsistent with Section 141(k) of the DGCL and our amended and restated certificate of incorporation, any director who is nominated by TPG Growth may only be removed by TPG Growth, and if TPG Growth provides notice of its desire to remove one of its nominated directors, our board of directors and the other parties to the Stockholders Agreement shall take all reasonable action necessary to effect such removal.
In addition, the Stockholders Agreement provides that for as long as TPG Growth owns or holds, directly or indirectly, at least 30% of the shares of our outstanding common stock, we must obtain the consent of TPG Growth before we or our subsidiaries are permitted to take any of the following actions:
| • | authorize, issue or enter into any agreement providing for the issuance (contingent or otherwise) of (x) any notes or debt securities with options, warrants or other rights to acquire equity securities or otherwise containing profit participation features or (y) any equity securities other than equity securities issued to employees, directors, consultants or advisors pursuant to a plan, agreement or arrangement approved by our board of directors; |
| • | liquidate, dissolve or effect a recapitalization or reorganization in any form of transaction or series of transactions; |
| • | incur any indebtedness in an aggregate amount in excess of $50.0 million (other than indebtedness under the terms and provisions of the Senior Secured Credit Facility); and |
| • | increase or decrease the size of our board of directors. |
92
Table of Contents
The Stockholders Agreement provides TPG Growth with certain information rights to receive our quarterly and annual financial statements so long as it has the right to designate at least one member of our board of directors. In addition, for so long as TPG Growth holds at least 5% of our outstanding common stock, TPG Growth will be permitted to review our books and records and to discuss our affairs, finances and condition with our officers.
The Stockholders Agreement further provides that it shall not preclude or in any way restrict TPG Growth or any of its affiliates from investing or participating in any particular enterprise, or trading in the securities thereof, whether or not such enterprise has products or services that compete with our products and services. The Company and the equity holders party to the Stockholders Agreement have waived, in perpetuity, any and all claims in connection with the doctrine of corporate opportunity (or any similar doctrine).
Management Services Agreement
We entered into a management services agreement (the “Management Services Agreement”) with TPG Growth on January 31, 2014 whereby TPG Growth agreed to provide certain financial and strategic advisory services and consulting services. We have agreed to indemnify TPG Growth and, among others, its employees, stockholders and affiliates, against all actions, suits, claims, liabilities, losses, damages, costs and out-of-pocket expenses incurred as a result the Management Services Agreement or TPG Growth’s initial investment in the Company.
The Management Services Agreement terminated on September 27, 2016 upon the consummation of our initial public offering. Upon the termination, and in accordance with the terms of the agreement, we paid TPG Growth the net present value of the remaining portion of any management and consulting fees owed through December 31, 2016 as well as certain other expenses of TPG Growth. Under the Management Services Agreement, we incurred management and consulting fees of $0.8 million, $0.9 million and $0.9 million in the Successor 2014 Period and the years ended December 31, 2015 and 2016, respectively.
Director and executive officer compensation
Please see “Executive compensation” for information regarding compensation of directors and executive officers.
Employment agreements
We have entered into employment agreements with our executive officers. For more information regarding these agreements, see “Executive compensation—Summary compensation table.”
Indemnification agreements and directors’ and officers’ liability insurance
We have entered into indemnification agreements with each of our directors and executive officers. These agreements require us to, among other things, indemnify each director and executive officer to the fullest extent permitted by Delaware law, including indemnification of expenses such as attorneys’ fees incurred by the director or executive officer in any action or proceeding, including any action or proceeding by or in right of us, arising out of the person’s services as a director or executive officer. We have obtained an insurance policy that insures our directors and officers against certain liabilities, including liabilities arising under applicable securities laws.
Other transactions
On January 25, 2016 and July 22, 2016, we loaned Tarang P. Amin, our Chief Executive Officer, Director and Chairman, $6.6 million at an interest rate of 0.75% and $1.5 million at an interest rate of 0.71%, respectively. The proceeds of the loans were used to finance the exercise price of Mr. Amin’s options to purchase common stock. As collateral for the loans, an aggregate of 2,640,637 shares of common stock beneficially owned by Mr. Amin were pledged to the Company pursuant to pledge and security agreements dated January 25, 2016 and July 22, 2016. In connection with the special dividend declared on June 7, 2016 (as described under “Dividend policy”), the outstanding amount of the loan provided on January 25, 2016 was reduced to $4.2 million. The loans were repaid in full on August 24, 2016.
93
Table of Contents
On January 25, 2016, we loaned Scott K. Milsten, our Senior Vice President, General Counsel and Corporate Secretary, $1.0 million at an interest rate of 0.75%. The proceeds of the loan were used to finance the exercise price of Mr. Milsten’s options to purchase common stock. As collateral for the loan, 267,720 shares of common stock beneficially owned by Mr. Milsten were pledged to the Company pursuant to a pledge and security agreement dated January 25, 2016. In connection with the special dividend declared on June 7, 2016, the outstanding amount of the loan was reduced to $0.6 million. The loan was repaid in full on August 22, 2016.
On February 9, 2016, we loaned John P. Bailey, our President and Chief Financial Officer, $2.2 million at an interest rate of 0.81%. The proceeds of the loan were used to finance the exercise price of Mr. Bailey’s options to purchase common stock. As collateral for the loan, 617,872 shares of common stock beneficially owned by Mr. Bailey were pledged to the Company pursuant to a pledge and security agreement dated February 9, 2016. In connection with the special dividend declared on June 7, 2016, the outstanding amount of the loan was reduced to $1.1 million. The loan was repaid in full on August 22, 2016.
On October 11, 2016, we entered into a sublease agreement with Fit for Life, LLC pursuant to which we subleased certain office and showroom space in New York, New York. The annual base rent for the sublease is approximately $0.3 million per year and the sublease has a term of 39 months. Joseph A. Shamah, a former member of our board of directors and a director and stockholder of J.A. Cosmetics Corp, the holder of approximately 11% of our outstanding common stock after giving effect to this offering, is the Chief Executive Officer of Fit for Life, LLC.
On February 13, 2017, we entered into an indemnification agreement with Joseph A. Shamah, a former member of our board of directors, and J.A. Cosmetics Corp., pursuant to which each of Mr. Shamah and J.A. Cosmetics Corp. jointly and severally agreed to indemnify the Company for and against any and all losses and expenses incurred by the Company in connection with a pending third-party commercial litigation.
The brother-in-law of John P. Bailey, our President and Chief Financial Officer, is as an employee of the Company. The approximate dollar value of the employee’s total compensation, including equity awards, for the year ended December 31, 2016 was $0.4 million.
Alan Shamah, our former president, is the father of Joseph A. Shamah, a former member of our board of directors. The approximate dollar value of Alan Shamah’s total compensation, including equity awards, for the combined Predecessor 2014 and Successor 2014 periods and the year ended December 31, 2015 was $0.6 million and $0.4 million, respectively. Mr. Shamah’s total compensation, including equity awards, during the year ended December 31, 2016 was zero.
Cosmopack LLC and Promotions Plus, each a related party entity owned by a relative of Frank Pisani, a former executive officer, managed until May 2016 our distribution and fulfillment operations at our New Jersey warehouse. In December 2014, Mr. Pisani concluded his employment with the Company. We incurred $4.1 million, $6.1 million and $3.0 million for these services during the combined Predecessor 2014 and Successor 2014 periods and the years ended December 31, 2015 and 2016, respectively.
Policies and procedures for related party transactions
Our board of directors has adopted a written related person transaction policy to set forth the policies and procedures for the review and approval or ratification of related person transactions. The policy covers, with certain exceptions set forth in Item 404 of Regulation S-K, any transaction, arrangement or relationship, or any series of similar transactions, arrangements or relationships in which we were or are to be a participant, where the amount involved exceeds $120,000 and a related person had, has or will have a direct or indirect material interest, including, without limitation, purchases of goods or services by or from the related person or entities in which the related person has a material interest, indebtedness, guarantees of indebtedness and employment by us of a related person.
Under the policy, the audit committee is responsible for reviewing and approving in advance the related party transactions covered by our related transaction policies and procedures.
94
Table of Contents
Principal and selling stockholders
The following table contains information about the beneficial ownership of our common stock as of March 1, 2017, (i) immediately prior to the consummation of this offering and (ii) as adjusted to reflect the sale of shares of our common stock offered by this prospectus by:
| • | each person, or group of persons, known to us who beneficially owns more than 5% of our capital stock; |
| • | each named executive officer; |
| • | each of our directors; |
| • | all directors and executive officers as a group; and |
| • | each selling stockholder. |
Our calculation of the percentage of beneficial ownership prior to and after the offering is based on 45,655,937 shares of common stock outstanding on March 1, 2017.
Beneficial ownership and percentage ownership are determined in accordance with the rules and regulations of the SEC and include voting or investment power with respect to shares of stock. This information does not necessarily indicate beneficial ownership for any other purpose. In computing the number of shares beneficially owned by a person and the percentage ownership of that person, shares of common stock subject to restrictions, options or warrants held by that person that are currently exercisable or exercisable within 60 days of March 1, 2017 are deemed outstanding. In addition, restricted stock units that vest within 60 days of March 1, 2017 are deemed to be beneficially owned by the individual holding the restricted stock units. Such shares are not deemed outstanding for the purposes of computing the percentage ownership of any other person. Except as indicated in the footnotes to the following table or pursuant to applicable community property laws, we believe, based on information furnished to us, that each stockholder named in the table has sole voting and investment power with respect to the shares set forth opposite such stockholder’s name.
Pursuant to the Stockholders Agreement, after giving effect to this offering (and assuming no exercise of the underwriters’ option to purchase additional shares), the holders of approximately 60% of our outstanding common stock have agreed to vote their shares in favor of individuals designated to serve on our board of directors by our Sponsor, and the holders of approximately 27% of our outstanding common stock have granted an irrevocable proxy to our Sponsor that gives it sole voting power with respect to matters relating to the composition of our board of directors and the rights of our Sponsor to appoint members of our board of directors, for so long as our Sponsor has the right to designate at least one member of our board of directors. For further information regarding the Stockholders Agreement and other material transactions between us and certain of our stockholders, see “Certain relationships and related party transactions.”
95
Table of Contents
Unless otherwise indicated in the footnotes, the address of each of the individuals named below is: c/o e.l.f. Beauty, Inc., 570 10th Street, Oakland, California 94607.
| Shares beneficially owned prior to the offering |
Shares Being Offered† |
Shares beneficially owned after the offering | ||||||||||||||||||||||||
| Excluding exercise of the underwriters’ option to purchase additional shares |
Including exercise of the underwriters’ option to purchase additional shares | |||||||||||||||||||||||||
| Name of beneficial owner | Number | Percent | Number | Number | Percent | Number | Percent | |||||||||||||||||||
| Greater than 5% Stockholders: |
||||||||||||||||||||||||||
| Parties to the Stockholders Agreement (1) |
35,379,345 | 73.6% | 6,618,128 | 28,761,217 | 59.8% | 28,271,651 | 58.8% | |||||||||||||||||||
| TPG elf Holdings, L.P. (2)(3) |
19,304,548 | 42.3% | 4,317,560 | 14,986,988 | 32.8% | 14,622,075 | 32.0% | |||||||||||||||||||
| J.A. Cosmetics Corp. (3)(4) |
6,422,098 | 14.1% | 1,302,630 | 5,119,468 | 11.2% | 4,994,815 | 10.9% | |||||||||||||||||||
| Named Executive Officers and Directors: |
||||||||||||||||||||||||||
| Tarang P. Amin (3)(5) |
5,927,523 | 12.8% | 463,000 | 5,464,523 | 11.8% | 5,464,523 | 11.8% | |||||||||||||||||||
| John P. Bailey (3)(6) |
1,453,351 | 3.1% | 271,714 | 1,181,637 | 2.5% | 1,181,637 | 2.5% | |||||||||||||||||||
| Scott K. Milsten (3)(7) |
772,861 | 1.7% | 91,000 | 681,861 | 1.5% | 681,861 | 1.5% | |||||||||||||||||||
| Lauren Cooks Levitan (8) |
34,500 | * | — | 34,500 | * | 34,500 | * | |||||||||||||||||||
| William E. McGlashan (9) |
— | — | — | — | — | — | — | |||||||||||||||||||
| Kirk L. Perry |
— | — | — | — | — | — | * | |||||||||||||||||||
| Sabrina Simmons (10) |
34,500 | * | — | 34,500 | * | 34,500 | — | |||||||||||||||||||
| Maureen Watson (11) |
34,500 | * | — | 34,500 | * | 34,500 | * | |||||||||||||||||||
| Richard G. Wolford (12) |
34,500 | * | — | 34,500 | * | 34,500 | * | |||||||||||||||||||
| All executive officers and directors as a group (11 persons) (13) |
8,995,555 | 18.8% | 825,714 | 8,169,841 | 17.1% | 8,169,841 | 17.1% | |||||||||||||||||||
| Other Selling Stockholders: |
||||||||||||||||||||||||||
| MRS Trust Dated 03/26/2007 (3)(14) |
551,999 |
|
1.2% | 123,457 | 428,542 | * | 418,108 | * | ||||||||||||||||||
| Entities Affiliated with PennantPark (3)(15) |
1,103,997 |
|
2.4% | 246,915 | 857,082 | 1.9% | 307,082 | * | ||||||||||||||||||
| Joseph A. Shamah (3)(16) |
6,908,210 | 15.1% | 1,388,742 | 5,519,468 | 12.1% | 5,394,815 | 11.8% | |||||||||||||||||||
| Alan Shamah (3)(17) |
6,908,210 | 15.1% | 1,388,742 | 5,519,468 | 12.1% | 5,394,815 | 11.8% | |||||||||||||||||||
| Claudia Williams (3)(18) |
41,400 | * | 11,500 | 29,900 | * | 29,900 | * | |||||||||||||||||||
|
| ||||||||||||||||||||||||||
| * | Less than 1% |
| † | If the underwriters exercise their option to purchase additional shares in full, certain selling stockholders will sell a total of 1,050,000 additional shares in the offering. |
| (1) | Pursuant to the Stockholders Agreement, (a) J.A. Cosmetics Corp. (“JAC”) and certain other parties have agreed to vote their shares in favor of individuals designated to serve on our board of directors by TPG elf Holdings, L.P. and (b) JAC, Mr. Amin and his family trusts and certain other parties have granted an irrevocable proxy in respect of all (or certain, in the case of Mr. Amin and his family trusts) of their shares of our common stock to TPG elf Holdings, L.P. (or its permitted transferees), for so long as TPG elf Holdings, L.P. has the right to designate at least one member of our board of directors, to vote all of the shares of the common stock held by such entity or individual in connection with matters relating to the composition of our board of directors and the right of TPG elf Holdings, L.P. to appoint members of our board of directors; provided, that such proxy will terminate with respect to Mr. Amin and his affiliated holders if and when he is no longer an executive officer, director or holder of more than 10% of any class of our equity securities. |
| (2) | Based on a Schedule 13G filed on February 13, 2017 by TPG Growth II Advisors, Inc., and its sole shareholders, David Bonderman and James G. Coulter. As a result of the voting obligations and irrevocable proxy set forth in the Stockholders Agreement, TPG elf Holdings, L.P. (“TPG elf”) may be deemed to be the beneficial owner of an additional 16,074,797 shares held by certain other parties to the agreement. TPG Growth II Advisors, Inc. is the general partner of TPG elf, which directly holds 19,304,548 shares of our common stock. As the sole shareholders of TPG Growth II Advisors, Inc., Messrs. Bonderman and Coulter may be deemed to beneficially own the securities held by TPG elf Holdings, L.P. Messrs. Bonderman and Coulter disclaim beneficial ownership of the securities held by TPG elf Holdings, L.P. except to the extent of their |
96
Table of Contents
| pecuniary interest. TPG elf will sell 4,317,560 shares of common stock in this offering; if the underwriters exercise their option to purchase additional shares in full, TPG elf would sell an additional 364,913 shares of common stock in this offering. The address of each of TPG Growth II Advisors, Inc. and Messrs. Bonderman and Coulter is c/o TPG Global, LLC, 301 Commerce Street, Suite 3300, Fort Worth, Texas 76102. |
| (3) | Selling stockholder in the offering. |
| (4) | Joseph A. Shamah, Alan Shamah and Frank Pisani have shared investment and dispositive power over the shares held by JAC. JAC will sell 1,302,630 shares of common stock in this offering; if the underwriters exercise their option to purchase additional shares in full, JAC would sell an additional 124,653 shares of common stock in this offering. The address of JAC is 1393 East 7th Street, Brooklyn, New York 11230. |
| (5) | Tarang P. Amin and Hirni Amin share beneficial ownership of 2,759,997 shares of common stock held by various family trusts for which they serve as co-trustees and over which they each have sole investment and voting power. Mr. Amin has the sole power to vote and dispose of 3,167,526 shares of common stock, including 476,888 shares of common stock underlying stock options exercisable within 60 days of March 1, 2017 held by Mr. Amin. Mr. Amin will sell 463,000 shares of common stock in this offering and will not sell any additional shares in this offering if the underwriters exercise their option to purchase additional shares. |
| (6) | Includes (a) 617,872 shares of common stock held by the Bailey Family Trust dated April 3, 2015 (the “Bailey Trust”), (b) 121,200 shares of common stock held by John P. Bailey and (c) 714,279 shares of common stock underlying stock options exercisable within 60 days of March 1, 2017 held by Mr. Bailey. The Bailey Trust will sell 271,714 shares of common stock in this offering and will not sell any additional shares in this offering if the underwriters exercise their option to purchase additional shares. |
| (7) | Includes (a) 179,399 shares of common stock held by Milsten/Conner Trust dated October 17, 2008, (b) 328,320 shares of common stock held by Scott K. Milsten and (c) 265,142 shares of common stock underlying stock options exercisable within 60 days of March 1, 2017 held by Mr. Milsten. Mr. Milsten will sell 91,000 shares of common stock in this offering and will not sell any additional shares in this offering if the underwriters exercise their option to purchase additional shares. |
| (8) | Includes 34,500 shares of common stock underlying stock options exercisable within 60 days of March 1, 2017 held by Lauren Cooks Levitan. |
| (9) | William E. McGlashan, Jr. is a TPG Partner. Mr. McGlashan has no voting or investment power over, and disclaims beneficial ownership of, the shares held by TPG elf Holdings, L.P. The address of Mr. McGlashan is c/o TPG Global, LLC, 301 Commerce Street, Suite 3300, Fort Worth, Texas 76102. |
| (10) | Includes 34,500 shares of common stock underlying stock options exercisable within 60 days of March 1, 2017 held by Sabrina L. Simmons. |
| (11) | Includes 34,500 shares of common stock underlying stock options exercisable within 60 days of March 1, 2017 held by Maureen C. Watson. |
| (12) | Includes 34,500 shares of common stock underlying stock options exercisable within 60 days of March 1, 2017 held by Richard G. Wolford. |
| (13) | Consists of 6,767,825 shares of common stock and 2,227,730 shares that may be acquired pursuant to the exercise of stock options within 60 days of March 1, 2017. |
| (14) | Shares held prior to the offering consists of 551,999 shares of common stock held by MRS Trust Dated 03/26/2007 (“MRS Trust”). MRS Trust will sell 123,457 shares of common stock in this offering; if the underwriters exercise their option to purchase additional shares in full, MRS Trust would sell an additional 10,434 shares of common stock in this offering. Thomas Hagerty, as trustee, and Mitchell Otolski, as agent, have voting and dispositive power over securities held by MRS Trust. The address of MRS Trust is c/o Thomas Hagerty, 100 Federal St., Boston, MA 02110. |
| (15) | Shares held prior to the offering consists of (i) 938,399 shares of common stock held by PennantPark Investment Corporation (“Investment Corp”), (ii) 110,399 shares of common stock held by PennantPark Floating Rate Capital Ltd. (“Floating Rate”) and (iii) 55,199 shares of common stock held by PennantPark Credit Opportunities Fund II LP (“Opportunities”, and together with Investment Corp and Floating Rate, the “PennantPark Entities”). The PennantPark Entities acted as creditors to us under that certain Second Lien Credit Agreement, dated as of January 31, 2014 (the “Credit Agreement”), by and among the Company, U.S. Bank National Association, as collateral agent, and the lenders from time to time party thereto. The Credit Agreement was paid off in full on December 23, 2016. Investment Corp, Floating Rate and Opportunities will sell 209,878, 24,691 and 12,346 shares of common stock in this offering, respectively; if the underwriters exercise their option to purchase additional shares in full, Investment Corp, Floating Rate and Opportunities would sell an additional 467,500, 55,000 and 27,500 shares of common stock in this offering, respectively. The address of each of Investment Corp, Floating Rate and Opportunities is 590 Madison Avenue, 15th Floor, New York, NY 10022. |
| (16) | Shares held prior to the offering consists of (i) 86,112 shares of common stock held directly by Joseph A. Shamah, (ii) 6,422,098 shares of common stock held by JAC, (iii) 100,000 shares of common stock held by Morgan Stanley Global ImpactFunding Trust, Inc. (“ImpactFunding Trust”) and (iv) 300,000 shares of common stock held by the A&H Shamah Family Foundation (“Family Foundation”). Joseph A. Shamah, Alan Shamah and Frank Pisani have shared voting, investment and dispositive power over the shares held by JAC, and Joseph A. Shamah and Alan Shamah have shared voting, investment and dispositive power over the shares held by ImpactFunding Trust and Family Foundation. Joseph A. Shamah will sell 86,112 shares of common stock in this offering and will not sell any additional shares in this offering if the underwriters exercise their option to purchase additional shares. Joseph A. Shamah served on our board of directors from January 2014 until March 2017. The address of Joseph A. Shamah is 10 West 33rd Street, New York, New York 10001. |
| (17) | Shares held prior to the offering consists of (i) 86,112 shares of common stock held directly by Alan Shamah, (ii) 6,422,098 shares of common stock held by JAC, (iii) 100,000 shares of common stock held by ImpactFunding Trust and (iv) 300,000 shares of common stock held by Family Foundation. Joseph A. Shamah, Alan Shamah and Frank Pisani have shared voting, investment and dispositive power over the shares held by JAC, and Joseph A. Shamah and Alan Shamah have shared voting, investment and dispositive power over the shares held by ImpactFunding Trust and Family Foundation. Alan Shamah will sell 86,112 shares of common stock in this offering and will not sell any additional shares in this offering if the underwriters exercise their option to purchase additional shares. Alan Shamah previously served as our president from January 2014 to December 2015. The address of Alan Shamah is 10 West 33rd Street, New York, New York 10001. |
| (18) | Consists of 41,400 shares that may be acquired pursuant to the exercise of stock options within 60 days of March 1, 2017. Ms. Williams will sell 11,500 shares of common stock in this offering and will not sell any additional shares in this offering if the underwriters exercise their option to purchase additional shares. |
97
Table of Contents
The following description summarizes the terms of our capital stock, our amended and restated certificate of incorporation and our amended and restated bylaws. Because it is only a summary, it does not contain all the information that may be important to you. For a complete description, you should refer to our amended and restated certificate of incorporation and amended and restated bylaws, the forms of which are incorporated by reference as exhibits to the registration statement of which this prospectus is a part.
Our purpose is to engage in any lawful act or activity for which corporations may now or hereafter be organized under the DGCL. Our authorized capital stock consists of 250,000,000 shares of common stock, par value $0.01 per share, and 30,000,000 shares of preferred stock, par value $0.01 per share. As of December 31, 2016, there were outstanding 45,276,137 shares of common stock held of record by 31 stockholders. In addition, 5,482,249 shares of our common stock were issuable upon exercise of outstanding options and 586,224 shares of common stock were issuable upon vesting of outstanding restricted stock units granted under the 2014 Equity Incentive Plan (the “2014 Plan”) and the 2016 Plan. As of December 31, 2016, no shares of preferred stock were issued or outstanding. Unless our board of directors determines otherwise, we will issue all shares of our capital stock in uncertificated form.
In connection with the offering related to this prospectus, we and our executive officers, directors and the selling stockholders have signed lock-up agreements with the underwriters that, subject to certain customary exceptions, restrict the sale of the shares of our common stock and certain other securities held by them. The lock-up agreements expire 90 days after the date of this prospectus. J.P. Morgan Securities LLC and Morgan Stanley & Co. LLC may, in their sole discretion and at any time without notice, release all or any portion of the shares or securities subject to any such lock-up agreements. See “Underwriting” for a description of these lock-up agreements.
Common stock
Holders of our common stock are entitled to one vote for each share held of record on all matters on which stockholders are entitled to vote generally, including the election or removal of directors. The holders of our common stock do not have cumulative voting rights in the election of directors. Upon our liquidation, dissolution or winding up and after payment in full of all amounts required to be paid to creditors and to the holders of preferred stock having liquidation preferences, if any, the holders of our common stock will be entitled to receive pro rata our remaining assets available for distribution. Holders of our common stock do not have preemptive, subscription, redemption or conversion rights. The common stock is not be subject to further calls or assessment by us. There are no redemption or sinking fund provisions applicable to the common stock. All outstanding shares of our common stock are fully paid and non-assessable. The rights, powers, preferences and privileges of holders of our common stock will be subject to those of the holders of any shares of our preferred stock we may authorize and issue in the future.
Preferred stock
Our amended and restated certificate of incorporation authorizes our board of directors to establish one or more series of preferred stock, including convertible preferred stock. Unless required by law, the authorized shares of preferred stock are available for issuance without further action by stockholders. Our board of directors is able to determine, with respect to any series of preferred stock, the powers including preferences and relative participations, optional or other special rights, and the qualifications, limitations or restrictions thereof, of that series, including, without limitation:
| • | the designation of the series; |
| • | the number of shares of the series, which our board of directors may, except where otherwise provided in the preferred stock designation, increase (but not above the total number of authorized shares of the class) or decrease (but not below the number of shares then outstanding); |
| • | whether dividends, if any, will be cumulative or non-cumulative and the dividend rate of the series; |
| • | the dates at which dividends, if any, will be payable; |
| • | the redemption rights and price or prices, if any, for shares of the series; |
| • | the terms and amounts of any sinking fund provided for the purchase or redemption of shares of the series; |
98
Table of Contents
| • | the amounts payable on shares of the series in the event of any voluntary or involuntary liquidation, dissolution or winding-up of the affairs of the Company; |
| • | whether the shares of the series will be convertible into shares of any other class or series, or any other security, of the Company or any other corporation and, if so, the specification of the other class or series or other security, the conversion price or prices or rate or rates, any rate adjustments, the date or dates as of which the shares will be convertible and all other terms and conditions upon which the conversion may be made; |
| • | restrictions on the issuance of shares of the same series or of any other class or series; and |
| • | the voting rights, if any, of the holders of the series. |
We are able to issue a series of preferred stock that could, depending on the terms of the series, impede or discourage an acquisition attempt or other transaction that some, or a majority, of the holders of our common stock might believe to be in their best interests or in which the holders of our common stock might receive a premium for their common stock over the market price of the common stock. In addition, the issuance of preferred stock may adversely affect the rights of holders of our common stock by restricting dividends on the common stock, diluting the voting power of the common stock or subordinating the liquidation rights of the common stock. As a result of these or other factors, the issuance of preferred stock may have an adverse impact on the market price of our common stock.
Dividends
The DGCL permits a corporation to declare and pay dividends out of “surplus” or, if there is no “surplus,” out of its net profits for the fiscal year in which the dividend is declared and/or the preceding fiscal year. “Surplus” is defined as the excess of the net assets of the corporation over the amount determined to be the capital of the corporation by the board of directors. The capital of the corporation is typically calculated to be (and cannot be less than) the aggregate par value of all issued shares of capital stock. Net assets equal the fair value of the total assets minus total liabilities. The DGCL also provides that dividends may not be paid out of net profits if, after the payment of the dividend, remaining capital would be less than the capital represented by the outstanding stock of all classes having a preference upon the distribution of assets.
The declaration, amount and payment of any future dividends is at the sole discretion of our board of directors. Our board of directors may take into account general and economic conditions, our financial condition and results of operations, our available cash and current and anticipated cash needs, capital requirements, contractual, legal, tax and regulatory restrictions and implications on the payment of dividends by us to our stockholders or by our subsidiaries to us, including restrictions under our existing credit facilities and other indebtedness we may incur, and such other factors as our board of directors may deem relevant. See “Description of certain indebtedness.” In addition, because we are a holding company and have no direct operations, we are only able to pay dividends from funds we receive from our subsidiaries.
We currently expect to retain all future earnings for use in the operation and expansion of our business and have no current plans to pay dividends.
Annual stockholder meetings
Our amended and restated bylaws provide that annual stockholder meetings are to be held at a date, time and place, if any, as exclusively selected by our board of directors. To the extent permitted under applicable law, we may conduct meetings by remote communications, including by webcast.
Anti-takeover effects of certain provisions of our amended and restated certificate of incorporation, amended and restated bylaws and Delaware law
Certain provisions of Delaware law and our amended and restated certificate of incorporation and our amended and restated bylaws contain provisions that could make the following transactions more difficult: acquisition of us by means of a tender offer; acquisition of us by means of a proxy contest or otherwise; or removal of our incumbent officers and directors. It is possible that these provisions could make it more difficult to accomplish or could deter transactions that stockholders may otherwise consider to be in their best interest or in our best interests, including transactions that might result in a premium over the market price for our shares.
These provisions, summarized below, are expected to discourage coercive takeover practices and inadequate takeover bids. These provisions are also designed to encourage persons seeking to acquire control of us to first negotiate with our board of
99
Table of Contents
directors. We believe that the benefits of increased protection of our potential ability to negotiate with the proponent of an unfriendly or unsolicited proposal to acquire or restructure us outweigh the disadvantages of discouraging these proposals because negotiation of these proposals could result in an improvement of their terms.
Delaware anti-takeover statute
After such time as the Trigger Event occurs, we will be subject to Section 203 of the DGCL, which prohibits persons deemed to be interested stockholders from engaging in a business combination with a publicly-held Delaware corporation for three years following the date these persons become interested stockholders unless the business combination is, or the transaction in which the person became an interested stockholder was, approved in a prescribed manner or another prescribed exception applies. Generally, an interested stockholder is a person who, together with affiliates and associates, owns, or within three years prior to the determination of interested stockholder status did own, 15% or more of a corporation’s voting stock. Generally, a business combination includes a merger, asset or stock sale or other transaction resulting in a financial benefit to the interested stockholder. The existence of this provision after the Trigger Event may have an anti-takeover effect with respect to transactions not approved in advance by the board of directors, such as discouraging takeover attempts that might result in a premium over the market price of our common stock.
Undesignated preferred stock
The ability to authorize undesignated preferred stock pursuant to our amended and restated certificate of incorporation makes it possible for our board of directors to issue preferred stock with voting or other rights or preferences that could impede the success of any attempt to change control of us. These and other provisions may have the effect of deterring hostile takeovers or delaying changes in control or management of our Company.
Special stockholder meetings
Our amended and restated certificate of incorporation provides that a special meeting of stockholders may be called at any time by the board of directors or, until the occurrence of the Trigger Event, our Sponsor, but such special meetings may not be called by the stockholders or any other person or persons.
Requirements for advance notification of stockholder nominations and proposals
Our amended and restated bylaws include advance notice procedures with respect to stockholder proposals and the nomination of candidates for election as directors, subject to the Stockholders Agreement, other than nominations made by or at the direction of the board of directors or a committee of the board of directors.
Elimination of stockholder action by written consent
Our amended and restated certificate of incorporation eliminates the right of stockholders to act by written consent without a meeting after the Trigger Event.
Classified board; election and removal of directors; filling vacancies
Our board of directors is divided into three classes. The directors in each class serve for a three-year term, one class being elected each year by our stockholders, with staggered three-year terms. Only one class of directors is elected at each annual meeting of our stockholders, with the other classes continuing for the remainder of their respective three-year terms. Because our stockholders do not have cumulative voting rights, our stockholders holding a majority of the shares of common stock outstanding are able to elect all of our directors. After the completion of this offering, our Sponsor will hold approximately 33% of our common stock and may be deemed to beneficially own approximately 60% of our common stock and J.A. Cosmetics Corp. will hold approximately 11% of our common stock (assuming no exercise of the underwriters option to purchase additional shares). Therefore, together they have the ability to control the composition of our board of directors, among other matters requiring stockholder approval. See “Certain relationships and related party transactions—Stockholders Agreement.” After the Trigger Event, our amended and restated certificate of incorporation provides for the removal of any of our directors only for cause and require a stockholder vote by the holders of at least a 75% of the voting power of the then-outstanding voting stock. For more information on the classified board, see “Management—Composition
100
Table of Contents
of the board of directors.” Furthermore, subject to the Stockholders Agreement, any vacancy on our board of directors, however occurring, including a vacancy resulting from an increase in the size of the board, may only be filled by a resolution of the board of directors unless the board of directors determines that such vacancies shall be filled by the stockholders. This system of electing and removing directors and filling vacancies may tend to discourage a third-party from making a tender offer or otherwise attempting to obtain control of us, because it generally makes it more difficult for stockholders to replace a majority of the directors.
Choice of forum
Our amended and restated certificate of incorporation and our amended and restated bylaws provide that the Court of Chancery of the State of Delaware will be the exclusive forum for any derivative action or proceeding brought on our behalf; any action asserting a breach of fiduciary duty; any action asserting a claim against us arising pursuant to the DGCL, our amended and restated certificate of incorporation or our amended and restated bylaws; or any action asserting a claim against us that is governed by the internal affairs doctrine. Although our amended and restated certificate of incorporation and amended and restated bylaws contain the choice of forum provision described above, it is possible that a court could find that such a provision is inapplicable for a particular claim or action or that such provision is unenforceable.
Corporate opportunities
Our amended and restated certificate of incorporation provides that our Sponsor and its affiliates do not have any duty to refrain from (i) engaging, directly or indirectly, in the same or similar business activities or lines of business as us, including those business activities or lines of business deemed to be competing with us, or (ii) doing business with any of our clients, customers or vendors. In the event that our Sponsor or any of its affiliates acquire knowledge of a potential business opportunity which may be a corporate opportunity for us, they will have no duty to communicate or offer such corporate opportunity to us. Our amended and restated certificate of incorporation also provides that, to the fullest extent permitted by law, neither our Sponsor nor any of its affiliates will be liable to us, for breach of any fiduciary duty or otherwise, by reason of the fact that our Sponsor or any of its affiliates directs such corporate opportunity to another person, or otherwise does not communicate information regarding such corporate opportunity to us, and we have waived and renounced any claim that such business opportunity constituted a corporate opportunity that should have been presented to us. In addition, any member of our board of directors designated by our Sponsor pursuant to the Stockholders Agreement may consider both the interests of our Sponsor and our Sponsor’s obligations under the Stockholders Agreement in exercising such board member’s powers, rights and duties as a director of our company.
Amendment of charter provisions
Before the Trigger Event, the amendment of any of the above provisions in our amended and restated certificate of incorporation will require the affirmative vote of holders of a majority of the voting power of the then-outstanding shares of voting stock. From and after the Trigger Event, the affirmative vote of holders of at least 75% of the voting power of the then-outstanding shares of voting stock will be required to amend certain provisions of our amended and restated certificate of incorporation.
The provisions of the DGCL, our amended and restated certificate of incorporation and our amended and restated bylaws could have the effect of discouraging others from attempting hostile takeovers, provided that we will not be subject to Section 203 of the DGCL until after such time as the Trigger Event occurs (see “Description of capital stock—Delaware anti-takeover statute”). As a consequence, they may also inhibit temporary fluctuations in the market price of our common stock that often result from actual or rumored hostile takeover attempts. These provisions may also have the effect of preventing changes in our management. It is possible that these provisions could make it more difficult to accomplish transactions that stockholders may otherwise deem to be in their best interests.
Limitations on liability and indemnification of officers and directors
The DGCL authorizes corporations to limit or eliminate the personal liability of directors to corporations and their stockholders for monetary damages for breaches of directors’ fiduciary duties, subject to certain exceptions. Our amended and restated certificate of incorporation includes a provision that, to the fullest extent permitted by the DGCL, eliminates the personal liability of directors to us or our stockholders for monetary damages for any breach of fiduciary duty as a director. The effect of these provisions is to eliminate the rights of us and our stockholders, through stockholders’ derivative
101
Table of Contents
suits on our behalf, to recover monetary damages from a director for breach of fiduciary duty as a director, including breaches resulting from grossly negligent behavior. However, exculpation will not apply to any director if the director has acted in bad faith, knowingly or intentionally violated the law, authorized illegal dividends or redemptions or derived an improper benefit from his or her actions as a director.
Further, our amended and restated certificate of incorporation and our amended and restated bylaws provide that we must indemnify and advance expenses to our directors and officers to the fullest extent authorized by the DGCL. We also are expressly authorized to carry directors’ and officers’ liability insurance providing indemnification for our directors, officers and certain employees for some liabilities. We believe that these indemnification and advancement provisions and insurance are useful to attract and retain qualified directors and officers.
The limitation of liability, indemnification and advancement provisions in our amended and restated certificate of incorporation and amended and restated bylaws may discourage stockholders from bringing a lawsuit against directors for breach of their fiduciary duty. These provisions also may have the effect of reducing the likelihood of derivative litigation against directors and officers, even though such an action, if successful, might otherwise benefit us and our stockholders. In addition, your investment may be adversely affected to the extent we pay the costs of settlement and damage awards against directors and officers pursuant to these indemnification provisions.
There is currently no pending material litigation or proceeding involving any of our directors, officers or employees for which indemnification is sought.
Listing
Our common stock is listed on the NYSE under the symbol “ELF.”
Transfer agent and registrar
The transfer agent and registrar for our common stock is Computershare Inc. The transfer agent and registrar’s address is 144 Fernwood Avenue, Edison, New Jersey 08837.
102
Table of Contents
Description of certain indebtedness
Senior Secured Credit Facility
Overview
On December 23, 2016, e.l.f. Cosmetics, Inc., JA 139 Fulton Street Corp., JA 741 Retail Corp., JA Cosmetics Retail, Inc., J.A. RF, LLC and J.A. Cherry Hill, LLC, as borrowers, and e.l.f. Beauty, Inc. as a guarantor entered into a senior secured credit agreement with Bank of Montreal, as the administrative agent, swingline lender and l/c issuer and the lenders from time to time party thereto, which provided a $165 million term loan facility (the “Term Loan Facility”) and a $35 million revolving credit facility (the “Revolving Credit Facility”). The proceeds from the Term Loan Facility were used to refinance the debt of the loan parties; pay related fees, costs and expenses; fund working capital; and for general corporate purposes.
As of December 31, 2016, there were undrawn letters of credit of $0.5 million outstanding under the Revolving Credit Facility and $165.0 million of borrowings outstanding under the Term Loan Facility.
Interest rate and fees
Borrowings under both the Term Loan Facility and the Revolving Credit Facility bear interest, at the borrowers’ option, at either (i) a rate per annum equal to an adjusted LIBOR rate determined by reference to the cost of funds for U.S. dollar deposits for the applicable interest period (subject to a minimum floor of 0.00%) plus an applicable margin ranging from 2.00% to 3.50% depending on the consolidated total net leverage ratio or (ii) a floating base rate plus an applicable margin ranging from 1.00% to 2.50% depending on the consolidated total net leverage ratio. The interest rate on both the Revolving Credit Facility and the Term Loan Facility was 4.5% as of December 31, 2016.
Interest on borrowings under the Senior Secured Credit Facility is payable (i) on the last day of any interest period with respect to LIBOR borrowing with an applicable interest period of three months or less, (ii) every three months with respect to LIBOR borrowings with an interest period of greater than three months or (iii) on the last business day of each March, June, September and December with respect to base rate borrowings. In addition, the Senior Secured Credit Facility requires payment of an unused fee ranging from 0.25% to 0.35% (0.35% through at least March 31, 2017, and potentially adjusting thereafter depending on the consolidated total net leverage ratio) times the average daily amount by which the unutilized commitments under the Revolving Credit Facility exceed the amount outstanding under the Revolving Credit Facility. The unused fee is payable in arrears on the last business day of each quarter. The borrowers are also required to pay customary letter of credit fees (including fronting fees) and annual agency fees as well as an annual administrative fee for the Term Loan Facility.
Prepayments
The Senior Secured Credit Facility requires prepayment of outstanding loans, subject to certain exceptions, with:
| • | 50% (which percentage will be reduced to 25% if our consolidated total net leverage ratio is less than 3.50:1.00 but greater than or equal to 3.00:1.00 and 0% if our consolidated total net leverage ratio is less than 3.00:1.00, in each case as determined as of the last day of the applicable fiscal year and subject to certain reductions) of our annual excess cash flow (defined as EBITDA less certain customary deductions including, without limitation, unfinanced capital expenditures, fees and expenses under loan documents, insurance proceeds and others); |
| • | 100% of the net cash proceeds of all non-ordinary course asset sales or other dispositions of property by the loan parties and their respective subsidiaries (including insurance and condemnation proceeds, subject to de minimis thresholds), (i) if we do not reinvest those net cash proceeds in assets to be used in our business within 365 days of the receipt of such net cash proceeds or (ii) if we do not commit to reinvest such net cash proceeds within 365 days of the receipt thereof and do not actually reinvest such net cash proceeds within 545 days of the receipt thereof; |
| • | 100% of the net proceeds of any issuance or incurrence of debt by the loan parties or any of their respective subsidiaries, other than debt permitted under the Senior Secured Credit Facility; and |
| • | any amounts outstanding under the Revolving Credit Facility in excess of the aggregate revolving credit commitments shall be applied to prepayment of the Revolving Credit Facility. |
The foregoing mandatory prepayments (other than repayment of excess revolving advances, which will be applied to prepayment of the Revolving Credit Facility) are used to first reduce the principal installments of the Term Loan Facility (prepaying the then-next four principal installments in direct order of maturity, then pro rata to the remaining principal installments), second, to the Revolving Credit Facility (without a corresponding reduction in the revolving credit commitment), and third, to cash collateralize the remaining letter of credit obligations. For the year ended
103
Table of Contents
December 31, 2016, we were not required to make any mandatory prepayments. As of December 31, 2016, our consolidated total net leverage ratio was 2.74:1.00.
We may voluntarily repay outstanding loans under the Senior Secured Credit Facility at any time without premium or penalty.
Amortization
Amortization installment payments on the Term Loan Facility are required to be made in quarterly installments of (i) $2,062,500 for each fiscal quarter in 2017 and 2018, (ii) $2,475,000 for each fiscal quarter in 2019, (iii) $3,093,750 for each fiscal quarter in 2020 and (iv) $4,125,000 for the first three fiscal quarters in 2021, with the remaining outstanding amount to be payable on December 23, 2021, the maturity date for the Term Loan Facility. Principal amounts outstanding under the Revolving Credit Facility will be due and payable in full on December 23, 2021, the maturity date for the Revolving Credit Facility.
Guarantee and security
All obligations under the Senior Secured Credit Facility are unconditionally guaranteed by e.l.f. Beauty, Inc. and, subject to certain exceptions, each of our current and future domestic subsidiaries. All obligations under our Senior Secured Credit Facility, and the guarantees of those obligations, are secured by substantially all of the following assets of the each borrower and guarantor, subject to certain exceptions, including:
| • | a pledge of 100% of the capital stock of each of the borrowers and 100% of the equity interests directly held by each borrower and guarantor in any subsidiary of the borrower or guarantor (which pledge, in the case of any (i) non-U.S. subsidiary of a U.S. subsidiary or (ii) certain excluded U.S. subsidiaries, will not include more than 65% of the voting stock of such subsidiary), subject to certain exceptions; and |
| • | a security interest in substantially all tangible and intangible assets (including intellectual property) of each borrower and guarantor, subject to certain exceptions. |
Certain covenants and events of default
The Senior Secured Credit Facility contains a number of covenants that, among other things, restrict the ability of the loan parties and their respective subsidiaries to (subject to certain exceptions):
| • | incur additional indebtedness or issue preferred stock; |
| • | create liens on assets; |
| • | enter into sale and leaseback transactions; |
| • | engage in mergers or consolidations; |
| • | sell or otherwise dispose of assets; |
| • | pay dividends and distributions or repurchase our capital stock; |
| • | make investments, loans or advances; |
| • | repay certain subordinated indebtedness; |
| • | make certain acquisitions; |
| • | engage in certain transactions with affiliates; |
| • | amend material agreements governing subordinated indebtedness; and |
| • | change the line of business. |
The Senior Secured Credit Facility also contains customary representations and warranties, affirmative covenants, notice provisions and events of default, including a change of control. The change of control provision is triggered (a) if any person or group (other than TPG Growth II Advisors, Inc. and its controlled investment affiliates (other than any portfolio company thereof), the individual founders of the e.l.f. cosmetics business identified prior to the closing date, such founders’ respective spouses and descendants, certain estate planning entities of such founders, and any entities that are 100% wholly-owned, directly or indirectly, by such founders (collectively, the “Permitted Holders”) becomes the beneficial owner, directly or indirectly, of voting equity interests representing more than 35% of the voting equity interests of e.l.f. Beauty,
104
Table of Contents
Inc. and a greater percentage of voting equity interests of e.l.f. Beauty, Inc. than is then beneficially owned, directly or indirectly, in the aggregate by the Permitted Holders, unless the Permitted Holders have, at such time, the right or the ability by percentage of voting equity interest of e.l.f. Beauty, Inc. owned, contract or otherwise to elect or designate for election at least a majority of the board of directors of e.l.f. Beauty, Inc., (b) e.l.f. Beauty, Inc. fails to own (i) 100% of the outstanding equity interests of e.l.f. Cosmetics, Inc. (or such entity’s permitted successor, subject to certain conditions) or (ii) directly or indirectly, 100% of the issued and outstanding equity interests of the other borrowers (except as otherwise permitted in the loan documents) and (c) the occurrence of any “change of control” or similar event under any material indebtedness.
The Senior Secured Credit Facility includes quarterly maintenance covenants that require maintenance of (a) a certain consolidated total net leverage ratio of not more than 4.25 to 1.00 for the four-fiscal-quarter period ended March 31, 2017, with gradual step-downs to 2.75 to 1.00 for the four -fiscal-quarter period ending September 30, 2020 and each fiscal quarter thereafter and (b) a certain consolidated fixed charge coverage ratio of not less than 1.15 to 1.00 for the four -fiscal-quarter period ending March 31, 2017 and each fiscal quarter thereafter. The availability of certain baskets and the ability to enter into certain transactions (including the ability of e.l.f. Beauty, Inc. to pay dividends to its stockholders) may also be subject to compliance with such leverage ratios. We were in compliance with the financial covenants in the Senior Secured Credit Facility as of December 31, 2016.
This description of the Senior Secured Credit Facility does not purport to be complete and is qualified in its entirety by reference to the full text of the senior credit documents, which are incorporated by reference as exhibits to the registration statement of which this prospectus is a part.
105
Table of Contents
Shares eligible for future sale
Future sales of substantial amounts of our common stock in the public market or the perception that such sales might occur may adversely affect market prices prevailing from time to time. Furthermore, there may be sales of substantial amounts of our common stock in the public market after the existing legal and contractual restrictions lapse. This may adversely affect the prevailing market price and our ability to raise equity capital in the future. See “Risk factors—Risks related to this offering and ownership of our common stock—Future sales, or the perception of future sales, by us or our existing stockholders in the public market could cause the market price of our common stock to decline.”
As of December 31, 2016, we had a total of 45,276,137 shares of our common stock outstanding. 9,683,333 of the outstanding shares are freely tradable without restriction or registration under the Securities Act, except that any shares held by our affiliates, as that term is defined under Rule 144 of the Securities Act, may be sold only in compliance with the limitations described below. The remaining outstanding 35,592,804 shares of common stock held by existing our stockholders, including our Sponsor and certain of our directors and officers, are deemed restricted securities under the meaning of Rule 144 and may be sold in the public market only if registered or if they qualify for an exemption from registration, including the exemptions pursuant to Rule 144 under the Securities Act, which we summarize below.
Lock-up agreements
After the completion of this offering (assuming no exercise of the underwriters’ option to purchase additional shares), there will be approximately 29,991,821 shares of common stock (including options) held by executive officers, directors and other selling stockholders who are subject to lock-up agreements for a period of 90 days after the date of this prospectus, under which they have agreed not to sell or otherwise dispose of their shares of common stock, subject to certain exceptions. J.P. Morgan Securities LLC and Morgan Stanley & Co. LLC may, in their sole discretion and at any time without notice, release all or any portion of the shares subject to any such lock-up agreements. See “Underwriting.”
Rule 144
In general, under Rule 144, as currently in effect, an affiliate who beneficially owns shares that were purchased from us, or any affiliate, at least six months previously, is entitled to sell, upon the expiration of any applicable lock-up agreement described in “Underwriting,” within any three-month period, a number of shares that does not exceed the greater of 1% of our then-outstanding shares of common stock, which equals approximately 453,537 shares as of March 1, 2017, or the average reported weekly trading volume of our common stock on NYSE during the four calendar weeks preceding the filing of a notice of the sale on Form 144.
Sales under Rule 144 by our affiliates or persons selling shares on behalf of our affiliates are also subject to certain manner of sale provisions, notice requirements and the availability of current public information about us. The sale of these shares, or the perception that sales will be made, may adversely affect the price of our common stock because a large number of shares would be, or would be perceived to be, available for sale in the public market.
A person who is not deemed to be or have been an affiliate of ours at the time of, or at any time during the three months preceding, a sale and who has beneficially owned restricted securities within the meaning of Rule 144 for at least six months, may sell such shares subject only to the availability of current public information about us, and any such person who has beneficially owned restricted shares of our common stock for at least one year may sell such shares without restriction.
We are unable to estimate the number of shares that will be sold under Rule 144 since this will depend on the market price for our common stock, the personal circumstances of the stockholder and other factors.
Rule 701
In general, under Rule 701, as currently in effect, any of our employees, directors, officers, consultants or advisors who purchased shares from us in connection with a compensatory stock or option plan or other written agreement before September 21, 2016, the effective date of our initial public offering, became entitled to resell such shares 90 days thereafter in reliance on Rule 144.
Securities issued in reliance on Rule 701 are restricted securities and, subject to the contractual restrictions described above, beginning 90 days after the date of this prospectus, may be sold by persons other than “affiliates,” as defined in Rule 144, subject only to the manner of sale provisions of Rule 144 and by “affiliates” under Rule 144 without compliance with its one-year minimum holding period requirement.
106
Table of Contents
Equity Incentive Plans and Employee Stock Purchase Plan
We have filed with the SEC registration statements under the Securities Act covering the shares of common stock that we may issue (i) pursuant to awards granted under the 2014 Plan and the 2016 Plan, and (ii) pursuant to the ESPP. Such registration statements were filed and became effective in September 2016 and March 2017. Accordingly, shares registered under such registration statements are available for sale in the open market, subject to Rule 144 volume limitations for affiliates and the lock-up agreements described above, if applicable.
Registration rights agreement
For a description of rights some holders of common stock have to require us to register the shares of common stock they own, see “Certain relationships and related party transactions—Registration rights.” Registration of these shares under the Securities Act would result in these shares becoming freely tradable without restriction under the Securities Act immediately upon effectiveness of the applicable registration statement.
107
Table of Contents
Material U.S. federal income tax consequences to non-U.S. holders
The following discussion is a summary of the material U.S. federal income tax consequences to Non-U.S. Holders (as defined below) of the purchase, ownership and disposition of our common stock sold pursuant to this offering, but does not purport to be a complete analysis of all potential tax effects. The effects of other U.S. federal tax laws, such as estate and gift tax laws and any applicable state, local or non-U.S. tax laws are not discussed. This discussion is based on the U.S. Internal Revenue Code of 1986, as amended (the “Code”), Treasury Regulations promulgated thereunder, judicial decisions, and published rulings and administrative pronouncements of the U.S. Internal Revenue Service (the “IRS”), in each case in effect as of the date hereof. These authorities may change or be subject to differing interpretations. Any such change or differing interpretation may be applied retroactively in a manner that could adversely affect a Non-U.S. Holder. We have not sought and will not seek any rulings from the IRS regarding the matters discussed below. There can be no assurance the IRS or a court will not take a contrary position to that discussed below regarding the tax consequences of the purchase, ownership and disposition of our common stock.
This discussion is limited to Non-U.S. Holders that hold our common stock as a “capital asset” within the meaning of Section 1221 of the Code (generally, property held for investment). This discussion does not address all U.S. federal income tax consequences relevant to a Non-U.S. Holder’s particular circumstances, including the impact of the Medicare contribution tax on net investment income. In addition, it does not address consequences relevant to Non-U.S. Holders subject to special rules, including, without limitation:
| • | U.S. expatriates and former citizens or long-term residents of the United States; |
| • | persons subject to the alternative minimum tax; |
| • | persons holding our common stock as part of a hedge, straddle or other risk reduction strategy or as part of a conversion transaction or other integrated investment; |
| • | banks, insurance companies and other financial institutions; |
| • | brokers, dealers or traders in securities; |
| • | “controlled foreign corporations,” “passive foreign investment companies” and corporations that accumulate earnings to avoid U.S. federal income tax; |
| • | partnerships or other entities or arrangements treated as partnerships for U.S. federal income tax purposes (and investors therein); |
| • | tax-exempt organizations or governmental organizations; |
| • | persons deemed to sell our common stock under the constructive sale provisions of the Code; |
| • | tax-qualified retirement plans; and |
| • | “qualified foreign pension funds” as defined in Section 897(l)(2) of the Code and entities all of the interests of which are held by qualified foreign pension funds. |
If an entity treated as a partnership for U.S. federal income tax purposes holds our common stock, the tax treatment of a partner in the partnership will depend on the status of the partner, the activities of the partnership and certain determinations made at the partner level. Accordingly, partnerships holding our common stock and the partners in such partnerships should consult their tax advisors regarding the U.S. federal income tax consequences to them.
THIS DISCUSSION IS NOT TAX ADVICE. INVESTORS SHOULD CONSULT THEIR TAX ADVISORS WITH RESPECT TO THE APPLICATION OF THE U.S. FEDERAL INCOME TAX LAWS TO THEIR PARTICULAR SITUATIONS AS WELL AS ANY TAX CONSEQUENCES OF THE PURCHASE, OWNERSHIP AND DISPOSITION OF OUR COMMON STOCK ARISING UNDER THE U.S. FEDERAL ESTATE OR GIFT TAX LAWS OR UNDER THE LAWS OF ANY STATE, LOCAL OR NON-U.S. TAXING JURISDICTION OR UNDER ANY APPLICABLE INCOME TAX TREATY.
Definition of a Non-U.S. Holder
For purposes of this discussion, a “Non-U.S. Holder” is any beneficial owner of our common stock that is neither a “U.S. person” nor an entity treated as a partnership for U.S. federal income tax purposes. A U.S. person is any person that, for U.S. federal income tax purposes, is or is treated as any of the following:
| • | an individual who is a citizen or resident of the United States; |
108
Table of Contents
| • | a corporation created or organized under the laws of the United States, any state thereof or the District of Columbia; |
| • | an estate, the income of which is subject to U.S. federal income tax regardless of its source; or |
| • | a trust that (i) is subject to the primary supervision of a U.S. court and all substantial decisions of which are subject to the control of one or more “United States persons” (within the meaning of Section 7701(a)(30) of the Code) or (ii) has a valid election in effect to be treated as a United States person for U.S. federal income tax purposes. |
Distributions
As described in the section entitled “Dividend policy,” we do not anticipate paying any additional cash dividends in the foreseeable future. However, if we do make distributions of cash or property on our common stock, such distributions will constitute dividends for U.S. federal income tax purposes to the extent paid from our current or accumulated earnings and profits, as determined under U.S. federal income tax principles. Amounts not treated as dividends for U.S. federal income tax purposes will constitute a return of capital and first be applied against and reduce a Non-U.S. Holder’s adjusted tax basis in its common stock, but not below zero. Any excess will be treated as capital gain and will be treated as described below under “—Sale or other taxable disposition.”
Subject to the discussion below regarding effectively connected income, dividends paid to a Non-U.S. Holder will be subject to U.S. federal withholding tax at a rate of 30% of the gross amount of the dividends (or such lower rate specified by an applicable income tax treaty, provided the Non-U.S. Holder furnishes a valid IRS Form W-8BEN or W-8BEN-E (or other applicable documentation) certifying qualification for the lower treaty rate). A Non-U.S. Holder that does not timely furnish the required documentation, but that qualifies for a reduced treaty rate, may obtain a refund of any excess amounts withheld by timely filing an appropriate claim for refund with the IRS. Non-U.S. Holders should consult their tax advisors regarding their entitlement to benefits under any applicable tax treaties.
If dividends paid to a Non-U.S. Holder are effectively connected with the Non-U.S. Holder’s conduct of a trade or business within the United States (and, if required by an applicable income tax treaty, the Non-U.S. Holder maintains a permanent establishment in the United States to which such dividends are attributable), the Non-U.S. Holder will be exempt from the U.S. federal withholding tax described above. To claim the exemption, the Non-U.S. Holder must furnish to the applicable withholding agent a valid IRS Form W-8ECI, certifying that the dividends are effectively connected with the Non-U.S. Holder’s conduct of a trade or business within the United States.
Any such effectively connected dividends will be subject to U.S. federal income tax on a net income basis at the regular graduated rates. A Non-U.S. Holder that is a corporation also may be subject to a branch profits tax at a rate of 30% (or such lower rate specified by an applicable income tax treaty) on such effectively connected dividends, as adjusted for certain items. Non-U.S. Holders should consult their tax advisors regarding any applicable tax treaties that may provide for different rules.
Sale or other taxable disposition
Subject to the discussions below regarding backup withholding and FATCA, a Non-U.S. Holder will not be subject to U.S. federal income tax on any gain realized upon the sale or other taxable disposition of our common stock unless:
| • | the gain is effectively connected with the Non-U.S. Holder’s conduct of a trade or business within the United States (and, if required by an applicable income tax treaty, the Non-U.S. Holder maintains a permanent establishment in the United States to which such gain is attributable); |
| • | the Non-U.S. Holder is a nonresident alien individual present in the United States for 183 days or more during the taxable year of the disposition and certain other requirements are met; or |
| • | our common stock constitutes a U.S. real property interest (“USRPI”) by reason of our status as a U.S. real property holding corporation (“USRPHC”) for U.S. federal income tax purposes. |
Gain described in the first bullet point above generally will be subject to U.S. federal income tax on a net income basis at the regular graduated rates. A Non-U.S. Holder that is a corporation also may be subject to a branch profits tax at a rate of 30% (or such lower rate specified by an applicable income tax treaty) on such effectively connected gain, as adjusted for certain items.
Gain described in the second bullet point above will be subject to U.S. federal income tax at a rate of 30% (or such lower rate specified by an applicable income tax treaty), which may be offset by certain U.S. source capital losses of the Non-U.S. Holder (even though the individual is not considered a resident of the United States), provided the Non-U.S. Holder has timely filed U.S. federal income tax returns with respect to such losses.
109
Table of Contents
With respect to the third bullet point above, we believe we currently are not, and do not anticipate becoming, a USRPHC. Because the determination of whether we are a USRPHC depends, however, on the fair market value of our USRPIs relative to the fair market value of our non-U.S. real property interests and our other business assets, there can be no assurance we currently are not a USRPHC or will not become one in the future. Even if we are or were to become a USRPHC, gain arising from the sale or other taxable disposition by a Non-U.S. Holder of our common stock will not be subject to U.S. federal income tax if our common stock is “regularly traded,” as defined by applicable Treasury Regulations, on an established securities market, and such Non-U.S. Holder owned, actually and constructively, 5% or less of our common stock throughout the shorter of the five-year period ending on the date of the sale or other taxable disposition or the Non-U.S. Holder’s holding period.
Non-U.S. Holders should consult their tax advisors regarding any applicable tax treaties that may provide for different rules.
Information reporting and backup withholding
Payments of dividends on our common stock will not be subject to backup withholding, provided the Non-U.S. Holder certifies its non-U.S. status, such as by furnishing a valid IRS Form W-8BEN, W-8BEN-E or W-8ECI, or otherwise establishes an exemption. However, information returns are required to be filed with the IRS in connection with any dividends on our common stock paid to the Non-U.S. Holder, regardless of whether any tax was actually withheld. In addition, proceeds of the sale or other taxable disposition of our common stock within the United States or conducted through certain U.S.-related brokers generally will not be subject to backup withholding or information reporting if the applicable withholding agent receives the certification described above or the Non-U.S. Holder otherwise establishes an exemption. Proceeds of a disposition of our common stock conducted through a non-U.S. office of a non-U.S. broker that does not have certain enumerated relationships with the United States generally will not be subject to backup withholding or information reporting.
Copies of information returns that are filed with the IRS may also be made available under the provisions of an applicable treaty or agreement to the tax authorities of the country in which the Non-U.S. Holder resides or is established.
Backup withholding is not an additional tax. Any amounts withheld under the backup withholding rules may be allowed as a refund or a credit against a Non-U.S. Holder’s U.S. federal income tax liability, provided the required information is timely furnished to the IRS.
Additional withholding tax on payments made to foreign accounts
Withholding taxes may be imposed under Sections 1471 to 1474 of the Code (such Sections commonly referred to as the Foreign Account Tax Compliance Act, or “FATCA”) on certain types of payments made to non-U.S. financial institutions and certain other non-U.S. entities. Specifically, a 30% withholding tax may be imposed on dividends on, or gross proceeds from the sale or other disposition of, our common stock paid to a “foreign financial institution” or a “non-financial foreign entity” (each as defined in the Code), unless (i) the foreign financial institution undertakes certain diligence and reporting obligations, (ii) the non-financial foreign entity either certifies it does not have any “substantial United States owners” (as defined in the Code) or furnishes identifying information regarding each substantial United States owner, or (iii) the foreign financial institution or non-financial foreign entity otherwise qualifies for an exemption from these rules. If the payee is a foreign financial institution and is subject to the diligence and reporting requirements in (i) above, it must enter into an agreement with the U.S. Department of the Treasury requiring, among other things, that it undertake to identify accounts held by certain “specified United States persons” or “United States-owned foreign entities” (each as defined in the Code), annually report certain information about such accounts, and withhold 30% on certain payments to non-compliant foreign financial institutions and certain other account holders. Foreign financial institutions located in jurisdictions that have an intergovernmental agreement with the United States governing FATCA may be subject to different rules.
Under the applicable Treasury Regulations and administrative guidance, withholding under FATCA generally applies to payments of dividends on our common stock, and, beginning on January 1, 2019, will apply to payments of gross proceeds from the sale or other disposition of such stock.
Prospective investors should consult their tax advisors regarding the potential application of withholding under FATCA to their investment in our common stock.
110
Table of Contents
The selling stockholders are offering the shares of common stock described in this prospectus through a number of underwriters. J.P. Morgan Securities LLC and Morgan Stanley & Co. LLC are acting as joint book-running managers of the offering and as representatives of the underwriters. We and the selling stockholders have entered into an underwriting agreement with the underwriters. Subject to the terms and conditions of the underwriting agreement, the selling stockholders have agreed to sell to the underwriters, and each underwriter has severally agreed to purchase, at the public offering price less the underwriting discounts and commissions set forth on the cover page of this prospectus, the number of shares of common stock listed next to its name in the following table:
| Name | Number of Shares |
|||
| J.P. Morgan Securities LLC |
||||
| Morgan Stanley & Co. LLC |
||||
| Piper Jaffray & Co. |
||||
| Wells Fargo Securities, LLC |
||||
|
|
|
|||
| Total |
7,000,000 | |||
|
|
||||
The underwriters are committed to purchase all the common shares offered by the selling stockholders if they purchase any shares. The underwriting agreement also provides that if an underwriter defaults, the purchase commitments of non-defaulting underwriters may also be increased or the offering may be terminated.
The underwriters propose to offer the common shares directly to the public at the public offering price set forth on the cover page of this prospectus and to certain dealers at that price less a concession not in excess of $ per share. After the public offering of the shares, the offering price and other selling terms may be changed by the underwriters. Sales of shares made outside of the United States may be made by affiliates of the underwriters.
The underwriters have an option to buy up to 1,050,000 additional shares of common stock from certain of the selling stockholders to cover sales of shares by the underwriters which exceed the number of shares specified in the table above. The underwriters have 30 days from the date of this prospectus to exercise this option. If any shares are purchased with this option, the underwriters will purchase shares in approximately the same proportion as shown in the table above. If any additional shares of common stock are purchased, the underwriters will offer the additional shares on the same terms as those on which the shares are being offered.
The underwriting fee is equal to the public offering price per share of common stock less the amount paid by the underwriters to the selling stockholders per share of common stock. The underwriting fee is $ per share. The following table shows the per share and total underwriting discounts and commissions to be paid to the underwriters assuming both no exercise and full exercise of the underwriters’ option to purchase additional shares.
| Without option exercise |
With full option exercise |
|||||||
| Per Share |
$ | $ | ||||||
| Total |
$ | $ | ||||||
|
|
||||||||
We estimate that the total expenses of this offering, including registration, filing and listing fees, printing fees and legal and accounting expenses, but excluding the underwriting discounts and commissions, will be approximately $530,000. We have agreed to reimburse the underwriters for certain FINRA-related and other expenses incurred by them in connection with this offering in an amount up to $30,000.
A prospectus in electronic format may be made available on the web sites maintained by one or more underwriters, or selling group members, if any, participating in the offering. The underwriters may agree to allocate a number of shares to underwriters and selling group members for sale to their online brokerage account holders. Internet distributions will be allocated by the representatives to underwriters and selling group members that may make Internet distributions on the same basis as other allocations.
111
Table of Contents
We have agreed not to (i) offer, pledge, sell, contract to sell, sell any option or contract to purchase, purchase any option or contract to sell, grant any option, right or warrant to purchase or otherwise transfer or dispose of, directly or indirectly, or file with the SEC a registration statement under the Securities Act relating to, any shares of our common stock or securities convertible into or exchangeable or exercisable for any shares of our common stock, or publicly disclose the intention to make any offer, sale, pledge, disposition or filing, or (ii) enter into any swap or other arrangement that transfers all or a portion of the economic consequences associated with the ownership of any shares of common stock or any such other securities (regardless of whether any of these transactions are to be settled by the delivery of shares of common stock or such other securities, in cash or otherwise), in each case without the prior written consent of J.P. Morgan Securities LLC and Morgan Stanley & Co. LLC for a period of 90 days after the date of this prospectus, other than the shares of our common stock to be sold hereunder, any shares of our common stock awarded, issued upon the exercise of options or purchase rights, issued upon vesting of equity awards and/or settlement of other awards granted under our existing stock incentive plans, the filing of registration statements on Form S-8 with respect to benefit plans and the issuance of common stock and securities convertible or exercisable or exchangeable for common stock, in an aggregate amount not to exceed 10% of our outstanding securities as of the date of closing of this offering, in connection with one more acquisitions of a company or a business, securities, property or assets of another person or entity, joint ventures, commercial relationships or strategic alliances.
Our directors and executive officers and the selling stockholders, have entered into lock-up agreements with the underwriters prior to the commencement of this offering pursuant to which each of these persons or entities, with limited exceptions, for a period of 90 days after the date of this prospectus, may not, without the prior written consent of J.P. Morgan Securities LLC and Morgan Stanley & Co. LLC on behalf of the Underwriters, (i) offer, pledge, sell, contract to sell, sell any option or contract to purchase, purchase any option or contract to sell, grant any option, right or warrant to purchase, or otherwise transfer or dispose of, directly or indirectly, any shares of our common stock or any securities convertible into or exercisable or exchangeable for our common stock (including, without limitation, common stock or such other securities which may be deemed to be beneficially owned by such directors, executive officers, managers and members in accordance with the rules and regulations of the SEC and securities which may be issued upon exercise of a stock option or warrant) or (ii) enter into any swap or other agreement that transfers, in whole or in part, any of the economic consequences of ownership of the common stock or such other securities, whether any such transaction described in clause (i) or (ii) above is to be settled by delivery of common stock or such other securities, in cash or otherwise, or (iii) make any demand for or exercise any right with respect to the registration of any shares of our common stock or any security convertible into or exercisable or exchangeable for our common stock. The restrictions described in the immediately preceding paragraph do not apply to certain exceptions described therein.
We and the selling stockholders have agreed to indemnify the underwriters against certain liabilities, including liabilities under the Securities Act of 1933, as amended.
Our common stock is listed on the NYSE under the symbol “ELF”.
In connection with this offering, the underwriters may engage in stabilizing transactions, which involves making bids for, purchasing and selling shares of common stock in the open market for the purpose of preventing or retarding a decline in the market price of the common stock while this offering is in progress. These stabilizing transactions may include making short sales of the common stock, which involves the sale by the underwriters of a greater number of shares of common stock than they are required to purchase in this offering, and purchasing shares of common stock on the open market to cover positions created by short sales. Short sales may be “covered” shorts, which are short positions in an amount not greater than the underwriters’ option referred to above, or may be “naked” shorts, which are short positions in excess of that amount. The underwriters may close out any covered short position either by exercising their option, in whole or in part, or by purchasing shares in the open market. In making this determination, the underwriters will consider, among other things, the price of shares available for purchase in the open market compared to the price at which the underwriters may purchase shares through the option to purchase additional shares. A naked short position is more likely to be created if the underwriters are concerned that there may be downward pressure on the price of the common stock in the open market that could adversely affect investors who purchase in this offering. To the extent that the underwriters create a naked short position, they will purchase shares in the open market to cover the position.
The underwriters have advised us and the selling stockholders that, pursuant to Regulation M of the Securities Act of 1933, they may also engage in other activities that stabilize, maintain or otherwise affect the price of the common stock, including the imposition of penalty bids. This means that if the representatives of the underwriters purchase common stock in the open market in stabilizing transactions or to cover short sales, the representatives can require the underwriters that sold those shares as part of this offering to repay the underwriting discount received by them.
112
Table of Contents
These activities may have the effect of raising or maintaining the market price of the common stock or preventing or retarding a decline in the market price of the common stock, and, as a result, the price of the common stock may be higher than the price that otherwise might exist in the open market. If the underwriters commence these activities, they may discontinue them at any time. The underwriters may carry out these transactions on the NYSE, in the OTC market or otherwise.
Neither we, the selling stockholders or the underwriters can assure investors that an active trading market will continue to develop or be sustained for our common shares, or that the shares will trade in the public market at or above the public offering price.
Certain of the underwriters and their affiliates may provide to us and our affiliates from time to time in the future certain commercial banking, financial advisory, investment banking and other services for us and such affiliates in the ordinary course of their business, for which they may receive customary fees and commissions. In addition, from time to time, certain of the underwriters and their affiliates may effect transactions for their own account or the account of customers, and hold on behalf of themselves or their customers, long or short positions in our debt or equity securities or loans, and may do so in the future.
Selling restrictions
General
Other than in the United States, no action has been taken by us or the underwriters that would permit a public offering of the securities offered by this prospectus in any jurisdiction where action for that purpose is required. The securities offered by this prospectus may not be offered or sold, directly or indirectly, nor may this prospectus or any other offering material or advertisements in connection with the offer and sale of any such securities be distributed or published in any jurisdiction, except under circumstances that will result in compliance with the applicable rules and regulations of that jurisdiction. Outside of the United States, persons into whose possession this prospectus comes are advised to inform themselves about and to observe any restrictions imposed by any applicable laws and regulations outside of the United States relating to the offering and the distribution of this prospectus.
This prospectus does not constitute an offer to sell or a solicitation of an offer to buy any securities offered by this prospectus in any jurisdiction in which such an offer or a solicitation is unlawful.
United Kingdom
This document is only being distributed to and is only directed at (i) persons who are outside the United Kingdom or (ii) to investment professionals falling within Article 19(5) of the Financial Services and Markets Act 2000 (Financial Promotion) Order 2005 (the “Order”) or (iii) high net worth entities, and other persons to whom it may lawfully be communicated, falling with Article 49(2)(a) to (d) of the Order (all such persons together being referred to as “relevant persons”). The securities are only available to, and any invitation, offer or agreement to subscribe, purchase or otherwise acquire such securities will be engaged in only with, relevant persons. Any person who is not a relevant person should not act or rely on this document or any of its contents.
European Economic Area
In relation to each Member State of the European Economic Area which has implemented the Prospectus Directive (each, a “Relevant Member State”), from and including the date on which the European Union Prospectus Directive (the “EU Prospectus Directive”) was implemented in that Relevant Member State (the “Relevant Implementation Date”) an offer of securities described in this prospectus may not be made to the public in that Relevant Member State prior to the publication of a prospectus in relation to the shares which has been approved by the competent authority in that Relevant Member State or, where appropriate, approved in another Relevant Member State and notified to the competent authority in that Relevant Member State, all in accordance with the EU Prospectus Directive, except that, with effect from and including the Relevant Implementation Date, an offer of securities described in this prospectus may be made to the public in that Relevant Member State at any time:
to any legal entity which is a qualified investor as defined under the EU Prospectus Directive;
to fewer than 100 or, if the Relevant Member State has implemented the relevant provision of the 2010 PD Amending Directive, 150 natural or legal persons (other than qualified investors as defined in the EU Prospectus Directive); or
113
Table of Contents
in any other circumstances falling within Article 3(2) of the EU Prospectus Directive, provided that no such offer of securities described in this prospectus shall result in a requirement for the publication by us of a prospectus pursuant to Article 3 of the EU Prospectus Directive.
For the purposes of this provision, the expression an “offer of securities to the public” in relation to any securities in any Relevant Member State means the communication in any form and by any means of sufficient information on the terms of the offer and the securities to be offered so as to enable an investor to decide to purchase or subscribe for the securities, as the same may be varied in that Member State by any measure implementing the EU Prospectus Directive in that Member State. The expression “EU Prospectus Directive” means Directive 2003/71/EC (and any amendments thereto, including the 2010 PD Amending Directive, to the extent implemented in the Relevant Member State) and includes any relevant implementing measure in each Relevant Member State, and the expression “2010 PD Amending Directive” means Directive 2010/73/EU.
Canada
The common stock may be sold only to purchasers purchasing, or deemed to be purchasing, as principal that are accredited investors, as defined in National Instrument 45-106 Prospectus Exemptions or subsection 73.3(1) of the Securities Act (Ontario), and are permitted clients, as defined in National Instrument 31-103 Registration Requirements, Exemptions and Ongoing Registrant Obligations. Any resale of shares of the common stock must be made in accordance with an exemption from, or in a transaction not subject to, the prospectus requirements of applicable securities laws.
Securities legislation in certain provinces or territories of Canada may provide a purchaser with remedies for rescission or damages if this prospectus (including any amendment thereto) contains a misrepresentation, provided that the remedies for rescission or damages are exercised by the purchaser within the time limit prescribed by the securities legislation of the purchaser’s province or territory. The purchaser should refer to any applicable provisions of the securities legislation of the purchaser’s province or territory for particulars of these rights or consult with a legal advisor.
Pursuant to section 3A.3 of National Instrument 33-105 Underwriting Conflicts (NI 33-105), the underwriters are not required to comply with the disclosure requirements of NI 33-105 regarding underwriter conflicts of interest in connection with this offering.
The validity of the issuance of the shares of common stock offered by the selling stockholders will be passed upon for e.l.f. Beauty, Inc. by Latham & Watkins LLP, Menlo Park, California. Certain legal matters relating to this offering will be passed upon for the underwriters by Ropes & Gray LLP, San Francisco, California.
The consolidated financial statements as of December 31, 2016, 2015 (Successor) and 2014 (Successor), and for the period from January 1, 2014 through January 31, 2014 (Predecessor), the period from February 1, 2014 through December 31, 2014 (Successor) and the years ended December 31, 2015 (Successor) and 2016 (Successor), have been audited by Deloitte & Touche LLP, an independent registered public accounting firm, as stated in their report appearing herein. Such consolidated financial statements have been so included in reliance upon the report of such firm given upon their authority as experts in accounting and auditing.
Where you can find additional information
We have filed with the SEC a registration statement on Form S-1 under the Securities Act with respect to the shares of common stock offered by this prospectus. This prospectus does not contain all of the information set forth in the registration statement and its exhibits, certain portions of which are omitted as permitted by the rules and regulations of the SEC. For further information pertaining to us and our common stock, we refer you to our registration statement filed on Form S-1 in connection with this offering, including its exhibits and the financial statements, notes and schedules filed as a part of that registration statement. Statements contained in this prospectus regarding the contents of any contract or other document referred to in those documents are not necessarily complete, and in each instance we refer you to the copy of the contract or other document filed as an exhibit to the registration statement or other document. Each of these statements is qualified in all respects by this reference.
114
Table of Contents
You may read and copy the registration statement and its exhibits and schedules at the SEC’s public reference room at 100 F Street, N.E., Washington, D.C. 20549. You also may obtain information on the operation of the public reference room by calling the commission at 1-800-SEC-0330. The SEC maintains a website at www.sec.gov that contains reports, proxy and information statements and other information regarding registrants, such as e.l.f. Beauty, Inc., that file electronically with the SEC.
We are subject to the information and reporting requirements of the Exchange Act and, in accordance with this law, file periodic reports, proxy statements and other information with the SEC. These periodic reports, proxy statements and other information are available for inspection and copying at the SEC’s public reference facilities and the website of the SEC referred to above. We also maintain a website at www.elfcosmetics.com. You may access these materials free of charge as soon as reasonably practicable after they are electronically filed with, or furnished to, the SEC. Information contained on our website is not a part of this prospectus and the inclusion of our website address in this prospectus is an inactive textual reference only.
115
Table of Contents
Index to consolidated financial statements
| F-2 | ||||
| Consolidated balance sheets as of December 31, 2015 (Successor) and 2016 (Successor) |
F-3 | |||
| F-4 | ||||
| F-5 | ||||
| F-6 | ||||
| F-8 | ||||
F-1
Table of Contents
REPORT OF INDEPENDENT REGISTERED PUBLIC ACCOUNTING FIRM
To the Board of Directors and Stockholders of e.l.f. Beauty, Inc.
Oakland, California
We have audited the accompanying consolidated balance sheets of e.l.f. Beauty, Inc. and subsidiaries (the “Company”) as of December 31, 2016 and 2015 (Successor), and the related consolidated statements of operations and comprehensive income (loss), preferred stock and stockholders’ equity (deficit), and cash flows for the period from January 1, 2014 through January 31, 2014 (Predecessor), the period from February 1, 2014 through December 31, 2014 (Successor), the year ended December 31, 2015 and the year ended December 31, 2016. These financial statements are the responsibility of the Company’s management. Our responsibility is to express an opinion on these financial statements based on our audits.
We conducted our audits in accordance with the standards of the Public Company Accounting Oversight Board (United States). Those standards require that we plan and perform the audit to obtain reasonable assurance about whether the financial statements are free of material misstatement. The Company is not required to have, nor were we engaged to perform, an audit of its internal control over financial reporting. Our audits included consideration of internal control over financial reporting as a basis for designing audit procedures that are appropriate in the circumstances, but not for the purpose of expressing an opinion on the effectiveness of the Company’s internal control over financial reporting. Accordingly, we express no such opinion. An audit also includes examining, on a test basis, evidence supporting the amounts and disclosures in the financial statements, assessing the accounting principles used and significant estimates made by management, as well as evaluating the overall financial statement presentation. We believe that our audits provide a reasonable basis for our opinion.
In our opinion, such consolidated financial statements present fairly, in all material respects, the financial position of e.l.f. Beauty, Inc. and subsidiaries as of December 31, 2016 and 2015 (Successor), and the results of their operations and their cash flows for the period from January 1, 2014 through January 31, 2014 (Predecessor), the period from February 1, 2014 through December 31, 2014 (Successor) the year ended December 31, 2015 and the year ended December 31, 2016, in conformity with accounting principles generally accepted in the United States of America.
/s/ DELOITTE & TOUCHE LLP
San Francisco, CA
March 15, 2017
F-2
Table of Contents
e.l.f. Beauty, Inc. and subsidiaries
Consolidated balance sheets
(in thousands, except share and per share data)
| December 31, 2015 |
December 31, 2016 |
|||||||
| Assets |
||||||||
| Current assets: |
||||||||
| Cash |
$ | 14,004 | $ | 15,295 | ||||
| Accounts receivable, net |
22,475 | 37,825 | ||||||
| Inventories |
31,261 | 69,397 | ||||||
| Prepaid expenses and other current assets |
2,978 | 2,387 | ||||||
|
|
|
|||||||
| Total current assets |
70,718 | 124,904 | ||||||
| Property and equipment, net |
9,854 | 17,151 | ||||||
| Intangible assets, net |
121,282 | 113,003 | ||||||
| Goodwill |
157,264 | 157,264 | ||||||
| Other assets |
1,954 | 2,407 | ||||||
|
|
|
|||||||
| Total assets |
$ | 361,072 | $ | 414,729 | ||||
|
|
|
|||||||
| Liabilities, convertible preferred stock and stockholders’ equity (deficit) |
||||||||
| Current liabilities: |
||||||||
| Current portion of long-term debt and capital lease obligations |
$ | 10,325 | $ | 8,650 | ||||
| Accounts payable |
11,114 | 37,944 | ||||||
| Accrued expenses and other current liabilities |
13,713 | 33,676 | ||||||
| Foreign currency forward contracts |
10,702 | — | ||||||
|
|
|
|||||||
| Total current liabilities |
45,854 | 80,270 | ||||||
| Long-term debt and capital lease obligations |
134,594 | 156,177 | ||||||
| Deferred tax liabilities |
42,126 | 34,212 | ||||||
| Other long-term liabilities |
1,601 | 3,208 | ||||||
|
|
|
|||||||
| Total liabilities |
224,175 | 273,867 | ||||||
| Commitments and contingencies (Note 10) |
||||||||
| Convertible preferred stock, par value of $0.01 per share; 200,000 shares authorized and 135,041 shares issued and outstanding as of December 31, 2015; liquidation preference of $197,295 as of December 31, 2015; no shares authorized, issued or outstanding as of December 31, 2016 |
197,295 | — | ||||||
| Stockholders’ equity (deficit): |
||||||||
| Preferred stock, par value of $0.01 per share; no shares authorized, issued or outstanding as of December 31, 2015; 30,000,000 shares authorized as of December 31, 2016; no shares issued and outstanding as of December 31, 2016 |
— | — | ||||||
| Common stock, par value of $0.01 per share; 13,800,000 and 250,000,000 shares authorized as of December 31, 2015 and December 31, 2016, respectively; 34,493 and 45,276,137 shares issued and outstanding as of December 31, 2015 and December 31, 2016, respectively |
— | 438 | ||||||
| Additional paid-in capital |
6,785 | 700,871 | ||||||
| Accumulated deficit |
(67,183 | ) | (560,447 | ) | ||||
|
|
|
|
|
|||||
| Total stockholders’ equity (deficit) |
(60,398 | ) | 140,862 | |||||
|
|
|
|
|
|||||
| Total liabilities, convertible preferred stock and stockholders’ equity (deficit) |
$ | 361,072 | $ | 414,729 | ||||
|
|
||||||||
The accompanying notes are an integral part of these consolidated financial statements.
F-3
Table of Contents
e.l.f. Beauty, Inc. and subsidiaries
Consolidated statements of operations and comprehensive income (loss)
(in thousands, except share and per share data)
| Predecessor | Successor | |||||||||||||||||||||||
| Period from through January 31, 2014 |
Period from February 1, 2014 through December 31, 2014 |
Year ended December 31, |
||||||||||||||||||||||
| 2015 | 2016 | |||||||||||||||||||||||
| Net sales |
$ | 9,810 | $ | 135,134 | $ | 191,413 | $ | 229,567 | ||||||||||||||||
| Cost of sales |
5,038 | 73,684 | 91,084 | 97,332 | ||||||||||||||||||||
|
|
|
|
|
|||||||||||||||||||||
| Gross profit |
4,772 | 61,450 | 100,329 | 132,235 | ||||||||||||||||||||
| Selling, general, and administrative expenses |
3,045 | 56,103 | 74,758 | 109,156 | ||||||||||||||||||||
|
|
|
|
|
|||||||||||||||||||||
| Operating income |
1,727 | 5,347 | 25,571 | 23,079 | ||||||||||||||||||||
| Other income (expense), net |
36 | (6,633 | ) | (4,172 | ) | 3,016 | ||||||||||||||||||
| Interest expense, net |
(128 | ) | (11,545 | ) | (12,721 | ) | (16,283 | ) | ||||||||||||||||
|
|
|
|
|
|||||||||||||||||||||
| Income (loss) before provision for income taxes |
1,635 | (12,831 | ) | 8,678 | 9,812 | |||||||||||||||||||
| Income tax benefit (provision) |
(542 | ) | 3,545 | (4,321 | ) | (4,499 | ) | |||||||||||||||||
|
|
|
|
|
|||||||||||||||||||||
| Net income (loss) |
$ | 1,093 | $ | (9,286 | ) | $ | 4,357 | $ | 5,313 | |||||||||||||||
|
|
|
|
|
|||||||||||||||||||||
| Comprehensive income (loss) |
$ | 1,093 | $ | (9,286 | ) | $ | 4,357 | $ | 5,313 | |||||||||||||||
|
|
|
|
|
|||||||||||||||||||||
| Net income (loss) per share (Note 16): |
||||||||||||||||||||||||
| Basic |
$ | 1,093.00 | $ | (709.35 | ) | $ | (1,559.81 | ) | $ | (39.47 | ) | |||||||||||||
| Diluted |
$ | 1,087.56 | $ | (709.35 | ) | $ | (1,559.81 | ) | $ | (39.47 | ) | |||||||||||||
| Weighted average shares outstanding (Note 16): |
||||||||||||||||||||||||
| Basic |
1,000 | 27,593 | 30,523 | 12,606,529 | ||||||||||||||||||||
| Diluted |
1,005 | 27,593 | 30,523 | 12,606,529 | ||||||||||||||||||||
|
|
||||||||||||||||||||||||
The accompanying notes are an integral part of these consolidated financial statements.
F-4
Table of Contents
e.l.f. Beauty, Inc. and subsidiaries
Consolidated statements of convertible preferred stock and stockholders’ equity (deficit)
(in thousands, except share data)
| Convertible preferred stock |
Common stock | Employee receivable |
Additional capital |
Retained earnings |
Total equity |
|||||||||||||||||||||||||||||||||||
| Shares | Amount | Shares | Amount | |||||||||||||||||||||||||||||||||||||
| Predecessor: |
||||||||||||||||||||||||||||||||||||||||
| Balance as of January 1, 2014 |
1,000 | $ | — | 1,000 | $ | — | $ | — | $ | (3,928 | ) | $ | 15,509 | $ | 11,581 | |||||||||||||||||||||||||
| Net income |
— | — | — | — | — | — | 1,093 | 1,093 | ||||||||||||||||||||||||||||||||
|
|
|
|
|
|||||||||||||||||||||||||||||||||||||
| Balance as of January 31, 2014 |
1,000 | $ | — | 1,000 | $ | — | $ | — | $ | (3,928 | ) | $ | 16,602 | $ | 12,674 | |||||||||||||||||||||||||
|
|
||||||||||||||||||||||||||||||||||||||||
| Convertible preferred stock |
Common stock | Employee receivable |
Additional capital |
Retained deficit) |
Total (deficit) |
|||||||||||||||||||||||||||||||||||
| Shares | Amount | Shares | Amount | |||||||||||||||||||||||||||||||||||||
| Successor: |
||||||||||||||||||||||||||||||||||||||||
| Balance as of February 1, 2014 |
— | $ | — | — | $ | — | $ | — | $ | — | $ | — | $ | — | ||||||||||||||||||||||||||
| Net loss |
— | — | — | — | — | — | (9,286 | ) | (9,286 | ) | ||||||||||||||||||||||||||||||
| Issuance of common stock for JACUS acquisition |
— | — | 27,593 | — | — | 100 | — | 100 | ||||||||||||||||||||||||||||||||
| Issuance of preferred stock |
135,041 | 135,041 | — | — | — | — | — | — | ||||||||||||||||||||||||||||||||
| Convertible preferred stock accretion |
— | 10,287 | — | — | — | — | (10,287 | ) | (10,287 | ) | ||||||||||||||||||||||||||||||
| Compensation expense paid to seller |
— | — | — | — | — | 5,380 | — | 5,380 | ||||||||||||||||||||||||||||||||
| Stock-based compensation |
— | — | — | — | — | 287 | — | 287 | ||||||||||||||||||||||||||||||||
|
|
|
|
|
|||||||||||||||||||||||||||||||||||||
| Balance as of December 31, 2014 |
135,041 | 145,328 | 27,593 | — | — | 5,767 | (19,573 | ) | (13,806 | ) | ||||||||||||||||||||||||||||||
| Net income |
— | — | — | — | — | — | 4,357 | 4,357 | ||||||||||||||||||||||||||||||||
| Convertible preferred stock accretion |
— | 51,967 | — | — | — | — | (51,967 | ) | (51,967 | ) | ||||||||||||||||||||||||||||||
| Compensation expense paid to seller |
— | — | — | — | — | 489 | — | 489 | ||||||||||||||||||||||||||||||||
| Stock-based compensation |
— | — | — | — | — | 503 | — | 503 | ||||||||||||||||||||||||||||||||
| Exercise of stock options |
— | — | 6,900 | — | — | 25 | — | 25 | ||||||||||||||||||||||||||||||||
|
|
|
|
|
|||||||||||||||||||||||||||||||||||||
| Balance as of December 31, 2015 |
135,041 | 197,295 | 34,493 | — | — | 6,785 | (67,183 | ) | (60,398 | ) | ||||||||||||||||||||||||||||||
| Net income |
— | — | — | — | — | — | 5,313 | 5,313 | ||||||||||||||||||||||||||||||||
| Stock-based compensation |
— | — | — | — | — | 7,149 | — | 7,149 | ||||||||||||||||||||||||||||||||
| Dividend paid |
— | — | — | — | — | (9,801 | ) | (62,259 | ) | (72,060 | ) | |||||||||||||||||||||||||||||
| Issuance of employee note receivable |
— | — | — | — | (11,932 | ) | — | — | (11,932 | ) | ||||||||||||||||||||||||||||||
| Accrued interest on employee note receivable |
— | — | — | — | (39 | ) | 39 | — | — | |||||||||||||||||||||||||||||||
| Repayment of employee note receivable |
— | — | — | — | 11,971 | — | — | 11,971 | ||||||||||||||||||||||||||||||||
| Convertible preferred stock accretion |
— | 436,317 | — | — | — | — | (436,317 | ) | (436,317 | ) | ||||||||||||||||||||||||||||||
| Conversion of preferred stock |
(135,041 | ) | (633,612 | ) | 37,271,375 | 372 | — | 633,240 | — | 633,612 | ||||||||||||||||||||||||||||||
| Issuance of common stock upon initial public offering |
— | — | 4,000,000 | 40 | — | 63,200 | — | 63,240 | ||||||||||||||||||||||||||||||||
| Vesting of early exercised stock options |
— | — | 2,169,003 | 22 | — | 7,837 | — | 7,859 | ||||||||||||||||||||||||||||||||
| Exercise of stock options |
— | — | 278,440 | 3 | — | 828 | — | 831 | ||||||||||||||||||||||||||||||||
| Deferred offering costs |
— | — | — | — | — | (8,406 | ) | — | (8,406 | ) | ||||||||||||||||||||||||||||||
|
|
|
|
|
|||||||||||||||||||||||||||||||||||||
| Balance as of December 31, 2016 |
— | $ | — | 43,753,311 | $ | 438 | $ | — | $ | 700,871 | $ | (560,447 | ) | 140,862 | ||||||||||||||||||||||||||
|
|
||||||||||||||||||||||||||||||||||||||||
The accompanying notes are an integral part of these consolidated financial statements.
F-5
Table of Contents
e.l.f. Beauty, Inc. and subsidiaries
Consolidated statements of cash flows
(in thousands)
| Predecessor | Successor | |||||||||||||||||||||||
| Period from January 1, 2014 through |
Period from February 1, 2014 through |
Year ended December 31, |
||||||||||||||||||||||
| January 31, 2014 | December 31, 2014 | 2015 | 2016 | |||||||||||||||||||||
| Cash flows from operating activities: |
||||||||||||||||||||||||
| Net income (loss) |
$ | 1,093 | $ | (9,286 | ) | $ | 4,357 | $ | 5,313 | |||||||||||||||
| Adjustments to reconcile net income (loss) to net cash provided by (used in) operating activities: |
||||||||||||||||||||||||
| Amortization of intangible assets |
11 | 7,552 | 8,246 | 8,279 | ||||||||||||||||||||
| Depreciation of property and equipment |
30 | 392 | 2,043 | 4,873 | ||||||||||||||||||||
| Stock-based compensation expense |
— | 287 | 503 | 7,149 | ||||||||||||||||||||
| Amortization of debt issuance costs and discount on debt |
15 | 994 | 1,070 | 1,281 | ||||||||||||||||||||
| Deferred income taxes |
1,967 | (4,276 | ) | (3,933 | ) | (7,575 | ) | |||||||||||||||||
| Loss on extinguishment of debt |
— | — | — | 2,736 | ||||||||||||||||||||
| Loss on disposal of fixed assets |
— | 71 | 571 | 260 | ||||||||||||||||||||
| Compensation expense paid to seller |
— | 5,380 | 489 | — | ||||||||||||||||||||
| Loss/(gain) on foreign currency forward contracts |
— | 5,961 | 4,741 | (10,702 | ) | |||||||||||||||||||
| Other, net |
— | 341 | 23 | (13 | ) | |||||||||||||||||||
| Changes in operating assets and liabilities: |
||||||||||||||||||||||||
| Accounts receivable |
5,492 | (10,980 | ) | 4,448 | (15,392 | ) | ||||||||||||||||||
| Inventories |
(1,455 | ) | (4,752 | ) | (2,147 | ) | (37,994 | ) | ||||||||||||||||
| Prepaid expenses and other assets |
(237 | ) | (2,146 | ) | 943 | (635 | ) | |||||||||||||||||
| Accounts payable and accrued expenses |
(6,032 | ) | 1,904 | 3,532 | 43,144 | |||||||||||||||||||
| Other liabilities |
2 | 232 | 787 | 1,396 | ||||||||||||||||||||
| Due to related parties |
22 | (89 | ) | (1,154 | ) | — | ||||||||||||||||||
|
|
|
|
|
|||||||||||||||||||||
| Net cash provided by (used in) operating activities |
908 | (8,415 | ) | 24,519 | 2,120 | |||||||||||||||||||
| Cash flows from investing activities: |
||||||||||||||||||||||||
| Acquisition, net of cash acquired |
— | (237,891 | ) | — | — | |||||||||||||||||||
| Purchase of property and equipment |
(19 | ) | (1,597 | ) | (10,142 | ) | (9,223 | ) | ||||||||||||||||
| Proceeds from sale of property and equipment |
— | — | — | 84 | ||||||||||||||||||||
| Acquisition of intangible assets |
— | — | (100 | ) | — | |||||||||||||||||||
|
|
|
|
|
|||||||||||||||||||||
| Net cash used in investing activities |
(19 | ) | (239,488 | ) | (10,242 | ) | (9,139 | ) | ||||||||||||||||
| Cash flows from financing activities: |
||||||||||||||||||||||||
| Proceeds from revolving line of credit |
— | 15,250 | 27,150 | 5,500 | ||||||||||||||||||||
| Repayment of revolving line of credit |
— | (5,600 | ) | (29,100 | ) | (13,200 | ) | |||||||||||||||||
| Proceeds from long term debt |
— | 145,000 | — | 172,749 | ||||||||||||||||||||
| Repayment of long term debt |
— | (1,969 | ) | (2,625 | ) | (151,540 | ) | |||||||||||||||||
| Cash received from issuance of common stock |
— | 100 | 25 | 64,071 | ||||||||||||||||||||
| Cash received from issuance of preferred stock |
— | 105,041 | — | — | ||||||||||||||||||||
| Deferred offering costs paid |
— | — | (391 | ) | (7,821 | ) | ||||||||||||||||||
| Proceeds from repayment of employee note receivable |
— | — | — | 7,912 | ||||||||||||||||||||
| Dividend paid |
— | — | — | (68,000 | ) | |||||||||||||||||||
| Debt issuance costs paid |
— | (5,251 | ) | — | (704 | ) | ||||||||||||||||||
| Other, net |
— | — | — | (657 | ) | |||||||||||||||||||
|
|
|
|
|
|||||||||||||||||||||
| Net cash provided by (used in) financing activities |
— | 252,571 | (4,941 | ) | 8,310 | |||||||||||||||||||
| Net increase in cash |
889 | 4,668 | 9,336 | 1,291 | ||||||||||||||||||||
| Cash—beginning of period |
6,934 | — | 4,668 | 14,004 | ||||||||||||||||||||
|
|
|
|
|
|||||||||||||||||||||
| Cash—end of period |
$ | 7,823 | $ | 4,668 | $ | 14,004 | $ | 15,295 | ||||||||||||||||
|
|
|
|
|
|||||||||||||||||||||
| Supplemental disclosure of cash flow information: |
||||||||||||||||||||||||
| Cash paid for interest |
— | 10,544 | 11,617 | 12,170 | ||||||||||||||||||||
| Cash paid for income taxes |
— | 3,948 | 7,790 | 8,466 | ||||||||||||||||||||
F-6
Table of Contents
| Predecessor | Successor | |||||||||||||||||||||||
| Period from January 1, 2014 through |
Period from February 1, 2014 through |
Year ended December 31, |
||||||||||||||||||||||
| January 31, 2014 | December 31, 2014 | 2015 | 2016 | |||||||||||||||||||||
| Supplemental disclosure of noncash investing and financing activities: |
||||||||||||||||||||||||
| Accretion of preferred stock to maximum redemption value |
— | 10,287 | 51,967 | 436,317 | ||||||||||||||||||||
| Deferred offering costs included in accounts payable and accrued expenses |
— | — | 829 | 193 | ||||||||||||||||||||
| Property and equipment acquired under capital leases |
— | — | — | 3,000 | ||||||||||||||||||||
| Property and equipment purchases included in accounts payable and accrued expenses |
— | — | 200 | 491 | ||||||||||||||||||||
| Vesting of shares related to early exercise of common stock options |
— | — | — | 7,859 | ||||||||||||||||||||
| Note receivable issued to finance early exercise of common stock |
— | — | — | (11,971 | ) | |||||||||||||||||||
| Net repayment of note receivable with dividend proceeds |
— | — | — | 4,060 | ||||||||||||||||||||
|
|
||||||||||||||||||||||||
The accompanying notes are an integral part of these consolidated financial statements.
F-7
Table of Contents
e.l.f. Beauty, Inc. and subsidiaries
Notes to consolidated financial statements
Note 1—Nature of operations
e.l.f. Beauty, Inc. and subsidiaries (the “Company,” “Successor,” “we,” “us,” “its” and “our”) was formed as a Delaware corporation on December 20, 2013 under the name J.A. Cosmetics Holdings, Inc. In April 2016, the Company changed its name to e.l.f. Beauty, Inc. The Company conducts business under the name e.l.f. Cosmetics, and offers high-quality, prestige-inspired beauty products for eyes, lips and face to consumers through its retail customers, e.l.f. stores and e-commerce channels.
On September 19, 2016, the Company amended and restated its certificate of incorporation to effect a 2.76:1 forward stock split of the Company’s common stock, increase the number of shares of common stock authorized for issuance to 250.0 million, provide for conversion of preferred stock into common stock prior to its initial public offering and at a ratio that has been adjusted to reflect the effects of the stock split and to address a variety of other corporate governance matters. There was no change in the par value of the Company’s common stock. All common shares, stock options and per share information presented in the financial statements have been adjusted to reflect the stock split on a retroactive basis for all periods presented.
Recapitalization
In conjunction with the Company’s acquisition of e.l.f. Cosmetics, Inc. on January 31, 2014, described further in Note 2, the Company entered into a five-year, senior secured credit agreement (as amended, the “2014 Senior Secured Credit Facility”) with a syndicate consisting of several large financial institutions. The 2014 Senior Secured Credit Facility originally consisted of a $20.0 million revolving line of credit (the “2014 Revolving Credit Facility”) and a $105.0 million term loan facility (the “2014 Term Loan Facility”). Concurrent with the Company’s entry into the 2014 Senior Secured Credit Facility, and as amended in conjunction with the special dividend declared on June 7, 2016 as described below, the Company entered into a second lien credit agreement (as amended, the “Second Lien Credit Facility”) that provided a $40.0 million second lien term loan (the “Second Lien Term Loan”).
On June 7, 2016, the Company incurred an incremental $64.0 million in term loan borrowings under the 2014 Senior Secured Credit Facility to fund, in part, the payment of a $72.0 million special dividend to stockholders, and increased the total availability under the 2014 Revolving Credit Facility to $25.0 million. In connection with the incremental borrowings, certain covenants were amended to reflect the increased leverage. All common stockholders, including individuals that received shares of restricted common stock in connection with the early exercise of certain unvested stock options, received a dividend of $1.79 per share. The $4.1 million dividend paid to restricted common stockholders was immediately used to pay down outstanding notes receivable from such common stockholders pursuant to the underlying recourse note agreements. Accordingly, the net cash outflow related to the dividend was $68.0 million.
Finally, in connection with the special dividend, the Company modified all stock options outstanding and reduced the exercise price by $1.79 per share in order to protect the option holders from dilution that would have otherwise resulted from the dividend recapitalization transaction. This constituted a modification in accordance with Accounting Standards Codification (“ASC”) 718, Compensation-stock compensation. The incremental compensation expense related to the modification was approximately $2.7 million and is being recognized over the original requisite service period for each modified option.
Initial public offering
On September 27, 2016, the Company completed the initial public offering of 9,583,333 shares of its common stock, including the underwriters’ exercise of their overallotment option, at an initial offering price to the public of $17.00 per share, for aggregate gross proceeds of $162.9 million. The Company received net proceeds of $54.9 million, after deducting underwriting discounts and commissions and other offering expenses, including offering expenses paid prior to the initial public offering. The Company did not receive any proceeds from the sale of 5,583,333 shares of its common stock by the existing stockholders in the initial public offering. As part of the initial public offering, the outstanding shares of the Company’s convertible preferred stock were converted into an aggregate of 37,271,375 shares of common stock.
The shares offered and sold in the initial public offering were registered under the Securities Act of 1933, as amended, pursuant to the Company’s Registration Statement on Form S-1 (Registration No. 333-213333), which was declared effective
by the Securities and Exchange Commission on September 21, 2016. The common stock began trading on the New York Stock Exchange on September 22, 2016 under the symbol “ELF.”
F-8
Table of Contents
e.l.f. Beauty, Inc. and subsidiaries
Notes to consolidated financial statements
Note 2—Summary of significant accounting policies
Basis of presentation
On January 31, 2014, the Company acquired 100% of the outstanding shares of capital stock of e.l.f. Cosmetics, Inc. and its subsidiaries (the “Predecessor,” formerly known as J.A. Cosmetics, Inc., or “JACUS”), a developer and marketer of branded value-priced cosmetics, from J.A. Cosmetics Corporation, TSG5 L.P., a private equity fund, and its co-investors (together, the “Sellers”) (the “Acquisition”). The Acquisition was accounted for as a business combination in accordance with Financial Accounting Standards Board (“FASB”) Accounting Standards Codification (“ASC”) Topic 805, Business Combinations (“ASC 805”), and the resulting new basis of accounting is reflected in the Company’s consolidated financial statements for all periods beginning on or after January 31, 2014. As a result, financial information of the Predecessor and Successor periods have been prepared under two different bases of accounting and therefore are not comparable.
The accompanying consolidated financial statements of the Company include all the accounts of e.l.f. Beauty, Inc. and its subsidiaries for periods designated as “Successor” and relate to periods after the Acquisition. The Company had no operations from December 20, 2013 to the date of the Acquisition. The period from January 1, 2014 through January 31, 2014 relates to the period prior to the Acquisition, includes all the accounts of e.l.f. Cosmetics, Inc. and its subsidiaries, and is referred to herein as the “Predecessor 2014 Period.” The period from February 1, 2014 through December 31, 2014 is referred to as the “Successor 2014 Period.”
The consolidated financial statements have been prepared in accordance with U.S. generally accepted accounting principles (“U.S. GAAP”) and all intercompany balances and transactions have been eliminated in consolidation.
Use of estimates
The preparation of financial statements in conformity with U.S. GAAP requires management to make estimates and assumptions that affect the reported amounts of assets and liabilities at the date of the financial statements and reported amounts of revenues and expenses during the reporting period. Actual results could differ from these estimates.
Cash and cash equivalents
Cash and cash equivalents include all cash balances and highly liquid investments purchased with maturities of three months or less.
Accounts receivable
Trade receivables consist of uncollateralized, non-interest bearing customer obligations from transactions with retail customers, reduced by an allowance for doubtful accounts for estimated losses resulting from the inability of customers to make payments. The allowance is based on the evaluation and aging of past due balances, specific exposures, historical trends and economic conditions. The Company writes off accounts receivable against the allowance when a balance is determined to be uncollectible. Recoveries of receivables previously written off are recorded when received. As of December 31, 2015 and 2016, the Company recorded an allowance for doubtful accounts of $40,000 and $0.1 million, respectively. The Company recorded a sales allowance of $3.9 million and $11.9 million as of December 31, 2015 and 2016, respectively, which is also presented as a reduction to accounts receivable. The Company grants credit terms in the normal course of business to its customers. Trade credit is extended based upon an evaluation of each customer’s ability to perform its payment obligations.
Concentrations of credit risk
Financial instruments, which potentially subject the Company to concentrations of credit risk, consist principally of cash and cash equivalents, foreign currency forward contracts and trade receivables. Although the Company deposits its cash with creditworthy financial institutions, its deposits, at times, may exceed federally insured limits. To date, the Company has not experienced any losses on its cash deposits. Foreign currency forward contracts are transacted with creditworthy financial institutions, and no collateral is required. The Company performs credit evaluations of its customers, and the risk with respect to trade receivables is further mitigated by the short duration of customer payment terms and the pedigree of the customer base.
F-9
Table of Contents
e.l.f. Beauty, Inc. and subsidiaries
Notes to consolidated financial statements
During the Predecessor 2014 Period, the Successor 2014 Period, and the year ended December 31, 2016, two customers individually accounted for greater than 10% of the Company’s revenue. During the year ended December 31, 2015, three customers individually accounted for greater than 10% of the Company’s revenue, as disclosed below:
| Predecessor | Successor | |||||||||||||||||||||||
| Period from January 1, 2014 through |
Period from February 1, 2014 through |
Year ended December 31, |
||||||||||||||||||||||
| January 31, 2014 | December 31, 2014 | 2015 | 2016 | |||||||||||||||||||||
| Customer A |
30% | 30% | 28% | 28% | ||||||||||||||||||||
| Customer B |
17% | 19% | 23% | 30% | ||||||||||||||||||||
| Customer C |
* | * | 10% | * | ||||||||||||||||||||
|
|
||||||||||||||||||||||||
| * | Customer comprised less than 10% of net revenue in the period. |
Two customers individually accounted for greater than 10% of the Company’s accounts receivable at the end of the periods presented:
| December 31, 2015 |
December 31, 2016 |
|||||||
| Customer A |
35% | 42% | ||||||
| Customer B |
21% | 23% | ||||||
|
|
||||||||
Inventory
Inventory, consisting principally of finished goods, is stated at the lower of cost or market. Cost is principally determined by the first-in, first-out method. A provision is recorded to adjust inventory to its estimated realizable value when inventory is determined to be in excess of anticipated demand. In the Predecessor 2014 Period, the Successor 2014 Period, and the years ended December 31, 2015 and 2016, the Company incurred insignificant inventory write-downs.
Property and equipment
Property and equipment is stated at cost and is depreciated on a straight-line basis over the estimated useful lives of the assets. Leasehold improvements are amortized on a straight-line basis over the shorter of the lease term or the useful lives of the assets. Repairs and maintenance expenditures are expensed as incurred.
Useful lives by major asset class are as follows:
| Estimated useful lives |
||||
| Machinery, equipment and software |
3-5 years | |||
| Leasehold improvements |
5 years | |||
| Furniture and fixtures |
2-5 years | |||
| Store fixtures |
2-3 years | |||
|
|
||||
The Company evaluates events and changes in circumstances that could indicate carrying amounts of long-lived assets, including property and equipment, may not be recoverable. When such events or changes in circumstances occur, the Company assesses the recoverability of long-lived assets by determining whether or not the carrying value of such assets will be recovered through undiscounted future cash flows derived from their use and eventual disposition. If the sum of the undiscounted future cash flows is less than the carrying amount of an asset, the Company records an impairment loss for the amount by which the carrying amount of the assets exceeds its fair value. There were no impairment charges recorded in the Predecessor 2014 Period, the Successor 2014 Period or the years ended December 31, 2015 or 2016.
F-10
Table of Contents
e.l.f. Beauty, Inc. and subsidiaries
Notes to consolidated financial statements
Goodwill and intangible assets
Goodwill represents the excess purchase price for the Acquisition over the fair value of the net assets acquired. As part of the Acquisition, the Company also acquired finite-lived intangible assets (customer relationships and favorable leases) and an indefinite-lived intangible asset (trademark).
Goodwill is not amortized but rather is reviewed annually for impairment, at the reporting unit level, or when there is evidence that events or changes in circumstances indicate that the Company’s carrying amount may not be recovered. When testing goodwill for impairment, the Company first performs an assessment of qualitative factors. If qualitative factors indicate that it is more likely than not that the fair value of the relevant reporting unit is less than its carrying amount, the Company tests goodwill for impairment at the reporting unit level using a two-step approach. In step one, the Company determines if the fair value of the reporting unit exceeds the unit’s carrying value. If step one indicates that the fair value of the reporting unit is less than its carrying value, the Company performs step two, determining the fair value of goodwill and, if the carrying value of goodwill exceeds its implied fair value, an impairment charge is recorded.
Historically the Company had a single reporting unit for the purpose of performing its goodwill impairment test. During the third quarter of 2015, the Company made structural and reporting changes to its internal organization. This reorganization aligned the internal management and functional support around the Company’s primary sales channels which report into the chief operating decision maker. These changes resulted in the identification of three reporting units that met the definition in ASC 350, Intangibles—Goodwill and Other, of components of the Company’s one operating segment: (i) retail customers, (ii) e.l.f. stores, and (iii) e-commerce. In accordance with ASC 350, on October 1, 2015, the Company reallocated the goodwill to the three reporting units using a relative fair value approach. As a result of the internal reorganization, the Company also performed a goodwill impairment test both immediately before and after this change in reporting units and concluded that no impairment existed.
Indefinite-lived intangible assets are not amortized but rather are tested for impairment annually, and impairment is recognized if the carrying amount exceeds the fair value of the intangible asset. The remaining useful life of the indefinite-lived intangible asset is evaluated each reporting period, and when the useful life is no longer considered to be indefinite, the intangible asset is amortized over its remaining useful life on a straight-line basis. Amortization of intangible assets with finite useful lives is computed on a straight-line basis over periods of three to 10 years. The determination of the estimated period of benefit is dependent upon the use and underlying characteristics of the intangible asset. The Company evaluates the recoverability of its intangible assets subject to amortization when facts and circumstances indicate that the carrying value of the asset may not be recoverable. If the carrying value of an intangible asset is not recoverable, impairment loss is measured as the amount by which the carrying value exceeds its estimated fair value.
Deferred initial public offering costs
Deferred offering costs, which primarily consist of direct incremental legal and accounting fees relating to the initial public offering, were capitalized and $8.4 million such costs were offset against proceeds from our initial public offering in September 2016. As of December 31, 2015, $1.2 million of offering costs were deferred in other assets on the consolidated balance sheets. No deferred offering costs were capitalized as of December 31, 2016.
Debt issuance costs
Debt issuance costs and lender fees were incurred for arranging the credit facilities from various financial institutions. For credit facilities consisting of both term and revolving debt, such costs are allocated to each sub-facility based upon the total borrowing capacity. For term debt, issuance costs are presented within the related long-term debt liability on the consolidated balance sheet and lender fees are presented as a direct deduction from the carrying amount. Both debt issuance costs and lender fees are amortized over the term of the related debt using the effective interest rate method. For revolving debt, issuance costs and lender fees are presented as a noncurrent asset and amortized over the term of the related debt on a straight-line basis.
Fair value of financial instruments
The carrying amounts of cash and cash equivalents, accounts receivable, and accounts payable and accrued expenses approximate their fair values due to the short-term nature of these items. The carrying amounts reported for bank debt
F-11
Table of Contents
e.l.f. Beauty, Inc. and subsidiaries
Notes to consolidated financial statements
approximate their fair values as the stated interest rates approximate market rates currently available to the Company for loans with similar terms. See Note 7—Fair value of financial instruments.
Segment reporting
Operating segments are components of an enterprise for which separate financial information is available that is evaluated by the chief operating decision maker in deciding how to allocate resources and in assessing performance. Utilizing these criteria, the Company manages its business on the basis of one operating segment and one reportable segment. It is impracticable for the Company to provide revenue by product line.
During the Predecessor 2014 Period, the Successor 2014 Period and the years ended December 31, 2015 and 2016, net sales in the United States and outside of the United States were as follows (in thousands):
| Predecessor | Successor | |||||||||||||||||||||||
| Period from January 1, 2014 through |
Period from February 1, 2014 through |
Year ended December 31, |
||||||||||||||||||||||
| January 31, 2014 | December 31, 2014 | 2015 | 2016 | |||||||||||||||||||||
| U.S. |
$ | 9,334 | $ | 122,317 | $ | 178,817 | $ | 210,236 | ||||||||||||||||
| International |
476 | 12,817 | 12,596 | 19,331 | ||||||||||||||||||||
|
|
|
|
|
|||||||||||||||||||||
| Total net sales |
$ | 9,810 | $ | 135,134 | $ | 191,413 | $ | 229,567 | ||||||||||||||||
|
|
||||||||||||||||||||||||
As of December 31, 2015 and December 31, 2016, the Company had long-lived assets in the United States and outside of the United States as follows (in thousands):
| December 31, 2015 |
December 31, 2016 |
|||||||
| U.S. |
$ | 9,230 | $ | 16,757 | ||||
| International |
624 | 394 | ||||||
|
|
|
|||||||
| Total long-lived assets |
$ | 9,854 | $ | 17,151 | ||||
|
|
||||||||
Revenue recognition
Revenue consists of sales of cosmetics through retail customers, e.l.f. stores and e-commerce channels. Sales are recognized when persuasive evidence of an arrangement exists, the product has shipped, title has passed, all risks and rewards of ownership have transferred, the sales price is fixed or determinable and collectability is reasonably assured. Delivery is considered to have occurred at the time the title and risk of loss passes to the customer.
For sales to retail customers, delivery is considered to have occurred at the time of shipment or the time of delivery depending upon the specific terms of the customer arrangement. For sales to e-commerce consumers, delivery is considered to have occurred at the time of delivery of merchandise to the customer.
Revenue from sales to consumers through e.l.f. stores is recognized at the time of purchase. Revenue recognized through e.l.f. store and e-commerce sales channels is recognized net of any taxes that are collected from consumers and subsequently remitted to governmental authorities, such as sales, use and value added taxes.
Provision for sales discounts, product returns, markdowns, shortages and price adjustments are recorded as revenue reductions. These revenue reductions are established by the Company based upon management’s best estimates at the time of sale. The Company regularly reviews and revises, when deemed necessary, its estimates of sales returns and other required reserves based primarily upon the historical rate of actual product returns and the duration of time between the original sale and return. These revenue reductions are reflected on the consolidated balance sheet as a sales allowance against accounts receivable.
F-12
Table of Contents
e.l.f. Beauty, Inc. and subsidiaries
Notes to consolidated financial statements
A reconciliation of the beginning and ending amounts of sales allowances for the Predecessor 2014 Period, the Successor 2014 Period and the years ended December 31, 2015 and 2016 is as follows (in thousands):
| Balance as of January 1, 2014 (Predecessor) |
$ | 2,411 | ||
| Charges |
306 | |||
| Deductions |
(1,092 | ) | ||
|
|
|
|||
| Balance as of January 31, 2014 (Predecessor) |
1,625 | |||
| Charges |
6,408 | |||
| Deductions |
(6,068 | ) | ||
|
|
|
|||
| Balance as of December 31, 2014 (Successor) |
1,965 | |||
| Charges |
13,903 | |||
| Deductions |
(12,002 | ) | ||
|
|
|
|||
| Balance as of December 31, 2015 (Successor) |
3,866 | |||
| Charges |
24,427 | |||
| Deductions |
(16,366 | ) | ||
|
|
|
|||
| Balance as of December 31, 2016 (Successor) |
$ | 11,927 | ||
|
|
||||
In the Predecessor 2014 Period, the Successor 2014 Period, and the years ended December 31, 2015 and 2016, the Company recorded $0.5 million, $4.0 million, $3.6 million and $1.4 million, respectively, of reimbursed shipping expenses from customers within revenues. The shipping and handling costs associated with product distribution were $0.9 million, $8.3 million, $12.6 million and $20.4 million in the Predecessor 2014 Period, the Successor 2014 Period and the years ended December 31, 2015 and 2016, respectively, and are included in selling, general and administrative expenses in the consolidated statements of operations.
Income taxes
Income taxes are accounted for under the asset and liability method. Deferred tax assets and liabilities are recognized for the future tax consequences attributable to differences between the financial statement carrying amounts of existing assets and liabilities and their respective tax bases and operating loss and tax credit carryforwards. Deferred tax assets and liabilities are measured using enacted tax rates expected to apply to taxable income in the years in which those temporary differences are expected to be recovered or settled. The effect on deferred tax assets and liabilities of a change in tax rates is recognized in income in the period that includes the enactment date. Valuation allowances are recorded to reduce deferred tax assets when it is more likely than not that a tax benefit will not be realized.
Future income tax benefits are recognized to the extent that realization of such benefits is more likely than not. The Company recognizes interest and penalties, if any, related to unrecognized tax benefits in its income tax provision.
Leases
The Company leases office space, warehouse and retail store locations, equipment and software. At the inception of each lease, the Company determines its classification as an operating or capital lease. Assets held under capital leases are included in property and equipment. Operating leases are expensed on a straight-line basis over the life of the lease, beginning on the date the Company takes possession of the leased asset.
Certain leases provide for rent abatements or scheduled increases in base rent. Rent expense is recognized on a straight-line basis over the lease term, which results in deferred rent payable being recognized on the consolidated balance sheet. As part of its lease agreements, the Company may receive construction allowances from landlords for tenant improvements. These leasehold improvements made by the Company are capitalized and amortized over the shorter of the lease term or five years. The construction allowances are recorded as deferred rent and amortized on a straight-line basis over the lease term as a reduction of rent expense.
F-13
Table of Contents
e.l.f. Beauty, Inc. and subsidiaries
Notes to consolidated financial statements
Foreign currency
The functional currency of the Company’s foreign subsidiaries is the U.S. dollar. Transactions denominated in currencies other than the functional currency are recorded at exchange rates in effect on the date of the transaction. At the end of each reporting period, monetary assets and liabilities are remeasured to the functional currency using exchange rates in effect at the balance sheet date. Non-monetary assets and liabilities are remeasured at historical exchange rates. Transaction gains or losses that arise from exchange rate fluctuations on transactions denominated in a currency other than the functional currency are included in other income (expense), net in the consolidated statements of operations.
Derivative instruments
The Company is exposed to foreign exchange risk as it has contracts with suppliers in China for future purchases of inventories denominated in the Chinese renminbi (“RMB”). The Company has previously used derivative instruments, specifically forward contracts, to mitigate the impact of foreign currency fluctuations on a portion of its forecasted foreign currency exposures. These contracts are carried at their fair value either as an asset or liability on the consolidated balance sheet. The Company’s derivative contracts are not designated as hedge instruments, and changes in fair value of derivatives are recorded in other income (expense), net in the consolidated statements of operations. The Company does not enter into derivative contracts for speculative or trading purposes.
Stock-based compensation
Stock-based compensation cost is measured at the grant date, based on the fair value of the award, and is recognized on a straight-line basis over the requisite service period, which is generally the award’s vesting period. The Company estimates the fair value of employee stock-based payment awards subject to only a service condition on the date of grant using the Black-Scholes valuation model. The Black-Scholes model requires the use of highly subjective and complex assumptions, including the option’s expected term and the price volatility of the underlying stock.
The Company estimates the fair value of employee stock-based payment awards subject to both a market condition and the occurrence of a performance condition on the date of grant using a Monte Carlo simulation model that assumes the performance criteria will be met and the target payout levels will be achieved. Compensation expense for employee stock-based awards whose vesting is subject to the fulfillment of both a market condition and the occurrence of a performance condition is recognized on a graded-vesting basis at the time the achievement of the performance condition becomes probable.
Forfeitures were previously estimated at the time of grant and revised, if necessary, in subsequent periods if actual forfeitures differed from those estimates. The Company early adopted ASU 2016-09 and beginning January 1, 2016, accounts for forfeitures as they occur. The Company recorded a cumulative-effect adjustment to retained earnings, which was not material, upon early adoption.
Advertising costs
Advertising costs, including promotions and print, are expensed as incurred or distributed. Advertising costs are included in selling, general, and administrative expenses in the accompanying consolidated statements of operations and amounted to approximately $0.2 million, $2.5 million, $3.9 million and $5.6 million in the Predecessor 2014 Period, the Successor 2014 Period, and the years ended December 31, 2015 and 2016, respectively.
Net income (loss) per common share
Basic net income (loss) per common share is computed using net income (loss) available to common stockholders divided by the weighted-average number of common shares outstanding during the period.
Diluted net income (loss) per share reflects the dilutive effects of stock options and restricted stock units outstanding during the period, to the extent such securities would not be anti-dilutive. During 2016, the Company issued unvested restricted stock in connection with the early exercise of certain employee stock options, as described in Note 13. Such restricted stock includes the right to receive non-forfeitable dividends or dividend equivalents and are considered participating securities, which require the Company to compute two-class EPS in periods of net income. Calculations of EPS under the two-class method exclude from the
F-14
Table of Contents
e.l.f. Beauty, Inc. and subsidiaries
Notes to consolidated financial statements
numerator any dividends paid or owed on participating securities and any undistributed earnings considered to be attributable to participating securities. The related participating securities are similarly excluded from the denominator.
Recent accounting pronouncements
The following table provides a brief description of recent accounting pronouncements that could have a material effect on the Company’s financial statements:
| Standard | Description | Date of expected adoption/adoption |
Effect on the financial statements or other significant matters | |||
| Standards that are not yet adopted | ||||||
| ASU 2014-09, Revenue from Contracts with Customers (Topic 606) | The standard will replace existing revenue recognition standards and significantly expand the disclosure requirements for revenue arrangements. It may be adopted either retrospectively or on a modified retrospective basis to new contracts and existing contracts with remaining performance obligations as of the effective date. | January 1, 2018 | The Company expects the standard to impact the methods used to reserve for discounts, refunds and other customer incentives, which may impact the timing of revenue recognition. The Company is currently evaluating the alternative methods of adoption, as well as other possible impacts of the adoption of this standard on its consolidated financial statements. | |||
| ASU 2015-14, Revenue from Contracts with Customers (Topic 606): Deferral of the Effective Date | In August 2015, the FASB issued ASU 2015-14, which deferred the effective date from annual periods beginning on or after December 15, 2016 to annual periods beginning on or after December 15, 2017. | |||||
| ASU 2016-08, Revenue from Contracts with Customers (Topic 606): Principal versus Agent Considerations (Reporting Revenue Gross versus Net)
ASU 2016-10, Revenue from Contracts with Customers (Topic 606): Identifying Performance Obligations and Licensing
ASU 2016-12, Revenue from Contracts with Customers (Topic 606): Narrow-Scope Improvements and Practical Expedient
ASU 2016-20, Technical Corrections and Improvements to Topic 606, Revenue from Contracts with Customers |
In March, April, May and December 2016, the FASB issued ASU 2016-08, ASU 2016-10, ASU 2016-12 and ASU 2016-20, respectively. These standards provide supplemental adoption guidance and clarification to ASU 2014-09, and must be adopted concurrently with the adoption of ASU 2014-09. | |||||
F-15
Table of Contents
e.l.f. Beauty, Inc. and subsidiaries
Notes to consolidated financial statements
| Standard | Description | Date of expected adoption/adoption |
Effect on the financial statements or other significant matters | |||
| ASU 2016-02, Leases (Topic 842) | The standard will require lessees to recognize a right-of-use asset and a lease liability for virtually all of their leases (other than leases that meet the definition of a short-term lease). The liability will be equal to the present value of lease payments. The asset will be based on the liability, subject to adjustment, such as for initial direct costs. Lessor accounting is similar to the current model, but updated to align with certain changes to the lessee model (e.g., certain definitions, such as initial direct costs, have been updated) and the new revenue recognition standard. It requires a modified retrospective approach for all leases existing at, or entered into after, the date of initial application. |
January 1, 2019 | The Company is currently evaluating the effect of the standard on its financial statements and related disclosures. | |||
| Standards that were adopted | ||||||
| ASU 2014-12, Compensation—Stock Compensation (Topic 718): Accounting for Share-Based Payments When the Terms of an Award Provide That a Performance Target Could Be Achieved after the Requisite Service Period | The standard will require that a performance target in a share-based payment award that affects vesting and that can be achieved after the requisite service period is completed to be accounted for as a performance condition. Compensation cost would be recognized in the period in which it becomes probable that the performance target will be achieved, and the amount of compensation cost recognized should be based on the portion of the service period fulfilled. The standard may be adopted either prospectively or retrospectively as of the effective date. | January 1, 2016 | The Company prospectively adopted this standard in the first quarter of 2016. The standard had no effect on the Company’s consolidated financial statements, as its historical practice complied with the new requirements. | |||
F-16
Table of Contents
e.l.f. Beauty, Inc. and subsidiaries
Notes to consolidated financial statements
| Standard | Description | Date of expected adoption/adoption |
Effect on the financial statements or other significant matters | |||
| ASU 2016-09, Improvements to Employee Share-Based Payment Accounting | The standard simplifies several aspects of the accounting for employee share-based payment transactions, including the accounting for income taxes, forfeitures, and statutory tax withholding requirements, as well as classification in the statement of cash flows. | January 1, 2016 | The Company early adopted this standard in the first quarter of 2016. The amendments were applied on a modified retrospective basis, except for amendments requiring recognition of excess tax benefits and deficiencies in the income statement, which was applied prospectively. The standard did not have a material effect on the Company’s consolidated financial statements. | |||
| ASU 2016-15, Classification of certain cash receipts and cash payments | The standard provides specific guidance intended to reduce diversity in practice around eight cash flow statement classification issues. | July 1, 2016 | The Company early adopted this standard in the third quarter of 2016. The amendments were applied on a retrospective basis. The standard did not have any effect on the Company’s consolidated financial statements. | |||
|
| ||||||
Note 3—Acquisition of e.l.f. Cosmetics, Inc. and subsidiaries
On January 31, 2014 (the “Acquisition Date”), the Company acquired 100% of the outstanding shares of capital stock of e.l.f. Cosmetics, Inc. from the Sellers. e.l.f. Cosmetics, Inc. serves as the operating entity of the Company and was incorporated in the State of Delaware in November 2010. The total purchase price was $271.0 million consisting of $239.1 million in cash ($237.9 million net of cash acquired), the issuance of 29,978 shares of the Company’s convertible preferred stock and 6,126 shares of its common stock with an aggregate fair value of $30.0 million, and contingent consideration of $1.9 million related to certain pre-Acquisition tax benefits payable to the Sellers. As of December 31, 2016, $1.9 million of the tax benefit payable to the Sellers remained unpaid.
To fund the cash portion of the Acquisition, the Company raised, in aggregate, $250.0 million, of which $145.0 million was drawn down from two credit facilities and $105.0 million was contributed by TPG Growth II Management, LLC (“TPG”) (through TPG Elf Holdings, LP, a wholly-owned subsidiary of TPG, and co-investors) and various other parties including certain executives of the Company and several of the credit facility lenders, in exchange for 105,063 shares of the Company’s convertible preferred stock and 21,467 shares of common stock. In connection with the arrangement of the credit facilities, the Company incurred, in aggregate, $5.3 million in deferred financing costs. Refer to Note 9 for further discussion of credit facilities.
Purchase price allocation
The Company has accounted for the Acquisition as a business combination in accordance with ASC 805, whereby the purchase price paid to effect the Acquisition was allocated to tangible assets acquired, liabilities assumed and identifiable intangible assets acquired based on their estimated fair values with the excess of the purchase consideration over the
F-17
Table of Contents
e.l.f. Beauty, Inc. and subsidiaries
Notes to consolidated financial statements
aggregate fair values recorded as goodwill. The value of goodwill was 58% of the total purchase consideration and is primarily attributable to the assembled workforce and expected future growth. The goodwill is not deductible for tax purposes.
The Acquisition provided the Company with three intangible assets: (i) customer relationships with useful lives ranging from three to 10 years, (ii) favorable leases with useful lives ranging from 27 to 71 months and (iii) an indefinite-lived trademark (See Note 4—Goodwill and other intangible assets). The customer relationships asset represents the value resulting from the Company’s relationships with its retail customers and e-commerce consumers. The favorable leases asset represents the value associated with the leasehold interests associated with the Company’s office and warehouse locations in New York and New Jersey. The trademark asset represents the value resulting from the popularity and recognition of the e.l.f. Cosmetics brand. The fair values of the acquired customer relationships were based on the excess earnings method and are subject to amortization on a straight-line basis over their remaining useful lives. The fair values of the acquired favorable leases were based on the difference between the actual lease rates and the-then current market rent for similar properties in those locations. The fair value of the acquired trademark was based on the relief from royalty method. In addition, the Acquisition resulted in a fair market adjustment to acquired inventory of $1.3 million, the fair value of which was based on the expected selling price less disposal costs and a reasonable profit margin. The Company incurred $2.8 million in Acquisition-related costs, which were expensed and included within selling, general and administrative expenses in the Successor 2014 Period.
The following table summarizes the consideration paid and the fair values of the assets acquired and liabilities assumed at the Acquisition Date (in thousands):
| Amount | ||||
| Tangible assets acquired |
$ | 51,755 | ||
| Intangible asset—customer relationships, retailers |
68,800 | |||
| Intangible asset—customer relationships, e-commerce |
3,800 | |||
| Intangible asset—trademark |
63,800 | |||
| Intangible asset—favorable leases |
580 | |||
| Goodwill |
157,264 | |||
| Liabilities assumed |
(74,990 | ) | ||
|
|
|
|||
| Fair value of total purchase consideration |
$ | 271,009 | ||
|
|
||||
Unaudited pro forma financial information
In accordance with ASC 805, the following unaudited pro forma financial information presents the combined results of continuing operations for the year ended December 31, 2014, as if the Acquisition had been completed on January 1, 2014 (in thousands). Unaudited pro forma financial information is not required to be presented for the year ended December 31, 2015 as the actual combined results of the Acquisition are already reflected in the consolidated financial statements for this period. The unaudited pro forma results do not reflect any operating efficiencies or potential cost savings that may result from the consolidation of operations.
The unaudited pro forma financial information should not be relied upon as necessarily being indicative of the historical results that would have been obtained if the Acquisition had actually occurred on that date or the results that will be obtained in the future.
| Year ended December 31, 2014 |
||||
| Net sales |
$ | 144,944 | ||
| Net loss |
(9,778 | ) | ||
|
|
||||
F-18
Table of Contents
e.l.f. Beauty, Inc. and subsidiaries
Notes to consolidated financial statements
Note 4—Goodwill and other intangible assets
Information regarding the Company’s goodwill and intangible assets as of December 31, 2015 is as follows (in thousands):
| Estimated useful life |
Gross carrying amount |
Accumulated amortization |
Net carrying amount |
|||||||||||||
| Customer relationships—retailers |
10 years | $ | 68,800 | $ | (13,187 | ) | $ | 55,613 | ||||||||
| Customer relationships—e-commerce |
3 years | 3,900 | (2,436 | ) | 1,464 | |||||||||||
| Favorable leases, net |
Varies | 580 | (175 | ) | 405 | |||||||||||
|
|
|
|||||||||||||||
| Total finite-lived intangibles |
73,280 | (15,798 | ) | 57,482 | ||||||||||||
| Trademarks |
Indefinite | 63,800 | — | 63,800 | ||||||||||||
| Goodwill |
157,264 | — | 157,264 | |||||||||||||
|
|
|
|||||||||||||||
| Total goodwill and other intangibles |
$ | 294,344 | $ | (15,798 | ) | $ | 278,546 | |||||||||
|
|
||||||||||||||||
Information regarding the Company’s goodwill and intangible assets as of December 31, 2016 is as follows (in thousands):
| Estimated useful life |
Gross carrying amount |
Accumulated amortization |
Net carrying amount |
|||||||||||||
| Customer relationships—retailers |
10 years | $ | 68,800 | $ | (20,067 | ) | $ | 48,733 | ||||||||
| Customer relationships—e-commerce |
3 years | 3,900 | (3,736 | ) | 164 | |||||||||||
| Favorable leases, net |
Varies | 580 | (274 | ) | 306 | |||||||||||
|
|
|
|||||||||||||||
| Total finite-lived intangibles |
73,280 | (24,077 | ) | 49,203 | ||||||||||||
| Trademarks |
Indefinite | 63,800 | — | 63,800 | ||||||||||||
| Goodwill |
157,264 | — | 157,264 | |||||||||||||
|
|
|
|||||||||||||||
| Total goodwill and other intangibles |
$ | 294,344 | $ | (24,077 | ) | $ | 270,267 | |||||||||
|
|
||||||||||||||||
The Company has not recognized any impairment charges on its goodwill or intangible assets. Amortization expense on the finite-lived intangible assets amounted to $11,000, $7.6 million, $8.2 million and $8.3 million in the Predecessor 2014 Period, the Successor 2014 Period, and the years ended December, 31 2015 and 2016, respectively.
As a result of the Acquisition, the $0.7 million carrying value of the Predecessor’s goodwill as of January 31, 2014, was eliminated and new goodwill was recorded by the Successor on February 1, 2014. In addition, the Predecessor’s $0.6 million in historical finite-lived intangible assets was stepped-up to fair value at the time of the Acquisition. The Predecessor did not recognize any impairment charges during the Predecessor 2014 Period.
The estimated future amortization expense related to the finite-lived intangible assets, assuming no impairment as of December 31, 2016, is as follows (in thousands):
| Year ending December 31, | ||||
| 2017 |
$ | 7,121 | ||
| 2018 |
7,007 | |||
| 2019 |
6,982 | |||
| 2020 |
6,880 | |||
| Thereafter |
21,213 | |||
|
|
|
|||
| Total |
49,203 | |||
|
|
||||
F-19
Table of Contents
e.l.f. Beauty, Inc. and subsidiaries
Notes to consolidated financial statements
Note 5—Property and equipment
Property and equipment as of December 31, 2015 and 2016 consists of the following (in thousands):
| December 31, 2015 |
December 31, 2016 |
|||||||
| Machinery, equipment and software |
$ | 1,322 | $ | 3,956 | ||||
| Leasehold improvements |
1,880 | 7,620 | ||||||
| Furniture and fixtures |
625 | 2,771 | ||||||
| Store fixtures |
8,147 | 8,921 | ||||||
|
|
|
|||||||
| Property and equipment, gross |
11,974 | 23,268 | ||||||
| Less: Accumulated depreciation and amortization |
(2,120 | ) | (6,117 | ) | ||||
|
|
|
|||||||
| Property and equipment, net |
$ | 9,854 | $ | 17,151 | ||||
|
|
||||||||
Depreciation and amortization expense on property and equipment were $30,000, $0.4 million, $2.0 million and $4.9 million in the Predecessor 2014 Period, the Successor 2014 Period and the years ended December 31, 2015 and 2016, respectively.
Note 6—Accrued expenses and other current liabilities
Accrued expenses as of December 31, 2015 and 2016 consists of the following (in thousands):
| December 31, 2015 |
December 31, 2016 |
|||||||
| Accrued expenses |
$ | 2,681 | $ | 9,537 | ||||
| Other current liabilities |
4,752 | 9,249 | ||||||
| Accrued compensation |
6,280 | 7,111 | ||||||
| Early exercised option deposit liability |
— | 4,074 | ||||||
| Income taxes payable |
— | 3,705 | ||||||
|
|
|
|||||||
| Accrued expenses and other current liabilities |
$ | 13,713 | $ | 33,676 | ||||
|
|
||||||||
Note 7—Fair value of financial instruments
The fair value of foreign currency forward contracts and bank debt are categorized based upon the level of judgment associated with the inputs used to measure their fair values. Fair value is measured using inputs from the three levels of the fair value hierarchy, which are described as follows:
Level 1—Quoted prices in active markets for identical assets or liabilities
Level 2—Quoted prices for similar assets and liabilities in active markets or inputs that are observable
Level 3—Inputs that are unobservable (for example, cash flow modeling inputs based on management’s assumptions)
The assets’ or liabilities’ fair value measurement level within the fair value hierarchy is based on the lowest level of any input that is significant to the fair value measurement. The Company’s Level 2 instruments consist of foreign currency forward contracts for which fair values were based on market prices obtained from independent brokers or determined using quantitative models that use as their basis readily observable market parameters that are actively quoted and can be validated through external sources, including third-party pricing services, brokers and market transactions.
F-20
Table of Contents
e.l.f. Beauty, Inc. and subsidiaries
Notes to consolidated financial statements
The following table sets forth the fair value of the Company’s financial liabilities by level within the fair value hierarchy as of December 31, 2015 (in thousands):
| Fair value measurements using | ||||||||||||||||
| Fair value | Level 1 | Level 2 | Level 3 | |||||||||||||
| Financial liabilities: |
||||||||||||||||
| Foreign currency forward contracts |
$ | 10,702 | $ | — | $ | 10,702 | $ | — | ||||||||
| Long-term debt, including current portion(1) |
148,106 | — | 148,106 | — | ||||||||||||
|
|
|
|||||||||||||||
| Total financial liabilities |
$ | 158,808 | $ | — | $ | 158,808 | $ | — | ||||||||
|
|
||||||||||||||||
| (1) | Of this amount, $10,325 is classified as current. The gross carrying amounts of the Company’s bank debt, before reduction of the debt issuance costs, approximate their fair values as the stated rates approximate market rates for loans with similar terms. |
The following table sets forth the fair value of the Company’s financial liabilities by level within the fair value hierarchy as of December 31, 2016 (in thousands):
| Fair value measurements using | ||||||||||||||||
| Fair value | Level 1 | Level 2 | Level 3 | |||||||||||||
| Financial liabilities: |
||||||||||||||||
| Foreign currency forward contracts |
$ | — | $ | — | $ | — | $ | — | ||||||||
| Long-term debt, including current portion(1) |
165,393 | — | 165,393 | — | ||||||||||||
|
|
|
|||||||||||||||
| Total financial liabilities |
$ | 165,393 | $ | — | $ | 165,393 | $ | — | ||||||||
|
|
||||||||||||||||
| (1) | Of this amount, $8,650 is classified as current. The gross carrying amounts of the Company’s bank debt, before reduction of the debt issuance costs, approximate their fair values as the stated rates approximate market rates for loans with similar terms. |
The Company did not transfer any assets measured at fair value on a recurring basis to or from Level 2 for any of the periods presented.
Note 8—Derivatives
The Company has previously used forward contracts to economically hedge the impact of the variability in exchange rates on contracts with its suppliers in China for future purchases of inventories denominated in RMB. The Company does not designate any of the forward contracts as hedges and does not apply hedge accounting. All forward contracts are recorded at fair value on the consolidated balance sheet. In the Predecessor 2014 Period, the Successor 2014 Period, and the years ended December 31, 2015 and 2016, realized and unrealized gains (losses) of ($0.1 million), ($6.9 million), ($7.9 million) and $1.1 million, respectively, from the Company’s forward contracts were recognized in other income (expense), net in the consolidated statements of operations and comprehensive income (loss).
The Company generally does not hedge the net assets of its international subsidiaries.
As of December 31, 2015 and December 31, 2016, the aggregate notional amount of the Company’s outstanding forward contracts was as follows (in thousands):
| Derivatives not designated as hedging instruments | December 31, 2015 |
December 31, 2016 |
||||||
| Foreign currency contracts |
$ | 148,978 | $ | — | ||||
|
|
||||||||
The Company’s derivative transactions are governed by ISDA Master Agreements, which include provisions governing the setoff of assets and liabilities between the parties. When the Company has more than one outstanding derivative transaction with a single counterparty, the setoff provisions contained within these agreements generally allow the non-defaulting party the right to reduce its liability to the defaulting party by amounts eligible for setoff as well as eligible offsetting transactions
F-21
Table of Contents
e.l.f. Beauty, Inc. and subsidiaries
Notes to consolidated financial statements
with that counterparty, irrespective of the currency, place of payment or booking office. The Company’s policy is to present its derivative assets and derivative liabilities on the consolidated balance sheets on a net basis.
| As of December 31, 2015 (in thousands) |
Net amount recognized in the consolidated balance sheets |
Gross amounts offset in the consolidated balance sheets |
Gross amount | |||||||||
| Liabilities: |
||||||||||||
| Foreign currency contracts |
$ | 10,702 | $ | — | $ | 10,702 | ||||||
|
|
|
|||||||||||
| Total liabilities |
$ | 10,702 | $ | — | $ | 10,702 | ||||||
|
|
||||||||||||
There were no forward contracts outstanding as of December 31, 2016.
Note 9—Debt
The following summarizes the recent significant transactions impacting the Company’s indebtedness:
| • | In connection with the Acquisition on January 31, 2014, as discussed in Note 2, the Company entered into the 2014 Senior Secured Credit Facility, which consisted of a $20.0 million revolving line of credit and a $105.0 million term loan. Also on January 31, 2014, the Company entered into the $40.0 million Second Lien Term Loan. The interest rate on both the revolving credit facility and the term loan under the 2014 Senior Secured Credit Facility was 6.25% per annum as of December 31, 2015. The interest rate on the Second Lien Term Loan was 11% per annum as of December 31, 2015. |
| • | On June 7, 2016, the Company incurred an incremental $64.0 million in term loan borrowings under the 2014 Senior Secured Credit Facility to fund, in part, a $72.0 million special dividend to stockholders, and increased the total availability under the revolving credit facility to $25.0 million. |
| • | On September 27, 2016, the Company used a portion of the proceeds from the initial public offering to repay the entire outstanding balance of $40.0 million from the Second Lien Term Loan. |
| • | On December 23, 2016, the Company refinanced its outstanding obligations under the 2014 Senior Secured Credit Facility, entering into a new 5-year, $200.0 million senior secured credit facility (the “Senior Secured Credit Facility”), as further described below. |
The Company’s outstanding debt as of December 31, 2015 and 2016 consists of the following (in thousands):
| December 31, 2015 |
December 31, 2016 |
|||||||
| Debt: |
||||||||
| Revolving credit facility |
$ | 7,700 | $ | — | ||||
| Term loan |
100,406 | 162,627 | ||||||
| Second lien term loan |
40,000 | — | ||||||
| Capital lease obligations |
— | 2,766 | ||||||
|
|
|
|||||||
| Total debt |
148,106 | 165,393 | ||||||
| Less: debt issuance costs |
(3,187 | ) | (566 | ) | ||||
|
|
|
|||||||
| Total debt, net of issuance costs |
144,919 | 164,827 | ||||||
| Less: current portion |
(10,325 | ) | (8,650 | ) | ||||
|
|
|
|||||||
| Long-term portion of debt |
$ | 134,594 | $ | 156,177 | ||||
|
|
||||||||
F-22
Table of Contents
e.l.f. Beauty, Inc. and subsidiaries
Notes to consolidated financial statements
Senior secured credit facility
On December 23, 2016, the Company entered into a new five-year, $200.0 million senior secured credit facility with a syndicate consisting of several large financial institutions. The facility consists of a $35.0 million revolving line of credit (the “Revolving Credit Facility”) and a $165.0 million term loan (the “Term Loan Facility”).
All amounts under the Revolving Credit Facility are available for draw until the maturity date on December 23, 2021. The Revolving Credit Facility is collateralized by substantially all of the Company’s assets and requires payment of an unused fee ranging from 0.35% to 0.25% (depending on the Company’s consolidated total net leverage ratio) times the average daily amount of unutilized commitments under the Revolving Credit Facility. The Revolving Credit Facility also provides for sub-facilities in the form of a $7.0 million letter of credit and a $5.0 million swing line loan; however, all amounts under the Revolving Credit Facility cannot exceed $35.0 million. The unused balance of the Revolving Credit Facility as of December 31, 2016 was $34.5 million.
The Term Loan Facility maturity date is also December 23, 2021, and is collateralized by substantially all of the Company’s assets. Amortization installment payments on the Term Loan Facility are required to be made in quarterly installments of (i) $2,062,500 for fiscal quarters ending March 31, 2017 through December 31, 2018, (ii) $2,475,000 for fiscal quarters ending March 31, 2019 through December 31, 2019, (iii) $3,093,750 for fiscal quarters ending March 31, 2020 through December 31, 2020 and (iv) $4,125,000 for fiscal quarters ending March 31, 2021 through September 30, 2021. The remaining Term Loan Facility balance is due upon the maturity date. The Term Loan Facility can be prepaid at any time without penalty and is subject to mandatory prepayments when there is (i) excess cash flow, which is defined as EBITDA less certain customary deductions, (ii) non-ordinary course asset dispositions that result in net proceeds in excess of $2.5 million during a year, unless reinvested within twelve months, or (iii) issuance of additional debt.
Both the Revolving Credit Facility and the Term Loan Facility bear interest, at the Company’s option, at a rate per annum equal to either (i) the greater of (x) 3.00% and (y) an adjusted LIBOR rate determined by reference to the cost of funds for U.S. dollar deposits for the applicable interest period plus an applicable margin ranging from 2.00% to 3.50% based on the Company’s consolidated total net leverage ratio or (ii) the greater of (x) 2.00% and (y) a floating base rate plus an applicable margin ranging from 1.00% to 2.50% based on the Company’s consolidated total net leverage ratio. The interest rate on both the Revolving Credit Facility and the Term Loan was 4.5% per annum as of December 31, 2016.
The Company incurred costs directly related to the Senior Secured Credit Facility of $2.3 million, consisting primarily of lender fees of $2.1 million and third-party fees of $0.2 million. These fees were allocated between the Revolving Credit Facility and the Term Loan Facility, with the portion attributable to the Term Loan Facility recorded as a reduction of the carrying amount of the debt and the portion attributable to the Revolving Credit Facility recorded as a noncurrent asset.
The Senior Secured Credit Facility contains a number of covenants that, among other things, restrict the Company’s ability to (subject to certain exceptions) pay dividends and distributions or repurchase its capital stock, incur additional indebtedness, create liens on assets, engage in mergers or consolidations and sell or otherwise dispose of assets. The Senior Secured Credit Facility also includes reporting, financial and maintenance covenants that require the Company to, among other things, comply with certain consolidated total net leverage ratios and consolidated fixed charge coverage ratios. As of December 31, 2015 and 2016, the Company was in compliance with all financial covenants.
Aggregate future minimum principal payments on the Term Loan are as follows (in thousands):
| Year ending December 31, |
||||
| 2017 |
$ | 8,250 | ||
| 2018 |
8,250 | |||
| 2019 |
9,900 | |||
| 2020 |
12,375 | |||
| Thereafter |
126,225 | |||
|
|
|
|||
| Total |
$ | 165,000 | ||
|
|
||||
F-23
Table of Contents
e.l.f. Beauty, Inc. and subsidiaries
Notes to consolidated financial statements
Interest expense and extinguishment of debt
In September 2016, the Company used a portion of the proceeds from the initial public offering to repay the entire outstanding balance of the Second Lien Term Loan. In connection with this extinguishment of debt, the Company incurred a $0.4 million prepayment penalty and wrote off $0.5 million in unamortized debt issuance costs attributable to the Second Lien Term Loan.
Additionally, as described above, in December 2016, the Company entered into a new Senior Secured Credit Facility and a portion of the debt outstanding under the 2014 Senior Secured Credit Facility was considered extinguished. In connection with this extinguishment of debt, the Company wrote off $1.7 million in unamortized debt discount and debt issuance costs, as well as approximately $0.1 million in other fees associated with the refinancing transaction. For the portion of the 2014 Senior Secured Credit Facility that was not considered extinguished, approximately $0.7 million in unamortized debt discount and $0.8 million in unamortized debt issuance costs remain on the balance sheet and are being amortized over the 5-year term of the new Senior Secured Credit Facility.
The components of interest expense are as follows (in thousands):
| Predecessor | Successor | |||||||||||||||||||||||
| Period from January 1, 2014 through |
Period from February 1, 2014 through |
Year ended December 31, |
||||||||||||||||||||||
| January 31, 2014 | December 31, 2014 | 2015 | 2016 | |||||||||||||||||||||
| Interest of term loan debt |
$ | 126 | $ | 10,192 | $ | 10,988 | $ | 12,076 | ||||||||||||||||
| Amortization of debt issuance costs |
— | 993 | 1,101 | 1,281 | ||||||||||||||||||||
| Loss on extinguishment of debt |
— | — | — | 2,736 | ||||||||||||||||||||
| Interest on revolving line of credit |
2 | 369 | 700 | 190 | ||||||||||||||||||||
| Other |
— | (9 | ) | (68 | ) | — | ||||||||||||||||||
|
|
|
|
|
|||||||||||||||||||||
| Interest expense, net |
$ | 128 | $ | 11,545 | $ | 12,721 | $ | 16,283 | ||||||||||||||||
|
|
||||||||||||||||||||||||
Note 10—Commitments and contingencies
Operating leases
The Company leases office, retail and warehouse space in New York, New Jersey, California and China from third parties under non-cancelable operating leases that provide for minimum base annual rental payments (excluding taxes and other charges). A number of the Company’s store leases provide for contingent rentals based upon sales. Contingent rent amounts have historically not been significant. The leases expire between 2018 and 2026. Total rent expense was $0.1 million, $1.9 million, $3.0 million and $4.1 million for the Predecessor 2014 Period, the Successor 2014 Period, and the years ended December 31, 2015 and 2016, respectively.
Future minimum lease payments under the operating leases are as follows (in thousands):
| Year ending December 31, |
||||
| 2017 |
$ | 4,789 | ||
| 2018 |
4,726 | |||
| 2019 |
4,636 | |||
| 2020 |
4,188 | |||
| Thereafter |
13,397 | |||
|
|
|
|||
| Total |
31,736 | |||
|
|
||||
F-24
Table of Contents
e.l.f. Beauty, Inc. and subsidiaries
Notes to consolidated financial statements
In November 2016, the Company vacated a previously leased office facility and has entered into a sublease agreement with a related party for that space. The estimated future sublease income as of December 31, 2016 is $0.9 million and has been recorded as a reduction to the accrual of all remaining lease operating lease payments recognized on the date the previous facility was vacated.
Litigation
From time to time, the Company may become involved in legal proceedings, claims, and litigation arising in the ordinary course of business. Management is not currently aware of any matters that it expects will have a material adverse effect on the Company’s consolidated financial position, results of operations or cash flows.
Note 11—Income taxes
The components of income (loss) before income taxes are as follows (in thousands):
| Predecessor | Successor | |||||||||||||||||||||||
| Period from January 1, 2014 through |
Period from February 1, 2014 through |
Year ended December 31, |
||||||||||||||||||||||
| January 31, 2014 | December 31, 2014 | 2015 | 2016 | |||||||||||||||||||||
| Domestic |
$ | 1,709 | $ | (13,517 | ) | $ | 8,053 | $ | 9,677 | |||||||||||||||
| Foreign |
(74 | ) | 686 | 625 | 135 | |||||||||||||||||||
|
|
|
|
|
|||||||||||||||||||||
| Total |
$ | 1,635 | $ | (12,831 | ) | $ | 8,678 | $ | 9,812 | |||||||||||||||
|
|
||||||||||||||||||||||||
| The components of the (provision) benefit for income taxes are as follows (in thousands):
|
| |||||||||||||||||||||||
| Predecessor | Successor | |||||||||||||||||||||||
| Period from January 1, 2014 through |
Period from February 1, 2014 through |
Year ended December 31, |
||||||||||||||||||||||
| January 31, 2014 | December 31, 2014 | 2015 | 2016 | |||||||||||||||||||||
| Current: |
||||||||||||||||||||||||
| U.S. federal |
$ | 1,394 | $ | (363 | ) | $ | (6,837 | ) | $ | (9,978 | ) | |||||||||||||
| State |
(5 | ) | (111 | ) | (1,026 | ) | (2,096 | ) | ||||||||||||||||
| Foreign |
18 | (257 | ) | (391 | ) | — | ||||||||||||||||||
|
|
|
|
|
|||||||||||||||||||||
| Total current |
1,407 | (731 | ) | (8,254 | ) | (12,074 | ) | |||||||||||||||||
| Deferred: |
||||||||||||||||||||||||
| U.S. federal |
(1,881 | ) | 3,881 | 3,710 | 8,384 | |||||||||||||||||||
| State |
(68 | ) | 324 | 201 | (773 | ) | ||||||||||||||||||
| Foreign |
— | 71 | 22 | (36 | ) | |||||||||||||||||||
|
|
|
|
|
|||||||||||||||||||||
| Total deferred |
(1,949 | ) | 4,276 | 3,933 | 7,575 | |||||||||||||||||||
|
|
|
|
|
|||||||||||||||||||||
| Total (provision) benefit for income taxes |
$ | (542 | ) | $ | 3,545 | $ | (4,321 | ) | $ | (4,499 | ) | |||||||||||||
|
|
||||||||||||||||||||||||
F-25
Table of Contents
e.l.f. Beauty, Inc. and subsidiaries
Notes to consolidated financial statements
| The following table presents a reconciliation of the federal statutory rate to the Company’s effective tax rate:
|
| |||||||||||||||||||||||
| Predecessor | Successor | |||||||||||||||||||||||
| Period from January 1, 2014 through |
Period from February 1, 2014 through |
Year ended December 31, |
||||||||||||||||||||||
| January 31, 2014 | December 31, 2014 | 2015 | 2016 | |||||||||||||||||||||
| Federal statutory rate |
34.0% | 34.0% | 35.0% | 35.0% | ||||||||||||||||||||
| State tax-net of federal benefit |
1.7% | 1.7% | 2.2% | 0.7% | ||||||||||||||||||||
| State tax deferred rate change |
0.0% | 0.0% | 0.3% | 18.7% | ||||||||||||||||||||
| Impact of foreign operations |
0.4% | 1.0% | (0.2% | ) | 0.1% | |||||||||||||||||||
| U.S. subpart F income |
0.0% | (2.2% | ) | 2.5% | 0.5% | |||||||||||||||||||
| Nondeductible transaction-related costs |
0.0% | (6.5% | ) | 0.0% | 2.0% | |||||||||||||||||||
| Uncertain tax positions |
0.0% | (0.2% | ) | 5.3% | 2.0% | |||||||||||||||||||
| Stock based compensation |
0.0% | 0.0% | 0.6% | (16.8% | ) | |||||||||||||||||||
| Others |
(3.0% | ) | (0.2% | ) | 4.1% | 3.7% | ||||||||||||||||||
|
|
|
|
|
|||||||||||||||||||||
| Effective tax rate |
33.1% | 27.6% | 49.8% | 45.9% | ||||||||||||||||||||
|
|
||||||||||||||||||||||||
The components of net deferred taxes arising from temporary differences are as follows (in thousands):
| December 31, 2015 |
December 31, 2016 |
|||||||
| Deferred tax assets: |
||||||||
| Compensation |
$ | 1,969 | $ | 1,848 | ||||
| Inventories and receivables |
1,604 | 6,905 | ||||||
| Accrued expenses |
2,120 | 1,996 | ||||||
| Stock compensation |
238 | 1,967 | ||||||
| Net operating losses |
— | 232 | ||||||
| Other |
446 | 1,304 | ||||||
|
|
|
|||||||
| Deferred tax assets |
6,377 | 14,252 | ||||||
| Deferred tax liabilities: |
||||||||
| Goodwill |
1,614 | 2,562 | ||||||
| Fixed assets |
1,620 | 2,699 | ||||||
| Intangible assets |
44,493 | 42,587 | ||||||
| Other |
514 | 579 | ||||||
|
|
|
|||||||
| Deferred tax liabilities |
48,241 | 48,427 | ||||||
|
|
|
|||||||
| Net deferred tax liabilities |
$ | 41,864 | $ | 34,175 | ||||
|
|
||||||||
F-26
Table of Contents
e.l.f. Beauty, Inc. and subsidiaries
Notes to consolidated financial statements
The deferred tax assets and liabilities within the same jurisdiction are reported net in the accompanying balance sheets as follows (in thousands):
| December 31, 2015 |
December 31, 2016 |
|||||||
| Noncurrent deferred tax assets |
$ | 262 | $ | 37 | ||||
| Noncurrent deferred tax liabilities |
42,126 | 34,212 | ||||||
|
|
|
|
|
|||||
| Net deferred tax liabilities |
$ | 41,864 | $ | 34,175 | ||||
|
|
||||||||
At December 31, 2016, the Company had gross foreign net operating loss carryforwards of $0.9 million. The foreign net operating loss carryforwards will begin to expire in 2020 and have a carryforward period of five years.
A reconciliation of the beginning and ending amount of unrecognized tax benefits is as follows (in thousands):
| Predecessor | Successor | |||||||||||||||||||||||
| Period from January 1, 2014 through |
Period from February 1, 2014 through |
Year ended December 31, |
||||||||||||||||||||||
| January 31, 2014 | December 31, 2014 | 2015 | 2016 | |||||||||||||||||||||
| Balance at beginning of year |
$ | 581 | $ | 581 | $ | 607 | $ | 1,256 | ||||||||||||||||
| Increases for prior year tax positions |
— | — | 1 | 438 | ||||||||||||||||||||
| Increases for current year tax positions |
— | 26 | 648 | 103 | ||||||||||||||||||||
| Decreases for prior year tax positions |
— | — | — | (589 | ) | |||||||||||||||||||
| Decreases due to settlements |
— | — | — | — | ||||||||||||||||||||
| Decreases due to statutes lapsing |
— | — | — | — | ||||||||||||||||||||
|
|
|
|
|
|||||||||||||||||||||
| Balance at end of year |
$ | 581 | $ | 607 | $ | 1,256 | $ | 1,208 | ||||||||||||||||
|
|
||||||||||||||||||||||||
If all of the Company’s unrecognized tax benefits as of December 31, 2015 and December 31, 2016 were recognized, $1.0 million and $0.7 million of unrecognized tax benefits, respectively, would impact the effective tax rate. The Company believes it is reasonably possible that $0.5 million of unrecognized tax benefits may reverse in the next twelve months.
The Company recognizes interest and penalties accrued related to unrecognized tax benefits in the provision for income taxes. The Company had $31,000 and $0.2 million of accrued gross interest and penalties as of December 31, 2015 and December 31, 2016, respectively. The Company recognized net interest expense of $20,000 and $0.1 million for the years ended December 31, 2015 and 2016, respectively. The Company did not recognize any net interest expense during the Predecessor 2014 Period and the Successor 2014 Period.
The Company files income tax returns in the U.S. federal jurisdiction and various state and foreign jurisdictions. As of December 31, 2016, with few exceptions, the Company or its subsidiaries are no longer subject to examination prior to tax year 2013. Certain state returns are currently under audit by the state tax authorities. The Company does not expect the results of these audits to have a material impact on the consolidated financial statements.
Note 12—Preferred stock
The Company has authorized 30,000,000 shares of preferred stock for issuance with a par value of $0.01 per share. There were no shares of preferred stock outstanding as of December 31, 2015 or December 31, 2016.
In conjunction with the Acquisition, 135,041 shares of convertible preferred stock were issued for a total consideration of approximately $135.0 million. These shares remained outstanding as of December 31, 2015 and were converted to 37,271,375 shares of common stock immediately prior to the initial public offering.
F-27
Table of Contents
e.l.f. Beauty, Inc. and subsidiaries
Notes to consolidated financial statements
Prior to conversion, the Company’s convertible preferred stock was classified as temporary equity in the accompanying consolidated balance sheets in accordance with ASC 480, Distinguishing Liabilities from Equity, as the convertible preferred stock was redeemable at the option of the holder and was also redeemable, if not converted to common stock, at the time of an initial public offering. In conjunction with this classification, the Company has accreted the carrying value of the convertible preferred stock to reflect its maximum redemption amount as of December 31, 2015 and through the date of conversion. The maximum redemption amount is the greater of the convertible preferred stock liquidation value (including dividends) or the as-converted value based on the common stock per share price.
For the Successor 2014 Period, the Company accreted $10.3 million, which represents dividends at the rate of 8% per annum. For the years ended December 31, 2015 and 2016, the Company accreted $52.0 million and $436.3 million, respectively, which reflect increases in the as-converted value. The accreted value was reclassified from temporary equity to additional paid-in capital upon conversion and the Company accounted for the accretion of convertible preferred stock as a reduction from amounts available for distribution to common stockholders.
Note 13—Stock-based compensation
Stock plans
The Company grants stock-based awards under its 2016 Equity Incentive Award Plan (the “2016 Plan”), which replaced its 2014 Equity Incentive Plan (the “2014 Plan”) and became effective immediately prior to the effectiveness of the Company’s registration statement on Form S-1. Immediately prior to the initial public offering, the 2014 Plan terminated and no further awards will be granted thereunder. The 2016 Plan permits the grant of incentive stock options, non-statutory stock options, restricted stock and other stock- or cash-based awards to employees, officers, directors, advisors and consultants. The 2016 Plan allows for option grants of the Company’s common stock based on service, performance and market conditions.
A total of 9,460,556 shares were reserved for grant and 607,276 shares remained available for future issuance under the 2014 Plan as of December 31, 2015. There were no shares reserved for grant or available for future issuance under the 2014 Plan as of December 31, 2016.
A total of 5,430,690 shares were initially reserved for grant under the 2016 Plan. Additionally, any awards outstanding under the 2014 Equity Plan that are forfeited or lapse unexercised will be added to the shares reserved and available for grant under the 2016 Plan, up to a maximum of 4,341,200 shares. As of December 31, 2016, a total of 5,510,040 shares were reserved for grant under the 2016 Plan, including 79,350 shares forfeited from the 2014 Plan to date, and 3,683,028 shares remained available for future issuance.
Early exercise of stock options
Stock options granted pursuant to the 2014 Plan permitted certain management-level option holders and directors to elect to exercise unvested options prior to vesting (“early exercise”). In the event of termination of the option holder’s employment or directorship, all unvested shares issued upon the early exercise, so long as they remain unvested, are subject to repurchase by the Company at the lower of the original exercise price or the fair market value of a share of common stock on the date of termination.
Consistent with authoritative guidance, early exercises are not considered substantive exercises for accounting purposes. Cash received for the exercise of unvested options is recorded as a liability, which is released to additional paid-in capital at each reporting date as the shares vest. During the year ended December 31, 2016, options to purchase 3,420,243 shares of common stock were early exercised prior to vesting. Subsequent to the date of exercise through December 31, 2016, options to purchase 1,869,817 shares of common stock subject to early exercise vested and options to purchase 27,600 shares of common stock subject to early exercise were forfeited and repurchased by the Company in connection with the resignation of a Board member. As of December 31, 2016, the Company recorded a liability of $4.1 million related to 1,522,826 shares that remained subject to a potential repurchase obligation of the Company. These shares are expected to vest within the next twelve months. Accordingly, the liability is included in accrued expenses and other current liabilities.
In connection with certain of these early exercises, the Company extended loans to certain key management personnel (the “Debtors”) totaling $10.4 million (the “2016 Notes”). The 2016 Notes served as financing for the Debtors’ exercises of
F-28
Table of Contents
e.l.f. Beauty, Inc. and subsidiaries
Notes to consolidated financial statements
previously issued stock options. The 2016 Notes were secured by the underlying shares and were full recourse to the respective Debtor’s personal assets. The 2016 Notes carried interest at between 0.75% and 0.81% per annum, due semi-annually, and matured in January 2018 or earlier upon the occurrence of certain events specified in the 2016 Note agreements. Amounts due from employees in relation to the 2016 Notes were recorded as a reduction in stockholders’ equity. Upon early exercise, the option holders received shares of restricted common stock and as such, participated in the June 2016 special dividend. Pursuant to the terms of the 2016 Notes, the proceeds from the dividend of $4.1 million were required to be used to pay down the outstanding principal balance.
In July 2016, the Company provided an additional loan totaling $1.5 million (the “July 2016 Add-On Note”) to one of the Debtors to finance the exercise of an additional option to purchase 808,028 shares of common stock at an exercise price of $1.84 per share. The July 2016 Add-On Note carried interest at 0.71% per annum, due semi-annually, and matured in July 2018 or earlier upon the occurrence of certain events specified in the Note agreement. All other terms and conditions of the July 2016 Add-On Note were identical to the 2016 Notes. Amounts due from this employee in relation to the July 2016 Add-On Notes were recorded as a reduction in stockholders’ equity. Upon early exercise, the option holder received shares of restricted common stock.
In August 2016, the Debtors repaid the remaining balance on both the 2016 Notes and the July 2016 Add-On Note of $7.9 million, including accrued interest, in full.
Stock option modification
In June 2016, the Company modified all stock options outstanding and reduced the exercise price by $1.79 per share in order to protect the option holders from dilution that would have otherwise resulted from the dividend recapitalization transaction. A total of 43 individuals, including three board members, held options that were modified. As the Company was not obligated to provide anti-dilution protection under the 2014 Plan, this constituted a modification, as defined by ASC 718 Compensation-stock compensation, which requires calculation of the incremental fair value of the new award. The incremental compensation related to the modification was approximately $2.7 million and is being recognized over the original requisite service period for each modified option. During the period in which the modification occurred, the Company recognized incremental compensation cost of $0.7 million related to the portion of the modified awards for which the requisite service had already been rendered.
Initial public offering grants
Effective immediately prior to the effectiveness of the Company’s registration statement on Form S-1, the Company granted 596,217 restricted stock units (“RSUs”) and, upon pricing of the initial public offering, the Company granted options to purchase 1,250,517 shares of the Company’s common stock to certain officers, employees and directors under the 2016 Plan. Each option has an exercise price per share equal to the initial public offering price.
Service-based stock options
A summary of the Company’s service-based stock option activity and related information is as follows:
| Options outstanding |
Weighted-average exercise price(1) |
Weighted-average remaining contractual life (in years) |
Aggregate (in thousands) |
|||||||||||||
| Balance as of December 31, 2015 |
3,997,502 | $ | 3.66 | |||||||||||||
| Granted |
1,872,897 | 13.58 | ||||||||||||||
| Exercised |
(2,447,443 | ) | 3.55 | |||||||||||||
| Forfeited |
(212,589 | ) | 4.40 | |||||||||||||
| Cancelled |
(41,400 | ) | 3.62 | |||||||||||||
|
|
|
|||||||||||||||
| Balance as of December 31, 2016 |
3,168,967 | $ | 8.55 | 8.7 | $ | 64,602 | ||||||||||
|
|
|
|||||||||||||||
| Exercisable, December 31, 2016 |
1,189,880 | $ | 1.86 | 7.3 | $ | 32,223 | ||||||||||
|
|
||||||||||||||||
| (1) | The weighted-average exercise prices reflect the impact of the $1.79 exercise price modification for any activity occurring after the June 7, 2016 modification date. |
F-29
Table of Contents
e.l.f. Beauty, Inc. and subsidiaries
Notes to consolidated financial statements
Additional information relating to service-based options is as follows (in thousands, except per share data):
| Predecessor | Successor | |||||||||||||||||||||||
| Period from January 1, 2014 through |
Period from February 1, 2014 through |
Year ended December 31, |
||||||||||||||||||||||
| January 31, 2014 | December 31, 2014 | 2015 | 2016 | |||||||||||||||||||||
| Stock-based compensation expense |
$ | — | $ | 287 | $ | 503 | $ | 4,286 | ||||||||||||||||
| Intrinsic value of options exercised |
— | — | 12 | 2,486 | ||||||||||||||||||||
| Weighted-average grant date fair value of options granted (per share)(1) |
$ | — | $ | 0.60 | $ | 0.99 | $ | 5.07 | ||||||||||||||||
|
|
||||||||||||||||||||||||
| (1) | Based on the grant date fair value at the date of grant, excluding the impact of any subsequent modifications. The weighted-average incremental fair value related to 640,600 service-based options modified in June 2016 was $3.63. |
As of December 31, 2016, there was $9.4 million of total unrecognized compensation cost related to service-based stock options, which is expected to be recognized over the remaining weighted-average vesting period of 3.8 years.
During the period prior to the initial public offering, the Company estimated the grant date fair value of stock options granted by first computing the fair value using a Black-Scholes option-pricing model under three potential liquidity scenarios and then applying a probability weighting of each scenario. For the Predecessor 2014 Period, the Successor 2014 Period and the years ended December 31, 2015 and 2016, the fair value of service-based stock options granted were calculated using the following weighted-average assumptions:
| Predecessor | Successor | |||||||||||||||||||||||
| Period from January 1, 2014 through |
Period from February 1, 2014 through |
Year ended December 31, |
||||||||||||||||||||||
| January 31, 2014 | December 31, 2014 | 2015 | 2016 | |||||||||||||||||||||
| Expected term (in years) |
n/a | 4.7 | 4.1 | 5.9 | ||||||||||||||||||||
| Expected volatility |
n/a | 45.00% | 40.92% | 36.50% | ||||||||||||||||||||
| Risk-free interest rate |
n/a | 1.34% | 1.51% | 1.34% | ||||||||||||||||||||
| Expected dividend yield |
n/a | 0.00% | 0.00% | 0.00% | ||||||||||||||||||||
|
|
||||||||||||||||||||||||
The determination of the fair value of stock options on the date of grant using a Black-Scholes option-pricing model is affected by the estimated fair value of the underlying common stock, as well as assumptions regarding a number of variables that are complex, subjective and generally require significant judgment. The assumptions used in the Black-Scholes option-pricing model to calculate the fair value of stock options were:
Fair value of common stock
The fair value of shares of common stock underlying stock options has historically been the responsibility of, and determined by, the Company’s board of directors, with input from management. Prior to the initial public offering, there was no public market for the Company’s common stock and the board of directors determined the fair value of common stock at the time of grant of the option by considering a number of objective and subjective factors including independent third-party valuations of the Company’s common stock, operating and financial performance, the lack of liquidity of capital stock and general and industry specific economic outlook, among other factors. After the initial public offering, the fair value of shares of common stock underlying stock options is based on the closing stock price on the date of grant.
F-30
Table of Contents
e.l.f. Beauty, Inc. and subsidiaries
Notes to consolidated financial statements
Expected term
The expected term of the options represents the period of time that the options are expected to be outstanding. Options granted have a maximum contractual life of 10 years. Prior to the initial public offering, the Company estimated the expected term of the option based on the estimated timing of potential liquidity events. For grants upon or after the initial public offering, the Company estimated the expected term based upon the simplified method described in Staff Accounting Bulletin No. 107, as the Company does not have sufficient historical exercise data to provide a reasonable basis upon which to estimate expected term due to the limited period of time its equity shares have been publicly traded.
Expected volatility
As the Company does not have sufficient trading history for its common stock, the expected stock price volatility for the common stock was estimated by taking the average historic price volatility for industry peers based on daily price observations over a period equivalent to the expected term of the stock option grants. Industry peers consist of several public companies within the same industry, which are of similar size, complexity and stage of development. The Company intends to continue to consistently apply this process using the same or similar public companies until a sufficient amount of historical information regarding the volatility of its own share price becomes available, or unless circumstances change such that the identified companies are no longer similar to the Company, in which case, more suitable companies whose share prices are publicly available would be used in the calculation.
Risk-free interest rate
The risk-free interest rate was based on the U.S. Treasury rate, with maturities similar to the expected term of the options.
Expected dividend yield
The Company does not anticipate paying any dividends in the foreseeable future. As such, the Company uses an expected dividend yield of zero.
Performance-based stock options
For the Company’s performance-based options, in addition to the service condition, the ultimate number of shares to be earned depends on the achievement of both a performance and market condition. The performance condition is based on the occurrence of a liquidity event and was satisfied in connection with the initial public offering in September 2016. The market condition is based upon the achievement of a minimum rate of return from the liquidity event, which will first be measured in March 2017, and holders of performance-based options must remain employed as of the measurement date.
A summary of the Company’s performance-based stock option activity and related information is as follows:
| Options outstanding |
Weighted-average exercise price(1) |
Weighted-average contractual life (in years) |
Aggregate (in thousands) |
|||||||||||||
| Balance as of December 31, 2015 |
4,848,869 | $ | 3.64 | |||||||||||||
| Granted |
276,690 | 6.69 | ||||||||||||||
| Exercised |
— | — | ||||||||||||||
| Forfeited |
(1,265,992 | ) | 3.57 | |||||||||||||
| Cancelled |
(23,460 | ) | 3.62 | |||||||||||||
|
|
|
|||||||||||||||
| Balance as of December 31, 2016 |
3,836,107 | $ | 2.46 | 7.8 | $ | 101,592 | ||||||||||
|
|
|
|
|
|
|
|
||||||||||
| (1) | The weighted-average exercise prices reflect the impact of the $1.79 exercise price modification for any activity occurring after the June 7, 2016 modification date. |
F-31
Table of Contents
e.l.f. Beauty, Inc. and subsidiaries
Notes to consolidated financial statements
In regards to the performance condition, if a liquidity event occurred on or prior to January 31, 2016, an additional number of options would have vested, assuming the minimum rate of return was achieved. During the year ended December 31, 2016, performance-based options to purchase a total of 919,611 shares of common stock did not vest and were forfeited because a liquidity event did not occur on or prior to January 31, 2016. The remaining forfeitures occurred in connection with the termination of employment of certain employees.
Additional information relating to performance-based options is as follows (in thousands, except per share data):
| Predecessor | Successor | |||||||||||||||||||||||
| Period from January 1, 2014 through |
Period from February 1, 2014 through |
Year ended December 31, |
||||||||||||||||||||||
| January 31, 2014 | December 31, 2014 | 2015 | 2016 | |||||||||||||||||||||
| Stock-based compensation expense |
$ | — | $ | — | $ | — | $ | 1,813 | ||||||||||||||||
| Intrinsic value of options exercised |
$ | — | — | — | — | |||||||||||||||||||
| Weighted-average grant date fair value of options granted (per share)(1) |
$ | — | $ | 0.40 | $ | 0.50 | $ | 1.52 | ||||||||||||||||
|
|
||||||||||||||||||||||||
| (1) | Based on the grant date fair value at the date of grant, excluding the impact of any subsequent modifications. The weighted-average incremental fair value related to 1,109,163 performance-based options modified in June 2016 was $0.31. |
Because the achievement of the performance condition was not deemed probable until a liquidity event occurred, no compensation expense was recognized during the Successor 2014 Period or the year ended December 31, 2015 related to performance-based options. As of December 31, 2016, there was $0.3 million of total unrecognized compensation cost related to performance-based options, which is expected to be recognized over the remaining weighted-average vesting period of 0.2 years. The remaining expense reflects the derived service period associated with the requirement to remain employed as of the date that the market condition is satisfied.
The fair values were determined using a Monte Carlo simulation model, based on rate of return from a potential liquidity event that ranges from 3.0x to 6.5x. The model assumed three potential liquidity scenarios and applied a probability weighting to each scenario. The rate of return is defined as the aggregate amount of distribution, dividends and sales proceeds received by equity holders, in a liquidity event, divided by the aggregate amount of original capital contribution made by these equity holders as of January 31, 2014.
Restricted stock units
A summary of the Company’s restricted stock unit activity and related information is as follows:
| Restricted stock units outstanding |
Weighted-average grant date fair value |
|||||||
| Balance as of December 31, 2015 |
— | $ | — | |||||
| Granted |
596,217 | 17.00 | ||||||
| Vested |
— | — | ||||||
| Forfeited |
(9,993 | ) | 17.00 | |||||
| Cancelled |
— | — | ||||||
|
|
|
|||||||
| Balance as of December 31, 2016 |
586,224 | $ | 17.00 | |||||
|
|
||||||||
The fair value for restricted stock units is calculated based on the stock price on the date of grant. The weighted-average grant date fair value of restricted stock units granted during the year ended December 31, 2016 was $17.00. The Company recognized $0.7 million in stock-based compensation expense associated with restricted stock units in the year ended December 31, 2016. As of December 31, 2016, there was $9.3 million of total unrecognized compensation cost related to restricted stock units, which is expected to be recognized over the remaining weighted-average vesting period of 3.7 years.
F-32
Table of Contents
e.l.f. Beauty, Inc. and subsidiaries
Notes to consolidated financial statements
Phantom shares
On November 14, 2014, the Company adopted the J.A. Cosmetics Holdings, Inc. 2014 Phantom Equity Plan (the “Phantom Plan”). The Phantom Plan authorizes the grant of up to 220,800 units of phantom equity to employees, directors and consultants of the Company and any of its subsidiaries. The phantom shares each represent a contractual right to payment of compensation in the future based on the amounts distributable to a holder of the Company’s common stock in connection with a sale of the Company (defined below), less the exercise price. The phantom shares do not represent shares of the Company’s common stock, and a recipient of phantom shares does not receive an ownership interest in the Company, stockholder voting rights or other incidents of ownership to the Company’s common stock.
The phantom shares vest immediately on sale of the majority of the Company’s outstanding common stock or substantially all of the Company’s assets (“sale of the Company”), and the phantom stockholder remains continuously employed by the Company from the date of grant through the date of a sale of the Company. Upon a sale of the Company, holders of a vested phantom share will receive a one-time cash payment in an amount equal to the difference between the fair market value of the amounts to be received by a holder of a share of the Company’s common stock in connection with the sale of the Company and the fair market value of a share of the Company’s common stock on the grant date, as set forth in the phantom shares award agreement. During the Successor 2014 Period and the year ended December 31, 2015, the Company granted 131,100 and 62,100 phantom shares, respectively. No phantom shares were granted during the year ended December 31, 2016. As a cash payment is triggered only upon a sale of the Company, no compensation expense has been recognized related to these phantom shares. As of December 31, 2016, there was $4.5 million of unrecognized stock-based compensation related to the phantom shares; that cost is expected to be recognized upon sale of the Company, if any.
Note 14—Employee benefit plan
The Company maintains a defined contribution 401(k) profit-sharing plan (the “401(k) Plan”) for eligible employees. Participants may make voluntary contributions up to the maximum amount allowable by law. The Company may make contributions to the 401(k) Plan on a discretionary basis which vest to the participants 100%. The Company elected not to make any contributions to the 401(k) Plan during the Predecessor 2014 Period or the Successor 2014 Period. The Company made $18,000 and $0.1 million of matching contributions to the 401(k) Plan during the years ended December 31, 2015 and 2016, respectively.
Note 15—Related-party transactions
The Company previously rented office space in Shanghai, China from a lessor who was also an employee of the Company. During the Predecessor 2014 Period and the Successor 2014 Period, the Company incurred $36,000 and $0.4 million in rent expense to this lessor, which was included in selling, general and administrative expenses. In 2015, the employee ceased employment with the Company, and the lease was terminated.
Cosmopack and Promotions Plus, each a related party entity owned by a relative of a former executive officer, managed the Company’s distribution and fulfillment operations for the New Jersey warehouse and charged the Company for these services. During the Predecessor 2014 Period and the Successor 2014 Period, the Company incurred $0.4 million and $3.7 million, respectively, for these services, which was included in selling, general and administrative expenses in the consolidated statement of operations. The former executive officer was an employee until December 31, 2014.
During the Successor 2014 Period and the years ended December 31, 2015 and 2016, the Company incurred $0.8 million, $0.9 million and $0.9 million, respectively, in management and consulting fees to its majority stockholder, TPG. Amounts owed are included in due to related parties in the consolidated balance sheet. Subsequent to the initial public offering, the Company ceased paying management and consulting fees to TPG and there are no amounts due to TPG as of December 31, 2016.
As disclosed in Note 13, during the year ended December 31, 2016, the Company extended loans to certain key management personnel totaling $12.0 million, which were repaid in full as of December 31, 2016.
As disclosed in Note 10, in November 2016, the Company vacated a previously leased office facility and has entered into a sublease agreement with a related party for that space. The estimated future sublease income as of December 31, 2016 is
F-33
Table of Contents
e.l.f. Beauty, Inc. and subsidiaries
Notes to consolidated financial statements
$0.9 million and has been recorded as a reduction to the accrual of all remaining lease operating lease payments recognized on the date the previous facility was vacated.
Note 16—Net income (loss) per share
The following is a reconciliation of the numerator and denominator in the basic and diluted net income (loss) per common share computations (in thousands, except share data):
| Predecessor | Successor | |||||||||||||||||||||||
| Period from January 1, 2014 through |
Period from February 1, 2014 through |
Year ended December 31, |
||||||||||||||||||||||
| January 31, 2014 | December 31, 2014 | 2015 | 2016 | |||||||||||||||||||||
| Numerator: |
||||||||||||||||||||||||
| Net income (loss) |
$ | 1,093 | $ | (9,286 | ) | $ | 4,357 | $ | 5,313 | |||||||||||||||
| Adjustments to numerator: |
||||||||||||||||||||||||
| Dividend paid to preferred stockholders |
— | — | — | $ | (66,531 | ) | ||||||||||||||||||
| Accretion of convertible preferred stock to maximum redemption value |
— | (10,287 | ) | (51,967 | ) | $ | (436,317 | ) | ||||||||||||||||
|
|
|
|
|
|||||||||||||||||||||
| Net loss attributable to common stockholders |
1,093 | (19,573 | ) | (47,610 | ) | $ | (497,535 | ) | ||||||||||||||||
| Denominator: |
||||||||||||||||||||||||
| Weighted average common shares outstanding—basic |
1,000 | 27,593 | 30,523 | 12,606,529 | ||||||||||||||||||||
| Weighted average common shares outstanding—diluted |
1,005 | 27,593 | 30,523 | 12,606,529 | ||||||||||||||||||||
| Net income (loss) per share: |
||||||||||||||||||||||||
| Basic |
$ | 1,093.00 | $ | (709.35 | ) | $ | (1,559.81 | ) | $ | (39.47 | ) | |||||||||||||
| Diluted |
$ | 1,087.56 | $ | (709.35 | ) | $ | (1,559.81 | ) | $ | (39.47 | ) | |||||||||||||
| Anti-dilutive securities excluded from diluted EPS: |
||||||||||||||||||||||||
| Service-based stock options |
— | 3,019,451 | 3,997,503 | 3,168,967 | ||||||||||||||||||||
| Common shares underlying convertible preferred stock |
— | 37,271,375 | 37,271,375 | — | ||||||||||||||||||||
| Performance-based stock options |
— | 3,557,057 | 4,848,869 | 3,836,107 | ||||||||||||||||||||
| Restricted stock units |
— | — | — | 586,224 | ||||||||||||||||||||
|
|
|
|
|
|||||||||||||||||||||
| Total |
— | 43,847,883 | 46,117,747 | 7,591,298 | ||||||||||||||||||||
|
|
||||||||||||||||||||||||
F-34
Table of Contents
e.l.f. Beauty, Inc. and subsidiaries
Notes to consolidated financial statements
Note 17—Quarterly financial summary (unaudited)
Unaudited quarterly results for the last two years were as follows (in thousands, except per share data):
| Q1 | Q2 | Q3 | Q4 | |||||||||||||
| 2016 |
||||||||||||||||
| Net sales |
52,673 | 44,147 | 56,312 | 76,436 | ||||||||||||
| Gross profit |
29,300 | 25,137 | 32,478 | 45,320 | ||||||||||||
| Net income (loss) |
3,804 | (2,715 | ) | (2,377 | ) | 6,601 | ||||||||||
| Net income (loss) attributable to common stockholders |
(34,143 | ) | (96,389 | ) | (373,605 | ) | 6,378 | |||||||||
| Net income (loss) per share: |
||||||||||||||||
| Basic |
$ | (69.57 | ) | $ | (117.31 | ) | $ | (73.13 | ) | $ | 0.15 | |||||
| Diluted |
$ | (69.57 | ) | $ | (117.31 | ) | $ | (73.13 | ) | $ | 0.13 | |||||
| 2015 |
||||||||||||||||
| Net sales |
38,941 | 36,253 | 50,783 | 65,436 | ||||||||||||
| Gross profit |
20,190 | 19,108 | 26,002 | 35,029 | ||||||||||||
| Net income (loss) |
1,315 | 1,363 | (748 | ) | 2,427 | |||||||||||
| Net loss attributable to common stockholders |
(1,580 | ) | (1,623 | ) | (4,701 | ) | (39,706 | ) | ||||||||
| Net loss per share: |
||||||||||||||||
| Basic |
$ | (57.26 | ) | $ | (58.82 | ) | $ | (154.42 | ) | $ | (1,151.13 | ) | ||||
| Diluted |
$ | (57.26 | ) | $ | (58.82 | ) | $ | (154.42 | ) | $ | (1,151.13 | ) | ||||
|
|
||||||||||||||||
F-35
Table of Contents

Table of Contents

Table of Contents
Part II
Information not required in prospectus
Item 13. Other expenses of issuance and distribution.
The following table sets forth the expenses payable by the Registrant expected to be incurred in connection with the issuance and distribution of the shares of common stock being registered hereby (other than underwriting discounts and commissions). All of such expenses are estimates, other than the filing and listing fees payable to the SEC and the Financial Industry Regulatory Authority, Inc. (“FINRA”).
| Item | Amount to be paid |
|||
| SEC registration fee |
$ | 24,165 | ||
| FINRA filing fee |
31,775 | |||
| Printing and engraving expenses |
100,000 | |||
| Legal fees and expenses |
250,000 | |||
| Accounting fees and expenses |
110,000 | |||
| Transfer agent fees and expenses |
6,700 | |||
| Miscellaneous expenses |
7,360 | |||
|
|
|
|||
| Total |
$ | 530,000 | ||
|
|
||||
Item 14. Indemnification of directors and officers.
Section 102(b)(7) of the DGCL allows a corporation to provide in its certificate of incorporation that a director of the corporation will not be personally liable to the corporation or its stockholders for monetary damages for breach of fiduciary duty as a director, except where the director breached the duty of loyalty, failed to act in good faith, engaged in intentional misconduct or knowingly violated a law, authorized the payment of a dividend or approved a stock repurchase in violation of Delaware corporate law or obtained an improper personal benefit. Our amended and restated certificate of incorporation provides for this limitation of liability.
Section 145 of the DGCL (“Section 145”), provides, among other things, that a Delaware corporation may indemnify any person who was, is or is threatened to be made, party to any threatened, pending or completed action, suit or proceeding, whether civil, criminal, administrative or investigative (other than an action by or in the right of such corporation), by reason of the fact that such person is or was an officer, director, employee or agent of such corporation or is or was serving at the request of such corporation as a director, officer, employee or agent of another corporation or enterprise. The indemnity may include expenses (including attorneys’ fees), judgments, fines and amounts paid in settlement actually and reasonably incurred by such person in connection with such action, suit or proceeding, provided such person acted in good faith and in a manner he or she reasonably believed to be in or not opposed to the corporation’s best interests and, with respect to any criminal action or proceeding, had no reasonable cause to believe that his or her conduct was illegal. A Delaware corporation may indemnify any persons who were or are a party to any threatened, pending or completed action or suit by or in the right of the corporation by reason of the fact that such person is or was a director, officer, employee or agent of another corporation or enterprise. The indemnity may include expenses (including attorneys’ fees) actually and reasonably incurred by such person in connection with the defense or settlement of such action or suit, provided such person acted in good faith and in a manner he or she reasonably believed to be in or not opposed to the corporation’s best interests, provided further that no indemnification is permitted without judicial approval if the officer, director, employee or agent is adjudged to be liable to the corporation. Where an officer or director is successful on the merits or otherwise in the defense of any action referred to above, the corporation must indemnify him against the expenses which such officer or director has actually and reasonably incurred.
Section 145 further authorizes a corporation to purchase and maintain insurance on behalf of any person who is or was a director, officer, employee or agent of the corporation or is or was serving at the request of the corporation as a director, officer, employee or agent of another corporation or enterprise, against any liability asserted against him or her and incurred by him or her in any such capacity, or arising out of his or her status as such, whether or not the corporation would otherwise have the power to indemnify him or her under Section 145.
II-1
Table of Contents
Our amended and restated certificate of incorporation includes a provision that, to the fullest extent permitted by the DGCL, eliminates the personal liability of directors to us or our stockholders for monetary damages for any breach of fiduciary duty as a director. The effect of these provisions is to eliminate the rights of us and our stockholders, through stockholders’ derivative suits on our behalf, to recover monetary damages from a director for breach of fiduciary duty as a director, including breaches resulting from grossly negligent behavior. However, exculpation will not apply to any director if the director has acted in bad faith, knowingly or intentionally violated the law, authorized illegal dividends or redemptions or derived an improper benefit from his or her actions as a director. Further, our amended and restated certificate of incorporation and our amended and restated bylaws provide that we must indemnify and advance expenses to our directors and officers to the fullest extent authorized by the DGCL. We are also expressly authorized to carry directors’ and officers’ liability insurance providing indemnification for our directors, officers and certain employees for some liabilities.
Section 174 of the DGCL provides, among other things, that a director, who willfully or negligently approves of an unlawful payment of dividends or an unlawful stock purchase or redemption, may be held jointly and severally liable for such actions. A director who was either absent when the unlawful actions were approved or dissented at the time may avoid liability by causing his or her dissent to such actions to be entered in the books containing the minutes of the meetings of the board of directors at the time such action occurred or immediately after such absent director receives notice of the unlawful acts.
The indemnification rights set forth above shall not be exclusive of any other right which an indemnified person may have or hereafter acquire under any statute, provision of our amended and restated certificate of incorporation, our amended and restated bylaws, agreement, vote of stockholders or disinterested directors or otherwise.
We maintain standard policies of insurance that provide coverage (i) to our directors and officers against loss rising from claims made by reason of breach of duty or other wrongful act and (ii) to us with respect to indemnification payments that we may make to such directors and officers.
The proposed form of Underwriting Agreement to be filed as Exhibit 1.1 to this Registration Statement provides for indemnification to us, our directors and officers and the selling stockholders by the underwriters, and to the underwriters by us and the selling stockholders, against certain liabilities.
Item 15. Recent sales of unregistered securities.
The following list sets forth information as to all securities the Company has sold since January 1, 2014, which were not registered under the Securities Act:
| 1. | In connection with the Company’s acquisition of 100% of the outstanding shares of capital stock of e.l.f. Cosmetics, Inc. on January 31, 2014, the Company issued 135,041 shares of preferred stock at a price per share of $1,000.00 and 27,593 shares of common stock at a price per share of $3.62 in exchange for cash consideration of $125.1 million and shares of Class A common stock of e.l.f. Cosmetics, Inc. from certain then-existing stockholders of e.l.f. Cosmetics, Inc. |
| 2. | The Company granted stock options and stock awards to employees, directors and consultants under the Company’s 2014 Equity Incentive Plan and the Company’s 2016 Equity Incentive Award Plan, covering an aggregate of 11,734,535 shares of common stock, at a weighted-average exercise price of $4.28 per share (as adjusted for the special dividend declared on June 7, 2016). Of these, options covering an aggregate of 2,341,152 shares were cancelled without being exercised. |
| 3. | The Company granted stock awards to employees and directors under the Company’s 2016 Equity Incentive Award Plan, covering an aggregate of 596,217 shares of common stock. Of these, stock awards covering an aggregate of 52,877 were cancelled prior to vesting. |
| 4. | The Company issued a total of 4,082,369 shares of common stock at a weighted-average price per share of $3.19 for total cash proceeds of $13.0 million upon the exercise of stock options. |
The issuances of the securities described in paragraph (1) were exempt from the registration requirements of the Securities Act as transactions by an issuer not involving a public offering in reliance on Section 4(a)(2) of the Securities Act.
The sales and issuances of securities in the transactions described in paragraphs (2) and (3) above were exempt from the registration requirements of the Securities Act as transactions by an issuer not involving a public offering in reliance on Section 4(a)(2) of the Securities Act and under Rule 701 promulgated under the Securities Act, in that they were offered and sold either pursuant to written compensatory plans or written contracts relating to compensation, as provided by Rule 701.
II-2
Table of Contents
No sales involved underwriters, underwriting discounts or commissions or public offerings of securities of the Company.
Item 16. Exhibits and financial statement schedules.
(a) Exhibits
See the Exhibit Index attached to this registration statement, which is incorporated by reference herein.
(b) Financial statement schedule
All schedules are omitted because the required information is either not present, not present in material amounts or presented within our audited consolidated financial statements included elsewhere in this prospectus and are incorporated herein by reference.
Item 17. Undertakings
Insofar as indemnification for liabilities arising under the Securities Act may be permitted to directors, officers and controlling persons of the registrant pursuant to the foregoing provisions, or otherwise, the registrant has been advised that in the opinion of the SEC such indemnification is against public policy as expressed in the Securities Act and is, therefore, unenforceable. In the event that a claim for indemnification against such liabilities (other than the payment by the registrant of expenses incurred or paid by a director, officer or controlling person of the registrant in the successful defense of any action, suit or proceeding) is asserted by such director, officer or controlling person in connection with the securities being registered, the registrant will, unless in the opinion of its counsel the matter has been settled by controlling precedent, submit to a court of appropriate jurisdiction the question of whether such indemnification by it is against public policy as expressed in the Securities Act and will be governed by the final adjudication of such issue.
The undersigned Registrant hereby undertakes that:
| (A) | For purposes of determining any liability under the Securities Act, the information omitted from the form of prospectus filed as part of this registration statement in reliance upon Rule 430A and contained in a form of prospectus filed by the registrant pursuant to Rule 424(b) (1) or (4) or 497(h) under the Securities Act shall be deemed to be part of this registration statement as of the time it was declared effective. |
| (B) | For the purpose of determining any liability under the Securities Act, each post-effective amendment that contains a form of prospectus shall be deemed to be a new registration statement relating to the securities offered therein, and the offering of such securities at that time shall be deemed to be the initial bona fide offering thereof. |
The undersigned Registrant hereby undertakes to provide to the underwriters at the closing specified in the underwriting agreement certificates in such denominations and registered in such names as required by the underwriters to permit prompt delivery to each purchaser.
II-3
Table of Contents
Signatures
Pursuant to the requirements of the Securities Act of 1933, as amended, the Registrant has duly caused this Amendment No. 1 to the Registration Statement or amendment thereto to be signed on its behalf by the undersigned, thereunto duly authorized, in Oakland, California, on the 24th day of March, 2017.
| e.l.f. Beauty, Inc. | ||
| By: |
/s/ Tarang P. Amin | |
| Name: Tarang P. Amin | ||
| Title: Chief Executive Officer | ||
Pursuant to the requirements of the Securities Act of 1933, as amended, this Amendment No. 1 to the Registration Statement or amendment thereto has been signed by the following persons in the capacities indicated on the 24th day of March, 2017.
| Signature |
Title | |
| /s/ Tarang P. Amin Tarang P. Amin |
Chief Executive Officer, Chairman and Director (Principal Executive Officer) | |
| /s/ John P. Bailey John P. Bailey |
President and Chief Financial Officer (Principal Financial and Accounting Officer) | |
| * Lauren Cooks Levitan |
Director | |
| * William E. McGlashan, Jr. |
Director | |
| * Kirk L. Perry |
Director | |
| * Sabrina L. Simmons |
Director | |
| * Maureen C. Watson |
Director | |
| * Richard G. Wolford |
Director | |
| * By: | /s/ Tarang P. Amin | |
| Tarang P. Amin Attorney-in-Fact |
Table of Contents
Exhibit index
| Incorporated by Reference | ||||||||||||||||||||||
| Exhibit Number |
Exhibit Description |
Provided Herewith |
Form | Exhibit Number |
File Number | Filing Date | ||||||||||||||||
| 1.1 | Form of Underwriting Agreement. | X | ||||||||||||||||||||
| 3.1 | Amended and Restated Certificate of Incorporation of e.l.f. Beauty, Inc. | 8-K | 3.1 | 001-37873 | 9/27/2016 | |||||||||||||||||
| 3.2 | Amended and Restated Bylaws of e.l.f. Beauty, Inc. | 8-K | 3.2 | 001-37873 | 9/27/2016 | |||||||||||||||||
| 4.1 | Reference is made to exhibits 3.1 and 3.2. | |||||||||||||||||||||
| 4.2 | Registration Rights Agreement, dated January 31, 2014, by and among e.l.f. Beauty, Inc. and certain stockholders party thereto. | S-1 | 4.2 | 333-213333 | 8/26/2016 | |||||||||||||||||
| 4.3 | Second Amended and Restated Stockholders Agreement, dated as of March 3, 2017, by and among e.l.f. Beauty, Inc., TPG elf Holdings, L.P. and certain equityholders party thereto. | 8-K | 10.1 | 001-37873 | 3/3/2017 | |||||||||||||||||
| 4.4 | Form of Common Stock Certificate. | S-1/A | 4.4 | 333-213333 | 9/12/2016 | |||||||||||||||||
| 5.1 | Opinion of Latham & Watkins LLP. | X | ||||||||||||||||||||
| 10.1 | Standard Multi-Tenant Office Lease, dated as of March 31, 2014, by and between 1007 Clay Street Properties LLC and e.l.f. Cosmetics, Inc. (formerly known as J.A. Cosmetics US, Inc.). | S-1 | 10.1 | 333-213333 | 8/26/2016 | |||||||||||||||||
| 10.2 | Addendum to Standard Multi-Tenant Office Lease, dated as of March 31, 2014, by and between 1007 Clay Street Properties LLC and e.l.f. Cosmetics, Inc. (formerly known as J.A. Cosmetics US, Inc.). | S-1 | 10.2 | 333-213333 | 8/26/2016 | |||||||||||||||||
| 10.3 | Standard Multi-Tenant Office Lease, dated as of October 5, 2015, by and between 1007 Clay Street Properties LLC and e.l.f. Cosmetics, Inc. (formerly known as J.A. Cosmetics US, Inc.). | S-1 | 10.3 | 333-213333 | 8/26/2016 | |||||||||||||||||
| 10.4 | Addendum to Standard Multi-Tenant Office Lease, dated as of October 22, 2015, by and between 1007 Clay Street Properties LLC and e.l.f. Cosmetics, Inc. (formerly known as J.A. Cosmetics US, Inc.). | S-1 | 10.4 | 333-213333 | 8/26/2016 | |||||||||||||||||
| 10.5 | Standard Industrial/Commercial Multi-Tenant Lease, dated as of December 9, 2015, by and between Jurupa Gateway LLC and e.l.f. Cosmetics, Inc. (formerly known as J.A. Cosmetics US, Inc.). | S-1 | 10.5 | 333-213333 | 8/26/2016 | |||||||||||||||||
| 10.6 | Senior Secured Credit Agreement, dated as of December 23, 2016, by and among e.l.f. Beauty, Inc., as parent guarantor, e.l.f. Cosmetics, Inc., JA 139 Fulton Street Corp., JA 741 Retail Corp., JA Cosmetics Retail, Inc., J.A. RF, LLC and J.A. Cherry Hill, LLC, each as a borrower, and Bank of Montreal, as the administrative agent, swingline lender and l/c issuer. | 8-K | 10.1 | 001-37873 | 12/28/2016 | |||||||||||||||||
Table of Contents
| Incorporated by Reference | ||||||||||||||
| Exhibit Number |
Exhibit Description |
Provided Herewith |
Form | Exhibit Number |
File Number | Filing Date | ||||||||
| 10.7(a)# | 2014 Equity Incentive Plan of e.l.f. Beauty, Inc. | S-1 | 10.12 | 333-213333 | 8/26/2016 | |||||||||
| 10.7(b)# | Amendment to 2014 Equity Incentive Plan of e.l.f. Beauty, Inc., dated as of March 15, 2017. | 10-K | 10.7(b) | 001-37873 | 3/15/2017 | |||||||||
| 10.8# | Forms of stock option award agreements used under the 2014 Equity Incentive Plan of e.l.f. Beauty, Inc. | S-1 | 10.13 | 333-213333 | 8/26/2016 | |||||||||
| 10.9# | 2014 Phantom Equity Plan of e.l.f. Beauty, Inc. | S-1 | 10.14 | 333-213333 | 8/26/2016 | |||||||||
| 10.10# | Amendment to 2014 Phantom Equity Plan of e.l.f. Beauty, Inc., dated as of September 5, 2016. | S-1 | 10.28 | 333-213333 | 9/12/2016 | |||||||||
| 10.11# | Form of phantom shares award agreement used under the 2014 Phantom Equity Plan of e.l.f. Beauty, Inc. | S-1 | 10.15 | 333-213333 | 8/26/2016 | |||||||||
| 10.12(a)# | 2016 Equity Incentive Award Plan of e.l.f. Beauty, Inc. | S-1 | 10.16 | 333-213333 | 9/12/2016 | |||||||||
| 10.12(b)# | Form of Stock Option Grant Notice under the 2016 Equity Incentive Award Plan of e.l.f. Beauty, Inc. | S-1/A | 10.17 | 333-213333 | 9/12/2016 | |||||||||
| 10.12(c)# | Form of Restricted Stock Unit Award Grant Notice under the 2016 Equity Incentive Award Plan of e.l.f. Beauty, Inc. | S-1/A | 10.27 | 333-213333 | 9/12/2016 | |||||||||
| 10.12(d)# | Form of Restricted Stock Award Grant Notice under the 2016 Equity Incentive Award Plan of e.l.f. Beauty, Inc. (Executives). | 10-K | 10.12(d) | 001-37873 | 3/15/2017 | |||||||||
| 10.12(e)# | Form of Restricted Stock Award Grant Notice under the 2016 Equity Incentive Award Plan of e.l.f. Beauty, Inc. (Chief Executive Officer). | 10-K | 10.12(e) | 001-37873 | 3/15/2017 | |||||||||
| 10.13# | 2016 Employee Stock Purchase Plan of e.l.f. Beauty, Inc. | S-1/A | 10.18 | 333-213333 | 9/12/2016 | |||||||||
| 10.14# | Employment Agreement, dated as of January 31, 2014, by and among Tarang Amin, e.l.f. Cosmetics, Inc. (formerly known as J.A. Cosmetics US, Inc.) and e.l.f. Beauty, Inc. | S-1 | 10.19 | 333-213333 | 8/26/2016 | |||||||||
| 10.15# | Employment Agreement, dated as of August 13, 2015, by and among John Bailey, e.l.f. Cosmetics, Inc. (formerly known as J.A. Cosmetics US, Inc.) and e.l.f. Beauty, Inc. | S-1 | 10.20 | 333-213333 | 8/26/2016 | |||||||||
| 10.16# | Employment Agreement, dated as of January 31, 2014, by and among Scott Milsten, e.l.f. Cosmetics, Inc. (formerly known as J.A. Cosmetics US, Inc.) and e.l.f. Beauty, Inc. | S-1 | 10.21 | 333-213333 | 8/26/2016 | |||||||||
| 10.17# | Employment Agreement, dated as of February 2, 2014, by and among Richard Baruch, Jr., e.l.f. Cosmetics, Inc. (formerly known as J.A. Cosmetics US, Inc.) and e.l.f. Beauty, Inc. | S-1 | 10.22 | 333-213333 | 8/26/2016 | |||||||||
Table of Contents
| Incorporated by Reference | ||||||||||||||
| Exhibit Number |
Exhibit Description |
Provided Herewith |
Form | Exhibit Number |
File Number | Filing Date | ||||||||
| 10.18# | Amended and Restated Employment Agreement, dated as of September 7, 2016, by and among Erin Daley, e.l.f. Cosmetics, Inc. (formerly known as J.A. Cosmetics US, Inc.) and e.l.f. Beauty, Inc. | S-1 | 10.23 | 333-213333 | 8/26/2016 | |||||||||
| 10.19# | Second Amended and Restated Employment Agreement, dated as of December 5, 2016, by and among Erin Daley, e.l.f. Cosmetics, Inc. and e.l.f. Beauty, Inc. | 10-K | 10.19 | 001-37873 | 3/15/2017 | |||||||||
| 10.20# | Employment Agreement, dated as of July 8, 2016, by and between Jonathan T. Fieldman, e.l.f. Cosmetics, Inc. and e.l.f. Beauty, Inc. | S-1 | 10.24 | 333-213333 | 8/26/2016 | |||||||||
| 10.21# | Form of Indemnification Agreement for directors and officers of e.l.f. Beauty, Inc. | S-1 | 10.25 | 333-213333 | 8/26/2016 | |||||||||
| 10.22# | Non-Employee Director Compensation Program of e.l.f. Beauty, Inc. | S-1 | 10.26 | 333-213333 | 9/12/2016 | |||||||||
| 21.1 | List of Significant Subsidiaries of e.l.f. Beauty, Inc. | 10-K | 21.1 | 001-37873 | 3/15/2017 | |||||||||
| 23.1 | Consent of Independent Registered Public Accounting Firm. | X | ||||||||||||
| 23.2 | Consent of Latham & Watkins LLP (included in Exhibit 5.1). | X | ||||||||||||
| 23.3 | Consent of Metrix Lab. | S-1 | 23.3 | 333-216720 | 3/15/2017 | |||||||||
| 23.4 | Consent of Calimesa Consulting Partners, LLC. | S-1 | 23.4 | 333-216720 | 3/15/2017 | |||||||||
| 24.1 | Power of Attorney. Reference is made to the signature page of the original filing. | X | ||||||||||||
| 101.ins | XBRL Instance Document | S-1 | 101.ins | 333-216720 | 3/15/2017 | |||||||||
| 101.sch | XBRL Taxonomy Schema Linkbase Document | S-1 | 101.sch | 333-216720 | 3/15/2017 | |||||||||
| 101.cal | XBRL Taxonomy Calculation Linkbase Document | S-1 | 101.cal | 333-216720 | 3/15/2017 | |||||||||
| 101.def | XBRL Taxonomy Definition Linkbase Document | S-1 | 101.def | 333-216720 | 3/15/2017 | |||||||||
| 101.lab | XBRL Taxonomy Label Linkbase Document | S-1 | 101.lab | 333-216720 | 3/15/2017 | |||||||||
| 101.pre | XBRL Taxonomy Presentation Linkbase Document | S-1 | 101.pre | 333-216720 | 3/15/2017 | |||||||||
| # | Indicates management contract or compensatory plan. |