Attached files
| file | filename |
|---|---|
| 8-K - 8-K - Santander Holdings USA, Inc. | q416shusair.htm |

March 20, 2017
SANTANDER HOLDINGS USA, INC.
Fixed Income Investor Presentation
Fourth Quarter 2016
2 Disclaimer
This presentation of Santander Holdings USA, Inc. (“SHUSA”) contains “forward-looking statements” within the meaning of the Private Securities
Litigation Reform Act of 1995 regarding the financial condition, results of operations, business plans and future performance of SHUSA. Words such
as “may,” “could,” “should,” “looking forward,” “will,” “would,” “believe,” “expect,” “hope,” “anticipate,” “estimate,” “intend,” “plan,” “assume” or similar
expressions are intended to indicate forward-looking statements.
Although SHUSA believes that the expectations reflected in these forward-looking statements are reasonable as of the date on which the statements
are made, these statements are not guarantees of future performance and involve risks and uncertainties based on various factors and
assumptions, many of which are beyond SHUSA’s control. Among the factors that could cause SHUSA’s financial performance to differ materially
from that suggested by the forward-looking statements are: (1) the effects of regulation and policies of the Board of Governors of the Federal
Reserve System (the “Federal Reserve”), the Federal Deposit Insurance Corporation, the Office of the Comptroller of the Currency and the
Consumer Financial Protection Bureau, including changes in trade, monetary and fiscal policies and laws, including interest rate policies of the
Federal Reserve, the failure to adhere to which could subject SHUSA to formal or informal regulatory compliance and enforcement actions; banking,
capital and liquidity, regulations and policies and the application and interpretations thereof by regulatory bodies, and the impact of changes in and
interpretations of generally accepted accounting principles in the United States of America; (2) the strength of the United States economy in general
and regional and local economies in which SHUSA conducts operations in particular, which may affect, among other things, the level of non-
performing assets, charge-offs, and provisions for credit losses; (3) the ability of certain European member countries to continue to service their debt
and the risk that a weakened European economy could negatively affect U.S.-based financial institutions, counterparties with which SHUSA does
business, as well as the stability of global financial markets; (4) inflation, interest rate, market and monetary fluctuations, which may, among other
things, reduce net interest margins, impact funding sources and affect the ability to originate and distribute financial products in the primary and
secondary markets; (5) adverse movements and volatility in debt and equity capital markets and adverse changes in the securities markets,
including those related to the financial condition of significant issuers in SHUSA’s investment portfolio; (6) SHUSA’s ability to manage changes in the
value and quality of its assets, changing market conditions that may force management to alter the implementation or continuation of cost savings or
revenue enhancement strategies and the possibility that revenue enhancement initiatives may not be successful in the marketplace or may result in
unintended costs; (7) SHUSA's ability to grow revenue, manage expenses, attract and retain highly-skilled people and raise capital necessary to
achieve its business goals and comply with regulatory requirements and expectations; (8) SHUSA’s ability to effectively mange its capital, including
approval of its capital plan by regulators; (9) changes in debt ratings assigned to SHUSA and its subsidiaries; (10) SHUSA’s ability to timely develop
competitive new products and services in a changing environment that are responsive to the needs of SHUSA's customers and are profitable to
SHUSA, the acceptance of such products and services by customers, and the potential for new products and services to impose additional costs on
SHUSA and expose SHUSA to increased operational risk; (11) changes or potential changes to the competitive environment, including changes due
to regulatory and technological changes, the effects of industry consolidation and perceptions of SHUSA as a suitable service provider or
counterparty; (12) the ability of SHUSA and its third-party vendors to convert and maintain SHUSA’s data processing and related systems on a
timely and acceptable basis and within projected cost estimates; (13) SHUSA's ability to control operational risks, data security breach risks and
outsourcing risks, and the possibility of errors in quantitative models SHUSA uses to manage its business and the possibility that SHUSA's controls
will prove insufficient, fail or be circumvented; (14) the impact of the Dodd-Frank Wall Street Reform and Consumer Protection Act, enacted in July
2010, which is a significant development for the industry, the full impact of which will not be known until the rule-making processes mandated by the
legislation are complete, although the impact has involved and will involve higher compliance costs that have affected and will affect SHUSA’s
revenue and earnings negatively; (15) SHUSA's ability to promote a strong culture of risk management, operating controls, compliance oversight
and governance that meets regulatory expectations; (16) competitors of SHUSA that may have greater financial resources or lower costs, may
innovate more effectively, or may develop products and technology that enable those competitors to compete more successfully than SHUSA;

3 Disclaimer (cont.)
(17) acts of terrorism or domestic or foreign military conflicts; and acts of God, including natural disasters; (18) the outcome of ongoing tax audits by
federal, state and local income tax authorities that may require SHUSA to pay additional taxes or recover fewer overpayments compared to what
has been accrued or paid as of period-end; (19) adverse publicity, whether specific to SHUSA or regarding other industry participants or industry-
wide factors, or other reputational harm; and (20) SHUSA’s success in managing the risks involved in the foregoing.
Because this information is intended only to assist investors, it does not constitute investment advice or an offer to invest, and in making this
presentation available, SHUSA gives no advice and makes no recommendation to buy, sell, or otherwise deal in shares or other securities of Banco
Santander, S.A. (“Santander”), SHUSA, Santander Bank, N.A. (“Santander Bank” or “SBNA”), or Santander Consumer Holdings USA, Inc. (“SC”) in
any other securities or investments. It is not our intention to state, indicate, or imply in any manner that current or past results are indicative of future
results or expectations. As with all investments, there are associated risks, and you could lose money investing. Prior to making any investment, a
prospective investor should consult with its own investment, accounting, legal, and tax advisers to evaluate independently the risks, consequences,
and suitability of that investment. No offering of securities shall be made in the United States except pursuant to registration under the U.S.
Securities Act of 1933, as amended, or an exemption therefrom.
In this presentation, we may sometimes refer to certain non-GAAP figures or financial ratios to help illustrate certain concepts. These ratios, each of
which is defined in this document, if utilized, may include Pre-Tax Pre-Provision Income, the Tangible Common Equity to Tangible Assets Ratio, and
the Texas Ratio. This information supplements our results as reported in accordance with GAAP and should not be viewed in isolation from, or as a
substitute for, our GAAP results, among others. We believe that this additional information and the reconciliations we provide may be useful to
investors, analysts, regulators and others as they evaluate the impact of these items on our results for the periods presented due to the extent to
which the items are indicative of our ongoing operations. Where applicable, we provide GAAP reconciliations for such additional information.
On February 18, 2014, the Federal Reserve issued the final rule implementing certain of the enhanced prudential standards mandated by Section
165 of the Dodd-Frank Wall Street Reform and Consumer Protection Act (the “Final Rule") to strengthen regulatory oversight of foreign banking
organizations ("FBOs"). Under the Final Rule, FBOs with over $50 billion of U.S. non-branch assets, including Santander, were required to
consolidate U.S. subsidiary activities under an intermediate holding company ("IHC"). Due to its U.S. non-branch total consolidated asset size,
Santander was subject to the Final Rule. As a result of this rule, Santander transferred substantially all of its equity interests in U.S. bank and non-
bank subsidiaries previously outside SHUSA to SHUSA, which became an IHC effective July 1, 2016. These subsidiaries included Santander
BanCorp, Banco Santander International (“BSI”), Santander Investment Services, Inc. (“SIS”), Santander Securities LLC (“SSLLC”), as well as
several other subsidiaries.
As these entities were and are solely owned and controlled by Santander prior to and after July 1, 2016, in accordance with Accounting Standards
Codification 805, the transaction has been accounted for under the common control guidance which requires SHUSA to recognize the assets and
liabilities transferred at their historical cost of the transferring entity at the date of transfer. Additionally, as this transaction represents a change in
reporting entity, the guidance requires retrospective combination of the entities for all periods presented in the financial statements as if the
combination had been in effect since the inception of common control. The entities transferred approximately $14.1 billion of assets and
approximately $11.8 billion of liabilities to SHUSA on July 1, 2016. The transfer added approximately $69.9 million and $68.8 million of net income to
SHUSA for the nine-month periods ended September 30, 2016 and 2015 after the financial statements have been recast to reflect the operations of
the commonly controlled entities for all periods presented as a change in reporting entity. Historical financial information in this presentation
has not been consistently recast to reflect the above financial reporting requirements.

4
Santander
Bank
Santander
Consumer
USA
Santander
Puerto Rico
Banco
Santander
International
Santander
Investment
Securities
SHUSA is a bank holding company (“BHC”) headquartered in Boston, MA and is
wholly owned by Santander (NYSE: SAN)
Introduction
• SHUSA consists of:
• Well-established banking franchises in
the Northeast and Puerto Rico
• A nationwide auto finance business
• A wholesale broker-dealer in New York
• International private banking business
• Regulated by the Federal Reserve
• SEC registered1
12SHUSA’s SEC filings are accessible on the SEC website at www.sec.gov. Filings are also accessible through
SHUSA’s website at www.santanderus.com
5
Corporate Structure1
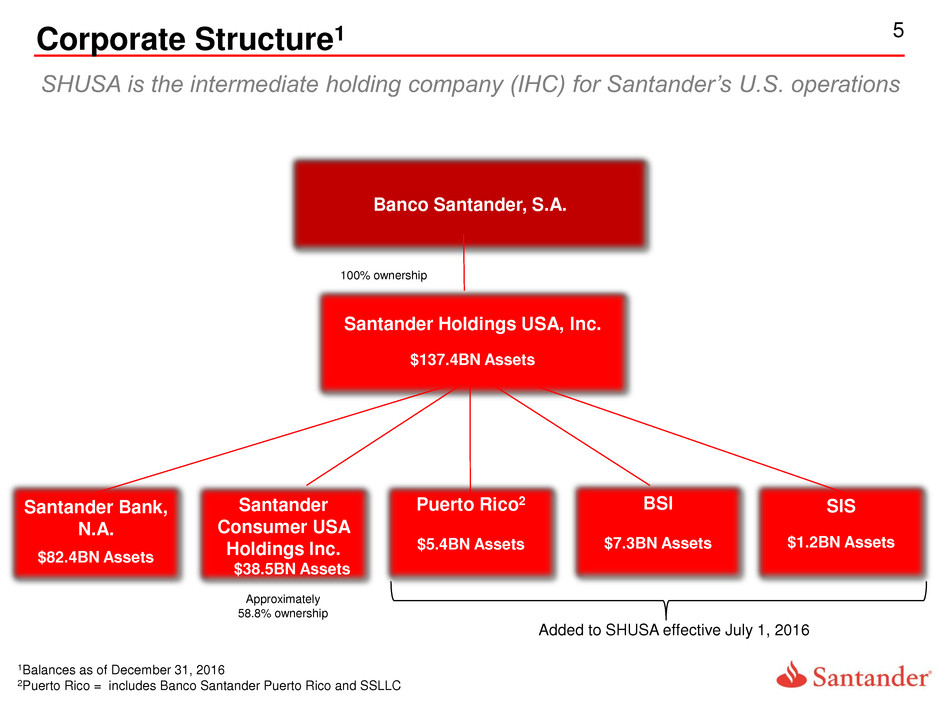
Santander Holdings USA, Inc.
$137.4BN Assets
Santander Bank,
N.A.
$82.4BN Assets
Santander
Consumer USA
Holdings Inc.
$38.5BN Assets
SHUSA is the intermediate holding company (IHC) for Santander’s U.S. operations
1Balances as of December 31, 2016
2Puerto Rico = includes Banco Santander Puerto Rico and SSLLC
Approximately
58.8% ownership
Banco Santander, S.A.
Puerto Rico2
$5.4BN Assets
BSI
$7.3BN Assets
SIS
$1.2BN Assets
100% ownership
Added to SHUSA effective July 1, 2016
6
2016 Executive Summary1
Liquidity and
Funding
Capital
Balance Sheet
1Data as of 12/31/16 unless otherwise noted
2Includes non controlling interest
3Liquidity coverage ratio
Earnings
Credit Quality
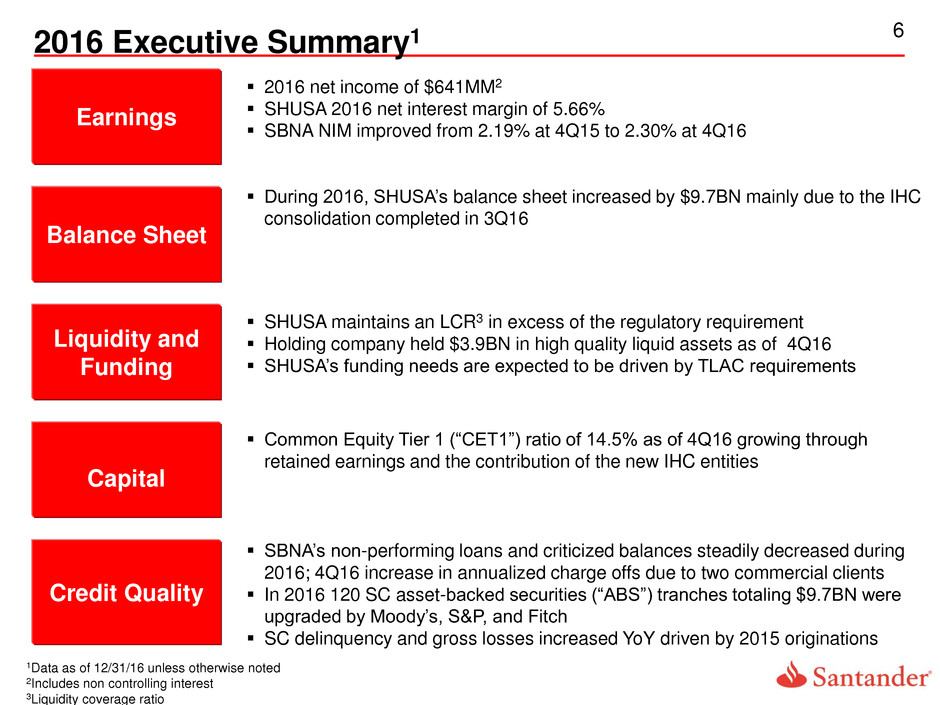
2016 net income of $641MM2
SHUSA 2016 net interest margin of 5.66%
SBNA NIM improved from 2.19% at 4Q15 to 2.30% at 4Q16
During 2016, SHUSA’s balance sheet increased by $9.7BN mainly due to the IHC
consolidation completed in 3Q16
SHUSA maintains an LCR3 in excess of the regulatory requirement
Holding company held $3.9BN in high quality liquid assets as of 4Q16
SHUSA’s funding needs are expected to be driven by TLAC requirements
Common Equity Tier 1 (“CET1”) ratio of 14.5% as of 4Q16 growing through
retained earnings and the contribution of the new IHC entities
SBNA’s non-performing loans and criticized balances steadily decreased during
2016; 4Q16 increase in annualized charge offs due to two commercial clients
In 2016 120 SC asset-backed securities (“ABS”) tranches totaling $9.7BN were
upgraded by Moody’s, S&P, and Fitch
SC delinquency and gross losses increased YoY driven by 2015 originations

7 Quarterly Profitability1
Net Interest Income ($MM) Pre-Tax Pre-Provision Income/(Loss) ($MM)
Pre-Tax Income/(Loss) ($MM) Net Income/(Loss) ($MM)2
(3,647)
1,032 985 1,022 783
(3,500)
(2,500)
(1,500)
(500)
500
1,500
4Q15 1Q16 2Q16 3Q16 4Q16
1,605 1,616 1,586 1,621 1,583
0
500
1,000
1,500
2,000
4Q15 1Q16 2Q16 3Q16 4Q16
(4,704)
150
388 334
3
(500)
(350)
(200)
(50)
100
250
400
4Q15 1Q16 2Q16 3Q16 4Q16
(3,665)
85
253 226
30
(500)
(375)
(250)
(125)
-
125
250
4Q15 1Q16 2Q16 3Q16 4Q16
1Periods prior to 3Q16 have not been re-cast for the IHC consolidation. Refer to SHUSA 2016 Form 10-K for annual results re-casted
for IHC consolidation
2 Net Income includes noncontrolling interest
4Q16 results impacted by one-time charges

8
18%
11%
5%
8%
7%
7% 16%
5%
4%
3%
16%
Balance Sheet Overview1
7%
5%
4%
6%
4% 7%
6%
19%
14%
7%
19%
Investments
Auto Loans
2%
Cash
Non Interest-
Bearing
Demand
Deposits
Other Assets
C&I
CRE Residential
Mortgage
Other
Loans
Operating
Lease Assets
Goodwill
Home
Equity
Multi-Family
$137.4BN Assets $115.0BN Liabilities
$22.4BN Equity
Interest-
Bearing
Demand
Deposits
Secured
Structured
Financings
Equity
Other
Liabilities
FHLB
Money
Market
Certificates
of Deposit
Savings
Revolving
Credit
Facilities
Other
Borrowings
SHUSA balance sheet reflects subsidiary banks funded by core deposits and an
auto finance company funded with secured wholesale funds
1Balances as of December 31, 2016

9
2
Balance Sheet Trends: Overview
$128 $131 $126
$139 $137
Liabilities & Equity
$ in billions
Balance sheet increase in Q316 driven by the IHC consolidation
$128 $131 $126
$139 $137
Assets
1Periods prior to 3Q16 have not been re-cast for the IHC consolidation. Refer to the SHUSA 2016 Form
10-K for annual results re-casted for the IHC consolidation.
10
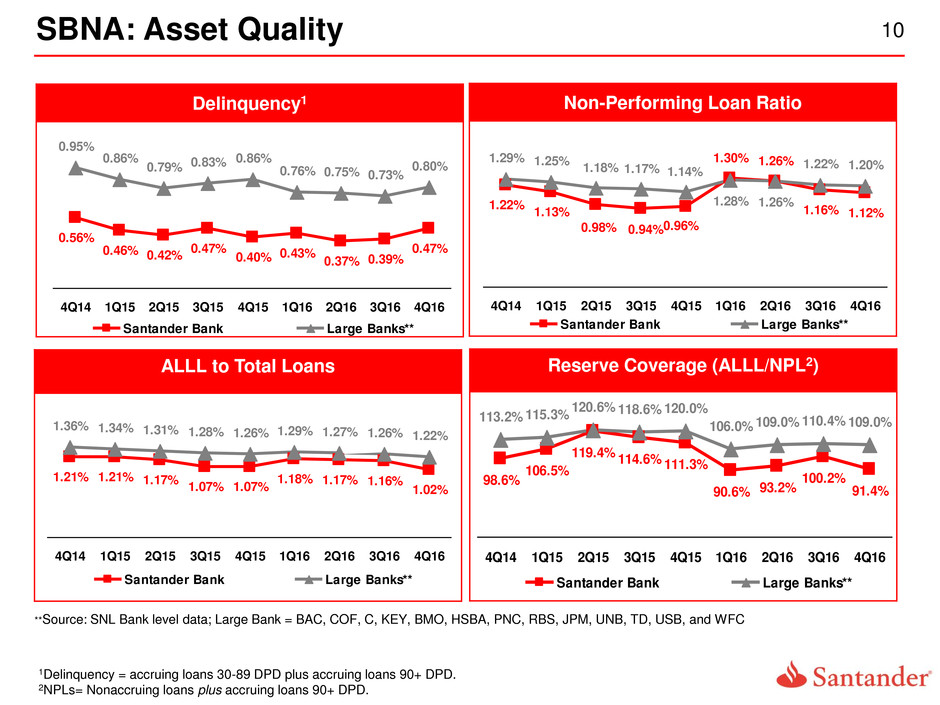
Reserve Coverage (ALLL/NPL2) ALLL to Total Loans
98.6%
93.2%
100.2%
90.6%
111.3%114.6%
119.4%
106.5%
91.4%
109.0%106.0%
120.0%118.6%120.6%115.3%113.2% 110.4% 109.0%
4Q14 1Q15 2Q15 3Q15 4Q15 1Q16 2Q16 3Q16 4Q16
Santander Bank Large Banks**
Non-Performing Loan Ratio Delinquency1
SBNA: Asset Quality
**Source: SNL Bank level data; Large Bank = BAC, COF, C, KEY, BMO, HSBA, PNC, RBS, JPM, UNB, TD, USB, and WFC
1Delinquency = accruing loans 30-89 DPD plus accruing loans 90+ DPD.
2NPLs= Nonaccruing loans plus accruing loans 90+ DPD.
0.56%
0.37% 0.39%
0.43%0.40%
0.47%
0.42%0.46%
0.47%
0.75%0.76%
0.86%0.83%0.79%
0.86%
0.95%
0.73%
0.80%
4Q14 1Q15 2Q15 3Q15 4Q15 1Q16 2Q16 3Q16 4Q16
Santander Bank Large Banks**
1.12%1.13%
0.98% 0.94%0.96%
1.30%
1.16%
1.26%
1.22%
1.20%1.22%
1.29% 1.25%
1.18% 1.17% 1.14%
1.28% 1.26%
4Q14 1Q15 2Q15 3Q15 4Q15 Q16 2Q16 3Q16 4Q16
Santander Bank Large Banks**
1.21% 1.17% 1.16%1.18%1.07%1.07%
1.17%1.21%
1.02%
1.27%1.29%1.26%1.28%1.3 %.34%
1.36%
1.2 % 1.22%
4Q14 1Q15 2Q15 3Q15 4Q15 1Q16 2Q16 3Q16 4Q16
Santander Bank Large Banks**

11 SBNA: Asset Quality (cont.)
$619
$590
$515 $497 $513
$710
$687
$615
$583
4Q14 1Q15 2Q15 3Q15 4Q15 1Q16 2Q16 3Q16 4Q16
Non-Performing Loans1 Criticized Balances2
Texas Ratio4 Annualized Net Charge off Ratio
$ MM
-6% $ MM
Annualized NCO = Quarterly NCO*4
**Source: SNL Bank level data; Large Bank = BAC, COF, C, KEY, BMO, HSBA, PNC, RBS, JPM, UNB, TD, USB, and WFC
13.7% 13.1% 12.9%
9.5%9.3% 8.5% 7.9% 8.6%
10.7% 9.6%10.3%10.1%
14.3%
16.2% 15.1% 14.5% 13.9% 14.0%
4Q14 1Q15 2Q15 3Q15 4Q15 1Q16 2Q16 3Q16 4Q16
Santander Bank Large Banks**
$1,980 $1,972
$2,073
$2,171
$2,333
$2,626
$2,376 $2,337
$2,018
3.92% 3.78% 3.95%
4.09%
4.35%
4.81%
4.36% 4.42%
3.87%
4Q14 1Q15 2Q15 3Q15 4Q15 1Q16 2Q16 3Q16 4Q16
Criticized Balances Criticized Ratio
NPLs and criticized balances continue their downward trend; 4Q16 charge off
increase due to two commercial clients
1NPLs = Nonaccruing loans plus accruing loans 90+ DPD;.
2Criticized = loans that are categorized as special mention, substandard, doubtful, or loss.
34Q16 impacted by two commercial clients. Excluding these clients the charge-off ratio would be 0.31%.
4See Appendix for definition and non-GAAP measurement reconciliation.
3
0.23%
0.15%
0.25%
0.12%
0.43%
0.20%
0.31%0.26%
0.91%
0.41%0.39%
0.38%
0.36%0.35%0.36%
0.49%
0.43% 0.45%
0.31%
4Q14 1Q15 2Q15 3Q15 4Q15 1Q16 2Q16 3Q16 4 16
Santander Bank Large Banks**

12 SC: Asset Quality – Loss and Delinquency
YoY delinquency and gross losses increased driven by 2015 originations which
were more nonprime in nature and slower portfolio growth
Recovery rates and net losses in Q2 2016 benefited by proceeds from bankruptcy sales1
1 Excluding bankruptcy sales, recovery rates would have been 59%
2Indivusally Acquired Retail Installment Contracts Held For Investment
Credit2 Delinquency2
SOURCE: SC Fourth Quarter and Full Year 2016 Presentation, January 25, 2017

13 SC: Asset Quality – Loss Performance
Gross Losses
*Retained originations only
1As of the end of the year each vintage was originated
2Auction fees included in net losses. Financial statements reflect auction fees in repossession expense, therefore, net losses
included on this slide are higher .
3First half vintage describes January through June vintage performance through the end of December for each year.
Net Losses2
Early indications show the first half of the 2016 vintage is outperforming the 2015
vintage on a gross and net loss basis1
SOURCE: SC Fourth Quarter and Full Year 2016 Presentation, January 25, 2017

14
2
2017 2018 2019 2020 … 2025 … … 2036 Perp
Wholesale Funding Profile1
Trust
Pref
$150
Sr
Debt
4.625%
Sr
Debt
3.0%
Sr
Debt
3.45%
2017 2018 2019 Perp6.3 3
10.7
6.9
8.0
8.0
13.5
13.5
Utilized
$31.4
SC ($BN)
Public Sec
Committed
FHLB
Bank Debt
HoldCo Debt
3rd Party Rev
Santander2
Trust
Pref
Pref
Stock
Sr
Debt
4.6%
Sr
Debt
3M+
145
REIT
Pref
12.2%
FHLB
0.6%
FHLB
0.8%
$0.18
$2.9
$4.0
Public Sec
$38.5
$0.6
$0.5
$0.22 $0.2
1As of December 31, 2016.
2$0.3BN difference in Santander balance between SHUSA and SC charts reflects
$0.3BN facility between SHUSA and SC that is eliminated at the consolidated level.
$44.4
$43.2
$1.0
Sr
Debt
2.65%
FHLB
0.8%
Private Amort.
SBNA ($BN, % yield)
SHUSA HOLDCO ($BN, % yield) SHUSA ($BN)
$1.1
Sr
Debt
4.5%
Debt
4.2%
$0.6
Private Amort.
3rd Party Rev
Santander2
Holding company funding will be driven by total loss-absorbing capacity (“TLAC”)
requirement and liquidity risk management
$1.0
Sr
Debt
2.7%
FHLB
15
2
2
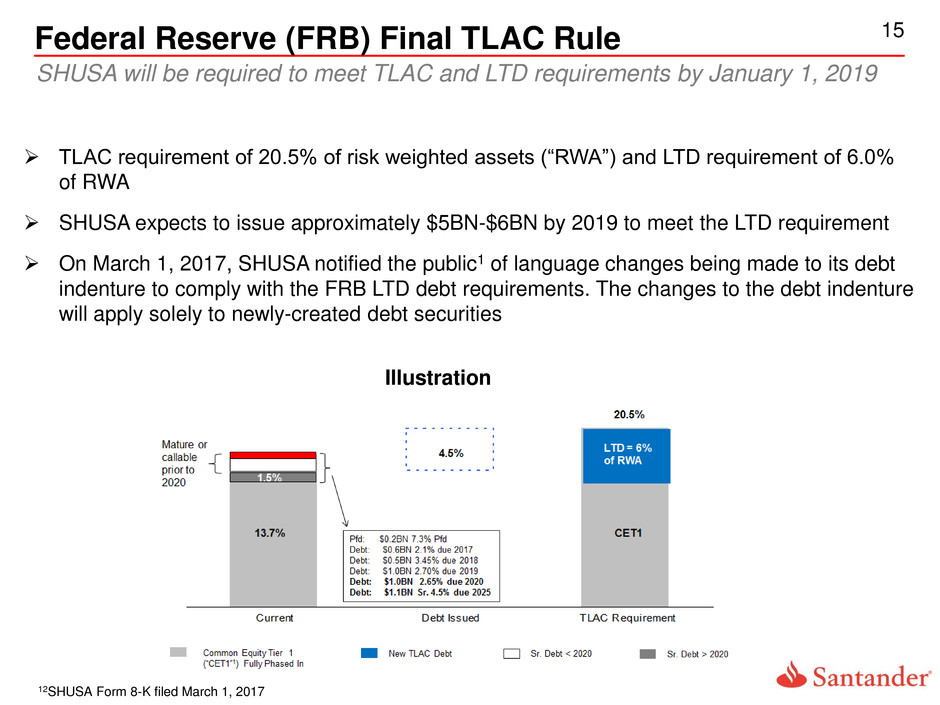
Federal Reserve (FRB) Final TLAC Rule
TLAC requirement of 20.5% of risk weighted assets (“RWA”) and LTD requirement of 6.0%
of RWA
SHUSA expects to issue approximately $5BN-$6BN by 2019 to meet the LTD requirement
On March 1, 2017, SHUSA notified the public1 of language changes being made to its debt
indenture to comply with the FRB LTD debt requirements. The changes to the debt indenture
will apply solely to newly-created debt securities
Illustration
12SHUSA Form 8-K filed March 1, 2017
SHUSA will be required to meet TLAC and LTD requirements by January 1, 2019

16
2
1Capital ratios calculated under the U.S. Basel III framework on a transitional basis
2Periods prior to 3Q16 have not been re-cast for the IHC consolidation
3Fully phased-in under the standardized approach - see SHUSA 2016 Form 10-K
Under fully phased-in US Basel III rule,3 CET1 ratio as of 4Q16 was 13.7%
Capital Ratios1,2
Tier 1 Leverage
Tier 1 risk based
Common Equity Tier 1
Total Risk Based
12.0% 11.9%
12.4%
14.1%
14.5%
4Q15 1Q16 2Q16 3Q16 4Q16
11.6% 11.5% 11.6%
12.5% 12.5%
4Q15 1Q16 2Q16 3Q16 4Q16
13.5% 13.4%
14.0%
15.7%
16.1%
4Q15 1Q16 2Q16 3Q16 4Q16
15.3% 15.3%
15.8%
17.6% 18.0%
4Q15 1Q16 2Q16 3Q16 4Q16
17
2
2
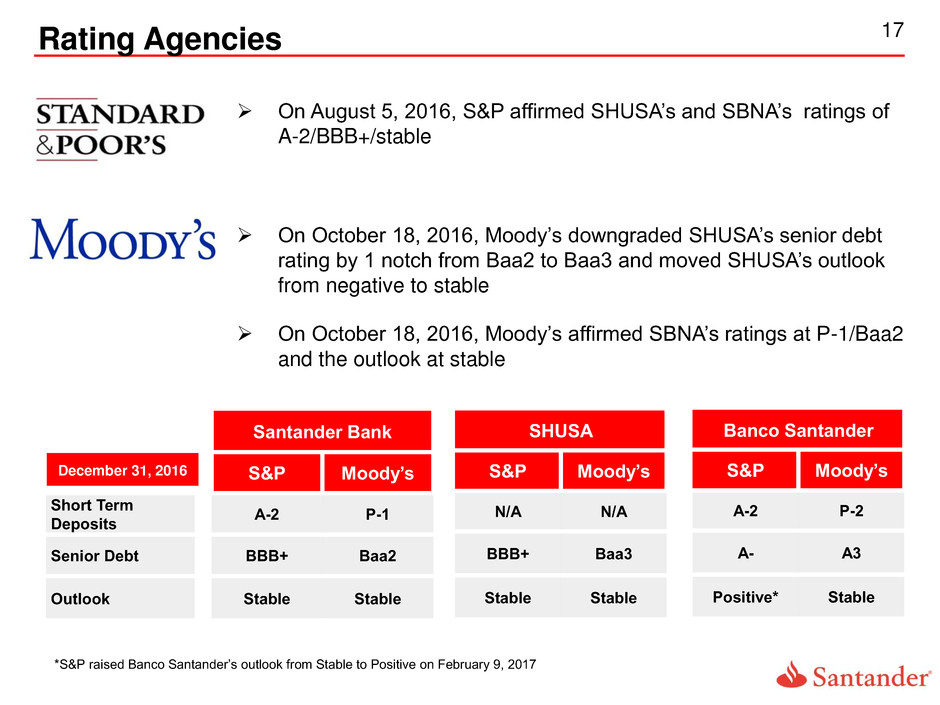
Rating Agencies
Santander Bank
Te S&P Moody’s
Short Term
Deposits
A-2 P-1
Senior Debt BBB+ Baa2
Outlook Stable Stable
SHUSA
S&P Moody’s
N/A N/A
BBB+ Baa3
Stable Stable
On August 5, 2016, S&P affirmed SHUSA’s and SBNA’s ratings of
A-2/BBB+/stable
On October 18, 2016, Moody’s downgraded SHUSA’s senior debt
rating by 1 notch from Baa2 to Baa3 and moved SHUSA’s outlook
from negative to stable
On October 18, 2016, Moody’s affirmed SBNA’s ratings at P-1/Baa2
and the outlook at stable
December 31, 2016
Banco Santander
S&P Moody’s
A-2 P-2
A- A3
Positive* Stable
*S&P raised Banco Santander’s outlook from Stable to Positive on February 9, 2017

Appendix

19
2
2
Santander U.S. Web site
SantanderUS.com
At-a-Glance
• Up-to-date key Santander US
information in one institutional
website
• 6 sections:
• About Us
• Structure and
governance
• Board of Directors
• Management
• Financial Services
• Investor and Shareholder
Relations (includes link to SEC
filings and fixed-income investor
presentations)
• Media Relations
• Communities
• Careers
• Links to U.S. business units
WWW.SANTANDERUS.COM
20
2
2
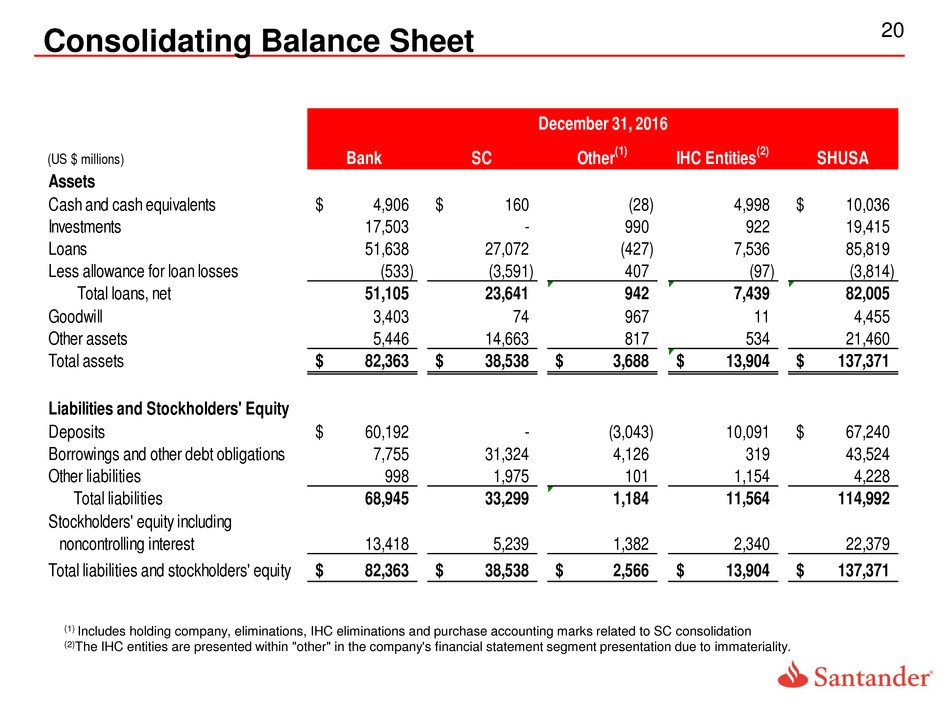
Consolidating Balance Sheet
(1) Includes holding company, eliminations, IHC eliminations and purchase accounting marks related to SC consolidation
(2)The IHC entities are presented within "other" in the company's financial statement segment presentation due to immateriality.
(US $ millions) Bank SC Other
(1)
IHC Entities
(2)
SHUSA
Assets
Cash and cash equivalents 4,906$ 160$ (28) 4,998 10,036$
Investments 17,503 - 990 922 19,415
Loans 51,638 27,072 (427) 7,536 85,819
Less allowance for loan losses (533) (3,591) 407 (97) (3,814)
Total loans, net 51,105 23,641 942 7,439 82,005
Goodwill 3,403 74 967 11 4,455
Other assets 5,446 14,663 817 534 21,460
Total assets 82,363$ 38,538$ 3,688$ 13,904$ 137,371$
Liabilities and Stockholders' Equity
Deposits 60,192$ - (3,043) 10,091 67,240$
Borrowings and other debt obligations 7,755 31,324 4,126 319 43,524
Other liabilities 998 1,975 101 1,154 4,228
Total liabilities 68,945 33,299 1,184 11,564 114,992
Stockholders' equity including
noncontrolling interest 13,418 5,239 1,382 2,340 22,379
Total liabilities and stockholders' equity 82,363$ 38,538$ 2,566$ 13,904$ 137,371$
December 31, 2016

21 Consolidating Income Statement
(1)Includes holding company activities, IHC eliminations, eliminations and purchase accounting marks related to SC consolidation.
(2) SHUSA net income includes non-controlling interest.
(3)The IHC entities are presented within "other" in the company's financial statement segment presentation due to immateriality.
(US $ Millions) Bank SC Other
(1)
IHC Entities
Interest income 2,209$ 5,255$ 173$ 353 7,990$
Interest expense (477) (806) (110) (32) (1,425)
Net interest income 1,732 4,449 63 321 6,565
Fees & other income/(expense) 928 1,431 (113) 452 2,698
Other non interest income 58 - - - 58
Net revenue 2,718 5,880 (50) 773 9,321
G & A expense (2,160) (2,235) (197) (530) (5,122)
Other expenses (193) (17) (37) (17) (264)
Provision for credit losses (132) (2,468) (309) (71) (2,980)
Income/(loss) before taxes 233 1,160 (593) 155 955
Income tax (expense)/benefit (81) (394) 166 (5) (314)
Net income/(loss)
2
152$ 766$ (427)$ 150$ 641$
SHUSA
For the year ended December 31, 2016

22
2
2
Quarterly Trended Statement of Operations1
(US $ Millions) 4Q151 1Q161 2Q161 3Q16 4Q16
Interest income 1,933$ 1,970$ 1,942$ 1,971$ 1,932$
Interest expense (328) (354) (356) (350) (349)
Net interest income 1,605 1,616 1,586 1,621 1,583
Fees & other income 518 575 585 728 623
Equity investment income/(expense) (3) (4) (1) - (6)
Other non interest income/(loss) - 26 31 - -
Net revenue 2,120 2,213 2,201 2,349 2,200
G&A expense (1,227) (1,109) (1,144) (1,281) (1,353)
Other expenses (4,540) (72) (72) (46) (64)
Provision for credit losses (1,057) (882) (597) (688) (780)
Income/(loss) before taxes (4,704) 150 388 334 3
Income tax (expense)/benefit 1,039 (65) (135) (108) 27
Net income/(loss)(2) (3,665)$ 85$ 253$ 226$ 30$
1Periods prior to 3Q16 have not been re-cast for the IHC consolidation. Refer to SHUSA 2016 Form 10-K
for annual results re-casted for IIHC consolidation.
2Represents net income/(loss) including noncontrolling interest.
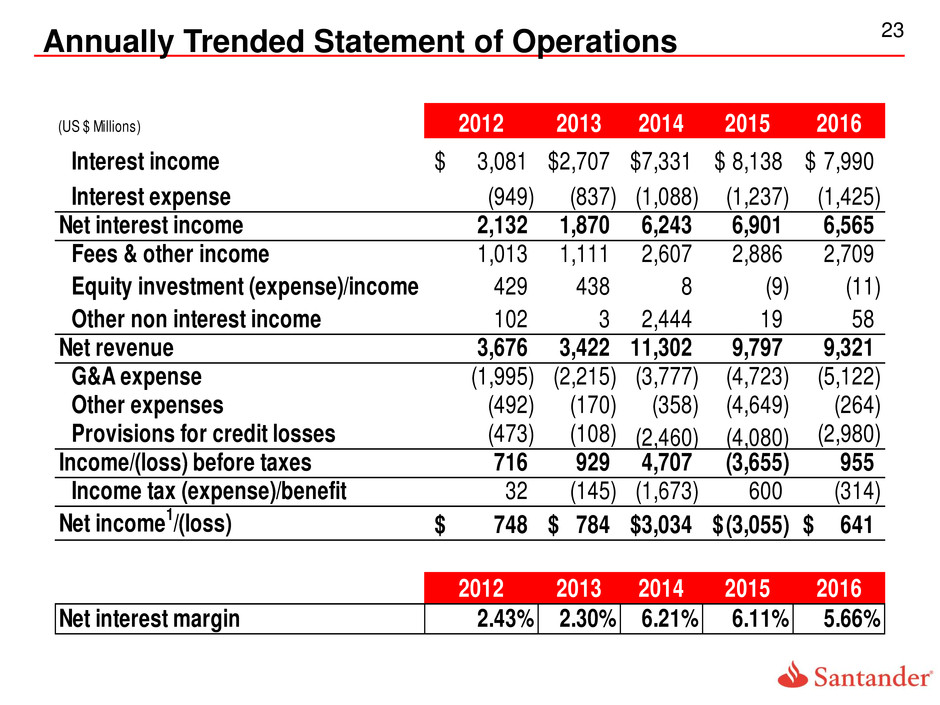
23 Annually Trended Statement of Operations
(US $ Millions) 2012 2013 2014 2015 2016
Interest income 3,081$ 2,707$ 7,331$ 8,138$ 7,990$
Interest expense (949) (837) (1,088) (1,237) (1,425)
Net interest income 2,132 1,870 6,243 6,901 6,565
Fees & other income 1,013 1,111 2,607 2,886 2,709
Equity investment (expense)/income 429 438 8 (9) (11)
Other non interest income 102 3 2,444 19 58
Net revenue 3,676 3,422 11,302 9,797 9,321
G&A expense (1,995) (2,215) (3,777) (4,723) (5,122)
Other expenses (492) (170) (358) (4,649) (264)
Provisions for credit losses (473) (108) (2,460) (4,080) (2,980)
Income/(loss) before taxes 716 929 4,707 (3,655) 955
Income tax (expense)/benefit 32 (145) (1,673) 600 (314)
Net income1/(loss) 748$ 784$ 3,034$ (3,055)$ 641$
2012 2013 2014 2015 2016
Net interest margin 2.43% 2.30% 6.21% 6.11% 5.66%
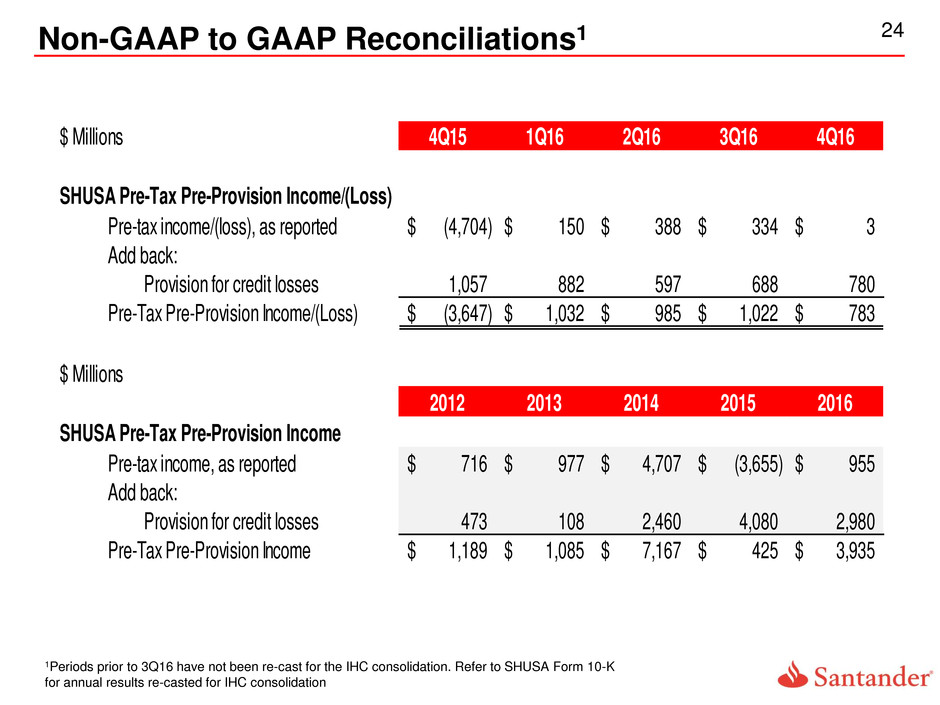
24
2
2
Non-GAAP to GAAP Reconciliations1
1Periods prior to 3Q16 have not been re-cast for the IHC consolidation. Refer to SHUSA Form 10-K
for annual results re-casted for IHC consolidation
$55,756 $56,638
$57,059 $57,114 $57,548
0.46%
0.48%
0.47%
0.39% 0.39%
0.30%
0.35%
0.39%
0.44%
0.48%
0.53%
4Q15 1Q16 2Q16 3Q16 4Q16
Total Deposits Avg. Interest Cost
$ Millions 4Q15 1Q16 2Q16 3Q16 4Q16
SHUSA Pre-Tax Pre-Provision Income/(Loss)
Pre-tax income/(loss), as reported (4,704)$ 150$ 388$ 334$ 3$
Add back:
Provision for credit losses 1,057 882 597 688 780
Pre-Tax Pre-Provision Income/(Loss) (3,647)$ 1,032$ 985$ 1,022$ 783$
$ Millions
2012 2013 2014 2015 2016
SHUSA Pre-Tax Pre-Provision Income
Pre-tax income, as reported 716$ 977$ 4,707$ (3,655)$ 955$
Add back:
Provision for credit losses 473 108 2,460 4,080 2,980
Pre-Tax Pre-Provision Income 1,189$ 1,085$ 7,167$ 425$ 3,935$
25
2
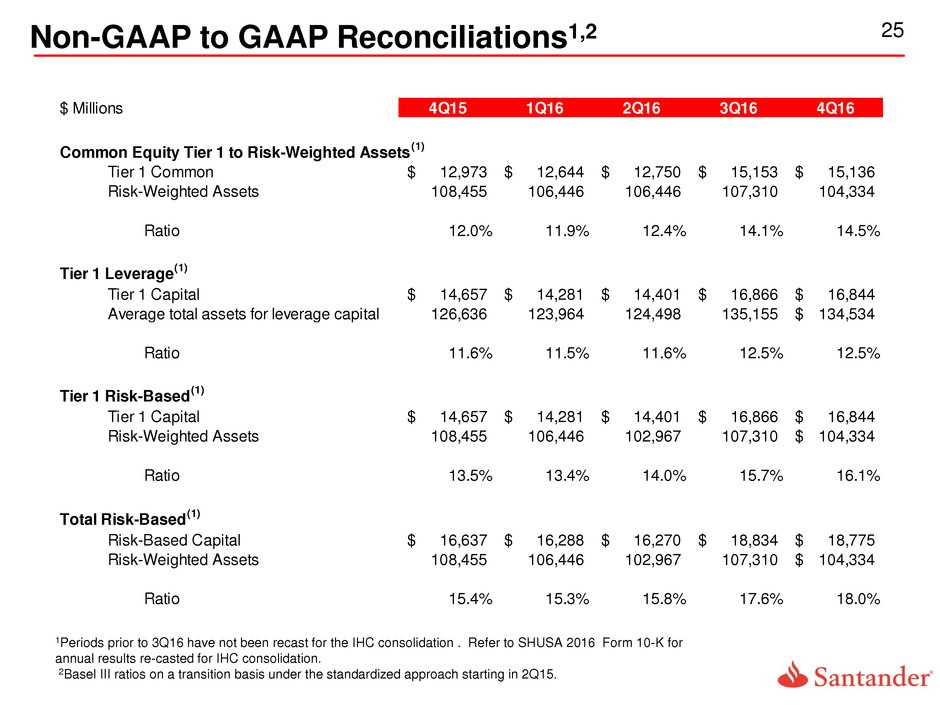
2
1
1Periods prior to 3Q16 have not been recast for the IHC consolidation . Refer to SHUSA 2016 Form 10-K for
annual results re-casted for IHC consolidation.
2Basel III ratios on a transition basis under the standardized approach starting in 2Q15.
Non-GAAP to GAAP Reconciliations1,2
$ Millions 4Q15 1Q16 2Q16 3Q16 4Q16
Common Equity Tier 1 to Risk-Weighted Assets
(1)
Tier 1 Common 12,973$ 12,644$ 12,750$ 15,153$ 15,136$
Risk-Weighted Assets 108,455 106,446 106,446 107,310 104,334
Ratio 12.0% 11.9% 12.4% 14.1% 14.5%
Tier 1 Leverage
(1)
Tier 1 Capital 14,657$ 14,281$ 14,401$ 16,866$ 16,844$
126,636 123,964 124,498 135,155 134,534$
Ratio 11.6% 11.5% 11.6% 12.5% 12.5%
Tier 1 Risk-Based
(1)
Tier 1 Capital 14,657$ 14,281$ 14,401$ 16,866$ 16,844$
Risk-Weighted Assets 108,455 106,446 102,967 107,310 104,334$
Ratio 13.5% 13.4% 14.0% 15.7% 16.1%
Total Risk-Based
(1)
Risk-Based Capital 16,637$ 16,288$ 16,270$ 18,834$ 18,775$
Risk-Weighted Assets 108,455 106,446 102,967 107,310 104,334$
Ratio 15.4% 15.3% 15.8% 17.6% 18.0%
Average total assets for leverage capital

26
2
2
SBNA: Quarterly Profitability
US $ millions
1See non-GAAP to GAAP reconciliation of Pre-Tax Pre-Provision Income
Net Interest Income ($MM) Pre-Tax Pre-Provision Income ($MM)
Pre-Tax Income/(Loss) ($MM) Net Income/(Loss) ($MM)
81
100 104
114
47
0
20
40
60
80
100
120
140
4Q15 1Q16 2Q16 3Q16 4Q16
424 434 438 433 426
2.19% 2.22%
2.24%
2.33% 2.30%
0
100
200
300
400
500
4Q15 1Q16 2Q16 3Q16 4Q16
NII Net Interest Margin
11
(20)
104
126
23
-25
0
25
50
75
100
125
150
4Q15 1Q16 2Q16 3Q16 4Q16
12
(17)
93 91
(15)
-20
5
30
55
80
105
4Q15 1Q16 2Q16 3Q16 4Q16
27
2
2
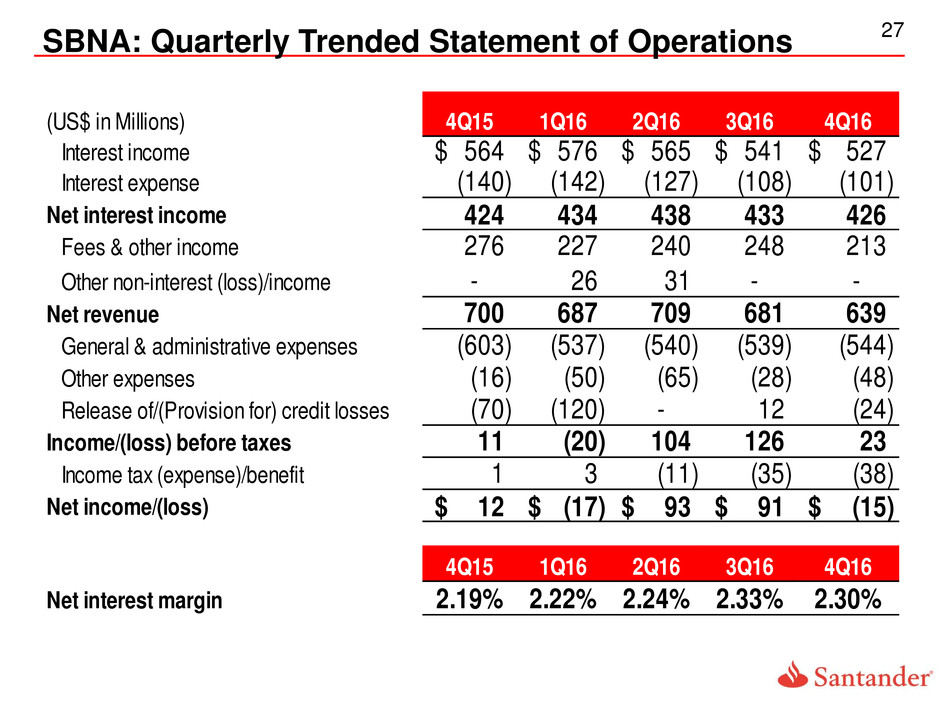
SBNA: Quarterly Trended Statement of Operations
(US$ in Millions) 4Q15 1Q16 2Q16 3Q16 4Q16
Interest income 564$ 576$ 565$ 541$ 527$
Interest expense (140) (142) (127) (108) (101)
Net interest income 424 434 438 433 426
Fees & other income 276 227 240 248 213
Other non-interest (loss)/income - 26 31 - -
Net revenue 700 687 709 681 639
General & administrative expenses (603) (537) (540) (539) (544)
Other expenses (16) (50) (65) (28) (48)
Release of/(Provision for) credit losses (70) (120) - 12 (24)
Income/(loss) before taxes 11 (20) 104 126 23
Income tax (expense)/benefit 1 3 (11) (35) (38)
Net income/(loss) 12$ (17)$ 93$ 91$ (15)$
4Q15 1Q16 2Q16 3Q16 4Q16
Net interest margin 2.19% 2.22% 2.24% 2.33% 2.30%

28
2
2
SBNA: Quarterly Average Balance Sheet
Quarterly Averages
(In millions)
Average Yield/ Average Yield/ Average Yield/ Average Yield/
Balance Rate Balance Rate Balance Rate Balance Rate
Deposits and investments 22,102$ 1.18% 22,018$ 1.32% 84$ -0.14% 25,320$ 1.70%
Loans 52,988 3.50% 53,530 3.51% (542) -0.01% 53,661 3.43%
Allowance for loan losses (597) --- (633) --- 36 --- (567) ---
Other assets 10,147 --- 10,597 --- (450) --- 11,190 ---
TOTAL ASSETS 84,640$ 2.50% 85,512$ 2.54% (872)$ -0.04% 89,604$ 2.53%
Interest-bearing demand deposits 9,845 0.23% 9,780 0.24% 65 -0.01% 11,451 0.51%
Noninterest-bearing demand deposits 11,861 --- 11,439 --- 422 --- 9,804 ---
Savings 4,053 0.12% 4,099 0.12% (46) 0.00% 3,932 0.12%
Money market 27,398 0.46% 26,977 0.48% 421 -0.02% 25,791 0.52%
Certificates of deposit 8,074 0.95% 8,357 0.91% (283) 0.04% 8,152 0.90%
Borrowed funds 8,140 2.10% 9,438 2.06% (1,298) 0.04% 15,143 1.89%
Other liabilities 1,709 --- 1,791 --- (82) --- 1,846 ---
Equity 13,560 --- 13,631 --- (71) --- 13,485 ---
TOTAL LIABILITIES & SE 84,640$ 0.47% 85,512$ 0.50% (872)$ -0.03% 89,604$ 0.62%
NET INTEREST MARGIN 2.30% 2.33% -0.03% 2.19%
4Q16 4Q153Q16 Change
29
2
2
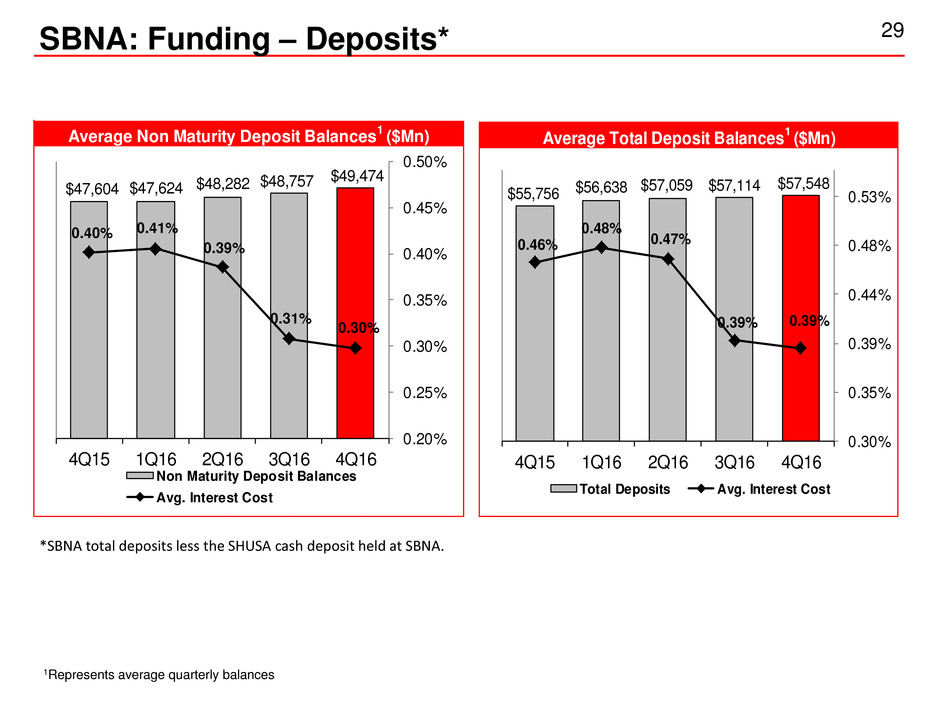
SBNA: Funding – Deposits*
1Represents average quarterly balances
*SBNA total deposits less the SHUSA cash deposit held at SBNA.
Average Non Maturity Deposit Balances
1
($Mn)
$47,604 $47,624 $48,282 $48,757
$49,474
0.40% 0.41%
0.39%
0.31%
0.30%
0.20%
0.25%
0.30%
0.35%
0.40%
0.45%
0.50%
4Q15 1Q16 2Q16 3Q16 4Q16
Non Maturity Deposit Balances
Avg. Interest Cost
Average Total Deposit Balances
1
($Mn)
$55,756 $56,638
$57,059 $57,114 $57,548
0.46%
0.48%
0.47%
0.39% 0.39%
0.30%
0.35%
0.39%
0.44%
0.48%
0.53%
4Q15 1Q16 2Q16 3Q16 4Q16
Total Deposits Avg. Interest Cost

30
Global Corporate Banking2
1Commercial Banking = Non-CRE total for Business Banking, Middle Market, Equipment Finance & Leasing and Commercial Banking NCE.
2Global Corporate Banking = Non-CRE total for Global Corporate Banking.
3Other Commercial = Non CRE total for all other Commercial Business segments.
4Other Consumer = Direct Consumer, Indirect Consumer, RV/Marine, Credit Cards, SFC, & RDM Run-off.
Commercial Banking1
Other Consumer4 Other Commercial3
Outstandings NPL* to Total Loans Net Charge-Offs**
SBNA: Asset Quality
*NPL = Nonaccruing loans plus accruing loans 90+ DPD
**NCO = Rolling 12-month average for that quarter and the prior 3 quarters US $ Billions
$5.4 $5.5 $5.5 $5.7
$6.0 $6.2
$6.5 $6.5 $6.3
1.4%
1.6%
1.4%
1.1% 1.1%
1.5% 1.6% 1.4%
1.6%
0.3% 0.5% 0.4% 0.4% 0.5% 0.2% 0.1%
0.4%
1.3%
4Q14 1Q15 2Q15 3Q15 4Q15 1Q16 2Q16 3Q16 4Q16
$1.9 $1.8 $1.7 $1.7 $1.7 $1.6 $1.6 $1.6 $1.6
2.2% 2.2% 2.0% 2.0% 1.8% 1.7% 1.7% 1.8% 1.9%
2.6% 2.6% 2.5% 2.6% 2.7% 2.7% 2.8%
2.9% 3.1%
4Q14 1Q15 2Q15 3Q15 4Q15 1Q16 2Q16 3Q16 4Q16
$8.3
$9.5
$10.1 $9.7 $10.0 $10.1 $9.4
$8.4
$7.9
0.0% 0.0% 0.0% 0.1%
0.2
0.6% 0.7% 0.8%
0.00 0 0 0 0 0 0 0
0.3%
0.3% 0.3% 0.3
0.4%
4Q14 1Q15 2Q15 3Q 5 4Q15 1Q16 2Q16 3Q16 4Q16
$6.4
$ .8 $6.7 $6.8
$7.1 $7.4
$7.6 $7.6 $7.6
0.3%
0.3% 0.3% 0.3% 0.4%
1.9% 1.6
1.2% 1.3%
0.4%
0.3% 0.2% 0.2% 0.2% 0.2% 0.2% 0.2% 0.1%
4Q14 1Q15 2Q 5 3Q15 4Q15 1Q16 2Q 6 3Q16 4Q16

31
Santander Real Estate Capital Commercial Real Estate1
Home Equity Mortgages
Outstandings NPL* to Total Loans Net Charge-Offs**
SBNA: Asset Quality
*NPL = Nonaccruing loans plus accruing loans 90+ DPD
**NCO = Rolling 12-month average for that quarter and the prior 3 quarters
1Commercial Real Estate is comprised of the commercial real estate, continuing care retirement communities and
non-owner occupied real estate secured commercial loans (SREC segment included in separate graph).
US $ Billions
$5.6 $5.8 $5.9 $5.8 $6.0
$6.6 $6.6 $6.5 $6.5
2.2% 1.9%
1.3% 1.3% 1.3% 1.7% 1.6% 1.2% 1.2%
0.5% 0.2% 0.4% 0.1% 0.2% 0.2% 0.0% -0.1% 0.0%
4Q14 1Q15 2Q15 3Q15 4Q15 1Q16 2Q16 3Q16 4Q16
$10.0 $9.7 $9.7
$10.7 $10.5 $10.3 $10.1 $9.8 $9.3
0.1% 0.1% 0.1% 0.1% 0.1% 0.1% 0.1% 0.1% 0.1%
0.0% 0.0% 0.0% 0.0% 0.0% 0.0% 0.0% 0.0% 0.0%
4Q14 Q15 2Q15 3Q 5 4Q15 1Q16 2Q16 3Q16 4Q16
$7.0 $7.0 $6.8 $6.7 $6.5 $6.4 $6.6 $6.7
$7.0
3.3% 3.0% 2.9% 2.8% 2.7% 2.6% 2.4% 2.2% 2.3%
1.2% 1.3% 1.3%
0.3% 0.2% 0.2% 0.2% 0.1% 0.1%
4Q14 1Q15 2Q15 3Q15 4Q15 1Q16 2Q16 3Q16 4Q16
$6.0 $6.0 $6.0 $6.0 $6.0 $5.9 $5.9 $5.9 $5.9
1.9% 1. % 1.8% 1.7% 1.8% 1.8% 1.7% 1.7% 1.7%
0.4% 0.3% 0.3% 0.3% 0.3% 0.3% 0.3% 0.3% 0.2%
4Q14 Q15 2Q15 3Q 5 4Q15 Q16 2Q16 3Q 6 4Q 6

32
2
2
SBNA: Capital Ratios
1Fully phased-in under the standardized approach - see SHUSA 2016 Form 10-K.
Under fully phased-in US Basel III rule1, CET1 ratio as of 4Q16 was 15.8%
13.8% 13.9%
14.9%
15.7% 16.2%
4Q15 1Q16 2Q16 3Q16 4Q16
13.8% 13.9%
14.9% 15.7%
16.2%
4Q15 1Q16 2Q16 3Q16 4Q16
11.5% 11.3% 11.4%
12.3% 12.3%
4Q15 1Q16 2Q16 3Q16 4Q16
15.1% 15.4%
16.2%
17.0% 17.4%
4Q15 1Q16 2Q16 3Q16 4Q16
Common Equity Tier 1 Tier 1 Leverage Ratio
Tier 1 Risk-Based Capital Ratio Total Risk-Based Capital Ratio

33
2
2
1
SBNA: Non-GAAP to GAAP Reconciliations1
1Basel III ratios on a transition basis under the standardized approach starting in 2Q15.
$ Millions 4Q15 1Q16 2Q16 3Q16 4Q16
Tier 1 Common to Risk-Weighted Assets
Tier 1 Common Capital 9,858$ 9,813$ 9,876$ 10,025$ 10,006$
Risk-Weighted Assets 71,395 70,512 66,357 64,015 61,886
Ratio 13.8% 13.9% 14.9% 15.7% 16.2%
Tier 1 Leverage
Tier 1 Capital 9,858$ 9,813$ 9,876$ 10,025$ 10,006$
86,028 87,066 86,358 81,815 81,076
Ratio 11.5% 11.3% 11.4% 12.3% 12.3%
Tier 1 Risk-Based
Tier 1 Capital 9,858$ 9,813$ 9,876$ 10,025$ 10,006$
Risk-Weighted Assets 71,395 70,512 66,357 64,015 61,886
Ratio 13.8% 13.9% 14.9% 15.7% 16.2%
Total Risk-Based
Risk-Based Capital 10,776$ 10,827$ 10,771$ 10,874$ 10,759$
Risk-Weighted Assets 71,395 70,512 66,357 64,015 61,886
Ratio 15.1% 15.4% 16.2% 17.0% 17.4%
Average total assets for leverage capital purposes

34 SBNA: Non-GAAP to GAAP Reconciliations (cont.)
$ Millions 4Q15 1Q16 2Q16 3Q16 4Q16
Santander Bank Texas Ratio
Total Equity 13,326$ 13,456$ 13,576$ 13,610$ 13,418$
Less:
Goodwill and other intangibles (excluding MSRs) (3,732) (3,723) (3,716) (3,681) (3,664)
Preferred stock - - - - -
Add: Allowance for loan losses 572 643 640 616 533
Total Equity and Loss Allowances for Texas Ratio 10,166$ 10,376$ 10,500$ 10,545$ 10,287$
Nonperforming Assets 550$ 747$ 748$ 648$ 618$
90+ DPD accruing 2 2 2 3 3
Accruing TDRs 323 364 364 356 353
Total Nonperforming Assets 875$ 1,113$ 1,114$ 1,007$ 974$
Texas Ratio 8.6% 10.7% 10.6% 9.5% 9.5%

35
2
2
SBNA: Non-GAAP to GAAP Reconciliations (cont.)
$ Millions 4Q15 1Q16 2Q16 3Q16 4Q16
Santander Bank Pre-Tax Pre-Provision Income
Pre-tax income, as reported 11$ (20)$ 104$ 126$ 23$
Add back:
Provision for credit losses 70 120 - (12) 24
Pre-Tax Pre-Provision Income 81$ 100$ 104$ 114$ 47$

