Attached files
| file | filename |
|---|---|
| 8-K - CHINA FUND INC | fp0024714_8k.htm |

Data as of 2/28/17
Manager’s Commentary
Market Review
Carrying on the strong momentum in early 2017, Greater China equities continued to strengthen in February. This was partly helped by better-than-expected macroeconomic data. The official manufacturing Purchasing Managers' Index ("PMI") in China increased to 51.6 in February, signalling that government fiscal spending has been stabilizing overall economic growth. Fund flows have been supportive to the equity market as well. As mainland investors continued to look for undervalued, high yield investment targets which offer US dollar ("USD") exposure, the Hong Kong equity market welcomed significant southbound flows through the stock connect schemes. Banks, insurance companies and select consumer discretionary names, which have been the key targets of such flows, enjoyed a strong rally in February.
Overall, cyclical sectors outperformed in February. In particular, the financials and materials sectors led the rally, fueled by improving profitability of upstream manufacturers and signs of asset quality stabilization. On the contrary, telecommunication stocks remained under pressure as investors continued to focus on global reflationary trades. Concerns over potential earnings disappointments in upcoming earnings releases, as well as worries about price competition, undermined performance of the telecommunications sector.
Fund Review
The China Fund, Inc. (the "Fund") underperformed the benchmark in February, largely driven by stock selection especially within the information technology sector. Semiconductor Manufacturing International Corporation, a Chinese semiconductor foundry, was hurt by higher than expected capital expenditures, which may drag down earnings in the near term. However, capacity expansion is necessary to help build up the company's capability to service more clients and expand to take market share from other second tier players. We believe this company is well positioned for the continuous manufacturing upgrade in China and we will continue to hold this stock.
Positive performance contributions mainly came from the real estate and healthcare sectors. The top contributor in February was Sun Hung Kai Properties, Ltd., a leading residential property developer and landlord in Hong Kong. The company's strong project pipeline and healthy balance sheet continued to underpin share price re-rating. Sustainable dividend yield backed by recurring rental income is also valued by investors, especially in the current market sentiment.
Key Transactions
There were no major transactions during the month.
Outlook
After a strong start of the year in the Greater China equity space, we continued to maintain our cautiously optimistic view, for two main reasons. First, Greater China equity markets remain some of the most under owned markets by global investors. As economic gloom in China starts to lift, it is likely to encourage a greater allocation back to this asset class. Second, corporate earnings are improving and balance sheets are healthier. While the current improvement is still concentrated in upstream industries, we expect this will spread along the value chain and become more broad-based. However, this will vary depending on each downstream sector's supply/demand dynamics. That said, improved profitability, particularly for those over-capacity sectors, should help alleviate concerns over non-performing loans within the Chinese banking sector.
In terms of portfolio strategy and positioning, we see opportunities related to infrastructure spending and manufacturing upgrade, which should continue to benefit from expansionary fiscal policies to support economic growth. Within our portfolio, we invest in areas such as semiconductor manufacturing and construction contractors. Another area of focus is domestic-based structural growth opportunities, which we believe are more immune from rising global protectionism. The ongoing development of the services sector in China will present a range of investment opportunities in areas such as e-commerce, consumption upgrade, telecommunication services and transportation.
|
In Brief
|
|
|
Fund Data
|
|
|
Description
|
Seeks to achieve long-term capital appreciation through investments in China companies.
|
|
Listing Date (NYSE)
|
July 10, 1992
|
|
Total Fund Assets (millions)
|
$296.7
|
|
Median Market Cap (in billions)
|
$12.2
|
|
Distribution Frequency
|
Annual
|
|
Management Firm
|
Allianz Global Investors U.S. LLC
|
|
Portfolio Management
|
Christina Chung, CFA, CMA Lead Portfolio Manager
|
|
Performance (US$ Returns)
(as of 2/28/17)
|
||
|
Fund
|
Benchmark1
|
|
|
One Month
|
2.22%
|
3.50%
|
|
Three Month
|
5.02%
|
5.96%
|
|
One Year
|
24.94%
|
29.89%
|
|
Three Year
|
4.02%
|
6.37%
|
|
Net Asset Value / Market Price
|
|
|
Net Asset Value (NAV) / Market Price at Inception
|
$13.15 / $14.26
|
|
NAV / Market Price (as of 2/28/17)
|
$18.87 / $16.15
|
|
High / Low Ranges (52-Week)
|
|
|
High / Low NAV
|
$19.37 / $15.50
|
|
High / Low Market Price
|
$16.79 / $13.46
|
|
Premium/Discount to NAV (as of 2/28/17)
|
-14.41%
|
|
Fund Data (Common Shares)
|
|
|
Shares Outstanding
|
15,722,675
|
|
Average Daily Volume
|
26,754
|
|
Expense Ratio
|
1.53%
|
Fund Manager

Christina Chung, CFA, CMA
Lead Portfolio Manager

The China Fund, Inc.
Investment Objective
The investment objective of the Fund is to achieve long-term capital appreciation. The Fund seeks to achieve its objective through investment in the equity securities of companies and other entities with significant assets, investments, production activities, trading or other business interests in China or which derive a significant part of their revenue from China.
The Fund has an operating policy that the Fund will invest at least 80% of its assets in China companies. For this purpose, 'China companies' are (i) companies for which the principal securities trading market is in China; (ii) companies for which the principal securities trading market is outside of China or in companies organized outside of China, that in both cases derive at least 50% of their revenues from goods or services sold or produced, or have at least 50% of their assets in China; or (iii) companies organized in China. Under the policy, China means the People's Republic of China, including Hong Kong, and Taiwan. The Fund will provide its stockholders with at least 60 days' prior notice of any change to this policy.
Returns For Periods Ended February 28, 2017*
|
1 Month
|
3 Month
|
YTD
|
1 Year
|
3 Year
|
5 Year
|
10 Year
|
Inception
|
|
|
NAV
|
2.22%
|
5.02%
|
8.39%
|
24.94%
|
4.02%
|
5.86%
|
8.12%
|
10.07%
|
|
Market Price
|
2.60%
|
3.91%
|
7.31%
|
23.14%
|
3.05%
|
4.83%
|
7.54%
|
9.02%
|
|
MSCI Golden Dragon Index
|
3.50%
|
5.96%
|
10.25%
|
29.89%
|
6.37%
|
5.47%
|
5.53%
|
—
|
Calendar Year Returns
|
2009
|
2010
|
2011
|
2012
|
2013
|
2014
|
2015
|
2016
|
|
|
NAV
|
72.83%
|
27.26%
|
-24.37%
|
12.12%
|
18.31%
|
7.82%
|
-5.51%
|
0.60%
|
|
Market Price
|
72.19%
|
23.60%
|
-27.51%
|
20.52%
|
12.70%
|
5.29%
|
-6.38%
|
-0.47%
|
|
MSCI Golden Dragon Index
|
67.12%
|
13.60%
|
-18.35%
|
22.65%
|
7.25%
|
8.06%
|
-7.12%
|
5.75%
|
Past performance is not a guide to future returns.
|
*
|
Annualized for periods greater than one year.
|
Source: State Street Bank and Trust Company. Source for index data: MSCI as at February 28, 2017. Investment returns are historical and do not guarantee future results. Investment returns reflect changes in net asset value and market price per share during each period and assumes that dividends and capital gains distributions, if any, were reinvested. The net asset value (NAV) percentages are not an indication of the performance of a shareholder's investment in the Fund, which is based on market price. NAV performance includes the deduction of management fees and other expenses. Market price performance does not include the deduction of brokerage commissions and other expenses of trading shares and would be lower had such commissions and expenses been deducted. It is not possible to invest directly in an index.
Premium/Discount
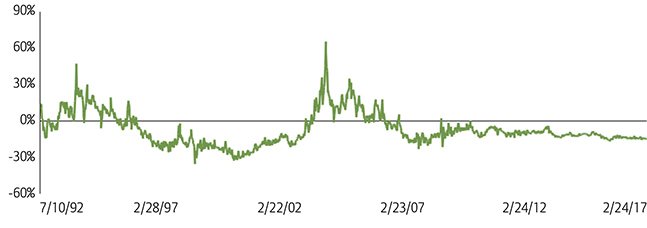
|
Sector Allocation
|
||
|
Fund
|
Benchmark1
|
|
|
Information Technology
|
38.85%
|
32.67%
|
|
Financials
|
19.71%
|
25.26%
|
|
Industrials
|
11.33%
|
6.63%
|
|
Telecom Services
|
9.25%
|
5.34%
|
|
Real Estate
|
7.76%
|
7.92%
|
|
Consumer Discretionary
|
5.87%
|
8.15%
|
|
Energy
|
2.42%
|
3.53%
|
|
Utilities
|
1.09%
|
3.87%
|
|
Health Care
|
0.97%
|
1.21%
|
|
Consumer Staples
|
0.65%
|
2.19%
|
|
Materials
|
0.29%
|
3.21%
|
|
Other assets & liabilities
|
1.81%
|
0.00%
|
Source: IDS GmbH - Analysis and Reporting Services, a subsidiary of Allianz SE.
|
Country Allocation
|
||
|
Fund
|
Benchmark1
|
|
|
China
|
71.92%
|
75.16%
|
|
Hong Kong Red Chips
|
28.66%
|
9.38%
|
|
Hong Kong 'H' shares
|
17.21%
|
21.16%
|
|
Equity linked securities ('A' shares)
|
0.94%
|
0.00%
|
|
China 'A' & 'B' shares
|
0.00%
|
0.12%
|
|
Other Hong Kong securities
|
25.11%
|
30.56%
|
|
Others
|
0.00%
|
13.94%
|
|
Taiwan
|
26.30%
|
24.84%
|
|
Other assets & liabilities
|
1.78%
|
0.00%
|
|
Top 10 Holdings
|
|
|
TAIWAN SEMIC CO LTD (Taiwan)
|
9.25%
|
|
TENCENT HOLDINGS LTD (China)
|
6.84%
|
|
SUN HUNG KAI PROPERTIES LTD (H.K.)
|
6.08%
|
|
CHINA MERCHANTS BANK CO LTD (China)
|
4.89%
|
|
ALIBABA GROUP HOLDING LTD (China)
|
4.48%
|
|
HK EXCHANGES & CLEARING LTD (H.K.)
|
3.51%
|
|
PING AN INSURANCE (China)
|
3.43%
|
|
QINGLING MOTORS CO LTD (China)
|
3.32%
|
|
CHINA UNICOM HONG KONG LTD (China)
|
3.06%
|
|
CHINA CONSTRUCTION BANK CORP (China)
|
3.00%
|
|
Portfolio Characteristics
|
||
|
Fund
|
Benchmark1
|
|
|
P/E Ratio
|
14.65
|
13.90
|
|
P/B Ratio
|
1.58
|
1.45
|
|
Issues in Portfolio
|
43
|
284
|
|
Foreign Holdings (%)
|
98.19
|
100.00
|
|
Other assets & liabilities (%)
|
1.81
|
0.00
|
|
Yield (%)
|
2.79
|
2.67
|
Source: IDS GmbH - Analysis and Reporting Services, a subsidiary of Allianz SE.
The China Fund, Inc.
Distribution History (10 Year)
|
Declaration
Date |
Ex-dividend
Date |
Record Date
|
Payable Date
|
Distribution/
Share |
Income
|
Long-term
Capital Gain |
Short-term
Capital Gain |
|
12/7/07
|
12/19/07
|
12/21/07
|
1/25/08
|
$12.12000
|
$0.28000
|
$9.00000
|
$2.84000
|
|
12/8/08
|
12/22/08
|
12/24/08
|
1/23/09
|
$5.81740
|
$0.48130
|
$5.33610
|
—
|
|
12/9/09
|
12/22/09
|
12/24/09
|
12/29/09
|
$0.25570
|
$0.25570
|
—
|
—
|
|
12/8/10
|
12/21/10
|
12/24/10
|
12/29/10
|
$2.27420
|
$0.37460
|
$1.89960
|
—
|
|
12/8/11
|
12/21/11
|
12/23/11
|
12/29/11
|
$2.99640
|
$0.17420
|
$2.82220
|
—
|
|
12/10/12
|
12/20/12
|
12/24/12
|
12/28/12
|
$3.25170
|
$0.34730
|
$2.90440
|
—
|
|
12/13/13
|
12/19/13
|
12/23/13
|
12/27/13
|
$3.31400
|
$0.43870
|
$2.87530
|
—
|
|
12/8/14
|
12/18/14
|
12/22/14
|
1/5/15
|
$3.76510
|
$0.29820
|
$3.46690
|
—
|
|
12/16/15
|
12/23/15
|
12/28/15
|
1/6/16
|
$1.49580
|
$0.21330
|
$0.84620
|
$0.43630
|
|
12/9/16
|
12/19/16
|
12/21/16
|
1/5/17
|
$0.46780
|
$0.46780
|
—
|
—
|
Distribution/Share includes Income, Long-term Capital gains and Short-term Capital gains.
The China Fund NAV Performance of $10,000 since inception
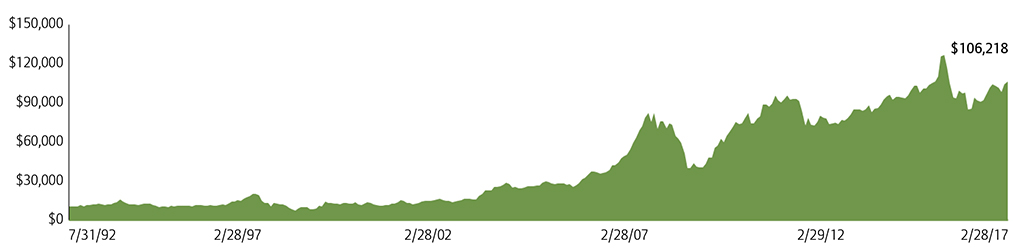
Past performance is not a guide to future returns.
Index Description
MSCI Golden Dragon Index
The MSCI Golden Dragon Index captures the equity market performance of large and mid cap China securities (H shares, B shares, Red-Chips and P-Chips) and non-domestic China securities listed in Hong Kong and Taiwan.
It is not possible to invest directly in an index.
The China Fund, Inc.
Portfolio in Full
|
Sector
|
Company
(exchange ticker) |
Market Price
|
Holding
|
Value US$
|
% of
net assets |
|
Information Technology
|
38.84
|
||||
|
TAIWAN SEMICONDUCTOR MANUFACTURING CO LTD
|
2330
|
189.00
|
4,461,000
|
27,442,479
|
9.25
|
|
TENCENT HOLDINGS LTD
|
700
|
207.00
|
760,900
|
20,290,013
|
6.84
|
|
ALIBABA GROUP HOLDING LTD
|
BABA
|
102.90
|
129,217
|
13,296,429
|
4.48
|
|
DELTA ELECTRONICS INC
|
2308
|
171.00
|
1,548,359
|
8,617,813
|
2.90
|
|
LARGAN PRECISION CO LTD
|
3008
|
4,560.00
|
54,000
|
8,014,712
|
2.70
|
|
HON HAI PRECISION INDUSTRY CO LTD
|
2317
|
89.50
|
2,537,100
|
7,390,774
|
2.49
|
|
ADVANTECH CO LTD
|
2395
|
261.50
|
798,841
|
6,799,255
|
2.29
|
|
SEMICONDUCTOR MANUFACTURING INTERNATIONAL CORP
|
981
|
10.10
|
5,109,400
|
6,647,765
|
2.24
|
|
DIGITAL CHINA HOLDINGS LTD
|
861
|
6.93
|
7,444,000
|
6,645,444
|
2.24
|
|
BAIDU INC
|
BIDU
|
174.13
|
32,722
|
5,697,882
|
1.92
|
|
PRIMAX ELECTRONICS LTD
|
4915
|
47.00
|
1,985,000
|
3,036,601
|
1.02
|
|
GOLDPAC GROUP LTD
|
3315
|
2.17
|
5,021,000
|
1,403,571
|
0.47
|
|
Financials
|
19.70
|
||||
|
CHINA MERCHANTS BANK CO LTD
|
3968
|
20.65
|
5,450,500
|
14,499,092
|
4.89
|
|
HONG KONG EXCHANGES & CLEARING LTD
|
388
|
192.70
|
419,700
|
10,418,497
|
3.51
|
|
PING AN INSURANCE GROUP CO OF CHINA LTD
|
2318
|
41.40
|
1,911,000
|
10,191,672
|
3.43
|
|
CHINA CONSTRUCTION BANK CORP
|
939
|
6.39
|
10,814,000
|
8,901,673
|
3.00
|
|
FUBON FINANCIAL HOLDING CO LTD
|
2881
|
49.75
|
3,758,000
|
6,085,260
|
2.05
|
|
CATHAY FINANCIAL HOLDING CO LTD
|
2882
|
48.25
|
2,880,000
|
4,522,922
|
1.52
|
|
CITIC SECURITIES CO LTD
|
6030
|
16.60
|
1,810,000
|
3,870,536
|
1.30
|
|
Industrials
|
11.32
|
||||
|
CHINA EVERBRIGHT INTERNATIONAL LTD
|
257
|
10.06
|
5,729,000
|
7,424,397
|
2.50
|
|
CN STATE CONSTRUCTION INTERNATIONAL HOLDINGS LTD
|
3311
|
12.70
|
3,046,000
|
4,983,311
|
1.68
|
|
CK HUTCHISON HOLDINGS LTD
|
1
|
95.90
|
310,000
|
3,829,700
|
1.29
|
|
QINGDAO PORT INTERNATIONAL CO LTD
|
6198
|
4.79
|
6,077,000
|
3,749,809
|
1.26
|
|
BEIJING ENTERPRISES HOLDINGS LTD
|
392
|
40.60
|
704,500
|
3,684,609
|
1.24
|
|
ZHUZHOU CRRC TIMES ELECTRIC CO LTD
|
3898
|
41.80
|
647,500
|
3,486,587
|
1.17
|
|
KING SLIDE WORKS CO LTD
|
2059
|
424.00
|
239,000
|
3,298,322
|
1.11
|
|
JARDINE MATHESON HOLDINGS LTD
|
J36
|
62.18
|
51,100
|
3,177,398
|
1.07
|
|
Telecom Services
|
9.25
|
||||
|
CHINA UNICOM HONG KONG LTD
|
762
|
9.44
|
7,466,000
|
9,079,133
|
3.06
|
|
CHINA MOBILE LTD
|
941
|
85.60
|
709,000
|
7,818,157
|
2.63
|
|
PCCW LTD
|
8
|
4.73
|
8,623,000
|
5,254,168
|
1.77
|
|
CHUNGHWA TELECOM CO LTD
|
2412
|
102.00
|
846,000
|
2,808,664
|
0.95
|
|
HUTCHISON TELECOMMUNICATIONS HK HOLDINGS LTD
|
215
|
2.43
|
7,974,000
|
2,496,128
|
0.84
|
|
Real Estate
|
7.76
|
||||
|
SUN HUNG KAI PROPERTIES LTD
|
16
|
113.50
|
1,234,000
|
18,042,446
|
6.08
|
|
CHINA OVERSEAS LAND & INVESTMENT LTD
|
688
|
23.90
|
1,616,000
|
4,975,350
|
1.68
|
|
Consumer Discretionary
|
5.87
|
||||
|
QINGLING MOTORS CO LTD
|
1122
|
2.64
|
28,960,000
|
9,848,881
|
3.32
|
|
SANDS CHINA LTD
|
1928
|
32.40
|
810,800
|
3,384,100
|
1.14
|
|
CITIGROUP GLOBAL MARKETS HOLD (exch. for CHINA CYTS TOURS HOLDIN)
|
N/A
|
3.14
|
888,827
|
2,790,917
|
0.94
|
|
LI & FUNG LTD
|
494
|
3.46
|
3,128,000
|
1,394,207
|
0.47
|
|
Energy
|
2.42
|
||||
|
CNOOC LTD
|
883
|
9.18
|
6,077,000
|
7,186,482
|
2.42
|
|
Utilities
|
1.09
|
||||
|
CHINA RESOURCES POWER HOLDINGS CO LTD
|
836
|
14.06
|
1,778,000
|
3,220,338
|
1.09
|
|
Health Care
|
0.97
|
||||
|
CSPC PHARMACEUTICAL GROUP LTD
|
1093
|
9.50
|
2,364,000
|
2,893,047
|
0.97
|
|
Consumer Staples
|
0.65
|
||||
|
VINDA INTERNATIONAL HOLDINGS LTD
|
3331
|
15.20
|
984,000
|
1,926,740
|
0.65
|
The China Fund, Inc.
Portfolio in Full
|
Sector
|
Company
(exchange ticker) |
Market Price
|
Holding
|
Value US$
|
% of
net assets |
|
Materials
|
0.29
|
||||
|
TIANGONG INTERNATIONAL CO LTD
|
826
|
0.93
|
7,246,000
|
868,092
|
0.29
|
Source: State Street Bank and Trust Company, IDS GmbH - Analysis and Reporting Services, a subsidiary of Allianz SE.
Important Information:
Holdings are subject to change daily. The Fund seeks to achieve its objective through investment in the equity securities of companies and other entities with significant assets, investments, production activities, trading or other business interests in China or which derive a significant part of their revenue from China. Investing in non-U.S. securities entails additional risks, including political and economic risk and the risk of currency fluctuations, as well as lower liquidity. These risks, which can result in greater price volatility, will generally be enhanced in less diversified funds that concentrate investments in a particular geographic region.
The information contained herein has been obtained from sources believed to be reliable but Allianz Global Investors U.S. LLC and its affiliates do not warrant the information to be accurate, complete or reliable. The opinions expressed herein are subject to change at any time and without notice. Past performance is not indicative of future results. This material is not intended as an offer or solicitation for the purchase or sale of any financial instrument. Investors should consider the investment objectives, risks, charges and expenses of any mutual fund carefully before investing. This and other information is contained in the Fund's annual and semiannual reports, proxy statement and other Fund information, which may be obtained by contacting your financial advisor or visiting the Fund's website at www.chinafundinc.com. This information is unaudited and is intended for informational purposes only. It is presented only to provide information on the Fund's holdings, performance and strategies. The Fund is a closed-end exchange traded management investment company. This material is presented only to provide information and is not intended for trading purposes. Closed-end funds, unlike open-end funds, are not continuously offered. After the initial public offering by a closed-end fund, its shares can be purchased and sold on the open market through a stock exchange, where shares may trade at a premium or a discount. The market price of holdings is subject to change daily.
P/E is a ratio of security price to earnings per share. Typically, an undervalued security is characterized by a low P/E ratio, while an overvalued security is characterized by a high P/E ratio. P/B is a ratio of the current stock price to the book value. This is used to identify undervalued stocks. Dividend yield is the annual percentage of return earned by an investor on a common or preferred stock. The average dividend yield is the dividend rate divided by current share price.
©2017 Allianz Global Investors Distributors LLC.
|
Investment Products: Not FDIC Insured | May Lose Value | Not Bank Guaranteed
|
FS-CHN-0217
|