Attached files
| file | filename |
|---|---|
| 8-K - DIME COMMUNITY BANCSHARES, INC. 8-K 3-16-2017 - DIME COMMUNITY BANCSHARES INC | form8k.htm |
Exhibit 99.1

Investor PresentationMarch 2017 DIME COMMUNITY BANCSHARES, INC(NASDAQ: DCOM)
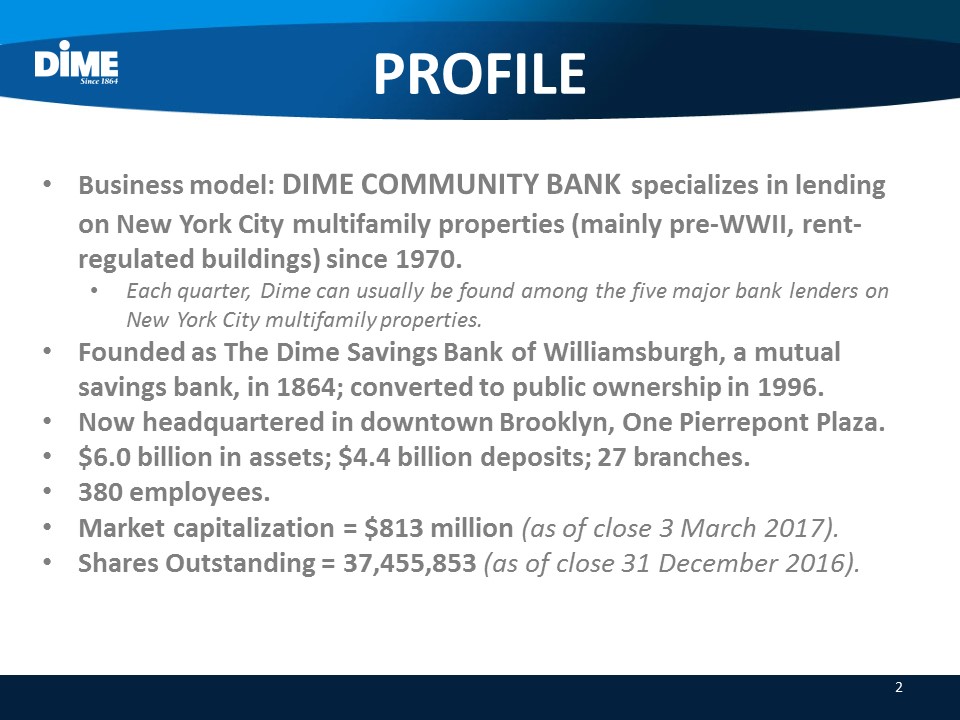
PROFILE 2 Business model: DIME COMMUNITY BANK specializes in lending on New York City multifamily properties (mainly pre-WWII, rent-regulated buildings) since 1970.Each quarter, Dime can usually be found among the five major bank lenders on New York City multifamily properties.Founded as The Dime Savings Bank of Williamsburgh, a mutual savings bank, in 1864; converted to public ownership in 1996.Now headquartered in downtown Brooklyn, One Pierrepont Plaza.$6.0 billion in assets; $4.4 billion deposits; 27 branches.380 employees.Market capitalization = $813 million (as of close 3 March 2017).Shares Outstanding = 37,455,853 (as of close 31 December 2016).
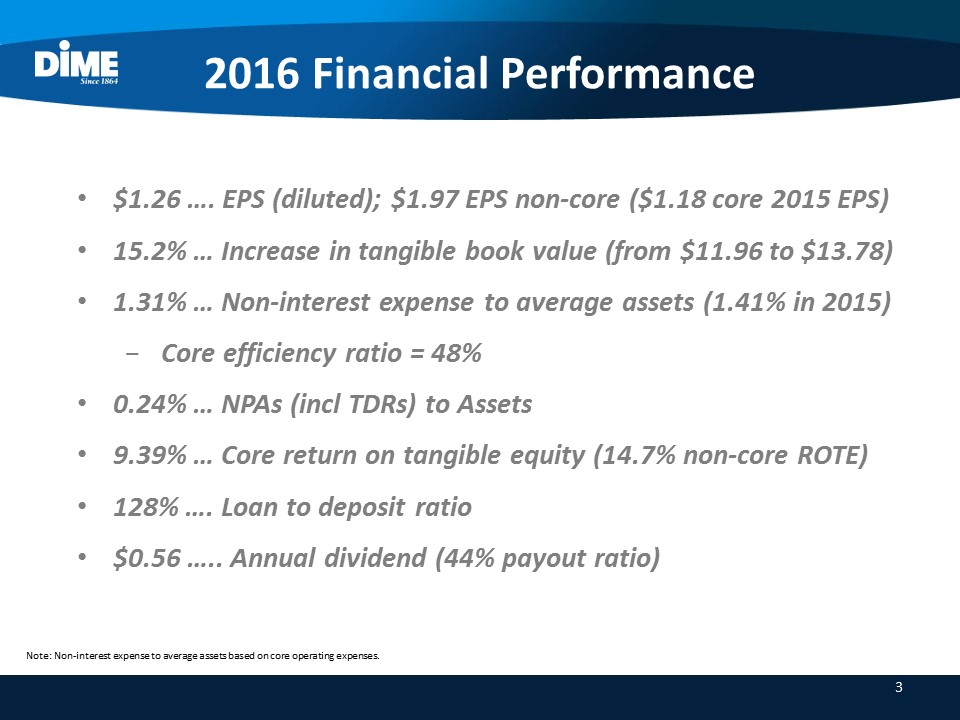
2016 Financial Performance 3 $1.26 …. EPS (diluted); $1.97 EPS non-core ($1.18 core 2015 EPS)15.2% … Increase in tangible book value (from $11.96 to $13.78)1.31% … Non-interest expense to average assets (1.41% in 2015)Core efficiency ratio = 48% 0.24% … NPAs (incl TDRs) to Assets 9.39% … Core return on tangible equity (14.7% non-core ROTE)128% …. Loan to deposit ratio$0.56 ….. Annual dividend (44% payout ratio) Note: Non-interest expense to average assets based on core operating expenses.
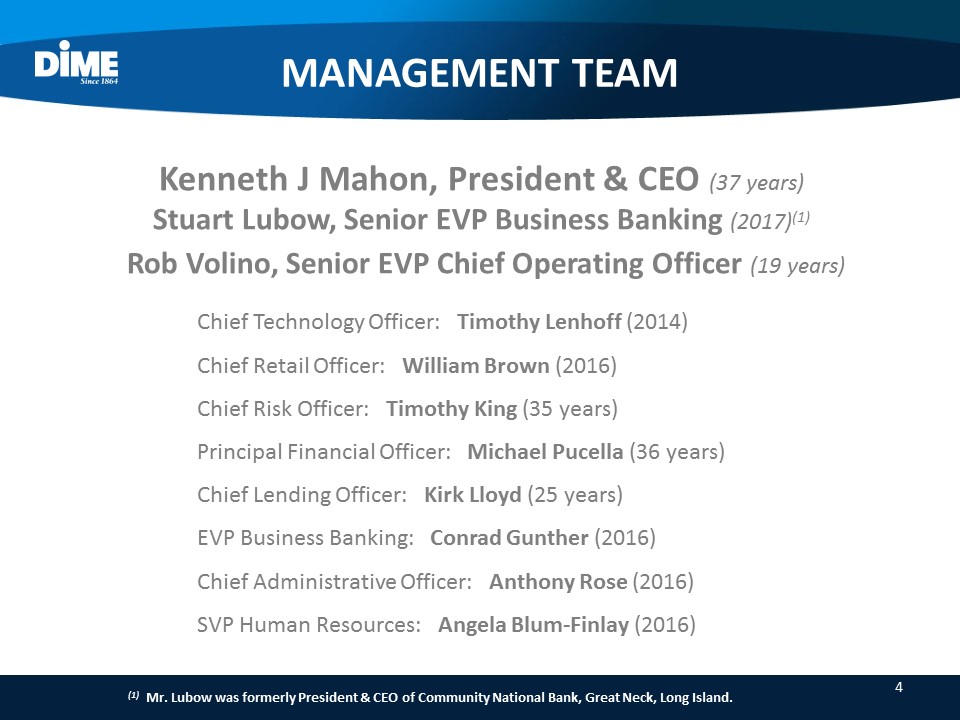
MANAGEMENT TEAM 4 Kenneth J Mahon, President & CEO (37 years)Stuart Lubow, Senior EVP Business Banking (2017)(1) Rob Volino, Senior EVP Chief Operating Officer (19 years)Chief Technology Officer: Timothy Lenhoff (2014) Chief Retail Officer: William Brown (2016)Chief Risk Officer: Timothy King (35 years)Principal Financial Officer: Michael Pucella (36 years)Chief Lending Officer: Kirk Lloyd (25 years)EVP Business Banking: Conrad Gunther (2016) Chief Administrative Officer: Anthony Rose (2016)SVP Human Resources: Angela Blum-Finlay (2016) (1) Mr. Lubow was formerly President & CEO of Community National Bank, Great Neck, Long Island.
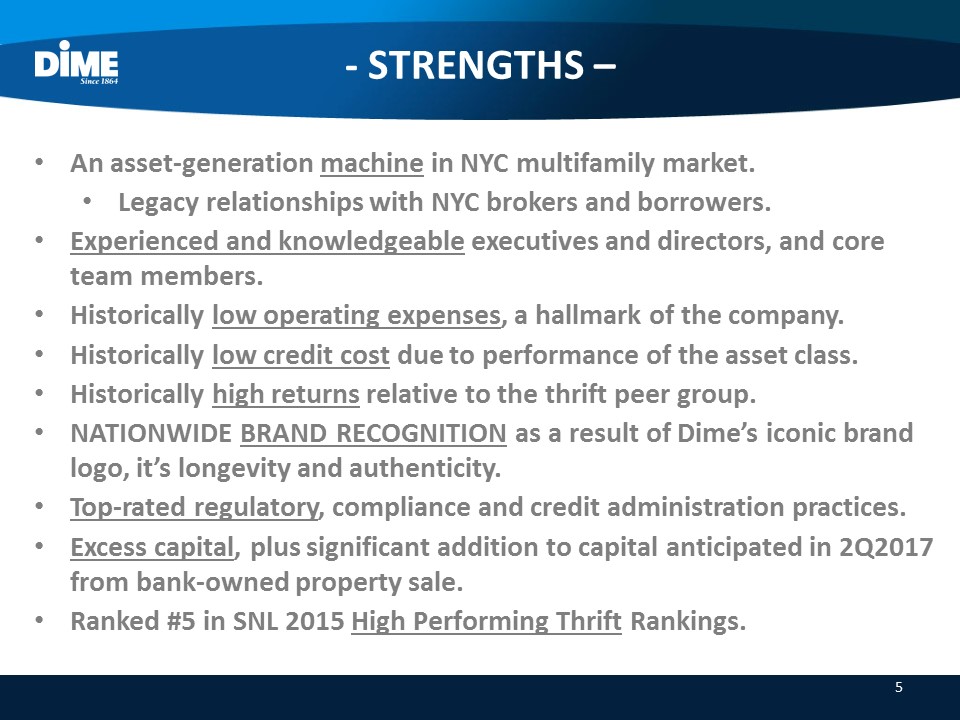
- STRENGTHS – 5 An asset-generation machine in NYC multifamily market.Legacy relationships with NYC brokers and borrowers.Experienced and knowledgeable executives and directors, and core team members.Historically low operating expenses, a hallmark of the company.Historically low credit cost due to performance of the asset class.Historically high returns relative to the thrift peer group.NATIONWIDE BRAND RECOGNITION as a result of Dime’s iconic brand logo, it’s longevity and authenticity.Top-rated regulatory, compliance and credit administration practices.Excess capital, plus significant addition to capital anticipated in 2Q2017 from bank-owned property sale.Ranked #5 in SNL 2015 High Performing Thrift Rankings.
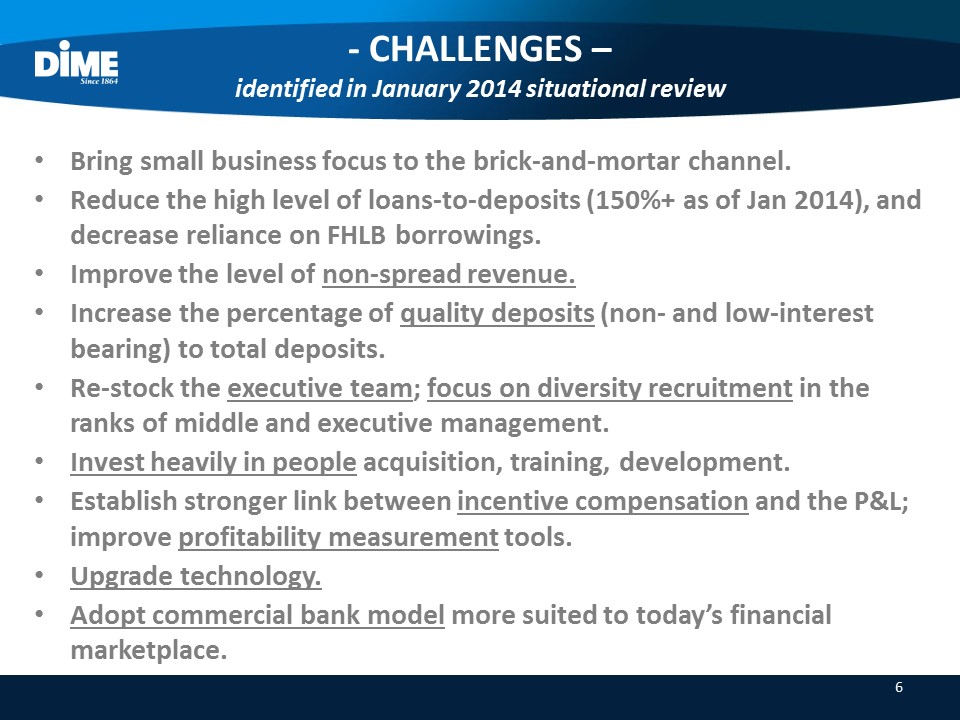
- CHALLENGES –identified in January 2014 situational review 6 Bring small business focus to the brick-and-mortar channel.Reduce the high level of loans-to-deposits (150%+ as of Jan 2014), and decrease reliance on FHLB borrowings.Improve the level of non-spread revenue.Increase the percentage of quality deposits (non- and low-interest bearing) to total deposits.Re-stock the executive team; focus on diversity recruitment in the ranks of middle and executive management.Invest heavily in people acquisition, training, development.Establish stronger link between incentive compensation and the P&L; improve profitability measurement tools.Upgrade technology.Adopt commercial bank model more suited to today’s financial marketplace.
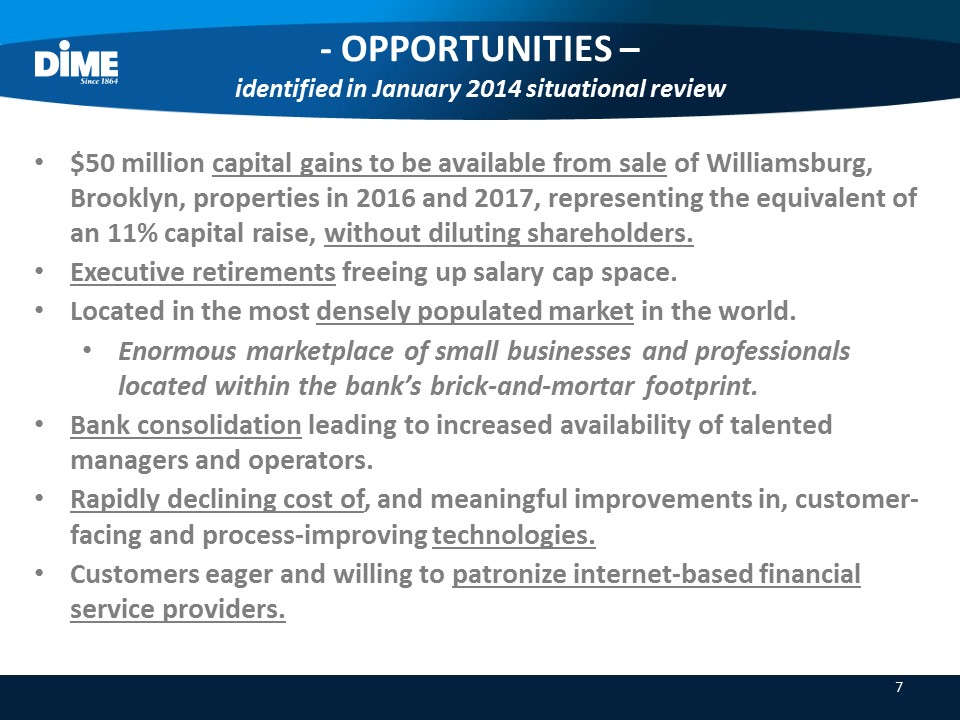
- OPPORTUNITIES – identified in January 2014 situational review 7 $50 million capital gains to be available from sale of Williamsburg, Brooklyn, properties in 2016 and 2017, representing the equivalent of an 11% capital raise, without diluting shareholders.Executive retirements freeing up salary cap space.Located in the most densely populated market in the world.Enormous marketplace of small businesses and professionals located within the bank’s brick-and-mortar footprint.Bank consolidation leading to increased availability of talented managers and operators.Rapidly declining cost of, and meaningful improvements in, customer-facing and process-improving technologies.Customers eager and willing to patronize internet-based financial service providers.
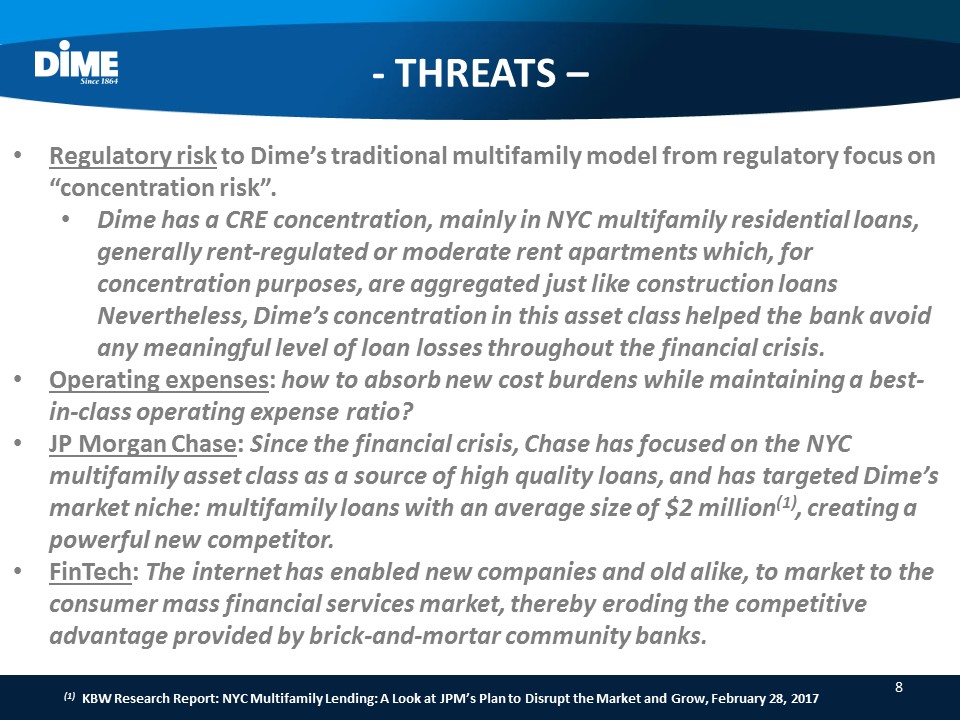
- THREATS – 8 Regulatory risk to Dime’s traditional multifamily model from regulatory focus on “concentration risk”.Dime has a CRE concentration, mainly in NYC multifamily residential loans, generally rent-regulated or moderate rent apartments which, for concentration purposes, are aggregated just like construction loans Nevertheless, Dime’s concentration in this asset class helped the bank avoid any meaningful level of loan losses throughout the financial crisis.Operating expenses: how to absorb new cost burdens while maintaining a best-in-class operating expense ratio?JP Morgan Chase: Since the financial crisis, Chase has focused on the NYC multifamily asset class as a source of high quality loans, and has targeted Dime’s market niche: multifamily loans with an average size of $2 million(1), creating a powerful new competitor.FinTech: The internet has enabled new companies and old alike, to market to the consumer mass financial services market, thereby eroding the competitive advantage provided by brick-and-mortar community banks. (1) KBW Research Report: NYC Multifamily Lending: A Look at JPM’s Plan to Disrupt the Market and Grow, February 28, 2017
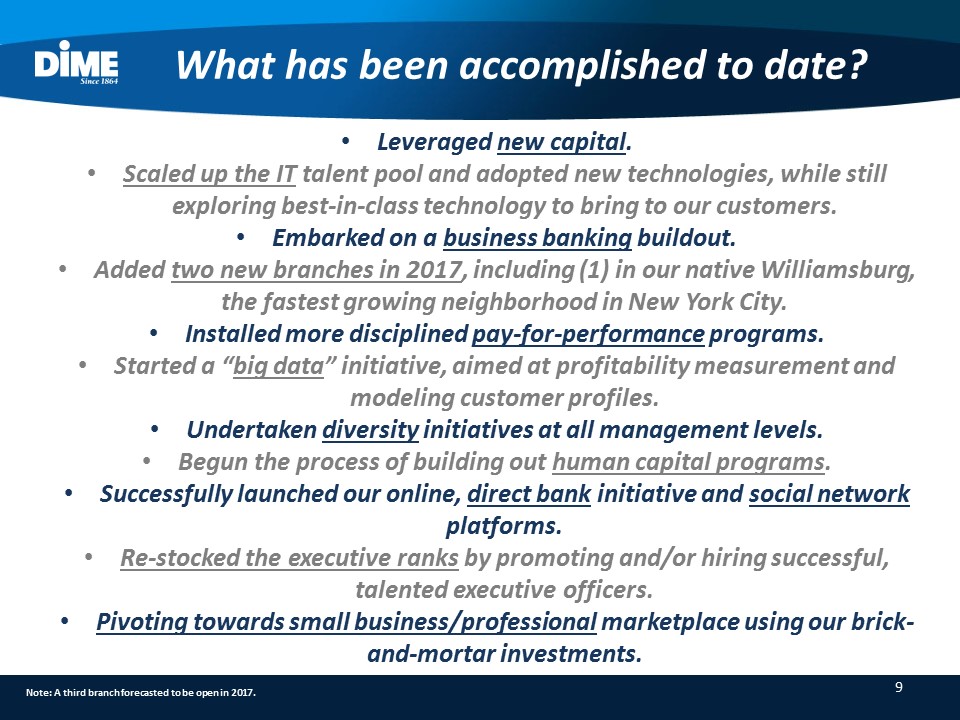
What has been accomplished to date? 9 Leveraged new capital.Scaled up the IT talent pool and adopted new technologies, while still exploring best-in-class technology to bring to our customers.Embarked on a business banking buildout.Added two new branches in 2017, including (1) in our native Williamsburg, the fastest growing neighborhood in New York City.Installed more disciplined pay-for-performance programs.Started a “big data” initiative, aimed at profitability measurement and modeling customer profiles.Undertaken diversity initiatives at all management levels.Begun the process of building out human capital programs.Successfully launched our online, direct bank initiative and social network platforms.Re-stocked the executive ranks by promoting and/or hiring successful, talented executive officers.Pivoting towards small business/professional marketplace using our brick-and-mortar investments. Note: A third branch forecasted to be open in 2017.
VISIONWhere is the company headed? 10 Our vision is to be a highly profitable, cost efficient, technology-driven community commercial bank with diverse, reliable sources of income;to be an aggregator of additional financial service companies;to be the company of choice for clients, an employer of choice for individuals, and an investment of choice for investors.
MISSIONWhat is it that we do, day-in and day-out? 11 Our mission is to provide choice, control and ease of use (i.e., a great customer experience through technology plus informed and engaged employees) of financial products and services, that enable our business and retail customers to manage their businesses and households for both today and the future.
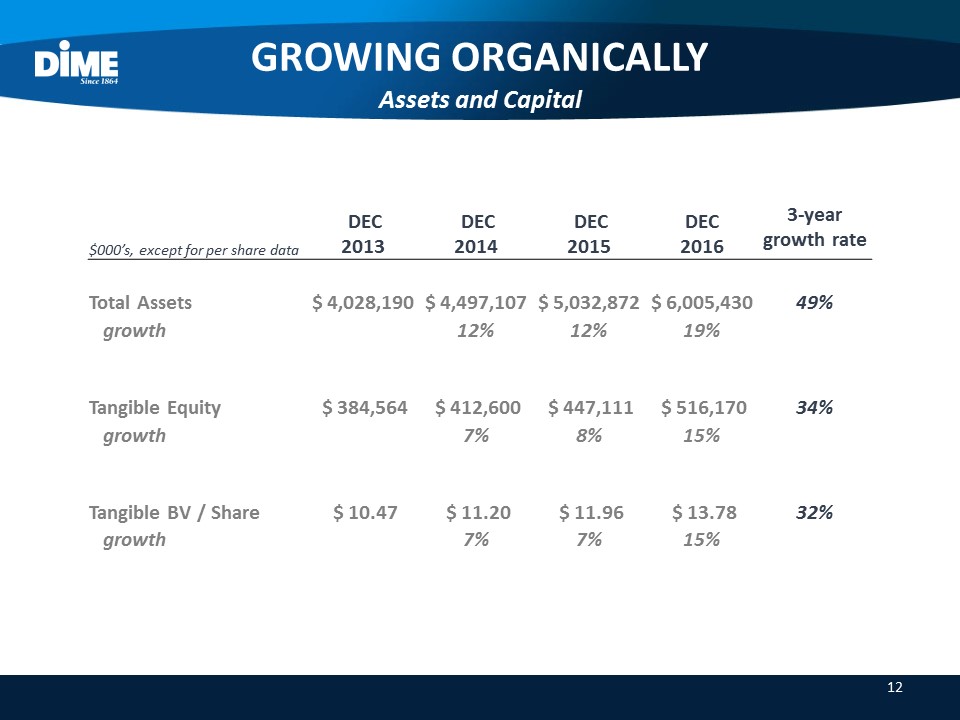
GROWING ORGANICALLYAssets and Capital 12 3-year growth rate $000’s, except for per share data DEC 2013 DEC 2014 DEC 2015 DEC 2016 Total Assets $ 4,028,190 $ 4,497,107 $ 5,032,872 $ 6,005,430 49% growth 12% 12% 19% Tangible Equity $ 384,564 $ 412,600 $ 447,111 $ 516,170 34% growth 7% 8% 15% Tangible BV / Share $ 10.47 $ 11.20 $ 11.96 $ 13.78 32% growth 7% 7% 15%
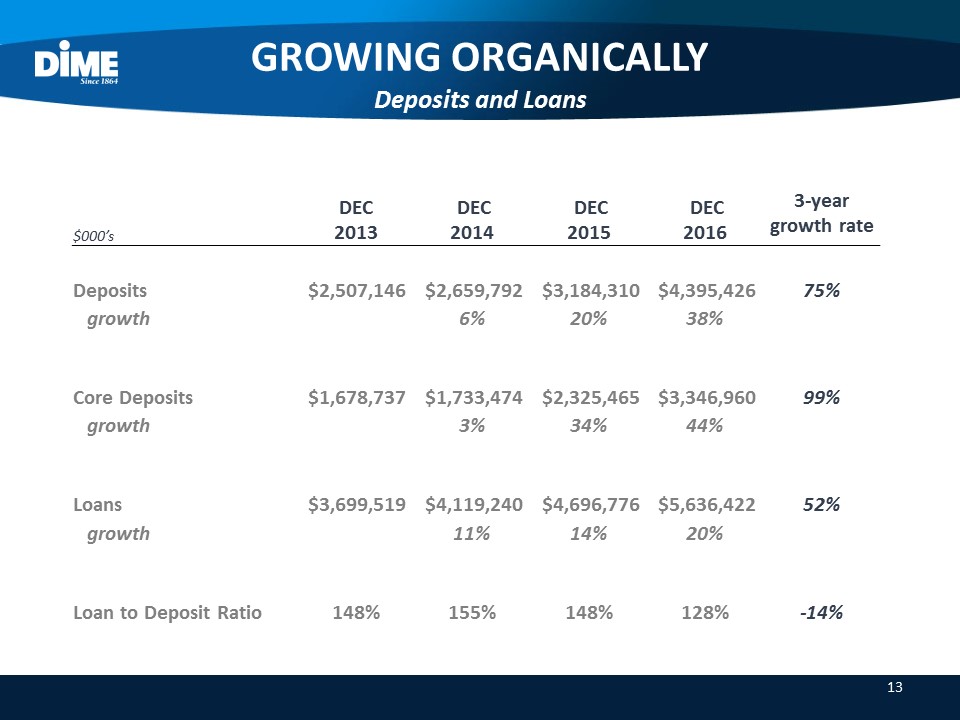
GROWING ORGANICALLYDeposits and Loans 13 3-year growth rate $000’s DEC 2013 DEC 2014 DEC 2015 DEC 2016 Deposits $2,507,146 $2,659,792 $3,184,310 $4,395,426 75% growth 6% 20% 38% Core Deposits $1,678,737 $1,733,474 $2,325,465 $3,346,960 99% growth 3% 34% 44% Loans $3,699,519 $4,119,240 $4,696,776 $5,636,422 52% growth 11% 14% 20% Loan to Deposit Ratio 148% 155% 148% 128% -14%
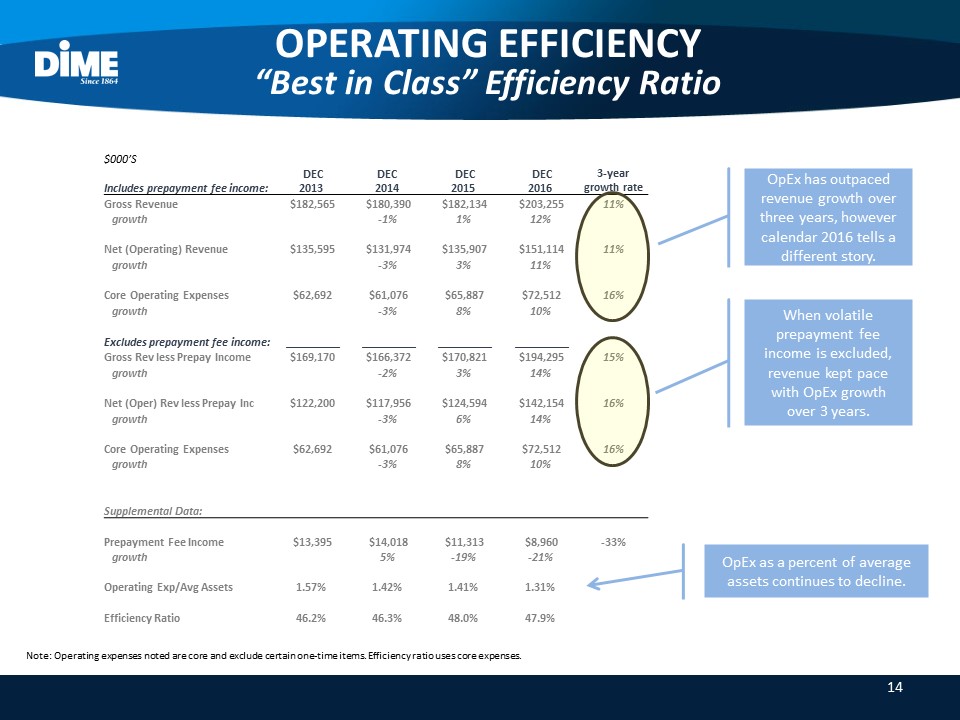
14 $000’S 3-year growth rate Includes prepayment fee income: DEC 2013 DEC 2014 DEC 2015 DEC 2016 Gross Revenue $182,565 $180,390 $182,134 $203,255 11% growth -1% 1% 12% Net (Operating) Revenue $135,595 $131,974 $135,907 $151,114 11% growth -3% 3% 11% Core Operating Expenses $62,692 $61,076 $65,887 $72,512 16% growth -3% 8% 10% Excludes prepayment fee income: _________ _________ _________ _________ Gross Rev less Prepay Income $169,170 $166,372 $170,821 $194,295 15% growth -2% 3% 14% Net (Oper) Rev less Prepay Inc $122,200 $117,956 $124,594 $142,154 16% growth -3% 6% 14% Core Operating Expenses $62,692 $61,076 $65,887 $72,512 16% growth -3% 8% 10% Supplemental Data: Prepayment Fee Income $13,395 $14,018 $11,313 $8,960 -33% growth 5% -19% -21% Operating Exp/Avg Assets 1.57% 1.42% 1.41% 1.31% Efficiency Ratio 46.2% 46.3% 48.0% 47.9% OPERATING EFFICIENCY“Best in Class” Efficiency Ratio OpEx has outpaced revenue growth over three years, however calendar 2016 tells a different story. When volatile prepayment fee income is excluded, revenue kept pace with OpEx growth over 3 years. OpEx as a percent of average assets continues to decline. Note: Operating expenses noted are core and exclude certain one-time items. Efficiency ratio uses core expenses.
Evolution to a community commercial bank 15 In January 2017, members of the former team of Community National Bank, Great Neck, LI, joined DIME along with former CEO Stu Lubow.Dime adds “direct lending/relationship banking” to its powerful “indirect/broker driven” lending platform.Small business loans, SBA loans, and eventually consumer credit, will be added to the DIME menu of available credit products.Several relationship banking teams have already joined DIME, and new offices are opening in Melville, Long Island, and midtown Manhattan to service existing and new clients.This buildout brings a fearless focus on building a strong, commercial bank-like deposit base.
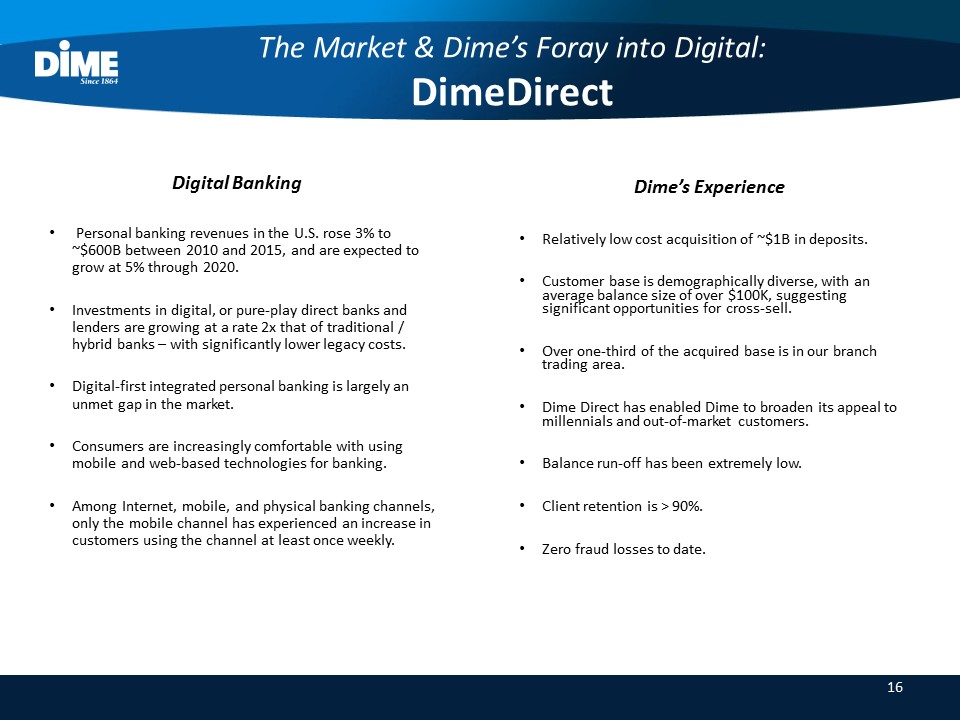
The Market & Dime’s Foray into Digital:DimeDirect Digital Banking Personal banking revenues in the U.S. rose 3% to ~$600B between 2010 and 2015, and are expected to grow at 5% through 2020.Investments in digital, or pure-play direct banks and lenders are growing at a rate 2x that of traditional / hybrid banks – with significantly lower legacy costs.Digital-first integrated personal banking is largely an unmet gap in the market.Consumers are increasingly comfortable with using mobile and web-based technologies for banking.Among Internet, mobile, and physical banking channels, only the mobile channel has experienced an increase in customers using the channel at least once weekly. Dime’s ExperienceRelatively low cost acquisition of ~$1B in deposits.Customer base is demographically diverse, with an average balance size of over $100K, suggesting significant opportunities for cross-sell.Over one-third of the acquired base is in our branch trading area.Dime Direct has enabled Dime to broaden its appeal to millennials and out-of-market customers.Balance run-off has been extremely low.Client retention is > 90%.Zero fraud losses to date. 16
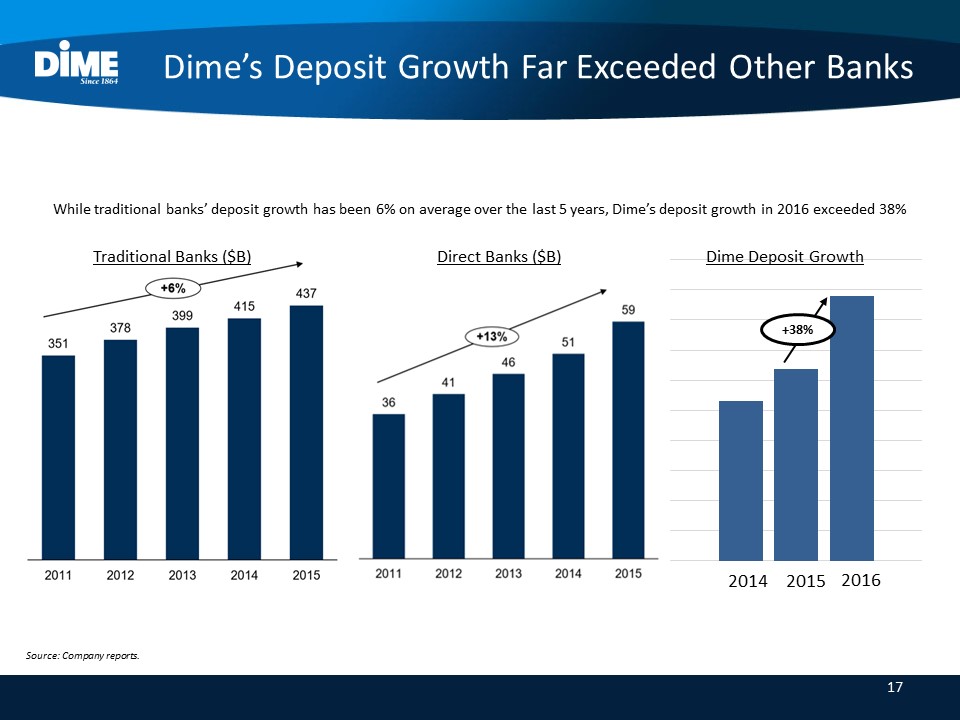
Dime’s Deposit Growth Far Exceeded Other Banks While traditional banks’ deposit growth has been 6% on average over the last 5 years, Dime’s deposit growth in 2016 exceeded 38% Traditional Banks ($B) Dime Deposit Growth Direct Banks ($B) +38% 17 Source: Company reports.
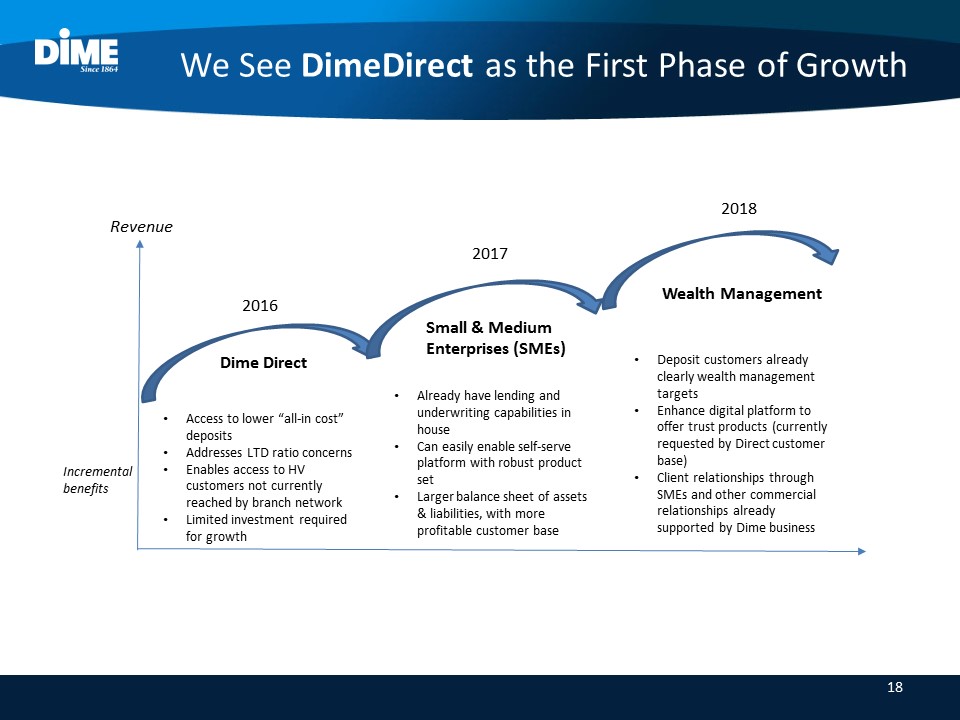
We See DimeDirect as the First Phase of Growth Revenue Incremental benefits Dime Direct Access to lower “all-in cost” depositsAddresses LTD ratio concernsEnables access to HV customers not currently reached by branch networkLimited investment required for growth Small & MediumEnterprises (SMEs) Wealth Management Already have lending and underwriting capabilities in houseCan easily enable self-serve platform with robust product setLarger balance sheet of assets & liabilities, with more profitable customer base Deposit customers already clearly wealth management targetsEnhance digital platform to offer trust products (currently requested by Direct customer base)Client relationships through SMEs and other commercial relationships already supported by Dime business 2017 2016 2018 18
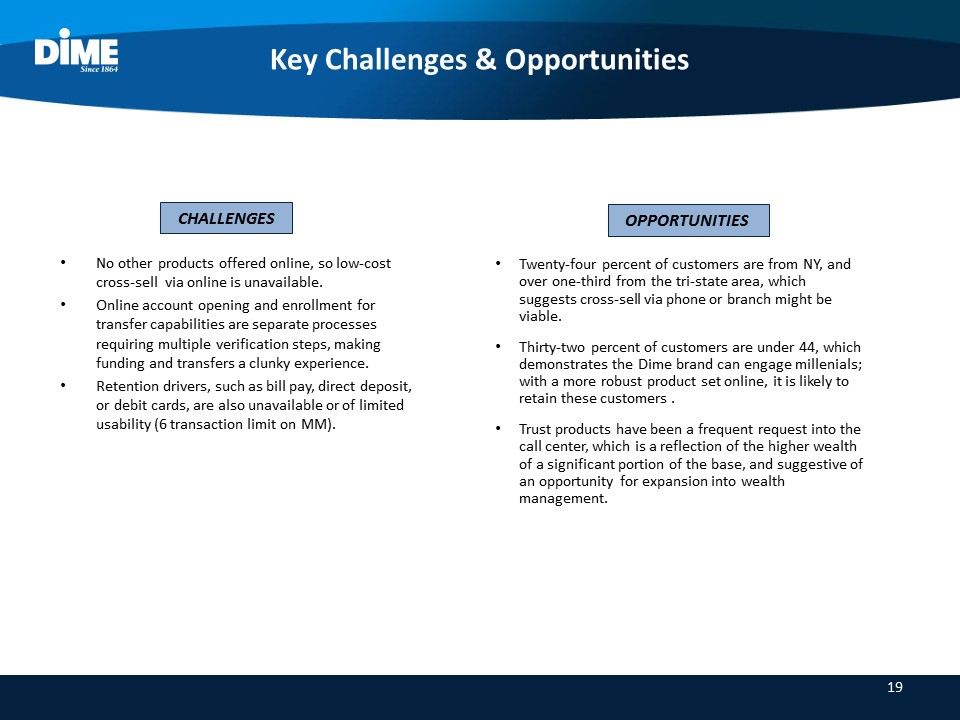
Key Challenges & Opportunities No other products offered online, so low-cost cross-sell via online is unavailable.Online account opening and enrollment for transfer capabilities are separate processes requiring multiple verification steps, making funding and transfers a clunky experience.Retention drivers, such as bill pay, direct deposit, or debit cards, are also unavailable or of limited usability (6 transaction limit on MM). CHALLENGES OPPORTUNITIES Twenty-four percent of customers are from NY, and over one-third from the tri-state area, which suggests cross-sell via phone or branch might be viable.Thirty-two percent of customers are under 44, which demonstrates the Dime brand can engage millenials; with a more robust product set online, it is likely to retain these customers .Trust products have been a frequent request into the call center, which is a reflection of the higher wealth of a significant portion of the base, and suggestive of an opportunity for expansion into wealth management. 19

Retention Attrition has been relatively low. At 1.10%, Dime’s rate is near the national leaders. However, the top tier competitors have so far shown little appetite to raise rates with this early move upward by the Federal Reserve. 20 Jan Mar Apr Feb May Jun Jul Aug Sep Oct Nov Dec Note: Percentages above each bar represent customer retention rates.
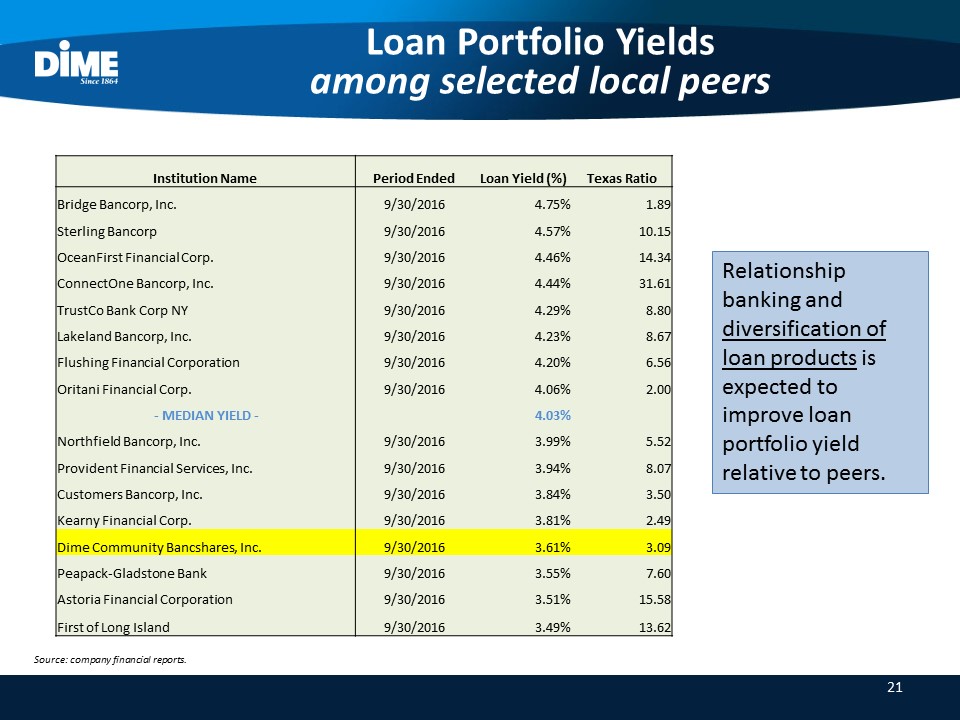
21 Loan Portfolio Yieldsamong selected local peers Institution Name Period Ended Loan Yield (%) Texas Ratio Bridge Bancorp, Inc. 9/30/2016 4.75% 1.89 Sterling Bancorp 9/30/2016 4.57% 10.15 OceanFirst Financial Corp. 9/30/2016 4.46% 14.34 ConnectOne Bancorp, Inc. 9/30/2016 4.44% 31.61 TrustCo Bank Corp NY 9/30/2016 4.29% 8.80 Lakeland Bancorp, Inc. 9/30/2016 4.23% 8.67 Flushing Financial Corporation 9/30/2016 4.20% 6.56 Oritani Financial Corp. 9/30/2016 4.06% 2.00 - MEDIAN YIELD - 4.03% Northfield Bancorp, Inc. 9/30/2016 3.99% 5.52 Provident Financial Services, Inc. 9/30/2016 3.94% 8.07 Customers Bancorp, Inc. 9/30/2016 3.84% 3.50 Kearny Financial Corp. 9/30/2016 3.81% 2.49 Dime Community Bancshares, Inc. 9/30/2016 3.61% 3.09 Peapack-Gladstone Bank 9/30/2016 3.55% 7.60 Astoria Financial Corporation 9/30/2016 3.51% 15.58 First of Long Island 9/30/2016 3.49% 13.62 Relationship banking and diversification of loan products is expected to improve loan portfolio yield relative to peers. Source: company financial reports.
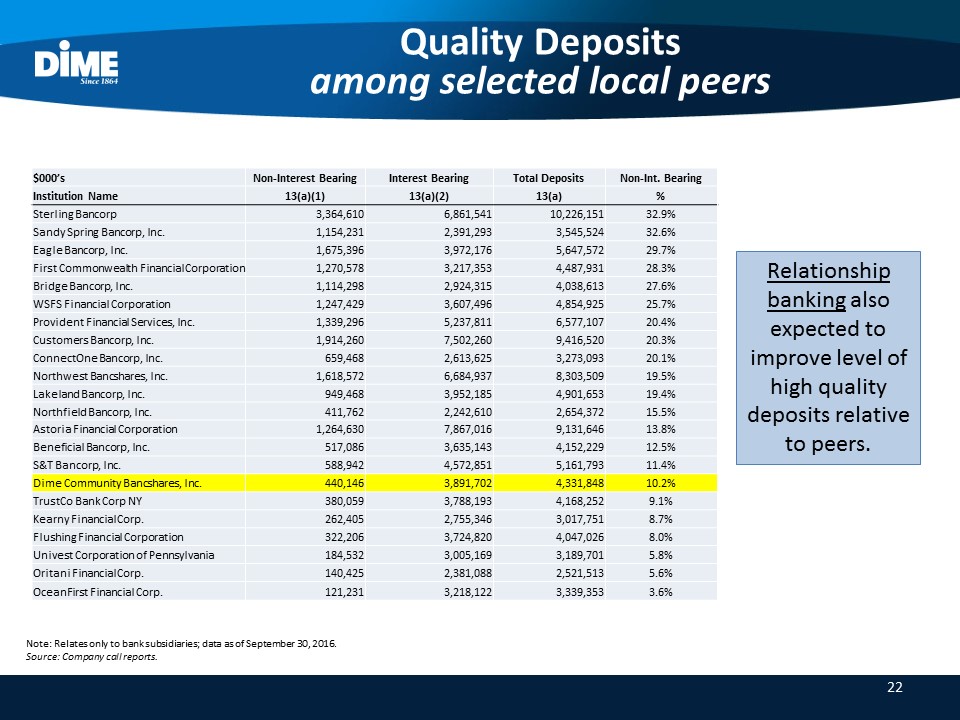
22 Quality Depositsamong selected local peers $000’s Non-Interest Bearing Interest Bearing Total Deposits Non-Int. Bearing Institution Name 13(a)(1) 13(a)(2) 13(a) % Sterling Bancorp 3,364,610 6,861,541 10,226,151 32.9% Sandy Spring Bancorp, Inc. 1,154,231 2,391,293 3,545,524 32.6% Eagle Bancorp, Inc. 1,675,396 3,972,176 5,647,572 29.7% First Commonwealth Financial Corporation 1,270,578 3,217,353 4,487,931 28.3% Bridge Bancorp, Inc. 1,114,298 2,924,315 4,038,613 27.6% WSFS Financial Corporation 1,247,429 3,607,496 4,854,925 25.7% Provident Financial Services, Inc. 1,339,296 5,237,811 6,577,107 20.4% Customers Bancorp, Inc. 1,914,260 7,502,260 9,416,520 20.3% ConnectOne Bancorp, Inc. 659,468 2,613,625 3,273,093 20.1% Northwest Bancshares, Inc. 1,618,572 6,684,937 8,303,509 19.5% Lakeland Bancorp, Inc. 949,468 3,952,185 4,901,653 19.4% Northfield Bancorp, Inc. 411,762 2,242,610 2,654,372 15.5% Astoria Financial Corporation 1,264,630 7,867,016 9,131,646 13.8% Beneficial Bancorp, Inc. 517,086 3,635,143 4,152,229 12.5% S&T Bancorp, Inc. 588,942 4,572,851 5,161,793 11.4% Dime Community Bancshares, Inc. 440,146 3,891,702 4,331,848 10.2% TrustCo Bank Corp NY 380,059 3,788,193 4,168,252 9.1% Kearny Financial Corp. 262,405 2,755,346 3,017,751 8.7% Flushing Financial Corporation 322,206 3,724,820 4,047,026 8.0% Univest Corporation of Pennsylvania 184,532 3,005,169 3,189,701 5.8% Oritani Financial Corp. 140,425 2,381,088 2,521,513 5.6% OceanFirst Financial Corp. 121,231 3,218,122 3,339,353 3.6% Relationship banking also expected to improve level of high quality deposits relative to peers. Note: Relates only to bank subsidiaries; data as of September 30, 2016.Source: Company call reports.
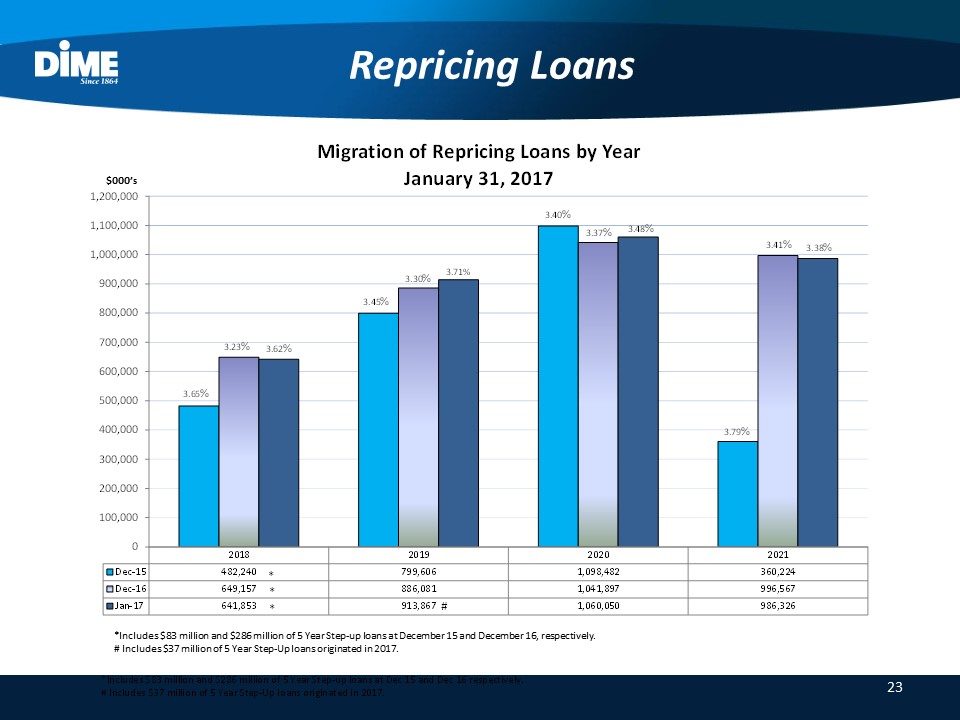
23 Repricing Loans $000’s *Includes $83 million and $286 million of 5 Year Step-up loans at December 15 and December 16, respectively.# Includes $37 million of 5 Year Step-Up loans originated in 2017.
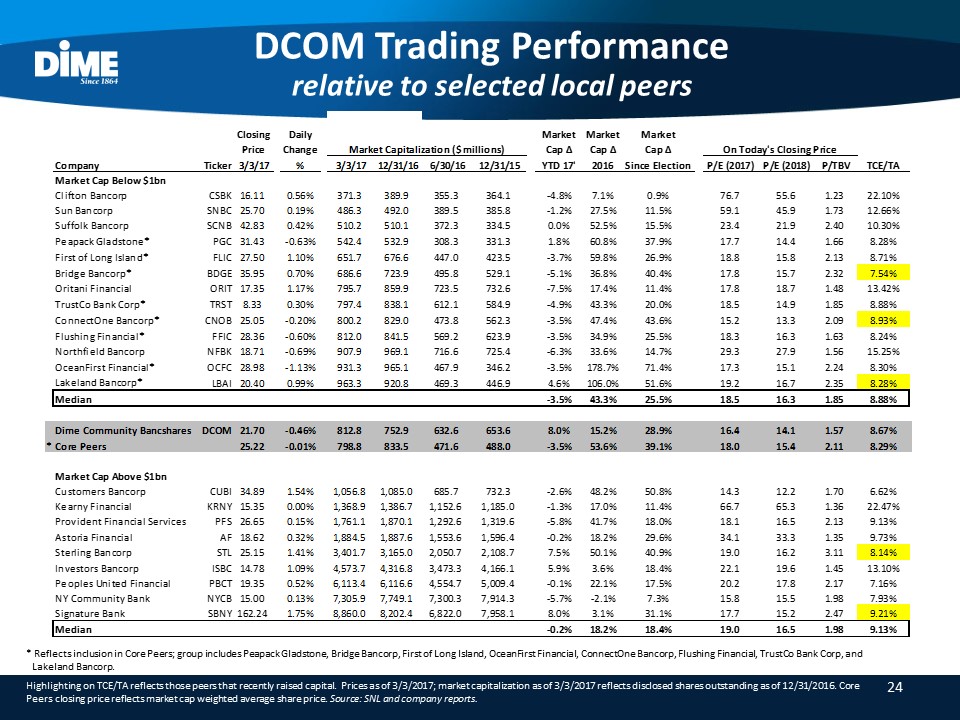
* Reflects inclusion in Core Peers; group includes Peapack Gladstone, Bridge Bancorp, First of Long Island, OceanFirst Financial, ConnectOne Bancorp, Flushing Financial, TrustCo Bank Corp, and Lakeland Bancorp.Highlighting on TCE/TA reflects those peers that recently raised capital. Prices as of 3/3/2017; market capitalization as of 3/3/2017 reflects disclosed shares outstanding as of 12/31/2016. Core Peers closing price reflects market cap weighted average share price. Source: SNL and company reports. DCOM Trading Performancerelative to selected local peers 24
25 Forward-Looking Statements This presentation contains a number of forward-looking statements within the meaning of Section 27A of the Securities Act of 1933, as amended and Section 21E of the Securities Exchange Act of 1934, as amended (the "Exchange Act"). These statements may be identified by use of words such as "anticipate," "believe," "could," "estimate," "expect," "intend," "seek," "may," "outlook," "plan," "potential," "predict," "project," "should," "will," "would" and similar terms and phrases, including references to assumptions.Forward-looking statements are based upon various assumptions and analyses made by Dime Community Bancshares, Inc. (the "Holding Company," and together with its direct and indirect subsidiaries, the "Company") in light of management’s experience and its perception of historical trends, current conditions and expected future developments, as well as other factors it believes appropriate under the circumstances. These statements are not guarantees of future performance and are subject to risks, uncertainties and other factors (many of which are beyond the Company’s control) that could cause actual conditions or results to differ materially from those expressed or implied by such forward-looking statements. These factors include, without limitation, the following:the timing and occurrence or non-occurrence of events may be subject to circumstances beyond the Company’s control;there may be increases in competitive pressure among financial institutions or from non-financial institutions;the net interest margin is subject to material short-term fluctuation based upon market rates;changes in deposit flows, loan demand or real estate values may adversely affect the business of Dime Community Bank (the "Bank");changes in accounting principles, policies or guidelines may cause the Company’s financial condition to be perceived differently;changes in corporate and/or individual income tax laws may adversely affect the Company's business or financial condition;general economic conditions, either nationally or locally in some or all areas in which the Company conducts business, or conditions in the securities markets or the banking industry may be less favorable than the Company currently anticipates;legislation or regulatory changes may adversely affect the Company’s business;technological changes may be more difficult or expensive than the Company anticipates;success or consummation of new business initiatives may be more difficult or expensive than the Company anticipates;litigation or other matters before regulatory agencies, whether currently existing or commencing in the future, may delay the occurrence or non-occurrence of events longer than the Company anticipates; andThe risks referred to in the section entitled "Risk Factors."The Company has no obligation to update any forward-looking statements to reflect events or circumstances after the date of this document.