Attached files
| file | filename |
|---|---|
| EX-32.2 - EXHIBIT 32.2 - Vishay Precision Group, Inc. | vpg-20161231x10kxex322.htm |
| EX-32.1 - EXHIBIT 32.1 - Vishay Precision Group, Inc. | vpg-20161231x10kxex321.htm |
| EX-31.2 - EXHIBIT 31.2 - Vishay Precision Group, Inc. | vpg-20161231x10kxex312.htm |
| EX-31.1 - EXHIBIT 31.1 - Vishay Precision Group, Inc. | vpg-20161231x10kxex311.htm |
| EX-23.1 - EXHIBIT 23.1 - Vishay Precision Group, Inc. | vpg-20161231x10kxex231.htm |
| EX-21.1 - EXHIBIT 21.1 - Vishay Precision Group, Inc. | vpg-20161231x10kxex211.htm |
| EX-10.37 - EXHIBIT 10.37 - Vishay Precision Group, Inc. | vpg-20161231x10kxex1037.htm |
UNITED STATES
SECURITIES AND EXCHANGE COMMISSION
WASHINGTON, D.C. 20549
FORM 10-K
ý ANNUAL REPORT PURSUANT TO SECTION 13 OR 15(d) OF THE SECURITIES
EXCHANGE ACT OF 1934
For the fiscal year ended December 31, 2016
or
o TRANSITION REPORT PURSUANT TO SECTION 13 OR 15(d) OF THE SECURITIES
EXCHANGE ACT OF 1934
For the transition period from _______ to _______
Commission file number 1-34679
Vishay Precision Group, Inc.
(Exact name of registrant as specified in its charter)
Delaware | 27-0986328 |
(State or other jurisdiction of | (IRS employer identification no.) |
incorporation or organization) | |
3 Great Valley Parkway, Suite 150
Malvern, PA 19355
(Address of principal executive offices)
484-321-5300
(Registrant’s telephone number, including area code)
Securities registered pursuant to Section 12(b) of the Act: | |
Common Stock, $0.10 par value | New York Stock Exchange |
(Title of class) | (Exchange on which registered) |
Securities registered pursuant to Section 12(g) of the Act: None
Indicate by check mark if the registrant is a well-known seasoned issuer, as defined in Rule 405 of the Securities Act. Yes o No ý
Indicate by check mark if the registrant is not required to file reports pursuant to Section 13 or Section 15(d) of the Act. Yes o No ý
Note – Checking the box above will not relieve any registrant required to file reports under Section 13 or 15(d) of the Exchange Act from their obligations under those Sections.
Indicate by check mark whether the registrant (1) has filed all reports required to be filed by Section 13 or 15(d) of the Securities Exchange Act of 1934 during the preceding 12 months (or for such shorter period that the registrant was required to file such reports), and (2) has been subject to such filing requirements for the past 90 days. Yes ý No o
Indicate by check mark whether the registrant has submitted electronically and posted on its corporate Web site, if any, every Interactive Data File required to be submitted and posted pursuant to Rule 405 of Regulation S-T (§ 232.405 of this chapter) during the preceding 12 months (or for such shorter period that the registrant was required to submit and post such files). Yes ý No o
Indicate by check mark if disclosure of delinquent filers pursuant to Item 405 of Regulation S-K (Section 229.405 of this chapter) is not contained herein, and will not be contained, to the best of registrant’s knowledge, in definitive proxy or information statements incorporated by reference in Part III of this Form 10-K or any amendment to this Form 10-K. o
Indicate by check mark whether the registrant is a large accelerated filer, an accelerated filer, a non-accelerated filer, or a smaller reporting company. See definition of “accelerated filer”, “large accelerated filer”, and “smaller reporting company” in Rule 12b-2 of the Act. (Check one):
Large accelerated filer o | Non-accelerated filer o |
Accelerated filer ý | Smaller reporting company o |
Indicate by check mark whether the registrant is a shell company (as defined in Rule 12b-2 of the Act). Yes o No ý
The aggregate market value of the voting stock held by non-affiliates computed by reference to the price at which the common stock was last sold as of the last business day of the registrant’s most recently completed second fiscal quarter ($13.34 on July 2, 2016), assuming conversion of all of its Class B convertible common stock held by non-affiliates into common stock of the registrant, was $164,999,000. There is no non-voting stock outstanding.
As of March 16, 2017, the registrant had 12,189,452 shares of its common stock and 1,025,158 shares of its Class B convertible common stock outstanding.
DOCUMENTS INCORPORATED BY REFERENCE
Portions of the registrant’s definitive proxy statement, which will be filed within 120 days of December 31, 2016, are incorporated by reference into Part III of this Annual Report on Form 10-K.
- 1 -
Vishay Precision Group, Inc.
Form 10-K for the year ended December 31, 2016
CONTENTS | ||
PART I | ||
Item 1. Business Description | ||
Item 1A. Risk Factors | ||
Item 1B. Unresolved Staff Comments | ||
Item 2. Properties | ||
Item 3. Legal Proceedings | ||
Item 4. Mine Safety Disclosures | ||
PART II | ||
Item 5. Market for Registrant’s Common Equity, Related Stockholder Matters, and Issuer Purchases of Equity Securities | ||
Item 6. Selected Financial Data | ||
Item 7. Management’s Discussion and Analysis of Financial Condition and Results of Operations | ||
Item 7A. Quantitative and Qualitative Disclosures About Market Risk | ||
Item 8. Financial Statements and Supplementary Data | ||
Item 9. Changes In and Disagreements With Accountants on Accounting and Financial Disclosure | ||
Item 9A. Controls and Procedures | ||
Item 9B. Other Information | ||
PART III | ||
Item 10. Directors, Executive Officers, and Corporate Governance | ||
Item 11. Executive Compensation | ||
Item 12. Security Ownership of Certain Beneficial Owners and Management and Related Stockholder Matters | ||
Item 13. Certain Relationships and Related Party Transactions, and Director Independence | ||
Item 14. Principal Accounting Fees and Services | ||
PART IV | ||
Item 15. Exhibits, Financial Statement Schedules | ||
Item 16. Form 10-K Summary | 50 | |
SIGNATURES | ||
Index to Consolidated Financial Statements | ||
Report of Independent Registered Public Accounting Firm | ||
Consolidated Balance Sheets as of December 31, 2016 and 2015 | ||
Consolidated Statements of Operations for the years ended December 31, 2016, 2015, 2014 | ||
Consolidated Statements of Comprehensive Income (Loss) for the years ended December 31, 2016, 2015, 2014 | ||
Consolidated Statements of Cash Flows for the years ended December 31, 2016, 2015, 2014 | ||
Consolidated Statements of Equity for the years ended December 31, 2016, 2015, 2014 | ||
Notes to Consolidated Financial Statements | ||
- 2 -
PART I
Item 1. BUSINESS DESCRIPTION
General
Vishay Precision Group, Inc. (“VPG,” the “Company,” “we,” “us” or “our”) is an internationally recognized designer, manufacturer and marketer of sensors, and sensor-based measurement systems, as well as specialty resistors and strain gages based upon our proprietary technology. We provide precision products and solutions, many of which are “designed-in” by our customers, specializing in the growing markets of stress, force, weight, pressure, and current measurements. A significant portion of our products and solutions are primarily based upon our proprietary foil technology and are produced as part of our vertically integrated structure. We believe this strategy results in higher quality, more cost effective and focused solutions for our customers. Our products are marketed under a variety of brand names that we believe are characterized as having a very high level of precision and quality. Our global operations enable us to produce a wide variety of products in strategically effective geographic locations that also optimize our resources for specific technologies, sensors, assemblies, and systems.
The Company also has a long heritage of innovation in precision foil resistors, foil strain gages, and sensors that convert mechanical inputs into an electronic signal for display, processing, interpretation, or control by our instrumentation and systems products. Our advanced sensor product line continues this heritage by offering high-quality foil strain gages produced in a proprietary, highly automated environment. Precision sensors are essential to the accurate measurement, resolution and display of force, weight, pressure, torque, tilt, motion, or acceleration, especially in the legal-for-trade, commercial, and industrial marketplaces. This expertise served as a foundation for our expansion into strain gage instrumentation, load cells, transducers, weighing modules, and complete systems for process control and on-board weighing. Although our products are typically used in the industrial market, we believe our advanced sensors may find application outside the industrial market.
The precision sensor market is integral to the development of intelligent products across a wide variety of end markets upon which we focus, including medical, agricultural, transportation, industrial, avionics, military, and space applications. We believe that as original equipment manufacturers (“OEMs”) continue a drive to make products “smarter,” they will integrate more sensors and related systems into their solutions to link the mechanical/physical world with digital control and/or response. We believe this offers a substantial growth opportunity for our products and expertise.
Our History
In 1962, Dr. Felix Zandman founded Vishay Intertechnology Inc. (“Vishay Intertechnology”) to develop and manufacture the first generation of Bulk Metal® foil resistors and later, foil strain gages.
Resistors are basic components used in all forms of electronic circuitry to adjust and regulate levels of voltage and current. They vary widely in precision and cost, and are manufactured from numerous materials and in many forms. Bulk Metal foil resistors, developed by Dr. Zandman in the 1950’s, are the most precise and stable type of resistors currently available. A strain gage is a resistive sensor that is attached to the surface of an object to determine the surface strain caused by an applied force.
Throughout the 1960’s and 1970’s, Vishay Intertechnology established itself as a technical and market leader in precision foil resistors, PhotoStress® products, and foil strain gages. These innovations were the genesis of the foil technology that is a unique strategic competitive advantage of Vishay Precision Group. The subsequent innovations and advancement of foil resistance and strain gage technology opened the door to numerous commercial applications, such as force sensors and control systems on a vertical market basis.
On July 6, 2010, Vishay Intertechnology spun off its precision measurement and foil technology businesses through a tax-free stock dividend of VPG stock to Vishay Intertechnology’s stockholders and we became a publicly-traded company. In the decade prior to the spin-off, Vishay Intertechnology expanded our sensor and measurement business through acquisitions, extending our business from its initial focus on precision foil resistors and foil strain gages to include an array of sensor-based solutions. These solutions include transducers/load cells, which are force sensors combining strain gages and the metallic structures to which they are bonded; load cell modules that utilize electronic instrumentation and software for measuring the load cell output; and measurement instrumentation and complete systems for process control and on-board weighing.
In 2013, we completed our first acquisition as an independent public company when we acquired substantially all of the assets of the George Kelk Corporation ("KELK"). KELK engineers, designs and manufactures highly accurate optical and electronic roll force measurement and control equipment primarily used by metals rolling mills and mining applications throughout the world. As a part of our acquisition, we acquired a leased manufacturing, engineering, sales, and administrative facility in Toronto, Canada.
On December 30, 2015, we completed the acquisition of Stress-Tek, Inc. ("Stress-Tek") based in Kent, Washington. Stress-Tek designs and manufactures state-of-the-art, rugged and reliable strain gage-based load cells and force measurement systems. Stress-Tek primarily operates in North America, where their sensors and display systems are used in a wide range of industries,
- 3 -
predominantly in transportation and trucking, for timber, refuse, aggregate, mining, and general trucking applications. Stress-Tek products are marketed under the Vulcan brand as part of the VPG Onboard Weighing offerings for our Weighing and Control Systems reporting segment. As a part of the Stress-Tek acquisition, we acquired ownership of a 47,000 square foot manufacturing, engineering, sales, administrative, and warehouse facility in Kent, Washington.
On April 6, 2016, the Company completed the acquisition of Pacific Instruments, Inc. ("Pacific") based in Concord, California. Pacific designs and manufactures high-performance signal conditioning, data acquisition and control systems and has extensive experience integrating these systems. Pacific sells primarily to the aerospace, commercial aviation and defense markets in the United States. Pacific products expanded the offerings of our Foil Technology Products reporting segment, which already offered data acquisition systems, primarily in the field of strain measurement. As a result of our acquisition, we occupy a leased 16,000 square foot manufacturing, engineering, sales and administrative facility in Concord, California.
While our acquisitions provided us an array of strong brand names, in addition to our historical resistor and strain gage brands, we believe the continued success of our strategy is best served by the establishment of a strong overall global brand. In 2014, we launched the “VPG” brand, which is intended to leverage the strength of these historical brands under the umbrella of a more unified, globally recognizable VPG name. We continue to broaden and emphasize the VPG brand in the markets we serve under the following brands for each of our business segments:
Foil Technology Products | Force Sensors | Weighing and Control Systems | ||
Alpha Electronics | VPG Transducers | BLH Nobel | ||
Micro-Measurements | - Celtron | KELK | ||
Powertron | - Revere | VPG Onboard Weighing | ||
Vishay Foil Resistors | - Sensortronics | |||
Pacific Instruments | - Tedea-Huntleigh | |||
Our acquisitions added to our strong, diverse, global manufacturing, sales and distribution network, which includes facilities in Canada, China, France, Germany, India, Israel, Japan, Sweden, Taiwan, the United Kingdom, and the United States.
We were incorporated in Delaware on August 28, 2009. Our principal executive offices are located at 3 Great Valley Parkway, Suite 150, Malvern, PA 19355. Our main telephone number is 484-321-5300.
Key Business Vision and Strategies
Our vision is to be the leading provider of sensors, and sensor-based systems with the highest precision, quality, value, and service for measuring force (weight, pressure, torque, acceleration) and current. As part of that vision, we are a leading provider of foil specialty resistors and strain gages, which are particularly effective in precision measurement applications.
Our strategy is to achieve corporate growth and shareholder value by expanding our existing product portfolio organically, as well as by acquiring complementary precision measurement products. Specifically, we are focused on the following strategic initiatives:
Optimize Core Competence
The Company’s core competency and key value proposition is providing customers with proprietary foil technology products and precision measurement sensors and sensor-based systems. Our foil technology resistors and strain gages are recognized as global market leading products that provide high precision and high stability over extreme temperature ranges, and long life. Our force sensor products and our weighing and control systems products are also certified to meet some of the highest levels of precision measurements of force, weight, pressure, torque, tilt, motion, and acceleration. We continue to optimize all aspects of our development, manufacturing and sales processes, including by increasing our technical sales efforts; continuing to innovate in product performance and design; and refining our manufacturing processes.
Our foil technology research group developed innovations that enhance the capability and performance of our strain gages, while simultaneously reducing their size and power consumption as part of our advanced sensors product line. We believe this new foil technology will create new markets as customers “design in” these next generation products in existing and new applications. Our development engineering team is also responsible for creating new processes to further automate manufacturing, and improve productivity and quality. Our advanced sensors manufacturing technology offers us the capability to produce high-quality foil strain gages in a highly automated environment, which we expect to result in reduced manufacturing and lead times, and increased margins. The implementation of this innovative manufacturing technology was the basis for a significant portion of the restructuring efforts we undertook in 2015 and 2016.
We also seek to achieve significant production cost savings through the transfer, expansion, and construction of manufacturing operations in countries such as India and Israel, where we can benefit from lower labor costs, improved efficiencies, or available
- 4 -
tax and other government-sponsored incentives. For example, in 2016, we relocated a significant portion of our force sensor manufacturing from leased locations with higher labor costs, to the owned facility we constructed in India. We closed a facility in Costa Rica and consolidated its functions to existing operations where significant efficiencies were available. This consolidation was part of our global restructuring and cost reduction program announced in November 2015 and substantially completed in 2016.
Organic Growth
Our product portfolio is focused, to a significant extent, on specialty products serving niche markets. The development of specialty products requires us to form long-term relationships with our customers. Our specialty products are usually designed, or engineered, to meet unique specifications for OEMs. This often results in our customers creating a non-standard part number used solely to designate our product on their bill of materials. We call this customer activity a “design win.” This activity may create organic growth as the OEM customer begins to order increasing quantities to meet their production requirements, with little or no opportunity to purchase a similar part from competing suppliers. The “design in” time for these initiatives is typically 12 to 24 months.
We expect to continue to use our research and development, engineering, and product marketing resources to introduce new and innovative specialty products. An example of our success in this regard is the recent acceptance and growth of our on-board vehicle weighing solution incorporating microelectromechanical systems ("MEMS") technology. Our ability to react to changing customer needs, emerging markets, and industry trends will continue to be a key to our success.
Our design, research, and product development teams, in partnership with our marketing teams, drive our efforts to bring innovations to market. We intend to leverage our insights into customer demand to continually develop and roll out new, innovative products within our existing lines and to modify our existing core products in ways that make them more appealing, addressing changing customer needs and industry trends in terms of form, fit, and function.
Growth from Acquisitions
We expect to continue to make strategic acquisitions where opportunities present themselves to grow our segments. Historically, our growth and acquisition strategy has been largely focused on vertical product integration, using our foil strain gages in our force sensor products, and incorporating those products into our weighing and control systems. The acquisitions of Stress-Tek and KELK, each of which employ our foil strain gages to manufacture load cells for their systems, continue this strategy. Additionally, the KELK acquisition resulted in the acquisition of certain optical sensor technology. The Pacific Instruments acquisition significantly broadened our existing data acquisition offerings and opened new markets for us. Along with our recent success in MEMS technology for on-board weighing, we expect to expand our expertise, and our acquisition focus, outside our traditional vertical approach to other precision sensor solutions in the fields of measurement of force, weight, pressure, torque, tilt, motion, and acceleration. We believe acquired businesses will benefit from improvements we implement to reduce redundant functions and from our current global manufacturing and distribution footprint.
Product Segments
Foil Technology Products
The Foil Technology Products ("FTP") segment includes our foil resistor and strain gage operating segments. Typical applications for foil resistors include high end test equipment for the aviation, military and space, semiconductor, process control, oil and gas, and medical markets. Typical applications for strain gages, which include advanced sensor gages, are stress analysis for structural testing in the aviation, military and space, infrastructure, and construction markets. Our innovative advanced sensors product line enhances the capability and performance of our strain gages, while simultaneously reducing their size and power consumption. This segment also includes our significantly expanded data acquisition systems business.
The products in these segments are primarily based on our resistive foil technology, which continues to evolve and enables many products in both segments to be suited for new and varied applications.
The manufacturing of the foil material is a critical and common component of the Company’s strain gage and precision foil resistor operating segments, and as a result, we experience synergies between our foil resistor and strain gage operating segments. The production cycles for foil resistors and strain gages are similar and many of the same raw materials are utilized in the manufacturing processes for both operating segments. The foil resistor and strain gage products require a similar level of labor and capital. However, the advanced sensors’ manufacturing technology offers us the capability to produce high-quality foil strain gages in a highly automated environment, which we expect will result in reduced manufacturing costs and lead times, and increase margins.
With the acquisition of Pacific Instruments, we now offer a broad range of high performance signal conditioning, data acquisition and control systems, many of which reach customers outside our traditional customer base. Our combined product lines provide us access to new government and commercial customers while offering us the opportunity to market Pacific Instruments systems on a global basis, expanding their use outside their United States base.
- 5 -
Our strain gage operating segment sells a significant amount of foil inventory to the Company’s foil resistor operating segment. A majority of products from the strain gage operating segment are sold to third parties as “standard catalog items”; the remainder of this operating segment's products are sold as non-standard and/or custom products to third parties and to our Force Sensors segment.
Force Sensors
The Force Sensors segment includes a broad line of load cells and force measurement transducers that are offered as precision sensors for industrial and commercial use. Typical applications for force sensors are in medical devices (such as hospital beds and medication dosing), agricultural equipment (for precision force measurement), and construction machinery (for tipping and overload protection). These sensors use our foil technology products, which serve as sensing elements and components within each unit. Further integration of our load cells technology is also offered as part of our weighing module products, which provide customers with a complete sensor assembly that may be used within a wide variety of digital transducers.
A majority of products from the Force Sensors segment are sold to third parties as “standard catalog items,” but a growing sector of this segment’s products are sold as non-standard and/or custom products to third parties and to our Weighing and Control Systems segment. Direct sales channels (field application engineers (“FAEs”)) are utilized as the primary customer interface relating to initial design specifications, development of prototypes, and pricing/delivery of this segment’s products. Distributors are also used for those customers that desire primarily standard, “as is” products.
Weighing and Control Systems
The Weighing and Control Systems segment designs and manufactures complete systems comprised of load cells and instrumentation for weighing and force control/measurement for a variety of uses, including on-board weighing and overload monitor systems. Typical applications for our weighing and control systems products are: process weighing of chemicals, food and pharmaceuticals; aircraft and truck weighing and overload protections; weight force and process optimization in steel and paper mills; and force measurement for offshore oil and gas exploration.
The Weighing and Control Systems segment acquires many of the load cells it requires from our Force Sensors segment. As such, the Company considers the load cell production line to be an integral component of the production process of our Weighing and Control Systems segment. Other major components that comprise our systems are: electronic displays; optical gages; signal processors; MEMS sensors; cabling; system software; and communication software/hardware. The end use for the majority of these products is the precision measurement of force, weight, pressure, torque, tilt, motion, and acceleration. Direct sales channels (FAEs) are utilized as the primary customer interface relating to initial design specifications, development of prototypes, and pricing/delivery of this segment’s products. Distributors and sales agents are also used, as appropriate, to market, sell, and support certain products in this segment.
Products
Our precision sensor and sensor-based systems include products such as load cells, transducers, weighing modules, and complete systems for process control and on-board weighing applications. Our precision foil resistors and strain gages are based on our proprietary foil technology, which we invented. We manufacture and sell high precision foil resistors, foil strain gages, and data acquisition systems.
Our product portfolio includes:
• | Foil resistors – Foil resistors are the most precise and stable type of resistors currently available. Resistors are basic components used in all forms of electronic circuitry to adjust and regulate levels of voltage and current. Our foil resistors and current sensors are used in applications requiring a high degree of precision and stability, such as in medical applications, precision equipment for front-end and back-end semiconductor testing and semiconductor fabrication equipment, and avionics/military/aerospace applications. We sell our foil resistors under the Vishay Foil Resistors, Alpha Electronics, and Powertron brands, including under our well-known Bulk Metal® trademark. |
• | Foil strain gages – Strain gages, including our advanced sensors, are resistive sensors that are attached to the surface of an object to determine the surface strain caused by an applied force. Typical uses of strain gages include test and measurement applications where the strength of the object is the main consideration and the object under test is a structural component in a machine or device, such as an automobile, an aircraft, or a highway bridge. Strain gages are also used inside precision transducers where the magnitude of an applied force is the focus of the measurement. A variety of physical measurements can be made using strain gages attached to metal components including force, weight, pressure, displacement, and acceleration. We sell our strain gages under the well-known Micro-Measurements brand. |
• | Transducers and load cells – A transducer is mounted on a structure that is subjected to weight or other stress, such as the platform of an industrial scale. The term “load cell” is primarily used to describe transducers used in weighing applications. Strain gage transducers consist of one or more strain gages bonded to a metallic support. The change in |
- 6 -
resistance of the strain gages in response to deformation of the transducer by the applied load is detected by electronic instrumentation. Transducers are manufactured with different designs and configurations depending on their application and the type of stress or strain to be measured; for example, weight or tension. We produce both analog and digital transducers. We sell our load cells under the overall VPG Transducers name as we continue to transition from the previously used Celtron, Revere, Sensortronics, and Tedea-Huntleigh brands.
• | Modules – Modules are transducers combined with a mounting and with external features, such as instruments and cables, and are used for weighing and control applications. |
• | Data acquisition systems – Data acquisition systems, which include instruments, measure, process, digitize, display, and record the output of our strain gages, transducers, and other sensor or sensor-based systems as well as deliver information to control systems. Our acquisition of Pacific Instruments significantly expanded our previous instruments offerings. |
• | Weighing and control systems – Weighing and control systems are integrated systems for the detection and measurement of weight and other types of force, primarily for use in industrial applications. These include systems to control process weighing in food, chemical, and pharmaceutical plants; force measurement systems used to control web tension in paper mills, roller force in steel mills, and cable tension in winch controls; on-board weighing systems installed in logging and waste-handling trucks; and special scale systems used for aircraft weighing and portable truck weighing. With our acquisition of Stress-Tek, we enhanced and broadened our on-board weighing offerings with products that are recognized for high quality in their markets. With our acquisition of KELK, we added certain optical gages for control systems and enhanced our other product offerings for process control in the steel mill industry. We sell our systems under a variety of brand names including BLH Nobel, KELK, and VPG Onboard Weighing. |
• | PhotoStress® products – PhotoStress coatings and instruments use a unique optical process to reveal and measure the distribution of stresses in structures under live load conditions. They are used to improve structural design in aerospace, automotive, military, civil engineering, industrial, and mechanical applications. |
Qualifications and Specifications
Certain of our products must be qualified or approved under various military and aerospace specifications and other standards.
We have qualified certain of our foil resistor and sensor products under various military specifications approved and monitored by the United States Defense Logistics Agency (“DLA”), under certain European military specifications, and various aerospace standards approved by the U.S. National Aeronautics and Space Administration (“NASA”) and the European Space Agency (“ESA”).
Qualification and specification levels are based in part upon the rate of failure of products. We must continuously perform tests on our products, and report the results for qualified products to the qualifying organization. If a product fails to meet the requirements for the applicable classification level, the product’s classification may be suspended or reduced to a lower level. During the time that the classification is suspended or reduced, net revenues and earnings attributable to that product may be adversely affected.
Certain of our load cell and instrumentation products are approved by the National Type Evaluation Program (“NTEP”) and International Organization of Legal Metrology (“OIML”). Many of our weighing systems must also meet these standards to make them usable for legal-for-trade weighing applications. Products and systems that are to be used in hazardous areas, where explosive atmospheres might exist, must comply with special safety standards, such as the European Atmosphère Explosible (“ATEX”) Standard and the U.S. Factory Mutual (“FM”) Standard. Our load cell manufacturing sites undergo periodic audits by regulatory authorities in order to verify compliance with standard requirements and to extend product approvals.
Manufacturing Operations
Our principal manufacturing facilities are located in Israel, the United States, Canada, India, the People’s Republic of China, and Japan. We also have manufacturing facilities in Germany, Sweden, the United Kingdom, the Republic of China (Taiwan), and France. Over the past several years, we have invested substantial resources to increase capacity and to enhance automation in our plants, which we believe will further reduce production costs.
We have quality management systems at all of our major manufacturing facilities approved under the ISO 9001 Quality Management Systems Standard. ISO 9001 is a comprehensive set of quality program standards developed by the International Organization for Standardization ("ISO"). The quality management system in our major foil resistors manufacturing site is certified against Aerospace Standard AS9100.
To maintain our cost competitiveness, we are pursuing our strategic initiatives to shift manufacturing emphasis to more advanced automation in higher-labor-cost regions and to relocate production to regions with skilled workforces and relatively lower labor costs. See additional information in Item 7 “Management’s Discussion and Analysis of Financial Condition and Results of Operations – Cost Management” related to our restructuring efforts.
- 7 -
Sources of Supplies
Although most materials incorporated in our products are available from a number of sources, certain materials are available only from a relatively limited number of suppliers. The principal materials used in our products include various metallic foil alloys, aluminum, stainless steel, tool steel, plastics, and for a few products, gold. Some of the most highly specialized materials for our sensors are sourced from a single vendor. We maintain a safety stock inventory of certain critical materials at our facilities. We are taking steps to determine the use, source, and origin of any tin, tantalum, tungsten, or gold in our global product portfolio and, if appropriate, would work with our suppliers to remediate issues and source more responsibly.
A significant portion of our Force Sensors and Weighing and Control Systems segment products are based on strain gages produced by our Foil Technology Products segment.
Inventory and Backlog
We manufacture both standardized products and those designed and produced to meet customer specifications. We maintain an inventory of standardized components, and monitor the backlog of outstanding orders for our products.
We include in our backlog only open orders that have been released by the customer for shipment in the next twelve months. Many of our customers for strain gages, load cells, and foil resistors encounter uncertain and changing demand for their products. They typically order products from us based on their forecasts. If the customers' business needs change, they may cancel or reschedule the shipments that are included in our backlog, in many instances without the payment of any penalty. Therefore, the backlog at any point in time is not necessarily indicative of the results to be expected for future periods.
Customers and Marketing
Our customer base is diversified in terms of industry, geographic region, and range of product needs. No single customer accounts for more than 5% of our net revenues. The vast majority of our products are used in the broad industrial market, with selected uses in the military and aerospace, medical, agricultural, steel, and construction sectors. Within the broad industrial market, our products serve a wide variety of applications in waste management, bulk hauling, logging, scales manufacturing, engineering systems, pharmaceutical, oil, chemical, steel, paper, and food industries.
Our net revenues attributable to customers by region are as follows:
Years ended December 31, | ||||||||
2016 | 2015 | 2014 | ||||||
Americas | 44 | % | 40 | % | 38 | % | ||
Europe | 35 | % | 38 | % | 40 | % | ||
Asia | 21 | % | 22 | % | 22 | % | ||
100 | % | 100 | % | 100 | % | |||
We sell through a variety of sales channels, including OEMs, electronic manufacturing services companies (“EMS”) (which manufacture for OEMs on an outsourcing basis), and independent distributors. We also sell directly to end-use customers. During 2016, sales channels for our three reporting segments were as follows:
Foil Technology Products | Force Sensors | Weighing and Control Systems | ||||||
OEMs | 38 | % | 64 | % | 48 | % | ||
EMS | 10 | % | — | % | — | % | ||
Distributors | 31 | % | 31 | % | 21 | % | ||
End users | 21 | % | 5 | % | 31 | % | ||
100 | % | 100 | % | 100 | % | |||
Many of our products have historically been sold by dedicated sales forces, consisting mainly of FAEs focusing on specific market segments or specific customers. The FAEs help identify the products in our portfolio that best meet the needs of our customers and provide technical and applications support. Their in-depth knowledge of customer needs is a key factor in new product design and future research and development initiatives.
- 8 -
Competition
Our competitive success depends on our ability to maintain a competitive advantage on the basis of superior product capability and performance, product quality, know-how, proprietary data, market knowledge, service capability, and business reputation. Price competitiveness can be an important factor, especially within our Force Sensors segment. Our sales and marketing programs offer our customers a broad range of world-class precision technologies, and superior global sales and support.
Competition in the markets where we sell the bulk of our products is extremely fragmented, both geographically and by application. To our knowledge, there are no competitors with the same product mix and proprietary technology as ours. Our competitors range from very small, local companies to large, international companies with greater financial resources than us.
Our foil resistors, where we maintain a leading market share, and our foil strain gages are based on our proprietary technology. Competitors try to compete in this market using different technology to offer functionally equivalent products. Competition in our Foil Technology Products segment includes IRC, SSM, KOA and Flat Dashi for foil resistors, and HBM, an operating company of Spectris, Tokyo Sokki Kenkyujo Co., Ltd (TML), Kyowa and Zemic for foil strain gages. Competitors in our Force Sensors segment include HBM, Zemic, Keli, and Flintec. Competitors in our Weighing and Control Systems segment include Roper Industries, Hardy Instruments, and Avery Weigh-Tronix for process weighing; ABB, Siemens, Haehne, Dalian and IMS for steel mill systems; and Air-Weigh, Vehicle Weighing Systems, MOBA, and AMCS for onboard weighing.
Research and Development
Many of our products, manufacturing techniques, and technologies have been invented, designed, and developed by our engineers and scientists. Special proprietary resistive metal foil is the most important material in both our foil resistors and our foil strain gages, and our research and development activities related to foil materials are an important linkage between these two products.
We maintain strategically placed design centers for each of our business segments where proximity to customers enables us to more easily monitor and satisfy the needs of local markets. These design centers are located in the United States, Israel, Canada, Sweden, Japan, the United Kingdom, Germany, and France.
We also maintain research and development staff, and promote programs at a number of our production facilities to develop new products and new applications of existing products, and to improve manufacturing techniques. This decentralized system encourages individualized product development at specific manufacturing facilities that occasionally has applications at other facilities.
Our research and development staff and our sales force are closely linked. Our sales force is comprised of individuals with an engineering background who can help meet the needs of our customers for technical and applications support. This in-depth knowledge of customer needs and specifications is a key factor in future research and development initiatives.
Research and development will continue to play a key role in our efforts to introduce innovative products for new sales, and to improve profitability. We expect to continue to expand our position as a leading supplier of precision foil technology products. We believe our R&D efforts should provide us with a variety of opportunities to leverage technology, products, and our manufacturing base and, ultimately, our financial performance. To that end, we expect to sustain or increase our R&D expenditures in order to fill the product development pipeline and lay the foundation for future sales growth.
Patents and Licenses
We have made a significant investment in securing intellectual property protection for our technology and products. We seek to protect our technology by, among other things, filing patent applications for technology considered important to the development of our business. Although we have numerous United States and foreign patents covering certain of our products and manufacturing processes, no particular patent is considered individually material to our business. We also rely upon trade secrets, unpatented know-how, and continuing technological innovation.
Our ability to compete effectively with other companies depends, in part, on our ability to maintain the proprietary nature of our technology. Although we have been awarded, have filed applications for, or have obtained numerous patents in the United States and other countries, there can be no assurance concerning the degree of protection afforded by these patents, or the likelihood that pending patents will be issued.
We require all of our technical, research and development, sales and marketing, and management employees, and most consultants and other advisors to execute confidentiality agreements upon the commencement of employment, or consulting relationships with us. These agreements provide that all confidential information developed, or made known to the entity or individual during the course of the entity’s or individual’s relationship with us, is to be kept confidential and not disclosed to third parties except in specific circumstances. Substantially all of our technical, research and development, sales and marketing, and management
- 9 -
employees have entered into agreements providing for the assignment to us of rights to inventions made by them while employed by us.
Environmental, Health and Safety
We have an Environmental, Health and Safety Policy that commits us to achieve health and safety for employees and protection of the environment, to maintain compliance with applicable environmental, health and safety laws, to promote proper management of hazardous materials, and to minimize the hazardous materials generated in the course of our operations. In addition, our manufacturing operations are subject to various regional, federal, state, and local laws restricting discharge of materials into the environment. We are not involved in any pending or threatened proceedings that would require curtailment of our operations.
Employees
As of December 31, 2016, we employed approximately 2,100 total employees, substantially all of which were full-time employees. Approximately 84% of the employees were located outside the United States. Our future success is substantially dependent on our ability to attract and retain highly qualified technical and administrative personnel. Some of our employees outside the United States are members of trade unions. Our relationship with our employees is generally good. However, no assurance can be given that labor unrest or strikes will not occur.
Executive Officers
The following table sets forth certain information regarding our executive officers as of March 16, 2017:
Name | Age | Positions | |
Ziv Shoshani | 50 | Chief Executive Officer, President, and Director | |
William M. Clancy | 54 | Executive Vice President and Chief Financial Officer | |
Roland B. Desilets | 55 | Vice President, General Counsel, and Secretary | |
Ziv Shoshani is our Chief Executive Officer and President, and also serves on the board of directors. Mr. Shoshani was Chief Operating Officer of Vishay Intertechnology from January 1, 2007 to November 1, 2009. During 2006, he was Deputy Chief Operating Officer of Vishay Intertechnology. Mr. Shoshani was Executive Vice President of Vishay Intertechnology from 2000 to 2009 with various areas of responsibility, including Executive Vice President of the Capacitors and the Resistors businesses, as well as heading the Measurements Group and Foil Divisions. Mr. Shoshani had been employed by Vishay Intertechnology since 1995. He continues to serve on the Vishay Intertechnology board of directors. Mr. Shoshani is a nephew of the late Dr. Felix Zandman, the founder of Vishay Intertechnology.
William M. Clancy is our Executive Vice President and Chief Financial Officer. Mr. Clancy was Corporate Controller of Vishay Intertechnology from 1993 until November 1, 2009. He became a Vice President of Vishay Intertechnology in 2001 and a Senior Vice President of Vishay Intertechnology in 2005. Mr. Clancy served as Corporate Secretary of Vishay Intertechnology from 2006 to 2009. From June 16, 2000 until May 16, 2005 (the date Vishay Intertechnology acquired the noncontrolling interest in Siliconix incorporated), Mr. Clancy served as the principal accounting officer of Siliconix. Mr. Clancy had been employed by Vishay Intertechnology since 1988. Mr. Clancy is a licensed CPA in Pennsylvania.
Roland B. Desilets is our Vice President, General Counsel, and Secretary. He joined VPG in March 2010 after serving as Executive Vice President, General Counsel, and Secretary for QAD, Inc. (NASDAQ:QADA/QADB) from 2001 to 2009. Prior to that time he spent one year as Executive Vice President, General Counsel, and Secretary of Atlas Commerce, Inc., a Safeguard Scientifics (NYSE:SFE) partner company. Mr. Desilets initially joined QAD, Inc. in 1993, serving as Regional General Counsel until 1998, when he was named General Counsel. Previously, he was Intellectual Property Counsel for Unisys Corporation. Mr. Desilets holds a juris doctor degree from Widener University Delaware School of Law, a master of science degree in computer science from Villanova University, and a bachelor of science degree in physics from Ursinus College.
Company Information and Website
We began filing annual, quarterly, and current reports, proxy statements, and other documents with the Securities and Exchange Commission (“SEC”) under the Securities Exchange Act of 1934 after our spin-off from Vishay Intertechnology on July 6, 2010. The public may read and copy any materials that we file with the SEC at the SEC’s Public Reference Room at Station Place, 100 F Street, NE, Washington, DC 20549. The public may obtain information on the operation of the Public Reference Room by calling the SEC at 1-800-SEC-0330. Also, the SEC maintains an Internet website that contains reports, proxy and information statements, and other information regarding issuers, including us, that file electronically with the SEC. The public can obtain any documents that we file with the SEC at www.sec.gov.
- 10 -
In addition, our company website can be found on the Internet at www.vpgsensors.com. The website contains information about us and our operations. Copies of each of our filings with the SEC on Form 10-K, Form 10-Q, and Form 8-K, and all amendments to those reports, can be viewed and downloaded free of charge as soon as reasonably practicable after the reports and amendments are electronically filed with or furnished to the SEC. To view the reports, access http://ir.vpgsensors.com and click on “SEC Filings”/ “Documents.”
The following corporate governance related documents are also available on our website:
• | Compensation Committee Charter |
• | Nominating and Corporate Governance Committee Charter |
• | Audit Committee Charter |
• | Code of Business Conduct and Ethics |
• | Code of Ethics Applicable to the Chief Executive Officer, Chief Financial Officer, and Principal Accounting Officer or Controller |
• | Corporate Governance Principles |
To view these documents, access http://ir.vpgsensors.com and click on “Corporate Governance.”
To view our Ethics Program Reporting Procedures, access http:/www.vpgsensors.com/company and click on “Ethics.”
We are not incorporating by reference into this Annual Report on Form 10-K any material from our website.
Any of the above documents can also be obtained in print by any stockholder, upon request to our Investor Relations Department at the following address:
Corporate Investor Relations
Vishay Precision Group, Inc.
3 Great Valley Parkway, Suite 150
Malvern, PA 19355
- 11 -
Item 1A. RISK FACTORS
You should carefully consider the following risks and other information in this Form 10-K in evaluating our company and common stock. Any of the following risks, as well as additional risks and uncertainties not currently known to us or that we currently deem immaterial, could materially and adversely affect our business, results of operations or financial condition, and could also adversely affect the trading price of our common stock.
Risks Related to Our Business
We face intense competition in our business.
We face various degrees and types of competition in our different businesses. In some cases our products compete directly with those of third party competitors. In other cases, competition in one segment, such as in our Weighing and Control Systems segment, may affect not only the sales of our systems within that segment, but also sales of products that we incorporate in those systems from other segments, such as load cells and strain gages.
We have a significant market position in foil resistors and foil strain gages. Foil resistors and foil strain gages are also produced by competitors, principally located in China. We believe that our foil technology products provide superior performance relative to our competitors, but that could change if our competitors succeed in developing and introducing innovative competitive offerings. Also, our foil strain gages compete with other types of strain gages, such as semiconductor strain gages, which we do not manufacture. We believe that other types of strain gages are not as reliable or stable as our foil strain gages, but that could change as the technology for these other products continues to evolve. If our competitors are able to improve the quality, performance, or pricing of their products relative to our offerings, our results of operations could be adversely affected.
The market for transducer/load cell products is highly fragmented and very competitive. Our load cell modules and systems face competition from numerous other load cell module and systems manufacturers. Competition for modules and systems is most often based on customer relationships, product reliability, technical performance, and the ability to anticipate and satisfy customer needs for specific design configurations. Many other manufacturers have more experience in particular geographic markets and specific applications than we do, and may be better positioned to compete in these areas. We cannot assure you that we will be able to successfully grow our business in the face of these competitive challenges.
Our vertical product integration exposes us to certain risks.
Our business structure emphasizes vertical product integration. For example, we use our strain gages in our force sensor products and our force sensor business is our largest customer (by volume) for our strain gages. Similarly, our weighing and control systems business uses our force sensor products in its systems. Many of our acquisitions, which form the core operations of our business, had the effect of extending our vertical integration.
While we believe this has been, and will continue to be, a sound business structure, vertical product integration and the resulting interdependencies of our divisions exposes us to certain risks. As a consequence of our vertical integration, our force sensors business may compete with certain of our customers and potential customers for strain gages while our systems business may compete with certain of our customers and potential customers for force sensors, who, for that reason, may elect not to do business with us.
We may not be successful in future acquisitions or other strategic transaction endeavors, if any, which could have an adverse effect on our business and results of operations.
Historically, we expanded our business in large part by completing acquisitions, and a material element of our business strategy continues to be expansion through acquisition. We cannot assure that we will identify, have the financial capabilities to execute, and/or successfully complete strategic transactions with suitable partners in the future. We also cannot assure that any such transactions that we do complete in the future will be successful.
Such transactions or investments involve a number of risks, including the following:
• | we may incur substantial costs, including advisory fees and diversion of management attention, in evaluating a potential transaction; |
• | we may be unable to achieve the anticipated benefits from the transaction; |
• | we may have difficulty integrating the operations and personnel of an acquired business, and may have difficulty retaining the key personnel of the acquired business; |
• | we may have difficulty incorporating acquired technologies or products into our existing solutions; |
• | our ongoing business and management's attention may be disrupted or diverted by transition or integration issues, and the complexity of managing geographically and culturally diverse locations; and |
• | we may lose customers of those companies, or may lose our customers due to the change in control or for other reasons. |
- 12 -
The factors noted above could have a material adverse effect on our business, results of operations, and financial condition or cash flows, particularly in the case of a larger acquisition. From time to time, we may enter into negotiations for acquisitions or investments that are not ultimately consummated. These negotiations could result in significant diversion of management time, as well as out-of-pocket costs.
Future acquisitions may require us to incur or issue additional indebtedness or issue additional equity.
If we were to undertake future substantial acquisitions for cash, these acquisitions would likely need to be financed in part through bank borrowings, or the issuance of public or private debt. This acquisition financing would likely decrease our ratio of earnings to fixed charges and adversely affect other credit metrics. Our revolving credit facilities require us to obtain the lenders’ consent for certain additional debt financing and to comply with other covenants, including the application of specific financial ratios. We cannot assure that the necessary acquisition financing would be available to us on acceptable terms, if and when, required. If we were to make an acquisition with equity, the acquisition may have a dilutive effect on the interests of the holders of our common stock.
We may experience difficulties, delays, or unexpected costs in completing our cost reduction programs.
To remain competitive, particularly when business conditions are difficult, we sometimes take steps to reduce our cost structure by restructuring our existing businesses to achieve efficiencies, eliminate redundant functions, facilities and staff positions, and move operations, where possible, to reduce labor or other costs. In 2015 and in 2016, we announced various cost reduction programs as part of our continuous efforts to improve efficiency and operating performance. The Company recorded restructuring costs of approximately $4.5 million and $2.7 million during 2015 and 2016, respectively, in relation to cost reduction programs at its subsidiaries in Asia, United Kingdom, United States, Canada, and Israel in 2015 and in Europe, the United States, Canada and Costa Rica in 2016. We expect to complete the implementation of these cost reduction programs in 2017.
We may not realize, in full or in part, the anticipated benefits of these programs without encountering difficulties, which may include complications in the transfer of production knowledge, loss of key employees and/or customers, and the disruption of ongoing business. Any of these difficulties could delay and/or undermine our ability to realize the benefits of these cost reduction programs, as well as potentially adversely affecting our customer relationships and operations.
Our business is cyclical, and in periods of increased economic strength, we may experience intense demand for our products. If our cost reduction programs and related restructuring result in us not being able to satisfy our customer’s demand for products during a rising economy, and our competitors sufficiently expand production, we could lose customers and/or market share. These losses could have an adverse effect on our operations, financial condition, and results of operations.
We might require additional capital to support business growth and this capital might not be available.
We intend to continue to make investments to support our business growth and may require additional funds to respond to business challenges or opportunities, including the need to develop new offerings or enhance our existing offerings, enhance our operating infrastructure, or acquire complementary businesses and technologies. Accordingly, we may need to engage in equity or debt financings to secure additional funds. If we raise additional funds through further issuances of equity or convertible debt securities, our existing stockholders could suffer significant dilution, and any new equity securities we issue could have rights, preferences, and privileges superior to those of holders of our common stock. Any debt financing secured by us in the future could involve additional restrictive covenants relating to our capital raising activities and other financial and operational matters, which may make it more difficult for us to obtain additional capital and to pursue business opportunities, including potential acquisitions.
In addition, we may not be able to obtain additional financing on terms favorable to us, if at all. If we are unable to obtain adequate financing or financing on terms satisfactory to us, when we require it, our ability to continue to support our business growth and to respond to business challenges could be significantly limited.
We may encounter difficulties in the implementation or operation of new enterprise resource planning systems.
We have implemented, and continue to implement, new enterprise resource planning (“ERP”) systems in different parts of our business. ERP systems are integral to our ability to accurately and efficiently manage our manufacturing and sales activities, and provide critical business information to management. The implementation of an ERP system may cause us to incur additional costs, shipment delays, and related customer dissatisfaction; expend employee (including Company management) time and attention; and otherwise burden our internal resources. Any difficulties we encounter with the implementation or successful operation of an ERP system could damage the effectiveness of our business processes and could adversely impact our ability to accurately and effectively forecast and manage sales demand, manage our supply chain, and report management information on an accurate and timely basis, any of which could have a material adverse effect on our business and results of operations.
- 13 -
To remain successful, we must continue to innovate, and our investments in new technologies may not prove successful.
Our future operating results depend on our ability to continually develop, introduce, and market new and innovative products, to modify existing products, to respond to technological change, and to customize certain products to meet customer requirements. There are numerous risks inherent in this process, including the risks that we will be unable to anticipate the direction of technological change, that customers may be unwilling, or unable, to adopt the new products or methods of using them, that we will be unable to develop and market new products and applications in a timely fashion to satisfy customer demands, or that such products will experience quality or other qualification issues with our customers as they, and we, gain experience with qualifying them and using them. If this occurs, we could lose customers and experience adverse effects on our financial condition and results of operations.
Our success is dependent upon our ability to protect our proprietary technology and other intellectual property.
We rely on a combination of the protections provided by applicable patent, trademark, copyright, and trade secret laws, as well as on confidentiality procedures and other contractual arrangements, to establish and protect our rights in our technology, and related materials and information. We enter into agreements with our customers and distributors. These agreements contain confidentiality and non-disclosure provisions, a limited warranty covering our products, and indemnification for the customer from infringement actions related to our products.
Despite our efforts, it may be possible for others to copy portions of our products, reverse engineer them, or obtain and use information that we regard as proprietary, all of which could adversely affect our competitive position. Furthermore, there can be no assurance that our competitors will not independently develop technology similar to ours. The laws of certain countries in which we manufacture do not protect our intellectual property rights to the same extent as the laws of the United States. In the Office of the United States Trade Representative (“USTR”) annual "Special 301" Report released in April 2016, the adequacy and effectiveness of intellectual property protection in a number of foreign countries were analyzed.
A number of countries in which we manufacture are identified in the report as being on the Priority Watch List. In China, for instance, the USTR is concerned about the existence of serious obstacles to the effective protection of intellectual property rights, including unchecked trade secret theft, measures favoring domestically owned intellectual property, rampant piracy and counterfeiting in China's online and physical markets, extensive use of unlicensed software and the supply of counterfeit goods to foreign markets. The USTR also expressed concern that in India serious deficiencies remain in its legal framework and enforcement system for intellectual property rights. Algeria, Argentina, Chile, Indonesia, Kuwait, Russia, Thailand, Ukraine, and Venezuela were also identified because of problems in intellectual property enforcement. The absence of harmonized intellectual property protection laws and effective enforcement makes it difficult to ensure consistent respect for patent, trade secret, and other intellectual property rights on a worldwide basis. As a result, it is possible that we will not be able to enforce our rights against third parties that misappropriate our proprietary technology in those countries.
The success of our business is highly dependent on maintenance of intellectual property rights.
The unauthorized use of our intellectual property rights may increase the cost of protecting these rights or reduce our revenues. We seek to protect trade secrets and our other proprietary technology, in part, by requiring each of our employees to enter into non-disclosure and intellectual property assignment agreements. In these agreements, the employee agrees to maintain the confidentiality of all of our proprietary information and, subject to certain exceptions, to assign to us all rights in any proprietary information or technology made, or contributed, by the employee during his or her employment. Generally, we do not enter into non-compete arrangements with our employees, with the exception of certain executives and, in some cases, one or more of the principals of the businesses that we acquire.
All of these types of agreements may be breached or be found unenforceable, and we may not have an adequate remedy for any such breach of, or inability to enforce, these agreements. We may initiate, or be subject to, claims or litigation for infringement of proprietary rights, or to establish the validity of our proprietary rights, which could result in significant expense to us, cause product shipment delays, require us to enter royalty or licensing agreements, and divert the efforts of our technical and management personnel from productive tasks, whether or not such litigation were determined in our favor.
We may be exposed to product liability claims.
While our agreements with our customers and distributors typically contain provisions designed to limit our exposure to potential material product liability claims, including appropriate warranty, indemnification, damages waiver, and limitation of liability provisions, it is possible that such provisions may not be effective under the laws of some jurisdictions, thus exposing us to substantial liability. Moreover, defending a suit, regardless of its merits, could entail substantial expense, and require the time and attention of key management personnel. If product liability claims are brought against us, the costs associated with defending such claims may adversely affect our results of operations and future cash flows.
- 14 -
We must expend significant resources to obtain design wins without assurance that we will be successful.
In many cases, we must initiate communication with our customers, and convince the customer that our products and systems will offer solutions for its business that are technically superior and more cost effective compared to their existing arrangements. To do so, we must often expend significant financial and human resources to develop technologically compelling products or systems with no guarantee that they will be adopted by our customers. The non-recurring engineering (“NRE”) costs for product development in these cases could be substantial, and may adversely affect our profitability if we are unable to recover these costs.
Also, customers will often require a lengthy period of on-site testing before committing to purchase a product or system, during which period we will not receive material revenue from the customer. While a design win for our products and systems may result in a long period of recurring revenue during which we hope to recover our costs, we must often internally finance our development costs over significant time periods. If our products or systems fail to gain acceptance with our customers, we will be forced to absorb any NRE costs, which could adversely affect our business if these costs are substantial.
The long development times for certain of our products and systems may result in unpredictable fluctuations in revenue and results of operations.
Our force sensor products, and weighing and control systems, often involve long product development cycles, both to develop the product or system and to secure customer acceptance following what may be a lengthy on-site testing period. During product development and testing, we may incur substantial costs without corresponding revenues. If our custom product or system is ultimately accepted by the customer, we may then begin to realize substantial revenues from our development efforts.
In particular, our weighing and control systems can be priced for several hundred thousand dollars per unit, so that a contract to acquire one or more units can materially contribute to our revenues during the period or periods that we are permitted to recognize the contract revenues for accounting purposes. The nature of our weighing and control products and systems, and in particular, the products and systems manufactured by the steel business, may therefore result in substantial fluctuations in our operating results, including revenues and profitability, from period to period, even though there has been no fundamental change in our business or its prospects. Further, customers may request a delay in shipping a product they have ordered due to changes in their business needs, which may delay the revenue recognition for the product until shipment occurs. This may make it difficult for investors to undertake period-to-period comparisons of our performance. Also, the fluctuating nature of key components of our revenues may limit the visibility of our management regarding performance in future periods, and make it more difficult for our management to provide guidance to our investors.
We may not have adequate facilities to satisfy future increases in demand for our products.
Our business is cyclical and in periods of a rising economy, we may experience intense demand for our products. During such periods, we may have difficulty expanding our manufacturing capacity to satisfy demand. Factors which could limit such expansion include delays in procurement of manufacturing equipment, shortages of skilled personnel, and physical constraints on expansion at our facilities. If we are unable to meet our customers’ requirements and our competitors sufficiently expand production, we could lose customers and/or market share. These losses could have an adverse effect on our financial condition and results of operations. Also, capacity that we add during upturns in the business cycle may result in excess capacity during periods when demand for our products recedes, resulting in inefficient use of capital, adversely affecting our business.
The nature of the market for our products may render them particularly susceptible to downturns in the economic environment.
Our products are designed to replace and provide superior functionality over existing product infrastructure utilized by our customers. Often, it is only after introductory demonstrations by our sales and engineering teams that our customers come to appreciate the advantages of our products and systems, and the long-term benefits of their adoption. An economic downturn or extended period of economic uncertainty may make customers less receptive to adopting new technological solutions at our suggestion - even ones with demonstrated operational and financial advantages. During these periods, customers may defer, or even cancel, orders for products and systems for which they have previously contracted, or given indications of interest.
Also, because our business is concentrated largely in the industrial sector, we do not benefit from countervailing fluctuations in consumer demand. As a result, our business may be more significantly affected by the consequences of a general economic slowdown than other segments of our industry, and may also take longer to recover from the effects of a slowdown.
With the acquisition of Pacific, combined with our existing aerospace business, we depend on United States government contracts for a portion of our business.
The Pacific Instruments business derived effectively 100% of total net sales, either directly or indirectly, from the United States government in 2016 and in the years before that. In addition, parts of our historical business related to aerospace are also heavily dependent on products their customers produce related to United States government contracts.
We believe that the United States government continues to face significant deficit reduction pressures and it is likely that discretionary spending by the United States government will remain constrained for a number of years. Under such conditions
- 15 -
all programs are potentially subject to increased scrutiny. A decision by the United States government to cut spending or reduce planned orders could have an adverse impact on our results of operations.
Our backlog is subject to customer cancellation.
Many of the orders that comprise our backlog may be canceled by our customers without penalty. Our customers, particularly for our foil technology products, often cancel orders when business is weak and inventories are excessive, a situation that we have experienced during periods of economic slowdown. Therefore, we cannot be certain that the amount of our backlog accurately forecasts the level of orders that will ultimately be delivered. Our results of operations could be adversely impacted if customers cancel a material portion of orders in our backlog.
The complexity of our sophisticated weighing and control systems may require costly corrections if design flaws are found.
Our weighing and control systems combine sophisticated electronic hardware and computer software. We believe that the sophistication of our systems contributes to their competitive advantage over similar products offered by other system integrators. We go to substantial lengths to assure that our systems are free of design flaws when they are delivered to our customers for installation and testing. However, due to the systems’ complexity, design flaws may occur and require correction. If the requisite corrections are substantial, or difficult to implement due to the systems’ complexity, we may not be able to recover the costs of correction and retesting, with the result that our profit margins on these systems could be substantially reduced, or even negated by losses, and our results of operations could be materially and adversely affected.
Our results are sensitive to raw material availability, quality, and cost.
Although most materials incorporated in our products are available from a number of sources, certain materials are available only from a relatively limited number of suppliers. The materials that are only available from a limited number of sources include certain molding compounds, metal package suppliers, low resistance switches, polyimide film and laminating adhesives. We generally maintain a supply of strategic raw materials for continuity and risk management. Our customers would need significant advance notification to qualify alternative materials, if we had to use them. Alternative suppliers are available worldwide for most of our raw materials, but significant time (between 3 to 12 months) would be required to qualify new suppliers and establish efficient production scheduling.
Certain metals used in the manufacture of our products are traded on active markets, and can be subject to significant price volatility.
Our results of operations may be materially and adversely affected if we have difficulty obtaining these raw materials, if the quality of available raw materials deteriorates, if there are significant price changes for these raw materials, or if compliance with the laws and regulations described below proves costly and time-consuming. For periods in which the prices of these raw materials are rising, we may be unable to pass on the increased cost to our customers, which would result in decreased margins for the products in which they are used. For periods in which the prices are declining, we may be required to write down our inventory carrying cost of these raw materials, since we record our inventory at the lower of cost or market. Depending on the extent of the difference between market price and our carrying cost, this write-down could have a material adverse effect on our net earnings. We also may need to record losses for adverse purchase commitments for these materials in periods of declining prices.
Pursuant to the SEC’s “conflict minerals” rules, reporting companies that determine that certain metals, dubbed “conflict minerals” by the SEC (which include tantalum, gold, tin, and tungsten sourced from the Democratic Republic of the Congo or adjoining countries), are necessary to the functionality or production of a product they manufacture, or contract to have manufactured, must file a specialized disclosure form with the SEC. We use raw materials that are subject to conflict minerals rules. The compliance with the SEC's related disclosure requirements may affect the sourcing and availability of minerals used in the manufacture of our products. Also, because our supply chain is complex, we may face reputational challenges with our customers and other stakeholders if we are unable to materially verify the origins of all "in scope" metals used in our products.
Our product sales may be adversely affected by changes in product classification levels under various qualification and specification standards.
Certain of our products must be qualified or approved under various military and aerospace specifications and other standards.
We have qualified certain of our foil resistor products under various military specifications approved and monitored by the DLA, and under certain European military specifications, and various aerospace standards approved by NASA and the ESA.
Qualification and specification levels are based in part upon product failure rate. We must continuously perform tests on our products, and for products that are qualified, the results of these tests must be reported to the qualifying organization.
Certain of our force sensor products are approved by the NTEP and OIML. Our on-board weighing systems must meet approved standards to make them legal-for-trade.
- 16 -
If a product fails to meet the requirements for the applicable classification level or other approval, the product’s classification or approval may be suspended or reduced to a lower level. During the time that the classification is suspended or reduced to a lower level, net revenues and earnings attributable to that product may be adversely affected.
Our future success is substantially dependent on our ability to attract and retain highly qualified technical, managerial, marketing, finance, and administrative personnel.
The competitive environment of our business requires us to attract and retain highly qualified personnel to develop technological innovations and bring them to market on a timely basis. Our complex operations also require us to attract and retain highly qualified administrative personnel in functions such as legal, tax, accounting, business development, financial reporting, and treasury. The market for personnel with such qualifications is highly competitive. We have not entered into employment or non-competition agreements with many of our key personnel.
The loss of the services of, or the failure to effectively recruit, qualified personnel, including for key executive positions, could have a material adverse effect on our business.
Failure to maintain effective internal control over financial reporting could adversely affect our ability to meet our reporting requirements.
Effective internal control over financial reporting is necessary for us to provide reasonable assurance with respect to our financial reports, and to effectively prevent fraud. Internal control over financial reporting may not prevent or detect misstatements because of inherent limitations, including the possibility of human error, the circumvention or overriding of controls, or fraud. Therefore, even effective internal control over financial reporting can provide only reasonable assurance with respect to the preparation and fair presentation of financial statements. If we cannot provide reasonable assurance with respect to our financial reports and effectively prevent fraud, our operating results could be harmed. In addition, projections of any evaluation of effectiveness of internal control over financial reporting to future periods is subject to the risk that the control may become inadequate because of changes in conditions, or that the degree of compliance with the policies or procedures may deteriorate. Our acquisition of new businesses requires the integration and harmonization of the acquired business’ controls with our existing controls in order to properly account for the acquired business’ assets and operations. If we fail to maintain the effectiveness of our internal control over financial reporting, including any failure to implement required new or improved controls, or if we experience difficulties in their implementation, our business and operating results could be harmed, we could fail to meet our reporting obligations, and there could be a material adverse effect on our stock price.
We are exposed to, and may be adversely affected by, interruptions to our computer and information technology systems and sophisticated cyber-attacks.
We rely on our information technology systems and networks in connection with many of our business activities. Some of these networks and systems are managed by third party service providers and are not under our direct control. Our operations routinely involve receiving, storing, processing, and transmitting sensitive information pertaining to our business, customers, suppliers, employees, and other sensitive matters. Any cyber incidents could materially disrupt operational systems; result in loss of trade secrets or other proprietary or competitively sensitive information; compromise personally identifiable information regarding customers or employees; and jeopardize the security of our facilities. Because techniques used to obtain unauthorized access, or to sabotage systems, change frequently and generally are not recognized until they are launched against a target, we may be unable to anticipate these techniques, or to implement adequate preventative measures. Information technology security threats, including security breaches, computer malware, and other cyber-attacks are increasing in both frequency and sophistication, and could create financial liability, subject us to legal or regulatory sanctions, or damage our reputation with customers, suppliers, and other stakeholders. We continuously seek to maintain a robust program of information security and controls, but the impact of a material information technology event could have a material adverse effect on our competitive position, reputation, results of operations, financial condition, and cash flows.
Future changes in our environmental liability and compliance obligations may harm our ability to operate or increase costs.
Our manufacturing operations, products and/or packaging are subject to environmental laws and regulations governing air emissions, wastewater discharges, the handling, disposal, and remediation of hazardous substances, wastes, and certain chemicals used or generated in our manufacturing processes, workplace health and safety labeling, or other notifications with respect to the content, or other aspects of our processes, products or packaging, restrictions on the use of certain materials in or on design aspects of our products or packaging, and responsibility for disposal of products or packaging. New liabilities could arise, and we may have unavoidably inherited certain pre-existing environmental liabilities, generally based on successor liability doctrines. Although we have never been involved in any environmental matter that has had a material adverse impact on our overall operations, there can be no assurance that in connection with any past or future operation, acquisition or otherwise, we will not be obligated to address environmental matters that could have a material adverse impact on our operations. In addition, more stringent environmental regulations may be enacted in the future, and we cannot presently determine the modifications, if any, in our operations that any such future regulations might require, or the cost of compliance with these regulations.
- 17 -
Our credit facilities subject us to financial and operating restrictions.
We maintain revolving credit agreements and term loans with banks that we use, or may use, for working capital, acquisition financing, and other purposes. These credit facilities subject us to certain restrictions which may affect, and in some cases significantly limit or prohibit, among other things, our ability to:
• | borrow additional funds; |
• | pay dividends or make other distributions; |
• | repurchase our common stock; |
• | make investments, including capital expenditures; |
• | complete acquisitions; |
• | engage in transactions with affiliates or subsidiaries; or |
• | create liens on our assets. |
Our primary credit facility requires us to maintain certain financial ratios. If we fail to comply with the covenant restrictions contained in the credit facility, that failure could result in termination of the facility, and all amounts outstanding could become immediately payable.
Unexpected events, such as a natural disaster, could disrupt our operations and adversely affect our results of operations.
We have manufacturing and other facilities in countries around the world. Unexpected events, including fires or explosions at facilities; natural disasters, such as flooding, hurricanes, and earthquakes; war or terrorist activities; unplanned outages; supply disruptions; and failures of equipment or systems at any of our facilities could adversely affect our results of operation. If adverse conditions were to arise with respect to any of our facilities as a result of a natural disaster or other unexpected event, they may result in customer disruption, physical damage to one or more key operating facilities, the temporary closure of one or more key operating facilities, the temporary disruptions of information systems, and/or an adverse effect on our results of operations.
Changes in our tax rate or exposure to additional income tax liabilities could affect our profitability. In addition, audits by tax authorities could result in additional tax payments for prior periods.
We are subject to income taxes in the U.S. and in various foreign jurisdictions. Domestic and international tax liabilities are subject to the allocation of income among various tax jurisdictions. Our effective tax rate can be affected by changes in the mix of earnings in countries with differing statutory tax rates (including as a result of business acquisitions and dispositions), changes in the valuation of deferred tax assets and liabilities, accruals related to contingent tax liabilities, the results of audits and examinations of previously filed tax returns, and changes in tax laws.
Any of these factors may adversely affect our tax rate and decrease our profitability. The amount of income taxes we pay is subject to audit by U.S. federal, state, local, and foreign tax authorities. If these tax audits result in assessments, our future results may be unfavorably impacted.
As a global business, we have a complex tax structure, and there is a risk that the tax authorities will disagree with our transfer pricing.
We are subject to complex transfer pricing regulations in the U.S. and foreign countries in which we operate. Transfer pricing regulations generally require that transactions between related companies be determined comparable to transactions on an arm’s length basis and that contemporaneous documentation be maintained to support the pricing used. Although transfer pricing standards are generally similar in many of the countries in which we operate, there is still a relatively high degree of uncertainty and inherent subjectivity in complying with these requirements. This topic has received additional scrutiny in recent years, including the Organization for Economic Co-operation and Development’s Base Erosion and Profit Shifting project. To the extent that any tax authority disagrees with our transfer pricing practices, we could incur significant costs to defend our position and could be subject to significant additional tax liabilities, interest, and penalties.
We may not be able to realize our deferred tax assets which would adversely impact tax expense in future periods.
We regularly assess the ability to realize deferred tax assets in each jurisdiction in which we operate based on a number of factors, including historic operating results, estimates of future earnings, the economic environment, the nature and character of the income, and the existence of cost effective tax planning strategies. This assessment requires significant judgment. If we determine that deferred tax assets are not "more likely than not" to be realized, we record a valuation allowance to reduce deferred tax assets to a level that is expected to be realized. If we subsequently determine that realization becomes "more likely than not", a valuation allowance will be reversed. Any increase or decrease in our valuation allowances could have a significant impact on our financial results.
- 18 -
Approximately 83% of our cash and cash equivalents and short-term investment balances were held by our non-U.S. subsidiaries.
We generate a significant amount of cash and profits from our non-U.S. subsidiaries. As of December 31, 2016, $48.6 million of our cash and cash equivalents and short-term investments were held in countries outside of the United States. At the present time, we expect the cash and profits generated by our foreign subsidiaries will be indefinitely reinvested outside of the United States. Accordingly, no provision has been made for foreign withholding taxes or U.S. federal and state income taxes on these foreign earnings. Our ability to repatriate cash to the United States from a foreign country may be limited by foreign country laws regulating the distribution of cash and earnings. If we decide to repatriate cash to the United States and are able to do so, we could be subject to additional U.S., state, and foreign income taxes, and withholding taxes.
We use the mark Vishay under license from Vishay Intertechnology, which could result in product and market confusion.
We use the mark Vishay as part of our name and in connection with many of our products. Our use of the Vishay mark is governed by an agreement between us and Vishay Intertechnology, giving us a perpetual, royalty-free, worldwide license for the use of the mark. We believe that it is important that we continue the use of the Vishay name, to a certain extent, in order to benefit from the reputation of the Vishay brand, which was first used in connection with our foil resistors and strain gages when Vishay Intertechnology was founded over 50 years ago.
There are risks associated with our use of the Vishay mark, however, both for us and for Vishay Intertechnology. Because both we, and Vishay Intertechnology, use the Vishay mark, confusion could arise in the market regarding the products offered by the two companies, and there could be a misplaced perception of our continuing to be associated with Vishay Intertechnology. Also, any negative publicity associated with one of the two companies in the future could adversely affect the public image of the other. Finally, Vishay Intertechnology will have the right to terminate the license agreement, in certain extreme circumstances, if we are in material and repeated breach of the terms of the agreement, which would likely have an adverse effect on us and our business.
Risks relating to our operations outside the United States
We obtain substantial benefits by operating in Israel, but these benefits may not continue.
We have substantial operations in Israel. The low tax rates in Israel applicable to earnings of our operations in that country, compared to the rates in the United States, have the general effect of increasing our net earnings. Any significant increase in the Israeli tax rates could have an adverse impact on our results of operations. There can also be no assurance that, in the future, the Israeli government will offer new tax incentive programs applicable to us or that, if it does, such programs will provide the same level of benefits we have historically received prior to 2016, or that we will be eligible to benefit from them.
We attempt to improve profitability by operating in countries in which manufacturing efficiencies may be achieved, but the shift of operations to these regions may entail considerable expense.
Our strategy is aimed at achieving significant production cost savings through the transfer and expansion of manufacturing operations to and in countries in which we have existing capacity, as well as countries with lower production costs or other benefits, such as India and Israel. During this process, we may experience under-utilization of certain plants and factories in higher-cost regions, and capacity constraints in plants and factories located in lower-cost regions. Also, we may experience delays in the expected transition from a higher-cost location to a lower-cost one that results in greater than expected use of the higher-cost facility. This transitional utilization may result initially in production inefficiencies and higher costs. These costs include those associated with compensation in connection with workforce reductions and plant closings in the higher-cost regions, start-up expenses, manufacturing and construction delays, and increased depreciation costs in connection with the initiation or expansion of production in lower-cost regions. In addition, as we implement transfers of certain of our operations, we may experience strikes or other types of labor unrest as a result of layoffs or termination of our employees in higher-cost countries.
In connection with the transfer of manufacturing operations to lower-cost countries, and upgrading of existing facilities in higher-cost countries, we are also increasing the level of automation in our plants to optimize our capital and labor resources in production, inventory management, quality control, and warehousing. Although we have substantial experience with automation in several of our plants in higher-cost countries, there are risks in automating plants which previously did not use a significant amount of automation, including the possibility of inefficiencies and higher operating costs in the transition from manual to automated operations. If the transition extends longer than anticipated, we could suffer product yield inefficiencies, contributing to higher product costs and increasing the time it will take for us to achieve a return on our investment in the capital equipment involved in the automation process. Furthermore, any layoffs or termination of our employees as a result of increased automation may lead to strikes or other types of labor unrest. If we experience these types of inefficiencies, they could have an adverse effect on our operating results, customer relationships, and financial condition.
We are subject to the risks of political, economic, and military instability in countries outside the United States in which we operate.
Some of our products are produced in Israel, India, China, and other countries which are particularly subject to risks of political, economic, and military instability. This instability could result in wars, riots, nationalization of industry, currency fluctuations,
- 19 -
and labor unrest. These conditions could have an adverse impact on our ability to operate in these regions and, depending on the extent and severity of these conditions, could materially and adversely affect our overall financial condition and operating results.
Our business has been in operation in Israel for over 40 years. We have never experienced any material interruption in our operations attributable to these factors, in spite of several Middle East crises, including wars. However, we might be adversely affected if events were to occur in the Middle East that interfered with our operations in Israel.
We are subject to foreign currency exchange rate risks which may impact our results of operations.
We are exposed to foreign currency exchange rate risks, particularly due to market values of transactions in currencies other than the functional currencies of certain subsidiaries.
Our significant foreign subsidiaries are located in the United Kingdom, Canada, Germany, Israel, Japan, and India. Our operations in Europe, Canada and certain locations in Asia primarily generate and expend cash in local currencies. Our operations in Israel and certain locations in Asia primarily generate cash in U.S. dollars, but these subsidiaries also have significant transactions in local currencies. Our exposure to foreign currency exchange rate risk is more pronounced in situations such as our operations in Canada, India, Israel, China and Taiwan - where costs, such as production labor costs are predominantly paid in local currencies while the sales revenue for those products is denominated in U.S. dollars.
As of December 31, 2016, we did not have in place any arrangements to mitigate or hedge against exposures relating to fluctuations in foreign currency exchange rate.
A change in the mix of the currencies in which we transact our business could have a material effect on results of operations. Furthermore, the timing of cash receipts and disbursements could have a material effect on our results of operations, particularly if there are significant changes in exchange rates in a short period of time.
Risks Relating to Our Common Stock
Our smaller size may affect the trading market for our shares.
We are considered a “microcap” company and our trading volume is likely to fluctuate. Also, it is possible that there will be less market and institutional interest in our shares, and that we will not attract substantial coverage in the analyst community. As a result, the trading market for our shares may be less liquid, making it more difficult for investors to dispose of their shares at favorable prices, and investors may have less independent information and analysis available to them concerning our company.
Our stock price could become more volatile and investments could lose value.
The market price of our common stock, and the number of shares traded each day, has experienced significant fluctuations and may continue to fluctuate significantly. The market price for our common stock may be affected by a number of factors, including, but not limited to:
• | shortfalls in our expected net revenue, earnings or key performance metrics; |
• | changes in recommendations or estimates by securities analysts; |
• | the announcement of new products by us or our competitors; |
• | quarterly variations in our or our competitors’ results of operations; |
• | a change in our dividend or stock repurchase activities; |
• | developments in our industry or changes in the market for technology stocks; |
• | changes in rules or regulations applicable to our business; and |
• | other factors, including economic instability and changes in political or market conditions. |
A significant drop in our stock price could expose us to costly and time consuming litigation, which could result in substantial costs, and divert management’s attention and resources, resulting in an adverse effect on our business.
The holders of Class B convertible common stock have effective voting control of our company.
We have two classes of common stock: common stock and Class B convertible common stock. The holders of common stock are entitled to one vote for each share held, while the holders of Class B convertible common stock are entitled to 10 votes for each share held. The ownership of Class B convertible common stock is highly concentrated, and holders of Class B convertible common stock effectively can cause the election of directors and the approval/or disapproval of other matters requiring stockholder approval. Mrs. Ruta Zandman, the wife of the late founder of our technology, Dr. Felix Zandman, controls, or shares control of, the voting of approximately 76.8% of our Class B convertible common stock, representing 35.1% of the total voting power of our capital stock as of December 31, 2016.
- 20 -
Your percentage ownership of our common stock may be diluted in the future.
Your percentage ownership of our common stock may be diluted in the future because of equity awards that we expect will be granted to our directors, officers, and employees, as well as due to certain convertible or exchangeable debt instruments. The Vishay Precision Group, Inc. 2010 Stock Incentive Program provides for the grant of equity-based awards, including restricted stock, restricted stock units, stock options, and other equity-based awards to our directors, officers, and other employees, advisors and consultants.
Certain provisions of our certificate of incorporation and bylaws may reduce the likelihood of any unsolicited acquisition proposal or potential change of control that you might consider favorable.
Our bylaws contain provisions that could be considered “anti-takeover” provisions because they make it harder for a third party to acquire us without the consent of our incumbent board of directors. Under these by-law provisions:
• | stockholders may not change the size of the board of directors or, except in limited circumstances, fill vacancies on the board of directors; |
• | stockholders may not call special meetings of stockholders; |
• | stockholders must comply with advance notice provisions for nominating directors or presenting other proposals at stockholder meetings; and |
• | our Board of Directors, may without stockholder approval, issue preferred shares and determine their rights and terms, including voting rights, or adopt a stockholder rights plan. |
These provisions could have the effect of discouraging an unsolicited acquisition proposal or delaying, deferring, or preventing a change of control transaction that might involve a premium price or otherwise be considered favorable by our stockholders.
- 21 -
Item 1B. UNRESOLVED STAFF COMMENTS
None.
Item 2. PROPERTIES
Our business has approximately 22 principal locations. Our facilities include owned locations and locations leased from third parties. The principal locations, along with available space including administrative offices, are listed below:
Reporting segment | Approx. Available Space (square feet) | |||
Owned Locations | ||||
Wendell, North Carolina USA | Foil Technology Products | 147,000 | ||
Chennai, India (a) | Force Sensors | 129,000 | ||
Holon, Israel | Foil Technology Products | 97,000 | ||
Bradford, United Kingdom | Weighing and Control Systems | 75,000 | ||
Kent, Washington | Weighing and Control Systems | 47,000 | ||
Akita, Japan (b) | Foil Technology Products | 46,000 | ||
Chartres, France | Force Sensors | 11,000 | ||
Basingstoke, United Kingdom | Force Sensors/Foil Technology Products | 11,000 | ||
Alajuela, Costa Rica | Foil Technology Products | 8,000 | ||
Third-Party Leased Locations | ||||
Tianjin, People’s Republic of China | Force Sensors | 67,000 | ||
Toronto, Canada | Weighing and Control Systems | 65,000 | ||
Rancho Cucamonga, California USA | Force Sensors/Weighing and Control Systems | 54,000 | ||
Karmiel, Israel | Force Sensors | 26,000 | ||
Omer, Israel | Foil Technology Products | 24,000 | ||
Concord, California USA | Foil Technology Products | 16,000 | ||
Holon, Israel | Foil Technology Products | 16,000 | ||
Taipei, Republic of China (Taiwan) | Force Sensors/Weighing and Control Systems | 13,000 | ||
Degerfors, Sweden | Weighing and Control Systems | 8,000 | ||
Malvern, Pennsylvania USA | Corporate | 8,000 | ||
Norwood, Massachusetts USA | Weighing and Control Systems | 6,000 | ||
Teltow, Germany | Foil Technology Products | 6,000 | ||
Kelowna, Canada | Weighing and Control Systems | 3,000 | ||
(a) | The Chennai building is owned and the land is held under a 99 year lease (which began in 2012). |
(b) | A facility on the campus is leased to Vishay Intertechnology. Approximate available space reported above excludes the area leased. |
In the opinion of management, our properties and equipment generally are in good operating condition and are adequate for our present needs. We do not anticipate difficulty in renewing leases as they expire, or in finding alternative facilities.
Our corporate headquarters are located at 3 Great Valley Parkway, Suite 150, Malvern, PA 19355.
Item 3. LEGAL PROCEEDINGS
We are subject to various legal proceedings that constitute ordinary, routine litigation incidental to our business. In our opinion, the disposition of these proceedings will not have a material adverse effect on our business or our financial condition, results of operations, and cash flows.
Item 4. MINE SAFETY DISCLOSURES
Not applicable.
- 22 -
PART II
Item 5. MARKET FOR REGISTRANT’S COMMON EQUITY, RELATED STOCKHOLDER MATTERS, AND ISSUER PURCHASES OF EQUITY SECURITIES
Our common stock is listed on the New York Stock Exchange under the symbol VPG. The following table sets forth the high and low sales prices for our common stock as reported on the New York Stock Exchange composite tape for the indicated fiscal quarters. The Board of Directors may only declare dividends or other distributions with respect to the common stock or the Class B convertible common stock if it grants such dividends or distributions in the same amount, per share, with respect to the other class of stock. Stock dividends or distributions, on any class of stock, are payable only in shares of stock of that class. Shares of either common stock or Class B convertible common stock cannot be split, divided, or combined unless the other is also split, divided, or combined equally. Holders of record of our common stock totaled approximately 860 at March 16, 2017.
2016 | 2015 | ||||||||||||||
High | Low | High | Low | ||||||||||||
Fourth Quarter | $ | 19.45 | $ | 11.17 | $ | 13.02 | $ | 10.96 | |||||||
Third Quarter | $ | 16.32 | $ | 11.75 | $ | 15.55 | $ | 10.25 | |||||||
Second Quarter | $ | 15.48 | $ | 12.83 | $ | 16.18 | $ | 12.74 | |||||||
First Quarter | $ | 14.67 | $ | 10.27 | $ | 17.65 | $ | 14.52 | |||||||
We have two classes of common stock: common stock and Class B convertible common stock. The holders of common stock are entitled to one vote for each share held, while the holders of Class B convertible common stock are entitled to 10 votes for each share held. At March 16, 2017 we had outstanding 1,025,158 shares of Class B convertible common stock, par value $0.10 per share. Currently, the holders of VPG’s Class B convertible common stock hold approximately 45.7% of the voting power of our Company. Mrs. Ruta Zandman, the wife of the late founder of our technology, Dr. Felix Zandman, controls, or shares control of, the voting of approximately 76.8% of our Class B convertible common stock, representing 35.1% of the total voting power of our capital stock as of December 31, 2016.
- 23 -
Stock Performance Graph
The graph and table below compare the cumulative total stockholder return on the Company’s common stock over a sixty month period, with the returns on the Russell 2000 Stock Index, and a peer group of companies selected by our management. The peer group is made up of six publicly held manufacturers of sensors, sensor-based equipment, and sensor-based systems. Management believes that the product offerings of the peer group companies are more similar to our product offerings than those of the companies contained in any published industry index. The return of each peer issuer has been weighted according to the respective issuer’s stock market capitalization. The graph and table assume that $100 had been invested at December 31, 2011, and that all dividends were reinvested. The graph and table are not necessarily indicative of future investment performance.
12/31/11 | 12/31/12 | 12/31/13 | 12/31/14 | 12/31/15 | 12/31/16 | |||||||||||||
Vishay Precision Group, Inc. | Cumulative $ | 100.00 | 82.73 | 93.18 | 107.38 | 70.84 | 118.27 | |||||||||||
Russell 2000 Index | Cumulative $ | 100.00 | 116.35 | 161.52 | 169.42 | 161.95 | 196.45 | |||||||||||
Peer Group * | Cumulative $ | 100.00 | 133.90 | 168.83 | 195.59 | 189.87 | 201.87 | |||||||||||
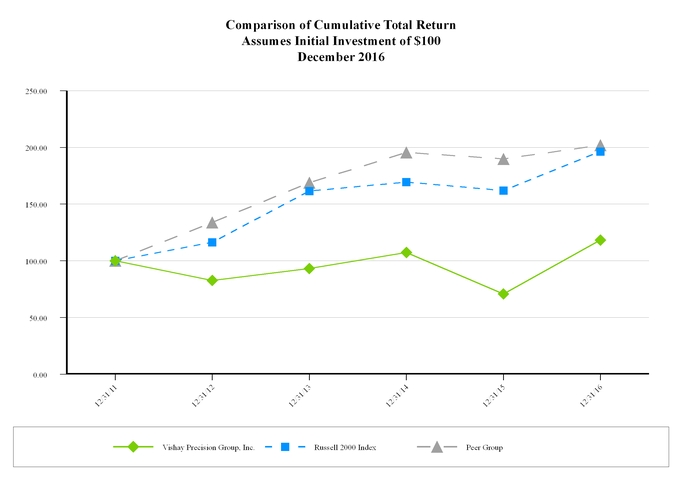
*The management selected peer group includes: MTS Systems, Kyowa Electronic Instruments, Mettler – Toledo, Spectris, Sensata Technologies, CTS Corp.
- 24 -
Item 6. SELECTED FINANCIAL DATA
The following table presents our selected historical financial data. The statements of operations data for each of the five years ended December 31, 2016 and the balance sheet data as of December 31, 2016, 2015, 2014, 2013, and 2012 have been derived from our audited consolidated financial statements.
The data should be read in conjunction with our historical financial statements and “Management’s Discussion and Analysis of Financial Condition and Results of Operations” included elsewhere in this document.
(in thousands, except per share amounts) | As of and for the years ended December 31, | ||||||||||||||||||
2016 | 2015 | 2014 | 2013 | 2012 | |||||||||||||||
Statement of Operations Data: | |||||||||||||||||||
Net revenues | $ | 224,929 | $ | 232,178 | $ | 250,028 | $ | 238,589 | $ | 217,616 | |||||||||
Costs of products sold | 142,120 | 147,949 | 159,254 | 155,134 | 142,567 | ||||||||||||||
Gross profit | 82,809 | 84,229 | 90,774 | 83,455 | 75,049 | ||||||||||||||
Selling, general, and administrative expenses | 68,938 | 71,282 | 77,034 | 74,059 | 63,692 | ||||||||||||||
Acquisition costs | 494 | 185 | — | 794 | 275 | ||||||||||||||
Impairment of goodwill and indefinite-lived intangibles | — | 4,942 | 5,579 | — | — | ||||||||||||||
Restructuring costs | 2,666 | 4,461 | 668 | 538 | — | ||||||||||||||
Operating income | 10,711 | 3,359 | 7,493 | 8,064 | 11,082 | ||||||||||||||
Other income (expense): | |||||||||||||||||||
Interest expense | (1,486 | ) | (771 | ) | (882 | ) | (967 | ) | (266 | ) | |||||||||
Other | 382 | (2,082 | ) | (740 | ) | (1,354 | ) | 331 | |||||||||||
Other (expense) income - net | (1,104 | ) | (2,853 | ) | (1,622 | ) | (2,321 | ) | 65 | ||||||||||
Income before taxes | 9,607 | 506 | 5,871 | 5,743 | 11,147 | ||||||||||||||
Income tax expense (benefit) | 3,199 | 13,500 | 2,613 | 1,251 | (1,144 | ) | |||||||||||||
Net earnings (loss) | 6,408 | (12,994 | ) | 3,258 | 4,492 | 12,291 | |||||||||||||
Less: net earnings attributable to noncontrolling interests | 4 | 14 | 178 | 56 | 73 | ||||||||||||||
Net earnings (loss) attributable to VPG stockholders | $ | 6,404 | $ | (13,008 | ) | $ | 3,080 | $ | 4,436 | $ | 12,218 | ||||||||
Earnings (loss) per share data: | |||||||||||||||||||
Basic | $ | 0.49 | $ | (0.96 | ) | $ | 0.22 | $ | 0.33 | $ | 0.91 | ||||||||
Diluted | $ | 0.48 | $ | (0.96 | ) | $ | 0.22 | $ | 0.32 | $ | 0.88 | ||||||||
Weighted average shares outstanding - basic | 13,187 | 13,485 | 13,755 | 13,563 | 13,367 | ||||||||||||||
Weighted average shares outstanding - diluted | 13,419 | 13,485 | 13,977 | 13,944 | 13,889 | ||||||||||||||
Balance Sheet Data: | |||||||||||||||||||
Cash and cash equivalents | $ | 58,452 | $ | 62,641 | $ | 79,642 | $ | 72,809 | $ | 93,839 | |||||||||
Total assets | 270,510 | 263,747 | 286,923 | 294,702 | 264,331 | ||||||||||||||
Long-term debt, less current portion | 33,529 | 31,037 | 17,713 | 22,936 | 11,154 | ||||||||||||||
Working capital | 118,952 | 121,065 | 131,714 | 137,391 | 153,642 | ||||||||||||||
Total VPG stockholders' equity | 171,383 | 172,256 | 199,651 | 206,046 | 197,879 | ||||||||||||||
- 25 -
Item 7. MANAGEMENT'S DISCUSSION AND ANALYSIS OF FINANCIAL CONDITION AND RESULTS OF OPERATIONS
Overview
VPG is an internationally recognized designer, manufacturer and marketer of sensors, and sensor-based measurement systems, as well as specialty resistors and strain gages based upon our proprietary technology. We provide precision products and solutions, many of which are “designed-in” by our customers, specializing in the growing markets of stress, force, weight, pressure, and current measurements. A significant portion of our products and solutions are primarily based upon our proprietary foil technology and are produced as part of our vertically integrated structure. We believe this strategy results in higher quality, more cost effective and focused solutions for our customers. Our products are marketed under a variety of brand names that we believe are characterized as having a very high level of precision and quality. Our global operations enable us to produce a wide variety of products in strategically effective geographic locations that also optimize our resources for specific technologies, sensors, assemblies, and systems.
The Company also has a long heritage of innovation in precision foil resistors, foil strain gages, and sensors that convert mechanical inputs into an electronic signal for display, processing, interpretation, or control by our instrumentation and systems products. Our advanced sensor product line continues this heritage by offering high-quality foil strain gages produced in a proprietary, highly automated environment. Precision sensors are essential to the accurate measurement, resolution and display of force, weight, pressure, torque, tilt, motion, or acceleration, especially in the legal-for-trade, commercial, and industrial marketplaces. This expertise served as a foundation for our expansion into strain gage instrumentation, load cells, transducers, weighing modules, and complete systems for process control and on-board weighing. Although our products are typically used in the industrial market, we believe our advanced sensors may find application outside the industrial market.
The precision sensor market is integral to the development of intelligent products across a wide variety of end markets upon which we focus, including medical, agricultural, transportation, industrial, avionics, military, and space applications. We believe that as original equipment manufacturers (“OEMs”) continue a drive to make products “smarter,” they will integrate more sensors and related systems into their solutions to link the mechanical/physical world with digital control and/or response. We believe this offers a substantial growth opportunity for our products and expertise.
VPG reports in three product segments: the Foil Technology Products segment, the Force Sensors segment, and the Weighing and Control Systems segment. The Foil Technology Products reporting segment is comprised of the foil resistor and strain gage operating segments. The Force Sensors reporting segment is comprised of transducers, load cells, and modules. The Weighing and Control Systems reporting segment is comprised of instruments, complete systems for process control, and on-board weighing applications.
Net revenues for the year ended December 31, 2016 were $224.9 million versus $232.2 million for the prior year. Net earnings (loss) attributable to VPG stockholders for the year ended December 31, 2016 were $6.4 million, or $0.48 per diluted share, versus $(13.0) million, or $(0.96) per diluted share, for the prior year.
The results of operations for the years ended December 31, 2016 and 2015 include items affecting comparability as listed in the reconciliations below. The reconciliations below include certain financial measures which are not recognized in accordance with U.S. generally accepted accounting principles ("GAAP"), including adjusted gross profits, adjusted gross profit margin, adjusted net earnings (loss), and adjusted net earnings (loss) per diluted share. These non-GAAP measures should not be viewed as an alternative to GAAP measures of performance. Non-GAAP measures such as adjusted gross profit margin, adjusted net earnings (loss), and adjusted net earnings (loss) per diluted share do not have uniform definitions. These measures, as calculated by VPG, may not be comparable to similarly titled measures used by other companies. Management believes that these measures are meaningful because they provide insight with respect to intrinsic operating results. The reconciling items presented below represent significant charges or credits which are important to understanding our intrinsic operations.
- 26 -
The items affecting comparability are (dollars in thousands, except per share amounts):
Years ended December 31, | |||||||
2016 | 2015 | ||||||
Gross profit | $ | 82,809 | $ | 84,229 | |||
Gross profit margin | 36.8 | % | 36.3 | % | |||
Reconciling items affecting gross profit margin | |||||||
Acquisition purchase accounting adjustments (a) | 586 | 172 | |||||
Adjusted gross profit | $ | 83,395 | $ | 84,401 | |||
Adjusted gross profit margin | 37.1 | % | 36.4 | % | |||
Years ended December 31, | |||||||
2016 | 2015 | ||||||
Net earnings (loss) attributable to VPG stockholders | $ | 6,404 | $ | (13,008 | ) | ||
Reconciling items affecting operating margin | |||||||
Acquisition purchase accounting adjustments (a) | 586 | 172 | |||||
Acquisition costs | 494 | 185 | |||||
Strategic alternative evaluation costs (b) | 1,344 | — | |||||
Gain on sale of building | (837 | ) | — | ||||
Impairment of goodwill and indefinite-lived intangibles | — | 4,942 | |||||
Restructuring costs | 2,666 | 4,461 | |||||
Less reconciling items affecting income tax expense | |||||||
Tax effect of reconciling items and discrete tax items(c) | 719 | (10,980 | ) | ||||
Adjusted net earnings attributable to VPG stockholders | $ | 9,938 | $ | 7,732 | |||
Weighted average shares outstanding - diluted | 13,419 | 13,485 | |||||
Adjusted net earnings per diluted share | $ | 0.74 | $ | 0.57 | |||
(a) | Acquisition purchase accounting adjustments include fair market value adjustments associated with inventory. |
(b) | The Company incurred costs associated with the Company's evaluation of strategic alternatives. The evaluation process did not result in the adoption of any particular strategic alternative other than the Company's continued execution of its business plan. It is not expected that the costs associated with the evaluation, which consisted principally of professional fees, will be continuing at this time. |
(c) | Included in the discrete tax items for 2016 is a $0.9 million tax benefit recorded related to a favorable fourth quarter 2016 settlement of an Israelis tax audit, offset by a series of correcting adjustments totaling $0.8 million to certain deferred tax accounts in various tax jurisdictions related to prior period balances. |
Financial Metrics
We utilize several financial measures and metrics to evaluate the performance and assess the future direction of our business. These key financial measures and metrics include net revenues, gross profit margin, end-of-period backlog, book-to-bill ratio, and inventory turnover.
Gross profit margin is gross profit shown as a percentage of net revenues. Gross profit is generally net revenues less costs of products sold, but could also include certain other period costs. Gross profit margin is clearly a function of net revenues, but also reflects our cost-cutting programs and our ability to contain fixed costs.
End-of-period backlog is one indicator of potential future sales. We include in our backlog only open orders that have been released by the customer for shipment in the next twelve months. If demand falls below customers’ forecasts, or if customers do not control
- 27 -
their inventory effectively, they may cancel or reschedule the shipments that are included in our backlog, in many instances without the payment of any penalty. Therefore, the backlog is not necessarily indicative of the results to be expected for future periods.
Another important indicator of demand in our industry is the book-to-bill ratio, which is the ratio of the amount of product ordered during a period compared with the product that we ship during that period. A book-to-bill ratio that is greater than one indicates that demand is higher than current revenues and manufacturing capacities, and it indicates that we may generate increasing revenues in future periods. Conversely, a book-to-bill ratio that is less than one is an indicator of lower demand compared to existing revenues and current capacities and may foretell declining sales.
We focus on our inventory turnover as a measure of how well we are managing our inventory. We define inventory turnover for a financial reporting period as our costs of products sold for the four fiscal quarters ending on the last day of the reporting period divided by our average inventory (computed using each quarter-end balance) for this same period. A higher level of inventory turnover reflects more efficient use of our capital.
The quarter-to-quarter trends in these financial metrics can also be an important indicator of the likely direction of our business. The following table shows net revenues, gross profit margin, the end-of-period backlog, the book-to-bill ratio, and the inventory turnover for our business as a whole during the five quarters beginning with the fourth quarter of 2015 and through the fourth quarter of 2016 (dollars in thousands):
4th Quarter 2015 | 1st Quarter 2016 | 2nd Quarter 2016 | 3rd Quarter 2016 | 4th Quarter 2016 | |||||||||||||||
Net revenues | $ | 58,913 | $ | 56,629 | $ | 57,996 | $ | 54,490 | $ | 55,814 | |||||||||
Gross profit margin | 35.2 | % | 34.9 | % | 37.1 | % | 37.2 | % | 38.1 | % | |||||||||
End-of-period backlog | $ | 48,800 | $ | 52,000 | $ | 51,400 | $ | 50,300 | $ | 56,800 | |||||||||
Book-to-bill ratio | 0.95 | 1.03 | 0.98 | 0.98 | 1.16 | ||||||||||||||
Inventory turnover | 2.77 | 2.62 | 2.52 | 2.36 | 2.41 | ||||||||||||||
- 28 -
4th Quarter 2015 | 1st Quarter 2016 | 2nd Quarter 2016 | 3rd Quarter 2016 | 4th Quarter 2016 | |||||||||||||||
Foil Technology Products | |||||||||||||||||||
Net revenues | $ | 26,244 | $ | 26,319 | $ | 25,359 | $ | 23,852 | $ | 25,412 | |||||||||
Gross profit margin | 36.5 | % | 42.3 | % | 36.8 | % | 36.2 | % | 40.4 | % | |||||||||
End-of-period backlog | $ | 22,500 | $ | 22,400 | $ | 23,800 | $ | 23,600 | $ | 28,800 | |||||||||
Book-to-bill ratio | 0.97 | 0.98 | 1.01 | 0.99 | 1.26 | ||||||||||||||
Inventory turnover | 2.99 | 2.67 | 2.65 | 2.57 | 2.57 | ||||||||||||||
Force Sensors | |||||||||||||||||||
Net revenues | $ | 15,586 | $ | 14,838 | $ | 15,396 | $ | 15,231 | $ | 14,769 | |||||||||
Gross profit margin | 20.2 | % | 18.4 | % | 29.0 | % | 31.0 | % | 25.3 | % | |||||||||
End-of-period backlog | $ | 11,500 | $ | 12,500 | $ | 11,700 | $ | 12,000 | $ | 13,000 | |||||||||
Book-to-bill ratio | 1.00 | 1.06 | 0.97 | 1.02 | 1.08 | ||||||||||||||
Inventory turnover | 2.06 | 2.15 | 1.97 | 1.84 | 1.93 | ||||||||||||||
Weighing and Control Systems | |||||||||||||||||||
Net revenues | $ | 17,083 | $ | 15,472 | $ | 17,241 | $ | 15,407 | $ | 15,633 | |||||||||
Gross profit margin | 47.0 | % | 38.3 | % | 44.7 | % | 44.9 | % | 46.5 | % | |||||||||
End-of-period backlog | $ | 14,800 | $ | 17,100 | $ | 15,900 | $ | 14,700 | $ | 15,000 | |||||||||
Book-to-bill ratio | 0.89 | 1.11 | 0.94 | 0.92 | 1.05 | ||||||||||||||
Inventory turnover | 4.15 | 3.50 | 3.27 | 2.98 | 3.08 | ||||||||||||||
Net revenues for the fourth quarter of 2016 increased 2.4% from the net revenues reported in the third quarter of 2016, and decreased 5.3% from $58.9 million of net revenues for the comparable prior year period.
Sequentially, higher net revenues in the Foil Technology Products and Weighing and Control Systems segments were due to higher volumes in each segment, partially offset by a decrease in net revenues in our Force Sensors segment, where we experienced lower volume. Net revenues for the fourth quarter of 2016 were negatively impacted by the effect of foreign exchange rates of $1.0 million as compared to the third quarter of 2016.
Compared to the fourth quarter of 2015, net revenues for the fourth quarter of 2016, including additional revenues from our two most recent acquisitions, were negatively impacted by the decrease in volume, predominately in the Foil Technology Products and Weighing and Control Systems segments. Net revenues for the fourth quarter of 2016 were negatively impacted by the effect of foreign exchange rates of $0.9 million as compared to the fourth quarter of 2015.
The gross profit margin in the fourth quarter of 2016 increased 0.9% as compared to the third quarter of 2016 and 2.9% as compared to the fourth quarter of 2015. Sequentially, higher gross profit margins in the Foil Technology Products and Weighing and Control Systems segments, due to higher volume, were partially offset by declines in the gross profit margin in the Force Sensors segments. The gross profit margin increase in the fourth quarter of 2016 as compared to the fourth quarter of 2015 reflects higher gross profit margin in the Foil Technology Products and Force Sensors segments due to increased volume, partially offset by a decline in the gross profit margin in the Weighing and Control Systems segment.
The Foil Technology Products segment revenues were $25.4 million in the fourth quarter of 2016, down 3.2% from $26.2 million in the fourth quarter last year, and up 6.5% from $23.9 million in the third quarter of 2016. The decrease from the prior year period was mainly due to lower volume from the test and measurement market sector in the Americas and Europe, which was only partially offset by the additional net revenues from the Pacific acquisition. The sequential increase in net revenue from the third quarter of 2016 was attributable to higher volume, primarily related to Pacific products. The gross profit margin for the fourth quarter of 2016 increased from the prior year quarter due to variable cost savings from operating efficiencies, partially offset by volume declines. Sequentially, the gross profit margin for the fourth quarter of 2016 increased from the third quarter of 2016 due to higher volume from Pacific and variable cost savings from operating efficiencies.
- 29 -
The Force Sensors segment net revenues of $14.8 million decreased 3.0% compared to revenues of $15.2 million in the prior quarter due to lower volume predominantly in the precision weighing market sector. Net revenues in the fourth quarter of 2016 were down 5.2% compared to $15.6 million in the fourth quarter last year. The decrease in revenues from the prior year period are attributable primarily to lower volume, product mix, and a negative exchange rate impact of $0.3 million. The gross profit margin for the quarter increased from the comparable prior year period primarily due to efficiencies achieved from our cost reduction programs. The sequential gross profit margin decreased from the third quarter of 2016 due to a decrease in volume, product mix, and a reduction in inventory.
The Weighing and Control Systems segment net revenues were $15.6 million in the fourth quarter of 2016, up 1.5% from $15.4 million in the third quarter of 2016 and down 8.5% from the $17.1 million in the fourth quarter last year. Sequentially, volume improved in our process weighing and steel businesses. However, those businesses declined from the prior year period, which offset the added net revenues from our Stress-Tek acquisition. The gross profit margin for the segment was 46.5% in the fourth quarter of 2016 versus 47.0% (47.8% excluding the KELK acquisition purchase accounting adjustments of $0.2 million) in the fourth quarter of 2015 and 44.9% in the third quarter of 2016. The decline in the gross profit margin for the quarter compared to the prior year period was due to the decline in volume. However, on a sequential basis, volume increased which, with a favorable product mix, resulted in an increase in gross profit margin.
Optimize Core Competence
The Company’s core competency and key value proposition is providing customers with proprietary foil technology products and precision measurement sensors and sensor-based systems. Our foil technology resistors and strain gages are recognized as global market leading products that provide high precision and high stability over extreme temperature ranges, and long life. Our force sensor products and our weighing and control systems products are also certified to meet some of the highest levels of precision measurements of force, weight, pressure, torque, tilt, motion, and acceleration. We continue to optimize all aspects of our development, manufacturing and sales processes, including by increasing our technical sales efforts; continuing to innovate in product performance and design; and refining our manufacturing processes.
Our foil technology research group developed innovations that enhance the capability and performance of our strain gages, while simultaneously reducing their size and power consumption as part of our advanced sensors product line. We believe this new foil technology will create new markets as customers “design in” these next generation products in existing and new applications. Our development engineering team is also responsible for creating new processes to further automate manufacturing, and improve productivity and quality. Our advanced sensors manufacturing technology offers us the capability to produce high-quality foil strain gages in a highly automated environment, which we expect to result in reduced manufacturing and lead times, and increased margins. The implementation of this innovative manufacturing technology was the basis for a significant portion of the restructuring efforts we undertook in 2015 and 2016.
Our design, research, and product development teams, in partnership with our marketing teams, drive our efforts to bring innovations to market. We intend to leverage our insights into customer demand to continually develop and roll out new, innovative products within our existing lines and to modify our existing core products in ways that make them more appealing, addressing changing customer needs and industry trends in terms of form, fit, and function.
We also seek to achieve significant production cost savings through the transfer, expansion, and construction of manufacturing operations in countries such as India and Israel, where we can benefit from lower labor costs, improved efficiencies, or available tax and other government-sponsored incentives. For example, in 2016, we relocated a significant portion of our force sensor manufacturing from leased locations with higher labor costs, to the owned facility we constructed in India. We closed a facility in Costa Rica and consolidated its functions to existing operations where significant efficiencies were available. This consolidation was part of our global restructuring and cost reduction program announced in November 2015 and substantially completed in 2016.
Acquisition Strategy
We expect to continue to make strategic acquisitions where opportunities present themselves to grow our segments. Historically, our growth and acquisition strategy has been largely focused on vertical product integration, using our foil strain gages in our force sensor products, and incorporating those products into our weighing and control systems. The acquisitions of Stress-Tek and KELK, each of which employ our foil strain gages to manufacture load cells for their systems, continue this strategy. Additionally, the KELK acquisition resulted in the acquisition of certain optical sensor technology. The Pacific Instruments acquisition significantly broadened our existing data acquisition offerings and opened new markets for us. Along with our recent success in MEMS technology for on-board weighing, we expect to expand our expertise, and our acquisition focus, outside our traditional vertical approach to other precision sensor solutions in the fields of measurement of force, weight, pressure, torque, tilt, motion, and acceleration. We believe acquired businesses will benefit from improvements we implement to reduce redundant functions and from our current global manufacturing and distribution footprint.
- 30 -
Research and Development
Research and development will continue to play a key role in our efforts to introduce innovative products to generate new sales and to improve profitability. We expect to continue to expand our position as a leading supplier of precision foil technology products. We believe our R&D efforts should provide us with a variety of opportunities to leverage technology, products, and our manufacturing base in order to ultimately improve our financial performance. The amount charged to expense for research and development aggregated $11.1 million, $9.6 million, and $10.1 million for the years ended December 31, 2016, 2015, and 2014, respectively.
Cost Management
To be successful, we believe we must seek new strategies for controlling operating costs. Through automation in our plants, we believe we can optimize our capital and labor resources in production, inventory management, quality control, and warehousing. We are in the process of moving some manufacturing from higher-cost countries to lower-cost countries. This may enable us to become more efficient and cost competitive, and also maintain tighter controls of the operation.
Production transfers, facility consolidations, and other long-term cost-cutting measures require us to initially incur significant severance and other exit costs. We are realizing the benefits of our restructuring through lower labor costs and other operating expenses, and expect to continue reaping these benefits in future periods. However, these programs to improve our profitability also involve certain risks which could materially impact our future operating results, as further detailed in Part I, Item 1A “Risk Factors” of this Annual Report on Form 10-K.
The Company recorded restructuring costs of $2.7 million, $4.5 million, and $0.7 million during the years ended December 31, 2016, 2015, and 2014, respectively. Restructuring costs were comprised primarily of employee termination costs, including severance and statutory retirement allowances, and were incurred in connection with various cost reduction programs.
We are evaluating plans to further reduce our costs by consolidating additional manufacturing operations. These plans may require us to incur restructuring and severance costs in future periods. While streamlining and reducing fixed overhead, we are exercising caution so that we will not negatively impact our customer service, or our ability to further develop products and processes.
Foreign Currency
We are exposed to foreign currency exchange rate risks, particularly due to transactions in currencies other than the functional currencies of certain subsidiaries. U.S. GAAP requires that entities identify the “functional currency” of each of their subsidiaries and measure all elements of the financial statements in that functional currency. A subsidiary’s functional currency is the currency of the primary economic environment in which it operates. In cases where a subsidiary is relatively self-contained within a particular country, the local currency is generally deemed to be the functional currency. However, a foreign subsidiary that is a direct and integral component or extension of the parent company’s operations generally would have the parent company’s currency as its functional currency. We have subsidiaries that fall into each of these categories.
Foreign Subsidiaries which use the Local Currency as the Functional Currency
Our operations in Europe, Canada, and certain locations in Asia primarily generate and expend cash using local currencies, and accordingly, these subsidiaries utilize the local currency as their functional currency. For those subsidiaries where the local currency is the functional currency, assets and liabilities in the consolidated balance sheets have been translated at the rate of exchange as of the balance sheet date. Translation adjustments do not impact the results of operations and are reported as a separate component of equity.
For those subsidiaries where the local currency is the functional currency, revenues and expenses are translated at the average exchange rate for the year. While the translation of revenues and expenses into U.S. dollars does not directly impact the consolidated statements of operations, the translation effectively increases or decreases the U.S. dollar equivalent of revenues generated and expenses incurred in those foreign currencies.
Foreign Subsidiaries which use the U.S. Dollar as the Functional Currency
Our operations in Israel and certain locations in Asia primarily generate cash in U.S. dollars, and accordingly, these subsidiaries utilize the U.S. dollar as their functional currency. For those foreign subsidiaries where the U.S. dollar is the functional currency, all foreign currency financial statement amounts are remeasured into U.S. dollars. Exchange gains and losses arising from remeasurement of foreign currency-denominated monetary assets and liabilities are included in the results of operations. While these subsidiaries transact most business in U.S. dollars, they may have significant costs, particularly related to payroll, which are incurred in the local currency.
- 31 -
Effects of Foreign Exchange Rate on Operations
For the year ended December 31, 2016, exchange rate impacts reduced net revenues by $2.8 million, and reduced costs of products sold and selling, general, and administrative expenses by $3.1million, when compared to the prior year. For the year ended December 31, 2015, exchange rate impacts reduced net revenues by $17.5 million, and costs of products sold and selling, general, and administrative expenses by $16.4 million, when compared to the prior year. For the year ended December 31, 2014, exchange rate impacts reduced net revenues by $0.8 million, and costs of products sold and selling, general, and administrative expenses by $1.2 million, when compared to the prior year.
Off-Balance Sheet Arrangements
As of December 31, 2016 and 2015, we did not have any off-balance sheet arrangements.
Critical Accounting Policies and Estimates
Our significant accounting policies are summarized in Note 1 to our consolidated financial statements. We identify here a number of policies that entail significant judgments or estimates by management.
Revenue Recognition
We recognize revenue on product sales during the period when the sales process is complete. This generally occurs when products are shipped to the customer in accordance with terms of an agreement of sale, title and risk of loss have been transferred, collectability is reasonably assured, and pricing is fixed or determinable. For a small percentage of sales where title and risk of loss pass at the point of delivery, we recognize revenue upon delivery to the customer, assuming all other criteria for revenue recognition are met.
Some of our larger systems products have post-shipment obligations, such as customer acceptance, training, or installation. In such circumstances, a portion of the revenue may be deferred until the obligation has been completed, unless such obligation is deemed inconsequential and perfunctory.
Given the specialized nature of our products, we generally do not allow product returns.
Accounts Receivable
Our receivables represent a significant portion of our current assets. We are required to estimate the collectability of our receivables and to establish allowances for the amount of receivables that will prove uncollectible. We base these allowances on our historical collection experience, the length of time our receivables are outstanding, the financial circumstances of individual customers, and general business and economic conditions.
Inventories
We value our inventories at the lower of cost or market, with cost determined under the first-in, first-out method, and market based upon net realizable value. The valuation of our inventories requires management to make market estimates. For work in process goods, we are required to estimate the cost to completion of the products and the prices at which we will be able to sell the products. For finished goods, we must assess the prices at which we believe the inventory can be sold. Inventories are also adjusted for estimated obsolescence and written down to net realizable value based upon estimates of future demand, technology developments, and market conditions.
Business Combinations
The Company allocates the purchase price of an acquired company, including when applicable, the fair value of contingent consideration between tangible and intangible assets acquired and liabilities assumed from the acquired businesses based on estimated fair values, with any residual of the purchase price recorded as goodwill. Third party appraisal firms and other consultants are engaged to assist management in determining the fair values of certain assets acquired and liabilities assumed. Estimating fair values requires significant judgments, estimates and assumptions, including but not limited to: discount rates, future cash flows and the economic lives of trade names, technology, customer relationships, property, plant and equipment, as well as income taxes. These estimates are based on historical experience and information obtained from the management of the acquired companies, and are inherently uncertain.
Estimates of Restructuring and Severance Costs
To maintain our cost competitiveness, we are shifting manufacturing emphasis to more advanced automation in higher-cost regions and relocating production to regions with skilled workforces and relatively lower labor costs. We could also incur similar costs after we acquire companies.
- 32 -
These production transfers, facility consolidations, and other long-term cost-cutting measures require us to initially incur significant severance and other exit costs. We anticipate that we will realize the benefits of our restructuring efforts through lower labor costs and other operating efficiencies in future periods.
Restructuring and severance costs are expensed during the period in which we incur those costs and all other requirements for accrual are met. Because transfers of manufacturing operations sometimes occur incrementally over a period of time, the expense initially recorded is often based on estimates. Because these costs are recorded based on estimates, our actual expenditures for restructuring activities may differ from the initially recorded costs. If this happens, we will adjust our estimates in future periods, either by recording additional expenses in future periods if our initial estimates were too low, or by reversing part of the charges that we recorded initially if our initial estimates were too high.
Goodwill and Other Intangible Assets
Goodwill, indefinite-lived trademarks, and in-process research and development ("IPRD") assets are tested for impairment at least annually, and whenever events or changes in circumstances occur indicating that it is "more likely than not" impairment may have been incurred. We have the option to first assess qualitative factors to determine whether it is "more likely than not" that the fair value of a reporting unit is less than its carrying amount as a basis for determining if it is necessary to perform the two-step goodwill impairment test. However, if we conclude otherwise, then we are required to perform the first step of the two-step impairment test by calculating the fair value of the reporting unit and comparing it against its carrying amount. We estimate the fair value of our reporting units by considering both an income approach and a market approach to valuation. The income approach to valuation uses our estimates of the future cash flows of the reporting unit discounted to their net present value using a discount rate determined using the capital asset pricing model and adjusted for the forecast risk inherent in our projections of future cash flows. The income approach to valuation is dependent on inputs from management such as expected revenue growth, profitability, capital expenditures, and working capital requirements. The market approach to valuation uses the market capitalization of public companies similar to the reporting unit to calculate an implied EBITDA multiple, and we apply that calculated EBITDA multiple to the expected EBITDA of the reporting unit to estimate the fair value of the reporting unit, after consideration of appropriate control premiums. We weigh the results of the income approach and the market approach to arrive at the estimated fair value of the reporting unit. If the carrying amount of a reporting unit exceeds its fair value, then we are required to perform the second step of the goodwill impairment test. To measure the amount of the impairment, we determine the implied fair value of goodwill in the same manner as if we had acquired those reporting units. Specifically, we must allocate the fair value of the reporting unit to all of the assets of that unit, including any unrecognized intangible assets, in a hypothetical calculation that would yield the implied fair value of goodwill. The impairment loss is measured as the difference between the book value of the goodwill and the implied fair value of the goodwill computed in step two.
The indefinite-lived trade names are tested for impairment either by employing the qualitative approach outlined above, or by comparing the carrying value to the fair value based on current revenue projections of the related operations, under the relief from royalty method. Any excess carrying value over the applicable fair value is recognized as impairment. Any impairment would be recognized in the reporting period in which it has been identified.
In 2015 and 2014, we estimated the fair value of our IPRD asset using an income approach to valuation. We estimated the future cash flows associated with the IPRD and discounted those cash flows back to their net present value using a discount rate determined using the capital asset pricing model, and adjusted for the forecast risk inherent in our projections of cash flows associated with this asset. Our estimates of cash flows included revenues to be generated by the products supported by the IPRD and the expected profits on those product sales. As of the date of the 2016 impairment test, IPRD was subject to amortization and therefore was not included as part of the 2016 impairment test.
Definite-lived assets, such as customer relationships, patents and acquired technology, non-competition agreements, and certain trade names are amortized on a straight-line method over their estimated useful lives. Patents and acquired technology are being amortized over useful lives of seven to twenty years. Customer relationships are being amortized over useful lives of five to eighteen years. Trade names are being amortized over their contractual period ranging from seven to ten years. Non-competition agreements are being amortized over periods of five to ten years. We review the carrying values of these assets for possible impairment whenever events or changes in circumstances indicate that the carrying value of the asset may not be recoverable based on undiscounted estimated cash flows expected to result from its use and eventual disposition.
During 2016, we recognized no impairment loss associated with the goodwill and indefinite lived intangible assets from the KELK acquisition. During 2015 and 2014, we recognized impairment losses associated with the goodwill and indefinite lived intangible assets from the KELK acquisition, which were recognized in the third quarter of fiscal 2015 and the fourth quarter of fiscal 2014. The impairments were driven principally by the impacts of excess steel manufacturing capacity, particularly in China, on our current and forecasted sales of product manufactured and sold by the reporting unit with the impairment losses. After considering
- 33 -
the impact of the impairment charges, the carrying value of goodwill, indefinite-lived trade names, and IPRD of this reporting unit as of December 31, 2015 was $6.2 million, $1.0 million, and $0.1 million, respectively. The carrying values of goodwill, indefinite-lived trade names, and IPRD of this reporting unit as of December 31, 2014 were $12.8 million, $1.4 million, and $0.1 million, respectively. Additional impairments could be recognized in the future to the extent that actual future operating results of the reporting unit are less favorable than those included in the forecasts used to derive our estimates of the fair value of the reporting unit, trade name, and IPRD. We believe that our estimates of the future operating performance of the reporting unit are reasonable in the circumstances and were based on the best available information as of the dates of our impairment tests.
Impairment of Long-Lived Assets
We assess the impairment of our long-lived assets, other than goodwill and indefinite-lived intangible assets, including property and equipment, whenever events or changes in circumstances indicate the carrying value may not be recoverable. Factors we consider important, which could trigger an impairment review, include significant changes in the manner of our use of the asset, changes in historical or projected operating performance, and significant negative economic trends.
Pension and Other Postretirement Benefits
Accounting for defined benefit pension and other postretirement plans involves numerous assumptions and estimates. The discount rate at which obligations could effectively be settled and the expected long-term rate of return on plan assets are two critical assumptions in measuring the cost and benefit obligations of our pension and other postretirement benefit plans. Other important assumptions include the anticipated rate of future increases in compensation levels, estimated mortality, and for postretirement medical plans, increases or trends in health care costs. Management reviews these assumptions at least annually. We use independent actuaries to assist us in formulating assumptions and making estimates. These assumptions are updated periodically to reflect the actual experience and expectations on a plan-specific basis, as appropriate.
Our defined benefit plans are concentrated in the United States and the United Kingdom. Plans in these countries comprise approximately 86% of our retirement obligations at December 31, 2016. We utilize published long-term high-quality bond indices to determine the discount rate at the measurement date. We utilize bond yields at various maturity dates to reflect the timing of expected future benefit payments. We believe the discount rates selected are the rates at which these obligations could effectively be settled.
For benefit plans which are funded, we establish strategic asset allocation percentage targets and appropriate benchmarks for significant asset classes with the aim of achieving a prudent balance between return and risk. We set the expected long-term rate of return based on the expected long-term average rates of return to be achieved by the underlying investment portfolios. In establishing this rate, we consider historical and expected returns for the asset classes in which the plans are invested, advice from pension consultants and investment advisors, and current economic and capital market conditions. The expected return on plan assets is incorporated into the computation of pension expense. The difference between this expected return and the actual return on plan assets is deferred.
We believe that the current assumptions used to estimate plan obligations and annual expense are appropriate in the current economic environment. However, if economic conditions change, we may be inclined to change some of our assumptions, and the resulting change could have a material impact on the consolidated statements of operations and on the consolidated balance sheets.
Income Taxes
We are subject to income taxes in the United States and numerous foreign jurisdictions. Our annual effective tax rate is based on pre-tax earnings, statutory tax rates, enacted tax laws and the ability to utilize net operating losses and tax credits. Significant judgments and estimates must be made in determining our consolidated income tax expense as presented in our financial statements.
We must assess the likelihood that we will realize deferred tax assets which requires significant judgment. If we determine that deferred tax assets are not "more likely than not" to be realized, we record a valuation allowance to reduce deferred tax assets to a level that is expected to be realized. If we subsequently determine that realization of a deferred tax asset becomes "more likely than not", the valuation allowance will be reversed. Any change in valuation allowances could have a significant impact on our financial results.
The calculation of our tax liabilities involves an assessment of uncertainties in the application of complex tax laws and regulations in multiple jurisdictions. We record a benefit from an uncertain tax position when it is "more likely than not" that a tax return position will be sustained upon examination, including resolutions of any related appeals or litigation based on the technical merits of the position. If the position is not "more likely than not" to be sustained, a liability for the tax return position is established. We adjust the liability when our judgment changes as a result of the evaluation of new information. The ultimate tax due in a jurisdiction
- 34 -
may result in a payment that is materially different from our most recent estimate of the liability. Further judgment is required in determining whether an uncertain tax position is effectively settled. Any change in the analysis will impact income tax expense.
We consider the earnings of most of our non-U.S. subsidiaries to be indefinitely invested outside the United States based on our estimates that future domestic cash generation will be sufficient to meet future domestic cash needs and our plans for reinvestment of foreign subsidiary earnings. We estimate that withholding taxes of approximately $14.7 million would be payable upon remittance of all previously unremitted earnings at December 31, 2016. If we decide to distribute earnings to the United States from a foreign country, we would adjust our income tax provision in the period we determine that the earnings are no longer indefinitely invested outside the United States.
On July 6, 2010, we entered into a Tax Matters Agreement with Vishay Intertechnology under which Vishay Intertechnology is responsible for all income taxes for periods before the date of the spin-off other than those taxes for which a liability was recorded on our books at the time of the spin-off. Vishay Intertechnology is also principally responsible for managing any income tax audits by the various tax jurisdictions for pre-spin-off periods.
Additional information about income taxes is included in Note 6 to our consolidated financial statements.
- 35 -
Results of Operations – Years Ended December 31, 2016, 2015, and 2014
Statement of operations’ captions as a percentage of net revenues and the effective tax rates were as follows:
Years ended December 31, | ||||||||
2016 | 2015 | 2014 | ||||||
Costs of products sold | 63.2 | % | 63.7 | % | 63.7 | % | ||
Gross profit | 36.8 | % | 36.3 | % | 36.3 | % | ||
Selling, general, and administrative expenses | 30.6 | % | 30.7 | % | 30.8 | % | ||
Operating income | 4.8 | % | 1.4 | % | 3.0 | % | ||
Income before taxes | 4.3 | % | 0.2 | % | 2.3 | % | ||
Net earnings (loss) | 2.8 | % | (5.6 | )% | 1.3 | % | ||
Net earnings (loss) attributable to VPG stockholders | 2.8 | % | (5.6 | )% | 1.2 | % | ||
Effective tax rate | 33.3 | % | 2,668.0 | % | 44.5 | % | ||
Net Revenues
Net revenues were as follows (dollars in thousands):
Years ended December 31, | |||||||||||
2016 | 2015 | 2014 | |||||||||
Net revenues | $ | 224,929 | $ | 232,178 | $ | 250,028 | |||||
Change versus prior year | $ | (7,249 | ) | $ | (17,850 | ) | |||||
Percentage change versus prior year | (3.1 | )% | (7.1 | )% | |||||||
Changes in net revenues were attributable to the following:
2016 vs. 2015 | 2015 vs. 2014 | ||||
Change attributable to: | |||||
Change in volume | (7.2 | )% | (0.1 | )% | |
Change in average selling prices | 0.1 | % | (0.1 | )% | |
Foreign currency effects | (1.1 | )% | (7.0 | )% | |
Acquisitions | 5.2 | % | — | % | |
Other | -0.1 | % | 0.1 | % | |
Net change | (3.1 | )% | (7.1 | )% | |
During the year ended December 31, 2016, revenues decreased 3.1% over the prior year. The increase in revenues attributable to the acquisitions of Stress-Tek and Pacific was offset by volume decreases in the Foil Technology Products segment, predominantly in the test and measurement market sector, and the Weighing and Control Systems segments, predominantly in the steel market sector.
During the year ended December, 31, 2015, revenues decreased 7.1% over the prior year, mainly due to exchange rate effects, which impacted all segments. The primary currencies contributing to this impact were the British pound, Canadian dollar, euro, Japanese yen, and Swedish krona.
- 36 -
Gross Profit Margin
Gross profit as a percentage of net revenues was as follows:
Years ended December 31, | ||||||||
2016 | 2015 | 2014 | ||||||
Gross profit margin | 36.8 | % | 36.3 | % | 36.3 | % | ||
The gross profit margin for the year ended December 31, 2016 increased slightly over the prior year mainly due to improved gross profit margins in the Force Sensors segment. Favorable impacts from the cost reduction programs implemented in this segment offset the decreased gross profit margins in the Foil Technology Products segment and the Weighing and Control Systems segment.
The gross profit margin for the year ended December 31, 2015 remained flat when compared with the prior year. An increase in gross profit margin in the Foil Technology Products segment was offset by decreases in gross profit margin in the Force Sensors and Weighing and Control Systems segments, as compared to the prior year.
Segments
Analysis of revenues and gross profit margins for our reportable segments is provided below.
Foil Technology Products
Net revenues of the Foil Technology Products segment were as follows (dollars in thousands):
Years ended December 31, | |||||||||||
2016 | 2015 | 2014 | |||||||||
Net revenues | $ | 100,942 | $ | 104,460 | $ | 107,758 | |||||
Change versus prior year | $ | (3,518 | ) | $ | (3,298 | ) | |||||
Percentage change versus prior year | (3.4 | )% | (3.1 | )% | |||||||
Changes in Foil Technology Products segment net revenues were attributable to the following:
2016 vs. 2015 | 2015 vs. 2014 | ||||
Change attributable to: | |||||
Change in volume | (7.9 | )% | 2.8 | % | |
Change in average selling prices | 0.3 | % | 0.1 | % | |
Foreign currency effects | 0.4 | % | (5.8 | )% | |
Acquisitions | 3.8 | % | — | % | |
Other | — | % | (0.2 | )% | |
Net change | (3.4 | )% | (3.1 | )% | |
For the year ended December 31, 2016, net revenues decreased 3.4% as compared to the prior year. Revenues added from the acquisition of Pacific were offset by lower volume. This reduced volume was primarily attributable to a downturn in the foil strain gage business, resulting from overstocking of inventory by our distributors as well as a decline in demand from the oil and gas sector.
For the year ended December 31, 2015, the impact of improved volume was offset by foreign currency effects, primarily relating to the euro and the Japanese yen.
- 37 -
Gross profit as a percentage of net revenues for the Foil Technology Products segment was as follows:
Years ended December 31, | ||||||||
2016 | 2015 | 2014 | ||||||
Gross profit margin | 39.0 | % | 39.9 | % | 39.0 | % | ||
For the year ended December 31, 2016, the gross profit margin decreased slightly as compared to the prior year mainly due to lower volume and labor inefficiencies related to the expansion of our advanced sensors platform.
For the year ended December 31, 2015, the gross profit margin slightly improved as compared to the prior year. Volume increases and lower variable costs helped to offset the impact of negative exchange rate effects.
Force Sensors
Net revenues of the Force Sensors segment were as follows (dollars in thousands):
Years ended December 31, | |||||||||||
2016 | 2015 | 2014 | |||||||||
Net revenues | $ | 60,234 | $ | 61,048 | $ | 68,301 | |||||
Change versus prior year | $ | (814 | ) | $ | (7,253 | ) | |||||
Percentage change versus prior year | (1.3 | )% | (10.6 | )% | |||||||
Changes in Force Sensors segment net revenues were attributable to the following:
2016 vs. 2015 | 2015 vs. 2014 | ||||
Change attributable to: | |||||
Change in volume | 0.8 | % | (6.5 | )% | |
Change in average selling prices | (0.6 | )% | (0.1 | )% | |
Foreign currency effects | (1.5 | )% | (4.4 | )% | |
Other | — | % | 0.4 | % | |
Net change | (1.3 | )% | (10.6 | )% | |
For the year ended December 31, 2016, revenues decreased 1.3% from the prior year. The slight improvement in volume was offset by negative foreign currency effects, primarily relating to the British pound.
For the year ended December 31, 2015, revenues decreased from the prior year. The decrease in volume, coupled with negative foreign currency effects, primarily relating to the euro and the British pound, were the main drivers of the decline. The reduction in volume is primarily due to weakness in the precision weighing market sector.
Gross profit as a percentage of net revenues for the Force Sensors segment was as follows:
Years ended December 31, | ||||||||
2016 | 2015 | 2014 | ||||||
Gross profit margin | 26.0 | % | 20.5 | % | 21.8 | % | ||
For the year ended December 31, 2016, the gross profit margin increased when compared to the prior year primarily due to cost savings realized from the movement of production from a leased facility in China to an owned facility in India and positive foreign currency impacts.
For the year ended December 31, 2015, the gross profit margin decreased when compared to the prior year primarily due to the volume decrease and negative foreign currency impacts described above.
- 38 -
Weighing and Control Systems
Net revenues of the Weighing and Control Systems segment were as follows (dollars in thousands):
Years ended December 31, | |||||||||||
2016 | 2015 | 2014 | |||||||||
Net revenues | $ | 63,753 | $ | 66,670 | $ | 73,969 | |||||
Change versus prior year | $ | (2,917 | ) | $ | (7,299 | ) | |||||
Percentage change versus prior year | (4.4 | )% | (9.9 | )% | |||||||
Changes in Weighing and Control Systems segment net revenues were attributable to the following:
2016 vs. 2015 | 2015 vs. 2014 | ||||
Change attributable to: | |||||
Change in volume | (13.7 | )% | 1.8 | % | |
Change in average selling prices | 0.4 | % | (0.3 | )% | |
Foreign currency effects | (3.5 | )% | (11.4 | )% | |
Acquisitions | 12.5 | % | — | % | |
Other | (0.1 | )% | — | % | |
Net change | (4.4 | )% | (9.9 | )% | |
For the year ended December 31, 2016, revenues decreased 4.4% when compared to the prior year. The increase in volume from the acquisition of Stress-Tek was offset by declines in volume from reduced demand in the steel industry, particularly in China, oil and gas downturn in the Norwegian offshore market and uncertainty in capital spending following the Brexit announcement. Foreign currency effects also negatively impacted net revenues.
For the year ended December 31, 2015, revenues decreased when compared to the prior year. Slight improvements in volume of products sold into the steel industry and in our on-board weighing business were completely offset by the negative foreign currency effects, primarily relating to the British pound, Canadian dollar, euro, and Swedish krona.
Gross profit as a percentage of net revenues for the Weighing and Control Systems segment was as follows:
Years ended December 31, | ||||||||
2016 | 2015 | 2014 | ||||||
Gross profit margin | 43.6 | % | 45.1 | % | 45.8 | % | ||
For the year ended December 31, 2016, the gross profit margin decreased from the prior year mainly due to lower volume in the process weighing and steel businesses and also the negative effect of foreign currencies, primarily the British pound, Euro and the Canadian dollar .
For the year ended December 31, 2015, the gross profit margin decreased from the prior year mainly due to the negative foreign currency effects described above.
Selling, General, and Administrative Expenses
Selling, general, and administrative (“SG&A”) expenses were as follows (dollars in thousands):
Years ended December 31, | |||||||||||
2016 | 2015 | 2014 | |||||||||
Total SG&A expenses | $ | 68,938 | $ | 71,282 | $ | 77,034 | |||||
as a percentage of net revenues | 30.6 | % | 30.7 | % | 30.8 | % | |||||
- 39 -
SG&A expenses for the year ended December 31, 2016 decreased $2.3 million versus the prior year. These decreases were related to reductions in personnel costs including headcount reductions, bonus accrual adjustments, adjustments to share-based compensation expense, and reductions in both travel and professional fees. The decrease was partially offset by an increase of $1.3 million in costs associated with our evaluation of strategic alternatives to enhance stockholder value and $4.3 million associated with our two acquisitions, Stress-Tek, which was acquired on December 30, 2015, and Pacific, which was acquired on April 6, 2016. Foreign currency exchange rates had the effect of reducing SG&A expenses by $0.8 million and the gain on the sale of a building in Karmiel, Israel had the effect of reducing SG&A expenses by $0.8 million.
SG&A expenses for the year ended December 31, 2015 decreased $5.8 million versus the prior year. The impact of foreign currency exchange rates had the effect of reducing SG&A expenses by $5.9 million.
Acquisition Costs
For the year ended December 31, 2016, we recorded acquisition costs in our consolidated statements of operations of $0.5 million in connection with the acquisitions of Stress-Tek and Pacific. For the year ended December 31, 2015, we recorded acquisition costs of $0.2 million in connection with the acquisition of Stress-Tek.
Impairment of Goodwill and Indefinite-lived Intangible Assets
For the year ended, December 31, 2016, there was no impairment in the carrying value of our goodwill and indefinite-lived intangible assets.
For the year ended December 31, 2015, we recorded a $4.9 million pre-tax, non-cash impairment charge which reduced the carrying value of our goodwill and indefinite-lived intangible assets, as a result of an interim impairment test performed on goodwill and indefinite-lived intangible assets. See our critical accounting policies and Note 4 for further discussion.
For the year ended December 31, 2014, we recorded a $5.6 million pre-tax, non-cash impairment charge which reduced the carrying value of our goodwill and indefinite-lived intangible assets, as a result of our required annual impairment test performed on goodwill and indefinite-lived intangible assets.
Restructuring Costs
Restructuring costs reflect the cost reduction programs implemented by the Company. Restructuring costs are expensed during the period in which the Company determines it will incur those costs and all requirements for accrual are met. Because these costs are recorded based upon estimates, actual expenditures for the restructuring activities may differ from the initially recorded costs. If the initial estimates are too low or too high, the Company could be required to either record additional expense in future periods, or to reverse part of the previously recorded charges.
On March 23, 2016, the Company announced, in connection with the November 16, 2015 global cost reduction program, the decision to close its facility in Alajuela, Costa Rica. Approximately $0.4 million of restructuring costs were recorded during the year ended December, 31, 2016 related to this closure. This closure was substantially complete as of December 31, 2016.
On November 16, 2015, the Company announced a cost reduction program as part of its efforts to improve efficiency and operating performance. Approximately $0.4 million of restructuring costs, excluding the costs associated with the Costa Rica closure, were recorded during the year ended December 31, 2016 related to this program. The Company has already exceeded its anticipated annual savings of at least $6.0 million. Complete implementation of this program is expected to occur by the end of the second quarter of 2017.
During the year ended December 31, 2016, the Company initiated other cost reduction plans at locations in Europe, the U.S. and Canada. Approximately $1.9 million of restructuring costs, primarily severance, were recorded during the year ended December 31, 2016 related to these plans.
The Company recorded restructuring costs of $2.7 million, $4.5 million, and $0.7 million during the years ended December 31, 2016, 2015, and 2014, respectively. Restructuring costs were comprised primarily of employee termination costs, including severance and statutory retirement allowances, and were incurred in connection with various cost reduction programs.
Other Income (Expense)
Interest Expense
The Company recorded interest expense of $1.5 million, $0.8 million, and $0.9 million for the years ended, December 31, 2016, 2015, and 2014, respectively. Interest expense was higher in 2016, as compared to the prior year periods, due to higher debt associated with funding the acquisitions of Stress-Tek and Pacific, which were completed on December 30, 2015 and April 6, 2016, respectively.
- 40 -
Other
The following table analyzes the components of the line “Other” on the consolidated statements of operations (in thousands):
Years ended December 31, | |||||||||||
2016 | 2015 | Change | |||||||||
Foreign exchange gain/(loss) | $ | 449 | $ | (2,146 | ) | $ | 2,595 | ||||
Interest income | 179 | 225 | $ | (46 | ) | ||||||
Other | (246 | ) | (161 | ) | $ | (85 | ) | ||||
$ | 382 | $ | (2,082 | ) | $ | 2,464 | |||||
Foreign currency exchange gains and losses represent the impact of changes in foreign currency exchange rates. The change in foreign exchange gains/(losses) during the period, as compared to the prior year period, is primarily due to fluctuations in the Canadian dollar and the British pound.
Years ended December 31, | |||||||||||
2015 | 2014 | Change | |||||||||
Foreign exchange loss | $ | (2,146 | ) | $ | (945 | ) | $ | (1,201 | ) | ||
Interest income | 225 | 261 | (36 | ) | |||||||
Other | (161 | ) | (56 | ) | (105 | ) | |||||
$ | (2,082 | ) | $ | (740 | ) | $ | (1,342 | ) | |||
Foreign currency exchange gains and losses represent the impact of changes in foreign currency exchange rates. The change in foreign exchange losses during the period, as compared to the prior year period is primarily due to fluctuations in the Canadian dollar and Israeli shekel.
Income Taxes
Our effective tax rate for the year ended December 31, 2016 was 33.3%, compared to 2,668.0% for the year ended December 31, 2015, and 44.5% for the year ended December 31, 2014. Our effective tax rate is lower in 2016 compared to 2015 primarily due to the establishment in 2015 of a significant valuation allowance with respect to substantially all of our U.S. deferred tax assets at the time. We reassessed our ability to realize our U.S. deferred tax assets during 2016 and have concluded that realization of those deferred tax assets is still not "more likely than not". The valuation allowance on U.S. deferred tax assets was increased for the additional deferred tax assets generated in 2016. In addition, our tax rate is affected by recurring items, such as tax rates in foreign jurisdictions as compared to the U.S. federal statutory tax rate, and the relative amount of income earned in each jurisdiction. The tax rate is also impacted by discrete items that vary from year to year and may not be indicative of the tax rate on continuing operations. The following items had the most significant impact on the difference between the statutory U.S. federal income tax rate and our effective tax rate:
2016
• | 13.2% rate increase relating to the current year impact of establishing valuation allowances on deferred tax assets, primarily with respect to U.S. federal and state deferred tax assets. |
• | 8.5% rate increase related to the adjustment of deferred tax assets established in various foreign jurisdictions in prior years. |
• | 10.5% rate reduction related to the difference between the U.S. statutory rate and foreign tax rates primarily attributable to our operations in Israel. |
• | 9.4% rate reduction attributable to changes in our liability for uncertain tax positions, primarily attributable to the settlement of a tax examination in Israel. |
2015
• | 2,572.5% rate increase resulting primarily from the establishment of valuation allowances with respect to substantially all of the U.S. federal and state deferred tax assets. |
- 41 -
• | 201.7% rate reduction from differences between U.S. and non-U.S. statutory tax rates which is primarily attributable to our operations in Israel. No tax provision has been recorded for additional U.S. tax attributable to these foreign earnings since our intention is to indefinitely reinvest these earnings outside the U.S. |
• | 71.2% rate increase primarily resulting from the non-deductible portion of the goodwill impairment associated with the Weighing and Control Systems segment. |
2014
• | 23.2% rate reduction due to the net reversal of a valuation allowance on deferred tax assets. The primary driver of the decrease was the release of $1.6 million of the valuation allowance against a portion of the U.S. foreign tax credit carryforward, due to a legal reorganization of certain of our Asian subsidiaries. |
• | 38.6% rate reduction resulting from tax rate differences between U.S. and non-U.S. jurisdictions. No provision has been made for U.S. taxes, as the majority of our undistributed foreign earnings are intended to be indefinitely reinvested outside the United States. The primary driver of the rate difference is associated with our operations in Israel. |
• | 43.0% rate increase resulting from the generation of U.S. tax on foreign earnings, net of foreign tax credits. The primary driver of the increase relates to the legal reorganization mentioned above. |
• | 17.0% rate increase resulting from the remeasurement of certain foreign jurisdiction's deferred tax assets, which are subject to U.S. dollar functional currency reporting. |
• | 5.2% rate increase primarily resulting from the non-deductible portion of the goodwill impairment associated with the Weighing and Control Systems segment. |
• | 4.7% rate increase due to the recording of an uncertain tax position relating to foreign jurisdictions in which we operate. |
Additional information about income taxes is included in Note 6 to our consolidated financial statements.
Financial Condition, Liquidity, and Capital Resources
We believe that our current cash and cash equivalents, credit facilities, and projected cash from operations will be sufficient to meet our liquidity needs for at least the next 12 months.
On December 30, 2015, the Company entered into a Second Amended and Restated Credit Agreement (the “2015 Credit Agreement”) among the Company, VPG Canada, the lenders, Citizens Bank, National Association and Wells Fargo Bank, National Association as joint book-runners and JPMorgan Chase Bank, National Association as agent for such lenders (the “Agent”), pursuant to which the terms of the Company’s multi-currency, secured credit facility were revised and expanded to provide for the following facilities: (1) a secured revolving facility (the “2015 Revolving Facility”) in an aggregate principal amount of $30.0 million, with a sublimit of $10.0 million which can be used for letters of credit for the account of the Company or its U.S. and Canadian subsidiaries, the proceeds of which may be used for working capital and general corporate purposes, and a portion of which was used to fund the Stress-Tek and Pacific acquisitions; (2) a secured closing date term facility for the Company (the “2015 U.S. Closing Date Term Facility”) in an aggregate principal amount of $4.5 million, the proceeds of which were used by the Company to refinance indebtedness under its existing term loan; (3) a secured delayed draw term facility for the Company (the "2015 U.S. Delayed Draw Term Facility") in an aggregate principal amount of $11.0 million, the proceeds of which were used to fund a portion of the Stress-Tek acquisition; and (4) a secured term facility for VPG Canada (the “2015 Canadian Term Facility”) in an aggregate principal amount of $9.5 million, the proceeds of which were used by VPG Canada to refinance indebtedness under its existing term loan. The aggregate principal amount of the 2015 Revolving Facility may be increased by a maximum of $15.0 million upon the request of the Company, subject to the terms of the 2015 Credit Agreement. The 2015 Credit Agreement terminates on December 30, 2020. The term loans are being repaid in quarterly installments.
Interest payable on amounts borrowed under the 2015 Revolving Facility, the 2015 U.S. Closing Date Term Facility, the 2015 U.S. Delayed Draw Term Facility, and the 2015 Canadian Term Facility (collectively, the “Facilities”) is based upon, at the Company’s option, (1) the greatest of: the Agent’s prime rate, the Federal Funds rate, or a LIBOR floor (the “Base Rate”), or (2) LIBOR plus a specified margin. An interest margin of 0.25% is added to Base Rate loans. Depending upon the Company’s leverage ratio, an interest rate margin ranging from 2.00% to 3.50% per annum is added to the applicable LIBOR rate to determine the interest payable on the Facilities. The Company is required to pay a quarterly commitment fee of 0.30% per annum to 0.50% per annum on the unused portion of the 2015 Revolving Facility, which is determined based on the Company’s leverage ratio each quarter. Additional customary fees apply with respect to letters of credit. The total interest rates at December 31, 2016 and December 31, 2015, were 4.00% and 3.75%, respectively, for the 2015 Revolving and U.S. Delayed Draw Term Facilities and 4.00% and 3.11%, respectively, for the 2015 U.S. Closing Date Term and 2015 Canadian Term Facilities.
The obligations of the Company and VPG Canada under the 2015 Credit Agreement are secured by pledges of stock in certain domestic and foreign subsidiaries, as well as guarantees by substantially all of the Company’s domestic subsidiaries and of the
- 42 -
Company (with respect to the 2015 Canadian Term Facility). The obligations of the Company and the guarantors under the 2015 Credit Agreement are secured by substantially all the assets (excluding real estate) of the Company and such guarantors. The 2015 Canadian Term Facility is secured by substantially all the assets of VPG Canada and by a secured guarantee by the Company and its domestic subsidiaries. The 2015 Credit Agreement restricts the Company from paying cash dividends and requires the Company to comply with other customary covenants, representations, and warranties, including the maintenance of specific financial ratios. The financial maintenance covenants include a tangible net worth ratio, a leverage ratio, and a fixed charges coverage ratio. The Company was in compliance with its financial maintenance covenants at December 31, 2016. If the Company is not in compliance with any of these covenant restrictions, the credit facility could be terminated by the lenders, and all amounts outstanding pursuant to the credit facility could become immediately payable.
The 2015 Credit Agreement replaced our previous credit agreement, entered into on January 30, 2013 in connection with our acquisition of KELK, among the Company, VPG Canada, the lenders, RBS Citizens, National Association as joint book-runner and JPMorgan Chase Bank, National Association as agent for such lenders (the “Prior Credit Agreement"). Interest payable on amounts borrowed under the facilities provided for in the Prior Credit Agreement was based upon LIBOR plus a specified margin. The Company was required to pay a quarterly commitment fee of 0.30% per annum to 0.50% per annum on the unused portion of the revolving facility. The total interest rate was 2.76% at December 31, 2014.
By reason of the spin-off, VPG assumed the liability for an aggregate $10.0 million principal amount of exchangeable notes effective July 6, 2010. The maturity date of the notes is December 13, 2102. Effective August 28, 2013, a holder of the Company's exchangeable notes exercised its option to exchange approximately $5.9 million principal amount of the notes for 259,687 shares of VPG common stock. Following this transaction, VPG has outstanding exchangeable unsecured notes with a principal amount of approximately $4.1 million, which are exchangeable for an aggregate of 181,537 shares of VPG common stock. The total interest rate was 1.00% at December 31, 2016.
Our other long-term debt is not significant and consists of debt held by one of our Japanese subsidiaries of approximately $0.5 million at December 31, 2016 and $0.6 million at December 31, 2015. The debt is payable monthly over the next 5 years at a zero percent interest rate.
See Note 7 to our consolidated financial statements for additional details.
Due to our strong product portfolio and market position, our business has historically generated significant cash flow. Our cash provided by operating activities for the year ended December 31, 2016 was $11.4 million as compared to $13.9 million for the year ended December 31, 2015, and $23.3 million for the year ended December 31, 2014. Cash provided by operating activities for the year ended December 31, 2016 was impacted by cash payments of $4.2 million related to restructuring and $1.1 million related to the strategic alternative evaluation process. Cash provided by operating activities for the year ended December 31, 2015 was impacted by a decrease in net earnings. Cash provided by operating activities for the year ended December 31, 2014 was impacted by an increase in net earnings, offset by a net increase in working capital accounts.
Approximately 83% and 90% of our cash and cash equivalents balance at December 31, 2016 and 2015, respectively, was held by our non-U.S. subsidiaries. See the following table for the percentage of cash and cash equivalents, by region, at December 31, 2016 and December 31, 2015:
December 31, | |||||
2016 | 2015 | ||||
Asia | 27 | % | 26 | % | |
United States | 17 | % | 10 | % | |
Israel | 16 | % | 24 | % | |
Europe | 19 | % | 17 | % | |
United Kingdom | 12 | % | 13 | % | |
Canada | 9 | % | 10 | % | |
Total | 100 | % | 100 | % | |
We earn a significant amount of our operating income outside the United States, the majority of which is deemed to be indefinitely reinvested in the foreign jurisdictions. As a result, as discussed above, a significant portion of our cash and short-term investments are held by foreign subsidiaries. We currently do not intend, nor do we foresee a need, to repatriate these funds. We expect existing domestic cash, short-term investments, and cash flows from operations to continue to be sufficient to fund our domestic operating activities and cash commitments for investing and financing activities, such as debt repayment and capital expenditures, for at least the next 12 months and thereafter for the foreseeable future.
- 43 -
If we should require more capital in the United States than is generated by our domestic operations, for example, to fund significant discretionary activities, such as business acquisitions, we could elect to repatriate future earnings from foreign jurisdictions or raise capital in the United States through debt or equity issuances. These alternatives could result in higher tax expense, increased interest expense, or dilution of our earnings. We consider the undistributed earnings of the majority of our foreign subsidiaries as of December 31, 2016, to be indefinitely reinvested and, accordingly, no provision has been made for U.S. income taxes. As of December 31, 2016, the amount of cash associated with indefinitely reinvested foreign earnings was approximately $48.6 million.
For the year ended December 31, 2016, we generated free cash of $5.2 million. We refer to “free cash,” a measure which management uses to evaluate our ability to fund acquisitions, as the amount of cash generated from operations ($11.4 million) in excess of our capital expenditures ($10.4 million) and net of proceeds from the sale of assets ($4.2 million). Included in the net proceeds from sale of assets for the year ended December 31, 2016, are proceeds of $3.7 million from the sale of our property in Karmiel, Israel.
The following table summarizes the components of net cash (debt) at December 31, 2016 and at December 31, 2015 (in thousands):
December 31, | |||||||
2016 | 2015 | ||||||
Cash and cash equivalents | $ | 58,452 | $ | 62,641 | |||
Third-party debt, including current and long-term | |||||||
Term loans | $ | 23,000 | $ | 25,000 | |||
Revolving debt | 9,000 | 4,000 | |||||
Third-party debt held by Japanese subsidiary | 509 | 614 | |||||
Exchangeable notes, due 2102 | 4,097 | 4,097 | |||||
Deferred financing costs | (454 | ) | (554 | ) | |||
Total third-party debt | 36,152 | 33,157 | |||||
Net cash | $ | 22,300 | $ | 29,484 | |||
Measurements such as “free cash” and “net cash (debt)” do not have uniform definitions and are not recognized in accordance with U.S. GAAP. Such measures should not be viewed as alternatives to GAAP measures of performance or liquidity. However, management believes that “free cash” is a meaningful measure of our ability to fund acquisitions, and that an analysis of “net cash (debt)” assists investors in understanding aspects of our cash and debt management. These measures, as calculated by us, may not be comparable to similarly titled measures used by other companies.
Our financial condition as of December 31, 2016 is strong, with a current ratio (current assets to current liabilities) of 4.2 to 1.0, as compared to a current ratio of 3.9 to 1.0 at December 31, 2015.
Cash paid for property and equipment for the year ended December 31, 2016 and December 31, 2015 was $10.4 million and $10.0 million, respectively. Capital spending for 2016 was comprised of projects related to the normal maintenance of business, cost reduction programs, and some carryover projects from 2015. Capital expenditures for 2017 are expected to be approximately $14.0 million to $16.0 million. The majority of these capital expenditures will be incurred outside the United States.
Contractual Commitments
As of December 31, 2016, we had contractual obligations as follows (in thousands):
- 44 -
Payments due by period | |||||||||||||||||||
Total | Less than 1 year | 1-3 years | 4-5 years | After 5 years | |||||||||||||||
Long-term debt | $ | 36,606 | $ | 2,623 | $ | 8,996 | $ | 20,890 | $ | 4,097 | |||||||||
Interest payments on long-term debt | 6,079 | 832 | 1,349 | 586 | 3,312 | ||||||||||||||
Operating leases | 7,896 | 2,820 | 3,703 | 1,308 | 65 | ||||||||||||||
Unrecognized tax benefits, including interest and penalties | 805 | 177 | — | — | 628 | ||||||||||||||
Expected pension and postretirement plan benefit payments from unfunded plans (a) | 3,611 | 360 | 626 | 785 | 1,840 | ||||||||||||||
Expected pension and postretirement plan contributions to funded plans (b) | 965 | 965 | — | — | — | ||||||||||||||
Total contractual cash obligations | $ | 55,962 | $ | 7,777 | $ | 14,674 | $ | 23,569 | $ | 9,942 | |||||||||
(a) | Due to the nature of unfunded plans, benefit payments are considered to be funded when paid. |
(b) | Due to the uncertainty of future cash outflows, contributions to the pension and other postretirement benefit plans subsequent to 2017 have been excluded from the table above. |
Our consolidated balance sheet at December 31, 2016 includes approximately $0.9 million of liabilities associated with uncertain tax positions relating to multiple taxing jurisdictions. There are certain guarantees and indemnifications extended among Vishay Intertechnology and us in accordance with the terms of the Master Separation and Distribution Agreement and the Tax Matters Agreement. The guarantees primarily relate to certain contingent tax liabilities included in the Tax Matters Agreement. See Note 6 to our consolidated financial statements for further discussion of the Tax Matters Agreement.
Of the $0.9 million of unrecognized tax benefits, $0.8 million are associated with our post spin-off operation, and thus are not covered under the terms of the Tax Matters Agreement. Due to the uncertainty and complexity relating to the settlement of tax matters, including the difficulty in predicting the conclusion of tax audits around the world, we are unable to make reliable estimates of the timing and amount of the remaining cash outflows, if any, relating to these liabilities. Accordingly, the remaining uncertain tax positions are classified as payments due after five years, although actual timing of payments may be sooner. See Note 6 to our consolidated financial statements for additional information.
Inflation
Normally, inflation does not have a significant impact on our operations as our products are not generally sold on long-term contracts. Consequently, we can adjust our selling prices, to the extent permitted by competition, to reflect cost increases caused by inflation.
Recent Accounting Pronouncements
See Note 1 to our consolidated financial statements for a discussion of recent accounting pronouncements.
- 45 -
Item 7A. QUANTITATIVE AND QUALITATIVE DISCLOSURES ABOUT MARKET RISK
We are exposed to certain financial risks, including fluctuations in foreign currency exchange rates, interest rates, and commodity prices. We manage our exposure to these market risks through internally established policies and procedures and, when deemed appropriate, through the use of derivative financial instruments. Our policies do not allow speculation in derivative instruments for profit or execution of derivative instrument contracts for which there are no underlying exposures. We do not use financial instruments for trading purposes and we are not a party to any leveraged derivatives. We monitor our underlying market risk exposures on an ongoing basis and believe that we can modify or adapt our strategies as needed.
Interest Rate Risk
We are exposed to changes in interest rates as a result of our borrowing activities and our cash balances.
At December 31, 2016, we have $4.1 million outstanding on our exchangeable notes, which bear interest at LIBOR.
The Company entered into a second amended and restated revolving credit facility on December 30, 2015. Interest payable on the facility is based upon the Agent’s prime rate, the Federal Funds rate or LIBOR, plus a spread. At December 31, 2016, the Company has $9.0 million borrowings outstanding under the revolving credit facility and $23.0 million in outstanding term loans.
At December 31, 2016, we have $58.5 million of cash and cash equivalents, which accrue interest at various variable rates.
Based on the debt and cash positions at December 31, 2016 and 2015, we would expect a 50 basis point increase or decrease in interest rates to have an immaterial impact to annualized net earnings in 2016 and to increase or decrease our annualized net earnings by approximately $0.3 million in 2015.
See Note 7 to our consolidated financial statements for additional information about our long-term debt.
Foreign Exchange Risk
We are exposed to foreign currency exchange rate risks, particularly due to market values of transactions in currencies other than the functional currencies of certain subsidiaries. Our significant foreign currency exposures are to the British pound, Canadian dollar, Chinese renminbi, euro, Indian rupee, Israeli shekel, Japanese yen, Swedish krona, and Taiwanese dollar.
Our operations in Europe, Canada, and certain locations in Asia primarily generate and expend cash in local currencies. Our operations in Israel and certain locations in Asia primarily generate cash in U.S. dollars, but these subsidiaries also have significant transactions in local currencies. Our exposure to foreign currency risk is mitigated to the extent that the costs incurred and the revenues earned in a particular currency offset one another. Our exposure to foreign currency risk, with respect to expenses, is more pronounced in Israel and India because the percentage of expenses denominated in Israeli shekels and Indian rupee to total expenses is much greater than the percentage of sales denominated in Israeli shekels and Indian rupee to total sales. Therefore, if the Israeli shekel and Indian rupee strengthen against all or most of our other major currencies, our operating profit is reduced. We also have a higher percentage of British pound-denominated sales than expenses. Therefore, when the British pound strengthens against all or most of our other major currencies, our operating profit is increased. VPG Canada has a secured term facility denominated in U.S. dollars. Therefore, we are exposed to potentially significant foreign exchange risk based on the valuation of this long-term debt related to the exchange rate between the U.S. dollar and the Canadian dollar.
We have performed a sensitivity analysis as of December 31, 2016 and 2015, respectively, using a model that measures the change in the values arising from a hypothetical 10% adverse movement in foreign currency exchange rates relative to the U.S. dollar, with all other variables held constant. The foreign currency exchange rates we used were based on market rates in effect at December 31, 2016 and 2015, respectively. The sensitivity analysis indicated that a hypothetical 10% adverse movement in foreign currency exchange rates would impact our net earnings by approximately $1.7 million and $1.0 million for the years ended December 31, 2016 and December 31, 2015, respectively, although individual line items in our consolidated statements of operations could be materially affected. For example, a 10% weakening in all foreign currencies would increase the U.S. dollar equivalent of operating income generated in foreign currencies, which would be offset by foreign exchange losses of our foreign subsidiaries that have significant transactions in U.S. dollars or have the U.S. dollar as their functional currency.
A change in the mix of the currencies in which we transact our business could have a material effect on the estimated impact of the hypothetical 10% movement in the value of the U.S. dollar. Furthermore, the timing of cash receipts and disbursements could result in materially different actual results versus the hypothetical 10% movement in the value of the U.S. dollar, particularly if there are significant changes in exchange rates in a short period of time.
Commodity Price Risk
Although most materials incorporated in our products are available from a number of sources, certain materials are available only from a relatively limited number of suppliers.
- 46 -
Some of the most highly specialized materials for our sensors are sourced from a single vendor. We maintain a safety stock inventory of certain critical materials at our facilities.
Certain metals used in the manufacture of our products are traded on active markets, and can be subject to significant price volatility.
Our results of operations may be materially and adversely affected if we have difficulty obtaining these raw materials, the quality of available raw materials deteriorates, or there are significant price changes for these raw materials. For periods in which the prices of these raw materials are rising, we may be unable to pass on the increased cost to our customers which would result in decreased margins for the products in which they are used. For periods in which the prices are declining, we may be required to write down our inventory carrying cost of these raw materials, since we record our inventory at the lower of cost or market. Depending on the extent of the difference between market price and our carrying cost, this write-down could have a material adverse effect on our net earnings. We also may need to record losses for adverse purchase commitments for these materials in periods of declining prices.
We estimate that a 10% increase or decrease in the costs of raw materials subject to commodity price risk would decrease or increase our net earnings by $1.0 million and $0.9 million for the years ended December 31, 2016 and December 31, 2015, respectively, assuming that such changes in our costs have no impact on the selling prices of our products, and that we have no pending commitments to purchase metals at fixed prices.
Item 8. FINANCIAL STATEMENTS AND SUPPLEMENTARY DATA
The financial statements required by this Item are included herein, commencing on page F-1 of this report.
Item 9. CHANGES IN AND DISAGREEMENTS WITH ACCOUNTANTS ON ACCOUNTING AND FINANCIAL DISCLOSURE
None.
Item 9A. CONTROLS AND PROCEDURES
Disclosure Controls and Procedures
An evaluation was performed under the supervision and with the participation of our management, including the Chief Executive Officer (“CEO”) and Chief Financial Officer (“CFO”), of the effectiveness of the design and operation of our disclosure controls and procedures, as such term is defined under Rule 13a-15(e) and Rule 15d-15(e) promulgated under the Securities Exchange Act of 1934, as amended (the “Exchange Act”). Based on that evaluation, our CEO and CFO concluded that our disclosure controls and procedures were effective as of the end of the period covered by this annual report to ensure that information required to be disclosed in reports that we file or submit under the Exchange Act are: (1) recorded, processed, summarized, and reported within the time periods specified in the SEC’s rules and forms; and (2) accumulated and communicated to our management, including our CEO and CFO, as appropriate to allow timely decisions regarding required disclosure.
Our management, including our CEO and CFO, believes that any disclosure controls and procedures or internal controls and procedures, no matter how well conceived and operated, can provide only reasonable, not absolute, assurance that the objectives of the control system are met. Further, the design of a control system must consider the benefits of controls relative to their costs. Inherent limitations within a control system include the realities that judgments in decision-making can be faulty, and that breakdowns can occur because of a simple error or mistake. Additionally, controls can be circumvented by the individual acts of some persons, by collusion of two or more people, or by unauthorized override of the control. While the design of any system of controls is to provide reasonable assurance of the effectiveness of disclosure controls, such design is also based in part upon certain assumptions about the likelihood of future events, and such assumptions, while reasonable, may not take into account all potential future conditions. Accordingly, because of the inherent limitations in a cost effective control system, misstatements due to error or fraud may occur and may not be prevented or detected.
Changes in Internal Controls over Financial Reporting
There were no changes in our internal control over financial reporting during our last fiscal quarter that have materially affected, or are reasonably likely to materially affect, our internal control over financial reporting.
Management's Report on Internal Control Over Financial Reporting
Our management is responsible for establishing and maintaining adequate internal control over financial reporting, as such term is defined in Exchange Act Rules 13a-15(f) and 15d-15(f). Under the supervision and with the participation of our management, including our CEO and CFO, we conducted an evaluation of the effectiveness of our internal control over financial reporting as
- 47 -
of December 31, 2016 based on the 2013 framework set forth in Internal Control - Integrated Framework issued by the Committee of Sponsoring Organizations of the Treadway Commission. Based on that evaluation, our management concluded that our internal control over financial reporting was effective as of December 31, 2016.
Our evaluation of internal control over financial reporting did not include the internal controls of the business acquired upon the purchase of Pacific Instruments, Inc., which is included in our 2016 consolidated financial statements beginning April 6, 2016 and constituted 6.0% total assets at December 31, 2016 and 1.7% of net revenues as of December 31, 2016.
Ernst & Young LLP has issued an attestation report on the effectiveness of our internal control over financial reporting, as stated in their report which is set forth on the next page.
- 48 -
Report of Independent Registered Public Accounting Firm
The Board of Directors and Shareholders of Vishay Precision Group, Inc.
We have audited Vishay Precision Group, Inc.’s internal control over financial reporting as of December 31, 2016, based on criteria established in Internal Control-Integrated Framework issued by the Committee of Sponsoring Organizations of the Treadway Commission (2013 framework) (the COSO criteria). Vishay Precision Group, Inc.’s management is responsible for maintaining effective internal control over financial reporting, and for its assessment of the effectiveness of internal control over financial reporting included in the accompanying Management’s Report on Internal Control Over Financial Reporting. Our responsibility is to express an opinion on the company’s internal control over financial reporting based on our audit.
We conducted our audit in accordance with the standards of the Public Company Accounting Oversight Board (United States). Those standards require that we plan and perform the audit to obtain reasonable assurance about whether effective internal control over financial reporting was maintained in all material respects. Our audit included obtaining an understanding of internal control over financial reporting, assessing the risk that a material weakness exists, testing and evaluating the design and operating effectiveness of internal control based on the assessed risk, and performing such other procedures as we considered necessary in the circumstances. We believe that our audit provides a reasonable basis for our opinion.
A company’s internal control over financial reporting is a process designed to provide reasonable assurance regarding the reliability of financial reporting and the preparation of financial statements for external purposes in accordance with generally accepted accounting principles. A company’s internal control over financial reporting includes those policies and procedures that (1) pertain to the maintenance of records that, in reasonable detail, accurately and fairly reflect the transactions and dispositions of the assets of the company; (2) provide reasonable assurance that transactions are recorded as necessary to permit preparation of financial statements in accordance with generally accepted accounting principles, and that receipts and expenditures of the company are being made only in accordance with authorizations of management and directors of the company; and (3) provide reasonable assurance regarding prevention or timely detection of unauthorized acquisition, use, or disposition of the company’s assets that could have a material effect on the financial statements.
Because of its inherent limitations, internal control over financial reporting may not prevent or detect misstatements. Also, projections of any evaluation of effectiveness to future periods are subject to the risk that controls may become inadequate because of changes in conditions, or that the degree of compliance with the policies or procedures may deteriorate.
As indicated in the accompanying Management’s Report on Internal Control Over Financial Reporting, management’s assessment of and conclusion on the effectiveness of internal control over financial reporting did not include the internal controls of Pacific Instruments, Inc., which is included in the December 31, 2016 consolidated financial statements of Vishay Precision Group, Inc. and constituted 6.0% and 7.1% of total and net assets, respectively, as of December 31, 2016 and 1.7% and (5.9)% of revenues and net income, respectively, for the year then ended. Our audit of internal control over financial reporting of Vishay Precision Group, Inc. also did not include an evaluation of the internal control over financial reporting of Pacific Instruments, Inc.
In our opinion, Vishay Precision Group, Inc. maintained, in all material respects, effective internal control over financial reporting as of December 31, 2016, based on the COSO criteria.
We also have audited, in accordance with the standards of the Public Company Accounting Oversight Board (United States), the consolidated balance sheets of Vishay Precision Group, Inc. as of December 31, 2016 and 2015, and the related consolidated statements of operations, comprehensive income (loss), equity, and cash flows for each of the three years in the period ended December 31, 2016 of Vishay Precision Group, Inc. and our report dated March 16, 2017 expressed an unqualified opinion thereon.
/s/ Ernst & Young LLP
Philadelphia, Pennsylvania
March 16, 2017
- 49 -
Item 9B. OTHER INFORMATION
None.
PART III
Item 10. DIRECTORS, EXECUTIVE OFFICERS, AND CORPORATE GOVERNANCE
Certain information required under this Item with respect to our Executive Officers is contained under the heading “Executive Officers” in Item 1 hereof. Other information required under this Item will be contained under the heading “Nominees for Election as Directors” in our definitive proxy statement for the Company’s 2017 Annual Meeting of Stockholders, which will be filed within 120 days of December 31, 2016, our most recent fiscal year end, and is incorporated herein by reference.
The Company has adopted codes of conduct that constitute “codes of ethics” as that term is defined in paragraph (b) of Item 406 of Regulation S-K and that apply to the Company’s principal executive officer, principal financial officer, principal accounting officer or controller, and to any persons performing similar functions. Such codes of conduct are posted on the Company’s internet website, the address of which is www.vpgsensors.com.
Item 11. EXECUTIVE COMPENSATION
Information required under this Item will be contained in our definitive proxy statement for the Company’s 2017 Annual Meeting of Stockholders, which will be filed within 120 days of December 31, 2016, our most recent fiscal year end, and is incorporated herein by reference.
Item 12. SECURITY OWNERSHIP OF CERTAIN BENEFICIAL OWNERS AND MANAGEMENT AND RELATED STOCKHOLDER MATTERS
Information required under this Item will be contained in our definitive proxy statement for the Company’s 2017 Annual Meeting of Stockholders, which will be filed within 120 days of December 31, 2016, our most recent fiscal year end, and is incorporated herein by reference.
Item 13. CERTAIN RELATIONSHIPS AND RELATED PARTY TRANSACTIONS, AND DIRECTOR INDEPENDENCE
Information required under this Item will be contained in our definitive proxy statement for the Company’s 2017 Annual Meeting of Stockholders, which will be filed within 120 days of December 31, 2016, our most recent fiscal year end, and is incorporated herein by reference.
Item 14. PRINCIPAL ACCOUNTING FEES AND SERVICES
Information required under this Item will be contained in our definitive proxy statement for the Company’s 2017 Annual Meeting of Stockholders, which will be filed within 120 days of December 31, 2016, our most recent fiscal year end, and is incorporated herein by reference.
- 50 -
PART IV
Item 15. EXHIBITS, FINANCIAL STATEMENT SCHEDULES
(a) | Documents Filed as part of Form 10-K |
1) | Financial Statements |
The Consolidated Financial Statements for the year ended December 31, 2016 are filed herewith. See index to the Consolidated Financial Statements on page F-1 of this report.
2) | Financial Statement Schedules |
All financial statement schedules for which provision is made in the applicable accounting regulation of the Securities and Exchange Commission are not required under the related instructions or are inapplicable and therefore have been omitted.
3) | Exhibits |
Exhibit No. | Description | |
2.1 | Asset Purchase Agreement, dated December 18, 2012, by and among Vishay Precision Group, Inc., Vishay Precision Group Canada ULC, George Kelk Corporation, Endevor Corporation and Peter Kelk (previously filed as an exhibit to the Registrant’s Current Report on Form 8-K filed with the SEC on December 19, 2012 and incorporated herein by reference). | |
3.1 | Amended and Restated Certificate of Incorporation of Vishay Precision Group, Inc., effective June 25, 2010 (previously filed as an exhibit to the Registrant’s Current Report on Form 8-K filed with the SEC on July 1, 2010 and incorporated herein by reference). | |
3.2 | Amendment no. 1 to Amended and Restated Certificate of Incorporation of Vishay Precision Group, Inc., effective June 2, 2011 (previously filed as an exhibit to the Registrant’s Current Report on Form 8-K filed with the SEC on June 6, 2011 and incorporated herein by reference). | |
3.3 | Second Amended and Restated Bylaws of Vishay Precision Group, Inc., adopted as of June 2, 2011 (previously filed as an exhibit to the Registrant’s Current Report on Form 8-K filed with the SEC on June 6, 2011 and incorporated herein by reference). | |
10.1 | Master Separation and Distribution Agreement, dated June 22, 2010, between Vishay Precision Group, Inc. and Vishay Intertechnology, Inc. (previously filed as an exhibit to the Registrant’s Form 10 Registration Statement of Vishay Precision Group, Inc., filed with the Securities and Exchange Commission on June 22, 2010 and incorporated herein by reference). | |
10.2 | Employee Matters Agreement, dated June 22, 2010, by and among Vishay Intertechnology, Inc. and Vishay Precision Group, Inc. (previously filed as an exhibit to the Registrant’s Current Report on Form 8-K filed with the SEC on June 23, 2010 and incorporated herein by reference). | |
10.3 | Tax Matters Agreement, dated July 6, 2010, between Vishay Precision Group, Inc. and Vishay Intertechnology, Inc. (previously filed as an exhibit to the Registrant’s Current Report on Form 8-K filed with the SEC on July 7, 2010 and incorporated herein by reference). | |
10.4 | Trademark License Agreement, dated July 6, 2010, between Vishay Precision Group, Inc. and Vishay Intertechnology, Inc. (previously filed as an exhibit to the Registrant’s Current Report on Form 8-K filed with the SEC on July 7, 2010 and incorporated herein by reference). | |
10.5 | Supply Agreement, dated July 6, 2010, between Vishay Advanced Technology, Ltd. and Vishay Dale Electronics, Inc. (previously filed as an exhibit to the Registrant’s Current Report on Form 8-K filed with the SEC on July 7, 2010 and incorporated herein by reference). | |
10.6* | Patent License Agreement, dated July 6, 2010, between Vishay Precision Group, Inc. and Vishay Dale Electronics, Inc. (previously filed as an exhibit to the Registrant’s Current Report on Form 8-K filed with the SEC on July 7, 2010 and incorporated herein by reference). | |
10.7* | Supply Agreement, dated July 6, 2010, between Vishay Dale Electronics, Inc. and Vishay Advanced Technology, Ltd. (previously filed as an exhibit to the Registrant’s Current Report on Form 8-K filed with the SEC on July 7, 2010 and incorporated herein by reference). | |
10.8* | Lease Agreement, dated July 4, 2010, between Vishay Advanced Technology, Ltd. and V.I.E.C. Ltd. (previously filed as an exhibit to the Registrant's Current Report on Form 8-K filed with the SEC on July 7, 2010 and incorporated herein by reference). | |
- 51 -
Exhibit No. | Description | |
10.9* | Supply Agreement, dated July 6, 2010, between Vishay Measurements Group, Inc. and Vishay S.A. (previously filed as an exhibit to the Registrant’s Current Report on Form 8-K filed with the SEC on July 7, 2010 and incorporated herein by reference). | |
10.10* | Manufacturing Agreement, dated July 6, 2010, between Vishay S.A. and Vishay Precision Foil GmbH (previously filed as an exhibit to the Registrant’s Current Report on Form 8-K filed with the SEC on July 7, 2010 and incorporated herein by reference). | |
10.11 | Intellectual Property License Agreement, dated July 6, 2010, between Vishay S.A. and Vishay Precision Foil GmbH (previously filed as an exhibit to the Registrant’s Current Report on Form 8-K filed with the SEC on July 7, 2010 and incorporated herein by reference). | |
10.12* | Supply Agreement, dated July 6, 2010, between Vishay Precision Foil GmbH and Vishay S.A. (previously filed as an exhibit to the Registrant’s Current Report on Form 8-K filed with the SEC on July 7, 2010 and incorporated herein by reference). | |
10.13 | Intellectual Property License Agreement, dated July 6, 2010, between Vishay S.A. and Vishay Measurements Group, Inc. (previously filed as an exhibit to the Registrant’s Current Report on Form 8-K filed with the SEC on July 7, 2010 and incorporated herein by reference). | |
10.14 | Lease Agreement, between Alpha Electronics Corp. and Vishay Japan Co., Ltd. (previously filed as an exhibit to the Registrant’s Current Report on Form 8-K filed with the SEC on July 7, 2010 and incorporated herein by reference). | |
10.15† | Amended and Restated 2010 Vishay Stock Incentive Program, adopted as of June 2, 2011 (previously filed as an exhibit to the Registrant’s Current Report on Form 8-K filed with the SEC on June 6, 2011 and incorporated herein by reference). | |
10.16 | Note Instrument, dated July 21, 2010, by Vishay Precision Group, Inc. (previously filed as an exhibit to the Registrant’s Annual Report on Form 10-K for the year ended December 31, 2010 and incorporated herein by reference). | |
10.17 | Put and Call Agreement, dated July 21, 2010, by and among Vishay Precision Group, Inc., American Stock Transfer & Trust Co. and the noteholders whose signatures are set forth on the signature pages thereto (previously filed as an exhibit to the Registrant’s Annual Report on Form 10-K for the year ended December 31, 2010 and incorporated herein by reference). | |
10.18† | Form of Stock Option Award Agreement (previously filed as an exhibit to the Registrant’s Quarterly Report on Form 10-Q filed with the SEC on November 2, 2010 and incorporated herein by reference). | |
10.19† | Form of Restricted Stock Unit Award Agreement for Director Grants (previously filed as an exhibit to the Registrant’s Quarterly Report on Form 10-Q filed with the SEC on November 2, 2010 and incorporated herein by reference). | |
10.20† | Form of Restricted Stock Unit Award Agreement for Employee Grants (previously filed as an exhibit to the Registrant’s Quarterly Report on Form 10-Q filed with the SEC on November 2, 2010 and incorporated herein by reference). | |
10.21† | Employment Agreement, dated November 17, 2010, by and among Vishay Advanced Technology and Ziv Shoshani (previously filed as an exhibit to the Registrant’s Current Report on Form 8-K filed with the SEC on November 23, 2010 and incorporated herein by reference). | |
10.22† | Employment Agreement, dated November 17, 2010, by and among Vishay Precision Group, Inc. and William M. Clancy (previously filed as an exhibit to the Registrant’s Current Report on Form 8-K filed with the SEC on November 23, 2010 and incorporated herein by reference). | |
10.23† | Amendment to Employment Agreement, dated December 8, 2011 by and among Vishay Advanced Technologies, Ltd. and Ziv Shoshani (previously filed as an exhibit to the Registrant’s Current Report on Form 8-K filed with the SEC on December 13, 2011 and incorporated herein by reference). | |
10.24† | Amendment to Employment Agreement, dated December 8, 2011 by and among Vishay Advanced Technologies, Ltd. and William M. Clancy (previously filed as an exhibit to the Registrant’s Current Report on Form 8-K filed with the SEC on December 13, 2011 and incorporated herein by reference). | |
10.25† | Form of Performance Restricted Stock Unit Award Agreement for Employee Grants (previously filed as an exhibit to the Registrant’s Current Report on Form 10-K filed with the SEC on March 12, 2013 and incorporated herein by reference). | |
10.26 | Lease Agreement, between George Kelk Corporation and Anndale Properties Limited (and its successors), dated January 30, 1996 and as amended as of January 17, 2011 (previously filed as an exhibit to the Registrant’s Quarterly Report on Form 10-Q filed with SEC on May 8, 2013 and incorporated herein by reference). | |
10.27 | Vishay Precision Group, Inc. 2010 Stock Incentive Program, as Amended and Restated Effective May 21, 2013 (previously filed as an exhibit to the Registrant’s Current Report on Form 8-K filed with the SEC on May 22, 2013 and incorporated herein by reference). | |
- 52 -
Exhibit No. | Description | |
10.28† | Amendment to Employment Agreement, dated November 7, 2013 by and among Vishay Advanced Technologies, Ltd. and Ziv Shoshani (previously filed as an exhibit to the Registrant’s Current Report on Form 8-K filed with the SEC on November 12, 2013 and incorporated herein by reference). | |
10.29† | Amendment to Employment Agreement, dated November 7, 2013 by and among Vishay Precision Group, Inc. and William Clancy (previously filed as an exhibit to the Registrant’s Current Report on Form 8-K filed with the SEC on November 12, 2013 and incorporated herein by reference). | |
10.30† | Lease agreement, dated January 26, 2014, by and among between Vishay Advanced Technologies, Inc. and Tefen Enterprises Ltd. (previously filed as an exhibit to the Registrant’s Quarterly Report on Form 10-Q filed with the SEC on May 7, 2014 and incorporated herein by reference). | |
10.31 | Stock Purchase Agreement, dated December 14, 2015, by and among VPG Systems U.S., Inc., Stress-Tek, Inc., the shareholders of Stress-Tek, Inc., and Keith Reichow, as Representative (previously filed as an exhibit to the Registrant’s Current Report on Form 8-K filed with the SEC on December 15, 2015 and incorporated herein by reference). | |
10.32† | Amended and Restated Employment Agreement, dated December 23, 2015, by and among the Company and Thomas Kieffer (previously filed as an exhibit to the Registrant’s Current Report on Form 8-K filed with the SEC on December 29, 2015 and incorporated herein by reference). | |
10.33 | Second Amended and Restated Credit Agreement, dated December 30, 2015, by and among Vishay Precision Group, Inc., Vishay Precision Group Canada ULC, JPMorgan Chase Bank, National Association, as agent, and lenders party thereto (previously filed as an exhibit to the Registrant’s Current Report on Form 8-K filed with the SEC on January 6, 2016 and incorporated herein by reference). | |
10.34 | Stock Purchase Agreement, dated March 30, 2016, by and among Vishay Precision Group, Inc., Pacific Instruments, Inc., the shareholders of Pacific Instruments, Inc., John Hueckel and Norman Hueckel as Owners, and John Hueckel, as Representative (previously filed as an exhibit to the Registrant's Current Report on Form 8-K filed with the SEC on April 5, 2016 and incorporated herein by reference). | |
10.35† | Form of Indemnification Agreement with directors (previously filed as an exhibit to the Registrant's Quarterly Report on Form 10-Q filed with the SEC on May 11, 2016 and incorporated herein by reference). | |
10.36† | Employment agreement, dated January 1, 2016, by and among Vishay Precision Group, Inc. and Roland Desilets ( previously filed as an exhibit to the Registrants' Quarterly Report on Form 10-Q filed with the SEC on August 10, 2016 and incorporated herein by reference). | |
10.37 | Lease agreement, dated July 7, 2016, by and among between Vishay Advanced Technologies, Ltd. and Marshee Estates & Investments Ltd. | |
21.1 | List of Subsidiaries. | |
23.1 | Consent of Ernst & Young LLP relating to the Registrant’s financial statements. | |
31.1 | Certification pursuant to Rule 13a-14(a) or 15d-14(a) under the Securities Exchange Act of 1934, as adopted pursuant to Section 302 of the Sarbanes-Oxley Act of 2002 - Ziv Shoshani, Chief Executive Officer. | |
31.2 | Certification pursuant to Rule 13a-14(a) or 15d-14(a) under the Securities Exchange Act of 1934, as adopted pursuant to Section 302 of the Sarbanes-Oxley Act of 2002 - William M. Clancy, Chief Financial Officer. | |
32.1 | Certification Pursuant to 18 U.S.C. Section 1350, as adopted pursuant to Section 906 of the Sarbanes-Oxley Act of 2002 - Ziv Shoshani, Chief Executive Officer. | |
32.2 | Certification Pursuant to 18 U.S.C. Section 1350, as adopted pursuant to Section 906 of the Sarbanes-Oxley Act of 2002 - William M. Clancy, Chief Financial Officer. | |
101 | Interactive Data File (Annual Report on Form 10-K, for the year ended December 31, 2016, furnished in XBRL (eXtensible Business Reporting Language)). | |
* Confidential treatment has been accorded to certain portions of this Exhibit. Omitted portions have been filed separately with the Securities and Exchange Commission.
† Denotes a management contract or compensatory plan, contract or arrangement.
Item 16. FORM 10-K SUMMARY
None.
- 53 -
SIGNATURES
Pursuant to the requirements of Section 13 or 15(d) of the Securities Exchange Act of 1934, the registrant has duly caused this report to be signed on its behalf by the undersigned, thereunto duly authorized.
VISHAY PRECISION GROUP, INC. | |||
By: | /s/ Ziv Shoshani | ||
Ziv Shoshani | |||
Date: March 16, 2017 | President and Chief Executive Officer | ||
POWER OF ATTORNEY
Vishay Precision Group, Inc., a Delaware corporation, and each person whose signature appears below constitutes and appoints each of Ziv Shoshani and William M. Clancy, and either of them, such person’s true and lawful attorney-in-fact, with full power of substitution and resubstitution, for such person and in such person’s name, place and stead, in any and all capacities, to sign on such person’s behalf, individually and in each capacity stated below, any and all amendments to this Annual Report on Form 10-K and other documents in connection therewith, and to file the same and all exhibits thereto and other documents in connection therewith, with the Securities and Exchange Commission, granting unto said attorneys-in-fact, and each of them, full power and authority to do and perform each and every act and thing necessary or desirable to be done in and about the premises, as fully to all intents and purposes as he or she might or could do in person, thereby ratifying and confirming all that said attorneys-in-fact, or any of them, or their or his or her substitute or substitutes, may lawfully do or cause to be done by virtue hereof.
Pursuant to the requirements of the Securities Exchange Act of 1934, as amended, this Form 10-K has been signed by the following persons on behalf of the Registrant in the capacities and on the date indicated below.
Signature | Title | Date | ||
/s/ Ziv Shoshani | Chief Executive Officer and Director | March 16, 2017 | ||
Ziv Shoshani | (Principal Executive Officer) | |||
/s/ William M. Clancy | Executive Vice President & Chief Financial Officer | March 16, 2017 | ||
William M. Clancy | (Principal Financial and Accounting Officer) | |||
/s/ Marc Zandman | Director | March 16, 2017 | ||
Marc Zandman | ||||
/s/ Saul V. Reibstein | Director | March 16, 2017 | ||
Saul V. Reibstein | ||||
/s/ Timothy V. Talbert | Director | March 16, 2017 | ||
Timothy V. Talbert | ||||
/s/ Cary Wood | Director | March 16, 2017 | ||
Cary Wood | ||||
/s/ Janet Clarke | Director | March 16, 2017 | ||
Janet Clarke | ||||
- 54 -
Vishay Precision Group, Inc.
Index to Consolidated Financial Statements
Report of Independent Registered Public Accounting Firm | |
Consolidated Balance Sheets | |
Consolidated Statements of Operations | |
Consolidated Statements of Comprehensive Income (Loss) | |
Consolidated Statements of Cash Flows | |
Consolidated Statements of Equity | |
Notes to Consolidated Financial Statements | |
F-1
Report of Independent Registered Public Accounting Firm
The Board of Directors and Shareholders of Vishay Precision Group, Inc.
We have audited the accompanying consolidated balance sheets of Vishay Precision Group, Inc. as of December 31, 2016 and 2015, and the related consolidated statements of operations, comprehensive income (loss), equity, and cash flows for each of the three years in the period ended December 31, 2016. These financial statements are the responsibility of the Company's management. Our responsibility is to express an opinion on these financial statements based on our audits.
We conducted our audits in accordance with the standards of the Public Company Accounting Oversight Board (United States). Those standards require that we plan and perform the audit to obtain reasonable assurance about whether the financial statements are free of material misstatement. An audit includes examining, on a test basis, evidence supporting the amounts and disclosures in the financial statements. An audit also includes assessing the accounting principles used and significant estimates made by management, as well as evaluating the overall financial statement presentation. We believe that our audits provide a reasonable basis for our opinion.
In our opinion, the financial statements referred to above present fairly, in all material respects, the consolidated financial position of Vishay Precision Group, Inc. at December 31, 2016 and 2015, and the consolidated results of its operations and its cash flows for each of the three years in the period ended December 31, 2016, in conformity with U.S. generally accepted accounting principles.
We also have audited, in accordance with the standards of the Public Company Accounting Oversight Board (United States), Vishay Precision Group, Inc.’s internal control over financial reporting as of December 31, 2016, based on criteria established in Internal Control-Integrated Framework issued by the Committee of Sponsoring Organizations of the Treadway Commission (2013 framework) and our report dated March 16, 2017 expressed an unqualified opinion thereon.
/s/ Ernst & Young LLP
Philadelphia, Pennsylvania
March 16, 2017
F-2
VISHAY PRECISION GROUP, INC.
Consolidated Balance Sheets
(In thousands, except share amounts)
December 31, 2016 | December 31, 2015 | ||||||
Assets | |||||||
Current assets: | |||||||
Cash and cash equivalents | $ | 58,452 | $ | 62,641 | |||
Accounts receivable, net of allowances for doubtful accounts of $523 and $334, respectively | 34,270 | 35,553 | |||||
Inventories: | |||||||
Raw materials | 15,647 | 15,062 | |||||
Work in process | 21,115 | 20,289 | |||||
Finished goods | 19,559 | 20,849 | |||||
Inventories, net | 56,321 | 56,200 | |||||
Prepaid expenses and other current assets | 6,831 | 7,814 | |||||
Total current assets | 155,874 | 162,208 | |||||
Property and equipment, at cost: | |||||||
Land | 3,344 | 3,639 | |||||
Buildings and improvements | 48,454 | 55,003 | |||||
Machinery and equipment | 89,080 | 84,409 | |||||
Software | 7,441 | 7,284 | |||||
Construction in progress | 4,340 | 2,288 | |||||
Accumulated depreciation | (97,374 | ) | (95,992 | ) | |||
Property and equipment, net | 55,285 | 56,631 | |||||
Goodwill | 18,717 | 12,603 | |||||
Intangible assets, net | 21,585 | 17,683 | |||||
Other assets | 19,049 | 14,622 | |||||
Total assets | $ | 270,510 | $ | 263,747 | |||
Continues on the following page.
F-3
VISHAY PRECISION GROUP, INC.
Consolidated Balance Sheets (continued)
(In thousands, except share amounts)
December 31, 2016 | December 31, 2015 | ||||||
Liabilities and equity | |||||||
Current liabilities: | |||||||
Trade accounts payable | $ | 8,264 | $ | 8,004 | |||
Payroll and related expenses | 11,978 | 13,888 | |||||
Other accrued expenses | 13,285 | 16,604 | |||||
Income taxes | 772 | 527 | |||||
Current portion of long-term debt | 2,623 | 2,120 | |||||
Total current liabilities | 36,922 | 41,143 | |||||
Long-term debt, less current portion | 33,529 | 31,037 | |||||
Deferred income taxes | 735 | 334 | |||||
Other liabilities | 13,054 | 7,195 | |||||
Accrued pension and other postretirement costs | 14,713 | 11,597 | |||||
Total liabilities | 98,953 | 91,306 | |||||
Commitments and contingencies | |||||||
Equity: | |||||||
Preferred stock, par value $1.00 per share: authorized - 1,000,000 shares; none issued | — | — | |||||
Common stock, par value $0.10 per share: authorized - 25,000,000 shares; 12,167,356 shares outstanding as of December 31, 2016 and 12,144,485 shares outstanding as of December 31, 2015 | 1,278 | 1,276 | |||||
Class B convertible common stock, par value $0.10 per share: authorized - 3,000,000 shares; 1,025,158 shares outstanding as of December 31, 2016 and December 31, 2015 | 103 | 103 | |||||
Treasury stock, at cost - 619,667 shares held at December 31, 2016 and December 31, 2015 | (8,765 | ) | (8,765 | ) | |||
Capital in excess of par value | 190,373 | 190,436 | |||||
Retained earnings | 28,731 | 22,327 | |||||
Accumulated other comprehensive loss | (40,337 | ) | (33,121 | ) | |||
Total Vishay Precision Group, Inc. stockholders' equity | 171,383 | 172,256 | |||||
Noncontrolling interests | 174 | 185 | |||||
Total equity | 171,557 | 172,441 | |||||
Total liabilities and equity | $ | 270,510 | $ | 263,747 | |||
See accompanying notes.
F-4
VISHAY PRECISION GROUP, INC.
Consolidated Statements of Operations
(In thousands, except per share amounts)
Years ended December 31, | |||||||||||
2016 | 2015 | 2014 | |||||||||
Net revenues | $ | 224,929 | $ | 232,178 | $ | 250,028 | |||||
Costs of products sold | 142,120 | 147,949 | 159,254 | ||||||||
Gross profit | 82,809 | 84,229 | 90,774 | ||||||||
Selling, general, and administrative expenses | 68,938 | 71,282 | 77,034 | ||||||||
Acquisition costs | 494 | 185 | — | ||||||||
Impairment of goodwill and indefinite-lived intangibles | — | 4,942 | 5,579 | ||||||||
Restructuring costs | 2,666 | 4,461 | 668 | ||||||||
Operating income | 10,711 | 3,359 | 7,493 | ||||||||
Other income (expense): | |||||||||||
Interest expense | (1,486 | ) | (771 | ) | (882 | ) | |||||
Other | 382 | (2,082 | ) | (740 | ) | ||||||
Other (expense) income - net | (1,104 | ) | (2,853 | ) | (1,622 | ) | |||||
Income before taxes | 9,607 | 506 | 5,871 | ||||||||
Income tax expense | 3,199 | 13,500 | 2,613 | ||||||||
Net earnings (loss) | 6,408 | (12,994 | ) | 3,258 | |||||||
Less: net earnings attributable to noncontrolling interests | 4 | 14 | 178 | ||||||||
Net earnings (loss) attributable to VPG stockholders | $ | 6,404 | $ | (13,008 | ) | $ | 3,080 | ||||
Basic earnings (loss) per share attributable to VPG stockholders | $ | 0.49 | $ | (0.96 | ) | $ | 0.22 | ||||
Diluted earnings (loss) per share attributable to VPG stockholders | $ | 0.48 | $ | (0.96 | ) | $ | 0.22 | ||||
Weighted average shares outstanding - basic | 13,187 | 13,485 | 13,755 | ||||||||
Weighted average shares outstanding - diluted | 13,419 | 13,485 | 13,977 | ||||||||
See accompanying notes.
F-5
VISHAY PRECISION GROUP, INC.
Consolidated Statements of Comprehensive Income (Loss)
(In thousands)
Years ended December 31, | |||||||||||
2016 | 2015 | 2014 | |||||||||
Net earnings (loss) | $ | 6,408 | $ | (12,994 | ) | $ | 3,258 | ||||
Other comprehensive loss, net of tax: | |||||||||||
Foreign currency translation adjustment | (4,488 | ) | (6,947 | ) | (8,015 | ) | |||||
Pension and other postretirement actuarial items | (2,728 | ) | 386 | (2,538 | ) | ||||||
Other comprehensive loss | (7,216 | ) | (6,561 | ) | (10,553 | ) | |||||
Comprehensive loss | (808 | ) | (19,555 | ) | (7,295 | ) | |||||
Less: comprehensive income attributable to noncontrolling interests | 4 | 14 | 178 | ||||||||
Comprehensive loss attributable to VPG stockholders | $ | (812 | ) | $ | (19,569 | ) | $ | (7,473 | ) | ||
See accompanying notes.
F-6
VISHAY PRECISION GROUP, INC.
Consolidated Statements of Cash Flows
(In thousands)
Years ended December 31, | |||||||||||
2016 | 2015 | 2014 | |||||||||
Operating activities | |||||||||||
Net earnings (loss) | $ | 6,408 | $ | (12,994 | ) | $ | 3,258 | ||||
Adjustments to reconcile net earnings to net cash provided by operating activities: | |||||||||||
Impairment of goodwill and indefinite-lived intangibles | — | 4,942 | 5,579 | ||||||||
Depreciation and amortization | 11,149 | 11,097 | 11,736 | ||||||||
(Gain) loss on disposal of property and equipment | (823 | ) | 15 | 63 | |||||||
Share-based compensation expense | 37 | 1,083 | 1,008 | ||||||||
Inventory write-offs for obsolescence | 1,755 | 1,354 | 1,290 | ||||||||
Deferred income taxes | 301 | 10,013 | (3,562 | ) | |||||||
Other | (2,129 | ) | 2,182 | 722 | |||||||
Net changes in operating assets and liabilities, net of acquisition: | |||||||||||
Accounts receivable | 1,322 | 982 | 318 | ||||||||
Inventories | (1,968 | ) | (3,961 | ) | (349 | ) | |||||
Prepaid expenses and other current assets | 955 | 2,799 | 266 | ||||||||
Trade accounts payable | 237 | (2,550 | ) | 618 | |||||||
Other current liabilities | (5,824 | ) | (1,034 | ) | 2,307 | ||||||
Net cash provided by operating activities | 11,420 | 13,928 | 23,254 | ||||||||
Investing activities | |||||||||||
Capital expenditures | (10,425 | ) | (9,978 | ) | (9,091 | ) | |||||
Proceeds from sale of property and equipment | 4,203 | 117 | 82 | ||||||||
Purchase of business | (10,626 | ) | (20,022 | ) | — | ||||||
Net cash used in investing activities | (16,848 | ) | (29,883 | ) | (9,009 | ) | |||||
Financing activities | |||||||||||
Proceeds from long-term debt | — | 29,000 | — | ||||||||
Repayments of principal upon termination of long-term debt | — | (14,000 | ) | — | |||||||
Principal payments on long-term debt | (2,133 | ) | (4,119 | ) | (4,137 | ) | |||||
Debt issuance costs | — | (453 | ) | — | |||||||
Proceeds from revolving facility | 25,000 | — | — | ||||||||
Payments on revolving facility | (20,000 | ) | — | — | |||||||
Purchase of treasury stock | — | (8,733 | ) | (32 | ) | ||||||
Distributions to noncontrolling interests | (15 | ) | (63 | ) | (77 | ) | |||||
Excess tax benefit from share-based compensation plan | — | — | 5 | ||||||||
Net cash provided by (used in) financing activities | 2,852 | 1,632 | (4,241 | ) | |||||||
Effect of exchange rate changes on cash and cash equivalents | (1,613 | ) | (2,678 | ) | (3,171 | ) | |||||
(Decrease) increase in cash and cash equivalents | (4,189 | ) | (17,001 | ) | 6,833 | ||||||
Cash and cash equivalents at beginning of year | 62,641 | 79,642 | 72,809 | ||||||||
Cash and cash equivalents at end of year | $ | 58,452 | $ | 62,641 | $ | 79,642 | |||||
See accompanying notes.
F-7
VISHAY PRECISION GROUP, INC.
Consolidated Statements of Equity
(In thousands, except share amounts)
Common Stock | Class B Convertible Common Stock | Treasury Stock | Capital in Excess of Par Value | Retained Earnings | Accumulated Other Comprehensive Income (Loss) | Total VPG Inc. Stockholders' Equity | Noncontrolling Interests | Total Equity | |||||||||||||||||||||||||||
Balance at January 1, 2014 | $ | 1,271 | $ | 103 | $ | — | $ | 188,424 | $ | 32,255 | $ | (16,007 | ) | $ | 206,046 | $ | 133 | $ | 206,179 | ||||||||||||||||
Net earnings | — | — | — | — | 3,080 | — | 3,080 | 178 | 3,258 | ||||||||||||||||||||||||||
Other comprehensive loss | — | — | — | — | — | (10,553 | ) | (10,553 | ) | — | (10,553 | ) | |||||||||||||||||||||||
Share-based compensation expense | — | — | — | 864 | — | — | 864 | — | 864 | ||||||||||||||||||||||||||
Restricted stock issuances (20,145 shares) | 2 | — | — | 239 | — | — | 241 | — | 241 | ||||||||||||||||||||||||||
Purchase of treasury stock (2,000 shares) | — | — | (32 | ) | — | — | — | (32 | ) | — | (32 | ) | |||||||||||||||||||||||
Tax effects of share-based compensation plan | — | — | — | 5 | — | — | 5 | — | 5 | ||||||||||||||||||||||||||
Distributions to noncontrolling interests | — | — | — | — | — | — | — | (77 | ) | (77 | ) | ||||||||||||||||||||||||
Balance at December 31, 2014 | $ | 1,273 | $ | 103 | $ | (32 | ) | $ | 189,532 | $ | 35,335 | $ | (26,560 | ) | $ | 199,651 | $ | 234 | $ | 199,885 | |||||||||||||||
Net (loss) earnings | — | — | — | — | (13,008 | ) | — | (13,008 | ) | 14 | (12,994 | ) | |||||||||||||||||||||||
Other comprehensive loss | — | — | — | — | — | (6,561 | ) | (6,561 | ) | — | (6,561 | ) | |||||||||||||||||||||||
Share-based compensation expense | — | — | — | 1,083 | — | — | 1,083 | — | 1,083 | ||||||||||||||||||||||||||
Restricted stock issuances (32,297 shares) | 3 | — | — | (179 | ) | — | — | (176 | ) | — | (176 | ) | |||||||||||||||||||||||
Purchase of treasury stock (617,667 shares) | — | — | (8,733 | ) | — | — | — | (8,733 | ) | — | (8,733 | ) | |||||||||||||||||||||||
Distributions to noncontrolling interests | — | — | — | — | — | — | — | (63 | ) | (63 | ) | ||||||||||||||||||||||||
Balance at December 31, 2015 | $ | 1,276 | $ | 103 | $ | (8,765 | ) | $ | 190,436 | $ | 22,327 | $ | (33,121 | ) | $ | 172,256 | $ | 185 | $ | 172,441 | |||||||||||||||
Net earnings | — | — | — | — | 6,404 | — | 6,404 | 4 | 6,408 | ||||||||||||||||||||||||||
Other comprehensive loss | — | — | — | — | — | (7,216 | ) | (7,216 | ) | — | (7,216 | ) | |||||||||||||||||||||||
Share-based compensation expense | — | — | — | 37 | — | — | 37 | — | 37 | ||||||||||||||||||||||||||
Restricted stock issuances (22,871 shares) | 2 | — | — | (100 | ) | — | — | (98 | ) | — | (98 | ) | |||||||||||||||||||||||
Distributions to noncontrolling interests | — | — | — | — | — | — | — | (15 | ) | (15 | ) | ||||||||||||||||||||||||
Balance at December 31, 2016 | $ | 1,278 | $ | 103 | $ | (8,765 | ) | $ | 190,373 | $ | 28,731 | $ | (40,337 | ) | $ | 171,383 | $ | 174 | $ | 171,557 | |||||||||||||||
See accompanying notes.
F-8
Vishay Precision Group, Inc.
Notes to Consolidated Financial Statements
Note 1 – Background and Summary of Significant Accounting Policies
Background
Vishay Precision Group, Inc. (“VPG” or the “Company”) is an internationally recognized designer, manufacturer and marketer of sensors, and sensor-based measurement systems, as well as specialty resistors and strain gages based upon the Company's proprietary technology. The Company provides precision products and solutions, many of which are “designed-in” by its customers, specializing in the growing markets of stress, force, weight, pressure, and current measurements.
Principles of Consolidation
The consolidated financial statements include the accounts of the individual entities in which the Company maintained a controlling financial interest. For those subsidiaries in which the Company’s ownership is less than 100 percent, the outside stockholders’ interests are shown as noncontrolling interests in the accompanying consolidated balance sheets.
All transactions, accounts, and profits between individual members comprising the Company have been eliminated in consolidation.
Use of Estimates
The preparation of financial statements in conformity with accounting principles generally accepted in the United States requires management to make estimates and assumptions that affect the amounts reported in the consolidated financial statements and accompanying notes. Actual results could differ significantly from those estimates.
Revenue Recognition
The Company recognizes revenue on product sales during the period when the sales process is complete. This generally occurs when products are shipped to the customer in accordance with terms of an agreement of sale, title and risk of loss have been transferred, collectability is reasonably assured, and pricing is fixed or determinable. For sales where title and risk of loss pass at the point of delivery, the Company recognizes revenue upon delivery to the customer, assuming all other criteria for revenue recognition are met.
The Company has post-shipment obligations, such as customer acceptance, training, or installation, with respect to some of its larger systems products. In such circumstances, a portion of the revenue may be deferred until the obligation has been completed, unless such obligation is deemed inconsequential or perfunctory.
Given the specialized nature of the Company’s products, it generally does not allow product returns.
Shipping and Handling Costs
Shipping and handling costs are included in costs of products sold.
Research and Development Expenses
Research and development costs are expensed as incurred. The amount charged to expense for research and development was $11.1 million, $9.6 million, and $10.1 million for the years ended December 31, 2016, 2015, and 2014, respectively. The Company spends additional amounts for the development of machinery and equipment for new processes, and for cost reduction measures.
Income Taxes
The Company accounts for income taxes under the asset and liability method, which requires the recognition of deferred tax assets and liabilities for the expected future tax consequences of events that have been included in the financial statements. Under this method, deferred tax assets and liabilities are determined based on the difference between the financial statement and tax basis of assets and liabilities using enacted tax rates in effect for the year in which the differences are expected to reverse. The effect of a change in tax rates on deferred tax assets and liabilities is recognized in income tax expense in the period that includes the enactment date.
The Company records net deferred tax assets to the extent it believes such assets will "more likely than not" be realized. In making this determination, the Company considers all positive and negative evidence, including historic earnings, projected future income, and cost-effective tax-planning strategies. When the Company determines that its ability to realize deferred tax assets is not "more likely than not", the Company adjusts its deferred tax asset valuation allowance, which increases income tax expense.
F-9
Note 1 – Background and Summary of Significant Accounting Policies (continued)
The Company records uncertain tax positions on the basis of a two-step process in which the Company first determines whether it is "more likely than not" that the tax positions will be sustained based on the technical merits of the position and then measures those tax positions that meet the more-likely-than-not recognition threshold. The Company recognizes the largest amount of tax benefit that is greater than 50 percent likely to be realized upon ultimate settlement with the tax authority.
The Company recognizes interest and penalties related to unrecognized tax benefits within income tax expense in the accompanying consolidated statements of operations. Accrued interest and penalties are included within the related tax liability line in the consolidated balance sheets.
Cash and Cash Equivalents
Cash and cash equivalents include demand deposits and highly liquid investments with original maturities of three months or less when purchased. Highly liquid investments with maturities greater than three months are classified as short-term investments. There were no investments classified as short-term investments at December 31, 2016 or 2015.
Allowance for Doubtful Accounts
The Company maintains an allowance for doubtful accounts for estimated losses resulting from the inability of its customers to make required payments. The allowance is determined through an analysis of the aging of accounts receivable and assessments of risk that are based on historical trends and an evaluation of the impact of current and projected economic conditions. The Company evaluates the past-due status of its trade receivables based on contractual terms of sale. If the financial condition of the Company’s customers were to deteriorate, resulting in an impairment of their ability to make payments, additional allowances may be required. The allowance for doubtful accounts was $0.5 million and $0.3 million at December 31, 2016 and 2015, respectively. Bad debt expense was $0.2 million, $0.1 million, $0.2 million for the years ended December 31, 2016, 2015, and 2014, respectively.
Inventories
Inventories are stated at the lower of cost, determined by the first-in, first-out method, or market based on net realizable value. Inventories are adjusted for estimated excess and obsolescence and written down to net realizable value based upon estimates of future demand, technology developments, and market conditions.
Property and Equipment
Property and equipment is carried at cost and is depreciated principally by the straight-line method based upon the estimated useful lives of the assets. Machinery and equipment are being depreciated over useful lives of seven to ten years. Buildings and building improvements are being depreciated over useful lives of twenty to forty years or the life of the leased property. Software is being depreciated over useful lives of three to five years. Construction in progress is not depreciated until the assets are placed in service. Depreciation expense was $9.3 million, $9.0 million, and $9.1 million for the years ended December 31, 2016, 2015, and 2014, respectively, which included software depreciation expense of $0.6 million, $0.8 million, and $1.0 million for the years ended December 31, 2016, 2015, and 2014, respectively.
Business Combinations
The Company allocates the purchase price of an acquired company, including when applicable, the fair value of contingent consideration between tangible and intangible assets acquired and liabilities assumed from the acquired businesses based on estimated fair values, with any residual of the purchase price recorded as goodwill. Third party appraisal firms and other consultants are engaged to assist management in determining the fair values of certain assets acquired and liabilities assumed. Estimating fair values requires significant judgments, estimates and assumptions, including but not limited to: discount rates, future cash flows and the economic lives of trade names, technology, customer relationships, property, plant and equipment, as well as income taxes. These estimates are based on historical experience and information obtained from the management of the acquired companies, and are inherently uncertain.
Goodwill and Other Intangible Assets
Goodwill, indefinite-lived trademarks, and in-process research and development ("IPRD") assets are tested for impairment at least annually, and whenever events or changes in circumstances occur indicating that it is "more likely than not" impairment may have been incurred. We have the option to first assess qualitative factors to determine whether it is "more likely than not" that the fair value of a reporting unit is less than its carrying amount as a basis for determining if it is necessary to perform the two-step goodwill impairment test. However, if we conclude otherwise, then we are required to perform the first step of the two-step impairment test by calculating the fair value of the reporting unit and comparing it against its carrying amount. We estimate the fair value of our reporting units by considering both an income approach and a market approach to valuation. The income approach to valuation uses our estimates of the future cash flows of the reporting unit discounted to their net present value using a discount rate determined
F-10
Note 1 – Background and Summary of Significant Accounting Policies (continued)
using the capital asset pricing model and adjusted for the forecast risk inherent in our projections of future cash flows. The income approach to valuation is dependent on inputs from management such as expected revenue growth, profitability, capital expenditures, and working capital requirements. The market approach to valuation uses the market capitalization of public companies similar to the reporting unit to calculate an implied EBITDA multiple, and we apply that calculated EBITDA multiple to the expected EBITDA of the reporting unit to estimate the fair value of the reporting unit, after consideration of appropriate control premiums. We weigh the results of the income approach and the market approach to arrive at the estimated fair value of the reporting unit. If the carrying amount of a reporting unit exceeds its fair value, then we are required to perform the second step of the goodwill impairment test. To measure the amount of the impairment, we determine the implied fair value of goodwill in the same manner as if we had acquired those reporting units. Specifically, we must allocate the fair value of the reporting unit to all of the assets of that unit, including any unrecognized intangible assets, in a hypothetical calculation that would yield the implied fair value of goodwill. The impairment loss is measured as the difference between the book value of the goodwill and the implied fair value of the goodwill computed in step two.
In 2015 and 2014, the Company estimated the fair value of its IPRD asset using an income approach to valuation. The Company estimated the future cash flows associated with the IPRD and discounted those cash flows back to their net present value using a discount rate determined using the capital asset pricing model, and adjusted for the forecast risk inherent in the projections of cash flows associated with this asset. The estimates of cash flows included revenues to be generated by the products supported by the IPRD and the expected profits on those product sales. As of the date of the 2016 impairment test, IPRD was subject to amortization and therefore was not included as part of the 2016 impairment test.
The Company's required goodwill annual impairment test is completed as of the first day of the fourth fiscal quarter each year. As more fully described in Note 4, the 2016 annual impairment test resulted in no impairment. The interim impairment test for 2015 resulted in the Company recording an impairment charge in the third quarter of 2015 and the annual impairment test for 2014 resulted in the Company recording an impairment charge in the fourth quarter of 2014.
The indefinite-lived trade names are tested for impairment by comparing the carrying value to the fair value based on current revenue projections of the related operations, under the relief from royalty method. Any excess carrying value over the applicable fair value is recognized as impairment. Any impairment would be recognized in the reporting period in which it has been identified. As more fully described in Note 4, the 2016 annual impairment test resulted in no impairment. The annual impairment test for 2015 resulted in the Company recording an impairment charge in the third quarter of 2015. There was no impairment identified through the annual impairment test completed in 2014.
Included in the Company's patents and acquired technology is an in-process research and development project acquired as part of the acquisition of the George Kelk Corporation ("KELK"). Until this project is ready for sale, it is analyzed as an indefinite-lived intangible asset. The Company's required annual indefinite-lived intangible asset impairment test is completed as of the first day of the fourth fiscal quarter each year. As more fully described in Note 4, there was no impairment identified through the annual impairment test which was completed in 2016 and 2015. The annual impairment test for 2014 resulted in the Company recording an impairment charge in the fourth quarter of 2014.
Definite-lived assets, such as customer relationships, patents and acquired technology, non-competition agreements, and certain trade names are amortized on a straight-line method over their estimated useful lives. Patents and acquired technology are being amortized over useful lives of seven to twenty years. Customer relationships are being amortized over useful lives of five to fifteen years. Trade names are being amortized over useful lives of seven to ten years. Non-competition agreements are being amortized over periods of five to ten years. The Company continually evaluates the reasonableness of the useful lives of these assets. Additionally, the Company reviews the carrying values of these assets for possible impairment whenever events or changes in circumstances indicate that the carrying value of the asset may not be recoverable based on undiscounted estimated cash flows expected to result from its use and eventual disposition.
Impairment of Long-Lived Assets
The carrying value of long-lived assets held-and-used, other than goodwill and indefinite-lived intangible assets, is evaluated when events or changes in circumstances indicate the carrying value may not be recoverable. The carrying value of a long-lived asset group is considered impaired when the total projected undiscounted cash flows from such asset group are separately identifiable and are less than the carrying value. In that event, a loss is recognized based on the amount by which the carrying value exceeds the fair market value of the long-lived asset group. Fair market value is determined primarily using present value techniques based on projected cash flows from the asset group. Losses on long-lived assets held-for-sale, other than goodwill and indefinite-lived intangible assets, are determined in a similar manner, except that fair market values are reduced for disposal costs.
F-11
Note 1 – Background and Summary of Significant Accounting Policies (continued)
Foreign Currency Translation
The Company has significant operations outside of the United States. The Company's operations in Europe, Canada, and certain locations in Asia primarily generate and expend cash in local currencies, and accordingly, these subsidiaries utilize the local currency as their functional currency. The Company’s operations in Israel and certain locations in Asia primarily generate cash in U.S. dollars, and accordingly, these subsidiaries utilize the U.S. dollar as their functional currency.
For those subsidiaries where the local currency is the functional currency, assets and liabilities in the consolidated balance sheets have been translated at the rate of exchange as of the balance sheet date. Revenues and expenses are translated at the average exchange rate for the year. Translation adjustments do not impact the consolidated statements of operations and are reported as a separate component of accumulated other comprehensive loss within the statement of comprehensive income. Foreign currency transaction gains and losses are included in the results of operations.
For those foreign subsidiaries where the U.S. dollar is the functional currency, all foreign currency financial statement amounts are remeasured into U.S. dollars. Exchange gains and losses arising from remeasurement of foreign currency-denominated monetary assets and liabilities are included in the consolidated statements of operations.
Share-Based Compensation
Compensation costs related to share-based payments are recognized in the consolidated financial statements. The amount of compensation cost is measured based on the grant-date fair value of the equity instruments issued. Compensation cost is recognized over the period that an officer, employee, or non-employee director provides service in exchange for the award. For performance based awards, the Company recognizes compensation cost for awards that are expected to vest and for which performance criteria are expected to be met. For options and restricted stock units subject to graded vesting, the Company recognizes expense over the service period for each separately vesting portion of the award as if the award was comprised of multiple awards.
Reclassifications
Certain prior year amounts have been reclassified to conform to the current financial statement presentation.
Commitments and Contingencies
Liabilities for loss contingencies arising from claims, assessments, litigation, fines, penalties, and other sources are recorded when it is probable that a liability has been incurred and the amount of the assessment and/or remediation can be reasonably estimated.
Recent Accounting Pronouncements
In January 2017, the Financial Accounting Standards Board (“FASB”) issued Accounting Standards Update (“ASU”) No. 2017‑04, “Simplifying the Test for Goodwill Impairment.” This ASU eliminates the requirement to calculate the implied fair value of goodwill (second step) to measure a goodwill impairment charge. Under the guidance, an impairment charge will be measured based on the excess of the reporting unit’s carrying amount over its fair value (first step). The amendments in this ASU are effective for interim and annual reporting periods beginning after December 15, 2019 and early adoption is permitted. The Company is evaluating the new standard to determine the impact on the Company’s consolidated financial statements.
In January 2017, FASB issued ASU No. 2017‑01, “Clarifying the Definition of a Business.” This ASU provides a more robust framework to determine when a set of assets and activities is a business. The amendments in this ASU are effective for interim and annual reporting periods beginning after December 15, 2017 and will be applied prospectively to any transactions occurring within the period of adoption. Early adoption is permitted, including for interim or annual periods in which the financial statements have not been issued or made available for issuance. The Company is evaluating the new standard to determine the impact on the Company’s consolidated financial statements.
In August 2016, FASB issued ASU No. 2016-15, “Classification of Certain Cash Receipts and Cash Payments.” This ASU is intended to clarify the presentation of certain cash receipts and payments within the statement of cash flows. The amendments in this ASU are effective for interim and annual periods beginning after December 15, 2017. Early adoption is permitted. The Company is evaluating the new standard to determine the impact on the Company’s consolidated financial statements.
In March 2016, FASB issued ASU No. 2016-09,"Improvements to Employee Share-Based Payment Accounting." This ASU simplifies several aspects of the accounting for employee share-based payment transactions, including the accounting for income taxes, forfeitures, and statutory tax withholding requirements, as well as classification in the statement of cash flows. The
F-12
Note 1 – Background and Summary of Significant Accounting Policies (continued)
amendments in this ASU are effective for interim and annual periods beginning after December 15, 2016. The adoption of this standard update is not expected to have a material impact on the Company's consolidated financial statements.
In February 2016, FASB issued ASU No. 2016-02, “Leases (Topic 842),” a comprehensive new lease standard that amends various aspects of existing accounting guidance for leases. The core principle of this ASU will require lessees to present the assets and liabilities that arise from leases on their balance sheets. The ASU is effective for public companies for annual periods beginning after December 15, 2018, and interim periods within those fiscal years. Early adoption is permitted. The Company is evaluating the new standard to determine the impact on the Company’s consolidated financial statements.
In September 2015, FASB issued ASU No. 2015-16, "Business Combinations (Topic 805)," which requires that an acquirer recognize adjustments to provisional amounts that are identified during the measurement period in the reporting period in which the adjustment amounts are determined. The amendment will be effective prospectively for reporting periods beginning on or after December 15, 2015, and therefore was adopted on January 1, 2016. The adoption of this standard update did not have a material impact on the Company's consolidated financial statements.
In July 2015, FASB issued ASU No. 2015-11, "Simplifying the Measurement of Inventory (Topic 330)," which simplifies the subsequent measurement of inventory by requiring inventory to be measured at the lower of cost and net realizable value. Net realizable value is the estimated selling price in the ordinary course of business, less reasonably predictable costs of completion, disposal and transportation. The ASU is effective for public companies for annual reporting periods beginning after December 15, 2016, and interim periods within those fiscal years. The adoption of this standard update is not expected to have a material impact on the Company's consolidated financial statements.
In April 2015, FASB issued ASU 2015-03, "Interest-Imputation of Interest (Subtopic 835-30): Simplifying the Presentation of Debt Issuance Costs." This standard update requires an entity to present debt issuance costs on the balance sheet as a direct deduction from the related debt liability rather than as an asset. Amortization of the costs will continue to be reported as interest expense. The update is effective for annual reporting periods (including interim reporting periods within those periods) beginning after December 15, 2015. The Company adopted this ASU in the first fiscal quarter of 2016. Accordingly, the Company reclassified its capitalized debt issuance costs previously recorded within other assets to a contra-liability reducing long-term debt on the consolidated balance sheets. The reclassification was $0.5 million and $0.6 million as of December 31, 2016 and 2015, respectively. The adoption of this ASU did not have a material impact on the Company's consolidated financial statements.
In May 2014, FASB issued ASU No. 2014-09, "Revenue from Contracts with Customers," and modified the standard thereafter. The objective of the ASU is to establish a single comprehensive model for entities to use in accounting for revenue arising from contracts with customers and will supersede most current revenue recognition guidance. The basis of the guidance is that an entity should recognize revenue to depict the transfer of promised goods or services to customers in an amount that reflects the consideration to which the entity expects to be entitled in exchange for those goods and services.
The ASU is effective for annual and interim periods beginning after December 15, 2017 and may be early adopted for annual and interim periods beginning after December 15, 2016. The guidance permits adoption by retrospectively applying the guidance to each prior reporting period presented (full retrospective method) or prospectively applying the guidance and providing additional disclosures comparing results to previous guidance, with the cumulative effect of initially applying the guidance recognized in beginning retained earnings at the date of initial application (modified retrospective method). The Company is in the process of determining the adoption method.
The Company is in the assessment phase, reviewing a representative sample of contracts, discussions with key stakeholders and cataloging potential impacts on the Company’s operations, accounting policies, internal control over financial reporting and financial statements. The Company has identified that the key changes in the ASU that could potentially impact the Company’s revenue recognition related to the allocation of contract revenues between various products and services, the timing of when those revenues are recognized and the deferral of incremental costs to obtain a contract. The Company is continuing to determine the impact of the ASU on the consolidated results of operations, financial position, cash flows and financial statement disclosures.
Note 2 – Related Party Transactions
Until July 6, 2010, VPG was part of Vishay Intertechnology, and the assets and liabilities consisted of those that Vishay Intertechnology attributed to its precision measurement and foil resistor businesses. Following the spin-off on July 6, 2010, VPG is an independent, publicly-traded company, and Vishay Intertechnology does not retain any ownership interest in VPG.
Subsequent to the spin-off, VPG and Vishay Intertechnology continue to share certain manufacturing locations. VPG owns one location in Japan at which it leases space to Vishay Intertechnology. Vishay Intertechnology owns one location in the United States,
F-13
Note 2 – Related Party Transactions (continued)
at which it leases space to VPG. Through July 2014, Vishay Intertechnology also leased a location in Israel to VPG. Lease receipts and payments related to the shared facilities are immaterial.
Note 3 – Acquisition Activity
Pacific Instruments, Inc.
On April 6, 2016, the Company completed the acquisition of Pacific Instruments, Inc. ("Pacific") for an aggregate purchase price of $10.6 million. Pacific is a designer and manufacturer of high-performance data acquisition systems and has extensive experience integrating these systems. Pacific sells primarily to the aerospace, commercial aviation and defense markets in the United States. Pacific provides installation, facility integration, training, and on-going technical support for their manufactured products. Pacific products expand the offerings of our Foil Technology Products reporting segment, which already offered data acquisition systems, primarily instruments in the field of strain measurement.
The following table summarizes the fair values assigned to the assets and liabilities of Pacific as of April 6, 2016 (in thousands):
April 6, 2016 | Adjustments | Adjusted | |||||||||
Working capital (a) | $ | 686 | $ | 235 | $ | 921 | |||||
Property and equipment | 26 | — | 26 | ||||||||
Long-term deferred income tax liability | (1,993 | ) | 90 | (1,903 | ) | ||||||
Intangible assets: | |||||||||||
Patents and acquired technology | 1,300 | — | 1,300 | ||||||||
Non-competition agreements | 40 | — | 40 | ||||||||
Customer relationships | 3,500 | — | 3,500 | ||||||||
Trade names | 700 | — | 700 | ||||||||
Total intangible assets | 5,540 | — | 5,540 | ||||||||
Fair value of acquired identifiable assets and liabilities | 4,259 | 325 | 4,584 | ||||||||
Purchase price | $ | 10,727 | $ | (101 | ) | $ | 10,626 | ||||
Goodwill | $ | 6,468 | $ | (426 | ) | $ | 6,042 | ||||
(a) | Working capital accounts include accounts receivable, inventory, prepaid expenses and other current assets, trade accounts payable, accrued payroll, income taxes payable, and other accrued expenses. |
The weighted average useful lives for the patents and acquired technology, non-competition agreements, and customer relationships are 20 years, 6.5 years, and 15 years, respectively. None of the goodwill associated with this transaction is deductible for income tax purposes.
The Company recorded acquisition costs associated with this transaction in its consolidated statements of operation as follows (in thousands):
Year ended December 31, 2016 | |||
Accounting and legal fees | $ | 369 | |
Appraisal fees | 41 | ||
Other | 21 | ||
$ | 431 | ||
Stress-Tek, Inc.
On December 30, 2015, the Company completed the acquisition of Stress-Tek, Inc. ("Stress-Tek"), based in Kent, Washington, for an aggregate purchase price of $20.1 million. Stress-Tek is a designer and manufacturer of state-of-the-art, rugged and reliable strain gage-based load cells and force measurement systems primarily servicing the North American market. Their sensors and display systems are used in a wide range of industries, predominantly in transportation and trucking, for timber, refuse, aggregate, mining, and general trucking applications. Stress-Tek adds new products to the Company's Weighing and Control Systems reporting segment which enhances and broadens the Company's on-board weighing offerings with products that are recognized for high quality in their markets.
F-14
Note 3 – Acquisition Activity (continued)
The following table summarizes the fair values assigned to the assets and liabilities as of the December 30, 2015 acquisition date (in thousands):
December 30, 2015 | Adjustments | Adjusted | |||||||||
Working capital (a) | $ | 2,479 | $ | 85 | $ | 2,564 | |||||
Property and equipment | 6,338 | — | 6,338 | ||||||||
Intangible assets: | |||||||||||
Patents and acquired technology | 1,600 | — | 1,600 | ||||||||
Non-competition agreements | 60 | — | 60 | ||||||||
Customer relationships | 2,500 | — | 2,500 | ||||||||
Trade names | 700 | — | 700 | ||||||||
Total intangible assets | 4,860 | — | 4,860 | ||||||||
Fair value of acquired identifiable assets | 13,677 | 85 | 13,762 | ||||||||
Purchase price | $ | 20,101 | $ | (28 | ) | $ | 20,073 | ||||
Goodwill | $ | 6,424 | $ | (113 | ) | $ | 6,311 | ||||
(a) | Working capital accounts include cash, accounts receivable, inventory, prepaid expenses and other current assets, trade accounts payable, accrued payroll, and other accrued expenses. |
The weighted average useful lives for the patents and acquired technology, non-competition agreements, and customer relationships are 20, 5, and 15 years, respectively. Most of the goodwill associated with this transaction will be deductible for income tax purposes.
The Company recorded acquisition costs associated with this transaction in its consolidated statements of operations as follows (in thousands):
Years ended December 31, | |||||||
2016 | 2015 | ||||||
Accounting and legal fees | $ | 51 | $ | 70 | |||
Appraisal fees | 12 | 62 | |||||
Other | — | 53 | |||||
$ | 63 | $ | 185 | ||||
F-15
Note 4 – Goodwill and Other Intangible Assets
The Company performed the first step of the two-step impairment test as of the first day of the fiscal 2016 fourth quarter by calculating the fair value of the reporting units and comparing it against its carrying amount. The Company estimated the fair value of its reporting units by considering both an income approach and a market approach to valuation. The income approach to valuation used the Company’s estimates of the future cash flows of the reporting unit discounted to their net present value applying a discount rate determined using the capital asset pricing model and adjusted for the forecast risk inherent in the Company’s projections of future cash flows. The income approach to valuation is dependent on inputs from management such as expected revenue growth, profitability, capital expenditures and working capital requirements. The market approach to valuation used the market capitalization of public companies similar to the reporting unit to calculate an implied EBITDA multiple. The Company applied that calculated EBITDA multiple to the expected EBITDA of the reporting unit to estimate the fair value of the reporting unit. Both of these approaches to estimating the fair value of the unit use inputs that are considered “Level 3” inputs to the fair value estimate (see Note 15 for a definition of Level 3 valuation inputs within the fair value hierarchy). The Company equally weighted the results of the income approach and the market approach to arrive at the estimated fair value of the reporting units.
After completing step one, the Company determined that the fair value of each of the reporting units exceeded its carrying value resulting in no impairment.
As a result of the 2015 and 2014 goodwill impairment tests for the KELK business, the Company recorded impairment charges of $4.8 million in 2015 and $4.6 million in 2014.
The determination of the fair value of the reporting unit and the allocation of that value to individual assets and liabilities within the reporting unit requires the Company to make significant estimates and assumptions. These estimates and assumptions include the selection of appropriate peer group companies, control premiums appropriate for acquisitions in the industries in which the Company competes, the discount rate, terminal growth rates, and forecasts of revenue, operating income, depreciation and amortization, and capital expenditures.
Due to the inherent uncertainty involved in making these estimates, actual financial results could differ from those estimates. Changes in assumptions concerning future financial results or other underlying assumptions could have a significant impact on either the fair value of the reporting unit or the amount of the goodwill impairment charges.
The change in the carrying amount of goodwill by segment is as follows (in thousands):
Total | Weighing and Control Systems Segment | Foil Technology Products Segment | |||||||||||||
KELK Acquisition | Stress-Tek Acquisition | Pacific Instruments | |||||||||||||
Balance at January 1, 2014 | $ | 12,788 | $ | 12,788 | $ | — | $ | — | |||||||
Goodwill acquired | 6,424 | — | 6,424 | — | |||||||||||
Impairment charges | (4,761 | ) | (4,761 | ) | — | — | |||||||||
Foreign currency translation adjustment | (1,848 | ) | (1,848 | ) | — | — | |||||||||
Balance at December 31, 2015 | $ | 12,603 | $ | 6,179 | $ | 6,424 | $ | — | |||||||
Goodwill acquired | 6,042 | — | — | 6,042 | |||||||||||
Adjustment to goodwill acquired | (113 | ) | — | (113 | ) | — | |||||||||
Foreign currency translation adjustment | 185 | 185 | — | — | |||||||||||
Balance at December 31, 2016 | $ | 18,717 | $ | 6,364 | $ | 6,311 | $ | 6,042 | |||||||
F-16
Note 4 – Goodwill and Other Intangible Assets (continued)
Intangible assets were as follows (in thousands):
December 31, | |||||||
2016 | 2015 | ||||||
Intangible assets subject to amortization | |||||||
(Definite-lived): | |||||||
Patents and acquired technology | $ | 9,669 | $ | 8,499 | |||
Customer relationships | 20,934 | 17,395 | |||||
Trade names | 1,621 | 1,688 | |||||
Non-competition agreements | 11,348 | 11,297 | |||||
43,572 | 38,879 | ||||||
Accumulated amortization: | |||||||
Patents and acquired technology | (3,865 | ) | (3,629 | ) | |||
Customer relationships | (8,162 | ) | (7,288 | ) | |||
Trade names | (1,609 | ) | (1,668 | ) | |||
Non-competition agreements | (10,761 | ) | (10,371 | ) | |||
(24,397 | ) | (22,956 | ) | ||||
Net intangible assets subject to amortization | $ | 19,175 | $ | 15,923 | |||
Intangible assets not subject to amortization | |||||||
(Indefinite-lived): | |||||||
Trade names | 2,410 | 1,680 | |||||
In-process research and development | — | 80 | |||||
$ | 21,585 | $ | 17,683 | ||||
Certain intangible assets are subject to foreign currency translation.
In conjunction with the acquisition of Pacific on April 6, 2016 (see Note 3), the Company allocated $4.8 million of the purchase price to definite-lived intangible assets and $0.7 million to indefinite-lived intangible assets at December 31, 2016. The Company has determined that the trade name is an indefinite-lived intangible asset.
In conjunction with the acquisition of Stress-Tek on December 30, 2015 (see Note 3), the Company allocated $4.2 million of the purchase price to definite-lived intangible assets and $0.7 million to indefinite-lived intangible assets at December 31, 2015. The Company has determined that the trade name is an indefinite-lived intangible asset.
The Company performed an impairment test on the indefinite-lived trade names as of the first day of the fiscal 2016 fourth quarter and determined there was no impairment. As a result of the 2015 indefinite-lived trade names impairment test, the Company recorded an impairment charge of $0.2 million. As a result of the 2014 indefinite-lived trade names impairment test, the Company determined there was no impairment.
As a result of the 2015 impairment test on the indefinite-lived in-process research and development (“IPRD”), the Company determined there was no impairment. As a result of the 2014 impairment test on the IPRD, the Company recorded an impairment charge of $0.8 million.
Amortization expense was $1.8 million, $2.1 million, and $2.6 million, for the years ended December 31, 2016, 2015, and 2014, respectively.
F-17
Note 4 – Goodwill and Other Intangible Assets (continued)
Estimated annual amortization expense for each of the next five years is as follows (in thousands):
2017 | $ | 1,890 | |
2018 | 1,679 | ||
2019 | 1,504 | ||
2020 | 1,501 | ||
2021 | 1,455 | ||
Note 5 – Restructuring Costs
Restructuring costs reflect the cost reduction programs implemented by the Company. Restructuring costs are expensed during the period in which the Company determines it will incur those costs and all requirements for accrual are met. Because these costs are recorded based upon estimates, actual expenditures for the restructuring activities may differ from the initially recorded costs. If the initial estimates are too low or too high, the Company could be required to either record additional expense in future periods or to reverse part of the previously recorded charges.
On March 23, 2016, the Company announced, in connection with the November 16, 2015 global cost reduction program, the decision to close its facility in Alajuela, Costa Rica. Approximately $0.4 million of restructuring costs were recorded during the year ended December, 31, 2016 related to this closure. This closure was substantially complete as of December 31, 2016.
On November 16, 2015, the Company announced a cost reduction program as part of its efforts to improve efficiency and operating performance. Approximately $0.4 million of restructuring costs, excluding the cost associated with the Costa Rica closure, were recorded during the year ended December 31, 2016 related to this program. Complete implementation of this program is expected to occur by the end of the second quarter of 2017.
During the year ended December 31, 2016, the Company initiated other cost reduction plans at locations in Europe, the U.S. and Canada. Approximately $1.9 million of restructuring costs, primarily severance, were recorded during the year ended December 31, 2016 related to these plans.
The Company recorded restructuring costs of $2.7 million, $4.5 million, and $0.7 million during the years ended December 31, 2016, 2015, and 2014, respectively. Restructuring costs were comprised primarily of employee termination costs, including severance and statutory retirement allowances, and were incurred in connection with various cost reduction programs.
The following table summarizes the activity to date related to these programs. The accrued restructuring liability balance as of December 31, 2016 and 2015, respectively, is included in other accrued expenses in the accompanying consolidated balance sheets (in thousands):
Balance at January 1, 2014 | 51 | ||
Restructuring charges in 2014 | 668 | ||
Adjustment | 8 | ||
Cash payments | (367 | ) | |
Foreign currency translation | (9 | ) | |
Balance at December 31, 2014 | $ | 351 | |
Restructuring charges in 2015 | 4,461 | ||
Cash payments | (1,964 | ) | |
Foreign currency translation | (21 | ) | |
Balance at December 31, 2015 | $ | 2,827 | |
Restructuring charges in 2016 | 2,666 | ||
Cash payments | (4,152 | ) | |
Foreign currency translation | (8 | ) | |
Balance at December 31, 2016 | $ | 1,333 | |
F-18
Note 6 – Income Taxes
For financial reporting purposes, income before taxes includes the following components (in thousands):
Years ended December 31, | |||||||||||
2016 | 2015 | 2014 | |||||||||
Domestic | $ | (5,285 | ) | $ | (4,874 | ) | $ | (3,575 | ) | ||
Foreign | 14,892 | 5,380 | 9,446 | ||||||||
$ | 9,607 | $ | 506 | $ | 5,871 | ||||||
The expense (benefit) for income taxes is comprised of (in thousands):
Years ended December 31, | |||||||||||
2016 | 2015 | 2014 | |||||||||
Current: | |||||||||||
Federal | $ | (18 | ) | $ | 492 | $ | 1,934 | ||||
State and local | 30 | (12 | ) | 36 | |||||||
Foreign | 2,886 | 3,007 | 4,205 | ||||||||
2,898 | 3,487 | 6,175 | |||||||||
Deferred: | |||||||||||
Federal | (1,176 | ) | 10,039 | (3,376 | ) | ||||||
State and local | (9 | ) | 630 | (46 | ) | ||||||
Foreign | 1,486 | (656 | ) | (140 | ) | ||||||
301 | 10,013 | (3,562 | ) | ||||||||
Total income tax expense | $ | 3,199 | $ | 13,500 | $ | 2,613 | |||||
A reconciliation of income tax expense (benefit) at the U.S. federal statutory income tax rate to the actual income tax provision is as follows (in thousands):
Years ended December 31, | |||||||||||
2016 | 2015 | 2014 | |||||||||
Tax at statutory rate | $ | 3,362 | $ | 177 | $ | 2,055 | |||||
State income taxes, net of U.S. federal tax benefit | (15 | ) | 383 | (10 | ) | ||||||
Effect of foreign operations | (1,023 | ) | 803 | (1,026 | ) | ||||||
Residual U.S. tax on foreign earnings | (307 | ) | — | 2,426 | |||||||
Change in valuation allowance | 1,266 | 12,309 | (1,361 | ) | |||||||
Change in unrecognized tax benefits, net | (899 | ) | 12 | 273 | |||||||
Impairment of goodwill and indefinite-lived intangibles | — | 360 | 303 | ||||||||
Specialty tax credits | (78 | ) | (216 | ) | (362 | ) | |||||
Statutory rate changes | (180 | ) | 114 | (166 | ) | ||||||
Prior period deferred tax adjustments | 817 | — | — | ||||||||
Other | 256 | (442 | ) | 481 | |||||||
Total income tax expense | $ | 3,199 | $ | 13,500 | $ | 2,613 | |||||
F-19
Note 6 – Income Taxes (continued)
Deferred income taxes represent the net tax effects of temporary differences between the carrying amounts of assets and liabilities for financial reporting purposes and the amounts for income tax purposes. During the fourth quarter of 2016, the Company wrote off deferred tax assets that had been recorded in periods prior to 2016, but which the Company determined did not meet the recognition criteria required by ASC 740 "Income Taxes". The deferred tax assets were recognized over a period of years. Of the amount written-off, $0.1 million was initially recognized in 2014 and the remaining $0.7 million was initially recognized in periods prior to 2014. Significant components of the Company’s deferred tax assets and liabilities are as follows (in thousands):
December 31, | |||||||
2016 | 2015 | ||||||
Deferred tax assets: | |||||||
Pension and other postretirement costs | $ | 4,714 | $ | 4,843 | |||
Inventories | 2,466 | 2,275 | |||||
Net operating/capital loss carryforwards | 11,825 | 9,482 | |||||
Tax credit carryforwards | 5,077 | 4,712 | |||||
Deferred compensation | 2,468 | 2,392 | |||||
Other accruals and reserves | 2,879 | 3,480 | |||||
Intangible assets, including tax deductible goodwill | — | 784 | |||||
Total gross deferred tax assets | 29,429 | 27,968 | |||||
Less: valuation allowance | (20,741 | ) | (19,144 | ) | |||
8,688 | 8,824 | ||||||
Deferred tax liabilities: | |||||||
Tax over book depreciation | (189 | ) | (255 | ) | |||
Intangible assets, including tax deductible goodwill | (1,361 | ) | — | ||||
Total gross deferred tax liabilities | (1,550 | ) | (255 | ) | |||
Net deferred tax assets | $ | 7,138 | $ | 8,569 | |||
In 2015, the Company established a valuation allowance with respect to substantially all of its U.S. deferred tax assets due to uncertainty regarding the realization of these assets. Throughout 2016, the Company reassessed its ability to realize its U.S. and other deferred tax assets by considering both positive and negative evidence regarding realization. The most significant negative evidence is continuing cumulative operating losses in the U.S. The impact of the acquisitions of Stress-Tek and Pacific was also considered in determining the realization of the U.S. deferred tax assets. The Pacific acquisition resulted in the establishment of deferred tax liabilities which allowed the Company to adjust its previously established valuation allowance by $1.6 million. Other aspects, such as operating results, additional interest expense and additional tax deductions related to the Stress-Tek acquisition, were also considered. The Company also considered positive evidence such as tax planning strategies and the projected benefits of our restructuring efforts. However, there was insufficient positive evidence to overcome the negative evidence.
Overall, the cumulative losses and the acquisition impacts still indicate that realization of our U.S. deferred tax assets remains uncertain such that the Company cannot conclude that it is "more likely than not" that the deferred tax assets will be recoverable. We will continue to monitor the realization of U.S. deferred tax assets and reduce the valuation allowance if, and when, sufficient positive evidence of realization exists. At December 31, 2016 and 2015, the valuation allowance on U.S. deferred tax assets was approximately $18.1 million and $16.7 million, respectively.
The Company also has valuation allowances of $2.6 million and $2.5 million at December 31, 2016 and 2015, respectively, with respect to certain foreign net operating loss and capital loss carryforwards. The valuation allowance related to Israel capital losses was reduced during 2016 as a result of the sale of the Karmiel facility because the sale triggered a capital gain. Significant valuation allowances are as follows (in thousands):
F-20
Note 6 – Income Taxes (continued)
December 31, | |||||||
Jurisdiction | 2016 | 2015 | |||||
U.S. federal | $ | 13,101 | $ | 12,454 | |||
U.S. state (net of U.S. federal tax benefit) | 5,022 | 4,206 | |||||
Israel - capital losses | 1,486 | 1,783 | |||||
The following table summarizes significant net operating losses and credit carryforwards as of December 31, 2016 (in thousands):
December 31, | |||||
Jurisdiction | 2016 | Expiring | |||
U.S. federal net operating losses | $ | 10,276 | 2035-2036 | ||
U.S. foreign tax credit | 4,970 | 2020-2024 | |||
U.S state net operating losses | 62,032 | 2023-2036 | |||
Israel net operating losses | 14,661 | No expiration | |||
Undistributed earnings of the Company’s foreign subsidiaries amounted to approximately $96.8 million at December 31, 2016 compared to $89.2 million at December 31, 2015. Substantially all of the undistributed earnings are considered to be indefinitely reinvested and accordingly, no provision has been made for U.S. federal and state income taxes. If those earnings were distributed to the U.S., the Company could be subject to U.S. income taxes, state income taxes, incremental foreign income taxes, and withholding taxes. Determination of the amount of unrecognized deferred U.S. income tax liability is not practicable because of the uncertainty regarding the timing of any such distribution, the impact on existing valuation allowances, and complexities associated with the U.S. foreign tax credit rules. Withholding taxes of approximately $14.7 million are estimated to be payable upon remittance of all previously unremitted earnings as of December 31, 2016.
Net income taxes paid were $3.9 million, $4.5 million, and $3.1 million for the years ended December 31, 2016, 2015, and 2014, respectively.
The Company and its subsidiaries are subject to income taxes imposed by the U.S., various states, and the foreign jurisdictions in which we operate. Each jurisdiction establishes rules that set forth the years which are subject to examination by its tax authorities. While the Company believes the tax positions taken on its tax returns for each jurisdiction are supportable, they may still be challenged by the jurisdiction's tax authorities. In anticipation of such challenges, the Company has established reserves for tax-related uncertainties. These liabilities are based on the Company’s best estimate of the potential tax exposures in each respective jurisdiction. It may take a number of years for a final tax liability in a jurisdiction to be determined, particularly in the event of an audit. If an uncertain matter is determined favorably, there could be a reduction in the Company’s tax expense. An unfavorable determination could increase tax expense and could require a cash payment, including interest and penalties.
Since the Company and its affiliates have been included in tax returns filed by Vishay Intertechnology, our former parent, for periods prior to, and including, July 6, 2010, the Company has joint and several liability in multiple tax jurisdictions with respect to those tax returns. Under the terms of the Tax Matters Agreement entered into with Vishay Intertechnology, they have agreed to indemnify us for any such liability including interest and penalties, and any similar liability related to U.S. federal, state, local, and foreign income taxes whether determined on a separate company, consolidated, combined, unitary, or similar basis for each tax period during which the Company or its subsidiaries were part of Vishay Intertechnology’s affiliated group.
As of December 31, 2016, the Company recorded a gross tax liability of $0.1 million, which includes interest and penalties, related to these uncertain tax positions. The Company has also recorded a corresponding receivable, net of a $0.2 million payment received in 2015, from Vishay Intertechnology.
F-21
Note 6 – Income Taxes (continued)
The following table summarizes changes in the Company's gross liabilities, excluding interest and penalties, associated with unrecognized tax benefits (in thousands):
December 31, | |||||||||||
2016 | 2015 | 2014 | |||||||||
Balance at beginning of year | $ | 1,506 | $ | 1,704 | $ | 1,373 | |||||
Addition based on tax positions related to current year | 63 | 109 | 238 | ||||||||
Addition based on tax positions related to prior years | 66 | 13 | 249 | ||||||||
Addition related to acquired company | 297 | — | — | ||||||||
Currency translation adjustments | 16 | (29 | ) | (100 | ) | ||||||
Reduction for settled tax examinations | (906 | ) | — | — | |||||||
Reduction for payments made | — | (241 | ) | — | |||||||
Reduction for lapses of statute of limitations | (270 | ) | (50 | ) | (56 | ) | |||||
Balance before indemnification receivable | 772 | 1,506 | 1,704 | ||||||||
Receivable from Vishay Intertechnology for indemnification | (57 | ) | (107 | ) | (281 | ) | |||||
Balance at end of year | $ | 715 | $ | 1,399 | $ | 1,423 | |||||
The Company recognizes accrued interest and penalties related to unrecognized tax benefits as a component of income tax expense. Related to the unrecognized tax benefits noted above, the Company accrued total penalties and interest of $0.3 million as of December 31, 2016, none of which was included in the indemnification receivable. As of December 31, 2015 and December 31, 2014, the Company accrued total penalties and interest of $0.3 million and $0.5 million, respectively, of which $0.0 million and $0.3 million, respectively, were recorded within the indemnification receivable from Vishay Intertechnology.
Included in the balance of unrecognized tax benefits as of December 31, 2016, 2015, and 2014 is $0.8 million, $1.5 million, and $1.7 million, respectively, of tax benefits that, if recognized, would impact the effective tax rate. The Company believes that it is reasonably possible that an increase in unrecognized tax benefits related to foreign exposures of between $0.1 million and $0.2 million may be necessary in 2017. As of December 31, 2016, the Company anticipates that it is reasonably possible that it will reverse up to $0.2 million of its current unrecognized tax benefits within the calendar year due to the expiration of the statute of limitations in certain jurisdictions. In addition, the Company believes it is reasonably possible that it may pay up to $0.2 million to tax authorities to settle current unrecognized tax benefits. Approximately $0.1 million of the unrecognized tax benefits the Company expects to reverse in 2017 due to statute lapses are covered by the Tax Matters Agreement. Upon reversal, the Company will recognize a pre-tax expense and a corresponding income tax benefit.
The Company and its subsidiaries file U.S. federal income tax returns, as well as income tax returns in various state, local, and foreign jurisdictions. The Company files federal, state, and local income tax returns on a combined, unitary, or stand-alone basis. The statute of limitations in those jurisdictions generally ranges from 3 to 4 years. Additionally, the Company's foreign subsidiaries file income tax returns in the countries in which they have operations and the statutes of limitations in those jurisdictions generally range from 3 to 10 years.
During 2016, the Company concluded a tax examination in Israel for the years 2012-2014. The Company is subject to ongoing income tax audits, administrative appeals and judicial proceedings in India spanning a number of years.
F-22
Note 7 – Long-Term Debt
Long-term debt consists of the following (in thousands):
December 31, | |||||||
2016 | 2015 | ||||||
2015 Credit Agreement - Revolving Facility | $ | 9,000 | $ | 4,000 | |||
2015 Credit Agreement - U.S. Closing Date Term Facility | 4,128 | 4,500 | |||||
2015 Credit Agreement - U.S. Delayed Draw Term Facility | 10,092 | 11,000 | |||||
2015 Credit Agreement - Canadian Term Facility | 8,780 | 9,500 | |||||
Exchangeable Unsecured Notes, due 2102 | 4,097 | 4,097 | |||||
Other debt | 509 | 614 | |||||
Deferred financing costs | (454 | ) | (554 | ) | |||
36,152 | 33,157 | ||||||
Less: current portion | 2,623 | 2,120 | |||||
$ | 33,529 | $ | 31,037 | ||||
2015 Credit Agreement
On December 30, 2015, the Company entered into a Second Amended and Restated Credit Agreement (the “2015 Credit Agreement”) among the Company, VPG Canada, the lenders, Citizens Bank, National Association and Wells Fargo Bank, National Association as joint book-runners and JPMorgan Chase Bank, National Association as agent for such lenders (the “Agent”), pursuant to which the terms of the Company’s multi-currency, secured credit facility were revised and expanded to provide for the following facilities: (1) a secured revolving facility (the “2015 Revolving Facility”) in an aggregate principal amount of $30.0 million, with a sublimit of $10.0 million which can be used for letters of credit for the account of the Company or its U.S. and Canadian subsidiaries, the proceeds of which may be used for working capital and general corporate purposes, and a portion of which was used to fund the Stress-Tek and Pacific acquisitions; (2) a secured closing date term facility for the Company (the “2015 U.S. Closing Date Term Facility”) in an aggregate principal amount of $4.5 million, the proceeds of which were used by the Company to refinance indebtedness under its existing term loan; (3) a secured delayed draw term facility for the Company (the "2015 U.S. Delayed Draw Term Facility") in an aggregate principal amount of $11.0 million, the proceeds of which were used to fund a portion of the Stress-Tek acquisition; and (4) a secured term facility for VPG Canada (the “2015 Canadian Term Facility”) in an aggregate principal amount of $9.5 million, the proceeds of which were used by VPG Canada to refinance indebtedness under its existing term loan. The aggregate principal amount of the 2015 Revolving Facility may be increased by a maximum of $15.0 million upon the request of the Company, subject to the terms of the 2015 Credit Agreement. The 2015 Credit Agreement terminates on December 30, 2020. The term loans are being repaid in quarterly installments.
Interest payable on amounts borrowed under the 2015 Revolving Facility, the 2015 U.S. Closing Date Term Facility, the 2015 U.S. Delayed Draw Term Facility, and the 2015 Canadian Term Facility (collectively, the “Facilities”) is based upon, at the Company’s option, (1) the greatest of: the Agent’s prime rate, the Federal Funds rate, or a LIBOR floor (the “Base Rate”), or (2) LIBOR plus a specified margin. An interest margin of 0.25% is added to Base Rate loans. Depending upon the Company’s leverage ratio, an interest rate margin ranging from 2.00% to 3.50% per annum is added to the applicable LIBOR rate to determine the interest payable on the Facilities. The Company is required to pay a quarterly commitment fee of 0.30% per annum to 0.50% per annum on the unused portion of the 2015 Revolving Facility, which is determined based on the Company’s leverage ratio each quarter. Additional customary fees apply with respect to letters of credit. The total interest rates at December 31, 2016 and December 31, 2015, were 4.00% and 3.75%, respectively, for the 2015 Revolving and U.S. Delayed Draw Term Facilities and 4.00% and 3.11%, respectively, for the 2015 U.S. Closing Date Term and 2015 Canadian Term Facilities.
The obligations of the Company and VPG Canada under the 2015 Credit Agreement are secured by pledges of stock in certain domestic and foreign subsidiaries, as well as guarantees by substantially all of the Company’s domestic subsidiaries and of the Company (with respect to the 2015 Canadian Term Facility). The obligations of the Company and the guarantors under the 2015 Credit Agreement are secured by substantially all the assets (excluding real estate) of the Company and such guarantors. The 2015 Canadian Term Facility is secured by substantially all the assets of VPG Canada and by a secured guarantee by the Company and its domestic subsidiaries. The 2015 Credit Agreement restricts the Company from paying cash dividends and requires the Company to comply with other customary covenants, representations, and warranties, including the maintenance of specific financial ratios. The financial maintenance covenants include a tangible net worth ratio, a leverage ratio, and a fixed charges coverage ratio. The Company was in compliance with its financial maintenance covenants at December 31, 2016. If the Company is not in compliance
F-23
Note 7 – Long-Term Debt (continued)
with any of these covenant restrictions, the credit facility could be terminated by the lenders, and all amounts outstanding pursuant to the credit facility could become immediately payable.
2013 Credit Agreement
On January 29, 2013, the Company entered into an Amended and Restated Credit Agreement (the “2013 Credit Agreement”) among the Company, VPG Canada, the lenders, RBS Citizens, National Association as joint book-runner and JPMorgan Chase Bank, National Association as agent for such lenders (the “Agent”), pursuant to which the terms of the Company’s multi-currency, secured credit facility were revised and expanded to provide for the following facilities: (1) a secured revolving facility (the “2013 Revolving Facility”) in an aggregate principal amount of $15.0 million; (2) a secured term facility for the Company (the “2013 U.S. Term Facility”) in an aggregate principal amount of $10.0 million; and (3) a secured term facility for VPG Canada (the “2013 Canadian Term Facility”) in an aggregate principal amount of $15.0 million. The 2013 Credit Agreement was terminated on December 30, 2015.
Interest payable on amounts borrowed under the 2013 Revolving Facility, the 2013 U.S. Term Facility and the 2013 Canadian Term Facility (collectively, the “Facilities”) was based upon LIBOR plus a specified margin. The Company was required to pay a quarterly commitment fee of 0.30% per annum to 0.50% per annum on the unused portion of the 2013 Revolving Facility. The total interest rate was 2.76% at December 31, 2014.
Other Lines of Credit
In addition to the 2015 and 2013 Revolving Facilities discussed above, certain subsidiaries of the Company had committed short-term lines of credit with a foreign bank aggregating approximately $3.0 million and $3.0 million at December 31, 2016 and 2015, respectively. The Company had outstanding letters of credit under these short-term lines of credit of $0.5 million and $0.8 million at December 31, 2016 and 2015, respectively.
Exchangeable Unsecured Notes, due 2102
By reason of the spin-off, Vishay Intertechnology was required to take action so that the existing exchangeable notes of Vishay Intertechnology were deemed exchanged as of the date of the spin-off, for a combination of new notes of Vishay Intertechnology and notes issued by VPG.
VPG assumed the liability for an aggregate $10.0 million principal amount of exchangeable notes effective July 6, 2010. The maturity date of the notes is December 13, 2102.
The notes are subject to a put and call agreement under which the holders may at any time put the notes to the Company in exchange for shares of the Company’s common stock, and the Company may call the notes in exchange for cash or for shares of its common stock at any time after January 1, 2018. The put/call rate of the VPG notes is $22.57 per share of common stock. Effective August 28, 2013, a holder of the Company's exchangeable notes exercised its option to exchange approximately $5.9 million principal amount of the notes for 259,687 shares of VPG common stock. Following this transaction, VPG has outstanding exchangeable unsecured notes with a principal amount of approximately $4.1 million, which are exchangeable for an aggregate of 181,537 shares of VPG common stock. (See also Note 13).
The notes bear interest at LIBOR. Interest is payable quarterly on March 31, June 30, September 30, and December 31 of each calendar year. The total interest rate was 1.00% at December 31, 2016.
Other Debt
Other debt consists of debt held by VPG’s Japanese subsidiary and is payable monthly over the next 5 years at a zero percent interest rate.
Aggregate annual maturities of long-term debt are as follows (in thousands):
2017 | $ | 2,623 | |
2018 | 3,873 | ||
2019 | 5,123 | ||
2020 | 20,874 | ||
2021 | 16 | ||
Thereafter | 4,097 | ||
F-24
Note 7 – Long-Term Debt (continued)
Interest paid on third-party debt was $1.3 million, $0.6 million, and $0.8 million during the years ended December 31, 2016, 2015, and 2014, respectively.
Note 8 – Stockholders’ Equity
The Company’s Class B convertible common stock carries ten votes per share. The common stock carries one vote per share. Class B shares are transferable only to certain permitted transferees while the common stock is freely transferable. Class B shares are convertible on a one-for-one basis at any time into shares of common stock. Transfers of Class B shares other than to permitted transferees result in the automatic conversion of the Class B shares into common stock.
The Board of Directors may only declare dividends or other distributions with respect to the common stock or the Class B convertible common stock if it grants such dividends or distributions in the same amount per share with respect to the other class of stock. As discussed in Note 7, the Company is restricted from paying cash dividends. Stock dividends or distributions, on any class of stock, are payable only in shares of stock of that class. Shares of either common stock or Class B convertible common stock cannot be split, divided, or combined unless the other is also split, divided, or combined equally.
The Board of Directors is authorized, without further stockholder approval, to issue from time to time up to an aggregate of 1,000,000 shares of preferred stock in one or more series. The Board of Directors may fix or alter the designation, preferences, rights and any qualification, limitations, restrictions of the shares of any series, including the dividend rights, dividend rates, conversion rights, voting rights, redemption terms and prices, liquidation preferences and the number of shares constituting any series. No shares of the Company’s preferred stock are currently outstanding.
On September 23, 2014, the Board of Directors approved a stock repurchase plan, authorizing the Company to repurchase, in the aggregate, up to 500,000 shares of its outstanding common stock. On May 21, 2015, the Board of Directors approved an increase in the shares of the Company's outstanding common stock available for repurchase, in the aggregate, from 500,000 shares to 2,000,000 shares. The stock repurchase plan expired in May 2016. The Company repurchased 617,667 and 2,000 shares of its common stock during the fiscal years ended December 31, 2015 and 2014, respectively. The Company did not repurchase shares in 2016.
F-25
Note 8 – Stockholders’ Equity (continued)
Other Comprehensive Income (Loss)
The cumulative balance of each component of other comprehensive income (loss) and the income tax effects allocated to each component are as follows (in thousands):
Beginning Balance | Before-Tax Amount | Tax Effect | Net-of-Tax Amount | Ending Balance | |||||||||||||||
December 31, 2014 | |||||||||||||||||||
Pension and other postretirement actuarial items | $ | (2,265 | ) | $ | (3,357 | ) | $ | 782 | $ | (2,575 | ) | $ | (4,840 | ) | |||||
Reclassification adjustment for recognition of actuarial items | 60 | (23 | ) | 37 | 37 | ||||||||||||||
Foreign currency translation adjustment | (13,742 | ) | (8,015 | ) | — | (8,015 | ) | (21,757 | ) | ||||||||||
$ | (16,007 | ) | $ | (11,312 | ) | $ | 759 | $ | (10,553 | ) | $ | (26,560 | ) | ||||||
December 31, 2015 | |||||||||||||||||||
Pension and other postretirement actuarial items | $ | (4,803 | ) | $ | 141 | $ | (21 | ) | $ | 120 | $ | (4,683 | ) | ||||||
Reclassification adjustment for recognition of actuarial items | 304 | (38 | ) | 266 | 266 | ||||||||||||||
Foreign currency translation adjustment | (21,757 | ) | (6,947 | ) | — | (6,947 | ) | (28,704 | ) | ||||||||||
$ | (26,560 | ) | $ | (6,502 | ) | $ | (59 | ) | $ | (6,561 | ) | $ | (33,121 | ) | |||||
December 31, 2016 | |||||||||||||||||||
Pension and other postretirement actuarial items | $ | (4,417 | ) | $ | (3,505 | ) | $ | 544 | $ | (2,961 | ) | $ | (7,378 | ) | |||||
Reclassification adjustment for recognition of actuarial items | 271 | (38 | ) | 233 | 233 | ||||||||||||||
Foreign currency translation adjustment | (28,704 | ) | (4,488 | ) | — | (4,488 | ) | (33,192 | ) | ||||||||||
$ | (33,121 | ) | $ | (7,722 | ) | $ | 506 | $ | (7,216 | ) | $ | (40,337 | ) | ||||||
Reclassifications of pension and other postretirement actuarial items out of accumulated other comprehensive income (loss) are included in the computation of net periodic benefit cost (see Note 9).
Note 9 – Pensions and Other Postretirement Benefits
Defined Benefit Plans
Employees of the Company participate in various defined benefit pension and other postretirement benefit plans.
U.S. Pension Plan
The Vishay Precision Group Non-Qualified Retirement Plan, like all nonqualified plans, is considered to be unfunded. The Company maintains a nonqualified trust, referred to as a “rabbi” trust, to fund benefits under this plan. Rabbi trust assets are subject to creditor claims under certain conditions and are not the property of employees. Therefore, they are accounted for as other noncurrent assets within the consolidated balance sheets. The assets held in the rabbi trust are invested in money market funds and company-owned life insurance policies. The consolidated balance sheets include assets held in trust related to the nonqualified pension plan of $1.6 million at December 31, 2016 and $1.6 million at December 31, 2015, and the related liabilities of $2.0 million and $2.0 million at December 31, 2016 and 2015, respectively.
The Vishay Precision Group Non-Qualified Retirement Plan is frozen. Accordingly, no new employees may participate in the plan, no further participant contributions are permitted, and no further benefits accrue. Benefits accumulated prior to the freezing of the U.S. pension plan will be paid to employees upon retirement, and the Company will likely need to make additional cash contributions to the rabbi trust to fund this accumulated benefit obligation.
Non-U.S. Pension Plans
The Company provides pension and similar benefits to employees of certain non-U.S. subsidiaries consistent with local practices. Pension benefits earned are generally based on years of service and compensation during active employment.
F-26
Note 9 – Pensions and Other Postretirement Benefits (continued)
Other Postretirement Benefit Plans
In the U.S., the Company maintains two unfunded non-pension other postretirement benefit plans (“OPEB”) which are funded as costs are incurred. These plans provide medical and death benefits to retirees.
The following table sets forth a reconciliation of the benefit obligation, plan assets, and funded status related to pension and other postretirement benefit plans (in thousands):
December 31, 2016 | December 31, 2015 | ||||||||||||||
Pension Plans | OPEB Plans | Pension Plans | OPEB Plans | ||||||||||||
Change in benefit obligation: | |||||||||||||||
Benefit obligation at beginning of year | $ | 23,348 | $ | 3,373 | $ | 24,655 | $ | 3,331 | |||||||
Service cost (adjusted for actual employee contributions) | 403 | 100 | 413 | 88 | |||||||||||
Interest cost | 784 | 130 | 857 | 126 | |||||||||||
Contributions by participants | 42 | — | 44 | — | |||||||||||
Actuarial (gains) losses | 4,809 | 525 | (413 | ) | 72 | ||||||||||
Benefits paid | (732 | ) | (295 | ) | (1,223 | ) | (244 | ) | |||||||
Curtailments and settlements | (20 | ) | — | (14 | ) | — | |||||||||
Currency translation | (3,447 | ) | — | (971 | ) | — | |||||||||
Benefit obligation at end of year | $ | 25,187 | $ | 3,833 | $ | 23,348 | $ | 3,373 | |||||||
Change in plan assets: | |||||||||||||||
Fair value of plan assets at beginning of year | $ | 15,122 | $ | — | $ | 15,697 | $ | — | |||||||
Actual return on plan assets | 1,441 | — | 194 | — | |||||||||||
Company contributions | 1,240 | 295 | 1,160 | 244 | |||||||||||
Contributions by participants | 42 | — | 44 | — | |||||||||||
Benefits paid | (732 | ) | (295 | ) | (1,223 | ) | (244 | ) | |||||||
Curtailments and settlements | — | — | (14 | ) | — | ||||||||||
Currency translation | (2,560 | ) | — | (736 | ) | — | |||||||||
Fair value of plan assets at end of year | $ | 14,553 | $ | — | $ | 15,122 | $ | — | |||||||
Funded status at end of year | $ | (10,634 | ) | $ | (3,833 | ) | $ | (8,226 | ) | $ | (3,373 | ) | |||
Amounts recognized in the consolidated balance sheets consist of the following pre-tax amounts (in thousands):
December 31, 2016 | December 31, 2015 | ||||||||||||||
Pension Plans | OPEB Plans | Pension Plans | OPEB Plans | ||||||||||||
Accrued pension and other postretirement costs | $ | (10,634 | ) | $ | (3,833 | ) | $ | (8,226 | ) | $ | (3,373 | ) | |||
Unrecognized actuarial gains and losses arise from several factors, including experience and assumption changes with respect to the obligations and from the difference between expected returns and actual returns on plan assets. Actuarial items consist of the following (in thousands):
December 31, 2016 | December 31, 2015 | ||||||||||||||
Pension Plans | OPEB Plans | Pension Plans | OPEB Plans | ||||||||||||
Unrecognized net actuarial loss | $ | 7,763 | $ | 1,588 | $ | 4,950 | $ | 1,138 | |||||||
Unrecognized prior service cost | 2 | — | 2 | — | |||||||||||
Unamortized transition obligation | 3 | — | 4 | — | |||||||||||
$ | 7,768 | $ | 1,588 | $ | 4,956 | $ | 1,138 | ||||||||
F-27
Note 9 – Pensions and Other Postretirement Benefits (continued)
The following table sets forth additional information regarding the projected and accumulated benefit obligations for the pension plans (in thousands):
December 31, | |||||||
2016 | 2015 | ||||||
Accumulated benefit obligation, all plans | $ | 23,633 | $ | 21,931 | |||
Plans for which the accumulated benefit obligation exceeds plan assets: | |||||||
Projected benefit obligation | $ | 24,102 | $ | 22,274 | |||
Accumulated benefit obligation | 22,963 | 21,256 | |||||
Fair value of plan assets | 13,491 | 14,204 | |||||
Unrecognized gains and losses are amortized into future net periodic pension cost using the 10% corridor method over the expected remaining service life of the employee group. The following table sets forth the components of net periodic cost of pension and other postretirement benefit plans (in thousands):
Years ended December 31, | |||||||||||||||||||||||
2016 | 2015 | 2014 | |||||||||||||||||||||
Pension Plans | OPEB Plans | Pension Plans | OPEB Plans | Pension Plans | OPEB Plans | ||||||||||||||||||
Annual service cost | $ | 445 | $ | 100 | $ | 457 | $ | 88 | $ | 470 | $ | 62 | |||||||||||
Less: employee contributions | 42 | — | 44 | — | 53 | — | |||||||||||||||||
Net service cost | 403 | 100 | 413 | 88 | 417 | 62 | |||||||||||||||||
Interest cost | 784 | 130 | 857 | 126 | 938 | 131 | |||||||||||||||||
Expected return on plan assets | (630 | ) | — | (656 | ) | — | (789 | ) | — | ||||||||||||||
Amortization of actuarial losses | 192 | 75 | 232 | 72 | 26 | 33 | |||||||||||||||||
Amortization of transition obligation | 5 | — | 1 | — | 1 | — | |||||||||||||||||
Curtailment and settlement losses | — | — | 1 | — | — | — | |||||||||||||||||
Net periodic benefit cost | $ | 754 | $ | 305 | $ | 848 | $ | 286 | $ | 593 | $ | 226 | |||||||||||
See Note 8 for the pre-tax, tax effect, and after tax amounts included in other comprehensive income during the years ended December 31, 2016, 2015, and 2014. The estimated actuarial items that will be amortized from accumulated other comprehensive loss into net periodic pension cost during 2017 is $0.6 million.
The following weighted-average assumptions were used to determine benefit obligations at December 31 of the respective years:
2016 | 2015 | ||||||||||
Pension Plans | OPEB Plans | Pension Plans | OPEB Plans | ||||||||
Discount rate | 2.59 | % | 3.77 | % | 3.65 | % | 3.98 | % | |||
Rate of compensation increase | 2.63 | % | N/A | 2.82 | % | N/A | |||||
Expected return on plan assets | 4.49 | % | N/A | 4.47 | % | N/A | |||||
The following weighted-average assumptions were used to determine the net periodic pension costs for the years ended December 31, 2016 and 2015:
2016 | 2015 | ||||||||||
Pension Plans | OPEB Plans | Pension Plans | OPEB Plans | ||||||||
Discount rate | 3.65 | % | 3.98 | % | 3.56 | % | 3.69 | % | |||
Rate of compensation increase | 2.82 | % | N/A | 2.70 | % | N/A | |||||
Expected return on plan assets | 4.47 | % | N/A | 4.19 | % | N/A | |||||
Health care trend rate | N/A | 4.81 | % | N/A | 7.52 | % | |||||
F-28
Note 9 – Pensions and Other Postretirement Benefits (continued)
The health care trend ultimate rate is 4.00% per the terms of the plan. The impact of a one-percentage-point change in assumed health care cost trend rates on the net periodic benefit cost and postretirement benefit obligation is not material.
The plans’ expected return on assets is based on management’s expectation of long-term average rates of return to be achieved by the underlying investment portfolios. In establishing this assumption, management considers historical and expected returns for the asset classes in which the plans are invested, advice from pension consultants and investment advisors, and current economic and capital market conditions.
The investment mix between equity securities and fixed income securities is based upon achieving a desired return, balancing higher return, more volatile equity securities, and lower return, less volatile fixed income securities. The target allocation of plan assets approximates the actual allocation of plan assets at December 31, 2016 and 2015.
Plan assets are comprised of:
December 31, 2016 | December 31, 2015 | ||||||||
Pension Plans | OPEB Plans | Pension Plans | OPEB Plans | ||||||
Equity securities | 55 | % | — | 56 | % | — | |||
Fixed income securities | 36 | % | — | 38 | % | — | |||
Cash and cash equivalents | 9 | % | — | 6 | % | — | |||
Total | 100 | % | — | 100 | % | — | |||
The Company maintains defined benefit retirement plans in certain of its subsidiaries. The assets of the plans are measured at fair value.
Equity securities held by the defined benefit retirement plans consist of equity securities that are valued based on quoted market prices on the last business day of the year. The fair value measurement of the equity securities is considered a Level 1 measurement within the fair value hierarchy.
Fixed income securities held by the defined benefit retirement plans consist of government bonds and corporate notes that are valued based on quoted market prices on the last business day of the year. The fair value measurement of the fixed income securities is considered a Level 1 measurement within the fair value hierarchy.
Cash held by the defined benefit retirement plans consists of deposits on account in various financial institutions. The carrying amount of the cash approximates its fair value.
F-29
Note 9 – Pensions and Other Postretirement Benefits (continued)
A summary of the Company’s pension plan assets for each fair value hierarchy level are as follows for the periods presented (see Note 15 for further description of the levels within the fair value hierarchy (in thousands)):
As of December 31, 2016 | Fair value measurements at reporting date using: | ||||||||||||||
Total Fair Value | Level 1 Inputs | Level 2 Inputs | Level 3 Inputs | ||||||||||||
Defined benefit pension plan assets | |||||||||||||||
Equity securities | $ | 8,047 | $ | 8,047 | $ | — | $ | — | |||||||
Fixed income securities | 5,203 | 5,203 | — | — | |||||||||||
Cash and cash equivalents | 1,303 | 1,303 | — | — | |||||||||||
$ | 14,553 | $ | 14,553 | $ | — | $ | — | ||||||||
As of December 31, 2015 | Fair value measurements at reporting date using: | ||||||||||||||
Total Fair Value | Level 1 Inputs | Level 2 Inputs | Level 3 Inputs | ||||||||||||
Defined benefit pension plan assets | |||||||||||||||
Equity securities | $ | 8,522 | $ | 8,522 | $ | — | $ | — | |||||||
Fixed income securities | 5,670 | 5,670 | — | — | |||||||||||
Cash and cash equivalents | 930 | 930 | — | — | |||||||||||
$ | 15,122 | $ | 15,122 | $ | — | $ | — | ||||||||
Estimated future benefit payments are as follows (in thousands):
Pension Plans | OPEB Plans | ||||||
2017 | $ | 547 | $ | 273 | |||
2018 | 583 | 217 | |||||
2019 | 558 | 233 | |||||
2020 | 547 | 277 | |||||
2021 | 655 | 323 | |||||
2022 - 2026 | 4,019 | 1,202 | |||||
The Company anticipates making contributions to its funded and unfunded pension and postretirement benefit plans of approximately $1.3 million during 2017.
Other Retirement Obligations
The Company participates in various other defined contribution and government-mandated retirement plans based on local law or custom. The Company periodically makes required contributions for certain of these plans. At December 31, 2016 and 2015, the consolidated balance sheets include $0.8 million and $0.7 million, respectively, within accrued pension and other postretirement costs related to these plans.
Most of the Company’s U.S. employees are eligible to participate in 401(k) savings plans which provide company matching under various formulas. The Company’s matching expense for the plans was $0.7 million, $0.6 million, and $0.6 million for the years ended December 31, 2016, 2015, and 2014, respectively. No material amounts are included in the consolidated balance sheets related to unfunded 401(k) contributions.
Certain key employees participate in a nonqualified deferred compensation plan, which allows these employees to defer a portion of their compensation until retirement, or elect shorter deferral periods. The accompanying consolidated balance sheets include a liability within other noncurrent liabilities related to these deferrals. The Company maintains a nonqualified trust, referred to as a “rabbi” trust, to fund payments under this plan. Rabbi trust assets are subject to creditor claims under certain conditions and are not the property of employees. Therefore, they are accounted for as other noncurrent assets within the consolidated balance sheets. The assets held in the rabbi trust are invested in money market funds and company-owned life insurance policies. The consolidated
F-30
Note 9 – Pensions and Other Postretirement Benefits (continued)
balance sheets include assets held in trust related to the nonqualified deferred compensation plan of $3.2 million at December 31, 2016 and $3.1 million at December 31, 2015, and the related liabilities of $4.1 million and $3.8 million at December 31, 2016 and 2015, respectively.
Note 10 – Share-Based Compensation
The Amended and Restated Vishay Precision Group, Inc. Stock Incentive Plan (as amended and restated, the “Plan”) permits the issuance of up to 1,000,000 shares of common stock. At December 31, 2016, the Company had reserved 355,235 shares of common stock for future grant of equity awards (restricted stock, unrestricted stock, restricted stock units (“RSUs”), or stock options). If any outstanding awards are forfeited by the holder or cancelled by the Company, the underlying shares would be available for future grants under the Plan.
Stock Options
In connection with the spin-off, VPG agreed to issue certain replacement awards to VPG employees holding equity-based awards of Vishay Intertechnology based on VPG’s common stock. The vesting schedule, expiration date, and other terms of these awards are generally the same as those of the Vishay Intertechnology equity-based awards they replaced.
The following table summarizes the Company’s stock option activity (number of options in thousands):
Years ended December 31, | ||||||||||||||||||||
2016 | 2015 | 2014 | ||||||||||||||||||
Number of Options | Weighted Average Exercise Price | Number of Options | Weighted Average Exercise Price | Number of Options | Weighted Average Exercise Price | |||||||||||||||
Outstanding: | ||||||||||||||||||||
Beginning of year | 18 | $ | 18.92 | 18 | $ | 18.92 | 27 | $ | 18.06 | |||||||||||
Granted | — | — | — | — | — | — | ||||||||||||||
Exercised | — | — | — | — | (4 | ) | 11.92 | |||||||||||||
Expired | — | — | — | — | (5 | ) | 20.58 | |||||||||||||
End of year | 18 | $ | 18.92 | 18 | $ | 18.92 | 18 | $ | 18.92 | |||||||||||
Vested and expected to vest | 18 | 18 | 18 | |||||||||||||||||
Exercisable: | ||||||||||||||||||||
End of year | 18 | 18 | 18 | |||||||||||||||||
The following table summarizes information concerning stock options outstanding and exercisable at December 31, 2016 (number of options in thousands):
Ranges of Exercise Prices | Options Outstanding | Options Exercisable | ||||||||||||||
Number of Options | Weighted Average Remaining Contractual Life | Weighted Average Exercise Price | Number of Options | Weighted Average Exercise Price | ||||||||||||
18.92 | 18 | 0.16 | $ | 18.92 | 18 | $ | 18.92 | |||||||||
The fair value of each option award is estimated on the date of grant using the Black-Scholes option-pricing model. There were no options granted in 2016, 2015, or 2014.
The pre-tax aggregate intrinsic value (the difference between the closing stock price of VPG’s common stock on the last trading day of 2016 of $18.90 per share and the exercise price, multiplied by the number of in-the-money options) that would have been received by the option holders had all option holders exercised their options on December 31, 2016 is not material, as no options were in-the-money. No options were exercised during the year ended December 31, 2016.
F-31
Note 10 – Share-Based Compensation (continued)
Restricted Stock Units
Pursuant to the Plan, the Company issued RSUs to board members, executive officers, and certain employees of the Company during 2016. The amount of compensation cost related to share-based payment transactions is measured based on the grant-date fair value of the equity instruments issued. VPG determines compensation cost for RSUs based on the grant-date fair value of the underlying common stock. Compensation cost is recognized over the period that the participant provides service in exchange for the award. The Company recognizes compensation cost for RSUs that are expected to vest and for which performance criteria are expected to be met.
On January 19, 2016, VPG’s three executive officers were granted annual equity awards in the form of RSUs, of which 75% are performance-based. The awards have an aggregate target grant-date fair value of $0.9 million and were comprised of 86,798 RSUs, as determined using the average of the closing stock prices of the Company's common stock for the last 5 trading days immediately preceding January 1, 2016. Twenty-five percent of these awards will vest on January 1, 2019, subject to the executives' continued employment. The performance-based portion of the RSUs will also vest on January 1, 2019, subject to the satisfaction of certain performance objectives relating to three-year cumulative “free cash” and net earnings goals, each weighted equally, and the executives' continued employment. The awards issued in 2014 and 2015 have similar allocations and vesting criteria.
On March 29, 2016, certain VPG employees were granted annual equity awards in the form of RSUs, of which 75% are performance-based. The awards have an aggregate target grant-date fair value of $0.4 million and were comprised of 25,613 RSUs. Twenty-five percent of these awards will vest on January 1, 2019 subject to the employees' continued employment. The performance-based portion of the RSUs will also vest on January 1, 2019, subject to the satisfaction of certain performance objectives relating to three-year cumulative earnings goals and cash flow goals, and their continued employment.
On March 24, 2016 and April 2, 2016, the Board of Directors approved the issuance of an aggregate of 525 RSUs and 417 RSUs, respectively, to the newly appointed independent members of the Board of Directors. These awards represented a pro-rated portion of the annual equity grant made to non-executive directors pursuant to the Plan. The aggregate grant-date fair value of these awards was immaterial. These RSUs vested on May 26, 2016.
On May 26, 2016, the Board of Directors approved the issuance of an aggregate of 16,178 RSUs to the independent board members of the Board of Directors and to the non-executive Chairman of the Board of Directors. The awards have an aggregate grant-date fair value of $0.2 million and will vest on May 26, 2017, subject to the directors' continued service on the Board of Directors.
RSU activity is presented below (number of RSUs in thousands):
Years ended December 31, | ||||||||||||||||||||
2016 | 2015 | 2014 | ||||||||||||||||||
Number of RSUs | Weighted Average Grant-date Fair Value | Number of RSUs | Weighted Average Grant-date Fair Value | Number of RSUs | Weighted Average Grant-date Fair Value | |||||||||||||||
Outstanding: | ||||||||||||||||||||
Beginning of year | 278 | $ | 15.04 | 236 | $ | 14.89 | 146 | $ | 14.72 | |||||||||||
Granted | 129 | 11.69 | 94 | 15.90 | 112 | 15.30 | ||||||||||||||
Vested | (30 | ) | 13.15 | (52 | ) | 15.93 | (22 | ) | 15.84 | |||||||||||
End of year | 377 | $ | 14.04 | 278 | $ | 15.04 | 236 | $ | 14.89 | |||||||||||
The fair value of the RSUs vested during 2016 approximates the grant-date fair value.
RSUs with performance-based vesting criteria are expected to vest as follows (number of RSUs in thousands):
Vesting Date | Expected to Vest | Not Expected to Vest | Total | ||||||
January 1, 2017 | 18 | 57 | 75 | ||||||
January 1, 2018 | 14 | 47 | 61 | ||||||
January 1, 2019 | 9 | 75 | 84 | ||||||
F-32
Note 10 – Share-Based Compensation (continued)
Share-Based Compensation Expense
The following table summarizes pre-tax share-based compensation expense recognized (in thousands):
Years ended December 31, | |||||||||||
2016 | 2015 | 2014 | |||||||||
Stock options | $ | — | $ | — | $ | — | |||||
Restricted stock units | 37 | 1,083 | 1,008 | ||||||||
Total | $ | 37 | $ | 1,083 | $ | 1,008 | |||||
Share-based compensation expense is recognized ratably over the vesting period of the awards and for RSUs with performance criteria, is recognized for RSU's that are expected to vest and for which performance criteria are expected to be met. During 2016, it was determined that certain performance objectives associated with awards granted in 2014, 2015, and 2016 to executives and certain other employees were not likely to be fully met. As a result, share-based compensation of $1.4 million was reversed during the year based on anticipated performance levels. A similar adjustment was made in 2015 and 2014, reducing share-based compensation expense by $0.2 million and $0.1 million, respectively.
The deferred tax benefit on share-based compensation expense was $0.0 million, $0.0 million, and $0.2 million for the years ended December 31, 2016, 2015, and 2014, respectively.
As of December 31, 2016, the Company had $0.6 million of unrecognized share-based compensation expense related to share-based awards that will be recognized over a weighted-average period of approximately one years.
Note 11 – Commitments, Contingencies, and Concentrations
Leases
The Company uses various leased facilities and equipment in its operations. In the normal course of business, operating leases are generally renewed or replaced by other leases. Certain operating leases include escalation clauses.
Total rental expense under operating leases was $3.6 million, $3.9 million, and $4.1 million for the years ended December 31, 2016, 2015, and 2014, respectively.
Future minimum lease payments for operating leases (excluding related party leases as described in Note 2) with initial or remaining noncancellable lease terms in excess of one year are as follows (in thousands):
2017 | $ | 2,820 | |
2018 | 2,185 | ||
2019 | 1,518 | ||
2020 | 893 | ||
2021 | 415 | ||
Thereafter | 65 | ||
Litigation
The Company is subject to various legal proceedings that constitute ordinary, routine litigation incidental to its business. The Company is of the opinion that the disposition of these proceedings will not have a material adverse effect on its business or its financial condition, results of operations, and cash flows.
Executive Employment Agreements
The Company has employment agreements with its executive officers which outline base salary, incentive compensation, and equity-based compensation. The employment agreements with the Company's executive officers also provide for incremental compensation in the event of termination without cause or for good reason.
Sources of Supplies
Although most materials incorporated in the Company’s products are available from a number of sources, certain materials are available only from a relatively limited number of suppliers.
F-33
Note 11 – Commitments, Contingencies, and Concentrations (continued)
Some of the most highly specialized materials for the Company’s sensors are sourced from a single vendor. The Company maintains a safety stock inventory of certain critical materials at its facilities.
Certain metals used in the manufacture of the Company’s products are traded on active markets, and can be subject to significant price volatility.
Market Concentrations
No single customer comprises greater than 10% of net revenues.
The vast majority of the Company’s products are used in the broad industrial market, with selected uses in military and aerospace, medical, agriculture, and construction. Within the broad industrial segment, the Company’s products serve wide applications in the waste management, bulk hauling, logging, scale manufacturing, engineering systems, pharmaceutical, oil, chemical, steel, paper, and food industries.
Credit Risk Concentrations
Financial instruments with potential credit risk consist principally of cash and cash equivalents, accounts receivable, and notes receivable. The Company maintains cash and cash equivalents with various major financial institutions. Concentrations of credit risk with respect to receivables are generally limited due to the Company’s large number of customers and their dispersion across many countries and industries. At December 31, 2016 and 2015, the Company had no significant concentrations of credit risk.
Geographic Concentrations
At December 31, 2016 and 2015, a significant percentage of the Company’s cash and cash equivalents are held outside the United States. See the following table for the percentage of cash and cash equivalents by region at December 31, 2016 and December 31, 2015:
December 31, | |||||
2016 | 2015 | ||||
Asia | 27 | % | 26 | % | |
United States | 17 | % | 10 | % | |
Israel | 16 | % | 24 | % | |
Europe | 19 | % | 17 | % | |
United Kingdom | 12 | % | 13 | % | |
Canada | 9 | % | 10 | % | |
Total | 100 | % | 100 | % | |
Note 12 – Segment and Geographic Data
VPG reports in three product segments: the Foil Technology Products segment, the Force Sensors segment, and the Weighing and Control Systems segment. The Foil Technology Products reporting segment is comprised of the foil resistor and strain gage operating segments. The Force Sensors reporting segment is comprised of transducers, load cells, and modules. The Weighing and Control Systems reporting segment is comprised of instruments, complete systems for process control, and on-board weighing applications.
VPG evaluates reporting segment performance based on multiple performance measures including gross profits, revenues, and operating income, exclusive of certain items. Management believes that evaluating segment performance, excluding items such as restructuring and severance costs, and other items is meaningful because it provides insight with respect to the intrinsic operating results of VPG. The accounting policies of the segments are the same as those described in the summary of significant accounting policies (see Note 1). Reporting segment assets are the owned or allocated assets used by each segment. Products are transferred between segments on a basis intended to reflect, as nearly as practicable, the market value of the products.
F-34
Note 12 – Segment and Geographic Data (continued)
The following table sets forth reporting segment information (in thousands):
Foil Technology Products | Force Sensors | Weighing and Control Systems | Corporate/ Other | Total | |||||||||||||||
2016 | |||||||||||||||||||
Net third-party revenues | $ | 100,942 | $ | 60,234 | $ | 63,753 | $ | — | $ | 224,929 | |||||||||
Intersegment revenues | 2,340 | 1,954 | 818 | (5,112 | ) | — | |||||||||||||
Gross profit | 39,368 | 15,632 | 27,809 | — | 82,809 | ||||||||||||||
Segment operating income (loss) | 20,391 | 7,056 | 10,221 | (26,957 | ) | 10,711 | |||||||||||||
Acquisition costs | 427 | — | 67 | — | 494 | ||||||||||||||
Restructuring costs | 1,137 | 413 | 837 | 279 | 2,666 | ||||||||||||||
Depreciation and amortization expense | 4,894 | 2,924 | 2,323 | 1,008 | 11,149 | ||||||||||||||
Capital expenditures | 6,516 | 2,179 | 1,551 | 179 | 10,425 | ||||||||||||||
Total assets | 99,411 | 64,934 | 90,447 | 15,718 | 270,510 | ||||||||||||||
2015 | |||||||||||||||||||
Net third-party revenues | $ | 104,460 | $ | 61,048 | $ | 66,670 | $ | — | $ | 232,178 | |||||||||
Intersegment revenues | 2,400 | 2,105 | 760 | (5,265 | ) | — | |||||||||||||
Gross profit | 41,640 | 12,510 | 30,079 | — | 84,229 | ||||||||||||||
Segment operating income (loss) | 24,285 | 3,459 | 11,289 | (35,674 | ) | 3,359 | |||||||||||||
Acquisition costs | — | — | 185 | — | 185 | ||||||||||||||
Impairment of goodwill and indefinite-lived intangibles | — | — | 4,942 | — | 4,942 | ||||||||||||||
Restructuring costs | 613 | 2,932 | 517 | 399 | 4,461 | ||||||||||||||
Depreciation and amortization expense | 5,098 | 3,080 | 1,956 | 963 | 11,097 | ||||||||||||||
Capital expenditures | 7,585 | 1,486 | 467 | 440 | 9,978 | ||||||||||||||
Total assets | 86,709 | 65,445 | 99,935 | 11,658 | 263,747 | ||||||||||||||
2014 | |||||||||||||||||||
Net third-party revenues | $ | 107,758 | $ | 68,301 | $ | 73,969 | $ | — | $ | 250,028 | |||||||||
Intersegment revenues | 3,190 | 1,773 | 1,039 | (6,002 | ) | — | |||||||||||||
Gross profit | 41,991 | 14,880 | 33,903 | — | 90,774 | ||||||||||||||
Segment operating income (loss) | 23,210 | 5,374 | 11,619 | (32,710 | ) | 7,493 | |||||||||||||
Impairment of goodwill and indefinite-lived intangibles | — | — | 5,579 | — | 5,579 | ||||||||||||||
Restructuring costs | 153 | — | 515 | — | 668 | ||||||||||||||
Depreciation and amortization expense | 5,192 | 3,556 | 2,112 | 876 | 11,736 | ||||||||||||||
Capital expenditures | 6,156 | 1,801 | 775 | 359 | 9,091 | ||||||||||||||
Total assets | 87,727 | 66,574 | 96,612 | 36,010 | 286,923 | ||||||||||||||
F-35
Note 12 – Segment and Geographic Data (continued)
The “Corporate/Other” column for segment operating income (loss) includes unallocated selling, general, and administrative expenses and certain items which management excludes from segment results when evaluating segment performance, as follows (in thousands):
Years ended December 31, | |||||||||||
2016 | 2015 | 2014 | |||||||||
Unallocated selling, general, and administrative expenses | $ | (23,797 | ) | $ | (26,086 | ) | $ | (26,463 | ) | ||
Acquisition costs | (494 | ) | (185 | ) | — | ||||||
Impairment of goodwill and indefinite-lived intangibles | — | (4,942 | ) | (5,579 | ) | ||||||
Restructuring costs | (2,666 | ) | (4,461 | ) | (668 | ) | |||||
$ | (26,957 | ) | $ | (35,674 | ) | $ | (32,710 | ) | |||
The following geographic data include net revenues based on revenues generated by subsidiaries located within that geographic area, and property and equipment based on physical location (in thousands):
Years ended December 31, | |||||||||||
Net Revenues | 2016 | 2015 | 2014 | ||||||||
United States | $ | 95,919 | $ | 92,332 | $ | 93,004 | |||||
United Kingdom | 26,845 | 30,684 | 36,358 | ||||||||
Other Europe | 46,401 | 50,857 | 57,014 | ||||||||
Israel | 5,497 | 3,435 | 3,661 | ||||||||
Asia | 34,883 | 34,893 | 37,916 | ||||||||
Canada | 15,384 | 19,977 | 22,075 | ||||||||
$ | 224,929 | $ | 232,178 | $ | 250,028 | ||||||
December 31, | |||||||
Property and Equipment - Net | 2016 | 2015 | |||||
United States | $ | 12,132 | $ | 11,989 | |||
United Kingdom | 4,110 | 5,092 | |||||
Other Europe | 1,255 | 1,300 | |||||
Israel | 19,894 | 20,278 | |||||
Asia | 16,904 | 16,751 | |||||
Canada and Other | 990 | 1,221 | |||||
$ | 55,285 | $ | 56,631 | ||||
Note 13 – Earnings Per Share
Basic earnings per share are computed using the weighted average number of common shares outstanding during the periods presented. Diluted earnings per share is computed using the weighted average number of common shares outstanding, adjusted to include the potentially dilutive effect of stock options and restricted stock units (see Note 10), and other potentially dilutive securities.
F-36
Note 13 – Earnings Per Share (continued)
The following table sets forth the computation of basic and diluted earnings per share attributable to VPG stockholders (in thousands, except earnings per share):
Years ended December 31, | |||||||||||
2016 | 2015 | 2014 | |||||||||
Numerator: | |||||||||||
Numerator for basic earnings per share: | |||||||||||
Net (loss) earnings attributable to VPG stockholders | $ | 6,404 | $ | (13,008 | ) | $ | 3,080 | ||||
Adjustment to the numerator for net earnings: | |||||||||||
Interest savings assuming conversion of dilutive exchangeable notes, net of tax | 18 | — | 6 | ||||||||
Numerator for diluted earnings per share: | |||||||||||
Net (loss) earnings attributable to VPG stockholders | $ | 6,422 | $ | (13,008 | ) | $ | 3,086 | ||||
Denominator: | |||||||||||
Denominator for basic earnings per share: | |||||||||||
Weighted average shares | 13,187 | 13,485 | 13,755 | ||||||||
Effect of dilutive securities: | |||||||||||
Exchangeable notes | 181 | — | 181 | ||||||||
Employee stock options | — | — | 1 | ||||||||
Restricted stock units | 51 | — | 40 | ||||||||
Dilutive potential common shares | 232 | — | 222 | ||||||||
Denominator for diluted earnings per share: | |||||||||||
Adjusted weighted average shares | 13,419 | 13,485 | 13,977 | ||||||||
Basic (loss) earnings per share attributable to VPG stockholders | $ | 0.49 | $ | (0.96 | ) | $ | 0.22 | ||||
Diluted (loss) earnings per share attributable to VPG stockholders | $ | 0.48 | $ | (0.96 | ) | $ | 0.22 | ||||
Diluted earnings per share for the periods presented do not reflect the following weighted average potential common shares, as the effect would be antidilutive (in thousands):
Years ended December 31, | ||||||||
2016 | 2015 | 2014 | ||||||
Weighted average employee stock options | 18 | 18 | 18 | |||||
Weighted average exchangeable notes | — | 181 | — | |||||
Weighted average restricted stock units | — | 36 | — | |||||
Note 14 – Additional Financial Statement Information
The caption “Other” on the consolidated statements of operations consists of the following (in thousands):
Years ended December 31, | |||||||||||
2016 | 2015 | 2014 | |||||||||
Foreign exchange gain (loss) | $ | 449 | $ | (2,146 | ) | $ | (945 | ) | |||
Interest income | 179 | 225 | 261 | ||||||||
Other | (246 | ) | (161 | ) | (56 | ) | |||||
$ | 382 | $ | (2,082 | ) | $ | (740 | ) | ||||
F-37
Note 14 – Additional Financial Statement Information (continued)
Other accrued expenses consist of the following (in thousands):
December 31, | |||||||
2016 | 2015 | ||||||
Customer advance payments | $ | 2,468 | $ | 3,004 | |||
Accrued restructuring | 1,333 | 2,827 | |||||
Goods received, not yet invoiced | 1,618 | 2,332 | |||||
Accrued taxes, other than income taxes | 1,379 | 1,468 | |||||
Accrued commissions | 1,460 | 1,785 | |||||
Accrued professional fees | 2,155 | 1,874 | |||||
Other | 2,872 | 3,314 | |||||
$ | 13,285 | $ | 16,604 | ||||
Israeli Severance Pay
The Israeli Severance Pay Law, 1963 ("Severance Pay Law"), specifies that employees of our Israeli subsidiary are entitled to severance payment, following the termination of their employment. Under the Severance Pay Law, the severance payment is calculated as one month salary for each year of employment, or a portion thereof.
Part of the subsidiary's liability for severance pay is covered by the provisions of Section 14 of the Severance Pay Law ("Section 14"). Under Section 14 employees are entitled to monthly deposits, at a rate of 8.33% of their monthly salary, contributed on their behalf to their insurance funds. Payments in accordance with Section 14 release the subsidiary from any future severance payments in respect of those employees. As a result, the Company does not recognize any liability for severance pay due to these employees and the deposits under Section 14 are not recorded as an asset in the Company's balance sheet.
For the subsidiary's employees in Israel who are not subject to Section 14, the Company calculated the liability for severance pay pursuant to the Severance Pay Law based on the most recent salary of these employees multiplied by the number of years of employment as of the balance sheet date. The Company recorded as expenses the increase in the severance liability, net of earnings (losses) from the related investment fund. The subsidiary's liability was partially funded by monthly payments deposited with insurers and the value of these deposits is recorded as an asset on the Company's balance sheet. Any unfunded amounts would be paid from operating funds and are covered by a provision established by the subsidiary. At December 31, 2016, a $6.6 million liability associated with Israeli severance requirements is included in other liabilities in the accompanying consolidated balance sheets.
Sale Leaseback
In the fourth quarter of 2016, the Company sold its Karmiel, Israel facility for $3.7 million and entered into a five year lease for a portion of the building. The Company recorded a $1.7 million gain on the sale of the facility, of which $0.8 million was recognized immediately in earnings, with the remaining $0.9 million ratably recognized in earnings over the five year lease term.
Note 15 – Fair Value Measurements
ASC Topic 820, Fair Value Measurements and Disclosures, establishes a valuation hierarchy of the inputs used to measure fair value. This hierarchy prioritizes the inputs to valuation techniques used to measure fair value into three broad levels. The following is a brief description of those three levels:
Level 1: Observable inputs such as quoted prices (unadjusted) in active markets for identical assets or liabilities.
Level 2: Inputs other than quoted prices that are observable for the asset or liability, either directly or indirectly. These include quoted prices for similar assets or liabilities in active markets and quoted prices for identical or similar assets or liabilities in markets that are not active.
Level 3: Unobservable inputs that reflect the Company’s own assumptions.
An asset or liability’s classification within the hierarchy is determined based on the lowest level input that is significant to the fair value measurement.
F-38
Note 15 – Fair Value Measurements (continued)
The following tables provide the financial assets and liabilities carried at fair value measured on a recurring basis (in thousands):
As of December 31, 2016 | Fair value measurements at reporting date using: | ||||||||||||||
Total Fair Value | Level 1 Inputs | Level 2 Inputs | Level 3 Inputs | ||||||||||||
Assets: | |||||||||||||||
Assets held in rabbi trusts | $ | 4,772 | $ | 537 | $ | 4,235 | $ | — | |||||||
As of December 31, 2015 | Fair value measurements at reporting date using: | ||||||||||||||
Total Fair Value | Level 1 Inputs | Level 2 Inputs | Level 3 Inputs | ||||||||||||
Assets: | |||||||||||||||
Assets held in rabbi trusts | $ | 4,676 | $ | 739 | $ | 3,937 | $ | — | |||||||
The Company maintains nonqualified trusts, referred to as “rabbi” trusts, to fund payments under deferred compensation and nonqualified pension plans. Rabbi trust assets consist primarily of marketable securities, classified as available-for-sale money market funds at December 31, 2016 and December 31, 2015, and company-owned life insurance assets. The marketable securities held in the rabbi trusts are valued using quoted market prices on the last business day of the year. The company-owned life insurance assets are valued in consultation with the Company’s insurance brokers using the value of underlying assets of the insurance contracts. The fair value measurement of the marketable securities held in the rabbi trust is considered a Level 1 measurement and the measurement of the company-owned life insurance assets is considered a Level 2 measurement within the fair value hierarchy.
The fair value of the long-term debt at December 31, 2016 and December 31, 2015 is approximately $36.0 million and $31.9 million, respectively, compared to its carrying value of $36.2 million and $33.2 million, respectively. The Company estimates the fair value of its long-term debt using a combination of quoted market prices for similar financing arrangements and expected future payments discounted at risk-adjusted rates. The fair value measurement of long-term debt is considered a Level 2 measurement.
The Company’s financial instruments include cash and cash equivalents, accounts receivable, short-term notes payable, and accounts payable. The carrying amounts for these financial instruments reported in the consolidated balance sheets approximate their fair values.
Note 16 – Subsequent Events
Executive RSU grant
On February 9, 2017, VPG’s three current executive officers were granted annual equity awards in the form of RSUs, of which 75% are performance-based. The awards have an aggregate target grant-date fair value of $0.9 million and were comprised of 53,913 RSUs, as determined using the average of the closing stock prices of the Company's common stock for the last 5 trading days immediately preceding January 1, 2017. Twenty-five percent of these awards will vest on January 1, 2020, subject to the executives continued employment. The performance-based portion of the RSUs will also vest on January 1, 2020, subject to the executives continued employment and the satisfaction of certain performance objectives relating to three-year cumulative “free cash” and net earnings goals.
F-39
Note 17 – Summary of Quarterly Financial Information (Unaudited)
(in thousands, except per share amounts) | 2016 (a) | 2015 (a) | |||||||||||||||||||||||||||||
First | Second | Third | Fourth | First | Second | Third | Fourth | ||||||||||||||||||||||||
Statement of Operations data: | |||||||||||||||||||||||||||||||
Net revenues | $ | 56,629 | $ | 57,996 | $ | 54,490 | $ | 55,814 | $ | 56,608 | $ | 59,508 | $ | 57,149 | $ | 58,913 | |||||||||||||||
Gross profit | 19,775 | 21,495 | 20,265 | 21,274 | 20,979 | 21,035 | 21,450 | 20,765 | |||||||||||||||||||||||
Operating income (loss) | 990 | 1,688 | 2,639 | 5,394 | 2,153 | 2,335 | (1,711 | ) | 582 | ||||||||||||||||||||||
Net earnings (loss) | 496 | 1,849 | 1,083 | 2,980 | 847 | 1,460 | (1,952 | ) | (13,349 | ) | |||||||||||||||||||||
Less: net (loss) earnings attributable to noncontrolling interests | 16 | (19 | ) | 32 | (25 | ) | (13 | ) | (16 | ) | (9 | ) | 52 | ||||||||||||||||||
Net earnings (loss) attributable to VPG stockholders | 480 | 1,868 | 1,051 | 3,005 | 860 | 1,476 | (1,943 | ) | (13,401 | ) | |||||||||||||||||||||
Per Share Data: (b) | |||||||||||||||||||||||||||||||
Basic earnings (loss) per share | $ | 0.04 | $ | 0.14 | $ | 0.08 | $ | 0.23 | $ | 0.06 | $ | 0.11 | $ | (0.15 | ) | $ | (1.02 | ) | |||||||||||||
Diluted earnings (loss) per share | $ | 0.04 | $ | 0.14 | $ | 0.08 | $ | 0.22 | $ | 0.06 | $ | 0.11 | $ | (0.15 | ) | $ | (1.02 | ) | |||||||||||||
Certain Items Recorded during the Quarters: | |||||||||||||||||||||||||||||||
Acquisition purchase accounting adjustments | $ | 296 | $ | 195 | $ | 46 | $ | 49 | $ | — | $ | 26 | $ | — | $ | 146 | |||||||||||||||
Acquisition costs | 62 | 352 | — | 80 | — | — | — | 185 | |||||||||||||||||||||||
Strategic alternative evaluation costs | — | — | 1,079 | 265 | — | — | — | — | |||||||||||||||||||||||
Gain on sale of building | — | — | — | (837 | ) | — | — | — | — | ||||||||||||||||||||||
Impairment of goodwill and indefinite-lived intangibles | — | — | — | — | — | — | 4,942 | — | |||||||||||||||||||||||
Restructuring costs | 675 | 1,011 | 709 | 271 | 78 | 304 | 459 | 3,620 | |||||||||||||||||||||||
Tax effect of reconciling items and discrete tax items | (179 | ) | 1,468 | 27 | (597 | ) | 16 | 41 | 1,081 | (12,118 | ) | ||||||||||||||||||||
(a) | The Company reports interim financial information for the 13-week periods beginning on a Sunday and ending on a Saturday, except for the first fiscal quarter, which always begins on January 1, and the fourth fiscal quarter, which always ends on December 31. The first, second, third, and fourth quarters of 2016 ended on April 2, July 2, October 1, and December 31, respectively. The first, second, third, and fourth quarters of 2015 ended on March 28, June 27, September 26, and December 31, respectively. |
(b) | Quarterly amounts may not agree in total to the corresponding annual amounts due to rounding. |
F-40