Attached files
UNITED STATES
SECURITIES AND EXCHANGE COMMISSION
Washington, D.C. 20549
FORM 10-K
| ☒ | Annual report pursuant to Section 13 or 15(d) of the Securities Exchange Act of 1934 for the fiscal year ended December 31, 2016 |
OR
| ☐ | Transition report pursuant to Section 13 or 15(d) of the Securities Exchange Act of 1934 for the transition period from to |
Commission File Number: 001-34765
Teucrium Commodity Trust
(Exact name of registrant as specified in its charter)
| Delaware | 61-1604335 | |
(State or other jurisdiction of incorporation or organization) |
(I.R.S. Employer Identification No.) |
232 Hidden Lake Road, Building A
Brattleboro, Vermont 05301
(Address of principal executive offices) (Zip code)
(802) 257-1617
(Registrant’s telephone number, including area code)
Securities registered pursuant to Section 12(b) of the Act:
| Title of each Fund | Name of each exchange on which registered | ||||
| Shares of Teucrium Corn Fund | NYSE Arca, Inc. | ||||
| Shares of Teucrium Sugar Fund | NYSE Arca, Inc. | ||||
| Shares of Teucrium Soybean Fund | NYSE Arca, Inc. | ||||
| Shares of Teucrium Wheat Fund | NYSE Arca, Inc. | ||||
| Shares of Teucrium Agricultural Fund | NYSE Arca, Inc. | ||||
Securities registered pursuant to Section 12(g) of the Act: None
Indicate by check mark if the registrant is a well-known seasoned issuer, as defined in Rule 405 of the Securities Act.
☐ Yes ☒ No
Indicate by check mark if the registrant is not required to file reports pursuant to Section 13 or Section 15(d) of the Act.
☐ Yes ☒ No
Indicate by check mark whether the registrant (1) has filed all reports required to be filed by Section 13 or 15(d) of the Securities Exchange Act of 1934 during the preceding 12 months (or for such shorter period that the registrant was required to file such reports), and (2) has been subject to such filing requirements for the past 90 days.
☒ Yes ☐ No
Indicate by check mark whether the registrant has submitted electronically and posted on its corporate Web site, if any, every Interactive Data File required to be submitted and posted pursuant to Rule 405 of Regulation S-T (§232.405 of this chapter) during the preceding 12 months (or for such shorter period that the registrant was required to submit and post such files).
☒ Yes ☐ No
Indicate by check mark if disclosure of delinquent files pursuant to Item 405 of Regulation S-K is not contained herein, and will not be contained, to the best of registrant’s knowledge, in definitive proxy or information statements incorporated by reference in Part III of this Form 10-K or any amendment to this Form 10-K. ☒
Indicate by check mark whether the registrant is a large accelerated filer, an accelerated filer, a non-accelerated filer, or a smaller reporting company. See the definitions of “large accelerated filer,” “accelerated filer” and “smaller reporting company” in Rule 12b-2 of the Exchange Act.
| Large accelerated filer ☐ | Accelerated filer ☒ | ||
| Non-accelerated filer ☐ | Smaller reporting company | ||
| (Do not check if a smaller reporting company) |
Indicate by check mark whether the registrant is a shell company (as defined in Rule 12b-2 of the Exchange Act).
☐ Yes ☒ No
The aggregate market value of the units of each series of the registrant held by non-affiliates as of June 30, 2016 are included in the table below:
| Aggregate
Market Value of Each Funds’ Shares Held by Non-Affiliates as of June 30, 2016 | Total Number of Outstanding Shares as of March 13, 2017 | |||||||
| Teucrium Corn Fund | $ | 66,625,000 | 3,675,000 | |||||
| Teucrium Sugar Fund | 7,128,000 | 475,000 | ||||||
| Teucrium Soybean Fund | 12,804,000 | 650,000 | ||||||
| Teucrium Wheat Fund | 36,918,750 | 9,400,000 | ||||||
| Teucrium Agricultural Fund | $ | 1,427,500 | 50,000 | |||||
| Total | $ | 124,903,250 | ||||||
Statement Regarding Forward-Looking Statements
This filing includes “forward-looking statements” which generally relate to future events or future performance. In some cases, you can identify forward-looking statements by terminology such as “may,” “will,” “should,” “expect,” “plan,” “anticipate,” “believe,” “estimate,” “predict,” “potential” or the negative of these terms or other comparable terminology. All statements (other than statements of historical fact) included in this filing that address activities, events or developments that will or may occur in the future, including such matters as movements in the commodities markets and indexes that track such movements, operations of the Funds, the Sponsor’s plans and references to the future success of a Fund or the Funds and other similar matters, are forward-looking statements. These statements are only predictions. Actual events or results may differ materially. These statements are based upon certain assumptions and analyses the Sponsor has made based on its perception of historical trends, current conditions and expected future developments, as well as other factors appropriate in the circumstances. Whether or not actual results and developments will conform to the Sponsor’s expectations and predictions, however, is subject to a number of risks and uncertainties, including the special considerations discussed in this prospectus, general economic, market and business conditions, changes in laws or regulations, including those concerning taxes, made by governmental authorities or regulatory bodies, and other world economic and political developments. Consequently, all the forward-looking statements made in this filing are qualified by these cautionary statements, and there can be no assurance that actual results or developments the Sponsor anticipates will be realized or, even if substantially realized, that they will result in the expected consequences to, or have the expected effects on, the operations of the Funds or the value of the Shares of the Funds.
2
Table of Contents
The Trust and the Funds
Teucrium Commodity Trust (“Trust”), a Delaware statutory trust organized on September 11, 2009, is a series trust consisting of five series: Teucrium Corn Fund (“CORN”), Teucrium Sugar Fund (“CANE”), Teucrium Soybean Fund (“SOYB”), Teucrium Wheat Fund (“WEAT”), and Teucrium Agricultural Fund (“TAGS”). All of the series of the Trust are collectively referred to as the “Funds” and singularly as the “Fund.” Each Fund is a commodity pool that is a series of the Trust. The Funds issue common units, called the “Shares,” representing fractional undivided beneficial interests in a Fund. The Trust and the Funds operate pursuant to the Trust’s Second Amended and Restated Declaration of Trust and Trust Agreement (the “Trust Agreement”).
Two additional series, the Teucrium Natural Gas Fund (“NAGS”) and the Teucrium WTI Crude Oil Fund (“CRUD”) commenced operations in 2011; however, on December 18, 2014 CRUD and NAGS ceased trading on the NYSE Arca and the Sponsor liquidated all commodity futures contracts held by these funds. All positions were sold through an exchange to unrelated parties. On December 22, 2014 the Administrator and Custodian proceeded to distribute cash to all shareholders in an amount equal to each shareholder’s pro rata interest in the respective fund. On December 30, 2014, Teucrium Trading, LLC (the “Sponsor”) completed the disposition of all of the assets of these funds. There were zero assets and liabilities as of December 31, 2014. The Form 15 was filed with the SEC on January 9, 2015.
The Sponsor
Teucrium Trading, LLC is the Sponsor of the Trust and each of the series of the Trust. The Sponsor is a Delaware limited liability company, formed on July 28, 2009. The principal office of the Trust and the Sponsor is located at 232 Hidden Lake Road, Brattleboro, Vermont 05301. The Sponsor is registered as a commodity pool operator (“CPO”) with the Commodity Futures Trading Commission (“CFTC”) and became a member of the National Futures Association (“NFA”) on November 10, 2009. The Trust and the Funds operate pursuant to the Trust Agreement.
Under the Trust Agreement, the Sponsor is solely responsible for the management of the Trust and the Funds, and conducts or directs the conduct of the business of the Trust, the Funds, and any other Fund that may from time to time be established and designated by the Sponsor. The Sponsor is required to oversee the purchase and sale of Shares by firms designated as “Authorized Purchasers” and to manage the Funds’ investments, including to evaluate the credit risk of futures commission merchants and swap counterparties and to review daily positions and margin/collateral requirements. The Sponsor has the power to enter into agreements as may be necessary or appropriate for the offer and sale of the Funds’ Shares and the conduct of the Trust’s activities. Accordingly, the Sponsor is responsible for selecting the Trustee, Administrator, Distributor, the independent registered public accounting firm of the Trust, and any legal counsel employed by the Trust. The Sponsor is also responsible for preparing and filing periodic reports on behalf of the Trust with the SEC and providing any required certification for such reports. No person other than the Sponsor and its principals was involved in the organization of the Trust or the Funds.
Teucrium Trading, LLC designs the Funds to offer liquidity, transparency, and capacity in single-commodity and commodity-baskets, in the case of TAGS, investing for a variety of investors, including institutions and individuals, in an exchange-traded product format. The Funds have also been designed to mitigate the impacts of contango and backwardation, situations that can occur in the course of commodity trading which can affect the potential returns to investors. Backwardation is defined as a market condition in which a futures price of a commodity is lower in the distant delivery months than in the near delivery months, while contango, the opposite of backwardation, is defined as a condition in which distant delivery prices for futures exceed spot prices, often due to the costs of storing and insuring the underlying commodity.
The Funds
On June 5, 2010, the initial Form S-1 for CORN was declared effective by the U.S. Securities and Exchange Commission (“SEC”). On June 8, 2010, four Creation Baskets for CORN were issued representing 200,000 shares and $5,000,000. CORN began trading on the New York Stock Exchange (“NYSE”) Arca on June 9, 2010. The current registration statement for CORN was declared effective by the SEC on April 29, 2016.
On June 17, 2011, the initial Forms S-1 for CANE, SOYB, and WEAT were declared effective by the SEC. On September 16, 2011, two Creation Baskets were issued for each Fund, representing 100,000 shares and $2,500,000, for CANE, SOYB, and WEAT. On September 19, 2011, CANE, SOYB, and WEAT started trading on the NYSE Arca. The current registration statements for CANE and SOYB were declared effective by the SEC on June 30, 2014. The current registration statement for WEAT was declared effective on July 15, 2016. This registration statement for WEAT registered an additional 24,050,000 shares.
On February 10, 2012, the Form S-1 for TAGS was declared effective by the SEC. On March 27, 2012, six Creation Baskets for TAGS were issued representing 300,000 shares and $15,000,000. TAGS began trading on the NYSE Arca on March 28, 2012. The current registration statement for TAGS was declared effective by the SEC on April 30, 2015.
1
Investing Strategy
Overview
The Funds are designed and managed so that the daily changes in percentage terms of the Shares’ Net Asset Value (“NAV”) reflect the daily changes in percentage terms of a weighted average of the closing settlement prices for specific futures contracts for designated commodities (each a “Designated Commodity”) or the closing Net Asset Value per share of the Underlying Funds (as defined below) in the case of TAGS. Each Fund pursues its investment objective by investing in a portfolio of exchange-traded futures contracts (each a “Futures Contract”) that expire in a specific month and trade on a specific exchange in the Specified Commodity comprising the Benchmark (as defined below), as defined below or shares of the Underlying Funds in the case of TAGS. Each Fund may also hold United States Treasury Obligations and/or other high credit quality short-term fixed income securities for deposit with the commodity broker of the Funds as margin.
This weighted average of the closing settlement prices of the referenced specific Futures Contracts for each Fund is referred to herein as the “Benchmark,” and the specific Futures Contracts that at any given time make up the Benchmark for that Fund are referred to herein as the “Benchmark Component Futures Contracts.”
The investment objective of CORN is to have the daily changes in percentage terms of the Shares’ NAV reflect the daily changes in percentage terms of a weighted average of the closing settlement prices for three futures contracts for corn (“Corn Futures Contracts”) that are traded on the Chicago Board of Trade (“CBOT”), specifically (1) the second-to-expire CBOT Corn Futures Contract, weighted 35%, (2) the third-to-expire CBOT Corn Futures Contract, weighted 30%, and (3) the CBOT Corn Futures Contract expiring in the December following the expiration month of the third-to-expire contract, weighted 35%.
The investment objective of SOYB is to have the daily changes in percentage terms of the Shares’ NAV reflect the daily changes in percentage terms of a weighted average of the closing settlement prices for three futures contracts for soybeans (“Soybean Futures Contracts”) that are traded on the CBOT. The three Soybean Futures Contracts will generally be: (1) second-to-expire CBOT Soybean Futures Contract, weighted 35%, (2) the third-to-expire CBOT Soybean Futures Contract, weighted 30%, and (3) the CBOT Soybean Futures Contract expiring in the November following the expiration month of the third-to-expire contract, weighted 35%.
The investment objective of CANE is to have the daily changes in percentage terms of the Shares’ NAV reflect the daily changes in percentage terms of a weighted average of the closing settlement prices for three futures contracts for sugar (“Sugar Futures Contracts”) that are traded on ICE Futures US (“ICE Futures”), specifically: (1) the second-to-expire Sugar No. 11 Futures Contract (a “Sugar No. 11 Futures Contract”), weighted 35%, (2) the third-to-expire Sugar No. 11 Futures Contract, weighted 30%, and (3) the Sugar No. 11 Futures Contract expiring in the March following the expiration month of the third-to-expire contract, weighted 35%.
The investment objective of WEAT is to have the daily changes in percentage terms of the Shares’ NAV reflect the daily changes in percentage terms of a weighted average of the closing settlement prices for three futures contracts for wheat (“Wheat Futures Contracts”) that are traded on the CBOT, specifically: (1) the second-to-expire CBOT Wheat Futures Contract, weighted 35%, (2) the third-to-expire CBOT Wheat Futures Contract, weighted 30%, and (3) the CBOT Wheat Futures Contract expiring in the December following the expiration month of the third-to-expire contract, weighted 35%.
The investment objective of the TAGS is to have the daily changes in percentage terms of the NAV of its Shares reflect the daily changes in percentage terms of a weighted average (the “Underlying Fund Average”) of the NAVs per share of four other commodity pools that are series of the Trust and are sponsored by the Sponsor: the Teucrium Corn Fund, the Teucrium Wheat Fund, the Teucrium Soybean Fund and the Teucrium Sugar Fund (collectively, the “Underlying Funds”). The Underlying Fund Average will have a weighting of 25% to each Underlying Fund, and the Fund’s assets will be rebalanced, generally on a daily basis, to maintain the approximate 25% allocation to each Underlying Fund.
Each Fund seeks to achieve its investment objective by investing under normal market conditions in Benchmark Component Futures Contracts (“Futures Contracts”) of the Fund or, in certain circumstances, in other Futures Contracts for its Specified Commodity. In addition, and to a limited extent, a Fund also may invest in exchange-traded options on Futures Contracts for its Specified Commodity. Once position limits or accountability levels on Futures Contracts on a Fund’s Specified Commodity are applicable, each Fund’s intention is to invest first in contracts and instruments such as cash-settled options on Futures Contracts and forward contracts, swaps and other over-the-counter transactions that are based on the price of its Specified Commodity or Futures Contracts on its Specified Commodity (collectively, “Other Commodity Interests,” and together with Futures Contracts, “Commodity Interests”). By utilizing certain or all of these investments, the Sponsor will endeavor to cause each Fund’s performance to closely track that of its Benchmark.
The Sponsor operates the Funds with the intent to never hold a Benchmark Component Futures Contract once it becomes the next-to-expire contract (commonly called the “spot” contract). Accordingly, the positions of each Fund in its Specified Commodity Interests are changed or “rolled” on a regular basis in order to track the changing nature of the Benchmark. Using CORN as an example, five times a year (on the dates on which certain Corn Futures Contracts expire), a particular Corn Futures Contract will no longer be a Benchmark Component Futures Contract, and the Corn Fund’s investments will have to be changed accordingly. Corn Futures Contracts traded on the CBOT expire on a specified day in the following five months: March, May, July, September, and December. Therefore, in terms of the Benchmark, in June of a given year the next-to-expire or “spot month” Corn Futures Contract will expire in July of that year, and the Benchmark Component Futures Contracts will be the contracts expiring in September of that year (the second-to-expire contract), December of that year (the third-to-expire contract), and December of the following year. As another example using CORN, in November of a given year the Benchmark Component Futures Contracts will be the contracts expiring in March, May and December of the following year. The Teucrium Corn Fund is designed to roll or replace its contracts five times per year but will always hold a December Corn Futures Contract as an “anchor” month. The Sponsor will determine if the investments of a Fund will be “rolled” in one day or over a period of several days, in order that any trading does not signal unwanted market movements and to make it more difficult for third parties to profit by trading ahead based on such expected market movements. Such “roll” periods are posted to the website for each Fund well in advance of the “roll” date.
2
The Sponsor employs a “neutral” investment strategy intended to track the changes in the Benchmark of each Fund regardless of whether the Benchmark goes up or goes down. The Funds’ “neutral” investment strategy is designed to permit investors generally to purchase and sell the Shares of each Fund for the purpose of investing indirectly in the commodity-specific market in a cost-effective manner. Such investors may include participants in the specific industry and other industries seeking to hedge the risk of losses in their commodity specific-related transactions, as well as investors seeking exposure to that commodity market. Accordingly, depending on the investment objective of an individual investor, the risks generally associated with investing in the commodity-specific market and/or the risks involved in hedging may exist. In addition, an investment in a Fund involves the risks that the changes in the price of the Fund’s Shares will not accurately track the changes in the Benchmark, and that changes in the Benchmark will not closely correlate with changes in the price of the commodity on the spot market. The Sponsor does not intend to operate each Fund in a fashion such that its per share NAV equals, in dollar terms, the spot price of the commodity or the price of any particular commodity-specific Futures Contract related to the Fund or the commodities of the Underlying Funds.
Calculation of the Benchmark
The notional amount of each Benchmark Component Futures Contract included in each Benchmark is intended to reflect the changes in market value of each such Benchmark Component Futures Contract within the Benchmark. The closing level of each Benchmark is calculated on each business day by the U.S. Bancorp Fund Services (the “Administrator”) based on the closing price of the futures contracts for each of the underlying Benchmark Component Futures Contracts and the notional amounts of such Benchmark Component Futures Contracts.
Each Benchmark is rebalanced periodically to ensure that each of the Benchmark Component Futures Contracts is weighted in the same proportion as in the investment objective for each Fund. The following tables reflect the December 31, 2016, Benchmark Component Futures Contracts weights for each of the Funds:
| CORN Benchmark Component Futures Contracts | Notional Value | Weight (%) | ||||||
| CBOT Corn Futures (1,438 contracts, MAY17) | $ | 25,704,250 | 35 | % | ||||
| CBOT Corn Futures (1,207 contracts, JUL17) | 21,982,488 | 30 | ||||||
| CBOT Corn Futures (1,347 contracts, DEC17) | 25,593,000 | 35 | ||||||
| Total at December 31, 2016 | $ | 73,279,738 | 100 | % | ||||
| SOYB Benchmark Component Futures Contracts | Notional Value | Weight (%) | ||||||
| CBOT Soybean Futures (90 contracts, MAR17) | $ | 4,518,000 | 35 | % | ||||
| CBOT Soybean Futures (76 contracts, MAY17) | 3,847,500 | 30 | ||||||
| CBOT Soybean Futures (91 contracts, NOV17) | 4,501,088 | 35 | ||||||
| Total at December 31, 2016 | $ | 12,866,588 | 100 | % | ||||
| CANE Benchmark Component Futures Contracts | Notional Value | Weight (%) | ||||||
| ICE Sugar Futures (89 contracts, MAY17) | $ | 1,918,840 | 35 | % | ||||
| ICE Sugar Futures (79 contracts, JUL17) | 1,667,848 | 30 | ||||||
| ICE Sugar Futures (93 contracts, MAR18) | 1,935,293 | 35 | ||||||
| Total at December 31, 2016 | $ | 5,521,981 | 100 | % | ||||
| WEAT Benchmark Component Futures Contracts | Notional Value | Weight (%) | ||||||
| CBOT Wheat Futures (1,037 contracts, MAY17) | $ | 21,802,925 | 35 | % | ||||
| CBOT Wheat Futures (861 contracts, JUL17) | 18,694,463 | 30 | ||||||
| CBOT Wheat Futures (939 contracts, DEC17) | 21,831,750 | 35 | ||||||
| Total at December 31, 2016 | $ | 62,329,138 | 100 | % | ||||
| TAGS Benchmark Component Futures Contracts | Fair Value | Weight (%) | ||||||
| Shares of Teucrium Corn Fund | $ | 323,979 | 25 | % | ||||
| Shares of Teucrium Soybean Fund | 315,486 | 24 | ||||||
| Shares of Teucrium Wheat Fund | 331,267 | 25 | ||||||
| Shares of Teucrium Sugar Fund | 342,822 | 26 | ||||||
| Total at December 31, 2016 | $ | 1,313,554 | 100 | % | ||||
3
The price relationship between the near month Futures Contract to expire and the Benchmark Component Futures Contracts will vary and may impact both the total return of each Fund over time and the degree to which such total return tracks the total return of the price indices related to the commodity of each Fund. In cases in which the near month contract’s price is lower than later-expiring contracts’ prices (a situation known as “contango” in the futures markets), then absent the impact of the overall movement in commodity prices the value of the Benchmark Component Futures Contracts would tend to decline as they approach expiration. In cases in which the near month contract’s price is higher than later-expiring contracts’ prices (a situation known as “backwardation” in the futures markets), then absent the impact of the overall movement in a Fund’s prices the value of the Benchmark Component Futures Contracts would tend to rise as they approach expiration.
The total portfolio composition for each Fund is disclosed each business day that the NYSE Arca is open for trading on the Fund’s website. The website for CORN is www.teucriumcornfund.com; for CANE is www.teucriumcanefund.com; for SOYB is www.teucriumsoybfund.com; for WEAT is www.teucriumweatfund.com; and for TAGS is www.teucriumtagsfund.com. These sites are accessible at no charge. The website disclosure of portfolio holdings is made daily and includes, as applicable, the name and value of each Futures Contract, Other Commodity Interest and the amount of cash and cash equivalents held in the Fund’s portfolio. The specific types of Other Commodity Interests (in addition to futures contracts, options on futures contracts and derivative contracts) that are tied to various commodities are entered into outside of public exchanges. These “over-the-counter” contracts are entered into between two parties in private contracts, or on a recently formed swap execution facility (“SEF”) for standardized swaps. For example, unlike Futures Contracts, which are guaranteed by a clearing organization, each party to an over-the-counter derivative contract bears the credit risk of the other party (unless such over-the-counter swap is cleared through a derivatives clearing organization (“DCO”)), i.e., the risk that the other party will not be able to perform its obligations under its contract, and characteristics of such Other Commodity Interests.
Consistent with achieving a Fund’s investment objective of closely tracking the Benchmark, the Sponsor may for certain reasons cause the Fund to enter into or hold Futures Contracts other than the Benchmark Component Futures Contracts and/or Other Commodity Interests. Other Commodity Interests that do not have standardized terms and are not exchange-traded, referred to as “over-the-counter” Corn Interests, can generally be structured as the parties to the Corn Interest contract desire. Therefore, each Fund might enter into multiple and/or over-the-counter Interests intended to replicate the performance of each of the Benchmark Component Futures Contracts for the Fund, or a single over-the-counter Interest designed to replicate the performance of the Benchmark as a whole. Assuming that there is no default by a counterparty to an over-the-counter Interest, the performance of the Interest will necessarily correlate with the performance of the Benchmark or the applicable Benchmark Component Futures Contract. Each Fund might also enter into or hold Interests other than Benchmark Component Futures Contracts to facilitate effective trading, consistent with the discussion of the Fund’s “roll” strategy. In addition, each Fund might enter into or hold Interests that would be expected to alleviate overall deviation between the Fund’s performance and that of the Benchmark that may result from certain market and trading inefficiencies or other reasons. By utilizing certain or all of the investments described above, the Sponsor will endeavor to cause the Fund’s performance to closely track that of the Benchmark of the Fund.
An “exchange for related position” (“EFRP”) can be used by the Fund as a technique to facilitate the exchanging of a futures hedge position against a creation or redemption order, and thus the Fund may use an EFRP transaction in connection with the creation and redemption of shares. The market specialist/market maker that is the ultimate purchaser or seller of shares in connection with the creation or redemption basket, respectively, agrees to sell or purchase a corresponding offsetting futures position which is then settled on the same business day as a cleared futures transaction by the FCMs. The Fund will become subject to the credit risk of the market specialist/market maker until the EFRP is settled within the business day, which is typically 7 hours or less. The Fund reports all activity related to EFRP transactions under the procedures and guidelines of the CFTC and the exchanges on which the futures are traded.
The Funds earn interest income from the Treasury securities and/or cash equivalents that it purchases and on the cash it holds through the Custodian or other financial institution. The Sponsor anticipates that the earned interest income will increase the NAV of each Fund. The Funds apply the earned interest income to the acquisition of additional investments or uses it to pay its expenses. If the Fund reinvests the earned interest income, it makes investments that are consistent with its investment objectives. Any Treasury security and cash equivalent invested by a Fund will have original maturity dates of three months or less at inception. Any cash equivalents invested by a Fund will be rated in the highest short-term rating category by a nationally recognized statistical rating organization or will be deemed by the Sponsor to be of comparable quality. As of December 31, 2016, available cash balances in each of the Funds were invested in either the Fidelity Government Money Market Portfolio or in demand deposits at Rabobank, N.A.
In managing the assets of the Funds, the Sponsor does not use a technical trading system that automatically issues buy and sell orders. Instead, the Sponsor will purchase or sell the specific underlying Commodity Interests with an aggregate market value that approximates the amount of cash received or paid upon the purchase or redemption of Shares.
The Sponsor does not anticipate letting the commodity Futures Contracts of any Fund expire, thus taking delivery of the underlying commodity. Instead, the Sponsor will close out existing positions, for instance, in response to ongoing changes in the Benchmark or if it otherwise determines it would be appropriate to do so and reinvest the proceeds in new Commodity Interests. Positions may also be closed out to meet redemption orders, in which case the proceeds from closing the positions will not be reinvested.
4
Market Outlook
The Corn Market
Corn is currently the most widely produced livestock feed grain in the United States, and the majority of the United States’ corn crop is used in livestock feed, with the amount used in ethanol production second. Corn is also processed into food and industrial products, including starch, sweeteners, corn oil, beverages and industrial alcohol. The United States Department of Agriculture (“USDA”) publishes weekly, monthly, quarterly and annual updates for U.S. domestic and worldwide corn production and consumption, and for other grains such as soybeans and wheat which can be used in some cases as a substitute for corn. These reports are available on the USDA’s website, www.usda.gov, at no charge.
The United States is the world’s leading producer and exporter of corn. For the Crop Year 2016-17, the United States Department of Agriculture (“USDA”) estimates that the U.S. will produce approximately 37% of all the corn globally, of which about 15% will be exported. For 2016-2017, global consumption of 1,027.0 Million Metric Tons (MMT) is expected to be slightly less than global production of 1,037.9 MMT. If the global supply of corn exceeds global demand, this may have an adverse impact on the price of corn. Besides the United States, other principal world corn exporters include Argentina, Brazil and the former Soviet Union nations known as the FSU-12 which includes the Ukraine. Major importer nations include Mexico, Japan, the European Union (EU), South Korea, Egypt and parts of Southeast Asia. China’s estimated production for 2016-17 at 219.6 MMT is under its domestic usage of 227.0 MMT.
According to the USDA, global corn consumption has increased almost 400% from 1960-2016 as demonstrated by the graph below, and is projected to continue to grow in upcoming years. Consumption growth is the result of a combination of many factors including: 1) global population growth, which, according to the U.S. Census Department, is estimated to increase by approximately 78 million people in the 2016-17 timeframe and reach over 9.4 billion by 2050; 2) a growing global middle class which is increasing the demand for protein and meat-based products globally and most significantly in developing countries; and 3) increased use of bio-fuels, including ethanol in the United States. Based on USDA estimates as of January 12, 2017, for each person added to the population, there needs to be an additional 5.5 bushels of corn, 1.7 bushels of soybeans and 3.7 bushels of wheat produced.
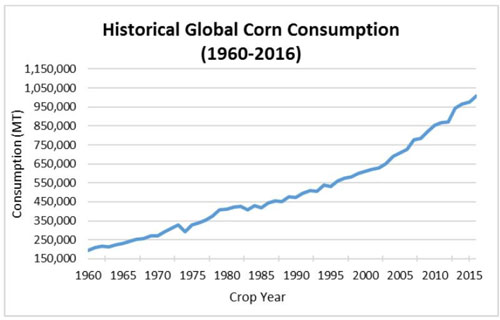
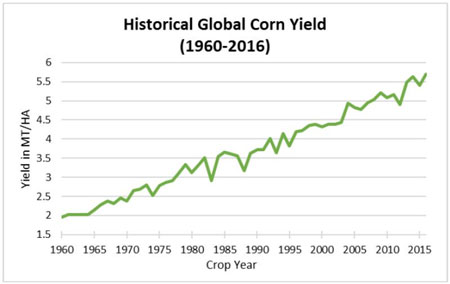
While global consumption of corn has increased over the 1960-2016 period, so has production, driven by increases in acres planted and yield per acre. However, according to the USDA and United Nations, future growth in planted acres and yield may be inhibited by lower-productive land, and lack of infrastructure and transportation. In addition, agricultural crops such as corn are highly weather-dependent for yield and therefore susceptible to changing weather patterns. In addition, given the current production/consumption patterns, nearly 100% of all corn produced globally is consumed which leaves minimal excess inventory if production issues arise.
5
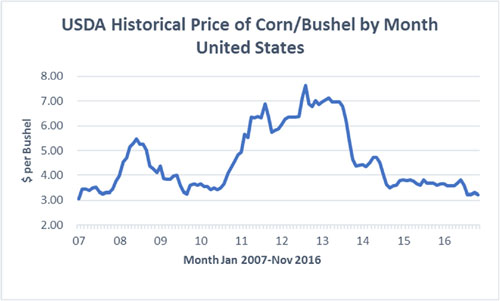
The price per bushel of corn in the United States is primarily a function of both U.S. and global production, as well as U.S. and global demand. The graph below shows the USDA published price per bushel by month for the period January 2007 to November 2016.
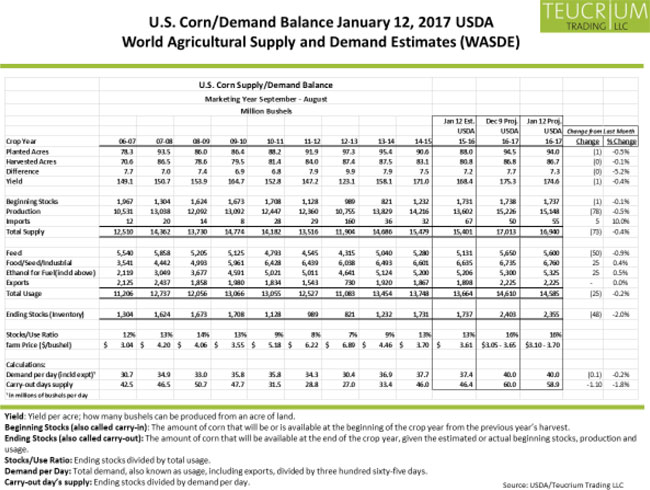
On January 12, 2017, the USDA released its monthly World Agricultural Supply and Demand Estimates (WASDE) for the Crop Year 2016-17. The exhibit below provides a summary of historical and current information for United States corn production.
Standard Corn Futures Contracts trade on the CBOT in units of 5,000 bushels, although 1,000 bushel “mini-corn” Corn Futures Contracts also trade. Three grades of corn are deliverable under CBOT Corn Futures Contracts: Number 1 yellow, which may be delivered at 1.5 cents over the contract price; Number 2 yellow, which may be delivered at the contract price; and Number 3 yellow, which may be delivered at 1.5 cents under the contract price. There are five months each year in which CBOT Corn Futures Contracts expire: March, May, July, September and December.
6
If the futures market is in a state of backwardation (i.e., when the price of corn in the future is expected to be less than the current price), the Fund will buy later-to-expire contracts for a lower price than the sooner-to-expire contracts that it sells. Hypothetically, and assuming no changes to either prevailing corn prices or the price relationship between immediate delivery, soon-to-expire contracts and later-to-expire contracts, the value of a contract will rise as it approaches expiration. Over time, if backwardation remained constant, the differences would continue to increase. If the futures market is in contango, the Fund will buy later-to-expire contracts for a higher price than the sooner-to-expire contracts that it sells. Hypothetically, and assuming no other changes to either prevailing corn prices or the price relationship between the spot price, soon-to-expire contracts and later-to-expire contracts, the value of a contract will fall as it approaches expiration. Over time, if contango remained constant, the difference would continue to increase. Historically, the corn futures markets have experienced periods of both contango and backwardation. Frequently, whether contango or backwardation exists is a function, among other factors, of the seasonality of the corn market and the corn harvest cycle. All other things being equal, a situation involving prolonged periods of contango may adversely impact the returns of the Fund; conversely a situation involving prolonged periods of backwardation may positively impact the returns of the Fund.
The Soybean Market
Global soybean production is concentrated in the U.S., Brazil, Argentina and China. The United States Department of Agriculture (“USDA”) has estimated that, for the Crop Year 2016-17, the United States will produce approximately 117.2 MMT of soybeans or approximately 35% of estimated world production, with Brazil production at 104 MMT. Argentina is projected to produce about 57 MMT. For 2016-17, global consumption of 330.3 MMT is expected to be slightly less than global production of 337.9 MMT. If the global supply of soybeans exceeds global demand, this may have an adverse impact on the price of soybeans. The USDA publishes weekly, monthly, quarterly and annual updates for U.S. domestic and worldwide soybean production and consumption. These reports are available on the USDA’s website, www.usda.gov, at no charge.
The soybean processing industry converts soybeans into soybean meal, soybean hulls, and soybean oil. Soybean meal and soybean hulls are processed into soy flour or soy protein, which are used, along with other commodities, by livestock producers and the farm fishing industry as feed. Soybean oil is sold in multiple grades and is used by the food, petroleum and chemical industries. The food industry uses soybean oil in cooking and salad dressings, baking and frying fats, and butter substitutes, among other uses. In addition, the soybean industry continues to introduce soy-based products as substitutes to various petroleum-based products including lubricants, plastics, ink, crayons and candles. Soybean oil is also converted to biodiesel for use as fuel.
Standard Soybean Futures Contracts trade on the CBOT in units of 5,000 bushels, although 1,000 bushel “mini-sized” Soybean Futures Contracts also trade. Three grades of soybean are deliverable under CBOT Soybean Futures Contracts: Number 1 yellow, which may be delivered at 6 cents per bushel over the contract price; Number 2 yellow, which may be delivered at the contract price; and Number 3 yellow, which may be delivered at 6 cents per bushel under the contract price. There are seven months each year in which CBOT Soybean Futures Contracts expire: January, March, May, July, August, September and November.
If the futures market is in a state of backwardation (i.e., when the price of soybeans in the future is expected to be less than the current price), the Fund will buy later-to-expire contracts for a lower price than the sooner-to-expire contracts that it sells. Hypothetically, and assuming no changes to either prevailing soybean prices or the price relationship between immediate delivery, soon-to-expire contracts and later-to-expire contracts, the value of a contract will rise as it approaches expiration. If the futures market is in contango, the Fund will buy later-to-expire contracts for a higher price than the sooner-to-expire contracts that it sells. Hypothetically, and assuming no other changes to either prevailing soybean prices or the price relationship between the spot price, soon-to-expire contracts and later-to-expire contracts, the value of a contract will fall as it approaches expiration. Historically, the soybeans futures markets have experienced periods of both contango and backwardation. Frequently, whether contango or backwardation exists is a function, among other factors, of the seasonality of the soybean market and the soybean harvest cycle. All other things being equal, a situation involving prolonged periods of contango may adversely impact the returns of the Fund; conversely a situation involving prolonged periods of backwardation may positively impact the returns of the Fund.
The price per bushel of soybeans in the United States is primarily a function of both U.S. and global production, as well as U.S. and global demand. The graph below shows the USDA published price per bushel by month for the period January 2007 to November 2016.
7
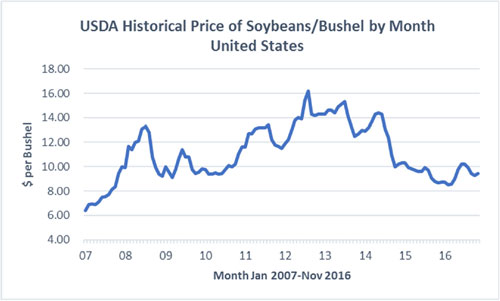
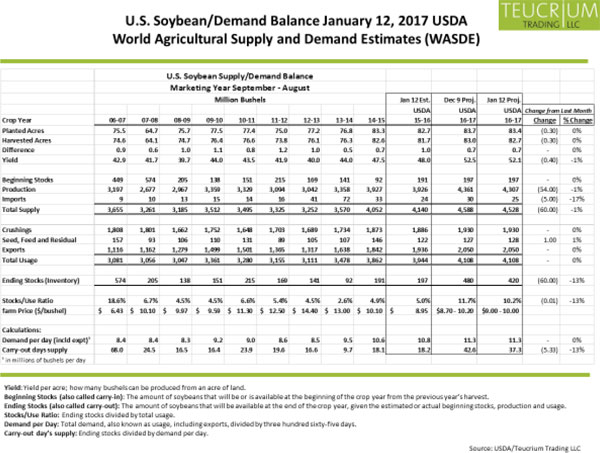
On January 12, 2017, the USDA released its monthly World Agricultural Supply and Demand Estimates (WASDE) for the Crop Year 2016-17. The exhibit below provides a summary of historical and current information for United States soybean production.
The Wheat Market
Wheat is used to produce flour, the key ingredient for breads, pasta, crackers and many other food products, as well as several industrial products such as starches and adhesives. Wheat by-products are used in livestock feeds. Wheat is the principal food grain produced in the United States, and the United States’ output of wheat is typically exceeded only by that of China, the European Union, the former Soviet nations, known as the FSU-12, including the Ukraine, and India. The United States Department of Agriculture (“USDA”) estimates that for 2016-17, the principal global producers of wheat will be the EU, the former Soviet nations known as the FSU-12, China, India, the United States, Australia and Canada. The U.S. generates approximately 8% of the global production, with approximately 42% of that being exported. For 2016-17, global consumption of 739.9 MMT is estimated to be surpassed by production of 752.7 MMT. If the global supply of wheat exceeds global demand, this may have an adverse impact on the price of wheat. The USDA publishes weekly, monthly, quarterly and annual updates for U.S. domestic and worldwide wheat production and consumption. These reports are available on the USDA’s website, www.usda.gov, at no charge.
8
There are several types of wheat grown in the U.S., which are classified in terms of color, hardness, and growing season. CBOT Wheat Futures Contracts call for delivery of #2 soft red winter wheat, which is generally grown in the eastern third of the United States, but other types and grades of wheat may also be delivered (Grade #1 soft red winter wheat, Hard Red Winter, Dark Northern Spring and Northern Spring wheat may be delivered at 3 cents premium per bushel over the contract price and #2 soft red winter wheat, Hard Red Winter, Dark Northern Spring and Northern Spring wheat may be delivered at the contract price.) Winter wheat is planted in the fall and is harvested in the late spring or early summer of the following year, while spring wheat is planted in the spring and harvested in late summer or fall of the same year.
Standard Wheat Futures Contracts trade on the CBOT in units of 5,000 bushels, although 1,000 bushel “mini-wheat” Wheat Futures Contracts also trade. There are five months each year in which CBOT Wheat Futures Contracts expire: March, May, July, September and December.
If the futures market is in a state of backwardation (i.e., when the price of wheat in the future is expected to be less than the current price), the Fund will buy later-to-expire contracts for a lower price than the sooner-to-expire contracts that it sells. Hypothetically, and assuming no changes to either prevailing wheat prices or the price relationship between immediate delivery, soon-to-expire contracts and later-to-expire contracts, the value of a contract will rise as it approaches expiration. If the futures market is in contango, the Fund will buy later-to-expire contracts for a higher price than the sooner-to-expire contracts that it sells. Hypothetically, and assuming no other changes to either prevailing wheat prices or the price relationship between the spot price, soon-to-expire contracts and later-to-expire contracts, the value of a contract will fall as it approaches expiration. Historically, the wheat futures markets have experienced periods of both contango and backwardation. Frequently, whether contango or backwardation exists is a function, among other factors, of the seasonality of the wheat market and the wheat harvest cycle. All other things being equal, a situation involving prolonged periods of contango may adversely impact the returns of the Fund; conversely a situation involving prolonged periods of backwardation may positively impact the returns of the Fund.
The price per bushel of wheat in the United States is primarily a function of both U.S. and global production, as well as U.S. and global demand. The graph below shows the USDA published price per bushel by month for the period January 2007 to November 2016.
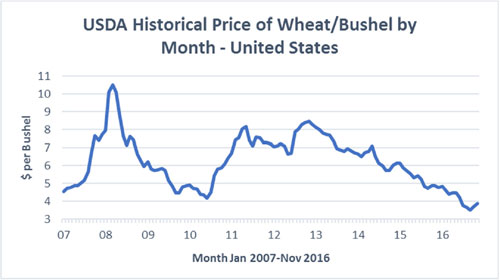
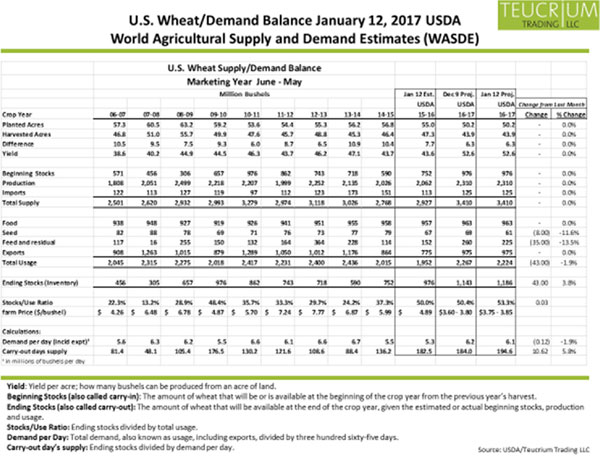
On January 12, 2017, the USDA released its monthly World Agricultural Supply and Demand Estimates (WASDE) for the Crop Year 2016-17. The exhibit below provides a summary of historical and current information for United States wheat production.
9
The Sugar Market
Sugarcane accounts for about 75% of the world’s sugar production, while sugar beets account for the remainder of the world’s sugar production. Sugar manufacturers use sugar beets and sugarcane as the raw material from which refined sugar (sucrose) for industrial and consumer use is produced. Sugar is produced in various forms, including granulated, powdered, liquid, brown, and molasses. The food industry (in particular, producers of baked goods, beverages, cereal, confections, and dairy products) uses sugar and sugarcane molasses to make sugar-containing food products. Sugar beet pulp and molasses products are used as animal feed ingredients. Ethanol is an important by-product of sugarcane processing. Additionally, the material that is left over after sugarcane is processed is used to manufacture paper, cardboard, and “environmentally friendly” eating utensils.
The Sugar No. 11 Futures Contract is the world benchmark contract for raw sugar trading. This contract prices the physical delivery of raw cane sugar, delivered to the receiver’s vessel at a specified port within the country of origin of the sugar. Sugar No. 11 Futures Contracts trade on the ICE Futures and the NYMEX in units of 112,000 pounds.
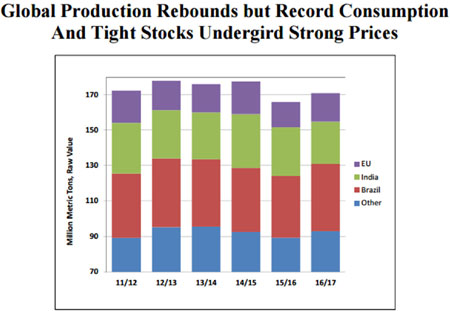
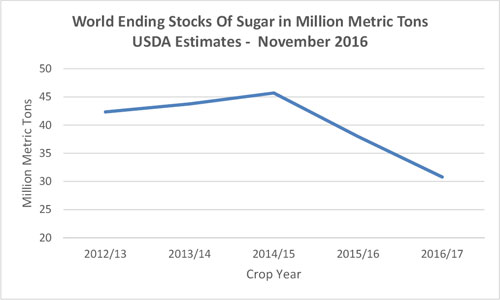
The United States Department of Agriculture (“USDA”) publishes two major reports annually on U.S. domestic and worldwide sugar production and consumption. These are usually released in November and May. In addition, the USDA publishes periodic, but not as comprehensive, reports on sugar monthly. These reports are available on the USDA’s website, www.usda.gov, at no charge. The USDA’s November 2016 report forecasts that Brazil, with estimated production of 37.8 million metric tons, an increase of 3.1 million metric tons, and 9%, from the year before, will continue to be the leading producer of sugarcane. Brazil’s production, which outpaces the other principal global producers, namely India, Thailand and China, equates to approximately 22% of the world’s supply. World estimated production is 170.9 million metric tons. Although world sugar production will increase by 5.1 million metric tons over last year, the USDA’s November 2016 report estimates record global consumption of 173.6 million metric tons will outpace production for the second consecutive year. Record consumption will reduce ending stocks to the lowest level in six years; this includes a 44% reduction of Chinese ending stocks as compared to last year, and a significant reduction in India’s production. The most current period has seen the global demand for sugar exceed supply which has, generally, resulted in price increases. However, if the global supply of sugar exceeds global demand, a situation which has occurred in the recent past, this may have an adverse impact on the price of sugar, and prices will generally fall. The principal producers of sugar beets, as forecasted by the USDA for 2017, include the European Union, the United States, and Russia.
The USDA, in its November 2017 report, highlighted in the graph immediately below, the fact that prices have risen in response to lower ending stocks. The tightening in global ending stocks is illustrated in the second graph.
10
If the futures market is in a state of backwardation (i.e., when the price of sugar in the future is expected to be less than the current price), the Fund will buy later-to-expire contracts for a lower price than the sooner-to-expire contracts that it sells. Hypothetically, and assuming no changes to either prevailing sugar prices or the price relationship between immediate delivery, soon-to-expire contracts and later-to-expire contracts, the value of a contract will rise as it approaches expiration. If the futures market is in contango, the Fund will buy later-to-expire contracts for a higher price than the sooner-to-expire contracts that it sells. Hypothetically, and assuming no other changes to either prevailing sugar prices or the price relationship between the spot price, soon-to-expire contracts and later-to-expire contracts, the value of a contract will fall as it approaches expiration. Historically, the sugar futures markets have experienced periods of both contango and backwardation. Frequently, whether contango or backwardation exists is a function, among other factors, of the seasonality of the sugar market and the sugar harvest cycle. All other things being equal, a situation involving prolonged periods of contango may adversely impact the returns of the Funds; conversely a situation involving prolonged periods of backwardation may positively impact the returns of the Funds.
Competitive Environment
Investors may choose among several options when considering an investment in agricultural commodities. For instance, an investor may choose to invest directly in commodity futures, although such an investment generally requires significant capital. Additionally, there are a variety of commodity index funds which include baskets of commodity interests; these funds invest in a range of commodity interests, although some are weighted toward, or invest solely in, agricultural commodities. Finally, there are exchange-traded notes which are credit instruments, some of which may invest or mirror investments in agricultural commodities.
11
The Sponsor’s Operations
The Sponsor established the Trust and caused the Trust to establish the first series, the Corn Fund, which commenced offering its Shares to the public on June 9, 2010. Three additional series, namely the Sugar Fund, the Soybean Fund and the Wheat Fund, commenced offering of shares in September, 2011 and the Teucrium Agricultural Fund commenced operation on March 28, 2012. Aside from establishing these series, operating those series that have commenced offering their shares and obtaining capital from a small number of outside investors in order to engage in these activities, the Sponsor did not engage in any business activity.
The Trust and the Funds do not have any employees or officers. Any persons acting as agents of the Trust or the Funds do so as employees or officers of the Sponsor.
Under the Trust Agreement, the Sponsor is solely responsible for the management, and conducts or directs the conduct of the business of the Trust, the Funds, and any other Fund that may from time to time be established and designated by the Sponsor. The Sponsor is required to oversee the purchase and sale of Shares by firms designated as “Authorized Purchasers” and to manage the Funds’ investments, including to evaluate the credit risk of futures commission merchants and swap counterparties and to review daily positions and margin/collateral requirements. The Sponsor has the power to enter into agreements as may be necessary or appropriate for the offer and sale of the Funds’ Shares and the conduct of the Trust’s activities. Accordingly, the Sponsor is responsible for selecting the Trustee, Administrator, Distributor, the independent registered public accounting firm of the Trust, and any legal counsel employed by the Trust. The Sponsor is also responsible for preparing and filing periodic reports on behalf of the Trust with the SEC and providing any required certification for such reports. No person other than the Sponsor and its principals was involved in the organization of the Trust or the Funds.
The Sponsor maintains websites on behalf of each of the Funds. The total portfolio composition of each Fund is disclosed on the Fund’s website each business day that the NYSE Arca is open for trading. The website disclosure of portfolio holdings is made daily and includes, as applicable, the name and value of each Commodity Futures Contract held and those that are pending and the amount of cash and cash equivalents held in the Fund’s portfolio. Each Fund’s website also includes the NAV, the 4 p.m. Bid/Ask Midpoint as reported by the NYSE Arca, the last trade price as reported by the NYSE Arca, the shares outstanding, the shares available for issuance, and the shares created or redeemed on that day. The prospectus, Monthly Statement of Account, Quarterly Performance of the Midpoint versus the NAV, and the Roll Dates, as well as Form 10-Qs, Form 10-Ks, and other SEC filings for that Fund, are also posted on the website. Each Fund’s website is publicly accessible at no charge. The website for CORN is www.teucriumcornfund.com; for CANE is www.teucriumcanefund.com; for SOYB is www.teucriumsoybfund.com; for WEAT is www.teucriumweatfund.com; and for TAGS is www.teucriumtagsfund.com. The website address for the Sponsor is www.teucrium.com.
The Sponsor receives a fee as compensation for services performed under the Trust Agreement, except in the case of TAGS where there is no such fee. The Sponsor’s fees accrue daily and are paid monthly at an annual rate of 1.00% of the average daily net assets of each Fund. In addition, each Fund is also generally responsible for other ongoing fees, costs and expenses of its operations, including brokerage fees and SEC registration fees, and legal, printing, accounting, custodial, administration and transfer agency costs, although the Sponsor has borne or will bear the costs and expenses related to the initial offer and sale of Shares. The Funds will generally bear the costs and expenses associated with filing a new registration statement for each Fund every three years, unless the Sponsor waives all or part of such costs and expenses. The Sponsor may choose to waive, for a period of time and at its discretion, the collection of the Sponsor Fee or certain other fees for any of the Funds. Certain aggregate expenses common to all Funds within the Trust are allocated by the Sponsor to the respective funds based on activity drivers deemed most appropriate by the Sponsor for such expenses, including but not limited to relative assets under management and creation and redeem order activity. These aggregate common expenses include, but are not limited to, legal, auditing, accounting and financial reporting, tax-preparation, regulatory compliance, trading activities, and insurance costs, as well as fees paid to the Distributor, which are included in the related line item in the combined statements of operations.
A portion of these aggregate common expenses are related to the Sponsor or related parties of principals of the Sponsor; these are necessary services to the Trust and the Funds, which are primarily the cost of performing accounting and financial reporting, regulatory compliance, and trading activities that are directly attributable to the Trust and the Funds. For the period ended December 31, such expenses, which are primarily included as distribution and marketing fees, totaled $1,825,552 in 2016, $1,601,237 in 2015, and $1,365,214 in 2014; of these amounts, $457,658 in 2016, $138,262 in 2015, and $113,224 in 2014 were waived by the Sponsor.
All asset-based fees and expenses for the Funds are calculated on the prior day’s net assets.
The Sponsor has an information technology plan (the “IT Plan”) in place which is part of the internal controls of the Trust and the Funds. The IT Plan is tested by both the management of the Sponsor and by the independent external auditor as a part of their internal control audit over the financial reporting of the Trust and the Funds. The IT Plan also takes reasonable care to look beyond the controls developed and implemented for the Trust and the Funds directly to the platforms and controls in place for the key service providers. Such review of the IT plans of key service providers is part of the Sponsor’s disaster recovery and business continuity planning. The Sponsor provides regular training to all employees of the Sponsor regarding cybersecurity topics, in addition to real-time dissemination of information regarding cybersecurity matters as needed. The IT plan is reviewed and updated as needed, but at a minimum on an annual basis.
Ownership or “membership” interests in the Sponsor are owned by persons referred to as “members.” The Sponsor currently has three voting or “Class A” members – Mr. Sal Gilbertie, Mr. Dale Riker and Mr. Carl N. Miller III – and a small number of non-voting or “Class B” members who have provided working capital to the Sponsor. Messrs. Gilbertie and Riker each currently own 45% of the Sponsor’s Class A membership interests.
12
Management of the Sponsor
In general, under the Sponsor’s Amended and Restated Limited Liability Company Operating Agreement, as amended from time to time, the Sponsor (and as a result the Trust and each Fund) is managed by the officers of the Sponsor. The Chief Executive Officer of the Sponsor is responsible for the overall strategic direction of the Sponsor and will have general control of its business. The Chief Investment Officer and President of the Sponsor is primarily responsible for new investment product development with respect to the Funds. The Chief Operating Officer has assumed primary responsibility for trade operations, trade execution, and portfolio activities with respect to the Fund. The Chief Financial Officer, Chief Accounting Officer and Chief Compliance Officer acts as the Sponsor’s principal financial and accounting officer, which position includes the functions previously performed by the Treasurer of the Sponsor, and administers the Sponsor’s regulatory compliance programs. Furthermore, certain fundamental actions regarding the Sponsor, such as the removal of officers, the addition or substitution of members, or the incurrence of liabilities other than those incurred in the ordinary course of business and de minimis liabilities, may not be taken without the affirmative vote of a majority of the Class A members (which is generally defined as the affirmative vote of Mr. Gilbertie and one of the other two Class A members). The Sponsor has no board of directors, and the Trust has no board of directors or officers.
The Officers of the Sponsor, two of whom are also Class A members of the Sponsor, are the following:
Sal Gilbertie has been the President of the Sponsor since its inception and its Chief Investment Officer since September 2011, was approved by the NFA as a principal of the Sponsor on September 23, 2009, and was registered as an associated person of the Sponsor on November 10, 2009. He maintains his main business office at 65 Adams Road, Easton, Connecticut 06612. Effective July 16, 2012, Mr. Gilbertie was registered with the NFA as the Branch Manager for this location. Since October 18, 2010, Mr. Gilbertie has been an associated person of the Distributor under the terms of the Securities Activities and Services Agreement (“SASA”) between the Sponsor and the Distributor. Additional information regarding the SASA can be found in the section of this disclosure document entitled “Plan of Distribution.” From October 2005 until December 2009, Mr. Gilbertie was employed by Newedge USA, LLC, an FCM and broker-dealer registered with the CFTC and the SEC, where he headed the Renewable Fuels/Energy Derivatives OTC Execution Desk and was an active futures contract and over-the-counter derivatives trader and market maker in multiple classes of commodities. (Between January 2008 and October 2008, he also held a comparable position with Newedge Financial, Inc., an FCM and an affiliate of Newedge USA, LLC.) From October 1998 until October 2005, Mr. Gilbertie was principal and co-founder of Cambial Asset Management, LLC, an adviser to two private funds that focused on equity options, and Cambial Financing Dynamics, a private boutique investment bank. While at Cambial Asset Management, LLC and Cambial Financing Dynamics, Mr. Gilbertie served as principal and managed the day-to-day activities of the business and the portfolio of both companies. Mr. Gilbertie is 56 years old.
Dale Riker has been the Secretary of the Sponsor since January 2010, and its Chief Executive Officer since September 2011, was approved by the NFA as a principal of the Sponsor on October 29, 2009, and was registered as an associated person of the Sponsor on February 17, 2010. He maintains his main business office at 232 Hidden Lake Road, Brattleboro, Vermont 05301 and is responsible for the overall strategic direction of the Sponsor and has general control of its business. Mr. Riker was Treasurer of the Sponsor from its inception until September 2011. From February 2005 to December 2012, Mr. Riker was the President of Cambial Emerging Markets LLC, a consulting company specializing in emerging market equity investment. As President of Cambial Emerging Markets LLC, Mr. Riker had responsibility for business strategy, planning and operations. From July 1996 to February 2005, Mr. Riker was a private investor. Mr. Riker is married to the Chief Financial Officer, Chief Accounting Officer and Chief Compliance Officer of the Sponsor, Barbara Riker. Mr. Riker is 59 years old.
Barbara Riker began working for the Sponsor in July 2010 providing accounting and compliance support. She has been the Chief Financial Officer, Chief Accounting Officer and Chief Compliance Officer for Teucrium since September 2011, was approved by the NFA as a principal of the Sponsor on October 19, 2011, and has a background in finance, accounting, investor relations, corporate communications and operations. She maintains her main business office at 232 Hidden Lake Road, Brattleboro, Vermont 05301. From September 1980 to February 1993, Ms. Riker worked in various financial capacities for Pacific Telesis Group, the California-based Regional Bell Operating Company, and its predecessors. In February 1993, with the spin-off of AirTouch Communications from Pacific Telesis Group, Ms. Riker was selected to lead the Investor Relations team for the global mobile phone operator. In her capacity as Executive Director – Investor Relations and Corporate Communications from February 1993 to June 1995, AirTouch completed its initial public offering and was launched as an independent publicly-traded company. In June 1995, she was named Chief Financial Officer of AirTouch International and, in addition to her other duties, served on the board of several of the firm’s joint ventures, both private and public, across Europe. In June 1997, Ms. Riker moved into an operations capacity as the District General Manager for AirTouch Paging’s San Francisco operations. In February 1998 she was named Vice President and General Manager of AirTouch Cellular for Arizona and New Mexico. Ms. Riker retired in July 1999, coincident with the purchase of AirTouch by Vodafone PLC and remained retired until she began working for the Sponsor. Ms. Riker graduated with a Bachelor of Science in Business Administration from Cal State – East Bay in 1980. Ms. Riker is married to the Chief Executive Officer of the Sponsor, Dale Riker. Ms. Riker is 58 years old.
Steve Kahler, Chief Operating Officer, began working for the Sponsor in November 2011 as Managing Director in the trading division. He became the Chief Operating Officer on May 24, 2012 and has primary responsibility for the Trade Operations for the Funds. He maintains his main business office at 13520 Excelsior Blvd., Minnetonka, MN 55345. Mr. Kahler was registered as an Associated Person of the Sponsor on November 25, 2011, approved as a Branch Manager of the Sponsor on March 16, 2012 and approved by the NFA as a Principal of the Sponsor on May 16, 2012. Since January 18, 2012, Mr. Kahler has been an associated person of the Distributor under the terms of the SASA between the Sponsor and the Distributor. Additional information regarding the SASA can be found in the section of this disclosure document entitled “Plan of Distribution.” Prior to his employment with the Sponsor, Mr. Kahler worked for Cargill Inc., an international producer and marketer of food, agricultural, financial and industrial products and services, from April 2006 until November 2011 in the Energy Division as Senior Petroleum Trader. In October 2006 and while employed at Cargill Inc., Mr. Kahler was approved as an Associated Person of Cargill Commodity Services Inc., a commodity trading affiliate of Cargill Inc. from September 13, 2006 to November 9, 2011. Mr. Kahler graduated from the University of Minnesota with a Bachelors of Agricultural Business Administration in 1992 and is 49 years old. Mr. Kahler is primarily responsible for making trading and investment decisions for the Fund and other Teucrium Funds, and for directing Fund and other Teucrium Fund trades for execution.
13
The third Class-A member of the Sponsor is the following:
Carl N. (Chuck) Miller III was approved by the NFA as a principal of the Sponsor on November 10, 2009 and was registered as an associated person of the Sponsor on April 19, 2010. He maintains his main business office at 232 Hidden Lake Road, Bldg A, Brattleboro, VT 05301. Mr. Miller has certain voting authority as a Class A member of the Sponsor as described above, but is not involved with the Sponsor’s day-to-day trading or operations or supervises people so engaged. For the period May 13, 2011 to July 24, 2014, Mr. Miller was an associated person of the Distributor under the terms of the SASA between the Sponsor and the Distributor. Additional information regarding the SASA can be found in the section of this disclosure document entitled “Plan of Distribution.”
Messrs. Gilbertie, Riker, Kahler and Miller and Ms. Riker are individual “principals,” as that term is defined in CFTC Rule 3.1, of the Sponsor. These individuals are principals due to their positions and/or due to their ownership interests in the Sponsor. Beneficial ownership interests of the principals, if any, are shown under the section entitled “Security Ownership of Principal Shareholders and Management” below and any of the principals may acquire beneficial interests in the Fund in the future. In addition, each of the three Class A members of the Sponsor are registered with the CFTC as associated persons of the Sponsor and are NFA associate members. GFI Group LLC is a principal for the Sponsor under CFTC Rules due to its ownership of certain non-voting securities of the Sponsor.
The Custodian and Administrator
In its capacity as the Fund’s custodian, the Custodian, currently U.S. Bank, N.A., holds the Funds’ securities, cash and/or cash equivalents pursuant to a custodial agreement. U.S. Bancorp Fund Services, LLC (“USBFS”), an entity affiliated with U.S. Bank, N.A., is the registrar and transfer agent for the Funds. In addition, USBFS also serves as Administrator for the Fund, performing certain administrative and accounting services and preparing certain SEC and CFTC reports on behalf of the Fund. For these services, the Fund pays fees to the Custodian and USBFS set forth in the table entitled “Contractual Fees and Compensation Arrangements with the Sponsor and Third-Party Service Providers.”
The Custodian is located at 1555 North RiverCenter Drive, Suite 302, Milwaukee, Wisconsin 53212. U.S. Bank N.A. is a nationally chartered bank, regulated by the Office of the Comptroller of the Currency, Department of the Treasury, and is subject to regulation by the Board of Governors of the Federal Reserve System. The principal address for USBFS is 615 East Michigan Street, Milwaukee, WI, 53202.
The Distributor
The Funds employ Foreside Fund Services, LLC as the Distributor for the Funds. The Distributor receives, for its services as distributor for the Funds, a fee at an annual rate of 0.01% of each Underlying Fund’s average daily net assets, and an annual fee of $100,000 in the aggregate for all of the Funds. These fees are set forth in the table entitled “Fees and Compensation Arrangements with the Sponsor and Non-Affiliated Service Providers.”
The Distribution Services Agreement among the Distributor, the Sponsor and the Trust calls for the Distributor to work with the Custodian in connection with the receipt and processing of orders for Creation Baskets and Redemption Baskets and the review and approval of all Fund sales literature and advertising materials. The Distributor and the Sponsor have also entered into a Securities Activities and Service Agreement (the “SASA”) under which certain employees and officers of the Sponsor are licensed as registered representatives or registered principals of the Distributor, under FINRA rules. As Registered Representatives of the Distributor, these persons are permitted to engage in certain marketing activities for the Fund that they would otherwise not be permitted to engage in. Under the SASA, the Sponsor is obligated to ensure that such marketing activities comply with applicable law and are permitted by the SASA and the Distributor’s internal procedures.
The Distributor’s principal business address is Three Canal Plaza, Suite 100, Portland, Maine 04101. The Distributor is a broker-dealer registered with the U.S. Securities and Exchange Commission and a member of the Financial Industry Regulatory Authority (“FINRA”).
The Trustee
The sole Trustee of the Trust is Wilmington Trust Company, a Delaware banking corporation. The Trustee’s principal offices are located at 1100 North Market Street, Wilmington, Delaware 19890-0001. The Trustee is unaffiliated with the Sponsor. The Trustee’s duties and liabilities with respect to the offering of Shares and the management of the Trust and the Fund are limited to its express obligations under the Trust Agreement.
The Trustee will accept service of legal process on the Trust in the State of Delaware and will make certain filings under the Delaware Statutory Trust Act. The Trustee does not owe any other duties to the Trust, the Sponsor or the Shareholders. The Trustee is permitted to resign upon at least sixty (60) days’ notice to the Sponsor. If no successor trustee has been appointed by the Sponsor within such sixty-day period, the Trustee may, at the expense of the Trust, petition a court to appoint a successor. The Trust Agreement provides that the Trustee is entitled to reasonable compensation for its services from the Sponsor or an affiliate of the Sponsor (including the Trust), and is indemnified by the Sponsor against any expenses it incurs relating to or arising out of the formation, operation or termination of the Trust, or any action or inaction of the Trustee under the Trust Agreement, except to the extent that such expenses result from the gross negligence or willful misconduct of the Trustee. The Sponsor has the discretion to replace the Trustee.
Under the Trust Agreement, the duty and authority to manage the business affairs of the Trust, and of all of the funds that are a series of the Trust, including control of the Fund and the Underlying Funds, is vested solely with the Sponsor, which the Sponsor may delegate as provided for in the Trust Agreement. The Trustee has no duty or liability to supervise or monitor the performance of the Sponsor, nor does the Trustee have any liability for the acts or omissions of the Sponsor. As the Trustee has no authority over the operation of the Trust, the Trustee itself is not registered in any capacity with the CFTC.
14
The Clearing Brokers
In 2014 and 2013, Newedge USA, LLC (“Newedge USA”) served as the Funds’ futures commission merchant (“FCM”) and primary clearing broker to execute and clear the Funds’ futures transactions and provide other brokerage-related services. In 2014, the Funds introduced the use of Jefferies LLC (“Jefferies”), for the execution and clearing of the Funds’ futures and options, if any, on futures transactions. On January 2, 2015, Newedge USA, LLC (“Newedge USA”) merged with and into SG Americas Securities, LLC (“SG”), with the latter as the surviving entity.
On February 6, 2015 Jefferies LLC (“Jefferies”) became the Funds’ FCM and primary clearing broker. All futures contracts held by SG were transferred to Jefferies on that date. As of February 23, 2015 all residual cash balances held at SG had been transferred to Jefferies and the balance in all SG accounts was $0.
Effective June 3, 2015, ED&F Man Capital Markets Inc. (“ED&F Man”) replaced Jefferies as the Funds’ FCM and the clearing broker to execute and clear the Funds’ futures and provide other brokerage-related services, other than services for TAGS. As of June 4, 2015 all futures contracts and residual cash balances held at Jefferies had been transferred to ED&F Man and the balance in all Jefferies accounts was $0.
ED&F Man is registered as a FCM with the U.S. CFTC and is a member of the NFA. ED&F Man is also registered as a broker/dealer with the U.S. Securities and Exchange Commission and is a member of the FINRA. ED&F Man is a clearing member of ICE Futures U.S., Inc., Chicago Board of Trade, Chicago Mercantile Exchange, New York Mercantile Exchange, and all other major United States commodity exchanges. There have been no material civil, administrative, or criminal proceedings pending, on appeal, or concluded against E D & F Man Capital Markets Inc. or its principals in the past five (5) years.
The Bank of New York Mellon Capital Markets is the broker for some, but not all, of the equity transactions related to the purchase and sale of the Underlying Funds for TAGS.
Contractual Fees and Compensation Arrangements with the Sponsor and Third-Party Service Providers
| Service Provider | Compensation Paid by the Funds | |
| Teucrium Trading, LLC, Sponsor | 1.00% of average net assets annually | |
U.S. Bank N.A., Custodian
U.S. Bancorp Fund Services, Transfer Agent, Fund Accountant and Fund Administrator
|
For custody services: 0.0075% of average gross assets up to $1 billion, and .0050% of average gross assets over $1 billion, annually, plus certain per-transaction charges
For Transfer Agency, Fund Accounting and Fund Administration services, based on the total assets for all the Funds in the Trust: 0.06% of average gross assets on the first $250 million, 0.05% on the next $250 million, 0.04% on the next $500 million and 0.03% on the balance over $1 billion annually. A combined minimum annual fee of $64,500 for custody, transfer agency, accounting and administrative services is assessed per Fund.
| |
| Foreside Fund Services, LLC, Distributor | The Distributor receives a fee of 0.01% of each Fund’s average daily net assets and an aggregate annual fee of $100,000 for all Funds, along with certain expense reimbursements currently estimated at $3,000 per year related to these services.
Under the Securities Activities and Service Agreement (the “SASA”), the Distributor receives compensation from the fund for its activities on behalf of all the Funds. The fees paid to the Distributor pursuant to the SASA for the offerings of the Funds are not expected to exceed a combined $40,000 per year. In addition, the Distributor receives certain expense reimbursements relating to the registration, continuing education and other administrative expenses of the Registered Representatives in relation to the Funds. These expense reimbursements are estimated not to exceed $25,000 per year.
| |
ED&F Man Capital Markets, Inc.
|
$4.50 per half-turn Futures Contract purchase or sale for corn, soybeans, wheat and sugar.
| |
| Wilmington Trust Company, Trustee | $3,300 annually for the Trust |
15
Asset-based fees are calculated on a daily basis (accrued at 1/365 of the applicable percentage of NAV on that day) and paid on
a monthly basis. NAV is calculated by taking the current market value of the Fund’s total assets and subtracting
any liabilities.
For each of the contractual agreements discussed above, the expense recognized in 2016 by the Trust and each Fund is detailed in the notes to the financial statements included in Part II of this filing.
Form of Shares
Registered Form
For all the Funds, Shares are issued in registered form in accordance with the Trust Agreement. USBFS has been appointed registrar and transfer agent for the purpose of transferring Shares in certificated form. USBFS keeps a record of all Shareholders and holders of the Shares in certificated form in the registry (Register). The Sponsor recognizes transfers of Shares in certificated form only if done in accordance with the Trust Agreement. The beneficial interests in such Shares are held in book-entry form through participants and/or accountholders in DTC.
Book Entry
For all Funds, individual certificates are not issued for the Shares. Instead, Shares are represented by one or more global certificates, which are deposited by the Administrator with DTC and registered in the name of Cede & Co., as nominee for DTC. The global certificates evidence all of the Shares outstanding at any time. Shareholders are limited to (1) participants in DTC such as banks, brokers, dealers and trust companies (DTC Participants), (2) those who maintain, either directly or indirectly, a custodial relationship with a DTC Participant (Indirect Participants), and (3) those who hold interests in the Shares through DTC Participants or Indirect Participants, in each case who satisfy the requirements for transfers of Shares. DTC Participants acting on behalf of investors holding Shares through such participant accounts in DTC will follow the delivery practice applicable to securities eligible for DTC’s Same-Day Funds Settlement System. Shares are credited to DTC Participants securities accounts following confirmation of receipt of payment.
DTC
DTC has advised us as follows: It is a limited purpose trust company organized under the laws of the State of New York and is a member of the Federal Reserve System, a “clearing corporation” within the meaning of the New York Uniform Commercial Code and a “clearing agency” registered pursuant to the provisions of Section 17A of the Exchange Act. DTC holds securities for DTC Participants and facilitates the clearance and settlement of transactions between DTC Participants through electronic book-entry changes in accounts of DTC Participants.
Transfer of Shares
For all Funds, the Shares are only transferable through the book-entry system of DTC. Shareholders who are not DTC Participants may transfer their Shares through DTC by instructing the DTC Participant holding their Shares (or by instructing the Indirect Participant or other entity through which their Shares are held) to transfer the Shares. Transfers are made in accordance with standard securities industry practice.
Transfers of interests in Shares with DTC are made in accordance with the usual rules and operating procedures of DTC and the nature of the transfer. DTC has established procedures to facilitate transfers among the participants and/or accountholders of DTC. Because DTC can only act on behalf of DTC Participants, who in turn act on behalf of Indirect Participants, the ability of a person or entity having an interest in a global certificate to pledge such interest to persons or entities that do not participate in DTC, or otherwise take actions in respect of such interest, may be affected by the lack of a certificate or other definitive document representing such interest.
DTC has advised us that it will take any action permitted to be taken by a Shareholder (including, without limitation, the presentation of a global certificate for exchange) only at the direction of one or more DTC Participants in whose account with DTC interests in global certificates are credited and only in respect of such portion of the aggregate principal amount of the global certificate as to which such DTC Participant or Participants has or have given such direction.
Creation and Redemption of Shares
The Funds create and redeem Shares from time to time, but only in one or more Creation Baskets or Redemption Baskets. The creation and redemption of baskets are only made in exchange for delivery to the Funds or the distribution by the Funds of the amount of cash equal to the combined NAV of the number of Shares included in the baskets being created or redeemed determined as of 4:00 p.m. New York time on the day the order to create or redeem baskets is properly received.
Authorized Purchasers are the only persons that may place orders to create and redeem baskets. Authorized Purchasers must be (1) either registered broker-dealers or other securities market participants, such as banks and other financial institutions, that are not required to register as broker-dealers to engage in securities transactions, and (2) DTC Participants. To become an Authorized Purchaser, a person must enter into an Authorized Purchaser Agreement with the Sponsor. The Authorized Purchaser Agreement provides the procedures for the creation and redemption of baskets and for the delivery of the cash required for such creations and redemptions. The Authorized Purchaser Agreement and the related procedures attached thereto may be amended by the Sponsor, without the consent of any Shareholder or Authorized Purchaser. Authorized Purchasers pay a transaction fee to the Sponsor for each order they place to create one or more baskets and a fee per basket when they redeem baskets.
16
Authorized Purchasers who make deposits with a Fund in exchange for baskets receive no fees, commissions or other form of compensation or inducement of any kind from either the Trust or the Sponsor, and no such person will have any obligation or responsibility to the Trust or the Sponsor to effect any sale or resale of Shares.
Certain Authorized Purchasers are expected to be capable of investing directly in the Specified Commodities or the Commodity Interest markets. Some Authorized Purchasers or their affiliates may from time to time buy or sell the Specified Commodity or Commodity Interests and may profit in these instances.
Each Authorized Purchaser will be required to be registered as a broker-dealer under the 1934 Act and a member in good standing with FINRA, or be exempt from being or otherwise not required to be registered as a broker-dealer or a member of FINRA, and will be qualified to act as a broker or dealer in the states or other jurisdictions where the nature of its business so requires. Certain Authorized Purchasers may also be regulated under federal and state banking laws and regulations. Each Authorized Purchaser has its own set of rules and procedures, internal controls and information barriers as it determines is appropriate in light of its own regulatory regime.
Under the Authorized Purchaser Agreement, the Sponsor has agreed to indemnify the Authorized Purchasers against certain liabilities, including liabilities under the 1933 Act, and to contribute to the payments the Authorized Purchasers may be required to make in respect of those liabilities.
Minimum Number of Shares
There are a minimum number of baskets and associated shares specified for each Fund in the Fund’s respective prospectus as amended from time to time. Once the minimum number of baskets is reached, there can be no more redemptions until there has been a creation basket. As of December 31, 2016 these minimum levels are as follows:
CORN: 50,000 shares representing 2 baskets (3,900,004 shares outstanding as of December 31, 2016; 3,675,004 shares outstanding as of March 13, 2017)
SOYB: 50,000 shares representing 2 baskets (675,004 shares outstanding as of December 31, 2016; 650,004 shares outstanding as of March 13, 2017)
CANE: 50,000 shares representing 2 baskets (425,004 shares outstanding as of December 31, 2016; 475,004 shares outstanding as of March 13, 2017)
WEAT: 50,000 shares representing 2 baskets (9,050,004 shares outstanding as of December 31, 2016; 9,400,004 shares outstanding as of March 13, 2017)
TAGS: 50,000 shares representing 2 baskets (minimum level of shares outstanding as of December 31, 2016 and as of March 13, 2017)
If a Fund has not more than the minimum number of shares outstanding, this means that there can be no redemptions of shares until there is a creation of shares or unless the Sponsor has reason to believe that the placer of the redemption order does in fact possess all the outstanding Shares in the Fund and can deliver them. When there can be no redemption of shares, the price of the Fund, as represented by the bid and the ask, compared to the NAV may diverge more than would be the case if redemptions could occur.
The following description of the procedures for the creation and redemption of baskets is only a summary and an investor should refer to the relevant provisions of the Trust Agreement and the form of Authorized Purchaser Agreement for more detail, each of which has been incorporated by reference as an exhibit to the registration statement for each of the Funds.
17
The Flow of Shares
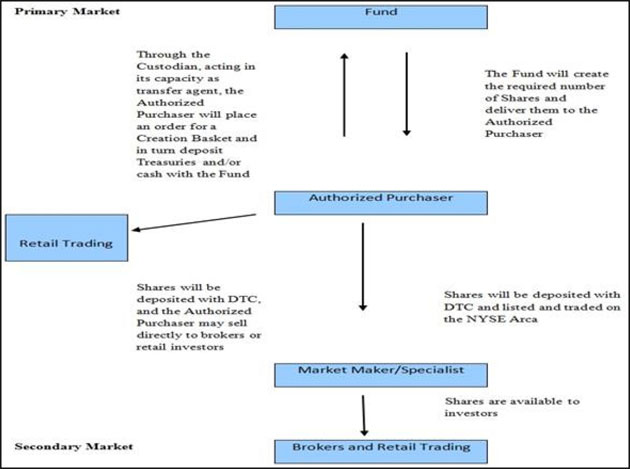
18
Calculating the Net Asset Value
The NAV of each Fund is calculated by:
| • | Taking the current market value of its total assets, and |
| • | Subtracting any liabilities. |
The Administrator calculates the NAV of each Fund once each trading day. It calculates NAV as of the earlier of the close of the New York Stock Exchange or 4:00 p.m., New York time. The NAV for a particular trading day will be released after 4:15 p.m., New York time.
In determining the value of the Futures Contracts for each Fund, the Administrator uses the closing price on the exchange on which the commodity is traded, commonly referred to as the settlement price. The time of settlement for each exchange is determined by that exchange and may change from time to time. The current settlement time for each exchange can be found at the appropriate website which are:
1) for the CBOT (CORN, SOYB and WEAT) http://www.cmegroup.com/trading_hours/commodities-hours.html;
2) for ICE (CANE) http://www.theice.com/productguide/Search.shtml?tradingHours=.
The Administrator determines the value of all other investments for each Fund as of the earlier of the close of the New York Stock Exchange or 4:00 p.m., New York time, in accordance with the current Services Agreement between the Administrator and the Trust.
The value of over-the-counter Commodity Interests will be determined based on the value of the commodity or Futures Contract underlying such Commodity Interest, except that a fair value may be determined if the Sponsor believes that a Fund is subject to significant credit risk relating to the counterparty to such Commodity Interest. For purposes of financial statements and reports, the Sponsor will recalculate the NAV of a specific Fund where necessary to reflect the “fair value” of a Futures Contract when the Futures Contract of such Fund closes at its price fluctuation limit for the day. Treasury Securities held by the Fund are valued by the Administrator using values received from recognized third-party vendors (such as Reuters) and dealer quotes. The NAV includes any unrealized profit or loss on open Commodity Interests and any other credit or debit accruing to each Fund but unpaid or not received by the Fund.
In addition, in order to provide updated information relating to the Funds for use by investors and market professionals, the NYSE Arca calculates and disseminates throughout the trading day an updated indicative fund value for each Fund. The indicative fund value is calculated by using the prior day’s closing NAV per share of the Fund as a base and updating that value throughout the trading day to reflect changes in the value of the Fund’s Commodity Interests during the trading day. Changes in the value of Treasury Securities and cash equivalents will not be included in the calculation of indicative value. For this and other reasons, the indicative fund value disseminated during NYSE Arca trading hours should not be viewed as an actual real time update of the NAV for each Fund. The NAV is calculated only once at the end of each trading day.
The indicative fund value is disseminated on a per share basis every 15 seconds during regular NYSE Arca trading hours of 9:30 a.m., New York time, to 4:00 p.m., New York time. The CBOT and the ICE are generally open for trading only during specified hours which vary by exchange and may be adjusted by the exchange. However, the futures markets on these exchanges do not currently operate twenty-four hours per day. In addition, there may be some trading hours which may be limited to electronic trading only. This means that there is a gap in time at the beginning and the end of each day during which the Fund’s Shares are traded on the NYSE Arca, when, for example, real-time CBOT trading prices for Corn Futures Contracts traded on such Exchange are not available. As a result, during those gaps there will be no update to the indicative fund values. The most current trading hours for each exchange may be found on the website of that exchange as listed above.
The NYSE Arca disseminates the indicative fund value through the facilities of CTA/CQ High Speed Lines. In addition, the indicative fund value is published on the NYSE Arca’s website and is available through on-line information services such as Bloomberg and Reuters.
Dissemination of the indicative fund values provides additional information that is not otherwise available to the public and is useful to investors and market professionals in connection with the trading of Shares of the Funds on the NYSE Arca. Investors and market professionals are able throughout the trading day to compare the market price of each Fund and its indicative fund value. If the market price of the Shares of a Fund diverges significantly from the indicative fund value, market professionals may have an incentive to execute arbitrage trades. For example, if the Fund appears to be trading at a discount compared to the indicative fund value, a market professional could buy Fund Shares on the NYSE Arca, aggregate them into Redemption Baskets, and receive the NAV of such Shares by redeeming them to the Trust, provided that there is not a minimum number of shares outstanding for the Fund. Such arbitrage trades can tighten the tracking between the market price of the Fund and the indicative fund value.
Creation Procedures
On any business day, an Authorized Purchaser may place an order with the transfer agent to create one or more baskets for a Fund. For purposes of processing purchase and redemption orders, a “business day” means any day other than a day when any of the NYSE Arca, CBOT, ICE, or the New York Stock Exchange is closed for regular trading. Purchase orders must be placed by noon New York time or the close of regular trading on the New York Stock Exchange, whichever is earlier for CANE and TAGS by 1:15pm New York time or the close of regular trading on the New York Stock Exchange, whichever is earlier for CORN, SOYB and WEAT. The day on which the transfer agent and Distributor receive a valid purchase order is referred to as the purchase order date.
19
By placing a purchase order, an Authorized Purchaser agrees to deposit Treasury Securities, cash, commodity futures or shares of the Underlying Funds or a combination thereof with the Trust, as described below. Prior to the delivery of baskets for a purchase order, the Authorized Purchaser must also have wired to the Custodian the non-refundable transaction fee due for the purchase order. Authorized Purchasers may not withdraw a purchase order without the prior consent of the Sponsor in its discretion.
Determination of Required Deposits
The total deposit required to create each basket (Creation Basket Deposit) is the amount of Treasury Securities, cash and/or commodity futures that is in the same proportion to the total assets of the applicable Fund (net of estimated accrued but unpaid fees, expenses and other liabilities) on the purchase order date as the number of Shares to be created under the purchase order is in proportion to the total number of Shares outstanding on the purchase order date. The Sponsor determines, directly in its sole discretion or in consultation with the Custodian and the Administrator, the requirements for Treasury Securities, cash and/or commodity futures, including the remaining maturities of the Treasury Securities and portions of Treasury Securities, that may be included in deposits to create baskets. If Treasury Securities are to be included in a Creation Basket Deposit for orders placed on a given business day, the Administrator will publish an estimate of the Creation Basket Deposit requirements at the beginning of such day.
Delivery of Required Deposits
An Authorized Purchaser who places a purchase order is responsible for transferring to the account of that Fund with the Custodian the required amount of securities, commodity futures and/or cash by the end of the next business day following the purchase order date or by the end of such later business day, not to exceed three business days after the purchase order date, as agreed to between the Authorized Purchaser and the Custodian when the purchase order is placed (the “Purchase Settlement Date”). Upon receipt of the deposit amount, the Custodian will direct DTC to credit the number of baskets ordered for the specific Fund to the Authorized Purchaser’s DTC account on the Purchase Settlement Date.
Because orders to purchase baskets must be placed by noon or 1:15pm, New York time, depending on the Fund, but the total payment required to create a basket during the continuous offering period will not be determined until 4:00 p.m., New York time, on the date the purchase order is received, Authorized Purchasers will not know the total amount of the payment required to create a basket at the time they submit an irrevocable purchase order for the basket. The Fund’s NAV and the total amount of the payment required to create a basket could rise or fall substantially between the time an irrevocable purchase order is submitted and the time the amount of the purchase price in respect thereof is determined.
Rejection of Purchase Orders
The Sponsor acting by itself or through the Distributor or transfer agent may reject a purchase order or a Creation Basket Deposit if:
● it determines that, due to position limits or otherwise, investment alternatives that will enable the Fund to meet its investment objective are not available or practicable at that time;
● it determines that the purchase order or the Creation Basket Deposit is not in proper form;
● it believes that acceptance of the purchase order or the Creation Basket Deposit would have adverse tax consequences to the Fund or its Shareholders;
● the acceptance or receipt of the Creation Basket Deposit would, in the opinion of counsel to the Sponsor, be unlawful;
● circumstances outside the control of the Sponsor, Distributor or transfer agent make it, for all practical purposes, not feasible to process creations of baskets;
● there is a possibility that any or all of the Benchmark Component Futures Contracts of the Fund on the CBOT from which the NAV of the Fund is calculated will be priced at a daily price limit restriction; or
● if, in the sole discretion of the Sponsor, the execution of such an order would not be in the best interest of the Fund or its Shareholders.
None of the Sponsor, Distributor or transfer agent will be liable for the rejection of any purchase order or Creation Basket Deposit.
In addition, the Sponsor may reject a previously placed purchase order at any time prior to the order cut-off time, if in the sole discretion of the Sponsor the execution of such an order would not be in the best interest of a Fund or its Shareholders.
Redemption Procedures
The procedures by which an Authorized Purchaser can redeem one or more baskets mirror the procedures for the creation of baskets. On any business day, an Authorized Purchaser may place an order with the Distributor to redeem one or more baskets. Redemption orders must be placed by noon or 1:15 pm, New York time, depending on the Fund, or the close of regular trading on the New York Stock Exchange, whichever is earlier. A redemption order so received will be effective on the date it is received in satisfactory form by the transfer agent and Distributor. The redemption procedures allow Authorized Purchasers to redeem baskets and do not entitle an individual Shareholder to redeem any Shares in an amount less than a Redemption Basket, or to redeem baskets other than through an Authorized Purchaser. By placing a redemption order, an Authorized Purchaser agrees to deliver the baskets to be redeemed through DTC’s book-entry system to a Fund by the end of the next business day following the effective date of the redemption order for all funds other than TAGS or by the end of the third business day for TAGS, or by the end of such later business day, not to exceed three business days after the effective date of the redemption order, as agreed to between the Authorized Purchaser, transfer agent and the Distributor when the redemption order is placed (the “Redemption Settlement Date”). Prior to the delivery of the redemption distribution for a redemption order, the Authorized Purchaser must also have wired to the Sponsor’s account at the Custodian the non-refundable transaction fee due for the redemption order. An Authorized Purchaser may not withdraw a redemption order without the prior consent of the Sponsor in its discretion.
20
Determination of Redemption Distribution
The redemption distribution from a Fund will consist of a transfer to the redeeming Authorized Purchaser of an amount of securities, commodity futures and/or cash that is in the same proportion to the total assets of the Fund (net of estimated accrued but unpaid fees, expenses and other liabilities) on the date the order to redeem is properly received as the number of Shares to be redeemed under the redemption order is in proportion to the total number of Shares outstanding on the date the order is received. The Sponsor, directly or in consultation with the Custodian and Administrator, determines the requirements for securities, commodity futures and/or cash, including the remaining maturities of the Treasury Securities and proportions of Treasury Securities and cash that may be included in distributions to redeem baskets. If Treasury Securities are to be included in a redemption distribution for orders placed on a given business day, the Administrator will publish an estimate of the redemption distribution composition as of the beginning of such day.
Delivery of Redemption Distribution
The redemption distribution due from a Fund will be delivered to the Authorized Purchaser on the Redemption Settlement Date if the Fund’s DTC account has been credited with the baskets to be redeemed. If the Fund’s DTC account has not been credited with all of the baskets to be redeemed by the end of such date, the redemption distribution will be delivered to the extent of whole baskets received. Any remainder of the redemption distribution will be delivered on the next business day after the Redemption Settlement Date to the extent of remaining whole baskets received if the Sponsor receives the fee applicable to the extension of the Redemption Settlement Date which the Sponsor may, from time to time, determine and the remaining baskets to be redeemed are credited to the Fund’s DTC account on such next business day. Any further outstanding amount of the redemption order shall be cancelled. Pursuant to information from the Sponsor, the Custodian will also be authorized to deliver the redemption distribution notwithstanding that the baskets to be redeemed are not credited to the Fund’s DTC account by noon New York time on the Redemption Settlement Date if the Authorized Purchaser has collateralized its obligation to deliver the baskets through DTC’s book entry-system on such terms as the Sponsor may from time to time determine.
Suspension or Rejection of Redemption Orders
The Sponsor may, in its discretion, suspend the right of redemption, or postpone the redemption settlement date, (1) for any period during which the NYSE Arca, CBOT or ICE is closed other than customary weekend or holiday closings, or trading on the NYSE Arca or any of the applicable exchanges, is suspended or restricted, (2) for any period during which an emergency exists as a result of which delivery, disposal or evaluation of Treasury Securities is not reasonably practicable, (3) for such other period as the Sponsor determines to be necessary for the protection of the Shareholders, (4) if there is a possibility that any or all of the Benchmark Component Futures Contracts of the applicable Fund on the exchange from which the NAV of the Fund is calculated will be priced at a daily price limit restriction, or (5) if, in the sole discretion of the Sponsor, the execution of such an order would not be in the best interest of the Fund or its Shareholders.
For example, the Sponsor may determine that it is necessary to suspend redemptions to allow for the orderly liquidation of a Fund’s assets at an appropriate value to fund a redemption. If the Sponsor has difficulty liquidating a Fund’s positions, e.g., because of a market disruption event in the futures markets or an unanticipated delay in the liquidation of a position in an over-the-counter contract, it may be appropriate to suspend redemptions until such time as such circumstances are rectified. None of the Sponsor, the Distributor, or the transfer agent will be liable to any person or in any way for any loss or damages that may result from any such suspension or postponement.
Redemption orders must be made in whole baskets. The Sponsor will reject a redemption order if the order is not in proper form as described in the Authorized Purchaser Agreement or if the fulfillment of the order, in the opinion of its counsel, might be unlawful. The Sponsor may also reject a redemption order if the number of Shares being redeemed would reduce the remaining outstanding Shares below the minimum levels established or less, unless the Sponsor has reason to believe that the placer of the redemption order does in fact possess all the outstanding Shares and can deliver them. The minimum number of shares for each Fund is presented above in the section titled Minimum Number of Shares.
Creation and Redemption Transaction Fees
To compensate the Sponsor for its expenses in connection with the creation and redemption of baskets, an Authorized Purchaser is required to pay a transaction fee to the Sponsor. The fees for all Funds as of December 31, 2016 are a flat $250 per creation or redemption order.
The transaction fees may be reduced, increased or otherwise changed by the Sponsor.
21
Tax Responsibility
Authorized Purchasers are responsible for any transfer tax, sales or use tax, stamp tax, recording tax, value added tax or similar tax or governmental charge applicable to the creation or redemption of baskets, regardless of whether or not such tax or charge is imposed directly on the Authorized Purchaser, and agree to indemnify the Sponsor and the Fund if they are required by law to pay any such tax, together with any applicable penalties, additions to tax and interest thereon.
The Trust Agreement
The following paragraphs are a summary of certain provisions of the Trust Agreement. The following discussion is qualified in its entirety by reference to the Trust Agreement.
Authority of the Sponsor
The Sponsor is generally authorized to perform all acts deemed necessary to carry out the purposes of the Trust and to conduct the business of the Trust. The Trust and the Funds will continue to exist until terminated in accordance with the Trust Agreement. The Sponsor’s authority includes, without limitation, the right to take the following actions:
● To enter into, execute, deliver and maintain contracts, agreements and any other documents as may be in furtherance of the Trust’s purpose or necessary or appropriate for the offer and sale of the Shares and the conduct of Trust activities;
● To establish, maintain, deposit into, sign checks and otherwise draw upon accounts on behalf of the Trust with appropriate banking and savings institutions, and execute and accept any instrument or agreement incidental to the Trust’s business and in furtherance of its purposes;
● To supervise the preparation and filing of any registration statement (and supplements and amendments thereto) for the Fund;
● To adopt, implement or amend, from time to time, such disclosure and financial reporting, information gathering and control policies and procedures as are necessary or desirable to ensure compliance with applicable disclosure and financial reporting obligations under any applicable securities laws;
● To make any necessary determination or decision in connection with the preparation of the Trust’s financial statements and amendments thereto;
● To prepare, file and distribute, if applicable, any periodic reports or updates that may be required under the 1934 Act, the Commodity Exchange Act (the “CEA”) or rules and regulations promulgated thereunder;
● To pay or authorize the payment of distributions to the Shareholders and expenses of the Fund;
● To make any elections on behalf of the Trust under the Code, or any other applicable U.S. federal or state tax law as the Sponsor shall determine to be in the best interests of the Trust; and
● In its sole discretion, to determine to admit an affiliate or affiliates of the Sponsor as additional Sponsors.
The Sponsor’s Obligations
In addition to the duties imposed by the Delaware Trust Statute, under the Trust Agreement the Sponsor has the following obligations as a sponsor of the Trust:
● Devote to the business and affairs of the Trust such of its time as it determines in its discretion (exercised in good faith) to be necessary for the benefit of the Trust and the Shareholders of the Fund;
● Execute, file, record and/or publish all certificates, statements and other documents and do any and all other things as may be appropriate for the formation, qualification and operation of the Trust and for the conduct of its business in all appropriate jurisdictions;
● Appoint and remove independent public accountants to audit the accounts of the Trust and employ attorneys to represent the Trust;
● Use its best efforts to maintain the status of the Trust as a statutory trust for state law purposes and as a partnership for U.S. federal income tax purposes;
● Invest, reinvest, hold uninvested, sell, exchange, write options on, lease, lend and, subject to certain limitations set forth in the Trust Agreement, pledge, mortgage, and hypothecate the estate of the Fund in accordance with the purposes of the Trust and any registration statement filed on behalf of the Fund;
● Have fiduciary responsibility for the safekeeping and use of the Trust’s assets, whether or not in the Sponsor’s immediate possession or control;
● Enter into and perform agreements with each Authorized Purchaser, receive from Authorized Purchasers and process properly submitted purchase orders, receive Creation Basket Deposits, deliver or cause the delivery of Creation Baskets to the Depository for the account of the Authorized Purchaser submitting a purchase order;
22
● Receive from Authorized Purchasers and process, or cause the Distributor or other Fund service provider to process, properly submitted redemption orders, receive from the redeeming Authorized Purchasers through the Depository, and thereupon cancel or cause to be cancelled, Shares corresponding to the Redemption Baskets to be redeemed;
● Interact with the Depository; and
● Delegate duties to one or more administrators, as the Sponsor determines
To the extent that, at law (common or statutory) or in equity, the Sponsor has duties (including fiduciary duties) and liabilities relating thereto to the Trust, or the Funds the Shareholders or to any other person, the Sponsor will not be liable to the Trust or the Funds, the Shareholders or to any other person for its good faith reliance on the provisions of the Trust Agreement unless such reliance constitutes gross negligence or willful misconduct on the part of the Sponsor.
Liability and Indemnification
Under the Trust Agreement, the Sponsor, the Trustee and their respective Affiliates (collectively, “Covered Persons”) shall have no liability to the Trust, the Fund, or to any Shareholder for any loss suffered by the Trust or the Fund which arises out of any action or inaction of such Covered Person if such Covered Person, in good faith, determined that such course of conduct was in the best interest of the Trust or the Fund and such course of conduct did not constitute gross negligence or willful misconduct of such Covered Person. Subject to the foregoing, neither the Sponsor nor any other Covered Person shall be personally liable for the return or repayment of all or any portion of the capital or profits of any Shareholder or assignee thereof, it being expressly agreed that any such return of capital or profits made pursuant to the Trust Agreement shall be made solely from the assets of the applicable Teucrium Fund without any rights of contribution from the Sponsor or any other Covered Person. A Covered Person shall not be liable for the conduct or willful misconduct of any administrator or other delegatee selected by the Sponsor with reasonable care, provided, however, that the Trustee and its Affiliates shall not, under any circumstances be liable for the conduct or willful misconduct of any administrator or other delegatee or any other person selected by the Sponsor to provide services to the Trust.
To the extent that, at law (common or statutory) or in equity, the Sponsor has duties (including fiduciary duties) and liabilities relating to the Trust, the Funds, the shareholders of the Funds, or to any other person, the Sponsor, acting under the Trust Agreement, shall not be liable to the Trust, the Funds, the shareholders of the Funds or to any other person for its good faith reliance on the provisions of the Trust Agreement. The provisions of the Trust Agreement, to the extent they restrict or eliminate the duties and liabilities of the Sponsor otherwise existing at law or in equity, replace such other duties and liabilities of the Sponsor.
The Trust Agreement also provides that the Sponsor shall be indemnified by the Trust (or by a series separately to the extent the matter in question relates to a single series or disproportionately affects a specific series in relation to other series) against any losses, judgments, liabilities, expenses and amounts paid in settlement of any claims sustained by it in connection with its activities for the Trust, provided that (i) the Sponsor was acting on behalf of or performing services for the Trust and has determined, in good faith, that such course of conduct was in the best interests of the Trust and such liability or loss was not the result of gross negligence, willful misconduct, or a breach of the Trust Agreement on the part of the Sponsor and (ii) any such indemnification will only be recoverable from the assets of the applicable series. The Sponsor’s rights to indemnification permitted under the Trust Agreement shall not be affected by the dissolution or other cessation to exist of the Sponsor, or the withdrawal, adjudication of bankruptcy or insolvency of the Sponsor, or the filing of a voluntary or involuntary petition in bankruptcy under Title 11 of the Bankruptcy Code by or against the Sponsor.
Notwithstanding the above, the Sponsor shall not be indemnified for any losses, liabilities or expenses arising from or out of an alleged violation of U.S. federal or state securities laws unless (i) there has been a successful adjudication on the merits of each count involving alleged securities law violations as to the particular indemnitee and the court approves the indemnification of such expenses (including, without limitation, litigation costs), (ii) such claims have been dismissed with prejudice on the merits by a court of competent jurisdiction as to the particular indemnitee and the court approves the indemnification of such expenses (including, without limitation, litigation costs), or (iii) a court of competent jurisdiction approves a settlement of the claims against a particular indemnitee and finds that indemnification of the settlement and related costs should be made.
The payment of any indemnification shall be allocated, as appropriate, among the Trust’s series. The Trust and its series shall not incur the cost of that portion of any insurance which insures any party against any liability, the indemnification of which is prohibited under the Trust Agreement.
Expenses incurred in defending a threatened or pending action, suit or proceeding against the Sponsor shall be paid by the Trust in advance of the final disposition of such action, suit or proceeding, if (i) the legal action relates to the performance of duties or services by the Sponsor on behalf of the Trust; (ii) the legal action is initiated by a party other than the Trust; and (iii) the Sponsor undertakes to repay the advanced funds with interest to the Trust in cases in which it is not entitled to indemnification.
The Trust Agreement provides that the Sponsor and the Trust shall indemnify the Trustee and its successors, assigns, legal representatives, officers, directors, shareholders, employees, agents and servants (the “Trustee Indemnified Parties”) against any liabilities, obligations, losses, damages, penalties, taxes, claims, actions, suits, costs, expenses or disbursements which may be imposed on a Trustee Indemnified Party relating to or arising out of the formation, operation or termination of the Trust, the execution, delivery and performance of any other agreements to which the Trust is a party, or the action or inaction of the Trustee under the Trust Agreement or any other agreement, except for expenses resulting from the gross negligence or willful misconduct of a Trustee Indemnified Party. Further, certain officers of the Sponsor are insured against liability for certain errors or omissions which an officer may incur or that may arise out of his or her capacity as such.
23
In the event the Trust is made a party to any claim, dispute, demand or litigation or otherwise incurs any liability or expense as a result of or in connection with any Shareholder’s (or assignee’s) obligations or liabilities unrelated to the Trust business, such Shareholder (or assignees cumulatively) is required under the Trust Agreement to indemnify the Trust for all such liability and expense incurred, including attorneys’ and accountants’ fees.
Withdrawal of the Sponsor
The Sponsor may withdraw voluntarily as the Sponsor of the Trust only upon ninety (90) days’ prior written notice to the holders of the Trust’s outstanding shares and the Trustee. If the withdrawing Sponsor is the last remaining Sponsor, shareholders holding a majority (over 50%) of the outstanding shares of the Funds voting together as a single class (not including shares acquired by the Sponsor through its initial capital contribution) may vote to elect a successor Sponsor. The successor Sponsor will continue the business of the Trust. Shareholders have no right to remove the Sponsor.
In the event of withdrawal, the Sponsor is entitled to a redemption of the shares it acquired through its initial capital contribution to any of the series of the Trust at their NAV per share. If the Sponsor withdraws and a successor Sponsor is named, the withdrawing Sponsor shall pay all expenses as a result of its withdrawal.
Meetings
Meetings of the Shareholders of the Trust’s Series may be called by the Sponsor and will be called by it upon the written request of Shareholders holding at least 25% of the Shares of the Trust or a Fund, as applicable (not including Shares acquired by the Sponsor through its initial capital contribution), to vote on any matter with respect to which Shareholders have a right to vote under the Trust Agreement. The Sponsor shall deposit in the United States mail or electronically transmit written notice to all Shareholders of a Fund of the meeting and the purpose of the meeting, which shall be held on a date not less than 30 nor more than 60 days after the date of mailing of such notice, at a reasonable time and place. When the meeting is being requested by Shareholders, the notice of the meeting shall be mailed or transmitted within 45 days after receipt of the written request from Shareholders. Any notice of meeting shall be accompanied by a description of the action to be taken at the meeting. Shareholders may vote in person or by proxy at any such meeting. Any action required or permitted to be taken by Shareholders by vote may be taken without a meeting by written consent setting forth the actions so taken. Such written consents shall be treated for all purposes as votes at a meeting. If the vote or consent of any Shareholder to any action of the Trust, a Fund, the Funds or any Shareholder, as contemplated by the Trust Agreement, is solicited by the Sponsor, the solicitation shall be effected by notice to each Shareholder given in the manner provided in accordance with the Trust Agreement.
Voting Rights
Shareholders have very limited voting rights. Specifically, the Trust Agreement provides that shareholders of the Funds holding shares representing at least a majority (over 50%) of the outstanding shares of the Funds voting together as a single class (excluding shares acquired by the Sponsor in connection with its initial capital contribution to any Trust series) may vote to (i) continue the Trust by electing a successor Sponsor as described above, and (ii) approve amendments to the Trust Agreement that impair the right to surrender Redemption Baskets for redemption. (Trustee consent to any amendment to the Trust Agreement is required if the Trustee reasonably believes that such amendment adversely affects any of its rights, duties or liabilities.) In addition, shareholders of the Funds holding shares representing seventy-five percent (75%) of the outstanding shares of the Funds, voting together as a single class (excluding shares acquired by the Sponsor in connection with its initial capital contribution to any Trust series) may vote to dissolve the Trust upon not less than ninety (90) days’ notice to the Sponsor. Shareholders have no voting rights with respect to the Trust or a Fund except as expressly provided in the Trust Agreement. For TAGS, fund Shareholders have no voting rights with respect to shares of the Underlying Funds held by that Fund.
Limited Liability of Shareholders
Shareholders shall be entitled to the same limitation of personal liability extended to stockholders of private corporations for profit organized under the general corporation law of Delaware, and no Shareholder shall be liable for claims against, or debts of the Trust or the Fund in excess of his share of a Fund’s assets. The Trust or a Fund shall not make a claim against a Shareholder with respect to amounts distributed to such Shareholder or amounts received by such Shareholder upon redemption unless, under Delaware law, such Shareholder is liable to repay such amount.
The Trust or a Fund shall indemnify to the full extent permitted by law and the Trust Agreement each Shareholder (excluding the Sponsor to the extent of its ownership of any Shares acquired through its initial capital contribution) against any claims of liability asserted against such Shareholder solely because of its ownership of Shares (other than for taxes on income from Shares for which such Shareholder is liable).
Every written note, bond, contract, instrument, certificate or undertaking made or issued by the Sponsor on behalf of the Trust or a Fund shall give notice to the effect that the same was executed or made by or on behalf of the Trust or a Fund and that the obligations of such instrument are not binding upon the Shareholders individually but are binding only upon the assets and property of a Fund and no recourse may be had with respect to the personal property of a Shareholder for satisfaction of any obligation or claim.
24
The Sponsor Has Conflicts of Interest
There are present and potential future conflicts of interest in the Trust’s structure and operation you should consider before you purchase Shares. The Sponsor may use this notice of conflicts as a defense against any claim or other proceeding made.
The Sponsor’s principals, officers and employees, do not devote their time exclusively to the Funds. Under the organizational documents of the Sponsor, Mr. Sal Gilbertie and Mr. Dale Riker, in their respective capacities as President and Chief Investment Officer of the Sponsor and Chief Executive Officer and Secretary of the Sponsor, are obligated to use commercially reasonable efforts to manage the Sponsor, devote such amount of time to the Sponsor as would be consistent with their roles in similarly placed commodity pool operators, and remain active in managing the Sponsor until they are no longer managing members of the Sponsor or the Sponsor dissolves. In addition, the Sponsor expects that operating the Teucrium Funds will generally constitute the principal and full-time business activity of its principals, officers and employees. Notwithstanding these obligations and expectations, the Sponsor’s principals may be directors, officers or employees of other entities, and may manage assets of other entities, including the other Teucrium Funds, through the Sponsor or otherwise. In particular, the principals could have a conflict between their responsibilities to the Fund on the one hand and to those other entities on the other. The Sponsor believes that it currently has sufficient personnel, time, and working capital to discharge its responsibilities to the Fund in a fair manner and that these persons’ conflicts should not impair their ability to provide services to the Fund. However, it is not possible to quantify the proportion of their time that the Sponsor’s personnel will devote to the Fund and its management.
The Sponsor and its principals, officers and employees may trade futures and related contracts for their own accounts. Shareholders will not be permitted to inspect the trading records of such persons or any written policies of the Sponsor related to such trading. A conflict of interest may exist if their trades are in the same markets and at approximately the same times as the trades for the Fund. A potential conflict also may occur when the Sponsor’s principals trade their accounts more aggressively or take positions in their accounts which are opposite, or ahead of, the positions taken by the Fund.
The Sponsor has sole current authority to manage the investments and operations of the Fund, and this may allow it to act in a way that furthers its own interests rather than your best interests, including the authority of the Sponsor to allocate expenses to and between the Funds. Shareholders have very limited voting rights, which will limit their ability to influence matters such as amendment of the Trust Agreement, change in the Fund’s basic investment policies, or dissolution of the Fund or the Trust.
The Sponsor serves as the Sponsor to the Teucrium Funds, and may in the future serve as the Sponsor or investment adviser to commodity pools other than the Teucrium Funds. The Sponsor may have a conflict to the extent that its trading decisions for the Fund may be influenced by the effect they would have on the other pools it manages. In addition, the Sponsor may be required to indemnify the officers and directors of the other pools, if the need for indemnification arises. This potential indemnification will cause the Sponsor’s assets to decrease. If the Sponsor’s other sources of income are not sufficient to compensate for the indemnification, it could cease operations, which could in turn result in Fund losses and/or termination of the Fund.
If the Sponsor acquires knowledge of a potential transaction or arrangement that may be an opportunity for the Fund, it shall have no duty to offer such opportunity to the Fund. The Sponsor will not be liable to the Fund or the Shareholders for breach of any fiduciary or other duty if Sponsor pursues such opportunity or directs it to another person or does not communicate such opportunity to the Fund. Neither the Fund nor any Shareholder has any rights or obligations by virtue of the Trust Agreement, the trust relationship created thereby, or this prospectus in such business ventures or the income or profits derived from such business ventures. The pursuit of such business ventures, even if competitive with the activities of the Fund, will not be deemed wrongful or improper.
Resolution of Conflicts Procedures
The Trust Agreement provides that whenever a conflict of interest exists between the Sponsor or any of its Affiliates, on the one hand, and the Trust, any shareholder of a Trust series, or any other person, on the other hand, the Sponsor shall resolve such conflict of interest, take such action or provide such terms, considering in each case the relative interest of each party (including its own interest) to such conflict, agreement, transaction or situation and the benefits and burdens relating to such interests, any customary or accepted industry practices, and any applicable generally accepted accounting practices or principles. In the absence of bad faith by the Sponsor, the resolution, action or terms so made, taken or provided by the Sponsor shall not constitute a breach of the Trust Agreement or any other agreement contemplated therein or of any duty or obligation of the Sponsor at law or in equity or otherwise.
The Sponsor or any affiliate thereof may engage in or possess an interest in other profit-seeking or business ventures of any nature or description, independently or with others, whether or not such ventures are competitive with the Trust and the doctrine of corporate opportunity, or any analogous doctrine, shall not apply to the Sponsor. If the Sponsor acquires knowledge of a potential transaction, agreement, arrangement or other matter that may be an opportunity for the Trust, it shall have no duty to communicate or offer such opportunity to the Trust, and the Sponsor shall not be liable to the Trust or to the Shareholders for breach of any fiduciary or other duty by reason of the fact that the Sponsor pursues or acquires for, or directors such opportunity to, another person or does not communicate such opportunity or information to the Trust. Neither the Trust nor any Shareholder shall have any rights or obligations by virtue of the Trust Agreement or the trust relationship created thereby in or to such independent ventures or the income or profits or losses derived therefrom, and the pursuit of such ventures, even if competitive with the activities of the Trust, shall not be deemed wrongful or improper. Except to the extent expressly provided in the Trust Agreement, the Sponsor may engage or be interested in any financial or other transaction with the Trust, the Shareholders or any affiliate of the Trust or the Shareholders.
25
Regulatory Considerations
The regulation of futures markets, futures contracts, and futures exchanges has historically been comprehensive. The CFTC and the exchanges are authorized to take extraordinary actions in the event of a market emergency including, for example, the retroactive implementation of speculative position limits, increased margin requirements, the establishment of daily price limits and the suspension of trading on an exchange or trading facility.
Pursuant to authority in the CEA, the NFA has been formed and registered with the CFTC as a registered futures association. At the present time, the NFA is the only self-regulatory organization for commodity interest professionals, other than futures exchanges. The CFTC has delegated to the NFA responsibility for the registration of CPOs and FCMs and their respective associated persons. The Sponsor and the Fund’s clearing broker are members of the NFA. As such, they will be subject to NFA standards relating to fair trade practices, financial condition and consumer protection. The NFA also arbitrates disputes between members and their customers and conducts registration and fitness screening of applicants for membership and audits of its existing members. Neither the Trust nor the Funds are required to become a member of the NFA. The regulation of commodity interest transactions in the United States is a rapidly changing area of law and is subject to ongoing modification by governmental and judicial action. Considerable regulatory attention has been focused on non-traditional investment pools that are publicly distributed in the United States. There is a possibility of future regulatory changes within the United States altering, perhaps to a material extent, the nature of an investment in the Funds, or the ability of a Fund to continue to implement its investment strategy. In addition, various national governments outside of the United States have expressed concern regarding the disruptive effects of speculative trading in the commodities markets and the need to regulate the derivatives markets in general. The effect of any future regulatory change on the Funds is impossible to predict but could be substantial and adverse.
The CFTC possesses exclusive jurisdiction to regulate the activities of commodity pool operators and commodity trading advisors with respect to “commodity interests,” such as futures and swaps and options, and has adopted regulations with respect to the activities of those persons and/or entities. Under the Commodity Exchange Act (“CEA”), a registered commodity pool operator, such as the Sponsor, is required to make annual filings with the CFTC and the NFA describing its organization, capital structure, management and controlling persons. In addition, the CEA authorizes the CFTC to require and review books and records of, and documents prepared by, registered commodity pool operators. Pursuant to this authority, the CFTC requires commodity pool operators to keep accurate, current and orderly records for each pool that they operate. The CFTC may suspend the registration of a commodity pool operator (1) if the CFTC finds that the operator’s trading practices tend to disrupt orderly market conditions, (2) if any controlling person of the operator is subject to an order of the CFTC denying such person trading privileges on any exchange, and (3) in certain other circumstances. Suspension, restriction or termination of the Sponsor’s registration as a commodity pool operator would prevent it, until that registration were to be reinstated, from managing the Funds, and might result in the termination of a Fund if a successor sponsor is not elected pursuant to the Trust Agreement. Neither the Trust nor the Funds are required to be registered with the CFTC in any capacity.
The Funds’ investors are afforded prescribed rights for reparations under the CEA. Investors may also be able to maintain a private right of action for violations of the CEA. The CFTC has adopted rules implementing the reparation provisions of the CEA, which provide that any person may file a complaint for a reparations award with the CFTC for violation of the CEA against a floor broker or an FCM, introducing broker, commodity trading advisor, CPO, and their respective associated persons.
The regulations of the CFTC and the NFA prohibit any representation by a person registered with the CFTC or by any member of the NFA, that registration with the CFTC, or membership in the NFA, in any respect indicates that the CFTC or the NFA has approved or endorsed that person or that person’s trading program or objectives. The registrations and memberships of the parties described in this summary must not be considered as constituting any such approval or endorsement. Likewise, no futures exchange has given or will give any similar approval or endorsement.
Trading venues in the United States are subject to varying degrees of regulation under the CEA depending on whether such exchange is a designated contract market (i.e. a futures exchange) or a swap execution facility. Clearing organizations are also subject to the CEA and the rules and regulations adopted thereunder as administered by the CFTC. The CFTC’s function is to implement the CEA’s objectives of preventing price manipulation and excessive speculation and promoting orderly and efficient commodity interest markets. In addition, the various exchanges and clearing organizations themselves as self-regulatory organizations exercise regulatory and supervisory authority over their member firms.
The Dodd-Frank Wall Street Reform and Consumer Protection Act (the “Dodd-Frank Act”) was enacted in response to the economic crisis of 2008 and 2009 and it significantly altered the regulatory regime to which the securities and commodities markets are subject. To date, the CFTC has issued proposed or final versions of almost all of the rules it is required to promulgate under the Dodd-Frank Act, and it continues to issue proposed versions of additional rules that it has authority to promulgate. Provisions of the new law include the requirement that position limits be established on a wide range of commodity interests, including agricultural, energy, and metal-based commodity futures contracts, options on such futures contracts and uncleared swaps that are economically equivalent to such futures contracts and options (“Reference Contracts”); new registration and recordkeeping requirements for swap market participants; capital and margin requirements for “swap dealers” and “major swap participants,” as determined by the new law and applicable regulations; reporting of all swap transactions to swap data repositories; and the mandatory use of clearinghouse mechanisms for sufficiently standardized swap transactions that were historically entered into in the over-the-counter market, but are now designated as subject to the clearing requirement; and margin requirements for over-the-counter swaps that are not subject to the clearing requirements.
26
In addition, considerable regulatory attention has recently been focused on non-traditional publicly distributed investment pools such as the Funds. Furthermore, various national governments have expressed concern regarding the disruptive effects of speculative trading in certain commodity markets and the need to regulate the derivatives markets in general. The effect of any future regulatory change on the Funds is impossible to predict, but could be substantial and adverse.
Management believes that as of December 31, 2016, it had fulfilled in a timely manner all Dodd-Frank reporting requirements, both historical and on-going, for the categories under which the firm operates and is registered.
The Dodd-Frank Act was intended to reduce systemic risks that may have contributed to the 2008/2009 financial crisis. Since the first draft of what became the Dodd-Frank Act, opponents have criticized the broad scope of the legislation and, in particular, the regulations implemented by federal agencies as a result. Since 2010, and most notably in 2015 and 2016, Republicans have proposed comprehensive legislation both in the House and the Senate of the US Congress. These bills are intended to pare back some of the provisions of the Dodd-Frank Act of 2010 that critics view as overly broad, unnecessary to the stability of the U.S. financial system, and inhibiting the growth of the U.S. economy. Further, during the campaign and after taking office, President Donald J. Trump has promised and issued several executive orders intended to relieve the financial burden created by the Dodd-Frank Act, although these executive orders only set forth several general principles to be followed by the federal agencies and do not mandate the wholesale repeal of the Dodd-Frank Act. The scope of the effect that passage of new financial reform legislation could have on U.S. securities, derivatives and commodities markets is not clear at this time because each federal regulatory agency would have to promulgate new regulations to implement such legislation. Nevertheless, regulatory reform may have a significant impact on U.S.-regulated entities.
Position Limits, Aggregation Limits, Price Fluctuation Limits
On December 16, 2016, the CFTC issued a final rule to amend part 150 of the CFTC’s regulations with respect to the policy for aggregation under the CFTC’s position limits regime for futures and option contracts on nine agricultural commodities (“the Aggregation Requirements”). This final rule addressed the circumstances under which market participants would be required to aggregate all their positions, for purposes of the position limits, of all positions in Reference Contracts of the 9 agricultural commodities held by a single entity and its affiliates, regardless of whether such positions exist on US futures exchanges, non-US futures exchanges, or in over-the-counter swaps. An affiliate of a market participant is defined as two or more persons acting pursuant to an express or implied agreement or understanding. The Aggregation Requirements will become effective on February 14, 2017. The Sponsor does not anticipate that this order will have an impact on the ability of a Fund to meet its respective investment objectives.
In addition, on December 30, 2016, the CFTC reproposed regulations that would establish revised specific limits on speculative positions in futures contracts, option contracts and swaps on 25 agricultural, energy and metals commodities (the “Proposed Position Limit Rules”).
The Proposed Position Limit Rules were a reproposal and the CFTC has requested comments from the public. It remains to be seen whether the Proposed Position Limit Rules will become effective as the CFTC has proposed, as comments could result in modifications to the proposed limits or implementation could be delayed for other reasons. In general, the Proposed Position Limit Rules do not appear to have a substantial or adverse effect on the Funds. However, if the total net assets of a Fund were to increase significantly from current levels, the Position Limit Rules as proposed could negatively impact the ability of a Fund to meet its respective investment objectives through limits that may inhibit the Sponsor’s ability to sell additional Creation Baskets of the Fund. However, it is not expected that any Fund will reach asset levels that would cause these position limits to be reached in the near future.
In addition, the Proposed Position Limit Rules state that the CFTC will review, and may amend, the Position Limit Rules at a minimum every two years and more often as deemed necessary. Such future amendments may affect a Fund or Funds, and it may, at that time, be substantial and adverse. By way of example, future amendments, in combination with the Position Limit Rules, may negatively impact the ability of the Fund to meet its respective investment objectives through limits that may inhibit the Sponsor’s ability to sell additional Creation Baskets of the Fund, if the total net assets of a Fund grow significantly from current levels.
The futures exchanges, e.g. the CME, may under the Proposed Position Limit Rules impose position limits which are lower than those imposed by the CFTC. Such a limit by an exchange on which a Fund trades futures contracts may negatively and adversely impact the ability of the Fund to meet its respective investment objectives through limits that may inhibit the Sponsor’s ability to sell additional Creation Baskets of the Fund. No such lower limits by an exchange are currently in place.
The aggregate position limits currently in place under the current position limits and the Aggregation Requirements are as follows for each of the commodities traded by the Funds:
| Commodity Future | Spot Month Position Limit | All Month Aggregate Position Limit |
| corn | 600 contracts | 33,000 contracts |
| soybeans | 600 contracts | 15,000 contracts |
| sugar | 5,000 contracts | Accountability – see discussion below |
| wheat | 600 contracts | 12,000 contracts |
27
The aggregate speculative position limits currently as proposed in the Proposed Position Limit Rules are as follows for each of the commodities traded by the Funds:
| Commodity Future | Spot Month Position Limit | All Month Aggregate Position Limit |
| corn | 600 contracts | 62,400 contracts |
| soybeans | 600 contracts | 31,900 contracts |
| sugar | 23,300 contracts | 38,400 contracts |
| wheat | 600 contracts | 32,800 contracts |
Accountability levels differ from position limits in that they do not represent a fixed ceiling, but rather a threshold above which a futures exchange may exercise greater scrutiny and control over an investor’s positions. If a Fund were to exceed an applicable accountability level for investments in futures contracts, the exchange will monitor the Fund’s exposure and may ask for further information on its activities, including the total size of all positions, investment and trading strategy, and the extent of liquidity resources of the Fund. If deemed necessary by the exchange, the Fund could be ordered to reduce its aggregate net position back to the accountability level.
In addition to position limits and accountability levels, the exchanges set daily price fluctuation limits on futures contracts. The daily price fluctuation limit establishes the maximum amount that the price of futures contracts may vary either up or down from the previous day’s settlement price. Once the daily price fluctuation limit has been reached in a particular futures contract, no trades may be made at a price beyond that limit.
As of May 1, 2014, the CME replaced the fixed price fluctuation limits with variable price limits for corn. The change, which is now effective and is described in the CME Group Special Executive Report S-7038 and can be accessed at http://www.cmegroup.com/tools-information/lookups/advisories/ser/SER-7038.html.
Margin for OTC Uncleared Swaps
During 2015 and 2016, the CFTC and the US bank prudential regulators completed their rulemakings under the Dodd-Frank Act on margin for uncleared over-the-counter swaps (and option agreements that qualify as swaps). Margin requirements went into effect for the largest swap entities in September 2016, and will go into effect for small financial entities in March 2017. Under these regulations, swap dealers (such as sell-side counterparties to swaps), major swap participants, and financial end users (such as buy-side counterparties to swaps who are not physical traders) are required in most instances, to post and collect initial and variation margin, depending on the regulatory classification of their counterparty. European and Asian regulators are also implementing similar regulations, which were scheduled to become effective on the same dates as the US-promulgated rules. As a result of these requirements, additional capital will be required to be committed to the margin accounts to support transactions involving uncleared over-the-counter swaps and, consequently, these transactions may become more expensive. While the Funds currently do not generally engage in uncleared over the counter swaps, to the extent they do so in the future, the additional margin required to be posted could adversely impact the profitability (if any) to the Funds from entering into these transactions.
Books and Records
The Trust keeps its books of record and account at its office located
at 232 Hidden Lake Road, Building A, Brattleboro, Vermont 05301, or at the offices of USBFS, the Administrator, located at 615
East Michigan Street, Milwaukee, Wisconsin 53202, or such office, including of an administrative agent, as it may subsequently
designate upon notice. The books of account of the Fund are open to inspection by any Shareholder (or any duly constituted
designee of a Shareholder) at all times during the usual business hours of the Fund upon reasonable advance notice to the extent
such access is required under CFTC rules and regulations. In addition, the Trust keeps a copy of the Trust Agreement on
file in its office which will be available for inspection by any Shareholder at all times during its usual business hours upon
reasonable advance notice.
SEC Reports
The Sponsor makes available, free of charge, on the website for each Fund, the annual reports on Form 10-K for the Trust, the quarterly reports on Form 10-Q for the Trust, current reports on Form 8-K and amendments to these reports as soon as reasonably practicable after these documents are filed with, or furnished to, the SEC. The documents that the Trust has filed with, or furnished to, the SEC may be found on the Fund’s website under the heading “Fund Information-Filings.” The website for CORN is www.teucriumcornfund.com; for CANE is www.teucriumcanefund.com; for SOYB is www.teucriumsoybfund.com; for WEAT is www.teucriumweatfund.com; and for TAGS is www.teucriumtagsfund.com. These reports are also available from the SEC through that agency’s website at: www.sec.gov and will be provided free of charge in paper or electronically on request.
28
CFTC Reports
The Sponsor makes available, free of charge, on the website for each Fund, the monthly reports required to be filed pursuant to Rule 4.22(h) under the Commodity Exchange Act.
Intellectual Property
On December 17, 2013 the Sponsor was issued a patent on certain business methods and procedures used with respect to the Funds.
The risk factors should be read in conjunction with the other information included in this annual report on Form 10-K, including Management’s Discussion and Analysis of Financial Condition and the Results of Operations, as well as the financial statements and the related footnotes for the Trust and the Funds.
The commodity interests in which each of the Funds invests, and in which TAGS invests indirectly through the Shares of the Underlying Funds, are referred to as Commodity Interests and for each Fund individually as the specific Commodity Interests, e.g. Corn Interests.
Additional information regarding many of the risk areas outlined below can be found in the section of this Form on 10-K entitled: Part I, Item 1. Business, which precedes this section. A discussion of the global information for each specific underlying commodity can be found in Part I, in the section titled “Market Outlook.”
Risks Applicable to all Funds
There are Risks Related to Fund Structure and Operations of the Funds
Unlike mutual funds, commodity pools and other investment pools that manage their investments so as to realize income and gains for distribution to their investors, a Fund generally does not distribute dividends to Shareholders. You should not invest in a Fund if you will need cash distributions from the Fund to pay taxes on your share of income and gains of the Fund, if any, or for other purposes.
The Sponsor has consulted with legal counsel, accountants and other advisers regarding the formation and operation of the Trust and the Funds. No counsel has been appointed to represent you in connection with the offering of Shares. Accordingly, you should consult with your own legal, tax and financial advisers regarding the desirability of an investment in the Shares.
The Sponsor intends to re-invest any income and realized gains of a Fund in additional Commodity Interests, or Shares of the Underlying Funds in the case of TAGS, rather than distributing cash to Shareholders. Although a Fund does not intend to make cash distributions, the income earned from its investments held directly or posted as margin may reach levels that merit distribution, e.g., at levels where such income is not necessary to support its underlying investments in Commodity Interests, corn for example, and where investors adversely react to being taxed on such income without receiving distributions that could be used to pay such tax. Cash distributions may be made in these and similar instances.
A Fund must pay for all brokerage fees, taxes and other expenses, including licensing fees for the use of intellectual property, registration or other fees paid to the SEC, the Financial Industry Regulatory Authority (“FINRA”), or any other regulatory agency in connection with the offer and sale of subsequent Shares, after its initial registration, and all legal, accounting, printing and other expenses associated therewith. Each Fund also pays the fees and expenses associated with the Trust’s tax accounting and reporting requirements. Each Fund, excluding TAGS, is also contractually obligated to pay a management fee to the Sponsor. Such fees may be waived by the Sponsor at its discretion. Accordingly, each Fund must have sufficient total net assets to be able realize in actuality the total expense ratio filed in regulatory filings.
A Fund may terminate at any time, regardless of whether the Fund has incurred losses, subject to the terms of the Trust Agreement. For example, the dissolution or resignation of the Sponsor would cause the Trust to terminate unless shareholders holding a majority of the outstanding shares of the Trust elect within 90 days of the event to continue the Trust and appoint a successor Sponsor. In addition, the Sponsor may terminate a Fund if it determines that the Fund’s aggregate net assets in relation to its operating expenses make the continued operation of the Fund unreasonable or imprudent. However, no level of losses will require the Sponsor to terminate a Fund. The Fund’s termination would result in the liquidation of its investments and the distribution of its remaining assets to the Shareholders on a pro rata basis in accordance with their Shares, and the Fund could incur losses in liquidating its investments in connection with a termination. Termination could also negatively affect the overall maturity and timing of your investment portfolio. Any expenses related to the operation of a Fund would need to be paid by the Fund at the time of termination.
To the extent that investors use a Fund as a means of investing indirectly in a specific Commodity Interest, there is the risk that the changes in the price of the Fund’s Shares on the NYSE Arca will not closely track the changes in spot price of that Commodity Interest. This could happen if the price of Shares traded on the NYSE Arca does not correlate with the Fund’s NAV, if the changes in the Fund’s NAV do not correlate with changes in the Benchmark, or if the changes in the Benchmark do not correlate with changes in the cash or spot price of the specific Commodity Interest. This is a risk because if these correlations are not sufficiently close, then investors may not be able to use the Fund as a cost-effective way to invest indirectly in the specific Commodity Interest, or the underlying specific Commodity Interest in the case of TAGS, or as a hedge against the risk of loss in commodity-related transactions.
29
Only an Authorized Purchaser may engage in creation or redemption transactions directly with the Funds. The Funds have a limited number of institutions that act as Authorized Purchasers. To the extent that these institutions exit the business or are unable to proceed with creation and/or redemption orders with respect to the Funds and no other Authorized Purchaser is able to step forward to create or redeem Creation Units, Fund shares may trade at a discount to NAV and possibly face trading halts and/or delisting. In addition, a decision by a market maker or lead market maker to step away from activities for a Fund, particularly in times of market stress, could adversely affect liquidity, the spread between the bid and ask quotes for the Fund’s Shares, and potentially the price of the Shares. The Sponsor can make no guarantees that participation by Authorized Purchasers or market makers will continue.
An investment in a Fund faces numerous risks from its shares being traded in the secondary market, any of which may lead to the Fund’s shares trading at a premium or discount to NAV. Although Fund shares are listed for trading on the NYSE Arca, there can be no assurance that an active trading market for such shares will develop or be maintained. Trading in Fund shares may be halted due to market conditions or for reasons that, in the view of the NYSE Arca, make trading in shares inadvisable. There can be no assurance that the requirements of the NYSE Arca necessary to maintain the listing of any Fund will continue to be met or will remain unchanged or that the shares will trade with any volume, or at all. The NAV of each Fund’s shares will generally fluctuate with changes in the market value of the Fund’s portfolio holdings. The market prices of shares will generally fluctuate in accordance with changes in the Fund’s NAV and supply and demand of shares on the NYSE Arca. It cannot be predicted whether a Fund shares will trade below, at or above their NAV. Investors buying or selling Fund shares in the secondary market will pay brokerage commissions or other charges imposed by brokers as determined by that broker. Brokerage commissions are often a fixed amount and may be a significant proportional cost for investors seeking to buy or sell relatively small amounts of shares.
None of the Funds are an investment company subject to the Investment Company Act of 1940. Accordingly, you do not have the protections afforded by that statute, which, for example, requires investment companies to have a board of directors with a majority of disinterested directors and regulates the relationship between the investment company and its investment manager.
The arrangements between clearing brokers and counterparties on the one hand and the Funds on the other generally are terminable by the clearing brokers or counterparty upon notice to the Funds. In addition, the agreements between the Funds and their third-party service providers, such as the Distributor and the Custodian, are generally terminable at specified intervals. Upon termination, the Sponsor may be required to renegotiate or make other arrangements for obtaining similar services if the Funds intend to continue to operate. Comparable services from another party may not be available, or even if available, these services may not be available on the terms as favorable as those of the expired or terminated arrangements.
The Sponsor does not employ trading advisors for the Funds; however, it reserves the right to employ them in the future. The only advisor to the Funds is the Sponsor. A lack of independent trading advisors may be disadvantageous to the Funds because they will not receive the benefit of their independent expertise.
The Sponsor’s trading strategy is quantitative in nature, and it is possible that the Sponsor will make errors in its implementation. The execution of the quantitative strategy is subject to human error, such as incorrect inputs into the Sponsor’s computer systems and incorrect information provided to the Funds’ clearing brokers. In addition, it is possible that a computer or software program may malfunction and cause an error in computation. Any failure, inaccuracy or delay in executing the Funds’ transactions could affect its ability to achieve its investment objective. It could also result in decisions to undertake transactions based on inaccurate or incomplete information. This could cause substantial losses on transactions. The Sponsor is not required to reimburse a Fund for any costs associated with an error in the placement or execution of a trade in commodity futures interests or shares of the Underlying Funds.
The Funds’ trading activities depend on the integrity and performance of the computer and communications systems supporting them. Extraordinary transaction volume, hardware or software failure, power or telecommunications failure, a natural disaster or other catastrophe could cause the computer systems to operate at an unacceptably slow speed or even fail. Any significant degradation or failure of the systems that the Sponsor uses to gather and analyze information, enter orders, process data, monitor risk levels and otherwise engage in trading activities may result in substantial losses on transactions, liability to other parties, lost profit opportunities, damages to the Sponsor’s and Funds’ reputations, increased operational expenses and diversion of technical resources.
The development of complex computer and communications systems and new technologies may render the existing computer and communications systems supporting the Funds’ trading activities obsolete. In addition, these computer and communications systems must be compatible with those of third parties, such as the systems of exchanges, clearing brokers and the executing brokers. As a result, if these third parties upgrade their systems, the Sponsor will need to make corresponding upgrades to continue effectively its trading activities. The Funds’ future success may depend on the Funds’ ability to respond to changing technologies on a timely and cost-effective basis.
The Funds depend on the proper and timely function of complex computer and communications systems maintained and operated by the futures exchanges, brokers and other data providers that the Sponsor uses to conduct trading activities. Failure or inadequate performance of any of these systems could adversely affect the Sponsor’s ability to complete transactions, including its ability to close out positions, and result in lost profit opportunities and significant losses on commodity interest transactions. This could have a material adverse effect on revenues and materially reduce the Funds’ available capital. For example, unavailability of price quotations from third parties may make it difficult or impossible for the Sponsor to conduct trading activities so that each Fund will closely track its Benchmark. Unavailability of records from brokerage firms may make it difficult or impossible for the Sponsor to accurately determine which transactions have been executed or the details, including price and time, of any transaction executed. This unavailability of information also may make it difficult or impossible for the Sponsor to reconcile its records of transactions with those of another party or to accomplish settlement of executed transactions.
30
The operations of the Funds, the exchanges, brokers and counterparties with which the Funds do business, and the markets in which the Funds do business could be severely disrupted in the event of a major terrorist attack, natural disaster, or the outbreak, continuation or expansion of war or other hostilities. Global terrorist attacks, anti-terrorism initiatives, and political unrest continue to fuel this concern.
Failures or breaches of the electronic systems of the Funds, the Sponsor, the Custodian or mutual funds or other financial institutions in which the Funds invest, or the Funds’ other service providers, market makers, Authorized Purchasers, NYSE Arca, exchanges on which Futures Contracts or Other Commodity Interests are traded or cleared, or counterparties have the ability to cause disruptions and negatively impact the Funds’ business operations, potentially resulting in financial losses to a Fund and its shareholders. While the Funds have established business continuity plans and risk management systems seeking to address system breaches or failures, there are inherent limitations in such plans and systems. Furthermore, the Funds cannot control the cyber security plans and systems of the Custodian or mutual funds or other financial institutions in which the Funds invest, or the Funds’ other service providers, market makers, Authorized Purchasers, NYSE Arca, exchanges on which Futures Contracts or Other Commodity Interests are traded or cleared, or counterparties.
The Trust may, in its discretion, suspend the right to redeem Shares of a Fund or postpone the redemption settlement date: (1) for any period during which an applicable exchange is closed other than customary weekend or holiday closing, or trading is suspended or restricted; (2) for any period during which an emergency exists as a result of which delivery, disposal or evaluation of a Fund’s assets is not reasonably practicable; (3) for such other period as the Sponsor determines to be necessary for the protection of Shareholders; (4) if there is a possibility that any or all of the Benchmark Component Futures Contracts of a Fund on the specific exchange where the Fund is traded and from which the NAV of the Fund is calculated will be priced at a daily price limit restriction; or (5) if, in the sole discretion of the Sponsor, the execution of such an order would not be in the best interest of a Fund or its Shareholders. In addition, the Trust will reject a redemption order if the order is not in proper form as described in the agreement with the Authorized Purchaser or if the fulfillment of the order, in the opinion of its counsel, might be unlawful. Any such postponement, suspension or rejection could adversely affect a redeeming Shareholder. For example, the resulting delay may adversely affect the value of the Shareholder’s redemption proceeds if the NAV of a Fund declines during the period of delay. The Trust Agreement provides that the Sponsor and its designees will not be liable for any loss or damage that may result from any such suspension or postponement. A minimum number of baskets and associated Shares are specified for each Fund in its prospectus and in Part I, Item 1 of this document. Once that minimum number of Shares outstanding is reached, there can be no further redemptions until there has been a Creation Basket.
The Intraday Indicative Value (“IIV”) and the Benchmark for each Fund are calculated and disseminated by the NYSE Arca under an agreement between the Sponsor and the NYSE Arca. Additionally, information may be calculated and disseminated under similar agreements between the Sponsor and other third party entities. Although reasonable efforts are taken to ensure the accuracy of the information disseminated under this agreement, there may, from time to time, be recalculations of previously released information.
Third parties may assert that the Sponsor has infringed or otherwise violated their intellectual property rights. Third parties may independently develop business methods, trademarks or proprietary software and other technology similar to that of the Sponsor and claim that the Sponsor has violated their intellectual property rights, including their copyrights, trademark rights, trade names, trade secrets and patent rights. As a result, the Sponsor may have to litigate in the future to determine the validity and scope of other parties’ proprietary rights, or defend itself against claims that it has infringed or otherwise violated other parties’ rights. Any litigation of this type, even if the Sponsor is successful and regardless of the merits, may result in significant costs, may divert resources from the Fund, or may require the Sponsor to change its proprietary software and other technology or enter into royalty or licensing agreements. The Sponsor has a patent on certain business methods and procedures used with respect to the Funds. The Sponsor utilizes certain proprietary software. Any unauthorized use of such proprietary software, business methods and/or procedures could adversely affect the competitive advantage of the Sponsor or the Funds and/or cause the Sponsor to take legal action to protect its rights.
In managing and directing the day-to-day activities and affairs of these Funds, the Sponsor relies almost entirely on a small number of individuals, including Mr. Sal Gilbertie, Mr. Dale Riker, Mr. Steve Kahler and Ms. Barbara Riker. If Mr. Gilbertie, Mr. Riker, Mr. Kahler or Ms. Riker were to leave or be unable to carry out their present responsibilities, it may have an adverse effect on the management of the Funds. To the extent that the Sponsor establishes additional commodity pools, even greater demands will be placed on these individuals.
The Sponsor was formed for the purpose of managing the Trust, including all the Funds, and any other series of the Trust that may be formed in the future, and has been provided with capital primarily by its principals and a small number of outside investors. If the Sponsor operates at a loss for an extended period, its capital will be depleted, and it may be unable to obtain additional financing necessary to continue its operations. If the Sponsor were unable to continue to provide services to these Funds, the Funds would be terminated if a replacement sponsor could not be found.
You cannot be assured that the Sponsor will be willing or able to continue to service each Fund for any length of time. The Sponsor was formed for the purpose of sponsoring the Funds and other commodity pools, and has limited financial resources and no significant source of income apart from its management fees from such commodity pools to support its continued service for each Fund. If the Sponsor discontinues its activities on behalf of a Fund, the Fund may be adversely affected. If the Sponsor’s registrations with the CFTC or memberships in the NFA were revoked or suspended, the Sponsor would no longer be able to provide services to the Funds.
The Sponsor May Have Conflicts of Interest
The structure and operation of the Funds may involve conflicts of interest. For example, a conflict may arise because the Sponsor and its principals and affiliates may trade for themselves. In addition, the Sponsor has sole current authority to manage the investments and operations, and the interests of the Sponsor may conflict with the Shareholders’ best interests, including the authority of the Sponsor to allocate expenses to and between the Funds.
31
The Performance of Each Fund May Not Correlate with the Applicable Benchmark
Each Fund has a limited operating history, so there is limited performance history to serve as a basis for you to evaluate an investment in the Fund.
If a Fund is required to sell Treasury Securities or cash equivalents at a price lower than the price at which they were acquired, the Fund will experience a loss. This loss may adversely impact the price of the Shares and may decrease the correlation between the price of the Shares, the Benchmark, and the spot price of the specific commodity interest or the commodity interests of the Underlying Funds in the case of TAGS. The value of Treasury Securities and other debt securities generally moves inversely with movements in interest rates. The prices of longer maturity securities are subject to greater market fluctuations as a result of changes in interest rates. While the short-term nature of a Fund’s investments in Treasury Securities and cash equivalents should minimize the interest rate risk to which the Fund is subject, it is possible that the Treasury Securities and cash equivalents held by the Fund will decline in value.
The Sponsor’s trading system is quantitative in nature, and it is possible that the Sponsor may make errors. In addition, it is possible that a computer or software program may malfunction and cause an error in computation.
Increases in assets under management may affect trading decisions. While all of the Funds’ assets are currently at manageable levels, the Sponsor does not intend to limit the amount of any Fund’s assets. The more assets the Sponsor manages, the more difficult it may be for it to trade profitably because of the difficulty of trading larger positions without adversely affecting prices and performance and of managing risk associated with larger positions.
Each Fund seeks to have the changes in its Shares’ NAV in percentage terms track changes in the Benchmark in percentage terms, rather than profit from speculative trading of the specific Commodity Interests, or the commodity interests of the Underlying Funds in the case of TAGS.
The Sponsor therefore endeavors to manage each Fund so that the Fund’s assets are, unlike those of many other commodity pools, not leveraged (i.e., so that the aggregate amount of the Fund’s exposure to losses from its investments in specific Commodity Interests at any time will not exceed the value of the Fund’s assets). There is no assurance that the Sponsor will successfully implement this investment strategy. If the Sponsor permits a Fund to become leveraged, you could lose all or substantially all of your investment if the Fund’s trading positions suddenly turns unprofitable. These movements in price may be the result of factors outside of the Sponsor’s control and may not be anticipated by the Sponsor.
The Sponsor cannot predict to what extent the performance of the commodity interest will or will not correlate to the performance of other broader asset classes such as stocks and bonds. If the performance of a specific Fund were to move more directly with the financial markets, an investment in the Fund may provide you little or no diversification benefits. Thus, in a declining market, the Fund may have no gains to offset your losses from other investments, and you may suffer losses on your investment in the Fund at the same time you may incur losses with respect to other asset classes. Variables such as drought, floods, weather, embargoes, tariffs and other political events may have a larger impact on commodity and Commodity Interests prices than on traditional securities and broader financial markets. These additional variables may create additional investment risks that subject a Fund’s investments to greater volatility than investments in traditional securities. Lower correlation should not be confused with negative correlation, where the performance of two asset classes would be opposite of each other. There is no historic evidence that the spot price of a specific commodity, corn, for example, and prices of other financial assets, such as stocks and bonds, are negatively correlated. In the absence of negative correlation, a Fund cannot be expected to be automatically profitable during unfavorable periods for the stock market, or vice versa.
Under the Trust Agreement, the Trustee and the Sponsor are not liable, and have the right to be indemnified, for any liability or expense incurred absent gross negligence or willful misconduct on the part of the Trustee or Sponsor, as the case may be. That means the Sponsor may require the assets of a Fund to be sold in order to cover losses or liability suffered by the Sponsor or by the Trustee. Any sale of that kind would reduce the NAV of the Fund and the value of its Shares.
The Shares of a Fund are limited liability investments; Shareholders may not lose more than the amount that they invest plus any profits recognized on their investment. However, Shareholders could be required, as a matter of bankruptcy law, to return to the estate of the Fund any distribution they received at a time when the Fund was in fact insolvent or in violation of its Trust Agreement.
The price relationship between the near month Commodity Futures Contract to expire and the Benchmark Component Futures Contracts for each Fund, or the Underlying Funds in the case of TAGS, will vary and may impact both a Fund’s total return over time and the degree to which such total return tracks the total return of the specific commodity price indices. In cases in which the near month contract’s price is lower than later-expiring contracts’ prices (a situation known as “contango” in the futures markets), then absent the impact of the overall movement in the commodity specific prices the value of the Benchmark Component Futures Contracts would tend to decline as they approach expiration which could cause the Benchmark Component Futures Contracts, and therefore the Fund’s total return, to track lower. In cases in which the near month contract’s price is higher than later-expiring contracts’ prices (a situation known as “backwardation” in the futures markets), then absent the impact of the overall movement in commodity specific prices, the value of the Benchmark Component Futures Contracts would tend to rise as they approach expiration.
While it is expected that the trading prices of the Shares will fluctuate in accordance with the changes in a Fund’s NAV, the prices of Shares may also be influenced by various market factors, including but not limited to, the number of shares of the Fund outstanding and the liquidity of the underlying Commodity Interests. There is no guarantee that the Shares will not trade at appreciable discounts from, and/or premiums to, the Fund’s NAV. This could cause the changes in the price of the Shares to substantially vary from the changes in the spot price of the underlying commodity, even if a Fund’s NAV was closely tracking movements in the spot price of that commodity. If this occurs, you may incur a partial or complete loss of your investment.
32
Investors, including those who directly participate in the specific commodity market, may choose to use a Fund as a vehicle to hedge against the risk of loss, and there are risks involved in hedging activities. While hedging can provide protection against an adverse movement in market prices, it can also preclude a hedger’s opportunity to benefit from a favorable market movement.
While it is not the current intention of the Funds to take physical delivery of any Commodity under its Commodity Interests, Commodity Futures Contracts are traditionally physically-deliverable contracts, and, unless a position was traded out of, it is possible to take or make delivery under these and some Other Commodity Interests. Storage costs associated with purchasing the specific commodity could result in costs and other liabilities that could impact the value of the Commodity Futures Contracts or certain Other Commodity Interests. Storage costs include the time value of money invested in the physical commodity plus the actual costs of storing the commodity less any benefits from ownership that are not obtained by the holder of a futures contract. In general, Commodity Futures Contracts have a one-month delay for contract delivery and the pricing of back month contracts (the back month is any future delivery month other than the spot month) includes storage costs. To the extent that these storage costs change for the commodity while a Fund holds the Commodity Interests, the value of the Commodity Interests, and therefore the Fund’s NAV, may change as well.
The design of each Fund’s Benchmark is such that the Benchmark Component Futures Contracts change throughout the year, and the Fund’s investments must be rolled periodically to reflect the changing composition of the Benchmark. For example, when the second-to-expire Commodity Futures Contract becomes the first-to-expire contract, such contract will no longer be a Benchmark Component Futures Contract and the Fund’s position in it will no longer be consistent with tracking the Benchmark. In the event of a commodity futures market where near-to-expire contracts trade at a higher price than longer-to-expire contracts, a situation referred to as “backwardation,” then absent the impact of the overall movement in the specific commodity prices of the Fund, the value of the Benchmark Component Futures Contracts would tend to rise as they approach expiration. As a result, a Fund may benefit because it would be selling more expensive contracts and buying less expensive ones on an ongoing basis. Conversely, using corn as an example, in the event of a corn futures market where near-to-expire contracts trade at a lower price than longer-to-expire contracts, a situation referred to as “contango,” then absent the impact of the overall movement in corn prices the value of the Benchmark Component Futures Contracts would tend to decline as they approach expiration. As a result, the Fund’s total return may be lower than might otherwise be the case because it would be selling less expensive contracts and buying more expensive ones. The impact of backwardation and contango may lead the total return of a Fund to vary significantly from the total return of other price references, such as the spot price of the specific commodity. In the event of a prolonged period of contango, and absent the impact of rising or falling specific commodity prices, this could have a significant negative impact on a Fund’s NAV and total return.
The Sponsor may use spreads and straddles as part of its overall trading strategy to closely follow the Benchmark. There is a risk that a Fund’s NAV may not closely track the change in its Benchmark. Spreads combine simultaneous long and short positions in related futures contracts that differ by commodity, by market or by delivery month (for example, long April, short November). Spreads gain or lose value as a result of relative changes in price between the long and short positions. Spreads often reduce risk to investors because the contracts tend to move up or down together. However, both legs of the spread could move against an investor simultaneously, in which case the spread would lose value. Certain types of spreads may face unlimited risk, e.g., because the price of a futures contract underlying a short position can increase by an unlimited amount and the investor would have to take delivery or offset at that price. A commodity straddle takes both long and short option position in the same commodity in the same market and delivery month simultaneously. The buyer of a straddle profits if either the long or the short leg of the straddle moves further than the combined cost of both options. The seller of the straddle profits if both the long and short positions do not trade beyond a range equal to the combined premium for selling both options. If the Sponsor were to utilize a spread or straddle position and the position performed differently than expected, the results could impact that Fund’s tracking error. This could affect the Fund’s investment objective of having its NAV closely track the Benchmark. Additionally, a loss on the position would negatively impact the Fund’s absolute return.
Position limits and daily price fluctuation limits set by the CFTC and the exchanges have the potential to cause tracking error, which could cause the price of Shares of the Fund to substantially vary from the Benchmark and prevent you from being able to effectively use the Fund as a way to hedge against underlying commodity-related losses or as a way to indirectly invest in the underlying commodity.
The Trust Structure and the Trust Agreement Provide Limited Shareholder Rights
You will have no rights to participate in the management of any of the Funds and will have to rely on the duties and judgment of the Sponsor to manage the Funds.
As interests in separate series of a Delaware statutory trust, the Shares do not involve the rights normally associated with the ownership of shares of a corporation (including, for example, the right to bring shareholder oppression and derivative actions). In addition, the Shares have limited voting and distribution rights (for example, Shareholders do not have the right to elect directors, as the Trust does not have a board of directors, and generally will not receive regular distributions of the net income and capital gains earned by the Fund). The Funds are also not subject to certain investor protection provisions of the Sarbanes Oxley Act of 2002 and the NYSE Arca governance rules (for example, audit committee requirements).
Each Fund is a series of a Delaware statutory trust and not itself a legal entity separate from the other Funds. The Delaware Statutory Trust Act provides that if certain provisions are included in the formation and governing documents of a statutory trust organized in series and if separate and distinct records are maintained for any series and the assets associated with that series are held in separate and distinct records and are accounted for in such separate and distinct records separately from the other assets of the statutory trust, or any series thereof, then the debts, liabilities, obligations and expenses incurred by a particular series are enforceable against the assets of such series only, and not against the assets of the statutory trust generally or any other series thereof. Conversely, none of the debts, liabilities, obligations and expenses incurred with respect to any other series thereof is enforceable against the assets of such series. The Sponsor is not aware of any court case that has interpreted this inter-series limitation on liability or provided any guidance as to what is required for compliance. The Sponsor intends to maintain separate and distinct records for each Fund and account for each Fund separately from any other Trust series, but it is possible a court could conclude that the methods used do not satisfy the Delaware Statutory Trust Act, which would potentially expose assets in any Fund to the liabilities of one or more of the Funds and/or any other Trust series created in the future.
33
Neither the Sponsor nor the Trustee is obligated to, although each may, in its respective discretion, prosecute any action, suit or other proceeding in respect of any Fund property. The Trust Agreement does not confer upon Shareholders the right to prosecute any such action, suit or other proceeding.
Rapidly Changing Regulation May Adversely Affect the Ability of the Funds to Meet Their Investment Objectives
The regulation of futures markets, futures contracts, and futures exchanges has historically been comprehensive. The CFTC and the exchanges are authorized to take extraordinary actions in the event of a market emergency including, for example, the retroactive implementation of speculative position limits, increased margin requirements, the establishment of daily price limits and the suspension of trading on an exchange or a trading facility.
The regulation of commodity interest transactions in the United States is a rapidly changing area of law and is subject to ongoing modification by governmental and judicial action. Subsequent to the enactment of the Dodd-Frank Act in 2010, swap agreements became fully regulated by the CFTC under the amended Commodity Exchange Act and the CFTC’s regulations thereunder. Considerable regulatory attention has been focused on non-traditional investment pools that are publicly distributed in the United States and that use trading in futures and options as an investment strategy and not for hedging or price discovery purposes, therefore altering traditional participation in futures and swaps markets. As the Dodd-Frank Act continues to be implemented by the CFTC and the SEC, there is a possibility of future regulatory changes within the United States altering, perhaps to a material extent, the nature of an investment in the Funds, or the ability of a Fund to continue to implement its investment strategy. In addition, various national governments outside of the United States have expressed concern regarding the disruptive effects of speculative trading in the commodities markets and the need to regulate the derivatives markets in general. The effect of any future regulatory change on the Funds is impossible to predict but could be substantial and adverse.
Further, President Donald J. Trump has promised and issued several executive orders intended to relieve the financial burden created by the Dodd-Frank Act, although these executive orders only set forth several general principles to be followed by the federal agencies and do not mandate the wholesale repeal of the Dodd-Frank Act. The scope of the effect that passage of new financial reform legislation could have on U.S. securities, derivatives and commodities markets is not clear at this time because each federal regulatory agency would have to promulgate new regulations to implement such legislation. These regulatory changes may affect the continued operation of the Funds. For additional information regarding recent regulatory developments that may impact the Funds or the Trust, refer to the section entitled “Regulatory Considerations” section of this document.
There Is No Assurance that There Will Be a Liquid Market for the Shares of the Funds or the Funds’ Underlying Investments, which May Mean that Shareholders May Not be Able to Sell Their Shares at a Market Price Relatively Close to the NAV
If a substantial number of requests for redemption of Redemption Baskets are received by a Fund during a relatively short period of time, the Fund may not be able to satisfy the requests from the Fund’s assets not committed to trading. As a consequence, it could be necessary to liquidate the Fund’s trading positions before the time that its trading strategies would otherwise call for liquidation.
A portion of a Fund’s investments could be illiquid, which could cause large losses to investors at any time or from time to time.
A Fund may not always be able to liquidate its positions in its investments at the desired price. As to futures contracts, it may be difficult to execute a trade at a specific price when there is a relatively small volume of buy and sell orders in a market. Limits imposed by futures exchanges or other regulatory organizations, such as accountability levels, position limits and price fluctuation limits, may contribute to a lack of liquidity with respect to some exchange-traded commodity Interests. In addition, over-the-counter contracts may be illiquid because they are contracts between two parties and generally may not be transferred by one party to a third party without the counterparty’s consent. Conversely, a counterparty may give its consent, but the Fund still may not be able to transfer an over-the-counter Commodity Interest to a third party due to concerns regarding the counterparty’s credit risk.
The exchanges set daily price fluctuation limits on futures contracts. The daily price fluctuation limit establishes the maximum amount that the price of futures contracts may vary either up or down from the previous day’s settlement price. Once the daily price fluctuation limit has been reached in a particular futures contract, no trades may be made at a price beyond that limit.
On March 12, 2014, the CME announced that, subject to CFTC approval, it would replace its fixed price fluctuation limits with variable price limits. The change was approved and went into effect May 1, 2014. Using corn as an example, this change amended Appendix A, Chapter 10 (Corn Futures), Section 10102.D (Trading Specifications – Daily Price Limits) to read as follows:
Daily price limits for Corn futures are reset every six months. The first reset date would be the first trading day in May based on the following: Daily settlement prices are collected for the nearest July contract over 45 consecutive trading days before and on the business day prior to April 16th. The average price is calculated based on the collected settlement prices and then multiplied by seven percent. The resulting number rounded to the nearest 5 cents per bushel, or 20 cents per bushel, whichever is higher will be the new initial price limits for Corn futures and will become effective on the first trading day in May and will remain in effect through the last trading day in October.
34
The second reset date would be the first trading day in November based on the following: Daily settlement prices are collected for the nearest December contract over 45 consecutive trading days before and on the business day prior to October 16th. The average price is calculated based on the collected settlement prices and then multiplied by seven percent. The resulting number, rounded to the nearest 5 cents per bushel, or 20 cents per bushel, whichever is higher, will be the new initial price limits for Corn futures and will become effective on the first trading day in November and will remain in effect through the last trading day in next April.
There shall be no trading in Corn futures at a price more than the initial price limit above or below the previous day’s settlement price. Should two or more Corn futures contract months within the first five listed non-spot contracts (or the remaining contract month in a crop year, which is the September contract) settle at limit, the daily price limits for all contract months shall increase by 50 percent the next business day, rounded up to the nearest 5 cents per bushel. If no Corn futures contract month settles at the expanded limit the next business day, daily price limits for all contract months shall revert back to the initial price limit the following business day. There shall be no price limits on the current month contract on or after the second business day preceding the first day of the delivery month.
A market disruption, such as a foreign government taking political actions that disrupt the market in its currency, its commodity production or exports, or in another major export, can also make it difficult to liquidate a position. Unexpected market illiquidity may cause major losses to investors at any time or from time to time. In addition, no Fund intends at this time to establish a credit facility, which would provide an additional source of liquidity, but instead will rely only on the Treasury Securities, cash and/or cash equivalents that it holds to meet its liquidity needs. The anticipated large value of the positions in a specific Commodity Interest that the Sponsor will acquire or enter into for a Fund increases the risk of illiquidity. Because Commodity Interests may be illiquid, a Fund’s holdings may be more difficult to liquidate at favorable prices in periods of illiquid markets and losses may be incurred during the period in which positions are being liquidated.
A Fund may invest in Other Commodity Interests. To the extent that these Other Commodity Interests are contracts individually negotiated between their parties, they may not be as liquid as Commodity Futures Contracts and will expose the Fund to credit risk that its counterparty may not be able to satisfy its obligations to the Fund.
The changing nature of the participants in the commodity specific market will influence whether futures prices are above or below the expected future spot price. Producers of the specific commodity will typically seek to hedge against falling commodity prices by selling Commodity Futures Contracts. Therefore, if commodity producers become the predominant hedgers in the futures market, prices of Commodity Futures Contracts will typically be below expected future spot prices. Conversely, if the predominant hedgers in the futures market are the purchasers of the commodity, who purchase Commodity Futures Contracts to hedge against a rise in prices, prices of the Commodity Futures Contracts will likely be higher than expected future spot prices. This can have significant implications for a Fund when it is time to sell a Commodity Futures Contract that is no longer a Benchmark Component Futures Contract and purchase a new Commodity Futures Contract or to sell a Commodity Futures Contract to meet redemption requests. A Fund may invest in Other Commodity Interests. To the extent that these Other Commodity Interests are contracts individually negotiated between their parties, they may not be as liquid as Commodity Futures Contracts and will expose the Fund to credit risk that its counterparty may not be able to satisfy its obligations to the Fund.
A Fund’s NAV includes, in part, any unrealized profits or losses on open swap agreements, futures or forward contracts. Under normal circumstances, the NAV reflects the quoted exchange settlement price of open futures contracts on the date when the NAV is being calculated. In instances when the quoted settlement price of a futures contract traded on an exchange may not be reflective of fair value based on market condition, generally due to the operation of daily limits or other rules of the exchange or otherwise, the NAV may not reflect the fair value of open future contracts on such date. For purposes of financial statements and reports, the Sponsor will recalculate the NAV where necessary to reflect the “fair value” of a Futures Contract when the Futures Contract closes at its price fluctuation limit for the day.
In the event that one or more Authorized Purchasers that are actively involved in purchasing and selling Shares cease to be so involved, the liquidity of the Shares will likely decrease, which could adversely affect the market price of the Shares and result in your incurring a loss on your investment. In addition, a decision by a market maker or lead market maker to cease activities for the Fund could adversely affect liquidity, the spread between the bid and ask quotes, and potentially the price of the Shares. The Sponsor can make no guarantees that participation by Authorized Purchasers or market makers will continue.
If a minimum number of Shares is outstanding for a Fund, market makers may be less willing to purchase Shares of that Fund in the secondary market which may limit your ability to sell Shares. There are a minimum number of baskets and associated Shares specified for each Fund. Once the minimum number of baskets is reached, there can be no more redemptions by an Authorized Purchaser of that Fund until there has been a Creation Basket. In such case, market makers may be less willing to purchase Shares of that Fund from investors in the secondary market, which may in turn limit the ability of Shareholders of that Fund to sell their Shares in the secondary market.
Trading in Shares of a Fund may be halted due to market conditions or, in light of NYSE Arca rules and procedures, for reasons that, in the view of the NYSE Arca, make trading in Shares inadvisable. In addition, trading is subject to trading halts caused by extraordinary market volatility pursuant to “circuit breaker” rules that require trading to be halted for a specified period based on a specified market decline. There can be no assurance that the requirements necessary to maintain the listing of the Shares will continue to be met or will remain unchanged. A Fund will be terminated if its Shares are delisted.
There is Credit Risk Associated with the Operation of the Funds, Service Providers and Counter-Parties Which May Cause an Investment Loss
For all of the Funds except for TAGS, the majority of each Fund’s assets are held in short-term Treasury Securities, cash and/or cash equivalents with the Custodian or with one or more alternate financial institutions unrelated to the Custodian (each, a “Financial Institution”). Any cash or cash equivalents invested by a Fund will be placed by the Sponsor in a Financial Institution rated in the highest short-term rating category by a nationally recognized statistical rating organization or will be deemed by the Sponsor to be of comparable quality.
35
The insolvency of the Custodian or any Financial Institution in which funds are deposited could result in a complete loss of a Fund’s assets held by the Custodian or the Financial Institution, which, at any given time, would likely comprise a substantial portion of a Fund’s total assets. Assets deposited with the Custodian or a Financial Institution will generally exceed federally insured limits. For TAGS, the vast majority of the Fund’s assets are held in Shares of the Underlying Funds. The failure or insolvency of the Custodian or the Financial Institution could impact the ability to access in a timely manner TAGS’ assets held by the Custodian.
Under CFTC regulations, a clearing broker with respect to a Fund’s exchange-traded Commodity Interests must maintain customers’ assets in a bulk segregated account. If a clearing broker fails to do so, or is unable to satisfy a substantial deficit in a customer account, its other customers may be subject to risk of a substantial loss of their funds in the event of that clearing broker’s bankruptcy. In that event, the clearing broker’s customers, such as a Fund, are entitled to recover, even in respect of property specifically traceable to them, only a proportional share of all property available for distribution to all of that clearing broker’s customers. A Fund also may be subject to the risk of the failure of, or delay in performance by, any exchanges and markets and their clearing organizations, if any, on which Commodity Interests are traded. From time to time, the clearing brokers may be subject to legal or regulatory proceedings in the ordinary course of their business. A clearing broker’s involvement in costly or time-consuming legal proceedings may divert financial resources or personnel away from the clearing broker’s trading operations, which could impair the clearing broker’s ability to successfully execute and clear a Fund’s trades. For additional information regarding recent regulatory developments that may impact the Funds or the Trust, refer to the section entitled “Regulatory Considerations” section of this document.
Commodity pools’ trading positions in futures contracts or other commodity interests are typically required to be secured by the deposit of margin funds that represent only a small percentage of a futures contract’s (or other commodity interest’s) entire market value. This feature permits commodity pools to “leverage” their assets by purchasing or selling futures contracts (or other commodity interests) with an aggregate notional amount in excess of the commodity pool’s assets. While this leverage can increase a pool’s profits, relatively small adverse movements in the price of a pool’s commodity interests can cause significant losses to the pool. While the Sponsor does not intend to leverage the Funds’ assets, it is not prohibited from doing so under the Trust Agreement. If the Sponsor were to cause or permit a Fund to become leveraged, you could lose all or substantially all of your investment if the Fund’s trading positions suddenly turns unprofitable.
An “exchange for related position” (“EFRP”) can be used by the Fund as a technique to facilitate the exchanging of a futures hedge position against a creation or redemption order, and thus the Fund may use an EFRP transaction in connection with the creation and redemption of shares. The market specialist/market maker that is the ultimate purchaser or seller of shares in connection with the creation or redemption basket, respectively, agrees to sell or purchase a corresponding offsetting futures position which is then settled on the same business day as a cleared futures transaction by the FCMs. The Fund will become subject to the credit risk of the market specialist/market maker until the EFRP is settled or terminated. The Fund reports all activity related to EFRP transactions under the procedures and guidelines of the CFTC and the exchanges on which the futures are traded. EFRPs are subject to specific rules of the CME and CFTC guidance. It is likely that EFRP mechanisms will be subject to changes in the future which may make it uneconomical or impossible from the regulatory perspective to utilize this mechanism by the Funds.
A portion of the Fund’s assets may be used to trade over-the-counter Commodity Interests, such as forward contracts or swaps. Currently, over-the-counter contracts are typically traded on a principal-to-principal non-cleared basis through dealer markets that are dominated by major money center and investment banks and other institutions and that prior to the passage of the Dodd-Frank Act had been essentially unregulated by the CFTC, although this is an area of pending, substantial regulatory change. The markets for over-the-counter contracts will continue to rely upon the integrity of market participants in lieu of the additional regulation imposed by the CFTC on participants in the futures markets. To date, the forward markets have been largely unregulated, except for anti-manipulation and anti-fraud prohibitions, forward contracts have been executed bi-laterally and, in general historically, forward contracts have not been cleared or guaranteed by a third party. On November 16, 2012, the Secretary of the Treasury issued a final determination that exempts both foreign exchange swaps and foreign exchange forwards from the definition of “swap” and, by extension, additional regulatory requirements (such as clearing and margin). The final determination does not extend to other FX derivatives, such as FX options, certain currency swaps, and non-deliverable forwards. While the Dodd-Frank Act and certain regulations adopted thereunder are intended to provide additional protections to participants in the over-the-counter market, the lack of regulation in these markets could expose the Fund in certain circumstances to significant losses in the event of trading abuses or financial failure by participants. While increased regulation of over-the-counter Commodity Interests is likely to result from changes that are required to be effectuated by the Dodd-Frank Act, there is no guarantee that such increased regulation will be effective to reduce these risks.
Each Fund faces the risk of non-performance by the counterparties to the over-the-counter contracts. Unlike in futures contracts, the counterparty to these contracts is generally a single bank or other financial institution, rather than a clearing organization backed by a group of financial institutions. As a result, there will be greater counterparty credit risk in these transactions. A counterparty may not be able to meet its obligations to a Fund, in which case the Fund could suffer significant losses on these contracts. If a counterparty becomes bankrupt or otherwise fails to perform its obligations due to financial difficulties, a Fund may experience significant delays in obtaining any recovery in a bankruptcy or other reorganization proceeding. During any such period, the Fund may have difficulty in determining the value of its contracts with the counterparty, which in turn could result in the overstatement or understatement of the Fund’s NAV. The Fund may eventually obtain only limited recovery or no recovery in such circumstances.
Over-the-counter contracts may have terms that make them less marketable than Futures Contracts. Over-the-counter contracts are less marketable because they are not traded on an exchange, do not have uniform terms and conditions, and are entered into based upon the creditworthiness of the parties and the availability of credit support, such as collateral, and in general, they are not transferable without the consent of the counterparty. These conditions make such contracts less liquid than standardized futures contracts traded on a commodities exchange and diminish the ability to realize the full value of such contracts. In addition, even if collateral is used to reduce counterparty credit risk, sudden changes in the value of over-the-counter transactions may leave a party open to financial risk due to a counterparty default since the collateral held may not cover a party’s exposure on the transaction in such situations. In general, valuing OTC derivatives is less certain than valuing actively traded financial instruments such as exchange traded futures contracts and securities because the price and terms on which such OTC derivatives are entered into or can be terminated are individually negotiated, and those prices and terms may not reflect the best price or terms available from other sources. In addition, while market makers and dealers generally quote indicative prices or terms for entering into or terminating OTC contracts, they typically are not contractually obligated to do so, particularly if they are not a party to the transaction. As a result, it may be difficult to obtain an independent value for an outstanding OTC derivatives transaction.
36
There are Risks Associated with Trading in International Markets
A significant portion of the Futures Contracts entered into by the Funds is traded on United States exchanges. However, a portion of the Funds’ trades may take place on markets or exchanges outside the United States. Some non-U.S. markets present risks because they are not subject to the same degree of regulation as their U.S. counterparts. None of the CFTC, NFA, or any domestic exchange regulates activities of any foreign boards of trade or exchanges, including the execution, delivery and clearing of transactions, has the power to compel enforcement of the rules of a foreign board of trade or exchange or of any applicable non-U.S. laws. Similarly, the rights of market participants, such as the Funds, in the event of the insolvency or bankruptcy of a non-U.S. market or broker are also likely to be more limited than in the case of U.S. markets or brokers. As a result, in these markets, the Funds have less legal and regulatory protection than it does when they trade domestically. Currently the Funds do not place trades on any markets or exchanges outside of the United States and do not anticipate doing so in the foreseeable future. In some of these non-U.S. markets, the performance on a futures contract is the responsibility of the counterparty and is not backed by an exchange or clearing corporation and therefore exposes the Funds to credit risk. Additionally, trading on non-U.S. exchanges is subject to the risks presented by exchange controls, expropriation, increased tax burdens and exposure to local economic declines and political instability. An adverse development with respect to any of these variables could reduce the profit or increase the loss earned on trades in the affected international markets.
The price of any non-U.S. Commodity Interest and, therefore, the potential profit and loss on such investment, may be affected by any variance in the foreign exchange rate between the time the order is placed and the time it is liquidated, offset or exercised. As a result, changes in the value of the local currency relative to the U.S. dollar may cause losses to a Fund even if the contract is profitable. The Funds invest primarily in Commodity Interests that are traded or sold in the United States. However, a portion of the trades for a Fund may take place in markets and on exchanges outside the United States. Some non-U.S. markets present risks because they are not subject to the same degree of regulation as their U.S. counterparts. In some of these non-U.S. markets, the performance on a contract is the responsibility of the counterparty and is not backed by an exchange or clearing corporation and therefore exposes a Fund to credit risk. Trading in non-U.S. markets also leaves a Fund susceptible to fluctuations in the value of the local currency against the U.S. dollar.
The CFTC’s implementation of its regulations under the Dodd-Frank Act may further affect the ability of the Funds to enter into foreign exchange contracts and to hedge its exposure to foreign exchange loss.
Some non-U.S. exchanges also may be in a more developmental stage so that prior price histories may not be indicative of current price dynamics. In addition, a Fund may not have the same access to certain positions on foreign trading exchanges as do local traders, and the historical market data on which the Sponsor bases its strategies may not be as reliable or accessible as it is for U.S. exchanges.
The Funds are Treated as Partnerships for Tax Purposes which Means that There May be a Lack of Certainty as to Tax Treatment for an Investor’s Gains and Losses
Cash or property will be distributed at the sole discretion of the Sponsor, and the Sponsor currently does not intend to make cash or other distributions with respect to Shares. You will be required to pay U.S. federal income tax and, in some cases, state, local, or foreign income tax, on your allocable share of a Fund’s taxable income, without regard to whether you receive distributions or the amount of any distributions. Therefore, the tax liability resulting from your ownership of Shares may exceed the amount of cash or value of property (if any) distributed.
Due to the application of the assumptions and conventions applied by a Fund in making allocations for U.S. federal income tax purposes and other factors, your allocable share of the Fund’s income, gain, deduction or loss may be different than your economic profit or loss from your Shares for a taxable year. This difference could be temporary or permanent and, if permanent, could result in your being taxed on amounts in excess of your economic income.
The Funds are treated as partnerships for United States federal income tax purposes. The U.S. tax rules pertaining to entities taxed as partnerships are complex and their application to publicly traded partnerships such as the Funds are in many respects uncertain. The Funds apply certain assumptions and conventions in an attempt to comply with the intent of the applicable rules and to report taxable income, gains, deductions, losses and credits in a manner that properly reflects Shareholders’ economic gains and losses. These assumptions and conventions may not fully comply with all aspects of the Internal Revenue Code (the “Code”) and applicable Treasury Regulations, however, and it is possible that the U.S. Internal Revenue Service (the “IRS”) will successfully challenge our allocation methods and require us to reallocate items of income, gain, deduction, loss or credit in a manner that adversely affects you. If this occurs, you may be required to file an amended tax return and to pay additional taxes plus deficiency interest.
The Trust has received an opinion of counsel that, under current U.S. federal income tax laws, the Funds will be treated as partnerships that are not taxable as corporations for U.S. federal income tax purposes, provided that (i) at least 90 percent of each Fund’s annual gross income consists of “qualifying income” as defined in the Code, (ii) the Funds are organized and operated in accordance with its governing agreements and applicable law, and (iii) the Funds do not elect to be taxed as corporations for federal income tax purposes. Although the Sponsor anticipates that the Funds have satisfied and will continue to satisfy the “qualifying income” requirement for all of its taxable years, that result cannot be assured. The Funds have not requested and will not request any ruling from the IRS with respect to its classification as partnerships not taxable as corporations for federal income tax purposes. If the IRS were to successfully assert that the Funds are taxable as corporations for federal income tax purposes in any taxable year, rather than passing through its income, gains, losses and deductions proportionately to Shareholders, each Fund would be subject to tax on its net income for the year at corporate tax rates. In addition, although the Sponsor does not currently intend to make distributions with respect to Shares, any distributions would be taxable to Shareholders as dividend income. Taxation of the Funds as corporations could materially reduce the after-tax return on an investment in Shares and could substantially reduce the value of your Shares.
37
Although the timing and nature of legislative changes is uncertain, based on recent comments made by the current Administration and Congress, the possibility exists that there will be significant tax reform legislation considered by the current Congress in the next several years. Among other things, measures have been proposed that would impact the general tax rates for corporations and individuals, tax rates on investment income, and base broadening including changes to the interest deduction. Overseas property investment may also be impacted by international tax reform. The taxation of investments in pass-through entities may also be altered as a result of tax reform. Congress may enact all or none of these or adopt additional measures not mentioned. Please consult a tax advisor with respect to legislative developments and their effect on an investment in any Shares of the Funds.
Risks Specific to the Teucrium Corn Fund
Investors may choose to use the Fund as a means of investing indirectly in corn, and there are risks involved in such investments. The risks and hazards that are inherent in corn production may cause the price of corn to fluctuate widely. Price movements for corn are influenced by, among other things: weather conditions, crop failure, production decisions, governmental policies, changing demand, the corn harvest cycle, and various economic and monetary events. Corn production is also subject to U.S. federal, state and local regulations that materially affect operations.
The price movements for corn are influenced by, among other things, weather conditions, crop disease, transportation difficulties, various planting, growing and harvesting problems, governmental policies, changing demand, and seasonal fluctuations in supply. More generally, commodity prices may be influenced by economic and monetary events such as changes in interest rates, changes in balances of payments and trade, U.S. and international inflation rates, currency valuations and devaluations, U.S. and international economic events, and changes in the philosophies and emotions of market participants. Because the Fund invests primarily in interests in a single commodity, it is not a diversified investment vehicle, and therefore may be subject to greater volatility than a diversified portfolio of stocks or bonds or a more diversified commodity pool.
The Fund is subject to the risks and hazards of the corn market because it invests in Corn Interests. The risks and hazards that are inherent in the corn market may cause the price of corn to fluctuate widely. If the changes in percentage terms of the Fund’s Shares accurately track the percentage changes in the Benchmark or the spot price of corn, then the price of its Shares will fluctuate accordingly.
The price and availability of corn is influenced by economic and industry conditions, including but not limited to supply and demand factors such as: crop disease and infestation (including, but not limited to, Leaf Blight, Ear Rot and Root Rot); transportation difficulties; various planting, growing, or harvesting problems; and severe weather conditions (particularly during the spring planting season and the fall harvest) such as drought, floods, or frost that are difficult to anticipate and which cannot be controlled. Demand for corn in the United States to produce ethanol has also been a significant factor affecting the price of corn. In turn, demand for ethanol has tended to increase when the price of gasoline has increased, and has been significantly affected by United States governmental policies designed to encourage the production of ethanol. Recent changes in government policy have the potential to reduce the demand for ethanol over the next several years. Additionally, demand for corn is affected by changes in consumer tastes, national, regional and local economic conditions, and demographic trends. Finally, because corn is often used as an ingredient in livestock feed, demand for corn is subject to risks associated with the outbreak of livestock disease.
Corn production is subject to United States federal, state, and local policies and regulations that materially affect operations. Governmental policies affecting the agricultural industry, such as taxes, tariffs, duties, subsidies, incentives, acreage control, and import and export restrictions on agricultural commodities and commodity products, can influence the planting of certain crops, the location and size of crop production, the volume and types of imports and exports, the availability and competitiveness of feedstocks as raw materials, and industry profitability. Additionally, corn production is affected by laws and regulations relating to, but not limited to, the sourcing, transporting, storing, and processing of agricultural raw materials as well as the transporting, storing and distributing of related agricultural products. U.S. corn producers also must comply with various environmental laws and regulations, such as those regulating the use of certain pesticides, and local laws that regulate the production of genetically modified crops. In addition, international trade disputes can adversely affect agricultural commodity trade flows by limiting or disrupting trade between countries or regions.
Seasonal fluctuations in the price of corn may cause risk to an investor because of the possibility that Share prices will be depressed because of the corn harvest cycle. In the United States, the corn market is normally at its weakest point, and corn prices are lowest, shortly before and during the harvest (between September and November), due to the high supply of corn in the market. Conversely, corn prices are generally highest during the winter and spring (between December and May), when farmer-owned corn has largely been sold and used. Seasonal corn market peaks generally occur after planting is complete in May or June, and again as harvest begins around August. These normal market conditions are, however, often influenced by weather patterns, and domestic and global economic conditions, among others factors, and any specific year may not necessarily follow the traditional seasonal fluctuations described above. In the futures market, these seasonal fluctuations are typically reflected in contracts expiring in the relevant season (e.g., contracts expiring during the harvest season are typically priced lower than contracts expiring in the winter and spring). Thus, seasonal fluctuations could result in an investor incurring losses upon the sale of Fund Shares, particularly if the investor needs to sell Shares when the Benchmark Component Futures Contracts are, in whole or part, Corn Futures Contracts expiring in the fall.
38
The CFTC and U.S. designated contract markets such as the CBOT have established position limits on the maximum net long or net short futures contracts in commodity interests that any person or group of persons under common trading control (other than as a hedge, which an investment by the Fund is not) may hold, own or control. For example, the current position limit for aggregate investments at any one time in U.S. exchange traded Corn Futures Contracts, non-U.S. exchange Corn Futures Contracts, and over-the-counter corn swaps are 600 spot month contracts, 33,000 contracts expiring in any other non-spot single month, or 33,000 cumulative total for all non-spot months. These position limits are fixed ceilings that the Fund would not be able to exceed without specific CFTC authorization.
All of these limits may potentially cause a tracking error between the price of the Shares and the Benchmark. This may in turn prevent you from being able to effectively use the Fund as a way to hedge against corn-related losses or as a way to indirectly invest in corn.
The Fund does not intend to limit the size of the offering and will attempt to expose substantially all of its proceeds to the corn market utilizing Corn Interests. If the Fund encounters position limits, accountability levels, or price fluctuation limits for Corn Futures Contracts on the CBOT, it may then, if permitted under applicable regulatory requirements, purchase Other Corn Interests and/or Corn Futures Contracts listed on foreign exchanges. However, the Corn Futures Contracts available on such foreign exchanges may have different underlying sizes, deliveries, and prices. In addition, the Corn Futures Contracts available on these exchanges may be subject to their own position limits and accountability levels. In any case, notwithstanding the potential availability of these instruments in certain circumstances, position limits could force the Fund to limit the number of Creation Baskets that it sells.
Risks Specific to the Teucrium Soybean Fund
Investors may choose to use the Fund as a means of investing indirectly in soybeans, and there are risks involved in such investments. The risks and hazards that are inherent in soybean production may cause the price of soybeans to fluctuate widely. Global price movements for soybeans are influenced by, among other things: weather conditions, crop failure, production decisions, governmental policies, changing demand, the soybean harvest cycle, and various economic and monetary events. Soybean production is also subject to domestic and foreign regulations that materially affect operations.
As discussed in more detail below, price movements for soybeans are influenced by, among other things, weather conditions, crop disease, transportation difficulties, various planting, growing and harvesting problems, governmental policies, changing demand, and seasonal fluctuations in supply. More generally, commodity prices may be influenced by economic and monetary events such as changes in interest rates, changes in balances of payments and trade, U.S. and international inflation rates, currency valuations and devaluations, U.S. and international economic events, and changes in the philosophies and emotions of market participants. Because the Fund invests primarily in interests in a single commodity, it is not a diversified investment vehicle, and therefore may be subject to greater volatility than a diversified portfolio of stocks or bonds or a more diversified commodity pool.
The Fund is subject to the risks and hazards of the soybean market because it invests in Soybean Interests. The risks and hazards that are inherent in the soybean market may cause the price of soybeans to fluctuate widely. If the changes in percentage terms of the Fund’s Shares accurately track the percentage changes in the Benchmark or the spot price of soybeans, then the price of its Shares will fluctuate accordingly.
The price and availability of soybeans is influenced by economic and industry conditions, including but not limited to supply and demand factors such as: crop disease; weed control; water availability; various planting, growing, or harvesting problems; severe weather conditions such as drought, floods, heavy rains, frost, or natural disasters that are difficult to anticipate and which cannot be controlled; uncontrolled fires, including arson; challenges in doing business with foreign companies; legal and regulatory restrictions; transportation costs; interruptions in energy supply; currency exchange rate fluctuations; and political and economic instability. Additionally, demand for soybeans is affected by changes in international, national, regional and local economic conditions, and demographic trends. The increased production of soybean crops in South America and the rising demand for soybeans in emerging nations such as China and India have increased competition in the soybean market.
The supply of soybeans could be reduced by the spread of soybean rust. Soybean rust is a wind-borne fungal disease that attacks soybeans. Although soybean rust can be killed with chemicals, chemical treatment increases production costs for farmers.
Soybean production is subject to United States and foreign policies and regulations that materially affect operations. Governmental policies affecting the agricultural industry, such as taxes, tariffs, duties, subsidies, incentives, acreage control, and import and export restrictions on agricultural commodities and commodity products, can influence the planting of certain crops, the location and size of crop production, the volume and types of imports and exports, and industry profitability. Additionally, soybean production is affected by laws and regulations relating to, but not limited to, the sourcing, transporting, storing and processing of agricultural raw materials as well as the transporting, storing and distributing of related agricultural products. Soybean producers also may need to comply with various environmental laws and regulations, such as those regulating the use of certain pesticides. In addition, international trade disputes can adversely affect agricultural commodity trade flows by limiting or disrupting trade between countries or regions.
Because processing soybean oil can create trans-fats, the demand for soybean oil may decrease due to heightened governmental regulation of trans-fats or trans-fatty acids. The U.S. Food and Drug Administration currently requires food manufacturers to disclose levels of trans-fats contained in their products, and various local governments have enacted or are considering restrictions on the use of trans-fats in restaurants. Several food processors have either switched or indicated an intention to switch to oil products with lower levels of trans-fats or trans-fatty acids.
39
In recent years, there has been increased global interest in the production of biofuels as alternatives to traditional fossil fuels and as a means of promoting energy independence. Soybeans can be converted into biofuels such as biodiesel. Accordingly, the soybean market has become increasingly affected by demand for biofuels and related legislation.
The costs related to soybean production could increase and soybean supply could decrease as a result of restrictions on the use of genetically modified soybeans, including requirements to segregate genetically modified soybeans and the products generated from them from other soybean products.
Seasonal fluctuations in the price of soybeans may cause risk to an investor because of the possibility that Share prices will be depressed because of the soybean harvest cycle. In the futures market, fluctuations are typically reflected in contracts expiring in the harvest season (i.e., contracts expiring during the fall are typically priced lower than contracts expiring in the winter and spring). Thus, seasonal fluctuations could result in an investor incurring losses upon the sale of Fund Shares, particularly if the investor needs to sell Shares when the Benchmark Component Futures Contracts are, in whole or part, Soybean Futures Contracts expiring in the fall.
The CFTC and U.S. designated contract markets have established position limits on the maximum net long or net short futures contracts in commodity interests that any person or group of persons under common trading control (other than as a hedge, which an investment by the Fund is not) may hold, own or control. For example, the current position limit for aggregate investments at any one time in U.S. exchange traded Soybean Futures Contracts, non-U.S. exchange Soybean Futures Contracts, and over-the-counter soybean swaps are 600 spot month contracts, 15,000 contracts expiring in any other single non-spot month, or 15,000 cumulative total for all non-spot months. These position limits are fixed ceilings that the Fund would not be able to exceed without specific CFTC authorization.
All of these limits may potentially cause a tracking error between the price of the Shares and the Benchmark. This may in turn prevent you from being able to effectively use the Fund as a way to hedge against soybean-related losses or as a way to indirectly invest in soybeans.
If the Fund encounters position limits or price fluctuation limits for Soybean Futures Contracts on the CBOT, it may then, if permitted under applicable regulatory requirements, purchase Other Soybean Interests and/or Soybean Futures Contracts listed on foreign exchanges. However, the Soybean Futures Contracts available on such foreign exchanges may have different underlying sizes, deliveries, and prices. In addition, the Soybean Futures Contracts available on these exchanges may be subject to their own position limits or similar restrictions. In any case, notwithstanding the potential availability of these instruments in certain circumstances, position limits could force the Fund to limit the number of Creation Baskets that it sells.
Risks Specific to the Teucrium Sugar Fund
Investors may choose to use the Fund as a means of investing indirectly in sugar, and there are risks involved in such investments. The risks and hazards that are inherent in sugar production may cause the price of sugar to fluctuate widely. Global price movements for sugar are influenced by, among other things: weather conditions, crop failure, production decisions, governmental policies, changing demand, the sugar harvest cycle, and various economic and monetary events. Sugar production is also subject to domestic and foreign regulations that materially affect operations.
As discussed in more detail below price movements for sugar are influenced by, among other things, weather conditions, crop disease, transportation difficulties, various planting, growing and harvesting problems, governmental policies, changing demand, and seasonal fluctuations in supply. More generally, commodity prices may be influenced by economic and monetary events such as changes in interest rates, changes in balances of payments and trade, U.S. and international inflation rates, currency valuations and devaluations, U.S. and international economic events, and changes in the philosophies and emotions of market participants. Because the Fund invests primarily in interests in a single commodity, it is not a diversified investment vehicle, and therefore may be subject to greater volatility than a diversified portfolio of stocks or bonds or a more diversified commodity pool.
The Fund is subject to the risks and hazards of the world sugar market because it invests in Sugar Interests. The two primary sources for the production of sugar are sugarcane and sugar beets, both of which are grown in various countries around the world. The risks and hazards that are inherent in the world sugar market may cause the price of sugar to fluctuate widely. If the changes in percentage terms of the Fund’s Shares accurately track the percentage changes in the Benchmark or the spot price of sugar, then the price of its Shares will fluctuate accordingly.
The global price and availability of sugar is influenced by economic and industry conditions, including but not limited to supply and demand factors such as: crop disease; weed control; water availability; various planting, growing, or harvesting problems; severe weather conditions such as drought, floods, or frost that are difficult to anticipate and which cannot be controlled; uncontrolled fires, including arson; challenges in doing business with foreign companies; legal and regulatory restrictions; fluctuation of shipping rates; currency exchange rate fluctuations; and political and economic instability. Global demand for sugar to produce ethanol has also been a significant factor affecting the price of sugar. Additionally, demand for sugar is affected by changes in consumer tastes, national, regional and local economic conditions, and demographic trends. The spread of consumerism and the rising affluence of emerging nations such as China and India have created demand for sugar. An influx of people in developing countries moving from rural to urban areas may create more disposable income to be spent on sugar products, and might also reduce sugar production in rural areas on account of worker shortages, all of which would result in upward pressure on sugar prices. On the other hand, public health concerns regarding obesity, heart disease and diabetes, particularly in developed countries, may reduce demand for sugar. In light of the time it takes to grow sugarcane and sugar beets and the cost of new facilities for processing these crops, it may not be possible to increase supply quickly or in a cost-effective manner in response to an increase in demand for sugar.
Sugar production is subject to United States and foreign policies and regulations that materially affect operations. Governmental policies affecting the agricultural industry, such as taxes, tariffs, duties, subsidies, incentives, acreage control, and import and export restrictions on agricultural commodities and commodity products, can influence the planting of certain crops, the location and size of crop production, the volume and types of imports and exports, and industry profitability. Many foreign countries subsidize sugar production, resulting in lower prices, but this has led other countries, including the United States, to impose tariffs and import restrictions on sugar imports. Sugar producers also may need to comply with various environmental laws and regulations, such as those regulating the use of certain pesticides.
40
Seasonal fluctuations in the price of sugar may cause risk to an investor because of the possibility that Share prices will be depressed because of the sugar harvest cycle. In the futures market, contracts expiring during the harvest season are typically priced lower than contracts expiring in the winter and spring. While the sugar harvest seasons varies from country to country, prices of Sugar Futures Contracts tend to be lowest in the late spring and early summer and again in early autumn of the Northern Hemisphere, reflecting the varied harvest seasons in Brazil, India, and Thailand the world’s leading producers and exporters of sugarcane. Thus, seasonal fluctuations could result in an investor incurring losses upon the sale of Fund Shares, particularly if the investor needs to sell Shares when the Benchmark Component Futures Contracts are, in whole or part, Sugar Futures Contracts expiring in the Northern Hemisphere’s late spring, early summer, or early autumn.
U.S. designated contract markets such as the ICE Futures and the NYMEX have established position limits and accountability levels on the maximum net long or net short Sugar Futures Contracts that any person or group of persons under common trading control may hold, own or control. The CFTC has not currently set position limits for Sugar Futures Contracts, and the ICE Futures and the NYMEX have established position limits only on spot month Sugar No. 11 Futures Contracts. For example, the ICE Futures’ position limit for Sugar No. 11 Futures Contracts is 5,000 spot month contracts, whereas the NYMEX Sugar No. 11 Futures limit is 1,000 spot month contracts, generally applicable only during the last month before expiration. All Sugar Futures Contracts held under the control of the Sponsor, including those held by any future series of the Trust, will be aggregated in determining the application of these position limits. However, because spot month contracts are not Benchmark Component Futures Contracts and the Fund’s roll strategy calls for the sale of all spot month Sugar No.11 Futures Contracts prior to the time the position limits would become applicable, it is unlikely that position limits on Sugar Futures Contracts will come into play.
In contrast to position limits, accountability levels are not fixed ceilings, but rather thresholds above which an exchange may exercise greater scrutiny and control over an investor, including by imposing position limits on the investor. For example, the current ICE Futures-established accountability level for investments in Sugar No. 11 Futures Contracts for any one month is 10,000, and the accountability level for all combined months is 15,000. (The current accountability level for Sugar No. 11 Futures Contracts traded on the NYMEX is 9,000 for any one month, and 9,000 for all combined months. Even though accountability levels are not fixed ceilings, the Fund does not intend to invest in Sugar Futures Contracts in excess of any applicable accountability levels.
All of these limits may potentially cause a tracking error between the price of the Shares and the Benchmark. This may in turn prevent you from being able to effectively use the Fund as a way to hedge against sugar-related losses or as a way to indirectly invest in sugar.
If the Fund encounters accountability levels, position limits, or price fluctuation limits for Sugar Futures Contracts on ICE Futures, it may then, if permitted under applicable regulatory requirements, purchase Other Sugar Interests and/or Sugar Futures Contracts listed on the NYMEX or foreign exchanges. However, the Sugar Futures Contracts available on such foreign exchanges may have different underlying sizes, deliveries, and prices. In addition, the Sugar Futures Contracts available on these exchanges may be subject to their own position limits and accountability levels. In any case, notwithstanding the potential availability of these instruments in certain circumstances, position limits could force the Fund to limit the number of Creation Baskets that it sells.
Risks Specific to the Teucrium Wheat Fund
Investors may choose to use the Fund as a means of investing indirectly in wheat, and there are risks involved in such investments. The risks and hazards that are inherent in wheat production may cause the price of wheat to fluctuate widely. Price movements for wheat are influenced by, among other things: weather conditions, crop failure, production decisions, governmental policies, changing demand, the wheat harvest cycle, and various economic and monetary events. Wheat production is also subject to U.S. federal, state and local regulations that materially affect operations.
As discussed in more detail below, price movements for wheat are influenced by, among other things, weather conditions, crop disease, transportation difficulties, various planting, growing and harvesting problems, governmental policies, changing demand, and seasonal fluctuations in supply. More generally, commodity prices may be influenced by economic and monetary events such as changes in interest rates, changes in balances of payments and trade, U.S. and international inflation rates, currency valuations and devaluations, U.S. and international economic events, and changes in the philosophies and emotions of market participants. Because the Fund invests primarily in interests in a single commodity, it is not a diversified investment vehicle, and therefore may be subject to greater volatility than a diversified portfolio of stocks or bonds or a more diversified commodity pool.
The Fund is subject to the risks and hazards of the wheat market because it invests in Wheat Interests. The risks and hazards that are inherent in the wheat market may cause the price of wheat to fluctuate widely. If the changes in percentage terms of the Fund’s Shares accurately track the percentage changes in the Benchmark or the spot price of wheat, then the price of its Shares will fluctuate accordingly.
The price and availability of wheat is influenced by economic and industry conditions, including but not limited to supply and demand factors such as: crop disease; weed control; water availability; various planting, growing, or harvesting problems; severe weather conditions such as drought, floods, or frost that are difficult to anticipate and which cannot be controlled. Demand for food products made from wheat flour is affected by changes in consumer tastes, national, regional and local economic conditions, and demographic trends. More specifically, demand for such food products in the United States is relatively unaffected by changes in wheat prices or disposable income, but is closely tied to tastes and preferences. For example, in recent years the increase in the popularity of low-carbohydrate diets caused the consumption of wheat flour to decrease rapidly before rebounding somewhat after 2005. Export demand for wheat fluctuates yearly, based largely on crop yields in the importing countries.
41
Wheat production is subject to United States federal, state and local policies and regulations that materially affect operations. Governmental policies affecting the agricultural industry, such as taxes, tariffs, duties, subsidies, incentives, acreage control, and import and export restrictions on agricultural commodities and commodity products, can influence the planting of certain crops, the location and size of crop production, the volume and types of imports and exports, the availability and competitiveness of feedstocks as raw materials, and industry profitability. Additionally, wheat production is affected by laws and regulations relating to, but not limited to, the sourcing, transporting, storing and processing of agricultural raw materials as well as the transporting, storing and distributing of related agricultural products. U.S. wheat producers also must comply with various environmental laws and regulations, such as those regulating the use of certain pesticides, and local laws that regulate the production of genetically modified crops. In addition, international trade disputes can adversely affect agricultural commodity trade flows by limiting or disrupting trade between countries or regions.
Seasonal fluctuations in the price of wheat may cause risk to an investor because of the possibility that Share prices will be depressed because of the wheat harvest cycle. In the United States, the market for winter wheat, the type of wheat upon which CBOT Wheat Futures Contracts are based, is at its lowest point, and wheat prices are lowest, shortly before and during the harvest (in the spring or early summer), due to the high supply of wheat in the market. Conversely, winter wheat prices are generally highest in the fall or early winter, when the wheat harvested that year has largely been sold and used. In the futures market, these seasonal fluctuations are typically reflected in contracts expiring in the relevant season (e.g., contracts expiring during the harvest season are typically priced lower than contracts expiring in the fall and early winter). Thus, seasonal fluctuations could result in an investor incurring losses upon the sale of Fund Shares, particularly if the investor needs to sell Shares when the Benchmark Component Futures Contracts are, in whole or part, Wheat Futures Contracts expiring in the spring.
Position limits and daily price fluctuation limits set by the CFTC and the exchanges have the potential to cause tracking error, which could cause the price of Shares to substantially vary from the Benchmark and prevent you from being able to effectively use the Fund as a way to hedge against wheat-related losses or as a way to indirectly invest in wheat.
The CFTC and U.S. designated contract markets such as the CBOT have established position limits on the maximum net long or net short futures contracts in commodity interests that any person or group of persons under common trading control (other than as a hedge, which an investment by the Fund is not) may hold, own or control. For example, the current position limit for aggregate investments at any one time in U.S. exchange traded Wheat Futures Contracts, non-U.S. exchange linked Wheat Futures Contracts, and over-the-counter wheat swaps are 600 spot month contracts, 12,000 contracts expiring in any other single month, or cumulative 12,000 total for all months. These position limits are fixed ceilings that the Fund would not be able to exceed without specific CFTC authorization.
If the Fund encounters position limits, accountability levels, or price fluctuation limits for Wheat Futures Contracts on the CBOT, it may then, if permitted under applicable regulatory requirements, purchase Other Wheat Interests and/or Wheat Futures Contracts listed on foreign exchanges. However, the Wheat Futures Contracts available on such foreign exchanges may have different underlying sizes, deliveries, and prices. In addition, the Wheat Futures Contracts available on these exchanges may be subject to their own position limits and accountability levels. In any case, notwithstanding the potential availability of these instruments in certain circumstances, position limits could force the Fund to limit the number of Creation Baskets that it sells.
Item 1B. Unresolved Staff Comments
There are no unresolved staff comments.
Not applicable.
Within the past 5 years of the date of this filing, there have been no material administrative, civil or criminal actions against the Sponsor, the Trust or any of the Funds, or any principal or affiliate of any of them. This includes any actions pending, on appeal, concluded, threatened, or otherwise known to them.
Item 4. Mine Safety Disclosures
Not applicable.
Item 5. Market for Registrant’s Common Equity, Related Stockholder Matters and Issuer Purchase of Equity Securities
The principal trading market for the shares of CORN, SOYB, CANE, WEAT and TAGS is the NYSE Arca.
42
Price Range of Shares
The following tables set forth the range of reported high and low closing prices of the shares for each Fund as reported on the NYSE Arca for the fiscal year ended December 31, 2016 and 2015.
The following table sets forth the range of reported high and low closing prices of the shares of the Teucrium Corn Fund (symbol “CORN”) as reported on the NYSE Arca:
| Fiscal Year Ended December 31, 2016: | High | Low | ||||||||
| Quarter Ended | ||||||||||
| March 31, 2016 | $ | 21.78 | $ | 20.12 | ||||||
| June 30, 2016 | $ | 23.60 | $ | 20.21 | ||||||
| September 30, 2016 | $ | 20.31 | $ | 17.71 | ||||||
| December 31, 2016 | $ | 19.71 | $ | 18.45 | ||||||
| Fiscal Year Ended December 31, 2015: | High | Low | ||||||||
| Quarter Ended | ||||||||||
| March 31, 2015 | $ | 27.12 | $ | 24.46 | ||||||
| June 30, 2015 | $ | 25.85 | $ | 22.41 | ||||||
| September 30, 2015 | $ | 26.99 | $ | 22.15 | ||||||
| December 31, 2015 | $ | 23.99 | $ | 21.22 | ||||||
The following table sets forth the range of reported high and low closing prices of the shares of the Teucrium Soybean Fund (symbol “SOYB”) as reported on the NYSE Arca:
| Fiscal Year Ended December 31, 2016: | High | Low | ||||||||
| Quarter Ended | ||||||||||
| March 31, 2016 | $ | 18.13 | $ | 17.06 | ||||||
| June 30, 2016 | $ | 21.62 | $ | 17.96 | ||||||
| September 30, 2016 | $ | 21.14 | $ | 18.16 | ||||||
| December 31, 2016 | $ | 20.12 | $ | 18.47 | ||||||
| Fiscal Year Ended December 31, 2015: | High | Low | ||||||||
| Quarter Ended | ||||||||||
| March 31, 2015 | $ | 21.37 | $ | 19.29 | ||||||
| June 30, 2015 | $ | 20.49 | $ | 18.49 | ||||||
| September 30, 2015 | $ | 20.54 | $ | 17.42 | ||||||
| December 31, 2015 | $ | 18.41 | $ | 17.26 | ||||||
The following table sets forth the range of reported high and low closing prices of the shares of the Teucrium Sugar Fund (symbol “CANE”) as reported on the NYSE Arca:
| Fiscal Year Ended December 31, 2016: | High | Low | ||||||||
| Quarter Ended | ||||||||||
| March 31, 2016 | $ | 11.31 | $ | 8.69 | ||||||
| June 30, 2016 | $ | 13.33 | $ | 9.84 | ||||||
| September 30, 2016 | $ | 15.04 | $ | 12.52 | ||||||
| December 31, 2016 | $ | 15.02 | $ | 12.23 | ||||||
| Fiscal Year Ended December 31, 2015: | High | Low | ||||||||
| Quarter Ended | ||||||||||
| March 31, 2015 | $ | 12.95 | $ | 9.60 | ||||||
| June 30, 2015 | $ | 10.88 | $ | 9.05 | ||||||
| September 30, 2015 | $ | 9.58 | $ | 7.93 | ||||||
| December 31, 2015 | $ | 10.14 | $ | 8.83 | ||||||
43
The following table sets forth the range of reported high and low closing prices of the shares of the Teucrium Wheat Fund (symbol “WEAT”) as reported on the NYSE Arca:
| Fiscal Year Ended December 31, 2016: | High | Low | ||||||||
| Quarter Ended | ||||||||||
| March 31, 2016 | $ | 9.33 | $ | 8.56 | ||||||
| June 30, 2016 | $ | 9.59 | $ | 8.25 | ||||||
| September 30, 2016 | $ | 8.18 | $ | 7.05 | ||||||
| December 31, 2016 | $ | 7.47 | $ | 6.71 | ||||||
| Fiscal Year Ended December 31, 2015: | High | Low | ||||||||
| Quarter Ended | ||||||||||
| March 31, 2015 | $ | 12.74 | $ | 10.36 | ||||||
| June 30, 2015 | $ | 12.26 | $ | 9.92 | ||||||
| September 30, 2015 | $ | 11.88 | $ | 9.24 | ||||||
| December 31, 2015 | $ | 10.35 | $ | 9.09 | ||||||
The following table sets forth the range of reported high and low closing prices of the shares of the Teucrium Agricultural Fund (symbol “TAGS”) as reported on the NYSE Arca:
| Fiscal Year Ended December 31, 2016: | High | Low | ||||||||
| Quarter Ended | ||||||||||
| March 31, 2016 | $ | 27.08 | $ | 24.52 | ||||||
| June 30, 2016 | $ | 30.00 | $ | 25.35 | ||||||
| September 30, 2016 | $ | 28.15 | $ | 25.88 | ||||||
| December 31, 2016 | $ | 27.50 | $ | 24.29 | ||||||
| Fiscal Year Ended December 31, 2015: | High | Low | ||||||||
| Quarter Ended | ||||||||||
| March 31, 2015 | $ | 33.05 | $ | 28.21 | ||||||
| June 30, 2015 | $ | 30.88 | $ | 27.49 | ||||||
| September 30, 2015 | $ | 30.91 | $ | 25.58 | ||||||
| December 31, 2015 | $ | 27.50 | $ | 26.00 | ||||||
Change in Net Asset Value per Share
The graphs below reflect the change in net asset value (“NAV”) per share for each year during which a Fund has been in operation. For the first year of operation, the graph reflects the change from the NAV per share from the initial price at the commencement of operations to the price on December 31 for that year-ended. For all other years, the change is from December 31 of the preceding year to December 31 of that year.
44
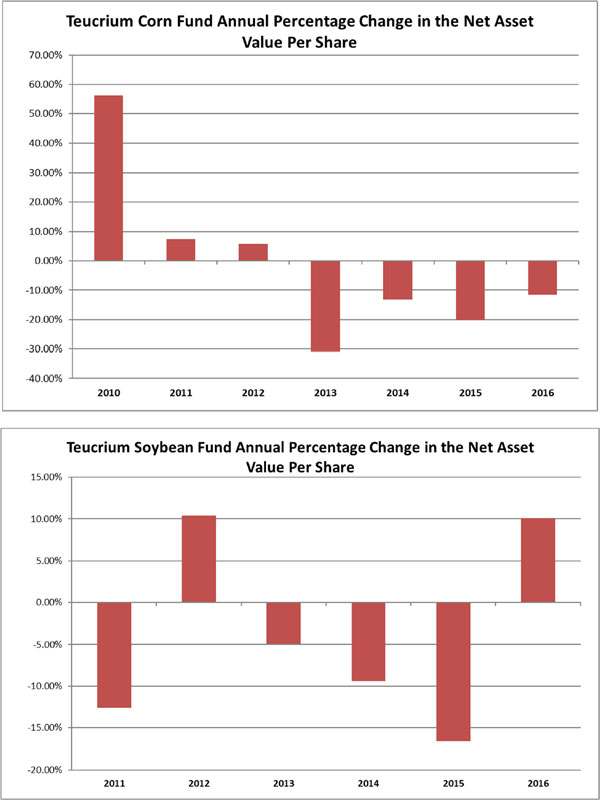
45
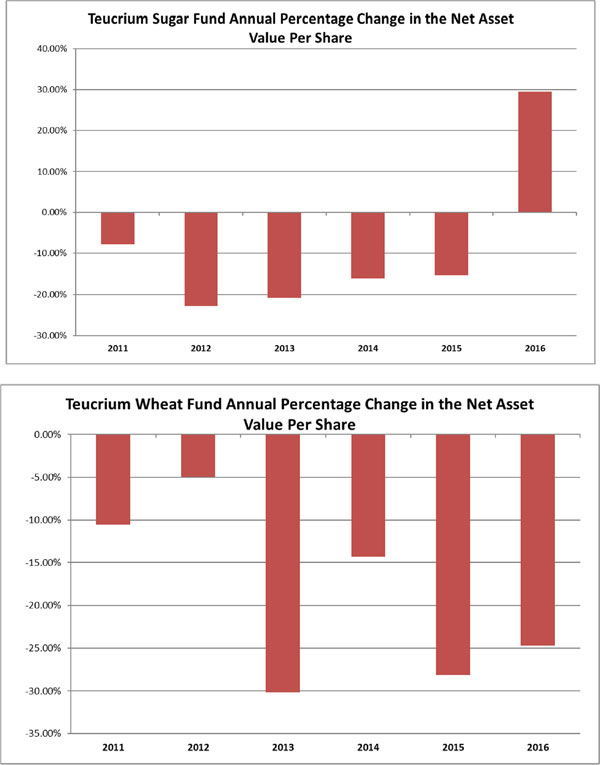
46
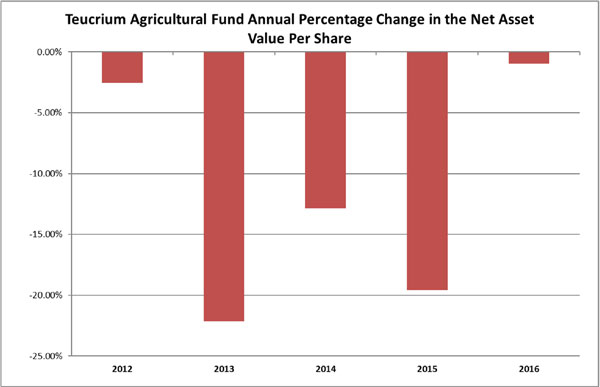
Holders of the Funds
The table below sets forth the approximate number of shareholders for each Fund of the Trust as of December 31, 2016.
| Fund | Approximate Number of Shareholders |
| CORN | 6,520 |
| SOYB | 945 |
| CANE | 600 |
| WEAT | 4,770 |
| TAGS | 100 |
Use of Proceeds
| The original registration statement on Form S-1 registering 30,000,000 common units, or “Shares,” of the Teucrium Corn Fund (File No. 333-162033) was declared effective on June 7, 2010. A second registration statement on Form S-1 (File No. 333-187463) which replaced the original registration statement was declared effective on April 30, 2013 and a third (File No. 333-210010) was declared effective on April 29, 2016. From June 9, 2010 (the commencement of operations) through December 31, 2016, 14,350,000 Shares of the Fund were sold at an aggregate offering price of $456,461,713. The Fund paid fees to Foreside Fund Services, LLC for its services to the Fund from June 9, 2010 (the commencement of operations) through December 31, 2016 in an amount equal to $739,542, resulting in net offering proceeds of $455,722,171. The offering proceeds were invested in corn futures contracts and cash and cash equivalents in accordance with the Fund’s investment objective stated in the prospectus. | |
| The original registration statement on Form S-1 registering 10,000,000 common units, or “Shares,” of Teucrium Soybean Fund (File No. 333-167590) was declared effective on June 17, 2011. A second registration statement on Form S-1 (File No. 333-196210) which replaced the original registration statement was declared effective on June 30, 2014. From September 19, 2011 (the commencement of the offering) through December 31, 2016, 1,975,000 Shares of the Fund were sold at an aggregate offering price of $43,624,191. The Fund paid fees to Foreside Fund Services, LLC for its services to the Fund through December 31, 2016 in an amount equal to $66,121, resulting in net offering proceeds of $43,558,070. The offering proceeds were invested in soybean futures contracts and cash and cash equivalents in accordance with the Fund’s investment objective stated in the prospectus. | |
| The original registration statement on Form S-1 registering 10,000,000 common units, or “Shares,” of Teucrium Sugar Fund (File No. 333-167585) was declared effective on June 17, 2011. A second registration statement on Form S-1 (File No. 333-196211) which replaced the original registration statement was declared effective on June 30, 2014. From September 19, 2011 (the commencement of the offering) through December 31, 2016, 1,100,000 Shares of the Fund were sold at an aggregate offering price of $16,249,671. The Fund paid fees to Foreside Fund Services, LLC for its services to the Fund through December 31, 2016 in an amount equal to $29,859, resulting in net offering proceeds of $16,219,812. The offering proceeds were invested in sugar futures contracts and cash and cash equivalents in accordance with the Fund’s investment objective stated in the prospectus. |
47
| The original registration statement on Form S-1 registering 10,000,000 common units, or “Shares,” of Teucrium Wheat Fund (File No. 333-167591) was declared effective on June 17, 2011. A second registration statement on Form S-1 (File No. 333-196209) which replaced the original registration statement was declared effective on June 30, 2014. A third registration statement on Form S-1 (File No. 333-212481) which registered a total of 25,350,000 shares was declared effective on July 15, 2016. From September 19, 2011 (the commencement of the offering) through December 31, 2016, 11,500,000 Shares of the Fund were sold at an aggregate offering price of $120,366,703. The Fund paid fees to Foreside Fund Services, LLC for its services to the Fund through December 31, 2016 in an amount equal to $140,075, resulting in net offering proceeds of $120,226,628. The offering proceeds were invested in wheat futures contracts and cash and cash equivalents in accordance with the Fund’s investment objective stated in the prospectus. | |
| The original registration statement on Form S-1 registering 5,000,000 common units, or “Shares,” of Teucrium Agricultural Fund (File No. 333-173691) was declared effective on February 10, 2012. A second registration statement on Form S-1 (File No. 333-201953) which replaced the original registration statement was declared effective on April 30, 2015. From March 28, 2012 (the commencement of the offering) through December 31, 2016, 350,000 Shares of the Fund were sold at an aggregate offering price of $17,706,578. The Fund paid fees to Foreside Fund Services, LLC for its services to the Fund through December 31, 2016 in an amount equal to $7,819, resulting in net offering proceeds of $17,698,759. The offering proceeds were invested in Shares of the Underlying Funds and cash and cash equivalents in accordance with the Fund’s investment objective stated in the prospectus. |
Issuer Purchases of Equity Securities
The Sponsor, the Trust or any Fund do not purchase shares directly from shareholders; however, the information below details for the current period, October 1 to December 31, 2016, by month and for the year ended December 31, 2016, the share purchases in connection with the redemption of baskets by Authorized Purchasers.
Issuer Purchases of CORN Shares:
| Period | Total
Number of Shares Purchased | Average
Price Paid per Share | Total Number
of Shares Purchased as Part of Publicly Announced Plans or Programs | Maximum Number
(or Approximate Dollar Value) of Shares that May Yet Be Purchased Under the Plans or Programs |
|||||||||||
| October 1, 2016 to October 31, 2016 | — | $ | — | N/A | N/A | ||||||||||
| November 1, 2016 to November 30, 2016 | 550,000 | $ | 18.72 | N/A | N/A | ||||||||||
| December 1, 2016 to December 31, 2016 | 325,000 | $ | 18.72 | N/A | N/A | ||||||||||
| Total | 875,000 | $ | 18.72 | ||||||||||||
| January 1, 2016 to December 31, 2016 | 1,850,000 | $ | 19.39 | N/A | N/A | ||||||||||
Issuer Purchases of SOYB Shares:
| Maximum Number (or | |||||||||||||||
| Total Number of | Approximate Dollar | ||||||||||||||
| Average | Shares Purchased | Value) of Shares that | |||||||||||||
| Total Number of | Price | as Part of Publicly | May Yet Be Purchased | ||||||||||||
| Shares | Paid per | Announced Plans | Under the Plans or | ||||||||||||
| Period | Purchased | Share | or Programs | Programs | |||||||||||
| October 1, 2016 to October 31, 2016 | — | $ | — | N/A | N/A | ||||||||||
| November 1, 2016 to November 30, 2016 | — | $ | — | N/A | N/A | ||||||||||
| December 1, 2016 to December 31, 2016 | 100,000 | $ | 19.51 | N/A | N/A | ||||||||||
| Total | 100,000 | $ | 19.51 | ||||||||||||
| January 1, 2016 to December 31, 2016 | 200,000 | $ | 19.53 | N/A | N/A | ||||||||||
48
Issuer Purchases of WEAT Shares:
| Maximum Number (or | |||||||||||||||
| Total Number of | Approximate Dollar | ||||||||||||||
| Average | Shares Purchased | Value) of Shares that | |||||||||||||
| Total Number of | Price | as Part of Publicly | May Yet Be Purchased | ||||||||||||
| Shares | Paid per | Announced Plans | Under the Plans or | ||||||||||||
| Period | Purchased | Share | or Programs | Programs | |||||||||||
| October 1, 2016 to October 31, 2016 | — | $ | — | N/A | N/A | ||||||||||
| November 1, 2016 to November 30, 2016 | — | $ | — | N/A | N/A | ||||||||||
| December 1, 2016 to December 31, 2016 | — | $ | — | N/A | N/A | ||||||||||
| Total | — | $ | — | ||||||||||||
| January 1, 2016 to December 31, 2016 | 325,000 | $ | 8.50 | N/A | N/A | ||||||||||
Issuer Purchases of CANE Shares:
| Maximum Number (or | |||||||||||||||
| Total Number of | Approximate Dollar | ||||||||||||||
| Average | Shares Purchased | Value) of Shares that | |||||||||||||
| Total Number of | Price | as Part of Publicly | May Yet Be Purchased | ||||||||||||
| Shares | Paid per | Announced Plans | Under the Plans or | ||||||||||||
| Period | Purchased | Share | or Programs | Programs | |||||||||||
| October 1, 2016 to October 31, 2016 | — | $ | — | N/A | N/A | ||||||||||
| November 1, 2016 to November 30, 2016 | 50,000 | $ | 13.64 | N/A | N/A | ||||||||||
| December 1, 2016 to December 31, 2016 | 50,000 | $ | 12.31 | N/A | N/A | ||||||||||
| Total | 100,000 | $ | 12.97 | ||||||||||||
| January 1, 2016 to December 31, 2016 | 375,000 | $ | 11.07 | N/A | N/A | ||||||||||
Dividends
Neither the Trust nor any Fund has made and none intends to make any cash distributions to shareholders.
Item 6. Selected Financial Data
Financial Highlights for the Teucrium Corn Fund (for the years ended December 31, 2016, 2015, 2014, 2013 and 2012).
| CORN | ||||||||||||||||||||
| Year ended | Year ended | Year ended | Year ended | Year ended | ||||||||||||||||
| December 31, 2016 | December 31, 2015 | December 31, 2014 | December 31, 2013 | December 31, 2012 | ||||||||||||||||
| Net assets | $ | 73,213,541 | $ | 61,056,223 | $ | 108,459,507 | $ | 47,499,620 | $ | 37,686,512 | ||||||||||
| Net realized and unrealized (loss) gain on futures contracts | $ | (6,991,162 | ) | $ | (14,193,913 | ) | $ | (4,449,213 | ) | $ | (13,252,851 | ) | $ | 10,009,773 | ||||||
| Net (Loss) Income | $ | (9,564,067 | ) | $ | (17,183,472 | ) | $ | (7,947,064 | ) | $ | (16,269,132 | ) | $ | 6,567,726 | ||||||
| Weighted-average shares outstanding | 3,598,843 | 3,243,223 | 3,460,141 | 1,169,662 | 1,506,835 | |||||||||||||||
| Net (loss) income per share | $ | (2.47 | ) | $ | (5.38 | ) | $ | (4.02 | ) | $ | (13.70 | ) | $ | 2.42 | ||||||
| Net (loss) income per weighted average share | $ | (2.66 | ) | $ | (5.30 | ) | $ | (2.30 | ) | $ | (13.91 | ) | $ | 4.36 | ||||||
| Cash and cash equivalents at end of year | $ | 69,072,284 | $ | 57,110,089 | $ | 106,858,496 | $ | 42,405,220 | $ | 34,631,982 | ||||||||||
Financial Highlights for the Teucrium Soybean Fund (for the years ended December 31, 2016, 2015, 2014, 2013, and 2012).
| SOYB | ||||||||||||||||||||
| Year ended | Year ended | Year ended | Year ended | Year ended | ||||||||||||||||
| December 31, 2016 | December 31, 2015 | December 31, 2014 | December 31, 2013 | December 31, 2012 | ||||||||||||||||
| Net assets | $ | 12,882,100 | $ | 6,502,552 | $ | 11,956,149 | $ | 4,016,972 | $ | 6,636,175 | ||||||||||
| Net realized and unrealized gain (loss) on futures contracts | $ | 1,507,050 | $ | (1,301,212 | ) | $ | (366,913 | ) | $ | (10,938 | ) | $ | (40,425 | ) | ||||||
| Net Income (Loss) | $ | 1,094,528 | $ | (1,517,824 | ) | $ | (582,405 | ) | $ | (393,523 | ) | $ | (511,303 | ) | ||||||
| Weighted-average shares outstanding | 623,023 | 386,237 | 251,648 | 257,127 | 250,277 | |||||||||||||||
| Net income (loss) per share | $ | 1.74 | $ | (3.45 | ) | $ | (2.16 | ) | $ | (1.18 | ) | $ | 2.27 | |||||||
| Net income (loss) per weighted average share | $ | 1.76 | $ | (3.93 | ) | $ | (2.31 | ) | $ | (1.53 | ) | $ | (2.04 | ) | ||||||
| Cash and cash equivalents at end of year | $ | 12,300,383 | $ | 5,937,824 | $ | 11,505,788 | $ | 3,765,791 | $ | 6,169,205 | ||||||||||
Financial Highlights for the Teucrium Sugar Fund (for the years ended December 31, 2016, 2015, 2014, 2013, and 2012).
| CANE | ||||||||||||||||||||
| Year ended | Year ended | Year ended | Year ended | Year ended | ||||||||||||||||
| December 31, 2016 | December 31, 2015 | December 31, 2014 | December 31, 2013 | December 31, 2012 | ||||||||||||||||
| Net assets | $ | 5,513,971 | $ | 5,508,663 | $ | 2,661,212 | $ | 2,468,403 | $ | 2,225,898 | ||||||||||
| Net realized and unrealized gain (loss) on futures contracts | $ | 1,457,243 | $ | (411,880 | ) | $ | (451,965 | ) | $ | (506,016 | ) | $ | (667,574 | ) | ||||||
| Net Income (Loss) | $ | 1,349,263 | $ | (475,806 | ) | $ | (502,562 | ) | $ | (542,436 | ) | $ | (897,618 | ) | ||||||
| Weighted-average shares outstanding | 507,654 | 373,018 | 195,963 | 161,031 | 116,534 | |||||||||||||||
| Net income (loss) per share | $ | 2.95 | $ | (1.81 | ) | $ | (2.27 | ) | $ | (3.71 | ) | $ | (5.25 | ) | ||||||
| Net income (loss) per weighted average share | $ | 2.66 | $ | (1.28 | ) | $ | (2.56 | ) | $ | (3.37 | ) | $ | (7.70 | ) | ||||||
| Cash and cash equivalents at end of year | $ | 5,016,531 | $ | 4,932,791 | $ | 2,489,338 | $ | 2,366,377 | $ | 2,088,533 | ||||||||||
49
Financial Highlights for the Teucrium Wheat Fund (for the years ended December 31, 2016, 2015, 2014, 2013, and 2012).
| WEAT | ||||||||||||||||||||
| Year ended | Year ended | Year ended | Year ended | Year ended | ||||||||||||||||
| December 31, 2016 | December 31, 2015 | December 31, 2014 | December 31, 2013 | December 31, 2012 | ||||||||||||||||
| Net assets | 62,344,759 | $ | 26,529,260 | $ | 22,263,457 | $ | 7,048,087 | $ | 3,791,209 | |||||||||||
| Net realized and unrealized loss on futures contracts | (11,628,525 | ) | $ | (7,200,826 | ) | $ | (1,070,987 | ) | $ | (2,061,837 | ) | $ | (97,050 | ) | ||||||
| Net Loss | (13,111,481 | ) | $ | (8,137,705 | ) | $ | (1,748,035 | ) | $ | (2,447,578 | ) | $ | (440,262 | ) | ||||||
| Weighted-average shares outstanding | 5,340,851 | 2,470,483 | 1,408,223 | 379,525 | 148,979 | |||||||||||||||
| Net loss per share | (2.26 | ) | $ | (3.57 | ) | $ | (2.12 | ) | $ | (6.41 | ) | $ | (1.11 | ) | ||||||
| Net loss per weighted average share | (2.45 | ) | $ | (3.29 | ) | $ | (1.24 | ) | $ | (6.45 | ) | $ | (2.96 | ) | ||||||
| Cash and cash equivalents at end of year | 58,931,911 | $ | 24,579,091 | $ | 21,568,368 | $ | 6,451,639 | $ | 3,356,906 | |||||||||||
Financial Highlights for the Teucrium Agricultural Fund (for the year ended December 31, 2016, 2015, 2014, 2013 and from the commencement of operations (March 28, 2012) through December 31, 2012).
| TAGS | Year
ended December 31, 2016 | Year
ended December 31, 2015 | Year
ended December 31, 2014 | Year
ended December 31, 2013 | From the commencement of operations (March 28, 2012) though December 31, 2012 | |||||||||||||||
| Net assets | $ | 1,316,370 | $ | 1,329,390 | $ | 1,652,749 | $ | 1,896,442 | $ | 2,436,721 | ||||||||||
| Net realized and unrealized loss on securities | $ | (6,231 | ) | $ | (316,182 | ) | $ | (234,501 | ) | $ | (529,472 | ) | $ | (880,180 | ) | |||||
| Net Loss | $ | (13,020 | ) | $ | (323,359 | ) | $ | (243,693 | ) | $ | (540,279 | ) | $ | (902,864 | ) | |||||
| Weighted-average shares outstanding | 50,002 | 50,002 | 50,002 | 50,002 | 103,765 | |||||||||||||||
| Net loss per share | $ | (0.26 | ) | $ | (6.46 | ) | $ | (4.88 | ) | $ | (10.81 | ) | $ | (1.27 | ) | |||||
| Net loss per weighted average share | $ | (0.26 | ) | $ | (6.47 | ) | $ | (4.87 | ) | $ | (10.81 | ) | $ | (8.70 | ) | |||||
| Cash equivalents at end of year | $ | 2,360 | $ | 1,815 | $ | 1,647 | $ | 2,880 | $ | 6,419 | ||||||||||
Item 7. Management’s Discussion and Analysis of Financial Condition and Results of Operations
The following discussion should be read in conjunction with the financial statements and the notes thereto of the Teucrium Commodity Trust and all of the Funds which are series of the Trust included elsewhere in the annual report on Form 10-K.
This annual report on Form 10-K, including this “Management’s Discussion and Analysis of Financial Condition and Results of Operations,” contains forward-looking statements by terminology such as “may,” “will,” “should,” “expect,” “plan,” “anticipate,” “believe,” “estimate,” “predict,” “potential” or the negative of these terms or other comparable terminology. All statements (other than statements of historical fact) included in this filing that address activities, events or developments that will or may occur in the future, including such matters as movements in the commodities markets and indexes that track such movements, operations of the Funds, the Sponsor’s plans and references to the future success of a Fund or the Funds and other similar matters, are forward-looking statements. These statements are only predictions. Actual events or results may differ materially.
These statements are based upon certain assumptions and analyses the Sponsor has made based on its perception of historical trends, current conditions and expected future developments, as well as other factors appropriate in the circumstances. Whether or not actual results and developments will conform to the Sponsor’s expectations and predictions, however, is subject to a number of risks and uncertainties, including the special considerations discussed in this prospectus, general economic, market and business conditions, changes in laws or regulations, including those concerning taxes, made by governmental authorities or regulatory bodies, and other world economic and political developments. Consequently, all the forward-looking statements made in this filing are qualified by these cautionary statements, and there can be no assurance that actual results or developments the Sponsor anticipates will be realized or, even if substantially realized, that they will result in the expected consequences to, or have the expected effects on, the operations of the Funds or the value of the Shares of the Funds.
Trust Overview
The business and operations of the Trust and each Fund are described above under Part I, Item I entitled “Business.”
Critical Accounting Policies
The Trust’s critical accounting policies for all the Funds are as follows:
| 1. | Preparation of the financial statements and related disclosures in conformity with U.S. generally-accepted accounting principles (“GAAP”) requires the application of appropriate accounting rules and guidance, as well as the use of estimates, and requires management to make estimates and assumptions that affect the reported amounts of assets and liabilities, revenue and expense and related disclosure of contingent assets and liabilities during the reporting period of the combined financial statements and accompanying notes. The Trust’s application of these policies involves judgments and actual results may differ from the estimates used. |
| 2. | The Sponsor has determined that the valuation of Commodity Interests that are not traded on a U.S. or internationally recognized futures exchange (such as swaps and other over-the-counter contracts) involves a critical accounting policy. The values which are used by the Funds for futures contracts will be provided by the commodity broker who will use market prices when available, while over-the-counter contracts will be valued based on the present value of estimated future cash flows that would be received from or paid to a third party in settlement of these derivative contracts prior to their delivery date. Values will be determined on a daily basis. |
| 50 |
| 3. | Commodity futures contracts held by the Funds are recorded on the trade date. All such transactions are recorded on the identified cost basis and marked to market daily. Unrealized appreciation or depreciation on commodity futures contracts are reflected in the statement of operations as the difference between the original contract amount and the fair market value as of the last business day of the year or as of the last date of the financial statements. Changes in the appreciation or depreciation between periods are reflected in the statement of operations. Interest on cash equivalents and deposits are recognized on the accrual basis. The Funds earn interest on funds held at the custodian or other financial institutions at prevailing market rates for such investments. |
| 4. | Cash and cash equivalents are cash held at financial institutions in demand-deposit accounts or highly-liquid investments with original maturity dates of three months or less at inception. The Funds reported cash equivalents in the statements of assets and liabilities at market value, or at carrying amounts that approximate fair value, because of their highly-liquid nature and short-term maturities. The Funds have a substantial portion of its assets on deposit with banks. Assets deposited with financial institutions may, at times, exceed federally insured limits. |
| 5. | The use of fair value to measure financial instruments, with related unrealized gains or losses recognized in earnings in each period is fundamental to the Trust’s financial statements. In accordance with GAAP, fair value is defined as the price that would be received to sell an asset or paid to transfer a liability (i.e., the “exit price”) in an orderly transaction between market participants at the measurement date. |
In determining fair value, the Trust uses various valuation approaches. In accordance with GAAP, a fair value hierarchy for inputs is used in measuring fair value that maximizes the use of observable inputs and minimizes the use of unobservable inputs by requiring that the most observable inputs be used when available. Observable inputs are those that market participants would use in pricing the asset or liability based on market data obtained from sources independent of the Trust. Unobservable inputs reflect the Trust’s assumptions about the inputs market participants would use in pricing the asset or liability developed based on the best information available in the circumstances. The fair value hierarchy is categorized into three levels: a) Level 1 - Valuations based on unadjusted quoted prices in active markets for identical assets or liabilities that the Trust has the ability to access. Valuation adjustments and block discounts are not applied to Level 1 securities and financial instruments. Since valuations are based on quoted prices that are readily and regularly available in an active market, valuation of these securities and financial instruments does not entail a significant degree of judgment, b) Level 2 - Valuations based on quoted prices in markets that are not active or for which all significant inputs are observable, either directly or indirectly, and c) Level 3 - Valuations based on inputs that are unobservable and significant to the overall fair value measurement. See the notes within the financial statements for further information.
The Funds and the Trust record their derivative activities at fair value. Gains and losses from derivative contracts are included in the statement of operations. Derivative contracts include futures contracts related to commodity prices. Futures, which are listed on a national securities exchange, such as the CBOT or the New York Mercantile Exchange (“NYMEX”), or reported on another national market, are generally categorized in Level 1 of the fair value hierarchy. OTC derivatives contracts (such as forward and swap contracts) which may be valued using models, depending on whether significant inputs are observable or unobservable, are categorized in Levels 2 or 3 of the fair value hierarchy.
| 6. | Brokerage commissions on all open commodity futures contracts are accrued on a full-turn basis. |
| 7. | Margin is the minimum amount of funds that must be deposited by a commodity interest trader with the trader’s broker to initiate and maintain an open position in futures contracts. A margin deposit acts to assure the trader’s performance of the futures contracts purchased or sold. Futures contracts are customarily bought and sold on initial margin that represents a very small percentage of the aggregate purchase or sales price of the contract. Because of such low margin requirements, price fluctuations occurring in the futures markets may create profits and losses that, in relation to the amount invested, are greater than are customary in other forms of investment or speculation. As discussed below, adverse price changes in the futures contract may result in margin requirements that greatly exceed the initial margin. In addition, the amount of margin required in connection with a particular futures contract is set from time to time by the exchange on which the contract is traded and may be modified from time to time by the exchange during the term of the contract. Brokerage firms, such as the Funds’ clearing brokers, carrying accounts for traders in commodity interest contracts generally require higher amounts of margin as a matter of policy to further protect themselves. Over-the-counter trading generally involves the extension of credit between counterparties, so the counterparties may agree to require the posting of collateral by one or both parties to address credit exposure. |
When a trader purchases an option, there is no margin requirement; however, the option premium must be paid in full. When a trader sells an option, on the other hand, he or she is required to deposit margin in an amount determined by the margin requirements established for the underlying interest and, in addition, an amount substantially equal to the current premium for the option. The margin requirements imposed on the selling of options, although adjusted to reflect the probability that out-of-the-money options will not be exercised, can in fact be higher than those imposed in dealing in the futures markets directly. Complicated margin requirements apply to spreads and conversions, which are complex trading strategies in which a trader acquires a mixture of options positions and positions in the underlying interest.
| 51 |
Ongoing or “maintenance” margin requirements are computed each day by a trader’s clearing broker. When the market value of a particular open futures contract changes to a point where the margin on deposit does not satisfy maintenance margin requirements, a margin call is made by the broker. If the margin call is not met within a reasonable time, the broker may close out the trader’s position. With respect to the Funds’ trading, the Funds (and not its shareholders personally) are subject to margin calls.
Finally, many major U.S. exchanges have passed certain cross margining arrangements involving procedures pursuant to which the futures and options positions held in an account would, in the case of some accounts, be aggregated, and margin requirements would be assessed on a portfolio basis, measuring the total risk of the combined positions.
| 8. | Due from/to broker for investments in financial instruments are securities transactions pending settlement. The Trust and TAGS are subject to credit risk to the extent any broker with whom it conducts business is unable to fulfill contractual obligations on its behalf. The management of the Trust and the Funds monitors the financial condition of such brokers and does not anticipate any losses from these counterparties. Since the inception of the Fund, the principal broker through which the Trust and TAGS clear securities transactions for TAGS is the Bank of New York Mellon Capital Markets. |
| 9. | The investment objective of TAGS is to have the daily changes in percentage terms of the Net Asset Value (“NAV”) of its common units (“Shares”) reflect the daily changes in percentage terms of a weighted average (the “Underlying Fund Average”) of the NAVs per share of four other commodity pools that are series of the Trust and are sponsored by the Sponsor: the Teucrium Corn Fund, the Teucrium Wheat Fund, the Teucrium Soybean Fund and the Teucrium Sugar Fund (collectively, the “Underlying Funds”). The Underlying Fund Average will have a weighting of 25% to each Underlying Fund, and the Fund’s assets will be rebalanced, generally on a daily basis, to maintain the approximate 25% allocation to each Underlying Fund. As such, TAGS will buy, sell and hold as part of its normal operations shares of the four Underlying Funds. The Trust excludes the shares of the other series of the Trust owned by the Teucrium Agricultural Fund from its statements of assets and liabilities. The Trust excludes the net change in unrealized appreciation or depreciation on securities owned by the Teucrium Agricultural Fund from its statements of operations. Upon the sale of the Underlying Funds by the Teucrium Agricultural Fund, the Trust includes any realized gain or loss in its statements of changes in net assets. |
| 10. | For tax purposes, the Funds will be treated as partnerships. Therefore, the Funds do not record a provision for income taxes because the partners report their share of a Fund’s income or loss on their income tax returns. The financial statements reflect the Funds’ transactions without adjustment, if any, required for income tax purposes. |
Results of Operations
The discussion below addresses the material changes in the results of operations for the year ended December 31, 2016 compared to the years ended December 31, 2015 and 2014.
CORN, SOYB, CANE WEAT and TAGS operated for the entirety of all periods discussed below. The combined results of operations for the Trust include NAGS and CRUD for all periods, up through the termination of operations on December 21, 2014. NAGS and CRUD did not operate for any part of 2016 or 2015.
Total expenses for the current and comparative periods are presented both gross and net of any expenses waived or paid by the Sponsor that would have been incurred by the Funds (“expenses waived by the Sponsor”). In addition, certain expenses paid by the Sponsor on behalf of the Funds for the years ended December 31, 2013 that were subject to possible recovery from the Funds in the following year, as had been previously disclosed in aggregate for the Trust in the Forms 10-K for 2013 and 2014, have also been included in expenses and waived expenses in the year incurred by the Sponsor. These expenses, if reimbursed by the Funds to the Sponsor in 2014 are then presented as a reimbursement of expenses previously waived. Consistent treatment has been applied to expenses which have been waived by the Sponsor in the 2014. For all expenses waived in 2014, 2015 and 2016, the Sponsor has determined that no reimbursement will be sought in future periods. “Total expenses, net”, which is after the impact of any expenses waived by or reimbursed to the Sponsor, are presented in the same manner as previously reported. There is, therefore, no impact to or change in the Net gain or Net loss in any period for the Trust and each Fund as a result of this change in presentation.
The Sponsor is responsible for investing the assets of the Fund in accordance with the objectives and policies of the Fund. In addition, the Sponsor arranges for one or more third parties to provide administrative, custodial, accounting, transfer agency and other necessary services to the Fund, including services directly attributable to the Fund such as accounting, financial reporting, regulatory compliance and trading activities, which the Sponsor elected not to outsource. In addition, the Funds, except for TAGS which has no such fee, are contractually obligated to pay a monthly management fee to the Sponsor, based on average daily net assets, at a rate equal to 1.00% per annum.
The Fund generally pays for all brokerage fees, taxes and other expenses, including licensing fees for the use of intellectual property, registration or other fees paid to the SEC, the Financial Industry Regulatory Authority (“FINRA”), or any other regulatory agency in connection with the offer and sale of subsequent Shares after its initial registration and all legal, accounting, printing and other expenses associated therewith. Each Fund also pays its portion of the fees and expenses associated with the Trust’s tax accounting and reporting requirements. Certain aggregate expenses common to all Funds within the Trust are allocated by the Sponsor to the respective funds based on activity drivers deemed most appropriate by the Sponsor for such expenses, including but not limited to relative assets under management and creation and redeem order activity. These aggregate common expenses include, but are not limited to, legal, auditing, accounting and financial reporting, tax-preparation, regulatory compliance, trading activities, and insurance costs, as well as fees paid to the Distributor, which are included in the related line item in the statements of operations. A portion of these aggregate common expenses are related to services provided by the Sponsor or related parties of principals of the Sponsor; these are necessary services to the Funds, which are primarily the cost of performing accounting and financial reporting, regulatory compliance, and trading activities that are directly attributable to the Funds and are, primarily, included as distribution and marketing fees on the statements of operations. These amounts, for the Trust and for each Fund, are detailed in the notes to the financial statements included in Part II of this filing.
| 52 |
The Sponsor has the ability to elect to pay certain expenses on behalf of the Funds or waive the management fee. This election is subject to change by the Sponsor, at its discretion. Expenses paid by the Sponsor and Management fees waived by the Sponsor are, if applicable, presented as waived expenses in the statements of operations for each Fund.
On August 17, 2015 (the “Conversion Date”), U.S. Bank N.A. replaced The Bank of New York Mellon as the Custodian for the Funds. In addition, effective on the Conversion Date, U.S. Bancorp Fund Services, LLC (“USBFS”), a wholly owned subsidiary of U.S. Bank, commenced serving as administrator for each Fund, performing certain administrative and accounting services and preparing certain SEC reports on behalf of the Funds, and also became the registrar and transfer agent for each Fund’s Shares. For such services, U.S. Bank, N.A. and USBFS will receive an asset-based fee, subject to a minimum annual fee.
The Sponsor stated in the Forms 10-Q filed on August 10, 2015 and November 9, 2015, in addition to other documents filed with the Securities and Exchange Commission, that it did not anticipate any material change to the expenses for any Fund, net of expenses waived by the Sponsor, as a result of the servicing conversion to USBFS and U.S. Bank, N.A. For the periods after the Conversion Date presented in this filing, any change in custodian fees and expenses resulting from the change in Administrator and Custodian, net of amounts waived by the Sponsor, are not considered by Management to be material.
For the period January 1, 2016 to December 31, 2016, the Funds, in total, recorded an increase in expenses, gross and net of any expenses waived by or reimbursed to the Sponsor, over what had been recorded in 2015. For the year 2016, total expenses gross of any waived expenses, were $6,146,659, while total expenses, net were $5,308,644. For the year 2015, these were, $5,416,644 and $4,435,961, respectively. For 2014, these were $4,814,899 and $4,554,324, respectively. The increase in expenses for the period 2016 compared to 2015, gross of any waived expenses, was $730,015 which was driven principally by: 1) a $165,793 increase in management fees paid to the Sponsor, 2) a $342,701 increase in professional fees, and 3) a $542,726 increase in distribution and marketing fees. These, and other smaller increase by category, were partially offset by a ($419,536) decrease in custodian fees and expenses related to the replacement of the Bank of New York Mellon on the Conversion Date as described above. Total expenses, net of expenses waived by the Sponsor and reimbursement of expenses previously waived, increased by $872,683 for 2016 compared to 2015 due to the increase in gross expenses as discussed above and a decrease of ($142,668) in expenses waived by the Sponsor.
For the period January 1, 2016 to December 31, 2016, the Funds, in total, recorded an increase in expenses, both gross and net of any expenses waived by or reimbursed to the Sponsor, over what had been recorded in 2014. The increase in expenses, gross of any waived expenses, was $1,331,760 which was principally driven by: 1) a $495,831 increase in professional fees, 2) a $631,097 increase in distribution and marketing fees, and 3) a $200,974 increase in custodian fees and expenses. There were also increases, period over period, in general and administrative expenses as well as other expenses. Partially offsetting these increases were decreases in business permits and licenses and brokerage commissions. Total expenses, net of expenses waived by the Sponsor and reimbursement of expenses previously waived, increased by $754,320 for 2016 compared to 2014 due to the increase in gross expenses as discussed above which was partially offset by an increase in expenses waived by the Sponsor and the fact that there were no expenses reimbursed to the Sponsor that had been previously waived as was the case in 2014.
For the year ended December 31, 2016, no reimbursement to the Sponsor will be sought in any future period for expenses that have been identified as waived by the Sponsor.
For the year ended December 31, 2013, there were approximately $590,000 of expenses recorded in the financial statements of the Sponsor which were subject to reimbursement by the Funds in 2014. At that time, the Sponsor determined that recovery of the expense amounts was not probable. For the year ended December 31, 2014, asset growth and other changes experienced by certain Funds enabled the Sponsor to claim reimbursement of $379,753 from those Funds, specifically $308,312 from CORN, $25,139 from SOYB and $46,302 from WEAT. These amounts are reflected in the combined statements of operations as a reimbursement of a previously waived expense for the Funds from which there was recovery in 2014. There was no recovery of amounts from the other Funds.
Teucrium Corn Fund
The Teucrium Corn Fund commenced investment operations on June 9, 2010. The investment objective of the Corn Fund is to have the daily changes in percentage terms of the Shares’ NAV reflect the daily changes in percentage terms of a weighted average of the closing settlement prices for three futures contracts for corn (“Corn Futures Contracts”) that are traded on the Chicago Board of Trade (“CBOT”), specifically (1) the second-to-expire CBOT Corn Futures Contract, weighted 35%, (2) the third-to-expire CBOT Corn Futures Contract, weighted 30%, and (3) the CBOT Corn Futures Contract expiring in the December following the expiration month of the third-to-expire contract, weighted 35%. On December 31, 2016, the Corn Fund held a total of 3,992 CBOT Corn Futures contracts with a notional value of $73,279,738. All of these contracts had a liability fair value equaling $1,460,800. The weighting of the notional value of the contracts was weighted as follows: (1) 35% to the MAY17 contracts, the second-to-expire CBOT Corn Futures Contract, (2) 30% to JUL17 CBOT contracts, the third-to-expire CBOT Corn Futures Contract, and (3) 35% to DEC17 CBOT contracts, the CBOT Corn Futures Contract expiring in the December following the expiration month of the third-to-expire contract.
| 53 |
The benchmark for the Fund is the Teucrium Corn Index (TCORN) which is defined as: A weighted average of daily changes in the closing settlement prices of (1) the second-to-expire Corn Futures Contract traded on the CBOT, weighted 35%, (2) the third-to-expire CBOT Corn Futures Contract, weighted 30%, and (3) the CBOT Corn Futures Contract expiring in the December following the expiration month of third-to-expire contract, weighted 35%. To convert to an index, 100 is set to $25, the opening day price of CORN. The chart below shows the percent change in the NAV per share for the Fund, the market price of the Fund shares, represented by the closing price of the Fund on the NYSE Arca or the mid-point of the 4 pm bid and ask if no closing price is available, and TCORN for two periods. One period is December 31, 2016 compared to December 31, 2015. The second period is from the commencement of operations to December 31, 2016. The Benchmark does not reflect any impact of expenses, which would generally reduce the Fund’s NAV, or interest income, which would generally increase the NAV. The actual results for the NAV do include the impacts of both expenses and interest income.
| Period | Change in NAV per share | Change in Market Price | Change
in the Benchmark (TCORN) | |||
| December 31, 2015 to December 31, 2016 | -11.60% | -11.83% | -8.28% | |||
| June 10, 2010 to December 31, 2016 | -27.37% | -27.46% | -2.40% |
For the Year Ended December 31, 2016 Compared to the Years Ended December 31, 2015 and 2014
On December 31, 2016, the Fund had 3,900,004 shares outstanding and net assets of $73,213,541. This is in comparison to 2,875,004 shares outstanding and net assets of $61,056,223 on December 31, 2015 and 4,075,004 shares outstanding with net assets of $108,459,507 on December 31, 2014. Shares outstanding increased by 1,025,000 and 36% for the period of 2016 when compared to 2015. This increase was, in the opinion of management, due to the relative low price of corn compared to the last decade which generated renewed investor interest in the commodity. In total, in 2016, the Fund issued 2,875,000 shares and purchased 1,850,000 shares as part of creation and redemption baskets. For the period 2016 compared to 2014, there was a decrease in shares outstanding of 175,000 and 4%. In total, in 2015, the Fund issued 350,000 shares and purchased 1,550,000 shares as part of creation and redemption baskets.
Total net assets for the Fund were $73,213,541 on December 31, 2016, compared to $61,056,223 on December 31, 2015 and $108,459,507 on December 31, 2014. The Net Asset Values (“NAV”) per share related to these balances were $18.77, $21.24 and $26.62 respectively. This represents a decrease in total net assets for the year ending December 31, 2016 versus 2014 of 33% which was driven by a combination of a decrease in the number of shares outstanding, combined with a change in the NAV per share which decreased by $7.85 or 30%. When comparing December 31, 2016 with 2015, there was an increase in total net assets of 20%, driven by an increase in total shares outstanding of 36% which was partially offset by a decrease in the NAV per share of $2.47 or 12%. The closing prices per share for 2016, 2015 and 2014, as reported by the NYSE Arca, were $18.71, $21.22 and $26.64, respectively. The change from December 31, 2016 over prior years was a 30% decrease from 2014 and a 12% decrease from 2015.
The graph below shows the actual shares outstanding, total net assets (or AUM) and net asset value per share (NAV per share) for the Fund from inception to December 31, 2016 and serves to illustrate the relative changes of these components.
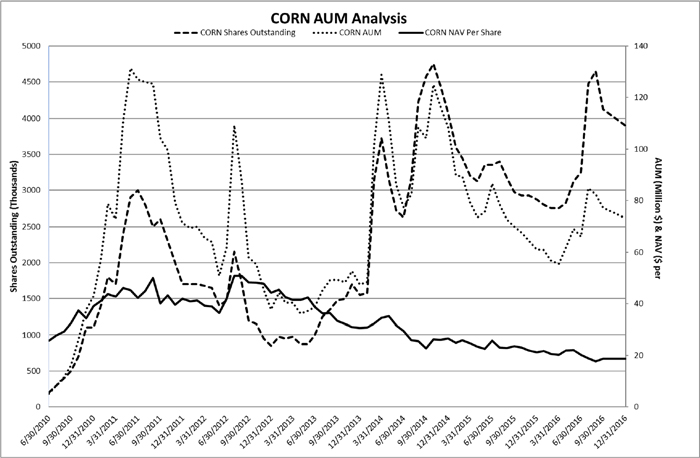
| 54 |
The total loss for the year ended December 31, 2016 was ($6,594,484) resulting primarily from the net change in realized loss on commodity futures contracts totaling ($9,438,913), and by a net change in unrealized appreciation of commodity futures contracts of $2,447,750. Total loss was ($14,047,008) in 2015, and ($4,413,618) in 2014. Realized gain or loss on trading of commodity futures contracts is a function of: 1) the change in the price of the particular contracts sold as part of a “roll” in contracts as the nearest to expire contracts are exchanged for the appropriate contact given the investment objective of the fund, 2) the change in the price of particular contracts sold in relation to redemption of shares, 3) the gain or loss associated with rebalancing trades which are made to ensure conformance to the benchmark and 4) the number of contracts held and then sold for either circumstance aforementioned. Unrealized gain or loss on trading of commodity futures contracts is a function of the change in the price of contracts held on the final date of the period versus the purchase price for each contract and the number of contracts held in each contract month. The Sponsor has a static benchmark as described above and trades futures contracts to adhere to that benchmark and to adjust for the creation or redemption of shares.
Interest income for year ended December 31, 2016, 2015, and 2014, respectively, was $396,679, $146,905 and $35,595. This increase year-over-year was the result of the Sponsor investing, at times, a portion of the available cash for the Fund in alternative demand-deposit savings accounts beginning in the second quarter of 2015. These accounts had higher overnight deposit rates than were available in money market products that had been utilized solely in the past. In addition, effective in December 2015 and 2016, interest rates paid on cash balances of the Fund increased in light of the increases in the Federal Funds rate. These higher levels of interest rates are expected to continue in 2017, absent any decreases in the Federal Funds rate.
Total expenses gross of expenses waived by the Sponsor and reimbursement to the Sponsor for previously waived expenses (“Total expenses”) for 2016 were $3,411,916; total expenses for 2015 were $3,232,532 and $3,330,404 in 2014. This represents a $179,384 or 6% increase for 2016 over 2015 and an $81,512 or 2% increase for 2016 over 2014. The increase for 2016 over 2015 was driven by: 1) a $303,484 or 41% increase in professional fees related to auditing, legal and tax preparation fees; and 2) a $55,475 or 134% increase in brokerage commissions due to an increase in contracts purchased and rolled. These increases were offset partially by: 1) a ($60,625) or 8% decrease in the management fee paid to the Sponsor as a result of lower average net assets; 2) a ($38,712) or 3% decrease in distribution and marketing fees; 3) a ($3,812) or 2% decrease in custodian fees and expenses; 4) a ($9,965) or 37% decrease in business permits and licenses; 5) a ($63,558) or 31% decrease in general administrative expenses, and a ($2,903) or 6% decrease other expenses. The decreases in operating expenses were due to expense controls under taken by the Sponsor and lower average net asset balance relative to the other Funds.
The increase for 2016 over 2014 was driven by: 1) a $499,588 or 91% increase in professional fees related to auditing, legal and tax preparation fees; and 2) a $54,257 or 42% increase in custodian fees and expenses. These were partially offset by decreases in all other categories including: 1) a ($267,588) or 27% decrease in the management fee paid to the Sponsor as a result of lower average net assets; 2) an ($87,141) or 7% decrease in distribution and marketing fees; 3) a ($13,697) or 45% decrease in business permits and licenses; 4) a ($32,275) or 18% decrease in general and administrative expenses; 5) a ($53,361) or 36% decrease on brokerage commissions due to lower average net assets and contracts held; and 6) an ($18,272) or 30% decrease in other expenses. The decreases in operating expenses were due to expense controls under taken by the Sponsor and lower average net asset balance relative to the other Funds. The total expense ratio gross of expenses waived by the Sponsor for these years was 4.74% in 2016, 4.15% in 2015, and 3.37% in 2014. The management fee is calculated at an annual rate of 1% of the Fund’s daily average net assets.
The Sponsor has the ability to elect to pay certain expenses on behalf of the Fund or waive the management fee. This election is subject to change by the Sponsor, at its discretion. For the year ended December 31, 2016, the Sponsor waived fees of $442,333; the Sponsor has determined that no reimbursement will be sought in future periods for those expenses which have been waived for the year. For 2015 the Sponsor permanently waived $96,068 of expenses. For 2014 there were $105,270 of expenses permanently waived by the Sponsor.
Total expenses net of expenses waived by the Sponsor and reimbursement to the Sponsor for previously waived expenses (“Total expenses, net”) for 2016, 2015 and 2014 were $2,969,583, $3,136,464 and $3,533,446 respectively. The total expense ratio net of expenses waived by the Sponsor periods was 4.13% in 2016, 4.03% in 2015 and 3.57% in 2014. Net investment loss, which includes the impact of expenses and interest income, was 3.58% in 2016, 3.84% in 2015, and 3.54% in 2014.
Other than the management fee to the Sponsor and the brokerage commissions, most of the expenses incurred by the Fund are associated with the day-to-day operation of the Fund and the necessary functions related to regulatory compliance. These are generally based on contracts, which extend for some period of time and up to one year, or commitments regardless of the level of assets under management. The structure of the Fund and the nature of the expenses are such that as total net assets grow, there is a scalability of expenses that may allow the total expense ratio to be reduced. However, if total net assets for the Fund fall, the total expense ratio of the Fund will increase unless additional reductions are made by the Sponsor to the daily expense accrual. The Sponsor can elect to adjust the daily expense accruals at its discretion based on market conditions and other Fund considerations.
For the year ended December 31, 2013, there were $426,248 of expenses recorded in the financial statements of the Sponsor which were subject to reimbursement by CORN in 2014. At that time, the Sponsor had determined that recovery of the expense amounts was not probable. In 2014, asset growth and other changes experienced by CORN enabled the Sponsor to claim reimbursement of $308,312 from the Fund. This amount is reflected in the statements of operations as a reimbursement of previously waived expenses.
Net cash used in the Fund’s operating activities during the year was ($9,759,190) in 2016, ($17,532,410) in 2015 and ($6,449,860) in 2014. In 2016, proceeds from the sale of shares were $57,591,933, representing 2,875,000 shares while payments for redemptions were $35,870,548, representing 1,850,000 shares. In 2015, proceeds from the sale of shares were $8,538,198, representing 350,000 shares while payments for redemptions were $38,758,010, representing 1,550,000 shares. In 2014, proceeds from the sale of shares were $146,789,763, representing 5,050,000 shares while payments for redemptions were $77,882,812, representing 2,525,000 shares.
| 55 |
The seasonality patterns for corn futures prices are impacted by a variety of factors. These include, but are not limited to, the harvest in the fall, the planting conditions in the spring, and the weather throughout the critical germination and growing periods. Prices for corn futures are affected by the availability and demand for substitute agricultural commodities, including soybeans and wheat, and the demand for corn as an additive for fuel, through the production of ethanol. The price of corn futures contracts is also influenced by global economic conditions, including the demand for exports to other countries. Such factors will impact the performance of the Fund and the results of operations on an ongoing basis. The Sponsor cannot predict the impact of such factors.
Teucrium Soybean Fund
The Teucrium Soybean Fund commenced investment operations on September 19, 2011. The investment objective of the Fund is to have the daily changes in percentage terms of the Shares’ Net Asset Value (“NAV”) reflect the daily changes in percentage terms of a weighted average of the closing settlement prices for three futures contracts for soybeans (“Soybean Futures Contracts”) that are traded on the Chicago Board of Trade (“CBOT”). Except as described in the following paragraph, the three Soybean Futures Contracts will be: (1) second-to-expire CBOT Soybean Futures Contract, weighted 35%, (2) the third-to-expire CBOT Soybean Futures Contract, weighted 30%, and (3) the CBOT Soybean Futures Contract expiring in the November following the expiration month of the third-to-expire contract, weighted 35%. On December 31, 2016, the Fund held a total of 257 CBOT soybean futures contracts with a notional value of $12,866,588. Of these, 181 had an asset fair value of $357,500, while 76 contracts had a liability fair value of $12,025. The weighting of the notional value of the contracts was weighted as follows: (1) 35% to MAR17 CBOT contracts, (2) 30% to MAY17 CBOT contracts, and (3) 35% to NOV17 CBOT contracts.
The benchmark for the Fund is the Teucrium Soybean Index (TSOYB) which is defined as: A weighted average of daily changes in the closing settlement prices of (1) the second-to-expire Soybean Futures Contract traded on the CBOT, weighted 35%, (2) the third-to-expire CBOT Soybean Futures Contract, weighted 30%, and (3) the CBOT Soybeans Futures Contract expiring in the November following the expiration month of third-to-expire contract, weighted 35%. During the period when the Excluded Contracts are the second-to-expire and third-to-expire Soybean Futures Contract, the fourth-to-expire and fifth-to-expire Soybean Futures Contracts will take the place of the second-to-expire and third-to-expire Soybean Futures Contracts, respectively, as Benchmark Component Futures Contracts. Similarly, when the August Contract is the third-to-expire Soybean Futures Contract, the fifth-to-expire Soybean Futures Contract will take the place of the August Contract as a Benchmark Component Futures Contract, and when the September Contract is the second-to-expire Soybean Futures Contract, the third-to-expire and fourth-to-expire Soybean Futures Contracts will be Benchmark Component Futures Contracts. To convert to an index, 100 is set to $25, the opening day price of SOYB.
The chart below shows the percent change in the NAV per share for the Fund, the market price of the Fund shares, represented by the closing price of the Fund on the NYSE Arca or the mid-point of the 4 pm bid and ask if no closing price is available, and TSOYB for two periods. One period is December 31, 2016 compared to December 31, 2015. The second period is from the commencement of operations to December 31, 2016. The Benchmark does not reflect any impact of expenses, which would generally reduce the Fund’s NAV, or interest income, which would generally increase the NAV. The actual results for the NAV do include the impacts of both expenses and interest income.
| Period | Change in NAV per share | Change in Market Price | Change
in the Benchmark (TSOYB) | |||
| December 31, 2015 to December 31, 2016 | 10.06% | 10.20% | 13.92% | |||
September 19, 2011 to December 31, 2016 |
-22.62% | -23.85% | 1.97% |
For the Year Ended December 31, 2016 Compared to the Years Ended December 31, 2015 and 2014
On December 31, 2016, the Fund had 675,004 shares outstanding and net assets of $12,882,100. This is in comparison to 375,004 shares outstanding and net assets of $6,502,552 on December 31, 2015 and 575,004 shares outstanding with net assets of $11,956,149 on December 31, 2014. Shares outstanding increased by 300,000 and 80% for the period of 2016 when compared to 2015. This increase was, in the opinion of management, due to the relatively low price of the commodity relative to prices in the last decade and continued global demand, particularly from China. In total, in 2016, the Fund issued 500,000 shares and purchased 200,000 shares as part of creation and redemption baskets. For the period 2016 compared to 2014, there was a increase in shares outstanding of 100,000 and 17%. In total, in 2015, the Fund issued 125,000 shares and purchased 325,000 shares as part of creation and redemption baskets.
Total net assets for the Fund were $12,882,100 on December 31, 2016, compared to $6,502,552 on December 31, 2015 and $11,956,149 on December 31, 2014. The Net Asset Values (“NAV”) per share related to these balances were $19.08, $17.34 and $20.79 respectively. This represents an increase in total net assets for the year ending December 31, 2016 versus 2014 of 8% which was driven by a combination of an increase in the number of shares outstanding, offset by a change in the NAV per share which decreased by $1.71 or 8%. When comparing December 31, 2016 with 2015, there was an increase in total net assets of 98%, driven by an increase in total shares outstanding of 80% and an increase in the NAV per share of $1.74 or 10%. The closing prices per share for 2016, 2015 and 2014, as reported by the NYSE Arca, were $19.10, $17.33 and $20.76, respectively. The change from December 31, 2016 over prior years was an 8% decrease from 2014 and a 10% increase from 2015.
| 56 |
The graph below shows the actual shares outstanding, total net assets (or AUM) and net asset value per share (NAV per share) for the Fund from inception to December 31, 2016 and serves to illustrate the relative changes of these components.
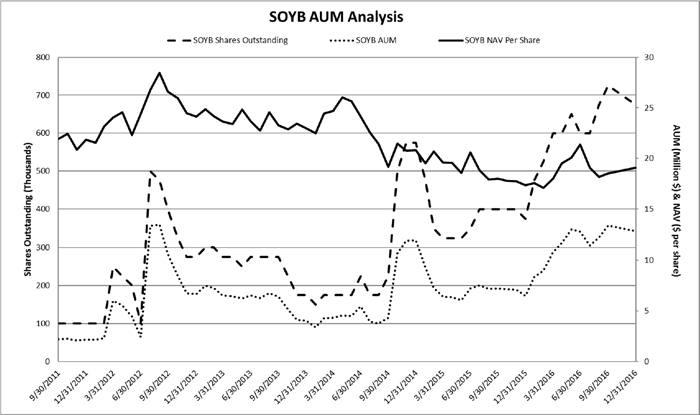
Total income for the year ended December 31, 2016 was $1,572,207 resulting from the net change in realized gain on commodity futures contracts totaling $939,088 and a change in unrealized appreciation on commodity futures contracts of $567,962. Total loss was ($1,288,083) in 2015 and ($364,975) in 2014. Realized gain or loss on trading of commodity futures contracts is a function of: 1) the change in the price of the particular contracts sold as part of a “roll” in contracts as the nearest to expire contracts are exchanged for the appropriate contact given the investment objective of the fund, 2) the change in the price of particular contracts sold in relation to redemption of shares, 3) the gain or loss associated with rebalancing trades which are made to ensure conformance to the benchmark and 4) the number of contracts held and then sold for either circumstance aforementioned. Unrealized gain or loss on trading of commodity futures contracts is a function of the change in the price of contracts held on the final date of the period versus the purchase price for each contract and the number of contracts held in each contract month. The Sponsor has a static benchmark as described above and trades futures contracts to adhere to that benchmark and to adjust for the creation or redemption of shares.
Interest income for the year ended December 31, 2016, 2015, and 2014, respectively, was $65,157, $13,129 and $1,938. This increase year-over-year was the result of the Sponsor investing, at times, a portion of the available cash for the Fund in alternative demand-deposit savings accounts beginning in the second quarter of 2015. These accounts had higher overnight deposit rates than were available in money market products that had been utilized solely in the past. In addition, effective in mid-December 2015 and 2016, interest rates paid on cash balances of the Fund increased again in light of the increases in the Federal Funds rate. These higher levels of interest rates are expected to continue in 2017, absent any decreases in the Federal Funds rate.
Total expenses gross of expenses waived by the Sponsor and reimbursement to the Sponsor for previously waived expenses (“Total expenses”) for 2016 were $546,593; total expenses for 2015 were $534,350 and $257,908 in 2014. This represents a $12,243 or 2% increase for 2016 over 2015 and a $288,685 or 112% increase for 2016 over 2014. The increase for 2016 over 2015 was driven by: 1) a $45,077 or 61% increase in management fee paid to the Sponsor due to higher average net assets; 2) a $100,906 or 86% increase in distribution and marketing fees; 3) a $1,680 or 10% increase in business permits and license fees; 4) a $10,606 or 49% increase in general and administrative expenses; and 5) a $5,646 or 126% increase in other expenses. These were partially offset by decreases of: 1) ($34,899) or 24% in professional fees related to auditing, legal and tax preparation fees; 2) ($112,237) or 76% in custodian fees and expenses; and 3) ($4,536) or 75% in brokerage commissions. The increases year over year were generally due to higher average net assets relative to other funds while the decreases in operating expenses were due to expense controls under taken by the Sponsor.
The increase for 2016 over 2014 was driven by increases in all expense categories period over period except for business permits and license fees and brokerage commissions. Increases were: 1) a $62,475 or 122% increase in management fee paid to the Sponsor due to higher average net assets; 2) a $20,610 or 22% increase in professional fees related to auditing, legal and tax preparation fees; 3) a $156,828 or 256% increase in distribution and marketing fees; 4) a $28,704 or 494% increase in custodian fees and expenses; 5) a $21,337 or 195% increase in in general and administrative expenses; and 5) a $3,432 or 51% increase in other expenses. These were partially offset by: 1) a ($3,832) or 17% decrease in business permits and license fees; and 2) an ($869) or 37% decrease in brokerage commissions. The increases year over year were generally due to higher average net assets relative to other funds. The total expense ratio gross of expenses waived by the Sponsor for these years was 4.61% in 2016, 7.31% in 2015, and 4.59% in 2014. The management fee is calculated at an annual rate of 1% of the Fund’s daily average net assets.
| 57 |
The Sponsor has the ability to elect to pay certain expenses on behalf of the Fund or waive the management fee. This election is subject to change by the Sponsor, at its discretion. For the year ended December 31, 2016, the Sponsor waived fees of $68,914; the Sponsor has determined that no reimbursement will be sought in future periods for those expenses which have been waived for the year. For 2015 the Sponsor permanently waived $304,609 of expenses. For 2014 there were $65,617 of expenses permanently waived by the Sponsor.
Total expenses net of expenses waived by the Sponsor and reimbursement to the Sponsor for previously waived expenses (“Total expenses, net”) for 2016, 2015 and 2014 were $477,679, $229,741 and $217,430 respectively. The total expense ratio net of expenses waived by the Sponsor periods was 4.03% in 2016, 3.14% in 2015 and 3.87% in 2014. Net investment loss, which includes the impact of expenses and interest income, was 3.48% in 2016, 2.96% in 2015, and 3.83% in 2014.
Other than the management fee to the Sponsor and the brokerage commissions, most of the expenses incurred by the Fund are associated with the day-to-day operation of the Fund and the necessary functions related to regulatory compliance. These are generally based on contracts, which extend for some period of time and up to one year, or commitments regardless of the level of assets under management. The structure of the Fund and the nature of the expenses are such that as total net assets grow, there is a scalability of expenses that may allow the total expense ratio to be reduced. However, if total net assets for the Fund fall, the total expense ratio of the Fund will increase unless additional reductions are made by the Sponsor to the daily expense accrual. The Sponsor can elect to adjust the daily expense accruals at its discretion based on market conditions and other Fund considerations.
For the year ended December 31, 2013, there were $68,857 of expenses recorded in the financial statements of the Sponsor which were subject to reimbursement by the Fund in 2014. At that time, the Sponsor had determined that recovery of the expense amounts was not probable. In 2014, asset growth and other changes experienced by the Fund enabled the Sponsor to claim reimbursement of $25,139 from the Fund. This amount is reflected in the statements of operations as a reimbursement of previously waived expenses.
Net cash provided by the Fund’s operating activities during the 2016 was $1,077,539. Net cash used in operating activities by the Fund was ($1,632,191) in 2015 and ($781,585) in 2014. In 2016, proceeds from the sale of shares were $9,190,140 representing 500,000 shares while payments for the redemption of shares were $3,905,120 representing 200,000 shares. In 2015, proceeds from the sale of shares were $2,478,439 representing 125,000 shares while payments for the redemption of shares were $6,414,212 representing 325,000 shares. In 2014, proceeds from the sale of shares were $10,769,361 while payments for the redemption of shares were $2,247,779.
The seasonality patterns for soybean futures prices are impacted by a variety of factors. These include, but are not limited to, the harvest in the fall, the planting conditions in the spring, and the weather throughout the critical germination and growing periods. Prices for soybean futures are affected by the availability and demand for substitute agricultural commodities, including corn and wheat. The price of soybean futures contracts is also influenced by global economic conditions, including the demand for exports to other countries. Such factors will impact the performance of the Fund and the results of operations on an ongoing basis. The Sponsor cannot predict the impact of such factors.
Teucrium Sugar Fund
The Teucrium Sugar Fund commenced investment operations on September 19, 2011. The investment objective of the Fund is to have the daily changes in percentage terms of the Shares’ Net Asset Value (“NAV”) reflect the daily changes in percentage terms of a weighted average of the closing settlement prices for three futures contracts for sugar (“Sugar Futures Contracts”) that are traded on ICE Futures US (“ICE Futures”), specifically: (1) the second-to-expire Sugar No. 11 Futures Contract (a “Sugar No. 11 Futures Contract”), weighted 35%, (2) the third-to-expire Sugar No. 11 Futures Contract, weighted 30%, and (3) the Sugar No. 11 Futures Contract expiring in the March following the expiration month of the third-to-expire contract, weighted 35%. On December 31, 2016, the Fund held a total of 261 ICE sugar futures contracts with a notional value of $5,521,981. Of these, 93 had an asset fair value of $185,147, while 168 contracts had a liability fair value of $331,542. The weighting of the notional value of the contracts was weighted as follows: (1) 35% to the MAY17 ICE No 11 contracts, (2) 30% to the JUL17 ICE No 11 contracts, and (3) 35% to the MAR18 ICE No 11 contracts.
The benchmark for the Fund is the Teucrium Sugar Index (TCANE) which is defined as: A weighted average of daily changes in the closing settlement prices (1) the second-to-expire Sugar No. 11 Futures Contract (a “Sugar No. 11 Futures Contract”), weighted 35%, (2) the third-to-expire Sugar No. 11 Futures Contract, weighted 30%, and (3) the Sugar No. 11 Futures Contract expiring in the March following the expiration month of the third-to-expire contract, weighted 35%. To convert to an index, 100 is set to $25, the opening day price of CANE.
The chart below shows the percent change in the NAV per share for the Fund, the market price of the Fund shares, represented by the closing price of the Fund on the NYSE Arca or the mid-point of the 4 pm bid and ask if no closing price is available, and TCANE for two periods. One period is December 31, 2016 compared to December 31, 2015. The second period is from the commencement of operations to December 31, 2016. The Benchmark does not reflect any impact of expenses, which would generally reduce the Fund’s NAV, or interest income, which would generally increase the NAV. The actual results for the NAV do include the impacts of both expenses and interest income.
| 58 |
| Period | Change in NAV per share | Change in Market Price | Change
in the Benchmark (TCANE) | |||
| December 31, 2015 to December 31, 2016 | 29.54% | 29.21% | 31.87% | |||
| September 19, 2011 to December 31, 2016 | -48.70% | -49.16% | -38.55% |
For the Year Ended December 31, 2016 Compared to the Years Ended December 31, 2015 and 2014
On December 31, 2016, the Fund had 425,004 shares outstanding and net assets of $5,513,971. This is in comparison to 550,004 shares outstanding and net assets of $5,508,663 on December 31, 2015 and 225,004 shares outstanding with net assets of $2,661,212 on December 31, 2014. Shares outstanding decreased by (125,000) and 23% for the period of 2016 when compared to 2015. This decrease was, in the opinion of management, due to the relative strength in sugar prices, compared to recent years, which led to profit-taking by some investors. In total, in 2016, the Fund issued 250,000 shares and purchased 375,000 shares as part of creation and redemption baskets. For the period 2016 compared to 2014, there was an increase in shares outstanding of 200,000 and 89%. In total, in 2015, the Fund issued 375,000 shares and purchased 50,000 shares as part of creation and redemption baskets.
Total net assets for the Fund were $5,513,971 on December 31, 2016, compared to $5,508,663 on December 31, 2015 and $2,661,212 on December 31, 2014. The Net Asset Values (“NAV”) per share related to these balances were $12.97, $10.02 and $11.83 respectively. This represents an increase in total net assets for the year ending December 31, 2016 versus 2014 of 107% which was driven by a combination of an increase in the number of shares outstanding and by a change in the NAV per share which increased by $1.14 or 10%. When comparing December 31, 2016 with 2015, there was an increase in total net assets of 0.01%, driven by a decrease in total shares outstanding of 23% which was offset by an increase in the NAV per share of $2.95 or 29%. The closing prices per share for 2016, 2015 and 2014, as reported by the NYSE Arca, were $13.00, $10.06 and $11.88, respectively. The change from December 31, 2016 over prior years was a 9% increase from 2014 and a 29% increase from 2015.
The graph below shows the actual shares outstanding, total net assets (or AUM) and net asset value per share (NAV per share) for the Fund from inception to December 31, 2016 and serves to illustrate the relative changes of these components.
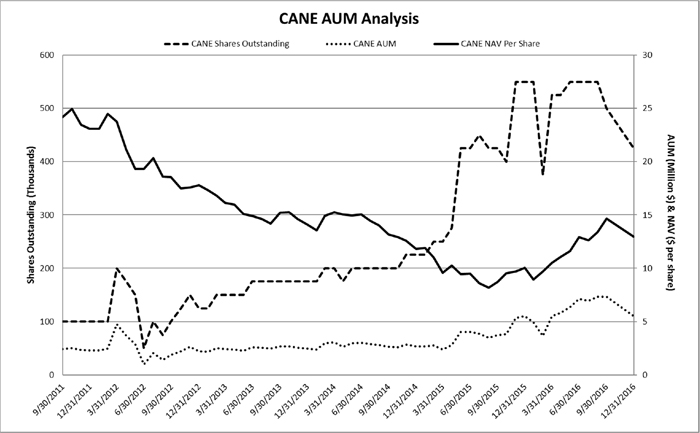
Total income for the year ended December 31, 2016 was $1,489,291 resulting primarily from the realized gain on commodity futures contracts totaling $1,967,694 and a loss generated by the net change in unrealized depreciation on commodity futures contracts of ($510,451). Total loss was ($404,210) in 2015 and ($451,152) in 2014. Realized gain or loss on trading of commodity futures contracts is a function of: 1) the change in the price of the particular contracts sold as part of a “roll” in contracts as the nearest to expire contracts are exchanged for the appropriate contact given the investment objective of the fund, 2) the change in the price of particular contracts sold in relation to redemption of shares, 3) the gain or loss associated with rebalancing trades which are made to ensure conformance to the benchmark and 4) the number of contracts held and then sold for either circumstance aforementioned. Unrealized gain or loss on trading of commodity futures contracts is a function of the change in the price of contracts held on the final date of the period versus the purchase price for each contract and the number of contracts held in each contract month. The Sponsor has a static benchmark as described above and trades futures contracts to adhere to that benchmark and to adjust for the creation or redemption of shares.
| 59 |
Interest income for year ended December 31, 2016, 2015, and 2014, respectively, was $32,048, $7,670 and $813. This increase year-over-year was the result of the Sponsor investing, at times, a portion of the available cash for the Fund in alternative demand-deposit savings accounts beginning in the second quarter of 2015. These accounts had higher overnight deposit rates than were available in money market products that had been utilized solely in the past. In addition, effective in mid-December 2015 and 2016, interest rates paid on cash balances of the Fund increased again in light of the increases in the Federal Funds rate. These higher levels of interest rates are expected to continue in 2017, absent any decreases in the Federal Funds rate.
Total expenses gross of expenses waived by the Sponsor and reimbursement to the Sponsor for previously waived expenses (“Total expenses”) for 2016 were $288,309; total expenses for 2015 were $327,823 and $171,106 in 2014. This represents a ($39,514) or 12% decrease for 2016 over 2015 and a $117,203 or 68% increase for 2016 over 2014. The decrease for 2016 over 2015 was driven by decreases of: 1) ($18,709) or 28% in professional fees related to auditing, legal and tax preparation fees; and 2) ($121,170) or 877% in custodian fees and expenses. These were partially offset by: 1) a $20,791 or 59% increase in management fee paid to the Sponsor due to higher average net assets; 2) a $59,775 or 107% increase in distribution and marketing fees; 3) a $2,798 or 18% increase in business permits and license fees; 4) a $8,810 or 101% increase in general and administrative expenses; 5) a $4,681 increase in brokerage commissions; and 6) a $3,510 or 128% increase in other expenses. The increases year over year were generally due to higher average net assets relative to other funds.
The increase for 2016 over 2014 was driven by increases in all expense categories period over period except for professional fees. Increases were: 1) a $28,992 or 106% increase in management fee paid to the Sponsor due to higher average net assets; 2) a $77,562 or 204% increase in distribution and marketing fees; 3) a $14,610 increase in custodian fees and expenses; 4) a $5,458 or 42% increase in business permits and license fees; 5) a $5,264 or 43% increase in in general and administrative expenses; 6) a $5,681 or 189% increase in brokerage commissions; and 7) a $3,911 or 166% increase in other expenses. These were partially offset by a ($24,275) or 34% decrease in professional fees related to auditing, legal and tax preparation fees. The increases year over year were generally due to higher average net assets relative to other funds. The total expense ratio gross of expenses waived by the Sponsor for these years was 4.72% in 2016, 9.16% in 2015, and 6.26% in 2014. The management fee is calculated at an annual rate of 1% of the Fund’s daily average net assets.
The Sponsor has the ability to elect to pay certain expenses on behalf of the Fund or waive the management fee. This election is subject to change by the Sponsor, at its discretion. For the year ended December 31, 2016, the Sponsor waived fees of $148,281; the Sponsor has determined that no reimbursement will be sought in future periods for those expenses which have been waived for the year. For 2015 and 2014, there were $256,227 and $119,696 of expenses permanently waived by the Sponsor.
Total expenses net of expenses waived by the Sponsor and reimbursement to the Sponsor for previously waived expenses (“Total expenses, net”) for 2016, 2015 and 2014 were $140,028, $71,596 and $51,410 respectively. The total expense ratio net of expenses waived by the Sponsor periods was 2.29% in 2016, 2.00% in 2015 and 1.88% in 2014. Net investment loss, which includes the impact of expenses and interest income, was 1.77% in 2016, 1.79% in 2015 and 1.85% in 2014.
Other than the management fee to the Sponsor and the brokerage commissions, most of the expenses incurred by the Fund are associated with the day-to-day operation of the Fund and the necessary functions related to regulatory compliance. These are generally based on contracts, which extend for some period of time and up to one year, or commitments regardless of the level of assets under management. The structure of the Fund and the nature of the expenses are such that as total net assets grow, there is a scalability of expenses that may allow the total expense ratio to be reduced. However, if total net assets for the Fund fall, the total expense ratio of the Fund will increase unless additional reductions are made by the Sponsor to the daily expense accrual. The Sponsor can elect to adjust the daily expense accruals at its discretion based on market conditions and other Fund considerations.
Net cash provided by the Fund’s operating activities during the 2016 was $1,427,695. Net cash used in operating activities by the Fund was ($879,804) in 2015 and ($572,410) in 2014. In 2016, proceeds from the sale of shares were $2,805,578 representing 250,000 shares while payments for the redemption of shares were $4,149,533 representing 375,000 shares. In 2015, proceeds from the sale of shares were $3,767,602 representing 375,000 shares while payments for the redemption of shares were $444,345 representing 50,000 shares. In 2014 proceeds from the sale of shares was $1,067,083 while payments for the redemption of shares were $371,712.
Teucrium Wheat Fund
The Teucrium Wheat Fund commenced investment operations on September 19, 2011. The investment objective of the Fund is to have the daily changes in percentage terms of the Shares’ Net Asset Value reflect the daily changes in percentage terms of a weighted average of the closing settlement prices for three futures contracts for wheat (“Wheat Futures Contracts”) that are traded on the Chicago Board of Trade (“CBOT”), specifically: (1) the second-to-expire CBOT Wheat Futures Contract, weighted 35%, (2) the third-to-expire CBOT Wheat Futures Contract, weighted 30%, and (3) the CBOT Wheat Futures Contract expiring in the December following the expiration month of the third-to-expire contract, weighted 35%. On December 31, 2016, the Fund held a total of 2,837 CBOT wheat futures contracts with a notional value of $62,329,138. These contracts had a liability fair value of $3,921,588. The weighting of the notional value of the contracts was weighted as follows: (1) 35% to MAY17 CBOT contracts, (2) 30% to JUL17 CBOT contracts, and (3) 35% to DEC17 CBOT contracts.
The benchmark for the Fund is the Teucrium Wheat Index (TWEAT) which is defined as: A weighted average of daily changes in the closing settlement prices of (1) the second-to-expire Wheat Futures Contract traded on the CBOT, weighted 35%, (2) the third-to-expire CBOT Wheat Futures Contract, weighted 30%, and (3) the CBOT Wheat Futures Contract expiring in the December following the expiration month of third-to-expire contract, weighted 35%. To convert to an index, 100 is set to $25, the opening day price of WEAT.
| 60 |
The chart below shows the percent change in the NAV per share for the Fund, the market price of the Fund shares, represented by the closing price of the Fund on the NYSE Arca or the mid-point of the 4 pm bid and ask if no closing price is available, and TWEAT for two periods. One period is December 31, 2016 compared to December 31, 2015. The second period is from the commencement of operations to December 31, 2016. The Benchmark does not reflect any impact of expenses, which would generally reduce the Fund’s NAV, or interest income, which would generally increase the NAV. The actual results for the NAV do include the impacts of both expenses and interest income.
| Period | Change in NAV per share | Change in Market Price | Change in the Benchmark (TWEAT) | |||
| December 31, 2015 to December 31, 2016 | -24.70% | -24.73% | -21.90% | |||
| September 19, 2011 to December 31, 2016 | -71.87% | -72.34% | -62.51% |
For the Year Ended December 31, 2016 Compared to the Years Ended December 31, 2015 and 2014
On December 31, 2016, the Fund had 9,050,004 shares outstanding and net assets of $62,344,759. This is in comparison to 2,900,004 shares outstanding and net assets of $26,529,260 on December 31, 2015 and 1,750,004 shares outstanding with net assets of $22,263,457 on December 31, 2014. Shares outstanding increased by 6,150,000 and 212% for the period of 2016 when compared to 2015. This increase was, in the opinion of management, due to the low price of wheat relative to recent years which accelerated investor interest. In total, in 2016, the Fund issued 6,475,000 shares and purchased 325,000 shares as part of creation and redemption baskets. For the period 2016 compared to 2014, there was an increase in shares outstanding of 7,300,000 shares and 417%. In total, in 2015, the Fund issued 1,675,000 shares and purchased 525,000 shares as part of creation and redemption baskets.
Total net assets for the Fund were $62,344,759 on December 31, 2016, compared to $26,529,260 on December 31, 2015 and $22,263,457 on December 31, 2014. The Net Asset Values (“NAV”) per share related to these balances were $6.89, $9.15 and $12.72 respectively. This represents an increase in total net assets for the year ending December 31, 2016 versus 2014 of 180% which was driven by a combination of an increase in the number of shares outstanding, offset by a change in the NAV per share which decreased by $5.83 or 46%. When comparing December 31, 2016 with 2015, there was an increase in total net assets of 135%, driven by an increase in total shares outstanding of 212% which was partially offset by a decrease in the NAV per share of $2.26 or 25%. The closing prices per share for 2016, 2015 and 2014, as reported by the NYSE Arca, were $6.88, $9.14 and $12.74, respectively. The change from December 31, 2015 over prior years was a 46% decrease from 2014 and a 25% decrease from 2015.
The graph below shows the actual shares outstanding, total net assets (or AUM) and net asset value per share (NAV per share) for the Fund from inception to December 31, 2016 and serves to illustrate the relative changes of these components.
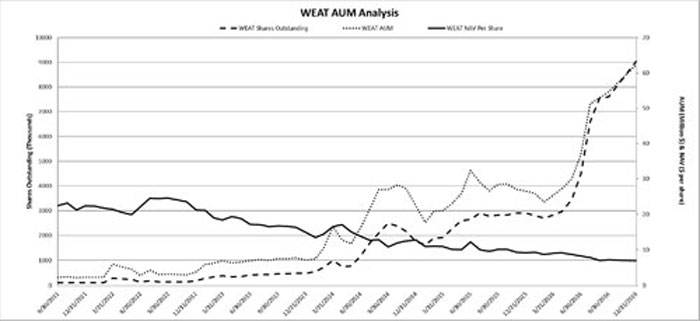
The total loss for the year ended December 31, 2016 was ($11,396,927) resulting primarily from the net change in realized loss on commodity futures contracts totaling ($9,631,400), and by a net change in unrealized depreciation of commodity futures contracts of ($1,997,125). Total loss was ($7,146,717) in 2015, and ($1,061,923) in 2014. Realized gain or loss on trading of commodity futures contracts is a function of: 1) the change in the price of the particular contracts sold as part of a “roll” in contracts as the nearest to expire contracts are exchanged for the appropriate contact given the investment objective of the fund, 2) the change in the price of particular contracts sold in relation to redemption of shares, 3) the gain or loss associated with rebalancing trades which are made to ensure conformance to the benchmark and 4) the number of contracts held and then sold for either circumstance aforementioned. Unrealized gain or loss on trading of commodity futures contracts is a function of the change in the price of contracts held on the final date of the period versus the purchase price for each contract and the number of contracts held in each contract month. The Sponsor has a static benchmark as described above and trades futures contracts to adhere to that benchmark and to adjust for the creation or redemption of shares.
61
Interest income for year ended December 31, 2016, 2015, and 2014, respectively, was $231,598, $54,109 and $9,064. This increase year-over-year was the result of higher average net assets and the Sponsor investing, at times, a portion of the available cash for the Fund in alternative demand-deposit savings accounts beginning in the second quarter of 2015. These accounts had higher overnight deposit rates than were available in money market products that had been utilized solely in the past. In addition, effective in mid-December 2015 and 2016, interest rates paid on cash balances of the Fund increased again in light of the increases in the Federal Funds rate. These higher levels of interest rates are expected to continue in 2017, absent any decreases in the Federal Funds rate.
Total expenses gross of expenses waived by the Sponsor and reimbursement to the Sponsor for previously waived expenses (“Total expenses”) for 2016 were $1,854,582; total expenses for 2015 were $1,121,704 and $671,507 in 2014. This represents a $732,878 or 65% increase for 2016 over 2015 and a $1,183,075 or 176% increase for 2016 over 2014. The increase for 2016 over 2015 was driven by: 1) a $160,550 or 63% increase in management fee paid to the Sponsor due to higher average net assets; 2) a $105,766 or 50% increase in professional fees related to auditing, legal and tax preparation fees; 3) a $403,272 or 108% increase in distribution and marketing fees; 4) a $25,313 or 183% increase in business permits and license fees; 5) a $25,632 or 39% increase in general and administrative expenses; 6) a $27,648 or 134% increase in brokerage commissions; and 7) a $35,615 or 487% increase in other expenses. These were partially offset by a decrease of ($50,918) or 30% in custodian fees and expenses. The increases year over year were generally due to higher average net assets relative to other funds.
The increase for 2016 over 2014 was driven by increases in all expense categories period over period. Increases were: 1) a $232,105 or 127% increase in management fee paid to the Sponsor due to higher average net assets; 2) a $157,216 or 97% increase in professional fees related to auditing, legal and tax preparation fees; 3) a $540,251 or 228% increase in distribution and marketing fees; 4) a $109,654 or 981% increase in custodian fees and expenses; 5) a $12,494 or 47% increase in business permits and license fees; 6) a $67,080 or 273% increase in in general and administrative expenses; 6) a $32,313 or 203% increase in brokerage commissions; and 7) a $31,962 or 292% increase in other expenses. The increases year over year were generally due to higher average net assets relative to other funds. The total expense ratio gross of expenses waived by the Sponsor for these years was 4.47% in 2016, 4.40% in 2015, and 3.66% in 2014. The management fee is calculated at an annual rate of 1% of the Fund’s daily average net assets.
The Sponsor has the ability to elect to pay certain expenses on behalf of the Fund or waive the management fee. This election is subject to change by the Sponsor, at its discretion. For the year ended December 31, 2016, the Sponsor waived fees of $140,028; the Sponsor has determined that no reimbursement will be sought in future periods for those expenses which have been waived for the year. For 2015 the Sponsor permanently waived $130,716 of expenses. For 2014 there were $31,697 of expenses permanently waived by the Sponsor.
Total expenses net of expenses waived by the Sponsor and reimbursement to the Sponsor for previously waived expenses (“Total expenses, net”) for 2016, 2015 and 2014 were $1,714,554, $990,988 and $686,112 respectively. The total expense ratio net of expenses waived by the Sponsor periods was 4.13% in 2016, 3.89% in 2015 and 3.74% in 2014. Net investment loss, which includes the impact of expenses and interest income, was 3.57% in 2016, 3.67% in 2015, and 3.69% in 2014.
| Other than the management fee to the Sponsor and the brokerage commissions, most of the expenses incurred by the Fund are associated with the day-to-day operation of the Fund and the necessary functions related to regulatory compliance. These are generally based on contracts, which extend for some period of time and up to one year, or commitments regardless of the level of assets under management. The structure of the Fund and the nature of the expenses are such that as total net assets grow, there is a scalability of expenses that may allow the total expense ratio to be reduced. However, if total net assets for the Fund fall, the total expense ratio of the Fund will increase unless additional reductions are made by the Sponsor to the daily expense accrual. The Sponsor can elect to adjust the daily expense accruals at its discretion based on market conditions and other Fund considerations. |
For the year ended December 31, 2013, there were $69,416 of expenses recorded in the financial statements of the Sponsor which were subject to reimbursement by the Fund in 2014. At that time, the Sponsor had determined that recovery of the expense amounts was not probable. In 2014, asset growth and other changes experienced by the Fund enabled the Sponsor to claim reimbursement of $46,302 from the Fund. This amount is reflected in the statements of operations as a reimbursement of previously waived expenses.
Net cash used in the Fund’s operating activities during the period was ($14,574,160) in 2016, ($9,392,785) in 2015 and ($1,846,676) in 2014. In 2016, proceeds from the sale of shares were $51,690,600 representing 6,475,000 shares while payments for redemption of shares were $2,763,620 representing 325,000 shares. In 2015, proceeds from the sale of shares were $18,019,705 representing 1,675,000 shares while payments for redemption of shares were $5,616,197 representing 525,000 shares. In 2014, proceeds from the sale of shares were $34,552,580 while payments for the redemption of shares were $17,589,175.
The seasonality patterns for wheat futures prices are impacted by a variety of factors. These include, but are not limited to, the harvest in the fall, the planting conditions in the spring, and the weather throughout the critical germination and growing periods. Prices for wheat futures are affected by the availability and demand for substitute agricultural commodities, including corn and soybeans. The price of wheat futures contracts is also influenced by global economic conditions, including the demand for exports to other countries. Such factors will impact the performance of the Fund and the results of operations on an ongoing basis. The Sponsor cannot predict the impact of such factors.
62
Teucrium Agricultural Fund
The Teucrium Agricultural Fund commenced operation on March 28, 2012. On April 22, 2011, an initial registration statement was filed with the Securities and Exchange Commission (“SEC”). On February 10, 2012, the Fund’s initial registration of 5,000,000 shares on Form S-1 was declared effective by the U.S. Securities and Exchange Commission (“SEC”). On March 28, 2012, the Fund listed its shares on the NYSE Arca under the ticker symbol “TAGS.” On the business day prior to that, the Fund issued 300,000 shares in exchange for $15,000,000 at the Fund’s initial NAV of $50 per share. The Fund also commenced investment operations on March 28, 2012 by purchasing shares of the Underlying Funds. On December 31, 2011, the Fund had two shares outstanding, which were owned by the Sponsor.
The investment objective of the Fund is to have the daily changes in percentage terms of the Net Asset Value (“NAV”) of its common units (“Shares”) reflect the daily changes in percentage terms of a weighted average (the “Underlying Fund Average”) of the NAVs per share of four other commodity pools that are series of the Trust and are sponsored by the Sponsor: the Teucrium Corn Fund (“CORN”), the Teucrium Wheat Fund (“WEAT”), the Teucrium Soybean Fund (“SOYB”) and the Teucrium Sugar Fund (“CANE”) (collectively, the “Underlying Funds”). The Underlying Fund Average will have a weighting of 25% to each Underlying Fund, and the Fund’s assets will be rebalanced, generally on a daily basis, to maintain the approximate 25% allocation to each Underlying Fund. The Fund does not intend to invest directly in futures contracts (“Futures Contracts”), although it reserves the right to do so in the future, including if an Underlying Fund ceases operations.
The investment objective of each Underlying Fund is to have the daily changes in percentage terms of its shares’ NAV reflect the daily changes in percentage terms of a weighted average of the closing settlement prices for certain Futures Contracts for the commodity specified in the Underlying Fund’s name. (This weighted average is referred to herein as the Underlying Fund’s “Benchmark,” the Futures Contracts that at any given time make up an Underlying Fund’s Benchmark are referred to herein as the Underlying Fund’s “Benchmark Component Futures Contracts,” and the commodity specified in the Underlying Fund’s name is referred to herein as its “Specified Commodity.”) Specifically, the Teucrium Corn Fund’s Benchmark is: (1) the second-to-expire Futures Contract for corn traded on the Chicago Board of Trade (“CBOT”), weighted 35%, (2) the third-to-expire CBOT corn Futures Contract, weighted 30%, and (3) the CBOT corn Futures Contract expiring in the December following the expiration month of the third-to-expire contract, weighted 35%. The Teucrium Wheat Fund’s Benchmark is: (1) the second-to-expire CBOT wheat Futures Contract, weighted 35%, (2) the third-to-expire CBOT wheat Futures Contract, weighted 30%, and (3) the CBOT wheat Futures Contract expiring in the December following the expiration month of the third-to-expire contract, weighted 35%. The Teucrium Soybean Fund’s Benchmark is: (1) the second-to-expire CBOT soybean Futures Contract, weighted 35%, (2) the third-to-expire CBOT soybean Futures Contract, weighted 30%, and (3) the CBOT soybean Futures Contract expiring in the November following the expiration month of the third-to-expire contract, weighted 35%, except that CBOT soybean Futures Contracts expiring in August and September will not be part of the Teucrium Soybean Fund’s Benchmark because of the less liquid market for these Futures Contracts. The Teucrium Sugar Fund’s Benchmark is: (1) the second-to-expire Sugar No. 11 Futures Contract traded on ICE Futures US (“ICE Futures”), weighted 35%, (2) the third-to-expire ICE Futures Sugar No. 11 Futures Contract, weighted 30%, and (3) the ICE Futures Sugar No. 11 Futures Contract expiring in the March following the expiration month of the third-to-expire contract, weighted 35%.
On December 31, 2016, the Fund held: 1) 17,258 shares of CORN with a fair value of $323,979; 2) 48,087 shares of WEAT with a fair value of $331,267; 3) 16,531 shares of SOYB with a fair value of $315,486; and 4) 26,424 shares of CANE with a fair value of $342,822. The weighting on December 31, 2016 was 25% to CORN, 25% to WEAT, 24% to SOYB and 26% to CANE.
| The benchmark for the Fund is the Teucrium Agricultural Index (TTAGS) which is defined as: A weighted average of the daily changes in percentage terms of the Shares’ NAV reflect the daily changes in percentage terms of a weighted average (the “Underlying Fund Average”) of the NAVs per share of four other commodity pools that are series of the Trust and are sponsored by the Sponsor: the Teucrium Corn Fund, the Teucrium Wheat Fund, the Teucrium Soybean Fund and the Teucrium Sugar Fund (collectively, the “Underlying Funds”). The Fund seeks to achieve its investment objective by investing under normal market conditions in the publicly-traded shares of each Underlying Fund so that the Underlying Fund Average will have a weighting of 25% to each Underlying Fund, and the Fund’s assets will be rebalanced, generally on a daily basis, to maintain the approximate 25% allocation to each Underlying Fund. To convert to an index, 100 is set to $50 the opening day price of TAGS. |
The chart below shows the percent change in the NAV per share for the Fund, the market price of the Fund shares, represented by the closing price of the Fund on the NYSE Arca or the mid-point of the 4 pm bid and ask if no closing price is available, and TTAGS for two periods. One period is December 31, 2016 compared to December 31, 2015. The second period is from the commencement of operations to December 31, 2016. The Benchmark does not reflect any impact of expenses, which would generally reduce the Fund’s NAV, or interest income, which would generally increase the NAV. The actual results for the NAV do include the impacts of both expenses and interest income.
| Period | Change in NAV per share | Change in Market Price | Change in the Benchmark (TTAGS) | |||
| December 31, 2015 to December 31, 2016 | -0.98% | -2.98% | -0.09% | |||
| March 28, 2012 to December 31, 2016 | -46.78% | -48.27% | -45.20% |
For the Year Ended December 31, 2016 Compared to the Years Ended December 31, 2015 and 2014
On December 31, 2016, 2015 and 2014, the Fund had 50,002 shares outstanding. The net assets of the Fund were $1,316,370 in 2016, $1,329,390 in 2015 and $1,652,749 in 2014. There were no shares issued or redeemed in 2016, 2015 or 2014. Effective August 2, 2012, the Fund was at 50,002 shares outstanding which represents a minimum number of shares and there could be no further redemptions until additional shares are created.
63
Total net assets for the Fund were $1,316,370 on December 31, 2016, compared to $1,329,390 on December 31, 2015 and $1,652,749 on December 31, 2014. The Net Asset Values (“NAV”) per share related to these balances were $26.33, $26.59 and $33.05 respectively. This represents a decrease in total net assets for the year ending December 31, 2016 versus 2015 of 1% and versus 2014 of 20% which were driven by a decrease in the NAV per share which decreased by $0.26 or 1% and $6.72 or 20% in the respective periods. The closing prices per share for 2016, 2015 and 2014, as reported by the NYSE Arca, were $25.68, $26.47 and $33.05, respectively. The change from December 31, 2016 over prior years was a 22% decrease from 2014 and 3% decrease from 2015.
The graph below shows the actual shares outstanding, total net assets (or AUM) and net asset value per share (NAV per share) for the Fund from inception to December 31, 2016 and serves to illustrate the relative changes of these components.
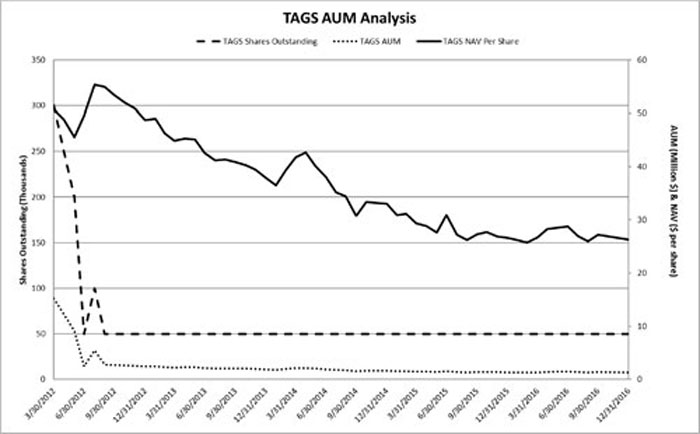
Total loss for 2016 was ($6,220) resulting from the realized loss on the securities of the Underlying Funds totaling ($87,644) and a gain generated by the unrealized appreciation on the securities of the Underlying Funds of $81,413. Total loss for the period in 2015 and 2014 was ($316,186) and ($234,509), respectively. Realized gain or loss on the securities of the Underlying Funds is a function of: 1) the change in the price of particular contracts sold in relation to redemption of shares, and 2) the gain or loss associated with rebalancing trades which are made to ensure conformance to the benchmark. Unrealized gain or loss on the securities of the Underlying Funds is a function of the change in the price of shares held on the final date of the period versus the purchase price for each and the number held. The Sponsor has a static benchmark as described above and trades futures contracts to adhere to that benchmark and to adjust for the creation or redemption of shares.
Total expenses gross of expenses waived by the Sponsor and reimbursement to the Sponsor for previously waived expenses (“Total expenses”) for 2016 were $45,259; total expenses for 2015 were $200,236 and $86,297 in 2014. This represents a ($154,977) and 77% decrease for 2016 over 2015 and a ($41,038) and 48% decrease for 2016 over 2014. The decrease for 2016 over 2015 was driven principally by a ($131,399) or 98% decrease in custodian fees and expenses. There were decreases in all other categories due to lower average net assets relative to the other Funds, except for brokerage commissions which had an increase of $223 for 2016 over 2015. The decrease for 2016 over 2014 was driven principally by a ($22,668) or 65% decrease in professional fees. Most other categories also decreased or remained relatively flat period over period, due to lower average net assets relative to the other Funds. The total expense ratio gross of expenses waived by the Sponsor for these years was 3.33% in 2016, 13.97% in 2015, and 4.70% in 2014.
The Sponsor has the ability to elect to pay certain expenses on behalf of the Fund. This election is subject to change by the Sponsor, at its discretion. For the year ended December 31, 2016, the Sponsor waived fees of $38,459; the Sponsor has determined that no reimbursement will be sought in future periods for those expenses which have been waived for the year. For 2015 and 2014, these amounts were $193,063 and $77,113.
Total expenses net of expenses waived by the Sponsor and reimbursement to the Sponsor for previously waived expenses (“Total expenses, net”) for 2016, 2015 and 2014 were $6,800, $7,173 and $9,184 respectively. The total expense ratio net of expenses waived by the Sponsor periods was 0.50% in 2016, 0.50% in 2015 and 0.50% in 2014.
64
Other than the brokerage commissions, most of the expenses incurred by the Fund are associated with the day-to-day operation of the Fund and the necessary functions related to regulatory compliance. These are generally based on contracts, which extend for some period of time and up to one year, or commitments regardless of the level of assets under management. The structure of the Fund and the nature of the expenses are such that as total net assets grow, there is a scalability of expenses that may allow the net expense ratio to be reduced. As the Sponsor has initiated a percentage based daily expense accrual for the Fund, even if total net assets for the Fund fall, the total expense ratio of the Fund will not increase. The Sponsor can elect to adjust the daily expense accruals at its discretion based on market conditions and other Fund considerations.
Net cash provided by or used in the Fund’s operating activities during the period was $545 in 2016, $168 in 2015 and ($1,233) in 2014. There were no proceeds from creation baskets or payments for redemption baskets in 2015, 2014 or in 2013.
Benchmark Performance
The Funds are new and have a limited operating history. Investing in Commodity Interests subjects the Funds to the risks of the underlying commodity market, and this could result in substantial fluctuations in the price of each Fund’s Shares. Unlike mutual funds, the Funds generally will not distribute dividends to Shareholders. Investors may choose to use the Funds as a means of investing indirectly in the underlying commodity, and there are risks involved in such investments. The Sponsor has limited experience operating a commodity pool. Investors may choose to use the Funds as vehicles to hedge against the risk of loss, and there are risks involved in hedging activities.
During the period from January 1, 2016 through December 31, 2016, the average daily change in the NAV of each Fund was within plus/minus 10 percent of the average daily change in the Benchmark of the Fund, as stated in the prospectus for each Fund.
Frequency Distribution of Premiums and Discounts
Description
The frequency distribution charts below present information about the difference between the daily market price for Shares of each Fund and the Fund’s reported Net Asset Value per share. The amount that a Fund’s market price is above the reported NAV is called the premium. The amount that a Fund’s market price is below the reported NAV is called the discount. The market price is determined using the midpoint between the highest bid and the lowest offer on the listing exchange, as of the time that a Fund’s NAV is calculated (usually 4:00 p.m., New York time). The horizontal axis of the chart shows the premium or discount expressed in basis points. The vertical axis indicates the number of trading days in the period covered by the chart. Each bar in the chart shows the number of trading days in which a Fund traded within the premium/discount range indicated. The charts are also available on the website for each Fund on a quarterly basis.
*A unit that is equal to 1/100th of 1% and is used to denote the change in a financial instrument.
NEITHER THE PAST PERFORMANCE OF A FUND NOR THE PRIOR INDEX LEVELS AND CHANGES, POSITIVE OR NEGATIVE, SHOULD BE TAKEN AS AN INDICATION OF THE FUND’S FUTURE PERFORMANCE
65
CORN
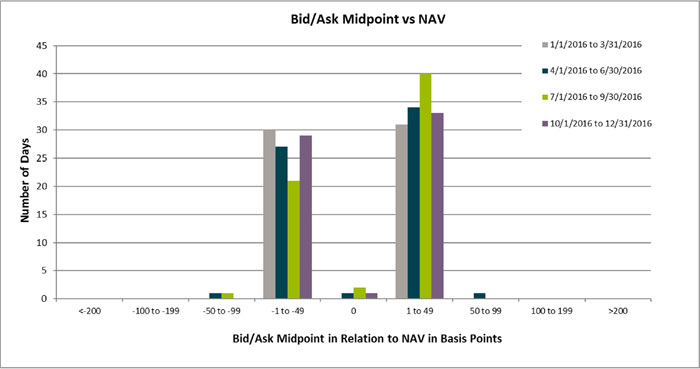
The performance data above for the Teucrium Corn Fund represents past performance. Past performance is not a guarantee of future results. Investment return and value of the Fund’s Shares will fluctuate so that an investor’s Shares, when sold, may be worth more or less than their original cost. Performance may be lower or higher than performance data quoted.
SOYB
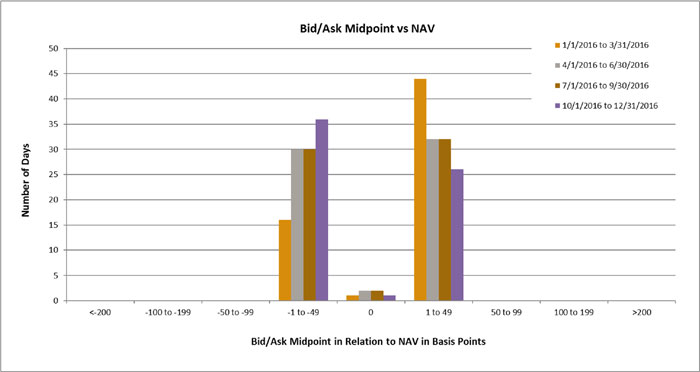
The performance data above for the Teucrium Soybean Fund represents past performance. Past performance is not a guarantee of future results. Investment return and value of the Fund’s Shares will fluctuate so that an investor’s Shares, when sold, may be worth more or less than their original cost. Performance may be lower or higher than performance data quoted.
66
CANE
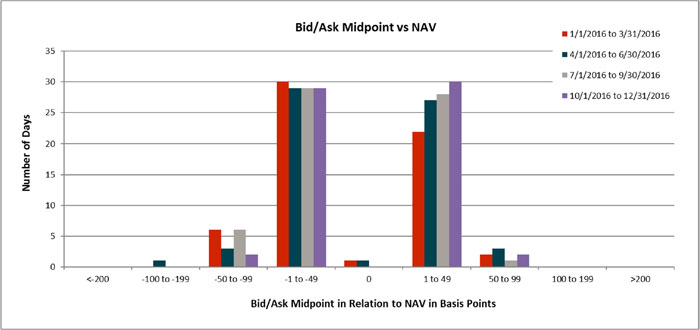
The performance data above for the Teucrium Sugar Fund represents past performance. Past performance is not a guarantee of future results. Investment return and value of the Fund’s Shares will fluctuate so that an investor’s Shares, when sold, may be worth more or less than their original cost. Performance may be lower or higher than performance data quoted.
WEAT
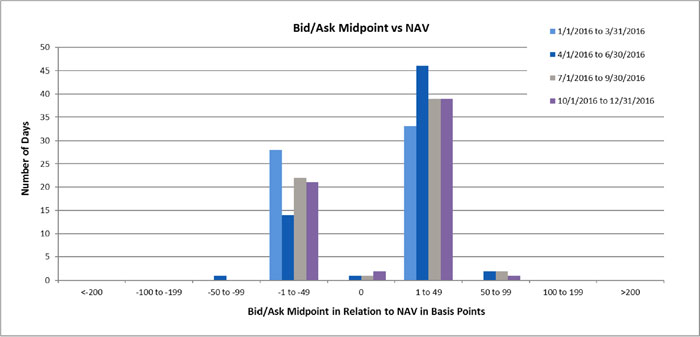
The performance data above for the Teucrium Wheat Fund represents past performance. Past performance is not a guarantee of future results. Investment return and value of the Fund’s Shares will fluctuate so that an investor’s Shares, when sold, may be worth more or less than their original cost. Performance may be lower or higher than performance data quoted.
67
TAGS
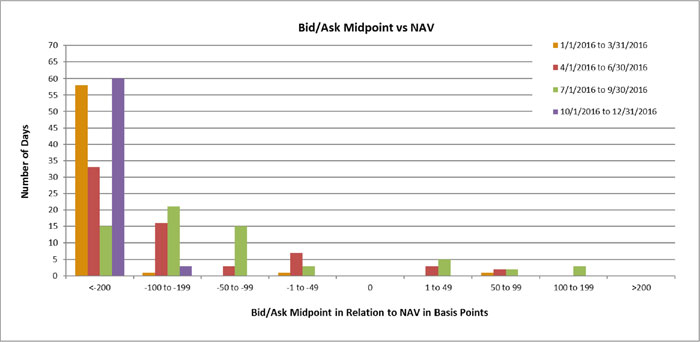
The performance data above for the Teucrium Agricultural Fund represents past performance. Past performance is not a guarantee of future results. Investment return and value of the Fund’s Shares will fluctuate so that an investor’s Shares, when sold, may be worth more or less than their original cost. Performance may be lower or higher than performance data quoted.
Beginning August 2, 2012 and through December 31, 2016, TAGS has 50,002 shares currently outstanding; this represents the minimum number of shares and, thus, no shares can be redeemed until additional shares have been created. This situation has, over the past 12 months, generated a situation in which the spread between bid/ask midpoint at 4pm and the NAV falls outside of the “1 to 49” or “-1 to -49” range. The situation does not affect the actual NAV of the Fund.
Off Balance Sheet Financing
As of December 31, 2016, neither the Trust nor any of the Funds has any loan guarantees, credit support or other off-balance sheet arrangements of any kind other than agreements entered into in the normal course of business, which may include indemnification provisions relating to certain risks service providers undertake in performing services which are in the best interests of the Funds. While the exposure of each Fund under these indemnification provisions cannot be estimated, they are not expected to have a material impact on the financial positions of each Fund.
Liquidity and Capital Resources
The Funds do not anticipate making use of borrowings or other lines of credit to meet their obligations. The Funds meet their liquidity needs in the normal course of business from the proceeds of the sale of their investments from the cash, cash equivalents and/or the Treasuries Securities that they intend to hold, and/or from the fee waivers provided by the Sponsor. The Funds’ liquidity needs include: redeeming their shares, providing margin deposits for existing Futures Contracts or the purchase of additional Futures Contracts, posting collateral for over-the-counter Commodity Interests, and paying expenses.
The Funds generate cash primarily from (i) the sale of Creation Baskets and (ii) interest earned on cash, cash equivalents and their investments in Treasuries Securities. Generally, all of the net assets of the Funds are allocated to trading in Commodity Interests. Most of the assets of the Funds are held in Treasury Securities, cash and/or cash equivalents that could or are used as margin or collateral for trading in Commodity Interests. The percentage that such assets bear to the total net assets will vary from period to period as the market values of the Commodity Interests change. Interest earned on interest-bearing assets of a Fund are paid to that Fund.
The investments of a Fund in Commodity Interests are subject to periods of illiquidity because of market conditions, regulatory considerations and other reasons. For example, U.S. futures exchanges limit the fluctuations in the prices of certain Futures Contracts during a single day by regulations referred to as “daily limits.” During a single day, no trades may be executed at prices beyond the daily limit. Once the price of such a Futures Contract has increased or decreased by an amount equal to the daily limit, positions in the contracts can neither be taken nor liquidated unless the traders are willing to effect trades at or within the limit. Such market conditions could prevent the Fund from promptly liquidating a position in Futures Contracts.
Market Risk
Trading in Commodity Interests such as Futures Contracts will involve the Funds entering into contractual commitments to purchase or sell specific amounts of commodities at a specified date in the future. The gross or face amount of the contracts is expected to significantly exceed the future cash requirements of each Fund as each Fund intends to close out any open positions prior to the contractual expiration date. As a result, each Fund’s market risk is the risk of loss arising from the decline in value of the contracts, not from the need to make delivery under the contracts. The Funds consider the “fair value” of derivative instruments to be the unrealized gain or loss on the contracts. The market risk associated with the commitment by the Funds to purchase a specific commodity will be limited to the aggregate face amount of the contacts held.
68
The exposure of the Funds to market risk will depend on a number of factors including the markets for the specific commodity, the volatility of interest rates and foreign exchange rates, the liquidity of the commodity-specific Interest markets and the relationships among the contracts held by each Fund.
Credit Risk
When any of the Funds enter into Commodity Interests, it will be exposed to the credit risk that the counterparty will not be able to meet its obligations. For purposes of credit risk, the counterparty for the Futures Contracts traded on the CBOT, NYMEX, and ICE is the clearinghouse associated with those exchanges. In general, clearinghouses are backed by their members who may be required to share in the financial burden resulting from the nonperformance of one of their members, which should significantly reduce credit risk. Some foreign exchanges are not backed by their clearinghouse members but may be backed by a consortium of banks or other financial institutions. Unlike in the case of exchange-traded futures contracts, the counterparty to an over-the-counter Commodity Interest contract is generally a single bank or other financial institution. As a result, there will be greater counterparty credit risk in over-the-counter transactions. There can be no assurance that any counterparty, clearinghouse, or their financial backers will satisfy their obligations to any of the Funds.
The Funds may engage in off exchange transactions broadly called an “exchange for risk” transaction, also referred to as an “exchange for swap.” For purposes of the Dodd-Frank Act and related CFTC rules, an “exchange for risk” transaction is treated as a “swap.” An “exchange for risk” transaction, sometimes referred to as an “exchange for swap” or “exchange of futures for risk,” is a privately negotiated and simultaneous exchange of a futures contract position for a swap or other over-the-counter instrument on the corresponding commodity. An exchange for risk transaction can be used by the Funds as a technique to avoid taking physical delivery of a commodity futures contract, corn for example, in that a counterparty will take the Fund’s position in a Corn Futures Contract into its own account in exchange for a swap that does not by its terms call for physical delivery. The Funds will become subject to the credit risk of a counterparty when it acquires an over-the-counter position in an exchange for risk transaction. The Fund may use an “exchange for risk” transaction in connection with the creation and redemption of shares. These transactions must be carried out only in accordance with the rules of the applicable exchange where the futures contracts trade.
The Sponsor will attempt to manage the credit risk of each Fund by following certain trading limitations and policies. In particular, each Fund intends to post margin and collateral and/or hold liquid assets that will be equal to approximately the face amount of the Interests it holds. The Sponsor will implement procedures that will include, but will not be limited to, executing and clearing trades and entering into over-the-counter transactions only with parties it deems creditworthy and/or requiring the posting of collateral by such parties for the benefit of each Fund to limit its credit exposure.
The CEA requires all FCMs, such as the Funds’ clearing brokers, to meet and maintain specified fitness and financial requirements, to segregate customer funds from proprietary funds and account separately for all customers’ funds and positions, and to maintain specified books and records open to inspection by the staff of the CFTC. The CFTC has similar authority over introducing brokers, or persons who solicit or accept orders for commodity interest trades but who do not accept margin deposits for the execution of trades. The CEA authorizes the CFTC to regulate trading by FCMs and by their officers and directors, permits the CFTC to require action by exchanges in the event of market emergencies, and establishes an administrative procedure under which customers may institute complaints for damages arising from alleged violations of the CEA. The CEA also gives the states powers to enforce its provisions and the regulations of the CFTC.
On November 14, 2013, the CFTC published final regulations that require enhanced customer protections, risk management programs, internal monitoring and controls, capital and liquidity standards, customer disclosures and auditing and examination programs for FCMs. The rules are intended to afford greater assurances to market participants that customer segregated funds and secured amounts are protected, customers are provided with appropriate notice of the risks of futures trading and of the FCMs with which they may choose to do business, FCMs are monitoring and managing risks in a robust manner, the capital and liquidity of FCMs are strengthened to safeguard the continued operations and the auditing and examination programs of the CFTC and the self-regulatory organizations are monitoring the activities of FCMs in a thorough manner.
Effective February 6, 2015, the Sponsor transferred all futures contracts from Societe Generale SA to Jefferies Group LLC (“Jefferies”) and Jefferies served as the FCM for the Funds, as discussed in Part I of this filing. On April 9, 2015, Jefferies announced that it had entered into a definitive agreement to have Societe Generale SA acquire the assets of its futures unit, including its FCM operations. Effective June 3, 2015, ED&F Man Capital Markets Inc. (“ED&F Man”) replaced Jefferies as the Funds’ FCM and the clearing broker to execute and clear the Funds’ futures and provide other brokerage-related services.
The Funds, other than TAGS, will generally retain cash positions of approximately 94% of total net assets; this balance represents the total net assets less the initial margin requirements held by the FCM. These cash assets are either: 1) deposited by the Sponsor in demand deposit accounts of financial institutions which are rated in the highest short-term rating category by a nationally recognized statistical rating organization or deemed by the Sponsor to be of comparable quality; 2) held in short-term Treasury Securities; or 3) held in a money-market fund which is deemed to be a cash equivalent under the most recent SEC definition.
69
Item 7A. Quantitative and Qualitative Disclosures about Market Risks
Trading in Commodity Interests such as Futures Contracts will involve the Funds entering into contractual commitments to purchase or sell specific amounts of commodities at a specified date in the future. The gross or face amount of the contracts is expected to significantly exceed the future cash requirements of each Fund as each Fund intends to close out any open positions prior to the contractual expiration date. As a result, each Fund’s market risk is the risk of loss arising from the decline in value of the contracts, not from the need to make delivery under the contracts. The Funds consider the “fair value” of derivative instruments to be the unrealized gain or loss on the contracts. The market risk associated with the commitment by the Funds to purchase a specific commodity will be limited to the aggregate face amount of the contacts held.
The exposure of the Funds to market risk will depend primarily on the market price of the specific commodities held by the Fund. The market price of the commodities depends in part on the volatility of interest rates and foreign exchange rates and the liquidity of the commodity-specific markets.
TAGS is subject to the risks of the commodity-specific futures contracts of the Underlying Funds as the fair value of its holdings is based on the NAV of each of the Underlying Funds, each of which is directly impacted by the factors discussed above.
The tables below present a quantitative analysis of hypothetical impact of price decreases and increases in each of the commodity futures contracts held by each of the Funds, or the Underlying Funds in the case of TAGS, on the actual holdings and NAV per share as of December 31, 2016. For purposes of this analysis, all futures contracts held by the Funds and the Underlying Funds are assumed to change by the same percentage. In addition, the cash held by the Funds and any management fees paid to the Sponsor are assumed to remain constant and not impact the NAV per share. There may be very slight and immaterial differences, due to rounding, in the tables presented below.
70
Quantitative Risk Analysis
CORN:
| December 31, 2016 as Reported | 10% Decrease | 15% Decrease | 20% Decrease | 10% Increase | 15% Increase | 20% Increase | ||||||||||||||||||||||||||||||
| Number of | Notional | Notional | Notional | Notional | Notional | Notional | Notional | |||||||||||||||||||||||||||||
| Holdings as of December 31, 2016 | Contracts Held | Closing Price | Amount | Amount | Amount | Amount | Amount | Amount | Amount | |||||||||||||||||||||||||||
| CBOT Corn Futures MAY17 | 1,438 | $ | 3.5750 | $ | 25,704,250 | $ | 23,133,825 | $ | 21,848,613 | $ | 20,563,400 | $ | 28,274,675 | $ | 29,559,888 | $ | 30,845,100 | |||||||||||||||||||
| CBOT Corn Futures JUL17 | 1,207 | $ | 3.6425 | $ | 21,982,488 | $ | 19,784,239 | $ | 18,685,114 | $ | 17,585,990 | $ | 24,180,736 | $ | 25,279,861 | $ | 26,378,985 | |||||||||||||||||||
| CBOT Corn Futures DEC17 | 1,347 | $ | 3.8000 | $ | 25,593,000 | $ | 23,033,700 | $ | 21,754,050 | $ | 20,474,400 | $ | 28,152,300 | $ | 29,431,950 | $ | 30,711,600 | |||||||||||||||||||
| Total CBOT Corn Futures | $ | 73,279,738 | $ | 65,951,764 | $ | 62,287,777 | $ | 58,623,790 | $ | 80,607,711 | $ | 84,271,698 | $ | 87,935,685 | ||||||||||||||||||||||
| Shares outstanding | 3,900,004 | 3,900,004 | 3,900,004 | 3,900,004 | 3,900,004 | 3,900,004 | 3,900,004 | |||||||||||||||||||||||||||||
| Net Asset Value per Share attributable directly to CBOT Corn Futures | $ | 18.79 | $ | 16.91 | $ | 15.97 | $ | 15.03 | $ | 20.67 | $ | 21.61 | $ | 22.55 | ||||||||||||||||||||||
| Total Net Asset Value per Share as reported | $ | 18.77 | ||||||||||||||||||||||||||||||||||
| Change in the Net Asset Value per Share | $ | (1.88 | ) | $ | (2.82 | ) | $ | (3.76 | ) | $ | 1.88 | $ | 2.82 | $ | 3.76 | |||||||||||||||||||||
| Percent Change in the Net Asset Value per Share | -10.01 | % | -15.01 | % | -20.02 | % | 10.01 | % | 15.01 | % | 20.02 | % | ||||||||||||||||||||||||
SOYB:
| December 31, 2016 as Reported | 10% Decrease | 15% Decrease | 20% Decrease | 10% Increase | 15% Increase | 20% Increase | ||||||||||||||||||||||||||||||
| Number of | Notional | Notional | Notional | Notional | Notional | Notional | Notional | |||||||||||||||||||||||||||||
| Holdings as of December 31, 2016 | Contracts Held | Closing Price | Amount | Amount | Amount | Amount | Amount | Amount | Amount | |||||||||||||||||||||||||||
| CBOT Soybean Futures MAR17 | 90 | $ | 10.0400 | $ | 4,518,000 | $ | 4,066,200 | $ | 3,840,300 | $ | 3,614,400 | $ | 4,969,800 | $ | 5,195,700 | $ | 5,421,600 | |||||||||||||||||||
| CBOT Soybean Futures MAY17 | 76 | $ | 10.1250 | $ | 3,847,500 | $ | 3,462,750 | $ | 3,270,375 | $ | 3,078,000 | $ | 4,232,250 | $ | 4,424,625 | $ | 4,617,000 | |||||||||||||||||||
| CBOT Soybean Futures NOV17 | 91 | $ | 9.8925 | $ | 4,501,088 | $ | 4,050,979 | $ | 3,825,924 | $ | 3,600,870 | $ | 4,951,196 | $ | 5,176,251 | $ | 5,401,305 | |||||||||||||||||||
| Total CBOT Soybean Futures | $ | 12,866,588 | $ | 11,579,929 | $ | 10,936,599 | $ | 10,293,270 | $ | 14,153,246 | $ | 14,796,576 | $ | 15,439,905 | ||||||||||||||||||||||
| Shares outstanding | 675,004 | 675,004 | 675,004 | 675,004 | 675,004 | 675,004 | 675,004 | |||||||||||||||||||||||||||||
| Net Asset Value per Share attributable directly to CBOT Soybean Futures | $ | 19.06 | $ | 17.16 | $ | 16.20 | $ | 15.25 | $ | 20.97 | $ | 21.92 | $ | 22.87 | ||||||||||||||||||||||
| Total Net Asset Value per Share as reported | $ | 19.08 | ||||||||||||||||||||||||||||||||||
| Change in the Net Asset Value per Share | $ | (1.91 | ) | $ | (2.86 | ) | $ | (3.81 | ) | $ | 1.91 | $ | 2.86 | $ | 3.81 | |||||||||||||||||||||
| Percent Change in the Net Asset Value per Share | -9.99 | % | -14.98 | % | -19.98 | % | 9.99 | % | 14.98 | % | 19.98 | % | ||||||||||||||||||||||||
CANE:
| December 31, 2016 as Reported | 10% Decrease | 15% Decrease | 20% Decrease | 10% Increase | 15% Increase | 20% Increase | ||||||||||||||||||||||||||||||
| Number of | Notional | Notional | Notional | Notional | Notional | Notional | Notional | |||||||||||||||||||||||||||||
| Holdings as of December 31, 2016 | Contracts Held | Closing Price | Amount | Amount | Amount | Amount | Amount | Amount | Amount | |||||||||||||||||||||||||||
| ICE #11 Sugar Futures MAY17 | 89 | $ | 0.1925 | $ | 1,918,840 | $ | 1,726,956 | $ | 1,631,014 | $ | 1,535,072 | $ | 2,110,724 | $ | 2,206,666 | $ | 2,302,608 | |||||||||||||||||||
| ICE #11 Sugar Futures JUL17 | 79 | $ | 0.1885 | $ | 1,667,848 | $ | 1,501,063 | $ | 1,417,671 | $ | 1,334,278 | $ | 1,834,633 | $ | 1,918,025 | $ | 2,001,418 | |||||||||||||||||||
| ICE #11 Sugar Futures MAR18 | 93 | $ | 0.1858 | $ | 1,935,293 | $ | 1,741,764 | $ | 1,644,999 | $ | 1,548,234 | $ | 2,128,822 | $ | 2,225,587 | $ | 2,322,351 | |||||||||||||||||||
| Total ICE #11 Sugar Futures | $ | 5,521,981 | $ | 4,969,783 | $ | 4,693,684 | $ | 4,417,585 | $ | 6,074,179 | $ | 6,350,278 | $ | 6,626,377 | ||||||||||||||||||||||
| Shares outstanding | 425,004 | 425,004 | 425,004 | 425,004 | 425,004 | 425,004 | 425,004 | |||||||||||||||||||||||||||||
| Net Asset Value per Share attributable directly to ICE #11 Sugar Futures | $ | 12.99 | $ | 11.69 | $ | 11.04 | $ | 10.39 | $ | 14.29 | $ | 14.94 | $ | 15.59 | ||||||||||||||||||||||
| Total Net Asset Value per Share as reported | $ | 12.97 | ||||||||||||||||||||||||||||||||||
| Change in the Net Asset Value per Share | $ | (1.30 | ) | $ | (1.95 | ) | $ | (2.60 | ) | $ | 1.30 | $ | 1.95 | $ | 2.60 | |||||||||||||||||||||
| Percent Change in the Net Asset Value per Share | -10.01 | % | -15.02 | % | -20.03 | % | 10.01 | % | 15.02 | % | 20.03 | % | ||||||||||||||||||||||||
71
WEAT:
| December 31, 2016 as Reported | 10% Decrease | 15% Decrease | 20% Decrease | 10% Increase | 15% Increase | 20% Increase | ||||||||||||||||||||||||||||||
| Number of | Notional | Notional | Notional | Notional | Notional | Notional | Notional | |||||||||||||||||||||||||||||
| Holdings as of December 31, 2016 | Contracts Held | Closing Price | Amount | Amount | Amount | Amount | Amount | Amount | Amount | |||||||||||||||||||||||||||
| CBOT Wheat Futures MAY17 | 1,037 | $ | 4.2050 | $ | 21,802,925 | $ | 19,622,633 | $ | 18,532,486 | $ | 17,442,340 | $ | 23,983,218 | $ | 25,073,364 | $ | 26,163,510 | |||||||||||||||||||
| CBOT Wheat Futures JUL17 | 861 | $ | 4.3425 | $ | 18,694,463 | $ | 16,825,016 | $ | 15,890,293 | $ | 14,955,570 | $ | 20,563,909 | $ | 21,498,632 | $ | 22,433,355 | |||||||||||||||||||
| CBOT Wheat Futures DEC17 | 939 | $ | 4.6500 | $ | 21,831,750 | $ | 19,648,575 | $ | 18,556,988 | $ | 17,465,400 | $ | 24,014,925 | $ | 25,106,513 | $ | 26,198,100 | |||||||||||||||||||
| Total CBOT Wheat Futures | $ | 62,329,138 | $ | 56,096,224 | $ | 52,979,767 | $ | 49,863,310 | $ | 68,562,051 | $ | 71,678,508 | $ | 74,794,965 | ||||||||||||||||||||||
| Shares outstanding | 9,050,004 | 9,050,004 | 9,050,004 | 9,050,004 | 9,050,004 | 9,050,004 | 9,050,004 | |||||||||||||||||||||||||||||
| Net Asset Value per Share attributable directly to CBOT Wheat Futures | $ | 6.89 | $ | 6.20 | $ | 5.85 | $ | 5.51 | $ | 7.58 | $ | 7.92 | $ | 8.26 | ||||||||||||||||||||||
| Total Net Asset Value per Share as reported | $ | 6.89 | ||||||||||||||||||||||||||||||||||
| Change in the Net Asset Value per Share | $ | (0.69 | ) | $ | (1.03 | ) | $ | (1.38 | ) | $ | 0.69 | $ | 1.03 | $ | 1.38 | |||||||||||||||||||||
| Percent Change in the Net Asset Value per Share | -10.00 | % | -14.99 | % | -19.99 | % | 10.00 | % | 14.99 | % | 19.99 | % | ||||||||||||||||||||||||
TAGS:
| December 31, 2016 as Reported | 10% Decrease | 15% Decrease | 20% Decrease | 10% Increase | 15% Increase | 20% Increase | ||||||||||||||||||||||||||||||
| Number of | ||||||||||||||||||||||||||||||||||||
| Holdings as of December 31, 2016 | Shares Held | Closing NAV | Fair Value | Fair Value | Fair Value | Fair Value | Fair Value | Fair Value | Fair Value | |||||||||||||||||||||||||||
| Teucrium Corn Fund | 17,258 | $ | 18.7727 | $ | 323,979 | $ | 291,581 | $ | 275,382 | $ | 259,183 | $ | 356,377 | $ | 372,576 | $ | 388,775 | |||||||||||||||||||
| Teucrium Soybean Fund | 16,531 | $ | 19.0845 | $ | 315,486 | $ | 283,937 | $ | 268,163 | $ | 252,389 | $ | 347,034 | $ | 362,809 | $ | 378,583 | |||||||||||||||||||
| Teucrium Sugar Fund | 26,424 | $ | 12.9739 | $ | 342,822 | $ | 308,540 | $ | 291,399 | $ | 274,258 | $ | 377,105 | $ | 394,246 | $ | 411,387 | |||||||||||||||||||
| Teucrium Wheat Fund | 48,087 | $ | 6.8889 | $ | 331,267 | $ | 298,140 | $ | 281,577 | $ | 265,013 | $ | 364,393 | $ | 380,957 | $ | 397,520 | |||||||||||||||||||
| Total value of shares of the Underlying Funds | $ | 1,313,554 | $ | 1,182,199 | $ | 1,116,521 | $ | 1,050,843 | $ | 1,444,909 | $ | 1,510,587 | $ | 1,576,265 | ||||||||||||||||||||||
| Shares outstanding | 50,002 | 50,002 | 50,002 | 50,002 | 50,002 | 50,002 | 50,002 | |||||||||||||||||||||||||||||
| Net Asset Value per Share attributable directly to shares of the Underlying Funds | $ | 26.27 | $ | 23.64 | $ | 22.33 | $ | 21.02 | $ | 28.90 | $ | 30.21 | $ | 31.52 | ||||||||||||||||||||||
| Total Net Asset Value per Share as reported | $ | 26.33 | ||||||||||||||||||||||||||||||||||
| Change in the Net Asset Value per Share | $ | (2.63 | ) | $ | (3.94 | ) | $ | (5.25 | ) | $ | 2.63 | $ | 3.94 | $ | 5.25 | |||||||||||||||||||||
| Percent Change in the Net Asset Value per Share | -9.98 | % | -14.97 | % | -19.96 | % | 9.98 | % | 14.97 | % | 19.96 | % | ||||||||||||||||||||||||
72
Qualitative Risk Analysis
Margin is the minimum amount of funds that must be deposited by a commodity interest trader with the trader’s broker to initiate and maintain an open position in futures contracts. A margin deposit acts to assure the trader’s performance of the futures contracts purchased or sold. Futures contracts are customarily bought and sold on initial margin that represents a very small percentage (ranging upward from less than 2%) of the aggregate purchase or sales price of the contract. Because of such low margin requirements, price fluctuations occurring in the futures markets may create profits and losses that, in relation to the amount invested, are greater than are customary in other forms of investment or speculation. As discussed below, adverse price changes in the futures contract may result in margin requirements that greatly exceed the initial margin. In addition, the amount of margin required in connection with a particular futures contract is set from time to time by the exchange on which the contract is traded and may be modified from time to time by the exchange during the term of the contract. Brokerage firms, such as the Funds’ clearing brokers, carrying accounts for traders in commodity interest contracts generally require higher amounts of margin as a matter of policy to further protect themselves. Over-the-counter trading generally involves the extension of credit between counterparties, so the counterparties may agree to require the posting of collateral by one or both parties to address credit exposure.
When a trader purchases an option, there is no margin requirement; however, the option premium must be paid in full. When a trader sells an option, on the other hand, he or she is required to deposit margin in an amount determined by the margin requirements established for the underlying interest and, in addition, an amount substantially equal to the current premium for the option. The margin requirements imposed on the selling of options, although adjusted to reflect the probability that out-of-the-money options will not be exercised, can in fact be higher than those imposed in dealing in the futures markets directly. Complicated margin requirements apply to spreads and conversions, which are complex trading strategies in which a trader acquires a mixture of options positions and positions in the underlying interest.
Ongoing or “maintenance” margin requirements are computed each day by a trader’s clearing broker. When the market value of a particular open futures contract changes to a point where the margin on deposit does not satisfy maintenance margin requirements, a margin call is made by the broker. If the margin call is not met within a reasonable time, the broker may close out the trader’s position. With respect to the various Funds’ trading, the Funds (and not its shareholders personally) are subject to margin calls.
Finally, many major U.S. exchanges have passed certain cross margining arrangements involving procedures pursuant to which the futures and options positions held in an account would, in the case of some accounts, be aggregated and margin requirements would be assessed on a portfolio basis, measuring the total risk of the combined positions.
The Dodd-Frank Act requires the CFTC, the SEC and the Office of the Comptroller of the Currency, the Board of Governors of the Federal Reserve System, the Federal Deposit Insurance Corporation, the Farm Credit System and the Federal Housing Finance Agency (collectively, the “Prudential Regulators”) to establish “both initial and variation margin requirements on all swaps that are not cleared by a registered clearing organization” (i.e., uncleared or over-the-counter swaps). The proposed rules would require swap dealers and major swap participants to collect both variation and initial margin from their financial entity counterparties such as the Funds or Underlying Funds but would not require these swap dealers or major swap participants to post variation margin or initial margin to the Funds or Underlying Funds. The CFTC and the Prudential Regulators finalized these rules in 2016 and compliance became necessary in September, 2016.
An “exchange for related position” (“EFRP”) can be used by the Fund as a technique to facilitate the exchanging of a futures hedge position against a creation or redemption order, and thus the Fund may use an EFRP transaction in connection with the creation and redemption of shares. The market specialist/market maker that is the ultimate purchaser or seller of shares in connection with the creation or redemption basket, respectively, agrees to sell or purchase a corresponding offsetting futures position which is then settled on the same business day as a cleared futures transaction by the FCMs. The Fund will become subject to the credit risk of the market specialist/market maker until the EFRP is settled or terminated. The Fund reports all activity related to EFRP transactions under the procedures and guidelines of the CFTC and the exchanges on which the futures are traded.
The Funds, other than TAGS, will generally retain cash positions of approximately 94% of total net assets; this balance represents the total net assets less the initial margin requirements discussed above. These cash assets are either: 1) deposited by the Sponsor in demand deposit accounts of financial institutions which are rated in the highest short-term rating category by a nationally recognized statistical rating organization or deemed by the Sponsor to be of comparable quality; 2) held in short-term Treasury Securities; or 3) held in a money-market fund which is deemed to be a cash equivalent under the most recent SEC definition.
Item 8. Financial Statements and Supplementary Data
See Index to Financial Statements for a list of the financial statements being filed herein.
The Sponsor, on behalf of the Teucrium Commodity Trust and each of the Funds that is a series of the Trust, assessed the effectiveness of both the Trust’s and each Fund’s internal control over financial reporting as of December 31, 2016. In making this assessment, it used the criteria in the Internal Control – Integrated framework issued by the Committee of Sponsoring Organizations of the Treadway Commission in 2013. Based on the assessment, the Trust believes that, as of December 31, 2016, the internal control over financial reporting of both the Trust and each of the Fund that is a series of the Trust is effective.
73
Item 9. Changes in and Disagreements with Accountants on Accounting and Financial Disclosure
None.
Item 9A. Controls and Procedures
Disclosure Controls and Procedures
The Trust and each Fund maintains disclosure controls and procedures that are designed to ensure that information required to be disclosed in the Trust’s periodic reports filed or submitted under the Securities Exchange Act of 1934, as amended (the “Exchange Act”) is recorded, processed, summarized and reported within the time period specified in the SEC’s rules and forms for the Trust and each Fund thereof.
Management of the Sponsor of the Funds (“Management”), including Dale Riker, the Sponsor’s Principal Executive Officer and Barbara Riker, the Sponsor’s Principal Financial Officer, who perform functions equivalent to those of a principal executive officer and principal financial officer of the Trust if the Trust had any officers, have evaluated the effectiveness of the design and operation of the Trust’s and each Fund’s disclosure controls and procedures (as defined in Rule 13a-15(e) or 15d-15(e) of the Securities Exchange Act of 1934, as amended (the “Exchange Act”)) as of the end of the period covered by this report, and, based upon that evaluation, concluded that the Trust’s and each Fund’s disclosure controls and procedures were effective as of the end of such period, to ensure that information the Trust is required to disclose in the reports that it files or submits with the SEC under the Exchange Act is recorded, processed, summarized and reported, within the time periods specified in the SEC’s rules and forms, and to ensure that information required to be disclosed by the Trust in the reports that it files or submits under the Exchange Act is accumulated and communicated to management of the Sponsor, as appropriate, to allow timely decisions regarding required disclosure. The scope of the evaluation of the effectiveness of the design and operation of its disclosure controls and procedures covers the Trust, as well as separately for each Fund that is a series of the Trust.
The certifications of the Chief Executive Officer and Chief Financial Officer are applicable to each Fund individually as well as the Trust as a whole.
Management’s Annual Report on Internal Control over Financial Reporting
Management of the Sponsor, on behalf of the Trust and each Fund are responsible for establishing and maintaining adequate internal control over financial reporting. The Trust’s and each Fund’s internal control system is designed to provide reasonable assurance to the Sponsor regarding the preparation and fair presentation of published financial statements. All internal control systems, no matter how well designed, have inherent limitations. Therefore, even those systems determined to be effective can provide only reasonable assurance with respect to financial statement preparation and presentation.
Management of the Sponsor, including Dale Riker, Principal Executive Officer of the Sponsor, and Barbara Riker, Principal Financial Officer of the Sponsor, who perform functions equivalent to those of a principal executive officer and principal financial officer of the Trust if the Trust had any officers, assessed the effectiveness of the Trust’s and each Fund’s internal control over financial reporting as of December 31, 2016. In making this assessment, it used the criteria in the Internal Control – Integrated framework issued by the Committee of Sponsoring Organizations of the Treadway Commission in 2013. Based on the assessment, Management believes that, as of December 31, 2016, the internal control over financial reporting is effective for the Trust and each Fund thereof. Grant Thornton, the public accounting firm that audited the financial statement included herein for the year-ended 2016, has issued an attestation report on the Trust and each Fund’s internal control over financial reporting for that period.
Changes in Internal Control over Financial Reporting
There has been no change in the Trust’s or the Funds’ internal controls over the financial reporting (as defined in the Rules 13a-15(f) and 15d-15(f) of the Exchange Act) that occurred during the Trust’s last fiscal quarter that has materially affected, or is reasonably likely to materially affect, the Trust’s or the Funds’ internal control over financial reporting.
Not applicable.
Item 10. Directors and Executive Officers of the Registrant
The Trust has no directors, officers or employees and is managed by the Sponsor, Teucrium Trading, LLC. The Sponsor is managed by the officers of the Sponsor under its Limited Liability Company Agreement. A discussion concerning the officers of the Sponsor is incorporated herein under Item 1 of this report.
74
Code of Ethics
The Sponsor has adopted a Code of Business Conduct and Ethics (the “Code of Ethics”) which applies to all of its officers (including senior financial officers) and employees; the Sponsor’s Code of Ethics covers all officers and employees that manage the Trust and the Funds. A printed copy of the Code of Ethics is available to any person free of charge, upon request, by contacting the Sponsor at:
Teucrium Trading, LLC
232 Hidden Lake Road
Building A
Brattleboro, Vermont 05301
Phone: (802) 257-1617
Section 16(a) Beneficial Ownership Reporting Compliance
Section 16(a) of the Exchange Act requires directors and executive officers of the Sponsor and persons who are beneficial owners of at least 10% a Fund’s Shares to file with the SEC an Initial Statement of Beneficial Ownership of Securities on Form 3 within ten calendar days of first becoming a director, executive officer or beneficial owner of at least 10% of a Fund’s Shares and a Statement of Changes in Beneficial Ownership of Securities on Form 4 within two business days of a subsequent acquisition or disposition of Shares of a Fund and, unless all reportable transactions were previously reported on Form 3 or Form 4, an Annual Statement of Changes in Beneficial Ownership of Securities on Form 5 within 45 days after the Trust’s fiscal year-end. For the year ended December 31, 2016, based solely on a review of the Section 16(a) reports furnished to the Trust and written representation by the Trust’s Section 16(a) reporting persons, to the best knowledge of the Sponsor, all such filings have been made within these prescribed timeframes.
Item 11. Executive Compensation
The Trust does not directly compensate any of the executive officers of the Sponsor. The executive officers of the Sponsor are compensated by the Sponsor for the work they perform on behalf of the Trust. The Trust does not set the amount or form of any portion of, the compensation paid to the executive officers by the Sponsor. Each of the series of the Trust, except for TAGS, is obligated to pay a management fee to the Sponsor at an annualized rate of 1.00% of average daily net assets. The Sponsor has the right to elect to waive the management fee for any Fund; that election may be changed by the Sponsor. For 2016, the Funds recognized $1,309,046 in management fees to the Sponsor. In addition to the management fee, each Fund reimburses the Sponsor for expenses related to the operation of the Fund. These related party expenses are discussed in the Notes to the Financial Statements for the Trust and each Fund in Part II of this filing.
Item 12. Security Ownership of Certain Beneficial Owners and Management and Related Stockholder Matters
| a. | Security Ownership of Certain Beneficial Owners. The following table sets forth information with respect to each person known to own beneficially more than 5% of the outstanding shares of any series in the Trust as of December 31, 2016, based on a review of the Schedules 13D and 13G filed with the SEC as of February 7, 2017. |
(1) Title of Class |
(2) Name
and Address of |
(3) Amount
and Nature of |
(4) Percent of Class |
| CANE | Counsel Portfolio Services Inc., 2680 Skymark Avenue, 7th Floor, Mississauga, Ontario A6 L4W 5L6 | 173,465 common units(1) | 40.81% |
| CANE | Teucrium Agricultural Fund, 232 Hidden Lake Road, Building A, Brattleboro, Vermont 05301 | 26,424 common units | 6.22% |
| SOYB | Counsel Portfolio Services Inc., 2680 Skymark Avenue, 7th Floor, Mississauga, Ontario A6 L4W 5L6 | 118,462 common units(2) | 16.34% |
(1) Based on information contained in a Schedule 13D/A filed with the SEC on February 7, 2017 by Counsel Portfolio Services, Inc. The Schedule 13D/A indicates that Counsel Portfolio Services, Inc. has sole voting and dispositive power with respect to all of the shares.
(2) Based on information contained in a Schedule 13D/A filed with the SEC on October 13, 2016 by Counsel Portfolio Services, Inc. The Schedule 13D/A indicates that Counsel Portfolio Services, Inc. has sole voting and dispositive power with respect to all of the shares.
75
b. Security Ownership of Management
The following table sets forth information regarding the beneficial ownership of shares by the executive officers of the Sponsor as of December 31, 2016. Except as listed, no other executive officer of the Sponsor is a beneficial owner of shares of any series of the Trust.
(1) Title of Class |
(2) Name of Beneficial Owner |
(3) Amount
and nature of |
(4) Percent of Class |
| CORN | Sal Gilbertie | 401 common units | * |
| SOYB | Sal Gilbertie | 100 common units | * |
| CANE | Sal Gilbertie | 500 common units | * |
| WEAT | Sal Gilbertie | 200 common units | * |
| TAGS | Sal Gilbertie | 1,400 common units | 2.80% |
| TAGS | Dale Riker | 200 common units(1) | * |
(1) Units are held by an entity controlled by Mr. Riker.
* Less than 1%.
c. Change in Control.
Neither the Sponsor nor the Trustee knows of any arrangements which may subsequently result in a change in the control of the Trust.
Item 13. Certain Relationships and Related Transactions and Director Independence
Neither the Trust or the Funds entered into any transaction in excess of $120,000 in which any related person had a direct or indirect material interest and the Trust and the Funds do not propose to enter into any such transaction.
Item 14. Principal Accountant Fees and Services
Fees paid by the Trust for services performed by Rothstein Kass and Grant Thornton, as applicable, for the years ended December 31, 2016 and December 31, 2015 were:
| Years Ended | ||||||||
| December 31, 2016 | December 31, 2015 | |||||||
| Audit fees - Rothstein Kass | $ | — | $ | 6,500 | ||||
| Audit fees – Grant Thornton | $ | 427,350 | $ | 370,250 | ||||
| Total | $ | 427,350 | $ | 376,775 | ||||
The Sponsor approved all of the services provided by Rothstein Kass and Grant Thornton above. The Sponsor preapproves all audit and non-audit services, if any, of the Trust’s independent registered public accounting firm, including all engagement fees and terms.
Item 15. Exhibits and Financial Statements Schedules
The following exhibits are filed as part of this report as required under Item 601 of Regulation S-K:
| 3.1 | Second Amended and Restated Declaration of Trust and Trust Agreement of the Registrant. (1) | |
| 3.2 | Certificate of Trust of the Registrant. (2) | |
3.3 |
Instrument Establishing Teucrium Sugar Fund, Teucrium Wheat Fund, Teucrium Soybean Fund, Teucrium Natural Gas Fund and Teucrium WTI Crude Oil Fund. (3) | |
| 3.4 | Instrument Establishing Teucrium Agricultural Fund (4) | |
| 10.1 | Form of Authorized Purchaser Agreement. (9) | |
| 10.2 | Distribution Services Agreement. (5) | |
| 10.3 | Amended and Restated Distribution Services Agreement. (6) | |
| 10.4 | Amendment to Amended and Restated Distribution Services Agreement. (7) |
76
| 10.5 | Second Amendment to Amended and Restated Distribution Services Agreement (8) | |
| 10.6 | Third Amendment to Amended and Restated Distribution Services Agreement (10) | |
10.7 |
Fourth Amendment to Amended and Restated Distribution Services Agreement (11) | |
| 10.8 | Custody Agreement. (12) | |
| 10.9 | Fund Accounting Servicing Agreement (12) | |
| 10.10 | Transfer Agent Servicing Agreement (12) | |
| 10.11 | Fund Administration Servicing Agreement (12) | |
| 31.1 | ||
| 31.2 | Certification by the Principal Financial Officer of the Registrant pursuant to Rules 13a-14 and 15d-14 of the Exchange Act. (13) | |
| 32.1 | Certification by the Principal Executive Officer of the Registrant pursuant to 18 U.S.C. Section 1350, as adopted pursuant to Section 906 of the Sarbanes-Oxley Act of 2002. (13) | |
| 32.2 | Certification by the Principal Financial Officer of the Registrant pursuant to 18 U.S.C. Section 1350, as adopted pursuant to Section 906 of the Sarbanes-Oxley Act of 2002. (13) | |
| 101.INS | XBRL Instance Document (13) | |
| 101.SCH | XBRL Taxonomy Extension Schema (13) | |
101.CAL |
XBRL Taxonomy Extension Calculation Linkbase (13) | |
| 101.DEF | XBRL Taxonomy Definition Linkbase (13) | |
| 101.LAB | XBRL Taxonomy Extension Label Linkbase (13) | |
| 101.PRE | XBRL Taxonomy Extension Presentation Linkbase (13) |
77
| (1) Previously filed as like-numbered exhibit to Post-Effective Amendment No. 1 to Registration Statement No. 333-162033, filed on October 22, 2010 and incorporated by reference herein. |
| (2) Previously filed as like-numbered exhibit to Registration Statement No. 333-162033, filed on September 21, 2009 and incorporated by reference herein. |
| (3) Previously filed as like-numbered exhibit to Pre-Effective Amendment No. 1 to Registration Statement No. 333-167590, filed on March 9, 2011 and incorporated by reference herein. |
(4) Previously filed as Exhibit 3.3 to Registration Statement No. 333-173691, filed on April 25, 2011 and incorporated by reference herein.
(5) Previously filed as Exhibit 10.2 to Post-Effective Amendment No. 1 to Registration Statement No. 333-162033, filed on October 22, 2010 and incorporated by reference herein. |
| (6) Previously filed as Exhibit 10.2(1) to Registrant’s Current Report on Form 8-K for the Teucrium Corn Fund, filed on November 1, 2011 and incorporated herein by reference. |
| (7) Previously filed as Exhibit 10.2(2) to Registrant’s Current Report on Form 8-K for the Teucrium Corn Fund, filed on November 1, 2011 and incorporated by reference herein. |
| (8) Previously filed as Exhibit 10.2(3) to Registrant’s Current Report on Form 8-K for the Teucrium Corn Fund, filed on November 1, 2011 and incorporated by reference herein. |
| (9) Previously filed as like-numbered exhibit to Pre-Effective Amendment No. 1 to Registration Statement No. 333-173691, filed on December 5, 2011. | ||
| (10) Previously filed as Exhibit 10.5 to Pre-Effective Amendment No.1 to Registration Statement No. 333-187463, filed on April 26, 2013. | ||
(11) Previously filed as Exhibit to 10.9 to Registration Statement No. 333-201953, filed on February 9, 2015 and incorporated by reference herein. |
(12) Previously filed as like-numbered exhibit to Registrant’s Report on Form 10-K for the fiscal year ended December 31, 2015, filed on March 16, 2016. |
| (13) Filed herein. |
78
TEUCRIUM COMMODITY TRUST
FINANCIAL STATEMENTS AS OF DECEMBER 31, 2016
Index to Financial Statements
| 79 |
Report of Independent Registered Public Accounting Firm
To the Executive Committee of the Sponsor of
Teucrium Commodity Trust
We have audited the accompanying combined statements of assets and liabilities of Teucrium Commodity Trust (a Delaware statutory trust) (the “Trust”), including the combined schedules of investments, as of December 31, 2016 and 2015, and the related combined statements of operations, changes in net assets, and cash flows for each of the three years in the period ended December 31, 2016. These financial statements are the responsibility of the Trust’s management. Our responsibility is to express an opinion on these financial statements based on our audits.
We conducted our audits in accordance with the standards of the Public Company Accounting Oversight Board (United States). Those standards require that we plan and perform the audit to obtain reasonable assurance about whether the financial statements are free of material misstatement. An audit includes examining, on a test basis, evidence supporting the amounts and disclosures in the financial statements. An audit also includes assessing the accounting principles used and significant estimates made by management, as well as evaluating the overall financial statement presentation. We believe that our audits provide a reasonable basis for our opinion.
In our opinion, the combined financial statements referred to above present fairly, in all material respects, the financial position of Teucrium Commodity Trust as of December 31, 2016 and 2015, and the results of their operations and their cash flows for each of the three years in the period ended December 31, 2016 in conformity with accounting principles generally accepted in the United States of America.
We also have audited, in accordance with the standards of the Public Company Accounting Oversight Board (United States), the Trust’s internal control over financial reporting as of December 31, 2016, based on criteria established in the 2013 Internal Control—Integrated Framework issued by the Committee of Sponsoring Organizations of the Treadway Commission (COSO), and our report dated March 16, 2017 expressed an unqualified opinion.
/s/ GRANT THORNTON LLP
New York, New York
March 16, 2017
| 80 |
Report of Independent Registered Public Accounting Firm
To the Executive Committee of the Sponsor of
Teucrium Commodity Trust
We have audited the internal control over financial reporting of Teucrium Commodity Trust (a Delaware statutory trust) (the “Trust”) as of December 31, 2016, based on criteria established in the 2013 Internal Control—Integrated Framework issued by the Committee of Sponsoring Organizations of the Treadway Commission (COSO). The Company’s management is responsible for maintaining effective internal control over financial reporting and for its assessment of the effectiveness of internal control over financial reporting, included in the accompanying Management’s Report on Internal Control over Financial Reporting. Our responsibility is to express an opinion on the Trust’s internal control over financial reporting based on our audit.
We conducted our audit in accordance with the standards of the Public Company Accounting Oversight Board (United States). Those standards require that we plan and perform the audit to obtain reasonable assurance about whether effective internal control over financial reporting was maintained in all material respects. Our audit included obtaining an understanding of internal control over financial reporting, assessing the risk that a material weakness exists, testing and evaluating the design and operating effectiveness of internal control based on the assessed risk, and performing such other procedures as we considered necessary in the circumstances. We believe that our audit provides a reasonable basis for our opinion.
A trust’s internal control over financial reporting is a process designed to provide reasonable assurance regarding the reliability of financial reporting and the preparation of financial statements for external purposes in accordance with generally accepted accounting principles. A trust’s internal control over financial reporting includes those policies and procedures that (1) pertain to the maintenance of records that, in reasonable detail, accurately and fairly reflect the transactions and dispositions of the assets of the trust; (2) provide reasonable assurance that transactions are recorded as necessary to permit preparation of financial statements in accordance with generally accepted accounting principles, and that receipts and expenditures of the trust are being made only in accordance with authorizations of management and directors of the trust; and (3) provide reasonable assurance regarding prevention or timely detection of unauthorized acquisition, use, or disposition of the trust’s assets that could have a material effect on the financial statements.
Because of its inherent limitations, internal control over financial reporting may not prevent or detect misstatements. Also, projections of any evaluation of effectiveness to future periods are subject to the risk that controls may become inadequate because of changes in conditions, or that the degree of compliance with the policies or procedures may deteriorate.
In our opinion, the Trust maintained, in all material respects, effective internal control over financial reporting as of December 31, 2016, based on criteria established in the 2013 Internal Control—Integrated Framework issued by COSO.
We also have audited, in accordance with the standards of the Public Company Accounting Oversight Board (United States), the combined financial statements of the Trust as of and for the year ended December 31, 2016, and our report dated March 16, 2017 expressed an unqualified opinion on those financial statements.
/s/ GRANT THORNTON LLP
New York, New York
March 16, 2017
| 81 |
TEUCRIUM COMMODITY TRUST
COMBINED STATEMENTS OF ASSETS AND LIABILITIES
| December 31, 2016 | December 31, 2015 | |||||||
| Assets | ||||||||
| Cash and cash equivalents | $ | 145,323,469 | $ | 92,561,610 | ||||
| Interest receivable | 708 | 776 | ||||||
| Restricted cash | 151,684 | 307,683 | ||||||
| Other assets | 27,135 | 723,450 | ||||||
| Equity in trading accounts: | ||||||||
| Commodity futures contracts | 542,647 | 380,231 | ||||||
| Due from broker | 13,782,616 | 11,790,423 | ||||||
| Total equity in trading accounts | 14,325,263 | 12,170,654 | ||||||
| Total assets | 159,828,259 | 105,764,173 | ||||||
| Liabilities | ||||||||
| Management fee payable to Sponsor | 129,201 | 82,863 | ||||||
| Other liabilities | 15,916 | 8,147 | ||||||
| Equity in trading accounts: | ||||||||
| Commodity futures contracts | 5,725,955 | 6,071,676 | ||||||
| Total liabilities | 5,871,072 | 6,162,686 | ||||||
| Net assets | $ | 153,957,187 | $ | 99,601,487 | ||||
The accompanying notes are an integral part of these financial statements.
| 82 |
TEUCRIUM COMMODITY TRUST
COMBINED SCHEDULE OF INVESTMENTS
December 31, 2016
| Description: Assets | Fair Value | Percentage of Net Assets | Shares | |||||||||
| Cash equivalents | ||||||||||||
| Money market funds | ||||||||||||
| Fidelity Institutional Money Market Funds - Government Portfolio (cost $1,412,423) | $ | 1,412,423 | 0.92 | % | 1,412,423 | |||||||
| Notional
Amount (Long Exposure) | ||||||||||||
| Commodity futures contracts | ||||||||||||
| United States soybean futures contracts | ||||||||||||
| CBOT soybean futures MAR17 (90 contracts) | $ | 107,125 | 0.07 | % | $ | 4,518,000 | ||||||
| CBOT soybean futures NOV17 (91 contracts) | 250,375 | 0.16 | 4,501,088 | |||||||||
| United States sugar futures contracts | ||||||||||||
| ICE sugar futures MAR18 (93 contracts) | 185,147 | 0.12 | 1,935,293 | |||||||||
| Total commodity futures contracts | $ | 542,647 | 0.35 | % | $ | 10,954,381 | ||||||
| Percentage of | Notional Amount | |||||||||||
| Description: Liabilities | Fair Value | Net Assets | (Long Exposure) | |||||||||
| Commodity futures contracts | ||||||||||||
| United States corn futures contracts | ||||||||||||
| CBOT corn futures MAY17 (1,438 contracts) | $ | 50,713 | 0.03 | % | $ | 25,704,250 | ||||||
| CBOT corn futures JUL17 (1,207 contracts) | 576,650 | 0.37 | 21,982,488 | |||||||||
| CBOT corn futures DEC17 (1,347 contracts) | 833,437 | 0.54 | 25,593,000 | |||||||||
| United States soybean futures contracts | ||||||||||||
| CBOT soybean futures MAY17 (76 contracts) | 12,025 | 0.01 | 3,847,500 | |||||||||
| United States sugar futures contracts | ||||||||||||
| ICE sugar futures MAY17 (89 contracts) | 105,829 | 0.07 | 1,918,840 | |||||||||
| ICE sugar futures JUL17 (79 contracts) | 225,713 | 0.15 | 1,667,848 | |||||||||
| United States wheat futures contracts | ||||||||||||
| CBOT wheat futures MAY17 (1,037 contracts) | 1,011,350 | 0.66 | 21,802,925 | |||||||||
| CBOT wheat futures JUL17 (861 contracts) | 213,963 | 0.14 | 18,694,463 | |||||||||
| CBOT wheat futures DEC17 (939 contracts) | 2,696,275 | 1.75 | 21,831,750 | |||||||||
| Total commodity futures contracts | $ | 5,725,955 | 3.72 | % | $ | 143,043,064 | ||||||
| Shares | ||||||||||||
| Exchange-traded funds* | ||||||||||||
| Teucrium Corn Fund | $ | 323,979 | 0.21 | % | 17,258 | |||||||
| Teucrium Soybean Fund | 315,486 | 0.20 | 16,531 | |||||||||
| Teucrium Sugar Fund | 342,822 | 0.22 | 26,424 | |||||||||
| Teucrium Wheat Fund | 331,267 | 0.22 | 48,087 | |||||||||
| Total exchange-traded funds (cost $2,033,919) | $ | 1,313,554 | 0.85 | % | ||||||||
*The Trust eliminates the shares owned by the Teucrium Agricultural Fund from its combined statements of assets and liabilities due to the fact that these represent holdings of the Underlying Funds owned by the Teucrium Agricultural Fund, which are included as shares outstanding of the Underlying Funds.
The accompanying notes are an integral part of these financial statements.
| 83 |
TEUCRIUM COMMODITY TRUST
COMBINED SCHEDULE OF INVESTMENTS
December 31, 2015
| Percentage of | ||||||||||||
| Description: Assets | Fair Value | Net Assets | Shares | |||||||||
| Cash equivalents | ||||||||||||
| Money market funds | ||||||||||||
| Fidelity Institutional Prime Money Market Portfolio (cost $2,539,642) | $ | 2,539,642 | 2.55 | % | 2,539,642 | |||||||
| Notional Amount | ||||||||||||
| (Long Exposure) | ||||||||||||
| Commodity futures contracts | ||||||||||||
| United States soybean futures contracts | ||||||||||||
| CBOT soybean futures MAY16 (45 contracts) | $ | 16,175 | 0.02 | % | $ | 1,956,375 | ||||||
| United States sugar futures contracts | ||||||||||||
| ICE sugar futures MAY16 (115 contracts) | 151,973 | 0.15 | 1,921,696 | |||||||||
| ICE sugar futures JUL16 (101 contracts) | 199,517 | 0.20 | 1,656,077 | |||||||||
| ICE sugar futures MAR17 (114 contracts) | 12,566 | 0.01 | 1,927,968 | |||||||||
| Total commodity futures contracts | $ | 380,231 | 0.38 | % | $ | 7,462,116 | ||||||
| Percentage of | Notional Amount | |||||||||||
| Description: Liabilities | Fair Value | Net Assets | (Long Exposure) | |||||||||
| Commodity futures contracts | ||||||||||||
| United States corn futures contracts | ||||||||||||
| CBOT corn futures MAY16 (1,172 contracts) | $ | 1,910,013 | 1.92 | % | $ | 21,359,700 | ||||||
| CBOT corn futures JUL16 (988 contracts) | 925,750 | 0.93 | 18,302,700 | |||||||||
| CBOT corn futures DEC16 (1,117 contracts) | 1,072,787 | 1.08 | 21,390,550 | |||||||||
| United States soybean futures contracts | ||||||||||||
| CBOT soybean futures MAR16 (52 contracts) | 30,075 | 0.03 | 2,247,050 | |||||||||
| CBOT soybean futures NOV16 (52 contracts) | 208,587 | 0.21 | 2,295,150 | |||||||||
| United States wheat futures contracts | ||||||||||||
| CBOT wheat futures MAY16 (390 contracts) | 379,713 | 0.38 | 9,291,750 | |||||||||
| CBOT wheat futures JUL16 (330 contracts) | 331,313 | 0.33 | 7,973,625 | |||||||||
| CBOT wheat futures DEC16 (366 contracts) | 1,213,438 | 1.22 | 9,287,250 | |||||||||
| Total commodity futures contracts | $ | 6,071,676 | 6.10 | % | $ | 92,147,775 | ||||||
| Exchange-traded funds* | Shares | |||||||||||
| Teucrium Corn Fund | $ | 326,157 | 0.33 | % | 15,358 | |||||||
| Teucrium Soybean Fund | 331,730 | 0.33 | 19,131 | |||||||||
| Teucrium Sugar Fund | 345,281 | 0.35 | 34,474 | |||||||||
| Teucrium Wheat Fund | 321,433 | 0.32 | 35,137 | |||||||||
| Total exchange-traded funds (cost $2,126,379) | $ | 1,324,601 | 1.33 | % | ||||||||
*The Trust eliminates the shares owned by the Teucrium Agricultural Fund from its combined statements of assets and liabilities due to the fact that these represent holdings of the Underlying Funds owned by the Teucrium Agricultural Fund, which are included as shares outstanding of the Underlying Funds.
The accompanying notes are an integral part of these financial statements.
| 84 |
TEUCRIUM COMMODITY TRUST
COMBINED STATEMENTS OF OPERATIONS
| Year ended | Year ended | Year ended | ||||||||||
| December 31, 2016 | December 31, 2015 | December 31, 2014 | ||||||||||
| Income | ||||||||||||
| Realized and unrealized gain (loss) gain on trading of commodity futures contracts: | ||||||||||||
| Realized loss on commodity futures contracts | $ | (16,163,531 | ) | $ | (15,729,142 | ) | $ | (14,566,828 | ) | |||
| Net change in unrealized appreciation or depreciation on commodity futures contracts | 508,136 | (7,378,689 | ) | 7,476,470 | ||||||||
| Interest income | 725,493 | 221,809 | 48,353 | |||||||||
| Total loss | (14,929,902 | ) | (22,886,022 | ) | (7,042,005 | ) | ||||||
| Expenses | ||||||||||||
| Management fees | 1,309,046 | 1,143,253 | 1,287,226 | |||||||||
| Professional fees | 1,540,639 | 1,197,938 | 1,044,808 | |||||||||
| Distribution and marketing fees | 2,287,894 | 1,763,168 | 1,656,797 | |||||||||
| Custodian fees and expenses | 359,937 | 779,473 | 158,963 | |||||||||
| Business permits and licenses fees | 104,956 | 88,529 | 161,525 | |||||||||
| General and administrative expenses | 286,251 | 311,620 | 250,198 | |||||||||
| Brokerage commissions | 155,345 | 71,854 | 171,561 | |||||||||
| Other expenses | 102,591 | 60,809 | 83,821 | |||||||||
| Total expenses | 6,146,659 | 5,416,644 | 4,814,899 | |||||||||
| Expenses waived by the Sponsor | (838,015 | ) | (980,683 | ) | (640,328 | ) | ||||||
| Reimbursement of expenses previously waived | — | — | 379,753 | |||||||||
| Total expenses, net | 5,308,644 | 4,435,961 | 4,554,324 | |||||||||
| Net loss | $ | (20,238,546 | ) | $ | (27,321,983 | ) | $ | (11,596,329 | ) | |||
The accompanying notes are an integral part of these financial statements.
| 85 |
TEUCRIUM COMMODITY TRUST
COMBINED STATEMENTS OF CHANGES IN NET ASSETS
| Year ended | Year ended | Year ended | ||||||||||
| December 31, 2016 | December 31, 2015 | December 31, 2014 | ||||||||||
| Operations | ||||||||||||
| Net loss | $ | (20,238,546 | ) | $ | (27,321,983 | ) | $ | (11,596,329 | ) | |||
| Capital transactions | ||||||||||||
| Issuance of Shares | 121,278,251 | 32,803,944 | 194,483,531 | |||||||||
| Redemption of Shares | (46,688,821 | ) | (51,232,764 | ) | (102,411,535 | ) | ||||||
| Net change in the cost of the Underlying Funds | 4,816 | 318 | 9,395 | |||||||||
| Total capital transactions | 74,594,246 | (18,428,502 | ) | 92,081,391 | ||||||||
| Net change in net assets | 54,355,700 | (45,750,485 | ) | 80,485,062 | ||||||||
| Net assets, beginning of period | 99,601,487 | 145,351,972 | 64,866,910 | |||||||||
| Net assets, end of period | $ | 153,957,187 | $ | 99,601,487 | $ | 145,351,972 | ||||||
The accompanying notes are an integral part of these financial statements.
| 86 |
TEUCRIUM COMMODITY TRUST
COMBINED STATEMENTS OF CASH FLOWS
| Year ended | Year ended | Year ended | ||||||||||
| December 31, 2016 | December 31, 2015 | December 31, 2014 | ||||||||||
| Cash flows from operating activities: | ||||||||||||
| Net loss | $ | (20,238,546 | ) | $ | (27,321,983 | ) | $ | (11,596,329 | ) | |||
| Adjustments to reconcile net loss to net cash used in operating activities: | ||||||||||||
| Net change in unrealized appreciation or depreciation on commodity futures contracts | (508,136 | ) | 7,378,689 | (7,476,470 | ) | |||||||
| Changes in operating assets and liabilities: | ||||||||||||
| Due from broker | (1,992,193 | ) | (8,824,417 | ) | 8,802,314 | |||||||
| Interest receivable | 67 | 9,219 | (5,895 | ) | ||||||||
| Restricted cash | 155,999 | (307,683 | ) | — | ||||||||
| Other assets | 696,315 | (130,874 | ) | (210,031 | ) | |||||||
| Due to broker | — | (60,805 | ) | (36,797 | ) | |||||||
| Management fee payable to Sponsor | 46,338 | (48,962 | ) | 78,727 | ||||||||
| Other liabilities | 7,769 | (130,524 | ) | 83,297 | ||||||||
| Net cash used in operating activities | (21,832,387 | ) | (29,437,340 | ) | (10,361,184 | ) | ||||||
| Cash flows from financing activities: | ||||||||||||
| Proceeds from sale of Shares | 121,278,251 | 32,803,944 | 194,483,531 | |||||||||
| Redemption of Shares | (46,688,821 | ) | (53,228,949 | ) | (100,415,350 | ) | ||||||
| Net change in cost of the Underlying Funds | 4,816 | 318 | 9,395 | |||||||||
| Net cash provided by (used in) financing activities | 74,594,246 | (20,424,687 | ) | 94,077,576 | ||||||||
| Net change in cash and cash equivalents | 52,761,859 | (49,862,027 | ) | 83,716,392 | ||||||||
| Cash and cash equivalents, beginning of period | 92,561,610 | 142,423,637 | 58,707,245 | |||||||||
| Cash and cash equivalents, end of period | $ | 145,323,469 | $ | 92,561,610 | $ | 142,423,637 | ||||||
The accompanying notes are an integral part of these financial statements.
| 87 |
December 31, 2016
Note 1 – Organization and Operation
Teucrium Commodity Trust (“Trust”), a Delaware statutory trust organized on September 11, 2009, is a series trust consisting of five series: Teucrium Corn Fund (“CORN”), Teucrium Sugar Fund (“CANE”), Teucrium Soybean Fund (“SOYB”), Teucrium Wheat Fund (“WEAT”), and Teucrium Agricultural Fund (“TAGS”). All these series of the Trust are collectively referred to as the “Funds” and singularly as the “Fund.” Each Fund is a commodity pool that is a series of the Trust. The Funds issue common units, called the “Shares,” representing fractional undivided beneficial interests in a Fund. The Trust and the Funds operate pursuant to the Trust’s Second Amended and Restated Declaration of Trust and Trust Agreement (the “Trust Agreement”). Two additional series, the Teucrium Natural Gas Fund (“NAGS”) and the Teucrium WTI Crude Oil Fund (“CRUD”) commenced operations in 2011; these, however, ceased trading and were deregistered effective with the close of trading on December 18, 2014. Liquidation of NAGS and CRUD was completed prior to December 31, 2014 and the Form 15 was filed on January 9, 2015.
On June 5, 2010, the initial Form S-1 for CORN was declared effective by the U.S. Securities and Exchange Commission (“SEC”). On June 8, 2010, four Creation Baskets for CORN were issued representing 200,000 shares and $5,000,000. CORN began trading on the New York Stock Exchange (“NYSE”) Arca on June 9, 2010. On April 29, 2016, a second subsequent registration statement for CORN was declared effective by the SEC.
On June 17, 2011, the initial Forms S-1 for CANE, SOYB, and WEAT were declared effective by the SEC. On September 16, 2011, two Creation Baskets were issued for each Fund, representing 100,000 shares and $2,500,000, for CANE, SOYB, and WEAT. On September 19, 2011, CANE, SOYB, and WEAT started trading on the NYSE Arca. On June 30, 2014, subsequent registration statements for CANE, SOYB and WEAT were declared effective by the SEC. On July 15, 2016, a subsequent registration statement for WEAT was declared effective. This registration statement for WEAT registered an additional 24,050,000 shares.
On February 10, 2012, the initial Form S-1 for TAGS was declared effective by the SEC. On March 27, 2012, six Creation Baskets for TAGS were issued representing 300,000 shares and $15,000,000. TAGS began trading on the NYSE Arca on March 28, 2012. On April 30, 2015, a subsequent registration statement for TAGS was declared effective by the SEC.
The specific investment objective of each Fund and information regarding the organization and operation of each Fund are included in each Fund’s financial statements and accompanying notes, as well as in other sections of this Form 10-K filing. In general, the investment objective of each Fund is to have the daily changes in percentage terms of its Shares’ Net Asset Value (“NAV”) reflect the daily changes in percentage terms of a weighted average of the closing settlement prices for certain Futures Contracts for the commodity specified for that Fund. The investment objective of TAGS is to have the daily changes in percentage terms of NAV of its common units (“Shares”) reflect the daily changes in percentage terms of a weighted average (the “Underlying Fund Average”) of the NAVs per share of four other commodity pools that are series of the Trust and are sponsored by the Sponsor: CORN, WEAT, SOYB, and CANE (collectively, the “Underlying Funds”). The Underlying Fund Average will have a weighting of 25% to each Underlying Fund, and the Fund’s assets will be rebalanced to maintain the approximate 25% allocation to each Underlying Fund.
Subject to the terms of the Trust Agreement, Teucrium Trading, LLC in its capacity as the Sponsor (“Sponsor”) may terminate a Fund at any time, regardless of whether the Fund has incurred losses, including, for instance, if it determines that the Fund’s aggregate net assets in relation to its operating expenses make the continued operation of the Fund unreasonable or imprudent. However, no level of losses will require the Sponsor to terminate a Fund.
Note 2 – Liquidation of Funds
On December 18, 2014 the Teucrium WTI Crude Oil Fund (“CRUD”) and the Natural Gas Fund (“NAGS”), both series of the Trust ceased trading on the NYSE Arca and the Sponsor liquidated all commodity futures contracts held by these Funds. All positions were sold through an exchange to unrelated parties. On December 22, 2014 the Bank of New York Mellon who served as the Fund’s Administrator and Custodian, proceeded to distribute cash to all shareholders in an amount equal to each shareholder’s pro rata interest in the respective fund. On December 30, 2014, the Sponsor completed the liquidation of all of the assets of NAGS and CRUD. During 2014, CRUD had $728,663 in subscriptions and $2,008,553 in redemptions, including the shares redeemed as part of the liquidation. During 2014, NAGS had $576,142 in subscriptions and $2,311,504 in redemptions, including the shares redeemed as part of the liquidation. There were zero assets and liabilities as of December 31, 2014. The Form 15 was filed with the SEC on January 9, 2015.
The following summarized financial information presents the results of operations for NAGS and other data for all periods presented, which have been included in continuing operations for the year ended December 31, 2014.
| Year ended | ||||
| December 31, 2014 | ||||
| Total Loss | $ | (16,003 | ) | |
| Total Expenses | $ | 131,501 | ||
| Total Expenses, net | $ | 21,890 | ||
| Net Loss | $ | (37,893 | ) | |
| 88 |
The following summarized financial information presents the results of operations for CRUD and other data for all periods presented, which have been included in continuing operations for the year ended December 31, 2014.
| Year ended | ||||
| December 31, 2014 | ||||
| Total Loss | $ | (734,326 | ) | |
| Total Expenses | $ | 166,176 | ||
| Total Expenses, net | $ | 34,852 | ||
| Net Loss | $ | (769,178 | ) | |
Note 3 – Principal Contracts and Agreements
On August 17, 2015 (the “Conversion Date”), U.S. Bank N.A. replaced The Bank of New York Mellon as the Custodian for the Funds. The principal business address for U.S. Bank N.A. is 1555 North Rivercenter Drive, Suite 302, Milwaukee, Wisconsin 53212. U.S. Bank N.A. is a Wisconsin state chartered bank subject to regulation by the Board of Governors of the Federal Reserve System and the Wisconsin State Banking Department. The principal address for U.S. Bancorp Fund Services, LLC (“USBFS”) is 777 East Wisconsin Avenue, Milwaukee, WI, 53202. In addition, effective on the Conversion Date, USBFS, a wholly owned subsidiary of U.S. Bank, commenced serving as administrator for each Fund, performing certain administrative and accounting services and preparing certain SEC reports on behalf of the Funds, and also became the registrar and transfer agent for each Fund’s Shares. For such services, U.S. Bank and USBFS will receive an asset-based fee, subject to a minimum annual fee.
Given this conversion, the Sponsor has, for the year-ended December 31, 2015, reflected an expense, before and after fees waived by the Sponsor, for fees associated with Custodian, Fund Administration and Transfer Agent services (“Custodian Fees”) that have or will be paid to the Bank of New York Mellon by a Fund or by the Sponsor on behalf of a Fund.
For custody services, the Funds will pay to U.S. Bank N.A. 0.0075% of average gross assets up to $1 billion, and .0050% of average gross assets over $1 billion, annually, plus certain per-transaction charges. For Transfer Agency, Fund Accounting and Fund Administration services, which are based on the total assets for all the Funds in the Trust, the Funds will pay to USBFS 0.06% of average gross assets on the first $250 million, 0.05% on the next $250 million, 0.04% on the next $500 million and 0.03% on the balance over $1 billion annually. A combined minimum annual fee of up to $64,500 for custody, transfer agency, accounting and administrative services is assessed per Fund. For the year ended December 31, 2015, such expenses include both the fees for the Bank of New York Mellon and USBFS. For the years ended December 31, the Funds recognized $359,937 in 2016, $779,473 in 2015 and $158,963 in 2014, respectively, for these services, which is recorded in custodian fees and expenses on the combined statements of operations; of these expenses $61,735 in 2016, $538,688 in 2015 and $13,924 in 2014 were waived by the Sponsor.
The Sponsor employs Foreside Fund Services, LLC (“Foreside” or the “Distributor”) as the Distributor for the Funds. The Distribution Services Agreement among the Distributor and the Sponsor calls for the Distributor to work with the Custodian in connection with the receipt and processing of orders for Creation Baskets and Redemption Baskets and the review and approval of all Fund sales literature and advertising materials. The Distributor and the Sponsor have also entered into a Securities Activities and Service Agreement (the “SASA”) under which certain employees and officers of the Sponsor are licensed as registered representatives or registered principals of the Distributor, under Financial Industry Regulatory Authority (“FINRA”) rules. For its services as the Distributor, Foreside receives a fee of 0.01% of the Fund’s average daily net assets and an aggregate annual fee of $100,000 for all Teucrium Funds, along with certain expense reimbursements. For its services under the SASA, Foreside receives a fee of $5,000 per registered representative and $1,000 per registered location. For the years ended December 31, the Funds recognized $147,940 in 2016, $149,080 in 2015 and $154,761 in 2014, respectively, for these services, which is recorded in distribution and marketing fees on the combined statements of operations; of these expenses $19,815 in 2016, $10,251 in 2015 and $10,311 in 2014 were waived by the Sponsor.
For the year ended December 31, 2014, Newedge USA, LLC (“Newedge USA”) served as the Funds’ futures commission merchant (“FCM”) and primary clearing broker to execute and clear the Funds’ futures transactions and provide other brokerage-related services. In 2014, the Funds introduced the use of Jefferies LLC (“Jefferies”), for the execution and clearing of the Funds’ futures and options, if any, on futures transactions. On January 2, 2015, Newedge USA, LLC (“Newedge USA”) merged with and into SG Americas Securities, LLC (“SG”), with the latter as the surviving entity. On February 6, 2015 Jefferies LLC (“Jefferies”) became the Funds’ FCM and primary clearing broker. All futures contracts held by SG were transferred to Jefferies on that date. As of February 23, 2015 all residual cash balances held at SG had been transferred to Jefferies and the balance in all SG accounts was $0. Effective June 3, 2015, ED&F Man Capital Markets Inc. (“ED&F Man”) replaced Jefferies as the Underlying Funds’ FCM and the clearing broker to execute and clear the Underlying Fund’s futures and provide other brokerage-related services. As of June 4, 2015 all futures contracts and residual cash balances held at Jefferies had been transferred to ED&F Man and the balance in all Jefferies accounts was $0.
Currently, ED&F Man serves as the Underlying Funds’ clearing broker to execute and clear the Underlying Funds’ futures and provide other brokerage-related services. ED&F Man is registered as a FCM with the U.S. CFTC and is a member of the NFA. ED&F Man is also registered as a broker/dealer with the U.S. Securities and Exchange Commission and is a member of the FINRA. ED&F Man is a clearing member of ICE Futures U.S., Inc., Chicago Board of Trade, Chicago Mercantile Exchange, New York Mercantile Exchange, and all other major United States commodity exchanges. For Corn, Soybean, Sugar and Wheat Futures Contracts ED&F Man, Jefferies and SG were paid $8.00 per round turn in 2015 and 2014. Effective January 1, 2016, ED&F Man, increased the per round-term charge for futures contracts commission to $9.00. For the years ended December 31, the Funds recognized $155,345 in 2016, $71,854 in 2015 and $171,561 in 2014, respectively, for these services, which is recorded in brokerage commissions on the combined statement of operations; of these expenses $0 in 2016, $30,000 in 2015 and $0 in 2014 was waived by the Sponsor.
| 89 |
The sole Trustee of the Trust is Wilmington Trust Company, a Delaware banking corporation. The Trustee will accept service of legal process on the Trust in the State of Delaware and will make certain filings under the Delaware Statutory Trust Act. For its services, the Trustee receives an annual fee of $3,300 from the Trust. The Funds recognized $3,300 for these services in 2016, 2015 and 2014, which is recorded in business permits and licenses fees on the combined statements of operations; of this expense $3,039 in 2016, $557 in 2015 and $81 in 2014 were waived by the Sponsor.
Note 4 – Summary of Significant Accounting Policies
Basis of Presentation
The accompanying financial statements have been prepared on a combined basis in conformity with accounting principles generally accepted in the United States of America (“U.S. GAAP”) as detailed in the Financial Accounting Standards Board’s Accounting Standards Codification and include the accounts of the Trust, CORN, CANE, SOYB, WEAT and TAGS. Refer to the accompanying separate financial statements for each Fund for more detailed information. For the periods represented by the financial statements herein the operations of the Trust contain the results of CORN, NAGS, CRUD, SOYB, CANE, WEAT, and TAGS except for eliminations for TAGS as explained below for the months during which each Fund was in operation. The financial statements of the Trust for the year ended December 31, 2014, include the operation of NAGS and CRUD through the termination of operations on December 21, 2014.
Given the investment objective of TAGS as described in Note 1 above, TAGS will buy, sell and hold, as part of its normal operations, shares of the four Underlying Funds. The Trust eliminates the shares of the other series of the Trust owned by the Teucrium Agricultural Fund from its combined statements of assets and liabilities. The Trust eliminates the net change in unrealized appreciation or depreciation on securities owned by the Teucrium Agricultural Fund from its combined statements of operations. The combined statements of changes in net assets and cash flows present a net presentation of the purchases and sales of the Underlying Funds of TAGS.
Reclassifications
Certain amounts in prior periods have been reclassified to conform to current period presentation.
Revenue Recognition
Commodity futures contracts are recorded on the trade date. All such transactions are recorded on the identified cost basis and marked to market daily. Unrealized appreciation or depreciation on commodity futures contracts are reflected in the statements of assets and liabilities as the difference between the original contract amount and the fair market value as of the last business day of the year or as of the last date of the financial statements. Changes in the appreciation or depreciation between periods are reflected in the statements of operations. Interest on cash equivalents and deposits with the Futures Commission Merchant are recognized on the accrual basis. The Funds earn interest on its assets denominated in U.S. dollars on deposit with the Futures Commission Merchant. In addition, the Funds earn interest on funds held at the custodian at prevailing market rates for such investments.
Brokerage Commissions
Brokerage commissions on all open commodity futures contracts are accrued on the trade date and on a full-turn basis.
Income Taxes
The Trust, as a Delaware statutory trust, is considered a trust for federal tax purposes and is, thus, a pass through entity. For tax purposes, the Funds will be treated as partnerships. Therefore, the Funds do not record a provision for income taxes because the shareholders report their share of a Fund’s income or loss on their income tax returns. The financial statements reflect the Funds’ transactions without adjustment, if any, required for income tax purposes.
The Funds are required to determine whether a tax position is more likely than not to be sustained upon examination by the applicable taxing authority, including resolution of any related appeals or litigation processes, based on the technical merits of the position. The Funds file income tax returns in the U.S. federal jurisdiction, and may file income tax returns in various U.S. states and foreign jurisdictions. For all tax years 2013 to 2016, the Funds remain subject to income tax examinations by major taxing authorities. The tax benefit recognized is measured as the largest amount of benefit that has a greater than fifty percent likelihood of being realized upon ultimate settlement. De-recognition of a tax benefit previously recognized results in the Funds recording a tax liability that reduces net assets. Based on their analysis, the Funds have determined that they have not incurred any liability for unrecognized tax benefits as of and for the years ended December 31, 2016, 2015, 2014 and 2013. However, the Funds’ conclusions regarding this policy may be subject to review and adjustment at a later date based on factors including, but not limited to, ongoing analysis of and changes to tax laws, regulations, and interpretations thereof.
The Funds recognize interest accrued related to unrecognized tax benefits and penalties related to unrecognized tax benefits in income tax fees payable, if assessed. No interest expense or penalties have been recognized as of and for the years ended December 31, 2016, 2015 and 2014.
| 90 |
The Funds may be subject to potential examination by U.S. federal, U.S. state, or foreign jurisdictional authorities in the area of income taxes. These potential examinations may include questioning the timing and amount of deductions, the nexus of income among various tax jurisdictions, and compliance with U.S. federal, U.S. state and foreign tax laws. The Funds’ management does not expect that the total amount of unrecognized tax benefits will materially change over the next twelve months.
Creations and Redemptions
Authorized Purchasers may purchase Creation Baskets from each Fund. The amount of the proceeds required to purchase a Creation Basket will be equal to the NAV of the shares in the Creation Basket determined as of 4:00 p.m. New York time on the day the order to create the basket is properly received.
Authorized Purchasers may redeem shares from each Fund only in blocks of shares called “Redemption Baskets.” The amount of the redemption proceeds for a Redemption Basket will be equal to the NAV of the shares in the Redemption Basket determined as of 4:00 p.m. New York time on the day the order to redeem the basket is properly received.
Each Fund receives or pays the proceeds from shares sold or redeemed within three business days after the trade date of the purchase or redemption. The amounts due from Authorized Purchasers are reflected in the statements of assets and liabilities as receivable for shares sold. Amounts payable to Authorized Purchasers upon redemption are reflected in the statements of assets and liabilities as payable for shares redeemed.
There are a minimum number of baskets and associated shares specified for each Fund in the Fund’s respective prospectus, as amended from time to time. Once the minimum number of baskets is reached, there can be no more redemptions until there has been a creation basket. These minimum levels are as follows:
CORN: 50,000 shares representing 2 baskets
SOYB: 50,000 shares representing 2 baskets
CANE: 50,000 shares representing 2 baskets
WEAT: 50,000 shares representing 2 baskets
TAGS: 50,000 shares representing 2 baskets (at minimum level as of December 31, 2016, 2015 and 2014)
Cash and Cash Equivalents
Cash equivalents are highly-liquid investments with maturity dates of 90 days or less when acquired. The Trust reported its cash equivalents in the combined statements of assets and liabilities at market value, or at carrying amounts that approximate fair value, because of their highly-liquid nature and short-term maturities. Each Fund that is a series of the Trust has the balance of its assets on deposit with banks. The Trust had a balance of $1,412,423 and $2,539,642 in money market funds at December 31, 2016 and December 31, 2015, respectively; these balances are included in cash and cash equivalents on the combined statements of assets and liabilities. Effective in the second quarter 2015, the Sponsor invested a portion of the available cash for the Funds in alternative demand-deposit savings accounts, which is classified as cash and not as cash equivalents. The Funds had a balance of $143,915,277 in demand-deposit savings accounts on December 31, 2016. This change resulted in a reduction in the balance held in money market funds. Assets deposited with the bank may, at times, exceed federally insured limits.
Restricted Cash
On August 17, 2015 (the “Conversion Date”), U.S. Bank N.A. replaced The Bank of New York Mellon as the Custodian for the Funds. Per the amended agreement between the Sponsor and The Bank of New York Mellon dated August 14, 2015, certain cash amounts for each Fund, except in the case of TAGS, are to remain at The Bank of New York Mellon until amounts for services and early termination fees are paid. The amended agreement allows for payments for such amounts owed to be made through December 31, 2017. Cash balances that are held in custody at The Bank of New York Mellon under this amended agreement are reflected on the combined statements of assets and liabilities of the Fund and the Trust as restricted cash.
Due from/to Broker
The amount recorded by the Trust for the amount due from and to the clearing broker includes, but is not limited to, cash held by the broker, amounts payable to the clearing broker related to open transactions and payables for commodities futures accounts liquidating to an equity balance on the clearing broker’s records.
Margin is the minimum amount of funds that must be deposited by a commodity interest trader with the trader’s broker to initiate and maintain an open position in futures contracts. A margin deposit acts to assure the trader’s performance of the futures contracts purchased or sold. Futures contracts are customarily bought and sold on initial margin that represents a very small percentage of the aggregate purchase or sales price of the contract. Because of such low margin requirements, price fluctuations occurring in the futures markets may create profits and losses that, in relation to the amount invested, are greater than are customary in other forms of investment or speculation. As discussed below, adverse price changes in the futures contract may result in margin requirements that greatly exceed the initial margin. In addition, the amount of margin required in connection with a particular futures contract is set from time to time by the exchange on which the contract is traded and may be modified from time to time by the exchange during the term of the contract. Brokerage firms, such as the Funds’ clearing brokers, carrying accounts for traders in commodity interest contracts generally require higher amounts of margin as a matter of policy to further protect themselves. Over-the-counter trading generally involves the extension of credit between counterparties, so the counterparties may agree to require the posting of collateral by one or both parties to address credit exposure.
| 91 |
When a trader purchases an option, there is no margin requirement; however, the option premium must be paid in full. When a trader sells an option, on the other hand, he or she is required to deposit margin in an amount determined by the margin requirements established for the underlying interest and, in addition, an amount substantially equal to the current premium for the option. The margin requirements imposed on the selling of options, although adjusted to reflect the probability that out-of-the-money options will not be exercised, can in fact be higher than those imposed in dealing in the futures markets directly. Complicated margin requirements apply to spreads and conversions, which are complex trading strategies in which a trader acquires a mixture of options positions and positions in the underlying interest.
Ongoing or “maintenance” margin requirements are computed each day by a trader’s clearing broker. When the market value of a particular open futures contract changes to a point where the margin on deposit does not satisfy maintenance margin requirements, a margin call is made by the broker. If the margin call is not met within a reasonable time, the broker may close out the trader’s position. With respect to the Funds’ trading, the Funds (and not their shareholders personally) are subject to margin calls.
Finally, many major U.S. exchanges have passed certain cross margining arrangements involving procedures pursuant to which the futures and options positions held in an account would, in the case of some accounts, be aggregated, and margin requirements would be assessed on a portfolio basis, measuring the total risk of the combined positions.
Payable/Receivable for Securities Purchased/Sold
Due from/to broker for investments in securities are securities transactions pending settlement. The Trust and the Funds are subject to credit risk to the extent any broker with whom it conducts business is unable to fulfill contractual obligations on its behalf. The management of the Trust and the Funds monitors the financial condition of such brokers and does not anticipate any losses from these counterparties. Since the inception of the Fund, the principal broker through which the Trust and TAGS clear securities transactions for TAGS is the Bank of New York Mellon Capital Markets.
Sponsor Fee, Allocation of Expenses and Related Party Transactions
The Fund’s sponsor, Teucrium Trading, LLC (the “Sponsor”), is responsible for investing the assets of the Funds in accordance with the objectives and policies of each Fund. In addition, the Sponsor arranges for one or more third parties to provide administrative, custodial, accounting, transfer agency and other necessary services to the Trust and the Funds. In addition, the Sponsor elected not to outsource services directly attributable to the Trust and the Funds such as accounting, financial reporting, regulatory compliance and trading activities. In addition, the Funds, except for TAGS which has no such fee, are contractually obligated to pay a monthly management fee to the Sponsor, based on average daily net assets, at a rate equal to 1.00% per annum.
The Funds pay for all brokerage fees, taxes and other expenses, including licensing fees for the use of intellectual property, registration or other fees paid to the SEC, FINRA, formerly the National Association of Securities Dealers, or any other regulatory agency in connection with the offer and sale of subsequent Shares, after its initial registration, and all legal, accounting, printing and other expenses associated therewith. The Funds also pay the fees and expenses associated with the Trust’s tax accounting and reporting requirements. Certain aggregate expenses common to all Funds within the Trust are allocated by the Sponsor to the respective Fund based on activity drivers deemed most appropriate by the Sponsor for such expenses, including but not limited to relative assets under management and creation and redeem order activity.
These aggregate common expenses include, but are not limited to, legal, auditing, accounting and financial reporting, tax-preparation, regulatory compliance, trading activities, and insurance costs, as well as fees paid to the Distributor, which are included in the related line item in the combined statements of operations. A portion of these aggregate common expenses are related to the Sponsor or related parties of principals of the Sponsor; these are necessary services to the Trust and the Funds, which are primarily the cost of performing accounting and financial reporting, regulatory compliance, and trading activities that are directly attributable to the Trust and the Funds. For the years ended December 31, the Funds recognized $1,825,552 in 2016, $1,601,237 in 2015 and $1,365,214 in 2014, respectively, for these services, which are primarily recorded in distribution and marketing fees on the combined statements of operations, of these expenses, $457,658 in 2016, $138,262 in 2015 and $113,224 in 2014 were waived by the Sponsor. All asset-based fees and expenses for the Funds are calculated on the prior day’s net assets.
The Sponsor has the ability to elect to pay certain expenses on behalf of the Funds or waive the management fee. This election is subject to change by the Sponsor, at its discretion. Expenses paid by the Sponsor and Management fees waived by the Sponsor are, if applicable, presented as waived expenses in the statements of operations for each Fund.
For the year ended December 31, 2016, there were $838,015 of expenses that were on the combined statements of operations of the Trust as expenses that were waived by the Sponsor. These were specifically: $442,333 for CORN, $68,914 for SOYB, $148,281 for CANE, $140,028 for WEAT, and $38,459 for TAGS. The Sponsor has determined that there would be no recovery sought for these amounts in any future period.
For the year ended December 31, 2015 there were $980,683 of expenses that were on the combined statements of operations of the Trust as expenses that were waived by the Sponsor. These were specifically: $96,068 for CORN, $304,609 for SOYB, $256,227 for CANE, $130,716 for WEAT, and $193,063 for TAGS. The Sponsor has determined that there would be no recovery sought for these amounts in any future period.
| 92 |
For the year ended December 31, 2014 there were $640,328 of expenses that were on the combined statements of operations of the Trust as expenses that were waived by the Sponsor. These were specifically: $105,270 for CORN, $109,611 for NAGS, $131,324 for CRUD, $65,617 for SOYB, $119,696 for CANE, $31,697 for WEAT, and $77,113 for TAGS. The Sponsor has determined that there would be no recovery sought for these amounts in any future period.
For the year ended December 31, 2013, there were $590,000 of expenses recorded in the financial statements of the Sponsor which were subject to reimbursement by the Funds in 2014. At that time, the Sponsor had determined that recovery of the expense amounts was not probable. For the year ended December 31, 2014, asset growth and other changes experienced by certain Funds enabled the Sponsor to claim reimbursement of $379,753 from those Funds, specifically, $308,312 from CORN, $25,139 from SOYB and $46,302 from WEAT. These amounts are reflected in the combined statements of operations for the year ended December 31, 2014 as a reimbursement of a previously waived expense for the Funds from which there was recovery in 2014. There was no recovery of amounts from the other Funds.
Use of Estimates
The preparation of financial statements in conformity with U.S. GAAP requires management to make estimates and assumptions that affect the reported amount of assets and liabilities and disclosure of contingent assets and liabilities at the date of the financial statements, and the reported amounts of the revenue and expenses during the reporting period. Actual results could differ from those estimates.
Fair Value - Definition and Hierarchy
In accordance with U.S. GAAP, fair value is defined as the price that would be received to sell an asset or paid to transfer a liability (i.e., the “exit price”) in an orderly transaction between market participants at the measurement date.
In determining fair value, the Trust uses various valuation approaches. In accordance with U.S. GAAP, a fair value hierarchy for inputs is used in measuring fair value that maximizes the use of observable inputs and minimizes the use of unobservable inputs by requiring that the most observable inputs be used when available. Observable inputs are those that market participants would use in pricing the asset or liability based on market data obtained from sources independent of the Trust. Unobservable inputs reflect the Trust’s assumptions about the inputs market participants would use in pricing the asset or liability developed based on the best information available in the circumstances. The fair value hierarchy is categorized into three levels based on the inputs as follows:
Level 1 - Valuations based on unadjusted quoted prices in active markets for identical assets or liabilities that the Trust has the ability to access. Valuation adjustments and block discounts are not applied to Level 1 futures contracts held by CORN, SOYB, CANE and WEAT, the securities of the Underlying Funds held by TAGS, and any other securities held by any Fund, together referenced throughout this filing as “financial instruments.” Since valuations are based on quoted prices that are readily and regularly available in an active market, valuation of these securities does not entail a significant degree of judgment.
Level 2 - Valuations based on quoted prices in markets that are not active or for which all significant inputs are observable, either directly or indirectly.
Level 3 - Valuations based on inputs that are unobservable and significant to the overall fair value measurement.
The availability of valuation techniques and observable inputs can vary from financial instrument to financial instrument and is affected by a wide variety of factors including, the type of financial instrument, whether the financial instrument is new and not yet established in the marketplace, and other characteristics particular to the transaction. To the extent that valuation is based on models or inputs that are less observable or unobservable in the market, the determination of fair value requires more judgment. Those estimated values do not necessarily represent the amounts that may be ultimately realized due to the occurrence of future circumstances that cannot be reasonably determined. Because of the inherent uncertainty of valuation, those estimated values may be materially higher or lower than the values that would have been used had a ready market for the financial instruments existed. Accordingly, the degree of judgment exercised by the Fund in determining fair value is greatest for financial instruments categorized in Level 3. In certain cases, the inputs used to measure fair value may fall into different levels of the fair value hierarchy. In such cases, for disclosure purposes, the level in the fair value hierarchy, within which the fair value measurement in its entirety falls, is determined based on the lowest level input that is significant to the fair value measurement.
Fair value is a market-based measure considered from the perspective of a market participant rather than an entity-specific measure. Therefore, even when market assumptions are not readily available, the Trust’s own assumptions are set to reflect those that market participants would use in pricing the asset or liability at the measurement date. The Trust uses prices and inputs that are current as of the measurement date, including periods of market dislocation. In periods of market dislocation, the observability of prices and inputs may be reduced for many financial instruments. This condition could cause a financial instrument to be reclassified to a lower level within the fair value hierarchy. For instance, when Corn Futures Contracts on the Chicago Board of Trade (“CBOT”) are not actively trading due to a “limit-up” or ‘limit-down” condition, meaning that the change in the Corn Futures Contracts has exceeded the limits established, the Trust and the Fund will revert to alternative verifiable sources of valuation of its assets. When such a situation exists on a quarter close, the Sponsor will calculate the NAV on a particular day using the Level 1 valuation, but will later recalculate the NAV for the impacted Fund based upon the valuation inputs from these alternative verifiable sources (Level 2 or Level 3) and will report such NAV in its applicable financial statements and reports.
On December 31, 2016 and 2015, in the opinion of the Trust, the reported value at the close of the market for each commodity contract fairly reflected the value of the futures and no alternative valuations were required. The determination is made as of the settlement of the futures contracts on the last day of trading for the reporting period. In making the determination of a Level 1 or Level 2 transfer, the Funds consider the average volume of the specific underlying futures contracts traded on the relevant exchange for the years being reported.
| 93 |
For the year ended December 31, 2016, the Funds did not have any significant transfers between any of the levels of the fair value hierarchy.
For the quarter ended June 30, 2015, Wheat Futures Contracts traded on the CBOT due to settle on December 14, 2016 (the “DEC16 Wheat Contracts”) did not, in the opinion of the Trust and WEAT, trade in an actively traded futures market as defined in the policy of the Trust and WEAT for the entire period during which they were held. Accordingly, the Trust and WEAT classified these as a Level 2 asset, The DEC16 Wheat Contracts were, in the opinion of the Trust and WEAT, fairly valued at settlement on June 30, 2015. The value of the contracts were $1,178,088, the balance transferred back to a Level 1 asset for the quarter ended September 30, 2015 as shown in Note 5.
The Funds and the Trust record their derivative activities at fair value. Gains and losses from derivative contracts are included in the statements of operations. Derivative contracts include futures contracts related to commodity prices. Futures, which are listed on a national securities exchange, such as the CBOT and the ICE, or reported on another national market, are generally categorized in Level 1 of the fair value hierarchy. OTC derivatives contracts (such as forward and swap contracts), which may be valued using models, depending on whether significant inputs are observable or unobservable, are categorized in Levels 2 or 3 of the fair value hierarchy.
Investments in the securities of the Underlying Funds are freely traded and listed on the NYSE Arca. These investments are valued at the NAV of the Underlying Fund as of the valuation date as calculated by the administrator based on the exchange-quoted prices of the commodity futures contracts held by the Underlying Fund.
Expenses
Expenses are recorded using the accrual method of accounting.
New Accounting Pronouncements
The Financial Accounting Standards Board (“FASB”) issued Accounting Standards Update (“ASU”) 2016-19, “Technical Corrections and Improvements”. The amendments in this update represent changes to clarify, correct errors, or make minor improvements to the Accounting Standards Codification. The amendments make the Accounting Standards Codification easier to understand and easier to apply by eliminating inconsistencies and providing clarifications. The amendments are effective for fiscal years, and interim periods with those fiscal years, for all entities beginning after December 15, 2016. The adoption did not have a material impact on the financial statements and disclosures of the Trust or the Funds.
The FASB issued ASU 2016-18, “Statement of Cash Flows (Topic 230)”. The amendments in this update require that a statement of cash flows explain the change during the period in the total of cash, cash equivalents, and amounts generally described as restricted cash or restricted cash equivalents. Therefore, amounts generally described as restricted cash and restricted cash equivalents should be included with cash and cash equivalents when reconciling the beginning-of-period and end-of-period total amounts shown on the statement of cash flows. The amendments are effective for fiscal years beginning after December 15, 2017, and interim periods within those fiscal years. This update is not expected to have a material impact on the financial statements and disclosures of the Trust or the Funds. The Sponsor believes there will be a change in presentation of restricted cash on the statements of cash flows.
The FASB issued ASU 2016-17, “Consolidation (Topic 810): Interests Held through Related Parties That are under Common Control”. The amendments in this update alters how a decision maker needs to consider indirect interests in a variable interest entity (VIE) held through an entity under common control. The new guidance amends ASU 2015-02, Consolidation (Topic 810): Amendments to the Consolidation Analysis, issued in February 2015. The amendments are effective for fiscal years beginning after December 15, 2016, including interim periods within those fiscal years. The adoption did not have a material impact on the financial statements and disclosures of the Trust or the Fund.
The FASB issued ASU 2016-15, “Statement of Cash Flows (Topic 230): Classification of Certain Cash Receipts and Cash Payments”. The amendments provide cash flow statement classification guidance. The amendments in this update are effective for fiscal years beginning after December 15, 2017. The Trust and the Funds are currently evaluating the impact on the financial statements and disclosures. The Trust and the Funds do not expect to adopt the guidance until the effective date.
The FASB issued ASU 2014-09 in May 2014, “Revenue from Contracts with Customers (Topic 606),” which replaces the revenue recognition requirements of “Revenue Recognition (Topic 605).” This ASU is based on the principle that revenue is recognized to depict the transfer of goods and services to customers in an amount that reflects the consideration to which the entity expects to be entitled in exchange for those goods or services. This ASU provides new and more detailed guidance on specific topics and expands and improves disclosures about revenue. In August 2015, the FASB issued ASU 2015-14 which defers the effective date of ASU 2014-09 by one year to fiscal years beginning after December 15, 2017. ASU 2015-14 also permits early adoption of ASU 2014-09, but not before the original effective date, which was for fiscal years beginning after December 15, 2016. The Trust and the Funds record income or loss from the recognition and measurement of futures contracts and from interest income under Subtopic 825-10. Revenue from financial instruments which are valued under Subtopic 825 will not be subject to the application of ASU 2014-09 and 2015-14. Therefore, these standards will not apply or have a material impact on the financial statements and disclosures of the Trust or the Funds.
| 94 |
The FASB issued ASU 2016-11, “Revenue Recognition (Topic 605) and Derivatives and Hedging (Topic 815): Rescission of SEC Guidance Because of Accounting Standards Updates 2014-09 and 2014-16 Pursuant to Staff Announcements at the March 3, 2016 EITF Meeting”. The amendments make targeted improvements to clarify the principal versus agent assessment and are intended to make the guidance more operable and lead to more consistent application. The Trust and the Funds record income or loss from the recognition and measurement of futures contracts and from interest income under Subtopic 825-10. Revenue from financial instruments which are valued under Subtopic 825 will not be subject to the application of ASU 2016-11. Therefore, this standard will not apply or have a material impact on the financial statements and disclosures of the Trust or the Funds.
The FASB issued ASU 2016-02, “Leases (Topic 842).” The amendments in this update increase transparency and comparability among organizations by recognizing lease assets and lease liabilities on the balance sheet and disclosing key information about leasing arrangements. The amendments in this update are effective for fiscal years beginning after December 15, 2018. This update is not expected to have a material impact on the financial statements and disclosures of the Trust or the Funds.
The FASB issued ASU 2016-01, “Financial Instruments-Overall (Subtopic 825-10): Recognition and Measurement of Financial Assets and Financial Liabilities.” The amendments in this update are intended to improve the recognitions measurement and disclosure of financial instruments. The amendments to this update are effective for fiscal years beginning after December 15, 2017, and interim periods within those fiscal years. These amendments are required to be applied prospectively. The Trust and the Fund are currently evaluating the impact on the financial statements and disclosures; but based on our review to date we do not expect the update will have a material impact on the financial statements and disclosures of the Trust or the Funds.
The FASB issued ASU 2015-10, “Technical Corrections and Improvements.” The amendments in this update represent changes to clarify the Codification, correct unintended application of guidance, or make minor improvements to the Codification that are not expected to have a significant effect on current accounting practice or create a significant administrative cost to most entities. The amendments are effective for fiscal years beginning after December 15, 2015. The adoption did not have a material impact on the financial statements and disclosures of the Trust or the Funds.
The FASB issued ASU 2015-07, “Fair Value Measurement (Topic 820): Disclosures for Investments in Certain Entities That Calculate Net Asset Value per Share (or Its Equivalent).” The ASU amends ASC 820 to create a practical expedient to measure the fair value of investments in certain entities that do not have a quoted market price but calculate net asset value per share or its equivalent. In addition, the amendments to ASC 820 provide guidance on classifying investments that are measured using the practical expedient in the fair value hierarchy and require specific disclosures for eligible investments, regardless of whether the practical expedient has been applied. The amendments in this Update are effective for fiscal years beginning after December 15, 2015, and interim periods within those fiscal years. These amendments are required to be applied retrospectively to all periods presented. The adoption did not have a material impact on the financial statements and disclosures of the Trust or the Funds.
The FASB issued ASU 2015-06, “Earnings per Share (Topic 260): Effects on Historical Earnings per Unit of Master Limited Partnership Dropdown Transactions.” The amendments specify how earnings (losses) of a transferred business before the date of a dropdown transaction should be allocated to the various interest holders in a master limited partnership for purposes of calculating earning per unit under the two-class method. The amendments to this update are effective for fiscal years beginning after December 15, 2015, and interim periods within those fiscal years. The amendments are required to be applied retrospectively for all periods presented. The adoption did not have a material impact on the financial statements and disclosures of the Trust or the Funds.
The FASB issued ASU 2015-02, “Consolidation (Topic 810): Amendments to the Consolidation Analysis.” The amendments are intended to improve targeted areas of consolidation guidance for legal entities such as limited partnerships, limited liability corporations, and securitization structures. The amendments to this update are effective for periods beginning after December 15, 2015. These amendments are required to be applied retrospectively for all periods presented. The adoption did not have a material impact on the financial statements and disclosures of the Trust or the Funds.
The FASB issued ASU 2014-08, “Presentation of Financial Statements (Topic 205) and Property, Plant, and Equipment (Topic 360): Reporting Discontinued Operations and Disclosures of Disposals of Components of an Entity.” The amendments in this update change the requirements for reporting discontinued operations in Subtopic 2015-20. A significant provision of ASU 2014-08 calls for reporting as discontinued operations only those disposals that represent a strategic shift or have a major impact on the entity’s financial results and operations. The Company elected to early adopt this ASU for the year ended December 31, 2014, the adoption did not have a significant impact on the financial statements and disclosures of the Funds.
| 95 |
Note 5 – Fair Value Measurements
The Trust’s assets and liabilities recorded at fair value have been categorized based upon a fair value hierarchy as described in the Trust’s significant accounting policies in Note 3. The following table presents information about the Trust’s assets and liabilities measured at fair value as of December 31, 2016 and December 31, 2015:
December 31, 2016
| Balance as of | ||||||||||||||||
| Assets: | Level 1 | Level 2 | Level 3 | December 31, 2016 | ||||||||||||
| Cash equivalents | $ | 1,412,423 | $ | — | $ | — | $ | 1,412,423 | ||||||||
| Commodity futures contracts | ||||||||||||||||
| Soybean futures contracts | 357,500 | — | — | 357,500 | ||||||||||||
| Sugar futures contracts | 185,147 | — | — | 185,147 | ||||||||||||
| Total | $ | 1,955,070 | $ | — | $ | — | $ | 1,955,070 | ||||||||
| Balance as of | ||||||||||||||||
| Liabilities: | Level 1 | Level 2 | Level 3 | December 31, 2016 | ||||||||||||
| Commodity futures contracts | ||||||||||||||||
| Corn futures contracts | $ | 1,460,800 | $ | — | $ | — | $ | 1,460,800 | ||||||||
| Soybean futures contracts | 12,025 | — | — | 12,025 | ||||||||||||
| Sugar futures contracts | 331,542 | — | — | 331,542 | ||||||||||||
| Wheat futures contracts | 3,921,588 | — | — | 3,921,588 | ||||||||||||
| Total | $ | 5,725,955 | $ | — | $ | — | $ | 5,725,955 | ||||||||
December 31, 2015
| Balance as of | ||||||||||||||||
| Assets: | Level 1 | Level 2 | Level 3 | December 31, 2015 | ||||||||||||
| Cash equivalents | $ | 2,539,641 | $ | — | $ | — | $ | 2,539,641 | ||||||||
| Commodity futures contracts | ||||||||||||||||
| Soybean futures contracts | 16,175 | — | — | 16,175 | ||||||||||||
| Sugar futures contracts | 364,056 | — | — | 364,056 | ||||||||||||
| Total | $ | 2,919,872 | $ | — | $ | — | $ | 2,919,872 | ||||||||
| Balance as of | ||||||||||||||||
| Liabilities: | Level 1 | Level 2 | Level 3 | December 31, 2015 | ||||||||||||
| Commodity futures contracts | ||||||||||||||||
| Corn futures contracts | $ | 3,908,550 | $ | — | $ | — | $ | 3,908,550 | ||||||||
| Soybean futures contracts | 238,662 | — | — | 238,662 | ||||||||||||
| Wheat futures contracts | 1,924,464 | — | — | 1,924,464 | ||||||||||||
| Total | $ | 6,071,676 | $ | — | $ | — | $ | 6,071,676 | ||||||||
For the period from January 1, 2016 through December 31, 2016, the Funds did not have any significant transfers between any of the levels of the fair value hierarchy.
Transfers into and out of each level of the fair value hierarchy for the DEC16 Wheat Contracts, for the period from January 1, 2015 through December 31, 2015 were as follows:
| Transfers | Transfers | Transfers | Transfers | Transfers | Transfers | |||||||||||||||||||
| into | out of | into | out of | into | out of | |||||||||||||||||||
| Level 1 | Level 1 | Level 2 | Level 2 | Level 3 | Level 3 | |||||||||||||||||||
| Assets (at fair value) | ||||||||||||||||||||||||
| Derivative contracts | ||||||||||||||||||||||||
| Wheat future contracts | $ | 1,178,088 | $ | 1,178,088 | $ | 1,178,088 | $ | 1,178,088 | $ | — | $ | — | ||||||||||||
See the Fair Value - Definition and Hierarchy section in Note 4 above for an explanation of the transfers into and out of each level of the fair value hierarchy.
Note 6 – Derivative Instruments and Hedging Activities
In the normal course of business, the Funds utilize derivative contracts in connection with its proprietary trading activities. Investments in derivative contracts are subject to additional risks that can result in a loss of all or part of an investment. The Funds’ derivative activities and exposure to derivative contracts are classified by the following primary underlying risks: interest rate, credit, commodity price, and equity price risks. In addition to its primary underlying risks, the Funds are also subject to additional counterparty risk due to inability of its counterparties to meet the terms of their contracts. For the years ended December 31, 2016 and 2015, the Funds invested only in commodity futures contracts specifically related to each Fund.
Futures Contracts
The Funds are subject to commodity price risk in the normal course of pursuing their investment objectives. A futures contract represents a commitment for the future purchase or sale of an asset at a specified price on a specified date.
The purchase and sale of futures contracts requires margin deposits with a FCM. Subsequent payments (variation margin) are made or received by each Fund each day, depending on the daily fluctuations in the value of the contract, and are recorded as unrealized gains or losses by each Fund. Futures contracts may reduce the Funds’ exposure to counterparty risk since futures contracts are exchange-traded; and the exchange’s clearinghouse, as the counterparty to all exchange-traded futures, guarantees the futures against default.
| 96 |
The Commodity Exchange Act requires an FCM to segregate all customer transactions and assets from the FCM’s proprietary activities. A customer’s cash and other equity deposited with an FCM are considered commingled with all other customer funds subject to the FCM’s segregation requirements. In the event of an FCM’s insolvency, recovery may be limited to each Fund’s pro rata share of segregated customer funds available. It is possible that the recovery amount could be less than the total of cash and other equity deposited.
The following table discloses information about offsetting assets and liabilities presented in the statements of assets and liabilities to enable users of these financial statements to evaluate the effect or potential effect of netting arrangements for recognized assets and liabilities. These recognized assets and liabilities are presented as defined in FASB ASU No. 2011-11 “Balance Sheet (Topic 210): Disclosures about Offsetting Assets and Liabilities” and subsequently clarified in FASB ASU 2013-01 “Balance Sheet (Topic 210): Clarifying the Scope of Disclosures about Offsetting Assets and Liabilities.”
The following table also identifies the fair value amounts of derivative instruments included in the statements of assets and liabilities as derivative contracts, categorized by primary underlying risk and held by the FCM, ED&F Man as of December 31, 2016 and 2015.
Offsetting of Financial Assets and Derivative Assets as of December 31, 2016
| (i) | (ii) | (iii) = (i) – (ii) | (iv) | (v) = (iii) – (iv) | ||||||||||||||||||||
| Gross Amount Not Offset in the | ||||||||||||||||||||||||
| Statement of Assets and Liabilities | ||||||||||||||||||||||||
| Gross Amount | Net Amount | |||||||||||||||||||||||
| Offset in the | Presented in the | Futures | ||||||||||||||||||||||
| Gross Amount | Statement of | Statement of | Contracts | |||||||||||||||||||||
| of Recognized | Assets and | Assets and | Available for | Collateral, Due | ||||||||||||||||||||
| Description | Assets | Liabilities | Liabilities | Offset | to Broker | Net Amount | ||||||||||||||||||
| Commodity price | ||||||||||||||||||||||||
| Soybean futures contracts | $ | 357,500 | $ | — | $ | 357,500 | $ | 12,025 | $ | — | $ | 345,475 | ||||||||||||
| Sugar futures contracts | 185,147 | — | 185,147 | 185,147 | — | — | ||||||||||||||||||
Offsetting of Financial Liabilities and Derivative Liabilities as of December 31, 2016
| (i) | (ii) | (iii) = (i) – (ii) | (iv) | (v) = (iii) – (iv) | ||||||||||||||||||||
| Gross Amount Not Offset in the | ||||||||||||||||||||||||
| Statement of Assets and Liabilities | ||||||||||||||||||||||||
| Gross Amount | Net Amount | |||||||||||||||||||||||
| Offset in the | Presented in the | Futures | ||||||||||||||||||||||
| Gross Amount | Statement of | Statement of | Contracts | |||||||||||||||||||||
| of Recognized | Assets and | Assets and | Available for | Collateral, Due | ||||||||||||||||||||
| Description | Liabilities | Liabilities | Liabilities | Offset | from Broker | Net Amount | ||||||||||||||||||
| Commodity price | ||||||||||||||||||||||||
| Corn futures contracts | $ | 1,460,800 | $ | — | $ | 1,460,800 | $ | — | $ | 1,460,800 | $ | — | ||||||||||||
| Soybean futures contracts | 12,025 | — | 12,025 | 12,025 | — | — | ||||||||||||||||||
| Sugar futures contracts | 331,542 | — | 331,542 | 185,147 | 146,395 | — | ||||||||||||||||||
| Wheat futures contracts | 3,921,588 | — | 3,921,588 | — | 3,921,588 | — | ||||||||||||||||||
Offsetting of Financial Assets and Derivative Assets as of December 31, 2015
| (i) | (ii) | (iii) = (i) – (ii) | (iv) | (v) = (iii) – (iv) | ||||||||||||||||||||
| Gross Amount Not Offset in the | ||||||||||||||||||||||||
| Statement of Assets and Liabilities | ||||||||||||||||||||||||
| Gross Amount | Net Amount | |||||||||||||||||||||||
| Offset in the | Presented in the | Futures | ||||||||||||||||||||||
| Gross Amount | Statement of | Statement of | Contracts | |||||||||||||||||||||
| of Recognized | Assets and | Assets and | Available for | Collateral, Due | ||||||||||||||||||||
| Description | Assets | Liabilities | Liabilities | Offset | to Broker | Net Amount | ||||||||||||||||||
| Commodity price | ||||||||||||||||||||||||
| Soybean futures contracts | $ | 16,175 | $ | — | $ | 16,175 | $ | 16,175 | $ | — | $ | — | ||||||||||||
| Sugar futures contracts | 364,056 | — | 364,056 | — | — | 364,056 | ||||||||||||||||||
| 97 |
Offsetting of Financial Liabilities and Derivative Liabilities as of December 31, 2015
| (i) | (ii) | (iii) = (i) – (ii) | (iv) | (v) = (iii) – (iv) | ||||||||||||||||||||
| Gross Amount Not Offset in the | ||||||||||||||||||||||||
| Statement of Assets and Liabilities | ||||||||||||||||||||||||
| Gross Amount | Net Amount | |||||||||||||||||||||||
| Offset in the | Presented in the | Futures | ||||||||||||||||||||||
| Gross Amount | Statement of | Statement of | Contracts | |||||||||||||||||||||
| of Recognized | Assets and | Assets and | Available for | Collateral, Due | ||||||||||||||||||||
| Description | Liabilities | Liabilities | Liabilities | Offset | from Broker | Net Amount | ||||||||||||||||||
| Commodity price | ||||||||||||||||||||||||
| Corn futures contracts | $ | 3,908,550 | $ | — | $ | 3,908,550 | $ | — | $ | 3,908,550 | $ | — | ||||||||||||
| Soybean futures contracts | 238,662 | — | 238,662 | 16,175 | 222,487 | — | ||||||||||||||||||
| Wheat futures contracts | 1,924,464 | — | 1,924,464 | — | 1,924,464 | — | ||||||||||||||||||
The following is a summary of realized and net change in unrealized gains (losses) of the derivative instruments utilized by the Trust:
Year ended December 31, 2016
| Realized (Loss) Gain on | Net Change in Unrealized Appreciation or Depreciation on | |||||||
| Primary Underlying Risk | Commodity Futures Contracts | Commodity Futures Contacts | ||||||
| Commodity price | ||||||||
| Corn futures contracts | $ | (9,438,913 | ) | $ | 2,447,750 | |||
| Soybean futures contracts | 939,088 | 567,962 | ||||||
| Sugar futures contracts | 1,967,694 | (510,451 | ) | |||||
| Wheat futures contracts | (9,631,400 | ) | (1,997,125 | ) | ||||
| Total commodity futures contracts | $ | (16,163,531 | ) | $ | 508,136 | |||
Year ended December 31, 2015
| Realized Loss on | Net Change in Unrealized Appreciation or Depreciation on | |||||||
| Primary Underlying Risk | Commodity Futures Contracts | Commodity Futures Contacts | ||||||
| Commodity price | ||||||||
| Corn futures contracts | $ | (8,533,650 | ) | $ | (5,660,263 | ) | ||
| Soybean futures contracts | (1,355,738 | ) | 54,526 | |||||
| Sugar futures contracts | (1,279,891 | ) | 868,011 | |||||
| Wheat futures contracts | (4,559,863 | ) | (2,640,963 | ) | ||||
| Total commodity futures contracts | $ | (15,729,142 | ) | $ | (7,378,689 | ) | ||
Year ended December 31, 2014
| Realized (Loss) Gain on | Net Change in Unrealized Appreciation or Depreciation on | |||||||
| Primary Underlying Risk | Commodity Futures Contracts | Commodity Futures Contacts | ||||||
| Commodity price | ||||||||
| Corn futures contracts | $ | (11,085,713 | ) | $ | 6,636,500 | |||
| Natural gas futures contracts | 67,650 | (84,050 | ) | |||||
| WTI crude oil futures contracts | (652,430 | ) | (82,450 | ) | ||||
| Soybean futures contracts | (278,763 | ) | (88,150 | ) | ||||
| Sugar futures contracts | (131,410 | ) | (320,555 | ) | ||||
| Wheat futures contracts | (2,486,162 | ) | 1,415,175 | |||||
| Total commodity futures contracts | $ | (14,566,828 | ) | $ | 7,476,470 | |||
Volume of Derivative Activities
The average notional market value categorized by primary underlying risk for all futures contracts held was $132.4 million in 2016, $108.8 million in 2015 and $142.9 million in 2014.
Note 7 - Organizational and Offering Costs
Expenses incurred in organizing of the Trust and the initial offering of the shares, including applicable SEC registration fees, were borne directly by the Sponsor for the Funds and will be borne directly by the Sponsor for any series of the Trust which is not yet operating or will be issued in the future. The Trust will not be obligated to reimburse the Sponsor.
| 98 |
Note 8 – Detail of the net assets and shares outstanding of the Funds that are a series of the Trust
The following are the net assets and shares outstanding of each Fund that is a series of the Trust and, thus, in total, comprise the combined net assets of the Trust:
December 31, 2016
| Outstanding Shares | Net Assets | |||||||
| Teucrium Corn Fund | 3,900,004 | $ | 73,213,541 | |||||
| Teucrium Soybean Fund | 675,004 | 12,882,100 | ||||||
| Teucrium Sugar Fund | 425,004 | 5,513,971 | ||||||
| Teucrium Wheat Fund | 9,050,004 | 62,344,759 | ||||||
| Teucrium Agricultural Fund: | ||||||||
| Net assets including the investment in the Underlying Funds | 50,002 | 1,316,370 | ||||||
| Less: Investment in the Underlying Funds | (1,313,554 | ) | ||||||
| Net for the Fund in the combined net assets of the Trust | 2,816 | |||||||
| Total | $ | 153,957,187 | ||||||
December 31, 2015
| Outstanding Shares | Net Assets | |||||||
| Teucrium Corn Fund | 2,875,004 | $ | 61,056,223 | |||||
| Teucrium Soybean Fund | 375,004 | 6,502,552 | ||||||
| Teucrium Sugar Fund | 550,004 | 5,508,663 | ||||||
| Teucrium Wheat Fund | 2,900,004 | 26,529,260 | ||||||
| Teucrium Agricultural Fund: | ||||||||
| Net assets including the investment in the Underlying Funds | 50,002 | 1,329,390 | ||||||
| Less: Investment in the Underlying Funds | (1,324,601 | ) | ||||||
| Net for the Fund in the combined net assets of the Trust | 4,789 | |||||||
| Total | $ | 99,601,487 | ||||||
The detailed information for the subscriptions and redemptions, and other financial information for each Fund that is a series of the Trust are included in the accompanying financial statements of each Fund.
Note 9 – Subsequent Events
Management has evaluated the financial statements for the period-ended December 31, 2016 for subsequent events through the date of this filing and noted no material events requiring either recognition through the date of the filing or disclosure herein for the Trust and Funds other than those noted below:
CORN: Nothing to Report
SOYB:
As of this filing, $13,000 of cash that had been held in custody at The Bank of New York Mellon was transferred to the Fund’s account at U.S. Bank. The balance for Restricted Cash is $61,068 as of this filing.
CANE:
As of this filing, $14,000 of cash that had been held in custody at The Bank of New York Mellon was transferred to the Fund’s account at U.S. Bank. The balance for Restricted Cash is $63,616 as of this filing.
WEAT: Nothing to Report
TAGS: Nothing to Report
| 99 |
Report of Independent Registered Public Accounting Firm
To the Sponsor and Shareholders of
Teucrium Corn Fund
We have audited the accompanying statements of assets and liabilities of Teucrium Corn Fund (the “Fund”), including the schedules of investments, as of December 31, 2016 and 2015, and the related statements of operations, changes in net assets, and cash flows for each of the three years in the period ended December 31, 2016. These financial statements are the responsibility of the Fund’s management. Our responsibility is to express an opinion on these financial statements based on our audits.
We conducted our audits in accordance with the standards of the Public Company Accounting Oversight Board (United States). Those standards require that we plan and perform the audit to obtain reasonable assurance about whether the financial statements are free of material misstatement. An audit includes examining, on a test basis, evidence supporting the amounts and disclosures in the financial statements. An audit also includes assessing the accounting principles used and significant estimates made by management, as well as evaluating the overall financial statement presentation. We believe that our audits provide a reasonable basis for our opinion.
In our opinion, the financial statements referred to above present fairly, in all material respects, the financial position of Teucrium Corn Fund as of December 31, 2016 and 2015, and the results of its operations and its cash flows for each of the three years in the period ended December 31, 2016 in conformity with accounting principles generally accepted in the United States of America.
We also have audited, in accordance with the standards of the Public Company Accounting Oversight Board (United States), the Fund’s internal control over financial reporting as of December 31, 2016, based on criteria established in the 2013 Internal Control—Integrated Framework issued by the Committee of Sponsoring Organizations of the Treadway Commission (COSO), and our report dated March 16, 2017 expressed an unqualified opinion.
/s/ GRANT THORNTON LLP
New York, New York
March 16, 2017
| 100 |
Report of Independent Registered Public Accounting Firm
To the Sponsor and Shareholders of
Teucrium Corn Fund
We have audited the internal control over financial reporting of Teucrium Corn Fund (the “Fund”) as of December 31, 2016, based on criteria established in the 2013 Internal Control—Integrated Framework issued by the Committee of Sponsoring Organizations of the Treadway Commission (COSO). The Fund’s management is responsible for maintaining effective internal control over financial reporting and for its assessment of the effectiveness of internal control over financial reporting, included in the accompanying Management’s Report on Internal Control over Financial Reporting. Our responsibility is to express an opinion on the Fund’s internal control over financial reporting based on our audit.
We conducted our audit in accordance with the standards of the Public Company Accounting Oversight Board (United States). Those standards require that we plan and perform the audit to obtain reasonable assurance about whether effective internal control over financial reporting was maintained in all material respects. Our audit included obtaining an understanding of internal control over financial reporting, assessing the risk that a material weakness exists, testing and evaluating the design and operating effectiveness of internal control based on the assessed risk, and performing such other procedures as we considered necessary in the circumstances. We believe that our audit provides a reasonable basis for our opinion.
A fund’s internal control over financial reporting is a process designed to provide reasonable assurance regarding the reliability of financial reporting and the preparation of financial statements for external purposes in accordance with generally accepted accounting principles. A fund’s internal control over financial reporting includes those policies and procedures that (1) pertain to the maintenance of records that, in reasonable detail, accurately and fairly reflect the transactions and dispositions of the assets of the fund; (2) provide reasonable assurance that transactions are recorded as necessary to permit preparation of financial statements in accordance with generally accepted accounting principles, and that receipts and expenditures of the fund are being made only in accordance with authorizations of management and directors of the fund; and (3) provide reasonable assurance regarding prevention or timely detection of unauthorized acquisition, use, or disposition of the fund’s assets that could have a material effect on the financial statements.
Because of its inherent limitations, internal control over financial reporting may not prevent or detect misstatements. Also, projections of any evaluation of effectiveness to future periods are subject to the risk that controls may become inadequate because of changes in conditions, or that the degree of compliance with the policies or procedures may deteriorate.
In our opinion, the Fund maintained, in all material respects, effective internal control over financial reporting as of December 31, 2016, based on criteria established in the 2013 Internal Control—Integrated Framework issued by COSO.
We also have audited, in accordance with the standards of the Public Company Accounting Oversight Board (United States), the financial statements of the Fund as of and for the year ended December 31, 2016, and our report dated March 16, 2017 expressed an unqualified opinion on those financial statements.
/s/ GRANT THORNTON LLP
New York, New York
March 16, 2017
| 101 |
TEUCRIUM CORN FUND
STATEMENTS OF ASSETS AND LIABILITIES
| December 31, 2016 | December 31, 2015 | |||||||
| Assets | ||||||||
| Cash and cash equivalents | $ | 69,072,284 | $ | 57,110,089 | ||||
| Interest receivable | 339 | 379 | ||||||
| Other assets | 10,451 | 505,352 | ||||||
| Equity in trading accounts: | ||||||||
| Due from broker | 5,664,656 | 7,405,938 | ||||||
| Total assets | 74,747,730 | 65,021,758 | ||||||
| Liabilities | ||||||||
| Management fee payable to Sponsor | 65,165 | 53,729 | ||||||
| Other liabilities | 8,224 | 3,256 | ||||||
| Equity in trading accounts: | ||||||||
| Commodity futures contracts | 1,460,800 | 3,908,550 | ||||||
| Total liabilities | 1,534,189 | 3,965,535 | ||||||
| Net assets | $ | 73,213,541 | $ | 61,056,223 | ||||
| Shares outstanding | 3,900,004 | 2,875,004 | ||||||
| Net asset value per share | $ | 18.77 | $ | 21.24 | ||||
| Market value per share | $ | 18.71 | $ | 21.22 | ||||
The accompanying notes are an integral part of these financial statements.
102
TEUCRIUM CORN FUND
December 31, 2016
| Percentage of | ||||||||||||
| Description: Assets | Fair Value | Net Assets | Shares | |||||||||
| Cash equivalents | ||||||||||||
| Money market funds | ||||||||||||
| Fidelity Institutional Money Market Funds - Government Portfolio (cost $692,293) | $ | 692,293 | 0.95 | % | 692,293 | |||||||
| Percentage of | Notional Amount | |||||||||||
| Description: Liabilities | Fair Value | Net Assets | (Long Exposure) | |||||||||
| Commodity futures contracts | ||||||||||||
| United States corn futures contracts | ||||||||||||
| CBOT corn futures MAY17 (1,438 contracts) | $ | 50,713 | 0.07 | % | $ | 25,704,250 | ||||||
| CBOT corn futures JUL17 (1,207 contracts) | 576,650 | 0.79 | 21,982,488 | |||||||||
| CBOT corn futures DEC17 (1,347 contracts) | 833,437 | 1.14 | 25,593,000 | |||||||||
| Total commodity futures contracts | $ | 1,460,800 | 2.00 | % | $ | 73,279,738 | ||||||
The accompanying notes are an integral part of these financial statements.
103
TEUCRIUM CORN FUND
SCHEDULE OF INVESTMENTS
December 31, 2015
| Percentage of | ||||||||||||
| Description: Assets | Fair Value | Net Assets | Shares | |||||||||
| Cash equivalents | ||||||||||||
| Money market funds | ||||||||||||
| Fidelity Institutional Prime Money Market Portfolio (cost $899,313) | $ | 899,313 | 1.47 | % | 899,313 | |||||||
| Percentage of | Notional Amount | |||||||||||
| Description: Liabilities | Fair Value | Net Assets | (Long Exposure) | |||||||||
| Commodity futures contracts | ||||||||||||
| United States corn futures contracts | ||||||||||||
| CBOT corn futures MAY16 (1,172 contracts) | $ | 1,910,013 | 3.13 | % | $ | 21,359,700 | ||||||
| CBOT corn futures JUL16 (988 contracts) | 925,750 | 1.52 | 18,302,700 | |||||||||
| CBOT corn futures DEC16 (1,117 contracts) | 1,072,787 | 1.76 | 21,390,550 | |||||||||
| Total commodity futures contracts | $ | 3,908,550 | 6.41 | % | $ | 61,052,950 | ||||||
The accompanying notes are an integral part of these financial statements.
104
TEUCRIUM CORN FUND
| Year ended | Year ended | Year ended | ||||||||||
| December 31, 2016 | December 31, 2015 | December 31, 2014 | ||||||||||
| Income | ||||||||||||
| Realized and unrealized gain (loss) on trading of commodity futures contracts: | ||||||||||||
| Realized loss on commodity futures contracts | $ | (9,438,913 | ) | $ | (8,533,650 | ) | $ | (11,085,713 | ) | |||
| Net change in unrealized appreciation or depreciation on commodity futures contracts | 2,447,750 | (5,660,263 | ) | 6,636,500 | ||||||||
| Interest income | 396,679 | 146,905 | 35,595 | |||||||||
| Total loss | (6,594,484 | ) | (14,047,008 | ) | (4,413,618 | ) | ||||||
| Expenses | ||||||||||||
| Management fees | 719,183 | 779,808 | 986,771 | |||||||||
| Professional fees | 1,049,134 | 745,650 | 549,545 | |||||||||
| Distribution and marketing fees | 1,160,864 | 1,199,576 | 1,248,005 | |||||||||
| Custodian fees and expenses | 183,452 | 187,264 | 129,195 | |||||||||
| Business permits and licenses fees | 16,887 | 26,852 | 30,584 | |||||||||
| General and administrative expenses | 142,932 | 206,490 | 175,207 | |||||||||
| Brokerage commissions | 96,725 | 41,250 | 150,086 | |||||||||
| Other expenses | 42,739 | 45,642 | 61,011 | |||||||||
| Total expenses | 3,411,916 | 3,232,532 | 3,330,404 | |||||||||
| Expenses waived by the Sponsor | (442,333 | ) | (96,068 | ) | (105,270 | ) | ||||||
| Reimbursement of expenses previously waived | — | — | 308,312 | |||||||||
| Total expenses, net | 2,969,583 | 3,136,464 | 3,533,446 | |||||||||
| Net loss | $ | (9,564,067 | ) | $ | (17,183,472 | ) | $ | (7,947,064 | ) | |||
| Net loss per share | $ | (2.47 | ) | $ | (5.38 | ) | $ | (4.02 | ) | |||
| Net loss per weighted average share | $ | (2.66 | ) | $ | (5.30 | ) | $ | (2.30 | ) | |||
| Weighted average shares outstanding | 3,598,843 | 3,243,223 | 3,460,141 | |||||||||
The accompanying notes are an integral part of these financial statements.
105
TEUCRIUM CORN FUND
STATEMENTS OF CHANGES IN NET ASSETS
| Year ended | Year ended | Year ended | ||||||||||
| December 31, 2016 | December 31, 2015 | December 31, 2014 | ||||||||||
| Operations | ||||||||||||
| Net loss | $ | (9,564,067 | ) | $ | (17,183,472 | ) | $ | (7,947,064 | ) | |||
| Capital transactions | ||||||||||||
| Issuance of Shares | 57,591,933 | 8,538,198 | 146,789,763 | |||||||||
| Redemption of Shares | (35,870,548 | ) | (38,758,010 | ) | (77,882,812 | ) | ||||||
| Total capital transactions | 21,721,385 | (30,219,812 | ) | 68,906,951 | ||||||||
| Net change in net assets | 12,157,318 | (47,403,284 | ) | 60,959,887 | ||||||||
| Net assets, beginning of period | $ | 61,056,223 | $ | 108,459,507 | $ | 47,499,620 | ||||||
| Net assets, end of period | $ | 73,213,541 | $ | 61,056,223 | $ | 108,459,507 | ||||||
| Net asset value per share at beginning of period | $ | 21.24 | $ | 26.62 | $ | 30.64 | ||||||
| Net asset value per share at end of period | $ | 18.77 | $ | 21.24 | $ | 26.62 | ||||||
| Creation of Shares | 2,875,000 | 350,000 | 5,050,000 | |||||||||
| Redemption of Shares | 1,850,000 | 1,550,000 | 2,525,000 | |||||||||
The accompanying notes are an integral part of these financial statements.
106
TEUCRIUM CORN FUND
| Year ended | Year ended | Year ended | ||||||||||
| December 31, 2016 | December 31, 2015 | December 31, 2014 | ||||||||||
| Cash flows from operating activities: | ||||||||||||
| Net loss | $ | (9,564,067 | ) | $ | (17,183,472 | ) | $ | (7,947,064 | ) | |||
| Adjustments to reconcile net loss to net cash used in operating activities: | ||||||||||||
| Net change in unrealized appreciation or depreciation on commodity futures contracts | (2,447,750 | ) | 5,660,263 | (6,636,500 | ) | |||||||
| Changes in operating assets and liabilities: | ||||||||||||
| Due from broker | 1,741,282 | (5,792,163 | ) | 8,238,438 | ||||||||
| Interest receivable | 40 | 6,950 | (4,353 | ) | ||||||||
| Other assets | 494,901 | (67,356 | ) | (223,365 | ) | |||||||
| Management fee payable to Sponsor | 11,436 | (45,069 | ) | 56,952 | ||||||||
| Other liabilities | 4,968 | (111,563 | ) | 66,032 | ||||||||
| Net cash used in operating activities | (9,759,190 | ) | (17,532,410 | ) | (6,449,860 | ) | ||||||
| Cash flows from financing activities: | ||||||||||||
| Proceeds from sale of Shares | 57,591,933 | 8,538,198 | 146,789,763 | |||||||||
| Redemption of Shares | (35,870,548 | ) | (40,754,195 | ) | (75,886,627 | ) | ||||||
| Net cash provided by (used in) financing activities | 21,721,385 | (32,215,997 | ) | 70,903,136 | ||||||||
| Net change in cash and cash equivalents | 11,962,195 | (49,748,407 | ) | 64,453,276 | ||||||||
| Cash and cash equivalents, beginning of period | 57,110,089 | 106,858,496 | 42,405,220 | |||||||||
| Cash and cash equivalents, end of period | $ | 69,072,284 | $ | 57,110,089 | $ | 106,858,496 | ||||||
The accompanying notes are an integral part of these financial statements.
107
December 31, 2016
Note 1 – Organization and Operation
Teucrium Corn Fund (referred to herein as “CORN,” or the “Fund”) is a commodity pool that is a series of Teucrium Commodity Trust (“Trust”), a Delaware statutory trust formed on September 11, 2009. The Fund issues common units, called the “Shares,” representing fractional undivided beneficial interests in the Fund. The Fund continuously offers Creation Baskets consisting of 25,000 Shares at their Net Asset Value (“NAV”) to “Authorized Purchasers” through Foreside Fund Services, LLC, which is the distributor for the Fund (the “Distributor”). Authorized Purchasers sell such Shares, which are listed on the New York Stock Exchange (“NYSE”) Arca under the symbol “CORN,” to the public at per-Share offering prices that reflect, among other factors, the trading price of the Shares on the NYSE Arca, the NAV of the Fund at the time the Authorized Purchaser purchased the Creation Baskets and the NAV at the time of the offer of the Shares to the public, the supply of and demand for Shares at the time of sale, and the liquidity of the markets for corn interests. The Fund’s Shares trade in the secondary market on the NYSE Arca at prices that are lower or higher than their NAV per Share.
The investment objective of CORN is to have the daily changes in percentage terms of the Shares’ NAV reflect the daily changes in percentage terms of a weighted average of the closing settlement prices for three futures contracts for corn (“Corn Futures Contracts”) that are traded on the Chicago Board of Trade (“CBOT”), specifically (1) the second-to-expire CBOT Corn Futures Contract, weighted 35%, (2) the third-to-expire CBOT Corn Futures Contract, weighted 30%, and (3) the CBOT Corn Futures Contract expiring in the December following the expiration month of the third-to-expire contract, weighted 35%.
The Fund commenced investment operations on June 9, 2010 and has a fiscal year ending on December 31. The Fund’s sponsor is Teucrium Trading, LLC (the “Sponsor”). The Sponsor is responsible for the management of the Fund. The Sponsor is a member of the National Futures Association (the “NFA”) and became a commodity pool operator registered with the Commodity Futures Trading Commission (the “CFTC”) effective November 10, 2009.
On June 5, 2010, the Fund’s initial registration of 30,000,000 shares on Form S-1 was declared effective by the U.S. Securities and Exchange Commission (“SEC”). On June 9, 2010, the Fund listed its shares on the NYSE Arca under the ticker symbol “CORN.” On the day prior to that, the Fund issued 200,000 shares in exchange for $5,000,000 at the Fund’s initial NAV of $25 per share. The Fund also commenced investment operations on June 9, 2010 by purchasing commodity futures contracts traded on the CBOT. On April 29, 2016, a second subsequent registration statement for CORN was declared effective by the SEC.
Subject to the terms of the Trust Agreement, Teucrium Trading, LLC, in its capacity as the Sponsor (“Sponsor”), may terminate a Fund at any time, regardless of whether the Fund has incurred losses, including, for instance, if it determines that the Fund’s aggregate net assets in relation to its operating expenses make the continued operation of the Fund unreasonable or imprudent. However, no level of losses will require the Sponsor to terminate a Fund.
Note 2 – Principal Contracts and Agreements
On August 17, 2015 (the “Conversion Date”), U.S. Bank N.A. replaced The Bank of New York Mellon as the Custodian for the Fund. The principal business address for U.S. Bank N.A. is 1555 North Rivercenter Drive, Suite 302, Milwaukee, Wisconsin 53212. U.S. Bank N.A. is a Wisconsin state chartered bank subject to regulation by the Board of Governors of the Federal Reserve System and the Wisconsin State Banking Department. The principal address for U.S. Bancorp Fund Services, LLC (“USBFS”) is 777 East Wisconsin Avenue, Milwaukee, WI, 53202. In addition, effective on the Conversion Date, USBFS, a wholly owned subsidiary of U.S. Bank, commenced serving as administrator for each Fund, performing certain administrative and accounting services and preparing certain SEC reports on behalf of the Funds, and also became the registrar and transfer agent for each Fund’s Shares. For such services, U.S. Bank and USBFS will receive an asset-based fee, subject to a minimum annual fee.
Given this conversion, the Sponsor has, for the year-ended December 31, 2015, reflected an expense, before and after fees waived by the Sponsor, for fees associated with Custodian, Fund Administration and Transfer Agent services (“Custodian Fees”) that have or will be paid to the Bank of New York Mellon by a Fund or by the Sponsor on behalf of a Fund.
For custody services, the Funds will pay to U.S. Bank N.A. 0.0075% of average gross assets up to $1 billion, and .0050% of average gross assets over $1 billion, annually, plus certain per-transaction charges. For Transfer Agency, Fund Accounting and Fund Administration services, which are based on the total assets for all the Funds in the Trust, the Funds will pay to USBFS 0.06% of average gross assets on the first $250 million, 0.05% on the next $250 million, 0.04% on the next $500 million and 0.03% on the balance over $1 billion annually. A combined minimum annual fee of up to $64,500 for custody, transfer agency, accounting and administrative services is assessed per Fund. For the years ended December 31, the Fund recognized $183,452 in 2016, $187,264 in 2015 and $129,195 in 2014, respectively, for these services, which is recorded in custodian fees and expenses on the combined statements of operations; of this expense $44,442 in 2016, $57,714 in 2015 and $0 in 2014 were waived by the Sponsor.
The Sponsor employs Foreside Fund Services, LLC (“Foreside” or the “Distributor”) as the Distributor for the Funds. The Distribution Services Agreement among the Distributor and the Sponsor calls for the Distributor to work with the Custodian in connection with the receipt and processing of orders for Creation Baskets and Redemption Baskets and the review and approval of all Fund sales literature and advertising materials. The Distributor and the Sponsor have also entered into a Securities Activities and Service Agreement (the “SASA”) under which certain employees and officers of the Sponsor are licensed as registered representatives or registered principals of the Distributor, under Financial Industry Regulatory Authority (“FINRA”) rules. For its services as the Distributor, Foreside receives a fee of 0.01% of the Fund’s average daily net assets and an aggregate annual fee of $100,000 for all Teucrium Funds, along with certain expense reimbursements. For its services under the SASA, Foreside receives a fee of $5,000 per registered representative and $1,000 per registered location. For the years ended December 31, the Fund recognized $76,491 in 2016, $95,978 in 2015 and $118,508 in 2014, respectively, for these services, which is recorded in distribution and marketing fees on the statements of operations; of this expense $12,779 in 2016 and $0 in 2015 and $0 2014 were waived by the Sponsor.
108
For the year ended December 31, 2014, Newedge USA, LLC (“Newedge USA”) served as the Funds’ futures commission merchant (“FCM”) and primary clearing broker to execute and clear the Funds’ futures transactions and provide other brokerage-related services. In 2014, the Funds introduced the use of Jefferies LLC (“Jefferies”), for the execution and clearing of the Funds’ futures and options, if any, on futures transactions. On January 2, 2015, Newedge USA, LLC (“Newedge USA”) merged with and into SG Americas Securities, LLC (“SG”), with the latter as the surviving entity. On February 6, 2015 Jefferies LLC (“Jefferies”) became the Funds’ FCM and primary clearing broker. All futures contracts held by SG were transferred to Jefferies on that date. As of February 23, 2015 all residual cash balances held at SG had been transferred to Jefferies and the balance in all SG accounts was $0. Effective June 3, 2015, ED&F Man Capital Markets Inc. (“ED&F Man”) replaced Jefferies as the Underlying Funds’ FCM and the clearing broker to execute and clear the Underlying Fund’s futures and provide other brokerage-related services. As of June 4, 2015 all futures contracts and residual cash balances held at Jefferies had been transferred to ED&F Man and the balance in all Jefferies accounts was $0.
Currently, ED&F Man serves as the Underlying Funds’ clearing broker to execute and clear the Underlying Funds’ futures and provide other brokerage-related services. ED&F Man is registered as a FCM with the U.S. CFTC and is a member of the NFA. ED&F Man is also registered as a broker/dealer with the U.S. Securities and Exchange Commission and is a member of the FINRA. ED&F Man is a clearing member of ICE Futures U.S., Inc., Chicago Board of Trade, Chicago Mercantile Exchange, New York Mercantile Exchange, and all other major United States commodity exchanges. For Corn, Soybean, Sugar and Wheat Futures Contracts ED&F Man, Jefferies and SG were paid $8.00 per round turn in 2015 and 2014. Effective January 1, 2016, ED&F Man, increased the per round-term charge for futures contracts commission to $9.00. For the years ended December 31, the Fund recognized $96,725 in 2016, $41,250 in 2015 and $150,086 in 2014, respectively, for these services, which is recorded in brokerage commission on the statements of operations; of this expense $0 in 2016, $18,000 in 2015 and $0 in 2014 were waived by the Sponsor.
The sole Trustee of the Trust is Wilmington Trust Company, a Delaware banking corporation. The Trustee will accept service of legal process on the Trust in the State of Delaware and will make certain filings under the Delaware Statutory Trust Act. For its services, the Trustee receives an annual fee of $3,300 from the Trust. For the years ended December 31, the Fund recognized $1,550 in 2016, $1,560 in 2015 and $2,350 in 2014, respectively, for these services, which is recorded in business permits and licenses fees on the statements of operations; of this expense $1,550 in 2016, $0 in 2015 and $0 in 2014 were waived by the Sponsor.
Note 3 – Summary of Significant Accounting Policies
Basis of Presentation
The accompanying financial statements have been prepared in accordance with accounting principles generally accepted in the United States of America (“U.S. GAAP”) as detailed in the Financial Accounting Standards Board’s Accounting Standards Codification.
Revenue Recognition
Commodity futures contracts are recorded on the trade date. All such transactions are recorded on the identified cost basis and marked to market daily. Unrealized appreciation or depreciation on commodity futures contracts are reflected in the statements of assets and liabilities as the difference between the original contract amount and the fair market value as of the last business day of the year or as of the last date of the financial statements. Changes in the appreciation or depreciation between periods are reflected in the statements of operations. Interest on cash equivalents and deposits with the Futures Commission Merchant are recognized on the accrual basis. The Fund earns interest on its assets denominated in U.S. dollars on deposit with the Futures Commission Merchant. In addition, the Fund earns interest on funds held at the custodian at prevailing market rates for such investments.
Brokerage Commissions
Brokerage commissions on all open commodity futures contracts are accrued on the trade date and on a full-turn basis.
Income Taxes
For tax purposes, the Fund will be treated as a partnership. The Fund does not record a provision for income taxes because the shareholders report their share of the Fund’s income or loss on their income tax returns. The financial statements reflect the Fund’s transactions without adjustment, if any, required for income tax purposes.
The Fund is required to determine whether a tax position is more likely than not to be sustained upon examination by the applicable taxing authority, including resolution of any related appeals or litigation processes, based on the technical merits of the position. The Fund files an income tax return in the U.S. federal jurisdiction, and may file income tax returns in various U.S. states and foreign jurisdictions. For all tax years 2013 to 2016, the Fund remains subject to income tax examinations by major taxing authorities. The tax benefit recognized is measured as the largest amount of benefit that has a greater than fifty percent likelihood of being realized upon ultimate settlement. De-recognition of a tax benefit previously recognized results in the Fund recording a tax liability that reduces net assets. Based on its analysis, the Fund has determined that it has not incurred any liability for unrecognized tax benefits as of and for the years ended December 31, 2016, 2015, 2014 and 2013. However, the Fund’s conclusions regarding this policy may be subject to review and adjustment at a later date based on factors including, but not limited to, ongoing analysis of and changes to tax laws, regulations, and interpretations thereof.
109
The Fund recognizes interest accrued related to unrecognized tax benefits and penalties related to unrecognized tax benefits in income tax fees payable, if assessed. No interest expense or penalties have been recognized as of and for the years ended December 31, 2016, 2015 and 2014.
The Fund may be subject to potential examination by U.S. federal, U.S. state, or foreign jurisdictional authorities in the area of income taxes. These potential examinations may include questioning the timing and amount of deductions, the nexus of income among various tax jurisdictions, and compliance with U.S. federal, U.S. state and foreign tax laws. The Fund’s management does not expect that the total amount of unrecognized tax benefits will materially change over the next twelve months.
Creations and Redemptions
Authorized Purchasers may purchase Creation Baskets consisting of 25,000 shares from CORN. The amount of the proceeds required to purchase a Creation Basket will be equal to the NAV of the shares in the Creation Basket determined as of 4:00 p.m. New York time on the day the order to create the basket is properly received.
Authorized Purchasers may redeem shares from the Fund only in blocks of 25,000 shares called “Redemption Baskets.” The amount of the redemption proceeds for a Redemption Basket will be equal to the NAV of the shares in the Redemption Basket determined as of 4:00 p.m. New York time on the day the order to redeem the basket is properly received.
The Fund receives or pays the proceeds from shares sold or redeemed within three business days after the trade date of the purchase or redemption. The amounts due from Authorized Purchasers are reflected in the Fund’s statements of assets and liabilities as receivable for shares sold. Amounts payable to Authorized Purchasers upon redemption are reflected in the Fund’s statements of assets and liabilities as payable for shares redeemed.
As outlined in the most recent Form S-1 filing, 50,000 shares represents two Redemption Baskets for the Fund and a minimum level of shares.
Allocation of Shareholder Income and Losses
Profit or loss is allocated among the shareholders of the Fund in proportion to the number of shares each shareholder holds as of the close of each month.
Cash and Cash Equivalents
Cash equivalents are highly-liquid investments with maturity dates of 90 days or less when acquired. The Fund reported its cash equivalents in the statements of assets and liabilities at market value, or at carrying amounts that approximate fair value, because of their highly-liquid nature and short-term maturities. The Fund has these balances of its assets on deposit with banks. The Fund had a balance of $692,293 and $899,313 in money market funds at December 31, 2016 and December 31, 2015, respectively; these balances are included in cash and cash equivalents on the statements of assets and liabilities. Effective in the second quarter 2015, the Sponsor invested a portion of the available cash for the Fund in alternative demand-deposit savings accounts, which is classified as cash and not as a cash equivalent. The Fund had a balance of $68,382,027 in demand-deposit savings accounts on December 31, 2016. This change resulted in a reduction in the balance held in money market funds. Assets deposited with the bank may, at times, exceed federally insured limits.
Due from/to Broker
The amount recorded by the Fund for the amount due from and to the clearing broker includes, but is not limited to, cash held by the broker, amounts payable to the clearing broker related to open transactions and payables for commodities futures accounts liquidating to an equity balance on the clearing broker’s records.
Margin is the minimum amount of funds that must be deposited by a commodity interest trader with the trader’s broker to initiate and maintain an open position in futures contracts. A margin deposit acts to assure the trader’s performance of the futures contracts purchased or sold. Futures contracts are customarily bought and sold on initial margin that represents a very small percentage of the aggregate purchase or sales price of the contract. Because of such low margin requirements, price fluctuations occurring in the futures markets may create profits and losses that, in relation to the amount invested, are greater than are customary in other forms of investment or speculation. As discussed below, adverse price changes in the futures contract may result in margin requirements that greatly exceed the initial margin. In addition, the amount of margin required in connection with a particular futures contract is set from time to time by the exchange on which the contract is traded and may be modified from time to time by the exchange during the term of the contract. Brokerage firms, such as the Fund’s clearing brokers, carrying accounts for traders in commodity interest contracts generally require higher amounts of margin as a matter of policy to further protect themselves. Over-the-counter trading generally involves the extension of credit between counterparties, so the counterparties may agree to require the posting of collateral by one or both parties to address credit exposure.
110
When a trader purchases an option, there is no margin requirement; however, the option premium must be paid in full. When a trader sells an option, on the other hand, he or she is required to deposit margin in an amount determined by the margin requirements established for the underlying interest and, in addition, an amount substantially equal to the current premium for the option. The margin requirements imposed on the selling of options, although adjusted to reflect the probability that out-of-the-money options will not be exercised, can in fact be higher than those imposed in dealing in the futures markets directly. Complicated margin requirements apply to spreads and conversions, which are complex trading strategies in which a trader acquires a mixture of options positions and positions in the underlying interest.
Ongoing or “maintenance” margin requirements are computed each day by a trader’s clearing broker. When the market value of a particular open futures contract changes to a point where the margin on deposit does not satisfy maintenance margin requirements, a margin call is made by the broker. If the margin call is not met within a reasonable time, the broker may close out the trader’s position. With respect to the Fund’s trading, the Fund (and not its shareholders personally) is subject to margin calls.
Finally, many major U.S. exchanges have passed certain cross margining arrangements involving procedures pursuant to which the futures and options positions held in an account would, in the case of some accounts, be aggregated and margin requirements would be assessed on a portfolio basis, measuring the total risk of the combined positions.
Calculation of Net Asset Value
The Fund’s NAV is calculated by:
| ● | Taking the current market value of its total assets and |
| ● | Subtracting any liabilities. |
The administrator, USBFS, calculates the NAV of the Fund once each trading day. It calculates the NAV as of the earlier of the close of the NYSE or 4:00 p.m. New York time. The NAV for a particular trading day is released after 4:15 p.m. New York time.
In determining the value of Corn Futures Contracts, the administrator uses the CBOT closing price. The administrator determines the value of all other Fund investments as of the earlier of the close of the NYSE or 4:00 p.m. New York time. The value of over-the-counter corn interests is determined based on the value of the commodity or futures contract underlying such corn interest, except that a fair value may be determined if the Sponsor believes that the Fund is subject to significant credit risk relating to the counterparty to such corn interest. For purposes of financial statements and reports, the Sponsor will recalculate the NAV where necessary to reflect the “fair value” of a Futures Contract when the Futures Contract closes at its price fluctuation limit for the day. Treasury securities held by the Fund are valued by the administrator using values received from recognized third-party vendors and dealer quotes. NAV includes any unrealized profit or loss on open corn interests and any other income or expense accruing to the Fund but unpaid or not received by the Fund.
Sponsor Fee, Allocation of Expenses and Related Party Transactions
The Sponsor is responsible for investing the assets of the Fund in accordance with the objectives and policies of the Fund. In addition, the Sponsor arranges for one or more third parties to provide administrative, custodial, accounting, transfer agency and other necessary services to the Trust and the Funds. In addition, the Sponsor elected not to outsource services directly attributable to the Trust and the Funds such as accounting, financial reporting, regulatory compliance and trading activities. In addition, the Fund is contractually obligated to pay a monthly management fee to the Sponsor, based on average daily net assets, at a rate equal to 1.00% per annum.
The Fund generally pays for all brokerage fees, taxes and other expenses, including licensing fees for the use of intellectual property, registration or other fees paid to the SEC, FINRA, formerly the National Association of Securities Dealers, or any other regulatory agency in connection with the offer and sale of subsequent Shares after its initial registration and all legal, accounting, printing and other expenses associated therewith. The Fund also pays its portion of the fees and expenses associated with the Trust’s tax accounting and reporting requirements. Certain aggregate expenses common to all Funds within the Trust are allocated by the Sponsor to the respective funds based on activity drivers deemed most appropriate by the Sponsor for such expenses, including but not limited to relative assets under management and creation and redeem order activity.
These aggregate common expenses include, but are not limited to, legal, auditing, accounting and financial reporting, tax-preparation, regulatory compliance, trading activities, and insurance costs, as well as fees paid to the Distributor, which are included in the related line item in the statements of operations. A portion of these aggregate common expenses are related to the Sponsor or related parties of principals of the Sponsor; these are necessary services to the Funds, which are primarily the cost of performing accounting and financial reporting, regulatory compliance, and trading activities that are directly attributable to the Fund. For the years ended December 31, the Fund recognized $936,695 in 2016, $1,034,163 in 2015 and $1,047,648 in 2014, respectively, for these expenses, which are primarily recorded in distribution and marketing fees on the statements of operations; of these amounts $275,884 in 2016, $20,000 in 2015 and $20,312 in 2014 were waived by the Sponsor. All asset-based fees and expenses for the Funds are calculated on the prior day’s net assets.
For the year ended December 31, 2016 there were $442,333 of expenses that were identified on the statements of operations of the Fund as expenses that were waived by the Sponsor. The Sponsor has determined that there would be no recovery sought for these amounts in any future period.
111
For the year ended December 31, 2015 there were $96,068 of expenses that were identified on the statements of operations of the Fund as expenses that were waived by the Sponsor. The Sponsor has determined that there would be no recovery sought for these amounts in any future period.
For the year ended December 31, 2014 there were $105,270 of expenses that were identified on the statements of operations of the Fund as expenses that were waived by the Sponsor. The Sponsor has determined that there would be no recovery sought for these amounts in any future period.
For the year ended December 31, 2013, there was $426,248 of expenses recorded in the financial statements of the Sponsor which were subject to reimbursement by CORN in 2014. At that time, the Sponsor had determined that recovery of the expense amounts was not probable. In 2014, asset growth and other changes experienced by CORN enabled the Sponsor to claim reimbursement of $308,312 from the Fund. This amount is reflected in the statements of operations as a reimbursement of previously waived expenses.
Use of Estimates
The preparation of financial statements in conformity with U.S. GAAP requires management to make estimates and assumptions that affect the reported amount of assets and liabilities and disclosure of contingent assets and liabilities at the date of the financial statements, and the reported amounts of the revenue and expenses during the reporting period. Actual results could differ from those estimates.
Fair Value - Definition and Hierarchy
In accordance with U.S. GAAP, fair value is defined as the price that would be received to sell an asset or paid to transfer a liability (i.e., the “exit price”) in an orderly transaction between market participants at the measurement date.
In determining fair value, the Fund uses various valuation approaches. In accordance with GAAP, a fair value hierarchy for inputs is used in measuring fair value that maximizes the use of observable inputs and minimizes the use of unobservable inputs by requiring that the most observable inputs be used when available. Observable inputs are those that market participants would use in pricing the asset or liability based on market data obtained from sources independent of the Fund. Unobservable inputs reflect the Fund’s assumptions about the inputs market participants would use in pricing the asset or liability developed based on the best information available in the circumstances. The fair value hierarchy is categorized into three levels based on the inputs as follows:
Level 1 - Valuations based on unadjusted quoted prices in active markets for identical assets or liabilities that the Fund has the ability to access. Valuation adjustments and block discounts are not applied to Level 1 financial instruments. Since valuations are based on quoted prices that are readily and regularly available in an active market, valuation of these financial instruments does not entail a significant degree of judgment.
Level 2 - Valuations based on quoted prices in markets that are not active or for which all significant inputs are observable, either directly or indirectly.
Level 3 - Valuations based on inputs that are unobservable and significant to the overall fair value measurement.
The availability of valuation techniques and observable inputs can vary from financial instrument to financial instrument and is affected by a wide variety of factors including, the type of financial instrument, whether the financial instrument is new and not yet established in the marketplace, and other characteristics particular to the transaction. To the extent that valuation is based on models or inputs that are less observable or unobservable in the market, the determination of fair value requires more judgment. Those estimated values do not necessarily represent the amounts that may be ultimately realized due to the occurrence of future circumstances that cannot be reasonably determined. Because of the inherent uncertainty of valuation, those estimated values may be materially higher or lower than the values that would have been used had a ready market for the financial instruments existed. Accordingly, the degree of judgment exercised by the Fund in determining fair value is greatest for financial instruments categorized in Level 3. In certain cases, the inputs used to measure fair value may fall into different levels of the fair value hierarchy. In such cases, for disclosure purposes, the level in the fair value hierarchy, within which the fair value measurement in its entirety falls, is determined based on the lowest level input that is significant to the fair value measurement.
Fair value is a market-based measure considered from the perspective of a market participant rather than an entity-specific measure. Therefore, even when market assumptions are not readily available, the Fund’s own assumptions are set to reflect those that market participants would use in pricing the asset or liability at the measurement date. The Fund uses prices and inputs that are current as of the measurement date, including during periods of market dislocation. In periods of market dislocation, the observability of prices and inputs may be reduced for many securities. This condition could cause a financial instrument to be reclassified to a lower level within the fair value hierarchy. For instance, when Corn Futures Contracts on the CBOT are not actively trading due to a “limit-up” or limit-down” condition, meaning that the change in the Corn Futures Contracts has exceeded the limits established, the Trust and the Fund will revert to alternative verifiable sources of valuation of its assets. When such a situation exists on a quarter close, the Sponsor will calculate the Net Asset Value (“NAV”) on a particular day using the Level 1 valuation, but will later recalculate the NAV for the impacted Fund based upon the valuation inputs from these alternative verifiable sources (Level 2 or Level 3) and will report such NAV in its applicable financial statements and reports.
On December 31, 2016 and 2015, in the opinion of the Trust and the Fund, the reported value of the Corn Futures Contracts traded on the CBOT fairly reflected the value of the Corn Futures Contracts held by the Fund, and no adjustments were necessary. The determination is made as of the settlement of the futures contracts on the last day of trading for the reporting period. In making the determination of a Level 1 or Level 2 transfer, the Fund considers the average volume of the specific underlying futures contracts traded on the relevant exchange for the years being reported.
112
For the years ended December 31, 2016 and 2015, the Fund did not have any significant transfers between any of the levels of the fair value hierarchy.
The Fund records its derivative activities at fair value. Gains and losses from derivative contracts are included in the statements of operations. Derivative contracts include futures contracts related to commodity prices. Futures, which are listed on a national securities exchange, such as the CBOT and the ICE, or reported on another national market, are generally categorized in Level 1 of the fair value hierarchy. OTC derivatives contracts (such as forward and swap contracts) which may be valued using models, depending on whether significant inputs are observable or unobservable, are categorized in Levels 2 or 3 of the fair value hierarchy.
Expenses
Expenses are recorded using the accrual method of accounting.
Net Income (Loss) per Share
Net income (loss) per Share is the difference between the NAV per unit at the beginning of each period and at the end of each period. The weighted average number of Shares outstanding was computed for purposes of disclosing net income (loss) per weighted average Share. The weighted average Shares are equal to the number of Shares outstanding at the end of the period, adjusted proportionately for Shares created or redeemed based on the amount of time the Shares were outstanding during such period.
New Accounting Pronouncements
The Financial Accounting Standards Board (“FASB”) issued Accounting Standards Update (“ASU”) 2016-19, “Technical Corrections and Improvements”. The amendments in this update represent changes to clarify, correct errors, or make minor improvements to the Accounting Standards Codification. The amendments make the Accounting Standards Codification easier to understand and easier to apply by eliminating inconsistencies and providing clarifications. The amendments are effective for fiscal years, and interim periods with those fiscal years, for all entities beginning after December 15, 2016. The adoption did not have a material impact on the financial statements and disclosures of the Trust or the Fund.
The FASB issued ASU 2016-18, “Statement of Cash Flows (Topic 230)”. The amendments in this update require that a statement of cash flows explain the change during the period in the total of cash, cash equivalents, and amounts generally described as restricted cash or restricted cash equivalents. Therefore, amounts generally described as restricted cash and restricted cash equivalents should be included with cash and cash equivalents when reconciling the beginning-of-period and end-of-period total amounts shown on the statement of cash flows. The amendments are effective for fiscal years beginning after December 15, 2017, and interim periods within those fiscal years. This update is not expected to have a material impact on the financial statements and disclosures of the Trust or the Fund. The Sponsor believes there will be a change in presentation of restricted cash on the statements of cash flows.
The FASB issued ASU 2016-17, “Consolidation (Topic 810): Interests Held through Related Parties That are under Common Control”. The amendments in this update alters how a decision maker needs to consider indirect interests in a variable interest entity (VIE) held through an entity under common control. The new guidance amends ASU 2015-02, Consolidation (Topic 810): Amendments to the Consolidation Analysis, issued in February 2015. The amendments are effective for fiscal years beginning after December 15, 2016, including interim periods within those fiscal years. The adoption did not have a material impact on the financial statements and disclosures of the Trust or the Fund.
The FASB issued ASU 2016-15, “Statement of Cash Flows (Topic 230): Classification of Certain Cash Receipts and Cash Payments”. The amendments provide cash flow statement classification guidance. The amendments in this update are effective for fiscal years beginning after December 15, 2017. The Trust and the Fund are currently evaluating the impact on the financial statements and disclosures. The Trust and the Fund do not expect to adopt the guidance until the effective date.
The FASB issued ASU 2014-09 in May 2014, “Revenue from Contracts with Customers (Topic 606),” which replaces the revenue recognition requirements of “Revenue Recognition (Topic 605).” This ASU is based on the principle that revenue is recognized to depict the transfer of goods and services to customers in an amount that reflects the consideration to which the entity expects to be entitled in exchange for those goods or services. This ASU provides new and more detailed guidance on specific topics and expands and improves disclosures about revenue. In August 2015, the FASB issued ASU 2015-14 which defers the effective date of ASU 2014-09 by one year to fiscal years beginning after December 15, 2017. ASU 2015-14 also permits early adoption of ASU 2014-09, but not before the original effective date, which was for fiscal years beginning after December 15, 2016. The Trust and the Fund record income or loss from the recognition and measurement of futures contracts and from interest income under Subtopic 825-10. Revenue from financial instruments which are valued under Subtopic 825 will not be subject to the application of ASU 2014-09 and 2015-14. Therefore, these standards will not apply or have a material impact on the financial statements and disclosures of the Trust or the Fund.
The FASB issued ASU 2016-11, “Revenue Recognition (Topic 605) and Derivatives and Hedging (Topic 815): Rescission of SEC Guidance Because of Accounting Standards Updates 2014-09 and 2014-16 Pursuant to Staff Announcements at the March 3, 2016 EITF Meeting”. The amendments make targeted improvements to clarify the principal versus agent assessment and are intended to make the guidance more operable and lead to more consistent application. The Trust and the Fund record income or loss from the recognition and measurement of futures contracts and from interest income under Subtopic 825-10. Revenue from financial instruments which are valued under Subtopic 825 will not be subject to the application of ASU 2016-11. Therefore, this standard will not apply or have a material impact on the financial statements and disclosures of the Trust or the Fund.
113
The FASB issued ASU 2016-02, “Leases (Topic 842).” The amendments in this update increase transparency and comparability among organizations by recognizing lease assets and lease liabilities on the balance sheet and disclosing key information about leasing arrangements. The amendments in this update are effective for fiscal years beginning after December 15, 2018. This update is not expected to have a material impact on the financial statements and disclosures of the Trust or the Fund.
The FASB issued ASU 2016-01, “Financial Instruments-Overall (Subtopic 825-10): Recognition and Measurement of Financial Assets and Financial Liabilities.” The amendments in this update are intended to improve the recognitions measurement and disclosure of financial instruments. The amendments to this update are effective for fiscal years beginning after December 15, 2017, and interim periods within those fiscal years. These amendments are required to be applied prospectively. The Trust and the Fund are currently evaluating the impact on the financial statements and disclosures; but based on our review to date we do not expect the update will have a material impact on the financial statements and disclosures of the Trust or the Fund.
The FASB issued ASU 2015-10, “Technical Corrections and Improvements.” The amendments in this update represent changes to clarify the Codification, correct unintended application of guidance, or make minor improvements to the Codification that are not expected to have a significant effect on current accounting practice or create a significant administrative cost to most entities. The amendments are effective for fiscal years beginning after December 15, 2015. The adoption did not have a material impact on the financial statements and disclosures of the Trust or the Fund.
The FASB issued ASU 2015-07, “Fair Value Measurement (Topic 820): Disclosures for Investments in Certain Entities That Calculate Net Asset Value per Share (or Its Equivalent).” The ASU amends ASC 820 to create a practical expedient to measure the fair value of investments in certain entities that do not have a quoted market price but calculate net asset value per share or its equivalent. In addition, the amendments to ASC 820 provide guidance on classifying investments that are measured using the practical expedient in the fair value hierarchy and require specific disclosures for eligible investments, regardless of whether the practical expedient has been applied. The amendments in this Update are effective for fiscal years beginning after December 15, 2015, and interim periods within those fiscal years. These amendments are required to be applied retrospectively to all periods presented. The adoption did not have a material impact on the financial statements and disclosures of the Trust or the Fund.
The FASB issued ASU 2015-06, “Earnings per Share (Topic 260): Effects on Historical Earnings per Unit of Master Limited Partnership Dropdown Transactions.” The amendments specify how earnings (losses) of a transferred business before the date of a dropdown transaction should be allocated to the various interest holders in a master limited partnership for purposes of calculating earning per unit under the two-class method. The amendments to this update are effective for fiscal years beginning after December 15, 2015, and interim periods within those fiscal years. The amendments are required to be applied retrospectively for all periods presented. The adoption did not have a material impact on the financial statements and disclosures of the Trust or the Fund.
The FASB issued ASU 2015-02, “Consolidation (Topic 810): Amendments to the Consolidation Analysis.” The amendments are intended to improve targeted areas of consolidation guidance for legal entities such as limited partnerships, limited liability corporations, and securitization structures. The amendments to this update are effective for periods beginning after December 15, 2015. These amendments are required to be applied retrospectively for all periods presented. The adoption did not have a material impact on the financial statements and disclosures of the Trust or the Fund.
The FASB issued ASU 2014-08, “Presentation of Financial Statements (Topic 205) and Property, Plant, and Equipment (Topic 360): Reporting Discontinued Operations and Disclosures of Disposals of Components of an Entity.” The amendments in this update change the requirements for reporting discontinued operations in Subtopic 2015-20. A significant provision of ASU 2014-08 calls for reporting as discontinued operations only those disposals that represent a strategic shift or have a major impact on the entity’s financial results and operations. The Company elected to early adopt this ASU for the year ended December 31, 2014, the adoption did not have a significant impact on the financial statements and disclosures of the Fund.
Note 4 – Fair Value Measurements
The Fund’s assets and liabilities recorded at fair value have been categorized based upon a fair value hierarchy as described in the Fund’s significant accounting policies in Note 3. The following table presents information about the Fund’s assets and liabilities measured at fair value as of December 31, 2016 and December 31, 2015:
| December 31, 2016 | ||||||||||||||||
| Balance as of | ||||||||||||||||
| Assets: | Level 1 | Level 2 | Level 3 | December 31, 2016 | ||||||||||||
| Cash equivalents | $ | 692,293 | $ | — | $ | — | $ | 692,293 | ||||||||
| Liabilities: | Level 1 | Level 2 | Level 3 | Balance as of December 31, 2016 | ||||||||||||
| Corn futures contracts | $ | 1,460,800 | $ | — | $ | — | $ | 1,460,800 | ||||||||
114
| December 31, 2015 | ||||||||||||||||
| Balance as of | ||||||||||||||||
| Assets: | Level 1 | Level 2 | Level 3 | December 31, 2015 | ||||||||||||
| Cash equivalents | $ | 899,313 | $ | — | $ | — | $ | 899,313 | ||||||||
| Liabilities: | Level 1 | Level 2 | Level 3 | Balance as of December 31, 2015 | ||||||||||||
| Corn futures contracts | $ | 3,908,550 | $ | — | $ | — | $ | 3,908,550 | ||||||||
For the years ended December 31, 2016 and 2015, the Fund did not have any significant transfers between any of the levels of the fair value hierarchy.
Note 5 - Derivative Instruments and Hedging Activities
In the normal course of business, the Fund utilizes derivative contracts in connection with its proprietary trading activities. Investments in derivative contracts are subject to additional risks that can result in a loss of all or part of an investment. The Fund’s derivative activities and exposure to derivative contracts are classified by the following primary underlying risks: interest rate, credit, commodity price, and equity price risks. In addition to its primary underlying risks, the Fund is also subject to additional counterparty risk due to inability of its counterparties to meet the terms of their contracts. For the years ended December 31, 2016 and 2015, the Fund invested only in commodity futures contracts.
Futures Contracts
The Fund is subject to commodity price risk in the normal course of pursuing its investment objectives. A futures contract represents a commitment for the future purchase or sale of an asset at a specified price on a specified date.
The purchase and sale of futures contracts requires margin deposits with a FCM. Subsequent payments (variation margin) are made or received by the Fund each day, depending on the daily fluctuations in the value of the contract, and are recorded as unrealized gains or losses by the Fund. Futures contracts may reduce the Fund’s exposure to counterparty risk since futures contracts are exchange-traded; and the exchange’s clearinghouse, as the counterparty to all exchange-traded futures, guarantees the futures against default.
The Commodity Exchange Act requires an FCM to segregate all customer transactions and assets from the FCM’s proprietary activities. A customer’s cash and other equity deposited with an FCM are considered commingled with all other customer funds subject to the FCM’s segregation requirements. In the event of an FCM’s insolvency, recovery may be limited to the Fund’s pro rata share of segregated customer funds available. It is possible that the recovery amount could be less than the total of cash and other equity deposited.
The following table discloses information about offsetting assets and liabilities presented in the statements of assets and liabilities to enable users of these financial statements to evaluate the effect or potential effect of netting arrangements for recognized assets and liabilities. These recognized assets and liabilities are presented as defined in FASB ASU No. 2011-11 “Balance Sheet (Topic 210): Disclosures about Offsetting Assets and Liabilities” and subsequently clarified in FASB ASU 2013-01 “Balance Sheet (Topic 210): Clarifying the Scope of Disclosures about Offsetting Assets and Liabilities.”
The following table also identifies the fair value amounts of derivative instruments included in the statements of assets and liabilities as derivative contracts, categorized by primary underlying risk and held by the FCM, ED&F Man as of December 31, 2016 and 2015.
Offsetting of Financial Liabilities and Derivative Liabilities as of December 31, 2016
| (i) | (ii) | (iii) = (i) – (ii) | (iv) | (v) = (iii) – (iv) | |||||||||||||||||
| Gross Amount Not Offset in the Statement of Assets and Liabilities | |||||||||||||||||||||
| Description | Gross Amount of Recognized Liabilities | Gross Amount Offset in the Statement of Assets and Liabilities | Net Amount Presented in the Statement of Assets and Liabilities | Futures Contracts Available for Offset | Collateral, Due from Broker | Net Amount | |||||||||||||||
| Commodity price | |||||||||||||||||||||
| Corn futures contracts | $ | 1,460,800 | $ | — | $ | 1,460,800 | $ | — | $ | 1,460,800 | $ | — | |||||||||
115
Offsetting of Financial Liabilities and Derivative Liabilities as of December 31, 2015
| (i) | (ii) | (iii) = (i) – (ii) | (iv) | (v) = (iii) – (iv) | |||||||||||||||||
| Gross Amount Not Offset in the Statement of Assets and Liabilities | |||||||||||||||||||||
| Description | Gross Amount of Recognized Liabilities | Gross Amount Offset in the Statement of Assets and Liabilities | Net Amount Presented in the Statement of Assets and Liabilities | Futures Contracts Available for Offset | Collateral, Due from Broker | Net Amount | |||||||||||||||
| Commodity price | |||||||||||||||||||||
| Corn futures contracts | $ | 3,908,550 | $ | — | $ | 3,908,550 | $ | — | $ | 3,908,550 | $ | — | |||||||||
The following is a summary of realized and net change in unrealized gains (losses) of the derivative instruments utilized by the Fund:
Year ended December 31, 2016
| Net Change in Unrealized | ||||||
| Realized Loss on | Appreciation or Depreciation on | |||||
| Commodity Futures Contracts | Commodity Futures Contacts | |||||
| Commodity Price | ||||||
| Corn futures contracts | $ | (9,438,913 | ) | $ | 2,447,750 | |
Year ended December 31, 2015
| Net Change in Unrealized | |||||||
| Realized Loss on | Appreciation or Depreciation on | ||||||
| Commodity Futures Contracts | Commodity Futures Contacts | ||||||
| Commodity Price | |||||||
| Corn futures contracts | $ | (8,533,650 | ) | $ | (5,660,263 | ) | |
Year ended December 31, 2014
| Net Change in Unrealized | |||||||
| Realized Loss on | Appreciation or Depreciation on | ||||||
| Commodity Futures Contracts | Commodity Futures Contacts | ||||||
| Commodity Price | |||||||
| Corn futures contracts | $ | (11,085,713 | ) | $ | 6,636,500 | ||
Volume of Derivative Activities
The average notional market value categorized by primary underlying risk for all futures contracts held was $71.6 million in 2016, $71 million in 2015 and $106.4 million in 2014.
Note 6 - Financial Highlights
The following table presents per share performance data and other supplemental financial data for the years ended December 31, 2016, 2015 and 2014. This information has been derived from information presented in the financial statements and is presented with total expenses gross of expenses waived by the Sponsor and with total expenses net of expenses waived by the Sponsor, as appropriate.
| Per Share Operation Performance | Year ended December 31, 2016 | Year ended December 31, 2015 | Year ended December 31, 2014 | |||||||||
| Net asset value at beginning of period | $ | 21.24 | $ | 26.62 | $ | 30.64 | ||||||
| From investment operations: | ||||||||||||
| Investment income | 0.11 | 0.05 | 0.01 | |||||||||
| Net realized and unrealized loss on commodity futures contracts | (1.75 | ) | (4.46 | ) | (3.01 | ) | ||||||
| Total net expenses | (0.83 | ) | (0.97 | ) | (1.02 | ) | ||||||
| Net decrease in net asset value | (2.47 | ) | (5.38 | ) | (4.02 | ) | ||||||
| Net asset value at end of period | $ | 18.77 | $ | 21.24 | $ | 26.62 | ||||||
| Total Return | (11.63 | )% | (20.21 | )% | (13.12 | )% | ||||||
| Ratios to Average Net Assets | ||||||||||||
| Total expenses | 4.74 | % | 4.15 | % | 3.37 | % | ||||||
| Total expense, net | 4.13 | % | 4.03 | % | 3.57 | % | ||||||
| Net investment loss | (3.58 | )% | (3.84 | )% | (3.54 | )% | ||||||
116
Effective in the third quarter 2015, the financial highlights per share data are calculated consistent with the methodology used to calculate asset-based fees and expenses. In prior periods, the financial highlights per share data are calculated using the average of the daily shares outstanding for the reporting period, which is inclusive of the last day of the period. Any change in methodology was not material to the ratios presented.
Note 7 – Quarterly Financial Data (Unaudited)
The following summarized quarterly financial information presents the results of operations for the Teucrium Corn Fund and other data for three-month periods ended March 31, June 30, September 30 and December 31, 2016 and 2015.
| First | Second | Third | Fourth | |||||||||||||
| Quarter 2016 | Quarter 2016 | Quarter 2016 | Quarter 2016 | |||||||||||||
| Total Income (Loss) | $ | (2,166,864 | ) | $ | 190,068 | $ | (5,440,285 | ) | $ | 822,596 | ||||||
| Total Expenses | $ | 773,352 | $ | 700,320 | $ | 878,103 | $ | 1,060,142 | ||||||||
| Total Expenses, net | $ | 773,352 | $ | 700,320 | $ | 743,942 | $ | 751,970 | ||||||||
| Net Income (Loss) | $ | (2,940,216 | ) | $ | (510,252 | ) | $ | (6,184,227 | ) | $ | 70,626 | |||||
| Net Income (Loss) per share | $ | (1.05 | ) | $ | 0.15 | $ | (1.63 | ) | $ | 0.06 | ||||||
| First | Second | Third | Fourth | |||||||||||||
| Quarter 2015 | Quarter 2015 | Quarter 2015 | Quarter 2015 | |||||||||||||
| Total (Loss) Income | $ | (5,644,150 | ) | $ | 4,832,415 | $ | (7,309,990 | ) | $ | (5,925,283 | ) | |||||
| Total Expenses | $ | 773,054 | $ | 767,280 | $ | 830,024 | $ | 862,174 | ||||||||
| Total Expenses, net | $ | 773,054 | $ | 767,280 | $ | 813,440 | $ | 782,690 | ||||||||
| Net (Loss) Income | $ | (6,417,204 | ) | $ | 4,065,135 | $ | (8,123,430 | ) | $ | (6,707,973 | ) | |||||
| Net (Loss) Income per share | $ | (1.87 | ) | $ | 1.13 | $ | (2.34 | ) | $ | (2.30 | ) | |||||
Note 8 - Organizational and Offering Costs
Expenses incurred in organizing of the Trust and the initial offering of the Shares of the Fund, including applicable SEC registration fees were borne directly by the Sponsor. The Fund will not be obligated to reimburse the Sponsor.
Note 9 – Subsequent Events
Management has evaluated the financial statements for the year-ended December 31, 2016 for subsequent events through the date of this filing and noted no material events requiring either recognition through the date of the filing or disclosure herein for the Fund.
117
Report of Independent Registered Public Accounting Firm
To the Sponsor and Shareholders of
Teucrium Soybean Fund
We have audited the accompanying statements of assets and liabilities of Teucrium Soybean Fund (the “Fund”), including the schedules of investments, as of December 31, 2016 and 2015, and the related statements of operations, changes in net assets, and cash flows for each of the three years in the period ended December 31, 2016. These financial statements are the responsibility of the Fund’s management. Our responsibility is to express an opinion on these financial statements based on our audits.
We conducted our audits in accordance with the standards of the Public Company Accounting Oversight Board (United States). Those standards require that we plan and perform the audit to obtain reasonable assurance about whether the financial statements are free of material misstatement. An audit includes examining, on a test basis, evidence supporting the amounts and disclosures in the financial statements. An audit also includes assessing the accounting principles used and significant estimates made by management, as well as evaluating the overall financial statement presentation. We believe that our audits provide a reasonable basis for our opinion.
In our opinion, the financial statements referred to above present fairly, in all material respects, the financial position of Teucrium Soybean Fund as of December 31, 2016 and 2015, and the results of its operations and its cash flows for each of the three years in the period ended December 31, 2016 in conformity with accounting principles generally accepted in the United States of America.
We also have audited, in accordance with the standards of the Public Company Accounting Oversight Board (United States), the Fund’s internal control over financial reporting as of December 31, 2016, based on criteria established in the 2013 Internal Control—Integrated Framework issued by the Committee of Sponsoring Organizations of the Treadway Commission (COSO), and our report dated March 16, 2017 expressed an unqualified opinion.
/s/ GRANT THORNTON LLP
New York, New York
March 16, 2017
118
Report of Independent Registered Public Accounting Firm
To the Sponsor and Shareholders of
Teucrium Soybean Fund
We have audited the internal control over financial reporting of Teucrium Soybean Fund (the “Fund”) as of December 31, 2016, based on criteria established in the 2013 Internal Control—Integrated Framework issued by the Committee of Sponsoring Organizations of the Treadway Commission (COSO). The Fund’s management is responsible for maintaining effective internal control over financial reporting and for its assessment of the effectiveness of internal control over financial reporting, included in the accompanying Management’s Report on Internal Control over Financial Reporting. Our responsibility is to express an opinion on the Fund’s internal control over financial reporting based on our audit.
We conducted our audit in accordance with the standards of the Public Company Accounting Oversight Board (United States). Those standards require that we plan and perform the audit to obtain reasonable assurance about whether effective internal control over financial reporting was maintained in all material respects. Our audit included obtaining an understanding of internal control over financial reporting, assessing the risk that a material weakness exists, testing and evaluating the design and operating effectiveness of internal control based on the assessed risk, and performing such other procedures as we considered necessary in the circumstances. We believe that our audit provides a reasonable basis for our opinion.
A fund’s internal control over financial reporting is a process designed to provide reasonable assurance regarding the reliability of financial reporting and the preparation of financial statements for external purposes in accordance with generally accepted accounting principles. A fund’s internal control over financial reporting includes those policies and procedures that (1) pertain to the maintenance of records that, in reasonable detail, accurately and fairly reflect the transactions and dispositions of the assets of the fund; (2) provide reasonable assurance that transactions are recorded as necessary to permit preparation of financial statements in accordance with generally accepted accounting principles, and that receipts and expenditures of the fund are being made only in accordance with authorizations of management and directors of the fund; and (3) provide reasonable assurance regarding prevention or timely detection of unauthorized acquisition, use, or disposition of the fund’s assets that could have a material effect on the financial statements.
Because of its inherent limitations, internal control over financial reporting may not prevent or detect misstatements. Also, projections of any evaluation of effectiveness to future periods are subject to the risk that controls may become inadequate because of changes in conditions, or that the degree of compliance with the policies or procedures may deteriorate.
In our opinion, the Fund maintained, in all material respects, effective internal control over financial reporting as of December 31, 2016, based on criteria established in the 2013 Internal Control—Integrated Framework issued by COSO.
We also have audited, in accordance with the standards of the Public Company Accounting Oversight Board (United States), the financial statements of the Fund as of and for the year ended December 31, 2016, and our report dated March 16, 2017 expressed an unqualified opinion on those financial statements.
/s/ GRANT THORNTON LLP
New York, New York
March 16, 2017
119
TEUCRIUM SOYBEAN FUND
STATEMENTS OF ASSETS AND LIABILITIES
| December 31, 2016 | December 31, 2015 | |||||||
| Assets | ||||||||
| Cash and cash equivalents | $ | 12,300,383 | $ | 5,937,824 | ||||
| Interest receivable | 38 | 51 | ||||||
| Restricted cash | 77,616 | 142,616 | ||||||
| Other assets | 4,104 | 49,618 | ||||||
| Equity in trading accounts: | ||||||||
| Commodity futures contracts | 357,500 | 16,175 | ||||||
| Due from broker | 170,973 | 604,666 | ||||||
| Total equity in trading accounts | 528,473 | 620,841 | ||||||
| Total assets | 12,910,614 | 6,750,950 | ||||||
| Liabilities | ||||||||
| Management fee payable to Sponsor | 11,891 | 5,908 | ||||||
| Other liabilities | 4,598 | 3,828 | ||||||
| Equity in trading accounts: | ||||||||
| Commodity futures contracts | 12,025 | 238,662 | ||||||
| Total liabilities | 28,514 | 248,398 | ||||||
| Net assets | $ | 12,882,100 | $ | 6,502,552 | ||||
| Shares outstanding | 675,004 | 375,004 | ||||||
| Net asset value per share | $ | 19.08 | $ | 17.34 | ||||
| Market value per share | $ | 19.10 | $ | 17.33 | ||||
The accompanying notes are an integral part of these financial statements.
120
TEUCRIUM SOYBEAN FUND
December 31, 2016
| Description: Assets | Fair Value | Percentage of Net Assets | Shares | |||||||||
| Cash equivalents | ||||||||||||
| Money market funds | ||||||||||||
| Fidelity Institutional Money Market Funds - Government Portfolio (cost $185,661) | $ | 185,661 | 1.44 | % | 185,661 | |||||||
| Notional Amount | ||||||||||||
| (Long Exposure) | ||||||||||||
| Commodity futures contracts | ||||||||||||
| United States soybean futures contracts | ||||||||||||
| CBOT soybean futures MAR17 (90 contracts) | $ | 107,125 | 0.83 | % | $ | 4,518,000 | ||||||
| CBOT soybean futures NOV17 (91 contracts) | 250,375 | 1.95 | 4,501,088 | |||||||||
| Total commodity futures contracts | $ | 357,500 | 2.78 | % | $ | 9,019,088 | ||||||
| Percentage of | Notional Amount | |||||||||||
| Description: Liabilities | Fair Value | Net Assets | (Long Exposure) | |||||||||
| Commodity futures contracts | ||||||||||||
| United States soybean futures contracts | ||||||||||||
| CBOT soybean futures MAY17 (76 contracts) | $ | 12,025 | 0.09 | % | $ | 3,847,500 | ||||||
The accompanying notes are an integral part of these financial statements.
121
TEUCRIUM SOYBEAN FUND
SCHEDULE OF INVESTMENTS
December 31, 2015
| Percentage of | ||||||||||||
| Description: Assets | Fair Value | Net Assets | Shares | |||||||||
| Cash equivalents | ||||||||||||
| Money market funds | ||||||||||||
| Fidelity Institutional Prime Money Market Portfolio (cost $161,718) | $ | 161,718 | 2.49 | % | 161,718 | |||||||
| Notional Amount | ||||||||||||
| Commodity futures contracts | (Long Exposure) | |||||||||||
| United States soybean futures contracts | ||||||||||||
| CBOT soybean futures MAY16 (45 contracts) | $ | 16,175 | 0.25 | % | $ | 1,956,375 | ||||||
| Percentage of | Notional Amount | |||||||||||
| Description: Liabilities | Fair Value | Net Assets | (Long Exposure) | |||||||||
| Commodity futures contracts | ||||||||||||
| United States soybean futures contracts | ||||||||||||
| CBOT soybean futures MAR16 (52 contracts) | $ | 30,075 | 0.46 | % | $ | 2,247,050 | ||||||
| CBOT soybean futures NOV16 (52 contracts) | 208,587 | 3.21 | 2,295,150 | |||||||||
| Total commodity futures contracts | $ | 238,662 | 3.67 | % | $ | 4,542,200 | ||||||
The accompanying notes are an integral part of these financial statements.
122
TEUCRIUM SOYBEAN FUND
| Year ended | Year ended | Year ended | ||||||||||
| December 31, 2016 | December 31, 2015 | December 31, 2014 | ||||||||||
| Income | ||||||||||||
| Realized and unrealized gain (loss) on trading of commodity futures contracts: | ||||||||||||
| Realized income (loss) on commodity futures contracts | $ | 939,088 | $ | (1,355,738 | ) | $ | (278,763 | ) | ||||
| Net change in unrealized appreciation or depreciation on commodity futures contracts | 567,962 | 54,526 | (88,150 | ) | ||||||||
| Interest income | 65,157 | 13,129 | 1,938 | |||||||||
| Total income (loss) | 1,572,207 | (1,288,083 | ) | (364,975 | ) | |||||||
| Expenses | ||||||||||||
| Management fees | 118,439 | 73,362 | 55,964 | |||||||||
| Professional fees | 113,387 | 148,286 | 92,777 | |||||||||
| Distribution and marketing fees | 218,086 | 117,180 | 61,258 | |||||||||
| Custodian fees and expenses | 34,515 | 146,752 | 5,811 | |||||||||
| Business permits and licenses fees | 18,288 | 16,608 | 22,120 | |||||||||
| General and administrative expenses | 32,260 | 21,654 | 10,923 | |||||||||
| Brokerage commissions | 1,507 | 6,043 | 2,376 | |||||||||
| Other expenses | 10,111 | 4,465 | 6,679 | |||||||||
| Total expenses | 546,593 | 534,350 | 257,908 | |||||||||
| Expenses waived by the Sponsor | (68,914 | ) | (304,609 | ) | (65,617 | ) | ||||||
| Reimbursement of expenses previously waived | — | — | 25,139 | |||||||||
| Total expenses, net | 477,679 | 229,741 | 217,430 | |||||||||
| Net income (loss) | $ | 1,094,528 | $ | (1,517,824 | ) | $ | (582,405 | ) | ||||
| Net income (loss) per share | $ | 1.74 | $ | (3.45 | ) | $ | (2.16 | ) | ||||
| Net income (loss) per weighted average share | $ | 1.76 | $ | (3.93 | ) | $ | (2.31 | ) | ||||
| Weighted average shares outstanding | 623,023 | 386,237 | 251,648 | |||||||||
The accompanying notes are an integral part of these financial statements.
123
TEUCRIUM SOYBEAN FUND
STATEMENTS OF CHANGES IN NET ASSETS
| Year ended | Year ended | Year ended | ||||||||||
| December 31, 2016 | December 31, 2015 | December 31, 2014 | ||||||||||
| Operations | ||||||||||||
| Net income (loss) | $ | 1,094,528 | $ | (1,517,824 | ) | $ | (582,405 | ) | ||||
| Capital transactions | ||||||||||||
| Issuance of Shares | 9,190,140 | 2,478,439 | 10,769,361 | |||||||||
| Redemption of Shares | (3,905,120 | ) | (6,414,212 | ) | (2,247,779 | ) | ||||||
| Total capital transactions | 5,285,020 | (3,935,773 | ) | 8,521,582 | ||||||||
| Net change in net assets | 6,379,548 | (5,453,597 | ) | 7,939,177 | ||||||||
| Net assets, beginning of period | $ | 6,502,552 | $ | 11,956,149 | $ | 4,016,972 | ||||||
| Net asset, end of period | $ | 12,882,100 | $ | 6,502,552 | $ | 11,956,149 | ||||||
| Net asset value per share at beginning of period | $ | 17.34 | $ | 20.79 | $ | 22.95 | ||||||
| Net asset value per share at end of period | $ | 19.08 | $ | 17.34 | $ | 20.79 | ||||||
| Creation of Shares | 500,000 | 125,000 | 500,000 | |||||||||
| Redemption of Shares | 200,000 | 325,000 | 100,000 | |||||||||
The accompanying notes are an integral part of these financial statements.
124
TEUCRIUM SOYBEAN FUND
| Year ended | Year ended | Year ended | ||||||||||
| December 31, 2016 | December 31, 2015 | December 31, 2014 | ||||||||||
| Cash flows from operating activities: | ||||||||||||
| Net income (loss) | $ | 1,094,528 | $ | (1,517,824 | ) | $ | (582,405 | ) | ||||
| Adjustments to reconcile net income (loss) to net cash provided by (used in) operating activities: | ||||||||||||
| Net change in unrealized appreciation or depreciation on commodity futures contracts | (567,962 | ) | (54,526 | ) | 88,150 | |||||||
| Changes in operating assets and liabilities: | ||||||||||||
| Due from broker | 433,693 | 97,434 | (301,348 | ) | ||||||||
| Interest receivable | 13 | 735 | (528 | ) | ||||||||
| Restricted cash | 65,000 | (142,616 | ) | — | ||||||||
| Other assets | 45,514 | (7,806 | ) | 3,688 | ||||||||
| Management fee payable to Sponsor | 5,983 | (4,538 | ) | 6,955 | ||||||||
| Other liabilities | 770 | (3,050 | ) | 3,903 | ||||||||
| Net cash provided by (used in) operating activities | 1,077,539 | (1,632,191 | ) | (781,585 | ) | |||||||
| Cash flows from financing activities: | ||||||||||||
| Proceeds from sale of Shares | 9,190,140 | 2,478,439 | 10,769,361 | |||||||||
| Redemption of Shares | (3,905,120 | ) | (6,414,212 | ) | (2,247,779 | ) | ||||||
| Net cash provided by (used in) financing activities | 5,285,020 | (3,935,773 | ) | 8,521,582 | ||||||||
| Net change in cash and cash equivalents | 6,362,559 | (5,567,964 | ) | 7,739,997 | ||||||||
| Cash and cash equivalents, beginning of period | 5,937,824 | 11,505,788 | 3,765,791 | |||||||||
| Cash and cash equivalents, end of period | $ | 12,300,383 | $ | 5,937,824 | $ | 11,505,788 | ||||||
The accompanying notes are an integral part of these financial statements.
125
December 31, 2016
Note 1 – Organization and Operation
Teucrium Soybean Fund (referred to herein as “SOYB” or the “Fund”) is a commodity pool that is a series of Teucrium Commodity Trust (“Trust”), a Delaware statutory trust formed on September 11, 2009. The Fund issues common units, called the “Shares,” representing fractional undivided beneficial interests in the Fund. The Fund continuously offers Creation Baskets consisting of 25,000 Shares at their Net Asset Value (“NAV”) to “Authorized Purchasers” through Foreside Fund Services, LLC, which is the distributor for the Fund (the “Distributor”). Authorized Purchasers sell such Shares, which are listed on the New York Stock Exchange (“NYSE”) Arca under the symbol “SOYB,” to the public at per-Share offering prices that reflect, among other factors, the trading price of the Shares on the NYSE Arca, the NAV of the Fund at the time the Authorized Purchaser purchased the Creation Baskets and the NAV at the time of the offer of the Shares to the public, the supply of and demand for Shares at the time of sale, and the liquidity of the markets for soybean interests. The Fund’s Shares trade in the secondary market on the NYSE Arca at prices that are lower or higher than their NAV per Share.
The investment objective of SOYB is to have the daily changes in percentage terms of the Shares’ NAV reflect the daily changes in percentage terms of a weighted average of the closing settlement prices for three futures contracts for soybeans (“Soybean Futures Contracts”) that are traded on the CBOT. The three Soybean Futures Contracts will generally be: (1) second-to-expire CBOT Soybean Futures Contract, weighted 35%, (2) the third-to-expire CBOT Soybean Futures Contract, weighted 30%, and (3) the CBOT Soybean Futures Contract expiring in the November following the expiration month of the third-to-expire contract, weighted 35%.
The Fund commenced investment operations on September 19, 2011 and has a fiscal year ending December 31. The Fund’s sponsor is Teucrium Trading, LLC (the “Sponsor”). The Sponsor is responsible for the management of the Fund. The Sponsor is a member of the National Futures Association (the “NFA”) and became a commodity pool operator registered with the Commodity Futures Trading Commission (the “CFTC”) effective November 10, 2009.
On June 17, 2011, the Fund’s initial registration of 10,000,000 shares on Form S-1 was declared effective by the SEC. On September 19, 2011, the Fund listed its shares on the NYSE Arca under the ticker symbol “SOYB.” On the business day prior to that, the Fund issued 100,000 shares in exchange for $2,500,000 at the Fund’s initial NAV of $25 per share. The Fund also commenced investment operations on September 19, 2011 by purchasing soybean commodity futures contracts traded on the CBOT. On December 31, 2010, the Fund had four shares outstanding, which were owned by the Sponsor. On June 30, 2014, a subsequent registration statement for SOYB was declared effective by the SEC.
Subject to the terms of the Trust Agreement, Teucrium Trading, LLC, in its capacity as the Sponsor (“Sponsor”), may terminate a Fund at any time, regardless of whether the Fund has incurred losses, including, for instance, if it determines that the Fund’s aggregate net assets in relation to its operating expenses make the continued operation of the Fund unreasonable or imprudent. However, no level of losses will require the Sponsor to terminate a Fund.
Note 2 – Principal Contracts and Agreements
On August 17, 2015 (the “Conversion Date”), U.S. Bank N.A. replaced The Bank of New York Mellon as the Custodian for the Fund. The principal business address for U.S. Bank N.A. is 1555 North Rivercenter Drive, Suite 302, Milwaukee, Wisconsin 53212. U.S. Bank N.A. is a Wisconsin state chartered bank subject to regulation by the Board of Governors of the Federal Reserve System and the Wisconsin State Banking Department. The principal address for U.S. Bancorp Fund Services, LLC (“USBFS”), is 777 East Wisconsin Avenue, Milwaukee, WI, 53202. In addition, effective on the Conversion Date, USBFS, a wholly owned subsidiary of U.S. Bank, commenced serving as administrator for each Fund, performing certain administrative and accounting services and preparing certain SEC reports on behalf of the Funds, and also became the registrar and transfer agent for each Fund’s Shares. For such services, U.S. Bank and USBFS will receive an asset-based fee, subject to a minimum annual fee.
Given this conversion, the Sponsor has, for the year-ended December 31, 2015, reflected an expense, before and after fees waived by the Sponsor, for fees associated with Custodian, Fund Administration and Transfer Agent services (“Custodian Fees”) that have or will be paid to the Bank of New York Mellon by a Fund or by the Sponsor on behalf of a Fund.
For custody services, the Funds will pay to U.S. Bank N.A. 0.0075% of average gross assets up to $1 billion, and .0050% of average gross assets over $1 billion, annually, plus certain per-transaction charges. For Transfer Agency, Fund Accounting and Fund Administration services, which are based on the total assets for all the Funds in the Trust, the Funds will pay to USBFS 0.06% of average gross assets on the first $250 million, 0.05% on the next $250 million, 0.04% on the next $500 million and 0.03% on the balance over $1 billion annually. A combined minimum annual fee of up to $64,500 for custody, transfer agency, accounting and administrative services is assessed per Fund. For the year ended December 31, 2015, such expenses include both the fees for the Bank of New York Mellon and USBFS. For the years ended December 31, the Fund recognized $34,515 in 2016, $146,752 in 2015 and $5,811 in 2014, respectively, for these services, which is recorded in custodian fees and expenses on the statements of operations; of this expense $0 in 2016, $146,752 in 2015 and $1,140 in 2014 were waived by the Sponsor.
The Sponsor and the Trust employ Foreside Fund Services, LLC (“Foreside” or the “Distributor”) as the Distributor for the Funds. The Distribution Services Agreement among the Distributor, the Sponsor and the Trust calls for the Distributor to work with the Custodian in connection with the receipt and processing of orders for Creation Baskets and Redemption Baskets and the review and approval of all Fund sales literature and advertising materials. The Distributor and the Sponsor have also entered into a Securities Activities and Service Agreement (the “SASA”) under which certain employees and officers of the Sponsor are licensed as registered representatives or registered principals of the Distributor, under Financial Industry Regulatory Authority (“FINRA”) rules. For its services as the Distributor, Foreside receives a fee of 0.01% of the Fund’s average daily net assets and an aggregate annual fee of $100,000 for all Teucrium Funds, along with certain expense reimbursements. For its services under the SASA, Foreside receives a fee of $5,000 per registered representative and $1,000 per registered location. For the years ended December 31, the Fund recognized $13,720 in 2016, $11,704 in 2015 and $5,621 in 2014, respectively, for these services, which is recorded in distribution and marketing fees on the statements of operations; of this expense $0 in 2016, $6,242 in 2015 and $1,943 in 2014 were waived by the Sponsor.
126
For the year ended December 31, 2014, Newedge USA, LLC (“Newedge USA”) served as the Funds’ futures commission merchant (“FCM”) and primary clearing broker to execute and clear the Funds’ futures transactions and provide other brokerage-related services. In 2014, the Funds introduced the use of Jefferies LLC (“Jefferies”), for the execution and clearing of the Funds’ futures and options, if any, on futures transactions. On January 2, 2015, Newedge USA, LLC (“Newedge USA”) merged with and into SG Americas Securities, LLC (“SG”), with the latter as the surviving entity. On February 6, 2015 Jefferies LLC (“Jefferies”) became the Funds’ FCM and primary clearing broker. All futures contracts held by SG were transferred to Jefferies on that date. As of February 23, 2015 all residual cash balances held at SG had been transferred to Jefferies and the balance in all SG accounts was $0. Effective June 3, 2015, ED&F Man Capital Markets Inc. (“ED&F Man”) replaced Jefferies as the Underlying Funds’ FCM and the clearing broker to execute and clear the Underlying Fund’s futures and provide other brokerage-related services. As of June 4, 2015 all futures contracts and residual cash balances held at Jefferies had been transferred to ED&F Man and the balance in all Jefferies accounts was $0.
Currently, ED&F Man serves as the Underlying Funds’ clearing broker to execute and clear the Underlying Funds’ futures and provide other brokerage-related services. ED&F Man is registered as a FCM with the U.S. CFTC and is a member of the NFA. ED&F Man is also registered as a broker/dealer with the U.S. Securities and Exchange Commission and is a member of the FINRA. ED&F Man is a clearing member of ICE Futures U.S., Inc., Chicago Board of Trade, Chicago Mercantile Exchange, New York Mercantile Exchange, and all other major United States commodity exchanges. For Corn, Soybean, Sugar and Wheat Futures Contracts ED&F Man, Jefferies and SG were paid $8.00 per round turn in 2015 and 2014. Effective January 1, 2016, ED&F Man, increased the per round-term charge for futures contracts commission to $9.00. For the years ended December 31, the Fund recognized $1,507 in 2016, $6,043 in 2015 and $2,376 in 2014, respectively, for these services, which is recorded in brokerage commissions on the statements of operations and was paid by the Fund.
The sole Trustee of the Trust is Wilmington Trust Company, a Delaware banking corporation. The Trustee will accept service of legal process on the Trust in the State of Delaware and will make certain filings under the Delaware Statutory Trust Act. For its services, the Trustee receives an annual fee of $3,300 from the Trust. For the years ended December 31, the Fund recognized $257 in 2016, $403 in 2015 and $104 in 2014, respectively, for these services, which is recorded in business permits and licenses fees on the statements of operations; of this expense $257 in 2016, $403 in 2015 and $0 in 2014 was waived by the Sponsor.
Note 3 – Summary of Significant Accounting Policies
Basis of Presentation
The accompanying financial statements have been prepared in accordance with accounting principles generally accepted in the United States of America (“U.S. GAAP”) as detailed in the Financial Accounting Standards Board’s Accounting Standards Codification.
Revenue Recognition
Commodity futures contracts are recorded on the trade date. All such transactions are recorded on the identified cost basis and marked to market daily. Unrealized appreciation or depreciation on commodity futures contracts are reflected in the statements of assets and liabilities as the difference between the original contract amount and the fair market value as of the last business day of the year or as of the last date of the financial statements. Changes in the appreciation or depreciation between periods are reflected in the statements of operations. Interest on cash equivalents and deposits with the Futures Commission Merchant are recognized on the accrual basis. The Fund earns interest on its assets denominated in U.S. dollars on deposit with the Futures Commission Merchant. In addition, the Fund earns interest on funds held at the custodian at prevailing market rates for such investments.
Brokerage Commissions
Brokerage commissions on all open commodity futures contracts are accrued on the trade date and on a full-turn basis.
Income Taxes
For tax purposes, the Fund will be treated as a partnership. The Fund does not record a provision for income taxes because the shareholders report their share of the Fund’s income or loss on their income tax returns. The financial statements reflect the Fund’s transactions without adjustment, if any, required for income tax purposes.
The Fund is required to determine whether a tax position is more likely than not to be sustained upon examination by the applicable taxing authority, including resolution of any related appeals or litigation processes, based on the technical merits of the position. The Fund files an income tax return in the U.S. federal jurisdiction, and may file income tax returns in various U.S. states and foreign jurisdictions. For all tax years 2013 to 2016, the Fund remains subject to income tax examinations by major taxing authorities. The tax benefit recognized is measured as the largest amount of benefit that has a greater than fifty percent likelihood of being realized upon ultimate settlement. De-recognition of a tax benefit previously recognized results in the Fund recording a tax liability that reduces net assets. Based on its analysis, the Fund has determined that it has not incurred any liability for unrecognized tax benefits as of and for the years ended December 31, 2016, 2015, 2014 and 2013. However, the Fund’s conclusions regarding this policy may be subject to review and adjustment at a later date based on factors including, but not limited to, ongoing analysis of and changes to tax laws, regulations, and interpretations thereof.
127
The Fund recognizes interest accrued related to unrecognized tax benefits and penalties related to unrecognized tax benefits in income tax fees payable, if assessed. No interest expense or penalties have been recognized as of and for the years ended December 31, 2016, 2015 and 2014.
The Fund may be subject to potential examination by U.S. federal, U.S. state, or foreign jurisdictional authorities in the area of income taxes. These potential examinations may include questioning the timing and amount of deductions, the nexus of income among various tax jurisdictions, and compliance with U.S. federal, U.S. state and foreign tax laws. The Fund’s management does not expect that the total amount of unrecognized tax benefits will materially change over the next twelve months.
Creations and Redemptions
Authorized Purchasers may purchase Creation Baskets consisting of 25,000 shares from the Fund. The amount of the proceeds required to purchase a Creation Basket will be equal to the NAV of the shares in the Creation Basket determined as of 4:00 p.m. New York time on the day the order to create the basket is properly received.
Authorized Purchasers may redeem shares from the Fund only in blocks of 25,000 shares called “Redemption Baskets.” The amount of the redemption proceeds for a Redemption Basket will be equal to the NAV of the shares in the Redemption Basket determined as of 4:00 p.m. New York time on the day the order to redeem the basket is properly received.
The Fund receives or pays the proceeds from shares sold or redeemed within three business days after the trade date of the purchase or redemption. The amounts due from Authorized Purchasers are reflected in the Fund’s statements of assets and liabilities as receivable for shares sold. Amounts payable to Authorized Purchasers upon redemption are reflected in the Fund’s statements of assets and liabilities as payable for shares redeemed.
As outlined in the most recent Form S-1 filing, 50,000 shares represents two Redemption Baskets for the Fund and a minimum level of shares.
Allocation of Shareholder Income and Losses
Profit or loss is allocated among the shareholders of the Fund in proportion to the number of shares each shareholder holds as of the close of each month.
Cash and Cash Equivalents
Cash equivalents are highly-liquid investments with maturity dates of 90 days or less when acquired. The Fund reported its cash equivalents in the statements of assets and liabilities at market value, or at carrying amounts that approximate fair value, because of their highly-liquid nature and short-term maturities. The Fund has these balances of its assets on deposit with banks. The Fund had a balance of $185,661 and $161,718 in money market funds at December 31, 2016 and December 31, 2015, respectively; these balances are included in cash and cash equivalents on the statements of assets and liabilities. Effective in the second quarter 2015, the Sponsor invested a portion of the available cash for the Fund in alternative demand-deposit savings accounts, which is classified as cash and not as a cash equivalent. The Fund had a balance of $12,115,082 in demand-deposit savings accounts as of December 31, 2016. This change resulted in a reduction in the balance held in money market funds. Assets deposited with the bank may, at times, exceed federally insured limits.
Restricted Cash
On August 17, 2015 (the “Conversion Date”), U.S. Bank N.A. replaced The Bank of New York Mellon as the Custodian for the Funds. Per the amended agreement between the Sponsor and The Bank of New York Mellon dated August 14, 2015, certain cash amounts for each Fund, except in the case of TAGS, are to remain at The Bank of New York Mellon until amounts for services and early termination fees are paid. The amended agreement allows for payments for such amounts owed to be made through December 31, 2017. Cash balances that are held in custody at The Bank of New York Mellon under this amended agreement are reflected on the statements of assets and liabilities of the Fund and the Trust as restricted cash.
Due from/to Broker
The amount recorded by the Fund for the amount due from and to the clearing broker includes, but is not limited to, cash held by the broker, amounts payable to the clearing broker related to open transactions and payables for commodities futures accounts liquidating to an equity balance on the clearing broker’s records.
Margin is the minimum amount of funds that must be deposited by a commodity interest trader with the trader’s broker to initiate and maintain an open position in futures contracts. A margin deposit acts to assure the trader’s performance of the futures contracts purchased or sold. Futures contracts are customarily bought and sold on initial margin that represents a very small percentage of the aggregate purchase or sales price of the contract. Because of such low margin requirements, price fluctuations occurring in the futures markets may create profits and losses that, in relation to the amount invested, are greater than are customary in other forms of investment or speculation. As discussed below, adverse price changes in the futures contract may result in margin requirements that greatly exceed the initial margin. In addition, the amount of margin required in connection with a particular futures contract is set from time to time by the exchange on which the contract is traded and may be modified from time to time by the exchange during the term of the contract. Brokerage firms, such as the Fund’s clearing brokers, carrying accounts for traders in commodity interest contracts generally require higher amounts of margin as a matter of policy to further protect themselves. Over-the-counter trading generally involves the extension of credit between counterparties, so the counterparties may agree to require the posting of collateral by one or both parties to address credit exposure.
128
When a trader purchases an option, there is no margin requirement; however, the option premium must be paid in full. When a trader sells an option, on the other hand, he or she is required to deposit margin in an amount determined by the margin requirements established for the underlying interest and, in addition, an amount substantially equal to the current premium for the option. The margin requirements imposed on the selling of options, although adjusted to reflect the probability that out-of-the-money options will not be exercised, can in fact be higher than those imposed in dealing in the futures markets directly. Complicated margin requirements apply to spreads and conversions, which are complex trading strategies in which a trader acquires a mixture of options positions and positions in the underlying interest.
Ongoing or “maintenance” margin requirements are computed each day by a trader’s clearing broker. When the market value of a particular open futures contract changes to a point where the margin on deposit does not satisfy maintenance margin requirements, a margin call is made by the broker. If the margin call is not met within a reasonable time, the broker may close out the trader’s position. With respect to the Fund’s trading, the Fund (and not its shareholders personally) is subject to margin calls.
Finally, many major U.S. exchanges have passed certain cross margining arrangements involving procedures pursuant to which the futures and options positions held in an account would, in the case of some accounts, be aggregated and margin requirements would be assessed on a portfolio basis, measuring the total risk of the combined positions.
Calculation of Net Asset Value
The Fund’s NAV is calculated by:
| ● | Taking the current market value of its total assets and |
| ● | Subtracting any liabilities. |
The administrator, USBFS, calculates the NAV of the Fund once each trading day. It calculates the NAV as of the earlier of the close of the NYSE or 4:00 p.m. New York time. The NAV for a particular trading day is released after 4:15 p.m. New York time.
In determining the value of Soybean Futures Contracts, the administrator uses the CBOT closing price. The administrator determines the value of all other Fund investments as of the earlier of the close of the NYSE or 4:00 p.m. New York time. The value of over-the-counter soybean interests is determined based on the value of the commodity or futures contract underlying such soybean interest, except that a fair value may be determined if the Sponsor believes that the Fund is subject to significant credit risk relating to the counterparty to such soybean interest. For purposes of financial statements and reports, the Sponsor will recalculate the NAV where necessary to reflect the “fair value” of a Futures Contract when the Futures Contract closes at its price fluctuation limit for the day. Treasury securities held by the Fund are valued by the administrator using values received from recognized third-party vendors and dealer quotes. NAV includes any unrealized profit or loss on open soybean interests and any other income or expense accruing to the Fund but unpaid or not received by the Fund.
Sponsor Fee, Allocation of Expenses and Related Party Transactions
The Sponsor is responsible for investing the assets of the Fund in accordance with the objectives and policies of the Fund. In addition, the Sponsor arranges for one or more third parties to provide administrative, custodial, accounting, transfer agency and other necessary services to the Trust and the Funds. In addition, the Sponsor elected not to outsource services directly attributable to the Trust and the Funds such as accounting, financial reporting, regulatory compliance and trading activities. In addition, the Fund is contractually obligated to pay a monthly management fee to the Sponsor, based on average daily net assets, at a rate equal to 1.00% per annum.
The Fund generally pays for all brokerage fees, taxes and other expenses, including licensing fees for the use of intellectual property, registration or other fees paid to the SEC, FINRA, formerly the National Association of Securities Dealers, or any other regulatory agency in connection with the offer and sale of subsequent Shares after its initial registration and all legal, accounting, printing and other expenses associated therewith. The Fund also pays its portion of the fees and expenses associated with the Trust’s tax accounting and reporting requirements. Certain aggregate expenses common to all Funds within the Trust are allocated by the Sponsor to the respective funds based on activity drivers deemed most appropriate by the Sponsor for such expenses, including but not limited to relative assets under management and creation and redeem order activity.
These aggregate common expenses include, but are not limited to, legal, auditing, accounting and financial reporting, tax-preparation, regulatory compliance, trading activities, and insurance costs, as well as fees paid to the Distributor, which are included in the related line item in the statements of operations. A portion of these aggregate common expenses are related to the Sponsor or related parties of principals of the Sponsor; these are necessary services to the Funds, which are primarily the cost of performing accounting and financial reporting, regulatory compliance, and trading activities that are directly attributable to the Fund. For the years ended December 31, the Fund recognized $169,614 in 2016, $124,331 in 2015 and $49,492 in 2014, respectively, such expenses, which are primarily included as distribution and marketing fees on the statements of operations; of these amounts $10,720 in 2016, $49,086 in 2015 and $12,915 in 2014 were waived by the Sponsor. All asset-based fees and expenses for the Funds are calculated on the prior day’s net assets.
129
For the year ended December 31, 2016, there were $68,914 of expenses that were identified on the statements of operations of the Fund as expenses that were waived by the Sponsor. The Sponsor has determined that there would be no recovery sought for these amounts in any future period.
For the year ended December 31, 2015, there were $304,609 of expenses that were identified on the statements of operations of the Fund as expenses that were waived by the Sponsor. The Sponsor has determined that there would be no recovery sought for these amounts in any future period.
For the year ended December 31, 2014, there were $65,617 of expenses that were identified on the statements of operations of the Fund as expenses that were waived by the Sponsor. The Sponsor has determined that there would be no recovery sought for these amounts in any future period.
For the year ended December 31, 2013, there were $68,857 of expenses recorded in the financial statements of the Sponsor which were subject to reimbursement by SOYB in 2014. At that time, the Sponsor had determined that recovery of the expense amounts was not probable. In 2014, asset growth and other changes experienced by SOYB enabled the Sponsor to claim reimbursement of $25,139 from the Fund. This amount is reflected in the statements of operations as a reimbursement of previously waived expenses.
Use of Estimates
The preparation of financial statements in conformity with U.S. GAAP requires management to make estimates and assumptions that affect the reported amount of assets and liabilities and disclosure of contingent assets and liabilities at the date of the financial statements, and the reported amounts of the revenue and expenses during the reporting period. Actual results could differ from those estimates.
Fair Value - Definition and Hierarchy
In accordance with U.S. GAAP, fair value is defined as the price that would be received to sell an asset or paid to transfer a liability (i.e., the “exit price”) in an orderly transaction between market participants at the measurement date.
In determining fair value, the Fund uses various valuation approaches. In accordance with U.S. GAAP, a fair value hierarchy for inputs is used in measuring fair value that maximizes the use of observable inputs and minimizes the use of unobservable inputs by requiring that the most observable inputs be used when available. Observable inputs are those that market participants would use in pricing the asset or liability based on market data obtained from sources independent of the Fund. Unobservable inputs reflect the Fund’s assumptions about the inputs market participants would use in pricing the asset or liability developed based on the best information available in the circumstances. The fair value hierarchy is categorized into three levels based on the inputs as follows:
Level 1 - Valuations based on unadjusted quoted prices in active markets for identical assets or liabilities that the Fund has the ability to access. Valuation adjustments and block discounts are not applied to Level 1 financial instruments. Since valuations are based on quoted prices that are readily and regularly available in an active market, valuation of these financial instruments does not entail a significant degree of judgment.
Level 2 - Valuations based on quoted prices in markets that are not active or for which all significant inputs are observable, either directly or indirectly.
Level 3 - Valuations based on inputs that are unobservable and significant to the overall fair value measurement.
The availability of valuation techniques and observable inputs can vary from financial instrument to financial instrument and is affected by a wide variety of factors including, the type of financial instrument, whether the financial instrument is new and not yet established in the marketplace, and other characteristics particular to the transaction. To the extent that valuation is based on models or inputs that are less observable or unobservable in the market, the determination of fair value requires more judgment. Those estimated values do not necessarily represent the amounts that may be ultimately realized due to the occurrence of future circumstances that cannot be reasonably determined. Because of the inherent uncertainty of valuation, those estimated values may be materially higher or lower than the values that would have been used had a ready market for the financial instruments existed. Accordingly, the degree of judgment exercised by the Fund in determining fair value is greatest for financial instruments categorized in Level 3. In certain cases, the inputs used to measure fair value may fall into different levels of the fair value hierarchy. In such cases, for disclosure purposes, the level in the fair value hierarchy, within which the fair value measurement in its entirety falls, is determined based on the lowest level input that is significant to the fair value measurement.
Fair value is a market-based measure considered from the perspective of a market participant rather than an entity-specific measure. Therefore, even when market assumptions are not readily available, the Fund’s own assumptions are set to reflect those that market participants would use in pricing the asset or liability at the measurement date. The Fund uses prices and inputs that are current as of the measurement date, including periods of market dislocation. In periods of market dislocation, the observability of prices and inputs may be reduced for many financial instruments. This condition could cause a financial instrument to be reclassified to a lower level within the fair value hierarchy. When such a situation exists on a quarter close, the Sponsor will calculate the NAV on a particular day using the Level 1 valuation, but will later recalculate the NAV for the impacted Fund based upon the valuation inputs from these alternative verifiable sources (Level 2 or Level 3) and will report such NAV in its applicable financial statements and reports.
130
On December 31, 2016 and 2015, in the opinion of the Trust and the Fund, the reported value of the Soybean Futures Contracts traded on the CBOT fairly reflected the value of the Soybean Futures Contracts held by the Fund, with no adjustments necessary. The determination is made as of the settlement of the futures contracts on the last day of trading for the reporting period. In making the determination of a Level 1 or Level 2 transfer, the Fund considers the average volume of the specific underlying futures contracts traded on the relevant exchange for the years being reported.
For the years ended December 31, 2016 and 2015, the Fund did not have any significant transfers between any of the levels of the fair value hierarchy.
The Fund records its derivative activities at fair value. Gains and losses from derivative contracts are included in the statements of operations. Derivative contracts include futures contracts related to commodity prices. Futures, which are listed on a national securities exchange, such as the CBOT and the ICE, or reported on another national market, are generally categorized in Level 1 of the fair value hierarchy. OTC derivatives contracts (such as forward and swap contracts) which may be valued using models, depending on whether significant inputs are observable or unobservable, are categorized in Levels 2 or 3 of the fair value hierarchy.
Expenses
Expenses are recorded using the accrual method of accounting.
Net Income (Loss) per Share
Net income (loss) per Share is the difference between the NAV per unit at the beginning of each period and at the end of each period. The weighted average number of Shares outstanding was computed for purposes of disclosing net income (loss) per weighted average Share. The weighted average Shares are equal to the number of Shares outstanding at the end of the period, adjusted proportionately for Shares created or redeemed based on the amount of time the Shares were outstanding during such period.
New Accounting Pronouncements
The Financial Accounting Standards Board (“FASB”) issued Accounting Standards Update (“ASU”) 2016-19, “Technical Corrections and Improvements”. The amendments in this update represent changes to clarify, correct errors, or make minor improvements to the Accounting Standards Codification. The amendments make the Accounting Standards Codification easier to understand and easier to apply by eliminating inconsistencies and providing clarifications. The amendments are effective for fiscal years, and interim periods with those fiscal years, for all entities beginning after December 15, 2016. The adoption did not have a material impact on the financial statements and disclosures of the Trust or the Fund.
The FASB issued ASU 2016-18, “Statement of Cash Flows (Topic 230)”. The amendments in this update require that a statement of cash flows explain the change during the period in the total of cash, cash equivalents, and amounts generally described as restricted cash or restricted cash equivalents. Therefore, amounts generally described as restricted cash and restricted cash equivalents should be included with cash and cash equivalents when reconciling the beginning-of-period and end-of-period total amounts shown on the statement of cash flows. The amendments are effective for fiscal years beginning after December 15, 2017, and interim periods within those fiscal years. This update is not expected to have a material impact on the financial statements and disclosures of the Trust or the Fund. The Sponsor believes there will be a change in presentation of restricted cash on the statements of cash flows.
The FASB issued ASU 2016-17, “Consolidation (Topic 810): Interests Held through Related Parties That are under Common Control”. The amendments in this update alters how a decision maker needs to consider indirect interests in a variable interest entity (VIE) held through an entity under common control. The new guidance amends ASU 2015-02, Consolidation (Topic 810): Amendments to the Consolidation Analysis, issued in February 2015. The amendments are effective for fiscal years beginning after December 15, 2016, including interim periods within those fiscal years. The adoption did not have a material impact on the financial statements and disclosures of the Trust or the Fund.
The FASB issued ASU 2016-15, “Statement of Cash Flows (Topic 230): Classification of Certain Cash Receipts and Cash Payments”. The amendments provide cash flow statement classification guidance. The amendments in this update are effective for fiscal years beginning after December 15, 2017. The Trust and the Funds are currently evaluating the impact on the financial statements and disclosures. The Trust and the Fund do not expect to adopt the guidance until the effective date.
The FASB issued ASU 2014-09 in May 2014, “Revenue from Contracts with Customers (Topic 606),” which replaces the revenue recognition requirements of “Revenue Recognition (Topic 605).” This ASU is based on the principle that revenue is recognized to depict the transfer of goods and services to customers in an amount that reflects the consideration to which the entity expects to be entitled in exchange for those goods or services. This ASU provides new and more detailed guidance on specific topics and expands and improves disclosures about revenue. In August 2015, the FASB issued ASU 2015-14 which defers the effective date of ASU 2014-09 by one year to fiscal years beginning after December 15, 2017. ASU 2015-14 also permits early adoption of ASU 2014-09, but not before the original effective date, which was for fiscal years beginning after December 15, 2016. The Trust and the Fund record income or loss from the recognition and measurement of futures contracts and from interest income under Subtopic 825-10. Revenue from financial instruments which are valued under Subtopic 825 will not be subject to the application of ASU 2014-09 and 2015-14. Therefore, these standards will not apply or have a material impact on the financial statements and disclosures of the Trust or the Fund.
131
The FASB issued ASU 2016-11, “Revenue Recognition (Topic 605) and Derivatives and Hedging (Topic 815): Rescission of SEC Guidance Because of Accounting Standards Updates 2014-09 and 2014-16 Pursuant to Staff Announcements at the March 3, 2016 EITF Meeting”. The amendments make targeted improvements to clarify the principal versus agent assessment and are intended to make the guidance more operable and lead to more consistent application. The Trust and the Fund record income or loss from the recognition and measurement of futures contracts and from interest income under Subtopic 825-10. Revenue from financial instruments which are valued under Subtopic 825 will not be subject to the application of ASU 2016-11. Therefore, this standard will not apply or have a material impact on the financial statements and disclosures of the Trust or the Fund.
The FASB issued ASU 2016-02, “Leases (Topic 842).” The amendments in this update increase transparency and comparability among organizations by recognizing lease assets and lease liabilities on the balance sheet and disclosing key information about leasing arrangements. The amendments in this update are effective for fiscal years beginning after December 15, 2018. This update is not expected to have a material impact on the financial statements and disclosures of the Trust or the Fund.
The FASB issued ASU 2016-01, “Financial Instruments-Overall (Subtopic 825-10): Recognition and Measurement of Financial Assets and Financial Liabilities.” The amendments in this update are intended to improve the recognitions measurement and disclosure of financial instruments. The amendments to this update are effective for fiscal years beginning after December 15, 2017, and interim periods within those fiscal years. These amendments are required to be applied prospectively. The Trust and the Fund are currently evaluating the impact on the financial statements and disclosures; but based on our review to date we do not expect the update will have a material impact on the financial statements and disclosures of the Trust or the Fund.
The FASB issued ASU 2015-10, “Technical Corrections and Improvements.” The amendments in this update represent changes to clarify the Codification, correct unintended application of guidance, or make minor improvements to the Codification that are not expected to have a significant effect on current accounting practice or create a significant administrative cost to most entities. The amendments are effective for fiscal years beginning after December 15, 2015. The adoption did not have a material impact on the financial statements and disclosures of the Trust or the Fund.
The FASB issued ASU 2015-07, “Fair Value Measurement (Topic 820): Disclosures for Investments in Certain Entities That Calculate Net Asset Value per Share (or Its Equivalent).” The ASU amends ASC 820 to create a practical expedient to measure the fair value of investments in certain entities that do not have a quoted market price but calculate net asset value per share or its equivalent. In addition, the amendments to ASC 820 provide guidance on classifying investments that are measured using the practical expedient in the fair value hierarchy and require specific disclosures for eligible investments, regardless of whether the practical expedient has been applied. The amendments in this Update are effective for fiscal years beginning after December 15, 2015, and interim periods within those fiscal years. These amendments are required to be applied retrospectively to all periods presented. The adoption did not have a material impact on the financial statements and disclosures of the Trust or the Fund.
The FASB issued ASU 2015-06, “Earnings per Share (Topic 260): Effects on Historical Earnings per Unit of Master Limited Partnership Dropdown Transactions.” The amendments specify how earnings (losses) of a transferred business before the date of a dropdown transaction should be allocated to the various interest holders in a master limited partnership for purposes of calculating earning per unit under the two-class method. The amendments to this update are effective for fiscal years beginning after December 15, 2015, and interim periods within those fiscal years. The amendments are required to be applied retrospectively for all periods presented. The adoption did not have a material impact on the financial statements and disclosures of the Trust or the Fund.
The FASB issued ASU 2015-02, “Consolidation (Topic 810): Amendments to the Consolidation Analysis.” The amendments are intended to improve targeted areas of consolidation guidance for legal entities such as limited partnerships, limited liability corporations, and securitization structures. The amendments to this update are effective for periods beginning after December 15, 2015. These amendments are required to be applied retrospectively for all periods presented. The adoption did not have a material impact on the financial statements and disclosures of the Trust or the Fund.
The FASB issued ASU 2014-08, “Presentation of Financial Statements (Topic 205) and Property, Plant, and Equipment (Topic 360): Reporting Discontinued Operations and Disclosures of Disposals of Components of an Entity.” The amendments in this update change the requirements for reporting discontinued operations in Subtopic 2015-20. A significant provision of ASU 2014-08 calls for reporting as discontinued operations only those disposals that represent a strategic shift or have a major impact on the entity’s financial results and operations. The Company elected to early adopt this ASU for the year ended December 31, 2014, the adoption did not have a significant impact on the financial statements and disclosures of the Fund.
132
Note 4 – Fair Value Measurements
The Fund’s assets and liabilities recorded at fair value have been categorized based upon a fair value hierarchy as described in the Fund’s significant accounting policies in Note 3. The following table presents information about the Fund’s assets and liabilities measured at fair value as of December 31, 2016 and December 31, 2015:
December 31, 2016
| Balance as of | ||||||||||||||||
| Assets: | Level 1 | Level 2 | Level 3 | December 31, 2016 | ||||||||||||
| Cash equivalents | $ | 185,661 | $ | — | $ | — | $ | 185,661 | ||||||||
| Soybean futures contracts | 357,500 | — | — | 357,500 | ||||||||||||
| Total | $ | 543,161 | $ | — | $ | — | $ | 543,161 | ||||||||
| Balance as of | ||||||||||||||||
| Liabilities: | Level 1 | Level 2 | Level 3 | December 31, 2016 | ||||||||||||
| Soybean futures contracts | $ | 12,025 | $ | — | $ | — | $ | 12,025 | ||||||||
December 31, 2015
| Balance as of | ||||||||||||||||
| Assets: | Level 1 | Level 2 | Level 3 | December 31, 2015 | ||||||||||||
| Cash equivalents | $ | 161,718 | $ | — | $ | — | $ | 161,718 | ||||||||
| Soybean futures contracts | 16,175 | — | — | 16,175 | ||||||||||||
| Total | $ | 177,893 | $ | — | $ | — | $ | 177,893 | ||||||||
| Balance as of | ||||||||||||||||
| Liabilities: | Level 1 | Level 2 | Level 3 | December 31, 2015 | ||||||||||||
| Soybean futures contracts | $ | 238,662 | $ | — | $ | — | $ | 238,662 | ||||||||
For the years ended December 31, 2016 and 2015, the Fund did not have any significant transfers between any of the levels of the fair value hierarchy.
Note 5 - Derivative Instruments and Hedging Activities
In the normal course of business, the Fund utilizes derivative contracts in connection with its proprietary trading activities. Investments in derivative contracts are subject to additional risks that can result in a loss of all or part of an investment. The Fund’s derivative activities and exposure to derivative contracts are classified by the following primary underlying risks: interest rate, credit, commodity price, and equity price risks. In addition to its primary underlying risks, the Fund is also subject to additional counterparty risk due to inability of its counterparties to meet the terms of their contracts. For years ended December 31, 2016 and 2015, the Fund invested only in commodity futures contracts.
Futures Contracts
The Fund is subject to commodity price risk in the normal course of pursuing its investment objectives. A futures contract represents a commitment for the future purchase or sale of an asset at a specified price on a specified date.
The purchase and sale of futures contracts requires margin deposits with a FCM. Subsequent payments (variation margin) are made or received by the Fund each day, depending on the daily fluctuations in the value of the contract, and are recorded as unrealized gains or losses by the Fund. Futures contracts may reduce the Fund’s exposure to counterparty risk since futures contracts are exchange-traded; and the exchange’s clearinghouse, as the counterparty to all exchange-traded futures, guarantees the futures against default.
The Commodity Exchange Act requires an FCM to segregate all customer transactions and assets from the FCM’s proprietary activities. A customer’s cash and other equity deposited with an FCM are considered commingled with all other customer funds subject to the FCM’s segregation requirements. In the event of an FCM’s insolvency, recovery may be limited to the Fund’s pro rata share of segregated customer funds available. It is possible that the recovery amount could be less than the total of cash and other equity deposited.
The following table discloses information about offsetting assets and liabilities presented in the statements of assets and liabilities to enable users of these financial statements to evaluate the effect or potential effect of netting arrangements for recognized assets and liabilities. These recognized assets and liabilities are presented as defined in FASB ASU No. 2011-11 “Balance Sheet (Topic 210): Disclosures about Offsetting Assets and Liabilities” and subsequently clarified in FASB ASU 2013-01 “Balance Sheet (Topic 210): Clarifying the Scope of Disclosures about Offsetting Assets and Liabilities.”
133
The following table also identifies the fair value amounts of derivative instruments included in the statements of assets and liabilities as derivative contracts, categorized by primary underlying risk and held by the FCM, ED&F Man as of December 31, 2016 and 2015.
Offsetting of Financial Assets and Derivative Assets as of December 31, 2016
| (i) | (ii) | (iii) = (i) – (ii) | (iv) | (v) = (iii) – (iv) | ||||||||||||||
| Gross Amount Not Offset in the Statement of Assets and Liabilities |
||||||||||||||||||
| Description | Gross Amount of Recognized Assets |
Gross Amount Offset in the Statement of Assets and Liabilities |
Net Amount Presented in the Statement of Assets and Liabilities |
Futures Contracts Available for Offset |
Collateral, Due to Broker |
Net Amount | ||||||||||||
| Commodity price | ||||||||||||||||||
| Soybean futures contracts | $ | 357,500 | $ | — | $ | 357,500 | $ | 12,025 | $ | — | $ | 345,475 | ||||||
Offsetting of Financial Liabilities and Derivative Liabilities as of December 31, 2016
| (i) | (ii) | (iii) = (i) – (ii) | (iv) | (v) = (iii) – (iv) | ||||||||||||||
| Gross Amount Not Offset in the Statement of Assets and Liabilities |
||||||||||||||||||
| Description | Gross Amount of Recognized Liabilities |
Gross Amount Offset in the Statement of Assets and Liabilities |
Net Amount Presented in the Statement of Assets and Liabilities |
Futures Contracts Available for Offset |
Collateral, Due from Broker |
Net Amount | ||||||||||||
| Commodity price | ||||||||||||||||||
| Soybean futures contracts | $ | 12,025 | $ | — | $ | 12,025 | $ | 12,025 | $ | — | $ | — | ||||||
Offsetting of Financial Assets and Derivative Assets as of December 31, 2015
| (i) | (ii) | (iii) = (i) – (ii) | (iv) | (v) = (iii) – (iv) | ||||||||||||||
| Gross Amount Not Offset in the Statement of Assets and Liabilities |
||||||||||||||||||
| Description | Gross Amount of Recognized Assets |
Gross Amount Offset in the Statement of Assets and Liabilities |
Net Amount Presented in the Statement of Assets and Liabilities |
Futures Contracts Available for Offset |
Collateral, Due to Broker |
Net Amount | ||||||||||||
| Commodity price | ||||||||||||||||||
| Soybean futures contracts | $ | 16,175 | $ | — | $ | 16,175 | $ | 16,175 | $ | — | $ | — | ||||||
Offsetting of Financial Liabilities and Derivative Liabilities as of December 31, 2015
| (i) | (ii) | (iii) = (i) – (ii) | (iv) | (v) = (iii) – (iv) | ||||||||||||||
| Gross Amount Not Offset in the Statement of Assets and Liabilities |
||||||||||||||||||
| Description | Gross Amount of Recognized Liabilities |
Gross Amount Offset in the Statement of Assets and Liabilities |
Net Amount Presented in the Statement of Assets and Liabilities |
Futures Contracts Available for Offset |
Collateral, Due from Broker |
Net Amount | ||||||||||||
| Commodity price | ||||||||||||||||||
| Soybean futures contracts | $ | 238,662 | $ | — | $ | 238,662 | $ | 16,175 | $ | 222,487 | $ | — | ||||||
The following is a summary of realized and net change in unrealized gains (losses) of the derivative instruments utilized by the Fund:
Year ended December 31, 2016
| Net Change in Unrealized | ||||||
| Realized Gain on | Appreciation or Depreciation on | |||||
| Commodity Futures Contracts | Commodity Futures Contacts | |||||
| Commodity Price | ||||||
| Soybean futures contracts | $ | 939,088 | $ | 567,962 | ||
Year ended December 31, 2015
| Net Change in Unrealized | ||||||
| Realized Loss on | Appreciation or Depreciation on | |||||
| Commodity Futures Contracts | Commodity Futures Contacts | |||||
| Commodity Price | ||||||
| Soybean futures contracts | $ | (1,355,738 | ) | $ | 54,526 | |
134
Year ended December 31, 2014
| Net Change in Unrealized | ||||||
| Realized Loss on | Appreciation or Depreciation on | |||||
| Commodity Futures Contracts | Commodity Futures Contacts | |||||
| Commodity Price | ||||||
| Soybean futures contracts | $ | (278,763) | $ | (88,150) | ||
Volume of Derivative Activities
The average notional market value categorized by primary underlying risk for all futures contracts held was $12.1 million in 2016, $7.1 million in 2015 and $7.9 million in 2014.
Note 6 - Financial Highlights
The following table presents per share performance data and other supplemental financial data for the years ended December 31, 2016, 2015 and 2014. This information has been derived from information presented in the financial statements and is presented with total expenses gross of expenses waived by the Sponsor and with total expenses net of expenses waived by the Sponsor, as appropriate.
| Per Share Operation Performance | Year ended December 31, 2016 | Year ended December 31, 2015 | Year ended December 31, 2014 | |||||||||
| Net asset value at beginning of period | $ | 17.34 | $ | 20.79 | $ | 22.95 | ||||||
| From investment operations: | ||||||||||||
| Investment income | 0.10 | 0.03 | 0.01 | |||||||||
| Net realized and unrealized gain (loss) on commodity futures contracts | 2.41 | (2.89 | ) | (1.31 | ) | |||||||
| Total net expenses | (0.77 | ) | (0.59 | ) | (0.86 | ) | ||||||
| Net increase (decrease) in net asset value | 1.74 | (3.45 | ) | (2.16 | ) | |||||||
| Net asset value at end of period | $ | 19.08 | $ | 17.34 | $ | 20.79 | ||||||
| Total Return | 10.03 | % | (16.59 | )% | (9.41 | )% | ||||||
| Ratios to Average Net Assets | ||||||||||||
| Total expenses | 4.61 | % | 7.31 | % | 4.59 | % | ||||||
| Total expense, net | 4.03 | % | 3.14 | % | 3.87 | % | ||||||
| Net investment loss | (3.48 | )% | (2.96 | )% | (3.83 | )% | ||||||
Effective in the third quarter 2015, the financial highlights per share data are calculated consistent with the methodology used to calculate asset-based fees and expenses. In prior periods, the financial highlights per share data are calculated using the average of the daily shares outstanding for the reporting period, which is inclusive of the last day of the period. Any change in methodology was not material to the ratios presented.
Note 7 – Quarterly Financial Data (Unaudited)
The following summarized quarterly financial information presents the results of operations for the Teucrium Soybean Fund and other data for three-month periods ended March 31, June 30, September 30 and December 31, 2016 and 2015.
| First | Second | Third | Fourth | |||||||||||||
| Quarter 2016 | Quarter 2016 | Quarter 2016 | Quarter 2016 | |||||||||||||
| Total Income (Loss) | $ | 456,077 | $ | 2,124,042 | $ | (1,566,866 | ) | $ | 558,954 | |||||||
| Total Expenses | $ | 86,484 | $ | 122,710 | $ | 189,647 | $ | 147,752 | ||||||||
| Total Expenses, net | $ | 86,484 | $ | 122,710 | $ | 126,534 | $ | 141,951 | ||||||||
| Net Income (Loss) | $ | 369,593 | $ | 2,001,332 | $ | (1,693,400 | ) | $ | 417,003 | |||||||
| Net Income (Loss) per share | $ | 0.68 | $ | 3.35 | $ | (2.84 | ) | $ | 0.55 | |||||||
| First | Second | Third | Fourth | |||||||||||||
| Quarter 2015 | Quarter 2015 | Quarter 2015 | Quarter 2015 | |||||||||||||
| Total (Loss) Income | $ | (526,088 | ) | $ | 387,766 | $ | (974,019 | ) | $ | (175,741 | ) | |||||
| Total Expenses | $ | 92,839 | $ | 112,600 | $ | 199,526 | $ | 129,385 | ||||||||
| Total Expenses, net | $ | 43,689 | $ | 47,578 | $ | 69,975 | $ | 68,499 | ||||||||
| Net (Loss) Income | $ | (569,777 | ) | $ | 340,188 | $ | (1,043,994 | ) | $ | (244,241 | ) | |||||
| Net (Loss) Income per share | $ | (1.17 | ) | $ | 0.98 | $ | (2.62 | ) | $ | (0.64 | ) | |||||
Note 8 - Organizational and Offering Costs
Expenses incurred in organizing of the Trust and the initial offering of the Shares of the Fund, including applicable SEC registration fees were borne directly by the Sponsor. The Fund will not be obligated to reimburse the Sponsor.
135
Note 9 – Subsequent Events
Management has evaluated the financial statements for the period-ended December 31, 2016 for subsequent events through the date of this filing and noted no material events requiring either recognition through the date of the filing or disclosure herein for the Fund other than those noted below:
As of this filing, $13,000 of cash that had been held in custody at The Bank of New York Mellon was transferred to the Fund’s account at U.S. Bank. The balance for Restricted Cash is $61,068 as of this filing.
136
Report of Independent Registered Public Accounting Firm
To the Sponsor and Shareholders of
Teucrium Sugar Fund
We have audited the accompanying statements of assets and liabilities of Teucrium Sugar Fund (the “Fund”), including the schedules of investments, as of December 31, 2016 and 2015, and the related statements of operations, changes in net assets, and cash flows for each of the three years in the period ended December 31, 2016. These financial statements are the responsibility of the Fund’s management. Our responsibility is to express an opinion on these financial statements based on our audits.
We conducted our audits in accordance with the standards of the Public Company Accounting Oversight Board (United States). Those standards require that we plan and perform the audit to obtain reasonable assurance about whether the financial statements are free of material misstatement. An audit includes examining, on a test basis, evidence supporting the amounts and disclosures in the financial statements. An audit also includes assessing the accounting principles used and significant estimates made by management, as well as evaluating the overall financial statement presentation. We believe that our audits provide a reasonable basis for our opinion.
In our opinion, the financial statements referred to above present fairly, in all material respects, the financial position of Teucrium Sugar Fund as of December 31, 2016 and 2015, and the results of its operations and its cash flows for each of the three years in the period ended December 31, 2016 in conformity with accounting principles generally accepted in the United States of America.
We also have audited, in accordance with the standards of the Public Company Accounting Oversight Board (United States), the Fund’s internal control over financial reporting as of December 31, 2016, based on criteria established in the 2013 Internal Control—Integrated Framework issued by the Committee of Sponsoring Organizations of the Treadway Commission (COSO), and our report dated March 16, 2017 expressed an unqualified opinion.
/s/ GRANT THORNTON LLP
New York, New York
March 16, 2017
137
Report of Independent Registered Public Accounting Firm
To the Sponsor and Shareholders of
Teucrium Sugar Fund
We have audited the internal control over financial reporting of Teucrium Sugar Fund (the “Fund”) as of December 31, 2016, based on criteria established in the 2013 Internal Control—Integrated Framework issued by the Committee of Sponsoring Organizations of the Treadway Commission (COSO). The Fund’s management is responsible for maintaining effective internal control over financial reporting and for its assessment of the effectiveness of internal control over financial reporting, included in the accompanying Management’s Report on Internal Control over Financial Reporting. Our responsibility is to express an opinion on the Fund’s internal control over financial reporting based on our audit.
We conducted our audit in accordance with the standards of the Public Company Accounting Oversight Board (United States). Those standards require that we plan and perform the audit to obtain reasonable assurance about whether effective internal control over financial reporting was maintained in all material respects. Our audit included obtaining an understanding of internal control over financial reporting, assessing the risk that a material weakness exists, testing and evaluating the design and operating effectiveness of internal control based on the assessed risk, and performing such other procedures as we considered necessary in the circumstances. We believe that our audit provides a reasonable basis for our opinion.
A fund’s internal control over financial reporting is a process designed to provide reasonable assurance regarding the reliability of financial reporting and the preparation of financial statements for external purposes in accordance with generally accepted accounting principles. A fund’s internal control over financial reporting includes those policies and procedures that (1) pertain to the maintenance of records that, in reasonable detail, accurately and fairly reflect the transactions and dispositions of the assets of the fund; (2) provide reasonable assurance that transactions are recorded as necessary to permit preparation of financial statements in accordance with generally accepted accounting principles, and that receipts and expenditures of the fund are being made only in accordance with authorizations of management and directors of the fund; and (3) provide reasonable assurance regarding prevention or timely detection of unauthorized acquisition, use, or disposition of the fund’s assets that could have a material effect on the financial statements.
Because of its inherent limitations, internal control over financial reporting may not prevent or detect misstatements. Also, projections of any evaluation of effectiveness to future periods are subject to the risk that controls may become inadequate because of changes in conditions, or that the degree of compliance with the policies or procedures may deteriorate.
In our opinion, the Fund maintained, in all material respects, effective internal control over financial reporting as of December 31, 2016, based on criteria established in the 2013 Internal Control—Integrated Framework issued by COSO.
We also have audited, in accordance with the standards of the Public Company Accounting Oversight Board (United States), the financial statements of the Fund as of and for the year ended December 31, 2016, and our report dated March 16, 2017 expressed an unqualified opinion on those financial statements.
/s/ GRANT THORNTON LLP
New York, New York
March 16, 2017
138
STATEMENTS OF ASSETS AND LIABILITIES
| December 31, 2016 | December 31, 2015 | |||||||
| Assets | ||||||||
| Cash and cash equivalents | $ | 5,016,531 | $ | 4,932,791 | ||||
| Interest receivable | 51 | 49 | ||||||
| Restricted cash | 74,068 | 142,457 | ||||||
| Other assets | 4,435 | 11,942 | ||||||
| Equity in trading accounts: | ||||||||
| Commodity futures contracts | 185,147 | 364,056 | ||||||
| Due from broker | 565,281 | 58,431 | ||||||
| Total equity in trading accounts | 750,428 | 422,487 | ||||||
| Total assets | 5,845,513 | 5,509,726 | ||||||
| Liabilities | ||||||||
| Other liabilities | — | 1,063 | ||||||
| Equity in trading accounts: | ||||||||
| Commodity futures contracts | 331,542 | — | ||||||
| Total liabilities | 331,542 | 1,063 | ||||||
| Net assets | $ | 5,513,971 | $ | 5,508,663 | ||||
| Shares outstanding | 425,004 | 550,004 | ||||||
| Net asset value per share | $ | 12.97 | $ | 10.02 | ||||
| Market value per share | $ | 13.00 | $ | 10.06 | ||||
The accompanying notes are an integral part of these financial statements.
139
TEUCRIUM SUGAR FUND
December 31, 2016
| Percentage of | ||||||||||||
| Description: Assets | Fair Value | Net Assets | Shares | |||||||||
| Cash equivalents | ||||||||||||
| Money market funds | ||||||||||||
| Fidelity Institutional Money Market Funds - Government Portfolio (cost $125,182) | $ | 125,182 | 2.27 | % | 125,182 | |||||||
| Notional Amount | ||||||||||||
| (Long Exposure) | ||||||||||||
| Commodity futures contracts | ||||||||||||
| United States sugar futures contracts | ||||||||||||
| ICE sugar futures MAR18 (93 contracts) | $ | 185,147 | 3.36 | % | $ | 1,935,293 | ||||||
| Percentage of | Notional Amount | |||||||||||
| Description: Liabilities | Fair Value | Net Assets | (Long Exposure) | |||||||||
| Commodity futures contracts | ||||||||||||
| United States sugar futures contracts | ||||||||||||
| ICE sugar futures MAY17 (89 contracts) | $ | 105,829 | 1.92 | % | $ | 1,918,840 | ||||||
| ICE sugar futures JUL17 (79 contracts) | 225,713 | 4.09 | 1,667,848 | |||||||||
| Total commodity futures contracts | $ | 331,542 | 6.01 | % | $ | 3,586,688 | ||||||
The accompanying notes are an integral part of these financial statements.
140
TEUCRIUM SUGAR FUND
SCHEDULE OF INVESTMENTS
December 31, 2015
| Percentage of | ||||||||||||
| Description: Assets | Fair Value | Net Assets | Shares | |||||||||
| Cash equivalents | ||||||||||||
| Money market funds | ||||||||||||
| Fidelity Institutional Prime Money Market Portfolio (cost $297,460) | $ | 297,460 | 5.40 | % | 297,460 | |||||||
| Notional Amount | ||||||||||||
| (Long Exposure) | ||||||||||||
| Commodity futures contracts | ||||||||||||
| United States sugar futures contracts | ||||||||||||
| ICE sugar futures MAY16 (115 contracts) | $ | 151,973 | 2.76 | % | $ | 1,921,696 | ||||||
| ICE sugar futures JUL16 (101 contracts) | 199,517 | 3.62 | 1,656,077 | |||||||||
| ICE sugar futures MAR17 (114 contracts) | 12,566 | 0.23 | 1,927,968 | |||||||||
| Total commodity futures contracts | $ | 364,056 | 6.61 | % | $ | 5,505,741 | ||||||
The accompanying notes are an integral part of these financial statements.
141
TEUCRIUM SUGAR FUND
| Year ended | Year ended | Year ended | ||||||||||
| December 31, 2016 | December 31, 2015 | December 31, 2014 | ||||||||||
| Income | ||||||||||||
| Realized and unrealized gain (loss) on trading of commodity futures contracts: | ||||||||||||
| Realized gain (loss) on commodity futures contracts | $ | 1,967,694 | $ | (1,279,891 | ) | $ | (131,410 | ) | ||||
| Net change in unrealized appreciation or depreciation on commodity futures contracts | (510,451 | ) | 868,011 | (320,555 | ) | |||||||
| Interest income | 32,048 | 7,670 | 813 | |||||||||
| Total income (loss) | 1,489,291 | (404,210 | ) | (451,152 | ) | |||||||
| Expenses | ||||||||||||
| Management fees | 56,277 | 35,486 | 27,285 | |||||||||
| Professional fees | 46,951 | 65,660 | 71,226 | |||||||||
| Distribution and marketing fees | 115,498 | 55,723 | 37,936 | |||||||||
| Custodian fees and expenses | 18,575 | 139,745 | 3,965 | |||||||||
| Business permits and licenses fees | 18,524 | 15,726 | 13,066 | |||||||||
| General and administrative expenses | 17,542 | 8,732 | 12,278 | |||||||||
| Brokerage commissions | 8,681 | 4,000 | 3,000 | |||||||||
| Other expenses | 6,261 | 2,751 | 2,350 | |||||||||
| Total expenses | 288,309 | 327,823 | 171,106 | |||||||||
| Expenses waived by the Sponsor | (148,281 | ) | (256,227 | ) | (119,696 | ) | ||||||
| Total expenses, net | 140,028 | 71,596 | 51,410 | |||||||||
| Net income (loss) | $ | 1,349,263 | $ | (475,806 | ) | $ | (502,562 | ) | ||||
| Net income (loss) income per share | $ | 2.95 | $ | (1.81 | ) | $ | (2.27 | ) | ||||
| Net income (loss) income per weighted average share | $ | 2.66 | $ | (1.28 | ) | $ | (2.56 | ) | ||||
| Weighted average shares outstanding | 507,654 | 373,018 | 195,963 | |||||||||
The accompanying notes are an integral part of these financial statements.
142
TEUCRIUM SUGAR FUND
STATEMENTS OF CHANGES IN NET ASSETS
| Year ended | Year ended | Year ended | ||||||||||
| December 31, 2016 | December 31, 2015 | December 31, 2014 | ||||||||||
| Operations | ||||||||||||
| Net income (loss) | $ | 1,349,263 | $ | (475,806 | ) | $ | (502,562 | ) | ||||
| Capital transactions | ||||||||||||
| Issuance of Shares | 2,805,578 | 3,767,602 | 1,067,083 | |||||||||
| Redemption of Shares | (4,149,533 | ) | (444,345 | ) | (371,712 | ) | ||||||
| Total capital transactions | (1,343,955 | ) | 3,323,257 | 695,371 | ||||||||
| Net change in net assets | 5,308 | 2,847,451 | 192,809 | |||||||||
| Net assets, beginning of period | $ | 5,508,663 | $ | 2,661,212 | $ | 2,468,403 | ||||||
| Net assets, end of period | $ | 5,513,971 | $ | 5,508,663 | $ | 2,661,212 | ||||||
| Net asset value per share at beginning of period | $ | 10.02 | $ | 11.83 | $ | 14.10 | ||||||
| At end of period | $ | 12.97 | $ | 10.02 | $ | 11.83 | ||||||
| Creation of Shares | 250,000 | 375,000 | 75,000 | |||||||||
| Redemption of Shares | 375,000 | 50,000 | 25,000 | |||||||||
The accompanying notes are an integral part of these financial statements.
143
TEUCRIUM SUGAR FUND
| Year ended | Year ended | Year ended | ||||||||||
| December 31, 2016 | December 31, 2015 | December 31, 2014 | ||||||||||
| Cash flows from operating activities: | ||||||||||||
| Net income (loss) | $ | 1,349,263 | $ | (475,806 | ) | $ | (502,562 | ) | ||||
| Adjustments to reconcile net income (loss) to net cash provided by (used in) operating activities: | ||||||||||||
| Net change in unrealized appreciation or depreciation on commodity futures contracts | 510,451 | (868,011 | ) | 320,555 | ||||||||
| Changes in operating assets and liabilities: | ||||||||||||
| Due from broker | (506,850 | ) | 591,700 | (388,444 | ) | |||||||
| Interest receivable | (2 | ) | 124 | (14 | ) | |||||||
| Restricted cash | 68,389 | (142,457 | ) | — | ||||||||
| Other assets | 7,507 | 14,077 | (2,376 | ) | ||||||||
| Other liabilities | (1,063 | ) | 569 | 431 | ||||||||
| Net cash provided by (used in) operating activities | 1,427,695 | (879,804 | ) | (572,410 | ) | |||||||
| Cash flows from financing activities: | ||||||||||||
| Proceeds from sale of Shares | 2,805,578 | 3,767,602 | 1,067,083 | |||||||||
| Redemption of Shares | (4,149,533 | ) | (444,345 | ) | (371,712 | ) | ||||||
| Net cash (used in) provided by financing activities | (1,343,955 | ) | 3,323,257 | 695,371 | ||||||||
| Net change in cash and cash equivalents | 83,740 | 2,443,453 | 122,961 | |||||||||
| Cash and cash equivalents, beginning of period | 4,932,791 | 2,489,338 | 2,366,377 | |||||||||
| Cash and cash equivalents, end of period | $ | 5,016,531 | $ | 4,932,791 | $ | 2,489,338 | ||||||
The accompanying notes are an integral part of these financial statements.
144
December 31, 2016
Note 1 – Organization and Operation
Teucrium Sugar Fund (referred to herein as “CANE” or the “Fund”) is a commodity pool that is a series of Teucrium Commodity Trust (“Trust”), a Delaware statutory trust formed on September 11, 2009. The Fund issues common units, called the “Shares,” representing fractional undivided beneficial interests in the Fund. The Fund continuously offers Creation Baskets consisting of 25,000 Shares at their Net Asset Value (“NAV”) to “Authorized Purchasers” through Foreside Fund Services, LLC, which is the distributor for the Fund (the “Distributor”). Authorized Purchasers sell such Shares, which are listed on the New York Stock Exchange (“NYSE”) Arca under the symbol “CANE,” to the public at per-Share offering prices that reflect, among other factors, the trading price of the Shares on the NYSE Arca, the NAV of the Fund at the time the Authorized Purchaser purchased the Creation Baskets and the NAV at the time of the offer of the Shares to the public, the supply of and demand for Shares at the time of sale, and the liquidity of the markets for sugar interests. The Fund’s Shares trade in the secondary market on the NYSE Arca at prices that are lower or higher than their NAV per Share.
The investment objective of CANE is to have the daily changes in percentage terms of the Shares’ NAV reflect the daily changes in percentage terms of a weighted average of the closing settlement prices for three futures contracts for sugar (“Sugar Futures Contracts”) that are traded on ICE Futures US (“ICE Futures”), specifically: (1) the second-to-expire Sugar No. 11 Futures Contract (a “Sugar No. 11 Futures Contract”), weighted 35%, (2) the third-to-expire Sugar No. 11 Futures Contract, weighted 30%, and (3) the Sugar No. 11 Futures Contract expiring in the March following the expiration month of the third-to-expire contract, weighted 35%.
The Fund commenced investment operations on September 19, 2011 and has a fiscal year ending December 31. The Fund’s sponsor is Teucrium Trading, LLC (the “Sponsor”). The Sponsor is responsible for the management of the Fund. The Sponsor is a member of the National Futures Association (the “NFA”) and became a commodity pool operator registered with the Commodity Futures Trading Commission (the “CFTC”) effective November 10, 2009.
On June 17, 2011, the Fund’s initial registration of 10,000,000 shares on Form S-1 was declared effective by the U.S. Securities and Exchange Commission (“SEC”). On September 19, 2011, the Fund listed its shares on the NYSE Arca under the ticker symbol “CANE.” On the business day prior to that, the Fund issued 100,000 shares in exchange for $2,500,000 at the Fund’s initial NAV of $25 per share. The Fund also commenced investment operations on September 19, 2011 by purchasing commodity futures contracts traded on ICE. On December 31, 2010, the Fund had four shares outstanding, which were owned by the Sponsor. On June 30, 2014, a subsequent registration statement for CANE was declared effective by the SEC.
Subject to the terms of the Trust Agreement, Teucrium Trading, LLC, in its capacity as the Sponsor (“Sponsor”), may terminate a Fund at any time, regardless of whether the Fund has incurred losses, including, for instance, if it determines that the Fund’s aggregate net assets in relation to its operating expenses make the continued operation of the Fund unreasonable or imprudent. However, no level of losses will require the Sponsor to terminate a Fund.
Note 2 – Principal Contracts and Agreements
On August 17, 2015 (the “Conversion Date”), U.S. Bank N.A. replaced The Bank of New York Mellon as the Custodian for the Fund. The principal business address for U.S. Bank N.A. is 1555 North Rivercenter Drive, Suite 302, Milwaukee, Wisconsin 53212. U.S. Bank N.A. is a Wisconsin state chartered bank subject to regulation by the Board of Governors of the Federal Reserve System and the Wisconsin State Banking Department. The principal address for U.S. Bancorp Fund Services, LLC (“USBFS”), is 777 East Wisconsin Avenue, Milwaukee, WI, 53202. In addition, effective on the Conversion Date, USBFS, a wholly owned subsidiary of U.S. Bank, commenced serving as administrator for each Fund, performing certain administrative and accounting services and preparing certain SEC reports on behalf of the Funds, and also became the registrar and transfer agent for each Fund’s Shares. For such services, U.S. Bank and USBFS will receive an asset-based fee, subject to a minimum annual fee.
Given this conversion, the Sponsor has, for the year-ended December 31, 2015, reflected an expense, before and after fees waived by the Sponsor, for fees associated with Custodian, Fund Administration and Transfer Agent services (“Custodian Fees”) that have or will be paid to the Bank of New York Mellon by a Fund or by the Sponsor on behalf of a Fund.
For custody services, the Funds will pay to U.S. Bank N.A. 0.0075% of average gross assets up to $1 billion, and .0050% of average gross assets over $1 billion, annually, plus certain per-transaction charges. For Transfer Agency, Fund Accounting and Fund Administration services, which are based on the total assets for all the Funds in the Trust, the Funds will pay to USBFS 0.06% of average gross assets on the first $250 million, 0.05% on the next $250 million, 0.04% on the next $500 million and 0.03% on the balance over $1 billion annually. A combined minimum annual fee of up to $64,500 for custody, transfer agency, accounting and administrative services is assessed per Fund. For the year ended December 31, 2015, such expenses include both the fees for the Bank of New York Mellon and USBFS. For the years ended December 31, the Fund recognized $18,575 in 2016, $139,745 in 2015 and $3,965 in 2014, respectively, for these services, which is recorded in custodian fees and expenses on the statements of operations; of this expense $13,118 in 2016, $139,745 in 2015 and $3,965 in 2014 was waived by the Sponsor.
The Sponsor and the Trust employ Foreside Fund Services, LLC as the Distributor for the Funds. The Distribution Services Agreement among the Distributor, the Sponsor and the Trust calls for the Distributor to work with the Custodian in connection with the receipt and processing of orders for Creation Baskets and Redemption Baskets and the review and approval of all Fund sales literature and advertising materials. The Distributor and the Sponsor have also entered into a Securities Activities and Service Agreement (the “SASA”) under which certain employees and officers of the Sponsor are licensed as registered representatives or registered principals of the Distributor, under FINRA rules. For its services as the Distributor, Foreside receives a fee of 0.01% of the Fund’s average daily net assets and an aggregate annual fee of $100,000 for all Teucrium Funds, along with certain expense reimbursements. For its services under the SASA, Foreside receives a fee of $5,000 per registered representative and $1,000 per registered location. For the years ended December 31, the Fund recognized $8,094 in 2016, $4,354 in 2015 and $2,842 in 2014, respectively, for these services, which is recorded in distribution and marketing fees on the statements of operations; of this expense $5,535 in 2016, $2,770 in 2015 and $2,842 in 2014 was waived by the Sponsor.
145
For the year ended December 31, 2014, Newedge USA, LLC (“Newedge USA”) served as the Funds’ futures commission merchant (“FCM”) and primary clearing broker to execute and clear the Funds’ futures transactions and provide other brokerage-related services. In 2014, the Funds introduced the use of Jefferies LLC (“Jefferies”), for the execution and clearing of the Funds’ futures and options, if any, on futures transactions. On January 2, 2015, Newedge USA, LLC (“Newedge USA”) merged with and into SG Americas Securities, LLC (“SG”), with the latter as the surviving entity. On February 6, 2015 Jefferies LLC (“Jefferies”) became the Funds’ FCM and primary clearing broker. All futures contracts held by SG were transferred to Jefferies on that date. As of February 23, 2015 all residual cash balances held at SG had been transferred to Jefferies and the balance in all SG accounts was $0. Effective June 3, 2015, ED&F Man Capital Markets Inc. (“ED&F Man”) replaced Jefferies as the Underlying Funds’ FCM and the clearing broker to execute and clear the Underlying Fund’s futures and provide other brokerage-related services. As of June 4, 2015 all futures contracts and residual cash balances held at Jefferies had been transferred to ED&F Man and the balance in all Jefferies accounts was $0.
Currently, ED&F Man serves as the Underlying Funds’ clearing broker to execute and clear the Underlying Funds’ futures and provide other brokerage-related services. ED&F Man is registered as a FCM with the U.S. CFTC and is a member of the NFA. ED&F Man is also registered as a broker/dealer with the U.S. Securities and Exchange Commission and is a member of the FINRA. ED&F Man is a clearing member of ICE Futures U.S., Inc., Chicago Board of Trade, Chicago Mercantile Exchange, New York Mercantile Exchange, and all other major United States commodity exchanges. For Corn, Soybean, Sugar and Wheat Futures Contracts ED&F Man, Jefferies and SG were paid $8.00 per round turn in 2015 and 2014. Effective January 1, 2016, ED&F Man, increased the per round-term charge for futures contracts commission to $9.00. For the years ended December 31, the Fund recognized $8,681 in 2016, $4,000 in 2015 and $3,000 in 2014, respectively, for these services, which is recorded in brokerage commissions on the statements of operations; of this expense $0 in 2016, $4,000 in 2015 and $0 in 2014 was waived by the Sponsor.
The sole Trustee of the Trust is Wilmington Trust Company, a Delaware banking corporation. The Trustee will accept service of legal process on the Trust in the State of Delaware and will make certain filings under the Delaware Statutory Trust Act. For its services, the Trustee receives an annual fee of $3,300 from the Trust. For the years ended December 31, the Fund recognized $133 in 2016, $130 in 2015 and $52 in 2014, respectively, for these services, which is recorded in business permits and licenses fees on the statements of operations; this expense was waived by the Sponsor for all years presented.
Note 3 – Summary of Significant Accounting Policies
Basis of Presentation
The accompanying financial statements have been prepared in accordance with accounting principles generally accepted in the United States of America (“U.S. GAAP”) as detailed in the Financial Accounting Standards Board’s Accounting Standards Codification.
Revenue Recognition
Commodity futures contracts are recorded on the trade date. All such transactions are recorded on the identified cost basis and marked to market daily. Unrealized appreciation or depreciation on commodity futures contracts are reflected in the statements of assets and liabilities as the difference between the original contract amount and the fair market value as of the last business day of the year or as of the last date of the financial statements. Changes in the appreciation or depreciation between periods are reflected in the statements of operations. Interest on cash equivalents and deposits with the Futures Commission Merchant are recognized on the accrual basis. The Fund earns interest on its assets denominated in U.S. dollars on deposit with the Futures Commission Merchant. In addition, the Fund earns interest on funds held at the custodian at prevailing market rates for such investments.
Brokerage Commissions
Brokerage commissions on all open commodity futures contracts are accrued on the trade date and on a full-turn basis.
Income Taxes
For tax purposes, the Fund will be treated as a partnership. The Fund does not record a provision for income taxes because the shareholders report their share of the Fund’s income or loss on their income tax returns. The financial statements reflect the Fund’s transactions without adjustment, if any, required for income tax purposes.
The Fund is required to determine whether a tax position is more likely than not to be sustained upon examination by the applicable taxing authority, including resolution of any related appeals or litigation processes, based on the technical merits of the position. The Fund files an income tax return in the U.S. federal jurisdiction, and may file income tax returns in various U.S. states and foreign jurisdictions. For all tax years 2013 to 2016, the Fund remains subject to income tax examinations by major taxing authorities. The tax benefit recognized is measured as the largest amount of benefit that has a greater than fifty percent likelihood of being realized upon ultimate settlement. De-recognition of a tax benefit previously recognized results in the Fund recording a tax liability that reduces net assets. Based on its analysis, the Fund has determined that it has not incurred any liability for tax benefits as of and for the years ended December 31, 2016, 2015, 2014 and 2013. However, the Fund’s conclusions regarding this policy may be subject to review and adjustment at a later date based on factors including, but not limited to, ongoing analysis of and changes to tax laws, regulations, and interpretations thereof.
146
The Fund recognizes interest accrued related to unrecognized tax benefits and penalties related to unrecognized tax benefits in income tax fees payable, if assessed. No interest expense or penalties have been recognized as of and for the years ended December 31, 2016, 2015 and 2014.
The Fund may be subject to potential examination by U.S. federal, U.S. state, or foreign jurisdictional authorities in the area of income taxes. These potential examinations may include questioning the timing and amount of deductions, the nexus of income among various tax jurisdictions, and compliance with U.S. federal, U.S. state and foreign tax laws. The Fund’s management does not expect that the total amount of unrecognized tax benefits will materially change over the next twelve months.
Creations and Redemptions
Authorized Purchasers may purchase Creation Baskets consisting of 25,000 shares from the Fund. The amount of the proceeds required to purchase a Creation Basket will be equal to the NAV of the shares in the Creation Basket determined as of 4:00 p.m. New York time on the day the order to create the basket is properly received.
Authorized Purchasers may redeem shares from the Fund only in blocks of 25,000 shares called “Redemption Baskets.” The amount of the redemption proceeds for a Redemption Basket will be equal to the NAV of the shares in the Redemption Basket determined as of 4:00 p.m. New York time on the day the order to redeem the basket is properly received.
The Fund receives or pays the proceeds from shares sold or redeemed within three business days after the trade date of the purchase or redemption. The amounts due from Authorized Purchasers are reflected in the Fund’s statements of assets and liabilities as receivable for shares sold. Amounts payable to Authorized Purchasers upon redemption are reflected in the Fund’s statements of assets and liabilities as payable for shares redeemed.
As outlined in the most recent Form S-1 filing, 50,000 shares represents two Redemption Baskets for the Fund and a minimum level of shares.
Allocation of Shareholder Income and Losses
Profit or loss is allocated among the shareholders of the Fund in proportion to the number of shares each shareholder holds as of the close of each month.
Cash and Cash Equivalents
Cash equivalents are highly-liquid investments with maturity dates of 90 days or less when acquired. The Fund reported its cash equivalents in the statements of assets and liabilities at market value, or at carrying amounts that approximate fair value, because of their highly-liquid nature and short-term maturities. The Fund has these balances of its assets on deposit with banks. The Fund had a balance of $125,182 and $297,460 in money market funds at December 31, 2016 and December 31, 2015, respectively; these balances are included in cash and cash equivalents on the statements of assets and liabilities. Effective in the second quarter 2015, the Sponsor invested a portion of the available cash for the Fund in alternative demand-deposit savings accounts, which is classified as cash and not as a cash equivalent. The Fund had a balance of $4,891,490 in a demand-deposit savings account on December 31, 2016. This change resulted in a reduction in the balance held in money market funds. Assets deposited with financial institutions, at times, exceed federally insured limits.
Restricted Cash
On August 17, 2015 (the “Conversion Date”), U.S. Bank N.A. replaced The Bank of New York Mellon as the Custodian for the Funds. Per the amended agreement between the Sponsor and The Bank of New York Mellon dated August 14, 2015, certain cash amounts for each Fund, except in the case of TAGS, are to remain at The Bank of New York Mellon until amounts for services and early termination fees are paid. The amended agreement allows for payments for such amounts owed to be made through December 31, 2017. Cash balances that are held in custody at The Bank of New York Mellon under this amended agreement are reflected on the statements of assets and liabilities of the Fund and the Trust as restricted cash.
Due from/to Broker
The amount recorded by the Fund for the amount due from and to the clearing broker includes, but is not limited to, cash held by the broker, amounts payable to the clearing broker related to open transactions and payables for commodities futures accounts liquidating to an equity balance on the clearing broker’s records.
Margin is the minimum amount of funds that must be deposited by a commodity interest trader with the trader’s broker to initiate and maintain an open position in futures contracts. A margin deposit acts to assure the trader’s performance of the futures contracts purchased or sold. Futures contracts are customarily bought and sold on initial margin that represents a very small percentage of the aggregate purchase or sales price of the contract. Because of such low margin requirements, price fluctuations occurring in the futures markets may create profits and losses that, in relation to the amount invested, are greater than are customary in other forms of investment or speculation. As discussed below, adverse price changes in the futures contract may result in margin requirements that greatly exceed the initial margin. In addition, the amount of margin required in connection with a particular futures contract is set from time to time by the exchange on which the contract is traded and may be modified from time to time by the exchange during the term of the contract. Brokerage firms, such as the Fund’s clearing brokers, carrying accounts for traders in commodity interest contracts generally require higher amounts of margin as a matter of policy to further protect themselves. Over-the-counter trading generally involves the extension of credit between counterparties, so the counterparties may agree to require the posting of collateral by one or both parties to address credit exposure.
147
When a trader purchases an option, there is no margin requirement; however, the option premium must be paid in full. When a trader sells an option, on the other hand, he or she is required to deposit margin in an amount determined by the margin requirements established for the underlying interest and, in addition, an amount substantially equal to the current premium for the option. The margin requirements imposed on the selling of options, although adjusted to reflect the probability that out-of-the-money options will not be exercised, can in fact be higher than those imposed in dealing in the futures markets directly. Complicated margin requirements apply to spreads and conversions, which are complex trading strategies in which a trader acquires a mixture of options positions and positions in the underlying interest.
Ongoing or “maintenance” margin requirements are computed each day by a trader’s clearing broker. When the market value of a particular open futures contract changes to a point where the margin on deposit does not satisfy maintenance margin requirements, a margin call is made by the broker. If the margin call is not met within a reasonable time, the broker may close out the trader’s position. With respect to the Fund’s trading, the Fund (and not its shareholders personally) is subject to margin calls.
Finally, many major U.S. exchanges have passed certain cross margining arrangements involving procedures pursuant to which the futures and options positions held in an account would, in the case of some accounts, be aggregated and margin requirements would be assessed on a portfolio basis, measuring the total risk of the combined positions.
Calculation of Net Asset Value
The Fund’s NAV is calculated by:
| ● | Taking the current market value of its total assets and |
| ● | Subtracting any liabilities. |
The administrator, USBFS, calculates the NAV of the Fund once each trading day. It calculates the NAV as of the earlier of the close of the NYSE or 4:00 p.m. New York time. The NAV for a particular trading day is released after 4:15 p.m. New York time.
In determining the value of Sugar Futures Contracts, the administrator uses the ICE closing price. The administrator determines the value of all other Fund investments as of the earlier of the close of the NYSE or 4:00 p.m. New York time. The value of over-the-counter sugar interests is determined based on the value of the commodity or futures contract underlying such sugar interest, except that a fair value may be determined if the Sponsor believes that the Fund is subject to significant credit risk relating to the counterparty to such sugar interest. For purposes of financial statements and reports, the Sponsor will recalculate the NAV where necessary to reflect the “fair value” of a Futures Contract when the Futures Contract closes at its price fluctuation limit for the day. Treasury securities held by the Fund are valued by the administrator using values received from recognized third-party vendors and dealer quotes. NAV includes any unrealized profit or loss on open sugar interests and any other income or expense accruing to the Fund but unpaid or not received by the Fund.
Sponsor Fee, Allocation of Expenses and Related Party Transactions
The Sponsor is responsible for investing the assets of the Fund in accordance with the objectives and policies of the Fund. In addition, the Sponsor arranges for one or more third parties to provide administrative, custodial, accounting, transfer agency and other necessary services to the Trust and the Funds. In addition, the Sponsor elected not to outsource services directly attributable to the Trust and the Funds such as accounting, financial reporting, regulatory compliance and trading activities. In addition, the Fund is contractually obligated to pay a monthly management fee to the Sponsor, based on average daily net assets, at a rate equal to 1.00% per annum.
The Fund generally pays for all brokerage fees, taxes and other expenses, including licensing fees for the use of intellectual property, registration or other fees paid to the SEC, FINRA, formerly the National Association of Securities Dealers, or any other regulatory agency in connection with the offer and sale of subsequent Shares after its initial registration and all legal, accounting, printing and other expenses associated therewith. The Fund also pays its portion of the fees and expenses associated with the Trust’s tax accounting and reporting requirements. Certain aggregate expenses common to all Funds within the Trust are allocated by the Sponsor to the respective funds based on activity drivers deemed most appropriate by the Sponsor for such expenses, including but not limited to relative assets under management and creation and redeem order activity.
These aggregate common expenses include, but are not limited to, legal, auditing, accounting and financial reporting, tax-preparation, regulatory compliance, trading activities, and insurance costs, as well as fees paid to the Distributor, which are included in the related line item in the statements of operations. A portion of these aggregate common expenses are related to the Sponsor or related parties of principals of the Sponsor; these are necessary services to the Funds, which are primarily the cost of performing accounting and financial reporting, regulatory compliance, and trading activities that are directly attributable to the Fund. For the years ended December 31, the Fund recognized $102,601 in 2016, $47,236 in 2015 and $25,911 in 2014, respectively, such expenses, which are primarily included as distribution and marketing fees on the statements of operations; of these amounts, $71,311 in 2016, $33,483 in 2015 and $25,845 in 2014 were waived by the Sponsor. All asset-based fees and expenses for the Funds are calculated on the prior day’s net assets.
148
For the year ended December 31, 2016, there were $148,281 of expenses that were identified on the statements of operations of the Fund as expenses that were waived by the Sponsor. The Sponsor has determined that there would be no recovery sought for these amounts in any future period.
For the year ended December 31, 2015, there were $256,227 of expenses that were identified on the statements of operations of the Fund as expenses that were waived by the Sponsor. The Sponsor has determined that there would be no recovery sought for these amounts in any future period.
For the year ended December 31, 2014, there were $119,696 of expenses that were identified on the statements of operations of the Fund as expenses that were waived by the Sponsor. The Sponsor has determined that there would be no recovery sought for these amounts in any future period.
Use of Estimates
The preparation of financial statements in conformity with U.S. GAAP requires management to make estimates and assumptions that affect the reported amount of assets and liabilities and disclosure of contingent assets and liabilities at the date of the financial statements, and the reported amounts of the revenue and expenses during the reporting period. Actual results could differ from those estimates.
Fair Value - Definition and Hierarchy
In accordance with U.S. GAAP, fair value is defined as the price that would be received to sell an asset or paid to transfer a liability (i.e., the “exit price”) in an orderly transaction between market participants at the measurement date.
In determining fair value, the Fund uses various valuation approaches. In accordance with U.S. GAAP, a fair value hierarchy for inputs is used in measuring fair value that maximizes the use of observable inputs and minimizes the use of unobservable inputs by requiring that the most observable inputs be used when available. Observable inputs are those that market participants would use in pricing the asset or liability based on market data obtained from sources independent of the Fund. Unobservable inputs reflect the Fund’s assumptions about the inputs market participants would use in pricing the asset or liability developed based on the best information available in the circumstances. The fair value hierarchy is categorized into three levels based on the inputs as follows:
Level 1 - Valuations based on unadjusted quoted prices in active markets for identical assets or liabilities that the Fund has the ability to access. Valuation adjustments and block discounts are not applied to Level 1 financial instruments. Since valuations are based on quoted prices that are readily and regularly available in an active market, valuation of these financial instruments does not entail a significant degree of judgment.
Level 2 - Valuations based on quoted prices in markets that are not active or for which all significant inputs are observable, either directly or indirectly.
Level 3 - Valuations based on inputs that are unobservable and significant to the overall fair value measurement.
The availability of valuation techniques and observable inputs can vary from financial instrument to financial instrument and is affected by a wide variety of factors including, the type of financial instrument, whether the financial instrument is new and not yet established in the marketplace, and other characteristics particular to the transaction. To the extent that valuation is based on models or inputs that are less observable or unobservable in the market, the determination of fair value requires more judgment. Those estimated values do not necessarily represent the amounts that may be ultimately realized due to the occurrence of future circumstances that cannot be reasonably determined. Because of the inherent uncertainty of valuation, those estimated values may be materially higher or lower than the values that would have been used had a ready market for the financial instruments existed. Accordingly, the degree of judgment exercised by the Fund in determining fair value is greatest for financial instruments categorized in Level 3. In certain cases, the inputs used to measure fair value may fall into different levels of the fair value hierarchy. In such cases, for disclosure purposes, the level in the fair value hierarchy, within which the fair value measurement in its entirety falls, is determined based on the lowest level input that is significant to the fair value measurement.
Fair value is a market-based measure considered from the perspective of a market participant rather than an entity-specific measure. Therefore, even when market assumptions are not readily available, the Fund’s own assumptions are set to reflect those that market participants would use in pricing the asset or liability at the measurement date. The Fund uses prices and inputs that are current as of the measurement date, including periods of market dislocation. In periods of market dislocation, the observability of prices and inputs may be reduced for many financial instruments. This condition could cause a financial instrument to be reclassified to a lower level within the fair value hierarchy. When such a situation exists on a quarter close, the Sponsor will calculate the NAV on a particular day using the Level 1 valuation, but will later recalculate the NAV for the impacted Fund based upon the valuation inputs from these alternative verifiable sources (Level 2 or Level 3) and will report such NAV in its applicable financial statements and reports.
149
On December 31, 2016 and 2015, in the opinion of the Trust and the Fund, the reported value of the Sugar Futures Contracts traded on the ICE fairly reflected the value of the Sugar Futures Contracts held by the Fund, and no adjustments were necessary. The determination is made as of the settlement of the futures contracts on the last day of trading for the reporting period. In making the determination of a Level 1 or Level 2 transfer, the Fund considers the average volume of the specific underlying futures contracts traded on the relevant exchange for the years being reported.
For the years ended December 31, 2016 and 2015, the Fund did not have any significant transfers between any of the levels of the fair value hierarchy.
The Fund records its derivative activities at fair value. Gains and losses from derivative contracts are included in the statements of operations. Derivative contracts include futures contracts related to commodity prices. Futures, which are listed on a national securities exchange, such as the CBOT and the ICE, or reported on another national market, are generally categorized in Level 1 of the fair value hierarchy. OTC derivatives contracts (such as forward and swap contracts) which may be valued using models, depending on whether significant inputs are observable or unobservable, are categorized in Levels 2 or 3 of the fair value hierarchy.
Expenses
Expenses are recorded using the accrual method of accounting.
Net Income (Loss) per Share
Net income (loss) per Share is the difference between the NAV per unit at the beginning of each period and at the end of each period. The weighted average number of Shares outstanding was computed for purposes of disclosing net income (loss) per weighted average Share. The weighted average Shares are equal to the number of Shares outstanding at the end of the period, adjusted proportionately for Shares created or redeemed based on the amount of time the Shares were outstanding during such period.
New Accounting Pronouncements
The Financial Accounting Standards Board (“FASB”) issued Accounting Standards Update (“ASU”) 2016-19, “Technical Corrections and Improvements”. The amendments in this update represent changes to clarify, correct errors, or make minor improvements to the Accounting Standards Codification. The amendments make the Accounting Standards Codification easier to understand and easier to apply by eliminating inconsistencies and providing clarifications. The amendments are effective for fiscal years, and interim periods with those fiscal years, for all entities beginning after December 15, 2016. The adoption did not have a material impact on the financial statements and disclosures of the Trust or the Fund.
The FASB issued ASU 2016-18, “Statement of Cash Flows (Topic 230)”. The amendments in this update require that a statement of cash flows explain the change during the period in the total of cash, cash equivalents, and amounts generally described as restricted cash or restricted cash equivalents. Therefore, amounts generally described as restricted cash and restricted cash equivalents should be included with cash and cash equivalents when reconciling the beginning-of-period and end-of-period total amounts shown on the statement of cash flows. The amendments are effective for fiscal years beginning after December 15, 2017, and interim periods within those fiscal years. This update is not expected to have a material impact on the financial statements and disclosures of the Trust or the Fund. The Sponsor believes there will be a change in presentation of restricted cash on the statements of cash flows.
The FASB issued ASU 2016-17, “Consolidation (Topic 810): Interests Held through Related Parties That are under Common Control”. The amendments in this update alters how a decision maker needs to consider indirect interests in a variable interest entity (VIE) held through an entity under common control. The new guidance amends ASU 2015-02, Consolidation (Topic 810): Amendments to the Consolidation Analysis, issued in February 2015. The amendments are effective for fiscal years beginning after December 15, 2016, including interim periods within those fiscal years. The adoption did not have a material impact on the financial statements and disclosures of the Trust or the Fund.
The FASB issued ASU 2016-15, “Statement of Cash Flows (Topic 230): Classification of Certain Cash Receipts and Cash Payments”. The amendments provide cash flow statement classification guidance. The amendments in this update are effective for fiscal years beginning after December 15, 2017. The Trust and the Funds are currently evaluating the impact on the financial statements and disclosures. The Trust and the Fund do not expect to adopt the guidance until the effective date.
The FASB issued ASU 2014-09 in May 2014, “Revenue from Contracts with Customers (Topic 606),” which replaces the revenue recognition requirements of “Revenue Recognition (Topic 605).” This ASU is based on the principle that revenue is recognized to depict the transfer of goods and services to customers in an amount that reflects the consideration to which the entity expects to be entitled in exchange for those goods or services. This ASU provides new and more detailed guidance on specific topics and expands and improves disclosures about revenue. In August 2015, the FASB issued ASU 2015-14 which defers the effective date of ASU 2014-09 by one year to fiscal years beginning after December 15, 2017. ASU 2015-14 also permits early adoption of ASU 2014-09, but not before the original effective date, which was for fiscal years beginning after December 15, 2016. The Trust and the Fund record income or loss from the recognition and measurement of futures contracts and from interest income under Subtopic 825-10. Revenue from financial instruments which are valued under Subtopic 825 will not be subject to the application of ASU 2014-09 and 2015-14. Therefore, these standards will not apply or have a material impact on the financial statements and disclosures of the Trust or the Fund.
150
The FASB issued ASU 2016-11, “Revenue Recognition (Topic 605) and Derivatives and Hedging (Topic 815): Rescission of SEC Guidance Because of Accounting Standards Updates 2014-09 and 2014-16 Pursuant to Staff Announcements at the March 3, 2016 EITF Meeting”. The amendments make targeted improvements to clarify the principal versus agent assessment and are intended to make the guidance more operable and lead to more consistent application. The Trust and the Fund record income or loss from the recognition and measurement of futures contracts and from interest income under Subtopic 825-10. Revenue from financial instruments which are valued under Subtopic 825 will not be subject to the application of ASU 2016-11. Therefore, this standard will not apply or have a material impact on the financial statements and disclosures of the Trust or the Fund.
The FASB issued ASU 2016-02, “Leases (Topic 842).” The amendments in this update increase transparency and comparability among organizations by recognizing lease assets and lease liabilities on the balance sheet and disclosing key information about leasing arrangements. The amendments in this update are effective for fiscal years beginning after December 15, 2018. This update is not expected to have a material impact on the financial statements and disclosures of the Trust or the Fund.
The FASB issued ASU 2016-01, “Financial Instruments-Overall (Subtopic 825-10): Recognition and Measurement of Financial Assets and Financial Liabilities.” The amendments in this update are intended to improve the recognitions measurement and disclosure of financial instruments. The amendments to this update are effective for fiscal years beginning after December 15, 2017, and interim periods within those fiscal years. These amendments are required to be applied prospectively. The Trust and the Fund are currently evaluating the impact on the financial statements and disclosures; but based on our review to date we do not expect the update will have a material impact on the financial statements and disclosures of the Trust or the Fund.
The FASB issued ASU 2015-10, “Technical Corrections and Improvements.” The amendments in this update represent changes to clarify the Codification, correct unintended application of guidance, or make minor improvements to the Codification that are not expected to have a significant effect on current accounting practice or create a significant administrative cost to most entities. The amendments are effective for fiscal years beginning after December 15, 2015. The adoption did not have a material impact on the financial statements and disclosures of the Trust or the Fund.
The FASB issued ASU 2015-07, “Fair Value Measurement (Topic 820): Disclosures for Investments in Certain Entities That Calculate Net Asset Value per Share (or Its Equivalent).” The ASU amends ASC 820 to create a practical expedient to measure the fair value of investments in certain entities that do not have a quoted market price but calculate net asset value per share or its equivalent. In addition, the amendments to ASC 820 provide guidance on classifying investments that are measured using the practical expedient in the fair value hierarchy and require specific disclosures for eligible investments, regardless of whether the practical expedient has been applied. The amendments in this Update are effective for fiscal years beginning after December 15, 2015, and interim periods within those fiscal years. These amendments are required to be applied retrospectively to all periods presented. The adoption did not have a material impact on the financial statements and disclosures of the Trust or the Fund.
The FASB issued ASU 2015-06, “Earnings per Share (Topic 260): Effects on Historical Earnings per Unit of Master Limited Partnership Dropdown Transactions.” The amendments specify how earnings (losses) of a transferred business before the date of a dropdown transaction should be allocated to the various interest holders in a master limited partnership for purposes of calculating earning per unit under the two-class method. The amendments to this update are effective for fiscal years beginning after December 15, 2015, and interim periods within those fiscal years. The amendments are required to be applied retrospectively for all periods presented. The adoption did not have a material impact on the financial statements and disclosures of the Trust or the Fund.
The FASB issued ASU 2015-02, “Consolidation (Topic 810): Amendments to the Consolidation Analysis.” The amendments are intended to improve targeted areas of consolidation guidance for legal entities such as limited partnerships, limited liability corporations, and securitization structures. The amendments to this update are effective for periods beginning after December 15, 2015. These amendments are required to be applied retrospectively for all periods presented. The adoption did not have a material impact on the financial statements and disclosures of the Trust or the Fund.
The FASB issued ASU 2014-08, “Presentation of Financial Statements (Topic 205) and Property, Plant, and Equipment (Topic 360): Reporting Discontinued Operations and Disclosures of Disposals of Components of an Entity.” The amendments in this update change the requirements for reporting discontinued operations in Subtopic 2015-20. A significant provision of ASU 2014-08 calls for reporting as discontinued operations only those disposals that represent a strategic shift or have a major impact on the entity’s financial results and operations. The Company elected to early adopt this ASU for the year ended December 31, 2014, the adoption did not have a significant impact on the financial statements and disclosures of the Fund.
| 151 |
Note 4 – Fair Value Measurements
The Fund’s assets and liabilities recorded at fair value have been categorized based upon a fair value hierarchy as described in the Fund’s significant accounting policies in Note 3. The following table presents information about the Fund’s assets and liabilities measured at fair value as of December 31, 2016 and December 31, 2015.
December 31, 2016
| Assets: | Level 1 | Level 2 | Level 3 | Balance
as of December 31, 2016 | ||||||||||||
| Cash equivalents | $ | 125,182 | $ | — | $ | — | $ | 125,182 | ||||||||
| Sugar futures contracts | 185,147 | — | — | 185,147 | ||||||||||||
| Total | $ | 310,329 | $ | — | $ | — | $ | 310,329 | ||||||||
| Liabilities: | Level 1 | Level 2 | Level 3 | Balance
as of December 31, 2016 | ||||||||||||
| Sugar futures contracts | $ | 331,542 | $ | — | $ | — | $ | 331,542 | ||||||||
December 31, 2015
| Assets: | Level 1 | Level 2 | Level 3 | Balance
as of December 31, 2015 | ||||||||||||
| Cash equivalents | $ | 297,460 | $ | — | $ | — | $ | 297,460 | ||||||||
| Sugar futures contracts | 364,056 | — | — | 364,056 | ||||||||||||
| Total | $ | 661,516 | $ | — | $ | — | $ | 661,516 | ||||||||
For the years ended December 31, 2016 and 2015, the Fund did not have any significant transfers between any of the levels of the fair value hierarchy.
Note 5 – Derivative Instruments and Hedging Activities
In the normal course of business, the Fund utilizes derivative contracts in connection with its proprietary trading activities. Investments in derivative contracts are subject to additional risks that can result in a loss of all or part of an investment. The Fund’s derivative activities and exposure to derivative contracts are classified by the following primary underlying risks: interest rate, credit, commodity price, and equity price risks. In addition to its primary underlying risks, the Fund is also subject to additional counterparty risk due to inability of its counterparties to meet the terms of their contracts. For the years ended December 31, 2016 and 2015, the Fund invested only in commodity futures contracts.
Futures Contracts
The Fund is subject to commodity price risk in the normal course of pursuing its investment objectives. A futures contract represents a commitment for the future purchase or sale of an asset at a specified price on a specified date.
The purchase and sale of futures contracts requires margin deposits with a FCM. Subsequent payments (variation margin) are made or received by the Fund each day, depending on the daily fluctuations in the value of the contract, and are recorded as unrealized gains or losses by the Fund. Futures contracts may reduce the Fund’s exposure to counterparty risk since futures contracts are exchange-traded; and the exchange’s clearinghouse, as the counterparty to all exchange-traded futures, guarantees the futures against default.
The Commodity Exchange Act requires an FCM to segregate all customer transactions and assets from the FCM’s proprietary activities. A customer’s cash and other equity deposited with an FCM are considered commingled with all other customer funds subject to the FCM’s segregation requirements. In the event of an FCM’s insolvency, recovery may be limited to the Fund’s pro rata share of segregated customer funds available. It is possible that the recovery amount could be less than the total of cash and other equity deposited.
The following table discloses information about offsetting assets and liabilities presented in the statements of assets and liabilities to enable users of these financial statements to evaluate the effect or potential effect of netting arrangements for recognized assets and liabilities. These recognized assets and liabilities are presented as defined in FASB ASU No. 2011-11 “Balance Sheet (Topic 210): Disclosures about Offsetting Assets and Liabilities” and subsequently clarified in FASB ASU 2013-01 “Balance Sheet (Topic 210): Clarifying the Scope of Disclosures about Offsetting Assets and Liabilities.”
The following table also identifies the fair value amounts of derivative instruments included in the statements of assets and liabilities as derivative contracts, categorized by primary underlying risk and held by the FCM, ED&F Man as of December 31, 2016 and 2015.
Offsetting of Financial Assets and Derivative Assets as of December 31, 2016
| (i) | (ii) | (iii) = (i) – (ii) | (iv) | (v) = (iii) – (iv) | ||||||||||||||||
| Gross Amount Not Offset
in the Statement of Assets and Liabilities | ||||||||||||||||||||
| Description | Gross
Amount of Recognized Assets | Gross
Amount Offset in the Statement of Assets and Liabilities | Net
Amount Presented in the Statement of Assets and Liabilities | Futures Contracts Available for Offset | Collateral,
Due to Broker | Net Amount | ||||||||||||||
| Commodity price | ||||||||||||||||||||
| Sugar futures contracts | $ | 185,147 | $ | — | $ | 185,147 | $ | 185,147 | $ | — | $ | — | ||||||||
| 152 |
Offsetting of Financial Liabilities and Derivative Liabilities as of December 31, 2016
| (i) | (ii) | (iii) = (i) – (ii) | (iv) | (v) = (iii) – (iv) | ||||||||||||||||
| Gross
Amount Not Offset in the Statement of Assets and Liabilities | ||||||||||||||||||||
| Description | Gross
Amount of Recognized Liabilities | Gross
Amount Offset in the Statement of Assets and Liabilities | Net
Amount Presented in the Statement of Assets and Liabilities | Futures Contracts Available for Offset | Collateral,
Due from Broker | Net Amount | ||||||||||||||
| Commodity price | ||||||||||||||||||||
| Sugar futures contracts | $ | 331,542 | $ | — | $ | 331,542 | $ | 185,147 | $ | 146,395 | $ | — | ||||||||
Offsetting of Financial Assets and Derivative Assets as of December 31, 2015
| (i) | (ii) | (iii) = (i) – (ii) | (iv) | (v) = (iii) – (iv) | ||||||||||||||||
| Gross
Amount Not Offset in the Statement of Assets and Liabilities | ||||||||||||||||||||
| Description | Gross
Amount of Recognized Assets | Gross
Amount Offset in the Statement of Assets and Liabilities | Net
Amount Presented in the Statement of Assets and Liabilities | Futures Contracts Available for Offset | Collateral,
Due to Broker | Net Amount | ||||||||||||||
| Commodity price | ||||||||||||||||||||
| Sugar futures contracts | $ | 364,056 | $ | — | $ | 364,056 | $ | — | $ | — | $ | 364,056 | ||||||||
The following is a summary of realized and net change in unrealized gains (losses) of the derivative instruments utilized by the Fund:
Year ended December 31, 2016
| Realized
Gain on Commodity Futures Contracts | Net Change in Unrealized Appreciation or Depreciation on Commodity Futures Contacts | |||||||
| Commodity Price | ||||||||
| Sugar futures contracts | $ | 1,967,694 | $ | (510,451 | ) | |||
Year ended December 31, 2015
| Realized
Loss on Commodity Futures Contracts | Net Change in Unrealized Appreciation or Depreciation on Commodity Futures Contacts | |||||||
| Commodity Price | ||||||||
| Sugar futures contracts | $ | (1,279,891 | ) | $ | 868,011 | |||
Year ended December 31, 2014
| Realized
Loss on Commodity Futures Contracts | Net Change in Unrealized Appreciation or Depreciation on Commodity Futures Contacts | |||||||
| Commodity Price | ||||||||
| Sugar futures contracts | $ | (131,410 | ) | $ | (320,555 | ) | ||
Volume of Derivative Activities
The average notional market value categorized by primary underlying risk for all futures contracts held was $6.1 million in 2016, $4.1 million in 2015 and $2.7 million in 2014.
Note 6 - Financial Highlights
The following table presents per share performance data and other supplemental financial data for the years ended December 31, 2016, 2015 and 2014. This information has been derived from information presented in the financial statements and is presented with total expenses gross of expenses waived by the Sponsor and with total expenses net of expenses waived by the Sponsor, as appropriate.
| 153 |
| Per Share Operation Performance | Year
ended December 31, 2016 | Year ended December 31, 2015 | Year ended December 31, 2014 | |||||||||
| Net asset value at beginning of period | $ | 10.02 | $ | 11.83 | $ | 14.10 | ||||||
| From investment operations: | ||||||||||||
| Investment income | 0.06 | 0.02 | — | |||||||||
| Net realized and unrealized gain (loss) on commodity futures contracts | 3.17 | (1.64 | ) | (2.01 | ) | |||||||
| Total net expenses | (0.28 | ) | (0.19 | ) | (0.26 | ) | ||||||
| Net increase (decrease) in net asset value | 2.95 | (1.81 | ) | (2.27 | ) | |||||||
| Net asset value at end of period | $ | 12.97 | $ | 10.02 | $ | 11.83 | ||||||
| Total Return | 29.44 | % | (15.30 | )% | (16.10 | )% | ||||||
| Ratios to Average Net Assets | ||||||||||||
| Total expenses | 4.72 | % | 9.16 | % | 6.26 | % | ||||||
| Total expense, net | 2.29 | % | 2.00 | % | 1.88 | % | ||||||
| Net investment loss | (1.77 | )% | (1.79 | )% | (1.85 | )% | ||||||
Effective in the third quarter 2015, the financial highlights per share data are calculated consistent with the methodology used to calculate asset-based fees and expenses. In prior periods, the financial highlights per share data are calculated using the average of the daily shares outstanding for the reporting period, which is inclusive of the last day of the period. Any change in methodology was not material to the ratios presented.
Note 7 – Quarterly Financial Data (Unaudited)
The following summarized quarterly financial information presents the results of operations for the Teucrium Sugar Fund and other data for three-month periods ended March 31, June 30, September 30 and December 31, 2016 and 2015.
| First | Second | Third | Fourth | |||||||||||||
| Quarter 2016 | Quarter 2016 | Quarter 2016 | Quarter 2016 | |||||||||||||
| Total Income (Loss) | $ | 1,628 | $ | 1,344,301 | $ | 939,912 | $ | (796,550 | ) | |||||||
| Total Expenses | $ | 42,333 | $ | 93,020 | $ | 88,916 | $ | 64,040 | ||||||||
| Total Expenses, net | $ | 27,353 | $ | 34,614 | $ | 40,873 | $ | 37,188 | ||||||||
| Net (Loss) Income | $ | (25,725 | ) | $ | 1,309,687 | $ | 899,039 | $ | (833,738 | ) | ||||||
| Net Income (Loss) per share | $ | 0.51 | $ | 2.39 | $ | 1.73 | $ | (1.68 | ) | |||||||
| First | Second | Third | Fourth | |||||||||||||
| Quarter 2015 | Quarter 2015 | Quarter 2015 | Quarter 2015 | |||||||||||||
| Total (Loss) Income | $ | (551,776 | ) | $ | (90,123 | ) | $ | (328,266 | ) | $ | 565,955 | |||||
| Total Expenses | $ | 28,517 | $ | 86,939 | $ | 128,825 | $ | 83,542 | ||||||||
| Total Expenses, net | $ | 12,101 | $ | 15,530 | $ | 19,472 | $ | 24,493 | ||||||||
| Net (Loss) Income | $ | (563,877 | ) | $ | (105,653 | ) | $ | (347,738 | ) | $ | 541,462 | |||||
| Net (Loss) Income per share | $ | (2.27 | ) | $ | (0.07 | ) | $ | (0.74 | ) | $ | 1.27 | |||||
Note 8 - Organizational and Offering Costs
Expenses incurred in organizing of the Trust and the initial offering of the Shares of the Fund, including applicable SEC registration fees, were borne directly by the Sponsor. The Fund will not be obligated to reimburse the Sponsor.
Note 9 – Subsequent Events
Management has evaluated the financial statements for the period-ended December 31, 2016 for subsequent events through the date of this filing and noted no material events requiring either recognition through the date of the filing or disclosure herein for the Fund other than those noted below:
As of this filing, $14,000 of cash that had been held in custody at The Bank of New York Mellon was transferred to the Fund’s account at U.S. Bank. The balance for Restricted Cash is $63,616 as of this filing.
| 154 |
Report of Independent Registered Public Accounting Firm
To the Sponsor and Shareholders of
Teucrium Wheat Fund
We have audited the accompanying statements of assets and liabilities of Teucrium Wheat Fund (the “Fund”), including the schedules of investments, as of December 31, 2016 and 2015, and the related statements of operations, changes in net assets, and cash flows for each of the three years in the period ended December 31, 2016. These financial statements are the responsibility of the Fund’s management. Our responsibility is to express an opinion on these financial statements based on our audits.
We conducted our audits in accordance with the standards of the Public Company Accounting Oversight Board (United States). Those standards require that we plan and perform the audit to obtain reasonable assurance about whether the financial statements are free of material misstatement. An audit includes examining, on a test basis, evidence supporting the amounts and disclosures in the financial statements. An audit also includes assessing the accounting principles used and significant estimates made by management, as well as evaluating the overall financial statement presentation. We believe that our audits provide a reasonable basis for our opinion.
In our opinion, the financial statements referred to above present fairly, in all material respects, the financial position of Teucrium Wheat Fund as of December 31, 2016 and 2015, and the results of its operations and its cash flows for each of the three years in the period ended December 31, 2016 in conformity with accounting principles generally accepted in the United States of America.
We also have audited, in accordance with the standards of the Public Company Accounting Oversight Board (United States), the Fund’s internal control over financial reporting as of December 31, 2016, based on criteria established in the 2013 Internal Control—Integrated Framework issued by the Committee of Sponsoring Organizations of the Treadway Commission (COSO), and our report dated March 16, 2017 expressed an unqualified opinion.
/s/ GRANT THORNTON LLP
New York, New York
March 16, 2017
| 155 |
Report of Independent Registered Public Accounting Firm
To the Sponsor and Shareholders of
Teucrium Wheat Fund
We have audited the internal control over financial reporting of Teucrium Wheat Fund (the “Fund”) as of December 31, 2016, based on criteria established in the 2013 Internal Control—Integrated Framework issued by the Committee of Sponsoring Organizations of the Treadway Commission (COSO). The Fund’s management is responsible for maintaining effective internal control over financial reporting and for its assessment of the effectiveness of internal control over financial reporting, included in the accompanying Management’s Report on Internal Control over Financial Reporting. Our responsibility is to express an opinion on the Fund’s internal control over financial reporting based on our audit.
We conducted our audit in accordance with the standards of the Public Company Accounting Oversight Board (United States). Those standards require that we plan and perform the audit to obtain reasonable assurance about whether effective internal control over financial reporting was maintained in all material respects. Our audit included obtaining an understanding of internal control over financial reporting, assessing the risk that a material weakness exists, testing and evaluating the design and operating effectiveness of internal control based on the assessed risk, and performing such other procedures as we considered necessary in the circumstances. We believe that our audit provides a reasonable basis for our opinion.
A fund’s internal control over financial reporting is a process designed to provide reasonable assurance regarding the reliability of financial reporting and the preparation of financial statements for external purposes in accordance with generally accepted accounting principles. A fund’s internal control over financial reporting includes those policies and procedures that (1) pertain to the maintenance of records that, in reasonable detail, accurately and fairly reflect the transactions and dispositions of the assets of the fund; (2) provide reasonable assurance that transactions are recorded as necessary to permit preparation of financial statements in accordance with generally accepted accounting principles, and that receipts and expenditures of the fund are being made only in accordance with authorizations of management and directors of the fund; and (3) provide reasonable assurance regarding prevention or timely detection of unauthorized acquisition, use, or disposition of the fund’s assets that could have a material effect on the financial statements.
Because of its inherent limitations, internal control over financial reporting may not prevent or detect misstatements. Also, projections of any evaluation of effectiveness to future periods are subject to the risk that controls may become inadequate because of changes in conditions, or that the degree of compliance with the policies or procedures may deteriorate.
In our opinion, the Fund maintained, in all material respects, effective internal control over financial reporting as of December 31, 2016, based on criteria established in the 2013 Internal Control—Integrated Framework issued by COSO.
We also have audited, in accordance with the standards of the Public Company Accounting Oversight Board (United States), the financial statements of the Fund as of and for the year ended December 31, 2016, and our report dated March 16, 2017 expressed an unqualified opinion on those financial statements.
/s/ GRANT THORNTON LLP
New York, New York
March 16, 2017
| 156 |
TEUCRIUM WHEAT FUND
STATEMENTS OF ASSETS AND LIABILITIES
| December 31, 2016 | December 31, 2015 | |||||||
| Assets | ||||||||
| Cash and cash equivalents | $ | 58,931,911 | $ | 24,579,091 | ||||
| Interest receivable | 279 | 297 | ||||||
| Restricted cash | — | 22,610 | ||||||
| Other assets | 7,637 | 153,564 | ||||||
| Equity in trading accounts: | ||||||||
| Due from broker | 7,381,706 | 3,721,388 | ||||||
| Total assets | 66,321,533 | 28,476,950 | ||||||
| Liabilities | ||||||||
| Management fee payable to Sponsor | 52,145 | 23,226 | ||||||
| Other liabilities | 3,041 | — | ||||||
| Equity in trading accounts: | ||||||||
| Commodity futures contracts | 3,921,588 | 1,924,464 | ||||||
| Total liabilities | 3,976,774 | 1,947,690 | ||||||
| Net assets | $ | 62,344,759 | $ | 26,529,260 | ||||
| Shares outstanding | 9,050,004 | 2,900,004 | ||||||
| Net asset value per share | $ | 6.89 | $ | 9.15 | ||||
| Market value per share | $ | 6.88 | $ | 9.14 | ||||
The accompanying notes are an integral part of these financial statements.
| 157 |
TEUCRIUM WHEAT FUND
December 31, 2016
| Percentage of | ||||||||||||
| Description: Assets | Fair Value | Net Assets | Shares | |||||||||
| Cash equivalents | ||||||||||||
| Money market funds | ||||||||||||
| Fidelity Institutional Money Market Funds - Government Portfolio (cost $406,927) | $ | 406,927 | 0.65 | % | 406,927 | |||||||
| Notional Amount | ||||||||||||
| Description: Liabilities | Fair Value | Percentage of Net Assets | (Long Exposure) | |||||||||
| Commodity futures contracts | ||||||||||||
| United States wheat futures contracts | ||||||||||||
| CBOT wheat futures MAY17 (1,037 contracts) | $ | 1,011,350 | 1.62 | % | $ | 21,802,925 | ||||||
| CBOT wheat futures JUL17 (861 contracts) | 213,963 | 0.34 | 18,694,463 | |||||||||
| CBOT wheat futures DEC17 (939 contracts) | 2,696,275 | 4.33 | 21,831,750 | |||||||||
| Total commodity futures contracts | $ | 3,921,588 | 6.29 | % | $ | 62,329,138 | ||||||
The accompanying notes are an integral part of these financial statements.
| 158 |
TEUCRIUM WHEAT FUND
SCHEDULE OF INVESTMENTS
December 31, 2015
| Percentage of | ||||||||||||
| Description: Assets | Fair Value | Net Assets | Shares | |||||||||
| Cash equivalents | ||||||||||||
| Money market funds | ||||||||||||
| Fidelity Institutional Prime Money Market Portfolio (cost $1,179,366) | $ | 1,179,336 | 4.45 | % | 1,179,336 | |||||||
| Notional Amount | ||||||||||||
| Description: Liabilities | Fair Value | Percentage
of Net Assets | (Long Exposure) | |||||||||
| Commodity futures contracts | ||||||||||||
| United States wheat futures contracts | ||||||||||||
| CBOT wheat futures MAY16 (390 contracts) | $ | 379,713 | 1.43 | % | $ | 9,291,750 | ||||||
| CBOT wheat futures JUL16 (330 contracts) | 331,313 | 1.25 | 7,973,625 | |||||||||
| CBOT wheat futures DEC16 (366 contracts) | 1,213,438 | 4.57 | 9,287,250 | |||||||||
| Total commodity futures contracts | $ | 1,924,464 | 7.25 | % | $ | 26,552,625 | ||||||
The accompanying notes are an integral part of these financial statements.
| 159 |
TEUCRIUM WHEAT FUND
| Year ended | Year ended | Year ended | ||||||||||
| December 31, 2016 | December 31, 2015 | December 31, 2014 | ||||||||||
| Income | ||||||||||||
| Realized and unrealized gain (loss) on trading of commodity futures contracts: | ||||||||||||
| Realized loss on commodity futures contracts | $ | (9,631,400 | ) | $ | (4,559,863 | ) | $ | (2,486,162 | ) | |||
| Net change in unrealized appreciation or depreciation on commodity futures contracts | (1,997,125 | ) | (2,640,963 | ) | 1,415,175 | |||||||
| Interest income | 231,598 | 54,109 | 9,064 | |||||||||
| Total loss | (11,396,927 | ) | (7,146,717 | ) | (1,061,923 | ) | ||||||
| Expenses | ||||||||||||
| Management fees | 415,147 | 254,597 | 183,042 | |||||||||
| Professional fees | 319,007 | 213,241 | 161,791 | |||||||||
| Distribution and marketing fees | 777,708 | 374,436 | 237,457 | |||||||||
| Custodian fees and expenses | 120,829 | 171,747 | 11,175 | |||||||||
| Business permits and licenses fees | 39,116 | 13,803 | 26,622 | |||||||||
| General and administrative expenses | 91,644 | 66,012 | 24,564 | |||||||||
| Brokerage commissions | 48,209 | 20,561 | 15,896 | |||||||||
| Other expenses | 42,922 | 7,307 | 10,960 | |||||||||
| Total expenses | 1,854,582 | 1,121,704 | 671,507 | |||||||||
| Expenses waived by the Sponsor | (140,028 | ) | (130,716 | ) | (31,697 | ) | ||||||
| Reimbursement of expenses previously waived | — | — | 46,302 | |||||||||
| Total expenses, net | 1,714,554 | 990,988 | 686,112 | |||||||||
| Net loss | $ | (13,111,481 | ) | $ | (8,137,705 | ) | $ | (1,748,035 | ) | |||
| Net loss per share | $ | (2.26 | ) | $ | (3.57 | ) | $ | (2.12 | ) | |||
| Net loss per weighted average share | $ | (2.45 | ) | $ | (3.29 | ) | $ | (1.24 | ) | |||
| Weighted average shares outstanding | 5,340,851 | 2,470,483 | 1,408,223 | |||||||||
The accompanying notes are an integral part of these financial statements.
| 160 |
TEUCRIUM WHEAT FUND
STATEMENTS OF CHANGES IN NET ASSETS
| Year ended | Year ended | Year ended | ||||||||||
| December 31, 2016 | December 31, 2015 | December 31, 2014 | ||||||||||
| Operations | ||||||||||||
| Net loss | $ | (13,111,481 | ) | $ | (8,137,705 | ) | $ | (1,748,035 | ) | |||
| Capital transactions | ||||||||||||
| Issuance of Shares | 51,690,600 | 18,019,705 | 34,552,580 | |||||||||
| Redemption of Shares | (2,763,620 | ) | (5,616,197 | ) | (17,589,175 | ) | ||||||
| Total capital transactions | 48,926,980 | 12,403,508 | 16,963,405 | |||||||||
| Net change in net assets | 35,815,499 | 4,265,803 | 15,215,370 | |||||||||
| Net assets, beginning of period | $ | 26,529,260 | $ | 22,263,457 | $ | 7,048,087 | ||||||
| Net assets, end of period | $ | 62,344,759 | $ | 26,529,260 | $ | 22,263,457 | ||||||
| Net asset value per share at beginning of period | $ | 9.15 | $ | 12.72 | $ | 14.84 | ||||||
| At end of period | $ | 6.89 | $ | 9.15 | $ | 12.72 | ||||||
| Creation of Shares | 6,475,000 | 1,675,000 | 2,575,000 | |||||||||
| Redemption of Shares | 325,000 | 525,000 | 1,300,000 | |||||||||
The accompanying notes are an integral part of these financial statements.
| 161 |
TEUCRIUM WHEAT FUND
| Year ended | Year ended | Year ended | ||||||||||
| December 31, 2016 | December 31, 2015 | December 31, 2014 | ||||||||||
| Cash flows from operating activities: | ||||||||||||
| Net loss | $ | (13,111,481 | ) | $ | (8,137,705 | ) | $ | (1,748,035 | ) | |||
| Adjustments to reconcile net loss to net cash used in operating activities: | ||||||||||||
| Net change in unrealized appreciation or depreciation on commodity futures contracts | 1,997,125 | 2,640,963 | (1,415,175 | ) | ||||||||
| Changes in operating assets and liabilities: | ||||||||||||
| Due from broker | (3,660,318 | ) | (3,721,388 | ) | 1,253,668 | |||||||
| Interest receivable | 17 | 1,410 | (1,257 | ) | ||||||||
| Restricted cash | 22,610 | (22,610 | ) | — | ||||||||
| Other assets | 145,927 | (76,816 | ) | (26,188 | ) | |||||||
| Due to broker | — | (60,805 | ) | 60,805 | ||||||||
| Management fee payable to Sponsor | 28,919 | 645 | 16,491 | |||||||||
| Other liabilities | 3,041 | (16,479 | ) | 13,015 | ||||||||
| Net cash used in operating activities | (14,574,160 | ) | (9,392,785 | ) | (1,846,676 | ) | ||||||
| Cash flows from financing activities: | ||||||||||||
| Proceeds from sale of Shares | 51,690,600 | 18,019,705 | 34,552,580 | |||||||||
| Redemption of Shares | (2,763,620 | ) | (5,616,197 | ) | (17,589,175 | ) | ||||||
| Net cash provided by financing activities | 48,926,980 | 12,403,508 | 16,963,405 | |||||||||
| Net change in cash and cash equivalents | 34,352,820 | 3,010,723 | 15,116,729 | |||||||||
| Cash and cash equivalents, beginning of period | 24,579,091 | 21,568,368 | 6,451,639 | |||||||||
| Cash and cash equivalents, end of period | $ | 58,931,911 | $ | 24,579,091 | $ | 21,568,368 | ||||||
The accompanying notes are an integral part of these financial statements.
| 162 |
December 31, 2016
Note 1 – Organization and Operation
Teucrium Wheat Fund (referred to herein as “WEAT” or the “Fund”) is a commodity pool that is a series of Teucrium Commodity Trust (“Trust”), a Delaware statutory trust formed on September 11, 2009. The Fund issues common units, called the “Shares,” representing fractional undivided beneficial interests in the Fund. The Fund continuously offers Creation Baskets consisting of 25,000 Shares at their Net Asset Value (“NAV”) to “Authorized Purchasers” through Foreside Fund Services, LLC, which is the distributor for the Fund (the “Distributor”). Authorized Purchasers sell such Shares, which are listed on the New York Stock Exchange (“NYSE”) Arca under the symbol “WEAT,” to the public at per-Share offering prices that reflect, among other factors, the trading price of the Shares on the NYSE Arca, the NAV of the Fund at the time the Authorized Purchaser purchased the Creation Baskets and the NAV at the time of the offer of the Shares to the public, the supply of and demand for Shares at the time of sale, and the liquidity of the markets for wheat interests. The Fund’s Shares trade in the secondary market on the NYSE Arca at prices that are lower or higher than their NAV per Share.
The investment objective of WEAT is to have the daily changes in percentage terms of the Shares’ NAV reflect the daily changes in percentage terms of a weighted average of the closing settlement prices for three futures contracts for wheat (“Wheat Futures Contracts”) that are traded on the CBOT, specifically: (1) the second-to-expire CBOT Wheat Futures Contract, weighted 35%, (2) the third-to-expire CBOT Wheat Futures Contract, weighted 30%, and (3) the CBOT Wheat Futures Contract expiring in the December following the expiration month of the third-to-expire contract, weighted 35%.
The Fund commenced investment operations on September 19, 2011 and has a fiscal year ending December 31. The Fund’s sponsor is Teucrium Trading, LLC (the “Sponsor”). The Sponsor is responsible for the management of the Fund. The Sponsor is a member of the National Futures Association (the “NFA”) and became a commodity pool operator registered with the Commodity Futures Trading Commission (the “CFTC”) effective November 10, 2009.
On June 17, 2011, the Fund’s initial registration of 10,000,000 shares on Form S-1 was declared effective by the SEC. On September 19, 2011, the Fund listed its shares on the NYSE Arca under the ticker symbol “WEAT.” On the business day prior to that, the Fund issued 100,000 shares in exchange for $2,500,000 at the Fund’s initial NAV of $25 per share. The Fund also commenced investment operations on September 19, 2011 by purchasing commodity futures contracts traded on the CBOT. On December 31, 2010, the Fund had four shares outstanding, which were owned by the Sponsor. On June 30, 2014, a subsequent registration statement for WEAT was declared effective by the SEC. On July 15, 2016, a subsequent registration statement for WEAT was declared effective. This registration statement for WEAT registered an additional 24,050,000 shares.
Subject to the terms of the Trust Agreement, Teucrium Trading, LLC, in its capacity as the Sponsor (“Sponsor”), may terminate a Fund at any time, regardless of whether the Fund has incurred losses, including, for instance, if it determines that the Fund’s aggregate net assets in relation to its operating expenses make the continued operation of the Fund unreasonable or imprudent. However, no level of losses will require the Sponsor to terminate a Fund.
Note 2 – Principal Contracts and Agreements
On August 17, 2015 (the “Conversion Date”), U.S. Bank N.A. replaced The Bank of New York Mellon as the Custodian for the Fund. The principal business address for U.S. Bank N.A. is 1555 North Rivercenter Drive, Suite 302, Milwaukee, Wisconsin 53212. U.S. Bank N.A. is a Wisconsin state chartered bank subject to regulation by the Board of Governors of the Federal Reserve System and the Wisconsin State Banking Department. The principal address for U.S. Bancorp Fund Services, LLC (“USBFS”), is 777 East Wisconsin Avenue, Milwaukee, WI, 53202. In addition, effective on the Conversion Date, USBFS, a wholly owned subsidiary of U.S. Bank, commenced serving as administrator for each Fund, performing certain administrative and accounting services and preparing certain SEC reports on behalf of the Funds, and also became the registrar and transfer agent for each Fund’s Shares. For such services, U.S. Bank and USBFS will receive an asset-based fee, subject to a minimum annual fee.
Given this conversion, the Sponsor has, for the year-ended December 31, 2015, reflected an expense, before and after fees waived by the Sponsor, for fees associated with Custodian, Fund Administration and Transfer Agent services (“Custodian Fees”) that have or will be paid to the Bank of New York Mellon by a Fund or by the Sponsor on behalf of a Fund.
For custody services, the Funds will pay to U.S. Bank N.A. 0.0075% of average gross assets up to $1 billion, and .0050% of average gross assets over $1 billion, annually, plus certain per-transaction charges. For Transfer Agency, Fund Accounting and Fund Administration services, which are based on the total assets for all the Funds in the Trust, the Funds will pay to USBFS 0.06% of average gross assets on the first $250 million, 0.05% on the next $250 million, 0.04% on the next $500 million and 0.03% on the balance over $1 billion annually. A combined minimum annual fee of up to $64,500 for custody, transfer agency, accounting and administrative services is assessed per Fund. For the year ended December 31, 2015, such expenses include both the fees for the Bank of New York Mellon and USBFS. For the years ended December 31, the Fund recognized $120,829 in 2016, $171,747 in 2015 and $11,175 in 2014, respectively, for these services, which is recorded in custodian fees and expenses on the statements of operations; of this expense $2,000 in 2016, $60,512 in 2015 and $0 in 2014 was waived by the Sponsor.
163
The Sponsor and the Trust employ Foreside Fund Services, LLC as the Distributor for the Funds. The Distribution Services Agreement among the Distributor, the Sponsor and the Trust calls for the Distributor to work with the Custodian in connection with the receipt and processing of orders for Creation Baskets and Redemption Baskets and the review and approval of all Fund sales literature and advertising materials. The Distributor and the Sponsor have also entered into a Securities Activities and Service Agreement (the “SASA”) under which certain employees and officers of the Sponsor are licensed as registered representatives or registered principals of the Distributor, under FINRA rules. For its services as the Distributor, Foreside receives a fee of 0.01% of the Fund’s average daily net assets and an aggregate annual fee of $100,000 for all Teucrium Funds, along with certain expense reimbursements. For its services under the SASA, Foreside receives a fee of $5,000 per registered representative and $1,000 per registered location. For the years ended December 31, the Fund recognized $48,516 in 2016, $35,804 in 2015 and $22,146 in 2014, respectively, for these services, which is recorded in distribution and marketing fees on the statements of operations; of this expense $570 in 2016, $0 in 2015 and $0 in 2014 was waived by the Sponsor.
For the year ended December 31, 2014, Newedge USA, LLC (“Newedge USA”) served as the Funds’ futures commission merchant (“FCM”) and primary clearing broker to execute and clear the Funds’ futures transactions and provide other brokerage-related services. In 2014, the Funds introduced the use of Jefferies LLC (“Jefferies”), for the execution and clearing of the Funds’ futures and options, if any, on futures transactions. On January 2, 2015, Newedge USA, LLC (“Newedge USA”) merged with and into SG Americas Securities, LLC (“SG”), with the latter as the surviving entity. On February 6, 2015 Jefferies LLC (“Jefferies”) became the Funds’ FCM and primary clearing broker. All futures contracts held by SG were transferred to Jefferies on that date. As of February 23, 2015 all residual cash balances held at SG had been transferred to Jefferies and the balance in all SG accounts was $0. Effective June 3, 2015, ED&F Man Capital Markets Inc. (“ED&F Man”) replaced Jefferies as the Underlying Funds’ FCM and the clearing broker to execute and clear the Underlying Fund’s futures and provide other brokerage-related services. As of June 4, 2015 all futures contracts and residual cash balances held at Jefferies had been transferred to ED&F Man and the balance in all Jefferies accounts was $0.
Currently, ED&F Man serves as the Underlying Funds’ clearing broker to execute and clear the Underlying Funds’ futures and provide other brokerage-related services. ED&F Man is registered as a FCM with the U.S. CFTC and is a member of the NFA. ED&F Man is also registered as a broker/dealer with the U.S. Securities and Exchange Commission and is a member of the FINRA. ED&F Man is a clearing member of ICE Futures U.S., Inc., Chicago Board of Trade, Chicago Mercantile Exchange, New York Mercantile Exchange, and all other major United States commodity exchanges. For Corn, Soybean, Sugar and Wheat Futures Contracts ED&F Man, Jefferies and SG were paid $8.00 per round turn in 2015 and 2014. Effective January 1, 2016, ED&F Man, increased the per round-term charge for futures contracts commission to $9.00. For the years ended December 31, the Fund recognized $48,209 in 2016, $20,561 in 2015 and $15,896 in 2014, respectively, for these services, which is recorded in brokerage commissions on the statements of operations; of this expense $0 in 2016, $4,000 in 2015 and $0 in 2014 was waived by the Sponsor.
The sole Trustee of the Trust is Wilmington Trust Company, a Delaware banking corporation. The Trustee will accept service of legal process on the Trust in the State of Delaware and will make certain filings under the Delaware Statutory Trust Act. For its services, the Trustee receives an annual fee of $3,300 from the Trust. For the years ended December 31, the Fund recognized $1,078 in 2016, $885 in 2015 and $687 in 2014, respectively, for these services, which is recorded in business permits and licenses fees on the statements of operations; of this expense $1,078 in 2016, $0 in 2015 and $0 in 2014 were waived by the Sponsor.
Note 3 – Summary of Significant Accounting Policies
Basis of Presentation
The accompanying financial statements have been prepared in accordance with accounting principles generally accepted in the United States of America (“U.S. GAAP”) as detailed in the Financial Accounting Standards Board’s Accounting Standards Codification.
Revenue Recognition
Commodity futures contracts are recorded on the trade date. All such transactions are recorded on the identified cost basis and marked to market daily. Unrealized appreciation or depreciation on commodity futures contracts are reflected in the statements of assets and liabilities as the difference between the original contract amount and the fair market value as of the last business day of the year or as of the last date of the financial statements. Changes in the appreciation or depreciation between periods are reflected in the statements of operations. Interest on cash equivalents and deposits with the Futures Commission Merchant are recognized on the accrual basis. The Fund earns interest on its assets denominated in U.S. dollars on deposit with the Futures Commission Merchant. In addition, the Fund earns interest on funds held at the custodian at prevailing market rates for such investments.
Brokerage Commissions
Brokerage commissions on all open commodity futures contracts are accrued on the trade date and on a full-turn basis.
Income Taxes
For tax purposes, the Fund will be treated as a partnership. The Fund does not record a provision for income taxes because the shareholders report their share of the Fund’s income or loss on their income tax returns. The financial statements reflect the Fund’s transactions without adjustment, if any, required for income tax purposes.
164
The Fund is required to determine whether a tax position is more likely than not to be sustained upon examination by the applicable taxing authority, including resolution of any related appeals or litigation processes, based on the technical merits of the position. The Fund files an income tax return in the U.S. federal jurisdiction, and may file income tax returns in various U.S. states and foreign jurisdictions. For all tax years 2013 to 2016, the Fund remains subject to income tax examinations by major taxing authorities. The tax benefit recognized is measured as the largest amount of benefit that has a greater than fifty percent likelihood of being realized upon ultimate settlement. De-recognition of a tax benefit previously recognized results in the Fund recording a tax liability that reduces net assets. Based on its analysis, the Fund has determined that it has not incurred any liability for unrecognized tax benefits as of and for the years ended December 31, 2016, 2015, 2014 and 2013. However, the Fund’s conclusions regarding this policy may be subject to review and adjustment at a later date based on factors including, but not limited to, ongoing analysis of and changes to tax laws, regulations, and interpretations thereof.
The Fund recognizes interest accrued related to unrecognized tax benefits and penalties related to unrecognized tax benefits in income tax fees payable, if assessed. No interest expense or penalties have been recognized as of and for the years ended December 31, 2016, 2015 and 2014.
The Fund may be subject to potential examination by U.S. federal, U.S. state, or foreign jurisdictional authorities in the area of income taxes. These potential examinations may include questioning the timing and amount of deductions, the nexus of income among various tax jurisdictions, and compliance with U.S. federal, U.S. state and foreign tax laws. The Fund’s management does not expect that the total amount of unrecognized tax benefits will materially change over the next twelve months.
Creations and Redemptions
Authorized Purchasers may purchase Creation Baskets consisting of 25,000 shares from the Fund. The amount of the proceeds required to purchase a Creation Basket will be equal to the NAV of the shares in the Creation Basket determined as of 4:00 p.m. New York time on the day the order to create the basket is properly received.
Authorized Purchasers may redeem shares from the Fund only in blocks of 25,000 shares called “Redemption Baskets.” The amount of the redemption proceeds for a Redemption Basket will be equal to the NAV of the shares in the Redemption Basket determined as of 4:00 p.m. New York time on the day the order to redeem the basket is properly received.
The Fund receives or pays the proceeds from shares sold or redeemed within three business days after the trade date of the purchase or redemption. The amounts due from Authorized Purchasers are reflected in the Fund’s statements of assets and liabilities as receivable for shares sold. Amounts payable to Authorized Purchasers upon redemption are reflected in the Fund’s statements of assets and liabilities as payable for shares redeemed.
As outlined in the most recent Form S-1 filing, 50,000 shares represents two Redemption Baskets for the Fund and a minimum level of shares.
Allocation of Shareholder Income and Losses
Profit or loss is allocated among the shareholders of the Fund in proportion to the number of shares each shareholder holds as of the close of each month.
Cash and Cash Equivalents
Cash equivalents are highly-liquid investments with maturity dates of 90 days or less when acquired. The Fund reported its cash equivalents in the statements of assets and liabilities at market value, or at carrying amounts that approximate fair value, because of their highly-liquid nature and short-term maturities. The Fund has these balances of its assets on deposit with banks. The Fund had a balance of $406,927 and $1,179,336 in money market funds at December 31, 2016 and December 31, 2015, respectively; these balances are included in cash and cash equivalents on the statements of assets and liabilities. Effective in the second quarter 2015, the Sponsor invested a portion of the available cash for the Fund in alternative demand-deposit savings accounts, which is classified as cash and not as a cash equivalent. The Fund had a balance of $58,526,678 in a demand-deposit savings account on December 31, 2016. This change resulted in a reduction in the balance held in money market funds. Assets deposited with financial institutions, at times, exceed federally insured limits.
Restricted Cash
On August 17, 2015 (the “Conversion Date”), U.S. Bank N.A. replaced The Bank of New York Mellon as the Custodian for the Funds. Per the amended agreement between the Sponsor and The Bank of New York Mellon dated August 14, 2015, certain cash amounts for each Fund, except in the case of TAGS, are to remain at The Bank of New York Mellon until amounts for services and early termination fees are paid. The amended agreement allows for payments for such amounts owed to be made through December 31, 2017. Cash balances that are held in custody at The Bank of New York Mellon under this amended agreement are reflected on the statements of assets and liabilities of the Fund and the Trust as restricted cash.
Due from/to Broker
The amount recorded by the Fund for the amount due from and to the clearing broker includes, but is not limited to, cash held by the broker, amounts payable to the clearing broker related to open transactions and payables for commodities futures accounts liquidating to an equity balance on the clearing broker’s records.
165
Margin is the minimum amount of funds that must be deposited by a commodity interest trader with the trader’s broker to initiate and maintain an open position in futures contracts. A margin deposit acts to assure the trader’s performance of the futures contracts purchased or sold. Futures contracts are customarily bought and sold on initial margin that represents a very small percentage of the aggregate purchase or sales price of the contract. Because of such low margin requirements, price fluctuations occurring in the futures markets may create profits and losses that, in relation to the amount invested, are greater than are customary in other forms of investment or speculation. As discussed below, adverse price changes in the futures contract may result in margin requirements that greatly exceed the initial margin. In addition, the amount of margin required in connection with a particular futures contract is set from time to time by the exchange on which the contract is traded and may be modified from time to time by the exchange during the term of the contract. Brokerage firms, such as the Fund’s clearing brokers, carrying accounts for traders in commodity interest contracts generally require higher amounts of margin as a matter of policy to further protect themselves. Over-the-counter trading generally involves the extension of credit between counterparties, so the counterparties may agree to require the posting of collateral by one or both parties to address credit exposure.
When a trader purchases an option, there is no margin requirement; however, the option premium must be paid in full. When a trader sells an option, on the other hand, he or she is required to deposit margin in an amount determined by the margin requirements established for the underlying interest and, in addition, an amount substantially equal to the current premium for the option. The margin requirements imposed on the selling of options, although adjusted to reflect the probability that out-of-the-money options will not be exercised, can in fact be higher than those imposed in dealing in the futures markets directly. Complicated margin requirements apply to spreads and conversions, which are complex trading strategies in which a trader acquires a mixture of options positions and positions in the underlying interest.
Ongoing or “maintenance” margin requirements are computed each day by a trader’s clearing broker. When the market value of a particular open futures contract changes to a point where the margin on deposit does not satisfy maintenance margin requirements, a margin call is made by the broker. If the margin call is not met within a reasonable time, the broker may close out the trader’s position. With respect to the Fund’s trading, the Fund (and not its shareholders personally) is subject to margin calls.
Finally, many major U.S. exchanges have passed certain cross margining arrangements involving procedures pursuant to which the futures and options positions held in an account would, in the case of some accounts, be aggregated and margin requirements would be assessed on a portfolio basis, measuring the total risk of the combined positions.
Calculation of Net Asset Value
The Fund’s NAV is calculated by:
| ● | Taking the current market value of its total assets and |
| ● | Subtracting any liabilities. |
The administrator, USBFS, calculates the NAV of the Fund once each trading day. It calculates the NAV as of the earlier of the close of the NYSE or 4:00 p.m. New York time. The NAV for a particular trading day is released after 4:15 p.m. New York time.
In determining the value of Wheat Futures Contracts, the administrator uses the CBOT closing price. The administrator determines the value of all other Fund investments as of the earlier of the close of the NYSE or 4:00 p.m. New York time. The value of over-the-counter wheat interests is determined based on the value of the commodity or futures contract underlying such wheat interest, except that a fair value may be determined if the Sponsor believes that the Fund is subject to significant credit risk relating to the counterparty to such wheat interest. For purposes of financial statements and reports, the Sponsor will recalculate the NAV where necessary to reflect the “fair value” of a Futures Contract when the Futures Contract closes at its price fluctuation limit for the day. Treasury securities held by the Fund are valued by the administrator using values received from recognized third-party vendors and dealer quotes. NAV includes any unrealized profit or loss on open wheat interests and any other income or expense accruing to the Fund but unpaid or not received by the Fund.
Sponsor Fee, Allocation of Expenses and Related Party Transactions
The Sponsor is responsible for investing the assets of the Fund in accordance with the objectives and policies of the Fund. In addition, the Sponsor arranges for one or more third parties to provide administrative, custodial, accounting, transfer agency and other necessary services to the Trust and the Funds. In addition, the Sponsor elected not to outsource services directly attributable to the Trust and the Funds such as accounting, financial reporting, regulatory compliance and trading activities. In addition, the Fund is contractually obligated to pay a monthly management fee to the Sponsor, based on average daily net assets, at a rate equal to 1.00% per annum.
The Fund generally pays for all brokerage fees, taxes and other expenses, including licensing fees for the use of intellectual property, registration or other fees paid to the SEC, FINRA, formerly the National Association of Securities Dealers, or any other regulatory agency in connection with the offer and sale of subsequent Shares after its initial registration and all legal, accounting, printing and other expenses associated therewith. The Fund also pays its portion of the fees and expenses associated with the Trust’s tax accounting and reporting requirements. Certain aggregate expenses common to all Funds within the Trust are allocated by the Sponsor to the respective funds based on activity drivers deemed most appropriate by the Sponsor for such expenses, including but not limited to relative assets under management and creation and redeem order activity.
166
These aggregate common expenses include, but are not limited to, legal, auditing, accounting and financial reporting, tax-preparation, regulatory compliance, trading activities, and insurance costs, as well as fees paid to the Distributor, which are included in the related line item in the statements of operations. A portion of these aggregate common expenses are related to the Sponsor or related parties of principals of the Sponsor; these are necessary services to the Funds, which are primarily the cost of performing accounting and financial reporting, regulatory compliance, and trading activities that are directly attributable to the Fund. For the years ended December 31, the Fund recognized $602,637 in 2016, $382,178 in 2015 and $193,111 in 2014, respectively, such expenses, which are primarily recorded in distribution and marketing fees on the statements of operations; of these amounts $87,767 in 2016, $22,364 in 2015 and $5,100 in 2014 were waived by the Sponsor. All asset-based fees and expenses for the Funds are calculated on the prior day’s net assets.
For the year ended December 31, 2016, there were $140,028 of expenses that were identified on the statements of operations of the Fund as expenses that were waived by the Sponsor. The Sponsor has determined that there would be no recovery sought for these amounts in any future period.
For the year ended December 31, 2015 there were $130,716 of expenses that were identified on the statements of operations of the Fund as expenses that were waived by the Sponsor. The Sponsor has determined that there would be no recovery sought for these amounts in any future period.
For the year ended December 31, 2014, there were $31,697 of expenses that were identified on the statements of operations of the Fund as expenses that were waived by the Sponsor. The Sponsor has determined that there would be no recovery sought for these amounts in any future period.
For the year ended December 31, 2013, there were $69,416 of expenses recorded in the financial statements of the Sponsor which were subject to reimbursement by WEAT in 2014. At that time, the Sponsor had determined that recovery of the expense amounts was not probable. In 2014, asset growth and other changes experienced by WEAT enabled the Sponsor to claim reimbursement of $46,302 from the Fund. This amount is reflected in the statements of operations as a reimbursement of previously waived expenses.
Use of Estimates
The preparation of financial statements in conformity with U.S. GAAP requires management to make estimates and assumptions that affect the reported amount of assets and liabilities and disclosure of contingent assets and liabilities at the date of the financial statements, and the reported amounts of the revenue and expenses during the reporting period. Actual results could differ from those estimates.
Fair Value - Definition and Hierarchy
In accordance with U.S. GAAP, fair value is defined as the price that would be received to sell an asset or paid to transfer a liability (i.e., the “exit price”) in an orderly transaction between market participants at the measurement date.
In determining fair value, the Fund uses various valuation approaches. In accordance with U.S. GAAP, a fair value hierarchy for inputs is used in measuring fair value that maximizes the use of observable inputs and minimizes the use of unobservable inputs by requiring that the most observable inputs be used when available. Observable inputs are those that market participants would use in pricing the asset or liability based on market data obtained from sources independent of the Fund. Unobservable inputs reflect the Fund’s assumptions about the inputs market participants would use in pricing the asset or liability developed based on the best information available in the circumstances. The fair value hierarchy is categorized into three levels based on the inputs as follows:
Level 1 - Valuations based on unadjusted quoted prices in active markets for identical assets or liabilities that the Fund has the ability to access. Valuation adjustments and block discounts are not applied to Level 1 financial instruments. Since valuations are based on quoted prices that are readily and regularly available in an active market, valuation of these financial instruments does not entail a significant degree of judgment.
Level 2 - Valuations based on quoted prices in markets that are not active or for which all significant inputs are observable, either directly or indirectly.
Level 3 - Valuations based on inputs that are unobservable and significant to the overall fair value measurement.
The availability of valuation techniques and observable inputs can vary from financial instrument to financial instrument and is affected by a wide variety of factors including, the type of financial instrument, whether the financial instrument is new and not yet established in the marketplace, and other characteristics particular to the transaction. To the extent that valuation is based on models or inputs that are less observable or unobservable in the market, the determination of fair value requires more judgment. Those estimated values do not necessarily represent the amounts that may be ultimately realized due to the occurrence of future circumstances that cannot be reasonably determined. Because of the inherent uncertainty of valuation, those estimated values may be materially higher or lower than the values that would have been used had a ready market for the financial instruments existed. Accordingly, the degree of judgment exercised by the Fund in determining fair value is greatest for financial instruments categorized in Level 3. In certain cases, the inputs used to measure fair value may fall into different levels of the fair value hierarchy. In such cases, for disclosure purposes, the level in the fair value hierarchy, within which the fair value measurement in its entirety falls, is determined based on the lowest level input that is significant to the fair value measurement.
167
Fair value is a market-based measure considered from the perspective of a market participant rather than an entity-specific measure. Therefore, even when market assumptions are not readily available, the Fund’s own assumptions are set to reflect those that market participants would use in pricing the asset or liability at the measurement date. The Fund uses prices and inputs that are current as of the measurement date, including periods of market dislocation. In periods of market dislocation, the observability of prices and inputs may be reduced for many financial instruments. This condition could cause a financial instrument to be reclassified to a lower level within the fair value hierarchy. When such a situation exists on a quarter close, the Sponsor will calculate the NAV on a particular day using the Level 1 valuation, but will later recalculate the NAV for the impacted Fund based upon the valuation inputs from these alternative verifiable sources (Level 2 or Level 3) and will report such NAV in its applicable financial statements and reports.
The determination is made as of the settlement of the futures contracts on the last day of trading for the reporting period. In making the determination of a Level 1 or Level 2 transfer, the Fund considers the average volume of the specific underlying futures contracts traded on the relevant exchange for the years being reported.
On December 31, 2016 and 2015, in the opinion of the Trust and the Fund, the reported value of the Wheat Futures Contracts traded on the CBOT fairly reflected the value of the Wheat Futures Contracts held by the Fund, and no adjustments were necessary. The determination is made as of the settlement of the futures contracts on the last day of trading for the reporting period. In making the determination of a Level 1 or Level 2 transfer, the Fund considers the average volume of the specific underlying futures contracts traded on the relevant exchange for the years being reported.
For the year ended December 31, 2016, the Fund did not have any significant transfers between any of the levels of the fair value hierarchy.
For the quarter ended June 30, 2015, Wheat Futures Contracts traded on the CBOT due to settle on December 14, 2016 (the “DEC16 Wheat Contracts”) did not, in the opinion of the Trust and WEAT, trade in an actively traded futures market as defined in the policy of the Trust and WEAT for the entire period during which they were held. Accordingly, the Trust and WEAT classified these as a Level 2 asset, The DEC16 Wheat Contracts were, in the opinion of the Trust and WEAT, fairly valued at settlement on June 30, 2015. The value of the contracts were $1,178,088, the balance transferred back to a Level 1 asset for the quarter ended September 30, 2015.
The Fund records its derivative activities at fair value. Gains and losses from derivative contracts are included in the statements of operations. Derivative contracts include futures contracts related to commodity prices. Futures, which are listed on a national securities exchange, such as the CBOT and the ICE, or reported on another national market, are generally categorized in Level 1 of the fair value hierarchy. OTC derivatives contracts (such as forward and swap contracts) which may be valued using models, depending on whether significant inputs are observable or unobservable, are categorized in Levels 2 or 3 of the fair value hierarchy.
Expenses
Expenses are recorded using the accrual method of accounting.
Net Income (Loss) per Share
Net income (loss) per Share is the difference between the NAV per unit at the beginning of each period and at the end of each period. The weighted average number of Shares outstanding was computed for purposes of disclosing net income (loss) per weighted average Share. The weighted average Shares are equal to the number of Shares outstanding at the end of the period, adjusted proportionately for Shares created or redeemed based on the amount of time the Shares were outstanding during such period.
New Accounting Pronouncements
The Financial Accounting Standards Board (“FASB”) issued Accounting Standards Update (“ASU”) 2016-19, “Technical Corrections and Improvements”. The amendments in this update represent changes to clarify, correct errors, or make minor improvements to the Accounting Standards Codification. The amendments make the Accounting Standards Codification easier to understand and easier to apply by eliminating inconsistencies and providing clarifications. The amendments are effective for fiscal years, and interim periods with those fiscal years, for all entities beginning after December 15, 2016. The adoption did not have a material impact on the financial statements and disclosures of the Trust or the Fund.
The FASB issued ASU 2016-18, “Statement of Cash Flows (Topic 230)”. The amendments in this update require that a statement of cash flows explain the change during the period in the total of cash, cash equivalents, and amounts generally described as restricted cash or restricted cash equivalents. Therefore, amounts generally described as restricted cash and restricted cash equivalents should be included with cash and cash equivalents when reconciling the beginning-of-period and end-of-period total amounts shown on the statement of cash flows. The amendments are effective for fiscal years beginning after December 15, 2017, and interim periods within those fiscal years. This update is not expected to have a material impact on the financial statements and disclosures of the Trust or the Fund. The Sponsor believes there will be a change in presentation of restricted cash on the statements of cash flows.
The FASB issued ASU 2016-17, “Consolidation (Topic 810): Interests Held through Related Parties That are under Common Control”. The amendments in this update alters how a decision maker needs to consider indirect interests in a variable interest entity (VIE) held through an entity under common control. The new guidance amends ASU 2015-02, Consolidation (Topic 810): Amendments to the Consolidation Analysis, issued in February 2015. The amendments are effective for fiscal years beginning after December 15, 2016, including interim periods within those fiscal years. The adoption did not have a material impact on the financial statements and disclosures of the Trust or the Fund.
168
The FASB issued ASU 2016-15, “Statement of Cash Flows (Topic 230): Classification of Certain Cash Receipts and Cash Payments”. The amendments provide cash flow statement classification guidance. The amendments in this update are effective for fiscal years beginning after December 15, 2017. The Trust and the Fund are currently evaluating the impact on the financial statements and disclosures. The Trust and the Fund do not expect to adopt the guidance until the effective date.
The FASB issued ASU 2014-09 in May 2014, “Revenue from Contracts with Customers (Topic 606),” which replaces the revenue recognition requirements of “Revenue Recognition (Topic 605).” This ASU is based on the principle that revenue is recognized to depict the transfer of goods and services to customers in an amount that reflects the consideration to which the entity expects to be entitled in exchange for those goods or services. This ASU provides new and more detailed guidance on specific topics and expands and improves disclosures about revenue. In August 2015, the FASB issued ASU 2015-14 which defers the effective date of ASU 2014-09 by one year to fiscal years beginning after December 15, 2017. ASU 2015-14 also permits early adoption of ASU 2014-09, but not before the original effective date, which was for fiscal years beginning after December 15, 2016. The Trust and the Fund record income or loss from the recognition and measurement of futures contracts and from interest income under Subtopic 825-10. Revenue from financial instruments which are valued under Subtopic 825 will not be subject to the application of ASU 2014-09 and 2015-14. Therefore, these standards will not apply or have a material impact on the financial statements and disclosures of the Trust or the Fund.
The FASB issued ASU 2016-11, “Revenue Recognition (Topic 605) and Derivatives and Hedging (Topic 815): Rescission of SEC Guidance Because of Accounting Standards Updates 2014-09 and 2014-16 Pursuant to Staff Announcements at the March 3, 2016 EITF Meeting”. The amendments make targeted improvements to clarify the principal versus agent assessment and are intended to make the guidance more operable and lead to more consistent application. The Trust and the Fund record income or loss from the recognition and measurement of futures contracts and from interest income under Subtopic 825-10. Revenue from financial instruments which are valued under Subtopic 825 will not be subject to the application of ASU 2016-11. Therefore, this standard will not apply or have a material impact on the financial statements and disclosures of the Trust or the Fund.
The FASB issued ASU 2016-02, “Leases (Topic 842).” The amendments in this update increase transparency and comparability among organizations by recognizing lease assets and lease liabilities on the balance sheet and disclosing key information about leasing arrangements. The amendments in this update are effective for fiscal years beginning after December 15, 2018. This update is not expected to have a material impact on the financial statements and disclosures of the Trust or the Fund.
The FASB issued ASU 2016-01, “Financial Instruments-Overall (Subtopic 825-10): Recognition and Measurement of Financial Assets and Financial Liabilities.” The amendments in this update are intended to improve the recognitions measurement and disclosure of financial instruments. The amendments to this update are effective for fiscal years beginning after December 15, 2017, and interim periods within those fiscal years. These amendments are required to be applied prospectively. The Trust and the Fund are currently evaluating the impact on the financial statements and disclosures; but based on our review to date we do not expect the update will have a material impact on the financial statements and disclosures of the Trust or the Fund.
The FASB issued ASU 2015-10, “Technical Corrections and Improvements.” The amendments in this update represent changes to clarify the Codification, correct unintended application of guidance, or make minor improvements to the Codification that are not expected to have a significant effect on current accounting practice or create a significant administrative cost to most entities. The amendments are effective for fiscal years beginning after December 15, 2015. The adoption did not have a material impact on the financial statements and disclosures of the Trust or the Fund.
The FASB issued ASU 2015-07, “Fair Value Measurement (Topic 820): Disclosures for Investments in Certain Entities That Calculate Net Asset Value per Share (or Its Equivalent).” The ASU amends ASC 820 to create a practical expedient to measure the fair value of investments in certain entities that do not have a quoted market price but calculate net asset value per share or its equivalent. In addition, the amendments to ASC 820 provide guidance on classifying investments that are measured using the practical expedient in the fair value hierarchy and require specific disclosures for eligible investments, regardless of whether the practical expedient has been applied. The amendments in this Update are effective for fiscal years beginning after December 15, 2015, and interim periods within those fiscal years. These amendments are required to be applied retrospectively to all periods presented. The adoption did not have a material impact on the financial statements and disclosures of the Trust or the Fund.
The FASB issued ASU 2015-06, “Earnings per Share (Topic 260): Effects on Historical Earnings per Unit of Master Limited Partnership Dropdown Transactions.” The amendments specify how earnings (losses) of a transferred business before the date of a dropdown transaction should be allocated to the various interest holders in a master limited partnership for purposes of calculating earning per unit under the two-class method. The amendments to this update are effective for fiscal years beginning after December 15, 2015, and interim periods within those fiscal years. The amendments are required to be applied retrospectively for all periods presented. The adoption did not have a material impact on the financial statements and disclosures of the Trust or the Fund.
The FASB issued ASU 2015-02, “Consolidation (Topic 810): Amendments to the Consolidation Analysis.” The amendments are intended to improve targeted areas of consolidation guidance for legal entities such as limited partnerships, limited liability corporations, and securitization structures. The amendments to this update are effective for periods beginning after December 15, 2015. These amendments are required to be applied retrospectively for all periods presented. The adoption did not have a material impact on the financial statements and disclosures of the Trust or the Fund.
169
The FASB issued ASU 2014-08, “Presentation of Financial Statements (Topic 205) and Property, Plant, and Equipment (Topic 360): Reporting Discontinued Operations and Disclosures of Disposals of Components of an Entity.” The amendments in this update change the requirements for reporting discontinued operations in Subtopic 2015-20. A significant provision of ASU 2014-08 calls for reporting as discontinued operations only those disposals that represent a strategic shift or have a major impact on the entity’s financial results and operations. The Company elected to early adopt this ASU for the year ended December 31, 2014, the adoption did not have a significant impact on the financial statements and disclosures of the Fund.
Note 4 – Fair Value Measurements
The Fund’s assets and liabilities recorded at fair value have been categorized based upon a fair value hierarchy as described in the Fund’s significant accounting policies in Note 3. The following table presents information about the Fund’s assets and liabilities measured at fair value as of December 31, 2016 and December 31, 2015:
December 31, 2016
| Balance as of | ||||||||||||||||
| Assets: | Level 1 | Level 2 | Level 3 | December 31, 2016 | ||||||||||||
| Cash equivalents | $ | 406,927 | $ | — | $ | — | $ | 406,927 | ||||||||
| Balance as of | ||||||||||||||||
| Liabilities: | Level 1 | Level 2 | Level 3 | December 31, 2016 | ||||||||||||
| Wheat futures contracts | $ | 3,921,588 | $ | — | $ | — | $ | 3,921,588 | ||||||||
December 31, 2015
| Balance as of | ||||||||||||||||
| Assets: | Level 1 | Level 2 | Level 3 | December 31, 2015 | ||||||||||||
| Cash equivalents | $ | 1,179,336 | $ | — | $ | — | $ | 1,179,336 | ||||||||
| Balance as of | ||||||||||||||||
| Liabilities: | Level 1 | Level 2 | Level 3 | December 31, 2015 | ||||||||||||
| Wheat futures contracts | $ | 1,924,464 | $ | — | $ | — | $ | 1,924,464 | ||||||||
For the year ended December 31, 2016, the Fund did not have any transfers between any of the level of the fair value hierarchy.
Transfers into and out of each level of the fair value hierarchy for the DEC15 Wheat Contracts, for the period from January 1, 2015 through December 31, 2015 were as follows:
| Transfers | Transfers | Transfers | Transfers | Transfers | Transfers | |||||||||||||||||||
| into | out of | into | out of | into | out of | |||||||||||||||||||
| Level 1 | Level 1 | Level 2 | Level 2 | Level 3 | Level 3 | |||||||||||||||||||
| Assets (at fair value) | ||||||||||||||||||||||||
| Derivative contracts | ||||||||||||||||||||||||
| Wheat future contracts | $ | 1,178,088 | $ | 1,178,088 | $ | 1,178,088 | $ | 1,178,088 | $ | — | $ | — | ||||||||||||
See the Fair Value - Definition and Hierarchy section in Note 3 above for an explanation of the transfers into and out of each level of the fair value hierarchy.
Note 5 – Derivative Instruments and Hedging Activities
In the normal course of business, the Fund utilizes derivative contracts in connection with its proprietary trading activities. Investments in derivative contracts are subject to additional risks that can result in a loss of all or part of an investment. The Fund’s derivative activities and exposure to derivative contracts are classified by the following primary underlying risks: interest rate, credit, commodity price, and equity price risks. In addition to its primary underlying risks, the Fund is also subject to additional counterparty risk due to inability of its counterparties to meet the terms of their contracts. For the years ended December 31, 2016 and 2015, the Fund invested only in commodity futures contracts.
Futures Contracts
The Fund is subject to commodity price risk in the normal course of pursuing its investment objectives. A futures contract represents a commitment for the future purchase or sale of an asset at a specified price on a specified date.
The purchase and sale of futures contracts requires margin deposits with a FCM. Subsequent payments (variation margin) are made or received by the Fund each day, depending on the daily fluctuations in the value of the contract, and are recorded as unrealized gains or losses by the Fund. Futures contracts may reduce the Fund’s exposure to counterparty risk since futures contracts are exchange-traded; and the exchange’s clearinghouse, as the counterparty to all exchange-traded futures, guarantees the futures against default.
170
The Commodity Exchange Act requires an FCM to segregate all customer transactions and assets from the FCM’s proprietary activities. A customer’s cash and other equity deposited with an FCM are considered commingled with all other customer funds subject to the FCM’s segregation requirements. In the event of an FCM’s insolvency, recovery may be limited to the Fund’s pro rata share of segregated customer funds available. It is possible that the recovery amount could be less than the total of cash and other equity deposited.
The following table discloses information about offsetting assets and liabilities presented in the statements of assets and liabilities to enable users of these financial statements to evaluate the effect or potential effect of netting arrangements for recognized assets and liabilities. These recognized assets and liabilities are presented as defined in FASB ASU No. 2011-11 “Balance Sheet (Topic 210): Disclosures about Offsetting Assets and Liabilities” and subsequently clarified in FASB ASU 2013-01 “Balance Sheet (Topic 210): Clarifying the Scope of Disclosures about Offsetting Assets and Liabilities.”
The following table also identifies the fair value amounts of derivative instruments included in the statements of assets and liabilities as derivative contracts, categorized by primary underlying risk and held by the FCM, ED&F Man as of December 31, 2016 and 2015.
Offsetting of Financial Liabilities and Derivative Liabilities as of December 31, 2016
| (i) | (ii) | (iii) = (i) – (ii) | (iv) | (v) = (iii) – (iv) | ||||||||||||||||||||
| Gross Amount Not Offset in the Statement of Assets and Liabilities | ||||||||||||||||||||||||
| Description | Gross Amount of Recognized Liabilities | Gross Amount Offset in the Statement of Assets and Liabilities | Net Amount Presented in the Statement of Assets and Liabilities | Futures Contracts Available for Offset | Collateral, Due from Broker | Net Amount | ||||||||||||||||||
| Commodity price | ||||||||||||||||||||||||
| Wheat futures contracts | $ | 3,921,588 | $ | — | $ | 3,921,588 | $ | — | $ | 3,921,588 | $ | — | ||||||||||||
Offsetting of Financial Liabilities and Derivative Liabilities as of December 31, 2015
| (i) | (ii) | (iii) = (i) – (ii) | (iv) | (v) = (iii) – (iv) | ||||||||||||||||||||
| Gross Amount Not Offset in the Statement of Assets and Liabilities | ||||||||||||||||||||||||
| Description | Gross Amount of Recognized Liabilities | Gross Amount Offset in the Statement of Assets and Liabilities | Net Amount Presented in the Statement of Assets and Liabilities | Futures Contracts Available for Offset | Collateral, Due from Broker | Net Amount | ||||||||||||||||||
| Commodity price | ||||||||||||||||||||||||
| Wheat futures contracts | $ | 1,924,464 | $ | — | $ | 1,924,464 | $ | — | $ | 1,924,464 | $ | — | ||||||||||||
The following is a summary of realized and net change in unrealized gains (losses) of the derivative instruments utilized by the Fund:
Year ended December 31, 2016
| Net Change in Unrealized | ||||||
| Realized Loss on | Appreciation or Depreciation on | |||||
| Commodity Futures Contracts | Commodity Futures Contacts | |||||
| Commodity Price | ||||||
| Wheat futures contracts | $ | (9,631,400) | $ | (1,997,125) |
Year ended December 31, 2015
| Net Change in Unrealized | ||||||
| Realized Loss on | Appreciation or Depreciation on | |||||
| Commodity Futures Contracts | Commodity Futures Contacts | |||||
| Commodity Price | ||||||
| Wheat futures contracts | $ | (4,559,863) | $ | (2,640,963) |
Year ended December 31, 2014
| Net Change in Unrealized | ||||||
| Realized Loss on | Appreciation or Depreciation on | |||||
| Commodity Futures Contracts | Commodity Futures Contacts | |||||
| Commodity Price | ||||||
| Wheat futures contracts | $ | (2,486,162) | $ | 1,415,175 |
171
Volume of Derivative Activities
The average notional market value categorized by primary underlying risk for all futures contracts held was $42.5 million in 2016, $26.6 million in 2015 and $22.5 million in 2014.
Note 6 – Financial Highlights
The following table presents per share performance data and other supplemental financial data for the years ended December 31, 2016, 2015 and 2014. This information has been derived from information presented in the financial statements and is presented with total expenses gross of expenses waived by the Sponsor and with total expenses net of expenses waived by the Sponsor, as appropriate.
| Per Share Operation Performance | Year ended December 31, 2016 | Year ended December 31, 2015 | Year ended December 31, 2014 | |||||||||
| Net asset value at beginning of period | $ | 9.15 | $ | 12.72 | 14.84 | |||||||
| From investment operations: | ||||||||||||
| Investment income | 0.04 | 0.02 | 0.01 | |||||||||
| Net realized and unrealized loss on commodity futures contracts | (1.98 | ) | (3.19 | ) | (1.64 | ) | ||||||
| Total net expenses | (0.32 | ) | (0.40 | ) | (0.49 | ) | ||||||
| Net decrease in net asset value | (2.26 | ) | (3.57 | ) | (2.12 | ) | ||||||
| Net asset value at end of period | $ | 6.89 | $ | 9.15 | 12.72 | |||||||
| Total Return | (24.70 | )% | (28.07 | )% | (14.29 | )% | ||||||
| Ratios to Average Net Assets | ||||||||||||
| Total expenses | 4.47 | % | 4.40 | % | 3.66 | % | ||||||
| Total expense, net | 4.13 | % | 3.89 | % | 3.74 | % | ||||||
| Net investment loss | (3.57 | )% | (3.67 | )% | (3.69 | )% | ||||||
Effective in the third quarter 2015, the financial highlights per share data are calculated consistent with the methodology used to calculate asset-based fees and expenses. In prior periods, the financial highlights per share data are calculated using the average of the daily shares outstanding for the reporting period, which is inclusive of the last day of the period. Any change in methodology was not material to the ratios presented.
Note 7 – Quarterly Financial Data (Unaudited)
The following summarized quarterly financial information presents the results of operations for the Teucrium Wheat Fund and other data for three-month periods ended March 31, June 30, September 30 and December 31, 2016 and 2015.
| First | Second | Third | Fourth | |||||||||||||
| Quarter 2016 | Quarter 2016 | Quarter 2016 | Quarter 2016 | |||||||||||||
| Total Loss | $ | (139,504 | ) | $ | (2,771,883 | ) | $ | (6,298,223 | ) | $ | (2,187,317 | ) | ||||
| Total Expenses | $ | 265,750 | $ | 309,403 | $ | 608,506 | $ | 670,923 | ||||||||
| Total Expenses, net | $ | 265,750 | $ | 309,403 | $ | 558,990 | $ | 580,411 | ||||||||
| Net Loss | $ | (405,254 | ) | $ | (3,081,286 | ) | $ | (6,857,213 | ) | $ | (2,767,728 | ) | ||||
| Net Loss per share | $ | (0.14 | ) | $ | (0.79 | ) | $ | (1.03 | ) | $ | (0.30 | ) | ||||
| First | Second | Third | Fourth | |||||||||||||
| Quarter 2015 | Quarter 2015 | Quarter 2015 | Quarter 2015 | |||||||||||||
| Total (Loss) Income | $ | (2,895,379 | ) | $ | 3,883,225 | $ | (5,771,360 | ) | $ | (2,363,203 | ) | |||||
| Total Expenses | $ | 186,713 | $ | 253,786 | $ | 307,481 | $ | 373,724 | ||||||||
| Total Expenses, net | $ | 172,413 | $ | 236,786 | $ | 296,607 | $ | 285,182 | ||||||||
| Net (Loss) Income | $ | (3,067,792 | ) | $ | 3,646,439 | $ | (6,067,967 | ) | $ | (2,648,385 | ) | |||||
| Net (Loss) Income per share | $ | (1.81 | ) | $ | 1.30 | $ | (2.13 | ) | $ | (0.93 | ) | |||||
Note 8 – Organizational and Offering Costs
Expenses incurred in organizing of the Trust and the initial offering of the Shares of the Fund, including applicable SEC registration fees, were borne directly by the Sponsor. The Fund will not be obligated to reimburse the Sponsor.
Note 9 – Subsequent Events
Management has evaluated the financial statements for the year-ended December 31, 2016 for subsequent events through the date of this filing and noted no material events requiring either recognition through the date of the filing or disclosure herein for the Fund.
172
Report of Independent Registered Public Accounting Firm
To the Sponsor and Shareholders of
Teucrium Agricultural Fund
We have audited the accompanying statements of assets and liabilities of Teucrium Agricultural Fund (the “Fund”), including the schedules of investments, as of December 31, 2016 and 2015, and the related statements of operations, changes in net assets, and cash flows for each of the three years in the period ended December 31, 2016. These financial statements are the responsibility of the Fund’s management. Our responsibility is to express an opinion on these financial statements based on our audits.
We conducted our audits in accordance with the standards of the Public Company Accounting Oversight Board (United States). Those standards require that we plan and perform the audit to obtain reasonable assurance about whether the financial statements are free of material misstatement. An audit includes examining, on a test basis, evidence supporting the amounts and disclosures in the financial statements. An audit also includes assessing the accounting principles used and significant estimates made by management, as well as evaluating the overall financial statement presentation. We believe that our audits provide a reasonable basis for our opinion.
In our opinion, the financial statements referred to above present fairly, in all material respects, the financial position of Teucrium Agricultural Fund as of December 31, 2016 and 2015, and the results of its operations and its cash flows for each of the three years in the period ended December 31, 2016 in conformity with accounting principles generally accepted in the United States of America.
We also have audited, in accordance with the standards of the Public Company Accounting Oversight Board (United States), the Fund’s internal control over financial reporting as of December 31, 2016, based on criteria established in the 2013 Internal Control—Integrated Framework issued by the Committee of Sponsoring Organizations of the Treadway Commission (COSO), and our report dated March 16, 2017 expressed an unqualified opinion.
/s/ GRANT THORNTON LLP
New York, New York
March 16, 2017
| 173 |
Report of Independent Registered Public Accounting Firm
To the Sponsor and Shareholders of
Teucrium Agricultural Fund
We have audited the internal control over financial reporting of Teucrium Agricultural Fund (the “Fund”) as of December 31, 2016, based on criteria established in the 2013 Internal Control—Integrated Framework issued by the Committee of Sponsoring Organizations of the Treadway Commission (COSO). The Fund’s management is responsible for maintaining effective internal control over financial reporting and for its assessment of the effectiveness of internal control over financial reporting, included in the accompanying Management’s Report on Internal Control over Financial Reporting. Our responsibility is to express an opinion on the Fund’s internal control over financial reporting based on our audit.
We conducted our audit in accordance with the standards of the Public Company Accounting Oversight Board (United States). Those standards require that we plan and perform the audit to obtain reasonable assurance about whether effective internal control over financial reporting was maintained in all material respects. Our audit included obtaining an understanding of internal control over financial reporting, assessing the risk that a material weakness exists, testing and evaluating the design and operating effectiveness of internal control based on the assessed risk, and performing such other procedures as we considered necessary in the circumstances. We believe that our audit provides a reasonable basis for our opinion.
A fund’s internal control over financial reporting is a process designed to provide reasonable assurance regarding the reliability of financial reporting and the preparation of financial statements for external purposes in accordance with generally accepted accounting principles. A fund’s internal control over financial reporting includes those policies and procedures that (1) pertain to the maintenance of records that, in reasonable detail, accurately and fairly reflect the transactions and dispositions of the assets of the fund; (2) provide reasonable assurance that transactions are recorded as necessary to permit preparation of financial statements in accordance with generally accepted accounting principles, and that receipts and expenditures of the fund are being made only in accordance with authorizations of management and directors of the fund; and (3) provide reasonable assurance regarding prevention or timely detection of unauthorized acquisition, use, or disposition of the fund’s assets that could have a material effect on the financial statements.
Because of its inherent limitations, internal control over financial reporting may not prevent or detect misstatements. Also, projections of any evaluation of effectiveness to future periods are subject to the risk that controls may become inadequate because of changes in conditions, or that the degree of compliance with the policies or procedures may deteriorate.
In our opinion, the Fund maintained, in all material respects, effective internal control over financial reporting as of December 31, 2016, based on criteria established in the 2013 Internal Control—Integrated Framework issued by COSO.
We also have audited, in accordance with the standards of the Public Company Accounting Oversight Board (United States), the financial statements of the Fund as of and for the year ended December 31, 2016, and our report dated March 16, 2017 expressed an unqualified opinion on those financial statements.
/s/ GRANT THORNTON LLP
New York, New York
March 16, 2017
| 174 |
TEUCRIUM AGRICULTURAL FUND
STATEMENTS OF ASSETS AND LIABILITIES
| December 31, 2016 | December 31, 2015 | |||||||
| Assets | ||||||||
| Cash equivalents | $ | 2,360 | $ | 1,815 | ||||
| Interest receivable | 1 | — | ||||||
| Other assets | 508 | 2,974 | ||||||
| Equity in trading accounts: | ||||||||
| Investments in securities, at fair value (cost $2,033,919 and $2,126,379 as of December 31, 2016 and December 31, 2015, respectively) | 1,313,554 | 1,324,601 | ||||||
| Total assets | 1,316,423 | 1,329,390 | ||||||
| Liabilities | ||||||||
| Other liabilities | 53 | — | ||||||
| Net assets | $ | 1,316,370 | $ | 1,329,390 | ||||
| Shares outstanding | 50,002 | 50,002 | ||||||
| Net asset value per share | $ | 26.33 | $ | 26.59 | ||||
| Market value per share | $ | 25.68 | $ | 26.47 | ||||
The accompanying notes are an integral part of these financial statements.
| 175 |
TEUCRIUM AGRICULTURAL FUND
December 31, 2016
| Percentage of | ||||||||||||
| Description: Assets | Fair Value | Net Assets | Shares | |||||||||
| Exchange-traded funds | ||||||||||||
| Teucrium Corn Fund | $ | 323,979 | 24.61 | % | 17,258 | |||||||
| Teucrium Soybean Fund | 315,486 | 23.97 | 16,531 | |||||||||
| Teucrium Sugar Fund | 342,822 | 26.04 | 26,424 | |||||||||
| Teucrium Wheat Fund | 331,267 | 25.17 | 48,087 | |||||||||
| Total exchange-traded funds (cost $2,033,919) | $ | 1,313,554 | 99.79 | % | ||||||||
| Cash equivalents | ||||||||||||
| Money market funds | ||||||||||||
| Fidelity Institutional Money Market Funds - Government Portfolio (cost $2,360) | $ | 2,360 | 0.18 | % | 2,360 | |||||||
The accompanying notes are an integral part of these financial statements.
| 176 |
TEUCRIUM AGRICULTURAL FUND
SCHEDULE OF INVESTMENTS
December 31, 2015
| Percentage of | ||||||||||||
| Description: Assets | Fair Value | Net Assets | Shares | |||||||||
| Exchange-traded funds | ||||||||||||
| Teucrium Corn Fund | $ | 326,157 | 24.53 | % | 15,358 | |||||||
| Teucrium Soybean Fund | 331,730 | 24.95 | 19,131 | |||||||||
| Teucrium Sugar Fund | 345,281 | 25.97 | 34,474 | |||||||||
| Teucrium Wheat Fund | 321,433 | 24.18 | 35,137 | |||||||||
| Total exchange-traded funds (cost $2,126,379) | $ | 1,324,601 | 99.63 | % | ||||||||
| Cash equivalents | ||||||||||||
| Money market funds | ||||||||||||
| Fidelity Institutional Prime Money Market Portfolio (cost $1,815) | $ | 1,815 | 0.14 | % | 1,815 | |||||||
The accompanying notes are an integral part of these financial statements.
| 177 |
TEUCRIUM AGRICULTURAL FUND
| Year ended | Year ended | Year ended | ||||||||||
| December 31, 2016 | December 31, 2015 | December 31, 2014 | ||||||||||
| Income | ||||||||||||
| Realized and unrealized gain (loss) on trading of securities: | ||||||||||||
| Realized loss on securities | $ | (87,644 | ) | $ | (266,180 | ) | $ | (183,067 | ) | |||
| Net change in unrealized appreciation or depreciation on securities | 81,413 | (50,002 | ) | (51,434 | ) | |||||||
| Interest income (loss) | 11 | (4 | ) | (8 | ) | |||||||
| Total loss | (6,220 | ) | (316,186 | ) | (234,509 | ) | ||||||
| Expenses | ||||||||||||
| Professional fees | 12,160 | 25,101 | 34,828 | |||||||||
| Distribution and marketing fees | 15,738 | 16,253 | 20,981 | |||||||||
| Custodian fees and expenses | 2,566 | 133,965 | 1,506 | |||||||||
| Business permits and licenses fees | 12,141 | 15,540 | 19,036 | |||||||||
| General and administrative expenses | 1,873 | 8,732 | 9,092 | |||||||||
| Brokerage commissions | 223 | — | — | |||||||||
| Other expenses | 558 | 645 | 854 | |||||||||
| Total expenses | 45,259 | 200,236 | 86,297 | |||||||||
| Expenses waived by the Sponsor | (38,459 | ) | (193,063 | ) | (77,113 | ) | ||||||
| Total expenses, net | 6,800 | 7,173 | 9,184 | |||||||||
| Net loss | $ | (13,020 | ) | $ | (323,359 | ) | $ | (243,693 | ) | |||
| Net loss per share | $ | (0.26 | ) | $ | (6.46 | ) | $ | (4.88 | ) | |||
| Net loss per weighted average share | $ | (0.26 | ) | $ | (6.47 | ) | $ | (4.87 | ) | |||
| Weighted average shares outstanding | 50,002 | 50,002 | 50,002 | |||||||||
The accompanying notes are an integral part of these financial statements.
| 178 |
TEUCRIUM AGRICULTURAL FUND
STATEMENTS OF CHANGES IN NET ASSETS
| Year ended | Year ended | Year ended | ||||||||||
| December 31, 2016 | December 31, 2015 | December 31, 2014 | ||||||||||
| Operations | ||||||||||||
| Net loss | $ | (13,020 | ) | $ | (323,359 | ) | $ | (243,693 | ) | |||
| Net change in net assets | (13,020 | ) | (323,359 | ) | (243,693 | ) | ||||||
| Net assets, beginning of period | $ | 1,329,390 | $ | 1,652,749 | $ | 1,896,442 | ||||||
| Net assets, end of period | $ | 1,316,370 | $ | 1,329,390 | $ | 1,652,749 | ||||||
| Net asset value per share at beginning of period | $ | 26.59 | $ | 33.05 | $ | 37.93 | ||||||
| Net asset value per share at end of period | $ | 26.33 | $ | 26.59 | $ | 33.05 | ||||||
| Creation of Shares | — | — | — | |||||||||
| Redemption of Shares | — | — | — | |||||||||
The accompanying notes are an integral part of these financial statements.
| 179 |
TEUCRIUM AGRICULTURAL FUND
| Year ended | Year ended | Year ended | ||||||||||
| December 31, 2016 | December 31, 2015 | December 31, 2014 | ||||||||||
| Cash flows from operating activities: | ||||||||||||
| Net loss | $ | (13,020 | ) | $ | (323,359 | ) | $ | (243,693 | ) | |||
| Adjustments to reconcile net loss to net cash provided by (used in) operating activities: | ||||||||||||
| Net change in unrealized appreciation or depreciation on securities | (81,413 | ) | 50,002 | 51,434 | ||||||||
| Changes in operating assets and liabilities: | ||||||||||||
| Net sale of investments in securities | 92,460 | 266,498 | 192,461 | |||||||||
| Interest receivable | (1 | ) | ||||||||||
| Other assets | 2,466 | 7,027 | (1,435 | ) | ||||||||
| Other liabilities | 53 | — | — | |||||||||
| Net cash provided by (used in) operating activities | 545 | 168 | (1,233 | ) | ||||||||
| Net change in cash equivalents | 545 | 168 | (1,233 | ) | ||||||||
| Cash equivalents, beginning of period | 1,815 | 1,647 | 2,880 | |||||||||
| Cash equivalents, end of period | $ | 2,360 | $ | 1,815 | $ | 1,647 | ||||||
The accompanying notes are an integral part of these financial statements.
| 180 |
December 31, 2016
Note 1 — Organization and Business
Teucrium Agricultural Fund (referred to herein as “TAGS” or the “Fund”) is a series of Teucrium Commodity Trust (“Trust”), a Delaware statutory trust organized on September 11, 2009. The Fund operates pursuant to the Trust’s Second Amended and Restated Declaration of Trust and Trust Agreement (the “Trust Agreement”). The Fund was formed on March 29, 2011 and is managed and controlled by Teucrium Trading, LLC (the “Sponsor”). The Sponsor is a limited liability company formed in Delaware on July 28, 2009 that is registered as a commodity pool operator (“CPO”) with the Commodity Futures Trading Commission (“CFTC”) and is a member of the National Futures Association (“NFA”).
On April 22, 2011, a registration statement was filed with the Securities and Exchange Commission (“SEC”). On February 10, 2012, the Fund’s initial registration of 5,000,000 shares on Form S-1 was declared effective by the SEC. On March 28, 2012, the Fund listed its shares on the NYSE Arca under the ticker symbol “TAGS.” On the business day prior to that, the Fund issued 300,000 shares in exchange for $15,000,000 at the Fund’s initial NAV of $50 per share. The Fund also commenced investment operations on March 28, 2012 by purchasing shares of the Underlying Funds. On December 31, 2011, the Fund had two shares outstanding, which were owned by the Sponsor. On April 30, 2015, a subsequent registration statement for TAGS was declared effective by the SEC.
The investment objective of the TAGS is to have the daily changes in percentage terms of the NAV of its Shares reflect the daily changes in percentage terms of a weighted average (the “Underlying Fund Average”) of the NAVs per share of four other commodity pools that are series of the Trust and are sponsored by the Sponsor: the Teucrium Corn Fund, the Teucrium Wheat Fund, the Teucrium Soybean Fund and the Teucrium Sugar Fund (collectively, the “Underlying Funds”). The Underlying Fund Average will have a weighting of 25% to each Underlying Fund, and the Fund’s assets will be rebalanced, generally on a daily basis, to maintain the approximate 25% allocation to each Underlying Fund.
The investment objective of each Underlying Fund is to have the daily changes in percentage terms of its shares’ NAV reflect the daily changes in percentage terms of a weighted average of the closing settlement prices for certain Futures Contracts for the commodity specified in the Underlying Fund’s name. (This weighted average is referred to herein as the Underlying Fund’s “Benchmark,” the Futures Contracts that at any given time make up an Underlying Fund’s Benchmark are referred to herein as the Underlying Fund’s “Benchmark Component Futures Contracts,” and the commodity specified in the Underlying Fund’s name is referred to herein as its “Specified Commodity.”) Specifically, the Teucrium Corn Fund’s Benchmark is: (1) the second-to-expire Futures Contract for corn traded on the Chicago Board of Trade (“CBOT”), weighted 35%, (2) the third-to-expire CBOT corn Futures Contract, weighted 30%, and (3) the CBOT corn Futures Contract expiring in the December following the expiration month of the third-to-expire contract, weighted 35%. The Teucrium Wheat Fund’s Benchmark is: (1) the second-to-expire CBOT wheat Futures Contract, weighted 35%, (2) the third-to-expire CBOT wheat Futures Contract, weighted 30%, and (3) the CBOT wheat Futures Contract expiring in the December following the expiration month of the third-to-expire contract, weighted 35%. The Teucrium Soybean Fund’s Benchmark is: (1) the second-to-expire CBOT soybean Futures Contract, weighted 35%, (2) the third-to-expire CBOT soybean Futures Contract, weighted 30%, and (3) the CBOT soybean Futures Contract expiring in the November following the expiration month of the third-to-expire contract, weighted 35%, except that CBOT soybean Futures Contracts expiring in August and September will not be part of the Teucrium Soybean Fund’s Benchmark because of the less liquid market for these Futures Contracts. The Teucrium Sugar Fund’s Benchmark is: (1) the second-to-expire Sugar No. 11 Futures Contract traded on ICE Futures US (“ICE Futures”), weighted 35%, (2) the third-to-expire ICE Futures Sugar No. 11 Futures Contract, weighted 30%, and (3) the ICE Futures Sugar No. 11 Futures Contract expiring in the March following the expiration month of the third-to-expire contract, weighted 35%.
While the Fund expects to maintain substantially all of its assets in shares of the Underlying Funds at all times, the Fund may hold some residual amount of assets in obligations of the United States government (“Treasury Securities”) or cash equivalents, and/or merely hold such assets in cash (generally in interest-bearing accounts). The Underlying Funds invest in Commodity Interests to the fullest extent possible without being leveraged or unable to satisfy their expected current or potential margin or collateral obligations with respect to their investments in Commodity Interests. After fulfilling such margin and collateral requirements, the Underlying Funds will invest the remainder of the proceeds from the sale of baskets in Treasury Securities or cash equivalents, and/or merely hold such assets in cash. Therefore, the focus of the Sponsor in managing the Underlying Funds is investing in Commodity Interests and in Treasury Securities, cash and/or cash equivalents. The Fund and Underlying Funds will earn interest income from the Treasury Securities and/or cash equivalents that it purchases and on the cash it holds through the Fund’s custodian.
Subject to the terms of the Trust Agreement, Teucrium Trading, LLC, in its capacity as the Sponsor (“Sponsor”), may terminate a Fund at any time, regardless of whether the Fund has incurred losses, including, for instance, if it determines that the Fund’s aggregate net assets in relation to its operating expenses make the continued operation of the Fund unreasonable or imprudent. However, no level of losses will require the Sponsor to terminate a Fund.
Note 2 – Principal Contracts and Agreements
On August 17, 2015 (the “Conversion Date”), U.S. Bank N.A. replaced The Bank of New York Mellon as the Custodian for the Fund. The principal business address for U.S. Bank N.A. is 1555 North Rivercenter Drive, Suite 302, Milwaukee, Wisconsin 53212. U.S. Bank N.A. is a Wisconsin state chartered bank subject to regulation by the Board of Governors of the Federal Reserve System and the Wisconsin State Banking Department. The principal address for U.S. Bancorp Fund Services, LLC (“USBFS”), is 777 East Wisconsin Avenue, Milwaukee, Wi, 53202. In addition, effective on the Conversion Date, USBFS, a wholly owned subsidiary of U.S. Bank, commenced serving as administrator for each Fund, performing certain administrative and accounting services and preparing certain SEC reports on behalf of the Funds, and also became the registrar and transfer agent for each Fund’s Shares. For such services, U.S. Bank and USBFS will receive an asset-based fee, subject to a minimum annual fee.
181
Given this conversion, the Sponsor has, for the year-ended December 31, 2015, reflected an expense, before and after fees waived by the Sponsor, for fees associated with Custodian, Fund Administration and Transfer Agent services (“Custodian Fees”) that have or will be paid to the Bank of New York Mellon by a Fund or by the Sponsor on behalf of a Fund.
For custody services, the Funds will pay to U.S. Bank N.A. 0.0075% of average gross assets up to $1 billion, and .0050% of average gross assets over $1 billion, annually, plus certain per-transaction charges. For Transfer Agency, Fund Accounting and Fund Administration services, which are based on the total assets for all the Funds in the Trust, the Funds will pay to USBFS 0.06% of average gross assets on the first $250 million, 0.05% on the next $250 million, 0.04% on the next $500 million and 0.03% on the balance over $1 billion annually. A combined minimum annual fee of up to $64,500 for custody, transfer agency, accounting and administrative services is assessed per Fund. For the years ended December 31, 2015, such expenses include both the fees for the Bank of New York Mellon and U.S. Bank. For the years ended December 31, the Fund recognized $2,566 in 2016, $133,965 in 2015 and $1,506 in 2014, respectively, for these services, which is recorded in custodian fees and expenses on the statements of operations; of this expense $2,175 in 2016, $133,965 in 2015 and $1,506 in 2014 was waived by the Sponsor.
The Sponsor and the Trust employ Foreside Fund Services, LLC (“Foreside” or the “Distributor”) as the Distributor for the Funds. The Distribution Services Agreement among the Distributor, the Sponsor and the Trust calls for the Distributor to work with the Custodian in connection with the receipt and processing of orders for Creation Baskets and Redemption Baskets and the review and approval of all Fund sales literature and advertising materials. The Distributor and the Sponsor have also entered into a Securities Activities and Service Agreement (the “SASA”) under which certain employees and officers of the Sponsor are licensed as registered representatives or registered principals of the Distributor, under Financial Industry Regulatory Authority (“FINRA”) rules. For its services as the Distributor, Foreside receives a fee of 0.01% of the Fund’s average daily net assets and an aggregate annual fee of $100,000 for all Teucrium Funds, along with certain expense reimbursements. For its services under the SASA, Foreside receives a fee of $5,000 per registered representative and $1,000 per registered location. For the years ended December 31, the Fund recognized $1,119 in 2016, $1,240 in 2015 and $1,850 in 2014, respectively, for these services, which is recorded in distribution and marketing fees on the statements of operations; of this expense $931 in 2016, $1,240 in 2015 and $1,850 in 2015 was waived by the Sponsor.
For the year ended December 31, 2014, Newedge USA, LLC (“Newedge USA”) served as the Funds’ futures commission merchant (“FCM”) and primary clearing broker to execute and clear the Funds’ futures transactions and provide other brokerage-related services. In 2014, the Funds introduced the use of Jefferies LLC (“Jefferies”), for the execution and clearing of the Funds’ futures and options, if any, on futures transactions. On January 2, 2015, Newedge USA, LLC (“Newedge USA”) merged with and into SG Americas Securities, LLC (“SG”), with the latter as the surviving entity. On February 6, 2015 Jefferies LLC (“Jefferies”) became the Funds’ FCM and primary clearing broker. All futures contracts held by SG were transferred to Jefferies on that date. As of February 23, 2015 all residual cash balances held at SG had been transferred to Jefferies and the balance in all SG accounts was $0. Effective June 3, 2015, ED&F Man Capital Markets Inc. (“ED&F Man”) replaced Jefferies as the Underlying Funds’ FCM and the clearing broker to execute and clear the Underlying Fund’s futures and provide other brokerage-related services. As of June 4, 2015 all futures contracts and residual cash balances of the Underlying Funds held at Jefferies had been transferred to ED&F Man and the balance in all Jefferies accounts was $0.
Currently, ED&F Man serves as the Underlying Funds’ clearing broker to execute and clear the Underlying Funds’ futures and provide other brokerage-related services. ED&F Man is registered as a FCM with the U.S. CFTC and is a member of the NFA. ED&F Man is also registered as a broker/dealer with the U.S. Securities and Exchange Commission and is a member of the FINRA. ED&F Man is a clearing member of ICE Futures U.S., Inc., Chicago Board of Trade, Chicago Mercantile Exchange, New York Mercantile Exchange, and all other major United States commodity exchanges. For Corn, Soybean, Sugar and Wheat Futures Contracts ED&F Man, Jefferies and SG were paid $8.00 per round turn in 2015 and 2014. Effective January 1, 2016, ED&F Man, increased the per round-term charge for futures contracts commission to $9.00. The Bank of New York Mellon serves as the broker for the Fund. For the years ended December 31, the Fund recognized $223 in 2016, $0 in 2015 and $0 in 2014, respectively, for these services, which is recorded in brokerage commissions on the statements of operations and was paid for by the Fund.
The sole Trustee of the Trust is Wilmington Trust Company, a Delaware banking corporation. The Trustee will accept service of legal process on the Trust in the State of Delaware and will make certain filings under the Delaware Statutory Trust Act. For its services, the Trustee receives an annual fee of $3,300 from the Trust. For the years ended December 31, the Fund recognized $21 in 2016, $24 in 2015 and $29 in 2014, respectively, for these services, which is recorded in business permits and licenses fees on the statements of operations; the total expense recognized in each year was waived by the Sponsor.
Note 3 – Summary of Significant Accounting Policies
Basis of Presentation
The accompanying financial statements have been prepared in accordance with accounting principles generally accepted in the United States of America (“U.S. GAAP”) as detailed in the Financial Accounting Standards Board’s Accounting Standards Codification.
Reclassifications
Certain amounts in prior periods have been reclassified to conform to current period presentation.
182
Revenue Recognition
Investment transactions are accounted for on a trade-date basis. All such transactions are recorded on the identified cost basis and marked to market daily. Unrealized appreciation or depreciation on investments are reflected in the statements of assets and liabilities as the difference between the original amount and the fair market value as of the last business day of the year or as of the last date of the financial statements. Changes in the appreciation or depreciation between periods are reflected in the statements of operations.
Brokerage Commissions
Brokerage commissions are accrued on the trade date and on a full-turn basis.
Income Taxes
The Fund will be treated as a partnership for United States federal income tax purposes. The Fund does not record a provision for income taxes because the shareholders report their share of the Fund’s income or loss on their income tax returns. The financial statements reflect the Fund’s transactions without adjustment, if any, required for income tax purposes.
The Fund is required to determine whether a tax position is more likely than not to be sustained upon examination by the applicable taxing authority, including resolution of any related appeals or litigation processes, based on the technical merits of the position. The Fund files an income tax return in the U.S. federal jurisdiction, and may file income tax returns in various U.S. states and foreign jurisdictions. For all tax years 2013 to 2016, the Fund remains subject to income tax examinations by major taxing authorities. The tax benefit recognized is measured as the largest amount of benefit that has a greater than fifty percent likelihood of being realized upon ultimate settlement. De-recognition of a tax benefit previously recognized results in the Fund recording a tax liability that reduces net assets. This policy has been applied to all existing tax positions upon the Fund’s initial adoption. Based on its analysis, the Fund has determined that it has not incurred any liability for unrecognized tax benefits as of and for the years ended December 31, 2016, 2015, 2014 and 2013. However, the Fund’s conclusions regarding this policy may be subject to review and adjustment at a later date based on factors including, but not limited to, ongoing analysis of and changes to tax laws, regulations, and interpretations thereof.
The Fund recognizes interest accrued related to unrecognized tax benefits and penalties related to unrecognized tax benefits in income tax fees payable, if assessed. No interest expense or penalties have been recognized as of and for the years ended December 31, 2016, 2015 and 2014.
The Fund may be subject to potential examination by U.S. federal, U.S. state, or foreign jurisdictional authorities in the area of income taxes. These potential examinations may include questioning the timing and amount of deductions, the nexus of income among various tax jurisdictions, and compliance with U.S. federal, U.S. state and foreign tax laws. The Fund’s management does not expect that the total amount of unrecognized tax benefits will materially change over the next twelve months.
Creations and Redemptions
Authorized Purchasers may purchase Creation Baskets consisting of 25,000 shares from the Fund. The amount of the proceeds required to purchase a Creation Basket will be equal to the NAV of the shares in the Creation Basket determined as of 4:00 p.m. New York time on the day the order to create the basket is properly received.
Authorized Purchasers may redeem shares from the Fund only in blocks of 25,000 shares called “Redemption Baskets.” The amount of the redemption proceeds for a Redemption Basket will be equal to the NAV of the shares in the Redemption Basket determined as of 4:00 p.m. New York time on the day the order to redeem the basket is properly received.
The Fund will receive the proceeds from shares sold or will pay for redeemed shares within three business days after the trade date of the purchase or redemption, respectively. The amounts due from Authorized Purchasers will be reflected in the Fund’s statements of assets and liabilities as receivable for shares sold. Amounts payable to Authorized Purchasers upon redemption will be reflected in the Fund’s statements of assets and liabilities as payable for shares redeemed.
As outlined in the most recent Form S-1 filing, 50,000 shares represents two Redemption Baskets for the Fund and a minimum level of shares.
Effective August 2, 2012, the Fund was at 50,002 shares outstanding which represents a minimum number of shares and there can be no further redemptions until additional shares are created.
Allocation of Shareholder Income and Losses
Profit or loss is allocated among the shareholders of the Fund in proportion to the number of shares each shareholder holds as of the close of each month.
183
Cash Equivalents
Cash equivalents are highly-liquid investments with maturity dates of 90 days or less when acquired. The Fund reported its cash equivalents in the statements of assets and liabilities at market value, or at carrying amounts that approximate fair value, because of their highly-liquid nature and short-term maturities. The Fund has these balances of its assets on deposit with banks. Assets deposited with the bank may, at times, exceed federally insured limits. TAGS had a balance of $2,360 and $1,815 in money market funds at December 31, 2016 and December 31, 2015, respectively; these balances are included in cash equivalents on the statements of assets and liabilities.
Payable/Receivable for Securities Purchased/Sold
Due from/to broker for investments in securities are securities transactions pending settlement. The Fund is subject to credit risk to the extent any broker with whom it conducts business is unable to fulfill contractual obligations on its behalf. The management of the Funds monitors the financial condition of such brokers and does not anticipate any losses from these counterparties.
Calculation of Net Asset Value
The Fund’s NAV is calculated by:
| ● | Taking the current market value of its total assets and |
| ● | Subtracting any liabilities. |
The administrator, USBFS, will calculate the NAV of the Fund once each trading day. It will calculate the NAV as of the earlier of the close of the New York Stock Exchange or 4:00 p.m. New York time. The NAV for a particular trading day will be released after 4:15 p.m. New York time.
For purposes of the determining the Fund’s NAV, the Fund’s investments in the Underlying Funds will be valued based on the Underlying Funds’ NAVs. In turn, in determining the value of the Futures Contracts held by the Underlying Funds, the Administrator will use the closing price on the exchange on which they are traded. The Administrator will determine the value of all other Fund and Underlying Fund investments as of the earlier of the close of the New York Stock Exchange or 4:00 p.m. New York time, in accordance with the current Services Agreement between the Administrator and the Trust. The value of over-the-counter Commodity Interests will be determined based on the value of the commodity or Futures Contract underlying such Commodity Interest, except that a fair value may be determined if the Sponsor believes that the Underlying Fund is subject to significant credit risk relating to the counterparty to such Commodity Interest. For purposes of financial statements and reports, the Sponsor will recalculate the NAV of an Underlying Fund where necessary to reflect the “fair value” of a Futures Contract held by an Underlying Fund when a Futures Contract held by an Underlying Fund closes at its price fluctuation limit for the day. Treasury Securities held by the Fund or Underlying Funds will be valued by the Administrator using values received from recognized third-party vendors (such as Reuters) and dealer quotes. NAV will include any unrealized profit or loss on open Commodity Interests and any other credit or debit accruing to the Fund but unpaid or not received by the Fund.
Sponsor Fee, Allocation of Expenses and Related Party Transactions
The Fund pays no direct management fees to the Sponsor. The Underlying Funds are contractually obligated to pay a monthly management fee to the Sponsor, based on average daily net assets, at a rate equal to 1.00% per annum; these fees are recognized in the statements contained in this Form 10-K for each of the Underlying Funds. The Fund pays for all brokerage fees, taxes and other expenses, including licensing fees for the use of intellectual property, registration or other fees paid to the SEC, FINRA, formerly the National Association of Securities Dealers, or any other regulatory agency in connection with the offer and sale of subsequent Shares after its initial registration and all legal, accounting, printing and other expenses associated therewith. The Fund also pays its portion of the fees and expenses for services directly attributable to the Fund such as accounting, financial reporting, regulatory compliance and trading activities, which the Sponsor elected not to outsource. The Sponsor may, at its discretion waive the payment by the Fund of certain expenses. This election is subject to change by the Sponsor, at its discretion. Certain aggregate expenses common to all Funds within the Trust are allocated by the Sponsor to the respective funds based on activity drivers deemed most appropriate by the Sponsor for such expenses, including but not limited to relative assets under management and creation and redeem order activity.
These aggregate common expenses include, but are not limited to, legal, auditing, accounting and financial reporting, tax-preparation, regulatory compliance, trading activities, and insurance costs, as well as fees paid to the Distributor, which are included in the related line item in the statements of operations. A portion of these aggregate common expenses are related to the Sponsor or related parties of principals of the Sponsor; these are necessary services to the Funds, which are primarily the cost of performing accounting and financial reporting, regulatory compliance, and trading activities that are directly attributable to the Fund. The Sponsor has the ability to elect to pay certain expenses on behalf of the Fund. This election is subject to change by the Sponsor, at its discretion. For the years ended December 31, the Fund recognized $14,004 in 2016, $13,329 in 2015 and $16,234 in 2014, respectively, such expenses, which are primarily recorded in distribution and marketing fees on the statements of operations; of these amounts $11,975 in 2016, $13,329 in 2015 and $16,234 in 2014 were waived by the Sponsor. All asset-based fees and expenses for the Funds are calculated on the prior day’s net assets. The Sponsor can elect to adjust the daily expense accruals at its discretion.
For the year ended December 31, 2016, there were $38,459 of expenses that were identified on the statements of operations of the Fund as expenses that were waived by the Sponsor. The Sponsor has determined that there would be no recovery sought for these amounts in any future period.
184
For the year ended December 31, 2015, there were $193,063 of expenses that were identified on the statements of operations of the Fund as expenses that were waived by the Sponsor. The Sponsor has determined that there would be no recovery sought for these amounts in any future period.
For the year ended December 31, 2014, there were $77,113 of expenses that were identified on the statements of operations of the Fund as expenses that were waived by the Sponsor. The Sponsor has determined that there would be no recovery sought for these amounts in any future period.
Expenses
Expenses are recorded using the accrual method of accounting.
Use of Estimates
The preparation of financial statements in conformity with accounting principles generally accepted in the United States of America requires management to make estimates and assumptions that affect the reported amount of assets and liabilities and disclosure of contingent assets and liabilities at the date of the financial statements, and the reported amounts of the revenue and expenses during the reporting period. Actual results could differ from those estimates.
New Accounting Pronouncements
The Financial Accounting Standards Board (“FASB”) issued Accounting Standards Update (“ASU”) 2016-19, “Technical Corrections and Improvements”. The amendments in this update represent changes to clarify, correct errors, or make minor improvements to the Accounting Standards Codification. The amendments make the Accounting Standards Codification easier to understand and easier to apply by eliminating inconsistencies and providing clarifications. The amendments are effective for fiscal years, and interim periods with those fiscal years, for all entities beginning after December 15, 2016. The adoption did not have a material impact on the financial statements and disclosures of the Trust or the Fund.
The FASB issued ASU 2016-18, “Statement of Cash Flows (Topic 230)”. The amendments in this update require that a statement of cash flows explain the change during the period in the total of cash, cash equivalents, and amounts generally described as restricted cash or restricted cash equivalents. Therefore, amounts generally described as restricted cash and restricted cash equivalents should be included with cash and cash equivalents when reconciling the beginning-of-period and end-of-period total amounts shown on the statement of cash flows. The amendments are effective for fiscal years beginning after December 15, 2017, and interim periods within those fiscal years. This update is not expected to have a material impact on the financial statements and disclosures of the Trust or the Fund. The Sponsor believes there will be a change in presentation of restricted cash on the statements of cash flows.
The FASB issued ASU 2016-17, “Consolidation (Topic 810): Interests Held through Related Parties That are under Common Control”. The amendments in this update alters how a decision maker needs to consider indirect interests in a variable interest entity (VIE) held through an entity under common control. The new guidance amends ASU 2015-02, Consolidation (Topic 810): Amendments to the Consolidation Analysis, issued in February 2015. The amendments are effective for fiscal years beginning after December 15, 2016, including interim periods within those fiscal years. The adoption did not have a material impact on the financial statements and disclosures of the Trust or the Fund.
The FASB issued ASU 2016-15, “Statement of Cash Flows (Topic 230): Classification of Certain Cash Receipts and Cash Payments”. The amendments provide cash flow statement classification guidance. The amendments in this update are effective for fiscal years beginning after December 15, 2017. The Trust and the Funds are currently evaluating the impact on the financial statements and disclosures. The Trust and the Fund do not expect to adopt the guidance until the effective date.
The FASB issued ASU 2014-09 in May 2014, “Revenue from Contracts with Customers (Topic 606),” which replaces the revenue recognition requirements of “Revenue Recognition (Topic 605).” This ASU is based on the principle that revenue is recognized to depict the transfer of goods and services to customers in an amount that reflects the consideration to which the entity expects to be entitled in exchange for those goods or services. This ASU provides new and more detailed guidance on specific topics and expands and improves disclosures about revenue. In August 2015, the FASB issued ASU 2015-14 which defers the effective date of ASU 2014-09 by one year to fiscal years beginning after December 15, 2017. ASU 2015-14 also permits early adoption of ASU 2014-09, but not before the original effective date, which was for fiscal years beginning after December 15, 2016. The Fund records income or loss from the recognition and measurement based on the change in the shares held by the Underlying Funds and from interest income under Subtopic 825-10. Revenue from financial instruments which are valued under Subtopic 825 will not be subject to the application of ASU 2014-09 and 2015-14. Therefore, these standards will not apply or have a material impact on the financial statements and disclosures of the Trust or the Fund.
The FASB issued ASU 2016-11, “Revenue Recognition (Topic 605) and Derivatives and Hedging (Topic 815): Rescission of SEC Guidance Because of Accounting Standards Updates 2014-09 and 2014-16 Pursuant to Staff Announcements at the March 3, 2016 EITF Meeting”. The amendments make targeted improvements to clarify the principal versus agent assessment and are intended to make the guidance more operable and lead to more consistent application. The Fund records income or loss from the recognition and measurement based on the change in the shares held by the Underlying Funds and from interest income under Subtopic 825-10. Revenue from financial instruments which are valued under Subtopic 825 will not be subject to the application of ASU 2014-09 and 2015-14. Therefore, these standards will not apply or have a material impact on the financial statements and disclosures of the Trust or the Fund.
185
The FASB issued ASU 2016-02, “Leases (Topic 842).” The amendments in this update increase transparency and comparability among organizations by recognizing lease assets and lease liabilities on the balance sheet and disclosing key information about leasing arrangements. The amendments in this update are effective for fiscal years beginning after December 15, 2018. This update is not expected to have a material impact on the financial statements and disclosures of the Trust or the Fund.
The FASB issued ASU 2016-01, “Financial Instruments-Overall (Subtopic 825-10): Recognition and Measurement of Financial Assets and Financial Liabilities.” The amendments in this update are intended to improve the recognitions measurement and disclosure of financial instruments. The amendments to this update are effective for fiscal years beginning after December 15, 2017, and interim periods within those fiscal years. These amendments are required to be applied prospectively. The Trust and the Fund are currently evaluating the impact on the financial statements and disclosures; but based on our review to date we do not expect the update will have a material impact on the financial statements and disclosures of the Trust or the Fund.
The FASB issued ASU 2015-10, “Technical Corrections and Improvements.” The amendments in this update represent changes to clarify the Codification, correct unintended application of guidance, or make minor improvements to the Codification that are not expected to have a significant effect on current accounting practice or create a significant administrative cost to most entities. The amendments are effective for fiscal years beginning after December 15, 2015. The adoption did not have a material impact on the financial statements and disclosures of the Trust or the Fund.
The FASB issued ASU 2015-07, “Fair Value Measurement (Topic 820): Disclosures for Investments in Certain Entities That Calculate Net Asset Value per Share (or Its Equivalent).” The ASU amends ASC 820 to create a practical expedient to measure the fair value of investments in certain entities that do not have a quoted market price but calculate net asset value per share or its equivalent. In addition, the amendments to ASC 820 provide guidance on classifying investments that are measured using the practical expedient in the fair value hierarchy and require specific disclosures for eligible investments, regardless of whether the practical expedient has been applied. The amendments in this Update are effective for fiscal years beginning after December 15, 2015, and interim periods within those fiscal years. These amendments are required to be applied retrospectively to all periods presented. The adoption did not have a material impact on the financial statements and disclosures of the Trust or the Fund.
The FASB issued ASU 2015-06, “Earnings per Share (Topic 260): Effects on Historical Earnings per Unit of Master Limited Partnership Dropdown Transactions.” The amendments specify how earnings (losses) of a transferred business before the date of a dropdown transaction should be allocated to the various interest holders in a master limited partnership for purposes of calculating earning per unit under the two-class method. The amendments to this update are effective for fiscal years beginning after December 15, 2015, and interim periods within those fiscal years. The amendments are required to be applied retrospectively for all periods presented. The adoption did not have a material impact on the financial statements and disclosures of the Trust or the Fund.
The FASB issued ASU 2015-02, “Consolidation (Topic 810): Amendments to the Consolidation Analysis.” The amendments are intended to improve targeted areas of consolidation guidance for legal entities such as limited partnerships, limited liability corporations, and securitization structures. The amendments to this update are effective for periods beginning after December 15, 2015. These amendments are required to be applied retrospectively for all periods presented. The adoption did not have a material impact on the financial statements and disclosures of the Trust or the Fund.
The FASB issued ASU 2014-08, “Presentation of Financial Statements (Topic 205) and Property, Plant, and Equipment (Topic 360): Reporting Discontinued Operations and Disclosures of Disposals of Components of an Entity.” The amendments in this update change the requirements for reporting discontinued operations in Subtopic 2015-20. A significant provision of ASU 2014-08 calls for reporting as discontinued operations only those disposals that represent a strategic shift or have a major impact on the entity’s financial results and operations. The Company elected to early adopt this ASU for the year ended December 31, 2014, the adoption did not have a significant impact on the financial statements and disclosures of the Fund.
Fair Value - Definition and Hierarchy
In accordance with GAAP, fair value is defined as the price that would be received to sell an asset or paid to transfer a liability (i.e., the “exit price”) in an orderly transaction between market participants at the measurement date.
In determining fair value, the Fund uses various valuation approaches. In accordance with GAAP, a fair value hierarchy for inputs is used in measuring fair value that maximizes the use of observable inputs and minimizes the use of unobservable inputs by requiring that the most observable inputs be used when available. Observable inputs are those that market participants would use in pricing the asset or liability based on market data obtained from sources independent of the Fund. Unobservable inputs reflect the Fund’s assumptions about the inputs market participants would use in pricing the asset or liability developed based on the best information available in the circumstances. The fair value hierarchy is categorized into three levels based on the inputs as follows:
Level 1 - Valuations based on unadjusted quoted prices in active markets for identical assets or liabilities that the Fund has the ability to access. Valuation adjustments and block discounts are not applied to Level 1 financial instruments of the Underlying Funds and securities of the Fund, together the “financial instruments”. Since valuations are based on quoted prices that are readily and regularly available in an active market, valuation of these financial instruments does not entail a significant degree of judgment.
Level 2 - Valuations based on quoted prices in markets that are not active or for which all significant inputs are observable, either directly or indirectly.
186
Level 3 - Valuations based on inputs that are unobservable and significant to the overall fair value measurement.
The availability of valuation techniques and observable inputs can vary from financial instrument to financial instrument and is affected by a wide variety of factors including, the type of financial instrument, whether the financial instrument is new and not yet established in the marketplace, and other characteristics particular to the transaction. To the extent that valuation is based on models or inputs that are less observable or unobservable in the market, the determination of fair value requires more judgment. Those estimated values do not necessarily represent the amounts that may be ultimately realized due to the occurrence of future circumstances that cannot be reasonably determined. Because of the inherent uncertainty of valuation, those estimated values may be materially higher or lower than the values that would have been used had a ready market for the financial instruments existed. Accordingly, the degree of judgment exercised by the Fund in determining fair value is greatest for financial instruments categorized in Level 3. In certain cases, the inputs used to measure fair value may fall into different levels of the fair value hierarchy. In such cases, for disclosure purposes, the level in the fair value hierarchy, within which the fair value measurement in its entirety falls, is determined based on the lowest level input that is significant to the fair value measurement.
Fair value is a market-based measure considered from the perspective of a market participant rather than an entity-specific measure. Therefore, even when market assumptions are not readily available, the Fund’s own assumptions are set to reflect those that market participants would use in pricing the asset or liability at the measurement date. The Fund uses prices and inputs that are current as of the measurement date, including periods of market dislocation. In periods of market dislocation, the observability of prices and inputs may be reduced for many financial instruments. This condition could cause a financial instrument to be reclassified to a lower level within the fair value hierarchy. When such a situation exists on a quarter close, the Sponsor will calculate the Net Asset Value (“NAV”) on a particular day using the Level 1 valuation, but will later recalculate the NAV for the impacted Fund based upon the valuation inputs from these alternative verifiable sources (Level 2 or Level 3) and will report such NAV in its applicable financial statements and reports.
The determination is made as of the settlement of the underlying futures contracts on the last day of trading for the reporting period. In making the determination of a Level 1 or Level 2 transfer, the Fund considers the average volume of the underlying futures contracts traded on the relevant exchange for the years being reported.
Investments in the financial instruments of the Underlying Funds are freely tradable and listed on the NYSE Arca. These investments are valued at the NAV of the Underlying Fund as of the valuation date as calculated by the administrator based on the exchange-quoted prices of the commodity futures contracts held by the Underlying Funds.
Net Income (Loss) per Share
Net income (loss) per Share is the difference between the NAV per unit at the beginning of each period and at the end of each period. The weighted average number of Shares outstanding was computed for purposes of disclosing net income (loss) per weighted average Share. The weighted average Shares are equal to the number of Shares outstanding at the end of the period, adjusted proportionately for Shares created or redeemed based on the amount of time the Shares were outstanding during such period.
Note 4 – Fair Value Measurements
The Fund’s assets and liabilities recorded at fair value have been categorized based upon a fair value hierarchy as described in the Fund’s significant accounting policies in Note 3. The following table presents information about the Fund’s assets and liabilities measured at fair value as of December 31, 2016 and December 31, 2015:
December 31, 2016
| Assets: | Level 1 | Level 2 | Level 3 | Balance
as of December 31, 2016 | ||||||||||||
| Exchange-traded funds | $ | 1,313,554 | $ | — | $ | — | $ | 1,313,554 | ||||||||
| Cash equivalents | 2,360 | — | — | 2,360 | ||||||||||||
| Total | $ | 1,315,914 | $ | — | $ | — | $ | 1,315,914 | ||||||||
December 31, 2015
| Assets: | Level 1 | Level 2 | Level 3 | Balance as of December 31, 2015 | ||||||||||||
| Exchange-traded funds | $ | 1,324,601 | $ | — | $ | — | $ | 1,324,601 | ||||||||
| Cash equivalents | 1,815 | — | — | 1,815 | ||||||||||||
| Total | $ | 1,326,416 | $ | — | $ | — | $ | 1,326,416 | ||||||||
For the years ended December 31, 2016 and 2015, the Fund did not have any transfers between any of the level of the fair value hierarchy.
See the Fair Value - Definition and Hierarchy section in Note 3 above for an explanation of the transfers into and out of each level of the fair value hierarchy.
187
Note 5 - Financial Highlights
The following table presents per share performance data and other supplemental financial data for the years ended December 31, 2016, 2015 and 2014. This information has been derived from information presented in the financial statements and is presented with total expenses gross of expenses waived by the Sponsor and with total expenses net of expenses waived by the Sponsor, as appropriate.
| Per Share Operation Performance | Year
ended December 31, 2016 | Year ended December 31, 2015 | Year
ended December 31, 2014 | |||||||||
| Net asset value at beginning of period | $ | 26.59 | $ | 33.05 | $ | 37.93 | ||||||
| From investment operations: | ||||||||||||
| Net realized and unrealized loss on securities | (0.12 | ) | (6.32 | ) | (4.70 | ) | ||||||
| Total net expenses | (0.14 | ) | (0.14 | ) | (0.18 | ) | ||||||
| Net decrease in net asset value | (0.26 | ) | (6.46 | ) | (4.88 | ) | ||||||
| Net asset value at end of period | $ | 26.33 | $ | 26.59 | $ | 33.05 | ||||||
| Total Return | (0.98 | )% | (19.55 | )% | (12.87 | )% | ||||||
| Ratios to Average Net Assets (Annualized) | ||||||||||||
| Total expenses | 3.33 | % | 13.97 | % | 4.70 | % | ||||||
| Total expense, net | 0.50 | % | 0.50 | % | 0.50 | % | ||||||
| Net investment loss | (0.50 | )% | (0.50 | )% | (0.50 | )% | ||||||
Effective in the third quarter 2015, the financial highlights per share data are calculated consistent with the methodology used to calculate asset-based fees and expenses. In prior periods, the financial highlights per share data are calculated using the average of the daily shares outstanding for the reporting period, which is inclusive of the last day of the period. Any change in methodology was not material to the ratios presented.
Note 6 – Quarterly Financial Data (Unaudited)
The following summarized quarterly financial information presents the results of operations for the Teucrium Agricultural Fund and other data for three-month periods ended March 31, June 30, September 30 and December 31, 2016 and 2015.
| First | Second | Third | Fourth | |||||||||||||
| Quarter 2016 | Quarter 2016 | Quarter 2016 | Quarter 2016 | |||||||||||||
| Total Income (Loss) | $ | 9,249 | $ | 104,911 | $ | (78,441 | ) | $ | (41,939 | ) | ||||||
| Total Expenses | $ | 21,991 | $ | 6,573 | $ | 11,603 | $ | 5,092 | ||||||||
| Total Expenses, net | $ | 1,634 | $ | 1,760 | $ | 1,710 | $ | 1,696 | ||||||||
| Net Income (Loss) | $ | 7,615 | $ | 103,151 | $ | (80,151 | ) | $ | (43,635 | ) | ||||||
| Net Income (Loss) per share | $ | 0.15 | $ | 2.06 | $ | (1.60 | ) | $ | (0.87 | ) | ||||||
| First | Second | Third | Fourth | |||||||||||||
| Quarter 2015 | Quarter 2015 | Quarter 2015 | Quarter 2015 | |||||||||||||
| Total (Loss) Income | $ | (184,220 | ) | $ | 78,385 | $ | (179,166 | ) | $ | (31,185 | ) | |||||
| Total Expenses | $ | 22,615 | $ | 59,576 | $ | 104,995 | $ | 13,050 | ||||||||
| Total Expenses, net | $ | 1,925 | $ | 1,796 | $ | 1,738 | $ | 1,714 | ||||||||
| Net (Loss) Income | $ | (186,145 | ) | $ | 76,589 | $ | (180,904 | ) | $ | (32,899 | ) | |||||
| Net (Loss) Income per share | $ | (3.72 | ) | $ | 1.53 | $ | (3.62 | ) | $ | (0.65 | ) | |||||
Note 7 – Organizational and Offering Costs
Expenses incurred in organizing of the Trust and the initial offering of the Shares of the Fund, including applicable SEC registration fees, were borne directly by the Sponsor. The Fund will not be obligated to reimburse the Sponsor.
Note 8 – Subsequent Events
Management has evaluated the financial statements for the year-ended December 31, 2016 for subsequent events through the date of this filing and noted no material events requiring either recognition through the date of the filing or disclosure herein for the Fund.
188
SIGNATURES
Pursuant to the requirements of the Securities Exchange Act of 1934, the Registrant has duly caused this report to be signed on its behalf by the undersigned, thereunto duly authorized.
| Teucrium Commodity Trust (Registrant) | ||
| By: | Teucrium Trading, LLC | |
| its Sponsor | ||
| By: | /s/ Dale Riker | |
| Name: | Dale Riker | |
| Title: | Chief Executive Officer | |
| By: | /s/ Barbara Riker | |
| Name: | Barbara Riker | |
| Chief Financial Officer | ||
| Date: March 16, 2017 | ||
189