Attached files
| file | filename |
|---|---|
| 8-K - 8-K - COLUMBIA PROPERTY TRUST, INC. | cxp8-k20170315presentation.htm |

1
03. 2017
INVESTOR
PRESENTATION
UPDATED 3.15.2017

2
FORWARD-LOOKING STATEMENTS
Certain statements contained in this presentation other than historical facts may be considered forward-looking statements. Such
statements include, in particular, statements about our plans, strategies, and prospects, and are subject to certain risks and uncertainties,
including known and unknown risks, which could cause actual results to differ materially from those projected or anticipated. Therefore,
such statements are not intended to be a guarantee of our performance in future periods. Such forward-looking statements can generally
be identified by our use of forward-looking terminology such as "may," "will," "expect," "intend," "anticipate," "estimate," "believe,"
"continue," or other similar words. Readers are cautioned not to place undue reliance on these forward-looking statements. We make no
representations or warranties (express or implied) about the accuracy of any such forward-looking statements contained in this
presentation, and we do not intend to publicly update or revise any forward-looking statements, whether as a result of new information,
future events, or otherwise.
Any such forward-looking statements are subject to risks, uncertainties, and other factors and are based on a number of assumptions
involving judgments with respect to, among other things, future economic, competitive, and market conditions, all of which are difficult or
impossible to predict accurately. To the extent that our assumptions differ from actual conditions, our ability to accurately anticipate results
expressed in such forward-looking statements, including our ability to generate positive cash flow from operations, make distributions to
stockholders, and maintain the value of our real estate properties, may be significantly hindered. See Item 1A in the Company's most
recently filed Annual Report on Form 10-K for the year ended December 31, 2016, for a discussion of some of the risks and uncertainties
that could cause actual results to differ materially from those presented in our forward-looking statements. The risk factors described in our
Annual Report are not the only ones we face but do represent those risks and uncertainties that we believe are material to us. Additional
risks and uncertainties not currently known to us or that we currently deem immaterial may also harm our business. For additional
information, including reconciliations of any non-GAAP financial measures found herein, please reference the supplemental report
furnished by the Company as Exhibit 99.2 to the Company Form 8-K furnished with the Securities and Exchange Commission in February,
2017.
The names, logos and related product and service names, design marks, and slogans are the trademarks or service marks of their
respective companies. When evaluating the Company’s performance and capital resources, management considers the financial impact
of investments held directly and through unconsolidated joint ventures. This report includes financial and operational information for our
wholly-owned investments and our proportional interest in unconsolidated investments. We do not control the Market Square Joint
Venture and recognize that proportional financial data may not accurately depict all of the legal and economic implications of our interest
in this joint venture. Unless otherwise noted, all data herein is as of December 31, 2016, and pro forma for the sale of the Houston
portfolio completed on January 6, 2017, the sale of Key Center Tower and Marriott in Cleveland completed on January 31, 2017, and the
planned return of 263 Shuman Boulevard to the lender.

3
COLUMBIA PROPERTY TRUST
$2.6B invested in high-barrier markets since 2011
More than 50 non-core assets sold, totaling $3.3B
FOCUSED
STRATEGY
Experienced senior management team
Regional leadership platforms in NYC, SF and DC
EXPERIENCED
LEADERSHIP
22.1% Net Debt to Real Estate Assets2
Investment grade rating (Baa2 Stable / BBB Stable)
FLEXIBLE
BALANCE SHEET
Proactive leasing: 2.5M SF since 2014YE
Effective capital program across portfolio
PROVEN
VALUE CREATOR
77% of portfolio in four high-barrier markets1
Prime CBD locationsTOP MARKETS
1Based on gross real estate assets under management; represents 100% of Market Square, which Columbia owns through an unconsolidated
joint venture. High-barrier markets are New York, San Francisco, Washington, D.C., and Boston.
2 As of 1/31/2017 pro forma for the return of 263 Shuman to the lender.

4
COMPANY OVERVIEW
6.9
Yrs. avg. weighted
lease term
7.8M
Total SF1
93.0%
Leased
1Includes 100% of the Market Square joint venture, in which the company owns a 51% interest.
NEW YORK
SAN FRANCISCO
WASHINGTON, D.C. ATLANTA
LOS ANGELES
PITTSBURGH
222 E. 41st Street
229 W. 43rd Street
315 Park Avenue S.
95 Columbus
221 Main Street
333 Market Street
650 California Street
University Circle
Market Square
80 M Street
Lindbergh Center
One Glenlake Parkway
Three Glenlake Parkway
BOSTON
116 Huntington Avenue
Pasadena Corporate Park
Cranberry Woods Drive
CXP
NYSE-Listed
Baa2 / BBB
Rated, Investment Grade
PO
R
TF
O
LI
O

5
EMBEDDED GROWTH DRIVERS
MARKET
CURRENTLY IN
ABATEMENT
LEASES SIGNED
BUT NOT YET
COMMENCED
VACANCY
LEASE-UP
ROLLOVER
THROUGH 2018
New York 480 - 45 207
San Francisco 18 26 138 361
Washington, D.C. 173 103 122 9
Atlanta 4 9 89 71
Boston - 6 54 41
TOTAL 675 144 448 689
SF in 000s1
1All as of 12.31.2016, pro forma for signing of WeWork lease at 650 California Street, the dispositions of Houston and Cleveland properties, and
the planned return of 263 Shuman to the lender; Reflects 51% of the SF for the Market Square joint venture, in which CXP owns a 51% interest.

6
EMBEDDED GROWTH FROM SIGNED LEASES1
TENANT PROPERTY MARKET
SF
(000s)
CURRENTLY IN
ABATEMENT
NOT YET
COMMENCED
NYU Langone Medical Center 222 E. 41st Street NY 390 ✔
Winton Capital 315 Park Avenue
South
NY 35 ✔
Equinox 315 Park Avenue
South
NY 45 ✔
Gryphon Technologies 80 M Street DC 24 ✔
Other Abated Leases 183 ✔
WeWork 80 M Street DC 69 ✔
WeWork 650 California Street SF 61 ✔
Other Leases Not Yet
Commenced
73 ✔
Total Embedded NOI – GAAP RENTS - $11.6M
Total Embedded NOI – CASH RENTS $30.0M $10.8M
1All as of 12.31.2016, pro forma for signing of WeWork lease at 650 California Street, the dispositions of Houston and Cleveland properties, and the
planned return of 263 Shuman to the lender; reflects 51% of the SF and NOI for the Market Square joint venture, in which CXP owns a 51% interest.

7
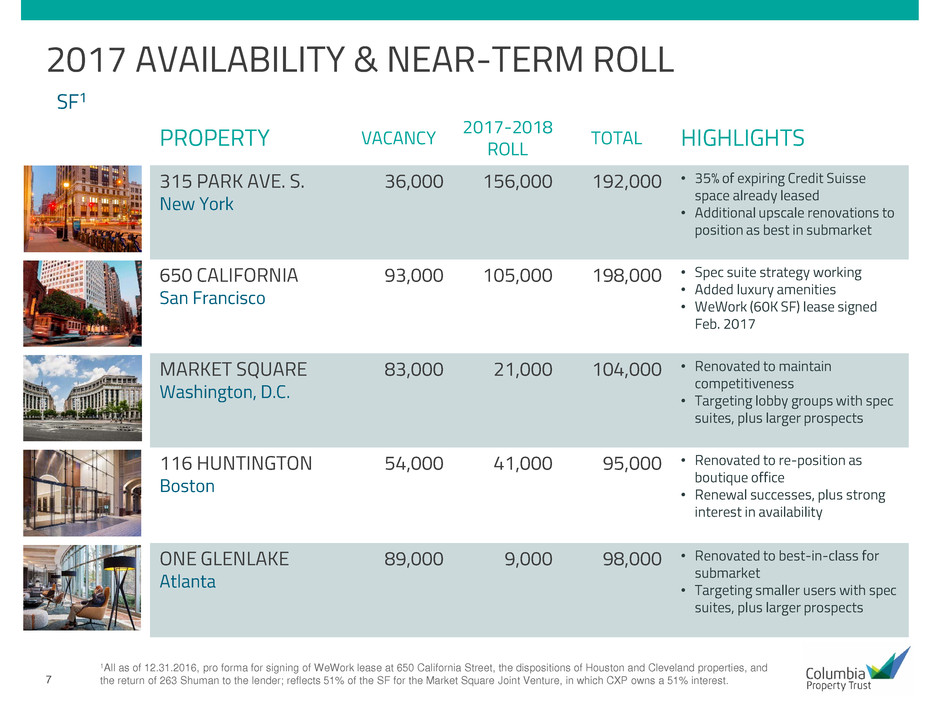
2017 AVAILABILITY & NEAR-TERM ROLL
PROPERTY VACANCY 2017-2018 ROLL TOTAL HIGHLIGHTS
315 PARK AVE. S.
New York
36,000 156,000 192,000 • 35% of expiring Credit Suisse
space already leased
• Additional upscale renovations to
position as best in submarket
650 CALIFORNIA
San Francisco
93,000 105,000 198,000 • Spec suite strategy working
• Added luxury amenities
• WeWork (60K SF) lease signed
Feb. 2017
MARKET SQUARE
Washington, D.C.
83,000 21,000 104,000 • Renovated to maintain
competitiveness
• Targeting lobby groups with spec
suites, plus larger prospects
116 HUNTINGTON
Boston
54,000 41,000 95,000 • Renovated to re-position as
boutique office
• Renewal successes, plus strong
interest in availability
ONE GLENLAKE
Atlanta
89,000 9,000 98,000 • Renovated to best-in-class for
submarket
• Targeting smaller users with spec
suites, plus larger prospects
SF1
1All as of 12.31.2016, pro forma for signing of WeWork lease at 650 California Street, the dispositions of Houston and Cleveland properties, and
the return of 263 Shuman to the lender; reflects 51% of the SF for the Market Square Joint Venture, in which CXP owns a 51% interest.

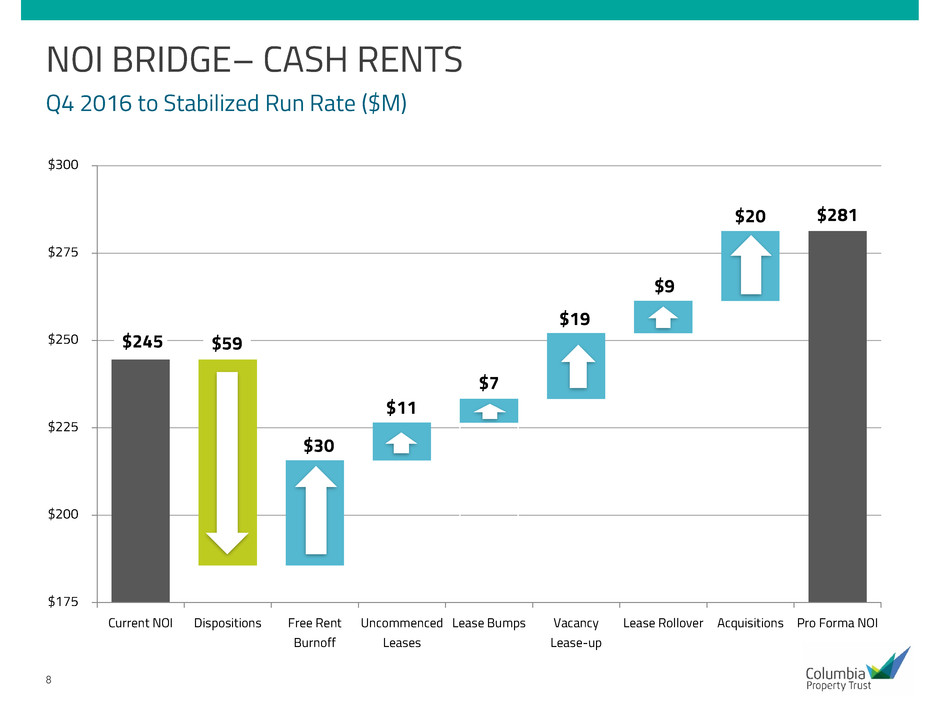
8
$245
$281
$30
$11
$7
$19
$9
$20
$59
$175
$200
$225
$250
$275
$300
Current NOI Dispositions Free Rent
Burnoff
Uncommenced
Leases
Lease Bumps Vacancy
Lease-up
Lease Rollover Acquisitions Pro Forma NOI
NOI BRIDGE– CASH RENTS
Q4 2016 to Stabilized Run Rate ($M)

9
NET ASSET VALUE AND IMPLIED CAP RATE
Per Share
Cash NOI $ 281,300
Cap Rate 5.50%
Capped NOI $ 41.86 $ 5,114,545
Debt1 (12.28) (1,500,000)
NAV $ 29.58 $3,614,545
Stock Price
Implied
Cap Rate
$ 22.50 6.62%
$ 25.00 6.18%
$ 27.50 5.79%
$30.00 5.45%
$ 32.50 5.14%
$35.00 4.87%
1Assumes cash on hand, disposition proceeds, and operation cash flows are used to fund the dividend, capital expenditures, and acquisitions in
2017 and 2018.

10
FLEXIBLE AND POISED FOR GROWTH
CONSERVATIVE
LEVERAGE LIQUIDITY
• Unencumbered asset pool of
$3.0 billion (80% of total
portfolio)
• $500M line of credit
• $670M cash balance
• $700M of investment grade
bonds issued in 2015-16
25% / 75%
Secured Unsecured
22.1%
Net Debt to Real-
Estate Assets1
Baa2
Stable /
Ratings
BBB
Stable
1Based on gross real estate assets as of 1.31.2017, pro forma for the return of 263 Shuman to the lender.

11
D
EB
T
O
U
TS
TA
N
D
IN
G
($
M
)
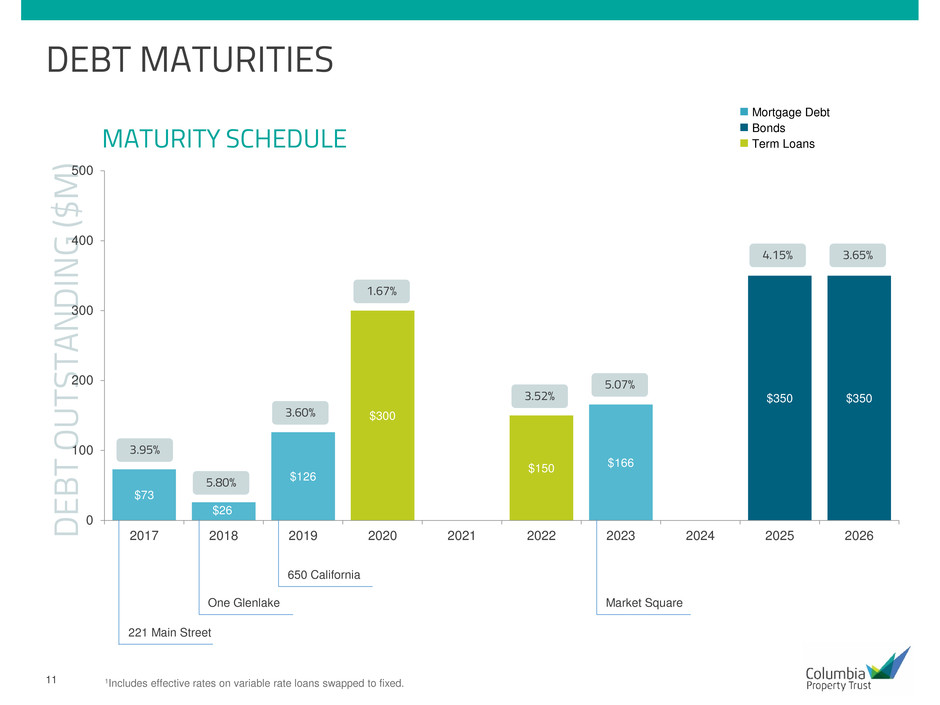
DEBT MATURITIES
$73
$26
$126
$166
$300
$150
$350 $350
0
100
200
300
400
500
2017 2018 2019 2020 2021 2022 2023 2024 2025 2026
MATURITY SCHEDULE
Mortgage Debt
Bonds
Term Loans
1Includes effective rates on variable rate loans swapped to fixed.
3.95%
3.60%
1.67%
3.52%
5.07%
4.15% 3.65%
5.80%
221 Main Street
One Glenlake
650 California
Market Square

12
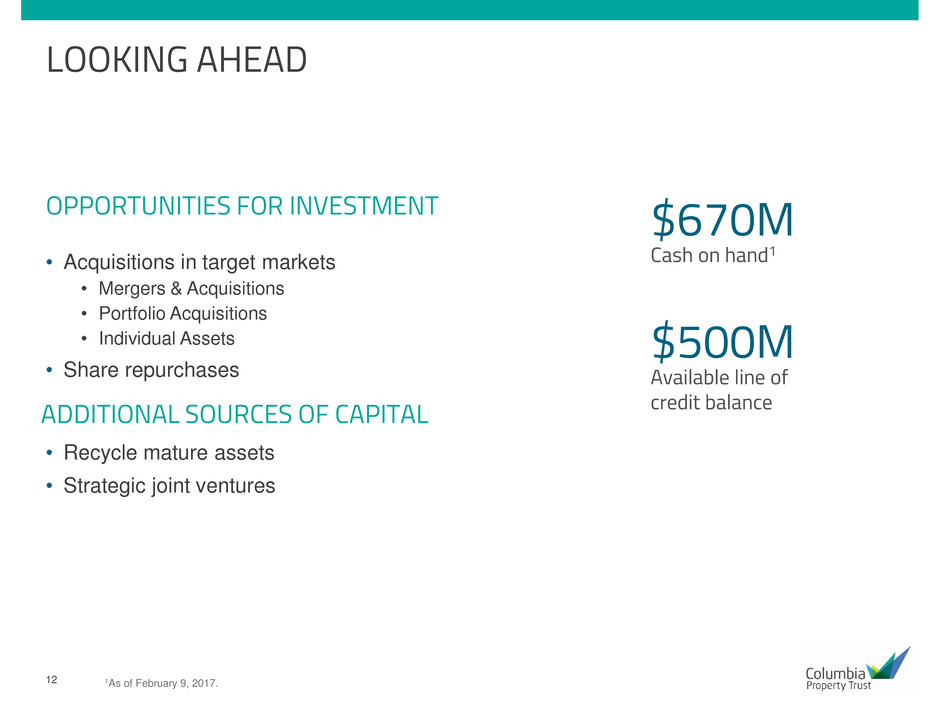
LOOKING AHEAD
OPPORTUNITIES FOR INVESTMENT
• Acquisitions in target markets
• Mergers & Acquisitions
• Portfolio Acquisitions
• Individual Assets
• Share repurchases
ADDITIONAL SOURCES OF CAPITAL
• Recycle mature assets
• Strategic joint ventures
$670M
Cash on hand1
$500M
Available line of
credit balance
1As of February 9, 2017.

13
FOR MORE INFORMATION
Columbia Property Trust
INVESTOR RELATIONS
404.465.2227
ir@columbia.reit
www.columbia.reit

14
RECONCILIATIONS: NON-GAAP TO COMPARABLE GAAP
MEASURES
(in thousands) Three Months
Ended 12/31/16 Annualized
Net Cash Provided by Operating Activities $ 43,387 $ 173,548
Straight line rental income 6,405 25,620
Depreciation of real estate assets (24,026) (96,104)
Amortization of lease-related costs (13,259) (53,036)
Loss from unconsolidated joint venture (2,120) (8,480)
Other non-cash expenses 20,412 81,648
Net changes in operating assets & liabilities (3,399) (13,596)
Net Income $ 27,400 $ 109,600
Interest expense (net) 15,158 60,632
Interest income from development authority bonds (1,800) (7,200)
Income tax expense 58 232
Depreciation of real estate assets 24,026 96,104
Amortization of lease-related costs 13,873 55,492
Adjustments from unconsolidated joint venture 4,216 16,864
EBITDA $ 82,931 $ 331,724
Loss on sale of real estate assets (22,242) (88,968)
Adjusted EBITDA $ 60,689 $ 242,756
General and administrative 8,158 32,632
Straight line rental income (6,152) (24,608)
Net effect of above (below) market amortization (611) (2,444)
Adjustments from unconsolidated joint venture (952) (3,808)
Net Operating Income (based on cash rents) $ 61,132 $ 244,528

15
RECONCILIATIONS: NON-GAAP TO COMPARABLE GAAP
MEASURES
(continued from prior page)
(in thousands) Three Months
Ended 12/31/16 Annualized
Current NOI (based on cash rents) $ 61,132 $ 244,528
Dispositions (14,700) (58,800)
Free rent burnoff 7,500 30,000
Uncommenced leases 2,700 10,800
Lease bumps 1,700 6,800
Vacancy lease-up 4,700 18,800
Lease rollover 2,300 9,200
Acquisitions 5,000 20,000
Pro forma NOI (based on cash rents) $ 70,332 $ 281,328
