Attached files
| file | filename |
|---|---|
| 8-K - CURRENT REPORT - CIT GROUP INC | e73491_8k.htm |
Exhibit 99.1
Fourth Quarter 2016 Financial Results January 31, 2017 Updated as of March 15, 2017
1 Important Notices | 4Q16 Earnings This presentation contains forward - looking statements within the meaning of applicable federal securities laws that are based upon our current expectations and assumptions concerning future events, which are subject to a number of risks and uncertainties that could cause actual results to differ materially from those anticipated . The words “expect,” “anticipate,” “estimate,” “forecast,” “initiative,” “objective,” “plan,” “goal,” “project,” “outlook,” “priorities,” “target,” “intend,” “evaluate,” “pursue,” “commence,” “seek,” “may,” “would,” “could,” “should,” “believe,” “potential,” “continue,” or the negative of any of those words or similar expressions is intended to identify forward - looking statements . All statements contained in this press release, other than statements of historical fact, including without limitation, statements about our plans, strategies, prospects and expectations regarding future events and our financial performance, are forward - looking statements that involve certain risks and uncertainties . While these statements represent our current judgment on what the future may hold, and we believe these judgments are reasonable, these statements are not guarantees of any events or financial results, and our actual results may differ materially . Important factors that could cause our actual results to be materially different from our expectations include, among others, the risk that ( i ) Bohai shareholders do not approve the transaction or the parties do not receive or satisfy regulatory or other approvals and conditions on a timely basis or approvals are subject to conditions that are not anticipated, (ii) modifications to the terms of the transaction may be required in order to obtain or satisfy such approvals or conditions, (iii) the risk that the transaction does not close or that there are changes in the anticipated timing for closing the transaction, (iv) there are difficulties, delays or unexpected costs in separating Commercial Air from CIT or in implementing the transaction, (v) business disruption during the pendency of or following the transaction, including diversion of management time, (vi) the risk that CIT is unsuccessful in implementing its Amended Capital Plan on the timing and terms contemplated, (vii) the risk that CIT is unsuccessful in implementing its strategy and business plan, (viii) the risk that CIT is unable to react to and address key business and regulatory issues, (ix) the risk that CIT is unable to achieve the projected revenue growth from its new business initiatives or the projected expense reductions from efficiency improvements, and (x) the risk that CIT becomes subject to liquidity constraints and higher funding costs . We describe these and other risks that could affect our results in Item 1 A, “Risk Factors,” of our latest Annual Report on Form 10 - K for the year ended December 31 , 2016 , which was filed with the Securities and Exchange Commission . Accordingly, you should not place undue reliance on the forward - looking statements contained in this press release . These forward - looking statements speak only as of the date on which the statements were made . CIT undertakes no obligation to update publicly or otherwise revise any forward - looking statements, except where expressly required by law . This presentation is to be used solely as part of CIT management’s continuing investor communications program . This presentation shall not constitute an offer or solicitation in connection with any securities .
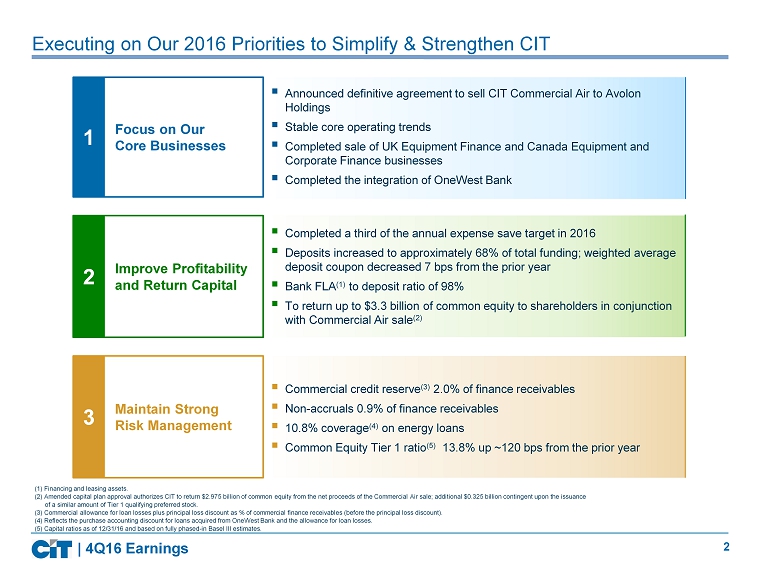
2 Executing on Our 2016 Priorities to Simplify & Strengthen CIT 1 Focus on Our Core Businesses 3 Maintain Strong Risk Management 2 Improve Profitability and Return Capital (1) Financing and leasing assets. (2) Amended capital plan approval authorizes CIT to return $2.975 billion of common equity from the net proceeds of the Comme rci al Air sale; additional $0.325 billion contingent upon the issuance of a similar amount of Tier 1 qualifying preferred stock. (3) Commercial allowance for loan losses plus principal loss discount as % of commercial finance receivables (before the prin cip al loss discount). (4) Reflects the purchase accounting discount for loans acquired from OneWest Bank and the allowance for loan losses. (5) Capital ratios as of 12/31/16 and based on fully phased - in Basel III estimates. ▪ Announced definitive agreement to sell CIT Commercial Air to Avolon Holdings ▪ Stable core operating trends ▪ Completed sale of UK Equipment Finance and Canada Equipment and Corporate Finance businesses ▪ C ompleted the integration of OneWest Bank ▪ Completed a third of the annual expense save target in 2016 ▪ Deposits increased to approximately 68% of total funding; weighted average deposit coupon decreased 7 bps from the prior year ▪ Bank FLA (1) to deposit ratio of 98% ▪ To return up to $3.3 billion of common equity to shareholders in conjunction with Commercial Air sale (2) ▪ Commercial credit reserve (3) 2.0% of finance receivables ▪ Non - accruals 0.9% of finance receivables ▪ 10.8% coverage (4) on energy loans ▪ Common Equity Tier 1 ratio (5) 13.8% up ~120 bps from the prior year | 4Q16 Earnings
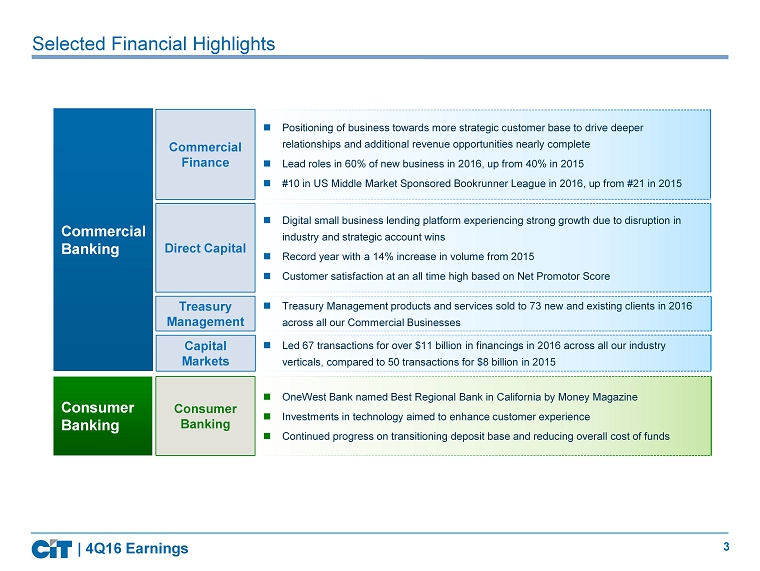
3 Selected Financial Highlights Positioning of business towards more strategic customer base to drive deeper relationships and additional revenue opportunities nearly complete Lead roles in 60% of new business in 2016, up from 40% in 2015 #10 in US Middle Market Sponsored Bookrunner League in 2016, up from #21 in 2015 Digital small business lending platform experiencing strong growth due to disruption in industry and strategic account wins Record year with a 14% increase in volume from 2015 Customer satisfaction at an all time high based on Net Promotor Score Direct Capital OneWest Bank named Best Regional Bank in California by Money Magazine Investments in technology aimed to enhance customer experience Continued progress on transitioning deposit base and reducing overall cost of funds Consumer Banking Treasury Management products and services sold to 73 new and existing clients in 2016 across all our Commercial Businesses Commercial Banking Consumer Banking Commercial Finance Treasury Management | 4Q16 Earnings Led 67 transactions for over $11 billion in financings in 2016 across all our industry verticals, compared to 50 transactions for $8 billion in 2015 Capital Markets
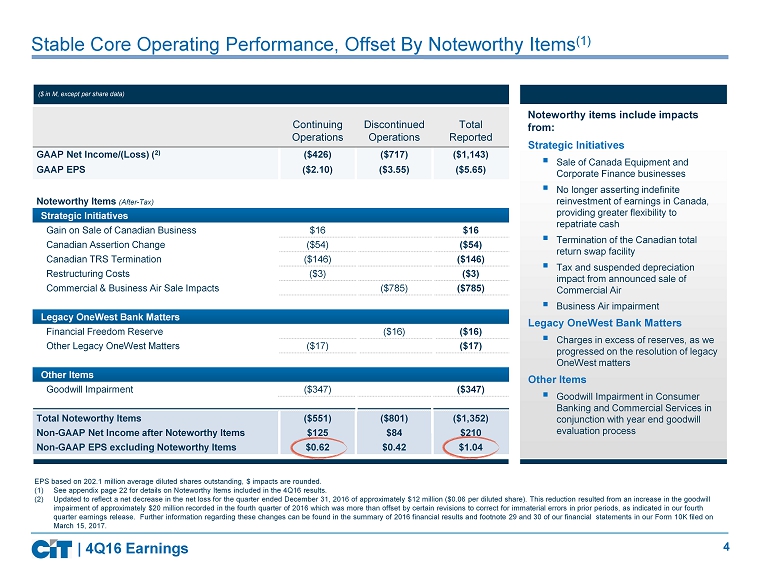
4 Stable Core O perating Performance, Offset By Noteworthy Items (1) Continuing Operations Discontinued Operations Total Reported GAAP Net Income/(Loss) ( 2) ($426) ($717) ($1,143) GAAP EPS ($2.10) ($3.55) ($5.65) Noteworthy Items (After - Tax) Strategic Initiatives Gain on Sale of Canadian Business $16 $16 Canadian Assertion Change ($54) ($54) Canadian TRS Termination ($146) ($146) Restructuring Costs ($3) ($3) Commercial & Business Air Sale Impacts ($785) ($785) Legacy OneWest Bank Matters Financial Freedom Reserve ($16) ($16) Other Legacy OneWest Matters ($17) ($17) Other Items Goodwill Impairment ($347) ($347) Total Noteworthy Items ($551) ($801) ($1,352) Non - GAAP Net Income after Noteworthy Items $125 $84 $210 Non - GAAP EPS excluding Noteworthy Items $0.62 $0.42 $1.04 ($ in M, except per share data) Noteworthy items include impacts from: Strategic Initiatives ▪ Sale of Canada Equipment and Corporate Finance businesses ▪ No longer asserting indefinite reinvestment of earnings in Canada, providing greater flexibility to repatriate cash ▪ Termination of the Canadian total return swap facility ▪ Tax and suspended depreciation impact from announced sale of Commercial Air ▪ Business Air impairment Legacy OneWest Bank Matters ▪ Charges in excess of reserves, as we progressed on the resolution of legacy OneWest matters Other Items ▪ Goodwill Impairment in Consumer Banking and Commercial Services in conjunction with year end goodwill evaluation process EPS based on 202.1 million average diluted shares outstanding, $ impacts are rounded . (1) See appendix page 22 for details on Noteworthy Items included in the 4Q16 results. (2) Updated to reflect a net decrease in the net loss for the quarter ended December 31, 2016 of approximately $12 million ($0.06 per diluted share ). This reduction resulted from an increase in the goodwill impairment of approximately $20 million recorded in the fourth quarter of 2016 which was more than offset by certain revisions to correct for immaterial err ors in prior periods, as indicated in our fourth quarter earnings release. Further information regarding these changes can be found in the summary of 2016 financial results and footnote 29 and 30 of our financial statements in our Form 10K filed on March 15, 2017. | 4Q16 Earnings
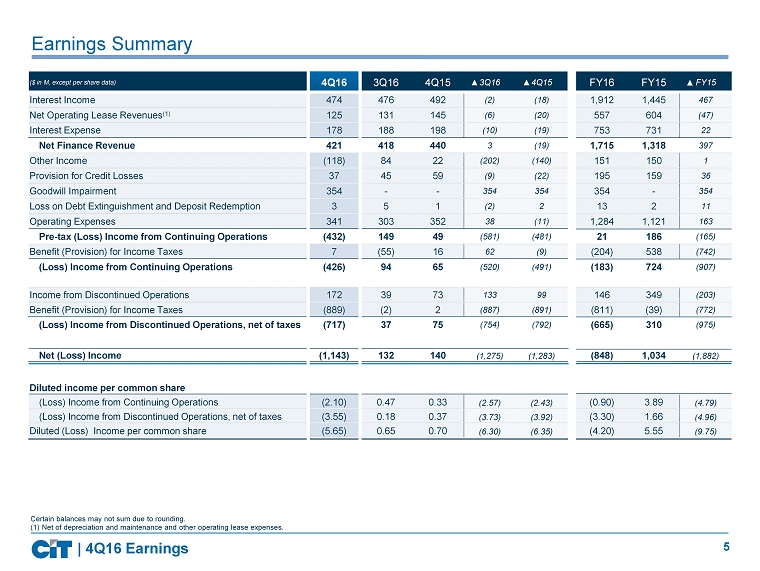
5 ($ in M, except per share data) 4Q16 3Q16 4Q15 3Q16 4Q15 Interest Income 474 476 492 (2) (18) Net Operating Lease Revenues (1) 125 131 145 (6) (20) Interest Expense 178 188 198 (10) (19) Net Finance Revenue 421 418 440 3 (19) Other Income (118) 84 22 (202) (140) Provision for Credit Losses 37 45 59 (9) (22) Goodwill Impairment 354 - - 354 354 Loss on Debt Extinguishment and Deposit Redemption 3 5 1 (2) 2 Operating Expenses 341 303 352 38 (11) Pre - tax (Loss) Income from Continuing Operations (432) 149 49 (581) (481) Benefit (Provision) for Income Taxes 7 (55) 16 62 (9) (Loss) Income from Continuing Operations (426) 94 65 (520) (491) Income from Discontinued Operations 172 39 73 133 99 Benefit (Provision) for Income Taxes (889) (2) 2 (887) (891) (Loss) Income from Discontinued Operations, net of taxes (717) 37 75 (754) (792) Net (Loss) Income (1,143) 132 140 (1,275) (1,283) Diluted income per common share (Loss) Income from Continuing Operations (2.10) 0.47 0.33 (2.57) (2.43) (Loss) Income from Discontinued Operations, net of taxes (3.55) 0.18 0.37 (3.73) (3.92) Diluted (Loss) Income per common share (5.65) 0.65 0.70 (6.30) (6.35) Earnings Summary | 4Q16 Earnings FY16 FY15 FY15 1,912 1,445 467 557 604 (47) 753 731 22 1,715 1,318 397 151 150 1 195 159 36 354 - 354 13 2 11 1,284 1,121 163 21 186 (165) (204) 538 (742) (183) 724 (907) 146 349 (203) (811) (39) (772) (665) 310 (975) (848) 1,034 (1,882) (0.90) 3.89 (4.79) (3.30) 1.66 (4.96) (4.20) 5.55 (9.75) Certain balances may not sum due to rounding. ( 1) Net of depreciation and maintenance and other operating lease expenses.
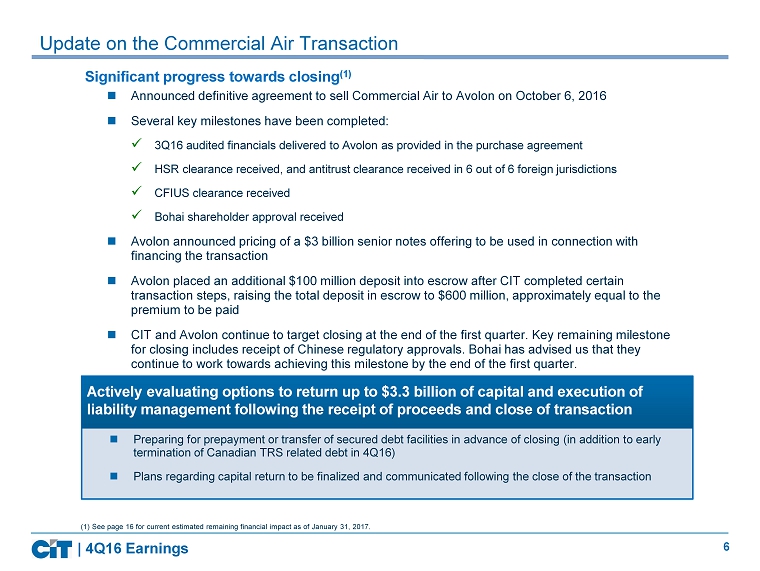
6 Update on the Commercial Air Transaction | 4Q16 Earnings ( 1 ) See page 16 for current estimated remaining financial impact as of January 31, 2017. Announced definitive agreement to sell Commercial Air to Avolon on October 6, 2016 Several key milestones have been completed: x 3Q16 audited financials delivered to Avolon as provided in the purchase agreement x HSR clearance received , and antitrust clearance received in 6 out of 6 foreign jurisdictions x CFIUS clearance received x Bohai shareholder approval received Avolon announced pricing of a $3 billion senior notes offering to be used in connection with financing the transaction Avolon placed an additional $100 million deposit into escrow after CIT completed certain transaction steps, raising the total deposit in escrow to $600 million, approximately equal to the premium to be paid CIT and Avolon continue to target closing at the end of the first quarter. Key remaining milestone for closing includes receipt of Chinese regulatory approvals. Bohai has advised us that they continue to work towards achieving this milestone by the end of the first quarter. Preparing for prepayment or transfer of secured debt facilities in advance of closing (in addition to early termination of Canadian TRS related debt in 4Q16) Plans regarding capital return to be finalized and communicated following the close of the transaction Significant progress towards closing (1) A ctively evaluating options to return up to $3.3 billion of capital and execution of liability management following the receipt of proceeds and close of transaction
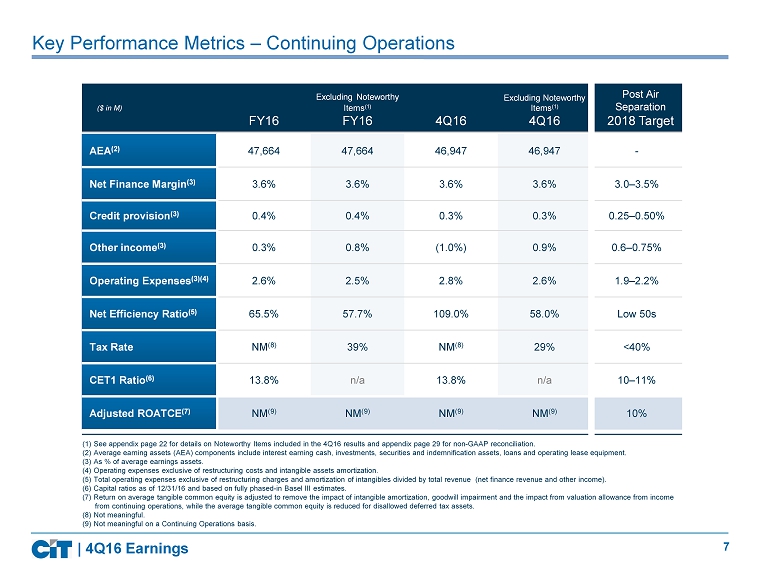
7 Key Performance Metrics – Continuing Operations (1) See appendix page 22 for details on Noteworthy Items included in the 4Q16 results and appendix page 29 for non - GAAP reconciliation. (2) Average earning assets (AEA) components include interest earning cash, investments, securities and indemnification assets, loans and ope rating lease equipment. ( 3 ) As % of average earnings assets . (4) Operating expenses exclusive of restructuring costs and intangible assets amortization. (5) Total operating expenses exclusive of restructuring charges and amortization of intangibles divided by total revenue (net finance revenue and other income). (6) Capital ratios as of 12/31/16 and based on fully phased - in Basel III estimates. (7) Return on average tangible common equity is adjusted to remove the impact of intangible amortization, goodwill impairment and th e impact from valuation allowance from income from continuing operations, while the average tangible common equity is reduced for disallowed deferred tax assets. (8) Not meaningful. (9) Not meaningful on a Continuing Operations basis. ($ in M) FY16 Excluding Noteworthy Items (1) FY16 4Q16 Excluding Noteworthy Items (1) 4Q16 Post Air Separation 2018 Target AEA (2) 47,664 47,664 46,947 46,947 - Net Finance Margin (3) 3.6% 3.6% 3.6% 3.6% 3.0 – 3.5% Credit provision (3) 0.4% 0.4% 0.3% 0.3% 0.25 – 0.50% Other income (3) 0.3% 0.8% (1.0%) 0.9% 0.6 – 0.75% Operating Expenses (3)(4) 2.6% 2.5% 2.8% 2.6% 1.9 – 2.2% Net Efficiency Ratio (5) 65.5% 57.7% 109.0% 58.0% Low 50s Tax Rate NM (8) 39% NM (8) 29% <40% CET1 Ratio (6) 13.8% n/a 13.8% n/a 10 – 11% Adjusted ROATCE (7) NM (9) NM (9) NM (9) NM (9) 10% | 4Q16 Earnings
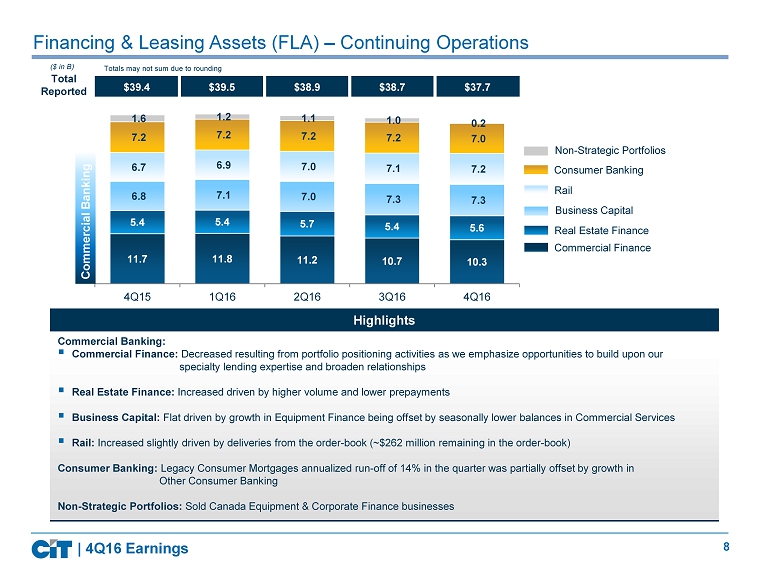
8 Financing & Leasing Assets (FLA) – Continuing Operations Highlights 11.7 11.8 11.2 10.7 10.3 5.4 5.4 5.7 5.4 5.6 6.8 7.1 7.0 7.3 7.3 6.7 6.9 7.0 7.1 7.2 7.2 7.2 7.2 7.2 7.0 1.6 1.2 1.1 1.0 0.2 0 20 40 4Q15 1Q16 2Q16 3Q16 4Q16 ($ in B) Commercial Banking: ▪ Commercial Finance: Decreased resulting from portfolio positioning activities as we emphasize opportunities to build upon our specialty lending expertise and broaden relationships ▪ Real Estate Finance : Increased driven by higher volume and lower prepayments ▪ Business Capital: Flat driven by growth in Equipment Finance being offset by seasonally lower balances in Commercial Services ▪ Rail: Increased slightly driven by deliveries from the order - book (~$262 million remaining in the order - book) Consumer Banking: Legacy Consumer Mortgages annualized run - off of 14% in the quarter was partially offset by growth in Other Consumer Banking Non - Strategic Portfolios: Sold Canada Equipment & Corporate Finance businesses $39.4 $39.5 $38.9 $38.7 $37.7 Total Reported | 4Q16 Earnings Consumer Banking Non - Strategic Portfolios Real Estate Finance Commercial Finance Business Capital Rail Commercial Banking Totals may not sum due to rounding
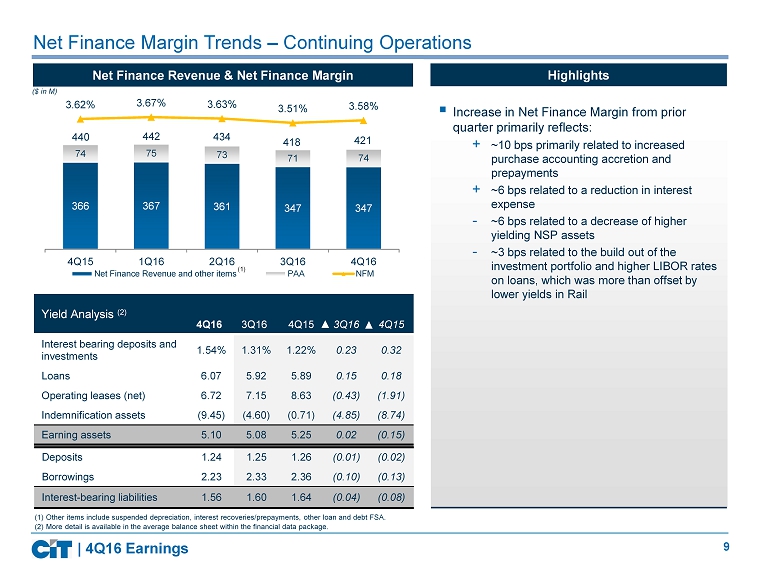
9 ▪ Increase in Net Finance Margin from prior quarter primarily reflects: + ~10 bps primarily related to increased purchase accounting accretion and prepayments + ~6 bps related to a reduction in interest expense - ~6 bps related to a decrease of higher yielding NSP assets - ~3 bps related to the build out of the investment portfolio and higher LIBOR rates on loans, which was more than offset by lower yields in Rail 366 367 361 347 347 74 75 73 71 74 3.62% 3.67% 3.63% 3.51% 3.58% 4Q15 1Q16 2Q16 3Q16 4Q16 Net Finance Revenue and other items PAA NFM Net Finance Margin Trends – Continuing Operations ($ in M) Yield Analysis (2) 4Q16 3Q16 4Q15 3Q16 4Q15 Interest bearing deposits and investments 1.54% 1.31% 1.22% 0.23 0.32 Loans 6.07 5.92 5.89 0.15 0.18 Operating leases (net) 6.72 7.15 8.63 (0.43) (1.91) Indemnification assets (9.45) (4.60) (0.71) (4.85) (8.74) Earning assets 5.10 5.08 5.25 0.02 (0.15) Deposits 1.24 1.25 1.26 (0.01) (0.02) Borrowings 2.23 2.33 2.36 (0.10) (0.13) Interest - bearing liabilities 1.56 1.60 1.64 (0.04) (0.08) Net Finance Revenue & Net Finance Margin 440 442 (1) Other items include suspended depreciation, interest recoveries/prepayments, other loan and debt FSA. (2) More detail is available in the average balance sheet within the financial data package. (1) Highlights 434 418 | 4Q16 Earnings 421
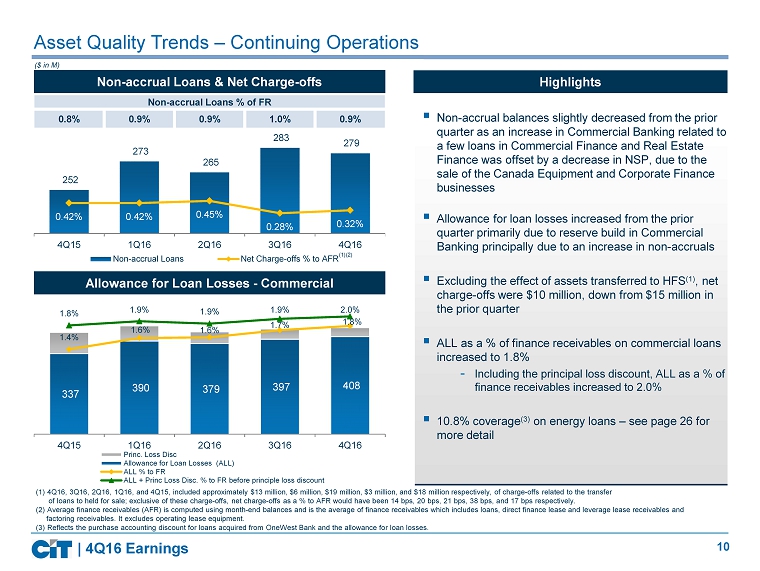
10 Asset Quality Trends – Continuing Operations ($ in M) 252 273 265 283 279 0.42% 0.42% 0.45% 0.28% 0.32% 4Q15 1Q16 2Q16 3Q16 4Q16 Non-accrual Loans Net Charge-offs % to AFR 337 390 379 397 408 1.4% 1.6% 1.6% 1.7% 1.8% 1.8% 1.9% 1.9% 1.9% 2.0% 4Q15 1Q16 2Q16 3Q16 4Q16 Princ. Loss Disc Allowance for Loan Losses (ALL) ALL % to FR ALL + Princ Loss Disc. % to FR before principle loss discount (1)(2) (1) 4Q16, 3Q16 , 2Q16 , 1Q16, and 4Q15, included approximately $13 million, $ 6 million, $19 million, $ 3 million , and $18 million respectively , of charge - offs related to the transfer of loans to held for sale; exclusive of these charge - offs, net charge - offs as a % to AFR would have been 14 bps, 20 bps, 21 bps, 38 bps , and 17 bps respectively. (2) Average finance receivables (AFR) is computed using month - end balances and is the average of finance receivables which inclu des loans, direct finance lease and leverage lease receivables and factoring receivables. It excludes operating lease equipment . (3) Reflects the purchase accounting discount for loans acquired from OneWest Bank and the allowance for loan losses. Non - accrual Loans & Net Charge - offs Allowance for Loan Losses - Commercial ▪ Non - accrual balances slightly decreased from the prior quarter as an increase in Commercial Banking related to a few loans in Commercial Finance and Real Estate Finance was offset by a decrease in NSP, due to the sale of the Canada Equipment and Corporate Finance businesses ▪ Allowance for loan losses increased from the prior quarter primarily due to reserve build in Commercial Banking principally due to an increase in non - accruals ▪ Excluding the effect of assets transferred to HFS (1) , net charge - offs were $10 million, down from $15 million in the prior quarter ▪ ALL as a % of finance receivables on commercial loans increased to 1.8% - Including the principal loss discount, ALL as a % of finance receivables increased to 2.0% ▪ 10.8% coverage (3) on energy loans – see page 26 for more detail Highlights Non - accrual Loans % of FR 0.8% 0.9% 0.9% 1.0% 0.9% | 4Q16 Earnings
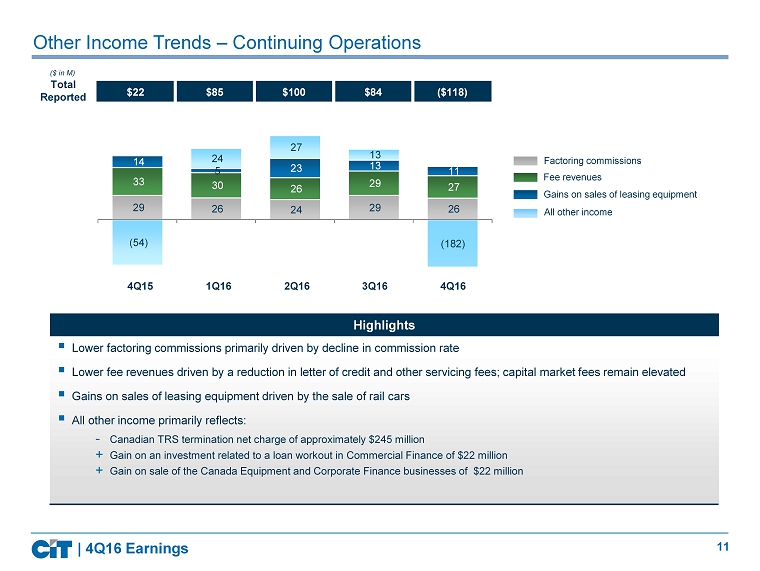
11 29 26 24 29 26 33 30 26 29 27 14 5 23 13 11 (54) 24 27 13 -55 -30 -5 20 45 70 95 120 145 Other Income Trends – Continuing Operations Factoring commissions Fee revenues Gains on sales of leasing equipment All other income ($ in M) 4 Q15 2 Q16 3 Q 16 4 Q16 1 Q16 Total Reported ▪ Lower factoring commissions primarily driven by decline in commission rate ▪ Lower fee revenues driven by a reduction in letter of credit and other servicing fees; capital market fees remain elevated ▪ Gains on sales of leasing equipment driven by the sale of rail cars ▪ All other income primarily reflects: - Canadian TRS termination net charge of approximately $245 million + Gain on an investment related to a loan workout in Commercial Finance of $22 million + Gain on sale of the Canada Equipment and Corporate Finance businesses of $22 million Highlights $22 $85 $100 $84 ($118) | 4Q16 Earnings (182)
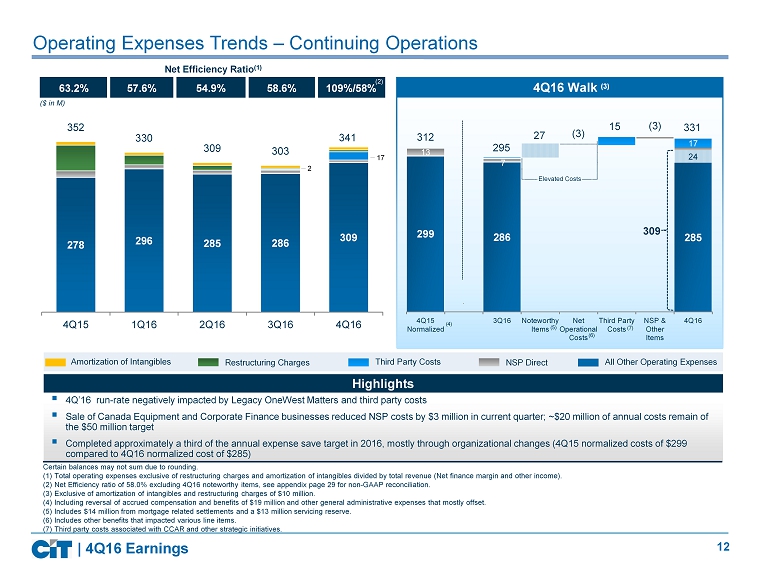
12 299 286 285 24 13 7 17 4Q15 Normalized 3Q16 Noteworthy Items Net Operational Costs Third Party Costs NSP & Other Items 4Q16 ▪ 4Q’16 run - rate negatively impacted by Legacy OneWest Matters and third party costs ▪ Sale of Canada Equipment and Corporate Finance businesses reduced NSP costs by $3 million in current quarter; ~$20 million of an nual costs remain of the $50 million target ▪ Completed approximately a third of the annual expense save target in 2016, mostly through organizational changes (4Q15 normal ize d costs of $299 compared to 4Q16 normalized cost of $285) All Other Operating Expenses Third Party Costs Amortization of Intangibles Restructuring Charges Operating Expenses Trends – Continuing Operations Certain balances may not sum due to rounding. (1) Total operating expenses exclusive of restructuring charges and amortization of intangibles divided by total revenue (Net finance m arg in and other income ). (2) Net Efficiency ratio of 58.0% excluding 4Q16 noteworthy items, see appendix page 29 for non - GAAP reconciliation. (3) Exclusive of amortization of intangibles and restructuring charges of $10 million. (4) Including reversal of accrued compensation and benefits of $19 million and other general administrative expenses that mos tly offset. (5) Includes $14 million from mortgage related settlements and a $13 million servicing reserve. (6) Includes other benefits that impacted various line items. (7) Third party costs associated with CCAR and other strategic initiatives. Highlights 63.2% 57.6% 54.9% 58.6% 109%/58% Net Efficiency Ratio (1) 278 296 285 286 309 352 330 309 303 341 4Q15 1Q16 2Q16 3Q16 4Q16 4 Q16 Walk (3) (4) | 4Q16 Earnings 312 27 (3) 15 331 17 NSP Direct 295 (3) 2 Elevated Costs (5) (6) (7) ($ in M) 309 (2)
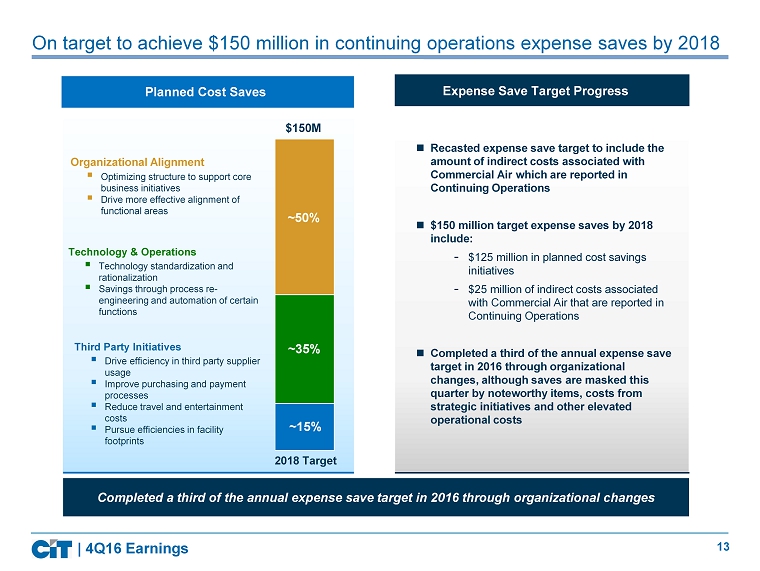
13 On target to achieve $150 million in continuing operations expense saves by 2018 | 4Q16 Earnings 2018 Target Organizational Alignment ▪ Optimizing structure to support core business initiatives ▪ Drive more effective alignment of functional areas Third Party Initiatives ▪ Drive efficiency in third party supplier usage ▪ Improve purchasing and payment processes ▪ Reduce travel and entertainment costs ▪ Pursue efficiencies in facility footprints Technology & Operations ▪ Technology standardization and rationalization ▪ Savings through process re - engineering and automation of certain functions ~50% ~35% ~15% $150M Recasted expense save target to include the amount of indirect costs associated with Commercial Air which are reported in Continuing Operations $150 million target expense saves by 2018 include: - $125 million in planned cost savings initiatives - $25 million of indirect costs associated with Commercial Air that are reported in Continuing Operations Completed a third of the annual expense save target in 2016 through organizational changes, although saves are masked this quarter by noteworthy items, costs from strategic initiatives and other elevated operational costs Completed a third of the annual expense save target in 2016 through organizational changes Expense Save Target Progress Planned Cost Saves
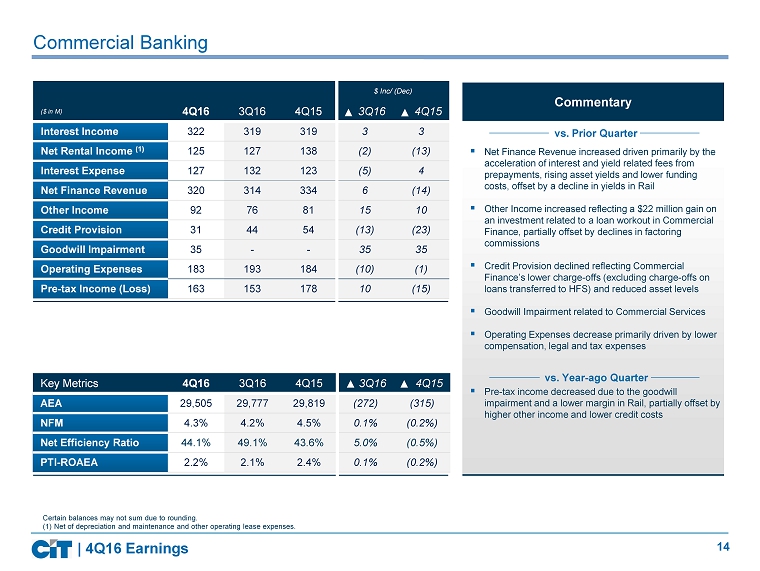
14 Commercial Banking $ Inc/ (Dec) ($ in M) 4Q16 3Q16 4Q15 3Q16 4Q15 Interest Income 322 319 319 3 3 Net Rental Income (1) 125 127 138 (2) (13) Interest Expense 127 132 123 (5) 4 Net Finance Revenue 320 314 334 6 (14) Other Income 92 76 81 15 10 Credit Provision 31 44 54 (13) (23) Goodwill Impairment 35 - - 35 35 Operating Expenses 183 193 184 (10) (1) Pre - tax Income (Loss) 163 153 178 10 (15) ▪ Net Finance Revenue increased driven primarily by the acceleration of interest and yield related fees from prepayments, rising asset yields and lower funding costs, offset by a decline in yields in Rail ▪ Other Income increased reflecting a $22 million gain on an investment related to a loan workout in Commercial Finance, partially offset by declines in factoring commissions ▪ Credit Provision declined reflecting Commercial Finance’s lower charge - offs (excluding charge - offs on loans transferred to HFS) and reduced asset levels ▪ Goodwill Impairment related to Commercial Services ▪ Operating Expenses decrease primarily driven by lower compensation, legal and tax expenses ▪ Pre - tax income decreased due to the goodwill impairment and a lower margin in Rail, partially offset by higher other income and lower credit costs Key Metrics 4Q16 3Q16 4Q15 3Q16 4Q15 AEA 29,505 29,777 29,819 (272) (315) NFM 4.3% 4.2% 4.5% 0.1% (0.2%) Net Efficiency Ratio 44.1% 49.1% 43.6% 5.0% (0.5%) PTI - ROAEA 2.2% 2.1% 2.4% 0.1% (0.2%) Certain balances may not sum due to rounding. (1) Net of depreciation and maintenance and other operating lease expenses. vs. Prior Quarter vs. Year - ago Quarter Commentary | 4Q16 Earnings
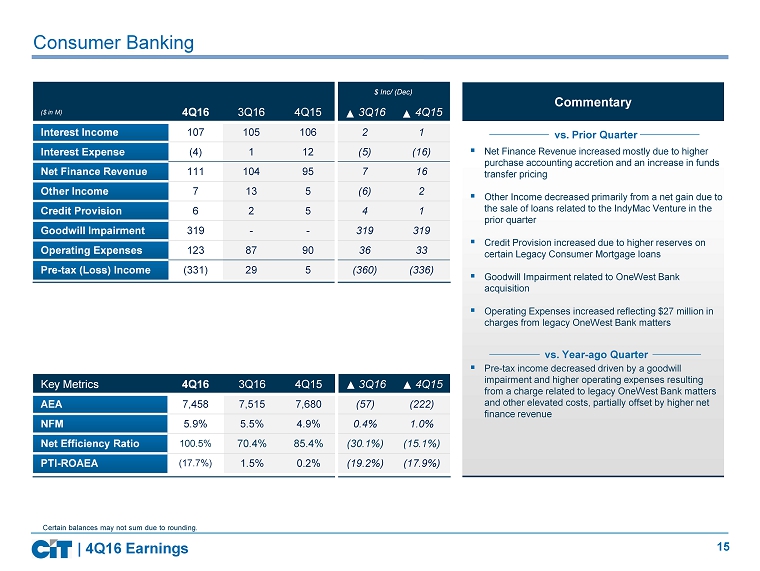
15 Commentary $ Inc/ (Dec) ($ in M) 4Q16 3Q16 4Q15 3Q16 4Q15 Interest Income 107 105 106 2 1 Interest Expense (4) 1 12 (5) (16) Net Finance Revenue 111 104 95 7 16 Other Income 7 13 5 (6) 2 Credit Provision 6 2 5 4 1 Goodwill Impairment 319 - - 319 319 Operating Expenses 123 87 90 36 33 Pre - tax (Loss) Income (331) 29 5 (360) (336) ▪ Net Finance Revenue increased mostly due to higher purchase accounting accretion and an increase in funds transfer pricing ▪ Other Income decreased primarily from a net gain due to the sale of loans related to the IndyMac Venture in the prior quarter ▪ Credit Provision increased due to higher reserves on certain Legacy Consumer Mortgage loans ▪ Goodwill Impairment related to OneWest Bank acquisition ▪ Operating Expenses increased reflecting $27 million in charges from legacy OneWest Bank matters ▪ Pre - tax income decreased driven by a goodwill impairment and higher operating expenses resulting from a charge related to legacy OneWest Bank matters and other elevated costs, partially offset by higher net finance revenue Key Metrics 4Q16 3Q16 4Q15 3Q16 4Q15 AEA 7,458 7,515 7,680 (57) (222) NFM 5.9% 5.5% 4.9% 0.4% 1.0% Net Efficiency Ratio 100.5% 70.4% 85.4% (30.1%) (15.1%) PTI - ROAEA (17.7%) 1.5% 0.2% (19.2%) (17.9%) Consumer Banking Certain balances may not sum due to rounding. vs. Prior Quarter vs. Year - ago Quarter | 4Q16 Earnings
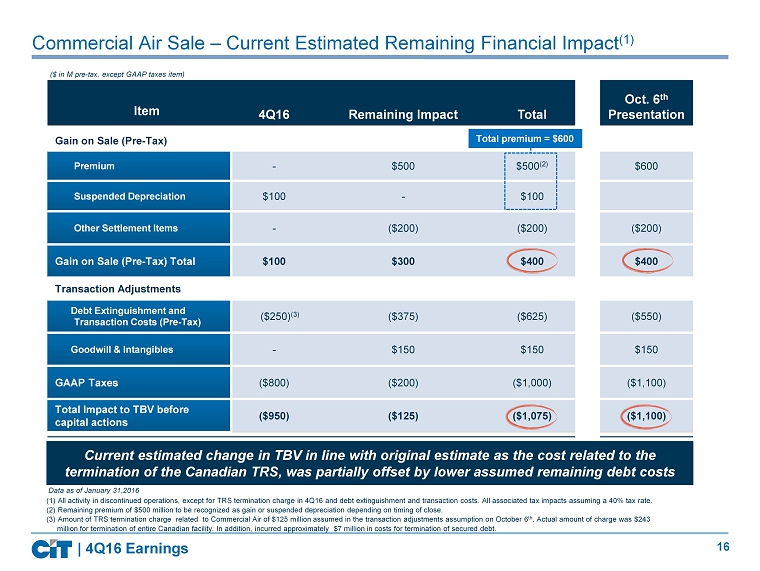
16 Commercial Air Sale – Current Estimated Remaining Financial Impact (1) | 4Q16 Earnings Item 4Q16 Remaining Impact Total Oct. 6 th Presentation Gain on Sale (Pre - Tax) Premium - $500 $500 (2) $600 Suspended Depreciation $100 - $100 Other Settlement Items - ($200) ($200) ($200) Gain on Sale (Pre - Tax) Total $100 $300 $400 $400 Transaction Adjustments Debt Extinguishment and Transaction Costs (Pre - Tax) ($250) (3) ($375) ($625) ($550) Goodwill & Intangibles - $150 $150 $150 GAAP Taxes ($800) ($200) ($1,000) ($1,100) Total Impact to TBV before capital actions ($950) ($125) ($1,075) ($1,100) ($ i n M pre - tax, except GAAP taxes item) ( 1 ) All activity in discontinued operations, except for TRS termination charge in 4Q16 and debt extinguishment and transaction costs. All associated tax impacts assuming a 40% tax rate. (2) Remaining premium of $500 million to be recognized as gain or suspended depreciation depending on timing of close. ( 3 ) Amount of TRS termination charge related to Commercial Air of $125 million assumed in the transaction adjustments assumption on October 6 th . Actual amount of charge was $243 million for termination of entire Canadian facility. In addition, incurred approximately $7 million in costs for terminati on of secured debt. Current estimated change in TBV in line with original estimate as the cost related to the termination of the Canadian TRS, was partially offset by lower assumed remaining debt costs Total premium = $600 Data as of January 31,2016
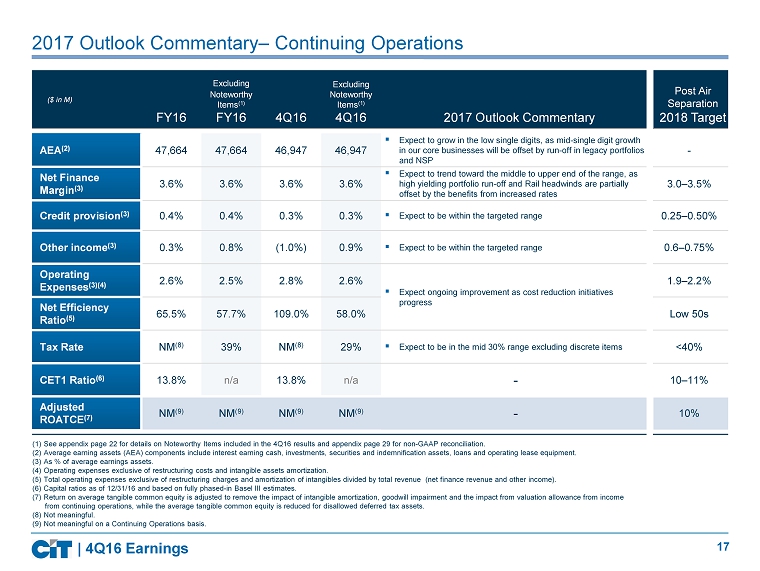
17 2017 Outlook Commentary – Continuing Operations ($ in M) FY16 Excluding Noteworthy Items (1) FY16 4Q16 Excluding Noteworthy Items (1) 4Q16 2017 Outlook Commentary Post Air Separation 2018 Target AEA (2) 47,664 47,664 46,947 46,947 ▪ Expect to grow in the low single digits, as mid - single digit growth in our core businesses will be offset by run - off in legacy portfolios and NSP - Net Finance Margin (3) 3.6% 3.6% 3.6% 3.6% ▪ Expect to trend toward the middle to upper end of the range, as high yielding portfolio run - off and Rail headwinds are partially offset by the benefits from increased rates 3.0 – 3.5% Credit provision (3) 0.4% 0.4% 0.3% 0.3% ▪ Expect to be within the targeted range 0.25 – 0.50% Other income (3) 0.3% 0.8% (1.0%) 0.9% ▪ Expect to be within the targeted range 0.6 – 0.75% Operating Expenses (3)(4) 2.6% 2.5% 2.8% 2.6% ▪ Expect ongoing improvement as cost reduction initiatives progress 1.9 – 2.2% Net Efficiency Ratio (5) 65.5% 57.7% 109.0% 58.0% Low 50s Tax Rate NM (8) 39% NM (8) 29% ▪ Expect to be in the mid 30% range excluding discrete items <40% CET1 Ratio (6) 13.8% n/a 13.8% n/a - 10 – 11% Adjusted ROATCE (7) NM (9) NM (9) NM (9) NM (9) - 10% | 4Q16 Earnings (1) See appendix page 22 for details on Noteworthy Items included in the 4Q16 results and appendix page 29 for non - GAAP reconciliation. (2) Average earning assets (AEA) components include interest earning cash, investments, securities and indemnification assets, loans and ope rating lease equipment. ( 3 ) As % of average earnings assets . (4) Operating expenses exclusive of restructuring costs and intangible assets amortization. (5) Total operating expenses exclusive of restructuring charges and amortization of intangibles divided by total revenue (net finance revenue and other income). (6) Capital ratios as of 12/31/16 and based on fully phased - in Basel III estimates. (7) Return on average tangible common equity is adjusted to remove the impact of intangible amortization, goodwill impairment and th e impact from valuation allowance from income from continuing operations, while the average tangible common equity is reduced for disallowed deferred tax assets. (8) Not meaningful. (9) Not meaningful on a Continuing Operations basis.
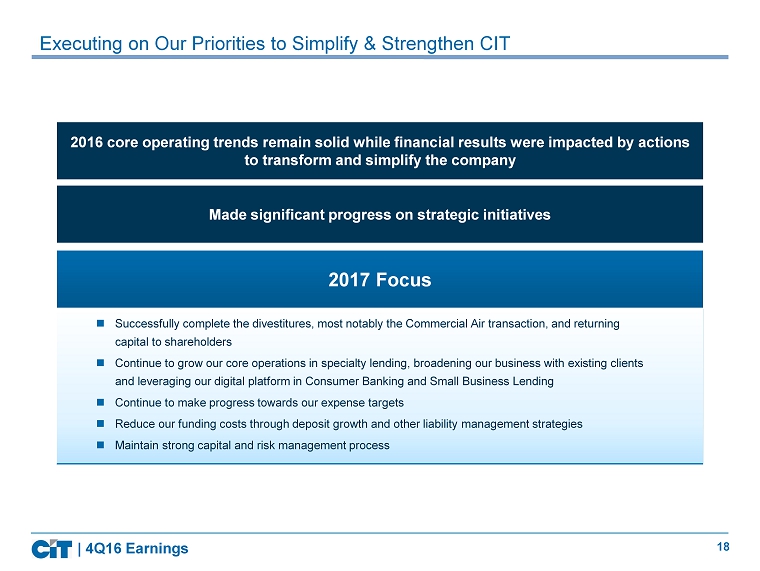
18 | 4Q16 Earnings 2016 core operating trends remain solid while financial results were impacted by actions to transform and simplify the company 2017 Focus Made significant progress on strategic initiatives Successfully complete the divestitures, most notably the Commercial Air transaction, and returning capital to shareholders Continue to grow our core operations in specialty lending, broadening our business with existing clients and leveraging our digital platform in Consumer Banking and Small Business Lending Continue to make progress towards our expense targets Reduce our funding costs through deposit growth and other liability management strategies Maintain strong capital and risk management process Executing on O ur Priorities to Simplify & Strengthen CIT
19 APPENDIX | 4Q16 Earnings
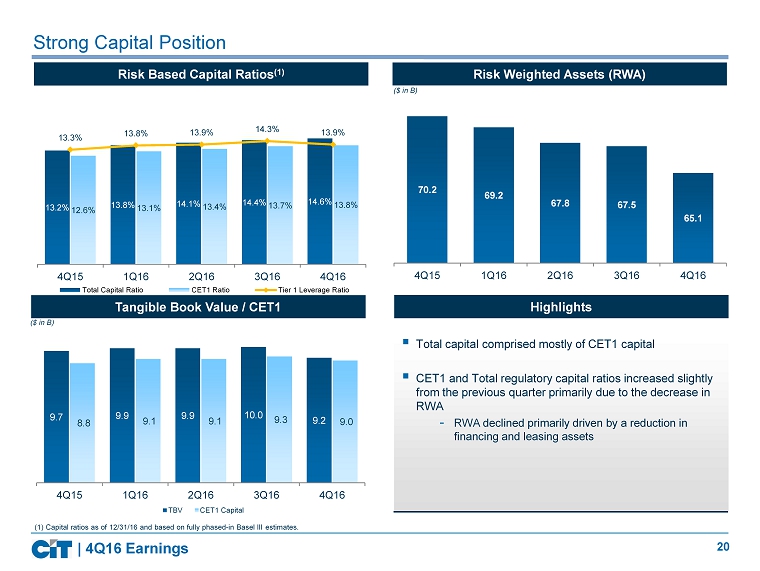
20 13.2% 13.8% 14.1% 14.4% 14.6% 12.6% 13.1% 13.4% 13.7% 13.8% 13.3% 13.8% 13.9% 14.3% 13.9% 4Q15 1Q16 2Q16 3Q16 4Q16 Total Capital Ratio CET1 Ratio Tier 1 Leverage Ratio Strong Capital Position 9.7 9.9 9.9 10.0 9.2 8.8 9.1 9.1 9.3 9.0 4Q15 1Q16 2Q16 3Q16 4Q16 TBV CET1 Capital Tangible Book Value / CET1 Risk Based Capital Ratios (1) ▪ Total capital comprised mostly of CET1 capital ▪ CET1 and Total regulatory capital ratios increased slightly from the previous quarter primarily due to the decrease in RWA - RWA declined primarily driven by a reduction in financing and leasing assets Highlights (1) Capital ratios as of 12/31/16 and based on fully phased - in Basel III estimates. ($ in B) 70.2 69.2 67.8 67.5 65.1 4Q15 1Q16 2Q16 3Q16 4Q16 Risk Weighted Assets (RWA) ($ in B) | 4Q16 Earnings
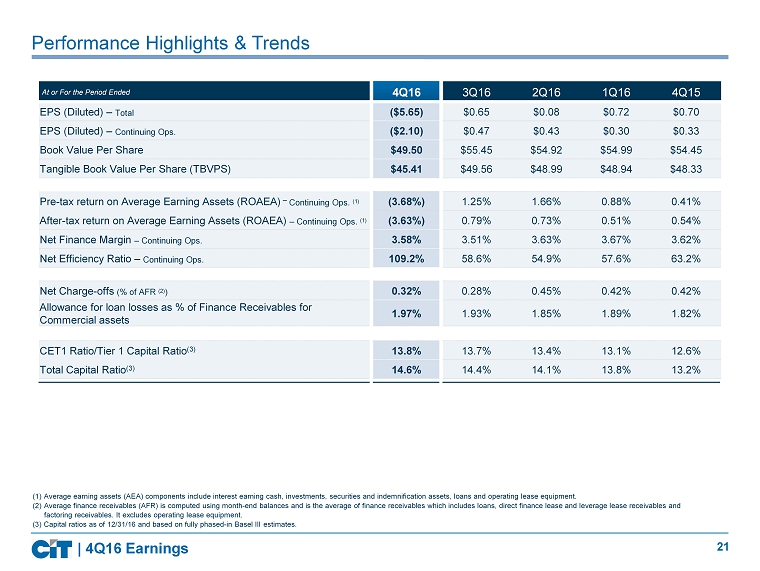
21 ( 1 ) Average earning assets (AEA) components include interest earning cash, investments, securities and indemnification assets, loans and operating lease equip men t. ( 2 ) Average finance receivables (AFR) is computed using month - end balances and is the average of finance receivables which include s loans, direct finance lease and leverage lease receivables and factoring receivables. It excludes operating lease equipment. (3) Capital ratios as of 12/31/16 and based on fully phased - in Basel III estimates. At or For the Period Ended 4Q16 3Q16 2Q16 1Q16 4Q15 EPS (Diluted) – Total ($5.65) $0.65 $0.08 $0.72 $0.70 EPS (Diluted) – Continuing Ops. ($2.10) $0.47 $0.43 $0.30 $0.33 Book Value Per Share $49.50 $55.45 $54.92 $54.99 $54.45 Tangible Book Value Per Share (TBVPS) $45.41 $49.56 $48.99 $48.94 $48.33 Pre - tax r eturn on Average Earning Assets (ROAEA) – Continuing Ops. (1) (3.68%) 1.25% 1.66% 0.88% 0.41% After - tax r eturn on Average Earning Assets (ROAEA) – Continuing Ops. (1) (3.63%) 0.79% 0.73% 0.51% 0.54% Net Finance Margin – Continuing Ops. 3.58% 3.51% 3.63% 3.67% 3.62% Net Efficiency Ratio – Continuing Ops. 109.2% 58.6% 54.9% 57.6% 63.2% Net Charge - offs (% of AFR (2) ) 0.32% 0.28% 0.45% 0.42% 0.42% A llowance for loan losses as % of Finance Receivables for Commercial assets 1.97% 1.93% 1.85% 1.89% 1.82% CET1 Ratio/Tier 1 Capital Ratio (3) 13.8% 13.7% 13.4% 13.1% 12.6% Total Capital Ratio (3) 14.6% 14.4% 14.1% 13.8% 13.2% Performance Highlights & Trends | 4Q16 Earnings
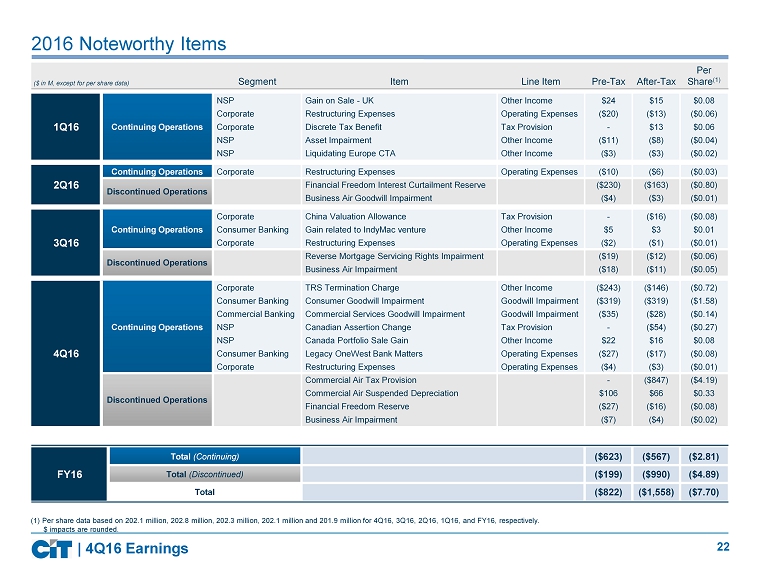
22 2016 Noteworthy Items Segment Item Line Item Pre - Tax After - Tax Per Share (1) 1Q16 Continuing Operations NSP Gain on Sale - UK Other Income $24 $15 $0.08 Corporate Restructuring Expenses Operating Expenses ($20) ($13) ($0.06) Corporate Discrete Tax Benefit Tax Provision - $13 $0.06 NSP Asset Impairment Other Income ($11) ($8) ($0.04) NSP Liquidating Europe CTA Other Income ($3) ($3) ($0.02) 2Q16 Continuing Operations Corporate Restructuring Expenses Operating Expenses ($10) ($6) ($0.03) Discontinued Operations Financial Freedom Interest Curtailment Reserve ($230) ($163) ($0.80) Business Air Goodwill Impairment ($4) ($3) ($0.01) 3Q16 Continuing Operations Corporate China Valuation Allowance Tax Provision - ($16) ($0.08) Consumer Banking Gain related to IndyMac venture Other Income $5 $3 $0.01 Corporate Restructuring Expenses Operating Expenses ($2) ($1) ($0.01) Discontinued Operations Reverse Mortgage Servicing Rights Impairment ($19) ($12) ($0.06) Business Air Impairment ($18) ($11) ($0.05) 4Q16 Continuing Operations Corporate TRS Termination Charge Other Income ($243) ($146) ($0.72) Consumer Banking Consumer Goodwill Impairment Goodwill Impairment ($319) ($319) ($1.58) Commercial Banking Commercial Services Goodwill Impairment Goodwill Impairment ($35) ($28) ($0.14) NSP Canadian Assertion Change Tax Provision - ($54) ($0.27) NSP Canada Portfolio Sale Gain Other Income $22 $16 $0.08 Consumer Banking Legacy OneWest Bank Matters Operating Expenses ($27) ($17) ($0.08) Corporate Restructuring Expenses Operating Expenses ($4) ($3) ($0.01) Discontinued Operations Commercial Air Tax Provision - ($847) ($4.19) Commercial Air Suspended Depreciation $106 $66 $0.33 Financial Freedom Reserve ($27) ($16) ($0.08) Business Air Impairment ($7) ($4) ($0.02) FY16 Total (Continuing) ($623) ($567) ($2.81) Total (Discontinued) ($199) ($990) ($4.89) Total ($822) ($1,558) ($7.70) (1) Per share data based on 202.1 million, 202.8 million, 202.3 million, 202.1 million and 201.9 million for 4Q16, 3Q16, 2Q16, 1Q16, and FY16, respect ive ly. $ impacts are rounded. ($ in M, except for per share data) | 4Q16 Earnings
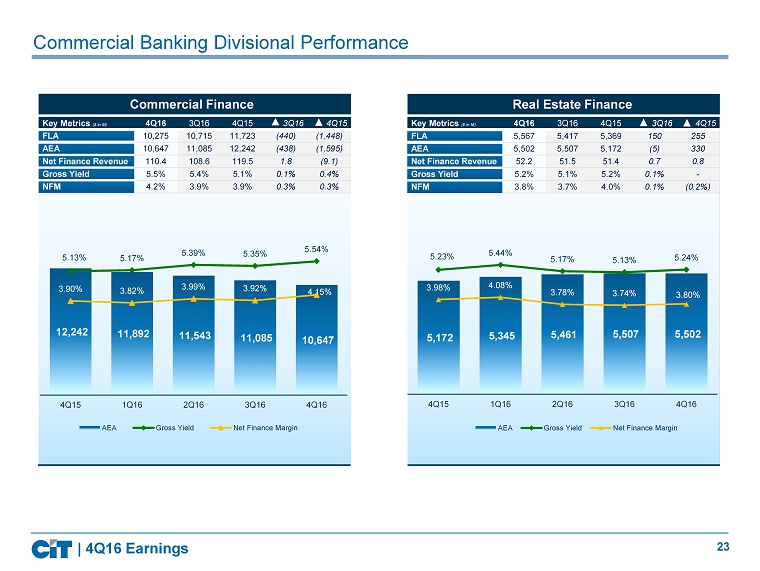
23 Commercial Banking Divisional Performance Key Metrics ($ in M) 4Q16 3Q16 4Q15 3Q16 4Q15 FLA 10,275 10,715 11,723 (440) (1,448) AEA 10,647 11,085 12,242 (438) (1,595) Net Finance Revenue 110.4 108.6 119.5 1.8 (9.1) Gross Yield 5.5% 5.4% 5.1% 0.1% 0.4% NFM 4.2% 3.9% 3.9% 0.3% 0.3% 12,242 11,892 11,543 11,085 10,647 5.13% 5.17% 5.39% 5.35% 5.54% 3.90% 3.82% 3.99% 3.92% 4.15% 4Q15 1Q16 2Q16 3Q16 4Q16 AEA Gross Yield Net Finance Margin Commercial Finance | 4Q16 Earnings Key Metrics ($ in M) 4Q16 3Q16 4Q15 3Q16 4Q15 FLA 5,567 5,417 5,369 150 255 AEA 5,502 5,507 5,172 (5) 330 Net Finance Revenue 52.2 51.5 51.4 0.7 0.8 Gross Yield 5.2% 5.1% 5.2% 0.1% - NFM 3.8% 3.7% 4.0% 0.1% (0.2%) Real Estate Finance 5,172 5,345 5,461 5,507 5,502 5.23% 5.44% 5.17% 5.13% 5.24% 3.98% 4.08% 3.78% 3.74% 3.80% 4Q15 1Q16 2Q16 3Q16 4Q16 AEA Gross Yield Net Finance Margin
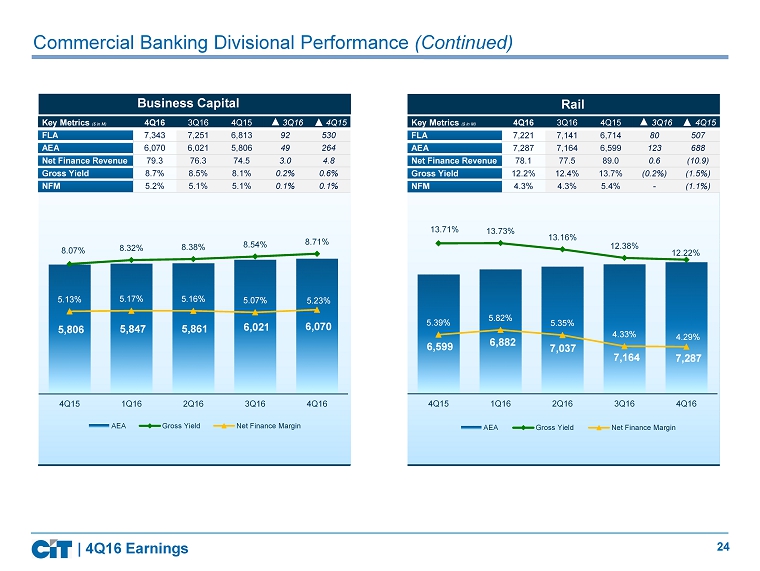
24 Commercial Banking Divisional Performance (Continued) Business Capital | 4Q16 Earnings Rail Key Metrics ($ in M) 4Q16 3Q16 4Q15 3Q16 4Q15 FLA 7,343 7,251 6,813 92 530 AEA 6,070 6,021 5,806 49 264 Net Finance Revenue 79.3 76.3 74.5 3.0 4.8 Gross Yield 8.7% 8.5% 8.1% 0.2% 0.6% NFM 5.2% 5.1% 5.1% 0.1% 0.1% 5,806 5,847 5,861 6,021 6,070 8.07% 8.32% 8.38% 8.54% 8.71% 5.13% 5.17% 5.16% 5.07% 5.23% 4Q15 1Q16 2Q16 3Q16 4Q16 AEA Gross Yield Net Finance Margin Key Metrics ($ in M) 4Q16 3Q16 4Q15 3Q16 4Q15 FLA 7,221 7,141 6,714 80 507 AEA 7,287 7,164 6,599 123 688 Net Finance Revenue 78.1 77.5 89.0 0.6 (10.9) Gross Yield 12.2% 12.4% 13.7% (0.2%) (1.5%) NFM 4.3% 4.3% 5.4% - (1.1%) 6,599 6,882 7,037 7,164 7,287 13.71% 13.73% 13.16% 12.38% 12.22% 5.39% 5.82% 5.35% 4.33% 4.29% 4Q15 1Q16 2Q16 3Q16 4Q16 AEA Gross Yield Net Finance Margin
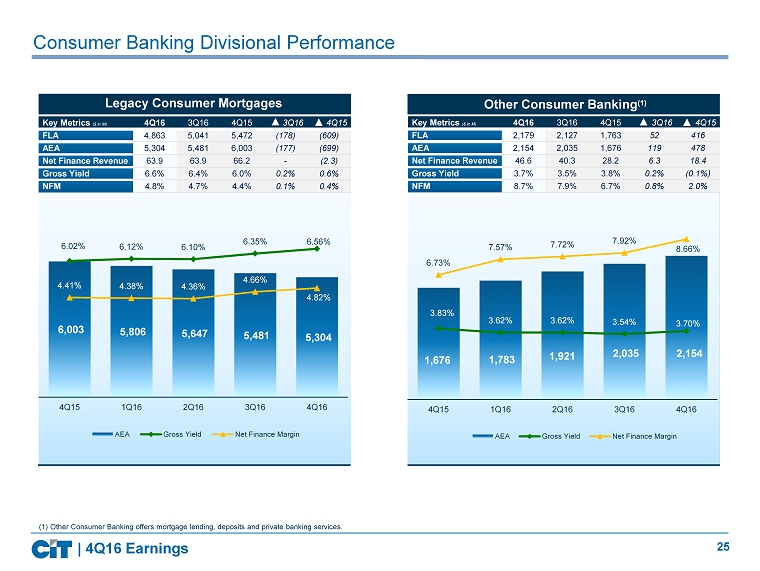
25 Consumer Banking Divisional Performance Legacy Consumer Mortgages | 4Q16 Earnings Other Consumer Banking (1) Key Metrics ($ in M) 4Q16 3Q16 4Q15 3Q16 4Q15 FLA 4,863 5,041 5,472 (178) (609) AEA 5,304 5,481 6,003 (177) (699) Net Finance Revenue 63.9 63.9 66.2 - (2.3) Gross Yield 6.6% 6.4% 6.0% 0.2% 0.6% NFM 4.8% 4.7% 4.4% 0.1% 0.4% 6,003 5,806 5,647 5,481 5,304 6.02% 6.12% 6.10% 6.35% 6.56% 4.41% 4.38% 4.36% 4.66% 4.82% 4Q15 1Q16 2Q16 3Q16 4Q16 AEA Gross Yield Net Finance Margin Key Metrics ($ in M) 4Q16 3Q16 4Q15 3Q16 4Q15 FLA 2,179 2,127 1,763 52 416 AEA 2,154 2,035 1,676 119 478 Net Finance Revenue 46.6 40.3 28.2 6.3 18.4 Gross Yield 3.7% 3.5% 3.8% 0.2% (0.1%) NFM 8.7% 7.9% 6.7% 0.8% 2.0% 1,676 1,783 1,921 2,035 2,154 3.83% 3.62% 3.62% 3.54% 3.70% 6.73% 7.57% 7.72% 7.92% 8.66% 4Q15 1Q16 2Q16 3Q16 4Q16 AEA Gross Yield Net Finance Margin ( 1 ) Other Consumer Banking offers mortgage lending, deposits and private banking services.
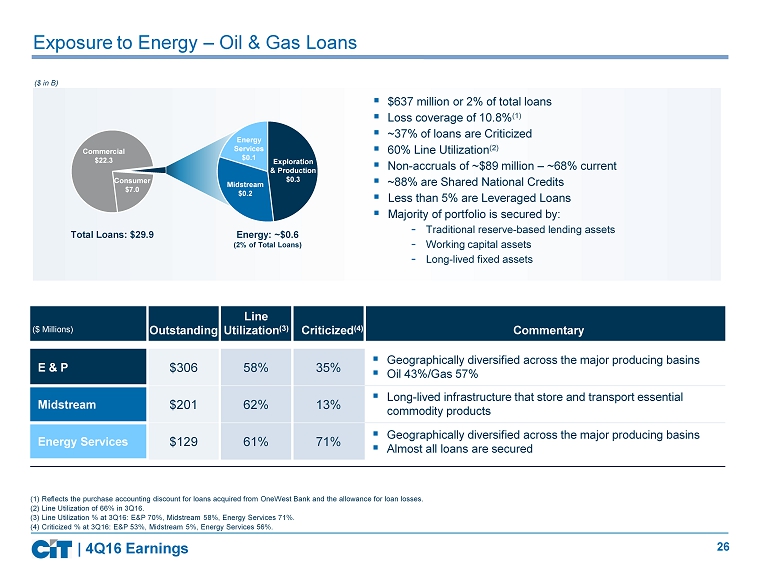
26 Exposure to Energy – Oil & Gas Loans ($ in B) (1) Reflects the purchase accounting discount for loans acquired from OneWest Bank and the allowance for loan losses. (2) Line Utilization of 66% in 3Q16. (3) Line Utilization % at 3Q16: E&P 70%, Midstream 58%, Energy Services 71%. (4) Criticized % at 3Q16: E&P 53%, Midstream 5%, Energy Services 56%. Outstanding Line Utilization (3) Criticized (4) Commentary E & P $306 58% 35% ▪ Geographically diversified across the major producing basins ▪ Oil 43%/Gas 57% Midstream $201 62% 13% ▪ Long - lived infrastructure that store and transport essential commodity products Energy Services $129 61% 71% ▪ Geographically diversified across the major producing basins ▪ Almost all loans are secured Total Loans: $29.9 Energy: ~$0.6 (2% of Total Loans) Commercial $22.3 Consumer $7.0 Midstream $0.2 Energy Services $0.1 Exploration & Production $0.3 ▪ $637 million or 2% of total loans ▪ Loss coverage of 10.8% ( 1) ▪ ~37% of loans are Criticized ▪ 60% Line Utilization (2) ▪ Non - accruals of ~$89 million – ~68% current ▪ ~88% are Shared National Credits ▪ Less than 5% are Leveraged Loans ▪ Majority of portfolio is secured by: - Traditional reserve - based lending assets - Working capital assets - Long - lived fixed assets ($ Millions) | 4Q16 Earnings
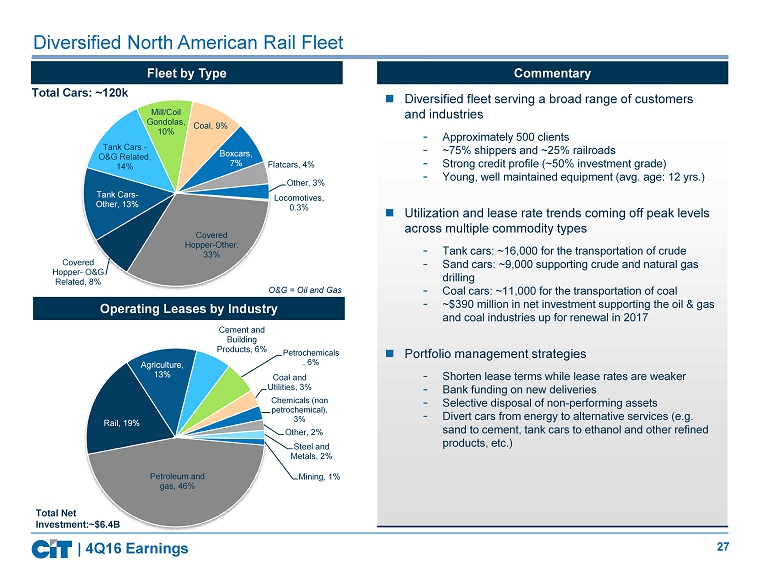
27 Petroleum and gas, 46% Rail, 19% Agriculture, 13% Cement and Building Products, 6% Petrochemicals , 6% Coal and Utilities, 3% Chemicals (non petrochemical), 3% Other, 2% Steel and Metals, 2% Mining, 1% Covered Hopper - Other, 33% Covered Hopper - O&G Related, 8% Tank Cars - Other, 13% Tank Cars - O&G Related, 14% Mill/Coil Gondolas, 10% Coal, 9% Boxcars, 7% Flatcars, 4% Other, 3% Locomotives, 0.3% Total Cars: ~120k Diversified North American Rail Fleet Operating Leases by Industry Fleet by Type Diversified fleet serving a broad range of customers and industries - Approximately 500 clients - ~75% shippers and ~25% railroads - Strong credit profile (~50% investment grade) - Young, well maintained equipment ( avg. age: 12 yrs.) Utilization and lease rate trends coming off peak levels across multiple commodity types - Tank cars: ~16,000 for the transportation of crude - Sand c ars: ~9,000 supporting crude and natural gas drilling - Coal cars: ~11,000 for the transportation of coal - ~$390 million in net investment supporting the oil & gas and coal industries up for renewal in 2017 Portfolio management strategies - Shorten lease terms while lease rates are weaker - Bank funding on new deliveries - Selective disposal of non - performing assets - Divert cars from energy to alternative services (e.g. sand to cement, tank cars to ethanol and other refined products, etc.) Total Net Investment:~$6.4B Commentary O&G = Oil and Gas | 4Q16 Earnings
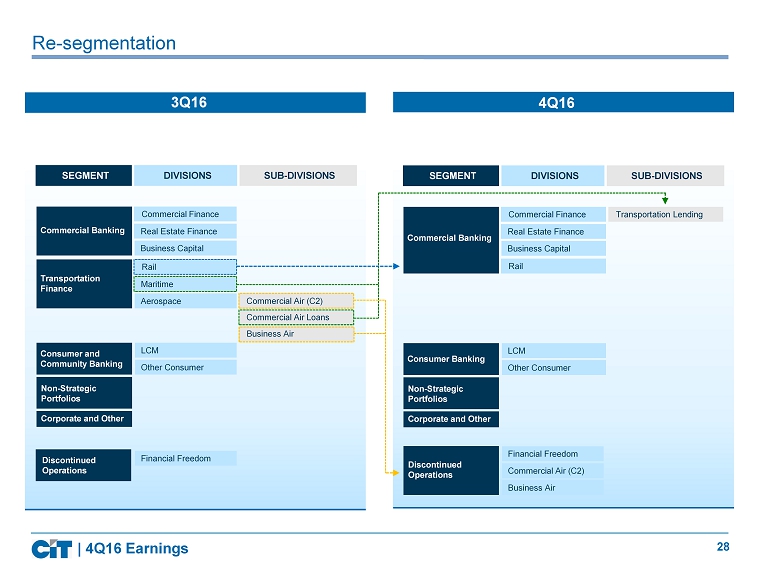
28 Re - segmentation 3Q16 SEGMENT DIVISIONS SUB - DIVISIONS 4Q16 Commercial Finance Real Estate Finance Business Capital LCM Other Consumer Rail Maritime Aerospace Commercial Banking Transportation Finance Consumer and Community Banking Non - Strategic Portfolios Corporate and Other SEGMENT DIVISIONS SUB - DIVISIONS Commercial Finance Real Estate Finance Business Capital LCM Other Consumer Rail Commercial Banking Consumer Banking Non - Strategic Portfolios Corporate and Other Transportation Lending | 4Q16 Earnings Commercial Air (C2) Commercial Air Loans Business Air Discontinued Operations Financial Freedom Financial Freedom Commercial Air (C2) Discontinued Operations Business Air
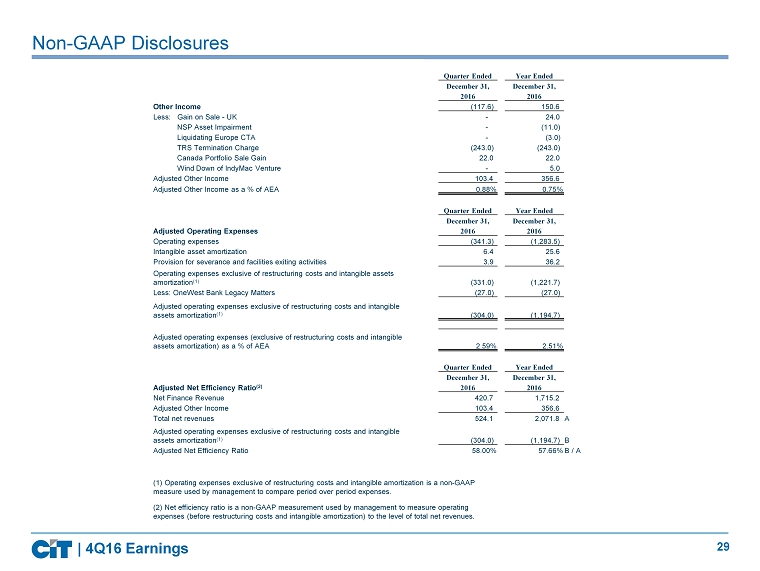
29 Non - GAAP Disclosures | 4Q16 Earnings Quarter Ended Year Ended December 31, December 31, 2016 2016 Other Income (117.6) 150.6 Less: Gain on Sale - UK - 24.0 NSP Asset Impairment - (11.0) Liquidating Europe CTA - (3.0) TRS Termination Charge (243.0) (243.0) Canada Portfolio Sale Gain 22.0 22.0 Wind Down of IndyMac Venture - 5.0 Adjusted Other Income 103.4 356.6 Adjusted Other Income as a % of AEA 0.88% 0.75% Quarter Ended Year Ended December 31, December 31, Adjusted Operating Expenses 2016 2016 Operating expenses (341.3) (1,283.5) Intangible asset amortization 6.4 25.6 Provision for severance and facilities exiting activities 3.9 36.2 Operating expenses exclusive of restructuring costs and intangible assets amortization (1) (331.0) (1,221.7) Less: OneWest Bank Legacy Matters (27.0) (27.0) Adjusted operating expenses exclusive of restructuring costs and intangible assets amortization (1) (304.0) (1,194.7) Adjusted operating expenses (exclusive of restructuring costs and intangible assets amortization) as a % of AEA 2.59% 2.51% Quarter Ended Year Ended December 31, December 31, Adjusted Net Efficiency Ratio (2) 2016 2016 Net Finance Revenue 420.7 1,715.2 Adjusted Other Income 103.4 356.6 Total net revenues 524.1 2,071.8 A Adjusted operating expenses exclusive of restructuring costs and intangible assets amortization (1) (304.0) (1,194.7) B Adjusted Net Efficiency Ratio 58.00% 57.66% B / A (1) Operating expenses exclusive of restructuring costs and intangible amortization is a non - GAAP measure used by management to compare period over period expenses. (2) Net efficiency ratio is a non - GAAP measurement used by management to measure operating expenses (before restructuring costs and intangible amortization) to the level of total net revenues.
30