Attached files
| file | filename |
|---|---|
| 8-K - FORM 8-K - Real Goods Solar, Inc. | t1700168_8k.htm |
Exhibit 99.1

29 th Annual ROTH Conference Presentation March 15, 2017 NASDAQ: RGSE

NASDAQ: RGSE Forward - Looking Statements This presentation by RGS Energy (the “Company,” “we,” “us,” “its,” “our”) contains forward - looking statements within the meaning of the U.S. Private Securities Litigation Reform Act of 1995 that involve risks and uncertainties, including statements regarding the Com pan y’s business and financial strategies, its growth opportunities, future sales and installation revenue, its growth strategy and plans to achie ve break - even or better results in future periods resulting from increased sales and reduced cost of goods sold and operating expenses. Forward - looking statements are neither historical facts nor assurances of future performance. Instead, they provide our current beliefs, expectations, assum pti ons, forecasts, and hypothetical constructs about future events, and include statements regarding our future results of operations and financial pos ition, business strategy, budgets, projected costs, plans and objectives of management for future operations. The words “hypothetical,” “anti cip ate,” “believe,” “plan,” “target”, “estimate,” “expect,” “future,” “may,” “will” and similar expressions as they relate to us are intended to ide ntify such forward - looking statements. Forward - looking statements should not be read as a guarantee of future performance or results, and will not necessarily be accur ate indications of the times at, or by, which such performance or results will be achieved, if at all. Forward looking statements are subjec t t o risks and uncertainties that could cause actual performance or results to differ materially from those expressed in or suggested by the fo rward looking statements. Therefore, the Company cautions you against relying on any of these forward - looking statements. Key risks and uncertainties that may cause a change in any forward - looking statement: the effect of electric power generation in dustry regulations in the states the Company operates; net electric power metering and related policies; the effect of future change s t o federal and state incentives for renewables; the level of demand for the Company’s solar energy systems; the availability of a sufficient , t imely, and cost - effective supply of solar panels; the Company’s ability to implement its growth strategy, achieve its target level of sales, and to generate cash flow from operations; the Company’s ability to achieve break - even and better results; the resolution of contract disputes in its discontinued operations; U.S. photovoltaic installation forecasts; the Company’s ability to successfully implement its sales and marketing st rategy; future changes in electricity rates charged by local utilities; RGS Energy’s ability to successfully expand into new states; RGS Ene rgy ’s ability to successfully win Solarize projects” somewhere in the list and RGS Energy’s ability to successfully expand its product offerin g t o include battery technology. You should read the section entitled “Risk Factors” in our 2016 Annual Report on Form 10 - K which has been filed with the Securities and Exchange Commission, which identify certain of these and additional risks and uncertainties. Any forward - looking statements made by us in this presentation speak only as of the date of this presentation. Factors or events that could cause our actual results to di ffe r may emerge from time to time, and it is not possible for us to predict all of them. We do not undertake any obligation to publicly update or rev ise any forward - looking statement, whether as a result of new information, future developments or otherwise, except as may be required by law . RGS Energy is the Company’s registered trade name. The Company files periodic and other reports with the Securities and Excha nge Commission under its official name “Real Goods Solar, Inc.” © Copyright 2017 Real Goods Solar, Inc. All Rights Reserved. 2

NASDAQ: RGSE We Sell & Install Rooftop Solar Systems A nationwide leader of turnkey solar energy solutions for residential and small commercial customers Installed 25,000+ solar energy systems , totaling more than 260 megawatts of clean energy since 1978 Majority of materials are “Buy American” under the American Recovery and Reinvestment Act and newest electrical codes Primary business segments: • Residential: Installs solar systems for homeowners and small commercial businesses in the continental U.S. – our largest segment • Sunetric: Installs residential and commercial solar systems in Hawaii – based in Oahu, Hawaii HQ in Denver, Colorado, with ~170 employees across the U.S. 3

NASDAQ: RGSE RGS Energy Key Stats: NASDAQ (RGSE) 4 Data source: S&P Capital IQ (mrq) – most recent quarter as of Dec. 31, 2016. 1) As of March 8, 2017 2) Pro forma as if the net proceeds of the $16.1M raised in February 2017 and the debt repayments made in January were comple ted on Dec. 31, 2016. RGSE Now Positioned for Growth Quarter Ended 12/31/2014 Quarter Ended 12/31/2015 Quarter Ended 12/31/2016 As of 2/28/2017 Target 12/31/2017 Capitalized for Growth Stockholders Equity (deficit) $(5,346,671) $(710,152) $4,978,000 ≈ $19,000,000 Cost s declined for margin improvement Residential segment cost per watt installed $3.61 $3.82 $3.07 $2.74 Rebuilding Sales Organization for Growth Number of residential segment salespeople 70 34 16 23 64 Stock Price (3/13/17) $1.37 52 Week Low - High $0.18 - $17.00 Avg. Vol. (3 mo.) 3.2M Shares Outstanding 1 7.5M Insider Holdings (est.) <1% Market Cap $10.3M Net Revenue (mrq) $5.1M Operating Loss from Cont. Ops. (mrq) $1.9M Cash (est.) 2 ≈$18M Total Debt 2 $0 Stockholders Equity 2 ≈$21M Employees ≈170

NASDAQ: RGSE Our Turnkey Customer Solar Solution: A solar system at work 5 Turning the Sun’s Energy Into Usable Power
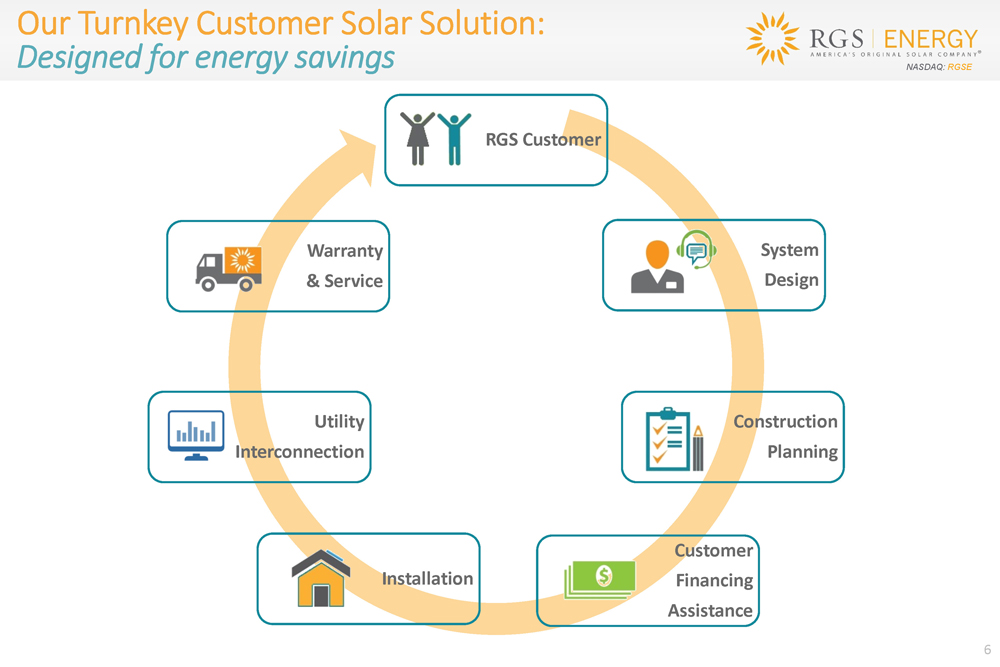
NASDAQ: RGSE Our Turnkey Customer Solar Solution: Designed for energy savings 6 RGS Customer System Design Construction Planning Customer Financing Assistance Installation Utility Interconnection Warranty & Service

NASDAQ: RGSE Residential Segment RGS Pacific Mid - Atlantic New England West Coast Total States of Operation HI NY NJ MA VT RI NH CT CA CO* 10 Residential x x x x x x x x x x 10 Small Commercial x x x x x x x x x x 10 Commercial x - - - - - - - - - 1 Company Field Sales Teams x x x x x x x x - - 8 RGS Construction Teams x - - x x x x x - - 6 Call Center Sales - x x x x x x x x x 9 Authorized 3rd Party Integrators x x x x x x x x x x 10 Number of Offices/Warehouses 2 1 - 1 - 1 - 1 - 1 7 Our National Operating Footprint 7 *Corporate Headquarters
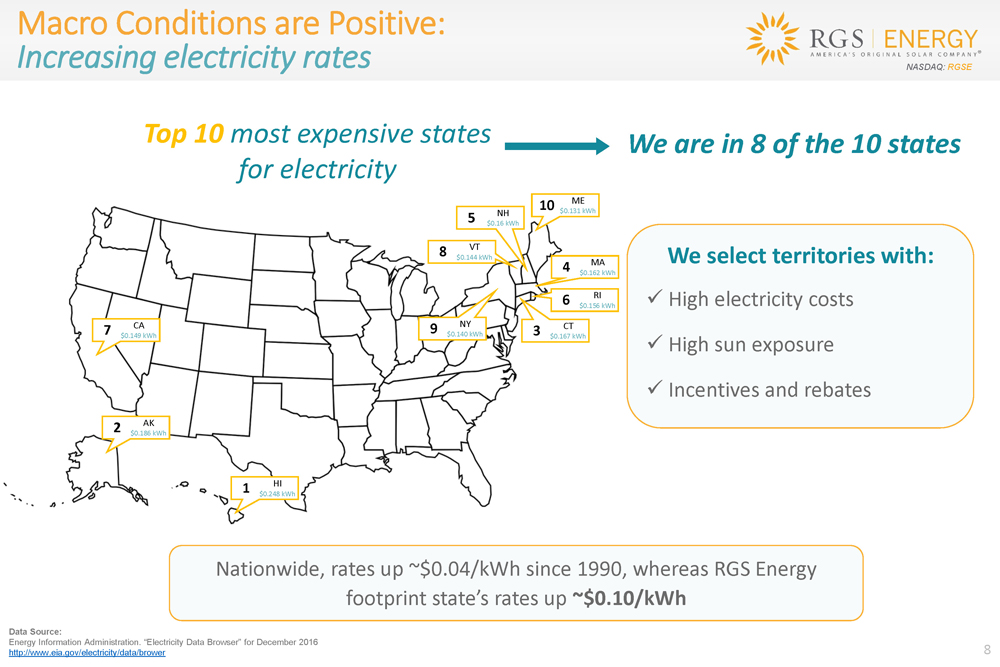
NASDAQ: RGSE Macro Conditions are Positive: Increasing electricity rates 8 1 HI $0.248 kWh 2 AK $0.186 kWh 3 CT $0.167 kWh 4 MA $0.162 kWh 5 NH $0.16 kWh 6 RI $0.156 kWh 7 CA $0.149 kWh 8 VT $0.144 kWh 9 NY $0.140 kWh 10 ME $0.131 kWh Data Source: Energy Information Administration. “Electricity Data Browser” for December 2016 http://www.eia.gov/electricity/data/brower Top 10 most expensive states for electricity We are in 8 of the 10 states We select territories with: x High electricity costs x High sun exposure x Incentives and rebates Nationwide, rates up ~$0.04/kWh since 1990, whereas RGS Energy footprint state’s rates up ~$0.10/kWh

NASDAQ: RGSE 0 5,000 10,000 15,000 20,000 25,000 2010 2011 2012 2013 2014 2015 2016 2017E 2018E 2019E 2020E 2021E Installed Capacity (MWdc) U.S. Photovoltaic (PV) Installation Forecast Residential PV Non-Residential PV Utility PV 9 Source: GTM Research, Solar Market Insight Report 2016 The ITC was extended by Congress through 2021 - expected to support continued demand. Macro Conditions are Positive: Strong outlook for business growth
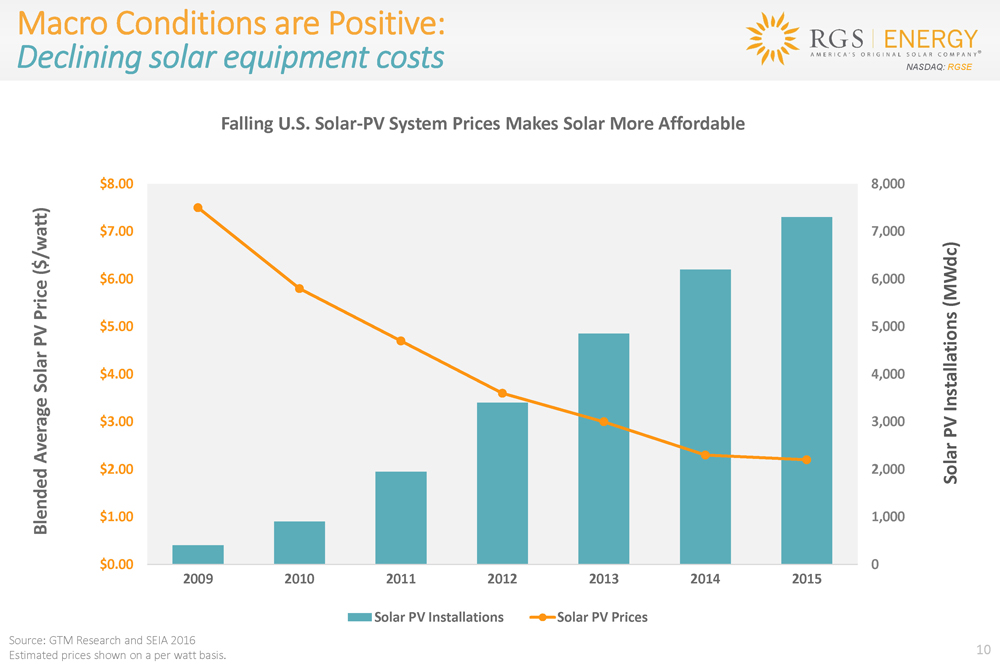
NASDAQ: RGSE Macro Conditions are Positive: Declining solar equipment costs 10 Source: GTM Research and SEIA 2016 Estimated prices shown on a per watt basis. 0 1,000 2,000 3,000 4,000 5,000 6,000 7,000 8,000 2009 2010 2011 2012 2013 2014 2015 $0.00 $1.00 $2.00 $3.00 $4.00 $5.00 $6.00 $7.00 $8.00 Solar PV Installations (MWdc) Blended Average Solar PV Price ($/watt) Falling U.S. Solar - PV System Prices Makes Solar More Affordable Solar PV Installations Solar PV Prices

NASDAQ: RGSE We Have a Niche: Attractive Customer IRR for Cash Transactions 11 *Assumes a 3% annual increase in electrical bills & production of 182,000 kWh Total System Cost $22,229 Tax Credits (5,816) Other Incentives (2,840) Net Investment $13,571 Cost per kWh: Today's Utility Electrical Rate: $0.19 Year 1 Cost of Electricity $0.08 (amortizing investment over 25 years) Break - Even Year 9 Internal Rate of Return 14% Total Costs for the Next 25 Years with Solar: $21,816 Total Costs for the Next 25 Years without Solar: $58,250 Your Net Savings with Solar: $36,434 • Our niche - Over 90% of RGS’ customers make a purchase with their own cash or proceeds from a loan • Customers enjoy the benefits of Investment Tax Credit (“ITC”) • Customers IRR is high for cash/loan purchases - a strong value proposition • Competitors focus on lease financing where the customer does not benefit from the ITC Example RGS Customer

NASDAQ: RGSE Sales Organization Marketing Other Sales Initiatives Expand our call center, field sales teams and sales support staff Utilize our proven internal training program and expand our in - house training team Increase sales organization , bringing total employees to over 200 team members in 2017 Seek and negotiate cost effective marketing agreements to generate leads for our sales teams utilizing: Digital Web Leads - Higher percentage from lead to close Partner Programs - Lower cost per acquisition Customer Referrals - Organic lead generation with the highest conversion rate and lowest cost per acquisition Paid Lead Programs - Structured for performance Continue to reduce cost of materials to offer a competitive price to our customers Focus on our niche - customers that can make a purchase with their own cash or proceeds from a loan Leverage our sourcing for Small Commercial opportunities and build a dedicated sales team Expand into new states Focus on Community Solarize Programs – we have done roughly 40 solarize programs in the past Introduce new products: battery storage solutions Our Revenue Growth Strategy: Rebuilding Sales and Marketing 12
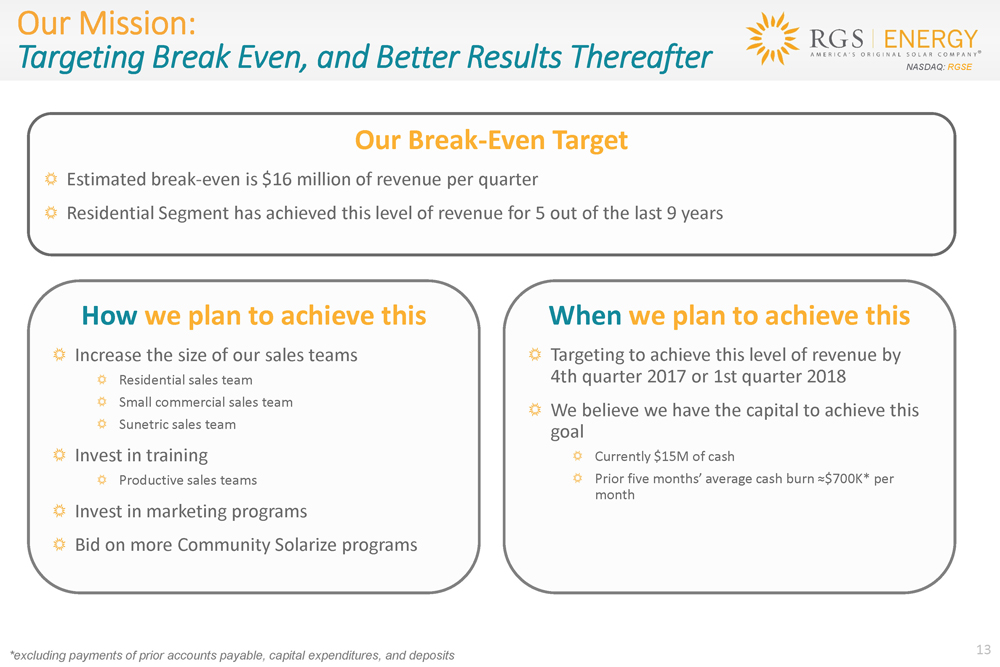
NASDAQ: RGSE Our Mission: Targeting Break Even, and Better Results Thereafter 13 Our Break - Even Target Estimated break - even is $16 million of revenue per quarter Residential Segment has achieved this level of revenue for 5 out of the last 9 years *excluding payments of prior accounts payable, capital expenditures, and deposits How we plan to achieve this Increase the size of our sales teams Residential sales team Small commercial sales team Sunetric sales team Invest in training Productive sales teams Invest in marketing programs Bid on more Community Solarize programs When we plan to achieve this Targeting to achieve this level of revenue by 4th quarter 2017 or 1st quarter 2018 We believe we have the capital to achieve this goal Currently $15M of cash Prior five months’ average cash burn ≈$700K* per month

NASDAQ: RGSE Strategies to Mitigate Industry Risks: Location and Financing Options 14 *Reflects residential installation results in kW for full year 2016 Many competitors have a high concentration in California, which has intense competition and high cost of marketing leads, which effects profitability Customer preference switching from lease to owning (our customers use their own cash or cash from a loan) – RGS is not reliant upon leasing Installs by State* Installs by Region*

NASDAQ: RGSE Strategies to Mitigate Industry Risks: Deleveraged Balance Sheet 15 RGSE is Debt Free 20% 20% 46% 45% 34% 35% 100% Competitor A Competitor B COMPARATIVE CAPITAL STACKS OF PUBLIC RESIDENTIAL SOLAR COMPANIES Tax Equity (repayment risk) Debt Shareholders Equity

NASDAQ: RGSE Our Strategies to Mitigate Industry Risks: Utilities opposition to net metering 16 Net Metering: surplus power produced from customers solar system is transferred to the utility grid, offsetting the cost of power later drawn from their utility. • Essentially using the utility as “battery storage” If utilities reduce or restrict net metering, customers have two options to maximize value • Install a smaller solar system size: only offset their “daily minimum load”, eliminates production of energy excess OR • Install a battery system: onsite storage to retain excess power produced until needed We are developing plans to incorporate battery technology into our offering 0 0.5 1 1.5 2 2.5 3 3.5 0:00 2:00 4:00 6:00 8:00 10:00 12:00 14:00 16:00 18:00 20:00 22:00 0:00 Power (kW) Hour Example: Daily Solar Production vs Load Usage Production

NASDAQ: RGSE 17 *The pro forma results present the company’s balance sheet as if the net proceeds of the $16.1 million raised in February 201 7 a nd the debt repayments made in January were completed on December 31, 2016. **Non - Cash expense for fair value accounting for complex financial instruments for which a corresponding increase to additional paid - in capital is recorded resulting in no impact on stockholders’ equity; the company does not expect to record similar material non - cash expense during 2017. RGSE Now Positioned for Growth: Stronger Financial Position & Progress Toward Break - Even Operating Results (000's omitted and unaudited) Pro forma After February Capital Raises* Quarter Reported Dec. 31, 2016 Quarter Reported Sept. 30, 2016 Year Ago Reported Dec. 31, 2015 Selected Balance Sheet Items: Cash $18,550 $2,940 $1,378 $594 Line of Credit Balance 0 663 3,598 774 Convertible Debt 1 124 5,388 0 Total Debt 1 787 8,986 774 Stockholder's Equity 21,201 4,978 (5,578) (1,013) Selected Income Statement Items: - Revenue for Quarter - $5,139 $2,463 $9,749 Gross Margin Percentage - 24% 5% 16% Operating Loss - (1,859) (3,038) (4,020) Non - Cash Income (Expense)** - (8,296) (3,366) 203 Net Loss (10,479) (7,735) (4,209) Other Items: Working Capital (Deficit) $18,808 $2,586 ($3,210) ($5,060) Backlog 8,382 12,593 16,698

NASDAQ: RGSE Key Takeaways Operates in a Large & Growing Market with Favorable Macro Dynamics - increasing utility rates, decreasing PV system costs and extension of ITC for 5 years 39 - years in Solar Industry - both residential & commercial Nationwide Platform - strategically located in key U.S. solar markets Viable Plan for Break - Even & Better Results • “Right sized” the business for a low targeted break - even revenue • Hire and train a larger salesforce • Strong balance sheet and capital to execute the plan • A plan that mitigates industry risks such as reliance on leasing and tax equity Opportunities to Improve Results • Grow revenue, achieve break - even and better results in the future • Ancillary product sales, such as water heaters and energy storage • Expand to new territories 18

NASDAQ: RGSE Contact Us RGS Energy Headquarters 110 16 th Street, 3 rd Floor Denver, CO 80202 Company Contact Tyler Clarke Director, Investor Relations Tel 303.222.8344 Investor Relations Contact Capital Market Access, LLC (CMA) Ron Both, Managing Partner Tel 949.432.7566 RGSE@cma.team 19 www.rgsenergy.com www.facebook.com/rgsenergy www.twitter.com/rgsenergy Disclaimer: Information on websites listed above is not incorporated by reference into this presentation.