Attached files
| file | filename |
|---|---|
| EX-32.1 - EX-32.1 - Pendrell Corp | pco-ex321_245.htm |
| EX-31.2 - EX-31.2 - Pendrell Corp | pco-ex312_246.htm |
| EX-31.1 - EX-31.1 - Pendrell Corp | pco-ex311_247.htm |
| EX-21.1 - EX-21.1 - Pendrell Corp | pco-ex211_249.htm |
| EX-10.17 - EX-10.17 - Pendrell Corp | pco-ex1017_250.htm |
| EX-10.16 - EX-10.16 - Pendrell Corp | pco-ex1016_251.htm |
| EX-10.12 - EX-10.12 - Pendrell Corp | pco-ex1012_292.htm |
| EX-10.7 - EX-10.7 - Pendrell Corp | pco-ex107_253.htm |
UNITED STATES
SECURITIES AND EXCHANGE COMMISSION
Washington, D.C. 20549
FORM 10-K
(Mark One)
|
☒ |
ANNUAL REPORT PURSUANT TO SECTION 13 OR 15(d) OF THE SECURITIES EXCHANGE ACT OF 1934 |
For the fiscal year ended December 31, 2016
Or
|
☐ |
TRANSITION REPORT PURSUANT TO SECTION 13 OR 15(d) OF THE SECURITIES EXCHANGE ACT OF 1934 |
For the transition period from to
Commission File Number 001-33008
PENDRELL CORPORATION
(Exact name of registrant as specified in its charter)
|
Washington |
98-0221142 |
|
(State or other jurisdiction of incorporation or organization) |
(IRS Employer Identification No.) |
2300 Carillon Point, Kirkland, Washington 98033
(Address of principal executive offices including zip code)
(425) 278-7100
(Registrant’s telephone number, including area code)
Securities registered pursuant to Section 12(b) of the Act:
|
Title of each class |
Name of each exchange on which registered |
|
Class A common stock, par value $0.01 per share |
The Nasdaq Capital Market |
Securities registered pursuant to Section 12(g) of the Act:
None
Indicate by check mark if the registrant is a well-known seasoned issuer, as defined in Rule 405 of the Securities Act. Yes ☐ No ☒.
Indicate by check mark if the registrant is not required to file reports pursuant to Section 13 or 15(d) of the Act. Yes ☐ No ☒.
Indicate by check mark whether the registrant: (1) has filed all reports required to be filed by Section 13 or 15(d) of the Securities Exchange Act of 1934 during the preceding 12 months (or for such shorter period that the registrant was required to file such reports), and (2) has been subject to such filing requirements for the past 90 days. Yes ☒ No ☐.
Indicate by check mark whether the registrant has submitted electronically and posted on its corporate Web site, if any, every Interactive Data File required to be submitted and posted pursuant to Rule 405 of Regulation S-T (§232.405 of this chapter) during the preceding 12 months (or for such shorter period that the registrant was required to submit and post such files). Yes ☒ No ☐.
Indicate by check mark if disclosure of delinquent filers pursuant to Item 405 of Regulation S-K is not contained herein, and will not be contained, to the best of registrant’s knowledge, in definitive proxy or information statements incorporated by reference in Part III of this Form 10-K or any amendment to this Form 10-K. ☒
Indicate by check mark whether the registrant is a large accelerated filer, an accelerated filer, a non-accelerated filer, or a smaller reporting company. See the definitions of “large accelerated filer, accelerated filer” and “smaller reporting company” in Rule 12b-2 of the Exchange Act.
|
Large accelerated filer |
☐ |
Accelerated filer |
☒ |
|
|
|
|
|
|
Non-accelerated filer |
☐ (Do not check if a smaller reporting company) |
Smaller reporting company |
☐ |
Indicate by check mark whether the registrant is a shell company (as defined in Rule 12b-2 of the Exchange Act). Yes ☐ No ☒.
As of June 30, 2016, the aggregate market value of common stock held by non-affiliates of the registrant was approximately $88,766,026
As of March 13, 2017, the registrant had 19,274,244 shares of Class A common stock and 5,366,000 shares of Class B common stock outstanding.
DOCUMENTS INCORPORATED BY REFERENCE
Portions of the Registrant’s Definitive Proxy Statement for its 2017 Annual Meeting of Shareholders are incorporated by reference in Part III of this Form 10-K.
2016 ANNUAL REPORT ON FORM 10-K
INDEX
|
|
|
Page |
|
|
||
|
Item 1. |
1 |
|
|
Item 1A. |
3 |
|
|
Item 1B. |
10 |
|
|
Item 2. |
10 |
|
|
Item 3. |
11 |
|
|
Item 4. |
11 |
|
|
|
|
|
|
|
|
|
|
Item 5. |
12 |
|
|
Item 6. |
14 |
|
|
Item 7. |
Management’s Discussion and Analysis of Financial Condition and Results of Operations |
16 |
|
Item 7A. |
24 |
|
|
Item 8. |
25 |
|
|
Item 9. |
Changes in and Disagreements with Accountants on Accounting and Financial Disclosure |
52 |
|
Item 9A. |
52 |
|
|
Item 9B. |
54 |
|
|
|
|
|
|
|
|
|
|
Item 10. |
54 |
|
|
Item 11. |
54 |
|
|
Item 12. |
Security Ownership of Certain Beneficial Owners and Management and Related Stockholder Matters |
54 |
|
Item 13. |
Certain Relationships and Related Transactions, and Director Independence |
54 |
|
Item 14. |
54 |
|
|
|
|
|
|
|
|
|
|
Item 15. |
55 |
|
|
Item 16. |
55 |
|
|
56 |
||
This Annual Report on Form 10-K (“Form 10-K”) contains certain forward-looking statements regarding future events and our future operating results that are subject to the safe harbors created under the Securities Act of 1933, as amended (“Securities Act”), and the Securities Exchange Act of 1934, as amended (“Exchange Act”). These statements may include words such as “anticipate,” “estimate,” “expect,” “project,” “plan,” “intend,” “believe,” “may,” “will,” “should,” “likely” and other words and terms of similar meaning in connection with any discussion of the timing or nature of future operating or financial performance or other events. All of these forward-looking statements are subject to risks and uncertainties that could cause our actual results to differ materially from those contemplated by the relevant forward-looking statements. Factors that might cause or contribute to such a difference include, but are not limited to, those discussed under “Item 1A of Part I – Risk Factors” and elsewhere in this Form 10-K. The forward-looking statements included in this document are made only as of the date of this report, and we undertake no obligation to publicly update these forward-looking statements to reflect subsequent events or circumstances.
Overview
Pendrell Corporation (“Pendrell”), with its consolidated subsidiaries, is referred to as “us,” “we,” or the “Company.” Pendrell has, for the past five years, invested in, acquired and monetized intellectual property (“IP”) rights. We are continuing our efforts to monetize our IP assets. We are also evaluating our IP investments to determine whether retention or disposition is appropriate. We no longer advise clients on IP strategies and transactions.
Pendrell was originally incorporated in 2000 as New ICO Global Communications (Holdings) Limited, a Delaware corporation. In July 2011, we changed our name to Pendrell Corporation. On November 14, 2012, we reincorporated from Delaware to Washington. Our principal executive office is located at 2300 Carillon Point, Kirkland, Washington 98033, and our telephone number is (425) 278-7100. Our website address is www.pendrell.com. The information contained in or that can be accessed through our website is not part of this Form 10-K.
Our Business
Revenue Generating Activities
We generate revenues by licensing and selling our IP rights to others. Our subsidiaries hold patents that support four IP licensing programs that we own and manage: (i) memory and storage technologies, (ii) digital media, (iii) digital cinema and (iv) wireless technologies.
We acquired most of our memory and storage patents and patent applications from Nokia Inc. in March 2013, many of which have been declared essential to standards that are applicable to memory and storage technologies used in electronic devices. These patents cover embedded memory components and storage subsystems. Potential licensees include flash memory component suppliers, solid state disk manufacturers and device vendors. Since 2014, we have entered into license agreements with four leading technology companies. We are in active license discussions with other memory component manufacturers and, in late 2016, filed litigation against SanDisk at the International Trade Commission (the “ITC”) and in federal district court alleging infringement of certain of our memory and storage patents (“SanDisk Litigation”).
Our digital media program is supported by patents and patent applications designed to protect against unauthorized duplication and use of digital content that is transferred from a source to one or more electronic devices. The majority of our digital media patents and patent applications came to us through our October 2011 purchase of a 90.1% interest in ContentGuard Holdings, Inc., where we partnered with Time Warner to expand the development and licensing of ContentGuard’s portfolio of digital rights management (“DRM”) technologies. We have entered into digital media licenses with manufacturers, distributors and providers of consumer products, including Amazon, DirecTV, Fujitsu, LG Electronics, Microsoft Corporation, Nokia, Panasonic, Pantech, Sharp,
1
Sony, Toshiba, Time Warner and Xerox Corporation. Other companies that manufacture, distribute or provide DRM-enabled consumer products and that we believe use ContentGuard’s innovations, including Apple, Google, HTC, Huawei, Motorola Mobility and Samsung (the “ContentGuard Defendants”), did not take a license to our digital media assets, which prompted us to file claims against them for patent infringement.
Our digital cinema program is supported by DRM patents and patent applications designed to protect against unauthorized creation, duplication and use of digital cinema content that is authored and distributed to movie theaters globally, many of which also came to us through our acquisition of ContentGuard. Potential digital cinema licensees include distributors and exhibitors of digital content, including motion picture producers, motion picture distributors and equipment vendors. We launched our digital cinema program in June 2013, and we are actively engaged in licensing discussions with leading feature film studios.
Our wireless technologies program is supported by U.S. and foreign patents, referred to as our “Pendragon portfolio,” many of which relate to key functionality in cellular and digital wireless devices and infrastructure. These patents were developed by leading innovators in the wireless space, including Philips, IBM and ETRI. We acquired the bulk of our Pendragon portfolio in 2012, but have not yet generated material revenue from the portfolio. As such, in addition to continuing our licensing discussions, we are actively seeking a buyer for the portfolio that may be better positioned to capitalize on its potential.
We typically license our patents via agreements that cover entire patent portfolios or large segments of portfolios. We expect licensing negotiations with prospective licensees to take approximately 12 to 24 months, and perhaps longer, measured from inception of technical discussions regarding the scope of our patents. If we are unable to secure reasonable, negotiated licenses, we may resort to litigation to enforce our IP rights, as evidenced by ContentGuard’s ongoing litigation against device makers and our recently-filed claims against SanDisk at the ITC and in federal district court.
Our IP revenue generation activities are not limited to licensing and litigation. Patents that we believe may generate greater value through a sales transaction, such as the Pendragon portfolio, may be sold. Although our revenue may occur in different forms, we regard our IP monetization activities as integrated and not separate revenue streams.
Our IP portfolio currently consists of patents that have already expired and others that expire between 2017 and 2035. We have no plans to develop or acquire new patentable inventions prior to the expiration of our patents and patent applications. See “Revenue opportunities from our IP monetization efforts are limited” under “Item 1A of Part I—Risk Factors.”
Business Outlook
From 2011 through 2015, we focused on acquiring and growing companies that developed or possessed unique, innovative technologies that could be licensed to third parties or could provide a competitive advantage to products we were developing. During the past two years, we moderated those efforts and reduced our costs by eliminating certain positions, abandoning certain patent assets that do not support our existing licensing programs, and lowering facilities costs.
We have explored and continue to explore investment opportunities that are not premised on the value of IP, with the goal of investing our capital in operating companies that can generate solid, stable income streams. Due to high valuations that we attribute to inexpensive and widely available capital, we did not acquire any such operating companies in 2015 or 2016. We may encounter more suitable opportunities in the future as the cost of capital increases, and we therefore intend to continue our exploratory activity while keeping our costs contained.
Although our focus may evolve away from companies that develop or possess unique, innovative technologies, we will continue to dedicate effort and resources to generate revenue from our existing IP assets.
2
Competition
Due to the unique nature of our IP rights, we do not compete directly with other patent holders or patent applicants. However, to the extent that multiple parties seek royalties on the same product or service, we might as a practical matter compete for a share of reasonable royalties from manufacturers and distributors.
As we pursue opportunities that are not premised on the value of IP, we may compete with well-capitalized companies pursuing those same opportunities.
Divestiture of Satellite Assets
When we were formed in 2000, our intent was to develop and operate a next generation global mobile satellite communications system. In 2011, we started selling assets associated with the satellite business and, during 2012, we divested the remaining vestiges of our satellite business, including the sale of our remaining medium earth orbit (“MEO”) satellites and related equipment and our real property in Brazil, the transfer to a liquidating trust (the “Liquidating Trust”) of certain former subsidiaries associated with the satellite business (the “International Subsidiaries”) to address the winding down of the International Subsidiaries, and the settlement of our litigation with The Boeing Company (“Boeing”).
The 2012 divestiture and the corresponding transfer to the Liquidating Trust of the International Subsidiaries triggered tax losses of approximately $2.4 billion, which we believe can be carried forward for up to twenty years. Under the sales agreement for the MEO assets, the Company is entitled to a substantial portion of any proceeds generated from the resale of the MEO assets. In January 2015, the party that acquired the MEO assets from the Company resold the MEO assets and as a result, the Company received $3.9 million during 2015, which has been recorded in gain on contingencies in the statement of operations for the year ended December 31, 2015. On February 23, 2016, that party received the final scheduled payment for the MEO assets, which resulted in the Company’s recognition of an additional $2.0 million gain on contingency in 2016.
Employees
As of December 31, 2016, on a consolidated basis, we had the equivalent of 14 full-time employees located in Washington, California, Finland and Texas.
Available Information
The address of our website is www.pendrell.com. You can find additional information about us and our business on our website. We make available on this website, free of charge, our annual reports on Form 10-K, quarterly reports on Form 10-Q, current reports on Form 8-K, and amendments to those reports, as soon as reasonably practicable after we electronically file or furnish such materials to the Securities and Exchange Commission (“SEC”). You may read and copy this Form 10-K at the SEC’s public reference room at 100 F Street, NE, Washington, DC 20549-0102. Information on the operation of the public reference room can be obtained by calling the SEC at 1-800-SEC-0330. These filings are also accessible on the SEC’s website at www.sec.gov.
We also make available on our website in a printable format the charters for certain of our various Board of Director committees, including the Audit Committee, the Compensation Committee and the Nominating and Governance Committee, and our Code of Conduct and Ethics in addition to our Articles of Incorporation, Bylaws and Tax Benefits Preservation Plan. This information is available in print without charge to any shareholder who requests it by sending a request to Pendrell Corporation, 2300 Carillon Point, Kirkland, Washington 98033, Attn: Corporate Secretary. The material on our website is not incorporated into or part of this Form 10-K.
The risks below address some of the factors that may affect our future operating results and financial performance. If any of the following risks develop into actual events, then our business, financial condition, results of operations or prospects could be materially adversely affected.
3
Risks Related to our Patents and Monetization Activities
Success of our licensing efforts depends on our ability to sign new license agreements or otherwise enforce our intellectual property rights.
IP licensing revenues are dependent on our ability to sign new license agreements with, or otherwise enforce our intellectual property rights against, users of our patented inventions. If users refuse to sign license agreements, we may need to resort to litigation or other measures to compel the payment of fair consideration, which to date has not been effective, and may not be effective in the future. This risk applies not only to new license agreements, but to existing license agreements with fixed expiration dates. If we fail to sign or renew license agreements on terms that are favorable to us or obtain favorable outcomes through litigation or other enforcement actions, the value of our IP could be further impaired.
We may have a limited number of prospective licensees.
We are actively pursuing licenses for our portfolios, including our DRM portfolio. However, our portfolios are applicable to only a limited number of prospective licensees. Moreover, many device makers who are prospective DRM licensees are currently shielded by adverse jury verdicts in the Apple Litigation and Google Litigation that we are appealing. In the memory and storage space, we believe we have licensed more products than remain unlicensed. As such, we have a limited number of prospective licensees, and if we are unable to sign licenses with this limited group, licensing revenue will be adversely impacted. Moreover, if our portfolios are not demonstrably applicable to prospective licensees’ products or services, whether due to poor quality, lack of breadth or otherwise, parties may refuse to sign license agreements.
Revenue opportunities from our IP monetization efforts are limited.
Patents have finite lives. Our IP portfolio currently consists of patents that have already expired, and others that expire between 2017 and 2035. With no plans to develop or acquire new patentable inventions prior to the expiration of our patents and patent applications, our IP revenue opportunities are limited.
Our licensing cycle is lengthy, costly and our licensing efforts may be unsuccessful.
Licensing our patents takes time, with some license negotiations spanning many years. We have incurred and expect to incur significant legal and sales expenses in our efforts to sign license agreements and generate license revenues. We also expect to spend considerable resources educating prospective licensees on the benefits of a license arrangement with us. As such, we may incur significant costs and losses before any associated revenue is generated.
Enforcement proceedings may be costly and ineffective and could lead to impairment of our IP assets.
We may choose to pursue litigation or other enforcement action to protect our intellectual property rights, such as the Apple Litigation, Google Litigation and SanDisk Litigation. Enforcement proceedings are typically protracted and complex, and might require cooperation of inventors and others who are unwilling or unable to assist with enforcement. Litigation also involves several stages, including the potential for a prolonged appeals process. The costs are typically substantial, and the outcomes are unpredictable. As evidenced in the Apple Litigation and Google Litigation, we might receive rulings or judgments, or sign licenses or settlement agreements, that compel us to revalue the IP assets that we are enforcing, which in turn might result in a reduction to the financial statement carrying value of such assets through a corresponding impairment charge. Enforcement actions will likely divert our managerial, technical, legal and financial resources from business operations. In certain cases, we may conclude that these costs and risks outweigh the potential benefits that would arise from successful enforcement, in which event we may opt not to pursue enforcement.
Our business could be negatively impacted by product composition and future innovation.
Our licensing revenues have been generated from manufacturers and distributors of products that use our patented inventions. Our business prospects could be negatively impacted if prospective licensees do not use our
4
inventions in their products, or if they later modify their products to eliminate use of our inventions. Moreover, changes in technology or customer requirements could alter product composition and render our patented inventions obsolete or unmarketable.
Our patent management activities could impact the value of our IP.
We assess our IP portfolio to identify patents and patent applications that are worth preserving and patents and patent applications that are not worth preserving. Our assessment is driven by numerous factors, many of which are not scientific. Our assessment drives decisions to maintain or abandon patents and patent applications. If we make decisions that prompt abandonment of patents and patent applications with value, we could materially impact the value of our IP portfolio and our ability to generate revenue from our IP portfolio.
Challenges to the validity or enforceability of our key patents could significantly harm our business.
Any third party may challenge the validity, scope, enforceability and ownership of our patents. Challenges may include review requests to patent authorities, such as inter partes review and covered business method proceedings that have been initiated by ZTE, Apple, Google and SanDisk. Review proceedings are costly and time-consuming, and we cannot predict their outcome or consequences. Such proceedings may narrow the scope of our claims or may cancel some or all claims. If patent claims are canceled, we could be prevented from enforcing or earning future revenues from the canceled claims. Even if our claims are not canceled, our enforcement actions against alleged infringers may be stayed pending resolution of reviews, or courts or tribunals reviewing our patent claims could make findings adverse to our interests. Irrespective of outcome, review challenges may result in substantial legal expenses and diversion of management’s time and attention away from our other business operations, including our ability to evaluate and acquire other businesses. Adverse decisions could impair the value of our inventions or result in a loss of our proprietary rights and may adversely affect our results of operations and our financial position.
Changes in patent law could adversely impact our business.
Patent laws may continue to change, and may alter protections afforded to owners of patent rights, impose additional enforcement risks, increase the costs of enforcement, or increase our licensing cycles. For instance, during 2013 and 2015, legislative initiatives were introduced to address perceived patent abuses by non-practicing entities. Some legislators have announced their intention to sponsor and introduce similar legislation in 2017. Even if legislative initiatives do not directly impact our business, such initiatives might encourage manufacturers to infringe our IP rights, lengthen our licensing cycles, increase the likelihood that we will litigate to enforce our IP rights, or make it more difficult and expensive to license our patents or enforce our patents against parties using our inventions without a license. Moreover, increased focus on the growing number of patent-related lawsuits may result in legislative changes which increase our costs and related risks of asserting patent enforcement actions.
Changes of interpretations of patent law could adversely impact our business.
Our success in review and enforcement proceedings relies in part on the historically consistent application of patent laws and regulations. Interpretations of patent laws and regulations by the courts and applicable regulatory bodies have evolved, and may continue to evolve, particularly with the introduction of new laws and regulations. Changes or potential changes in judicial interpretation could have a negative impact on our ability to monetize our patent rights.
Risks Related to our Acquisition Activities
We may over-estimate the value of assets or businesses we acquire.
We make investments from which we intend to generate a return. We estimate the value of these investments prior to acquisition, using both objective and subjective methodologies. If we over-estimate such value, we may not generate desired returns on our investment, or we may need to adjust the value of the investments to fair value and record a corresponding impairment charge, either of which could adversely affect our results of operations and our financial position.
5
We may not generate a return on acquired assets.
Even if we accurately value the investments we make, we must succeed in generating a return on the investments. Our success in generating a return depends on effective efforts of our employees and outside professionals. If we do not generate desired returns on our investments or if we are compelled to adjust the value of the investments to fair value and record a corresponding impairment charge, it could adversely affect our results of operations and our financial position.
We may pursue acquisition or investment opportunities that do not yield desired results.
We intend to continue investigating potential acquisitions that support our business objectives and strategy. Acquisitions are time-consuming, complex and costly. The terms of acquisition agreements tend to be heavily negotiated. We may incur significant transactional expenses, regardless of whether acquisitions are consummated. Moreover, the integration of acquired companies may create significant challenges, and we can provide no assurances that the integration of acquired businesses with our business will result in the realization of the full benefits we anticipate from such acquisitions. Investigating businesses and assets and integrating newly acquired businesses or assets may be costly and time-consuming, and such activities could divert our attention from other business concerns. In addition, we might lose key employees while integrating new organizations. Acquisitions could also result in potentially dilutive issuances of equity securities or the incurrence of debt, the assumption or incurrence of contingent liabilities, possible impairment charges related to goodwill or other intangible assets or other unanticipated events or circumstances, any of which could negatively impact our financial position. We might not be successful in integrating acquired businesses and might not achieve desired revenues and cost benefits.
The financing of our acquisition activities could threaten our ability to use NOLs to offset future taxable income.
We have substantial historical net operating losses (“NOLs”) for United States federal income tax purposes. As explained in greater detail below, our use of our NOLs will be significantly limited if we undergo a “Tax Ownership Change,” as defined in Section 382 of the Internal Revenue Code. If and to the extent we finance acquisitions through the sale or issuance of stock, we will likely cause an ownership shift that increases the possibility that a future Tax Ownership Change might occur. If a Tax Ownership Change occurs, we will be permanently unable to use most of our NOLs.
Avoiding a Tax Ownership Change may limit our ability to use our shares in an acquisition which could limit our ability to execute a transaction.
The use of our NOLs will be significantly limited if we undergo a Tax Ownership Change. Given the potential economic benefit of our NOL, we have taken steps to reduce the risk of a Tax Ownership Change including our Tax Benefit Preservation Plan. Issuing new shares in an acquisition transaction could cause or would increase the risk of a Tax Ownership Change. As a result, if a potential seller or partner requires a large number of shares as part of an acquisition transaction, we may choose not to execute that transaction.
We rely on representations, warranties and opinions from third parties that might not be accurate.
When we acquire assets or businesses or establish relationships with inventors or strategic partners, we may rely on representations and warranties made by third parties. We also may rely on opinions of lawyers and other professionals. We may not have the opportunity to independently investigate and verify the facts upon which such representations, warranties and opinions are made. By relying on these representations, warranties and opinions, we may be exposed to unforeseen liabilities that could have a material adverse effect on our operating results and financial condition.
6
Risks Related to our Operations
Our financial and operating results have been and may continue to be uneven.
Our operating results may fluctuate and, as such, our operating results are difficult to predict. Quarterly or annual comparisons of our results of operations should not be relied upon as an indication of our future performance. Factors that could cause our operating results to fluctuate during any period or that could adversely affect our operating results include the timing of license and sales agreements, compliance with such agreements, the terms and conditions for payment under those agreements, our ability to protect and enforce our intellectual property rights, costs of enforcement, changes in demand for products that incorporate our inventions, the time period between commencement and completion of license negotiations or enforcement proceedings, revenue recognition principles, and changes in accounting policies.
Our revenues may not offset our operating expenses.
2016 was the first year we reported operating income. Although we have taken steps to reduce our operating expenses, revenue from our IP licensing business continues to be inconsistent. If we are unable to generate revenue that is sufficient to cover these costs, we will report a net operating loss in future years.
Failure to effectively manage the composition of our employee base could strain our business.
Our success depends, in large part, on continued contributions of our small group of key managers and employees, many of whom are highly skilled and would be difficult to replace. Our success also depends on the ability of our personnel to function effectively, both individually and as a group. At the end of 2015, we terminated the employment of numerous IP professionals whose roles we believe were unnecessary to advance our current and anticipated business strategies. If we misjudged our ongoing personnel needs or lose any of our remaining senior managers or key personnel, it could lead to dissatisfaction among our clients or licensees, which could slow our growth or result in a loss of business. Moreover, if we fail to manage the composition of our employee base effectively or otherwise strain our relationships with our personnel, our business and financial results may be materially harmed.
If we need financing and cannot obtain financing on favorable terms, our business may suffer.
If we deploy a significant portion of our capital or encounter unforeseen difficulties in the future that deplete our capital resources more rapidly than anticipated, we may need to obtain additional financing. Financing might not be available on favorable terms, if at all, may dilute our existing shareholders, and may prompt us to pursue structural changes that could impact shareholder concentration and liquidity. If we fail to obtain additional capital as and when needed, such failure could have a material adverse impact on our business, results of operations and financial condition.
Future changes in standards, rules, practices or interpretation may impact our financial results.
We prepare our consolidated financial statements in accordance with accounting principles generally accepted in the United States of America. These principles are subject to interpretations by the SEC and various accounting bodies. In addition, we are subject to various taxation rules in many jurisdictions. The existing taxation rules are generally complex, voluminous, frequently changing and often ambiguous. Changes to existing taxation rules, changes to the financial accounting standards, or any changes to the interpretations of these standards or rules, or changes in practices under these standards and rules, may adversely affect our reported financial results or the way we conduct our business.
Unauthorized use or disclosure of our confidential information could adversely affect our business.
We rely primarily on a combination of license agreements, nondisclosure agreements, other contractual relationships and patent, trademark, trade secret and copyright laws to protect our confidential and proprietary information, our technology and our intellectual property. We cannot be certain that these protections have not been and will not be breached, that we will be able to timely detect unauthorized use or transfer of our trade secrets or
7
intellectual property, that we will have adequate remedies for any breach, or that our trade secrets will not otherwise become known or be independently discovered by competitors. If we are unable to detect in a timely manner the unauthorized use or disclosure of our proprietary or other confidential information or if we are unable to enforce our rights under our agreements or applicable laws, the misappropriation of such information could harm our business.
Our company has an evolving business model, which raises doubt about our ability to increase our revenues and grow our business.
We have shifted our principal focus away from the IP business and are evaluating opportunities that generate solid, stable income streams with greater growth potential. Those opportunities must be considered in light of the risks, expenses, and difficulties frequently encountered by companies in an early stage of development. We may not be successful in addressing such risks, and the failure to do so could have a material adverse effect on our business, operating results and financial condition. There can be no assurance that we will be able to increase our revenues and otherwise grow our business as we execute on new business opportunities in the future.
Risks Related to our Tax Losses
We cannot be certain that our tax losses will be available to offset future taxable income.
A significant portion of our NOLs were triggered when we disposed of our satellite assets. We believe these NOLs can be carried forward to offset certain future taxable income. However, the NOLs have not been audited or otherwise validated by the Internal Revenue Service (“IRS”). We cannot assure you that we would prevail if the IRS were to challenge the amount or our use of the NOLs. If the IRS were successful in challenging our NOLs, all or some amount of our NOLs would not be available to offset future taxable income which would result in an increase to our future income tax liability. The NOL carryforward period begins to expire in 2025 with the bulk of our NOLs expiring in 2032. If the tax laws are amended to limit or eliminate our ability to carry forward our NOLs for any reason, or to lower income tax rates, the value of our NOLs may be significantly reduced.
An Ownership Change under Section 382 of the Internal Revenue Code may significantly limit our ability to use NOLs to offset future taxable income.
Our use of our NOLs will be significantly limited if we undergo a Tax Ownership Change. Broadly, a Tax Ownership Change will occur if, over a three-year testing period, the percentage of our stock, by value, owned by one or more 5% shareholder increases by more than 50 percentage points. For purposes of this test, shareholders that own less than 5% of our stock are aggregated into one or more separate “public groups,” each of which is treated as a 5% shareholder. In general, shares traded within a public group are not included in the Tax Ownership Change test. Despite our adoption of certain protections against a Tax Ownership Change (such as our Tax Benefits Preservation Plan), we cannot control the trading activity of our significant shareholders. If shareholders acquire or divest their shares in a manner or at times that do not account for the loss-limiting provisions of the Internal Revenue Code or regulations adopted thereunder, a Tax Ownership Change could occur. If a Tax Ownership Change occurs, we will be permanently unable to use most of our NOLs.
Our NOLs cannot be used to offset the Personal Holding Company tax.
The Internal Revenue Code imposes an additional tax on the undistributed income of a Personal Holding Company (“PHC”). In general, a corporation is classified as a PHC if 50% or more of its outstanding shares, measured by value, are owned directly or indirectly by five or fewer individual shareholders at any time during the second half of a calendar year (“Concentrated Ownership”) and at least 60% of its adjusted ordinary gross income is Personal Holding Company Income (“PHCI”). Broadly, PHCI includes items such as dividends, interest, rents and royalties, among others. Pendrell met the Concentrated Ownership test in 2016, and it is likely that Pendrell will meet the Concentrated Ownership test in 2017. We have determined that in 2016 ContentGuard had not yet met the Concentrated Ownership test due to the interest held by its minority shareholder, but it is possible that ContentGuard could meet the Concentrated Ownership test in 2017. If Pendrell or ContentGuard meets the Concentrated Ownership test and generates positive net PHCI, Pendrell or ContentGuard will be subject to the PHC tax on undistributed net PHCI. The PHC tax, which is in addition to the income tax and cannot be offset by our NOL, is currently levied at 20% of the net PHCI not distributed to the corporation’s shareholders.
8
Our NOLs cannot be used to completely offset the Alternative Minimum Tax or other taxes.
We may also be subject to the corporate Alternative Minimum Tax (“AMT”) in a year in which we have net taxable income because the AMT cannot be completely offset by available NOLs, as losses carried forward generally can offset no more than 90% of a corporation’s AMT liability. In addition, our federal NOLs will not shield us from foreign withholding taxes, state and local income taxes, or revenue-based taxes incurred in jurisdictions that impose such taxes.
Our ability to utilize our NOLs is dependent on the generation of future taxable income.
Our ability to utilize our NOLs is dependent upon the generation of future taxable income before the expiration of the carry forward period attributable to the NOLs, which begin to expire in 2025. We generated taxable income in 2016, but we may not generate sufficient taxable income in future years to use the NOLs before they begin expiring.
Risks Related to Our Class A Common Stock
A sale of shares by our larger shareholders could depress the market price of our Class A common stock.
A small number of our shareholders hold a majority of our Class A common stock and our Class B common stock, which is convertible at the option of the holders into Class A common stock. The sale or prospect of the sale of a substantial number of these shares could have an adverse effect on the market price of our Class A common stock.
The interests of our controlling shareholder may conflict with the interests of other Class A holders.
Eagle River Satellite Holdings, LLC (“ERSH”), together with its affiliates Eagle River Investments, LLC (“ERI”), Eagle River, Inc. and Eagle River Partners, LLC (“ERP”) (collectively, “Eagle River”) controls approximately 67% of the voting power of our outstanding capital stock. Craig O. McCaw, our Executive Chairman, is the sole manager and beneficial member of ERI, which is the sole member of ERSH. Mr. McCaw is the sole shareholder of Eagle River, Inc. and the beneficial member of ERP. Accordingly, Eagle River has control over the outcome of matters requiring shareholder approval, including the election of directors, amendments to our governing documents, the adoption or prevention of mergers, consolidations or sales of all or substantially all of our assets, or control changes. Eagle River is not restricted or prohibited from competing with us.
We are a “controlled company” within the meaning of the Nasdaq Marketplace Rules and therefore qualify for, and may rely on, exemptions from certain corporate governance requirements.
Eagle River controls approximately 67% of the voting power of our outstanding capital stock. As a result, we are a “controlled company” within the meaning of the Nasdaq corporate governance standards, and therefore may elect not to comply with certain Nasdaq corporate governance requirements, including (i) the requirement that a majority of the board of directors consist of independent directors, (ii) the requirement that the compensation of officers be determined, or recommended to the board of directors for determination, by a majority of the independent directors or a compensation committee comprised solely of independent directors, and (iii) the requirement that director nominees be selected, or recommended for the board of directors’ selection, by a majority of the independent directors or a nominating committee comprised solely of independent directors with a written charter or board resolution addressing the nomination process. We do not currently rely on any of these exemptions, but reserve the right to do so in the future. If we choose to do so, our shareholders may not have the same protections afforded to shareholders of companies that are subject to all Nasdaq corporate governance requirements.
Our Tax Benefits Preservation Plan (“Tax Benefits Plan”), as well as certain provisions in our restated articles of incorporation, may discourage takeovers, which could affect the rights of holders of our Class A common stock.
Our Tax Benefits Plan is intended to act as a deterrent against any person or group acquiring or otherwise obtaining beneficial ownership of more than 4.9% of our securities without the approval of our board of directors. In addition, our articles of incorporation require us to take all necessary and appropriate action to protect certain rights
9
of our common shareholders, including voting, dividend and conversion rights and rights in the event of a liquidation, merger, consolidation or sale of substantially all of our assets. Our articles of incorporation also provide that we will not avoid or seek to avoid the observance or performance of those rights by charter amendment, entry into an inconsistent agreement or reorganization, recapitalization, transfer of assets, consolidation, merger, dissolution or the issuance or sale of securities. The rights protected by these provisions of the articles of incorporation include our Class B common shareholders’ right to ten votes per share on matters submitted to a vote of our shareholders and option to convert each share of Class B common stock into one share of Class A common stock. The provisions of the Tax Benefits Plan and our articles of incorporation could discourage takeovers of our company, which could adversely affect the rights of our shareholders.
If we delist from Nasdaq, our ability to access the capital markets could be negatively impacted.
Our common stock is listed for trading on the Nasdaq Capital Market. However, our Board of Directors has proposed to our shareholders that we engage in a reverse stock split to reduce our number of record holders to less than 300 and thereafter eliminate our SEC reporting obligations and our Nasdaq listing. Elimination of our SEC reporting obligations and delisting could harm our ability to raise capital through financing sources on terms acceptable to us, or at all, and result in the potential loss of confidence by investors, increased employee turnover, and fewer business development opportunities.
If we delist from Nasdaq, our trading volume and common stock price may be depressed.
Our trading volume is relatively low. If we are no longer required to fulfill SEC reporting obligations and no longer listed on Nasdaq, trading volume may further decrease, in which case the market price of our Class A common stock could decline. More specifically, our stock (i) may be more thinly traded, making it more difficult for our shareholders to sell shares, (ii) may experience greater price volatility, and (iii) may not attract analyst coverage, all of which may result in a lower stock price. For these reasons and others, shareholders may not receive what they view as a fair price for their shares.
If we delist from Nasdaq, it may be more difficult to trade our stock in compliance with applicable laws.
If we are no longer required to fulfill SEC reporting obligations and no longer listed on Nasdaq, we may choose not to file current or periodic reports. Even if we choose to file reports, they likely will not be audited. The absence of those reports or the absence of an audit may mean that material information regarding the Company is not in the public domain, which may make it more difficult to buy or sell shares in compliance with applicable securities laws. For these reasons and others, shareholders may not receive what they view as a fair price for their shares.
If our number of record holders increases, we may be subject to SEC reporting obligations.
We have limited ability to control our shareholders’ acquisition or disposition of shares. If we engage in a reverse stock split to reduce our number of record holders to less than 300 so that we can terminate our SEC reporting obligations and delist from Nasdaq, we could lose the corresponding cost-saving benefits if our number of record holders thereafter increases to more than 300, in which case we will again be required to fulfill SEC reporting obligations.
None.
Our corporate headquarters are located in Kirkland, Washington, where we lease 8,050 square feet in Kirkland under a lease which expires on July 31, 2019. We currently sublease 2,882 square feet of that space and occupy the remaining 5,168 square feet.
We believe our facilities are adequate for our current business and operations.
10
See Note 8 – “Commitments and Contingencies” of the Notes to the Consolidated Financial Statements included in Item 8 of this report.
Not Applicable.
11
|
Item 5. |
Market for Registrant’s Common Equity, Related Stockholder Matters and Issuer Purchases of Equity Securities. |
Market for Our Class A Common Stock
Our Class A common stock trades on the Nasdaq Capital Market under the symbol “PCO.”
Prior to October 1, 2016, the closing bid price of our Class A common stock price remained below the $1.00 price required by Nasdaq’s continued listing requirements. For continued listing, the stock price deficiency was required to be remediated prior to October 31, 2016. To address this stock price deficiency, we completed a 1-for-10 reverse stock split on September 30, 2016. As a result of the reverse stock split, our share count, per share data and price per share reported in this annual report on Form 10-K have been adjusted retrospectively as if the reverse stock split had been in effect for all periods presented.
The table below sets forth the high and low sales prices of our Class A common stock in U.S. dollars for each of the periods presented. Stock prices represent amounts published by Nasdaq. As of March 13, 2017, the closing sales price of our Class A common stock was $7.39 per share.
|
|
|
2016 |
|
|
2015 |
|
||||||||||
|
Period |
|
High |
|
|
Low |
|
|
High |
|
|
Low |
|
||||
|
First Quarter |
|
$ |
6.55 |
|
|
$ |
4.61 |
|
|
$ |
13.60 |
|
|
$ |
9.90 |
|
|
Second Quarter |
|
$ |
6.93 |
|
|
$ |
4.85 |
|
|
$ |
14.50 |
|
|
$ |
9.56 |
|
|
Third Quarter |
|
$ |
7.33 |
|
|
$ |
5.00 |
|
|
$ |
16.10 |
|
|
$ |
7.20 |
|
|
Fourth Quarter |
|
$ |
7.23 |
|
|
$ |
6.05 |
|
|
$ |
8.03 |
|
|
$ |
5.00 |
|
As of March 13, 2017, there were approximately 300 record holders of our Class A common stock.
Market for Our Class B Common Stock
There is no established trading market for our Class B common stock, of which we have 5,366,000 shares outstanding with two holders of record. Each share of Class B common stock is convertible at any time at the option of its holder into one share of Class A common stock.
Dividends
We have never paid a cash dividend on shares of our equity securities. Unless we become subject to personal holding company tax, we do not intend to pay any cash dividends on our common shares during the foreseeable future. It is anticipated that future earnings, if any, from our operations will be used to finance growth.
12
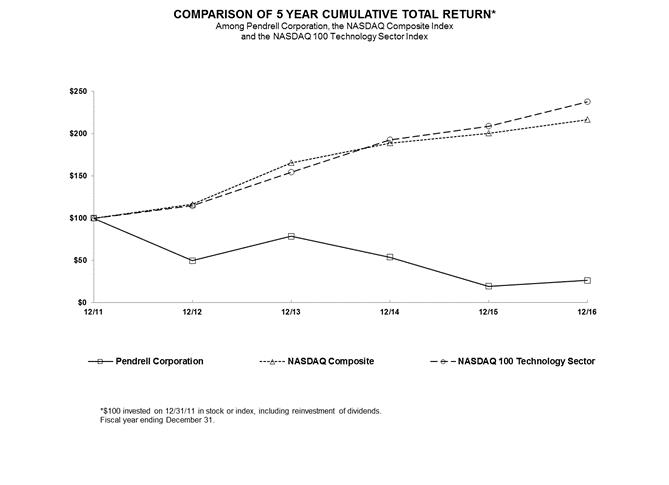
Performance Measurement Comparison
The following graph shows the total shareholder return as of the dates indicated of an investment of $100 in cash on December 31, 2011 for: (i) our Class A common stock; (ii) the Nasdaq Composite Index; and (iii) the Nasdaq 100 Technology Sector Index.
The stock price performance graph below is not necessarily indicative of future performance.
|
|
|
12/11 |
|
12/12 |
|
12/13 |
|
12/14 |
|
12/15 |
|
12/16 |
|
Pendrell Corporation |
|
100.00 |
|
49.61 |
|
78.52 |
|
53.91 |
|
19.57 |
|
26.37 |
|
NASDAQ Composite |
|
100.00 |
|
116.41 |
|
165.47 |
|
188.69 |
|
200.32 |
|
216.54 |
|
NASDAQ 100 Technology Sector |
|
100.00 |
|
114.75 |
|
154.25 |
|
192.47 |
|
208.75 |
|
237.51 |
13
The following selected consolidated financial data should be read in conjunction with “Item 7— Management’s Discussion and Analysis of Financial Condition and Results of Operations” and our consolidated financial statements and accompanying notes included in this Form 10-K.
|
|
|
Year Ended December 31, |
|
|||||||||||||||||
|
|
|
2016 |
|
|
2015 |
|
|
2014 |
|
|
2013 |
|
|
2012 |
|
|||||
|
|
|
(in thousands, except per share data) |
|
|||||||||||||||||
|
Revenue |
|
$ |
59,018 |
|
|
$ |
43,519 |
|
|
$ |
42,534 |
|
|
$ |
13,128 |
|
|
$ |
33,775 |
|
|
Operating expenses: |
|
|
|
|
|
|
|
|
|
|
|
|
|
|
|
|
|
|
|
|
|
Cost of revenues(1) |
|
|
18,156 |
|
|
|
10,215 |
|
|
|
14,170 |
|
|
|
7,872 |
|
|
|
314 |
|
|
Patent administration and related costs(1) |
|
|
1,046 |
|
|
|
2,668 |
|
|
|
6,386 |
|
|
|
4,405 |
|
|
|
3,655 |
|
|
Patent litigation(1) |
|
|
4,169 |
|
|
|
13,076 |
|
|
|
9,880 |
|
|
|
4,564 |
|
|
|
2,538 |
|
|
General and administrative(1) |
|
|
7,508 |
|
|
|
16,750 |
|
|
|
27,467 |
|
|
|
25,939 |
|
|
|
29,844 |
|
|
Stock-based compensation |
|
|
3,424 |
|
|
|
4,507 |
|
|
|
9,405 |
|
|
|
12,345 |
|
|
|
8,597 |
|
|
Amortization of intangibles |
|
|
9,498 |
|
|
|
13,939 |
|
|
|
15,929 |
|
|
|
15,864 |
|
|
|
13,471 |
|
|
Impairment of intangibles and goodwill(2) |
|
|
— |
|
|
|
103,499 |
|
|
|
11,013 |
|
|
|
— |
|
|
|
— |
|
|
Operating expenses, net |
|
|
43,801 |
|
|
|
164,654 |
|
|
|
94,250 |
|
|
|
70,989 |
|
|
|
58,419 |
|
|
Operating income (loss) |
|
|
15,217 |
|
|
|
(121,135 |
) |
|
|
(51,716 |
) |
|
|
(57,861 |
) |
|
|
(24,644 |
) |
|
Net interest income (expense)(3) |
|
|
696 |
|
|
|
103 |
|
|
|
(99 |
) |
|
|
(64 |
) |
|
|
(2,245 |
) |
|
Gain on deconsolidation of subsidiaries(3) |
|
|
— |
|
|
|
— |
|
|
|
— |
|
|
|
— |
|
|
|
48,685 |
|
|
Gain on settlement of Boeing litigation(4) |
|
|
— |
|
|
|
— |
|
|
|
— |
|
|
|
— |
|
|
|
10,000 |
|
|
Gain associated with disposition of assets(5) |
|
|
— |
|
|
|
— |
|
|
|
— |
|
|
|
— |
|
|
|
5,599 |
|
|
Gain on contingencies (6) |
|
|
2,047 |
|
|
|
6,095 |
|
|
|
— |
|
|
|
— |
|
|
|
— |
|
|
Other income (expense) |
|
|
(11 |
) |
|
|
(14 |
) |
|
|
(16 |
) |
|
|
(55 |
) |
|
|
1,588 |
|
|
Income (loss) before income taxes |
|
|
17,949 |
|
|
|
(114,951 |
) |
|
|
(51,831 |
) |
|
|
(57,980 |
) |
|
|
38,983 |
|
|
Income tax benefit (expense)(7) |
|
|
— |
|
|
|
(2,631 |
) |
|
|
(6,303 |
) |
|
|
— |
|
|
|
1,034 |
|
|
Net income (loss) |
|
|
17,949 |
|
|
|
(117,582 |
) |
|
|
(58,134 |
) |
|
|
(57,980 |
) |
|
|
40,017 |
|
|
Net income (loss) attributable to noncontrolling interest |
|
|
186 |
|
|
|
(7,902 |
) |
|
|
(7,132 |
) |
|
|
(2,918 |
) |
|
|
(67 |
) |
|
Net income (loss) attributable to Pendrell |
|
$ |
17,763 |
|
|
$ |
(109,680 |
) |
|
$ |
(51,002 |
) |
|
$ |
(55,062 |
) |
|
$ |
40,084 |
|
|
Basic income (loss) per share attributable to Pendrell |
|
$ |
0.66 |
|
|
$ |
(4.13 |
) |
|
$ |
(1.93 |
) |
|
$ |
(2.10 |
) |
|
$ |
1.56 |
|
|
Diluted income (loss) per share attributable to Pendrell |
|
$ |
0.64 |
|
|
$ |
(4.13 |
) |
|
$ |
(1.93 |
) |
|
$ |
(2.10 |
) |
|
$ |
1.52 |
|
|
Total assets |
|
$ |
212,393 |
|
|
$ |
180,892 |
|
|
$ |
304,104 |
|
|
$ |
351,994 |
|
|
$ |
381,415 |
|
|
Long-term obligations, including current portion of capital lease obligations(8) |
|
$ |
7,796 |
|
|
|
— |
|
|
$ |
1,521 |
|
|
$ |
6,695 |
|
|
$ |
2,241 |
|
|
(1) |
Certain prior period amounts have been reclassified to conform to the current year presentation of expenses in our consolidated statements of operations, including the presentation of “cost of revenues” and “patent litigation” as separate captions; as such costs were previously included in “patent administration, litigation and related costs” and “general and administrative” in 2013 and prior years. |
|
(2) |
During the fourth quarter of the year ended December 31, 2015, we recorded a non-cash impairment charge of $103.5 million related to our patents, other intangible assets and goodwill. During the fourth quarter of the year ended December 31, 2014, we recorded a non-cash impairment charge of $11.0 million related to the goodwill and proprietary micro-propagation technology of Provitro Biosciences LLC (“Provitro”). In early 2015, we suspended further development of the Provitro™ proprietary micro-propagation technology and related laboratory processes that were designed to facilitate production on a commercial scale of certain plants, particularly timber bamboo. |
14
|
(3) |
Prior to 2013, certain of our subsidiaries had agreements with operators of gateways for our MEO satellite system, some of which were capital leases. We continued to accrue expenses according to our subsidiaries’ contractual obligations until the liabilities, including interest costs resulting from capital lease obligations, were transferred to the Liquidating Trust on June 29, 2012, resulting in a recognized a gain of $48.7 million upon their deconsolidation. |
|
(4) |
We had been in litigation with Boeing regarding the development and launch of our former MEO satellites and related launch vehicles. On June 25, 2012, we settled our litigation against Boeing for $10.0 million. The settlement agreement and mutual release between ourselves and Boeing fully released and discharged any and all claims between us and Boeing. As a result of the settlement agreement, we recorded a gain of $10.0 million during the year ended December 31, 2012. |
|
(5) |
During the year ended December 31, 2012, we sold real property located in Brazil for approximately $5.6 million. |
|
(6) |
During the years ended December 31, 2016 and 2015, we recorded gain on contingencies of $2.0 million and $3.9 million, respectively, due to the receipt of contingent payments associated with the disposition of MEO satellites and related launch vehicles of our prior satellite business. During the year ended December 31, 2015, we also recorded a gain on contingency associated with a $1.6 million settlement received from the J&J Group. See Note 10 - “Gain on Contingencies” for further discussion. |
|
(7) |
During the years ended December 31, 2015 and 2014, we recorded tax provisions of $4.1 million and $6.3 million, respectively, related to foreign taxes withheld on revenue generated from license agreements executed with third party licensees domiciled in foreign jurisdictions. Additionally, during the year ended December 31, 2015, as a result of the impairment of certain indefinite-lived intangible assets, the deferred tax liability associated with the intangibles was decreased, resulting in a tax benefit of $1.5 million. |
|
(8) |
Prior to 2015, long-term obligations consisted primarily of deferred tax liabilities. Long-term obligations at December 31, 2013 also included an installment payment obligation arising from the 2013 acquisition of our memory and storage technologies portfolio and expense related to restricted stock awards that is required to be treated as a liability. Long-term obligations at December 31, 2016 consist primarily of revenue share obligations. |
15
The following discussion and analysis should be read in conjunction with our consolidated financial statements and accompanying notes included elsewhere in this Form 10-K.
Special Note Regarding Forward-Looking Statements
With the exception of historical facts, the statements contained in this management’s discussion and analysis are “forward-looking” statements. All of these forward-looking statements are subject to risks and uncertainties that could cause our actual results to differ materially from those contemplated by the relevant forward-looking statements. Factors that might cause or contribute to such a difference include, but are not limited to, those discussed under “Item 1A of Part I—Risk Factors” and elsewhere in this Form 10-K. The forward-looking statements included in this document are made only as of the date of this report, and we undertake no obligation to publicly update these forward-looking statements to reflect subsequent events or circumstances.
Overview
For the past five years, through our consolidated subsidiaries, we have invested in, acquired and monetized IP rights. We have generated positive returns on our patents applicable to memory and storage technologies (our “Memory Patents”), but not our digital rights management patents (“DRM Patents”) or the wireless, digital and other patents held in our Pendragon subsidiaries.
During 2016, we licensed our Memory Patents to Toshiba Corporation. The Toshiba license was the fourth significant Memory Patent license signed since we acquired the Memory Patents in 2013. Through those four licenses, we have generated aggregate license fees of approximately $110 million. Prior to 2017, pursuant to the agreement under which we acquired the Memory Patents, we shared a significant portion of those license fees with the seller. In early 2017, the seller agreed to relinquish its future revenue share rights in exchange for an up-front payment and future installment payments. This will result in a one-time charge of $3.2 million to expense in our first quarter of 2017 and will significantly reduce our “cost of revenues” on future revenue from our Memory Patents. Our 2017 buyout of future revenue share rights reflects our confidence in the value of our memory portfolio and our belief that standard compliant unlicensed flash memory component suppliers, solid state disk manufacturers and device vendors will ultimately need to obtain a license from us to continue their commercial activities.
In that regard, our licensing discussions with SanDisk reached impasse in 2016, leading to our filing of two actions against SanDisk: an International Trade Commission (“ITC”) proceeding, in which we seek an exclusionary order that prevents SanDisk from importing infringing products into the United States, and a patent infringement suit in the federal district court for the Central District of California, in which we seek monetary damages for SanDisk’s infringement. Due to the accelerated pace of ITC proceedings, we anticipate a trial with an administrative law judge as early as October 2017.
While we continue to work on monetizing our Memory Patents, we are also pursuing our appeal of two adverse jury decisions in 2015 relating to our DRM Patents. Briefing for those two appeals is complete, with oral argument in front of the federal district court scheduled for early June 2017. If we succeed on appeal, we intend to re-open licensing discussions with numerous device makers who are currently shielded by the adverse verdicts. Meanwhile, we have continued our dialogue with participants in the digital cinema initiative to address our view that modern-day digital delivery of motion pictures from studios to theaters implicates our DRM Patents.
Management of our IP portfolio is not detracting us from our primary mission, which is identification of business opportunities that generate solid, stable income streams and greater growth potential. We have evaluated several opportunities with business owners and investment partners who see the benefits of working with a well-established, well-funded organization. Although we have not reached agreement with any of these potential owners or partners, we continue to identify and evaluate new business opportunities. During the course of our evaluations, we have learned that many of these potential targets are better suited for an organization that is not encumbered by the additional infrastructure required of an SEC reporting company. That knowledge, combined with our current costs and regulatory burdens of being a reporting company, our inability to provide robust confidentiality commitments (due to reporting obligations), and limited flexibility resulting from SEC and Nasdaq corporate
16
governance mandates, prompted our board of directors to appoint a special committee of our independent directors (the “Special Committee”) to determine whether the Company should de-register and de-list.
Following months of assessment and deliberation, the Special Committee determined that it is in our best interests and the best interests of shareholders to de-register and de-list. Therefore, the Special Committee recommended, and our board of directors endorsed, a reverse stock split (“Reverse Split”) of our common stock that transforms each one hundred shares of common stock into one share of common stock, with fractionalized shares redeemed for cash. Our shareholders will be asked to approve the reverse stock split at the 2017 annual meeting of shareholders and, if approved, will be implemented promptly thereafter. We anticipate that the Reverse Split will reduce our number of record holders to substantially less than 300, which will entitle us to de-register and de-list.
In conjunction with approval and recommendation of the reverse stock split, and consistent with a recommendation from the Special Committee, our board of directors also approved a stock repurchase plan for up to one million shares of our common stock. The Special Committee designed the repurchase plan to provide shareholders with an opportunity for liquidity prior to the effective date of the reverse stock split. The repurchase plan contemplates the repurchase of shares from time to time at prevailing market prices, through open market or privately negotiated transactions, pursuant to one or more plans established pursuant to Rule 10b5-1 under the Exchange Act. The repurchase plan does not require the Company to repurchase any minimum number of shares, and may be suspended, discontinued or modified at any time, for any reason and without notice.
Additionally, our board of directors assessed and continues to assess potential redemptions of outstanding shares of common stock, which led to discussions with Highland Crusader Offshore Partners, L.P., one of our largest minority shareholders (the “Crusader Fund”). The discussions with the Crusader Fund culminated in an agreement to repurchase all 2,432,923 of the Crusader Fund’s shares of Class A common stock at a price per share of $6.55, subject to possible adjustment if, on or before August 15, 2017, the Company buys or sells a substantial number of shares of Class A Stock for a higher price. Although we deployed significant cash to complete the Crusader Fund redemption, we believe the redemption will benefit our remaining shareholders in both the short and long term.
Critical Accounting Policies
Critical accounting policies require difficult, subjective or complex judgments, often as a result of the need to make estimates about the effect of matters that are inherently uncertain. Our estimates and judgments are based on information available at the time the estimates and judgments are made. Actual results could differ materially from those estimates. We make estimates and judgments when accounting for, among other matters, intangible assets, revenue recognition, stock-based compensation, income taxes and contingencies, as more fully described below.
Intangible Assets. We amortize finite-lived intangible assets, including patents, acquired in purchase transactions over their expected useful lives. We evaluate finite-lived intangible assets when events or circumstances indicate that the carrying amount of an asset or asset group may not be recoverable. These events or circumstances could include: a significant change in the business climate, legal factors, operating performance indicators, or changes in technology or customer requirements. Recoverability of an asset or asset group is measured by a comparison of the carrying amount to the future undiscounted net cash flows expected to be generated by the asset or asset group over its life. This comparison requires management to make judgments regarding estimated future cash flows. Our ability to realize the estimated future cash flows may be affected by factors such as changes in operating performance, changes in business strategy, invalidation of patents, unfavorable judgments in legal proceedings and changes in economic conditions. If our estimates of the undiscounted cash flows do not equal or exceed the carrying value of the asset or asset group, we recognize an impairment charge equal to the amount by which the recorded value of the asset or asset group exceeds its fair value.
Revenue Recognition. We derive our operating revenue from IP monetization activities, including patent licensing and patent sales. Additionally, prior to our sale of the Ovidian Group LLC in December 2015, we also derived revenue from IP consulting services. Although our revenue may occur in different forms, we regard our IP monetization activities as integrated and not separate revenue streams. For example, a third party relationship could involve consulting and licensing activities, or the acquisition of a patent portfolio can lead to licensing, consulting and patent sales revenue.
17
Our patent licensing agreements often provide for the payment of contractually determined upfront license fees representing all or a majority of the revenues that will be generated from such agreements for nonexclusive, nontransferable, limited duration licenses. These agreements typically grant (i) a nonexclusive license to make, sell, distribute, and use certain specified products that read on our patents, (ii) a covenant not to enforce patent rights against the licensee based on such activities, and (iii) the release of the licensee from certain claims. Generally, the agreements provide no further obligation for the Company upon receipt of the minimum upfront license fee. As such, the earnings process is complete and revenue is recognized upon the execution of the agreement, when collectability is reasonably assured, or upon receipt of the minimum upfront license fee, and when all other revenue recognition criteria have been met.
Certain of our patent licensing agreements provide for future royalties or future payment obligations triggered upon satisfaction of conditions. Future royalties and future payments are recognized in revenue upon satisfaction of any related conditions, provided that all revenue recognition criteria, as described below, have been met.
We sell patents from our portfolios from time to time. These sales are part of our ongoing operations. Consequently, the related proceeds are recorded as revenue. We recognize the revenue when (i) persuasive evidence of an arrangement exists, (ii) delivery has occurred, (iii) amounts are fixed or determinable, and (iv) collectability is reasonably assured.
Fees earned from IP consulting services were generally recognized as the services were performed.
The timing and amount of revenue recognized from IP monetization activities depend on the specific terms of each agreement and the nature of the deliverables and obligations. For agreements that are deemed to contain multiple elements, consideration is allocated to each element of an agreement that has stand-alone value using the relative fair value method. We recognize revenue when (i) persuasive evidence of an arrangement exists, (ii) all material obligations have been substantially performed pursuant to agreement terms or services have been rendered to the customer, (iii) amounts are fixed or determinable, and (iv) collectability is reasonably assured. As a result of the contractual terms of our patent monetization agreements and the unpredictable nature, form and frequency of monetizing transactions, our revenue may fluctuate substantially from period to period.
Stock-Based Compensation. We record stock-based compensation on stock options, performance stock awards, restricted stock awards, restricted stock units and other stock awards issued to employees, directors, consultants and/or advisors based on the estimated fair value on the date of grant and recognize compensation cost over the requisite service period for awards expected to vest. The fair value of stock options are estimated on the date of grant using the Black-Scholes option pricing model (“Black-Scholes Model”) based on the single option award approach. The fair value of restricted stock awards and restricted stock units is determined based on the number of shares granted and either the quoted market price of our Class A common stock on the date of grant for time-based and performance-based awards, or the fair value on the date of grant using the Monte Carlo Simulation model (“Monte Carlo Simulation”) for market-based awards. The fair value of stock options, restricted stock awards and restricted stock units with service conditions are typically amortized to expense on a straight-line basis over the requisite service periods of the awards, which is generally the vesting period. The fair value of stock options, restricted stock awards and restricted stock units with performance conditions deemed probable of being achieved and cliff vesting are amortized to expense over the requisite service period using the straight-line method of expense recognition. The fair value of restricted stock awards and restricted stock units with performance and market conditions are amortized to expense over the requisite service period using the straight-line method of expense recognition. The fair value of stock-based payment awards as determined by the Black-Scholes Model and the Monte Carlo Simulation are affected by our stock price as well as other assumptions. These assumptions include, but are not limited to, the expected stock price volatility over the term of the awards and actual and projected employee stock option exercise behaviors. Forfeitures are estimated at the date of grant and revised, if necessary, in subsequent periods if actual forfeitures differ from those estimates.
Income Taxes. We must make certain estimates and judgments in determining income tax expense for financial statement purposes. These estimates and judgments occur in the calculation of tax credits, tax benefits and deductions. Significant changes to these estimates may result in an increase or decrease to our tax provision in a subsequent period.
18
We must assess the likelihood that we will be able to recover our deferred tax assets. If recovery is not likely, we must record a valuation allowance against the deferred tax assets that we estimate will not ultimately be recoverable. Since our utilization of our deferred tax assets is dependent upon future taxable income that is not assured, we have recorded a valuation allowance sufficient to reduce the deferred tax assets to an amount that is more likely than not to be realized. However, should there be a change in our ability to recover our deferred tax assets, our tax provision would decrease or may result in a tax benefit in the period in which we determined that the recovery was more likely than not to occur.
The application of income tax law is inherently complex. As such, we are required to make many assumptions and judgments regarding our income tax positions and the likelihood whether such tax positions would be sustained if challenged. Interpretations and guidance surrounding income tax laws and regulations change over time, and changes in our assumptions and judgments can materially affect amounts recognized in our consolidated financial statements.
Contingencies. The outcomes of legal proceedings and claims brought by and against us are subject to significant uncertainty. We accrue an estimated loss from a loss contingency, such as a legal claim against us, by a charge to income if it is probable that an asset has been impaired or a liability has been incurred and the amount of the loss can be reasonably estimated. We disclose a contingency if there is at least a reasonable possibility that a loss has been incurred. In determining whether a contingent loss should be accrued or disclosed, we evaluate, among other factors, the degree of probability of an unfavorable outcome and the ability to make a reasonable estimate of the amount of loss. Changes in these factors could materially impact our financial position, results of operations or cash flows. For contingencies that might result in a gain, we do not record the gain until realized.
New Accounting Pronouncements
See Note 2 – “Summary of Significant Accounting Policies” of the Notes to Consolidated Financial Statements (Part II, Item 8 of this Form 10-K) for further discussion.
Key Components of Results of Operations
Revenue—We derive our operating revenue from IP monetization activities, including patent licensing, patent sales and, prior to 2016, from IP consulting services, or a combination thereof. Although our revenue may occur in different forms, we regard our IP monetization activities as integrated and not separate revenue streams. Our revenues from IP monetization activities continue to depend in large part on our ability to enter into new license agreements with third parties. Because our licensing agreements often provide for the payment of upfront license fees rather than a royalty stream and as a result of the unpredictable nature, form and frequency of our transactions, our revenue may fluctuate substantially from period to period.
Cost of revenue—Cost of revenue consists of certain costs that are variable in nature and are directly attributable to our revenue generating activities including (i) payments to third parties to whom we have an obligation to share revenue, (ii) commissions, and (iii) success fees. Additionally, in periods when patent sales occur, cost of revenue includes the net book value and other related costs associated with the sold patents. Depending on the patents being monetized, revenue share payments as a percentage of revenues may vary significantly.
Patent administration and related costs—Patent administration and related costs are comprised of (i) patent-related maintenance and prosecution costs incurred to maintain our patents, (ii) other costs that support our patent monetization efforts, and (iii) costs associated with the abandonment of patents, including the write-off of any remaining net book value.
Patent litigation—Patent litigation costs consist of costs and expenses incurred in connection with our patent-related enforcement and litigation activities. These may include non-contingent or contingent fee obligations to external counsel.
19
General and administrative—General and administrative expenses are primarily comprised of (i) personnel costs, (ii) general legal fees, (iii) professional fees, (iv) acquisition investigation costs, and (v) general office related costs.
Stock-based compensation—Stock-based compensation expense includes expense associated with the granting of stock options, restricted stock awards, restricted stock units and other stock awards issued to employees, directors, consultants and/or advisors based on the estimated fair value on the date of grant and expensed over the requisite service period for awards expected to vest.
Amortization of intangible assets—Amortization of intangible assets reflects the expensing of the cost to acquire intangible assets which are capitalized and amortized ratably over their estimated useful lives. Estimating the economic useful lives of our intangible assets depends on various factors including the remaining statutory life of the underlying assets as well as their expected period of benefit.
Results of Operations
The following table is provided to facilitate the discussion of our results of operations for the years ended December 31, 2016, 2015 and 2014 (in thousands):
|
|
|
Year ended December 31, |
|
|||||||||
|
|
|
2016 |
|
|
2015 |
|
|
2014 |
|
|||
|
Revenue |
|
$ |
59,018 |
|
|
$ |
43,519 |
|
|
$ |
42,534 |
|
|
Cost of revenues |
|
|
18,156 |
|
|
|
10,215 |
|
|
|
14,170 |
|
|
Patent administration and related costs |
|
|
1,046 |
|
|
|
2,668 |
|
|
|
6,386 |
|
|
Patent litigation |
|
|
4,169 |
|
|
|
13,076 |
|
|
|
9,880 |
|
|
General and administrative |
|
|
7,508 |
|
|
|
16,750 |
|
|
|
27,467 |
|
|
Stock-based compensation |
|
|
3,424 |
|
|
|
4,507 |
|
|
|
9,405 |
|
|
Amortization of intangibles |
|
|
9,498 |
|
|
|
13,939 |
|
|
|
15,929 |
|
|
Impairment of intangibles and goodwill |
|
|
— |
|
|
|
103,499 |
|
|
|
11,013 |
|
|
Interest income |
|
|
696 |
|
|
|
156 |
|
|
|
94 |
|
|
Interest expense |
|
|
— |
|
|
|
53 |
|
|
|
193 |
|
|
Gain on contingencies |
|
|
2,047 |
|
|
|
6,095 |
|
|
|
— |
|
|
Other expense |
|
|
11 |
|
|
|
14 |
|
|
|
16 |
|
|
Income tax expense |
|
|
— |
|
|
|
2,631 |
|
|
|
6,303 |
|
Revenue. Our revenue of $59.0 million for the year ended December 31, 2016 increased by $15.5 million, or 36%, as compared to $43.5 million for the year ended December 31, 2015. Revenue of $43.5 million for the year ended December 31, 2015 increased by $1.0 million, or 2%, as compared to $42.5 million for the year ended December 31, 2014. The year over year increase in all instances was due to an increase in licensing revenue, primarily licenses of our Memory Patents including our May 2016 license agreement with Toshiba.
Cost of Revenues. Cost of revenues of $18.2 million for the year ended December 31, 2016 increased by $8.0 million, or 78%, as compared to $10.2 million for the year ended December 31, 2015. This increase was primarily due to costs associated with our May 2016 license agreement with Toshiba, including payments to third parties to whom we have an obligation to share revenue.
Cost of revenues of $10.2 million for the year ended December 31, 2015 decreased by $4.0 million, or 28%, as compared to $14.2 million for the year ended December 31, 2014. This decrease was primarily due to lower revenue share obligations in the year ended December 31, 2015 as compared to 2014.
In future periods, cost of revenues as a percentage of revenue may vary significantly, depending upon related revenue share obligations arising from licensing arrangements and the sales price realized compared to the net book value of patents sold. Additionally, our buyout of future revenue share rights in early 2017 will significantly reduce our cost of revenues on future revenue from our Memory Patents.
20
Patent Administration and Related Costs. Patent administration and related costs of $1.0 million for the year ended December 31, 2016 decreased by $1.7 million, or 61%, as compared to $2.7 million for the year ended December 31, 2015. Patent administration and related costs of $2.7 million for the year ended December 31, 2015 decreased by $3.7 million, or 58%, as compared to $6.4 million for the year ended December 31, 2014. The year over year decrease in all instances was primarily due to a decline in the cost of patents abandoned each year as compared to the prior year; as well as a reduction in patent maintenance and prosecution costs resulting from the abandonment of certain patents and applications during prior years that were not part of existing licensing programs.
Patent Litigation. Patent litigation expenses of $4.2 million for the year ended December 31, 2016 decreased by $8.9 million, or 68%, as compared to $13.1 million for the year ended December 31, 2015. The higher patent litigation expenses in 2015 included costs incurred by our subsidiary, ContentGuard, as it prepared for its March 2015 claim construction hearing and jury trials in September 2015 and November 2015 in the Google Litigation and Apple Litigation, as well as trial cost reimbursements, and contingent fees associated with our settlement and license agreement with Amazon. Patent litigation expenses for 2016 included costs and fees associated with our settlement and license agreement with DirecTV and costs incurred to pursue enforcement actions against certain companies with whom we have been unable to secure negotiated licenses.
Patent litigation expenses of $13.1 million for the year ended December 31, 2015 increased by $3.2 million, or 32%, as compared to $9.9 million for the year ended December 31, 2014. The increase in patent litigation expenses was primarily due to litigation expenses and trial cost reimbursements in the Google Litigation and Apple Litigation which commenced in 2014 and contingent fees associated with our settlement and license agreement with Amazon.
General and Administrative. General and administrative expenses of $7.5 million for the year ended December 31, 2016 decreased by $9.3 million, or 55%, as compared to $16.8 million for the year ended December 31, 2015. The decrease was primarily due to (i) $5.5 million reduction in employment expenses resulting from a lower headcount, (ii) $1.0 million loss on the sale of Provitro’s assets and the disposal of corporate office assets incurred in 2015, (iii) $0.7 million reduction in expenses associated with Provitro, (iv) $0.9 million reduction in facilities costs and $0.3 million decrease in depreciation expense due to the closure of office locations, and (v) $0.9 million reduction in professional fees and other expenses.
General and administrative expenses of $16.8 million for the year ended December 31, 2015 decreased $10.7 million, or 39%, as compared to $27.5 million for the year ended December 31, 2014. The decrease was primarily due to (i) $3.6 million reduction in employment expenses resulting from a lower headcount in 2015, (ii) a 2014 charge of $3.2 million for a lump-sum severance payment to our CEO who departed in November 2014, (iii) $1.5 million reduction in expenses associated with Provitro, (iv) $1.4 million reduction in amortized prepaid compensation expense associated with the acquisition of Ovidian in June 2011 (which was fully amortized as of June 2014), (v) $1.2 million decrease in expense associated with researching acquisition opportunities, and (vi) $0.8 million reduction in professional fees and other expenses partially offset by $1.0 million loss on the sale of the Provitro tangible assets and the disposal of corporate office assets.
Stock-based Compensation. Stock-based compensation of $3.4 million for the year ended December 31, 2016 decreased by $1.1 million, or 24%, as compared to $4.5 million for the year ended December 31, 2015. The decrease was primarily due to a lower headcount in 2016 versus 2015, partially offset by expense associated with awards issued in June 2015 to our CEO.
Stock-based compensation of $4.5 million for the year ended December 31, 2015 decreased by $4.9 million, or 52%, as compared to $9.4 million for the year ended December 31, 2014. The decrease in stock-based compensation expense was primarily due to the vesting of awards during the second quarter of 2014 and the accelerated vesting of awards in November 2014 associated with the departure of our former CEO for which no expense was incurred in 2015, partially offset by expense associated with awards issued in June 2015 to our new CEO.
Amortization of Intangibles. Amortization of intangible assets of $9.5 million for the year ended December 31, 2016 decreased by $4.4 million, or 32%, as compared to $13.9 million for the year ended December 31, 2015 due to a reduction in value of our intangible assets as a result of their impairment during the fourth quarter of 2015, partially offset by a change in their estimated useful lives.
21
Amortization of intangibles of $13.9 million for the year ended December 31, 2015 decreased by $2.0 million, or 12%, as compared to $15.9 million for the year ended December 31, 2014. The decrease in amortization was primarily due to the abandonments of certain patents in 2015 and 2014 that do not support our existing licensing programs, the elimination of the amortization of the Provitro™ technology that was written down to zero in the fourth quarter of fiscal 2014, as well as the elimination of the amortization of the intangible assets that were impaired in the fourth quarter of 2015.
Impairment of Intangibles and Goodwill. During the fourth quarter of the year ended December 31, 2015, we recorded an impairment charge of $103.5 million due to a reduction in the carrying value of our IP and goodwill as a result of the non-infringement verdicts in the Google Litigation and Apple Litigation.
During the year ended December 31, 2014, we took an impairment charge of approximately $11.0 million, which was equal to our unamortized investment in the Provitro™ technology and related goodwill. The impairment resulted from the inability to identify near-term opportunities to commercialize the technology.
The Company recorded no such impairment charges during the year ended December 31, 2016.
Interest Income. Interest income for the years ended December 31, 2016, 2015 and 2014 primarily related to interest earned on money market funds.
Interest Expense. Interest expense of $0.1 million for the year ended December 31, 2015 and $0.2 million for the year ended December 31, 2014, consisted primarily of interest expense resulting from the installment payment obligations associated with intangible assets acquired during 2013. The payment obligation was satisfied in March 2015 and no further interest expense is being incurred.
Gain on Contingencies. Gain on contingencies of $2.0 million for the year ended December 31, 2016 was due to the receipt of contingent payments associated with the disposition of assets of our prior satellite business. Gain on contingencies of $6.1 million for the year ended December 31, 2015 was due to (i) $3.9 million from the disposition of assets associated with our former satellite business, (ii) $1.6 million, net of collection costs, upon the full and final settlement of all claims against the J&J Group, and (iii) $0.5 million from the release of a tax indemnification liability associated with our acquisition of Ovidian in June 2011.
Other Expense. Other expense for the year ended December 31, 2016, 2015 and 2014 was due to losses on foreign currency transactions.
Income Tax Expense. We did not have a U.S. federal income tax liability for the years ended December 31, 2016, 2015 or 2014. However, we recorded tax provisions of $4.1 million and $6.3 million for the years ended December 31, 2015 and 2014, respectively, related to foreign taxes withheld on revenue generated from a license agreement executed with a licensee domiciled in a foreign jurisdiction. In general, foreign taxes withheld may be claimed as a deduction on future U.S. corporate income tax returns, or as a credit against future U.S. federal income tax liabilities, subject to certain limitations. However, due to uncertainty regarding our ability to utilize the deduction or credit resulting from the foreign withholding, at December 31, 2016 and 2015, we established a full valuation allowance against this deferred tax asset. Additionally, during the year ended December 31, 2015, as a result of the impairment of certain indefinite-lived intangible assets, the deferred tax liability associated with these intangibles was decreased, resulting in a tax benefit of $1.5 million, resulting in a net tax provision for the year ended December 31, 2015 of $2.6 million.
Liquidity and Capital Resources
Overview. As of December 31, 2016, we had cash and cash equivalents of $174.6 million. Our primary expected cash needs for the next twelve months include repurchases of shares from our shareholders, ongoing operating costs associated with commercialization of our IP assets, expenses in connection with legal proceedings, expenses associated with researching new business opportunities and other general corporate purposes. We may also use our cash, and may incur debt or issue equity, to acquire or invest in other businesses or assets.
22
We believe our current balances of cash and cash equivalents and cash flows from operations will be adequate to meet our liquidity needs for the foreseeable future. Cash and cash equivalents in excess of our immediate needs are held in interest bearing accounts with financial institutions.
Cash and Cash Equivalents. Cash and cash equivalents were $174.6 million at December 31, 2016, compared to $162.5 million at December 31, 2015. The following table is provided to facilitate the discussion of our liquidity and capital resources for the years ended December 31, 2016 and 2015 (in thousands):
|
|
|
Year ended December 31, |
|
|||||
|
|
|
2016 |
|
|
2015 |
|
||
|
Net cash provided (used) in: |
|
|
|
|
|
|
|
|
|
Operating activities |
|
$ |
10,926 |
|
|
$ |
(47 |
) |
|
Investing activities |
|
|
1,288 |
|
|
|
(1,968 |
) |
|
Financing activities |
|
|
(40 |
) |
|
|
(4,321 |
) |
|
Net increase (decrease) in cash and cash equivalents |
|
|
12,174 |
|
|
|
(6,336 |
) |
|
Cash and cash equivalents—beginning of period |
|
|
162,457 |
|
|
|
168,793 |
|
|
Cash and cash equivalents—end of period |
|
$ |
174,631 |
|
|
$ |
162,457 |
|
The increase in cash and cash equivalents for the year ended December 31, 2016 of $12.2 million was primarily due to $28.6 million of collected revenue, $2.0 million received from the disposition of assets associated with our former satellite business and the receipt of $1.3 million in installment payments on a note receivable, partially offset by $13.7 million of general corporate expenditures and $6.0 million paid on revenue share obligations.
The decrease in cash and cash equivalents for the year ended December 31, 2015 of $6.3 million was primarily due to $2.0 million utilized to acquire additional intangible assets in February 2015 and a $4.0 million payment in March 2015 of an accrued obligation associated with the 2013 acquisition of our memory and storage technologies portfolio.
Cash Flows from Operating Activities. Cash provided by operating activities of $10.9 million for the year ended December 31, 2016 consisted primarily of (i) revenue generated by operations of $59.0 million, (ii) $2.0 million received from the disposition of assets associated with our former satellite business, and (iii) $0.7 million of interest income, partially offset by a $30.4 million increase in accounts receivable and operating expenses of $43.8 million adjusted for various non-cash items including (a) $9.5 million of amortization expense associated with intangibles, (b) $3.4 million of stock-based compensation expense, and (c) $0.3 million of depreciation and costs associated with abandonment of patents, as well as a $10.2 million increase in accounts payable, accrued expenses and other current/non-current liabilities.
For the year ended December 31, 2015, the $47,000 of cash used in operating activities consisted primarily of (i) revenue generated by operations of $43.5 million, (ii) $3.9 million from the disposition of assets associated with our former satellite business, and (iii) $1.6 million, net of collection costs, upon the full and final settlement of all claims against the J&J Group, partially offset by (a) foreign taxes paid of $4.1 million, (b) $3.6 million decrease in accounts payable, accrued expenses and other liabilities, (c) $1.1 million increase in accounts receivable, prepaids and other current/non-current assets, and (d) operating expenses of $164.7 million adjusted for various non-cash items including (i) $103.5 million of impairment of intangibles and goodwill, (ii) $13.9 million of amortization expense associated with patents and other intangibles, (iii) $4.5 million of stock-based compensation expense, (iv) $1.0 million of loss on the sale of the Provitro assets and the disposal of corporate office assets, (v) $1.0 million of non-cash loss associated with the abandonment of patents, (vi) $0.4 million of depreciation expense, and (vii) $0.1 million of cost associated with patents sold.
Cash Flows from Investing Activities. Cash provided by investing activities of $1.3 million for the year ended December 31, 2016 was due to the receipt of installment payments associated with the sale of the Provitro assets in 2015.
23
For the year ended December 31, 2015, the $1.9 million of cash used in investing activities was primarily due to the $2.0 million acquisition of intangible assets in February 2015, partially offset by $0.1 million of proceeds associated with the disposition of property and intangible assets.
Cash Flows from Financing Activities. Cash used in financing activities of $40,000 for the year ended December 31, 2016, relates to statutory taxes paid as a result of the vesting of restricted stock awards.
For the year ended December 31, 2015, the $4.3 million of cash used in financing activities consisted of a $4.0 million payment of an accrued obligation associated with the 2013 purchase of property and intangible assets and $0.4 million payment to acquire the minority partner’s interest in Provitro, partially offset by net proceeds of $0.1 million related to stock option/award activities.
Contractual Obligations. Our primary contractual obligations relate to an operating lease agreement for our main office location in Kirkland, Washington. Our contractual obligations as of December 31, 2016, were as follows (in thousands):
|
|
|
Years ending December 31, |
|
|||||||||||||||||
|
|
|
Total |
|
|
2017 |
|
|
2018 |
|
|
2019 |
|
|
2020 and Thereafter |
|
|||||
|
Operating lease obligations |
|
$ |
892 |
|
|
$ |
339 |
|
|
$ |
348 |
|
|
$ |
205 |
|
|
$ |
— |
|
Inflation
The impact of inflation on our consolidated financial condition and results of operations was not significant during any of the years presented.
Off-Balance Sheet Arrangements
We do not have any off-balance sheet arrangements.
We have assessed our vulnerability to certain market risks, including interest rate risk associated with our accounts receivable, accounts payable, other liabilities, and cash and cash equivalents and foreign currency risk associated with our cash held in foreign currencies.
As of December 31, 2016, our cash and investment portfolio consisted of both cash and money market funds with a fair value of $174.6 million. The primary objective of our investments in money market funds is to preserve principal while optimizing returns and minimizing risk, and our policies require, at the time of purchase, that we make these investments in short-term, high rated securities which currently yield between zero to 100 basis points.
|
|
|
December 31, 2016 |
|
|
|
Cash |
|
$ |
13,485 |
|
|
Money market funds |
|
|
161,146 |
|
|
|
|
$ |
174,631 |
|
Our primary foreign currency exposure relates to cash balances in foreign currencies. Due to the small balances we hold, we have determined that the risk associated with foreign currency fluctuations is not material to us.
24
REPORT OF INDEPENDENT REGISTERED PUBLIC ACCOUNTING FIRM
Board of Directors and Shareholders
Pendrell Corporation
We have audited the accompanying consolidated balance sheets of Pendrell Corporation (a Washington corporation) and subsidiaries (the “Company”) as of December 31, 2016 and 2015, and the related consolidated statements of operations, changes in shareholders’ equity, and cash flows for each of the three years in the period ended December 31, 2016. These financial statements are the responsibility of the Company’s management. Our responsibility is to express an opinion on these financial statements based on our audits.
We conducted our audits in accordance with the standards of the Public Company Accounting Oversight Board (United States). Those standards require that we plan and perform the audit to obtain reasonable assurance about whether the financial statements are free of material misstatement. An audit includes examining, on a test basis, evidence supporting the amounts and disclosures in the financial statements. An audit also includes assessing the accounting principles used and significant estimates made by management, as well as evaluating the overall financial statement presentation. We believe that our audits provide a reasonable basis for our opinion.
In our opinion, the consolidated financial statements referred to above present fairly, in all material respects, the financial position of Pendrell Corporation and subsidiaries as of December 31, 2016 and 2015, and the results of their operations and their cash flows for each of the three years in the period ended December 31, 2016, in conformity with accounting principles generally accepted in the United States of America.
We also have audited, in accordance with the standards of the Public Company Accounting Oversight Board (United States), the Company’s internal control over financial reporting as of December 31, 2016, based on criteria established in the 2013 Internal Control—Integrated Framework issued by the Committee of Sponsoring Organizations of the Treadway Commission (COSO), and our report dated March 15, 2017, expressed an unqualified opinion.
/s/ GRANT THORNTON LLP
Seattle, Washington
March 15, 2017
25
Pendrell Corporation
Consolidated Balance Sheets
(In thousands, except share data)
|
|
|
December 31, 2016 |
|
|
December 31, 2015 |
|
||
|
ASSETS |
|
|
|
|
|
|
|
|
|
Current assets: |
|
|
|
|
|
|
|
|
|
Cash and cash equivalents |
|
$ |
174,631 |
|
|
$ |
162,457 |
|
|
Accounts receivable |
|
|
15,457 |
|
|
|
87 |
|
|
Other receivables |
|
|
669 |
|
|
|
1,329 |
|
|
Prepaid expenses and other current assets |
|
|
262 |
|
|
|
384 |
|
|
Total current assets |
|
|
191,019 |
|
|
|
164,257 |
|
|
Property in service – net of accumulated depreciation of $531 and $512, respectively |
|
|
74 |
|
|
|
118 |
|
|
Non-current accounts receivable |
|
|
16,555 |
|
|
|
1,502 |
|
|
Other assets |
|
|
29 |
|
|
|
638 |
|
|
Intangible assets – net of accumulated amortization of $62,884 and $54,523, respectively |
|
|
4,716 |
|
|
|
14,377 |
|
|
Total |
|
$ |
212,393 |
|
|
$ |
180,892 |
|
|
LIABILITIES, SHAREHOLDERS’ EQUITY AND NONCONTROLLING INTEREST |
|
|
|
|
|
|
|
|
|
Current liabilities: |
|
|
|
|
|
|
|
|
|
Accounts payable |
|
$ |
125 |
|
|
$ |
140 |
|
|
Accrued expenses |
|
|
6,278 |
|
|
|
4,292 |
|
|
Other liabilities |
|
|
95 |
|
|
|
119 |
|
|
Total current liabilities |
|
|
6,498 |
|
|
|
4,551 |
|
|
Other non-current liabilities |
|
|
7,796 |
|
|
|
— |
|
|
Total liabilities |
|
|
14,294 |
|
|
|
4,551 |
|
|
Commitments and contingencies (Note 8) |
|
|
|
|
|
|
|
|
|
Shareholders’ equity and noncontrolling interest: |
|
|
|
|
|
|
|
|
|
Preferred stock, $0.01 par value, 75,000,000 shares authorized, no shares issued or outstanding |
|
|
— |
|
|
|
— |
|
|
Class A common stock, $0.01 par value, 900,000,000 shares authorized 27,268,261 and 27,187,911 shares issued, and 21,491,373 and 21,410,896 shares outstanding |
|
|
2,151 |
|
|
|
2,144 |
|
|
Class B convertible common stock, $0.01 par value, 150,000,000 shares authorized, 8,466,338 shares issued and 5,366,000 shares outstanding |
|
|
537 |
|
|
|
537 |
|
|
Additional paid-in capital |
|
|
1,962,178 |
|
|
|
1,958,376 |
|
|
Accumulated deficit |
|
|
(1,763,060 |
) |
|
|
(1,780,823 |
) |
|
Total Pendrell shareholders’ equity |
|
|
201,806 |
|
|
|
180,234 |
|
|
Noncontrolling interest |
|
|
(3,707 |
) |
|
|
(3,893 |
) |
|
Total shareholders’ equity and noncontrolling interest |
|
|
198,099 |
|
|
|
176,341 |
|
|
Total |
|
$ |
212,393 |
|
|
$ |
180,892 |
|
The accompanying notes are an integral part of these consolidated financial statements.
26
Pendrell Corporation
Consolidated Statements of Operations
(In thousands, except share and per share data)
|
|
|
Year ended December 31, |
|
|||||||||
|
|
|
2016 |
|
|
2015 |
|
|
2014 |
|
|||
|
Revenue |
|
$ |
59,018 |
|
|
$ |
43,519 |
|
|
$ |
42,534 |
|
|
Operating expenses: |
|
|
|
|
|
|
|
|
|
|
|
|
|
Cost of revenues |
|
|
18,156 |
|
|
|
10,215 |
|
|
|
14,170 |
|
|
Patent administration and related costs |
|
|
1,046 |
|
|
|
2,668 |
|
|
|
6,386 |
|
|
Patent litigation |
|
|
4,169 |
|
|
|
13,076 |
|
|
|
9,880 |
|
|
General and administrative |
|
|
7,508 |
|
|
|
16,750 |
|
|
|
27,467 |
|
|
Stock-based compensation |
|
|
3,424 |
|
|
|
4,507 |
|
|
|
9,405 |
|
|
Amortization of intangibles |
|
|
9,498 |
|
|
|
13,939 |
|
|
|
15,929 |
|
|
Impairment of intangibles and goodwill |
|
|
— |
|
|
|
103,499 |
|
|
|
11,013 |
|
|
Total operating expenses |
|
|
43,801 |
|
|
|
164,654 |
|
|
|
94,250 |
|
|
Operating income (loss) |
|
|
15,217 |
|
|
|
(121,135 |
) |
|
|
(51,716 |
) |
|
Interest income |
|
|
696 |
|
|
|
156 |
|
|
|
94 |
|
|
Interest expense |
|
|
— |
|
|
|
(53 |
) |
|
|
(193 |
) |
|
Gain on contingencies |
|
|
2,047 |
|
|
|
6,095 |
|
|
|
— |
|
|
Other expense |
|
|
(11 |
) |
|
|
(14 |
) |
|
|
(16 |
) |
|
Income (loss) before income taxes |
|
|
17,949 |
|
|
|
(114,951 |
) |
|
|
(51,831 |
) |
|
Income tax expense |
|
|
— |
|
|
|
(2,631 |
) |
|
|
(6,303 |
) |
|
Net income (loss) |
|
|
17,949 |
|
|
|
(117,582 |
) |
|
|
(58,134 |
) |
|
Net income (loss) attributable to noncontrolling interests |
|
|
186 |
|
|
|
(7,902 |
) |
|
|
(7,132 |
) |
|
Net income (loss) attributable to Pendrell |
|
$ |
17,763 |
|
|
$ |
(109,680 |
) |
|
$ |
(51,002 |
) |
|
Basic income (loss) per share attributable to Pendrell |
|
$ |
0.66 |
|
|
$ |
(4.13 |
) |
|
$ |
(1.93 |
) |
|
Diluted income (loss) per share attributable to Pendrell |
|
$ |
0.64 |
|
|
$ |
(4.13 |
) |
|
$ |
(1.93 |
) |
|
Weighted average shares outstanding: |
|
|
|
|
|
|
|
|
|
|
|
|
|
Basic |
|
|
26,758,985 |
|
|
|
26,570,733 |
|
|
|
26,440,750 |
|
|
Diluted |
|
|
27,691,866 |
|
|
|
26,570,733 |
|
|
|
26,440,750 |
|
The accompanying notes are an integral part of these consolidated financial statements.
27
Pendrell Corporation
Consolidated Statements of Changes in Shareholders’ Equity
(In thousands, except share data)
|
|
|
Common stock |
|
|
Additional |
|
|
|
|
|
|
|
|
|
|
|
|
|
||||||||||||||
|
|
|
Class A |
|
|
Class B |
|
|
|
|
|
paid-in |
|
|
Accumulated |
|
|
Shareholder’s |
|
|
Noncontrolling |
|
|
|
|
||||||||
|
|
|
shares |
|
|
shares |
|
|
Amount |
|
|
capital |
|
|
deficit |
|
|
Equity |
|
|
interests |
|
|
Total |
|
||||||||
|
Balance, January 1, 2014 |
|
|
21,244,998 |
|
|
|
5,366,000 |
|
|
$ |
2,663 |
|
|
$ |
1,941,818 |
|
|
$ |
(1,619,993 |
) |
|
$ |
324,488 |
|
|
$ |
12,305 |
|
|
$ |
336,793 |
|
|
Vesting of Class A common stock issued for Ovidian acquisition |
|
|
— |
|
|
|
— |
|
|
|
— |
|
|
|
2,229 |
|
|
|
— |
|
|
|
2,229 |
|
|
|
— |
|
|
|
2,229 |
|
|
Issuance of Class A common stock from exercise of stock options |
|
|
51,493 |
|
|
|
— |
|
|
|
5 |
|
|
|
424 |
|
|
|
— |
|
|
|
429 |
|
|
|
— |
|
|
|
429 |
|
|
Class A common stock withheld at vesting to cover statutory tax obligations |
|
|
(16,182 |
) |
|
|
— |
|
|
|
(2 |
) |
|
|
(633 |
) |
|
|
(140 |
) |
|
|
(775 |
) |
|
|
— |
|
|
|
(775 |
) |
|
Stock-based compensation and issuance of restricted stock, net of forfeitures |
|
|
17,215 |
|
|
|
— |
|
|
|
3 |
|
|
|
9,042 |
|
|
|
— |
|
|
|
9,045 |
|
|
|
— |
|
|
|
9,045 |
|
|
Net loss |
|
|
— |
|
|
|
— |
|
|
|
— |
|
|
|
— |
|
|
|
(51,002 |
) |
|
|
(51,002 |
) |
|
|
(7,132 |
) |
|
|
(58,134 |
) |
|
Balance, December 31, 2014 |
|
|
21,297,524 |
|
|
|
5,366,000 |
|
|
$ |
2,669 |
|
|
$ |
1,952,880 |
|
|
$ |
(1,671,135 |
) |
|
$ |
284,414 |
|
|
$ |
5,173 |
|
|
$ |
289,587 |
|
|
Issuance of Class A common stock from exercise of stock options |
|
|
35,835 |
|
|
|
— |
|
|
|
4 |
|
|
|
215 |
|
|
|
— |
|
|
|
219 |
|
|
|
— |
|
|
|
219 |
|
|
Class A common stock withheld at vesting to cover statutory tax obligations |
|
|
(3,881 |
) |
|
|
— |
|
|
|
(1 |
) |
|
|
(131 |
) |
|
|
(8 |
) |
|
|
(140 |
) |
|
|
— |
|
|
|
(140 |
) |
|
Stock-based compensation and issuance of restricted stock, net of forfeitures |
|
|
115,668 |
|
|
|
— |
|
|
|
12 |
|
|
|
4,693 |
|
|
|
— |
|
|
|
4,705 |
|
|
|
— |
|
|
|
4,705 |
|
|
Repurchase of restricted stock |
|
|
(25,000 |
) |
|
|
— |
|
|
|
(2 |
) |
|
|
— |
|
|
|
— |
|
|
|
(2 |
) |
|
|
— |
|
|
|
(2 |
) |
|
Shares received through divesture of Ovidian |
|
|
(9,250 |
) |
|
|
— |
|
|
|
(1 |
) |
|
|
(45 |
) |
|
|
— |
|
|
|
(46 |
) |
|
|
— |
|
|
|
(46 |
) |
|
Purchase of noncontrolling interest in Provitro Biosciences LLC |
|
|
— |
|
|
|
— |
|
|
|
— |
|
|
|
764 |
|
|
|
— |
|
|
|
764 |
|
|
|
(1,164 |
) |
|
|
(400 |
) |
|
Net loss |
|
|
— |
|
|
|
— |
|
|
|
— |
|
|
|
— |
|
|
|
(109,680 |
) |
|
|
(109,680 |
) |
|
|
(7,902 |
) |
|
|
(117,582 |
) |
|
Balance, December 31, 2015 |
|
|
21,410,896 |
|
|
|
5,366,000 |
|
|
$ |
2,681 |
|
|
$ |
1,958,376 |
|
|
$ |
(1,780,823 |
) |
|
$ |
180,234 |
|
|
$ |
(3,893 |
) |
|
$ |
176,341 |
|
|
Class A common stock withheld at vesting to cover statutory tax obligations |
|
|
(6,352 |
) |
|
|
— |
|
|
|
— |
|
|
|
(40 |
) |
|
|
— |
|
|
|
(40 |
) |
|
|
— |
|
|
|
(40 |
) |
|
Stock-based compensation and issuance of restricted stock, net of forfeitures |
|
|
86,829 |
|
|
|
— |
|
|
|
7 |
|
|
|
3,842 |
|
|
|
— |
|
|
|
3,849 |
|
|
|
— |
|
|
|
3,849 |
|
|
Net income |
|
|
— |
|
|
|
— |
|
|
|
— |
|
|
|
— |
|
|
|
17,763 |
|
|
|
17,763 |
|
|
|
186 |
|
|
|
17,949 |
|
|
Balance, December 31, 2016 |
|
|
21,491,373 |
|
|
|
5,366,000 |
|
|
$ |
2,688 |
|
|
$ |
1,962,178 |
|
|
$ |
(1,763,060 |
) |
|
$ |
201,806 |
|
|
$ |
(3,707 |
) |
|
$ |
198,099 |
|
The accompanying notes are an integral part of these consolidated financial statements.
28
Pendrell Corporation
Consolidated Statements of Cash Flows
(In thousands, except share data)
|
|
|
Year ended December 31, |
|
|||||||||
|
|
|
2016 |
|
|
2015 |
|
|
2014 |
|
|||
|
Operating activities: |
|
|
|
|
|
|
|
|
|
|
|
|
|
Net income (loss) including noncontrolling interest |
|
$ |
17,949 |
|
|
$ |
(117,582 |
) |
|
$ |
(58,134 |
) |
|
Adjustments to reconcile net income (loss) to net cash provided (used) in operating activities: |
|
|
|
|
|
|
|
|
|
|
|
|
|
Stock-based compensation |
|
|
3,424 |
|
|
|
4,507 |
|
|
|
9,405 |
|
|
Amortization of prepaid compensation from Ovidian acquisition |
|
|
— |
|
|
|
— |
|
|
|
1,380 |
|
|
Amortization of intangible assets |
|
|
9,498 |
|
|
|
13,939 |
|
|
|
15,929 |
|
|
Impairment of intangible assets and goodwill |
|
|
— |
|
|
|
103,499 |
|
|
|
11,013 |
|
|
Depreciation |
|
|
51 |
|
|
|
351 |
|
|
|
523 |
|
|
Non-cash cost of patents monetized |
|
|
— |
|
|
|
138 |
|
|
|
794 |
|
|
Loss associated with the abandonment and/or disposition of patents |
|
|
163 |
|
|
|
958 |
|
|
|
2,765 |
|
|
Loss on the disposition of property |
|
|
— |
|
|
|
1,015 |
|
|
|
— |
|
|
Other |
|
|
4 |
|
|
|
3 |
|
|
|
222 |
|
|
Other changes in certain assets and liabilities: |
|
|
|
|
|
|
|
|
|
|
|
|
|
Accounts receivable, current and non-current |
|
|
(30,423 |
) |
|
|
44 |
|
|
|
271 |
|
|
Prepaid expenses and other current/non-current assets |
|
|
91 |
|
|
|
(1,108 |
) |
|
|
938 |
|
|
Accounts payable |
|
|
(15 |
) |
|
|
(141 |
) |
|
|
115 |
|
|
Accrued expenses and other current liabilities |
|
|
2,388 |
|
|
|
(5,670 |
) |
|
|
1,470 |
|
|
Non-current liabilities |
|
|
7,796 |
|
|
|
— |
|
|
|
— |
|
|
Net cash provided (used) in operating activities |
|
|
10,926 |
|
|
|
(47 |
) |
|
|
(13,309 |
) |
|
Investing activities: |
|
|
|
|
|
|
|
|
|
|
|
|
|
Payment received on note receivable |
|
|
1,300 |
|
|
|
— |
|
|
|
— |
|
|
Purchases of property and intangible assets |
|
|
(12 |
) |
|
|
(2,077 |
) |
|
|
(119 |
) |
|
Proceeds associated with disposition of property |
|
|
— |
|
|
|
109 |
|
|
|
— |
|
|
Net cash provided (used) in investing activities |
|
|
1,288 |
|
|
|
(1,968 |
) |
|
|
(119 |
) |
|
Financing activities: |
|
|
|
|
|
|
|
|
|
|
|
|
|
Proceeds from exercise of stock options |
|
|
— |
|
|
|
219 |
|
|
|
429 |
|
|
Payment of statutory taxes for stock awards |
|
|
(40 |
) |
|
|
(140 |
) |
|
|
(775 |
) |
|
Payment of accrued obligations for purchased intangible assets |
|
|
— |
|
|
|
(4,000 |
) |
|
|
(2,000 |
) |
|
Purchase of noncontrolling interest in Provitro Biosciences LLC |
|
|
— |
|
|
|
(400 |
) |
|
|
— |
|
|
Net cash used in financing activities |
|
|
(40 |
) |
|
|
(4,321 |
) |
|
|
(2,346 |
) |
|
Net increase (decrease) in cash and cash equivalents |
|
|
12,174 |
|
|
|
(6,336 |
) |
|
|
(15,774 |
) |
|
Cash and cash equivalents—beginning of period |
|
|
162,457 |
|
|
|
168,793 |
|
|
|
184,567 |
|
|
Cash and cash equivalents—end of period |
|
$ |
174,631 |
|
|
$ |
162,457 |
|
|
$ |
168,793 |
|
|
Supplemental disclosures: |
|
|
|
|
|
|
|
|
|
|
|
|
|
Income taxes paid |
|
$ |
— |
|
|
$ |
4,125 |
|
|
$ |
6,272 |
|
|
Supplemental disclosure of non-cash investing and financing activities: |
|
|
|
|
|
|
|
|
|
|
|
|
|
Note receivable for disposition of property |
|
|
— |
|
|
|
1,900 |
|
|
|
— |
|
The accompanying notes are an integral part of these consolidated financial statements.
29
Pendrell Corporation
Notes to Consolidated Financial Statements
1. Organization and Business
Overview—These consolidated financial statements include the accounts of Pendrell Corporation (“Pendrell”) and its consolidated subsidiaries (collectively referred to as the “Company”). Since 2011, the Company’s strategy, through its consolidated subsidiaries, has been to invest in, acquire and develop businesses with unique technologies that are often protected by intellectual property (“IP”) rights, and that present the opportunity to address large, global markets. The Company’s subsidiaries focus on licensing the IP rights they hold to third parties. The Company regularly evaluates its existing investments to determine whether retention or disposition is appropriate, and investigates new investment and business acquisition opportunities. From 2011 through 2015, the Company also advised clients on various IP strategies and transactions through its consulting subsidiary Ovidian Group LLC (“Ovidian”). As of December 31, 2015, the Company sold Ovidian for nominal consideration.
The Company was formed in 2000 to operate a next generation global mobile satellite communications system. The Company began its exit from the satellite business in 2011 with the sale of its interests in DBSD North America, Inc. and its subsidiaries to DISH Network Corporation. During 2012, the Company completed its exit with (i) the sale of its medium earth orbit (“MEO”) satellite assets (“MEO Assets”) that had been in storage for nominal consideration, (ii) the transfer of its in-orbit MEO satellite to a new operator who assumed responsibility for all related operating costs effective April 1, 2012, and (iii) the deconsolidation of its MEO-related international subsidiaries.
2. Summary of Significant Accounting Policies
Principles of Consolidation and Basis of Presentation— The consolidated financial statements of the Company include the assets and liabilities of its wholly-owned subsidiaries and subsidiaries it controls or in which it has a controlling financial interest. Noncontrolling interests on the consolidated balance sheets include third-party investments in entities that the Company consolidates, but does not wholly own. Noncontrolling interests are classified as part of equity and the Company allocates net income (loss), other comprehensive income (loss) and other equity transactions to its noncontrolling interests in accordance with their applicable ownership percentages. All intercompany transactions and balances have been eliminated in consolidation. All information in these financial statements is in U.S. dollars. These financial statements have been prepared in accordance with accounting principles generally accepted in the United States of America (“GAAP”).
In February 2015, the Company acquired the minority partner’s interest in Provitro Biosciences LLC (“Provitro”) for nominal consideration resulting in 100% ownership of Provitro. The Company continues to have a minority partner in its ContentGuard Holdings, Inc. (“ContentGuard”) subsidiary.
Capital Structure Change—At the Company’s annual meeting of shareholders on July 7, 2016, the Company’s shareholders approved a reverse split (the “Reverse Stock Split”) of the Company’s issued and outstanding shares of Class A common stock and Class B common stock within a range of one share of common stock for every three shares of common stock (1-for-3) to one share of common stock for every ten shares of common stock (1-for-10), with the exact Reverse Stock Split ratio to be set within this range as determined by the Company’s board of directors in its sole discretion. On September 20, 2016, the Company’s board of directors fixed the Reverse Stock Split ratio at 1-for-10. As a result of the Reverse Stock Split, the share counts and per share data reported in the historical financial statements have been adjusted retrospectively as if the Reverse Stock Split had been in effect for all periods presented. Additionally, the exercise prices and the number of shares issuable under the Company’s stock-based compensation plans have been adjusted retrospectively to reflect the Reverse Stock Split.
Segment Information—The Company operates in and reports on one segment (IP management). Operating segments are based upon the Company’s internal organization structure, the manner in which its operations are managed, and the criteria used by its Chief Operating Decision Maker. Substantially all of the Company’s revenue is generated by operations located within the United States, and the Company does not have any long-lived assets located in foreign countries.
30
Use of Estimates—The preparation of financial statements in conformity with GAAP requires management to make estimates and assumptions that affect the reported amounts of assets and liabilities and disclosure of contingent assets and liabilities at the date of the financial statements and the reported amounts of revenues and expenses during the reporting period. Actual results could differ materially from these estimates.
On an ongoing basis, the Company evaluates its estimates, including among others, those related to revenue share obligations for the purpose of determining cost of revenue, the fair value of acquired intangible assets and goodwill, the useful lives and potential impairment of intangible assets and property and equipment, the value of stock awards for the purpose of determining stock-based compensation expense, accrued liabilities (including bonus accruals), valuation allowances related to the ability to realize deferred tax assets, allowances for doubtful receivables and certain tax liabilities. Estimates are based on historical experience and other factors, including the current economic environment as deemed appropriate under the circumstances. Estimates and assumptions are adjusted when facts and circumstances dictate. As future events and their effects cannot be determined with precision, actual results could differ significantly from these estimates. Any changes in estimates used to prepare these financial statements will be reflected in the financial statements in future periods.
Cash and Cash Equivalents—Cash and cash equivalents are defined as short-term, highly liquid investments with original maturities from the date of purchase of 90 days or less. Cash and cash equivalents are comprised of the following (in thousands):
|
|
|
December 31, |
|
|||||
|
|
|
2016 |
|
|
2015 |
|
||
|
Cash |
|
$ |
13,485 |
|
|
$ |
26,951 |
|
|
Money market funds |
|
|
161,146 |
|
|
|
135,506 |
|
|
|
|
$ |
174,631 |
|
|
$ |
162,457 |
|
The fair value of money market funds at December 31, 2016 and 2015 was classified as Level 1 in the hierarchy established by the Financial Accounting Standards Board (“FASB”) as amounts were based on quoted prices available in active markets for identical investments as of the reporting date.
Accounts Receivable—Accounts receivable consist primarily of amounts billed to customers under licensing arrangements. For the years ended December 31, 2016, 2015 and 2014, the Company did not incur any losses on its accounts receivable. Based upon historical collections experience and currently available information, the Company has determined that no allowance for doubtful accounts was required at either December 31, 2016 or December 31, 2015. Carrying amounts of such receivables approximate their fair value due to their short-term nature.
Prepaid Expenses and Other Current Assets—As of December 31, 2016 and 2015, prepaid expenses and other current assets consisted primarily of insurance prepayments, prepayments of patent maintenance fees and prepayments of rent for leased facilities.
Property in Service—Property in service consists primarily of computer equipment, software, furniture and fixtures and leasehold improvements. Property in service is recorded at cost, net of accumulated depreciation, and is depreciated using the straight-line method. Computer equipment and furniture and fixtures are depreciated over their estimated useful lives ranging from three to five years. Software is depreciated over the shorter of its contractual license period or three years. Leasehold improvements are amortized over the shorter of their estimated useful lives or the term of the respective lease. Significant additions and improvements to property in service are capitalized. Repair and maintenance costs are expensed as incurred.
31
Business Combinations—The Company accounts for business combinations using the acquisition method and, accordingly, the identifiable assets acquired and liabilities assumed are recorded at their acquisition date fair values. This valuation requires management to make significant estimates and assumptions, especially with respect to intangible assets. Valuation methodologies may include the cost, market or income approach. Critical estimates in valuing intangible assets include but are not limited to estimates about: future expected cash flows from customers, proprietary technology, the acquired company’s brand awareness and market position and discount rates. The estimates are based upon assumptions the Company believes to be reasonable, but which are inherently uncertain and unpredictable. Goodwill is calculated as the excess of the purchase price over the fair value of net assets, including the amount assigned to identifiable intangible assets. Subsequent changes to assets, liabilities, valuation allowance or uncertain tax positions that relate to the acquired company and existed at the acquisition date that occur both within the measurement period and as a result of new information about facts and circumstances that existed at the acquisition date are recognized as an adjustment to goodwill. Acquisition-related costs, including advisory, legal, accounting, valuation and other costs, are expensed in the periods in which the costs are incurred. The results of operations of acquired businesses are included in the consolidated financial statements from the acquisition date.
Intangible Assets and Goodwill— The Company amortizes finite-lived intangible assets, including patents, acquired in purchase transactions over their expected useful lives. The Company assigns goodwill and indefinite-lived intangible assets to its reporting units based on the expected benefit from the synergies arising from each business combination.
The Company evaluates finite-lived intangible assets when events or circumstances indicate that the carrying amount of an asset or asset group may not be recoverable. These events or circumstances could include: a significant change in the business climate, legal factors, operating performance indicators, or changes in technology or customer requirements. Recoverability of an asset or asset group is measured by a comparison of the carrying amount to the future undiscounted net cash flows expected to be generated by the asset or asset group over its life. This comparison requires management to make judgments regarding estimated future cash flows. The Company’s ability to realize the estimated future cash flows may be affected by factors such as changes in operating performance, changes in business strategy, invalidation of patents, unfavorable judgments in legal proceedings and changes in economic conditions. If the Company’s estimates of the undiscounted cash flows do not equal or exceed the carrying value of the asset or asset group, an impairment charge equal to the amount by which the recorded value of the asset or asset group exceeds its fair value is recognized.
The Company previously evaluated goodwill for impairment on an annual basis during the fourth quarter, or more frequently if circumstances indicated that the carrying value of a Company reporting unit may exceed its fair value. When evaluating goodwill and indefinite-lived intangible assets for impairment, the Company first performed a qualitative assessment to determine if fair value of the reporting unit was more likely than not greater than the carrying amount. If the assessment indicated that it was more likely than not that the fair value of a reporting unit was less than its carrying amount, then the Company further evaluated the estimated fair value of the reporting unit through the use of discounted cash flow models, which required management to make significant judgments as to the estimated future cash flows utilized. The Company’s ability to realize the future cash flows utilized in its fair value calculations could be affected by factors such as changes in its operating performance, changes in its business strategy, invalidation of its patents, unfavorable judgments in legal proceedings and changes in economic conditions. The results of the models were compared to the carrying amount of the reporting unit. If such comparison indicated that the fair value of the reporting unit was lower than the carrying amount, impairment would exist and the impairment charge would be measured by comparing the implied fair value of the reporting unit’s goodwill to its carrying value.
During 2015, the Company determined that a portion of its intellectual property assets and the balance of its goodwill were impaired and recognized an impairment charge of $103.5 million for the year ended December 31, 2015. During 2014, the Company recognized an impairment charge of $11.0 million related to intangibles and goodwill of its Provitro asset group. See Note 5, “Intangible Assets and Goodwill” for further details.
As a result of the impairments in 2015 and 2014, the Company no longer maintains balances for goodwill or indefinite-lived intangible assets in its financial statements.
32
Fair Value of Financial Instruments—The Company determines the fair value of its financial instruments based on the fair value hierarchy established by the FASB. The three levels of inputs used to measure fair value are as follows:
Level 1—Quoted prices in active markets for identical assets and liabilities.
Level 2—Quoted prices in active markets for similar assets and liabilities or other inputs that are observable for the asset or liability, either directly or indirectly, for substantially the full term of the financial instrument.
Level 3—Unobservable inputs that are supported by little or no market activity and are significant to the fair value of the assets and liabilities. This includes certain pricing models, discounted cash flow methodologies and similar techniques that use significant unobservable inputs.
As of December 31, 2016 and 2015, the Company’s financial instruments included its cash and cash equivalents, accounts receivable, other receivables, accounts payable and certain other assets and liabilities. The Company has determined that the carrying value of its financial instruments, based on the hierarchy established by the FASB, approximates the fair value of the financial instruments as they are equivalent to cash or due to their short-term nature.
Revenue Recognition— The Company derives its operating revenue from IP monetization activities, including patent licensing and patent sales; and, in years prior to 2016, from IP consulting services. Although the Company’s revenue may occur in different forms, it regards its IP monetization activities as integrated and not separate revenue streams. For example, a third party relationship could involve consulting and licensing activities, or the acquisition of a patent portfolio can lead to licensing, consulting and patent sales revenue.
The Company’s patent licensing agreements often provide for the payment of contractually determined upfront license fees representing all or a majority of the revenue that will be generated from such agreements for nonexclusive, nontransferable, limited duration licenses. These agreements typically grant (i) a nonexclusive license to make, sell, distribute, and use certain specified products that read on the Company’s patents, (ii) a covenant not to enforce patent rights against the licensee based on such activities, and (iii) the release of the licensee from certain claims. Generally, the agreements provide no further obligation for the Company upon receipt of the minimum upfront license fee. As such, the earnings process is complete and revenue is recognized upon the execution of the agreement, when collectability is reasonably assured, or upon receipt of the minimum upfront license fee, and when all other revenue recognition criteria have been met.
Certain of the Company’s patent licensing agreements provide for future royalties or future payment obligations triggered upon satisfaction of conditions. Future royalties and future payments are recognized in revenue upon satisfaction of any related conditions, provided that all revenue recognition criteria, as described below, have been met.
The Company sells patents from its portfolios from time to time. These sales are part of the Company’s ongoing operations. Consequently, the related proceeds are recorded as revenue.
The timing and amount of revenue recognized from IP monetization activities depend on the specific terms of each agreement and the nature of the deliverables and obligations. Fees earned from IP consulting services are generally recognized as the services are performed. For agreements that are deemed to contain multiple elements, consideration is allocated to each element of an agreement that has stand-alone value using the relative fair value method. The Company recognizes revenue when (i) persuasive evidence of an arrangement exists, (ii) all material obligations have been substantially performed pursuant to agreement terms, services have been rendered to the customer or delivery has occurred, (iii) amounts are fixed or determinable, and (iv) collectability is reasonably assured. As a result of the contractual terms of our patent monetization agreements and the unpredictable nature, form and frequency of monetizing transactions, our revenue may fluctuate substantially from period to period.
Research and Development—The Company incurs costs associated with research and development activities and expenses the costs in the period incurred. Research and development expenses during the period were not material for separate disclosure and are included in general and administrative expenses.
33
Stock-Based Compensation—The Company records stock-based compensation on stock options, stock appreciation rights, restricted stock awards, restricted stock units and other stock awards issued to employees, directors, consultants and/or advisors based on the estimated fair value on the date of grant and recognizes compensation cost over the requisite service period for awards expected to vest. The fair value of stock options and stock appreciation rights is estimated on the date of grant using the Black-Scholes option pricing model (“Black-Scholes Model”) based on the single option award approach. The fair value of restricted stock awards and restricted stock units is determined based on the number of shares granted and either the quoted market price of the Company’s Class A common stock on the date of grant for time-based and performance-based awards, or the fair value on the date of grant using the Monte Carlo Simulation model (“Monte Carlo Simulation”) for market-based awards. The fair value of stock options, restricted stock awards and restricted stock units with service conditions are amortized to expense on a straight-line basis over the requisite service periods of the awards, which is generally the vesting period. The fair value of stock options, stock appreciation rights, restricted stock awards and restricted stock units with performance conditions deemed probable of being achieved and cliff vesting is amortized to expense over the requisite service period using the straight-line method of expense recognition. The fair value of restricted stock awards and restricted stock units with performance and market conditions are amortized to expense over the requisite service period using the straight-line method of expense recognition. The fair value of stock-based payment awards as determined by the Black-Scholes Model and the Monte Carlo Simulation are affected by the Company’s stock price as well as other assumptions. These assumptions include, but are not limited to, the expected stock price volatility over the term of the awards and actual and projected employee stock option exercise behaviors. Forfeitures are estimated at the date of grant and revised, if necessary, in subsequent periods if actual forfeitures differ from those estimates.
The Company accounts for the modification of the terms or conditions of a stock-based payment award as an exchange of the original award for a new award. Compensation expense for modified stock-based payment awards is equal to the fair value of the original award plus the incremental cost conveyed as a result of the modification expensed over the remaining life of the award.
Income Taxes—The Company accounts for income taxes using the asset and liability method under which deferred tax assets and liabilities are recognized for the future tax consequences attributable to differences between the financial statement carrying amounts of existing assets and liabilities and their respective tax bases. Deferred tax assets and liabilities are measured using enacted tax rates expected to apply to taxable income in the years in which those temporary differences are expected to reverse. The effect on deferred tax assets and liabilities of a change in tax rates is recognized in the period that includes the enactment date. A valuation allowance against deferred tax assets (“DTAs”) is recorded when it is more likely than not that the assets will not be realized.
The Company records an unrecognized tax benefit from an uncertain tax position only if it is more likely than not that the tax position will be sustained upon examination by the tax authorities. The Company’s policy is to recognize interest and/or penalties related to unrecognized tax benefits as income tax expense.
Contingencies—Outcomes of legal proceedings and claims brought by and against the Company are subject to significant uncertainty. The Company accrues an estimated loss from a loss contingency, such as a legal claim, by a charge to income if it is probable that an asset has been impaired or a liability has been incurred and the amount of the loss can be reasonably estimated. The Company discloses a contingency if there is at least a reasonable possibility that a loss has been incurred. In determining whether a contingent loss should be accrued or disclosed, the Company evaluates, among other factors, the degree of probability of an unfavorable outcome and the ability to make a reasonable estimate of the amount of loss. Changes in these factors could materially impact the Company’s financial position, results of operations or cash flows. For contingencies that might result in a gain, the Company does not record the gain until realized.
Income (Loss) Per Share—Basic income (loss) per share is calculated based on the weighted average number of Class A common stock and Class B common stock (the “Common Shares”) outstanding during the period. Diluted income (loss) per share is calculated by dividing the income (loss) allocable to common shareholders by the weighted average Common Shares outstanding plus dilutive potential Common Shares. Prior to the satisfaction of vesting conditions, unvested restricted stock awards are considered contingently issuable and are excluded from weighted average Common Shares outstanding used for computation of basic loss per share.
34
Potential dilutive Common Shares consist of the incremental Class A common stock issuable upon the exercise of outstanding stock options (both vested and non-vested) and unvested restricted stock awards and units, calculated using the treasury stock method. The calculation of dilutive loss per share for the years ended December 31, 2015 and 2014 excludes all potential dilutive Common Shares as their inclusion would have been antidilutive.
The following table sets forth the computation of basic and diluted income (loss) per share (in thousands, except share and per share data):
|
|
|
Year ended December 31, |
|
|||||||||
|
|
|
2016 |
|
|
2015 |
|
|
2014 |
|
|||
|
Net income (loss) attributable to Pendrell |
|
$ |
17,763 |
|
|
$ |
(109,680 |
) |
|
$ |
(51,002 |
) |
|
Weighted average common shares outstanding |
|
|
26,827,699 |
|
|
|
26,713,685 |
|
|
|
26,633,662 |
|
|
Less: weighted average unvested restricted stock awards |
|
|
(68,714 |
) |
|
|
(142,952 |
) |
|
|
(192,912 |
) |
|
Shares used for computation of basic income (loss) per share |
|
|
26,758,985 |
|
|
|
26,570,733 |
|
|
|
26,440,750 |
|
|
Add back: weighted average unvested restricted stock awards and units |
|
|
932,881 |
|
|
|
— |
|
|
|
— |
|
|
Shares used for computation of diluted income (loss) per share (1) |
|
|
27,691,866 |
|
|
|
26,570,733 |
|
|
|
26,440,750 |
|
|
Basic income (loss) per share attributable to Pendrell |
|
$ |
0.66 |
|
|
$ |
(4.13 |
) |
|
$ |
(1.93 |
) |
|
Diluted income (loss) per share attributable to Pendrell |
|
$ |
0.64 |
|
|
$ |
(4.13 |
) |
|
$ |
(1.93 |
) |
|
(1) |
Stock options, restricted stock awards and units totaling 1,305,365, 2,784,787 and 2,811,354 for the years ended December 31, 2016, 2015 and 2014, respectively, were excluded from the calculation of diluted income (loss) per share as their inclusion was anti-dilutive. |
New Accounting Pronouncements—In February 2016, the Financial Accounting Standards Board (“FASB”) issued Accounting Standard Update (“ASU”) No. 2016-02, Leases (Topic 842), which requires companies that are lessees to recognize a right-of-use asset and lease liability for most leases that do not meet the definition of a short-term lease. For income statement purposes, leases will continue to be classified as either operating or financing. Classification will be based on criteria that are largely similar to those applied in current lease accounting. Compliance with this ASU is required for annual periods beginning after December 15, 2018, and interim periods therein. Early adoption is permitted. As the Company’s future minimum lease commitments as of December 31, 2016 are less than $1.0 million, the Company believes the future adoption of this ASU will not have a material impact on its financial position, results of operations or cash flows.
In March 2016, the FASB issued ASU No. 2016-09, Compensation—Stock Compensation (Topic 718): Improvements to Employee Share-Based Payment Accounting, to simplify certain provisions in stock compensation accounting, including: (1) accounting for income taxes, (2) classification of excess tax benefits on the statement of cash flow, (3) forfeitures, (4) minimum statutory tax withholding requirements, (5) classification of employee taxes paid on the statement of cash flows when an employer withholds shares for tax withholding purposes, (6) the practical expedient for estimating the expected term and (7) intrinsic value. Compliance with this ASU is required for annual periods beginning after December 15, 2016, and interim periods therein. Early adoption is permitted. The Company plans to adopt this ASU in the first quarter of its fiscal year ended December 31, 2017, which will result in an adjustment to retained earnings and additional paid in capital of approximately $0.2 million due to a change in its accounting for forfeitures. The Company believes this adjustment will not have a material impact on its financial position, results of operations or cash flows.
35
In August 2016, the FASB issued ASU No. 2016-15, Statement of Cash Flows (Topic 230): Classification of Certain Cash Receipts and Cash Payments, which addresses the diversity in practice in how certain cash receipts and cash payments are presented and classified in the statement of cash flows including: (1) debt prepayment or debt extinguishment costs, (2) settlement of zero-coupon bonds, (3) contingent consideration payments made after a business combination, (4) proceeds from the settlement of insurance claims, (5) proceeds from the settlement of corporate-owned life insurance policies, including bank-owned life insurance policies, (6) distributions received from equity method investees, (7) beneficial interests in securitization transactions and (8) separately identifiable cash flows and application of the predominance principle. Compliance with this ASU is required for annual periods beginning after December 15, 2017, and interim periods therein. Early adoption is permitted. The adoption of this ASU during the year ended December 31, 2016 did not have an impact on the Company’s financial position, results of operations or cash flows.
Throughout the year ended December 31, 2016, the FASB has issued a number of ASUs which provide further clarification to ASU No. 2014-09, Revenue (Topic 606): Revenue from Contracts with Customers, issued in May 2014, which supersedes existing revenue recognition guidance under GAAP. The core principle of ASU No. 2014-09 is to recognize as revenue the amount that an entity expects to be entitled for goods or services at the time the goods or services are transferred to customers. In August 2015, the FASB issued ASU No. 2015-14, which deferred the effective date of the amendments in ASU No. 2014-09 to the annual reporting period beginning after December 15, 2017, with early adoption permitted beginning January 1, 2017. The ASUs issued in 2016 related to ASU No. 2014-09 will become effective when the guidance in ASU No. 2014-09 becomes effective. The Company is continuing to assess the impact, if any, of implementing ASU No. 2014-09 and related ASUs as of January 1, 2018, under the modified retrospective method where the cumulative effect is recognized at the date of initial application. The Company believes future adoption of these ASUs will not have a material impact on its financial position, results of operations or cash flows.
3. Provitro
In February 2013, the Company acquired a 68.75% interest in Provitro, the developer of the Provitro™ proprietary micro-propagation technology designed to facilitate the production on a commercial scale of certain plants, particularly timber bamboo. In February 2015, the Company acquired the minority partner’s interest in Provitro for nominal consideration resulting in 100% ownership of Provitro.
From acquisition through the year ended December 31, 2014, the Company attempted to develop a strategy to commercialize the Provitro™ technology, but did not generate revenue from the technology. In January 2015, the Company suspended further development of the Provitro™ technology due to the Company’s inability to identify near-term opportunities for commercialization. The Company began seeking a buyer for Provitro’s assets and took an $11.0 million impairment charge during the fourth quarter of its year ended December 31, 2014. The impairment charge was equal to the sum of its unamortized investment in the Provitro™ technology and the goodwill associated with its acquisition of Provitro.
36
In September 2015, the Company sold Provitro’s facility and related tangible assets for $2.0 million, resulting in a $0.7 million loss which is included in general and administrative expenses for the year ended December 31, 2015. The purchase price is payable in installments of which $0.1 million was paid immediately, $0.4 million was received in January 2016, $0.9 million was received in August 2016 and $0.6 million is scheduled to be paid no later than March 1, 2017. The installment payments are reflected in the balance sheet as follows (in thousands):
|
|
|
December 31, 2016 |
|
|
December 31, 2015 |
|
||
|
Other receivables: |
|
|
|
|
|
|
|
|
|
Provitro note receivable |
|
$ |
600 |
|
|
$ |
1,300 |
|
|
Other |
|
|
69 |
|
|
|
29 |
|
|
Total other receivables |
|
$ |
669 |
|
|
$ |
1,329 |
|
|
|
|
|
|
|
|
|
|
|
|
Other assets: |
|
|
|
|
|
|
|
|
|
Provitro note receivable |
|
$ |
— |
|
|
$ |
600 |
|
|
Other |
|
|
29 |
|
|
|
38 |
|
|
Total other assets |
|
$ |
29 |
|
|
$ |
638 |
|
Additionally, in December 2015, the Company sold its rights to the Provitro™ micro-propagation technology, resulting in a nominal amount of revenue.
4. Accounts Receivable (Current and Non-current)
The Company expects to receive the $15.5 million of current accounts receivable at December 31, 2016 no later than July 2017. The Company expects to receive payment of approximately $15.7 million of its non-current accounts receivable in 2018 and the remainder in 2019.
A significant portion of the Company’s accounts receivable balance (current and noncurrent) is due from Toshiba Corporation. In December 2016, Toshiba announced that it expects to write-down its nuclear business by several billion dollars. The write-down could result in negative shareholder equity, which could make it difficult for Toshiba to obtain funding if needed. At this time, based on its review of currently available information, the Company believes that no allowance for doubtful accounts is required with regards to its receivable from Toshiba. The Company continues to evaluate its position as more information becomes available.
5. Intangible Assets and Goodwill
2015 Impairment of Intangibles and Goodwill
In November 2015, as a result of the non-infringement verdicts in the Google Litigation and Apple Litigation (see Note 8), the Company revised its projected cash flows for its intangible assets, triggering an impairment analysis of its intangible assets and goodwill. The Company records an impairment charge on its intangible assets if it determines that their carrying value may not be recoverable. The carrying value is not recoverable if it exceeds the undiscounted cash flows resulting from the use of the asset and its eventual disposition. When the Company determines that the carrying value of its intangible assets may not be recoverable, the Company measures the potential impairment based on a projected discounted cash flow method using a discount rate determined by its management to be commensurate with the risk inherent in its current business model. An impairment loss is recognized only if the carrying amount of the intangible assets exceeds its estimated fair value. An impairment charge is recorded to reduce the pre-impairment carrying amount of the intangible assets to their estimated fair value.
Determining the fair value is highly judgmental in nature and requires the use of significant estimates and assumptions considered to be Level 3 fair value inputs, including anticipated future revenue opportunities, operating margins, and discount rates, among others. The estimated fair value of the intangible assets was determined based on the income approach, as it was deemed to be most indicative of the Company's fair value in an orderly transaction between market participants. Under the income approach the Company determined fair value based on estimated
37
future cash flows resulting from licensing its intangible assets. The estimated cash flows were discounted by an estimated weighted-average cost of capital which reflects the overall level of inherent risk of the Company and the rate of return an outside investor would expect to earn. Upon completion of the analysis, the Company concluded that the estimated fair value of its intangible assets was less than their carrying amount and recorded an impairment charge of $82.3 million, which is included in "Impairment of intangibles and goodwill" in the accompanying Consolidated Statements of Operations.
The Company then evaluated the carrying value of its goodwill by estimating the fair value of the reporting unit through the use of discounted cash flow models, which required management to make significant judgments as to the estimated future cash flows resulting from licensing its intangible assets. Upon completion of the analysis, the Company concluded that the estimated fair value of its reporting unit was less than its carrying amount and recorded an additional $21.2 million impairment charge related to goodwill in the fourth quarter of 2015.
2014 Impairment of Intangibles and Goodwill
In January 2015, the Company suspended further development of the Provitro™ technology as it had been unable to identify near-term opportunities to commercialize the technology. The Company determined that this suspension provided additional evidence about conditions that existed prior to December 31, 2014, triggering an impairment analysis of the intangibles associated with its Provitro asset group. In its impairment analysis, the Company compared the carrying amount of the Provitro™ technology to the future undiscounted net cash flows expected to be generated by the Provitro™ technology. The Company concluded that the anticipated undiscounted cash flows from the Provitro™ technology did not exceed the carrying value of the Provitro™ technology, and the Company recorded a $10.5 million non-cash impairment charge in its results of operations for the year ended December 31, 2014. Additionally, as of December 31, 2014, the company determined that the goodwill related to its acquisition of Provitro was impaired and recorded a $0.5 million non-cash impairment charge for the year ended December 31, 2014.
Intangible Assets
The following table presents details of the Company’s intangible assets and related amortization (in thousands):
|
|
|
December 31, 2016 |
|
|
December 31, 2015 |
|
||
|
Cost: |
|
|
|
|
|
|
|
|
|
Patents |
|
$ |
65,796 |
|
|
$ |
67,096 |
|
|
Customer relationships |
|
|
1,804 |
|
|
|
1,804 |
|
|
Total cost |
|
|
67,600 |
|
|
|
68,900 |
|
|
Accumulated amortization: |
|
|
|
|
|
|
|
|
|
Patents |
|
|
(61,080 |
) |
|
|
(52,719 |
) |
|
Customer relationships |
|
|
(1,804 |
) |
|
|
(1,804 |
) |
|
Total accumulated amortization |
|
|
(62,884 |
) |
|
|
(54,523 |
) |
|
Intangible assets, net |
|
$ |
4,716 |
|
|
$ |
14,377 |
|
At December 31, 2016, the Company determined that the expected period of benefit of its patents is approximately two years.
The Company has used, and may continue to use, different structures and forms of consideration for its acquisitions of intangible assets. Acquisitions may be consummated through the use of cash, equity, seller financing, third party debt, earn-out obligations, revenue sharing, profit sharing, or some combination of these types of consideration. Consequently, the acquisition values reflected in the Company’s investing activities may represent lower amounts than would be reflected, for example, in a situation where cash alone was utilized to complete the acquisition.
38
During the year ended December 31, 2015, the Company further enhanced its existing memory and storage technologies patent portfolio for an additional $2.0 million. No patents were purchased during the years ended December 31, 2014 and 2016.
During the years ended December 31, 2015 and 2014, the Company sold certain patents in several transactions and has included the gross proceeds in revenue. No patents were sold during the year ended December 31, 2016. Cost associated with the patents sold, including any remaining net book value, are included in cost of revenues in the Company’s consolidated statements of operations. Certain of the patents sold, as well as certain of those licensed, were subject to an obligation to pay a substantial portion of the net proceeds to a third party. These costs are also included in cost of revenues. In future periods, these third party payments as a percentage of revenues may vary significantly based on the structure utilized for any given acquisition. Costs associated with patents sold during the years ended December 31, 2016, 2015 and 2014 were as follows (in thousands):
|
|
|
Year ended December 31, |
|
|||||||||
|
|
|
2016 |
|
|
2015 |
|
|
2014 |
|
|||
|
Cost of patents sold |
|
$ |
— |
|
|
$ |
138 |
|
|
$ |
794 |
|
The Company periodically abandons patents that are not part of existing licensing programs or for which the Company has determined that it would no longer allocate resources to their maintenance and enforcement. Costs associated with the abandonment of patents, including any remaining net book value, are included in patent administration and related costs in the Company’s consolidated statements of operations and were as follows for the years ended December 31, 2016, 2015 and 2014 (in thousands):
|
|
|
Year ended December 31, |
|
|||||||||
|
|
|
2016 |
|
|
2015 |
|
|
2014 |
|
|||
|
Cost associated with the abandonment and/or disposition of patents |
|
$ |
163 |
|
|
$ |
958 |
|
|
$ |
2,765 |
|
Amortization expense related to purchased intangible assets, reported as amortization of intangibles in the consolidated statements of operations, for the years ended December 31, 2016, 2015 and 2014 were as follows (in thousands):
|
|
|
Year ended December 31, |
|
|||||||||
|
|
|
2016 |
|
|
2015 |
|
|
2014 |
|
|||
|
Amortization of intangibles |
|
$ |
9,498 |
|
|
$ |
13,939 |
|
|
$ |
15,929 |
|
The estimated future amortization expense of purchased intangible assets as of December 31, 2016 is as follows (in thousands):
|
Year ending December 31, |
|
Amount |
|
|
|
2017 |
|
$ |
2,358 |
|
|
2018 |
|
|
2,358 |
|
|
Total |
|
$ |
4,716 |
|
6. Accrued expenses
The following table summarizes accrued expenses (in thousands):
|
|
|
December 31, 2016 |
|
|
December 31, 2015 |
|
||
|
Accrued payroll and related expenses |
|
$ |
1,134 |
|
|
$ |
1,742 |
|
|
Accrued legal, professional and other expenses |
|
|
538 |
|
|
|
2,550 |
|
|
Accrued revenue share obligations |
|
|
4,606 |
|
|
|
— |
|
|
|
|
$ |
6,278 |
|
|
$ |
4,292 |
|
39
7. Other non-current liabilities
At December 31, 2016, other non-current liabilities, primarily consisting of revenue share obligations, are estimated to be payable as follows (in thousands):
|
Fiscal 2018 |
|
$ |
7,362 |
|
|
Fiscal 2019 |
|
|
434 |
|
|
|
|
$ |
7,796 |
|
8. Commitments and Contingencies
Lease and Commitments— The Company has operating lease agreements for its main office in Kirkland, Washington, and its office in Finland. The Company terminated its lease for office space in Plano, Texas effective June 30, 2016. Total rental expense included in general and administrative expenses in the Company’s consolidated statements of operations for the years ended December 31, 2016, 2015 and 2014 was as follows (in thousands):
|
|
|
Year ended December 31, |
|
|||||||||
|
|
|
2016 |
|
|
2015 |
|
|
2014 |
|
|||
|
Rent expense |
|
$ |
245 |
|
|
$ |
793 |
|
|
$ |
662 |
|
As of December 31, 2016, future minimum payments under the Company’s lease agreements were as follows (in thousands):
|
|
|
Operating leases |
|
|
|
2017 |
|
$ |
339 |
|
|
2018 |
|
|
348 |
|
|
2019 |
|
|
205 |
|
|
Total minimum payments |
|
$ |
892 |
|
Litigation—In the opinion of management, except for those matters described below and elsewhere in this report, to the extent so described, litigation, contingent liabilities and claims against the Company in the normal course of business are not expected to involve any judgments or settlements that would be material to the Company’s financial condition, results of operations or cash flows.
ContentGuard Enforcement Actions—In late 2013 and early 2014, in the Eastern District of Texas, ContentGuard filed patent infringement lawsuits against various manufacturers of mobile communication and computing devices, through which ContentGuard alleged that these manufacturers infringed and continue to infringe nine of ContentGuard’s patents by making, using, selling or offering for sale their devices. The lawsuits culminated in two trials in the Fall of 2015: one against Apple, Inc. (the “Apple Litigation”) and the other against Google, Inc. and manufacturers of Android devices (the “Google Litigation”).
Settlements. In late 2015 and early 2016, ContentGuard agreed to license its patents to Amazon and DirecTV, thereby settling its claims against those two parties and releasing them from the Apple Litigation and Google Litigation.
Google Litigation Verdict. On September 23, 2015, a jury in the Google Litigation found that the patents asserted against Google and Samsung are valid, but that products accused in the Google Litigation do not infringe the patents. The judge entered judgment consistent with the verdict in October 2015. The non-infringement decision, if not overturned on appeal, applies to all defendants that manufacture, sell or distribute Android devices that run Google Play services.
Apple Litigation Verdict. On November 20, 2015, a jury in the Apple Litigation found that the patents asserted against Apple in the Apple Litigation are valid, but that Apple products accused in the Apple Litigation do not infringe the patents. The judge entered judgment consistent with the verdict in December 2015.
40
Appeals. ContentGuard appealed the juries’ findings in the Google Litigation and Apple Litigation to the Federal Circuit Court, which designated the appeals as companion cases. As such, the same panel of three judges will hear and decide both appeals. Briefing was completed in February 2017, and the Company anticipates that oral arguments will be heard in early June 2017. The Company cannot predict the outcome of the appeals.
IPR and CBM Petitions. In December 2014, Apple and Google filed a total of 35 petitions with the USPTO, through which Apple and Google challenged the validity of all nine patents asserted in the Apple Litigation and Google Litigation. The USPTO terminated all but one petition. The lone remaining petition, relating to patent number 7,774,280, went to trial and was resolved in ContentGuard’s favor. Google appealed the trial finding to the Federal Circuit Court. The Company cannot predict the outcome of the appeal.
ZTE —In early 2012, ContentGuard and its subsidiaries filed lawsuits in United States and German courts, alleging that ZTE Corporation, ZTE (USA) Inc. and ZTE Deutschland GmbH (collectively “ZTE”) infringed and continue to infringe ContentGuard patents by making, using, selling or offering for sale certain mobile communication and computing devices. In response, ZTE filed a nullity action against two of the patents and an opposition proceeding against the third patent. ZTE prevailed in the opposition proceeding, resulting in the revocation of one European patent, which ContentGuard has appealed. The infringement and nullity proceedings in Germany, along with all U.S. court actions, were “put to rest” or stayed as the result of a standstill agreement signed by ContentGuard and ZTE in December 2013. The standstill agreement has been extended through the end of 2017.
MTL Enforcement Actions—In December 2016, the Company’s wholly-owned subsidiary, Memory Technologies LLC (“MTL”) filed patent infringement claims against SanDisk LLC and certain affiliated companies (collectively, “SanDisk”) at the International Trade Commission (the “ITC”) and in the Federal District Court for the Central District of California (the “District Court”), through which MTL alleged that SanDisk infringed and continues to infringe MTL’s patents.
ITC Action. In its ITC filing, MTL requested that the ITC commence an investigation against SanDisk to bar the unlawful importation into the United States, the sale for importation, and the sale within the United States after importation of secure digital cards, microSD cards and components of such cards. The ITC instituted the investigation in January 2017, and MTL is cooperating with the investigation.
District Court Action. In parallel with the ITC Action, MTL filed a District Court action against SanDisk alleging infringement of eight patents and seeking monetary damages for patent infringement. The District Court action has been stayed pending resolution of the ITC Action.
The Company is unable to anticipate the timing or outcome of the ITC Action and the District Court Action.
9. Shareholders’ Equity
Common Stock—The Company’s Articles of Incorporation authorizes two classes of common stock, Class A and Class B. The rights of the holders of shares of Class A common stock and Class B common stock are identical, except with respect to voting and conversion. Holders of shares of Class A common stock are entitled to one vote per share. Holders of shares of Class B common stock are entitled to ten votes per share. The Class B common stock is convertible at any time at the option of its holder into shares of Class A common stock. Each share of Class B common stock is convertible into one share of Class A common stock. Additionally, subject to certain exceptions, shares of Class B common stock will automatically convert into shares of Class A common stock if the shares of Class B common stock are sold or transferred. Class A common stock is not convertible. Eagle River Satellite Holdings, LLC, the Company’s controlling shareholder, together with its affiliates Eagle River Investments, LLC, Eagle River, Inc. and Eagle River Partners, LLC held an economic interest of approximately 33.3% and a voting interest of approximately 65.0% in the Company as of December 31, 2016.
Stock Incentive Plan—On November 14, 2012, the Company’s shareholders approved the Pendrell Corporation 2012 Equity Incentive Plan (the “2012 Plan”). Effective upon the approval of the 2012 Plan, the Company’s 2000 Stock Incentive Plan, as amended and restated (the “2000 Plan”) was terminated. No additional awards will be granted under the 2000 Plan.
41
The purpose of the 2012 Plan is to assist the Company in securing and retaining the services of skilled employees, directors, consultants and/or advisors of the Company and to provide incentives for such individuals to exert maximum efforts toward the Company’s success. The 2012 Plan allows for the grant of stock options, stock appreciation rights, performance stock awards, performance cash awards, restricted stock awards, restricted stock unit awards and other stock awards (collectively, “Awards”) to employees, directors, consultants and/or advisors who provide services to the Company or its subsidiaries.
Under the 2012 Plan, the aggregate number of shares of Class A common stock that may be issued pursuant to Awards from and after the effective date of the 2012 Plan will not exceed, in the aggregate, the sum of 3,795,254 shares, plus any shares subject to outstanding stock awards granted under the 2000 Plan that (i) expire or terminate for any reason prior to exercise or settlement; (ii) are forfeited, canceled or otherwise returned due to the failure to meet a condition required to vest such shares; or (iii) are reacquired, withheld or not issued to satisfy a tax withholding obligation in connection with an award. As of December 31, 2016, 2,449,419 shares were reserved and remain available for grant under the 2012 Plan.
Stock-Based Compensation—The Company records stock-based compensation based on the estimated fair value on the date of grant and recognizes compensation cost over the requisite service period for awards expected to vest. The Company estimates its forfeiture rate for Awards based on the Company’s historical rate of forfeitures due to terminations and expectations for forfeitures in the future. The Company’s estimated forfeiture rate was 5% for the years ended December 31, 2016, 2015 and 2014.
Stock-based compensation expense included in the Company’s consolidated statements of operations for the years ended December 31, 2016, 2015 and 2014 was as follows (in thousands):
|
|
|
Year ended December 31, |
|
|||||||||
|
|
|
2016 |
|
|
2015 |
|
|
2014 |
|
|||
|
Stock options (1) |
|
$ |
1,193 |
|
|
$ |
2,236 |
|
|
$ |
7,268 |
|
|
Restricted stock awards (1) (2) |
|
|
2,231 |
|
|
|
2,271 |
|
|
|
2,137 |
|
|
Total stock-based compensation expense |
|
$ |
3,424 |
|
|
$ |
4,507 |
|
|
$ |
9,405 |
|
|
(1) |
On November 19, 2014, Benjamin G. Wolff resigned from his positions as President and Chief Executive Officer of the Company. The Company entered into a separation agreement in accordance with the terms of Mr. Wolff’s Amended and Restated Employment Letter Agreement (the "Agreement"). The Agreement provided for the vesting of all options, shares of restricted stock ("RSAs") and restricted stock units ("RSUs") in which Mr. Wolff would have vested had he remained actively employed by the Company through the second anniversary of his resignation, excluding any unvested performance-based RSAs or performance-based RSUs. The Agreement also provided for an extension of the exercise period for Mr. Wolff’s vested stock options until December 15, 2015. The extension of the exercise period is considered a modification and resulted in additional stock-based compensation expense of $0.7 million, as determined using a Black-Scholes model, which was recognized on the modification date as the options were vested pursuant to the Agreement. The accelerated vesting of the options, RSUs and RSAs resulted in $2.1 million of additional stock-based compensation expense in the year ended December 31, 2014. |
|
(2) |
Stock-based compensation expense for the year ended December 31, 2015 and 2014, includes $0.2 million and $0.8 million of expense, respectively, related to 250,000 Class A common stock restricted stock awards that are required to be treated as a liability. The Company settled the related liability with a $2.5 million payment in April 2015 and no further expense has been incurred. |
42
At December 31, 2016, the balance of stock-based compensation cost to be expensed in future years related to unvested stock-based awards, as adjusted for expected forfeitures, is as follows (in thousands):
|
2017 (1) |
|
$ |
2,823 |
|
|
2018 (1) |
|
|
1,859 |
|
|
2019 and thereafter |
|
|
— |
|
|
|
|
$ |
4,682 |
|
|
(1) |
Future expense does not include expense related to 0.1 million performance-based stock options and 0.2 million performance-based restricted stock awards granted in 2015, as these awards vest upon the achievement of certain performance milestones for which the related performance targets have yet to be established. The fair value of these awards will not be known until the date the performance targets are established at which point expensing will commence. |
The weighted average period over which the unearned stock-based compensation expense is expected to be recognized is approximately 1.75 years.
Stock Options and Stock Appreciation Rights—The Company has granted stock options and stock appreciation rights to employees, directors, consultants and advisors in connection with their service to the Company. Stock options to purchase the Company’s Class A common stock are granted at the fair market value of the stock on the date of grant. The Company has both service-based stock options and performance-based stock options. The majority of service-based stock options granted to employees become exercisable over a four year period, while stock options granted to non-employee directors generally vest over one year. Performance-based stock options become exercisable if the Company achieves specified performance goals during the performance period and the grantee remains employed during the subsequent vesting period. Stock options generally expire 10 years after the date of grant or up to three months after termination of employment, whichever occurs earlier. There are no stock appreciation rights currently outstanding.
The weighted average fair value of stock options granted during the years ended December 31, 2016, 2015 and 2014 was estimated using the Black-Scholes Model with the following assumptions:
|
|
|
Year ended December 31, |
|
|||||||||
|
|
|
2016 |
|
|
2015 |
|
|
2014 |
|
|||
|
Weighted average expected volatility |
|
|
53 |
% |
|
|
48 |
% |
|
|
55 |
% |
|
Weighted average risk-free interest rate |
|
|
1.2 |
% |
|
|
1.9 |
% |
|
|
1.9 |
% |
|
Expected dividend yield |
|
|
0 |
% |
|
|
0 |
% |
|
|
0 |
% |
|
Weighted average expected term in years |
|
|
5.5 |
|
|
|
6.0 |
|
|
|
6.2 |
|
|
Weighted average estimated fair value per option granted |
|
$ |
3.32 |
|
|
$ |
4.70 |
|
|
$ |
7.90 |
|
The assumptions used to calculate the fair value are evaluated and revised, as necessary, to reflect market conditions and the Company’s experience.
The Company’s expected stock price volatility rate is based on a peer group, which the Company believes is a reasonable representation of the Company’s business direction and expected future volatility as an IP investment and asset management business.
The risk-free interest rate is based upon U.S. Treasury bond interest rates appropriate for the term of the Company’s employee stock options. The expected dividend yield is based on the Company’s history and expectation of dividend payments. The expected term has been estimated using the simplified method which permit entities, under certain circumstances, to continue to use the simplified method in developing estimates of the expected term of “plain-vanilla” share options.
43
The Company’s stock option activity for the year ended December 31, 2016 is summarized as follows:
|
|
|
Number of options |
|
|
Weighted average exercise price |
|
|
Weighted average remaining life (in years) |
|
|||
|
Outstanding at December 31, 2015 |
|
|
1,731,732 |
|
|
$ |
16.21 |
|
|
|
|
|
|
Granted (1) |
|
|
24,000 |
|
|
|
6.91 |
|
|
|
|
|
|
Forfeited |
|
|
(450,367 |
) |
|
|
17.19 |
|
|
|
|
|
|
Outstanding at December 31, 2016 (2) |
|
|
1,305,365 |
|
|
$ |
15.70 |
|
|
|
6.72 |
|
|
Exercisable at December 31, 2016 (2) |
|
|
800,140 |
|
|
$ |
16.97 |
|
|
|
5.95 |
|
|
Vested and expected to vest at December 31, 2016 (2) |
|
|
1,256,354 |
|
|
$ |
15.64 |
|
|
|
6.81 |
|
|
(1) |
All options granted were to members of the Company’s board of directors. |
|
(2) |
Aggregate intrinsic value represents the amount by which the market value of the underlying stock exceeded the exercise price of outstanding options, before applicable income taxes and represents the amount optionees would have realized if all in-the-money options had been exercised on December 31, 2016. As of December 31, 2016, the aggregate intrinsic values of stock options outstanding, exercisable, and vested and expected to vest were all zero as the closing stock price of the Company’s stock was lower than the exercise prices of its outstanding options. |
The total fair value of options which vested during the years ended December 31, 2016, 2015 and 2014 was approximately $2.0 million, $2.5 million and $7.3 million, respectively.
The following table summarizes significant ranges of outstanding and exercisable stock options as of December 31, 2016:
|
|
|
Outstanding stock options |
|
|
Exercisable stock options |
|
||||||||||||||
|
Range of exercise prices |
|
Number of options |
|
|
Weighted average exercise price |
|
|
Weighted average remaining life (in years) |
|
|
Number of options |
|
|
Weighted average exercise price |
|
|||||
|
$ 6.91—$12.90 |
|
|
268,125 |
|
|
$ |
11.00 |
|
|
|
6.37 |
|
|
|
244,125 |
|
|
$ |
11.40 |
|
|
$12.91—$13.25 |
|
|
176,090 |
|
|
|
13.10 |
|
|
|
8.38 |
|
|
|
88,050 |
|
|
|
13.10 |
|
|
$13.26—$14.05 |
|
|
400,000 |
|
|
|
13.40 |
|
|
|
8.52 |
|
|
|
100,000 |
|
|
|
13.40 |
|
|
$14.06—$19.60 |
|
|
232,500 |
|
|
|
16.24 |
|
|
|
5.75 |
|
|
|
167,002 |
|
|
|
16.60 |
|
|
$19.61—$42.20 |
|
|
228,650 |
|
|
|
26.67 |
|
|
|
4.06 |
|
|
|
200,963 |
|
|
|
27.49 |
|
|
|
|
|
1,305,365 |
|
|
$ |
15.70 |
|
|
|
6.72 |
|
|
|
800,140 |
|
|
$ |
16.97 |
|
Restricted Stock Awards—The Company has granted restricted stock awards to employees, directors and consultants in connection with their service to the Company. The Company’s stock grants can be categorized as either service-based awards, performance-based awards, and/or market-based awards.
44
The Company’s restricted stock award activity for the year ended December 31, 2016 is summarized as follows:
|
|
|
Number of restricted stock awards |
|
|
Weighted average grant date fair value |
|
||
|
Unvested—December 31, 2015 |
|
|
1,053,075 |
|
|
$ |
8.40 |
|
|
Granted (1) |
|
|
78,083 |
|
|
|
5.46 |
|
|
Vested |
|
|
(200,856 |
) |
|
|
10.52 |
|
|
Forfeited |
|
|
(39,547 |
) |
|
|
10.32 |
|
|
Unvested—December 31, 2016 |
|
|
890,755 |
|
|
$ |
8.23 |
|
|
(1) |
Represents shares issued to the Company’s Board of Directors as compensation for service. These awards have a grant date fair value of $0.4 million and vest upon issuance. |
During the year ended December 31, 2016, 122,773 stock awards vested as a result of the Company’s employees achieving service and performance targets. Certain holders of the vested RSAs and RSUs exercised their right to have their awards net-share settled to cover statutory employee taxes related to the vesting of the RSAs and RSUs. The settlement of these awards resulted in the Company repurchasing and/or cancelling 6,352 shares for approximately $40,000.
10. Gain on Contingencies
During 2012, as part of the Company’s exit from the satellite business, the Company sold its MEO Assets that had been in storage for nominal consideration. Under the sales agreement, the Company was entitled to a substantial portion of any proceeds that the buyer generated from the resale of the MEO Assets. In January 2015, the buyer resold the MEO Assets and the Company received two of three scheduled payments for these assets in 2015, resulting in the recognition of $3.9 million gain on contingency in the year ended December 31, 2015.
The Company received the final scheduled payment in April 2016, resulting in the recognition of a $2.0 million gain on contingency in the year ended December 31, 2016. Due to the uncertainty of collection at December 31, 2015, the Company did not recognize the gain generated by the third scheduled payment for the MEO Assets in 2015.
In March 2012, the Company asserted claims in arbitration in London against the J&J Group to recover approximately $2.7 million in costs that J&J was required to reimburse the Company pursuant to a MEO satellite asset purchase agreement that was signed in April 2011. During 2011, the Company recorded a receivable of $2.7 million to reflect the J&J Group’s reimbursement obligation and established a corresponding reserve in the full amount of the receivable pending resolution of the dispute. In November 2012, the Company obtained an arbitration judgment award for approximately $4.0 million, which included the requested reimbursement plus costs and fees of approximately $1.3 million. J&J Group submitted multiple appeals to the UK courts, and in December 2014, the Company obtained an enforcement judgment against J&J Group, and commenced collection efforts. In November 2015, the Company entered into a settlement agreement with the J&J Group whereby it received approximately $1.6 million, net of collection costs, in full and final settlement of all claims against the J&J Group which is included in gain on contingencies in the statements of operations for the year ended December 31, 2015.
Additionally, the Company recorded a gain of $0.5 million during 2015 as a result of the release of a tax indemnification liability associated with the acquisition of Ovidian in June 2011.
45
11. Income Taxes
The Company’s income tax expense for the years ended December 31, 2016, 2015 and 2014 consists of the following (in thousands):
|
|
|
Year ended December 31, |
|
|||||||||
|
|
|
2016 |
|
|
2015 |
|
|
2014 |
|
|||
|
United States—deferred |
|
$ |
— |
|
|
$ |
(1,497 |
) |
|
$ |
33 |
|
|
Foreign—current |
|
|
— |
|
|
|
4,128 |
|
|
|
6,270 |
|
|
|
|
$ |
— |
|
|
$ |
2,631 |
|
|
$ |
6,303 |
|
For the year ended December 31, 2016, the Company did not record a provision for U.S. federal income tax due to available tax loss carryforwards. During the year ended December 31, 2015, as a result of the impairment of certain indefinite-lived intangibles, the deferred tax liability associated with these intangibles was decreased, resulting in a federal tax benefit of $1.5 million.
For the years ended December 31, 2015 and 2014, the Company recorded tax provisions of $4.1 million and $6.3 million, respectively, related to foreign taxes withheld on revenue generated from license agreements executed with third party licensees domiciled in a foreign jurisdiction. The Company had no foreign taxes withheld during the year ended December 31, 2016. In general, foreign taxes withheld may be claimed as a deduction on future U.S. corporate income tax returns, or as a credit against future U.S. federal income tax liabilities, subject to certain limitations. However, due to uncertainty regarding the Company’s ability to utilize the deduction or credit resulting from the foreign withholding, the Company established a full valuation allowance against the related deferred tax asset.
A reconciliation of the federal statutory income tax rate of 34% to the Company’s effective income tax rate is as follows:
|
|
|
Year ended December 31, |
|
|||||||||
|
|
|
2016 |
|
|
2015 |
|
|
2014 |
|
|||
|
Statutory tax rate |
|
|
34.00 |
% |
|
|
34.00 |
% |
|
|
34.00 |
% |
|
Change in valuation allowance |
|
|
(59.30 |
) |
|
|
(22.59 |
) |
|
|
(95.75 |
) |
|
Release of uncertain tax position |
|
|
— |
|
|
|
— |
|
|
|
62.77 |
|
|
Foreign withholding taxes |
|
|
— |
|
|
|
(2.37 |
) |
|
|
(7.98 |
) |
|
Goodwill impairment |
|
|
— |
|
|
|
(6.07 |
) |
|
|
— |
|
|
Stock-based compensation |
|
|
10.24 |
|
|
|
(3.23 |
) |
|
|
— |
|
|
Loss on sale of subsidiary |
|
|
13.70 |
|
|
|
— |
|
|
|
— |
|
|
Other |
|
|
1.36 |
|
|
|
(2.03 |
) |
|
|
(5.20 |
) |
|
Effective tax rate |
|
|
0 |
% |
|
|
(2.29 |
)% |
|
|
(12.16 |
)% |
46
The significant components of the Company’s net deferred tax assets and liabilities are as follows (in thousands):
|
|
|
December 31, 2016 |
|
|
December 31, 2015 |
|
||
|
Deferred tax assets: |
|
|
|
|
|
|
|
|
|
Net operating losses |
|
$ |
941,163 |
|
|
$ |
956,181 |
|
|
Basis difference in Liquidating Trust |
|
|
16,955 |
|
|
|
16,894 |
|
|
Accrued expenses and other |
|
|
12,336 |
|
|
|
10,380 |
|
|
Total deferred tax assets |
|
|
970,454 |
|
|
|
983,455 |
|
|
Valuation allowance |
|
|
(970,454 |
) |
|
|
(981,096 |
) |
|
Net deferred tax assets |
|
$ |
— |
|
|
$ |
2,359 |
|
|
Deferred tax liabilities: |
|
|
|
|
|
|
|
|
|
Intangibles |
|
$ |
— |
|
|
$ |
(2,359 |
) |
|
Total deferred tax liabilities |
|
$ |
— |
|
|
$ |
(2,359 |
) |
|
Net deferred tax liabilities |
|
$ |
— |
|
|
$ |
— |
|
As of December 31, 2016, the Company had federal tax net operating loss carryforwards in the United States (“NOLs”) of approximately $2.5 billion. A significant portion of the NOL was generated when the Company disposed of its satellite business and transferred the MEO-related international subsidiaries to a liquidating trust. The Company believes the NOL can be carried forward to offset certain future taxable income that may be generated during the NOL carryforward period. The NOL carryforward period begins to expire in 2025 with a significant portion expiring in 2032. The use of the NOL will be significantly limited if the Company undergoes a Tax Ownership Change under Section 382 of the Internal Revenue Code (“Tax Ownership Change”). Broadly, the Company will have a Tax Ownership Change if, over a three year testing period, the portion of all stock of the Company, by value, owned by one or more 5% shareholder increases by more than 50 percentage points. For purposes of this test, shareholders that own less than 5% of the stock of the Company are aggregated into one or more separate “public groups”, each of which is treated as a 5% shareholder. In general, shares traded within a public group are not included in the Tax Ownership Change test. As discussed below, the Board of Directors adopted a Tax Benefits Preservation Plan designed to preserve shareholder value and the value of certain tax assets primarily associated with NOLs. As of December 31, 2016, the Company also had tax loss carryforwards in the state of California of approximately $1.3 billion, a portion of which will expire in 2017. A significant portion of the California loss carryforward was generated when the Company disposed of its satellite business and will expire in 2032. The impacts of a Tax Ownership Change, discussed above, would apply to the California tax losses as well.
For all years presented, the Company has considered all available evidence, including the history of tax losses and the uncertainty around future taxable income. Based on the weight of the evidence available at December 31, 2016, a valuation allowance has been recorded to reduce the value of the Company’s DTA, including the DTA associated with the NOL, to an amount that is more likely than not to be realized.
As of December 31, 2016, the Company had unrecognized tax benefits of $15.3 million related to income tax refund claims filed in various jurisdictions. Due to the uncertain nature of the refund claims, the uncertain tax positions have not been recorded as an income tax benefit.
A reconciliation of the beginning and ending amount of unrecognized tax benefits is as follows (in thousands):
|
|
|
December 31, |
|
|||||||||
|
|
|
2016 |
|
|
2015 |
|
|
2014 |
|
|||
|
Beginning of period |
|
$ |
15,594 |
|
|
$ |
5,132 |
|
|
$ |
37,665 |
|
|
Additions for tax positions taken during the current period |
|
|
— |
|
|
|
10,462 |
|
|
|
— |
|
|
Reductions for tax positions taken during prior periods |
|
|
— |
|
|
|
— |
|
|
|
(32,533 |
) |
|
Exchange rate fluctuations |
|
|
(271 |
) |
|
|
— |
|
|
|
— |
|
|
End of period |
|
$ |
15,323 |
|
|
$ |
15,594 |
|
|
$ |
5,132 |
|
47
All of the unrecognized tax benefits at December 31, 2016, if fully recognized, would affect the Company’s effective tax rate. The Company estimates that a reduction in its unrecognized tax benefits of approximately $15.3 million may occur within the next twelve months upon resolution of determinations by taxing authorities.
The Company and its subsidiaries file U.S. federal income tax returns and tax returns in various state and foreign jurisdictions. The Company is open to examination for the years ended 2005 and forward with respect to NOLs generated and carried forward from those years. The Company is open to examination by foreign jurisdictions for tax years 2012 forward.
Certain Taxes Payable Irrespective of NOLs—Under the Internal Revenue Code and related Treasury Regulations, the Company may “carry forward” its NOLs in certain circumstances to offset current and future income and thus reduce its federal income tax liability, subject to certain restrictions. To the extent that the NOLs do not otherwise become limited, the Company believes that it will be able to carry forward a significant amount of NOLs. However, these NOLs will not impact all taxes to which the Company may be subject. For instance, state or foreign income taxes and/or revenue based taxes may be payable if the Company’s income or revenue is attributed to jurisdictions that impose such taxes; the Company’s NOLs do not entirely offset its income for alternative minimum tax; and the NOLs will not offset federal personal holding company tax liability that Pendrell or one or more of its corporate subsidiaries may incur. This is not an exhaustive list, but merely illustrative of the types of taxes to which the Company’s NOLs are not applicable.
Personal Holding Company Determination—The Internal Revenue Code imposes an additional tax on the undistributed income of a Personal Holding Company (“PHC”). In general, a corporation will be classified as a PHC if 50% or more of its outstanding shares, measured by value, are owned directly or indirectly by five or fewer individual shareholders at any time during the second half of the year (“Concentrated Ownership”) and at least 60% of its adjusted ordinary gross income is Personal Holding Company Income (“PHCI”). Broadly, PHCI includes items such as dividends, interest, rents and royalties, among others. For a corporate subsidiary, Concentrated Ownership is determined by reference to ownership of the parent corporation(s), and the subsidiary’s income is subject to additional tests to determine whether its income renders the subsidiary a PHC. If a corporation is a PHC, generates positive net PHCI and does not distribute to its shareholders a proportionate dividend in the full amount of the net PHCI, then the undistributed net PHCI is taxed (at 20% under current law).
Due to the significant number of shares held by the Company’s largest shareholders and the type of income that the Company generates, the Company must continually assess share ownership of Pendrell and its consolidated subsidiary ContentGuard to determine whether or not there is Concentrated Ownership of either corporation. For 2016, the Company determined that Pendrell, the parent company, met the Concentrated Ownership test, but that ContentGuard has not yet met the Concentrated Ownership test due to the interest held by its minority shareholder. The Company does not expect to have a PHC liability for 2016 because Pendrell did not have undistributed net PHCI. If either Pendrell or ContentGuard is determined to be a PHC in the future, generates net PHCI, and does not distribute to its shareholders a proportionate dividend in the full amount of the net PHCI, then the undistributed net PHCI will be taxed.
Tax Benefits Preservation Plan—Effective January 29, 2010, the Board of Directors adopted the Tax Benefits Preservation Plan (“Tax Benefits Plan”) to help the Company preserve its ability to utilize fully its NOLs and to help preserve potential future NOLs. As discussed above, if the Company experiences a “Tax Ownership Change,” as defined in Section 382 of the Internal Revenue Code, the Company’s ability to use the NOLs could be significantly limited.
The Tax Benefits Plan is intended to act as a deterrent to any person or group acquiring, without the approval of the Company’s Board of Directors, beneficial ownership of 4.9% or more of the Company’s securities, defined to include: (i) shares of its Class A common stock and Class B common stock, (ii) shares of its preferred stock, (iii) warrants, rights, or options to purchase its securities, and (iv) any interest that would be treated as “stock” of the Company for purposes of Section 382 or pursuant to Treasury Regulation § 1.382-2T(f)(18).
48
Holders of 4.9% or more of the Company’s securities outstanding as of the close of business on January 29, 2010 will not trigger the Tax Benefits Plan so long as they do not (i) acquire additional securities constituting one-half of one percent (0.5%) or more of the Company’s securities outstanding as of the date of the Tax Benefits Plan (as adjusted to reflect any stock splits, subdivisions and the like), or (ii) fall under 4.9% ownership of the Company’s securities and then re-acquire securities that increase their ownership to 4.9% or more of the Company’s securities. The Board of Directors may exempt certain persons whose acquisition of securities is determined by the Board of Directors not to jeopardize the Company’s tax benefits or to otherwise be in the best interest of the Company and its shareholders. The Board of Directors may also exempt certain transactions.
12. Employee Benefits
The Company provides its eligible employees with medical and dental benefits, insurance arrangements to cover death in service, long-term disability and personal accident, as well as a defined contribution retirement plan. Expense related to contributions by the Company under the defined contribution retirement plan included in general and administrative expenses in the Company’s consolidated statements of operations for the years ended December 31, 2016, 2015 and 2014 was as follows (in thousands):
|
|
|
Year ended December 31, |
|
|||||||||
|
|
|
2016 |
|
|
2015 |
|
|
2014 |
|
|||
|
Defined contribution expenses |
|
$ |
80 |
|
|
$ |
201 |
|
|
$ |
264 |
|
13. Related Parties
The Company considers its related parties to be its principal shareholder and its affiliates.
Eagle River Satellite Holdings, LLC (“ERSH”), Eagle River Investments, LLC (“ERI”), Eagle River, Inc. and Eagle River Partners, LLC (“ERP”)—ERSH is the Company’s controlling shareholder. ERSH, together with its affiliates ERI, Eagle River, Inc. and ERP (collectively, “Eagle River”) holds an economic interest of approximately 33.3% of the Company’s outstanding common stock and a voting interest of approximately 65.0% in the Company as of December 31, 2016. Craig O. McCaw, our Executive Chairman, is the sole manager and beneficial member of ERI, which is the sole member of ERSH. Mr. McCaw is the sole shareholder of Eagle River, Inc. and the beneficial member of ERP. Mr. McCaw disclaims beneficial ownership of the securities owned by ERSH, ERI and ERP, except to the extent of any pecuniary interest.
49
14. Quarterly Financial Data (Unaudited)
The following table contains selected unaudited statement of operations information for each quarter of the years ended December 31, 2016 and 2015. The quarterly financial data reflects all normal recurring adjustments necessary for a fair presentation of the information for the periods presented. The operating results for any quarter are not necessarily indicative of results for any future period.
Unaudited quarterly results were as follows (in thousands, except per share data):
|
|
|
Three months ended |
|
||||||||||||||||||||||||||||
|
|
|
March 31, |
|
|
June 30, |
|
|
September 30, |
|
|
December 31, |
|
|||||||||||||||||||
|
|
|
2016 |
|
|
2015 |
|
|
2016 |
|
|
2015 |
|
|
2016 |
|
|
2015 |
|
|
2016 |
|
2015 |
|
||||||||
|
Revenue |
|
$ |
13,500 |
|
|
$ |
25,245 |
|
|
$ |
45,003 |
|
|
$ |
2,147 |
|
|
$ |
— |
|
|
$ |
15,465 |
|
|
$ |
515 |
|
$ |
662 |
|
|
Impairment of intangibles and goodwill |
|
|
— |
|
|
|
— |
|
|
|
— |
|
|
|
— |
|
|
|
— |
|
|
|
— |
|
|
|
— |
|
|
(103,499 |
) |
|
Operating income (loss) |
|
|
4,928 |
|
|
|
1,076 |
|
|
|
21,103 |
|
|
|
(8,021 |
) |
|
|
(5,501 |
) |
|
|
(2,129 |
) |
|
|
(5,313 |
) |
|
(112,061 |
) |
|
Net income (loss) |
|
|
7,110 |
|
|
|
(1,315 |
) |
|
|
21,257 |
|
|
|
(7,990 |
) |
|
|
(5,341 |
) |
|
|
127 |
|
|
|
(5,077 |
) |
|
(108,404 |
) |
|
Net income (loss) attributable to Pendrell |
|
|
6,565 |
|
|
|
(559 |
) |
|
|
21,420 |
|
|
|
(7,558 |
) |
|
|
(5,254 |
) |
|
|
1 |
|
|
|
(4,968 |
) |
|
(101,564 |
) |
|
Basic income (loss) per share attributable to Pendrell (1) |
|
$ |
0.25 |
|
|
$ |
(0.02 |
) |
|
$ |
0.80 |
|
|
$ |
(0.28 |
) |
|
$ |
(0.20 |
) |
|
$ |
— |
|
|
$ |
(0.19 |
) |
$ |
(3.82 |
) |
|
Diluted income (loss) per share attributable to Pendrell (1) |
|
$ |
0.24 |
|
|
$ |
(0.02 |
) |
|
$ |
0.77 |
|
|
$ |
(0.28 |
) |
|
$ |
(0.20 |
) |
|
$ |
— |
|
|
$ |
(0.19 |
) |
$ |
(3.82 |
) |
|
(1) |
Per share amounts for the three months ended September 30, 2015 were less than $0.01. |
15. Subsequent Events
Pursuant to the 2013 agreement under which the Company acquired its memory and storage technologies portfolio, the Company shares a significant portion of the revenue generated from memory patents with the seller. On February 23, 2017, the seller agreed to relinquish its future revenue share in exchange for an up-front payment and future installment payments. This agreement will result in a one-time charge of $3.2 million to expense in the first quarter of 2017 and will significantly reduce the Company’s “cost of revenues” on future memory patent revenue.
Additionally, on March 9, 2017, the Company agreed to redeem 2,432,923 shares of the Company’s Class A common stock from Highland Crusader Offshore Partners, L.P. (“Crusader”) in a private transaction at a price of $6.55 per share, subject to possible adjustment if, on or before August 15, 2017, the Company buys or sells a substantial number of shares of Class A Stock for a higher price.
Further, on March 10, 2017, the Board of Directors (the “Board”) of the Company approved and recommended that the Company’s shareholders approve a 1-for-100 reverse stock split (the “Reverse Split”) of the Company’s shares of Class A Stock and Class B common stock (collectively, the “Common Stock”). If approved by the shareholders at the Company’s 2017 annual meeting of shareholders, the Reverse Split will be effective at the close of trading on June 30, 2017 (the “Effective Date”), the Company’s Articles of Incorporation will be amended as of the Effective Date to reflect the Reverse Split, and any shareholder who holds less than 100 shares of Common Stock immediately prior to the Reverse Split will receive a cash payment in lieu of their fractionalized shares.
50
The Board approved the Reverse Split based on a recommendation from a special committee of the Board’s independent directors (the “Committee”). The Committee recommended the Reverse Split to enable the Company to terminate the registration of the Class A Stock under the Securities Exchange Act of 1934 as amended (the “Exchange Act”), and cease to be a reporting company under the Exchange Act if, after the Reverse Split, there are fewer than 300 record holders of Class A Stock. This de-registration will eliminate the expenses related to the disclosure, reporting and compliance requirements of the Exchange Act and related federal securities laws and regulations. The Board may abandon the proposed Reverse Split at any time prior to the Effective Date if the Board determines that it is no longer in the best interests of the Company or its shareholders. However, if its shareholders approve the Reverse Split, the Company anticipates the termination of its registration and the termination of its Nasdaq listing as soon as practicable after the Effective Date.
On March 10, 2017, at the recommendation of the Committee, the Board also authorized a share repurchase plan (the “Repurchase Plan”) for up to one million shares of Class A Stock. The Repurchase Plan contemplates the repurchase of shares from time to time at prevailing market prices, through open market or privately negotiated transactions, pursuant to one or more plans established pursuant to Rule 10b5-1 under the Exchange Act. The Committee recommended the Repurchase Plan, and the Board approved the Repurchase Plan, to provide shareholders with an opportunity for liquidity prior to the Effective Date of the Reverse Split. The Repurchase Plan does not require the Company to repurchase any minimum number of shares, and may be suspended, discontinued or modified at any time, for any reason and without notice.
51
None.
Evaluation of Disclosure Controls and Procedures
Our chief executive officer and chief financial officer have evaluated our disclosure controls and procedures as of December 31, 2016, as such terms are defined under Rule 13a-15(e) promulgated under the Securities Exchange Act of 1934, as amended (the “Exchange Act”), and have concluded that these disclosure controls and procedures are effective to ensure that the information required to be disclosed by us in the reports that we file or submit under the Exchange Act (as defined in Rules 13a-15(e) and 15d-15(e)) is recorded, processed, summarized and reported within the time periods specified in the SEC’s rules and forms and is accumulated and communicated to our management, including our chief executive officer and chief financial officer, as appropriate to allow timely decisions regarding required disclosure.
Management’s Report on Internal Control over Financial Reporting
Our management is responsible for establishing and maintaining adequate internal control over financial reporting, as defined in Rule 13a-15f of the Exchange Act. These internal controls are designed to provide reasonable assurance that the reported financial information is presented fairly, that disclosures are adequate and that the judgments inherent in the preparation of financial statements are reasonable. There are inherent limitations in the effectiveness of any system of internal control, including the possibility of human error and overriding of controls. Consequently, an effective internal control system can only provide reasonable, not absolute, assurance with respect to reporting financial information.
Management conducted an evaluation of the effectiveness of our internal control over financial reporting based on the framework and criteria established in Internal Control—Integrated Framework (2013), issued by the Committee of Sponsoring Organizations of the Treadway Commission. Based on this evaluation, management concluded that our internal control over financial reporting was effective as of December 31, 2016.
Our internal control over financial reporting as of December 31, 2016 has been audited by Grant Thornton, an independent registered public accounting firm, as stated in their report which appears in “Item 9A—Controls and Procedures” within this Form 10-K.
Changes in Internal Control Over Financial Reporting
There have been no changes in our internal control over financial reporting during the fourth quarter of 2016 that have materially affected, or are reasonably likely to materially affect, our internal control over financial reporting.
52
REPORT OF INDEPENDENT REGISTERED PUBLIC ACCOUNTING FIRM
Board of Directors and Shareholders
Pendrell Corporation
We have audited the internal control over financial reporting of Pendrell Corporation (a Washington corporation) and subsidiaries (the “Company”) as of December 31, 2016, based on criteria established in the 2013 Internal Control—Integrated Framework issued by the Committee of Sponsoring Organizations of the Treadway Commission (COSO). The Company’s management is responsible for maintaining effective internal control over financial reporting and for its assessment of the effectiveness of internal control over financial reporting, included in the accompanying Management’s Report on Internal Control over Financial Reporting. Our responsibility is to express an opinion on the Company’s internal control over financial reporting based on our audit.
We conducted our audit in accordance with the standards of the Public Company Accounting Oversight Board (United States). Those standards require that we plan and perform the audit to obtain reasonable assurance about whether effective internal control over financial reporting was maintained in all material respects. Our audit included obtaining an understanding of internal control over financial reporting, assessing the risk that a material weakness exists, testing and evaluating the design and operating effectiveness of internal control based on the assessed risk, and performing such other procedures as we considered necessary in the circumstances. We believe that our audit provides a reasonable basis for our opinion.
A company’s internal control over financial reporting is a process designed to provide reasonable assurance regarding the reliability of financial reporting and the preparation of financial statements for external purposes in accordance with generally accepted accounting principles. A company’s internal control over financial reporting includes those policies and procedures that (1) pertain to the maintenance of records that, in reasonable detail, accurately and fairly reflect the transactions and dispositions of the assets of the company; (2) provide reasonable assurance that transactions are recorded as necessary to permit preparation of financial statements in accordance with generally accepted accounting principles, and that receipts and expenditures of the company are being made only in accordance with authorizations of management and directors of the company; and (3) provide reasonable assurance regarding prevention or timely detection of unauthorized acquisition, use, or disposition of the company’s assets that could have a material effect on the financial statements.
Because of its inherent limitations, internal control over financial reporting may not prevent or detect misstatements. Also, projections of any evaluation of effectiveness to future periods are subject to the risk that controls may become inadequate because of changes in conditions, or that the degree of compliance with the policies or procedures may deteriorate.
In our opinion, the Company maintained, in all material respects, effective internal control over financial reporting as of December 31, 2016, based on criteria established in the 2013 Internal Control—Integrated Framework issued by COSO.
We also have audited, in accordance with the standards of the Public Company Accounting Oversight Board (United States), the consolidated financial statements of the Company as of and for the year ended December 31, 2016, and our report dated March 15, 2017, expressed an unqualified opinion on those financial statements.
/s/ GRANT THORNTON LLP
Seattle, Washington
March 15, 2017
53
None.
The information required by this item is incorporated by reference to the sections entitled “Election of Directors,” “Executive Officers,” “Section 16(a) Beneficial Ownership Reporting Compliance” and “Corporate Governance” in our Proxy Statement relating to our 2017 Annual Meeting of Shareholders.
The information required by this item is incorporated by reference to the sections entitled “Executive Compensation,” “Director Compensation” and “Corporate Governance-Meetings of the Board, Committees of the Board and Compensation Committee Interlocks and Insider Participation” and “Executive Compensation—Compensation Committee Report” in our Proxy Statement relating to our 2017 Annual Meeting of Shareholders.
|
Item 12. |
Security Ownership of Certain Beneficial Owners and Management and Related Stockholder Matters. |
The information required by this item is incorporated by reference to the sections entitled “Security Ownership of Certain Beneficial Owners and Management” and “Securities Authorized for Issuance Under Equity Compensation Plans” in our Proxy Statement relating to our 2017 Annual Meeting of Shareholders.
The information required by this item is incorporated by reference to the sections entitled “Certain Relationships and Related Transactions” and “Corporate Governance-Independence of the Board of Directors” in our Proxy Statement relating to our 2017 Annual Meeting of Shareholders.
The information required by this item is incorporated by reference to the section entitled “Ratification of the Selection of Our Independent Registered Public Accounting Firm” in our Proxy Statement relating to our 2017 Annual Meeting of Shareholders.
54
|
(a) |
Documents filed as part of this report |
|
|
(1) |
Consolidated financial statements |
The following consolidated financial statements are included in Part II, Item 8 of this report:
|
|
• |
Report of Independent Registered Public Accounting Firm |
|
|
• |
Consolidated Balance Sheets as of December 31, 2016 and 2015 |
|
|
• |
Consolidated Statements of Operations for the years ended December 31, 2016, 2015 and 2014 |
|
|
• |
Consolidated Statements of Changes in Shareholders’ Equity for the years ended December 31, 2016, 2015 and 2014 |
|
|
• |
Consolidated Statements of Cash Flows for the years ended December 31, 2016, 2015 and 2014 |
|
|
• |
Notes to Consolidated Financial Statements |
|
|
(2) |
Financial statement schedules |
All other consolidated financial statements schedules not listed above have been omitted because they are not applicable or are not required or the information required to be set forth in the schedules is included in the consolidated financial statements or the accompanying notes.
|
|
(3) |
Exhibits |
The Exhibits listed in the Index to Exhibits, which appears immediately following the signature page and is incorporated herein by reference, are filed as part of this Form 10-K.
The Company has elected not to include summary information.
55
Pursuant to the requirements of Section 13 or 15(d) of the Securities Exchange Act of 1934, the registrant has duly caused this report to be signed on its behalf by the undersigned, thereunto duly authorized.
|
|
PENDRELL CORPORATION |
|
|
|
(Registrant) |
|
|
|
|
|
|
Date: March 15, 2017 |
By: |
/S/ LEE E. MIKLES |
|
|
|
Lee E. Mikles Chief Executive Officer and President (Principal Executive Officer) |
POWER OF ATTORNEY
KNOW ALL PERSONS BY THESE PRESENTS, that each person whose signature appears below constitutes and appoints Lee E. Mikles, Steven A. Ednie and Timothy M. Dozois, and each of them, as his true and lawful attorneys-in-fact and agents, with full power of substitution for him, and in his name in any and all capacities, to sign any and all amendments to this Annual Report on Form 10-K, and to file the same, with exhibits thereto and other documents in connection therewith, with the Securities and Exchange Commission, granting unto said attorneys-in-fact and agents, and each of them, full power and authority to do and perform each and every act and thing requisite and necessary to be done therewith, as fully to all intents and purposes as he might or could do in person, hereby ratifying and confirming all that said attorneys-in-fact and agents, and any of them or his or her substitute or substitutes, may lawfully do or cause to be done by virtue hereof.
Pursuant to the requirements of the Securities Act of 1934, this report has been signed by the following persons on behalf of the Registrant in the capacities indicated on March 15, 2017:
|
Signature |
|
Title |
|
Date |
|
|
|
|
|
|
|
/S/ LEE E. MIKLES
Lee E. Mikles |
|
Chief Executive Officer and President (Principal Executive Officer), Director |
|
March 15, 2017 |
|
|
|
|
|
|
|
/S/ STEVEN A. EDNIE
Steven A. Ednie |
|
Vice President, Chief Financial Officer (Principal Financial and Accounting Officer) |
|
March 15, 2017 |
|
|
|
|
|
|
|
/S/ RICHARD P. EMERSON
Richard P. Emerson |
|
Director |
|
March 15, 2017 |
|
|
|
|
|
|
|
/S/ NICOLAS KAUSER
Nicolas Kauser |
|
Director |
|
March 15, 2017 |
|
|
|
|
|
|
|
/S/ CRAIG O. MCCAW
Craig O. McCaw |
|
Executive Chairman and Chairman of the Board of Directors |
|
March 15, 2017 |
|
|
|
|
|
|
|
/S/ R. GERARD SALEMME
R. Gerard Salemme |
|
Director |
|
March 15, 2017 |
|
|
|
|
|
|
|
/S/ STUART M. SLOAN
Stuart M. Sloan |
|
Director |
|
March 15, 2017 |
|
|
|
|
|
|
|
/S/ H. BRIAN THOMPSON
H. Brian Thompson |
|
Director |
|
March 15, 2017 |
56
|
|
|
|
|
Incorporated By Reference |
||||||||
|
Exhibit No. |
|
Exhibit Description |
|
Form |
|
SEC File No. |
|
Original Exhibit No. |
|
Filing Date |
|
Filed Herewith |
|
|
|
|
|
|
|
|
|
|
|
|
|
|
|
2.1 |
|
Agreement and Plan of Merger dated November 14, 2012 between Pendrell Corporation, a Delaware corporation and Pendrell Washington Corporation, a Washington corporation |
|
8-K |
|
001-33008 |
|
2.1 |
|
11/15/12 |
|
|
|
|
|
|
|
|
|
|
|
|
|
|
|
|
|
3.1 |
|
Articles of Incorporation of Pendrell Corporation, a Washington corporation |
|
8-K |
|
001-33008 |
|
3.1 |
|
11/15/12 |
|
|
|
|
|
|
|
|
|
|
|
|
|
|
|
|
|
3.2 |
|
Articles of Amendment to Articles of Incorporation of Pendrell Corporation |
|
8-K |
|
001-33008 |
|
3.1 |
|
06/19/15 |
|
|
|
|
|
|
|
|
|
|
|
|
|
|
|
|
|
3.3 |
|
Articles of Amendment to Articles of Incorporation of Pendrell Corporation |
|
8-K |
|
001-33008 |
|
3.1 |
|
09/30/16 |
|
|
|
|
|
|
|
|
|
|
|
|
|
|
|
|
|
3.4 |
|
Bylaws of Pendrell Corporation, a Washington corporation |
|
8-K |
|
001-33008 |
|
3.2 |
|
11/15/12 |
|
|
|
|
|
|
|
|
|
|
|
|
|
|
|
|
|
3.5 |
|
Amendment No. 1 to Bylaws of Pendrell Corporation |
|
8-K |
|
001-33008 |
|
3.2 |
|
06/19/15 |
|
|
|
|
|
|
|
|
|
|
|
|
|
|
|
|
|
4.1 |
|
Tax Benefits Preservation Plan dated as of January 29, 2010 and re-affirmed on June 17, 2015, by and between ICO Global Communications (Holdings) Limited and Computershare, as Rights Agent |
|
8-K |
|
001-33008 |
|
4.1 |
|
02/01/10 |
|
|
|
|
|
|
|
|
|
|
|
|
|
|
|
|
|
4.2 |
|
Subscription Form and Form of Rights Certificate |
|
8-K |
|
001-33008 |
|
4.19 |
|
02/18/10 |
|
|
|
|
|
|
|
|
|
|
|
|
|
|
|
|
|
10.1 |
|
Form of Director and Executive Officer Indemnification Agreement of Pendrell Corporation, a Washington corporation |
|
8-K |
|
001-33008 |
|
10.1 |
|
11/15/12 |
|
|
|
|
|
|
|
|
|
|
|
|
|
|
|
|
|
10.2 |
|
Indemnification Agreement, dated August 11, 2000, between ICO-Teledesic Global Limited and Eagle River Investments, LLC |
|
10-12G |
|
000-52006 |
|
10.14 |
|
05/15/06 |
|
|
|
|
|
|
|
|
|
|
|
|
|
|
|
|
|
10.3 |
|
Indemnification Agreement, dated July 17, 2000, between ICO-Teledesic Global Limited and Cascade Investment, LLC |
|
10-12G |
|
000-52006 |
|
10.16 |
|
05/15/06 |
|
|
|
|
|
|
|
|
|
|
|
|
|
|
|
|
|
10.4* |
|
ICO Global Communications (Holdings) Limited 2000 Stock Incentive Plan, As Amended and Restated effective June 15, 2007 |
|
10-Q |
|
001-33008 |
|
10.20.1 |
|
08/14/07 |
|
|
|
|
|
|
|
|
|
|
|
|
|
|
|
|
|
10.5* |
|
Form of Class A Common Stock Option Agreement under 2000 Stock Incentive Plan |
|
10-12G |
|
000-52006 |
|
10.21 |
|
05/15/06 |
|
|
|
|
|
|
|
|
|
|
|
|
|
|
|
|
|
10.6* |
|
Form of Restricted Stock Award Agreement under 2000 Stock Incentive Plan |
|
10-12G |
|
000-52006 |
|
10.23 |
|
05/15/06 |
|
|
|
|
|
|
|
|
|
|
|
|
|
|
|
|
|
10.7* |
|
Pendrell Corporation 2012 Equity Incentive Plan, as amended |
|
|
|
|
|
|
|
|
|
X |
|
|
|
|
|
|
|
|
|
|
|
|
|
|
57
|
|
|
|
|
Incorporated By Reference |
||||||||
|
Exhibit No. |
|
Exhibit Description |
|
Form |
|
SEC File No. |
|
Original Exhibit No. |
|
Filing Date |
|
Filed Herewith |
|
|
|
|
|
|
|
|
|
|
|
|
|
|
|
10.8* |
|
Form of Stock Option Agreement under 2012 Equity Incentive Plan, as amended |
|
10-K |
|
001-33008 |
|
10.9 |
|
03/08/13 |
|
|
|
|
|
|
|
|
|
|
|
|
|
|
|
|
|
10.9* |
|
Form of Restricted Stock Unit Agreement under 2012 Equity Incentive Plan |
|
10-Q |
|
001-33008 |
|
10.1 |
|
10/30/15 |
|
|
|
|
|
|
|
|
|
|
|
|
|
|
|
|
|
10.10* |
|
Form of Restricted Stock Award Agreement under 2012 Equity Incentive Plan |
|
10-Q |
|
001-33008 |
|
10.2 |
|
10/30/15 |
|
|
|
|
|
|
|
|
|
|
|
|
|
|
|
|
|
10.11* |
|
Pendrell Corporation 2016 Incentive Plan |
|
8-K |
|
001-33008 |
|
10.1 |
|
03/18/16 |
|
|
|
|
|
|
|
|
|
|
|
|
|
|
|
|
|
10.12* |
|
Board Compensation Policy, effective January 1, 2013, as amended on September 30, 2016 |
|
|
|
|
|
|
|
|
|
X |
|
|
|
|
|
|
|
|
|
|
|
|
|
|
|
10.13 |
|
Form of Securities Purchase Agreement |
|
8-K |
|
001-33008 |
|
10.1 |
|
06/06/08 |
|
|
|
|
|
|
|
|
|
|
|
|
|
|
|
|
|
10.14* |
|
Employment Letter Agreement between Pendrell Corporation and Lee E. Mikles signed June 8, 2015 to be effective June 1, 2015 |
|
8-K |
|
001-33008 |
|
10.1 |
|
06/10/15 |
|
|
|
|
|
|
|
|
|
|
|
|
|
|
|
|
|
10.15* |
|
Retention Agreement effective February 16, 2015 between Pendrell Corporation and R. Gerard Salemme |
|
10-K |
|
001-33008 |
|
10.16 |
|
03/16/15 |
|
|
|
|
|
|
|
|
|
|
|
|
|
|
|
|
|
10.16* |
|
Employment Letter Agreement between Pendrell Corporation and Steven A. Ednie dated August 28, 2014, as supplemented by addenda dated February 13, 2015 and February 1, 2017 |
|
|
|
|
|
|
|
|
|
X |
|
|
|
|
|
|
|
|
|
|
|
|
|
|
|
10.17* |
|
Employment Letter Agreement between Pendrell Corporation (formerly ICO Global Communications (Holdings) Limited) and Timothy M. Dozois dated July 1, 2011, as supplemented by addenda dated January 1, 2015, February 13, 2015 and February 1, 2017 |
|
|
|
|
|
|
|
|
|
X |
|
|
|
|
|
|
|
|
|
|
|
|
|
|
|
10.18 |
|
Stock Redemption Agreement dated March 9, 2017 between Pendrell Corporation and Highland Crusader Offshore Partners, L.P. |
|
8-K |
|
001-33008 |
|
10.1 |
|
03/13/17 |
|
|
|
|
|
|
|
|
|
|
|
|
|
|
|
|
|
21.1 |
|
List of Subsidiaries |
|
|
|
|
|
|
|
|
|
X |
|
|
|
|
|
|
|
|
|
|
|
|
|
|
|
31.1 |
|
Certification of the principal executive officer required by Rule 13a-14(a) or Rule 15d-14(a) |
|
|
|
|
|
|
|
|
|
X |
|
|
|
|
|
|
|
|
|
|
|
|
|
|
|
31.2 |
|
Certification of the principal financial and accounting officer required by Rule 13a-14(a) or Rule 15d-14(a) |
|
|
|
|
|
|
|
|
|
X |
|
|
|
|
|
|
|
|
|
|
|
|
|
|
|
32.1 |
|
Certifications required by Rule 13a-14(b) or Rule 15d-14(b) and Section 1350 of Chapter 63 of Title 18 of the United States Code (18 U.S.C. § 1350) |
|
|
|
|
|
|
|
|
|
X |
|
|
|
|
|
|
|
|
|
|
|
|
|
|
58
|
|
|
|
|
Incorporated By Reference |
||||||||
|
Exhibit No. |
|
Exhibit Description |
|
Form |
|
SEC File No. |
|
Original Exhibit No. |
|
Filing Date |
|
Filed Herewith |
|
|
|
|
|
|
|
|
|
|
|
|
|
|
|
101 |
|
The following financial statements from Pendrell Corporation’s 10-K for the fiscal year ended December 31, 2016 formatted in XBRL: (i) the Consolidated Balance Sheets, (ii) the Consolidated Statements of Operations, (iii) the Consolidated Statements of Changes in Shareholders’ Equity, (iv) the Consolidated Statements of Cash Flows and (v) the Notes to Consolidated Financial Statements |
|
|
|
|
|
|
|
|
|
X |
|
* |
Management contract or compensatory plan or arrangement. |
59