Attached files
| file | filename |
|---|---|
| EX-32.1 - EXHIBIT 32.1 - Parkway, Inc. | pkyinc-20161231x10kxex321.htm |
| EX-32.2 - EXHIBIT 32.2 - Parkway, Inc. | pkyinc-20161231x10kxex322.htm |
| EX-31.2 - EXHIBIT 31.2 - Parkway, Inc. | pkyinc-20161231x10kxex312.htm |
| EX-31.1 - EXHIBIT 31.1 - Parkway, Inc. | pkyinc-20161231x10kxex311.htm |
| EX-23.3 - EXHIBIT 23.3 - Parkway, Inc. | pkyinc-20161231x10kxex233.htm |
| EX-23.2 - EXHIBIT 23.2 - Parkway, Inc. | pkyinc-20161231x10kxex232.htm |
| EX-23.1 - EXHIBIT 23.1 - Parkway, Inc. | pkyinc-20161231x10kxex231.htm |
| EX-21.1 - EXHIBIT 21.1 - Parkway, Inc. | pkyinc-20161231x10kxex211.htm |
| EX-10.48 - EXHIBIT 10.48 - Parkway, Inc. | pkyinc-20161231x10kxex1048.htm |
| EX-10.47 - EXHIBIT 10.47 - Parkway, Inc. | pkyinc-20161231x10kxex1047.htm |
| EX-10.46 - EXHIBIT 10.46 - Parkway, Inc. | pkyinc-20161231x10kxex1046.htm |
| EX-10.28 - EXHIBIT 10.28 - Parkway, Inc. | jasonbatesemploymentagre.htm |
UNITED STATES SECURITIES AND EXCHANGE COMMISSION
Washington, D.C. 20549
FORM 10-K
x ANNUAL REPORT PURSUANT TO SECTION 13 OR 15(d)
OF THE SECURITIES EXCHANGE ACT OF 1934
For the fiscal year ended December 31, 2016
OR
o TRANSITION REPORT PURSUANT TO SECTION 13 OR 15(d)
OF THE SECURITIES EXCHANGE ACT OF 1934
For the transition period from to
Commission file number 001-37819
Parkway, Inc.
(Exact name of registrant as specified in its charter)
Maryland | 61-1796261 |
(State or other jurisdiction | (I.R.S. Employer |
of incorporation or organization) | Identification No.) |
San Felipe Plaza
5847 San Felipe Street, Suite 2200
Houston, Texas 77057
(Address of principal executive offices) (Zip Code)
(346) 200-3100
(Registrant’s telephone number, including area code)
Securities registered pursuant to Section 12(b) of the Act:
Common Stock, $0.001 Par Value
New York Stock Exchange
Securities registered pursuant to Section 12(g) of the Act:
None
Indicate by check mark if the registrant is a well-known seasoned issuer, as defined in Rule 405 of the Securities Act. o Yes xNo
Indicate by check mark if the registrant is not required to file reports pursuant to Section 13 or Section 15(d) of the Act. o Yes x No
Indicate by check mark whether the registrant (1) has filed all reports required to be filed by Section 13 or 15(d) of the Securities Exchange Act of 1934 during the preceding 12 months (or for such shorter period that the registrant was required to file such reports), and (2) has been subject to such filing requirements for the past 90 days. x Yes o No
Indicate by check mark whether the registrant has submitted electronically and posted on its corporate Web site, if any, every Interactive Data File required to be submitted and posted pursuant to Rule 405 of Regulation S-T (§232.405 of this chapter) during the preceding 12 months (or for such shorter period that the registrant was required to submit and post such files). xYes oNo
Indicate by check mark if disclosure of delinquent filers pursuant to Item 405 of Regulation S-K is not contained herein, and will not be contained, to the best of registrant’s knowledge, in definitive proxy or information statements incorporated by reference in Part III of this Form 10-K or any amendment to this Form 10-K. x
Indicate by check mark whether the registrant is a large accelerated filer, an accelerated filer, a non-accelerated filer or a smaller reporting company. See definition of “large accelerated filer” in Rule 12b-2 of the Exchange Act. (Check one):
Large accelerated filer o Accelerated filer o
Non-accelerated filer x (do not check if a smaller reporting company) Smaller reporting company o
Indicate by check mark whether the registrant is a shell company (as defined in Rule 12b-2 of the Exchange Act). o Yes x No
The Registrant’s shares of common stock, $0.001 par value per share (“common stock”), are listed and trade on the New York Stock Exchange (“NYSE”) and began trading publicly in the regular way on October 7, 2016. There were 49,195,214 shares of common stock outstanding on March 8, 2017. The aggregate market value of common stock held by non-affiliates, based on the closing price of $20.50 per share as reported on the NYSE on March 8, 2017, was approximately $990.4 million.
DOCUMENTS INCORPORATED BY REFERENCE
Portions of the Registrant’s Definitive Proxy Statement for the 2017 Annual Meeting of Stockholders to be filed with the Securities and Exchange Commission are incorporated by reference into Part III of this Annual Report on Form 10-K.
EXPLANATORY NOTE
This Annual Report on Form 10-K of Parkway, Inc. (the “Company”) includes the financial statements of the Company as of December 31, 2016 and for the period from June 29, 2016 (date of capitalization) to December 31, 2016, the Company’s predecessor, Parkway Houston, as of October 5, 2016 and December 31, 2015 and for the period from January 1, 2016 to October 5, 2016 and the years ended December 31, 2015 and 2014, and the Company’s other predecessor, Cousins Houston, as of October 6, 2016 and December 31, 2015 and for the period from January 1, 2016 to October 6, 2016 and the years ended December 31, 2015 and 2014. “Parkway Houston” is the portion of the Houston Business (as defined below) previously owned and operated by Parkway Properties, Inc. (“Legacy Parkway”), including Legacy Parkway’s fee-based real estate services and certain other assets previously owned by Legacy Parkway. “Cousins Houston” is the portion of the Houston Business previously owned and operated by Cousins Properties Incorporated (“Cousins”). “Houston Business” is the portion of the combined businesses of Legacy Parkway and Cousins relating to the ownership of real properties in Houston Texas, together with Legacy Parkway’s fee-based real estate services, which was contributed to the Company pursuant to the Separation (as defined below). Parkway Houston and Cousins Houston were not operated by Legacy Parkway or Cousins as stand-alone businesses.
On October 6, 2016, Legacy Parkway merged with and into Clinic Sub Inc., a wholly owned subsidiary of Cousins, with Clinic Sub Inc. continuing as the surviving corporation and a wholly owned subsidiary of Cousins (the “Merger”). The Merger was consummated pursuant to that certain Agreement and Plan of Merger, dated April 28, 2016 (the “Merger Agreement”), by and among Cousins, Clinic Sub Inc., Legacy Parkway and Parkway Properties LP (“Parkway LP”). Following the consummation of the Merger on October 6, 2016, in accordance with the Merger Agreement, Cousins separated the portion of its combined businesses relating to the ownership of real properties in Houston, Texas, as well as Legacy Parkway’s fee-based real estate services, from the remainder of the combined businesses (the “Separation”). In connection with the Separation, Cousins and Legacy Parkway reorganized the combined businesses through a series of transactions (the “UPREIT Reorganization”) pursuant to which the Houston Business was transferred to the Company, and the remainder of the combined business was transferred to Cousins Properties LP, a Delaware limited partnership (“Cousins LP”), the operating partnership of Cousins. On October 7, 2016, following the Separation and Reorganization, Cousins completed the spin-off of the Company, by distributing all of the Company’s outstanding shares of common and limited voting stock to the holders of Cousins common and limited voting preferred stock as of the record date, October 6, 2016 (the “Spin-Off”). The Spin-Off was consummated pursuant to the Merger Agreement and that certain Separation, Distribution and Transition Services Agreement, dated October 5, 2016, by and among the Company, Parkway LP, Cousins, Cousins LP and certain other parties (the “Separation and Distribution Agreement”).
The financial statements of the Company presented in this report cover the period from June 29, 2016 (date of capitalization) to December 31, 2016, part of which was prior to consummation of the Separation, the UPREIT Reorganization and the Spin-Off. Therefore, the discussion of the Company’s results of operations, cash flows and financial condition set forth in this report is not necessarily indicative of the future results of operations, cash flows or financial condition of the Company as an independent, publicly traded company. Moreover, the combined financial statements for the Company’s predecessors are not necessarily indicative of the Company’s results of operations, cash flows or financial position following the completion of the Separation, the UPREIT Reorganization and the Spin-Off.
PARKWAY, INC.
TABLE OF CONTENTS
Page | ||
PART I. | ||
Item 1. | ||
Item 1A. | ||
Item 1B. | ||
Item 2. | ||
Item 3. | ||
Item 4. | ||
PART II. | ||
Item 5. | ||
Item 6. | ||
Item 7. | ||
Item 7A. | ||
Item 8. | ||
Item 9. | ||
Item 9A. | ||
Item 9B. | ||
PART III. | ||
Item 10. | ||
Item 11. | ||
Item 12. | ||
Item 13. | ||
Item 14. | ||
PART IV. | ||
Item 15. | ||
Item 16. | ||
SIGNATURES | ||
Forward-Looking Statements
Certain sections of this Annual Report on Form 10-K contain “forward-looking statements” within the meaning of the Private Securities Litigation Reform Act of 1995 set forth in Section 27A of the Securities Act of 1933, as amended (the “Securities Act”), and Section 21E of the Securities Exchange Act of 1934, as amended (the “Exchange Act”). Examples of forward-looking statements include projected capital resources, projected profitability and portfolio performance, estimates of market rental rates, projected capital improvements, expected sources of financing, expectations as to the timing of closings of acquisitions, dispositions or other transactions, the ability to complete acquisitions and dispositions and the risks associated therewith, and the expected operating performance of anticipated near-term acquisitions and descriptions relating to these expectations. We caution investors that any forward-looking statements presented in this Annual Report on Form 10-K are based on management’s beliefs and assumptions made by, and information currently available to, management. When used, the words “anticipate,” “assume,” “believe,” “estimate,” “expect,” “forecast,” “guidance,” “intend,” “may,” “might,” “plan,” “potential,” “project,” “should,” “will,” “result” or similar expressions that do not relate solely to historical matters are intended to identify forward-looking statements. You can also identify forward-looking statements by discussions of strategy, plans or intentions.
The matters discussed in these forward-looking statements are subject to risks, uncertainties and other factors that could cause actual results to differ materially from those projected, anticipated or implied in the forward-looking statements.
Although we believe the expectations reflected in any forward-looking statements are based on reasonable assumptions, we can give no assurance that our expectations will be attained, and it is possible that our actual results may differ materially from those indicated by these forward-looking statements due to a variety of risks and uncertainties. Such factors include, but are not limited to:
• | our short operating history as an independent company; |
• | conditions associated with our primary market, including an oversupply of office space, customer financial difficulties and general economic conditions; |
• | that each of our properties represent a significant portion of our revenues and costs; |
• | that our Spin-Off from Cousins will not qualify for tax-free treatment; |
• | our ability to meet mortgage debt obligations on certain of our properties; |
• | the availability of refinancing current debt obligations; |
• | risks associated with joint ventures and potential co-investments with third-parties; |
• | changes in any credit rating we may subsequently obtain; |
• | changes in the real estate industry and in performance of the financial markets and interest rates and our ability to effectively hedge against interest rate changes; |
• | the actual or perceived impact of global and economic conditions, including U.S. monetary policy; |
• | declines in commodity prices, which may negatively impact the Houston, Texas market; |
• | the concentration of our customers in the energy sector; |
• | the demand for and market acceptance of our properties for rental purposes; |
• | our ability to enter into new leases or renewal leases on favorable terms; |
• | the potential for termination of existing leases pursuant to customer termination rights; |
• | the amount, growth and relative inelasticity of our expenses; |
• | the bankruptcy or insolvency of companies for which we provide property management services or the sale of these properties; |
• | the outcome of claims and litigation involving or affecting the company; |
• | the ability to satisfy conditions necessary to close pending transactions and the ability to successfully integrate the assets and related operations acquired in such transactions after the closing; |
• | applicable regulatory changes; |
• | risks associated with the ownership and development of real property, including risks related to natural disasters and illiquidity of real estate; |
• | risks associated with acquisitions, including the integration of the combined Houston Business; |
• | risks associated with the fact that our historical and pro forma financial information may not be a reliable indicator of our future results; |
• | risks associated with achieving expected synergies or cost savings; |
• | defaults or non-renewal of leases; |
• | termination or non-renewal of property management contracts; |
• | our failure to maintain our status as real estate investment trust (“REIT”) under the Internal Revenue Code of 1986, as amended (the “Code”); |
• | risks associated with the potential volatility of our common stock; and |
• | other risks and uncertainties detailed from time to time in our Securities and Exchange Commission (“SEC”) filings. |
A discussion of these and other risks and uncertainties that could cause actual results and events to differ materially from such forward-looking statements is included in “Risk Factors” and “Management’s Discussion and Analysis of Financial Condition and Results of Operations” of this Annual Report on Form 10-K. Should one or more of these risks or uncertainties occur, or should underlying assumptions prove incorrect, our business, financial condition, liquidity, cash flows and financial results could differ materially from those expressed in any forward-looking statement. While forward-looking statements reflect our good faith beliefs, they are not guarantees of future performance. Any forward-looking statement speaks only as of the date on which it is made. New risks and uncertainties arise over time, and it is not possible for us to predict the occurrence of those matters or the manner in which they may affect us. Except as required by law, we undertake no obligation to publicly update or revise any forward-looking statement to reflect changes in underlying assumptions or factors, of new information, data or methods, future events or other changes.
PART I
ITEM 1. Business
As used herein, the terms “we,” “us,” “our,” “Parkway” and the “Company” refer to Parkway, Inc., a Maryland corporation, individually or together with its subsidiaries, including Parkway Operating Partnership LP, a Delaware limited partnership, and our predecessors. The term “Operating Partnership” refers to Parkway Operating Partnership LP individually or together with its subsidiaries.
Overview
We are an independent, publicly traded, self-managed REIT that owns and operates high-quality office properties located in attractive submarkets in Houston, Texas. Our portfolio consists of five Class A assets comprising 19 buildings and totaling approximately 8.7 million rentable square feet in the Greenway, Galleria and Westchase submarkets of Houston, providing geographic focus and significant operational scale and efficiencies. Our portfolio has proven to be resilient throughout market cycles and is occupied by a diversified customer base with strong credit profiles and limited near-term lease expirations. We believe that the creation of a geographically focused REIT with a strong balance sheet and targeted internal value-creation opportunities will generate attractive risk-adjusted returns for our stockholders while providing a platform for external growth opportunities over the longer-term.
In addition, the Company operates a fee-based real estate service (the “Third-Party Services Business”) through a wholly owned subsidiary, Eola Office Partners, LLC and its wholly owned subsidiaries (collectively, “Eola”), which in total managed approximately 3.8 million square feet (unaudited) for primarily third-party owners as of December 31, 2016
Our mission is to own and operate high-quality office properties located in attractive submarkets in Houston, with a primary focus on unlocking value within our existing portfolio through implementing active and creative leasing strategies, leveraging our scale to increase pricing power in lease and vendor negotiations and targeting redevelopment and asset repositioning opportunities. We plan to maintain a conservative balance sheet with low leverage and ample liquidity, which we expect will allow us to access multiple sources of capital. We believe that this strategy will support both our internal growth initiatives and our patient and disciplined approach to pursuing new investment opportunities at the appropriate time. We believe that this strategy, combined with our highly experienced management team that has a successful history of operating a publicly traded REIT, significant expertise in the Houston, Texas office sector and extensive relationships with industry participants, positions us for long-term internal and external growth.
Our Spin-Off from Cousins
On October 7, 2016, pursuant to the Merger Agreement and the Separation and Distribution Agreement, Cousins completed the Spin-Off of our company by distributing all of our outstanding shares of common and limited voting stock to the holders of Cousins common and limited voting preferred stock as of the record date, October 6, 2016.
We were incorporated on June 3, 2016 as a wholly owned subsidiary of Legacy Parkway. On October 6, 2016, pursuant to the Merger Agreement, Legacy Parkway merged with and into Clinic Sub Inc., with Clinic Sub Inc. continuing as the surviving corporation and a wholly owned subsidiary of Cousins. In connection with the Merger, we became a subsidiary of Cousins. Immediately following the effective time of the Merger, in accordance with the Merger Agreement, Cousins separated the Houston Business from the remainder of the combined businesses. In connection with the Separation and UPREIT Reorganization, the Houston Business was transferred to us, and the remainder of the combined business was transferred to Cousins LP, the operating partnership of Cousins. Following the Separation and UPREIT Reorganization, Cousins effected the Spin-Off on October 7, 2016.
Greenway Properties Joint Venture
On February 17, 2017, we, through our Operating Partnership and certain other subsidiaries, entered into an Omnibus Contribution and Partial Interest Assignment Agreement (the “Contribution Agreement”) with an affiliate of Canada Pension Plan Investment Board (“CPPIB”) and an entity controlled by TH Real Estate Global Asset Management and Silverpeak Real Estate Partners (“TIAA/SP”). Pursuant to the Contribution Agreement, we have agreed to sell to these two investors, indirectly through a new joint venture, an aggregate 49% interest in our Greenway Plaza and Phoenix Tower properties (the “Greenway Properties”). The new joint venture is expected to be owned 51% through subsidiaries of the Operating Partnership (with 1% being held by a subsidiary acting as the general partner and 50% being held by a subsidiary acting as a limited partner) and 24.5% by each of CPPIB and TIAA/SP, each as a limited partner of the joint venture. TIAA/SP will acquire its aggregate percentage interest in two
5
tranches over a three business day period. The Contribution Agreement contains customary representations, warranties and interim operating covenants of the parties that are subject, in some cases, to specified exceptions and qualifications, and the transaction is subject to certain closing conditions. Obtaining the new mortgage financing described below is not a condition to closing. Closing under the Contribution Agreement is expected to occur during the second quarter of 2017, subject to extension to an outside date of May 31, 2017, which may be further extended to June 21, 2017 in certain circumstances. We cannot provide assurances that the Greenway Properties joint venture transaction will be consummated on the terms or timeline currently contemplated, or at all, which may have a material adverse effect on our business, financial condition and results of operations.
At closing under the Contribution Agreement, a subsidiary of the joint venture expects to assume the existing mortgage loan on Phoenix Tower and to enter into new mortgage financing of up to $465 million secured by the Greenway Plaza properties, as described below. At closing, the Operating Partnership will use a portion of the proceeds of the new mortgage financing and the purchase price received from the investors, in each case net of required reserves, to repay all amounts outstanding under our current credit facility, dated October 6, 2016, by and among us, the Operating Partnership, Bank of America, N.A. and certain other parties, and to fund a credit to the joint venture with respect to certain outstanding contractual lease obligations and in-process capital expenditures. The remainder of these proceeds will be retained by us for general corporate purposes.
In connection with the Contribution Agreement, the Operating Partnership received a debt commitment letter (the “Commitment Letter”) from Goldman Sachs Mortgage Company (“Goldman Sachs”) pursuant to which Goldman Sachs has, among other things, agreed to provide the joint venture and certain of its subsidiaries a mortgage loan in an aggregate principal amount of up to $465 million (the “Loan”) secured by the Greenway Plaza properties and all related assets. On February 22, 2017, the Operating Partnership and Goldman Sachs entered into the Commitment Letter and a rate lock agreement. Funding of the Loan is subject to certain other conditions set forth in the Commitment Letter.
Competitive Strengths
Accomplished management team with a demonstrated track record of acquiring, operating and repositioning assets and managing a public office REIT. Our management team, led by Mr. James R. Heistand, our President and Chief Executive Officer, has extensive experience in the office real estate industry, including in operations, leasing, acquisition, development and disposition of office assets through all stages of the real estate cycle, and has a proven track record of executing business strategies and delivering strong results for stockholders. Since joining Legacy Parkway in the fourth quarter of 2011 through October 6, 2016, our management team acquired $3.9 billion of high-quality, Class A office assets and disposed of approximately $2.6 billion of non-core assets resulting in approximately $290.0 million of net gains. During this time, our management team also realized significant portfolio-wide operational improvements as evidenced by a 47.6% increase in average in-place rents and an increase in the leased percentage of the portfolio from 85.7% to 90.5%. In addition, our management team has proven its ability to be creative in unlocking value from complex transactions and to create stockholder value through targeted asset sales and strategic capital recycling. Through this experience, our management team has proven its strong execution capabilities and established relationships with industry participants.
Houston focus with local and regional expertise. We are focused initially on owning and operating office properties in Houston, Texas, which is a region we believe is well-positioned for economic recovery. We believe our position as a “pure-play” Houston real estate company allows us to have a targeted focus on property performance that otherwise could be diluted in a company with more geographically diverse holdings. Additionally, our management and property-level teams have in-depth knowledge of the Houston real estate market and an extensive network of long-standing relationships with leading local, regional and national industry participants that we believe will drive our ability to identify and capitalize on internal and external value-creation opportunities and attractive acquisition opportunities as well as identify opportunities with potential joint venture partners, as such opportunities arise from time to time.
High-quality portfolio of Class A office assets concentrated in desirable, resilient Houston submarkets. We own five Class A assets comprising 19 buildings and totaling approximately 8.7 million square feet in the Greenway, Galleria and Westchase submarkets, which are among the most desirable submarkets in Houston. These particular submarkets have a strong track record of outperforming the overall Houston market in rental rates, occupancy and value improvement over time. They are located adjacent to many high-income residential areas and offer state-of-the-art amenities, including high-end retail, restaurants, entertainment and recreational activities. We are the largest landlord in each of these submarkets, owning 60% of the Class A office inventory in Greenway, 15% in Galleria, and 15% in Westchase based on square footage as of December 31, 2016. We expect that these ownership levels will lead to pricing power in lease and vendor negotiations; the ability to attract, hire and retain superior local market leadership and leasing teams; flexibility to meet changing customer space demands; and an enhanced ability to identify and capitalize on emerging investment opportunities.
6
High-quality, creditworthy customer base with limited near-term lease maturities. Our diversified customer base generally consists of high-quality and creditworthy customers. As of December 31, 2016, nearly 47% of our customers based on annual base rent had investment grade credit ratings from major credit rating agencies. In order to monitor the credit quality of our customers, our property management teams communicate regularly with all of our customers. We receive monthly credit reports for the largest customers in our portfolio and regularly review the financials of those customers that are in the energy industry. Further, with a weighted average remaining lease term of approximately six years as of December 31, 2016, our portfolio has limited near-term lease maturities which is expected to provide stable cash flows with minimal decline in contractual revenue over the next several years.
Flexible and conservative capital structure. We believe our flexible and conservative capital structure provides us with an advantage over many of our private and public competitors. We have limited near-term debt maturities, and as of December 31, 2016, approximately $230.3 million in cash and cash equivalents and up to $100 million of additional liquidity through a revolving credit facility (“the Revolving Credit Facility”), all of which provide financial flexibility, support ongoing capital improvement needs and reinforce our business and growth strategies of unlocking the value in our portfolio through leasing and asset repositioning. In addition, we believe our conservative approach to balance sheet management may provide strategic benefits by providing us with enhanced access to multiple sources of attractively priced capital that may not be available to many of our competitors in Houston. We also believe that our moderate leverage and strong liquidity will enable us to take advantage of attractive redevelopment and acquisition opportunities as they rise from time to time.
Embedded growth opportunities through leasing, asset repositioning and redevelopment. Our portfolio has significant, identified embedded growth opportunities both through leasing the remaining vacancies in the portfolio and through targeted asset repositioning and redevelopment opportunities. We expect that our initial focus on one geographic location, combined with our strong balance sheet, market knowledge and customer relationships, will allow us to successfully execute internal and external growth strategies. With our scale, we expect that we will have the ability to attract, hire and maintain a best-in-class leasing team that will help us identify opportunities early and implement aggressive and creative leasing strategies at our properties. We also own assets that offer various pricing points within the same submarkets, giving us the flexibility to move and relocate customers within our portfolio based on their changing needs, which we expect will lead to higher customer retention. We also believe there are opportunities to add revenue-generating amenities to our assets, such as additional retail options and parking. We believe that our management team’s experience, as well as its ability to exclusively focus on our growth strategy following the Spin-Off will allow us to unlock the value that we expect exists in our portfolio.
Business and Growth Strategies
Maximize cash flow growth and value through proactive asset management and leasing strategies. We believe we are well-positioned to drive growth in cash flow and maximize the value of our portfolio with proactive, creative and aggressive leasing and asset management strategies. We also expect that our substantial scale in the Greenway, Galleria and Westchase submarkets will provide us with enhanced visibility into submarket dynamics that will lead to stronger negotiating leverage with customers and vendors and will result in a potential reduction in our operating costs and improvement in NOI over time. We expect that we will also be able to leverage our broad existing customer relationships, leading market position and deep financial flexibility to attract new, high-quality customers, increase occupancy over the long-term and maximize customer retention rates at our properties.
Focus on unlocking value through repositioning and redeveloping existing properties. We expect that our management team will devote significant attention to internal value-creating investment opportunities that are intended to generate attractive growth in revenues and cash flow, enhancing the value of our portfolio. Specifically, we expect to leverage our real estate expertise to reposition and redevelop our existing properties, as well as properties that we may acquire in the future, with the objective of increasing occupancy, rental rates and risk-adjusted returns on our invested capital. As the Houston, Texas market continues to recover, our management team will seek to identify investment opportunities, that include creating joint ventures with existing ownership interests in certain of our properties, that will create value for our stockholders, enable us to better serve our customers, be consistent with our strategic objectives and have attractive risk-return profiles.
Maintain a conservative, flexible balance sheet with adequate liquidity to fund near-term growth opportunities. We maintain a conservative capital structure that will provide the resources and flexibility to position our company for both internal and external growth. As of December 31, 2016, we had approximately $230.3 million in cash and cash equivalents and $100 million of additional liquidity through the Revolving Credit Facility. We focus on maintaining sufficient liquidity with minimal short-term debt maturities, allowing us to pursue value enhancement strategies within our portfolio and support acquisition activities as they may arise from time to time. Initially, we expect to maintain a mix of property-level secured indebtedness as well as corporate debt secured by a pool of assets. As the Houston market recovers, we anticipate funding additional growth opportunities
7
through proceeds received from asset dispositions, joint ventures, the refinancing of debt or public equity offerings. We also expect to target a net debt to Adjusted EBITDA multiple of no more than 6.0x.
Pursue acquisitions with a patient, prudent approach. While our initial focus is to unlock internal embedded growth in our existing portfolio, we intend to take advantage of current and future market dislocation in Houston to capitalize on emerging acquisition opportunities within our current submarkets as well as other Houston submarkets, if such assets meet our investment criteria. We may also acquire assets in other markets from time to time if such opportunities meet our investment criteria. However, we intend to devote the majority of our resources to sourcing opportunities within the Houston market for the foreseeable future. We believe that our management team’s in-depth market knowledge and relationships and its extensive acquisitions experience will enhance our ability to source new acquisition opportunities as they may arise from time to time. Whether we operate exclusively in Houston, or diversify our market exposure over the longer-term, our management team will use a patient, prudent and disciplined approach to investment decision-making.
Competition
We compete with a number of developers, owners and operators of office and commercial real estate, many of which own properties similar to ours in the same Houston submarkets in which our properties are located, and some of which have greater financial resources than we do. In operating and managing our portfolio, we compete for customers based on a number of factors, including location, leasing terms (including rent and other charges and allowances for customer improvements), security, flexibility and expertise to design space to meet prospective customers’ needs, quality and breadth of customer services provided and the manner in which the property is operated, maintained and marketed. As leases at our properties expire, we may encounter significant competition to renew or re-let space in light of the large number of competing properties within the submarkets in which we operate. As a result, we may be required to provide rent concessions or abatements, incur charges for customer improvements and other inducements, including early termination rights or below-market renewal options, or we may not be able to timely lease vacant space. In that case, the per share trading price of our common stock, our financial condition, results of operations, cash flow and ability to satisfy our debt service obligations and to pay dividends to stockholders may be adversely affected.
We will also face competition when pursuing acquisition and disposition opportunities. Our competitors may be able to pay higher property acquisition prices, may have private access to opportunities not available to us or may otherwise be in a better position to acquire a property. Competition may also have the effect of reducing the number of suitable acquisition opportunities available to us, increasing the price required to consummate an acquisition opportunity and generally reducing the demand for commercial office space in our submarkets. Likewise, competition with sellers of similar properties to locate suitable purchasers may result in our receiving lower proceeds from a sale or in our not being able to dispose of a property at a time of our choosing due to the lack of an acceptable return.
Administration
We, were formed as a corporation under the laws of the state of Maryland in June 2016, and we intend to elect to be taxed as a REIT for U.S. federal income tax purposes beginning with our short taxable year that commenced on the day prior to the Spin-Off and ended December 31, 2016 upon the filing of our U.S. federal income tax return for such year. We generally perform commercial real estate leasing, management and acquisition services on an in-house basis. As of December 31, 2016, we had 158 employees. Our principal executive office is located at 5847 San Felipe Street, Suite 2200, Houston, Texas 77057 and our telephone number is (346) 200-3100. In addition, we have two regional offices in Jacksonville, Florida and Orlando, Florida.
Insurance
We or customers at our properties, carry comprehensive commercial general liability, fire, extended coverage, business interruption, rental loss coverage, environmental and umbrella liability coverage on all of our properties. We also carry wind and flood coverage on properties in areas where we believe such coverage is warranted, in each case with limits of liability that we deem adequate based on industry practice. Similarly, our properties are insured against the risk of direct physical damage in amounts we believe to be adequate to reimburse us, on a replacement cost basis, for costs incurred to repair or rebuild each property, including loss of rental income during the reconstruction period. We believe that the insurance coverage on our properties contains policy specifications and insured limits that are customary for similar properties, business activities and markets, and we believe our properties are adequately insured. However, we may be subject to certain types of losses that are generally uninsured losses, including, but not limited to, losses caused by riots, chemical, biological, nuclear and radiation acts of terrorism, war or acts of God. In the opinion of our management, our properties are adequately insured given the relative risk of loss, the cost of the coverage, and industry practice.
8
Regulation
We believe that our properties are in compliance in all material respects with all U.S. federal, state and local laws, ordinances and regulations. Our properties are subject to various covenants, laws, ordinances and regulations, including regulations relating to common areas and fire and safety requirements. We believe that each of the properties in our portfolio have the necessary permits and approvals to operate its business. For more information, see “Risk Factors-Risks Related to Our Properties and Business.”
Americans with Disabilities Act
Our properties must comply with Title III of the Americans with Disabilities Act (“ADA”), to the extent that our properties are “public accommodations” as defined by the ADA. The ADA may require, among other things, (1) the removal of structural barriers to access by persons with disabilities in certain public areas of our properties where such removal is readily achievable, and (2) the reasonable modification of policies, practices and procedures that deny equal access to persons with disabilities. The ADA also requires that the design and construction of new facilities and some alterations comply with certain accessibility guidelines. See “Risk Factors-Risks Related to Our Properties and Business-Compliance or failure to comply with the Americans with Disabilities Act could result in substantial costs.”
Environmental Matters
Under various U.S. federal, state and local laws, ordinances and regulations, current and former owners and operators of real estate are liable for the costs of removal or remediation of certain hazardous or toxic substances on such real estate. These laws often impose such liability without regard to whether the owner knew of, or was responsible for, the presence of such hazardous or toxic substances. The costs of remediation or removal of such substances may be substantial and the presence of such substances, or the failure to promptly remediate such substances, may adversely affect an owner’s ability to sell such real estate or to borrow using such real estate as collateral. In connection with our ownership and operation of our properties, we may be potentially liable for such costs. The operations of current and former customers at our properties have involved, or may have involved, the use of hazardous materials or generated hazardous wastes. The release of such hazardous materials and wastes could result in the incurrence of liabilities to remediate any resulting contamination, if the responsible party is unable or unwilling to do so. In addition, our properties are located in urban areas, and are therefore exposed to the risk of contamination originating from third-party sources. While a property owner may not be held responsible for remediating contamination that has migrated onsite from an offsite source, the contaminant’s presence can have material adverse effects on our business, operations and the redevelopment of our properties. We are not aware of any environmental condition that we believe would have a material adverse effect on our capital expenditures, earnings or competitive position (before consideration of any potential insurance coverage). Nevertheless, it is possible that there are material environmental conditions and liabilities of which we are unaware. Moreover, no assurances can be given that (1) future laws, ordinances or regulations or future interpretations of existing requirements will not impose any material environmental liability or (2) the current environmental condition of our properties has not been or will not be affected by customers and occupants of our properties, by the condition of properties in the vicinity of our properties or by third parties. For more information, see “Risk Factors-Risks Related to Our Properties and Business.”
Emerging Growth Company Status
We are an “emerging growth company” as defined in the Jumpstart Our Business Startups Act (the “JOBS Act”). As such, we are eligible to take advantage of certain exemptions from various reporting requirements that apply to other public companies that are not emerging growth companies, including, but not limited to, compliance with the auditor attestation requirements of Section 404 of the Sarbanes-Oxley Act and the requirements to hold a non-binding advisory vote on executive compensation and any golden parachute payments not previously approved. If we do take advantage of some or all of these exemptions, some investors may find our common stock less attractive. The result may be a less active trading market for our common stock and our stock price may be more volatile.
In addition, Section 107 of the JOBS Act provides that an emerging growth company may take advantage of the extended transition period provided in Section 13(a) of the Exchange Act for complying with new or revised accounting standards. In other words, an emerging growth company can delay the adoption of certain accounting standards until those standards would otherwise apply to private companies. We have elected not to take advantage of the benefits of this extended transition period and, therefore, will be subject to the same new or revised accounting standards as other public companies that are not emerging growth companies. This election is irrevocable.
9
We will remain an emerging growth company until the earliest of (a) the last day of the first fiscal year in which our annual gross revenues exceed $1 billion, (b) the last day of the fiscal year following the fifth anniversary of the date of the first sale of our common equity securities pursuant to an effective registration statement under the Securities Act, (c) the date that we become a “large accelerated filer” as defined in Rule 12b-2 under the Exchange Act, which would occur on the last day of the fiscal year in which the market value of our common stock that is held by non-affiliates exceeds $700 million as of the last business day of our most recently completed second fiscal quarter, or (d) the date on which we have issued more than $1 billion in non-convertible debt during the preceding three-year period.
Available Information
We make available free of charge on the “Investors” page of our web site, www.pky.com, our filed and furnished reports on Form 10-K, 10-Q and 8-K and all amendments thereto, as soon as reasonably practicable after we electronically file such material with, or furnish it to, the SEC. The information on our website is not and should not be considered part of this Annual Report and is not incorporated by reference in this document. We have included our website address as an inactive textual reference and do not intend it to be an active link to our website.
Our Corporate Governance Guidelines, Code of Business Conduct and Ethics and the charters of the Audit Committee, Nominating and Corporate Governance Committee and Compensation Committee of our Board are available on the “Investors” page of our web site. Copies of these documents are also available free of charge in print upon written request addressed to Investor Relations, Parkway, Inc., 390 North Orange Avenue, Suite 2400, Orlando, Florida 32801.
ITEM 1A. Risk Factors.
In addition to the other information contained or incorporated by reference in this document, readers should carefully consider the following risk factors. Any of these risks or the occurrence of any one or more of the uncertainties described below could have a material adverse effect on our financial condition and the performance of our business.
Risks Related to Our Properties and Business
If global market and economic conditions deteriorate, our business, financial condition and results of operations could be materially adversely affected.
Weak economic conditions generally, sustained uncertainty about global economic conditions, a tightening of credit markets, business layoffs, downsizing, industry slowdowns and other similar factors that affect our customers could negatively impact commercial real estate fundamentals and result in lower occupancy, lower rental rates and declining values in our real estate portfolio. Additionally, these factors and conditions could have an impact on our lenders or customers, causing them to fail to meet their obligations to us. No assurances can be given regarding such macroeconomic factors or conditions, and our ability to lease our properties and increase or maintain rental rates may be negatively impacted, which may have a material adverse effect on our business, financial condition and results of operations.
The conditions of our market affect our business, financial condition and results of operations.
All of our properties are located in Houston, Texas. Therefore, our business, financial condition, results of operations and ability to pay dividends to our stockholders are directly linked to economic conditions in Houston generally, as well as the market for office space in Houston. An economic downturn in Houston, particularly increases in unemployment and customer bankruptcies, may materially adversely affect our business, financial condition and results of operations.
Additionally, as a result of the geographic concentration of our properties in Houston, we are particularly susceptible to adverse weather conditions that threaten southern and coastal states, such as hurricanes and flooding. A single catastrophe or destructive weather event may have a material adverse effect on our business, financial condition and results of operations.
Our business could be materially adversely affected by a decline in commodity prices, particularly a decline in the price of crude oil.
The Houston market is economically dependent on the petroleum industry. A key economic variable that affects the petroleum industry is the price of crude oil, which can be influenced by general economic conditions, industry inventory levels, production quotas imposed by the Organization of Petroleum Exporting Countries, weather-related damage and disruptions, competing fuel prices and geopolitical risk. If the Houston market faces significant exposure to fluctuations in global crude oil prices, particularly for extended periods of time, or oil prices remain at historically low levels, the Houston market may experience
10
business layoffs, downsizing, consolidations, industry slowdowns and other similar factors. These potential risks to our customers in Houston could negatively impact commercial real estate fundamentals and result in lower occupancy, an increased market for sublease space, lower rental rates and declining values in our real estate portfolio in Houston, which may have a material adverse effect on our business, financial condition and results of operations.
We derive a significant portion of our revenues from customers in the energy sector, which will subject us to more risk than if we were broadly diversified.
As of December 31, 2016, approximately 47% of our revenues were derived from customers in the energy sector. Our customers in the energy sector may be negatively impacted by changes in the supply and demand for crude oil, natural gas and other energy commodities, exploration, production and other capital expenditures related to the energy projects, government regulation and other risks related to commodity prices described in the risk factor entitled “—Our business could be materially adversely affected by a decline in commodity prices, particularly a decline in the price of crude oil.” The occurrence of any of these events that have a negative impact on the energy sector would have a much larger adverse effect on our revenues than they would if we had a more diversified customer base, which may have a material adverse effect on our business, financial condition and results of operations.
Our performance is subject to risks inherent in owning real estate investments.
We are generally subject to risks incidental to the ownership of real estate. These risks include:
• | changes in supply of or demand for office properties in our market or sub-markets; |
• | competition for customers in our market or sub-markets; |
• | the ongoing need for capital improvements; |
• | increased operating costs, which may not necessarily be offset by increased rents, including insurance premiums, utilities and real estate taxes, due to inflation and other factors; |
• | changes in tax, real estate and zoning laws; |
• | changes in governmental rules and fiscal policies; |
• | inability of customers to pay rent; |
• | competition from the development of new office space in our market or sub-markets and the quality of competition, such as the attractiveness of our properties as compared to our competitors’ properties based on considerations such as convenience of location, rental rates, amenities and safety record; and |
• | civil unrest, acts of war, terrorism, acts of God, including earthquakes, hurricanes and other natural disasters (which may result in uninsured losses) and other factors beyond our control. |
Should any of the foregoing occur, it may have a material adverse effect on our business, financial condition and results of operations.
We face considerable competition in the leasing market and may be unable to renew existing leases or re-let space on terms similar to our existing leases, or we may expend significant capital in our efforts to re-let space, which may adversely affect our business, financial condition and results of operations.
We compete with a number of other owners and operators of office properties to renew leases with our existing customers and to attract new customers. To the extent that we are able to renew leases that are scheduled to expire in the short-term or re-let such space to new customers, heightened competition may require us to give rent concessions or provide customer improvements to a greater extent than we otherwise would have. In addition, the economic downturn of the last several years has led to increased competition for creditworthy customers and we may have difficulty competing with competitors who have purchased properties at depressed prices, because our competitors’ lower cost basis in such properties may allow them to offer space to customers at reduced rental rates.
If our competitors offer space at rental rates below current market rates or below the rental rates we currently charge our customers, we may lose potential customers, and we may be pressured to reduce our rental rates below those we currently charge, or may not be able to increase rates to market rates, in order to retain customers upon expiration of their existing leases. Even if our customers renew their leases or we are able to re-let the space, the terms and other costs of renewal or re-letting, including the cost of required renovations, increased customer improvement allowances, leasing commissions, declining rental rates, and other potential concessions, may be less favorable than the terms of our current leases and could require significant capital expenditures. Our inability to renew leases or re-let space in a reasonable time, a decline in rental rates or an increase in customer improvement, leasing commissions, or other costs may have a material adverse effect on our business, financial condition and results of operations.
11
More than half of our total annualized rent comes from a group of 20 customers, and as a result, the inability of any such customer to pay rent or a decision by such customer to vacate its premises could have a significant negative impact on our results of operations or financial condition.
As of December 31, 2016, our top 20 customers based on rental revenue represented 58.1% of our total annualized rent, with no single customer accounting for more than 10.1% of our annualized rent. The inability of any of our significant customers to pay rent, a decision by a significant customer to vacate their premises prior to, or at the conclusion of, their lease term, or potentially unfavorable terms in our future dealings or negotiations in order to maintain our relationship with a significant customer could have a significant negative impact on our results of operations or financial condition if a suitable replacement customer is not secured in a timely manner. These events could have a significant adverse impact on our results of operations or financial condition.
An oversupply of office space in our market could cause rental rates and occupancies to decline, making it more difficult for us to lease space at attractive rental rates, if at all.
Undeveloped land in the Houston market is generally more readily available and less expensive per square foot than in markets such as New York City, Chicago, Boston, San Francisco and Los Angeles. As a result, even during times of positive economic growth, it may be easier for our competitors to construct new buildings that would compete with our properties than it would be if we operated in higher barrier-to-entry markets. Any oversupply of office space in our market could result in lower occupancy and rental rates in our portfolio, which may have a material adverse effect on our business, financial condition and results of operations.
Customer defaults may have a material adverse effect on our business, financial condition and results of operations.
The majority of our revenues and income comes from rental income from real property. As such, our business, financial condition and results of operations could be adversely affected if our customers default on their lease obligations. Our ability to manage our assets is also subject to U.S. federal bankruptcy laws and state laws that limit creditors’ rights and remedies available to real property owners to collect delinquent rents. If a customer becomes insolvent or bankrupt, we cannot be sure that we could recover the premises from the customer promptly or from a trustee or debtor-in-possession in any bankruptcy proceeding relating to that customer. We also cannot be sure that we would receive rent in the proceeding sufficient to cover our expenses with respect to the premises. If a customer becomes bankrupt, the U.S. federal bankruptcy code will apply and, in some instances, may restrict the amount and recoverability of our claims against the customer. A customer’s default on its obligations may have a material adverse effect on our business, financial condition and results of operations.
Some of our leases provide customers with the right to terminate their leases early, which may have a material adverse effect on our business, financial condition and results of operations.
Certain of our leases permit our customers to terminate their leases as to all or a portion of their leased premises prior to their stated lease expiration dates under certain circumstances, such as providing notice by a certain date and, in most cases, paying a termination fee. To the extent that our customers exercise early termination rights, our cash flow and earnings may be adversely affected, and we can provide no assurances that we will be able to generate an equivalent amount of net effective rent by leasing the vacated space to new third-party customers. If our customers elect to terminate their leases early, it may have a material adverse effect on our business, financial condition and results of operations.
Our expenses may remain constant or increase, even if our revenues decrease, which may have a material adverse effect on our business, financial condition and results of operations.
Costs associated with our business, such as mortgage payments, real estate taxes, insurance premiums and maintenance costs, are relatively inelastic and generally do not decrease, but may increase, when a property is not fully occupied, rental rates decrease, a customer fails to pay rent or other circumstances cause a reduction in property revenues. As a result, if revenues drop, we may not be able to reduce our expenses accordingly, which may have a material adverse effect on our business, financial condition and results of operations.
Our property taxes could increase due to a change in property tax rates or a reassessment, which could impact our cash flows.
Even if we qualify as a REIT for U.S. federal income tax purposes, we will be required to pay state and local taxes on our properties. The real property taxes on our properties may increase as property tax rates change or as our properties are assessed or reassessed by taxing authorities. Therefore, the amount of property taxes we pay in the future may increase substantially. If the property taxes we pay increase, our financial condition, results of operations, cash flows, trading price of our common stock and
12
our ability to satisfy our principal and interest obligations and to pay dividends to our stockholders could be adversely affected, which may have a material adverse effect on our business, financial condition and results of operations.
Illiquidity of real estate may limit our ability to vary our portfolio.
Real estate investments are relatively illiquid. Our ability to vary our portfolio by selling properties and buying new properties in response to changes in economic and other conditions may therefore be limited. In addition, the Code limits our ability to sell our properties by imposing a penalty tax of 100% on the gain derived from prohibited transactions, which are generally defined as sales or other dispositions of property (other than foreclosure property) held primarily for sale in the ordinary course of a trade or business. The frequency of sales and the holding period of the property sold are two primary factors in determining whether the property sold fits within this definition. These considerations may limit our ability to sell our properties. If we must sell an investment, we cannot assure you that we will be able to dispose of the investment in the time period we desire or that the sales price of the investment will recoup or exceed our cost for the investment, or that the penalty tax would not be assessed, each of which may have a material adverse effect on our business, financial condition and results of operations.
Our portfolio is concentrated in five assets and, as a result, any adverse changes impacting any one of our properties may have a material adverse effect on our business, financial condition and results of operations.
As of December 31, 2016, four of our five assets, CityWestPlace, Greenway Plaza, Post Oak Central and San Felipe Plaza, individually accounted for more than 10% of our assets or rental revenue on a consolidated basis. Our revenue and funds available for distribution to our stockholders would be materially and adversely affected if any of these properties were materially damaged or destroyed. Additionally, our revenue and funds available for distribution to our stockholders would be materially adversely affected if customers at any of these properties experienced a downturn in their business, which could weaken their financial condition and result in their failure to make timely rental payments, defaulting under their leases or filing for bankruptcy. The significance of these properties in our portfolio means that any adverse change at any of these properties may have a material adverse effect on our business, financial condition and results of operations.
Competition for acquisitions may reduce the number of acquisition opportunities available to us and increase the costs of those acquisitions.
While our initial focus is to unlock internal embedded growth in our existing portfolio, we may acquire properties if we are presented with an attractive opportunity to do so. We may face competition for such acquisition opportunities from other investors, and such competition may adversely affect us by subjecting us to the following risks:
• | an inability to acquire a desired property because of competition from other well-capitalized real estate investors, including publicly traded and privately held REITs, private real estate funds, domestic and foreign financial institutions, life insurance companies, sovereign wealth funds, pension trusts, partnerships and individual investors; and |
• | an increase in the purchase price for such acquisition property in the event we are able to acquire such desired property. |
Accordingly, competition for acquisitions may limit our opportunities to grow, which may have a material adverse effect on our business, financial condition and results of operations.
We may acquire properties or portfolios of properties through tax deferred contribution transactions, which could result in stockholder dilution and limit our ability to sell such assets.
We may acquire properties or portfolios of properties through tax deferred contribution transactions in exchange for partnership interests in our Operating Partnership. These transactions can result in stockholder dilution. This acquisition structure can have the effect of, among other things, reducing the amount of tax depreciation we could deduct over the tax life of the acquired properties, and may require (and in the case of our properties, requires) that we agree to protect the contributors’ ability to defer recognition of taxable gain through restrictions on our ability to dispose of the acquired properties or the allocation of partnership debt to the contributors to maintain their tax bases. These restrictions could limit our ability to sell an asset at a time, or on terms, that would be favorable absent such restrictions, which may have a material adverse effect on our business, financial condition and results of operations.
13
We may face risks associated with future property acquisitions.
From time to time, we may pursue the acquisition of properties or portfolios of properties, including large portfolios that could further increase our size and result in changes to our capital structure. Our acquisition activities and their success are subject to the following risks:
• | acquisition agreements contain conditions to closing, which may include completion of due diligence to our satisfaction or other conditions that are not within our control, which may not be satisfied; |
• | necessary financing for such acquisitions may not be available on favorable terms or at all; |
• | acquisition, development or redevelopment projects may require the consent of third parties, such as anchor customers, mortgage lenders and joint venture partners, and such consents may be withheld; |
• | the diversion of management’s attention to the assimilation of the operations of the acquired businesses or assets; |
• | acquired properties may fail to perform as expected; |
• | difficulties in the integration of operations and systems and the inability to realize potential operating synergies; |
• | difficulties in the assimilation and retention of the personnel of the acquired companies; |
• | challenges in retaining customers; |
• | the actual costs of repositioning acquired properties may be higher than our estimates; |
• | adequate insurance coverage for new properties may not be available on favorable terms or at all; |
• | future acquisitions may result in unanticipated expenses or charges to earnings, including unanticipated operating expenses and depreciation or amortization expenses over the life of any assets acquired; |
• | we may not achieve the expected benefits of future acquisitions; |
• | acquired properties may be located in new markets where we face risks associated with incomplete knowledge or understanding of the local market and a limited number of established business relationships in the area; |
• | accounting, regulatory or compliance issues that could arise, including internal control over financial reporting; and |
• | acquired properties may be subject to liabilities and we may not have any recourse, or only limited recourse, to the transferor with respect to unknown liabilities, including liabilities for cleanup of undisclosed environmental contamination or non-compliance with environmental laws. As a result, if a claim were asserted against us based upon ownership of such properties, we might be required to pay a substantial sum, either in settlements or in damages, which could adversely affect our cash flow. |
Any of the foregoing may have a material adverse effect on our business, financial condition and results of operations.
We may be unable to develop new properties successfully, which could materially adversely affect our results of operations due to unexpected costs, delays and other contingencies.
From time to time, we may acquire unimproved real property for development purposes as market conditions warrant, with a joint venture partner or otherwise. In addition to the risks associated with the ownership of real estate investments in general, and investments in joint ventures specifically, there are significant risks associated with our development activities, including the following:
• | delays in obtaining, or an inability to obtain, necessary zoning, land-use, building, occupancy and other required governmental permits and authorizations, which could result in completion delays and increased development costs; |
• | incurrence of development costs for a property that exceed original estimates due to increased materials, labor or other costs, changes in development plans or unforeseen environmental conditions, which could make completion of the property more costly or uneconomical; |
• | abandonment of contemplated development projects or projects in which we have started development, and the failure to recover expenses and costs incurred through the time of abandonment which could result in significant expenses; |
• | risk of loss of periodic progress payments or advances to builders prior to completion; |
• | termination of leases by customers due to completion delays; |
• | failure to achieve expected occupancy levels, as the lease-up of space at our development projects may be slower than estimated; and |
• | other risks related to the lease-up of newly constructed properties. |
In addition, we also rely on rental income and expense projections and estimates of the fair market value of a property upon completion of construction when agreeing to a purchase price at the time we acquire unimproved real property. If our projections are inaccurate, including due to any of the risks described above, we may overestimate the purchase price for a property and be unable to charge rents that compensate us for our increased costs, which may have a material adverse effect on our business, financial condition and results of operations.
14
The Greenway Properties joint venture transaction may not be consummated on the terms or timeline currently contemplated, or at all.
Closing of the Greenway Properties joint venture transaction is subject to certain conditions under the Contribution Agreement, including performance in all material respects of each party’s pre-closing covenants and agreements contained in the Contribution Agreement, delivery of title insurance policies with respect to the Greenway Properties, certain local regulatory approvals, and consummation of certain pre-closing structuring in anticipation of the transaction, including the formation of a holding company subsidiary of the joint venture to be qualified as a REIT. We cannot provide assurances that the Greenway Properties joint venture transaction will be consummated on the terms or timeline currently contemplated, or at all, which may have a material adverse effect on our business, financial condition and results of operations.
We expect to co-invest in joint ventures with third parties from time to time, and such investments could be adversely affected by the capital markets, lack of sole decision-making authority, reliance on joint venture partners’ financial condition and any disputes that may arise between us and our joint venture partners.
On February 17, 2017, we entered into the Contribution Agreement pursuant to which, upon closing, we will own Greenway Plaza and Phoenix Tower through a joint venture with two other parties, CPPIB and TIAA/SP. Additionally, we may co-invest with third parties through other partnerships, joint ventures or other structures in which we acquire noncontrolling interests in, or share responsibility for, managing the affairs of a property, partnership, co-tenancy or other entity. Although we will own a majority interest in the Greenway Properties joint venture and manage its day-to-day operations, our joint venture partners will have customary approval rights over certain major decisions. We may not be in a position to exercise sole decision-making authority regarding the properties owned through this or other joint ventures or similar ownership structures. In addition, investments in joint ventures may, under certain circumstances, involve risks not present when a third party is not involved, including potential deadlocks in making major decisions, restrictions on our ability to exit the joint venture, reliance on joint venture partners and the possibility that a joint venture partner might become bankrupt or fail to fund its share of required capital contributions, thus exposing us to liabilities in excess of our share of the joint venture or jeopardizing our REIT status. The funding of our capital contributions to such joint ventures may be dependent on proceeds from asset sales, credit facility advances or sales of equity securities. Joint venture partners may have business interests or goals that are inconsistent with our business interests or goals, and may be in a position to take actions contrary to its policies or objectives. We may, in specific circumstances, be liable for the actions of our joint venture partners. In addition, any disputes that may arise between us and joint venture partners may result in litigation or arbitration that would increase our expenses. Any of the foregoing may have a material adverse effect on our business, financial condition and results of operations.
We, our customers and our properties are subject to various U.S. federal, state and local regulatory requirements, such as environmental laws, state and local fire and safety requirements, building codes and land use regulations.
We, our customers and our properties are subject to various U.S. federal, state and local regulatory requirements, such as environmental laws, state and local fire and safety requirements, building codes and land use regulations. Failure to comply with these requirements could subject us, or our customers, to governmental fines or private litigant damage awards. In addition, compliance with these requirements, including new requirements or stricter interpretation of existing requirements, may require us, or our customers, to incur significant expenditures. We do not know whether existing requirements will change or whether future requirements, including any requirements that may emerge from pending or future climate change legislation, will develop. Environmental noncompliance liability also could impact a customer’s ability to make rental payments to us. Furthermore, our reputation could be negatively affected if we violate environmental laws or regulations, which may have a material adverse effect on our business, financial condition and results of operations.
In addition, as a current or former owner or operator of real property, we may be subject to liabilities resulting from the presence of hazardous substances, waste or petroleum products at, on, under or emanating from such property, including investigation and cleanup costs, natural resource damages, third-party liability for cleanup costs, personal injury or property damage and costs or losses arising from property use restrictions. In particular, some of our properties are adjacent to or near other properties that have contained or currently contain underground storage tanks used to store petroleum products or other hazardous or toxic substances. In addition, certain of our properties are on, adjacent to or near sites upon which others, including former owners or customers of our properties, have engaged, or may in the future engage, in activities that have released or may have released petroleum products or other hazardous or toxic substances. Cleanup liabilities are often imposed without regard to whether the owner or operator knew of, or was responsible for, the presence of such contamination, and the liability may be joint and several. The presence of hazardous substances also may result in use restrictions on impacted properties or result in liens on contaminated sites in favor of the government for damages it incurs to address contamination. We also may be liable for the costs of removal or remediation of hazardous substances or waste disposal or treatment facilities if we arranged for disposal or treatment of hazardous substances at such facilities, whether or not we own such facilities. Moreover, buildings and other improvements on our properties
15
may contain asbestos-containing material or other hazardous building materials or could have indoor air quality concerns (e.g., from airborne contaminants such as mold), which may subject us to costs, damages and other liabilities including abatement cleanup, personal injury, and property damage liabilities. The foregoing could adversely affect occupancy and our ability to develop, sell or borrow against any affected property and could require us to make significant unanticipated expenditures that may have a material adverse effect on our business, financial condition and results of operations.
We may be materially adversely affected by laws, regulations or other issues related to climate change.
If we become subject to laws or regulations related to climate change, our business, financial condition and results of operations could be materially adversely affected. The federal government has enacted, and Houston or the state of Texas may enact, certain climate change laws and regulations which may, among other things, regulate “carbon footprints” and greenhouse gas emissions. Such laws and regulations could result in substantial compliance costs, retrofit costs and construction costs, including monitoring and reporting costs and capital expenditures for environmental control facilities and other new equipment. Furthermore, our reputation could be negatively affected if we violate climate change laws or regulations. We cannot predict how future laws and regulations, or future interpretations of current laws and regulations related to climate change will affect our business, financial condition and results of operations. Additionally, the potential physical impacts of climate change on our operations are highly uncertain and would be particular to Houston. These may include changes in rainfall and storm patterns and intensity, water shortages, changing sea levels and changing temperatures. These impacts may have a material adverse effect on our business, financial condition and results of operations.
Compliance or failure to comply with the Americans with Disabilities Act could result in substantial costs.
Our properties must comply with the ADA and any equivalent state or local laws, to the extent that our properties are public accommodations as defined under such laws. Under the ADA, all public accommodations must meet U.S. federal requirements related to access and use by disabled persons. If one or more of our properties is not in compliance with the ADA or any equivalent state or local laws, we may be required to incur additional costs to bring such property into compliance with the ADA or similar state or local laws. Noncompliance with the ADA or similar state and local laws could also result in the imposition of fines or an award of damages to private litigants. We cannot predict the ultimate amount of the cost of compliance with the ADA or any equivalent state or local laws. If we incur substantial costs to comply with the ADA or any equivalent state or local laws, it may have a material adverse effect on our business, financial condition and results of operations.
Our third-party management agreements are subject to the risk of termination and non-renewal.
Our third-party management agreements are subject to the risk of possible termination under certain circumstances, including our failure to perform as required under these agreements, and to the risk of non-renewal by the property owner upon expiration or renewal of such management agreements on terms less favorable to us than the terms of current management agreements. If management agreements are terminated, or are not renewed upon expiration, our expected revenues will decrease which may have a material adverse effect on our business, financial condition and results of operations.
Our Third-Party Services Business may subject us to certain liabilities.
We may hire and supervise third-party contractors to provide construction, engineering and various other services for properties we are managing on behalf of third-party clients. Depending upon (1) the terms of our contracts with third-party clients, which, for example, may place us in the position of a principal rather than an agent, or (2) the responsibilities we assume or are legally deemed to have assumed in the course of a client engagement (whether or not memorialized in a contract), we may be subjected to, or become liable for, claims for construction defects, negligent performance of work or other similar actions by third parties we do not control. Adverse outcomes of property management disputes or litigation could negatively impact our business, financial condition and results of operations, particularly if we have not limited in our contracts the extent of damages to which we may be liable for the consequences of our actions, or if our liabilities exceed the amounts of the commercial third-party insurance that we carry. Moreover, our clients may seek to hold us accountable for the actions of contractors because of our role as property manager, even if we have technically disclaimed liability as a legal matter, in which case we may find it commercially prudent to participate in a financial settlement for purposes of preserving the client relationship.
Acting as a principal may also mean that we pay a contractor before we have been reimbursed by the client, which exposes us to additional risks of collection from the client in the event of an intervening bankruptcy or insolvency of the client. The reverse can occur as well, where a contractor that we have paid files for bankruptcy or commits fraud before completing a project for which we have paid it in part or in full. As part of our project management business, we are responsible for managing the various contractors required for a project, including general contractors, in order to ensure that the cost of a project does not exceed the contract price and that the project is completed on time. In the event that one of the other contractors on the project does not or
16
cannot perform as a result of bankruptcy or for any other reason, we may be responsible for cost overruns as well as the consequences for late delivery. In the event that we have not accurately estimated our own costs of providing services under warranted or guaranteed cost contracts, we may lose money on such contracts until such time as we can legally terminate them, which may have a material adverse effect on our business, financial condition and results of operations.
We are required to maintain certain licenses to conduct our Third-Party Services Business.
Our Third-Party Services Business, which involves the brokerage of real estate leasing transactions and property management, requires us to maintain licenses in various jurisdictions in which we operate and to comply with particular regulations in such jurisdictions. If we fail to maintain our licenses or conduct regulated activities without a license or in contravention of applicable regulations, we may be required to pay fines or return commissions, which may have a material adverse effect on our business, financial condition and results of operations.
As a licensed real estate service provider and advisor in various jurisdictions, we may be subject to various due diligence, disclosure, standard-of-care, anti-money laundering and other obligations in the jurisdictions in which we operate our Third-Party Services Business. Failure to fulfill these obligations could subject us to litigation from parties who leased properties we brokered or managed. We could become subject to claims by participants in real estate sales or other services claiming that we did not fulfill our obligations as a service provider or broker. This may include claims with respect to conflicts of interest where we are acting, or are perceived to be acting, for two or more clients with potentially contrary interests. Any such claims may have a material adverse effect on our business, financial condition and results of operations.
Our assets may be subject to impairment charges.
We regularly review our real estate assets for impairment, and based on these reviews, we may record impairment losses that have a material adverse effect on our business, financial condition and results of operations. Negative or uncertain market and economic conditions, as well as market volatility, increase the likelihood of incurring impairment losses. Such impairment losses may have a material adverse effect on our business, financial condition and results of operations.
Uninsured and underinsured losses may adversely affect our operations.
We, or in certain instances, customers at our properties, carry comprehensive commercial general liability, fire, extended coverage, business interruption, rental loss coverage, environmental and umbrella liability coverage on all of our properties. We also carry wind and flood coverage on properties in areas where we believe such coverage is warranted, in each case with limits of liability that we deem adequate. Similarly, we are insured against the risk of direct physical damage in amounts we believe to be adequate to reimburse us, on a replacement cost basis, for costs incurred to repair or rebuild each property, including loss of rental income during the reconstruction period. However, we may be subject to certain types of losses that are generally uninsured losses, including, but not limited to losses caused by riots, war or acts of God. In the event of substantial property loss, the insurance coverage may not be sufficient to pay the full current market value or current replacement cost of the property. In the event of an uninsured loss, we could lose some or all of our capital investment, cash flow and anticipated profits related to one or more properties. Inflation, changes in building codes and ordinances, environmental considerations and other factors also might make it not feasible to use insurance proceeds to replace a property after it has been damaged or destroyed. Under such circumstances, the insurance proceeds we receive might not be adequate to restore our economic position with respect to such property, which may have a material adverse effect on our business, financial condition and results of operations.
We may be subject to litigation, which could have a material adverse effect on our financial condition.
We may be subject to litigation, including claims related to our assets and operations that are otherwise in the ordinary course of business. Some of these claims may result in significant defense costs and potentially significant judgments against us, some of which we may not be insured against. While we generally intend to vigorously defend ourselves against such claims, we cannot be certain of the ultimate outcomes of claims that may be asserted against us. Unfavorable resolution of such litigation may result in our having to pay significant fines, judgments, or settlements, which, if uninsured—or if the fines, judgments and settlements exceed insured levels—would adversely impact our earnings and cash flows, thereby negatively impacting our ability to service debt and pay dividends to our stockholders, which may have a material adverse effect on our business, financial condition and results of operations. Certain litigation, or the resolution of certain litigation, may affect the availability or cost of some of our insurance coverage, expose us to increased risks that would be uninsured, or adversely impact our ability to attract officers and directors, each of which may have a material adverse effect on our business, financial condition and results of operations.
17
Our business could be materially adversely affected by security breaches through cyber-attacks, cyber intrusions or otherwise.
We face risks associated with security breaches, whether through cyber-attacks or cyber intrusions, malware, computer viruses, attachments to e-mails, persons inside our organization or persons with access to systems inside our organization and other significant disruptions of our information technology networks and related systems. These risks include operational interruptions, private data exposure and damage to our relationships with our customers, among other things. There can be no assurance that our efforts to maintain the security and integrity of our information technology networks and related systems will be effective. A security breach involving our networks and related systems could disrupt our operations in numerous ways that may have a material adverse effect on our business, financial condition and results of operations.
If we are unable to satisfy the regulatory requirements of the Sarbanes-Oxley Act, or if our disclosure controls or internal control over financial reporting is not effective, investors could lose confidence in our reported financial information, which could adversely affect the perception of our business and the trading price of our common stock.
As a public company, we are subject to the reporting requirements of the Exchange Act, the Sarbanes-Oxley Act and the Dodd-Frank Act and are required to prepare our financial statements in accordance with the rules and regulations promulgated by the SEC. The design and effectiveness of our disclosure controls and procedures and internal control over financial reporting may not prevent all errors, misstatements or misrepresentations. Although management will continue to review the effectiveness of our disclosure controls and procedures and internal controls over financial reporting, there can be no guarantee that our internal controls over financial reporting will be effective in accomplishing all of our control objectives. If we are not able to comply with these and other requirements in a timely manner, or if we or our independent registered public accounting firm identify deficiencies in our internal controls over financial reporting that are deemed to be material weaknesses, the market price of shares of our common stock could decline and we could be subject to sanctions or investigations by the NYSE, the SEC or other regulatory authorities, which may have a material adverse effect on our business, financial condition and results of operations.
The success of our business depends on retaining officers and employees.
Our continued success depends to a significant degree upon the contributions of certain key personnel of the Company who would be difficult to replace. Although we entered into employment agreements with executive officers in December 2016, we cannot provide any assurance that they, including our senior management, will remain employed by us. Our ability to retain our executive officers, or to attract suitable replacements should they leave, is dependent on the competitive nature of the employment market. The loss of their services may have a material adverse effect on our business, financial condition and results of operations.
We have a significant amount of indebtedness and may need to incur more in the future.
As of December 31, 2016, we had $793.2 million of total outstanding indebtedness. In addition, in connection with executing our business strategies going forward, we expect to continue to evaluate the possibility of acquiring additional properties and making strategic investments, and we may elect to finance these endeavors by incurring additional indebtedness. The amount of such indebtedness could have material adverse consequences for us, including:
• | hindering our ability to adjust to changing market, industry or economic conditions; |
• | limiting our ability to access the capital markets to raise additional equity or refinance maturing debt on favorable terms or to fund acquisitions or emerging businesses; |
• | limiting the amount of free cash flow available for future operations, acquisitions, dividends, stock repurchases or other uses; |
• | making us more vulnerable to economic or industry downturns, including interest rate increases; and |
• | placing us at a competitive disadvantage compared to less leveraged competitors. |
Moreover, to respond to competitive challenges, we may be required to raise substantial additional capital to execute our business strategy. Our ability to arrange additional financing will depend on, among other factors, our financial position and performance, as well as prevailing market conditions and other factors beyond our control. If we are able to obtain additional financing, our credit ratings could be further adversely affected, which could further raise our borrowing costs and further limit our future access to capital and our ability to satisfy our obligations under our indebtedness, which may have a material adverse effect on our business, financial condition and results of operations.
18
We have existing debt and refinancing risks that could affect our cost of operations.
We have both fixed and variable rate indebtedness and may incur additional indebtedness in the future, including borrowings under a $350 million term loan facility (the “Term Loan”) and the Revolving Credit Facility (together with the Term Loan, the “Credit Facility”), to finance possible acquisitions and for general corporate purposes. As a result, we are, and expect to be, subject to the risks normally associated with debt financing including:
• | that interest rates may rise; |
• | that our cash flow will be insufficient to make required payments of principal and interest; |
• | that we will be unable to refinance some or all of our debt; |
• | that any refinancing will not be on terms as favorable as those of our existing debt; |
• | that required payments on mortgages and on our other debt are not reduced if the economic performance of any property declines; |
• | that debt service obligations will reduce funds available for distribution to our stockholders; |
• | that any default on our debt, due to noncompliance with financial covenants or otherwise, could result in acceleration of those obligations; |
• | that we may be unable to refinance or repay the debt as it becomes due; and |
• | that if our degree of leverage is viewed unfavorably by lenders or potential joint venture partners, it could affect our ability to obtain additional financing. |
If we are unable to repay or refinance our indebtedness as it becomes due, we may need to sell assets or to seek protection from our creditors under applicable law, which may have a material adverse effect on our business, financial condition and results of operations.
Our governing documents do not limit the amount of indebtedness we may incur and we may become more highly leveraged.
Our Articles of Amendment and Restatement (“Charter”) and Amended and Restated Bylaws (“Bylaws”) do not limit the amount of indebtedness we may incur. Accordingly, our board of directors may permit us to incur additional debt and would do so, for example, if it were necessary to maintain our status as a REIT. We might become more highly leveraged as a result, and our financial condition, results of operations and funds available for distribution to stockholders might be negatively affected, and the risk of default on our indebtedness could increase, which may have a material adverse effect on our business, financial condition and results of operations.
The cost and terms of mortgage financings may render the sale or financing of a property difficult or unattractive.
The sale of a property subject to a mortgage loan may trigger pre-payment penalties, yield maintenance payments or make-whole payments to the lender, which would reduce the amount of gain or increase our loss on the sale of a property and could make the sale of a property less likely. Certain of our mortgage loans will have significant outstanding principal balances on their maturity dates, commonly known as “balloon payments.” There is no assurance that we will be able to refinance such balloon payments upon the maturity of the loans, which may force disposition of properties on disadvantageous terms or require replacement with debt with higher interest rates, either of which would have an adverse impact on our financial condition and results of operations. Additionally, at the time a loan matures, the property may be worth less than the loan amount and, as a result, we may determine not to refinance the loan and permit foreclosure, generating a loss. Any such losses may have a material adverse effect on our business, financial condition and results of operations.
Financial covenants could materially adversely affect our ability to conduct our business.
The credit agreement governing the Credit Facility contains restrictions on the amount of debt we may incur and other restrictions and requirements on its operations. These restrictions, as well as any additional restrictions to which we may become subject in connection with additional financings or refinancings, could restrict our ability to pursue business initiatives, effect certain transactions or make other changes to our business that may otherwise be beneficial to us, which could adversely affect our results of operations. In addition, violations of these covenants could cause declarations of default under, and acceleration of, any related indebtedness, which would result in adverse consequences to our financial condition. The credit agreement contains cross-default provisions that give the lenders the right to declare a default if we are in default resulting in (or permitting the) acceleration of other debt under other loans in excess of certain amounts. In the event of a default, we may be required to repay such debt with capital from other sources, which may not be available to us on attractive terms, or at all, which may have a material adverse effect on our business, financial condition and results of operations.
19
Mortgage debt obligations expose us to the possibility of foreclosure, which could result in the loss of our investment in a property or group of properties subject to mortgage debt.
Incurring mortgage and other secured debt obligations increases our risk of property losses because defaults on indebtedness secured by properties may result in foreclosure actions initiated by lenders and ultimately our loss of the property securing any loans for which we are in default. Any foreclosure on a mortgaged property or group of properties could adversely affect the overall value of our portfolio of properties (or portions thereof).
For tax purposes, a foreclosure of any of our properties that is subject to a nonrecourse mortgage loan generally would be treated as a sale of the property for a purchase price equal to the outstanding balance of the debt secured by the mortgage. If the outstanding balance of the debt secured by the mortgage exceeds our tax basis in the property, we would recognize taxable income on foreclosure, but would not receive any cash proceeds, which could hinder our ability to satisfy the distribution requirements applicable to REITs under the Code. Foreclosures could also trigger our tax indemnification obligations under the terms of our agreements with certain continuing investors with respect to sales of certain properties, which may have a material adverse effect on our business, financial condition and results of operations.
We depend on external sources of capital that are outside of our control, which may affect our ability to pursue strategic opportunities, refinance or repay our indebtedness and make distributions to our stockholders.
In order to qualify to be taxed as a REIT, we generally must distribute annually at least 90% of our “REIT taxable income,” subject to certain adjustments and excluding any net capital gain, to our stockholders. Because of this distribution requirement, it is not likely that we will be able to fund all future capital needs from income from operations. As a result, when we engage in the development or acquisition of new properties or expansion or redevelopment of existing properties, we will continue to rely on third-party sources of capital, including lines of credit, collateralized or unsecured debt (both construction financing and permanent debt) and equity issuances. Our access to third-party sources of capital depends on a number of factors, including general market conditions, the market’s view of the quality of our assets, the market’s perception of our growth potential, our current debt levels and our current and expected future earnings. There can be no assurance that we will be able to obtain the financing necessary to fund our current or new developments or project expansions or our acquisition activities on terms favorable to us or at all. If we are unable to obtain a sufficient level of third-party financing to fund our capital needs, our ability to make distributions to our stockholders may be adversely affected which may have a material adverse effect on our business, financial condition and results of operations.
We may amend our investment strategy and business policies without stockholder approval.
Our board of directors may change our investment strategy or any of our investment guidelines, financing strategy or leverage policies with respect to investments, developments, acquisitions, growth, operations, indebtedness, capitalization and dividends at any time without the consent of our stockholders, which could result in an investment portfolio with a different risk profile. Such a change in our strategy may increase our exposure to interest rate risk, default risk and real estate market fluctuations, among other risks. These changes could adversely affect our ability to pay dividends to our stockholders, and may have a material adverse effect on our business, financial condition and results of operations.
TPG Pantera is a significant stockholder and may have conflicts of interest with us in the future.
As of December 31, 2016, TPG VI Pantera Holdings, L.P. (“TPG Pantera”) and TPG VI Management, LLC (“TPG Management,” and together with TPG Pantera, the “TPG Parties”) owned approximately 9.8% of our issued and outstanding common stock. In addition, pursuant to the stockholders agreement, dated October 7, 2016, among us and the TPG Parties (the “Stockholders Agreement”), so long as TPG Pantera (together with its affiliates, other than portfolio companies of TPG Pantera or its affiliates) beneficially owns at least 5% of our issued and outstanding common stock, the TPG Parties will have preemptive rights to participate in our future equity issuances, subject to certain conditions. This concentration of ownership in one group of stockholders, together with the contractual ability for these stockholders to acquire additional shares, could potentially be disadvantageous to other stockholders’ interests. If the TPG Parties were to sell or otherwise transfer all or a large percentage of their holdings, our stock price could decline and we could find it difficult to raise capital, if needed, through the sale of additional equity securities.
Additionally, the interests of the TPG Parties may differ from the interests of our other stockholders in material respects. For example, the TPG Parties may have an interest in directly or indirectly pursuing acquisitions, divestitures, financings or other transactions that, in the TPG Parties’ judgment, could enhance their other equity investments, even though such transactions might involve risks to us. The TPG Parties are in the business of making or advising on investments in companies and may from time to time in the future acquire interests in, or provide advice to, businesses that directly or indirectly compete with certain portions
20
of our business. The TPG Parties may also pursue acquisition opportunities that may be complementary to our business, and, as a result, those acquisition opportunities may not be available to us, which may have a material adverse effect on our business, financial condition and results of operations.
The Stockholders Agreement with the TPG Parties grants TPG Pantera certain rights that may restrain our ability to take various actions in the future.
On October 7, 2016, we entered into the Stockholders Agreement, pursuant to which we granted TPG Pantera certain board rights, which could allow TPG Pantera to influence our board of directors. Under the Stockholders Agreement, we have granted TPG Pantera the right to nominate a specified number of directors to our board of directors and to have a specified number of such directors appointed to the compensation committee of our board of directors (the “Compensation Committee”) and the investment committee of our board of directors (the “Investment Committee”) for so long as TPG Pantera (together with its affiliates, other than portfolio companies of TPG Pantera or its affiliates) beneficially owns at least 2.5% of the outstanding shares of our common stock. TPG is entitled to nominate to our board of directors (i) three directors if TPG Pantera’s beneficial ownership of the issued and outstanding shares of our common stock is at least 30%, (ii) two directors if TPG Pantera’s beneficial ownership of the issued and outstanding shares of our common stock is at least 5% but less than 30% and (iii) one director if TPG Pantera’s beneficial ownership of the issued and outstanding shares of our common stock is at least 2.5% but less than 5%. In addition, we have agreed to constitute our Investment Committee as a four member committee and (i) for so long as TPG Pantera (together with its affiliates, other than portfolio companies of TPG Pantera or its affiliates) beneficially owns at least 5% of the issued and outstanding shares of our common stock, TPG Pantera will have the right to have two of its designees to our board of directors appointed to the Investment Committee and one of its designees to our board of directors appointed to the Compensation Committee; and (ii) for so long as TPG Pantera (together with its affiliates, other than portfolio companies of TPG Pantera or its affiliates) beneficially owns at least 2.5% but less than 5% of the issued and outstanding shares of our common stock, TPG will have the right to have one of its designees to our board of directors appointed to the Investment Committee and the Compensation Committee. Pursuant to the terms of the Stockholders Agreement, so long as TPG Pantera (together with its affiliates, other than portfolio companies of TPG Pantera or its affiliates) beneficially owns at least 5% of the outstanding shares of our common stock, other than in connection with any change in control of us, TPG Pantera also will have the right to consent to any change in the size or rights and responsibilities of either our Investment Committee or the Compensation Committee and to certain other matters. The ability of TPG Pantera to influence our board of directors may have a material adverse effect on our business, financial condition and results of operations.
Mr. James A. Thomas, the chairman of our board of directors, is a significant stockholder and may have interests that differ from our other stockholders.
Mr. James A. Thomas, the chairman of our board of directors, is a significant stockholder on a fully diluted basis. Concurrently with the execution of the Merger Agreement, Legacy Parkway and Parkway LP entered into a letter agreement (the “Thomas Letter Agreement”) with Mr. Thomas, then chairman of the Legacy Parkway board of directors, and certain unitholders of Parkway LP who are affiliated with Mr. Thomas (together with Mr. Thomas, the “Thomas Parties”) relating to certain governance rights of Mr. Thomas, certain tax protection arrangements, and registration rights. Pursuant to the Separation and Distribution Agreement, the Thomas Letter Agreement is binding on us. Among other things, the Thomas Letter Agreement provides that Legacy Parkway would cause Mr. Thomas to be appointed as our chairman and that Legacy Parkway would modify certain existing tax protection agreements in favor of Mr. Thomas. While, as our director, Mr. Thomas has a fiduciary duty to us and our stockholders, Mr. Thomas’ interests may differ from the interests of our other stockholders and, given his significant ownership in us, he may influence opportunities that have an effect on our business, financial condition and results of operations.
Risks Related to the Separation, the UPREIT Reorganization and the Spin-Off
Our business and operating results could be negatively affected if we are unable to successfully integrate the Houston businesses previously owned by Cousins and Parkway.
The Merger involved the combination of two companies which previously operated as independent public companies. The Separation, the UPREIT Reorganization and the Spin-Off involved the separation, reorganization and distribution of the assets of two companies that previously operated as independent public companies. Our management team has devoted and will continue to devote significant management attention and resources to post-closing activities. Potential difficulties we may encounter in the integration process and related post-closing activities include the following:
• | difficulties in the integration of operations and systems of the Houston businesses previously owned by Cousins and Legacy Parkway; |
• | the inability to realize potential operating synergies; |
21
• | the failure by us to retain key employees; |
• | the complexities of combining two companies with different histories, cultures, regulatory restrictions, markets and customer bases; |
• | accounting, regulatory or compliance issues that could arise, including internal control over financial reporting; |
• | potential unknown liabilities and unforeseen increased expenses, delays or regulatory conditions associated with the Merger, the Separation, the UPREIT Reorganization and the Spin-Off; and |
• | challenges in retaining the customers of each of Cousins and Legacy Parkway after the Spin-Off. |
For all these reasons, you should be aware that it is possible that the integration process, the Separation, the UPREIT Reorganization and the Spin-Off or the related post-closing activities could result in the distraction of our management, the disruption of our ongoing business or inconsistencies in our services, standards, controls, procedures and policies, any of which could adversely affect our ability to maintain relationships with customers, vendors and employees or to achieve the anticipated benefits of the Separation, the UPREIT Reorganization and the Spin-Off, which may have a material adverse effect on our business, financial condition and results of operations.
We have no operating history as an independent company, and our historical and pro forma financial information is not necessarily representative of the results that we would have achieved as a separate, publicly traded company and may not be a reliable indicator of our future results.
The historical information about our business in this Annual Report on Form 10-K refers to Cousins’ portion of the Houston Business as operated and integrated with Legacy Parkway’s portion of the Houston Business. Our historical and pro forma financial information included in this report is derived from the consolidated financial statements and accounting records of Cousins and Legacy Parkway. Accordingly, the historical and pro forma financial information included in this report does not necessarily reflect the financial condition, results of operations or cash flows that we would have achieved as a separate, publicly traded company during the periods presented, or those that we will achieve in the future. Factors which could cause our results to materially differ from those reflected in such historical and pro forma financial information and which may adversely impact our ability to achieve similar results in the future may include, but are not limited to, the following:
• | the financial results in this report do not reflect all of the expenses we will incur as a public company; |
• | prior to the Separation, the UPREIT Reorganization and the Spin-Off, our business was operated by Legacy Parkway and Cousins as part of their respective corporate organizations. We will need to make investments to replicate or outsource from other providers certain facilities, systems, infrastructure, and personnel to which we will no longer have access after the Spin-Off, which will be costly; |
• | after the Spin-Off, we are unable to use Legacy Parkway’s and Cousins’ economies of scope and scale in procuring various goods and services and in maintaining vendor and customer relationships. Although we entered into the Separation and Distribution Agreement, which provides for certain transition-related arrangements between us and Cousins, these arrangements may not fully capture the benefits we have previously enjoyed as a result of our business being integrated within the businesses of Legacy Parkway and Cousins and may result in us paying higher charges than in the past for necessary services; |
• | prior to the Separation, the UPREIT Reorganization and the Spin-Off, our working capital requirements and capital for our general corporate purposes, including acquisitions, research and development, and capital expenditures, were satisfied as part of the corporation-wide cash management policies of Cousins and Legacy Parkway. Following the Spin-Off, while we have entered into the Credit Facility, we may need to obtain additional financing from banks, through public offerings or private placements of debt or equity securities, strategic relationships or other arrangements, which may not be on terms as favorable to those obtained by Cousins or Legacy Parkway, and the cost of capital for our business may be higher than Cousins’ or Legacy Parkway’s cost of capital prior to the Separation, the UPREIT Reorganization and the Spin-Off, which may have a material adverse effect on our business, financial condition and results of operations; and |
• | our cost structure, management, financing and business operations will be significantly different as a result of operating as an independent public company. These changes will result in increased costs, including, but not limited to, legal, accounting, compliance and other costs associated with being a public company with equity securities traded on the NYSE. |
Other significant changes may occur in our cost structure, management, financing and business operations as a result of our status as an independent company, which may result in greater than anticipated costs. For additional information about the past financial performance of our business and the basis of presentation of the historical combined financial statements and the unaudited pro forma combined financial statements of our business, please see “Selected Historical Consolidated Financial Data—Parkway, Inc.,” “Selected Historical Combined Financial Data—Parkway Houston,” “Selected Historical Combined Financial
22
Data—Cousins Houston,” “Management’s Discussion and Analysis of Financial Condition and Results of Operations” and the historical financial statements and accompanying notes included in this Annual Report on Form 10-K.
Cousins may fail to perform under various transaction agreements that were executed as part of the Separation, the UPREIT Reorganization and the Spin-Off, or we may fail to have necessary systems and services in place when certain of the transaction agreements expire.
Prior to the effective time of the Merger, we entered into agreements with Cousins in connection with the Separation, the UPREIT Reorganization and the Spin-Off including the Separation and Distribution Agreement, the Employee Matters Agreement (the “Employee Matters Agreement”) and the Tax Matters Agreement (the “Tax Matters Agreement”), each dated as of October 5, 2016, among us, Legacy Parkway, Cousins and certain other parties thereto. Certain of these agreements provide for the performance of services by each company for the benefit of the other for a period of time after the Spin-Off. We rely on Cousins to satisfy its performance and payment obligations under such agreements. If Cousins is unable to satisfy such obligations, including its indemnification obligations, we could incur operational difficulties or losses, which may have a material adverse effect on our business, financial condition and results of operations.
If we do not have in place similar agreements with other providers of these services when the transaction agreements terminate and we are not able to provide these services internally, we may not be able to operate our business effectively and our profitability may decline, which may have a material adverse effect on our business, financial condition and results of operations.
Potential indemnification liabilities owed to Cousins pursuant to the Separation and Distribution Agreement may have a material adverse effect on our business, financial condition and results of operations.
The Separation and Distribution Agreement provides for, among other things, the principal corporate transactions required to effect the Separation, the UPREIT Reorganization and the Spin-Off, certain conditions to the Separation, the UPREIT Reorganization and the Spin-Off and provisions governing our relationship with Cousins with respect to and following the Spin-Off. Among other things, the Separation and Distribution Agreement provides for indemnification obligations designed to make us financially responsible for substantially all liabilities that may exist related to our business activities, whether incurred prior to or after the Spin-Off, as well as certain obligations of Cousins that we assumed pursuant to the Separation and Distribution Agreement. If we are required to indemnify Cousins under the circumstances set forth in the Separation and Distribution Agreement, we may be subject to substantial liabilities, which may have a material adverse effect on our business, financial condition and results of operations.
Certain of our directors may have actual or potential conflicts of interest because of their previous or continuing equity interests in, or positions at, Cousins.
Certain of our directors are persons who have previously served as directors of Cousins or who may own Cousins common stock or other equity awards. Even though our board of directors consists of a majority of independent directors, we expect that certain of our directors will continue to have a financial interest in Cousins common stock. Continued ownership of Cousins common stock or other equity awards could create, or appear to create, potential conflicts of interest, which may have a material adverse effect on our business, financial condition and results of operations.
We may not achieve some or all of the expected benefits of the Separation, the UPREIT Reorganization and the Spin-Off, which may have a material adverse effect on our business, financial condition and results of operations.
We may not be able to achieve the full strategic and financial benefits expected to result from the Separation, the UPREIT Reorganization and the Spin-Off, or such benefits may be delayed due to a variety of circumstances, not all of which may be under our control.
We may not achieve the anticipated benefits of the Separation, the UPREIT Reorganization and the Spin-Off for a variety of reasons, including, among others: (i) diversion of management’s attention from operating and growing our business; (ii) disruption of our ongoing business or inconsistencies in our services, standards, controls, procedures and policies, which could adversely affect our ability to maintain relationships with customers; (iii) increased susceptibility to market fluctuations and other adverse events following the Separation, the UPREIT Reorganization and the Spin-Off; and (iv) lack of diversification in our business, compared to Legacy Parkway’s or Cousins’ businesses prior to the Separation, the UPREIT Reorganization and the Spin-Off. Failure to achieve some or all of the benefits expected to result from the Separation, the UPREIT Reorganization and the Spin-Off, or a delay in realizing such benefits, may have a material adverse effect on our business, financial condition and results of operations.
23
Our agreements with Cousins in connection with the Separation, the UPREIT Reorganization and the Spin-Off involve conflicts of interest, and we may have received better terms from unaffiliated third parties than the terms received in these agreements.
Because the Separation, the UPREIT Reorganization and the Spin-Off involved the combination and division of certain businesses previously owned by Legacy Parkway and Cousins into two independent companies, we entered into certain agreements with Cousins to provide a framework for our relationship with Cousins following the Separation, the UPREIT Reorganization and the Spin-Off, including the Separation and Distribution Agreement, the Tax Matters Agreement and the Employee Matters Agreement. The terms of these agreements were determined while portions of our business were still owned by Cousins and Legacy Parkway and were negotiated by persons who were employees, officers or directors of Legacy Parkway, Cousins or their respective subsidiaries prior to the Separation, the UPREIT Reorganization and the Spin-Off, or who are employees, officers or directors of Cousins following the effective time of the Merger, and, accordingly, may have conflicts of interest. For example, during the period in which the terms of these agreements were negotiated, our board of directors was not independent of Legacy Parkway or Cousins. As a result, the terms of those agreements may not reflect terms that would have resulted from arm’s-length negotiations between unaffiliated third parties, which may have a material adverse effect on our business, financial condition and results of operations.
Pursuant to the Separation and Distribution Agreement, Cousins will indemnify us for certain pre-Spin-Off liabilities and liabilities related to Cousins’ assets. However, there can be no assurance that these indemnities will be sufficient to insure us against the full amount of such liabilities, or that Cousins’ ability to satisfy its indemnification obligation will not be impaired in the future.
Pursuant to the Separation and Distribution Agreement, Cousins will indemnify us for certain liabilities. However, third parties could seek to hold us responsible for any of the liabilities that Cousins retains, and there can be no assurance that Cousins will be able to fully satisfy its indemnification obligations to us. Moreover, even if we ultimately succeed in recovering from Cousins any amounts for which we were held liable by such third parties, any indemnification received may be insufficient to fully offset the financial impact of such liabilities or we may be temporarily required to bear these losses while seeking recovery from Cousins, which may have a material adverse effect on our business, financial condition and results of operations.
Risks Related to Our Status as a REIT
Failure to qualify to be taxed as a REIT, or failure to remain qualified as a REIT, would cause us to be subject to U.S. federal income tax as a regular corporation and could cause us to face substantial tax liability, which would substantially reduce funds available for distribution to our stockholders.
We intend to elect and qualify to be taxed as a REIT beginning with our short taxable year that commenced on the day prior to the Spin-Off and ended December 31, 2016, upon the filing of our U.S. federal income tax return for such year. We believe that we have been organized, and have operated and will continue to operate in such a manner as to qualify for taxation as a REIT. To qualify as a REIT we must satisfy numerous requirements (some on an annual and quarterly basis) established under the highly technical and complex provisions of the Code applicable to REITs, which include:
• | maintaining ownership of specified minimum levels of real estate related assets; |
• | generating specified minimum levels of real estate related income; |
• | maintaining certain diversity of ownership requirements with respect to our Capital Stock; and |
• | distributing at least 90% of our “REIT taxable income,” subject to certain adjustments and excluding any net capital gain on an annual basis. |
Only limited judicial and administrative interpretations exist of the REIT rules. Certain facts and circumstances not entirely within our control may affect our ability to qualify as a REIT. In addition, we can provide no assurance that legislation, new regulations, administrative interpretations, or court decisions will not adversely affect our qualification as a REIT or the U.S. federal income tax consequences of our REIT status.
If we were to fail to qualify as a REIT in any taxable year, we would face serious tax consequences that would substantially reduce the funds available for distributions to our stockholders because:
• | we would not be allowed a deduction for dividends paid to stockholders in computing our taxable income and would be subject to U.S. federal income tax at regular corporate rates; |
• | we could be subject to the U.S. federal alternative minimum tax and possibly increased state and local taxes; and |
• | unless we were entitled to relief under certain U.S. federal income tax laws, we would not be able to re-elect REIT status until the fifth calendar year after the year in which we failed to qualify as a REIT. |
24
In addition, if we were to fail to qualify as a REIT, we would no longer be required to make distributions. Any corporate tax liability imposed as a result of our failure to qualify as a REIT could be substantial and would reduce the amount of funds available for distribution to our stockholders. As a result of all these factors, our failure to qualify as a REIT could adversely affect the value of, and trading prices for, our common stock, and could have a material adverse effect on our business, financial condition and results of operations.
If our Operating Partnership failed to qualify as a partnership for U.S. federal income tax purposes, we would cease to qualify as a REIT and suffer other adverse consequences.
We believe that our Operating Partnership is properly treated as a partnership for U.S. federal income tax purposes. As a partnership, our Operating Partnership is not subject to U.S. federal income tax on its income. Instead, each of its partners, including us, is allocated, and may be required to pay tax with respect to, its share of our Operating Partnership's income. We cannot assure you, however, that the Internal Revenue Service (“IRS”) will not challenge the status of our Operating Partnership or any other subsidiary partnerships in which we own an interest as a partnership for U.S. federal income tax purposes, or that a court would not sustain such a challenge. If the IRS were successful in treating our Operating Partnership or certain of our other subsidiary partnerships as an entity taxable as a corporation for U.S. federal income tax purposes, we would fail to meet the gross income tests and certain of the asset tests applicable to REITs and, accordingly, we would likely cease to qualify as a REIT. Also, the failure of our Operating Partnership or any subsidiary partnerships to qualify as a partnership would cause it to become subject to U.S. federal and state corporate income tax, which could reduce significantly the amount of cash available for debt service and for distribution to its partners, including us.
If either Cousins or Legacy Parkway failed, or fails, to qualify as a REIT in its 2012 through 2016 taxable years, we would be prevented from electing to qualify as a REIT for several years.
We believe that, from the time of our formation until the issuance of our non-voting preferred stock to Cousins LP in the UPREIT Reorganization, we were a “qualified REIT subsidiary” of Cousins. Under applicable Treasury Regulations, if either Cousins or Legacy Parkway failed to qualify as a REIT in its 2012 through 2016 taxable years, unless Cousins’ or Legacy Parkway’s failure was subject to relief under U.S. federal income tax laws, we would be prevented from electing to qualify as a REIT prior to the fifth calendar year following the year in which Cousins or Legacy Parkway failed to qualify. Failure to qualify as a REIT would have a material adverse effect on our business, financial condition and results of operations.
Even if we qualify as a REIT, we may face other tax liabilities that reduce our cash flows.
Even if we qualify for taxation as a REIT, we may be subject to certain U.S. federal, state and local taxes on our income and assets, including taxes on any undistributed income, tax on income from some activities conducted as a result of a foreclosure, and state or local income, property and transfer taxes. Moreover, if we have net income from “prohibited transactions,” that income will be subject to a 100% tax. In addition, we could, in certain circumstances, be required to pay an excise or penalty tax (which could be significant in amount) in order to utilize one or more relief provisions under the Code to maintain our qualification as a REIT. Any of these taxes would decrease cash available for the payment of our debt obligations and distributions to stockholders. Moreover, our taxable REIT subsidiary (“TRS”) generally will be subject to U.S. federal corporate income tax on its net taxable income.
In addition, for U.S. federal income tax purposes, if a REIT acquires property from a non-REIT “C” corporation in a transaction in which gain is not required to be recognized for tax purposes and sells such property within a specified number of years after such acquisition, the REIT will be subject to corporate income tax on the gain that would have been recognized had the property been sold in a taxable transaction at the time of the acquisition (referred to as “sting tax gain”). Legacy Parkway acquired properties in December 2013 from a non-REIT “C” corporation that are subject to these rules. Cousins transferred these properties to us in the Separation. The parties structured the Separation in a manner intended to cause Cousins to recognize the “sting tax gain,” and to preclude us from having to recognize “sting tax gain” with respect to these properties if they were to be sold by us prior to January 2019. There can be no assurance, however, that if these properties were to be sold by us prior to January 2019 that we would not also be subject to the corporate income tax on the “sting tax gain” associated with those properties. If the IRS were to assert that position successfully, then we could incur a significant corporate income tax liability if we were to sell these former Legacy Parkway properties prior to January 2019.
Failure to make required distributions would subject us to U.S. federal corporate income tax.
We intend to operate in a manner so as to qualify as a REIT for U.S. federal income tax purposes. In order to qualify as a REIT (and assuming that certain other requirements are also satisfied), we are required to distribute at least 90% of our REIT taxable income, determined without regard to the dividends paid deduction and excluding any net capital gain, each year to our
25
stockholders. To the extent that we satisfy this distribution requirement, but distribute less than 100% of our REIT taxable income, determined without regard to the dividends paid deduction and excluding any net capital gain, we will be subject to U.S. federal corporate income tax on our undistributed net taxable income. In addition, we will be subject to a 4% nondeductible excise tax if the actual amount that we distribute to our stockholders in a calendar year is less than a minimum amount specified under the Code. If we are subject to a U.S. federal corporate income tax, it could have a material adverse effect on our business, financial condition and results of operations.
REIT distribution requirements could adversely affect our liquidity and may force us to borrow funds or sell assets during unfavorable market conditions.
To satisfy the REIT distribution requirements, we may need to borrow funds on a short-term basis or sell assets, even if the then-prevailing market conditions are not favorable for these borrowings or sales. Our cash flows from operations may be insufficient to fund required distributions as a result of differences in timing between the actual receipt of cash and the recognition of taxable income for U.S. federal income tax purposes, or the effect of non-deductible capital expenditures, the creation of reserves or required debt service or amortization payments. The insufficiency of our cash flows to cover our distribution requirements could have an adverse impact on our ability to raise short- and long-term debt or sell equity securities in order to fund distributions required to maintain our qualification as a REIT, which could have a material adverse effect on our business, financial condition and results of operations.
Our ownership of our TRS, and any other TRSs we form, is subject to limitations and our transactions with our TRS, and any other TRSs we form, may cause us to be subject to a 100% penalty tax on certain income or deductions if those transactions are not conducted on arm’s-length terms.
A REIT may own up to 100% of the stock of one or more TRSs. Overall, no more than 25% (20% for taxable years beginning after December 31, 2017) of the value of a REIT’s assets may consist of stock or securities of one or more TRSs. While we anticipate that the aggregate value of the stock and securities of our TRSs will be less than 25% (20% for taxable years beginning after December 31, 2017) of the value of our total gross assets (including our TRS stock and securities), there can be no assurance that we will be able to comply with this ownership limitation. We will monitor the value of our respective investments in our TRSs for the purpose of ensuring compliance with TRS ownership limitations.
In addition, the Code limits the deductibility of interest paid or accrued by a TRS to its parent REIT to assure that the TRS is subject to an appropriate level of corporate taxation. The Code also imposes a 100% excise tax on certain transactions between a TRS and its parent REIT that are not conducted on an arm’s-length basis. The 100% tax would apply, for example, to the extent that we were found to have charged our TRS lessees rent in excess of an arm’s-length rent. We have structured and will continue to structure our transactions with our TRS on terms that we believe are arm’s length to avoid incurring the 100% excise tax. There can be no assurance, however, that we will be able to avoid the application of the 100% excise tax. The limitations and taxes imposed on TRSs could have a material adverse effect on our business, financial condition and results of operations
Complying with REIT requirements may force us to forgo and/or liquidate otherwise attractive investment opportunities.
To qualify as a REIT, we must ensure that we meet the REIT gross income tests annually and that at the end of each calendar quarter, at least 75% of the value of our assets consists of cash, cash items, government securities and qualified real estate assets. The remainder of our investment in securities (other than government securities and qualified real estate assets) generally cannot include more than 10% of the outstanding voting securities of any one issuer or more than 10% of the total value of the outstanding securities of any one issuer. In addition, in general, no more than 5% of the value of our assets (other than government securities and qualified real estate assets) can consist of the securities of any one issuer, no more than 25% (20% for taxable years beginning after December 31, 2017) of the value of our total assets can be represented by securities of one or more taxable REIT subsidiaries, and no more than 25% of the value of our total assets can be represented by nonqualified publicly offered REIT debt instruments. If we fail to comply with these requirements at the end of any calendar quarter, we must correct the failure within 30 days after the end of the calendar quarter or qualify for certain statutory relief provisions to avoid losing our REIT qualification and suffering adverse tax consequences. As a result, we may be required to liquidate from our portfolio or contribute to our TRS otherwise attractive investments in order to maintain our qualification as a REIT. These actions could have the effect of reducing our income and funds available for distribution to our stockholders. In addition, we may be required to make distributions to stockholders at disadvantageous times or when we do not have funds readily available for distribution, and may be unable to pursue investments that would otherwise be advantageous to us in order to satisfy the source of income or asset diversification requirements for qualifying as a REIT. Thus, compliance with the REIT requirements may hinder our ability to make, and, in certain cases, maintain ownership of, certain attractive investments, which could have a material adverse effect on our business, financial condition and results of operations.
26
You may be restricted from acquiring or transferring certain amounts of our capital stock.
The stock ownership restrictions of the Code for REITs and the stock ownership limit in our Charter may inhibit market activity in our capital stock (as defined in our Charter) and restrict our business combination opportunities.
In order to qualify as a REIT for each of our taxable years after 2016, five or fewer individuals, as defined in the Code, may not own, beneficially or constructively, more than 50% in value of our issued and outstanding stock at any time during the last half of a taxable year. Attribution rules in the Code determine if any individual or entity beneficially or constructively owns our capital stock under this requirement. Additionally, at least 100 persons must beneficially own our capital stock during at least 335 days of a taxable year for each of our taxable years after 2016. To help insure that we meet these tests, our Charter restricts the acquisition and ownership of shares of our capital stock.
Our Charter generally authorizes our board of directors to take such actions as are necessary and desirable to preserve our qualification as a REIT. In order to assist us in complying with the limitations on the concentration of ownership of REIT stock imposed by the Code, among other purposes, our Charter generally prohibits any person (other than a person who has been granted an exception) from actually or constructively owning more than 9.8% of the aggregate of the outstanding shares of our common stock and limited voting stock (each, as defined in our Charter) (by value or by number of shares, whichever is more restrictive), or more than 9.8% of the aggregate of the outstanding shares of any class or series of preferred stock (as defined in our Charter) (by value or by number of shares, whichever is more restrictive). Our Charter grants Cousins and certain of its affiliates an exemption from these ownership limits with respect to Cousins’ ownership of our Series A non-voting preferred stock (as defined in our Charter). Our Charter also permits exceptions to be made for stockholders provided our board of directors determines such exceptions will not jeopardize our qualification as a REIT. These restrictions on transferability and ownership will not apply, however, if our board of directors determines that it is no longer in our best interest to continue to qualify as a REIT or that compliance is no longer required in order for us to qualify as a REIT.
Our board of directors has granted TPG an exemption from the stock ownership limits contained in our Charter to enable TPG to acquire up to 32% of our common stock, subject to continued compliance with the terms of our Charter.
We may pay taxable dividends on our common stock in common stock and cash, in which case stockholders may sell shares of our common stock to pay tax on such dividends, placing downward pressure on the market price of our common stock.
In connection with our qualification as a REIT, we are required to annually distribute to our stockholders at least 90% of our “REIT taxable income,” determined without regard to the deduction for dividends paid and excluding net capital gain. Although we do not currently intend to do so, in order to satisfy this requirement, we are permitted, subject to certain conditions and limitations, to make distributions that are in part payable in shares of our common stock.
If we made a taxable dividend payable in cash and common stock, taxable stockholders receiving such dividends would be required to include the full amount of the dividend as ordinary income to the extent of our current and accumulated earnings and profits, as determined for U.S. federal income tax purposes. As a result, stockholders may be required to pay income tax with respect to such dividends in excess of the cash dividends received. If a U.S. stockholder sells the common stock that it receives as a dividend in order to pay this tax, the sales proceeds may be less than the amount included in income with respect to the dividend, depending on the market price of our common stock at the time of the sale. Furthermore, with respect to certain non-U.S. stockholders, we may be required to withhold U.S. federal income tax with respect to such dividends, including in respect of all or a portion of such dividend that is payable in common stock. If we made a taxable dividend payable in cash and our common stock and a significant number of our stockholders determine to sell shares of our common stock in order to pay taxes owed on dividends, it may put downward pressure on the trading price of our common stock.
Various tax aspects of such a taxable cash/stock distribution are uncertain and have not yet been addressed by the IRS. No assurance can be given that the IRS will not impose requirements in the future with respect to taxable cash/stock distributions, including on a retroactive basis, or assert that the requirements for such taxable cash/stock distributions have not been met.
Dividends payable by REITs do not qualify for the reduced tax rates available for some dividends.
The maximum tax rate applicable to “qualified dividend income” payable to U.S. stockholders that are taxed at individual rates is 20%. Dividends payable by REITs, however, are generally not eligible for the reduced rates on qualified dividend income. The more favorable rates applicable to regular corporate qualified dividends could cause investors who are taxed at individual rates to perceive investments in REITs to be relatively less attractive than investments in the shares of non-REIT corporations that pay dividends treated as qualified dividend income, which could adversely affect the value of the shares of REITs, including our common stock.
27
Complying with REIT requirements may limit our ability to hedge effectively.
The REIT provisions of the Code may limit our ability to hedge the risks inherent to our operations. Under current law, income that we generate from derivatives or other transactions that we enter into to manage the risk of interest rate changes with respect to borrowings made, or to be made, to acquire or carry real estate assets (each such hedge, a “Borrowings Hedge”) does not constitute “gross income” for purposes of the 75% and 95% gross income requirements applicable to REITs, provided that certain identification requirements are met. This exclusion from the 95% and 75% gross income tests also applies if we previously entered into a Borrowings Hedge, a portion of the hedged indebtedness or property is disposed of, and in connection with such extinguishment or disposition we enter into a new “clearly identified” hedging transaction to offset the prior hedging position. To the extent that we enter into other types of hedging transactions or fail to properly identify such transactions as a hedge, the income from such transactions is likely to be treated as non-qualifying income for purposes of both the 75% and 95% gross income tests. As a result of these rules, we may be required to limit the use of hedging techniques that might otherwise be advantageous, or implement those hedges through a TRS. This could increase the cost of our hedging activities because any such TRS may be subject to tax on gains or expose us to greater risks associated with changes in interest rates or other changes than we would otherwise incur. In addition, losses in any TRS will generally not provide any tax benefit, except that such losses could theoretically be carried back or forward against past or future taxable income in the TRS, which could have a material adverse effect on our business, financial condition and results of operations.
The ability of our board of directors to revoke our REIT qualification without stockholder approval may cause adverse consequences to our stockholders.
Our Charter provides that our board of directors may revoke or otherwise terminate our REIT election, without the approval of our stockholders, if it determines that it is no longer in our best interest to continue to qualify as a REIT. If we cease to qualify as a REIT, we would become subject to U.S. federal income tax on our taxable income and would no longer be required to distribute most of our taxable income to our stockholders, which may have a material adverse effect on our total return to our stockholders, or on our business, financial condition and results of operations.
We may be subject to adverse legislative, administrative, or regulatory tax changes that could reduce the market price of our common stock.
At any time, the U.S. federal income tax laws governing REITs or the administrative interpretations of those laws may be amended. Legislative and regulatory changes, including comprehensive tax reform, may be more likely in the 115th Congress, which convened in January 2017, because the Presidency and both Houses of Congress will be controlled by the same political party. We cannot predict when or if any new U.S. federal income tax law, regulation, or administrative interpretation, or any amendment to any existing U.S. federal income tax law, regulation or administrative interpretation will be adopted, promulgated or become effective and any such law, regulation, or interpretation may take effect retroactively. Any such change in, or any new, U.S. federal income tax law, regulation or administrative interpretation, could have a material adverse effect on our business, financial condition and results of operations.
The prohibited transactions tax may limit our ability to dispose of our assets, and we could incur a material tax liability if the IRS successfully asserts that the 100% prohibited transaction tax applies to some or all of our dispositions.
A REIT’s net income from prohibited transactions is subject to a 100% tax. In general, prohibited transactions are sales or other dispositions of property, other than foreclosure property, held primarily for sale to customers in the ordinary course of business. We may be subject to the prohibited transactions tax equal to 100% of net gain upon a disposition of property. Although a safe harbor to the characterization of the sale of property by a REIT as a prohibited transaction is available, some or all of our future dispositions may not qualify for that safe harbor. We intend to avoid disposing of property that may be characterized as held primarily for sale to customers in the ordinary course of business. To avoid the prohibited transaction tax, we may choose not to engage in certain sales of our assets or may conduct such sales through a TRS, which would be subject to federal, state and local income taxation. Moreover, no assurance can be provided that the IRS will not assert that some or all of our future dispositions are subject to the 100% prohibited transactions tax. If the IRS successfully imposes the 100% prohibited transactions tax on some or all of our dispositions, the resulting tax liability could be material, which could have a material adverse effect on our business, financial condition and results of operations.
28
Risks Related to an Investment in Our Common Stock
The price of our common stock may be volatile or may decline.
The market price of our common stock may fluctuate widely as a result of a number of factors, many of which are outside of our control. In addition, the stock market is subject to fluctuations in share prices and trading volumes that affect the market prices of the shares of many companies. These fluctuations in the stock market may adversely affect the market price of our common stock. Among the factors that could affect the market price of our common stock are:
• | actual or anticipated quarterly fluctuations in our business, financial condition and operating results; |
• | changes in revenues or earnings estimates or publication of research reports and recommendations by financial analysts or actions taken by rating agencies with respect to our securities or those of other REITs; |
• | the ability of our customers to pay rent to us and meet their other obligations to us under current lease terms; |
• | our ability to re-lease spaces as leases expire; |
• | our ability to refinance our indebtedness as it matures; |
• | any changes in our dividend policy; |
• | any future issuances of equity securities; |
• | strategic actions by us or our competitors, such as acquisitions or restructurings; |
• | general market conditions and, in particular, developments related to market conditions for the real estate industry; and |
• | domestic and international economic factors unrelated to our performance. |
In addition, until the market has fully evaluated our business as a stand-alone entity, the prices at which shares of our common stock trade may fluctuate more significantly than might otherwise be typical, even with other market conditions, including general volatility, held constant. The increased volatility of our stock price following the Spin-Off may have a material adverse effect on our business, financial condition and results of operations.
Limitations on the ownership of our common stock and other provisions of our Charter may preclude the acquisition or change of control of our Company.
Certain provisions contained in our Charter and certain provisions of Maryland law may have the effect of discouraging a third party from making an acquisition proposal for us and may thereby inhibit a change of control. Provisions of our Charter are designed to assist us in maintaining our qualification as a REIT under the Code by preventing concentrated ownership of our capital stock that might jeopardize our REIT qualification. Among other things, unless exempted by our board of directors, no person may actually or constructively own more than 9.8% of the aggregate of the outstanding shares of our common stock and limited voting stock (by value or by number of shares, whichever is more restrictive), or 9.8% of the aggregate of the outstanding shares of any class or series of preferred stock (by value or by number of shares, whichever is more restrictive). Our Charter grants Cousins and certain of its affiliates an exemption from these ownership limits with respect to Cousins’ ownership of our Series A non-voting preferred stock. Our board of directors may, in its sole discretion, grant other exemptions to the stock ownership limits, subject to such conditions and the receipt by our board of directors of certain representations and undertakings. Our board of directors has granted TPG an exemption from the Common Stock Ownership Limit contained in our Charter to enable TPG to acquire up to 32% of our Common Stock, subject to continued compliance with the terms of our Charter.
In addition to these ownership limits, our Charter also prohibits any person from (a) beneficially or constructively owning, as determined by applying certain attribution rules of the Code, shares of our capital stock that would result in us being “closely held” under Section 856(h) of the Code, (b) transferring our capital stock if such transfer would result in our stock being owned by fewer than 100 persons (determined without reference to any rules of attribution), (c) beneficially or constructively owning shares of our capital stock to the extent such ownership would result in us owning (directly or indirectly) an interest in a tenant described in Section 856(d)(2)(B) of the Code if the income derived by us from that tenant for our taxable year during which such determination is being made would reasonably be expected to equal or exceed the lesser of one percent of our gross income or an amount that would cause us to fail to satisfy any of the REIT gross income requirements and (d) beneficially or constructively owning shares of our capital stock that would cause us otherwise to fail to qualify as a REIT. If any transfer of shares of our common stock occurs which, if effective, would result in any person beneficially or constructively owning shares of stock in excess, or in violation, of the above transfer or ownership limitations, (such person, a prohibited owner), then that number of shares of stock, the beneficial or constructive ownership of which otherwise would cause such person to violate the transfer or ownership limitations (rounded up to the nearest whole share), will be automatically transferred to a charitable trust for the exclusive benefit of a charitable beneficiary, and the prohibited owner will not acquire any rights in such shares. If the transfer to the charitable trust would not be effective for any reason to prevent the violation of the above transfer or ownership limitations, then the transfer of that number of shares of our capital stock that otherwise would cause any person to violate the above limitations will be void. The prohibited owner will not benefit economically from ownership of any shares of our capital stock held in the charitable trust,
29
will have no rights to dividends or other distributions and will not possess any rights to vote or other rights attributable to the shares of our capital stock held in the charitable trust.
Generally, the ownership limits imposed under the Code are based upon direct or indirect ownership by “individuals,” but only during the last half of a taxable year. The ownership limits contained in our Charter are based upon direct or indirect ownership at any time by any “person,” which term includes entities. These ownership limitations in our Charter are common in REIT governing documents and are intended to provide added assurance of compliance with the tax law requirements, and to minimize administrative burdens. However, the ownership limits on our common stock also might delay, defer or prevent a transaction or a change in control of our company that might involve a premium price for shares of our common stock or otherwise be in the best interest of our stockholders.
Furthermore, under our Charter, our board of directors has the authority to classify and reclassify any of our unissued shares of capital stock into shares of capital stock with such preferences, rights, powers and restrictions as our board of directors may determine. The authorization and issuance of a new class of capital stock could have the effect of delaying or preventing someone from taking control of us, even if a change in control were in our stockholders’ best interests, which could have a material adverse effect on our business, financial condition and results of operations.
Certain provisions of Maryland law could inhibit changes in control, which may discourage third parties from conducting a tender offer or seeking other change of control transactions that could involve a premium price for Parkway common stock or that our stockholders otherwise believe to be in their best interest.
Certain provisions of the Maryland General Corporation Law (the “MGCL”) may have the effect of inhibiting a third party from making a proposal to acquire us or of impeding a change of control under circumstances that otherwise could provide the holders of Parkway common stock with the opportunity to realize a premium over the then-prevailing market price of such shares, including:
• | “business combination” provisions that, subject to limitations, prohibit certain business combinations between us and an “interested shareholder” (defined generally as any person who beneficially owns 10 percent or more of the voting power of our common stock or an affiliate thereof or an affiliate or associate of ours who was the beneficial owner, directly or indirectly, of 10 percent or more of the voting power of our then outstanding voting shares at any time within the two-year period immediately prior to the date in question) for five years after the most recent date on which the stockholder becomes an “interested shareholder,” and thereafter impose fair price and/or supermajority and stockholder voting requirements on these combinations; and |
• | “control share” provisions that provide that “control shares” of our company (defined as shares that, when aggregated with other shares controlled by the stockholder, entitle the stockholder to exercise one of three increasing ranges of voting power in electing directors) acquired in a “control share acquisition” (defined as the direct or indirect acquisition of ownership or control of issued and outstanding “control shares”) have no voting rights with respect to their control shares, except to the extent approved by our stockholders by the affirmative vote of at least two-thirds of all the votes entitled to be cast on the matter, excluding all interested shares. |
As permitted by the MGCL, we have elected to opt out of the business combination and control share provisions of the MGCL. However, we cannot assure you that our board of directors will not opt to be subject to such business combination and control share provisions of the MGCL in the future. Subtitle 8 of Title 3 of the MGCL, known as the Maryland Unsolicited Takeover Act, permits the board of directors of a Maryland corporation, without stockholder approval and regardless of what is currently provided in the corporation’s charter or bylaws, to implement certain corporate governance provisions, some of which (for example, a classified board) are not currently applicable to us. These provisions may have the effect of limiting or precluding a third party from making an unsolicited acquisition proposal or of delaying, deferring or preventing a change in control of us under circumstances that otherwise could provide the holders of the corporation’s common stock with the opportunity to realize a premium over the then current market price. We have elected to opt out of certain provisions of the Maryland Unsolicited Takeover Act and cannot opt back in without obtaining stockholder approval in advance.
Market interest rates may have an effect on the value of our common stock.
One of the factors that influence the price of our common stock is its dividend yield, or the dividend per share as a percentage of the price of our common stock, relative to market interest rates. An increase in market interest rates, which are currently at historically low levels, may lead prospective purchasers of our common stock to expect a higher dividend yield, and higher interest rates would likely increase our borrowing costs and potentially decrease funds available for distribution. If market interest rates increase and we are unable to increase our dividend in response, including due to an increase in borrowing costs,
30
insufficient funds available for distribution or otherwise, investors may seek alternative investments with a higher dividend yield, which would result in selling pressure on, and a decrease in the market price of, our common stock. As a result, the price of our common stock may decrease as market interest rates increase, which may have a material adverse effect on our business, financial condition and results of operations.
Substantial sales of our common stock may occur, which could cause our share price to decline.
As of December 31, 2016, we had an aggregate of approximately 49,110,645 shares of common stock issued and outstanding. Such shares of our common stock are freely tradable without restriction or further registration under the Securities Act, unless the shares are owned by one of our “affiliates,” as that term is defined in Rule 405 under the Securities Act.
Although we have no actual knowledge of any plan or intention on the part of any of our 5% or greater stockholders to sell their shares of our common stock, it is possible that some of our large stockholders will sell our common stock that they received in the Spin-Off. For example, our stockholders may sell our common stock because our concentration in Houston, Texas, our business profile or our market capitalization as an independent company does not fit their investment objectives, or because shares of our common stock are not included in certain indices after the Spin-Off. A portion of Cousins common stock is held by index funds, and if we are not included in these indices, these index funds may be required to sell our common stock. The sales of significant amounts of our common stock, or the perception in the market that this may occur, may result in the lowering of the market price of our common stock, which may have a material adverse effect on our business, financial condition and results of operations.
The number of shares of our common stock available for future issuance or sale could adversely affect the per share trading price of our common stock and may be dilutive to current stockholders.
Our Charter authorizes our board of directors to, among other things, issue a certain amount of additional shares of our common stock without stockholder approval. We cannot predict whether future issuances or sales of shares of our common stock, or the availability of shares for resale in the open market, will decrease the per share trading price of our common stock. The issuance of a substantial number of shares of our common stock in the open market or the issuance of a substantial number of shares of our common stock upon the exchange of OP units, or the perception that such issuances might occur, could adversely affect the per share trading price of our common stock. In addition, any such issuance could dilute our existing stockholders’ interests in our company. In addition, we have adopted an equity incentive plan, and we may issue shares of our common stock or grant equity incentive awards exercisable for or convertible or exchangeable into shares of our common stock under the plan. Future issuances of shares of our common stock may be dilutive to existing stockholders, which may have a material adverse effect on our business, financial condition and results of operations.
Future offerings of debt securities, which would be senior to our common stock upon liquidation, or preferred equity securities which may be senior to our common stock for purposes of dividends or upon liquidation, may materially adversely affect the per share trading price of our common stock.
In the future, we may increase our capital resources by making additional offerings of debt or equity securities (or causing the Operating Partnership to issue such debt securities), including medium-term notes, senior or subordinated notes and additional classes or series of preferred stock. Upon liquidation, holders of our debt securities and shares of preferred stock or preferred units and lenders with respect to other borrowings will be entitled to receive our available assets prior to distribution of such assets to holders of our common stock. Additionally, any convertible or exchangeable securities that we may issue in the future may have rights, preferences and privileges more favorable than those of our common stock, and may result in dilution to owners of our common stock. Other than TPG Pantera’s rights pursuant to the Stockholders Agreement, holders of our common stock are not entitled to preemptive rights or other protections against dilution. Our non-voting preferred stock has a preference on liquidating distributions and a preference on dividends that could limit our ability to pay dividends to the holders of our common stock. Any shares of preferred stock or preferred units that we issue in the future could have a preference on liquidating distributions or a preference on dividends that could limit our ability to pay dividends to the holders of our common stock. Because our decision to issue securities in any future offering will depend on market conditions and other factors beyond our control, we cannot predict or estimate the amount, timing or nature of our future offerings. Any such future offerings may reduce the per share trading price of our common stock, which may have a material adverse effect on our business, financial condition and results of operations.
Our ability to pay dividends is limited by the requirements of Maryland law.
Our ability to pay dividends on our common stock is limited by Maryland law. Under the MGCL, a Maryland corporation generally may not make a dividend if, after giving effect to the dividend, the corporation would not be able to pay its debts as such debts become due in the ordinary course of business or the corporation’s total assets would be less than the sum of its total liabilities
31
plus, unless the corporation’s charter permits otherwise, the amount that would be needed, if the corporation were dissolved at the time of the dividend, to satisfy the preferential rights upon dissolution of stockholders whose preferential rights are superior to those receiving the dividend. Accordingly, we generally may not make a dividend on our common stock if, after giving effect to the dividend, we would not be able to pay our debts as they become due in the ordinary course of business or our total assets would be less than the sum of our total liabilities plus, unless the terms of such class or series provide otherwise, the amount that would be needed to satisfy the preferential rights upon dissolution of the holders of shares of any class or series of preferred stock then outstanding, if any, with preferences upon dissolution senior to those of our common stock. If we are unable to pay dividends, or our ability to pay dividends is limited, investors may seek alternative investments, which would result in selling pressure on, and a decrease in the market price of, our common stock. As a result, the price of our common stock may decrease, which may have a material adverse effect on our business, financial condition and results of operations.
The Credit Facility may limit our ability to pay dividends on our common stock, including repurchasing shares of our common stock.
Under the credit agreement governing the Credit Facility, our dividends may not exceed the greater of (1) 90% of our funds from operations, and (2) the amount required for us to qualify and maintain our status as a REIT. Other permitted dividends include the amount required for us to avoid the imposition of income and excise taxes. Any inability to pay dividends may negatively impact our REIT status or could cause stockholders to sell shares of our common stock, which may have a material adverse effect on our business, financial condition and results of operations.
We may change our dividend policy.
Future dividends will be declared and paid at the discretion of our board of directors, and the amount and timing of dividends will depend upon cash generated by operating activities, our business, financial condition, results of operations, capital requirements, annual distribution requirements under the REIT provisions of the Code, and such other factors as our board of directors deems relevant. Our board of directors may change our dividend policy at any time, and there can be no assurance as to the manner in which future dividends will be paid or that the current dividend level will be maintained in future periods. Any reduction in our dividends may cause investors to seek alternative investments, which would result in selling pressure on, and a decrease in the market price of, our common stock. As a result, the price of our common stock may decrease, which may have a material adverse effect on our business, financial condition and results of operations.
During the period in which we qualify as an “emerging growth company,” we will not be required to comply with certain reporting requirements, including those relating to accounting standards and disclosure about our executive compensation, that apply to other public companies.
The JOBS Act contains provisions that, among other things, relax certain reporting requirements for “emerging growth companies,” including certain requirements relating to accounting standards and compensation disclosure. We currently qualify as an emerging growth company. For as long as we are an emerging growth company, which may be up to five full fiscal years, we are not required to (1) provide an auditor’s attestation report on management’s assessment of the effectiveness of our internal control over financial reporting pursuant to Section 404 of the Sarbanes-Oxley Act, (2) comply with any new or revised financial accounting standards applicable to public companies until such standards are also applicable to private companies under Section 102(b)(1) of the JOBS Act, (3) comply with any new requirements adopted by the Public Company Accounting Oversight Board (the “PCAOB”), requiring mandatory audit firm rotation or a supplement to the auditor’s report in which the auditor would be required to provide additional information about the audit and the financial statements of the issuer, (4) comply with any new audit rules adopted by the PCAOB after April 5, 2012 unless the SEC determines otherwise, (5) provide certain disclosure regarding executive compensation required of larger public companies or (6) hold stockholder advisory votes on executive compensation. Although we have elected not to take advantage of the extended transition period for compliance with new or revised financial accounting standards described in clause (2) above, we cannot predict if investors will find our common stock less attractive if we choose to rely on these exemptions. If some investors find our common stock less attractive as a result of any choices to reduce future disclosure, there may be a less active trading market for our common stock and our stock price may be more volatile.
ITEM 1B. Unresolved Staff Comments.
None.
32
ITEM 2. Properties.
Our portfolio consists of five Class A office assets located in the Galleria, Greenway and Westchase submarkets in Houston, Texas, comprising 19 buildings and totaling approximately 8.7 million rentable square feet. As of December 31, 2016, our portfolio had an occupancy rate of 85.8%. Upon closing of the joint venture transaction pursuant to the Contribution Agreement, we will own a 51% interest in Greenway Plaza and Phoenix Tower through a joint venture with two other parties, CPPIB and TIAA/SP.
The following table sets forth certain information about office properties which we owned or had an interest in at December 31, 2016:
Property | Total Square Feet (in thousands) | Occupancy Percentage | Leased Percentage | Weighted Average Expiring Net Rental Rate per Net Rentable Square Foot (“NRSF”) | Weighted Average Estimated Market Rent per NRSF | ||||||||||||
CityWestPlace | 1,473 | 72.5 | % | 77.3 | % | $ | 23.01 | $ | 22.00 | ||||||||
San Felipe Plaza | 980 | 84.8 | % | 85.4 | % | 22.06 | 23.00 | ||||||||||
Phoenix Tower | 630 | 79.0 | % | 80.9 | % | 18.80 | 20.00 | ||||||||||
Greenway Plaza | 4,322 | 89.6 | % | 90.7 | % | 16.63 | 18.91 | ||||||||||
Post Oak Central | 1,280 | 92.5 | % | 93.4 | % | 20.13 | 21.00 | ||||||||||
Total office properties as of December 31, 2016 | 8,685 | 85.8 | % | 87.5 | % | $ | 18.85 | $ | 20.21 | ||||||||
Lease expirations
The following table represents the embedded growth by lease expiration year for our portfolio:
Year of Expiration | Occupied Square Footage (in thousands) | Percentage of Total Occupied Square Feet | Annualized Rental Revenue (1) (in thousands) | Number of Leases | Weighted Average Expiring Net Rental Rate per NRSF | Weighted Average Estimated Market Rent per NRSF | ||||||||||||||||
2016 | 96 | 1.3 | % | $ | 1,620 | 57 | $ | 16.88 | $ | 18.67 | (2) | |||||||||||
2017 | 530 | 7.1 | % | 9,463 | 78 | 17.85 | 20.08 | |||||||||||||||
2018 | 494 | 6.6 | % | 9,472 | 63 | 19.17 | 19.50 | |||||||||||||||
2019 | 1,043 | 14.0 | % | 20,540 | 56 | 19.69 | 20.47 | |||||||||||||||
2020 | 587 | 7.9 | % | 12,022 | 66 | 20.48 | 20.12 | |||||||||||||||
2021 | 459 | 6.2 | % | 9,114 | 42 | 19.86 | 20.47 | |||||||||||||||
2022 | 418 | 5.6 | % | 7,838 | 35 | 18.75 | 19.15 | |||||||||||||||
2023 | 1,218 | 16.3 | % | 21,666 | 21 | 17.79 | 19.55 | |||||||||||||||
2024 | 291 | 3.9 | % | 4,890 | 15 | 16.80 | 19.09 | |||||||||||||||
2025 | 369 | 4.9 | % | 7,964 | 7 | 21.58 | 21.65 | |||||||||||||||
2026 | 1,273 | 17.1 | % | 20,180 | 12 | 15.85 | 20.44 | |||||||||||||||
Thereafter | 675 | 9.1 | % | 15,721 | 9 | 23.29 | 20.39 | |||||||||||||||
7,453 | 100.0 | % | $ | 140,490 | 461 | $ | 18.85 | $ | 20.21 | |||||||||||||
(1) Annualized rental revenue represents the rental rate per square foot, multiplied by the number of square feet leased by the customer, multiplied by 12. Annualized rental revenue is defined as rental revenue less operating expense reimbursements.
(2) Includes square feet expiring on the last day of the fourth quarter.
33
Top 20 Customers (based on rental revenue)
At December 31, 2016, our office properties were subject to 461 leases associated with 371 customers, which are in a wide variety of industries. The following table sets forth information concerning the 20 largest customers in our portfolio based on annualized rental revenues as of December 31, 2016:
Customer (1) | Weighted Average Lease Term | Occupied Square Footage (in thousands) | Percentage of Rentable Square Feet | Annualized Rental Revenue (in thousands) (2) | Percentage of Annualized Rental Revenue | Annualized Rental Revenue Per Occupied Square Foot | |||||||||||||
Occidental Oil & Gas Corporation | 9.7 | 962 | 12.9 | % | $ | 14,122 | 10.1 | % | $ | 14.69 | |||||||||
Statoil Gulf Services, LLC | 15.7 | 507 | 6.8 | % | 12,300 | 8.8 | % | 24.24 | |||||||||||
Apache Corporation | 3.0 | 524 | 7.0 | % | 9,340 | 6.6 | % | 17.81 | |||||||||||
Invesco Management Group, Inc | 7.0 | 391 | 5.2 | % | 6,525 | 4.6 | % | 16.69 | |||||||||||
Stewart Information Services Corporation | 2.7 | 183 | 2.5 | % | 4,737 | 3.4 | % | 25.90 | |||||||||||
Ion Geophysical Corporation | 6.7 | 176 | 2.4 | % | 4,435 | 3.2 | % | 25.15 | |||||||||||
BMC Software, Inc. | 9.5 | 216 | 2.9 | % | 3,708 | 2.6 | % | 17.15 | |||||||||||
Transocean Offshore Deepwater Drilling, Inc. | 6.0 | 255 | 3.4 | % | 3,551 | 2.5 | % | 13.90 | |||||||||||
CPL Retail Energy, LP | 6.4 | 202 | 2.7 | % | 3,260 | 2.3 | % | 16.17 | |||||||||||
ENSCO International Incorporated | 9.0 | 167 | 2.2 | % | 3,251 | 2.3 | % | 19.48 | |||||||||||
Nalco Company | 1.2 | 130 | 1.7 | % | 2,380 | 1.7 | % | 18.29 | |||||||||||
Engie Holdings Inc. | 3.3 | 135 | 1.8 | % | 2,158 | 1.5 | % | 16.03 | |||||||||||
Raymond James & Associates, Inc. | 4.9 | 97 | 1.3 | % | 2,013 | 1.4 | % | 20.86 | |||||||||||
Camden Property Trust | 8.7 | 87 | 1.2 | % | 1,764 | 1.3 | % | 20.34 | |||||||||||
Parker Drilling Mgmt. Services | 4.7 | 87 | 1.2 | % | 1,596 | 1.1 | % | 18.37 | |||||||||||
Regus Equity Business Centers, LLC | 4.4 | 71 | 1.0 | % | 1,419 | 1.0 | % | 19.96 | |||||||||||
W & T Offshore, LLC | 5.8 | 83 | 1.1 | % | 1,394 | 1.0 | % | 16.82 | |||||||||||
Sheridan Production Company, LLC | 3.5 | 71 | 1.0 | % | 1,293 | 0.9 | % | 18.17 | |||||||||||
Frontica Business Solutions, Inc. | 0.1 | 76 | 1.0 | % | 1,289 | 0.9 | % | 17.00 | |||||||||||
Houston Series of Lockton Companies, LLC | 1.0 | 84 | 1.1 | % | 1,267 | 0.9 | % | 15.13 | |||||||||||
Totals | 4,504 | 60.4 | % | $ | 81,802 | 58.1 | % | $ | 18.17 | ||||||||||
(1) In some cases, the actual tenant may be an affiliate or subsidiary of the customer shown.
(2) Annualized rental revenue represents the rental rate per square foot, multiplied by the number of square feet leased by the customer, multiplied by 12. Annualized rental revenue is defined as rental revenue less operating expense reimbursements.
Significant Properties
Four of our five properties, CityWestPlace, Greenway Plaza, Post Oak Central and San Felipe Plaza, had a book value that exceeded 10% of total assets at December 31, 2016 or had rental revenue that exceeded 10% of consolidated gross revenues for the year ended December 31, 2016 and are therefore deemed to be significant properties.
CityWestPlace
CityWestPlace is located in Houston, Texas and comprises four office buildings in a 35.3 acre complex that range from six stories to 21 stories with an aggregate of 1.5 million rentable square feet. Our predecessor, Parkway Houston, acquired CityWestPlace in December 2013. The buildings were constructed between 1993 and 2001. CityWestPlace’s major customers include companies in the technology and energy industries. At December 31, 2016, the property was 72.5% occupied with a weighted average expiring net rental rate per net rentable square foot of $23.01. The average occupancy and rental rate per square foot since Parkway Houston acquired ownership of CityWestPlace is as follows:
Year | Average Occupancy | Average Rental Rate per Square Foot | ||||
2013 | 97.4% | $ | 16.30 | |||
2014 | 96.4% | 16.54 | ||||
2015 | 85.3% | 19.43 | ||||
2016 | 77.2% | 23.74 | ||||
34
Lease expirations for CityWestPlace at December 31, 2016 are as follows (in thousands, except square feet of leases expiring and number of leases):
Year | Square Feet of Leases Expiring | Percentage of Total Square Feet | Annualized Rental Revenue (1) | Percentage of Total Annualized Rental Revenue | Number of Leases | ||||||||||||
2016 | 585 | 0.1 | % | $ | — | — | % | 3 | (2) | ||||||||
2017 | 75,816 | 5.2 | % | 1,294 | 5.3 | % | 2 | ||||||||||
2018 | — | — | % | 5 | — | % | — | ||||||||||
2019 | — | — | % | — | — | % | 1 | ||||||||||
2020 | 35,550 | 2.4 | % | 1,219 | 5.0 | % | 5 | ||||||||||
2021 | 16,286 | 1.1 | % | 384 | 1.6 | % | 3 | ||||||||||
2022 | — | — | % | — | — | % | — | ||||||||||
2023 | 176,349 | 12.0 | % | 4,435 | 18.1 | % | 1 | ||||||||||
2024 | — | — | % | — | — | % | — | ||||||||||
2025 | 39,114 | 2.7 | % | 1,214 | 4.9 | % | 1 | ||||||||||
2026 | 216,237 | 14.7 | % | 3,708 | 15.1 | % | 1 | ||||||||||
Thereafter | 507,420 | 34.3 | % | 12,300 | 50.0 | % | 2 | ||||||||||
1,067,357 | 72.5 | % | $ | 24,559 | 100.0 | % | 19 | ||||||||||
(1) Annualized rental revenue represents the rental rate per square foot, multiplied by the number of square feet leased by the customer, multiplied by 12. Annualized rental revenue is defined as rental revenue less operating expense reimbursements.
(2) Includes square feet expiring on the last day of the fourth quarter.
CityWestPlace has three customers that occupy 10% or more of the rentable square footage. Information regarding these customers is as follows:
Nature of Business | Square Feet Expiring (in thousands) | Lease Expiration Date | Effective Rental Rate Per Square Foot | Annualized Rental Revenue (1) | Lease Options |
Energy | 507 | 2032 | $24.24 | $12,300 | (2) |
Technology | 216 | 2026 | 17.15 | 3,708 | (3) |
Energy | 176 | 2023 | 25.15 | 4,435 | (4) |
(1) Annualized rental revenue represents the rental rate per square foot, multiplied by the number of square feet leased by the customer, multiplied by 12. Annualized rental revenue is defined as rental revenue less operating expense reimbursements.
(2) This tenant has three one-time options to cancel one floor each effective August 31, 2022, August 31, 2024, and August 21, 2027 upon 12 months' prior notice.
(3) This tenant has an option to cancel 10,448 square feet effective July 2, 2021 upon 12 months' prior notice.
(4) This tenant has an option to cancel 23,000 square feet effective October 1, 2017 upon 12 months' prior notice.
For tax purposes, depreciation is calculated over 39 years for buildings and garages, seven to 39 years for building and tenant improvements and five to seven years for equipment, furniture and fixtures. The federal tax basis, without adjustments for gain recognized and/or loss disallowed in connection with transactions occurring on October 6, 2016, net of accumulated tax depreciation of CityWestPlace is estimated as follows at December 31, 2016 (in thousands):
CityWestPlace | |||
Land | $ | 31,555 | |
Building and garage | 175,212 | ||
Building and tenant improvements | 73,531 | ||
Real estate tax expense for the property for the period from October 7, 2016 (date of the Spin-Off) to December 31, 2016 was $2.7 million.
Greenway Plaza
Greenway Plaza is located in Houston, Texas and comprises 10 office buildings in a 52.4 acre complex that range from five stories to 31 stories with an aggregate of 4.3 million rentable square feet. The buildings were constructed between 1969 and 1981. Greenway Plaza’s major customers include companies primarily in the energy and finance industries. On February 17, 2017, we entered into the Contribution Agreement pursuant to which, upon closing, we will own a 51% interest in Greenway Plaza through a joint venture with two other parties, CPPIB and TIAA/SP. At December 31, 2016, the property was 89.6% occupied
35
with a weighted average expiring net rental rate per net rentable square foot of $16.63. The average occupancy and rental rate per square foot since Cousins Houston acquired ownership of Greenway Plaza is as follows:
Year | Average Occupancy | Average Rental Rate per Square Foot |
2013 | 95.2% | $13.18 |
2014 | 93.1% | 14.42 |
2015 | 89.8% | 15.40 |
2016 | 82.2% | 17.67 |
Lease expirations for Greenway Plaza at December 31, 2016 are as follows (in thousands, except square feet of leases expiring and number of leases):
Year | Square Feet of Leases Expiring | Percentage of Total Square Feet | Annualized Rental Revenue (1) | Percentage of Total Annualized Rental Revenue | Number of Leases | |||||||
2016 | 85,005 | 2.0 | % | $ | 1,424 | 2.2 | % | 38 | (2) | |||
2017 | 240,770 | 5.6 | % | 4,161 | 6.5 | % | 44 | |||||
2018 | 208,067 | 4.8 | % | 3,879 | 6.0 | % | 38 | |||||
2019 | 207,297 | 4.8 | % | 3,504 | 5.4 | % | 29 | |||||
2020 | 286,929 | 6.6 | % | 5,573 | 8.7 | % | 40 | |||||
2021 | 224,594 | 5.2 | % | 4,006 | 6.2 | % | 21 | |||||
2022 | 300,179 | 6.9 | % | 5,360 | 8.3 | % | 19 | |||||
2023 | 943,611 | 21.8 | % | 14,988 | 23.3 | % | 15 | |||||
2024 | 212,209 | 4.9 | % | 2,947 | 4.6 | % | 8 | |||||
2025 | 137,074 | 3.2 | % | 2,862 | 4.4 | % | 3 | |||||
2026 | 1,000,463 | 23.2 | % | 15,108 | 23.5 | % | 7 | |||||
Thereafter | 25,204 | 0.6 | % | 568 | 0.9 | % | 1 | |||||
3,871,402 | 89.6 | % | $ | 64,380 | 100.0 | % | 263 | |||||
(1) Annualized rental revenue represents the rental rate per square foot, multiplied by the number of square feet leased by the customer, multiplied by 12. Annualized rental revenue is defined as rental revenue less operating expense reimbursements.
(2) Includes square feet expiring on the last day of the fourth quarter.
Greenway Plaza has one customer that occupies 10% or more of the rentable square footage. Information regarding this customer is as follows:
Nature of Business | Square Feet Expiring (in thousands) | Lease Expiration Date | Effective Rental Rate Per Square Foot | Annualized Rental Revenue (1) | Lease Options |
Energy | 962 | 2016, 2026 | $14.69 | $14,122 | (2) |
(1) Annualized rental revenue represents the rental rate per square foot, multiplied by the number of square feet leased by the customer, multiplied by 12. Annualized rental revenue is defined as rental revenue less operating expense reimbursements.
(2) This tenant has an annual option through December 31, 2024 to cancel up to three full floors in the aggregate upon 12 months' prior notice.
For tax purposes, depreciation is calculated over 39 years for buildings and garages, seven to 39 years for building and tenant improvements and five to seven years for equipment, furniture and fixtures. The federal tax basis, without adjustments for gain recognized and/or loss disallowed in connection with transactions occurring on October 6, 2016, net of accumulated tax depreciation of Greenway Plaza is estimated as follows at December 31, 2016 (in thousands):
Greenway Plaza | |||
Land | $ | 179,649 | |
Building and garage | 477,972 | ||
Building and tenant improvements | 146,967 | ||
Real estate tax expense for the property for the period from October 7, 2016 (date of the Spin-Off) to December 31, 2016 was $6.9 million.
36
Post Oak Central
Post Oak Central is located in Houston, Texas and comprises three office buildings in a 17.19 acre complex that are 24 stories each with an aggregate of 1.3 million rentable square feet. The buildings were constructed between 1974 and 1980. Post Oak Central’s major customers include companies in energy and financial services industries. At December 31, 2016, the property was 92.5% occupied with a weighted average expiring net rental rate per net rentable square foot of $20.13. The average occupancy and rental rate per square foot since Cousins Houston acquired ownership of Post Oak Central is as follows:
Year | Average Occupancy | Average Rental Rate per Square Foot |
2013 | 92.0% | $14.55 |
2014 | 94.9% | 16.04 |
2015 | 95.4% | 18.31 |
2016 | 94.0% | 18.28 |
Lease expirations for Post Oak Central at December 31, 2016 are as follows (in thousands, except square feet of leases expiring and number of leases):
Year | Square Feet of Leases Expiring | Percentage of Total Square Feet | Annualized Rental Revenue (1) | Percentage of Total Annualized Rent | Number of Leases | |||||||
2016 | 7,392 | 0.5 | % | $ | 133 | 0.5 | % | 9 | (2) | |||
2017 | 45,125 | 3.5 | % | 1,041 | 4.4 | % | 14 | |||||
2018 | 782 | 0.1 | % | 21 | 0.1 | % | 1 | |||||
2019 | 747,555 | 58.4 | % | 15,025 | 63.0 | % | 16 | |||||
2020 | 172,521 | 13.5 | % | 3,055 | 12.8 | % | 10 | |||||
2021 | 89,580 | 7.0 | % | 1,802 | 7.6 | % | 10 | |||||
2022 | 43,034 | 3.4 | % | 929 | 3.9 | % | 8 | |||||
2023 | 31,731 | 2.5 | % | 714 | 3.0 | % | 3 | |||||
2024 | 33,044 | 2.6 | % | 817 | 3.4 | % | 3 | |||||
2025 | — | — | % | — | — | % | — | |||||
2026 | 6,574 | 0.5 | % | 135 | 0.6 | % | 1 | |||||
Thereafter | 7,392 | 0.5 | % | 170 | 0.7 | % | 1 | |||||
1,184,730 | 92.5 | % | $ | 23,842 | 100.0 | % | 76 | |||||
(1) Annualized rental revenue represents the rental rate per square foot, multiplied by the number of square feet leased by the customer, multiplied by 12. Annualized rental revenue is defined as rental revenue less operating expense reimbursements.
(2) Includes square feet expiring on the last day of the current quarter.
Post Oak Central has three customers that occupy 10% or more of the rentable square footage. Information regarding these customers is as follows:
Nature of Business | Square Feet Expiring (in thousands) | Lease Expiration Date | Effective Rental Rate Per Square Foot | Annualized Rental Revenue (1) | Lease Options |
Energy | 524 | 2019 | $17.81 | $9,340 | (2) |
Finance | 183 | 2019 | 25.90 | 4,737 | (3) |
Energy | 135 | 2020 | 16.03 | 2,158 | (2) |
(1) Annualized rental revenue represents the rental rate per square foot, multiplied by the number of square feet leased by the customer, multiplied by 12. Annualized rental revenue is defined as rental revenue less operating expense reimbursements.
(2) This tenant has no contraction or termination options.
(3) This tenant has an option to cancel the 10th and/or 14th floor effective September 30, 2016 upon 90 days prior notice, and the option to cancel 9,526 square feet of storage space effective between October 1, 2016 and September 30, 2018 upon 90 days' prior notice.
For tax purposes, depreciation is calculated over 39 years for buildings and garages, seven to 39 years for building and tenant improvements and five to seven years for equipment, furniture and fixtures. The federal tax basis, without adjustments for gain recognized and/or loss disallowed in connection with transactions occurring on October 6, 2016, net of accumulated tax depreciation of Post Oak Central is estimated as follows at December 31, 2016 (in thousands):
37
Post Oak Central | |||
Land | $ | 81,667 | |
Building and garage | 94,379 | ||
Building and tenant improvements | 39,574 | ||
Real estate tax expense for the property for the period from October 7, 2016 (date of the Spin-Off) to December 31, 2016 was $2.3 million.
San Felipe Plaza
San Felipe Plaza is located in Houston, Texas and is a 46 story office building with an aggregate of 980,000 rentable square feet. The building was constructed in 1984. San Felipe Plaza’s major customers include companies in the energy and financial services industries. At December 31, 2016, the property was 84.8% occupied with a weighted average expiring net rental rate per net rentable square foot of $22.06. The average occupancy and rental rate per square foot since Parkway Houston acquired ownership of San Felipe Plaza is as follows:
Year | Average Occupancy | Average Rental Rate per Square Foot |
2013 | 87.4% | $16.55 |
2014 | 86.6% | 18.69 |
2015 | 84.1% | 20.60 |
2016 | 84.6% | 21.40 |
Lease expirations for San Felipe Plaza at December 31, 2016 are as follows (in thousands, except square feet of leases expiring and number of leases):
Year | Square Feet of Leases Expiring | Percentage of Total Square Feet | Annualized Rental Revenue (1) | Percentage of Total Annualized Rent | Number of Leases | |||||||
2016 | 1,645 | 0.2 | % | $ | 17 | 0.1 | % | 6 | (2) | |||
2017 | 107,430 | 10.9 | % | 1,912 | 10.4 | % | 8 | |||||
2018 | 81,614 | 8.2 | % | 1,888 | 10.3 | % | 13 | |||||
2019 | 44,678 | 4.6 | % | 1,166 | 6.4 | % | 2 | |||||
2020 | 66,264 | 6.8 | % | 1,611 | 8.8 | % | 8 | |||||
2021 | 118,507 | 12.1 | % | 2,604 | 14.2 | % | 6 | |||||
2022 | 30,521 | 3.1 | % | 790 | 4.3 | % | 5 | |||||
2023 | 66,573 | 6.8 | % | 1,529 | 8.3 | % | 2 | |||||
2024 | 46,198 | 4.7 | % | 1,126 | 6.1 | % | 4 | |||||
2025 | 177,110 | 18.1 | % | 3,512 | 19.1 | % | 2 | |||||
2026 | 49,836 | 5.1 | % | 1,228 | 6.7 | % | 3 | |||||
Thereafter | 41,265 | 4.2 | % | 965 | 5.3 | % | 2 | |||||
831,641 | 84.8 | % | $ | 18,348 | 100.0 | % | 61 | |||||
(1) Annualized rental revenue represents the rental rate per square foot, multiplied by the number of square feet leased by the customer, multiplied by 12. Annualized rental revenue is defined as rental revenue less operating expense reimbursements.
(2) Includes square feet expiring on the last day of the fourth quarter.
San Felipe Plaza has one customer that occupies 10% or more of the rentable square footage. Information regarding this customer is as follows:
Nature of Business | Square Feet Expiring (in thousands) | Lease Expiration Date | Effective Rental Rate Per Square Foot | Annualized Rental Revenue (1) | Lease Options |
Energy | 167 | 2017, 2025 | $19.48 | $3,251 | (2) |
(1) Annualized rental revenue represents the rental rate per square foot, multiplied by the number of square feet leased by the customer, multiplied by 12. Annualized rental revenue is defined as rental revenue less operating expense reimbursements.
(2) This tenant has no contraction or termination options.
38
For tax purposes, depreciation is calculated over 39 years for buildings and garages, seven to 39 years for building and tenant improvements and five to seven years for equipment, furniture and fixtures. The federal tax basis, without adjustments for gain recognized and/or loss disallowed in connection with transactions occurring on October 6, 2016, net of accumulated tax depreciation of San Felipe Plaza is estimated as follows at December 31, 2016 (in thousands):
San Felipe Plaza | |||
Land | $ | 10,696 | |
Building and garage | 96,574 | ||
Building and tenant improvements | 50,627 | ||
Real estate tax expense for the property for the period from October 7, 2016 (date of the Spin-Off) to December 31, 2016 was $2.4 million.
Mortgage Debt
Four of our five properties, CityWestPlace, Phoenix Tower, Post Oak Central and San Felipe Plaza, are subject to mortgage debt. A summary of mortgage notes payable, net at December 31, 2016 is as follows (dollars in thousands):
Office Properties | Fixed Rate | Maturity Date | December 31, 2016 | ||||
San Felipe Plaza | 4.8% | 12/01/2018 | $ | 106,085 | |||
CityWestPlace III and IV | 5.0% | 03/05/2020 | 88,700 | ||||
Post Oak Central | 4.3% | 10/01/2020 | 178,285 | ||||
Phoenix Tower | 3.9% | 03/01/2023 | 76,561 | ||||
Unamortized premium, net | 2,600 | ||||||
Unamortized debt issuance costs, net | (654 | ) | |||||
Total mortgage notes payable, net | $ | 451,577 | |||||
Upon closing of the joint venture transaction under the Contribution Agreement, a subsidiary of the joint venture expects to assume the existing mortgage loan on Phoenix Tower. In addition, on February 22, 2017, the Operating Partnership and Goldman Sachs entered into the Commitment Letter pursuant to which Goldman Sachs has, among other things, agreed to provide the joint venture and certain of its subsidiaries the Loan in an aggregate principal amount of up to $465 million secured by the Greenway Plaza properties and all related assets. Funding of the Loan is subject to certain conditions set forth in the Commitment Letter.
We did not have any material liens or encumbrances that exceeded 10% of total assets at December 31, 2016.
For additional information, see “Management’s Discussion and Analysis of Financial Condition and Results of Operations—Parkway, Inc.—Liquidity and Capital Resources.”
ITEM 3. Legal Proceedings.
We and our subsidiaries may be involved from time to time in various legal proceedings that arise in the ordinary course of our business, including, but not limited to commercial disputes, environmental matters and litigation in connection with transactions including acquisitions and divestitures. We believe that such litigation, claims and administrative proceedings will not have a material adverse impact on our financial position or our results of operations. Most occurrences involving liability, claims of negligence and employees will be covered by insurance with solvent insurance carriers. For those losses not covered by insurance, we will record a liability when a loss is considered probable and the amount can be reasonably estimated.
ITEM 4. Mine Safety Disclosures
Not Applicable.
39
PART II
ITEM 5. Market for Registrant’s Common Equity, Related Stockholder Matters and Issuer Purchases of Equity Securities.
Market Price of and Dividends on the Issuer’s Common Equity
Our common stock, $0.001 par value, is listed and trades on the New York Stock Exchange (the “NYSE”) under the symbol “PKY” and began trading publicly in the regular way on October 7, 2016. The number of record holders of our common stock and limited voting stock was 1,516 and six, respectively, at March 8, 2017.
The following table sets forth, for the period indicated, the high and low sales prices per share of our common stock on the NYSE. We have not paid any dividends during or with respect to the period indicated.
Price Range | ||||||||||||
High | Low | Dividends | ||||||||||
2016: | ||||||||||||
Fourth quarter (1) | $ | 23.20 | $ | 16.39 | $ | — | ||||||
(1) Information provided only for the period from October 7, 2016 to December 31, 2016, as our common stock did not begin trading publicly in the regular way until October 7, 2016.
At March 8, 2017, the last reported sales price per share of our common stock on the NYSE was $20.50.
Dividends
We are a newly formed company that has recently commenced operations, and as a result, we have not declared or paid any dividends from the period from June 29, 2016 to December 31, 2016. We intend to make regular distributions to our stockholders to satisfy the requirements to qualify as a REIT. To qualify as a REIT, we must distribute to our stockholders an amount at least equal to:
(1) | 90 % of our REIT taxable income, determined before the deduction for dividends paid and excluding any net capital gain (which does not necessarily equal net income as calculated in accordance with accounting principles generally accepted in the United States (“GAAP”)); plus |
(2) | 90% of the excess of our net income from foreclosure property over the tax imposed on such income by the Code; less |
(3) | any excess non-cash income (as determined under the Code). |
We cannot assure you that our dividend policy will remain the same in the future, or that any estimated dividends will be made or sustained. Dividends made by us will be authorized and determined by our board of directors, in its sole discretion, out of legally available funds, and will be dependent upon a number of factors, including restrictions under applicable law, actual and projected financial condition, liquidity, funds from operations and results of operations, the revenue we actually receive from our properties, our operating expense, our debt service requirements, our capital expenditures, prohibitions and other limitations under our financial arrangements, the annual REIT distribution requirements and such other factors as our board of directors deems relevant.
Although we have not paid any dividends on our common stock as of the date of this Annual Report on Form 10-K, in accordance with our Charter and as authorized by our board of directors, we have declared a quarterly dividend in the amount of $0.10 per share of common stock to holders of record of our common stock on March 16, 2017. The common dividend will be paid on March 30, 2017. In addition, we declared a dividend in the amount of $2,000 per share of Series A non-voting preferred stock to Cousins LP, the holder of record of all outstanding shares of such stock. A preferred dividend totaling approximately $100,000 will be paid on March 31, 2017 to the holder of record of Series A non-voting preferred stock on March 17, 2017.
Our Credit Facility contains provisions that may limit our ability to make distributions to our stockholders. These facilities generally provide that if a default occurs and is continuing, we will be precluded from making distributions on our common stock (other than those required to allow us to qualify and maintain our status as a REIT, so long as such default does not arise from a payment default or bankruptcy) and lenders under the facility and, potentially, other indebtedness, could accelerate the maturity of the related indebtedness. The Credit Facility also contains covenants providing for a maximum distribution of the greater of (i) the amount required for us to qualify as a REIT or (ii) 90% of our funds from operations (as defined in such credit agreement). Upon closing of the Greenway Properties joint venture transaction, we expect to terminate the Credit Facility and prepay the $350
40
million outstanding balance using proceeds from the joint venture transaction. We cannot provide assurances that the Greenway Properties joint venture transaction will be consummated on the terms or timeline currently contemplated, or at all, which may have a material adverse effect on our business, financial condition and results of operations.
Unregistered Sales of Equity Securities
None.
Purchases of Equity Securities by the Issuer
None.
Performance Graph
The following graph provides a comparison of cumulative stockholder returns for the period from October 7, 2016 through December 31, 2016 among Parkway, Inc., the Morgan Stanley Capital International (“MSCI”) US REIT (RMS) Index and the Standard & Poor’s 500 Index (“S&P 500”). The stock performance graph assumes an investment of $100 in our common stock and each index and the reinvestment of any dividends. The historical information set forth below is not necessarily indicative of future performance.
The performance graph and related information shall not be deemed “soliciting material” or deemed to be “filed” with the SEC for purposes of Section 18 of the Exchange Act, nor shall such information be incorporated by reference into any future filing under the Securities Act or the Exchange Act, except to the extent that we specifically incorporate it by reference into such filing.
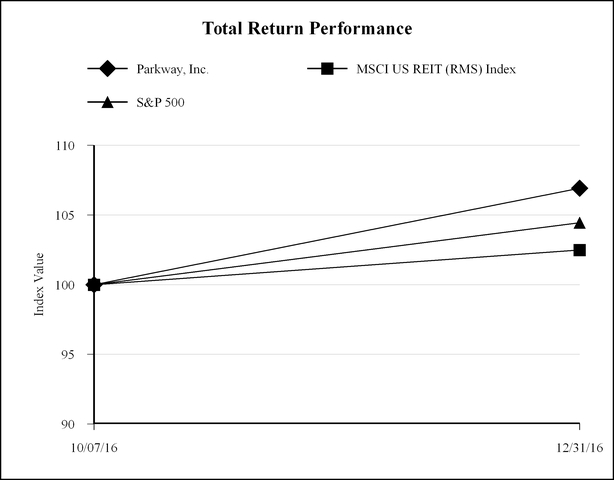
41
Period Ending | ||||||
Index | 10/7/2016 | 12/31/2016 | ||||
Parkway, Inc. | 100.00 | 106.92 | ||||
MSCI US REIT (RMS) Index | 100.00 | 102.49 | ||||
S&P 500 | 100.00 | 104.45 | ||||
Source: SNL Financial, an offering of S&P Global Market Intelligence
42
ITEM 6. Selected Financial Data.
SELECTED FINANCIAL DATA—PARKWAY, INC.
The following table sets forth our selected financial data as of December 31, 2016 and for the period from June 29, 2016 (date of capitalization) to December 31, 2016, consisting primarily of operating activity for the 86-day period from October 7, 2016 (date on which our common stock began regular way trading on the NYSE) to December 31, 2016. This data should be read with our consolidated financial statements and notes thereto and “Management’s Discussion and Analysis of Financial Condition and Results of Operations” included elsewhere in this Annual Report on Form 10-K.
For the Period From June 29, 2016 (Date of Capitalization) to December 31, 2016 | |||
(In thousands, except per share data) | |||
Income Statement Data: | |||
Revenues | |||
Income from office properties | $ | 67,550 | |
Management company income | 1,381 | ||
Total revenues | 68,931 | ||
Expenses | |||
Property operating expenses | 32,518 | ||
Management company expenses | 1,050 | ||
Depreciation and amortization | 25,139 | ||
General and administrative | 17,510 | ||
Total expenses | 76,217 | ||
Operating loss | (7,286 | ) | |
Other income and expenses | |||
Interest and other income | 1,225 | ||
Interest expense | (8,007 | ) | |
Loss before income taxes | (14,068 | ) | |
Income tax expense | (453 | ) | |
Net loss | (14,521 | ) | |
Net loss attributable to noncontrolling interest - unitholders | 299 | ||
Net loss attributable to Parkway, Inc. | (14,222 | ) | |
Dividends on preferred stock | (94 | ) | |
Net loss attributable to common stockholders | $ | (14,316 | ) |
Net loss per common share attributable to common stockholders - basic and diluted | $ | (0.29 | ) |
Dividends per share of common stock | $ | — | |
Weighted average shares outstanding - basic and diluted | 49,111 | ||
As of December 31, 2016 | |||
(In thousands) | |||
Balance Sheet Data: | |||
Total real estate related investments, net | $ | 1,705,611 | |
Total assets | 2,163,895 | ||
Notes payable to banks, net | 341,602 | ||
Mortgage notes payable, net | 451,577 | ||
Total liabilities | 1,011,973 | ||
Preferred stock | 5,000 | ||
Total Parkway, Inc. stockholders’ equity | 1,128,885 | ||
Noncontrolling interests | 23,037 | ||
43
SELECTED HISTORICAL COMBINED FINANCIAL DATA—PARKWAY HOUSTON
The following table sets forth the selected historical combined financial data of Parkway Houston, one of our predecessors, which was carved out from the financial information of Legacy Parkway as described below. The selected historical financial data set forth below as of October 5, 2016, December 31, 2015, 2014 and 2013, for the period from January 1, 2016 to October 5, 2016 (the date immediately prior to the closing date of the Merger), and for the years ended December 31, 2015, 2014 and 2013 has been derived from Parkway Houston’s audited combined financial statements.
Parkway Houston’s combined financial statements were carved out from the financial information of Legacy Parkway at a carrying value reflective of historical cost in Legacy Parkway's records. Parkway Houston’s historical financial results reflect charges for certain corporate expenses which include, but are not limited to, costs related to property management, accounting, human resources, security, payroll and benefits, legal, corporate communications, information services and restructuring and reorganization. Costs of the services were allocated based on either actual costs incurred or a proportion of costs estimated to be applicable to us based on a number of factors, most significantly Parkway Houston’s percentage of Legacy Parkway’s square footage. Parkway Houston believes these charges are reasonable; however, these results may not reflect what Parkway Houston’s expenses would have been had Parkway Houston been operating as a separate, stand-alone public company. The historical combined financial information presented may not be indicative of the results of operations, financial position or cash flows that would have been obtained if Parkway Houston had been an independent, stand-alone entity during the periods shown. Please refer to “Management’s Discussion and Analysis of Financial Condition and Results of Operations.”
The historical combined financial data set forth below does not indicate results expected for any future periods. This data should be read with Parkway Houston's combined financial statements and notes thereto and “Management’s Discussion and Analysis of Financial Condition and Results of Operations” included elsewhere in this Annual Report on Form 10-K.
44
Period from January 1, 2016 to October 5, 2016 (the date immediately prior to the closing date of the Merger) | Year Ended December 31, | ||||||||||||||
2015 | 2014 | 2013 | |||||||||||||
Income Statement Data (in thousands): | |||||||||||||||
Revenues | |||||||||||||||
Income from office properties | $ | 83,249 | $ | 108,507 | $ | 123,172 | $ | 20,965 | |||||||
Management company income | 3,835 | 9,891 | 23,971 | 17,526 | |||||||||||
Sale of condominium units | — | 11,063 | 16,554 | — | |||||||||||
Total revenues | 87,084 | 129,461 | 163,697 | 38,491 | |||||||||||
Expenses | |||||||||||||||
Property operating expenses | 39,758 | 45,385 | 54,856 | 9,119 | |||||||||||
Management company expenses | 3,263 | 9,362 | 27,038 | 23,638 | |||||||||||
Cost of sales - condominium units | — | 11,120 | 13,199 | 14 | |||||||||||
Depreciation and amortization | 30,791 | 55,570 | 64,012 | 10,465 | |||||||||||
Impairment loss on management contracts | — | — | 4,750 | — | |||||||||||
General and administrative | 4,880 | 6,336 | 6,917 | 7,267 | |||||||||||
Total expenses | 78,692 | 127,773 | 170,772 | 50,503 | |||||||||||
Operating income (loss) | 8,392 | 1,688 | (7,075 | ) | (12,012 | ) | |||||||||
Other income and expenses | |||||||||||||||
Interest and other income | 196 | 246 | 244 | 1,663 | |||||||||||
Gain on extinguishment of debt | 154 | — | — | — | |||||||||||
Interest expense | (10,010 | ) | (16,088 | ) | (16,252 | ) | (3,296 | ) | |||||||
Loss before income taxes | (1,268 | ) | (14,154 | ) | (23,083 | ) | (13,645 | ) | |||||||
Income tax (expense) benefit | (1,113 | ) | (1,635 | ) | 180 | 1,276 | |||||||||
Net loss | (2,381 | ) | (15,789 | ) | (22,903 | ) | (12,369 | ) | |||||||
Net (income) loss attributable to noncontrolling interests | — | 7 | (148 | ) | — | ||||||||||
Net loss attributable to Parkway Houston | $ | (2,381 | ) | $ | (15,782 | ) | $ | (23,051 | ) | $ | (12,369 | ) | |||
As of October 5, | As of December 31, | ||||||||||||||
2016 | 2015 | 2014 | 2013 | ||||||||||||
Balance Sheet Data (in thousands): | |||||||||||||||
Total real estate related investments, net | $ | 744,956 | $ | 752,653 | $ | 738,846 | $ | 757,848 | |||||||
Total assets | 855,502 | 865,731 | 866,496 | 903,165 | |||||||||||
Mortgage notes payables, net | 276,441 | 396,901 | 407,211 | 414,656 | |||||||||||
Total liabilities | 326,314 | 456,665 | 485,535 | 503,130 | |||||||||||
Legacy Parkway equity | 529,188 | 409,066 | 380,053 | 396,985 | |||||||||||
Noncontrolling interests | — | — | 908 | 3,050 | |||||||||||
45
SELECTED HISTORICAL COMBINED FINANCIAL DATA—COUSINS HOUSTON
The following table sets forth the selected historical combined financial data of Cousins Houston, one of our predecessors, which was carved out from the financial information of Cousins as described below. The selected historical combined financial data set forth below as of October 6, 2016, December 31, 2015, 2014 and 2013, for the period from January 1, 2016 to October 6, 2016 (closing date of the Merger), for the years ended December 31, 2015 and 2014 and for the period from February 7, 2013 (date of inception) to December 31, 2013 has been derived from Cousins Houston’s audited combined financial statements.
Cousins Houston’s combined financial statements were carved out from Cousins’ financial information based on historical cost. The historical financial results for Cousins Houston include certain allocated corporate costs, which we believe are reasonable. These costs were incurred by Cousins and estimated to be applicable to Cousins Houston based on proportionate leasable square footage. Such costs do not necessarily reflect what the actual costs would have been if Cousins Houston were operating as a separate stand-alone public company. These costs are discussed further in “Note 3—Related Party Transactions” of the combined financial statements of Cousins Houston for the period ended October 6, 2016. The selected historical combined financial information presented may not be indicative of the results of operations, financial position or cash flows that would have been obtained if Cousins Houston had been an independent, stand-alone entity during the periods shown.
The selected historical combined financial data set forth below do not indicate results expected for any future periods. This data should be read with Cousins Houston’s combined financial statements and notes thereto and “Management’s Discussion and Analysis of Financial Condition and Results of Operations” included elsewhere in this Annual Report on Form 10-K.
Period from January 1, 2016 to October 6, 2016 (closing date of the Merger) | Year Ended December 31, | Period from February 7, 2013 (date of inception) to December 31, 2013 | |||||||||||||
2015 | 2014 | ||||||||||||||
Income Statement Data (in thousands): | |||||||||||||||
Revenues: | |||||||||||||||
Rental property revenues | $ | 137,374 | $ | 177,890 | $ | 184,536 | $ | 72,696 | |||||||
Other | 288 | — | 31 | 11 | |||||||||||
Total revenues | 137,662 | 177,890 | 184,567 | 72,707 | |||||||||||
Costs and Expenses: | |||||||||||||||
Rental property operating expenses | 58,704 | 74,162 | 79,625 | 31,759 | |||||||||||
General and administrative expenses | 6,787 | 6,328 | 7,347 | 3,793 | |||||||||||
Depreciation and amortization | 47,345 | 63,791 | 77,760 | 29,146 | |||||||||||
Interest expense | 6,021 | 7,988 | 8,127 | 2,618 | |||||||||||
Acquisition and related costs | 6,349 | — | — | 3,858 | |||||||||||
Total costs and expenses | 125,206 | 152,269 | 172,859 | 71,174 | |||||||||||
Net income | $ | 12,456 | $ | 25,621 | $ | 11,708 | $ | 1,533 | |||||||
As of October 6, | As of December 31, | ||||||||||||||
2016 | 2015 | 2014 | 2013 | ||||||||||||
Balance Sheet Data (in thousands): | |||||||||||||||
Operating properties, net | $ | 1,081,712 | $ | 1,086,451 | $ | 1,077,290 | $ | 1,087,181 | |||||||
Total assets | 1,180,221 | 1,188,236 | 1,188,355 | 1,220,551 | |||||||||||
Note payable | 178,180 | 180,937 | 184,097 | 187,120 | |||||||||||
Total liabilities | 260,681 | 271,364 | 278,558 | 283,604 | |||||||||||
Equity | 919,540 | 916,872 | 909,797 | 936,947 | |||||||||||
46
ITEM 7. Management’s Discussion and Analysis of Financial Condition and Results of Operations.
The following discussion and analysis covers the financial condition and results of operations of the Company, and our predecessors, Parkway Houston and Cousins Houston. You should read the following discussion and analysis in conjunction with the accompanying consolidated financial statements and related notes of Parkway, Inc., Parkway Houston and Cousins Houston, and “Risk Factors” contained elsewhere in this Annual Report on Form 10-K.
PARKWAY, INC.
Overview
We are an independent, publicly traded, self-managed REIT that owns and operates high-quality office properties located in attractive submarkets in Houston, Texas. Our portfolio consists of five Class A assets comprising 19 buildings and totaling approximately 8.7 million rentable square feet in the Greenway, Galleria and Westchase submarkets of Houston, providing geographic focus and significant operational scale and efficiencies.
In addition, we offer fee-based real estate services through Eola, which in total managed approximately 3.8 million square feet primarily for third-party property owners at December 31, 2016. Unless otherwise indicated, all references to square feet represent net rentable square feet.
Our mission is to own and operate high-quality office properties located in submarkets in Houston, with a primary focus on unlocking value within our existing portfolio through implementing active and creative leasing strategies, leveraging our scale to increase pricing power in lease and vendor negotiations and targeting redevelopment and asset repositioning opportunities. We plan to maintain a conservative balance sheet with low leverage and ample liquidity, which we expect will allow us to access multiple sources of capital. We believe that this strategy will support both our internal growth initiatives and our patient and disciplined approach to pursuing new investment opportunities at the appropriate time. We believe that this strategy, combined with our highly experienced management team that has a successful history of operating a publicly traded REIT, significant expertise in the Houston, Texas office sector and extensive relationships with industry participants, positions us for long-term internal and external growth.
Our Spin-Off from Cousins
Prior to the Spin-Off, we were incorporated on June 3, 2016 as a wholly owned subsidiary of Legacy Parkway. On October 6, 2016, pursuant to the Merger Agreement, Legacy Parkway merged with and into Clinic Sub Inc., with Clinic Sub Inc. continuing as the surviving corporation and a wholly owned subsidiary of Cousins. In connection with the Merger, we became a subsidiary of Cousins. On October 7, 2016, Cousins completed the Spin-Off of our company by distributing all of our outstanding shares of common and limited voting stock to the holders of Cousins common and limited voting preferred stock as of the record date, October 6, 2016.
Greenway Properties Joint Venture
On February 17, 2017, we, through our Operating Partnership and certain other subsidiaries, entered into the Contribution Agreement with CPPIB and TIAA/SP, pursuant to which we have agreed to sell to these two investors, indirectly through a new joint venture, an aggregate 49% interest in the Greenway Properties. The new joint venture is expected to be owned 51% through subsidiaries of the Operating Partnership (with 1% being held by a subsidiary acting as the general partner and 50% being held by a subsidiary acting as a limited partner) and 24.5% by each of CPPIB and TIAA/SP, each as a limited partner of the joint venture. At closing under the Contribution Agreement, a subsidiary of the joint venture expects to assume the existing mortgage loan on Phoenix Tower and to enter into new mortgage financing of up to $465 million secured by the Greenway Plaza properties, in accordance with the Commitment Letter with Goldman Sachs. Subject to certain conditions, closing under the Contribution Agreement is expected to occur during the second quarter of 2017, subject to extension to an outside date of May 31, 2017, which may be further extended to June 21, 2017 in certain circumstances.
47
Leasing Activity
Rental Rates
An increase in vacancy rates in a market or at a specific property has the effect of reducing market rental rates. Inversely, a decrease in vacancy rates in a market or at a specific property has the effect of increasing market rental rates. Our leases typically have three- to seven-year terms, though from time to time, we may enter into leases with terms that are either shorter or longer than that typical range. As leases expire, we seek to replace existing leases with new leases at the current market rental rate. For our properties owned as of December 31, 2016, management estimates that we have approximately $1.36 per square foot in annual rental rate embedded growth in our office property leases. Embedded growth is defined as the difference between the weighted average in-place cash rents including operating expense reimbursements and the weighted average estimated market rental rate.
The following table represents the embedded growth by lease expiration year for our portfolio:
Year of Expiration | Occupied Square Footage (in thousands) | Percentage of Total Occupied Square Feet | Annualized Rental Revenue (1) (in thousands) | Number of Leases | Weighted Average Expiring Net Rental Rate per NRSF | Weighted Average Estimated Market Rent per NRSF | ||||||||||||||||
2016 | 96 | 1.3 | % | $ | 1,620 | 57 | $ | 16.88 | $ | 18.67 | (2) | |||||||||||
2017 | 530 | 7.1 | % | $ | 9,463 | 78 | $ | 17.85 | $ | 20.08 | ||||||||||||
2018 | 494 | 6.6 | % | 9,472 | 63 | 19.17 | 19.50 | |||||||||||||||
2019 | 1,043 | 14.0 | % | 20,540 | 56 | 19.69 | 20.47 | |||||||||||||||
2020 | 587 | 7.9 | % | 12,022 | 66 | 20.48 | 20.12 | |||||||||||||||
2021 | 459 | 6.2 | % | 9,114 | 42 | 19.86 | 20.47 | |||||||||||||||
2022 | 418 | 5.6 | % | 7,838 | 35 | 18.75 | 19.15 | |||||||||||||||
2023 | 1,218 | 16.3 | % | 21,666 | 21 | 17.79 | 19.55 | |||||||||||||||
2024 | 291 | 3.9 | % | 4,890 | 15 | 16.80 | 19.09 | |||||||||||||||
2025 | 369 | 4.9 | % | 7,964 | 7 | 21.58 | 21.65 | |||||||||||||||
2026 | 1,273 | 17.1 | % | 20,180 | 12 | 15.85 | 20.44 | |||||||||||||||
Thereafter | 675 | 9.1 | % | 15,721 | 9 | 23.29 | 20.39 | |||||||||||||||
7,453 | 100.0 | % | 140,490 | 461 | $ | 18.85 | $ | 20.21 | ||||||||||||||
(1) Annualized rental revenue represents the rental rate per square foot, multiplied by the number of square feet leased by the customer, multiplied by 12. Annualized rental revenue is defined as rental revenue less operating expense reimbursements.
(2) Includes square feet expiring on the last day of the fourth quarter.
For the period from October 7, 2016 (date of the Spin-Off) to December 31, 2016, six leases were renewed totaling 30,000 rentable square feet at an average annual rental rate per square foot of $19.46, and at an average cost of $4.70 per square foot per year of the lease term. Leases totaling approximately 35,500 rentable square feet expired and were not renewed during the period from October 7, 2016 (date of the Spin-Off) to December 31, 2016.
For the period from October 7, 2016 (date of the Spin-Off) to December 31, 2016, two expansion leases were signed totaling 2,000 rentable square feet at an average annual rental rate per square foot of $19.50 and at an average cost of $8.86 per square foot per year of the lease term.
For the period from October 7, 2016 (date of the Spin-Off) to December 31, 2016, two new leases were signed totaling 26,000 rentable square feet at an average annual rental rate per square foot of $20.09 and at an average cost of $7.40 per square foot per year of the term.
Financial Condition
Comparison of December 31, 2016 to June 29, 2016 (Date of Capitalization)
We were incorporated on June 3, 2016 and were capitalized on June 29, 2016 with Legacy Parkway as our sole stockholder. As of December 31, 2016, our total assets and liabilities were $2.2 billion and $1.0 billion, respectively. The carrying value of our investment in office properties, net of accumulated depreciation, at December 31, 2016 was $1.7 billion and consisted of five
48
office properties that were contributed to us in connection with the Spin-Off. Prior to the Spin-Off, we had not conducted any business as a separate company other than start-up related activities and had no material assets or liabilities.
Results of Operations
For the Period from June 29, 2016 (Date of Capitalization) to December 31, 2016
Net loss attributable to common stockholders. Net loss attributable to common stockholders was $14.3 million for the period from June 29, 2016 (date of capitalization) to December 31, 2016 and consists primarily of operating activity for the 86-day period from October 7, 2016 (date our common stock began regular way trading on the NYSE) to December 31, 2016. For periods presented prior to the date of the Spin-Off, our historical consolidated financial results reflect charges for certain costs related to the Spin-Off which were incurred directly by us, or by Legacy Parkway on our behalf. In each case, these charges were allocated to us based on an analysis of key metrics such as leasable square feet, personnel hours or expenses that were otherwise specifically identifiable, and accordingly, we believe the allocations are reasonable.
Income from Office Properties. Income from office properties was $67.6 million for the 86-day period following the Spin-Off.
Property Operating Expenses. Property operating expenses was $32.5 million for the 86-day period following the Spin-Off.
Management Company Income and Expenses. Management company income and expenses was $1.4 million and $1.1 million, respectively, for the 86-day period following the Spin-Off.
Depreciation and Amortization. Depreciation and amortization expense attributable to office properties was $25.1 million for the 86-day period following the Spin-Off, consisting of $17.0 million of depreciation expense related to office properties and $8.1 million of amortization expense associated with in-place leases and lease commissions.
General and Administrative. General and administrative expense was $17.5 million for the period from June 29, 2016 (date of capitalization) to December 31, 2016, of which $12.1 million was for the 86-day period following the Spin-Off. Included in general and administrative expense for the period from June 29, 2016 (date of capitalization) to December 31, 2016 was $11.4 million of transaction and acquisition costs primarily associated with the Merger and the Greenway Properties joint venture, of which $8.3 million was for the 86-day period following the Spin-Off.
Interest and Other Income. Interest and other income was $1.2 million for the 86-day period following the Spin-Off, consisting primarily of a $1.1 million gain on the sale of non-depreciable real estate.
Interest Expense. Interest expense was $8.0 million for the 86-day period following the Spin-Off, consisting of $4.2 million of mortgage loan interest expense, $3.0 million of interest expense associated with our Term Loan, and approximately $800,000 of amortization of deferred financing costs.
Income Taxes. Income tax expense was $453,000 for the period from June 29, 2016 (date of capitalization) to December 31, 2016, consisting of current income tax expense of $318,000 and deferred income tax expense of $135,000.
49
UNAUDITED PRO FORMA COMBINED FINANCIAL STATEMENTS
For the Years Ended December 31, 2016 and 2015
The following unaudited pro forma combined financial statements have been prepared for, and are included in, this Annual Report on Form 10-K, solely to provide a useful comparison of the Company’s 2016 and 2015 operating results. The pro forma combined financial statements supplements the financial statements of Parkway, Inc., Parkway Houston, and Cousins Houston included elsewhere in this Annual Report on Form 10-K to show the results of Parkway Houston and Cousins Houston on a consolidated basis for 2015, and for Parkway Houston and Cousins Houston from January 1, 2016 to October 5 and October 6, 2016, respectively, and Parkway, Inc. from October 6, 2016 to December 31, 2016 on a consolidated basis, as if Parkway, Inc. had conducted the Houston Business for the years ended December 31, 2015 and 2016.
On April 28, 2016, Cousins, Legacy Parkway, Parkway LP and Clinic Sub Inc. entered into the Merger Agreement, pursuant to which Legacy Parkway merged with and into Clinic Sub Inc., a wholly owned subsidiary of Cousins, with Clinic Sub Inc. continuing as the surviving corporation of the Merger and a wholly owned subsidiary of Cousins. Upon consummation of the Merger, we were initially a wholly owned subsidiary of Cousins. Immediately after the effective time of the Merger, our businesses were separated from the remainder of Cousins’ businesses through the Separation and the UPREIT Reorganization. On the business day following the closing of the Merger, all of the outstanding shares of our common stock and our limited voting stock were distributed pro rata to the holders of Cousins common stock and Cousins limited voting preferred stock, respectively, including Legacy Parkway common and limited voting stockholders. The following unaudited pro forma combined financial statements reflect the distribution ratio of one share of our common stock for every eight shares of Cousins common stock and one share of our limited voting stock for every eight shares of Cousins limited voting preferred stock (the “Distribution Ratio”).
The following unaudited pro forma combined financial statements give effect to the following:
• | the Merger, the Separation, the UPREIT Reorganization, the Spin-Off and the Distribution Ratio; |
• | our post-Separation capital structure which includes proceeds from the $350.0 million Term Loan, $150.0 million of which the Operating Partnership has retained; and |
• | Cousins LP’s contribution of $5 million to us in exchange for shares of our non-voting preferred stock, par value $0.001 per share. |
For purposes of facilitating the discussion of our results of operations in this Management’s Discussion and Analysis, the unaudited pro forma combined financial statements do not give effect to the pending Greenway Properties joint venture transaction contemplated by the Contribution Agreement, which is described elsewhere in this Annual Report on Form 10-K. We cannot provide assurances that the Greenway Properties joint venture transaction will be consummated on the terms or timeline currently contemplated, or at all, which may have a material adverse effect on our business, financial condition and results of operations.
The unaudited pro forma combined statements of operations presented for the years ended December 31, 2016 and 2015 assume the Separation and the related transactions occurred on January 1, 2015. The pro forma adjustments are based on currently available information and assumptions we believe are reasonable, factually supportable, directly attributable to the Separation, the UPREIT Reorganization, and the Spin-Off, and for purposes of the statements of operations, are expected to have a continuing impact on our business. Our unaudited pro forma combined financial statements and explanatory notes present how our financial statements may have appeared had we completed the above transactions as of the dates noted above.
The Merger was accounted for as a “purchase,” as that term is used under GAAP, for accounting and financial reporting purposes. Under purchase accounting, the assets (including identifiable intangible assets) and liabilities (including executory contracts and other commitments) of Legacy Parkway as of the effective time of the Merger were recorded at their respective fair values and added to the assets and liabilities of Cousins. The separation of the assets and liabilities related to the Houston Business from the remainder of Cousins’ businesses in the Separation and the UPREIT Reorganization were at Cousins’ carryover basis after adjusting the Legacy Parkway assets and liabilities to fair value. As a result, our financial statements reflect carryover basis for Cousins Houston properties and fair value basis for the Legacy Parkway assets.
The following unaudited pro forma combined financial statements were prepared in accordance with Article 11 of Regulation S-X (“Article 11”), using the assumptions set forth in the notes to our unaudited pro forma combined financial statements, except they do not include adjustments for the Greenway Properties joint venture transaction that are contemplated by the Contribution Agreement entered into on February 17, 2017 by the Operating Partnership and certain of its affiliates. The unaudited pro forma combined financial statements are presented for illustrative purposes only in order to facilitate the discussion of our result of operations in this Management's Discussion and Analysis and not in order to comply with any applicable SEC
50
rules or regulations. They do not purport to comply with all requirements of Article 11. and do not purport to reflect the results we may achieve in future periods or the historical results that would have been obtained had the above transactions been completed on January 1, 2015. The unaudited pro forma combined financial statements also do not give effect to the potential impact of current financial conditions, any anticipated synergies, operating efficiencies or cost savings that may result from the Separation, the UPREIT Reorganization, and the Spin-Off.
The unaudited pro forma combined financial statements do not indicate results expected for any future period. The unaudited pro forma combined financial statements are derived from and should be read in conjunction with the historical combined financial statements and accompanying notes of Parkway, Inc., Parkway Houston and Cousins Houston appearing in this Annual Report on Form 10-K.
51
PARKWAY, INC.
UNAUDITED PRO FORMA COMBINED STATEMENT OF OPERATIONS
FOR THE YEAR ENDED DECEMBER 31, 2016
(In thousands, except per share data)
(Unaudited)
Parkway Inc. | Cousins Houston Historical (1) | Parkway Houston Historical | Adjustments | Total | |||||||||||||||
Revenues | |||||||||||||||||||
Income from office properties | $ | 67,550 | $ | 137,374 | $ | 83,249 | $ | (8,204 | ) | a | $ | 279,969 | |||||||
Management company income | 1,381 | — | 3,835 | — | 5,216 | ||||||||||||||
Total revenues | 68,931 | 137,374 | 87,084 | (8,204 | ) | 285,185 | |||||||||||||
Expenses | |||||||||||||||||||
Property operating expenses | 32,518 | 58,704 | 39,758 | — | 130,980 | ||||||||||||||
Management company expenses | 1,050 | — | 3,263 | — | 4,313 | ||||||||||||||
Depreciation and amortization | 25,139 | 47,345 | 30,791 | (14,263 | ) | b | 89,012 | ||||||||||||
General and administrative | 17,510 | 13,136 | 4,880 | (17,775 | ) | c | 17,751 | ||||||||||||
Total expenses | 76,217 | 119,185 | 78,692 | (32,038 | ) | 242,056 | |||||||||||||
Operating income (loss) | (7,286 | ) | 18,189 | 8,392 | 23,834 | 43,129 | |||||||||||||
Other income and expenses | |||||||||||||||||||
Interest and other income | 1,225 | 288 | 196 | (196 | ) | d | 1,513 | ||||||||||||
Gain on extinguishment of debt | — | — | 154 | (154 | ) | e | — | ||||||||||||
Interest expense | (8,007 | ) | (6,021 | ) | (10,010 | ) | 9,478 | f | (14,560 | ) | |||||||||
Income (loss) before income taxes | (14,068 | ) | 12,456 | (1,268 | ) | 32,962 | 30,082 | ||||||||||||
Income tax expense | (453 | ) | — | (1,113 | ) | — | (1,566 | ) | |||||||||||
Net income (loss) | (14,521 | ) | 12,456 | (2,381 | ) | 32,962 | 28,516 | ||||||||||||
Net (income) loss attributable to noncontrolling interests | 299 | — | — | (861 | ) | g | (562 | ) | |||||||||||
Net income (loss) attributable to controlling interests | (14,222 | ) | 12,456 | (2,381 | ) | 32,101 | 27,954 | ||||||||||||
Dividends on preferred stock | (94 | ) | — | — | (306 | ) | h | (400 | ) | ||||||||||
Net income (loss) attributable to common stockholders | $ | (14,316 | ) | $ | 12,456 | $ | (2,381 | ) | $ | 31,795 | $ | 27,554 | |||||||
Weighted average shares outstanding—basic | i | 49,111 | |||||||||||||||||
Weighted average shares outstanding—diluted | i | 50,137 | |||||||||||||||||
Basic and diluted earnings per share | $ | 0.56 | |||||||||||||||||
(1) Certain of Cousins Houston historical balances have been reclassified to conform with Parkway Houston historical balances.
See notes to unaudited pro forma combined financial statements
52
PARKWAY, INC.
UNAUDITED PRO FORMA COMBINED STATEMENT OF OPERATIONS
FOR THE YEAR ENDED DECEMBER 31, 2015
(In thousands, except per share data)
(Unaudited)
Parkway, Inc. | Cousins Houston Historical (1) | Parkway Houston Historical | Adjustments | Total | |||||||||||||||
Revenues | |||||||||||||||||||
Income from office properties | $ | — | $ | 177,890 | $ | 108,507 | $ | (28,883 | ) | a | $ | 257,514 | |||||||
Management company income | — | — | 9,891 | — | 9,891 | ||||||||||||||
Sale of condominium units | — | — | 11,063 | — | 11,063 | ||||||||||||||
Total revenues | — | 177,890 | 129,461 | (28,883 | ) | 278,468 | |||||||||||||
Expenses | |||||||||||||||||||
Property operating expenses | — | 74,162 | 45,385 | — | 119,547 | ||||||||||||||
Management company expenses | — | — | 9,362 | — | 9,362 | ||||||||||||||
Cost of sales - condominium units | — | — | 11,120 | — | 11,120 | ||||||||||||||
Depreciation and amortization | — | 63,791 | 55,570 | (33,631 | ) | b | 85,730 | ||||||||||||
General and administrative | — | 6,328 | 6,336 | — | c | 12,664 | |||||||||||||
Total expenses | — | 144,281 | 127,773 | (33,631 | ) | 238,423 | |||||||||||||
Operating income | 33,609 | 1,688 | 4,748 | 40,045 | |||||||||||||||
Other income and expenses | |||||||||||||||||||
Interest and other income | — | — | 246 | (246 | ) | d | — | ||||||||||||
Interest expense | — | (7,988 | ) | (16,088 | ) | 9,569 | f | (14,507 | ) | ||||||||||
Income (loss) before income taxes | — | 25,621 | (14,154 | ) | 14,071 | 25,538 | |||||||||||||
Income tax expense | — | — | (1,635 | ) | (1,635 | ) | |||||||||||||
Net income (loss) | — | 25,621 | (15,789 | ) | 14,071 | 23,903 | |||||||||||||
Net (income) loss attributable to noncontrolling interests | — | — | 7 | (477 | ) | g | (470 | ) | |||||||||||
Net income (loss) attributable to controlling interests | — | 25,621 | (15,782 | ) | 13,594 | 23,433 | |||||||||||||
Dividends on preferred stock | — | — | — | (400 | ) | h | (400 | ) | |||||||||||
Net income (loss) attributable to common stockholders | $ | — | $ | 25,621 | $ | (15,782 | ) | $ | 13,194 | $ | 23,033 | ||||||||
Weighted average shares outstanding—basic | i | 49,111 | |||||||||||||||||
Weighted average shares outstanding—diluted | i | 50,137 | |||||||||||||||||
Basic and diluted earnings per share | $ | 0.47 | |||||||||||||||||
(1) Certain of Cousins Houston historical balances have been reclassified to conform with Parkway Houston historical balances.
See notes to unaudited pro forma combined financial statements
53
NOTES TO UNAUDITED PRO FORMA COMBINED FINANCIAL STATEMENTS
Adjustments to the Unaudited Pro Forma Combined Statements of Operations
a. Income from office properties
Represents the elimination of historical straight-line rents and historical amortization of below market rents, net associated with the leases of Parkway Houston, which were eliminated after the Merger and the amount of below market rents, net associated with Parkway Houston based on fair value in the Merger. The entire lease term was used to calculate the pro forma adjustments for straight-line rent and amortization of above- and below-market rent. No early termination options in leases were accounted for in the lease term because leases including such options contain penalties substantial enough that the continuation of such leases appears, at inception, to be reasonably assured.
The following table summarizes the adjustments made to income from office properties for Parkway Houston’s properties for the period from January 1, 2016 to October 5, 2016 and the year ended December 31, 2015 (in thousands):
Period From January 1, 2016 to October 5, 2016 | ||||
Pro forma Parkway Houston straight-line rent adjustment | $ | 188 | ||
Pro forma (above)/below market rent adjustment | 330 | |||
Historical Parkway Houston amounts | (8,722 | ) | ||
Pro forma adjustment | $ | (8,204 | ) | |
Year Ended December 31, 2015 | ||||
Pro forma Parkway Houston straight-line rent adjustment | $ | 1,537 | ||
Pro forma (above)/below market rent adjustment | 441 | |||
Historical Parkway Houston amounts | (30,861 | ) | ||
Pro forma adjustment | $ | (28,883 | ) | |
b. Depreciation and amortization
The following tables summarize the adjustments made to depreciation and amortization for Parkway Houston’s properties based on fair values in the Merger for the period from January 1, 2016 to October 5, 2016 and the year ended December 31, 2015 (in thousands):
Period From January 1, 2016 to October 5, 2016 | ||||
Pro forma depreciation and amortization | $ | 16,431 | ||
Historical Parkway Houston amounts | (30,694 | ) | ||
Pro forma adjustment | $ | (14,263 | ) | |
Year Ended December 31, 2015 | ||||
Pro forma depreciation and amortization | $ | 21,908 | ||
Historical Parkway Houston amounts | (55,539 | ) | ||
Pro forma adjustment | $ | (33,631 | ) | |
c. General and administrative expenses
Pro forma adjustments represent the elimination of the transaction costs that were incurred by Parkway, Inc. and Cousins Houston related to the Spin-Off.
Management initially expects annual general and administrative expenses to be approximately $16.0 million without consideration for share-based compensation expenses of the Company.
54
This estimate is based on anticipated: (i) corporate-level salaries, including salaries set forth in employment agreements with the executive officers of Legacy Parkway that were assigned to and assumed by Parkway pursuant to the Employee Matters Agreement in connection with the Spin-Off, but not including non-cash compensation, (ii) benefits, (iii) director fees, (iv) rent and related expenses, (v) professional fees and (vi) costs to operate as a public company.
d. Interest and other income
Represents the elimination of the interest income related to Legacy Parkway’s preferred equity investment in ACP Peachtree Center Manager, LLC, which was not assigned to or assumed by the Company in connection with the Separation, the UPREIT Reorganization, and the Spin-Off.
e. Gain on extinguishment of debt
Represents the elimination of gain on extinguishment of debt related to the payoff in full of the $114.0 million mortgage debt secured by CityWestPlace I and II.
f. Interest expense
Represents the pro forma interest expense and pro forma amortization of deferred financing costs related to the Credit Facility and pro forma amortization of above-market debt values created by marking the assumed debt of the Parkway Houston properties to fair market value.
The following tables summarize the adjustments to the unaudited pro forma combined statements of operations to reflect the Credit Facility activity and amortization of Parkway Houston properties’ above-market debt and the elimination of the historical interest expense on the CityWestPlace I and II debt for the period from January 1, 2016 to October 5, 2016 and the year ended December 31, 2015 (in thousands):
Period From January 1, 2016 to October 5, 2016 | ||||
Pro forma interest on Credit Facility | $ | 9,782 | ||
Pro forma amortization of deferred financing costs | 2,477 | |||
Pro forma amortization of above market debt | (2,451 | ) | ||
Historical Parkway Houston amortization of above market debt | 1,544 | |||
Historical interest on CityWestPlace I and II | (1,874 | ) | ||
Pro forma adjustment | $ | 9,478 | ||
Year Ended December 31, 2016 | ||||
Pro forma interest on Credit Facility | $ | 12,798 | ||
Pro forma amortization of deferred financing costs | 3,240 | |||
Pro forma amortization of above market debt | (3,268 | ) | ||
Historical Parkway Houston amortization of above market debt | 3,991 | |||
Historical interest on CityWestPlace I and II | (7,192 | ) | ||
Pro forma adjustment | $ | 9,569 | ||
The Term Loan bears interest at one-month LIBOR plus a spread that ranges from 2.50% to 3.50% per annum (the “Margin”) based on the ratio of the Company's total indebtedness to total asset value. Based upon management’s expectation of the ratio of indebtedness to our total assets after the Spin-Off, the Term Loan bears interest at one-month LIBOR plus a spread of 3.00% for the purposes of pro forma adjustments. At December 31, 2016 and December 31, 2015, LIBOR was approximately 0.77% and 0.43%, respectively, for a total pro forma borrowing rate of approximately 3.77% and 3.43%, respectively. A 12.5 basis point change in LIBOR would result in a change in pro forma interest expense on the Term Loan of approximately $438,000 per year. A 50 basis point change in the margin would result in a change in pro forma interest expense on the Term Loan of approximately $1.8 million per year.
55
g. Noncontrolling interest
Represents the adjustment to allocate net income (loss) to limited partners of Parkway LP.
h. Dividends on Non-Voting Preferred Stock
Represents the pro forma dividend on the $5 million non-voting preferred stock, with an 8.00% per annum stated dividend rate.
i. Weighted average shares
The following table summarizes the pro forma weighted average shares of Parkway common stock outstanding as if the Spin-Off occurred on January 1, 2015 (in thousands):
As of January 1, 2015 | ||
Weighted average shares of common stock-basic | 49,111 | |
Effect of conversion and exchange of OP units in Parkway LP | 1,026 | |
Weighted average shares of Parkway common stock-diluted | 50,137 | |
56
Comparison of the year ended December 31, 2016 to the year ended December 31, 2015 on a pro forma basis.
The following discussion is a comparison of the results of operations of Parkway, Inc. for the years ended December 31, 2016 and 2015, on a pro forma basis, as if the Company owned the Houston Business from January 1, 2015, and does not reflect any other pro forma adjustments. The pro forma comparison is based on the results of operations of Parkway Houston from January 1, 2015 through October 5, 2016, the results of operations of Cousins Houston from January 1, 2015 through October 6, 2016, and the results of operations of Parkway, Inc. from October 7, 2016 through December 31, 2016, all as adjusted for the Merger and the Spin-Off. This discussion is for comparison purposes only and may not be indicative of the results of operations we would have obtained if we had operated the Houston Business as an independent standalone entity during such periods.
Net loss attributable to common stockholders on a pro forma basis for the year ended December 31, 2016 was $27.6 million as compared to $23.0 million on a pro forma basis for the year ended December 31, 2015.
Income from Office Properties. Income from office properties was $280.0 million on a pro forma basis for the year ended December 31, 2016 as compared to $257.5 million on a pro forma basis for the year ended December 31, 2015. The increase is related to a pro forma adjustment of $28.9 million for the year ended December 31, 2015 to eliminate straight-line rent and amortization of below market leases net, as compared to a pro forma adjustment of $8.2 million for the year ended December 31, 2016.
Property Operating Expenses. Property operating expenses was $131.0 million on a pro forma basis for the year ended December 31, 2016 as compared to $119.5 million on a pro forma basis for the year ended December 31, 2015. The increase is primarily due to an increase in real estate taxes and the commencement of new leases at Greenway Plaza.
Management company income and expense. Management company income was $5.2 million on a pro forma basis for the year ended December 31, 2016 as compared to $9.9 million on a pro forma basis for the year ended December 31, 2015. Management company expense was $4.3 million on a pro forma basis for the year ended December 31, 2016 as compared to $9.4 million on a pro forma basis for the year ended December 31, 2015. The decrease in management company income is primarily due to the termination of certain Eola management contracts. The decrease in management company expense is primarily due to a decrease in salary expense associated with personnel formerly employed at assets for which the related management contracts have been terminated.
Depreciation and Amortization. Depreciation and amortization expense attributable to office properties was $89.0 million on a pro forma basis for the year ended December 31, 2016 as compared to $85.7 million on a pro forma basis for the year ended December 31, 2015. The increase in depreciation and amortization is primarily due to depreciation expense for tenant improvements in 2016.
General and Administrative. General and administrative expense was $17.8 million on a pro forma basis for the year ended December 31, 2016 as compared to $12.7 million on a pro forma basis for the year ended December 31, 2015. The increase is primarily due to share-based compensation expense.
Interest and Other Income. Interest and other income was $1.5 million on a pro forma basis for the year ended December 31, 2016 as compared to $0 on a pro forma basis for the year ended December 31, 2015. The increase is primarily due to a $1.1 million gain on the sale of non-depreciable real estate in 2016 and an increase in termination fees.
Interest expense. Interest expense was $14.6 million on a pro forma basis for the year ended December 31, 2016 as compared to $14.5 million on a pro forma basis for the year ended December 31, 2015.
Income Taxes. Income tax expense was $1.6 million on a pro forma basis for the year ended December 31, 2016 as compared to $1.6 million on a pro forma basis for the year ended December 31, 2015.
57
Liquidity and Capital Resources
General
For the next 12 months, our principal liquidity needs are to: (i) fund operating expenses; (ii) meet our debt service requirements; (iii) fund capital expenditures; (iv) make distributions to our stockholders, as required for us to qualify as a REIT; and (v) fund acquisitions, investments and commitments. We expect that these liquidity needs generally will be satisfied by a combination of cash flows from operations and anticipated proceeds from the Greenway Properties joint venture transaction.
Our long-term liquidity needs include the payment of the principal amount of our long-term debt as it matures, making significant capital expenditures from time to time at our properties and acquiring additional investments that meet our investment criteria. In order to adequately meet these long-term liquidity needs, we anticipate using any of the following funding sources: (i) a portion of the anticipated proceeds from the Greenway Properties joint venture transaction, subject to its closing under the Contribution Agreement; (ii) proceeds from the placement of new mortgage loans and refinancing of existing mortgage loans; (iii) proceeds from the sale of assets or portions of wholly owned assets through joint ventures; and (iv) the possible sale of equity or debt securities.
We continually evaluate alternative financing and believe that we can obtain financing on reasonable terms. We expect that our primary uses of capital will be for property and other asset acquisitions and the funding of tenant improvements and other capital expenditures, and debt refinancing.
Cash Flows
Cash and cash equivalents was $230.3 million at December 31, 2016. Cash flows provided by operating activities for the period from June 29, 2016 (date of capitalization) to December 31, 2016 was $38.6 million and is primarily attributable to operating activity at our properties for the 86-day period from October 7, 2016 (date of the Spin-Off) to December 31, 2016, partially offset by transaction costs in connection with the Spin-Off and acquisition costs in connection with the Greenway Properties joint venture transaction contemplated by the Contribution Agreement.
Cash used in investing activities was $4.3 million for the period from June 29, 2016 (date of capitalization) to December 31, 2016 and is primarily due to improvements to real estate, offset by increases in proceeds from the sale of non-depreciable real estate.
Cash provided by financing activities was $196.1 million for the period from June 29, 2016 (date of capitalization) to December 31, 2016 and is primarily attributable to proceeds received from bank borrowings and the issuance of preferred stock in connection with the Spin-Off, offset by total distributions to Cousins in connection with the Spin-Off and principal payments on mortgage notes payable.
Notes Payable to Banks, Net
A summary of notes payable to banks, net at December 31, 2016 is as follows (dollars in thousands):
Interest Rate | Initial Maturity | Outstanding Balance | ||||||
$100.0 Million Revolving Credit Facility | 3.8% | 10/06/2019 | $ | — | ||||
$350.0 Million Three-Year Term Loan | 3.7% | 10/06/2019 | 350,000 | |||||
Notes payable to banks outstanding | $ | 350,000 | ||||||
Unamortized debt issuance costs, net | (8,398 | ) | ||||||
Total notes payable to banks, net | $ | 341,602 | ||||||
Credit Facility
In connection with the Separation and the UPREIT Reorganization, on October 6, 2016, the Company and the Operating Partnership, as borrower, entered into a credit agreement providing for (i) the three-year, $100 million Revolving Credit Facility and (ii) the three-year, $350 million Term Loan with Bank of America, N.A., as Administrative Agent and the lenders party thereto (collectively, the “Lenders”). The Credit Facility has an initial maturity date of October 6, 2019, but is subject to a one-year extension option at the election of the Operating Partnership. The exercise of the extension option requires the payment of an extension fee and the satisfaction of certain other customary conditions. The credit agreement also permits the Operating Partnership
58
to utilize up to $15 million of the Revolving Credit Facility for the issuance of letters of credit. Interest on the Credit Facility will accrue at a rate based on LIBOR or a base rate plus an applicable margin. The Credit Facility will be prepayable at the election of the borrower (upon not less than three business days’ written notice to the administrative agent) without premium or penalty (other than customary breakage fees), and will not require any scheduled repayments of principal prior to the maturity date. The Credit Facility is guaranteed pursuant to a Guaranty Agreement entered into on October 6, 2016, by us, all wholly owned material subsidiaries of the Operating Partnership that are not otherwise prohibited from guarantying the Credit Facility, Parkway Properties General Partners, Inc. and Parkway LP.
As of December 31, 2016, no amounts had been drawn on the Revolving Credit Facility. The Term Loan was fully funded on October 6, 2016 in connection with the Separation and the UPREIT Reorganization, whereby the Company contributed approximately $167 million of the proceeds of the Term Loan, directly or indirectly, to Cousins LP, which used such funds to repay certain indebtedness of Cousins and its subsidiaries, including Legacy Parkway’s previously-existing credit facilities. The Operating Partnership retained the remaining proceeds of the Term Loan as working capital that will be used for the general corporate purposes of the Operating Partnership.
We monitor a number of leverage and other financial metrics including, but not limited to, debt to total asset value ratio, as defined in the loan agreements for our Revolving Credit Facility. In addition, we also monitor interest and fixed charge coverage ratios, as well as the net debt plus preferred stock to Adjusted EBITDA - annualized multiple. The interest coverage ratio is computed by comparing the cash interest accrued to Adjusted EBITDA. The interest coverage ratio for the period from June 29, 2016 (date of capitalization) to December 31, 2016 was 3.8 times. The fixed charge coverage ratio is computed by comparing the cash interest accrued, principal payments made on mortgage loans and preferred dividends accrued to Adjusted EBITDA. The fixed charge coverage ratio for the period from June 29, 2016 (date of capitalization) to December 31, 2016 was 3.1 times. The net debt plus preferred stock to Adjusted EBITDA - annualized multiple is computed by comparing our net debt plus preferred stock to Adjusted EBITDA for the current quarter, as annualized. The net debt plus preferred stock to Adjusted EBITDA - annualized multiple for the three months ended December 31, 2016 was 4.1 times. Management believes various leverage and other financial metrics it monitors provide useful information on total debt levels as well as our ability to cover interest, principal and/or preferred dividend payments. See “Non-GAAP Financial Measures—EBITDA and Adjusted EBITDA” for additional information regarding these ratios.
In connection with the closing of the Greenway Properties joint venture transaction, a portion of the proceeds of the new mortgage financing and the purchase price received from the investors, in each case net of required reserves, is expected to be used to repay all amounts then-outstanding under the Company’s Credit Facility.
Mortgage Notes Payable, Net
At December 31, 2016, we had $451.6 million in mortgage notes payable, net secured by office properties, with an average interest rate of 4.5%.
The aggregate annual maturities and weighted average interest rates of mortgage notes payable, net at December 31, 2016 are as follows (dollars in thousands):
Weighted Average Interest Rate | Total Mortgage Maturities | Balloon Payments | Principal Amortization | ||||||||||
2017 | 4.4% | $ | 9,306 | $ | — | $ | 9,306 | ||||||
2018 | 4.8% | 111,960 | 102,402 | 9,558 | |||||||||
2019 | 4.3% | 8,097 | — | 8,097 | |||||||||
2020 | 4.5% | 252,499 | 246,765 | 5,734 | |||||||||
2021 | 3.9% | 2,418 | — | 2,418 | |||||||||
Thereafter | 3.9% | 65,351 | 62,193 | 3,158 | |||||||||
Total principal maturities | 449,631 | $ | 411,360 | $ | 38,271 | ||||||||
Unamortized premium, net | 2,600 | ||||||||||||
Unamortized debt issuance costs, net | (654 | ) | |||||||||||
Total mortgage notes payable, net | 4.5% | $ | 451,577 | ||||||||||
59
In connection with the Greenway Properties joint venture transaction, on February 22, 2017, the Operating Partnership received the Commitment Letter from Goldman Sachs pursuant to which Goldman Sachs has, among other things, agreed to provide the joint venture and certain of its subsidiaries the Loan in an aggregate principal amount of up to $465 million secured by the Greenway Plaza properties and all related assets. Funding of the Loan is subject to closing of the transaction under the Contribution Agreement and certain other conditions set forth in the Commitment Letter. The new mortgage loan is expected to bear interest at a rate of 3.75%, pursuant to a rate lock agreement entered into simultaneously with the Commitment Letter. In connection with the closing of the joint venture transaction, a portion of the proceeds of the new mortgage financing and the purchase price received from the investors, in each case net of required reserves, is expected to be used to repay all amounts then-outstanding under the Company’s Credit Facility. It is expected that, at closing, a subsidiary of the joint venture will assume the existing mortgage debt secured by Phoenix Tower, which has an outstanding balance of approximately $76.2 million and matures on March 1, 2023.
Equity
In September 2016, we adopted the Parkway, Inc. and Parkway Operating Partnership LP 2016 Omnibus Equity Incentive Plan (the “2016 Plan”), pursuant to which the following types of awards may be granted to our employees, directors and consultants: (i) options, including nonstatutory stock options and incentive stock options; (ii) stock appreciation rights; (iii) restricted shares; (iv) restricted stock units; (v) profits interest units (LTIP units); (vi) dividend equivalents; (vii) other forms of awards payable in or denominated by reference to shares of common stock; or (viii) cash. The 2016 Plan permits the grant of awards with respect to 6,002,596 shares of common stock, which is equal to the sum of (i) 5,000,000 shares of common stock, plus (ii) any shares of our common stock issuable pursuant to awards resulting from awards originally granted under the Parkway Properties, Inc. and Parkway Properties LP 2015 Omnibus Equity Incentive Plan (as successor to the Parkway Properties, Inc. and Parkway Properties LP 2013 Omnibus Equity Incentive Plan) that were outstanding immediately prior to the Spin-Off, replaced with awards of the Company with respect to shares of Cousins’ common stock pursuant to the Merger Agreement and further replaced with awards with respect to shares of our common stock pursuant to and as described in that certain Employee Matters Agreement, dated October 5, 2016, by and among the Company, the Operating Partnership, Cousins and certain other parties, which was entered into in connection with the Spin-Off.
As of December 31, 2016, there were 270,815 time-vesting restricted stock units, 159,899 performance-vesting restricted stock units and 773,617 options to purchase shares of our common stock outstanding under the 2016 Plan.
Dividends
On December 31, 2016, in accordance with our Charter and as authorized by our board of directors, we declared a dividend in the amount of $1,889 per share of Series A non-voting preferred stock to Cousins LP, the holder of record of all outstanding shares of such stock. A preferred dividend totaling approximately $94,000 was paid on January 12, 2017.
Although we have not paid any dividends on our common stock as of the date of this Annual Report on Form 10-K, in accordance with our Charter and as authorized by our board of directors, we have declared a quarterly dividend in the amount of $0.10 per share of common stock to holders of record of our common stock on March 16, 2017. The common dividend will be paid on March 30, 2017. In addition, we declared a dividend in the amount of $2,000 per share of Series A non-voting preferred stock to Cousins LP, the holder of record of all outstanding shares of such stock. A preferred dividend totaling approximately $100,000 will be paid on March 31, 2017 to the holder of record of Series A non-voting preferred stock on March 17, 2017.
We intend to elect and qualify to be taxed as a REIT for U.S. federal income tax purposes beginning with our taxable year that commenced on the day prior to the Spin-Off and ended December 31, 2016. We intend to make regular distributions to our stockholders to satisfy the requirements to qualify as a REIT.
Our dividends may be funded from a variety of sources. In particular, we expect that, initially, our dividends may exceed our net income under GAAP because of non-cash expenses, mainly depreciation and amortization expense, which are included in net income. To the extent that our funds available for distribution are less than the amount we must distribute to our stockholders to satisfy the requirements to qualify as a REIT, we may consider various means to cover any such shortfall, including borrowing under our Revolving Credit Facility or other loans, selling certain of our assets or using a portion of the net proceeds we receive from future offerings of equity, equity-related securities or debt securities or declaring taxable share dividends. In addition, the outstanding shares of Series A non-voting preferred stock have a dividend preference that ranks senior to our common stock, and our Charter allows us to issue additional shares of preferred equity that could have a preference on dividends. Such dividend preferences on preferred equity could limit our ability to pay dividends to the holders of our common stock.
60
Contractual Obligations
We have contractual obligations including mortgage notes payable, notes payable to banks and purchase obligations. The table below presents total payments due under specified contractual obligations by year through maturity at December 31, 2016 (in thousands):
Payments Due By Period | |||||||||||||||||||||||||||
Contractual Obligations | 2017 | 2018 | 2019 | 2020 | 2021 | Thereafter | Total | ||||||||||||||||||||
Long-term debt principal and interest payments (1) | $ | 41,991 | $ | 144,225 | $ | 382,099 | $ | 262,086 | $ | 4,999 | $ | 68,442 | $ | 903,842 | |||||||||||||
Purchase obligations (tenant improvements, lease commissions and lease incentives) | 44,424 | 8,426 | 10,668 | 11,445 | — | — | 74,963 | ||||||||||||||||||||
Total | $ | 86,415 | $ | 152,651 | $ | 392,767 | $ | 273,531 | $ | 4,999 | $ | 68,442 | $ | 978,805 | |||||||||||||
(1) Variable interest payments are calculated using the rate at December 31, 2016.
Capital Expenditures
During the period from June 29, 2016 (date of capitalization) to December 31, 2016, we incurred $8.3 million in capital expenditures. These costs include building improvements, tenant improvements and leasing costs. All such improvements were financed with cash flow from the properties, capital expenditure escrow accounts or borrowings under our Term Loan.
We presently expect to make capital expenditures for building improvements, tenant improvements and leasing commissions of approximately $70.0 million to $80.0 million, representing our share for the year ended December 31, 2017.
Off-Balance Sheet Arrangements
We have a 1% limited partnership interest in 2121 Market Street Associates, LP (“2121 Market Street”). A mortgage loan secured by a first trust deed on 2121 Market Street is guaranteed by us up to a maximum amount of $14.0 million expiring in December 2022.
Critical Accounting Policies and Estimates
General
Our investments are generally made in office properties. Therefore, we are generally subject to risks incidental to the ownership of real estate. Some of these risks include changes in supply or demand for office properties or customers for such properties in an area in which we have buildings; changes in real estate tax rates; and changes in federal income tax, real estate and zoning laws. Our discussion and analysis of financial condition and results of operations is based upon our consolidated financial statements. Our consolidated financial statements include the accounts of the Company, the Operating Partnership and our majority owned subsidiaries in which we have a controlling interest. We also consolidate subsidiaries where the entity is a variable interest entity and we are the primary beneficiary. The preparation of financial statements in conformity with GAAP requires us to make estimates and assumptions that affect the reported amounts of assets and liabilities at the date of the financial statements and the reported amounts of revenues and expenses for the reporting period. Actual results could differ from our estimates.
The accounting policies and estimates used in the preparation of our consolidated financial statements are more fully described in the notes to our consolidated financial statements. However, certain of our significant accounting policies are considered critical accounting policies due to the increased level of assumptions used or estimates made in determining their impact on our consolidated financial statements.
We consider critical accounting policies and estimates to be those used in the determination of the reported amounts and disclosure related to the following items:
Revenue Recognition
We recognize revenue from real estate rentals on a straight-line basis over the noncancelable lease term at the inception of each respective lease in accordance with Financial Accounting Standards Board’s (“FASB”) Accounting Standards Codification (“ASC”) 840, Leases (“ASC 840”). The cumulative difference between lease revenue recognized under this method and contractual lease payment terms is recorded as straight line rent receivable on the accompanying balance sheets.
61
When we are the owner of the tenant improvements, the leased space is ready for its intended use when the tenant improvements are substantially completed, at which point revenue recognition begins. In limited instances, when the tenant is the owner of the tenant improvements, straight-line rent is recognized when the tenant takes possession of the unimproved space.
The leases also typically provide for tenant reimbursement of a portion of common area maintenance, real estate taxes and other operating expenses. Property operating cost recoveries from customers (“expense reimbursements”) are recognized as revenue in the period in which the expenses are incurred. The computation of expense reimbursements is dependent on the provisions of individual customer leases. Most customers make monthly fixed payments of estimated expense reimbursements. We make adjustments, positive or negative, to expense reimbursement income quarterly to adjust the recorded amounts to our best estimate of the final property operating costs based on the most recent annual estimate. After the end of the calendar year, we compute each customer’s final expense reimbursements and issue a bill or credit for the difference between the actual amount and the amounts billed monthly during the year. Differences between actual billed amounts and accrued amounts are considered immaterial.
Management company income represents market-based fees earned from providing management, construction, leasing, brokerage, and acquisition services to related parties and third parties. Management fee income is computed and recorded monthly in accordance with the terms set forth in the management service agreements. Leasing and brokerage commissions, as well as salary and administrative fees, are recognized pursuant to the terms of the agreements at the time underlying leases are signed, which is the point at which the earnings process is complete and collection of the fees is reasonably assured. Fees relating to the purchase or sale of property are recognized when the earnings process is complete and the collection of fees is reasonably assured, which usually occurs at closing. All fees on Company-owned properties are eliminated in consolidation.
We recognize gains or losses on sales of real estate at times and in amounts determined in accordance with the accounting guidance for sales of real estate. The guidance takes into account the terms of the transaction and any continuing involvement, including in the form of management, leasing of space or financial assistance associated with the properties. If the sales criteria for the full accrual method are not met, then we defer gain recognition and account for the transaction by applying the deposit, finance, installment or cost recovery methods, as appropriate.
Impairment of Long-Lived Assets
Changes in the supply or demand of customers for our properties could impact our ability to fill available space. Should a significant amount of available space exist for an extended period, our investment in a particular office building may be impaired. We evaluate our real estate assets and intangible assets upon the occurrence of significant adverse changes to assess whether any impairment indicators are present that affect the recovery of the carrying amount.
We classify certain assets as held for sale based on management having the authority and intent of entering into commitments for sale transactions to close in the next twelve months. We consider an office property as held for sale once we have executed a contract for sale, allowed the buyer to complete its due diligence review and received a substantial non-refundable deposit. Until a buyer has completed its due diligence review of the asset, necessary approvals have been received and substantive conditions to the buyer’s obligation to perform have been satisfied, we do not consider a sale to be probable. When we identify an asset as held for sale, we estimate the net realizable value of such asset and discontinue recording depreciation on the asset. We record assets held for sale at the lower of carrying amount or fair value less cost to sell. If the fair value of the asset net of estimated selling costs is less than the carrying amount, we record an impairment loss.
With respect to assets classified as held and used, we recognize an impairment loss if the carrying amount is not recoverable and exceeds the sum of undiscounted future cash flows expected to result from the use and eventual disposition of the asset. Upon impairment, we recognize an impairment loss to reduce the carrying value of the real estate asset to the estimate of its fair value. The cash flow and fair value estimates are based on assumptions about employing the asset for its remaining useful life. Factors considered in projecting future cash flows include, but are not limited to: existing leases, future leasing and lease terminations, market rental rates, capital improvements, tenant improvements, leasing commissions, inflation, discount rates, capitalization rates and other known variables.
Depreciable Lives Applied to Real Estate and Improvements to Real Estate
Depreciation of buildings and parking garages is computed using the straight-line method over an estimated useful life a range of 7 to 40 years. Depreciation of building improvements is computed using the straight-line method over the estimated useful life of the improvement. If our estimate of useful lives proves to be incorrect, the depreciation expense recognized would also be incorrect. Therefore, a change in the estimated useful lives assigned to buildings and improvements would result in either an increase or decrease in depreciation expense prospectively, which would result in a decrease or increase in earnings.
62
Initial Recognition, Measurement and Assignment of the Cost of Real Estate Acquired
Spin-Off Accounting
The Merger was accounted for as a “purchase,” as that term is used under GAAP, for accounting and financial reporting purposes. Under purchase accounting, the assets (including identifiable intangible assets) and liabilities (including executory contracts and other commitments) of Legacy Parkway as of the effective time of the Merger were recorded at their respective fair values and added to the assets and liabilities of Cousins. The separation of the assets and liabilities related to the Houston Business from the remainder of Cousins’ businesses in the Separation and the UPREIT Reorganization were at Cousins’ carryover basis after adjusting the Legacy Parkway assets and liabilities to fair value. As a result, our financial statements initially reflected carryover basis for Cousins Houston properties and fair value basis for the Legacy Parkway assets.
Operating Property Acquisitions
Upon acquisition of an operating property, we record the acquired tangible and intangible assets and assumed liabilities at fair value at the acquisition date. Fair value is based on estimated cash flow projections that utilize available market information and discount and/or capitalization rates as appropriate. Estimates of future cash flows are based on a number of factors including historical operating results, known and anticipated trends, and market and economic conditions. The acquired assets and assumed liabilities for an acquired operating property generally include, but are not limited to: land, buildings, and identified tangible and intangible assets and liabilities associated with in-place leases, including tenant improvements, leasing costs, value of above-market and below-market leases, and value of acquired in-place leases.
The fair value of land is derived from comparable sales of land within the same submarket and/or region. The fair value of buildings, tenant improvements, and leasing costs are based upon current market replacement costs and other relevant market rate information.
The fair value of the above-market or below-market component of an acquired in-place lease is based upon the present value (calculated using a market discount rate) of the difference between (i) the contractual rents to be paid pursuant to the lease over its remaining term and (ii) management’s estimate of the rents that would be paid using fair market rental rates and rent escalations at the date of acquisition over the remaining term of the lease. In-place leases at acquired properties are reviewed at the time of acquisition to determine if contractual rents are above or below current market rents for the acquired property, and an identifiable intangible asset or liability is recorded if there is an above-market or below-market lease.
The fair value of acquired in-place leases is derived based on our assessment of lost revenue and costs incurred for the period required to lease the “assumed vacant” property to the occupancy level when purchased. This fair value is based on a variety of considerations including, but not necessarily limited to: (1) the value associated with avoiding the cost of originating the acquired in-place leases; (2) the value associated with lost revenue related to tenant reimbursable operating costs estimated to be incurred during the assumed lease-up period; and (3) the value associated with lost rental revenue from existing leases during the assumed lease-up period. Factors considered in performing these analyses include an estimate of the carrying costs during the expected lease-up periods, such as real estate taxes, insurance, and other operating expenses, current market conditions, and costs to execute similar leases, such as leasing commissions, legal, and other related expenses.
The amounts recorded for above-market and in-place leases are included in intangible assets, net on the balance sheet. These amounts are amortized on a straight-line basis as an adjustment to rental income over the remaining term of the applicable leases.
The determination of the fair value of the acquired tangible and intangible assets and assumed liabilities of operating property acquisitions requires significant judgments and assumptions about the numerous inputs discussed above. The use of different assumptions in these fair value calculations could significantly affect the reported amounts of the allocation of the acquisition related assets and liabilities and the related amortization and depreciation expense recorded for such assets and liabilities. In addition, since the values of above-market and below-market leases are amortized as either a reduction or increase to rental income, respectively, the judgments for these intangibles could have a significant impact on reported rental revenues and results of operations.
63
Share-Based Compensation
We account for share-based employee compensation plans under the fair value recognition and measurement provisions in accordance with applicable accounting standards, which require all share-based payments to employees to be measured based on the grant-date fair value of the awards.
Allocated Costs
The historical financial results include certain allocated corporate costs which we believe are reasonable. These costs incurred by Legacy Parkway are reflected as an equity contribution and are estimated to be applicable to us based on an analysis of key metrics such as leasable square feet, personnel hours or expenses that were otherwise specifically identifiable.
Recent Accounting Pronouncements
See information appearing under the caption “—Recent Accounting Pronouncements—” in “Note 2—Basis of Presentation and Summary of Significant Accounting Policies” to the consolidated financial statements of Parkway, Inc. for a discussion of the recent accounting pronouncements not yet adopted by us.
Non-GAAP Financial Measures
Funds From Operations, Recurring FFO and Funds Available for Distribution
Management believes that funds from operations (“FFO”) is an appropriate measure of performance for equity REITs and computes this measure in accordance with the National Association of Real Estate Investment Trusts (“NAREIT”) definition of FFO (including any guidance that NAREIT releases with respect to the definition). FFO is defined by NAREIT as net income (loss) (computed in accordance with GAAP), reduced by preferred dividends, excluding gains or losses from the sale of previously depreciable real estate assets, impairment charges related to depreciable real estate under GAAP, plus depreciation and amortization related to depreciable real estate. Further, we do not adjust FFO to eliminate the effects of non-recurring charges. We believe that FFO is a meaningful supplemental measure of our operating performance because historical cost accounting for real estate assets in accordance with GAAP implicitly assumes that the value of real estate assets diminishes predictably over time, as reflected through depreciation and amortization expenses. We believe that the use of FFO, combined with the required GAAP presentations, has been beneficial in improving the understanding of operating results of REITs among the investing public and making comparisons of operating results among such companies more meaningful. FFO measures 100% of the operating performance of the Operating Partnership in which the Company owns an interest.
The following table presents a reconciliation of net loss to FFO attributable to the Operating Partnership for the period from June 29, 2016 (date of capitalization) to December 31, 2016 (in thousands):
For the Period From June 29, 2016 (Date of Capitalization) to December 31, 2016 | ||||
Net loss | $ | (14,521 | ) | |
Adjustments to derive FFO attributable to the Operating Partnership: | ||||
Dividends on preferred stock | (94 | ) | ||
Depreciation and amortization | 25,139 | |||
FFO attributable to the Operating Partnership | $ | 10,524 | ||
In addition to FFO, we also disclose recurring FFO (“Recurring FFO”), which excludes transaction and acquisition costs or other unusual items. Although this is a non-GAAP measure that differs from NAREIT’s definition of FFO, we believe it provides a meaningful presentation of operating performance because it allows investors to compare our operating performance to our performance in prior reporting periods without the effect of items that by their nature are not comparable from period to period and tend to obscure our actual operating results. Recurring FFO measures 100% of the operating performance of the Operating Partnership in which the Company owns an interest.
64
The following table presents a reconciliation of FFO attributable to the Operating Partnership to Recurring FFO attributable to the Operating Partnership for the period from June 29, 2016 (date of capitalization) to December 31, 2016 (in thousands):
For the Period From June 29, 2016 (Date of Capitalization) to December 31, 2016 | ||||
FFO attributable to the Operating Partnership | $ | 10,524 | ||
Adjustments to derive Recurring FFO attributable to the Operating Partnership: | ||||
Transaction and acquisition costs (1) | 11,426 | |||
Recurring FFO attributable to the Operating Partnership | $ | 21,950 | ||
(1) Transaction and acquisition costs include costs incurred in connection with (i) the Spin-Off and (ii) the pending Greenway Properties joint venture transaction contemplated by the Contribution Agreement.
In addition to FFO and Recurring FFO, we also disclose funds available for distribution (“FAD”). There is not a generally accepted definition established for FAD. Therefore, our measure of FAD may not be comparable to FAD reported by other REITs. We define FAD as FFO, excluding straight-line rents, amortization of below market leases, net, share-based compensation expense, amortization of loan costs, amortization of mortgage interest premium and reduced by capital expenditures for building improvements, tenant improvements and leasing costs. FAD measures 100% of the operating performance of the Operating Partnership in which the Company owns an interest.
The following table presents a reconciliation of FFO attributable to the Operating Partnership to FAD attributable to the Operating Partnership for the period from June 29, 2016 (date of capitalization) to December 31, 2016 (in thousands):
For the Period From June 29, 2016 (Date of Capitalization) to December 31, 2016 | ||||
FFO attributable to the Operating Partnership | $ | 10,524 | ||
Add (deduct): | ||||
Straight-line rents | (3,789 | ) | ||
Amortization of below market leases, net | (1,285 | ) | ||
Share-based compensation expense | 3,780 | |||
Amortization of loan costs | 805 | |||
Amortization of mortgage interest premium | (555 | ) | ||
Capital expenditures: | ||||
Building improvements | (1,939 | ) | ||
Tenant improvements | (5,036 | ) | ||
Leasing costs | (1,317 | ) | ||
Total capital expenditures | (8,292 | ) | ||
FAD attributable to the Operating Partnership | $ | 1,188 | ||
EBITDA and Adjusted EBITDA
We believe that using EBITDA as a non-GAAP financial measure helps investors and our management analyze our ability to service debt. We define EBITDA as net income (loss) before interest expense, income taxes and depreciation and amortization. We further adjust EBITDA to exclude share-based compensation expense and transaction and acquisition costs, which we refer to as “Adjusted EBITDA,” a non-GAAP financial measure. Although EBITDA and Adjusted EBITDA have limitations as analytical tools, we compensate for the limitations by only using EBITDA and Adjusted EBITDA to supplement GAAP financial measures. Additionally, we believe that investors should consider EBITDA and Adjusted EBITDA in conjunction with net income and the other required GAAP measures of our performance to improve their understanding of our operating results. EBITDA and Adjusted EBITDA measure 100% of the operating performance of the Operating Partnership in which the Company owns an interest.
Because EBITDA and Adjusted EBITDA are not measures of financial performance calculated in accordance with GAAP, they should not be considered in isolation or as a substitute for operating income, net income, or cash flows provided by operating, investing and financing activities prepared in accordance with GAAP.
65
The reconciliation of net loss to EBITDA and Adjusted EBITDA and the computation of our proportionate share of interest and fixed charge coverage ratios is as follows for the period from June 29, 2016 (date of capitalization) to December 31, 2016 (in thousands):
For the Period From June 29, 2016 (Date of Capitalization) to December 31, 2016 | |||
Net loss | $ | (14,521 | ) |
Adjustments to net loss: | |||
Interest expense | 8,007 | ||
Income tax expense | 453 | ||
Depreciation and amortization | 25,139 | ||
EBITDA | 19,078 | ||
Share-based compensation expense | 231 | ||
Transaction and acquisition costs (1) | 11,426 | ||
Adjusted EBITDA | $ | 30,735 | |
Interest coverage ratio: | |||
Adjusted EBITDA | $ | 30,735 | |
Interest expense | $ | 8,007 | |
Interest coverage ratio | 3.8 | ||
Fixed charge coverage ratio: | |||
Adjusted EBITDA | $ | 30,735 | |
Fixed charges: | |||
Interest expense | $ | 8,007 | |
Principal payments | 1,679 | ||
Dividends on preferred stock | 94 | ||
Total fixed charges | $ | 9,780 | |
Fixed charge coverage ratio | 3.1 | ||
(1) Transaction and acquisition costs include costs incurred in connection with (i) the Spin-Off and (ii) the pending Greenway Properties joint venture transaction contemplated by the Contribution Agreement.
66
The reconciliation of net loss to EBITDA and Adjusted EBITDA for the three months ended December 31, 2016 and the computation of our proportionate share of interest and fixed charge coverage ratios, as well as the net debt plus preferred stock to Adjusted EBITDA - annualized multiple (in thousands):
Three Months Ended December 31, 2016 | |||
Net loss | $ | (9,149 | ) |
Adjustments to net loss: | |||
Interest expense | 8,007 | ||
Income tax expense | 453 | ||
Depreciation and amortization | 25,139 | ||
EBITDA | 24,450 | ||
Share-based compensation expense | 231 | ||
Transaction and acquisition costs (1) | 8,324 | ||
Adjusted EBITDA | $ | 33,005 | |
Interest coverage ratio: | |||
Adjusted EBITDA | $ | 33,005 | |
Interest expense | $ | 8,007 | |
Interest coverage ratio | 4.1 | ||
Fixed charge coverage ratio: | |||
Adjusted EBITDA | $ | 33,005 | |
Fixed charges: | |||
Interest expense | $ | 8,007 | |
Principal payments | 1,679 | ||
Dividends on preferred stock | 94 | ||
Total fixed charges | $ | 9,780 | |
Fixed charge coverage ratio | 3.4 | ||
Net debt plus preferred stock to Adjusted EBITDA - annualized multiple: | |||
Adjusted EBITDA - annualized (2) | $ | 140,463 | |
Total debt: | |||
Mortgage notes payable, at par | $ | 449,631 | |
Notes payable to banks, at par | 350,000 | ||
Total debt | 799,631 | ||
Less: cash and cash equivalents | (230,333 | ) | |
Net debt | 569,298 | ||
Series A preferred stock (liquidation value) | 5,000 | ||
Net debt plus preferred stock | $ | 574,298 | |
Net debt plus preferred stock to Adjusted EBITDA - annualized multiple | 4.1 | ||
(1) Transaction and acquisition costs include costs incurred in connection with (i) the Spin-Off and (ii) the pending Greenway Properties joint venture transaction contemplated by the Contribution Agreement.
(2) Adjusted EBITDA is annualized for the 86-day period from October 7, 2016 (the day our common stock began regular way trading on the NYSE) to December 31, 2016.
Net Operating Income
We define net operating income (“NOI”) as income from office properties less property operating expenses. We consider NOI to be a useful performance measure to investors and management because it reflects the revenues and expenses directly associated with owning and operating our properties and the impact to operations from trends in occupancy rates, rental rates and operating costs not otherwise reflected in net income. NOI measures 100% of the operating performance of the Operating Partnership in which the Company owns an interest.
67
The following table presents a reconciliation of our net loss to NOI for the period from June 29, 2016 (date of capitalization) to December 31, 2016 (in thousands):
For the Period From June 29, 2016 (Date of Capitalization) to December 31, 2016 | |||
Net loss | $ | (14,521 | ) |
Add (deduct): | |||
Income tax expense | 453 | ||
Interest expense | 8,007 | ||
Interest and other income | (1,225 | ) | |
General and administrative | 17,510 | ||
Depreciation and amortization | 25,139 | ||
Management company expenses | 1,050 | ||
Management company income | (1,381 | ) | |
NOI | $ | 35,032 | |
Inflation
Inflation has not had a significant impact on us because of the relatively low inflation rate in our geographic area of operation. Additionally, most of our leases require customers to pay their pro rata share of operating expenses, including common area maintenance, real estate taxes, utilities and insurance, thereby reducing our exposure to increases in operating expenses resulting from inflation. Our leases typically have three to ten year terms, which may enable us to replace existing leases with new leases at market base rent, which may be higher or lower than the existing lease rate.
PARKWAY HOUSTON
Leasing Activity
During the period from January 1, 2016 to October 5, 2016 (the date immediately prior to the closing date of the Merger), 10 leases were renewed totaling 103,126 rentable square feet at an average annual gross rental rate per square foot of $35.53 and at an average cost of $6.56 per square foot per year of the lease term. Leases totaling approximately 405,000 rentable square feet expired and were not renewed during the period from January 1, 2016 to October 5, 2016 (the date immediately prior to the closing date of the Merger).
During the period from January 1, 2016 to October 5, 2016 (the date immediately prior to the closing date of the Merger), three expansion leases were signed totaling 8,876 rentable square feet at an average annual gross rental rate per square foot of $38.72 and at an average cost of $7.41 per square foot per year of the lease term.
During the period from January 1, 2016 to October 5, 2016 (the date immediately prior to the closing date of the Merger), seven new leases were signed totaling 77,960 rentable square feet at an average annual gross rental rate per square foot of $37.56 and at an average cost of $11.04 per square foot per year of the lease term.
Results of Operations
Comparison of the period from January 1, 2016 to October 5, 2016 (the date immediately prior to the closing date of the Merger) (the “2016 period”) to the year ended December 31, 2015 (the “2015 period”).
Operations for Parkway Houston ended on October 5, 2016 (the date immediately prior to the closing date of the Merger). The Parkway Houston assets were owned for all of 2015 resulting in a decrease in revenues and expenses between the periods due to the 2016 period having only 279 days of activity.
Income from Office Properties. Income from office properties decreased $25.3 million, or 23.3%, between the 2015 period and 2016 period primarily due to a decrease of approximately $26.8 million in income as a result of having only 279 days of activity in 2016 as compared to a full year in 2015, partially offset by an approximately $1.5 million increase primarily due to the impact of a lease commencement at CityWestPlace during the second half of 2015.
68
Property Operating Expenses. Property operating expenses decreased $5.6 million, or 12.4%, between the 2015 period and 2016 period primarily due to a decrease of approximately $9.3 million in expenses as a result of having only 279 days of activity in 2016 as compared to a full year in 2015, partially offset by an approximately $3.7 million increase primarily due to the impact of a lease commencement at CityWestPlace during the second half of 2015.
Management Company Income and Expenses. Management company income decreased $6.1 million, or 61.2%, between the 2015 period and 2016 period primarily as a result of having only 279 days of activity in 2016 as compared to a full year in 2015 and the termination of certain Eola management contracts. Management company expenses decreased $6.1 million, or 65.1%, between the 2015 and 2016 periods primarily as a result of having only 279 days of activity in 2016 as compared to a full year in 2015 and a decrease in salary expense associated with personnel formerly employed at assets for which the related management contracts have been terminated.
Sales and Cost of Sales of Condominium Units. Parkway Houston sold the remaining Murano residential condominium units that were available for sale and recognized $11.1 million in income and $11.1 million in expenses during the year ended December 31, 2015. Accordingly, Parkway Houston had no income and expenses to report for such sales during the 2016 period.
Depreciation and Amortization. Depreciation and amortization expense attributable to office properties decreased $24.8 million, or 44.6%, between the 2015 period and 2016 period primarily due to a decrease of approximately $14.5 million in expenses as a result of having only 279 days of activity in 2016 as compared to a full year in 2015, and a decrease in amortization expense of in-place leases of approximately $10.3 million between the comparative 2016 and 2015 periods prior to the Spin-Off.
General and Administrative. General and administrative expense decreased $1.5 million, or 23.0%, between the 2015 period and 2016 period primarily as a result of having only 279 days of activity in 2016 as compared to a full year in 2015.
Gain on Extinguishment of Debt. On April 6, 2016, Legacy Parkway paid in full the $114.0 million mortgage debt secured by CityWestPlace I and II and recognized a gain on extinguishment of debt of $154,000 during the 2016 period. This paydown has been reflected as a capital contribution for Parkway Houston.
Interest Expense. Interest expense decreased $6.1 million, or 37.8%, between the 2015 period and 2016 period primarily as a result of having only 279 days of activity in 2016 as compared to a full year in 2015 and due to a decrease in mortgage interest expense as a result of Legacy Parkway's April 6, 2016 payment in full of the $114.0 million mortgage debt secured by CityWestPlace I and II.
Income Taxes. The analysis below includes changes attributable to income tax expense for the periods as presented (in thousands):
Period from January 1, 2016 to October 5, 2016 (the date immediately prior to the closing date of the Merger | Year Ended December 31, 2015 | $ Change | % Change | |||||||||||
Income tax expense - current | $ | (547 | ) | $ | (1,272 | ) | $ | 725 | (57.0 | )% | ||||
Income tax expense - deferred | (566 | ) | (363 | ) | (203 | ) | 55.9 | % | ||||||
Total income tax expense | $ | (1,113 | ) | $ | (1,635 | ) | $ | 522 | (31.9 | )% | ||||
*N/M - Not meaningful | ||||||||||||||
Current income tax expense decreased $725,000, or 57.0%, between the 2015 and 2016 periods primarily as a result of the Spin-Off and the sale of the Murano residential condominium units during 2015, partially offset by an increase in net income of Parkway Houston's taxable REIT subsidiary during the first quarter of 2016. Deferred income tax expense increased $203,000, or 55.9%, between the 2015 period and 2016 period primarily as a result of the Spin-Off and the book to tax differences related to the sale of the Murano residential condominium units.
Comparison of the year ended December 31, 2015 to the year ended December 31, 2014.
Net loss attributable to Parkway Houston. Net loss attributable to Parkway Houston was $15.8 million and $23.1 million for the years ended December 31, 2015 and 2014, respectively. The decrease in net loss attributable to Parkway Houston in the amount of $7.3 million for the year ended December 31, 2015, as compared to the year ended December 31, 2014, is primarily attributable to an increase in operating income, partially offset by an increase in income tax expenses.
69
Income from Office Properties. Income from office properties decreased $14.7 million, or 11.9%, during the year ended December 31, 2015 compared to the year ended December 31, 2014, primarily due to a tenant move out at CityWestPlace during the first half of 2015.
Property Operating Expenses. Property operating expenses decreased $9.5 million, or 17.3%, during the year ended December 31, 2015, compared to the year ended December 31, 2014, primarily due to cost savings related to a tenant move out at CityWestPlace during the first half of 2015.
Management Company Income and Expenses. Management company income decreased $14.1 million, or 58.7%, during the year ended December 31, 2015, compared to the year ended December 31, 2014, primarily due to the termination of certain Eola management contracts. Management company expenses decreased $17.7 million, or 65.4%, during the year ended December 31, 2015, compared to the year ended December 31, 2014, and is primarily due to a decrease in salary expense associated with personnel formerly employed at assets for which the related management contracts have been terminated and a decrease in amortization of management contract intangibles, net.
Sale of Condominium Units. Income from the sale of condominium units decreased $5.5 million during the year ended December 31, 2015, compared to the year ended December 31, 2014, primarily due to a decrease in the sale of condominium units partially as a result of a decrease in the number of remaining condominium units available for sale.
Cost of Sales—Condominium Units. Cost of sales decreased $2.1 million during the year ended December 31, 2015, compared to the year ended December 31, 2015, primarily due to the decrease in the sale of condominium units during the period.
Depreciation and Amortization. Depreciation and amortization expense attributable to office properties decreased $8.4 million, or 13.2%, for the year ended December 31, 2015 compared to the year ended December 31, 2014, primarily due to a decrease in amortization expense of in-place leases, partially offset by an increase in depreciation expense associated with tenant improvements.
Impairment Loss on Management Contracts. During the year ended December 31, 2014, Parkway Houston recorded a $4.8 million pre-tax non-cash impairment loss related to certain Eola management contracts. Parkway Houston did not record any impairment losses on management contracts during the year ended December 31, 2015.
General and Administrative. General and administrative expense decreased $581,000, or 8.4%, for the year ended December 31, 2015, compared to the year ended December 31, 2014, and is primarily due to a decrease in allocated general and administrative expenses, largely related to share-based compensation expense for equity based awards issued by Legacy Parkway to its directors and officers.
Interest Expense. Interest expense decreased $164,000, or 1.0%, for the year ended December 31, 2015 compared to the year ended December 31, 2014.
Income Taxes. The analysis below includes changes attributable to income tax benefit (expense) for the years ended December 31, 2015 and 2014 (in thousands):
Year Ended December 31, | ||||||||||||||
2015 | 2014 | $ Change | % Change | |||||||||||
Income tax expense - current | $ | (1,272 | ) | $ | (4,583 | ) | $ | 3,311 | (72.2 | )% | ||||
Income tax (expense) benefit - deferred | (363 | ) | 4,763 | (5,126 | ) | *N/M | ||||||||
Total income tax expense | $ | (1,635 | ) | $ | 180 | $ | (1,815 | ) | *N/M | |||||
*N/M - Not meaningful | ||||||||||||||
Current income tax expense decreased $3.3 million for the year ended December 31, 2015 compared to the year ended December 31, 2014. The decrease is primarily attributable to the decrease of income from the sale of Murano residential condominium units. Deferred income tax benefit decreased $5.1 million for the year ended December 31, 2015 compared to the year ended December 31, 2014. The decrease is primarily attributable to the book to tax differences related to the impairment loss associated with certain Eola management contracts and the reversal of a valuation allowance on the deferred tax assets in 2014.
70
Liquidity and Capital Resources
Cash Flows
Cash and cash equivalents were $13.7 million, $12.0 million and $8.0 million at October 5, 2016 (the date immediately prior to the closing date of the Merger), December 31, 2015 and 2014, respectively. The following table summarizes the changes in cash flows for the periods presented (in thousands):
Period from January 1 to October 5, | Year Ended December 31, | 2016 to 2015 | 2015 to 2014 | ||||||||||||||||
2016 | 2015 | 2014 | Change | Change | |||||||||||||||
Net cash provided by operating activities | $ | 11,264 | $ | 12,856 | $ | 3,192 | $ | (1,592 | ) | $ | 9,664 | ||||||||
Net cash used in investing activities | (13,420 | ) | (46,421 | ) | (4,360 | ) | 33,001 | (42,061 | ) | ||||||||||
Net cash provided by (used in) financing activities | 3,866 | 37,534 | (1,264 | ) | (33,668 | ) | 38,798 | ||||||||||||
Cash flows provided by operating activities decreased $1.6 million between the 2016 and 2015 periods primarily due to the ceasing of operations as a result of the shorter reporting period in 2016 due to the Spin-Off. Cash flows from operating activities decreased further between the periods due to an increase in payments of accounts payable and accrued liabilities as a result of the Spin-Off.
Cash flows used in investing activities decreased $33.0 million between the 2016 and 2015 periods primarily due to the ceasing of operations as a result of the shorter reporting period in 2016 due to the Spin-Off.
Cash flows provided by financing activities decreased $33.7 million between the 2016 and 2015 periods primarily due to the ceasing of operations as a result of the shorter reporting period in 2016 due to the Spin-Off.
Mortgage Notes Payable, Net
At October 5, 2016 (the date immediately prior to the closing date of the Merger), Parkway Houston had $276.4 million in mortgage notes payable, net secured by office properties, including unamortized premiums, net on debt acquired of $4.3 million and unamortized debt issuance costs, net of $274,000, with a weighted average interest rate of 4.6%. The table below presents the principal payments due and weighted average interest rates for total mortgage notes payable, net at October 5, 2016 (dollars in thousands).
Weighted Average Interest Rate | Total Mortgage Maturities | Balloon Payments | Principal Amortization | ||||||||||
Schedule of Mortgage Maturities by Years: | |||||||||||||
2016 | 4.4% | $ | 1,088 | $ | — | $ | 1,088 | ||||||
2017 | 4.5% | 5,670 | — | 5,670 | |||||||||
2018 | 4.8% | 108,166 | 102,402 | 5,764 | |||||||||
2019 | 4.4% | 4,138 | — | 4,138 | |||||||||
2020 | 5.0% | 85,602 | 82,949 | 2,653 | |||||||||
Thereafter | 3.9% | 67,770 | 62,193 | 5,577 | |||||||||
Total principal maturities | 272,434 | $ | 247,544 | $ | 24,890 | ||||||||
Unamortized premium, net | N/A | 4,281 | |||||||||||
Unamortized debt issuance costs, net | N/A | (274 | ) | ||||||||||
Total mortgage notes payable, net | 4.6% | $ | 276,441 | ||||||||||
Contractual Obligations
Parkway Houston has contractual obligations including mortgage notes payable, net and purchase obligations. The table below presents total payments due under specified contractual obligations by year through maturity at October 5, 2016 (in thousands):
71
Payments Due By Period | |||||||||||||||||||||||||||
Contractual Obligations: | 2016 | 2017 | 2018 | 2019 | 2020 | Thereafter | Total | ||||||||||||||||||||
Long-term debt principal and interest payments | $ | 3,425 | $ | 18,049 | $ | 120,283 | $ | 11,139 | $ | 89,319 | $ | 73,440 | $ | 315,655 | |||||||||||||
Purchase obligations (tenant improvements and lease commissions) | 11,646 | 696 | 10 | — | — | — | 12,352 | ||||||||||||||||||||
Total | $ | 15,071 | $ | 18,745 | $ | 120,293 | $ | 11,139 | $ | 89,319 | $ | 73,440 | $ | 328,007 | |||||||||||||
The amounts presented above for long-term debt include principal and interest payments. The amounts presented for purchase obligations represent the remaining tenant improvement allowances and lease commissions for leases in place at October 5, 2016. As of October 5, 2016, Parkway Houston did not have any variable rate debt.
Capital Expenditures
During the period from January 1, 2016 to October 5, 2016 (the date immediately prior to the closing date of the Merger), Parkway Houston incurred approximately $4.0 million, $9.2 million, and $6.5 million in building improvements, tenant improvements, and leasing commissions, respectively. All such improvements were financed with cash flow from the properties, capital expenditure escrow accounts and Legacy Parkway contributions.
Off Balance-Sheet Arrangements
Parkway Houston’s off-balance sheet arrangements are discussed in “Note 9—Commitments and Contingencies” of the accompanying combined financial statements for Parkway Houston.
Critical Accounting Policies and Estimates
The accounting policies and estimates used in the preparation of the Parkway Houston and Cousins Houston combined financial statements are more fully described in the notes to the respective combined financial statements. However, certain significant accounting policies are considered critical accounting policies due to the increased level of assumptions used or estimates made in determining their impact on our consolidated financial statements. Parkway Houston considers critical accounting policies and estimates to be those used in the determination of the reported amounts and disclosure related to the following items:
Revenue Recognition
Parkway Houston recognizes revenue from real estate rentals on a straight-line basis over the noncancelable lease term at the inception of each respective lease in accordance with ASC 840, Leases. The cumulative difference between lease revenue recognized under this method and contractual lease payment terms is recorded as straight-line rent receivable on the accompanying balance sheets.
When Parkway Houston is the owner of the customer improvements, the leased space is ready for its intended use when the tenant improvements are substantially completed, at which point revenue recognition begins. In limited instances, when the tenant is the owner of the tenant improvements, straight-line rent is recognized when the tenant takes possession of the unimproved space.
The leases also typically provide for tenant reimbursement of a portion of common area maintenance, real estate taxes and other operating expenses. Parkway Houston recognizes property operating cost recoveries from customers (“expense reimbursements”) as revenue in the period in which the expenses are incurred. The computation of expense reimbursements is dependent on the provisions of individual customer leases. Most customers make monthly fixed payments of estimated expense reimbursements. Parkway Houston makes quarterly adjustments, positive or negative, to expense reimbursement income to adjust the recorded amounts to Parkway Houston’s best estimate of the final property operating costs based on the most recent annual estimate. After the end of the calendar year, Parkway Houston computes each customer’s final expense reimbursements and issues a bill or credit for the difference between the actual amount and the amounts billed monthly during the year. Differences between actual billed amounts and accrued amounts are considered immaterial.
Management company income represents market-based fees earned from providing management, construction, leasing, brokerage, and acquisition services to Legacy Parkway's unconsolidated joint ventures, related parties, and third parties. Management fee income is computed and recorded monthly in accordance with the terms set forth in the management contracts. Leasing and brokerage commissions, as well as salary and administrative fees, are recognized by Parkway Houston pursuant to the terms of the agreements at the time underlying leases are signed, which is the point at which the earnings process is complete
72
and collection of the fees is reasonably assured. Fees relating to the purchase or sale of property are recognized by Parkway Houston when the earnings process is complete and the collection of fees is reasonably assured, which usually occurs at closing.
Parkway Houston recognizes fees earned from Legacy Parkway’s unconsolidated joint ventures in management company income. At December 31, 2016, Parkway Houston was not a party to any consolidated or unconsolidated joint ventures. The fees from management company income from Legacy Parkway’s unconsolidated joint ventures recognized by Parkway Houston are included herein because they are reflected in the historical financial statements of Legacy Parkway and are attributable to Parkway Houston because Eola, which provides or has provided property management services to certain of Legacy Parkway’s unconsolidated joint ventures, is included in the combined financial statements of Parkway Houston.
Impairment of Long-Lived Assets
Changes in the supply or demand of customers for Parkway Houston’s properties could impact Parkway Houston’s ability to fill available space. Should a significant amount of available space exist for an extended period, Parkway Houston’s investment in a particular office building may be impaired. Parkway Houston has evaluated its real estate assets and intangible assets upon the occurrence of significant adverse changes to assess whether any impairment indicators are present that affect the recovery of the carrying amount.
Parkway Houston classifies certain assets as held for sale based on management having the authority and intent of entering into commitments for sale transactions to close in the next 12 months. Parkway Houston considers an office property as held for sale once it has executed a contract for sale, allowed the buyer to complete its due diligence review and received a substantial nonrefundable deposit. Until a buyer has completed its due diligence review of the asset, necessary approvals have been received and substantive conditions to the buyer’s obligation to perform have been satisfied, Parkway Houston does not consider a sale to be probable. When Parkway Houston identifies an asset as held for sale, it estimates the net realizable value of such asset and discontinue recording depreciation on the asset. Parkway Houston records assets held for sale at the lower of the carrying amount or fair value less cost to sell. If the fair value of the asset net of estimated selling costs is less than the carrying amount, it records an impairment loss.
With respect to assets classified as held and used, Parkway Houston recognizes an impairment loss if the carrying amount is not recoverable and exceeds the sum of undiscounted future cash flows expected to result from the use and eventual disposition of the asset. Upon impairment, Parkway Houston recognizes an impairment loss to reduce the carrying value of the real estate asset to the estimate of its fair value. The cash flow and fair value estimates are based on assumptions about employing the asset for its remaining useful life. Factors considered in projecting future cash flows include, but are not limited to: existing leases, future leasing and terminations, market rental rates, capital improvements, tenant improvements, leasing commissions, inflation, discount rates, capitalization rates and other known variables.
Depreciable Lives Applied to Real Estate and Improvements to Real Estate
Parkway Houston computes depreciation of buildings and parking garages using the straight-line method over an estimated useful life of 40 years. Depreciation of building improvements is computed using the straight-line method over the estimated useful life of the improvement. If Parkway Houston’s estimate of useful lives proves to be incorrect, the depreciation expense recognized would also be incorrect. Therefore, a change in the estimated useful lives assigned to buildings and improvements would result in either an increase or decrease in depreciation expense prospectively, which would result in a decrease or increase in earnings.
Initial Recognition, Measurement and Assignment of the Cost of Real Estate Acquired
Parkway Houston accounts for its acquisitions of real estate by allocating the fair value of real estate to acquired tangible assets, consisting of land, building, garage, building improvements and tenant improvements, identified intangible assets and liabilities, which consist of the value of above and below market leases, lease costs, the value of in-place leases and any value attributable to above or below market debt assumed with the acquisition.
Parkway Houston assigns the purchase price of properties to tangible and intangible assets based on fair values. Parkway Houston determines the fair value of the tangible and intangible components using a variety of methods and assumptions all of which result in an approximation of fair value. Differing assumptions and methods could result in different estimates of fair value and thus, a different purchase price assignment and corresponding increase or decrease in depreciation and amortization expense.
73
Allocated Costs
The historical financial results for Parkway Houston include certain allocated corporate costs which Parkway Houston believes are reasonable. These costs incurred by Legacy Parkway are reflected as an equity contribution and are estimated to be applicable to Parkway Houston based on an analysis of key metrics such as leasable square feet, personnel hours or expenses that were otherwise specifically identifiable. Such costs do not necessarily reflect what the actual costs would have been if Parkway Houston were operating as a separate stand-alone public company
Recent Accounting Pronouncements
Parkway Houston's operations ceased on October 5, 2016, and none of the recent accounting pronouncements impacted Parkway Houston's financial statements and notes. Therefore, this section is not applicable.
Non-GAAP Financial Measures
Funds From Operations
Parkway Houston’s management believes that FFO is an appropriate measure of performance for a REIT and computes this measure in accordance with the NAREIT definition of FFO (including any guidance that NAREIT releases with respect to the definition). FFO is defined by NAREIT as net income (computed in accordance with GAAP), reduced by preferred dividends, excluding gains or losses from sale of previously depreciable real estate assets, impairment charges related to depreciable real estate under GAAP, plus depreciation and amortization related to depreciable real estate. Further, Parkway Houston does not adjust FFO to eliminate the effects of non-recurring charges. Parkway Houston believes that FFO is a meaningful supplemental measure of its operating performance because historical cost accounting for real estate assets in accordance with GAAP implicitly assumes that the value of real estate assets diminishes predictably over time, as reflected through depreciation and amortization expenses. Parkway Houston believes that the use of FFO, combined with the required GAAP presentations, has been beneficial in improving the understanding of operating results of REITs by the investing public and making comparisons of operating results among such companies more meaningful. FFO as reported by Parkway Houston may not be comparable to FFO reported by other REITs that do not define the term in accordance with the current NAREIT definition.
The following table reconciles net loss attributable to Parkway Houston to FFO for the period from January 1, 2016 to October 5, 2016 (the date immediately prior to the closing date of the Merger), and for the years ended December 31, 2015 and 2014 (in thousands):
Period from January 1, 2016 to October 5, 2016 (the date immediately prior to the closing date of the Merger) | Year Ended December 31, | ||||||||||
2015 | 2014 | ||||||||||
(unaudited) | |||||||||||
Net loss attributable to Parkway Houston | $ | (2,381 | ) | $ | (15,782 | ) | $ | (23,051 | ) | ||
Depreciation and amortization | 30,791 | 55,570 | 64,012 | ||||||||
FFO | $ | 28,410 | $ | 39,788 | $ | 40,961 | |||||
Earnings Before Interest, Taxes, Depreciation and Amortization
Parkway Houston believes that using EBITDA as a non-GAAP financial measure helps investors and its management analyze its ability to service debt. Parkway Houston defines EBITDA as net loss attributable to Parkway Houston before interest expense, income tax expense and depreciation and amortization.
The following table reconciles net loss attributable to Parkway Houston to EBITDA for the period from January 1, 2016 to October 5, 2016 (the date immediately prior to the closing date of the Merger), and for the years ended December 31, 2015 and 2014 (in thousands):
74
Period from January 1, 2016 to October 5, 2016 (the date immediately prior to the closing date of the Merger) | Year Ended December 31, | ||||||||||
2015 | 2014 | ||||||||||
(unaudited) | |||||||||||
Net loss attributable to Parkway Houston | $ | (2,381 | ) | $ | (15,782 | ) | $ | (23,051 | ) | ||
Interest expense | 10,010 | 16,088 | 16,252 | ||||||||
Income tax expense (benefit) | 1,113 | 1,635 | (180 | ) | |||||||
Depreciation and amortization | 30,791 | 55,570 | 64,012 | ||||||||
EBITDA | $ | 39,533 | $ | 57,511 | $ | 57,033 | |||||
Net Operating Income
Parkway Houston defines NOI as income from office properties less property operating expenses. Parkway Houston considers NOI to be a useful performance measure to investors and management because it reflects the revenues and expenses directly associated with owning and operating its properties and the impact to operations from trends in occupancy rates, rental rates and operating costs not otherwise reflected in net income.
The following table reconciles net loss attributable to Parkway Houston to NOI for the period from January 1, 2016 to October 5, 2016 (the date immediately prior to the closing date of the Merger), and for the years ended December 31, 2015 and 2014(in thousands):
Period from January 1, 2016 to October 5, 2016 (the date immediately prior to the closing date of the Merger) | Year Ended December 31, | ||||||||||
2015 | 2014 | ||||||||||
(unaudited) | |||||||||||
Net loss attributable to Parkway Houston | $ | (2,381 | ) | $ | (15,782 | ) | $ | (23,051 | ) | ||
Net income (loss) attributable to noncontrolling interests | — | (7 | ) | 148 | |||||||
Income tax expense (benefit) | 1,113 | 1,635 | (180 | ) | |||||||
Interest expense | 10,010 | 16,088 | 16,252 | ||||||||
Gain on extinguishment of debt | (154 | ) | — | — | |||||||
Interest and other income | (196 | ) | (246 | ) | (244 | ) | |||||
General and administrative | 4,880 | 6,336 | 6,917 | ||||||||
Impairment loss on management contracts | — | — | 4,750 | ||||||||
Depreciation and amortization | 30,791 | 55,570 | 64,012 | ||||||||
Cost of sales - condominium units | — | 11,120 | 13,199 | ||||||||
Management company expenses | 3,263 | 9,362 | 27,038 | ||||||||
Sale of condominium units | — | (11,063 | ) | (16,554 | ) | ||||||
Management company income | (3,835 | ) | (9,891 | ) | (23,971 | ) | |||||
NOI | $ | 43,491 | $ | 63,122 | $ | 68,316 | |||||
COUSINS HOUSTON
Leasing Activity
In the period from January 1, 2016 to October 6, 2016, Cousins Houston leased or renewed approximately 322,000 square feet of office space. Net effective rent, representing base rent less operating expense reimbursements and leasing costs, for new or renewed non-amenity leases with terms greater than one year was $12.29 per square foot for the period then ended. Cash basis net effective rent per square foot increased 9.0% during the same period on spaces that have been previously occupied. Cash basis
75
net effective rent represents net rent at the end of the term paid by the prior tenant compared to the net rent at the beginning of the term paid by the current tenant.
In 2015, Cousins Houston leased or renewed approximately 1.3 million square feet of office space. Net effective rent, representing base rent less operating expense reimbursements and leasing costs, for new or renewed non-amenity leases with terms greater than one year was $15.90 per square foot for the year ended December 31, 2015. Cash basis net effective rent per square foot increased 32.5% during 2015 on spaces that had been previously occupied. Cash basis net effective rent represents net rent at the end of the term paid by the prior tenant compared to the net rent at the beginning of the term paid by the current tenant.
Results of Operations
Comparison of the period from January 1, 2016 to October 6, 2016 (the closing date of the Merger) (the “2016 period”) to the year ended December 31, 2015 (the “2015 period”)
Operations for Cousins Houston ceased October 6, 2016 in connection with the Separation, the UPREIT Reorganization, and the Spin-Off of the combined Houston Business as described in Note 1 to the combined financial statements of Cousins Houston contained elsewhere in this Annual Report on Form 10-K, whereas Cousins Houston operated for the full year during 2015, resulting in a decrease in revenues and expenses between the full 2015 period and partial 2016 period. In addition, Cousins Houston incurred transaction costs of $6.3 million in connection with the Separation, the UPREIT Reorganization, and the Spin-Off, with no comparable expenses recorded in 2015.
Rental Property Revenues. Rental property revenues decreased $40.5 million between the 2015 period and 2016 period, primarily from a decrease of $45.4 million as a result of the 2016 period only having 280 days of activity. This decrease was partially offset by an increase of $4.9 million from new leases commencing and an increase in expense recoveries at Greenway Plaza in the 2016 period.
Other Income. Other income increased $288,000 between the 2015 period and 2016 period due to an increase in termination fees.
Rental Property Operating Expenses. Rental property operating expenses decreased $15.5 million between the 2015 period and 2016 period primarily from a decrease of $20.0 million as a result of the 2016 period only having 280 days of activity. This decrease was partially offset by an increase of $4.5 million from new leases commencing at Greenway Plaza in the 2016 period
General and Administrative Expenses. General and administrative expenses increased $459,000 between the 2015 period and 2016 period as a result of an increase in long-term incentive compensation expense incurred by Cousins and allocated to the Company, offset by a decrease in expenses as a result of the Spin-Off.
Interest Expense. Interest expense decreased $2.0 million between the 2015 period and 2016 period as a result of the Spin-Off.
Depreciation and amortization. Depreciation and amortization decreased $16.4 million between the 2015 period and 2016 period, primarily due to a decrease of $14.5 million as a result of the 2016 period only having 280 days of activity. Depreciation and amortization decreased $1.9 million further due to extensions of useful lives from lease amendments at both Greenway Plaza and Post Oak Central, offset by increases due the aforementioned lease commencements in the 2016 period at Greenway Plaza.
Comparison of the year ended December 31, 2015 to the year ended December 31, 2014.
Rental Property Revenues. Rental property revenues decreased $6.6 million between the 2014 and 2015 periods, primarily due to a decrease in occupancy at Greenway Plaza.
Rental Property Operating Expenses. Rental property operating expenses decreased $5.5 million between the 2014 and 2015 periods, primarily due to a decrease in real estate taxes coupled with the decrease in occupancy at Greenway Plaza.
General and Administrative Expenses. General and administrative expenses decreased $1.0 million between the 2014 and 2015 reporting periods, primarily as a result of a decrease in long-term incentive compensation expense incurred by Cousins and allocated to the Company.
76
Depreciation and amortization. Depreciation and amortization decreased $14.0 million between the 2014 and 2015 periods, primarily due to a decrease in occupancy at Greenway Plaza and decreases related to extensions of useful lives of certain tenant assets as a result of lease modifications at Greenway Plaza.
Liquidity and Capital Resources
Cash Flows
Cousins Houston reports and analyzes its cash flows based on operating activities, investing activities and financing activities. Cash and cash equivalents were $0, $109,000 and $684,000 at October 6, 2016, December 31, 2015 and 2014, respectively. The following table summarizes the changes in cash flows for the periods presented (in thousands):
Period from January 1, 2016 to October 6, | Year Ended December 31, | 2016 to 2015 | 2015 to 2014 | ||||||||||||||||
2016 | 2015 | 2014 | Change | Change | |||||||||||||||
Net cash provided by operating activities | $ | 42,667 | $ | 76,395 | $ | 80,220 | $ | (33,728 | ) | $ | (3,825 | ) | |||||||
Net cash used in investing activities | (30,095 | ) | (55,085 | ) | (37,478 | ) | 24,990 | (17,607 | ) | ||||||||||
Net cash used in financing activities | (12,681 | ) | (21,885 | ) | (42,058 | ) | 9,204 | 20,173 | |||||||||||
Cash Flows - Period from January 1, 2016 to October 6, 2016 Compared to the Year Ended December 31, 2015
Cash flows provided by operating activities decreased $33.7 million between the 2016 and 2015 periods primarily due to the ceasing of operations as a result of the shorter reporting period in 2016 due to the Spin-Off. Cash flows from operating activities decreased further between the periods due to an increase in transaction costs of $6.3 million.
Cash flows used in investing activities and financing activities decreased $25.0 million and $9.2 million between the 2016 and 2015 periods, respectively, primarily due to the ceasing of operations as a result of the shorter reporting period in 2016 due to the Spin-Off.
Cash Flows - Year Ended December 31, 2015 Compared to Year Ended December 31, 2014
Cash flows provided by operating activities decreased $3.8 million between the 2015 and 2014 periods primarily due to the timing of operating cash receipts and payments, and a decrease in net cash received from property operations as a result of decreased occupancy at Greenway Plaza.
Cash flows used in investing activities increased $17.6 million between the 2015 and 2014 periods due to an increase in property improvements and tenant asset expenditures.
Cash flows used in financing activities decreased $20.2 million between the 2015 and 2014 periods due to a decrease in net distributions to Cousins. This decrease was primarily due to the increase in cash used for building improvement and tenant asset expenditures.
Note Payable
In September 2013, Cousins Houston entered into a $188.8 million non-recourse mortgage note payable secured by Post Oak Central. The note bears interest at 4.26%, and the maturity date is October 1, 2020. In connection with this note payable, Cousins Houston incurred $1.2 million in loan costs. These costs, net of accumulated amortization of $553,000 and $416,000 at October 6, 2016 and December 31, 2015, respectively, are reflected as a reduction of the loan balance on the accompanying balance sheets. Future principal payments due under this mortgage are as follows (in thousands):
77
Interest Rate | Total Mortgage Maturities | Balloon Payment | Principal Amortization | |||||||||||
Schedule of Mortgage Maturities by Years: | ||||||||||||||
2016 | $ | 591 | $ | — | $ | 591 | ||||||||
2017 | 3,636 | — | 3,636 | |||||||||||
2018 | 3,794 | — | 3,794 | |||||||||||
2019 | 3,959 | — | 3,959 | |||||||||||
2020 | 166,896 | 163,815 | 3,081 | |||||||||||
Total principal maturities | 178,876 | $ | 163,815 | $ | 15,061 | |||||||||
Unamortized debt issuance costs, net | (696 | ) | ||||||||||||
Note payable | 4.3 | % | $ | 178,180 | ||||||||||
Fair value at October 6, 2016 | $ | 185,373 | ||||||||||||
Contractual Obligations and Commitments
Cousins Houston was subject to the following contractual obligations and commitments at October 6, 2016 (in thousands):
Total | Less than 1 year | 1-3 years | 3-5 years | More than 5 years | |||||||||||||||
Contractual Obligations: | |||||||||||||||||||
Company debt: | |||||||||||||||||||
Mortgage notes payable | $ | 178,876 | $ | 591 | $ | 7,340 | $ | 170,855 | $ | — | |||||||||
Interest commitments | 29,232 | 1,269 | 14,891 | 13,072 | — | ||||||||||||||
Total contractual obligations | $ | 208,108 | $ | 1,860 | $ | 22,231 | $ | 183,927 | $ | — | |||||||||
Commitments: | |||||||||||||||||||
Unfunded tenant improvements | $ | 63,135 | $ | 29,779 | $ | 17,008 | $ | 16,348 | $ | — | |||||||||
Total commitments | $ | 63,135 | $ | 29,779 | $ | 17,008 | $ | 16,348 | $ | — | |||||||||
In addition, Cousins Houston has several standing or renewable service contracts mainly related to the operation of the buildings. These contracts are in the ordinary course of business and are generally one year or less. These contracts are not included in the above table and are generally reimbursed in whole or in part by tenants.
As of October 6, 2016, Cousins Houston did not have any variable rate debt.
Capital Expenditures
Cousins Houston incurs costs related to its real estate assets that include leasing costs for new or replacement tenants, expenditures for tenant improvements and ongoing property repairs and maintenance. These capital expenditures are included within investing activities on the statements of cash flows in the property improvements and tenant expenditures line item. Amounts accrued are removed from the table below (accrued capital adjustment) to show the components on these costs on a cash basis. Components of costs included in this line item for the periods presented are as follows (in thousands):
Period from January 1 to October 6, 2016 | Year Ended December 31, | ||||||||||
2015 | 2014 | ||||||||||
Operating properties - leasing costs | $ | 14,202 | $ | 37,109 | $ | 26,628 | |||||
Operating properties - building improvements | 17,633 | 17,762 | 10,119 | ||||||||
Accrued capital expenditures adjustment and other adjustments | (1,740 | ) | 214 | 731 | |||||||
Total property acquisition and development expenditures | $ | 30,095 | $ | 55,085 | $ | 37,478 | |||||
Capital expenditures decreased in 2016 mainly due to decreased capitalized leasing costs. Capitalized leasing costs, which include tenant improvements, leasing costs and related capitalized personnel costs, are a function of the number and size of newly executed leases or renewals of existing leases. The amounts of tenant improvement and leasing costs on a per square foot basis for the period from January 1, 2016 to October 1, 2016 were as follows:
78
Period from January 1 to October 6, 2016 | |||
New leases | $ | 7.71 | |
Renewal leases | 4.91 | ||
Expansion leases | 6.63 | ||
Off Balance-Sheet Arrangements
As of October 6, 2016, Cousins Houston did not have any off-balance sheet arrangements.
Critical Accounting Policies
Cousins Houston's financial statements are prepared in accordance with GAAP as outlined in the Financial Accounting Standards Board’s (“FASB”) Accounting Standards Codification (“ASC”), and the notes to the combined financial statements include a summary of the significant accounting policies. The preparation of financial statements in accordance with GAAP requires the use of certain estimates, a change in which could materially affect revenues, expenses, assets, or liabilities. Some of Cousins Houston's accounting policies are considered to be critical accounting policies, which are ones that are both important to the portrayal of Cousins Houston's financial condition, results of operations, and cash flows, and ones that also require significant judgment or complex estimation processes. Cousins Houston's critical accounting policies are as follows:
Operating Property Acquisitions
Upon acquisition of an operating property, Cousins Houston records the acquired tangible and intangible assets and assumed liabilities at fair value at the acquisition date. Fair value is based on estimated cash flow projections that utilize available market information and discount and/or capitalization rates as appropriate. Estimates of future cash flows are based on a number of factors including historical operating results, known and anticipated trends, and market and economic conditions. The acquired assets and assumed liabilities for an acquired operating property generally include, but are not limited to: land, buildings, and identified tangible and intangible assets and liabilities associated with in-place leases, including tenant improvements, leasing costs, value of above-market and below-market leases, and value of acquired in-place leases.
The fair value of land is derived from comparable sales of land within the same submarket and/or region. The fair value of buildings, tenant improvements, and leasing costs are based upon current market replacement costs and other relevant market rate information.
The fair value of the above-market or below-market component of an acquired in-place lease is based upon the present value (calculated using a market discount rate) of the difference between (i) the contractual rents to be paid pursuant to the lease over its remaining term and (ii) management’s estimate of the rents that would be paid using fair market rental rates and rent escalations at the date of acquisition over the remaining term of the lease. In-place leases at acquired properties are reviewed at the time of acquisition to determine if contractual rents are above or below current market rents for the acquired property, and an identifiable intangible asset or liability is recorded if there is an above-market or below-market lease.
The fair value of acquired in-place leases is derived based on Cousin Houston's assessment of lost revenue and costs incurred for the period required to lease the “assumed vacant” property to the occupancy level when purchased. This fair value is based on a variety of considerations including, but not necessarily limited to: (1) the value associated with avoiding the cost of originating the acquired in-place leases; (2) the value associated with lost revenue related to tenant reimbursable operating costs estimated to be incurred during the assumed lease-up period; and (3) the value associated with lost rental revenue from existing leases during the assumed lease-up period. Factors considered in performing these analyses include an estimate of the carrying costs during the expected lease-up periods, such as real estate taxes, insurance, and other operating expenses, current market conditions, and costs to execute similar leases, such as leasing commissions, legal, and other related expenses.
The amounts recorded for above-market and in-place leases are included in other assets on the balance sheets, and the amounts for below-market leases are included in other liabilities on the balance sheets. These amounts are amortized on a straight-line basis as an adjustment to rental income over the remaining term of the applicable leases.
The determination of the fair value of the acquired tangible and intangible assets and assumed liabilities of operating property acquisitions requires significant judgments and assumptions about the numerous inputs discussed above. The use of different assumptions in these fair value calculations could significantly affect the reported amounts of the allocation of the acquisition related assets and liabilities and the related amortization and depreciation expense recorded for such assets and liabilities.
79
In addition, since the values of above-market and below-market leases are amortized as either a reduction or increase to rental income, the judgments for these intangibles could have a significant impact on reported rental revenues and results of operations.
Depreciation and Amortization
Cousins Houston depreciates or amortizes operating real estate assets over their estimated useful lives using the straight-line method of depreciation. Cousins Houston uses judgment when estimating the life of real estate assets and when allocating certain indirect project costs to projects under development. Historical data, comparable properties, and replacement costs are some of the factors considered in determining useful lives and cost allocations. The use of different assumptions for the estimated useful life of assets or cost allocations could significantly affect depreciation and amortization expense and the carrying amount of Cousin Houston's real estate assets.
Impairment
Cousins Houston reviews its real estate assets on a property-by-property basis for impairment. This review includes Cousin Houston's operating properties and land holdings.
The first step in this process is for us to use judgment to determine whether an asset is considered to be held and used or held for sale, in accordance with accounting guidance. In order to be considered a real estate asset held for sale, Cousins Houston must, among other things, have the authority to commit to a plan to sell the asset in its current condition, have commenced the plan to sell the asset, and have determined that it is probable that the asset will sell within one year. If Cousins Houston determines that an asset is held for sale or to be distributed to stockholders in a spin-off, it must record an impairment loss if the fair value less costs to sell is less than the carrying amount. All real estate assets not meeting the held for sale criteria are considered to be held and used.
In the impairment analysis for assets held and used, Cousins Houston must use judgment to determine whether there are indicators of impairment. For operating properties, these indicators could include a decline in a property’s leasing percentage, a current period operating loss or negative cash flows combined with a history of losses at the property, a decline in lease rates for that property or others in the property’s market, or an adverse change in the financial condition of significant tenants. For land holdings, indicators could include an overall decline in the market value of land in the region, a decline in development activity for the intended use of the land or other adverse economic and market conditions.
If Cousins Houston determines that an asset that is held and used has indicators of impairment, Cousins Houston must determine whether the undiscounted cash flows associated with the asset exceed the carrying amount of the asset. If the undiscounted cash flows are less than the carrying amount of the asset, Cousins Houston must reduce the carrying amount of the asset to fair value.
In calculating the undiscounted net cash flows of an asset, Cousins Houston must estimate a number of inputs. For operating properties, Cousins Houston must estimate future rental rates, expenditures for future leases, future operating expenses, and market capitalization rates for residual values, among other things. In addition, if there are alternative strategies for the future use of the asset, Cousins Houston must assess the probability of each alternative strategy and perform a probability-weighted undiscounted cash flow analysis to assess the recoverability of the asset. Cousins Houston must use considerable judgment in determining the alternative strategies and in assessing the probability of each strategy selected.
In determining the fair value of an asset, Cousins Houston exercise judgment on a number of factors. Cousins Houston may determine fair value by using a discounted cash flow calculation or by utilizing comparable market information. Cousins Houston must determine an appropriate discount rate to apply to the cash flows in the discounted cash flow calculation. Cousins Houston must use judgment in analyzing comparable market information because no two real estate assets are identical in location and price.
The estimates and judgments used in the impairment process are highly subjective and susceptible to frequent change. If Cousins Houston determines that an asset is held and used, the results of operations could be materially different than if Cousins Houston determines that an asset is held for sale. Different assumptions Cousins Houston uses in the calculation of undiscounted net cash flows of a project, including the assumptions associated with alternative strategies and the probabilities associated with alternative strategies, could cause a material impairment loss to be recognized when no impairment is otherwise warranted. Cousin Houston's assumptions about the discount rate used in a discounted cash flow estimate of fair value and Cousin Houston's judgment with respect to market information could materially affect the decision to record impairment losses or, if required, the amount of the impairment losses.
80
Valuation of Receivables
Notes and accounts receivable are reduced by an allowance for amounts that may become uncollectible in the future. Cousins Houston reviews its receivables regularly for potential collection problems in computing the allowance to record against Cousin Houston's receivables. This review requires us to make certain judgments regarding collectibility, notwithstanding the fact that ultimate collections are inherently difficult to predict. Economic conditions fluctuate over time, and Cousins Houston has tenants in many different industries which experience changes in economic health, making collectibility prediction difficult. Therefore, certain receivables currently deemed collectible could become uncollectible, and those reserved could ultimately be collected. A change in judgments made could result in an adjustment to the allowance for doubtful accounts with a corresponding effect on net income.
Recoveries from Tenants
Recoveries from tenants for operating expenses are determined on a calendar year and on a lease-by-lease basis. The most common types of cost reimbursements in Cousin Houston's leases are utility expenses, building operating expenses, real estate taxes, and insurance, for which the tenant pays its pro rata share in excess of a base year amount, if applicable. The computation of these amounts is complex and involves numerous judgments, including the interpretation of lease terms and other customer lease provisions. Leases are not uniform in dealing with such cost reimbursements and there are many variations in the computation. Cousins Houston accrues income related to these payments each month. Cousins Houston makes monthly accrual adjustments, positive or negative, to recorded amounts to Cousin Houston's best estimate of the annual amounts to be billed and collected with respect to the cost reimbursements. After the end of the calendar year, Cousins Houston computes each customer’s final cost reimbursements and, after considering amounts paid by the tenant during the year, issue a bill or credit for the appropriate amount to the tenant. The differences between the amounts billed less previously received payments and the accrual adjustments are recorded as increases or decreases to revenues when the final bills are prepared, which occurs during the first half of the subsequent year.
Recent Accounting Pronouncements
Cousins Houston's operations ceased on October 6, 2016, and none of the recent accounting pronouncements impacted Cousins Houston's financial statements and notes. Therefore, this section is not applicable.
Non-GAAP Financial Measures
Funds From Operations (FFO)
The table below shows FFO, a non-GAAP financial measure, and the related reconciliation to net income. Cousins Houston calculates FFO in accordance with the National Association of Real Estate Investment Trusts’ (“NAREIT”) definition, which is net income (computed in accordance with GAAP), excluding extraordinary items, cumulative effect of change in accounting principle and gains on sale or impairment losses on depreciable property, plus depreciation and amortization of real estate assets.
FFO is used by industry analysts and investors as a supplemental measure of a REIT’s operating performance. Historical cost accounting for real estate assets implicitly assumes that the value of real estate assets diminishes predictably over time. Since real estate values instead have historically risen or fallen with market conditions, many industry investors and analysts have considered presentation of operating results for real estate companies that use historical cost accounting to be insufficient by themselves. Thus, NAREIT created FFO as a supplemental measure of REIT operating performance that excludes historical cost depreciation, among other items, from GAAP net income. The use of FFO, combined with the required primary GAAP presentations, has been fundamentally beneficial, improving the understanding of operating results of REITs among the investing public and making comparisons of REIT operating results more meaningful. Cousin Houston's management evaluates operating performance in part based on FFO. The reconciliation of net income to FFO is as follows (in thousands):
81
Period from January 1, 2016 to October 6, | Year ended | ||||||||||
December 31, | |||||||||||
2016 | 2015 | 2014 | |||||||||
(unaudited) | |||||||||||
Net income | $ | 12,456 | $ | 25,621 | $ | 11,708 | |||||
Depreciation and amortization | 47,345 | 63,791 | 77,760 | ||||||||
FFO | $ | 59,801 | $ | 89,412 | $ | 89,468 | |||||
Earnings Before Interest, Taxes, Depreciation and Amortization (EBITDA)
Cousins Houston believes that using EBITDA as a non-GAAP financial measure helps investors and Cousin Houston’s management analyze its ability to service debt and pay cash distributions. Cousins Houston defines EBITDA as net income before interest expense and depreciation and amortization.
The following table reconciles net income to EBITDA of Cousins Houston for the period from January 1 to October 6, 2016, and for the years ended December 31, 2015 and 2014 (in thousands):
Period from January 1 to October 6, | Year Ended | ||||||||||
December 31, | |||||||||||
2016 | 2015 | 2014 | |||||||||
(unaudited) | |||||||||||
Net income | $ | 12,456 | $ | 25,621 | $ | 11,708 | |||||
Interest expense | 6,021 | 7,988 | 8,127 | ||||||||
Depreciation and amortizaion | 47,345 | 63,791 | 77,760 | ||||||||
EBITDA | $ | 65,822 | $ | 97,400 | $ | 97,595 | |||||
Net Operating Income (NOI)
Cousins Houston defines NOI as income from office properties less property operating expenses. Cousins Houston considers NOI to be a useful performance measure to investors and management because it reflects the revenues and expenses directly associated with owning and operating Cousins Houston’s properties and the impact to operations from trends in occupancy rates, rental rates and operating costs not otherwise reflected in net income.
The following table reconciles net income to NOI of Cousins Houston for the period from January 1 to October 6, 2016, and for the years ended December 31, 2015 and 2014 (in thousands):
Period from January 1, 2016 to October 6, | Year ended December 31, | ||||||||||
2016 | 2015 | 2014 | |||||||||
(unaudited) | |||||||||||
Net income | $ | 12,456 | $ | 25,621 | $ | 11,708 | |||||
Other income | (288 | ) | — | (31 | ) | ||||||
General and administrative expenses | 6,787 | 6,328 | 7,347 | ||||||||
Depreciation and amortization | 47,345 | 63,791 | 77,760 | ||||||||
Interest expense | 6,021 | 7,988 | 8,127 | ||||||||
Transaction costs | 6,349 | — | — | ||||||||
NOI | $ | 78,670 | $ | 103,728 | $ | 104,911 | |||||
82
ITEM 7A. Quantitative and Qualitative Disclosures About Market Risk.
Our future income, cash flows and fair values relevant to financial instruments are dependent upon prevailing market interest rates, which is the primary market risk to which we believe we are exposed. Many factors, including governmental monetary and tax policies, domestic and international economic and political considerations and other factors that are beyond our control, contribute to interest rate risk. On October 6, 2016, we entered into the credit agreement governing the Credit Facility. We are exposed to interest rate changes primarily through our three-year, $350 million senior secured Term Loan, which bears interest at a rate equal to LIBOR plus a margin ranging from 2.50% to 3.50%, and the $100 million Revolving Credit Facility, if and when we make a draw under it. From time to time, we may enter into hedging transactions with respect to our outstanding indebtedness. Any such hedging transactions could take a variety of forms, including the use of derivative instruments such as interest rate swap or cap agreements, option agreements, and futures or forward contracts.
As of December 31, 2016, our outstanding debt consisted of a total of approximately $451.6 million in fixed-rate mortgage debt on four of our five properties and $350 million outstanding under Term Loan, which bore interest at a rate of LIBOR plus 2.50% to 3.50%. For additional information, see Item 2. “Properties—Mortgage Debt.” An increase in LIBOR by one percentage point would increase the interest expense on the amount outstanding under the Term Loan as of December 31, 2016 by approximately $3.5 million annually. Conversely, a decrease in LIBOR to 0% would decrease the interest expense on this indebtedness by approximately $2.7 million annually, based on the one month LIBOR rate of approximately 0.77% as of December 31, 2016.
The above analyses do not consider the effect of any change in overall economic activity that could impact interest rates or expected changes associated with future indebtedness. Further, in the event of a change of that magnitude, we may take actions to further mitigate our exposure to the change. However, due to the uncertainty of the specific actions that would be taken and their possible effects, these analyses assume no changes in our financial structure.
In connection with the Greenway Properties joint venture, on February 22, 2017, the Operating Partnership received the Commitment Letter from Goldman Sachs pursuant to which Goldman Sachs has, among other things, agreed to provide the joint venture and certain of its subsidiaries the Loan in an aggregate principal amount of up to $465 million secured by the Greenway Plaza properties and all related assets. Funding of the new mortgage loan is subject to closing of the transaction under the Contribution Agreement and certain other conditions set forth in the Commitment Letter. The new mortgage loan is expected to bear interest at a rate of 3.75%, pursuant to a rate lock agreement entered into simultaneously with the Commitment Letter. In connection with the closing of the joint venture transaction, a portion of the proceeds of the new mortgage financing and the purchase price received from the investors, in each case net of required reserves, will be used to repay all amounts then-outstanding under the Company’s Credit Facility. It is expected that, at closing, the joint venture will assume the existing mortgage debt secured by Phoenix Tower, which has an outstanding balance of approximately $76.2 million and matures on March 1, 2023.
For additional information, see information under the caption “Liquidity” appearing in “Item 7. Management’s Discussion and Analysis of Financial Condition and Results of Operations—Parkway, Inc.”
83
ITEM 8. Financial Statements and Supplementary Data.
Index to Financial Statements | Page |
Parkway, Inc. | |
Parkway Houston | |
Cousins Houston | |
All other financial schedules are not required under the related instructions, or are inapplicable, and therefore have been omitted. | |
84
REPORT OF INDEPENDENT REGISTERED PUBLIC ACCOUNTING FIRM
THE BOARD OF DIRECTORS AND STOCKHOLDERS
PARKWAY, INC.
We have audited the accompanying consolidated balance sheet of Parkway, Inc. and subsidiaries (the “Company”) as of December 31, 2016, and the related consolidated statements of operations, changes in equity and cash flows for the period from June 29, 2016 (date of capitalization) to December 31, 2016. Our audit also included the financial statement schedule of the Company listed in the Index at Item 15(a)(2). These financial statements and schedule are the responsibility of the Company’s management. Our responsibility is to express an opinion on these financial statements and schedule based on our audit.
We conducted our audit in accordance with the standards of the Public Company Accounting Oversight Board (United States). Those standards require that we plan and perform the audit to obtain reasonable assurance about whether the financial statements are free of material misstatement. We were not engaged to perform an audit of the Company’s internal control over financial reporting. Our audit included consideration of internal control over financial reporting as a basis for designing audit procedures that are appropriate in the circumstances, but not for the purpose of expressing an opinion on the effectiveness of the Company’s internal controls over financial reporting. Accordingly, we express no such opinion. An audit also includes examining, on a test basis, evidence supporting the amounts and disclosures in the financial statements, assessing the accounting principles used and significant estimates made by management, and evaluating the overall financial statement presentation. We believe that our audit provides a reasonable basis for our opinion.
In our opinion, the financial statements referred to above present fairly, in all material respects, the consolidated financial position of the Company at December 31, 2016, and the consolidated results of its operations and its cash flows for the period from June 29, 2016 (date of capitalization) to December 31, 2016, in conformity with U.S. generally accepted accounting principles. Also, in our opinion, the related financial statement schedule, when considered in relation to the basic financial statements taken as a whole, presents fairly in all material respects the information set forth therein.
/s/ Ernst & Young LLP
Indianapolis, Indiana
March 15, 2017
85
PARKWAY, INC.
CONSOLIDATED BALANCE SHEET
(in thousands, except share and per share data)
December 31, 2016 | |||
Assets | |||
Real estate related investments: | |||
Office properties | $ | 1,864,668 | |
Accumulated depreciation | (159,057 | ) | |
Total real estate related investments, net | 1,705,611 | ||
Cash and cash equivalents | 230,333 | ||
Receivables and other assets | 92,257 | ||
In-place lease intangibles, net of accumulated amortization of $76,137 | 117,243 | ||
Other intangible assets, net | 18,451 | ||
Total assets | $ | 2,163,895 | |
Liabilities | |||
Notes payable to banks, net | $ | 341,602 | |
Mortgage notes payable, net | 451,577 | ||
Accounts payable and other liabilities | 47,219 | ||
Accrued tenant improvements | 66,104 | ||
Accrued property taxes | 53,659 | ||
Below market leases, net of accumulated amortization of $26,958 | 51,812 | ||
Total liabilities | 1,011,973 | ||
Equity | |||
Parkway, Inc. stockholders’ equity | |||
Common stock, $0.001 par value, 200,000,000 shares authorized and 49,110,645 shares issued and outstanding | 49 | ||
Limited voting stock, $0.001 par value, 1,000,000 shares authorized and 858,417 shares issued and outstanding | 1 | ||
8.00% Series A non-voting preferred stock, $100,000 liquidation preference per share, 50 shares authorized, issued and outstanding, and preferred stock, $0.001 par value, 48,999,950 shares authorized, zero issued and outstanding | 5,000 | ||
Additional paid-in capital | 1,138,151 | ||
Accumulated deficit | (14,316 | ) | |
Total Parkway, Inc. stockholders’ equity | 1,128,885 | ||
Noncontrolling interest - unitholders | 23,037 | ||
Total equity | 1,151,922 | ||
Total liabilities and equity | $ | 2,163,895 | |
See notes to consolidated financial statements.
86
PARKWAY, INC.
CONSOLIDATED STATEMENT OF OPERATIONS
(in thousands, except per share data)
For the Period From June 29, 2016 (Date of Capitalization) to December 31, 2016 | |||
Revenues | |||
Income from office properties | $ | 67,550 | |
Management company income | 1,381 | ||
Total revenues | 68,931 | ||
Expenses | |||
Property operating expenses | 32,518 | ||
Management company expenses | 1,050 | ||
Depreciation and amortization | 25,139 | ||
General and administrative | 17,510 | ||
Total expenses | 76,217 | ||
Operating loss | (7,286 | ) | |
Other income and expenses | |||
Interest and other income | 1,225 | ||
Interest expense | (8,007 | ) | |
Loss before income taxes | (14,068 | ) | |
Income tax expense | (453 | ) | |
Net loss | (14,521 | ) | |
Net loss attributable to noncontrolling interest - unitholders | 299 | ||
Net loss attributable to Parkway, Inc. | (14,222 | ) | |
Dividends on preferred stock | (94 | ) | |
Net loss attributable to common stockholders | $ | (14,316 | ) |
Net loss per common share attributable to common stockholders: | |||
Basic net loss per common share attributable to common stockholders | $ | (0.29 | ) |
Diluted net loss per common share attributable to common stockholders | $ | (0.29 | ) |
Weighted average shares outstanding: | |||
Basic | 49,111 | ||
Diluted | 49,111 | ||
See notes to consolidated financial statements.
87
PARKWAY, INC.
CONSOLIDATED STATEMENT OF CHANGES IN EQUITY
(in thousands, except share and per share data)
Parkway, Inc. Stockholders’ Equity | |||||||||||||||||||||||||||
Common Stock | Limited Voting Stock | Preferred Stock | Additional Paid-In Capital | Accumulated Deficit | Noncontrolling Interest - Unitholders | Total Equity | |||||||||||||||||||||
Balance at June 29, 2016 (date of capitalization) | $ | — | $ | — | $ | — | $ | — | $ | — | $ | — | $ | — | |||||||||||||
Net loss | — | — | — | — | (14,222 | ) | (299 | ) | (14,521 | ) | |||||||||||||||||
Preferred dividends declared - $1,889 per share | — | — | — | — | (94 | ) | — | (94 | ) | ||||||||||||||||||
Share-based compensation | — | — | — | 3,780 | — | — | 3,780 | ||||||||||||||||||||
Contributions from Parkway Properties, Inc. | — | — | — | 17,114 | — | — | 17,114 | ||||||||||||||||||||
Contribution in connection with Spin-Off | — | — | — | 1,117,257 | — | — | 1,117,257 | ||||||||||||||||||||
Issuance of 49,110,645 shares of common stock in connection with Spin-Off | 49 | — | — | — | — | — | 49 | ||||||||||||||||||||
Issuance of 858,417 shares of limited voting stock in connection with Spin-Off | — | 1 | — | — | — | — | 1 | ||||||||||||||||||||
Issuance of 50 shares of 8.00% Series A preferred stock in connection with Spin-Off | — | — | 5,000 | — | — | — | 5,000 | ||||||||||||||||||||
Contribution of capital by noncontrolling interests in connection with Spin-Off | — | — | — | — | — | 23,336 | 23,336 | ||||||||||||||||||||
Balance at December 31, 2016 | $ | 49 | $ | 1 | $ | 5,000 | $ | 1,138,151 | $ | (14,316 | ) | $ | 23,037 | $ | 1,151,922 | ||||||||||||
See notes to consolidated financial statements.
88
PARKWAY, INC.
CONSOLIDATED STATEMENT OF CASH FLOWS
(in thousands)
For the Period From June 29, 2016 (Date of Capitalization) to December 31, 2016 | |||
Operating activities | |||
Net loss | $ | (14,521 | ) |
Adjustments to reconcile net loss to cash provided by operating activities: | |||
Depreciation and amortization | 25,139 | ||
Amortization of above/below market leases, net | (1,285 | ) | |
Amortization of financing costs | 805 | ||
Amortization of debt premium | (555 | ) | |
Share-based compensation expense | 3,780 | ||
Deferred income tax expense | 135 | ||
Gain on sale of non-depreciable real estate | (1,097 | ) | |
Non-cash operating activities paid by Parkway Properties, Inc. | 7,790 | ||
Increase in deferred leasing costs | (1,317 | ) | |
Changes in operating assets and liabilities: | |||
Change in receivables and other assets | 977 | ||
Change in accounts payable and other accrued expenses | 18,728 | ||
Cash provided by operating activities | 38,579 | ||
Investing activities | |||
Proceeds from sale of non-depreciable real estate | 2,653 | ||
Improvements to real estate | (6,975 | ) | |
Cash used in investing activities | (4,322 | ) | |
Financing activities | |||
Principal payments on mortgage notes payable | (1,679 | ) | |
Proceeds from bank borrowings | 350,000 | ||
Distribution of cash to Cousins Properties Incorporated in connection with Spin-Off | (157,245 | ) | |
Proceeds from issuance of preferred stock | 5,000 | ||
Cash provided by financing activities | 196,076 | ||
Change in cash and cash equivalents | 230,333 | ||
Cash and cash equivalents at beginning of period | — | ||
Cash and cash equivalents at end of period | $ | 230,333 | |
See notes to consolidated financial statements.
89
PARKWAY, INC.
CONSOLIDATED STATEMENT OF CASH FLOWS (continued)
(in thousands)
For the Period From June 29, 2016 (Date of Capitalization) to December 31, 2016 | |||
Supplemental cash flow information: | |||
Cash paid for interest | $ | 5,243 | |
Cash paid for income taxes | — | ||
Supplemental schedule of non-cash investing and financing activity: | |||
Contribution of real estate, net in connection with Spin-Off | $ | 1,712,449 | |
Contribution of receivables and other assets in connection with Spin-Off | 91,165 | ||
Contribution of intangibles, net in connection with Spin-Off | 143,705 | ||
Mortgage notes payable, net assumed in connection with Spin-Off | 453,769 | ||
Contribution of accounts payable and other liabilities, accrued tenant improvements, accrued property taxes and below market leases, net in connection with Spin-Off | 195,662 | ||
Issuance of common stock in connection with Spin-Off | 49 | ||
Issuance of limited voting stock in connection with Spin-Off | 1 | ||
Financing activities paid by Parkway Properties, Inc. | 9,161 | ||
Contribution of capital by noncontrolling interests in connection with Spin-Off | 23,336 | ||
Accrued capital expenditures | 5,889 | ||
90
PARKWAY, INC.
NOTES TO CONSOLIDATED FINANCIAL STATEMENTS
December 31, 2016
Note 1—Organization
Parkway, Inc. (“the Company”) is an independent, publicly traded, self-managed real estate investment trust (“REIT”) that owns and operates high-quality office properties located in submarkets in Houston, Texas. The Company’s portfolio consists of five assets comprising 19 buildings and totaling approximately 8.7 million rentable square feet (unaudited) in the Galleria, Greenway and Westchase submarkets of Houston, providing geographic focus and significant operational scale and efficiencies.
In addition, the Company operates a fee-based real estate service (the “Third-Party Services Business”) through a wholly owned subsidiary, Eola Office Partners, LLC and its wholly owned subsidiaries (collectively, “Eola”), which in total managed approximately 3.8 million square feet (unaudited) for primarily third-party owners as of December 31, 2016. Unless otherwise indicated, all references to square feet represent net rentable square feet.
The Company’s Spin-Off from Cousins
On October 7, 2016, Cousins Properties Incorporated (“Cousins”) completed the spin-off of the Company, by distributing all of the Company’s outstanding shares of common and limited voting stock to the holders of Cousins common and limited voting preferred stock as of the record date, October 6, 2016 (the “Spin-Off”). The Spin-Off was effected pursuant to that certain Agreement and Plan of Merger (the “Merger Agreement”), dated as of April 28, 2016, by and among Parkway Properties, Inc. (“Legacy Parkway”), Parkway Properties LP (“Parkway LP”), Cousins and Clinic Sub Inc., a wholly owned subsidiary of Cousins, and pursuant to that certain Separation, Distribution and Transition Services Agreement (the “Separation and Distribution Agreement”), dated as of October 5, 2016, among the Company, Cousins and certain other parties thereto.
Prior to the Spin-Off, the Company was incorporated on June 3, 2016 as a wholly owned subsidiary of Legacy Parkway. On October 6, 2016, pursuant to the Merger Agreement, Legacy Parkway merged with and into Clinic Sub Inc., with Clinic Sub Inc. continuing as the surviving corporation and a wholly owned subsidiary of Cousins (the “Merger”). In connection with the Merger, the Company became a subsidiary of Cousins. Immediately following the effective time of the Merger, in accordance with the Merger Agreement, Cousins separated the portion of its combined businesses relating to the ownership of real properties in Houston, Texas, as well as Legacy Parkway’s fee-based real estate services (the “Third-Party Services Business” and together with the Houston real properties, the “Houston Business”), from the remainder of the combined businesses (the “Separation”). In connection with the Separation, the Company and Cousins reorganized the businesses through a series of transactions (the “UPREIT Reorganization”), pursuant to which the Houston Business was transferred to the Company, and the remainder of the combined business was transferred to Cousins Properties LP, a Delaware limited partnership (“Cousins LP”), the operating partnership of Cousins. Following the Separation and UPREIT Reorganization, Cousins effected the Spin-Off on October 7, 2016.
The Company's consolidated financial statements include operational activity for the 86 day period following the Spin-Off. Prior to the Spin-Off, the Company had not conducted any business as a separate company other than start-up related activities and had no material assets or liabilities. Expenses prior to the Spin-Off of $7.8 million associated with these start-up related activities are reflected in general and administrative expense on the Company's consolidated statement of operations. The financial statements reflect the common shares and units as if they were outstanding for the entire period presented.
91
The following represents the net contribution from the Spinoff (in thousands):
Amount | |||
Assets | |||
Office properties | $ | 1,854,257 | |
Accumulated depreciation | (141,808 | ) | |
Cash and cash equivalents | 192,755 | ||
Receivables and other assets | 91,165 | ||
Intangible assets, net of accumulated amortization of $72,909 | 143,705 | ||
Total assets | $ | 2,140,074 | |
Liabilities | |||
Notes payable to banks | $ | 350,000 | |
Mortgage notes payable, net | 453,769 | ||
Accounts payable and other liabilities | 40,965 | ||
Accrued tenant improvements | 60,654 | ||
Accrued property taxes | 40,289 | ||
Unamortized below market leases, net of accumulated amortization of $24,797 | 53,754 | ||
Total liabilities | 999,431 | ||
Net contribution from Cousins | $ | 1,140,643 | |
Note 2—Basis of Presentation and Summary of Significant Accounting Policies
Basis of Presentation and Principles of Consolidation
The Company is the sole, indirect general partner of Parkway Operating Partnership LP (the “Operating Partnership”) and as of December 31, 2016, owned a 97.9% interest in the Operating Partnership directly and through its subsidiaries Parkway Properties General Partners, Inc. and Parkway LP. The remaining 2.1% interest is indirectly held by certain persons, through Parkway LP. As the sole, indirect general partner of the Operating Partnership, the Company has full and complete authority over the Operating Partnership’s operations and management.
The accompanying financial statements have been prepared by the Company’s management (“management”) in accordance with accounting principles generally accepted in the United States (“GAAP”) and the requirements of the Securities and Exchange Commission (“SEC”). In the opinion of management, all adjustments (consisting of normal recurring adjustments) considered necessary for a fair presentation have been included.
The consolidated financial statements include the accounts of the Company and its wholly owned subsidiaries. The Company also consolidates subsidiaries where the entity is a variable interest entity (a “VIE”) and it is the primary beneficiary and has the power to direct the activities of the VIE and has the obligation to absorb losses or the right to receive benefits from the VIE that could potentially be significant to the VIE. The Operating Partnership was determined to be a VIE and the Company is considered to be the primary beneficiary. All significant intercompany transactions and accounts have been eliminated in the accompanying financial statements.
Business
The Company’s operations are exclusively in the real estate industry, principally the operation, leasing, acquisition and ownership of office buildings in Houston.
Use of Estimates
The preparation of financial statements in conformity with GAAP requires management to make estimates and assumptions that affect the reported amounts of assets and liabilities, the disclosure of contingent assets and liabilities at the date of the financial statements and the reported amounts of revenues and expenses during the reporting period. Although the Company believes the assumptions and estimates made are reasonable and appropriate, as discussed in the applicable sections throughout these consolidated financial statements, different assumptions and estimates could materially impact reported results. The current economic environment has increased the degree of uncertainty inherent in these estimates and assumptions; therefore, changes in
92
market conditions could impact the Company’s future operating results. The Company’s most significant estimates relate to purchase price assignments and impairments on real estate and other assets. Actual results could differ from these estimates and assumptions.
Real Estate Properties
Real estate properties are carried at cost less accumulated depreciation. Cost includes the carrying amount of the Company’s investment plus any additional consideration paid, liabilities assumed and improvements made subsequent to acquisition. Depreciation of buildings and building improvements is computed using the straight-line method over the estimated useful lives of the assets. Depreciation of tenant improvements, including personal property, is computed using the straight-line method over the lesser of the useful life or the term of the lease involved. Maintenance and repair expenses are charged to expense as incurred.
The Company evaluates its real estate assets for impairment upon occurrence of significant adverse changes in its operations to assess whether any impairment indicators are present that affect the recovery of the carrying amount. The carrying amount includes the net book value of tangible and intangible assets and liabilities. Real estate assets are classified as held for sale or held and used. The Company classifies certain assets as held for sale based on management having the authority and intent of entering into commitments for sale transactions to close in the next 12 months. The Company considers an office property as held for sale once it has executed a contract for sale, allowed the buyer to complete its due diligence review and received a substantial non-refundable deposit. Until a buyer has completed its due diligence review of the asset, necessary approvals have been received and substantive conditions to the buyer’s obligation to perform have been satisfied, the Company does not consider a sale to be probable. When the Company identifies an asset as held for sale, it estimates the net realizable value of such asset and discontinues recording depreciation on the asset. The Company records assets held for sale at the lower of the carrying amount or fair value less cost to sell. If the fair value of the asset net of estimated selling costs is less than the carrying amount, the Company records an impairment loss.
With respect to assets classified as held and used, the Company recognizes an impairment loss if the carrying amount is not recoverable and exceeds the sum of undiscounted future cash flows expected to result from the use and eventual disposition of the asset. Upon impairment, the Company recognizes an impairment loss to reduce the carrying value of the real estate asset to the estimate of its fair value. The cash flow and fair value estimates are based on assumptions about employing the asset for its remaining useful life. Factors considered in projecting future cash flows include, but are not limited to: existing leases, future leasing and terminations, market rental rates, capital improvements, tenant improvements, leasing commissions, inflation, discount rates, capitalization rates and other known variables, and contractual purchase and sale agreements, if any. This market information is considered a Level 2 or Level 3 input as defined by the Financial Accounting Standards Board’s (“FASB”) Accounting Standards Codification (“ASC”) 820, “Fair Value Measurements and Disclosures,” (“ASC 820”).
The Company recognizes gains or losses on sales of real estate at times and in amounts determined in accordance with the accounting guidance for sales of real estate. The guidance takes into account the terms of the transaction and any continuing involvement, including in the form of management, leasing of space or financial assistance associated with the properties. If the sales criteria for the full accrual method are not met, then the Company defers gain recognition and accounts for the transaction by applying the deposit, finance, installment or cost recovery methods, as appropriate.
Initial Recognition, Measurement and Assignment of the Cost of Real Estate Acquired
Accounting for the Spin-Off
The Merger was accounted for as a “purchase,” as that term is used under GAAP, for accounting and financial reporting purposes. Under purchase accounting, the assets (including identifiable intangible assets) and liabilities (including executory contracts and other commitments) of Legacy Parkway as of the effective time of the Merger were recorded at their respective fair values and added to the assets and liabilities of Cousins. The separation of the assets and liabilities related to the Houston Business from the remainder of Cousins’ businesses in the Separation and the UPREIT Reorganization were at Cousins’ carryover basis after adjusting the Legacy Parkway assets and liabilities to fair value. As a result, the financial statements initially reflected carryover basis for Cousins Houston properties and fair value basis for the Legacy Parkway assets.
93
Operating Property Acquisitions
The Company assigns the purchase price of real estate to tangible and intangible assets and liabilities based on fair value. Tangible assets consist of land, building, garage, building improvements and tenant improvements. Intangible assets and liabilities consist of the value of above and below market leases, lease costs, the value of in-place leases and any value attributable to above or below market debt assumed with the acquisition.
The Company engages independent third-party appraisers to perform the valuations used to determine the fair value of these identifiable tangible and intangible assets. These valuations and appraisals use commonly employed valuation techniques, such as discounted cash flow analyses. Factors considered in these analyses include an estimate of costs during hypothetical expected lease-up periods considering current market conditions and costs to execute similar leases. The Company also considers information obtained about each property as a result of its pre-acquisition due diligence, marketing and leasing activities in estimating the fair value of the tangible and intangible assets acquired. The Company includes real estate taxes, insurance and other operating expenses and estimates of lost rentals at market rates during the expected lease-up periods depending on specific local market conditions and the type of property acquired. Additionally, the Company estimates costs to execute similar leases including leasing commissions, legal and other related expenses.
The fair value of above or below market in-place lease values is the present value of the difference between the contractual amount to be paid pursuant to the in-place lease and the estimated current market lease rate expected over the remaining non-cancelable life of the lease. The capitalized above market lease values are amortized as a reduction of rental income over the remaining term of the respective leases. The portion of the values of the leases associated with below-market renewal options that are likely to be exercised are amortized to rental income over the respective renewal. The capitalized below market lease values are amortized as an increase to rental income over the remaining term of the respective leases. As of December 31, 2016, the weighted average amortization periods for above market leases and below market leases were 7.1 years and 8.1 years, respectively. Total amortization for above and below market leases was a net increase of rental income of $1.3 million for the period from June 29, 2016 (date of capitalization) to December 31, 2016.
As of December 31, 2016, the remaining amortization of above/below market leases, net is projected as a net increase to rental income as follows (in thousands):
Amount | |||
2017 | $ | 5,308 | |
2018 | 4,496 | ||
2019 | 4,368 | ||
2020 | 2,806 | ||
2021 | 2,799 | ||
Thereafter | 15,605 | ||
Total | $ | 35,382 | |
The fair value of in-place leases is the present value associated with re-leasing the in-place lease as if the property was vacant. Factors to be considered include estimates of costs during hypothetical expected lease-up periods considering current market conditions and costs to execute similar leases. In estimating costs, the Company includes estimates of lost rentals at market rates during the expected lease-up periods. The value of at market in-place leases is amortized as a lease cost amortization expense over the expected life of the lease. As of December 31, 2016, the weighted average amortization period for in-place leases was 6.1 years. Total amortization expense for the value of in-place leases was $6.7 million period from June 29, 2016 (date of capitalization) to December 31, 2016.
94
As of December 31, 2016, the remaining amortization expense for the value of in-place leases is projected as follows (in thousands):
Amount | |||
2017 | $ | 24,365 | |
2018 | 18,136 | ||
2019 | 15,247 | ||
2020 | 11,832 | ||
2021 | 10,227 | ||
Thereafter | 37,436 | ||
Total | $ | 117,243 | |
A separate component of the fair value of in-place leases is identified for the lease costs. The fair value of lease costs represents the estimated commissions and legal fees paid in connection with the current leases in place. Lease costs are amortized over the non-cancelable terms of the respective leases as amortization expense.
In no event does the amortization period for intangible assets exceed the remaining depreciable life of the building. Should a customer terminate its lease, the unamortized portion of the tenant improvement, in-place lease value and lease cost intangibles would be charged to expense. Additionally, the unamortized portion of above market in-place leases would be recorded as a reduction to rental income and the below market in-place lease value would be recorded as an increase to rental income.
The Company calculates the fair value of mortgage notes payable by discounting the remaining contractual cash flows on each instrument at the current market rate for these borrowings.
Capitalization of Costs
Costs related to planning, developing, leasing and constructing a property, including costs of development personnel working directly on projects under development, are capitalized. The Company also capitalizes certain costs of leasing personnel in connection with the completion of leasing arrangements.
Cash Equivalents
The Company considers all highly liquid investments with a maturity of three months or less to be cash equivalents.
Allowance for Doubtful Accounts
Accounts receivable are reduced by an allowance for amounts that the Company estimates to be uncollectible. The receivable balance is comprised primarily of rent and expense reimbursement income due from the customers. Management evaluates the adequacy of the allowance for doubtful accounts considering such factors as the credit quality of the customers, delinquency of payment, historical trends and current economic conditions. The Company provides an allowance for doubtful accounts for customer balances that are over 90 days past due and for specific customer receivables for which collection is considered doubtful.
The components of allowance for doubtful accounts for the period from June 29, 2016 (date of capitalization) to December 31, 2016 is as follows (in thousands):
Beginning balance: | $ | — | |
Contribution from Spin-Off | 567 | ||
Bad debt expense | 9 | ||
Write-offs | (140 | ) | |
Ending balance: | $ | 436 | |
95
Amortization of Debt Origination Costs and Leasing Costs
Debt origination costs are deferred and amortized using a method that approximates the effective interest method over the term of the loan. These costs are classified within the consolidated balance sheet as a direct deduction from the carrying amount of debt within total liabilities. Leasing costs are deferred and amortized using the straight-line method over the term of the respective lease.
Fair Value Measurements
Level 1 fair value inputs are quoted prices for identical assets or liabilities in active, liquid and visible markets such as stock exchanges. Level 2 fair value inputs are observable information for similar assets or liabilities in active or inactive markets, and appropriately consider counterparty creditworthiness in the valuations. Level 3 fair value inputs reflect the Company’s best estimate of inputs and assumptions market participants would use in pricing an asset or liability at the measurement date. These inputs are unobservable in the market and significant to the valuation estimate.
Noncontrolling Interest
A noncontrolling interest in a subsidiary is an ownership interest in the consolidated entity that should be reported as equity in the consolidated financial statements and separate from the parent company’s equity. In addition, consolidated net income is required to be reported as amounts that include the amounts attributable to both the parent and the noncontrolling interest and the amount of consolidated net income attributable to the parent and the noncontrolling interest are required to be disclosed on the face of the consolidated statement of operations. Income is allocated to noncontrolling interests based on the weighted average percentage ownership during the period.
Noncontrolling interests in the Operating Partnership represent common Operating Partnership units that are not owned by the Company. Certain holders of Operating Partnership units have registration rights with respect to shares of common stock issuable upon conversion of such units, or have shares of common stock available for issuance under effective registration statements. Limited partners have the right under the partnership agreement of the Operating Partnership to tender their units for redemption in exchange for cash or unregistered shares of the Company’s common stock, as selected by the Company in its sole and absolute discretion. Accordingly, the Company classifies the common Operating Partnership units held by limited partners in permanent equity because the Company may elect to issue shares of its common stock to limited partners exercising their redemption rights rather than using cash.
Revenue Recognition
Revenue from real estate rentals is recognized on a straight-line basis over the noncancelable lease term at the inception of each respective lease in accordance with FASB ASC 840, Leases. The cumulative difference between lease revenue recognized under this method and contractual lease payment terms is recorded as straight-line rent receivable on the accompanying balance sheets. The straight-line rent adjustment increased revenue by $3.8 million for the period from June 29, 2016 (date of capitalization) to December 31, 2016.
When the Company is the owner of the tenant improvements, the leased space is ready for its intended use when the tenant improvements are substantially completed, at which point revenue recognition begins. In limited instances, when the tenant is the owner of the customer improvements, straight-line rent is recognized when the tenant takes possession of the unimproved space.
The leases also typically provide for tenant reimbursement of a portion of common area maintenance, real estate taxes and other operating expenses. Property operating cost recoveries from customers (“expense reimbursements”) are recognized as revenue in the period in which the expenses are incurred. The computation of expense reimbursements is dependent on the provisions of individual customer leases. Most customers make monthly fixed payments of estimated expense reimbursements. The Company makes adjustments, positive or negative, to expense reimbursement income quarterly to adjust the recorded amounts to the Company’s best estimate of the final property operating costs based on the most recent annual estimate. After the end of the calendar year, the Company computes each customer’s final expense reimbursements and issues a bill or credit for the difference between the actual amount and the amounts billed monthly during the year. Differences between actual billed amounts and accrued amounts are considered immaterial.
96
Management company income represents market-based fees earned from providing management, construction, leasing, brokerage and acquisition services to third parties and related parties. Management fee income is computed and recorded monthly in accordance with the terms set forth in the management service agreements. Leasing and brokerage commissions, as well as salary and administrative fees, are recognized pursuant to the terms of the agreements at the time underlying leases are signed, which is the point at which the earnings process is complete and collection of fees is reasonably assured. Fees relating to the purchase or sale of property are recognized when the earnings process is complete and collection of fees is reasonably assured, which usually occurs at closing. All fees on Company-owned properties are eliminated in consolidation.
Share-Based and Long-Term Compensation
Compensation expense for service-based awards is recognized over the expected vesting period of such awards. The total compensation expense for the long-term equity incentive awards is based upon the fair value of the shares on the grant date. Time-vesting restricted shares are valued based on the New York Stock Exchange closing market price of the Company’s common shares as of the date of grant. The grant date fair value for performance-vesting restricted stock units (“RSUs”) is determined using a simulation pricing model developed to specifically accommodate the unique features of the awards. The total compensation expense for stock options is estimated based on the fair value of the options as of the date of grant using the Black-Scholes model. Use of peer company data was used for assumptions in the Black-Scholes model due to the lack of history for the Company. Forfeitures will be recognized in the period as they occur.
Net Income (Loss) Per Common Share
Basic earnings per share (“EPS”) is computed by dividing income (loss) attributable to common stockholders by the weighted-average number of common shares outstanding for the period. In arriving at net income (loss) attributable to common stockholders, preferred stock dividends are deducted. Diluted EPS reflects the potential dilution that could occur if share equivalents such as Operating Partnership units, employee stock options, and time-vesting and performance-vesting RSUs were exercised or converted into common stock that then shared in the earnings of the Company.
Income Taxes
The Company intends to elect and qualify to be taxed as a REIT for U.S. federal income tax purposes, beginning with its short taxable year that commenced on the day prior to Spin-Off and ended on December 31, 2016. To qualify as a REIT, the Company must meet a number of organizational and operational requirements, including a requirement that it distribute annually at least 90% of its “REIT taxable income,” determined without regard to the dividends paid deduction and excluding any net capital gain to its stockholders. It is management’s current intention to adhere to these requirements and the Company believes that it was in compliance with all REIT requirements for the Company's taxable year ended December 31, 2016. As a REIT, the Company generally will not be subject to corporate level U.S. federal income tax on its “REIT taxable income,” determined without regard to the dividends paid deduction and excluding any net capital gain, that it distributes currently to its stockholders, provided that the REIT meets the applicable REIT distribution requirements and other requirements for qualification as a REIT under the Code. Even if the Company qualifies for taxation as a REIT, the Company may be subject to certain state and local taxes, and to federal income and excise taxes on its undistributed taxable income. In addition, taxable income from non-REIT activities managed through the Company's taxable TRS is subject to federal, state and local income taxes. The Company provides for income taxes based on pretax income and applicable tax rates in the various jurisdictions in which it operates. The Company's effective tax rate reflects the impact of earnings attributable to REIT operations and noncontrolling interests for which no federal income taxes have been provided.
Through October 6, 2016, the Company was a qualified REIT subsidiary of Cousins generally not subject to federal income taxes as all of the Company's taxable income and deductions were treated as if realized by Cousins directly.
The Company recognizes the tax benefit from uncertain tax positions only if it is more likely than not that the tax position will be sustained upon examination, based on the technical merits of the position with the taxing authority having full knowledge of all relevant information. The tax benefit recognized in the financial statements for a particular tax position is based on the largest amount of benefit that is greater than 50 percent likely of being realized upon ultimate settlement. The Company's policy is to recognize interest and penalties related to income taxes, including accrued interest and penalties, if any, associated with unrecognized tax benefits, as components of income tax expense.
97
Segment Reporting
FASB ASC 280, “Segment Reporting,” established standards for disclosure about operating segments and related disclosures about products and services, geographic areas and major customers. The Company currently operates in one business segment, the acquisition, development, ownership and management of commercial real estate. Additionally, the Company operates in one geographic area, Houston, Texas. Our chief operating decision maker reviews operating and financial data on a consolidated basis.
Allocated Costs
The historical financial results include certain allocated corporate costs which the Company believes are reasonable. These costs incurred by Legacy Parkway are reflected as an equity contribution and are estimated to be applicable to the Company based on an analysis of key metrics such as leasable square feet, personnel hours or expenses that were otherwise specifically identifiable.
Recent Accounting Pronouncements
In May 2014, the FASB issued Accounting Standards Update (“ASU”) 2014-09, “Revenue from Contract with Customers (Topic 606)” (“ASU 2014-09”). The objective of ASU 2014-09 is to establish a single comprehensive model for entities to use in accounting for revenue arising from contracts with customers and will supersede most of the existing revenue recognition guidance, including industry-specific guidance. The core principle is that an entity should recognize revenue to depict the transfer of promised goods or services to customers in an amount that reflects the consideration to which the entity expects to be entitled in exchange for those goods or services. The Company's revenues that will be impacted by this standard include revenues earned from fee-based real estate services, sales of real estate assets including land parcels and operating properties and other ancillary income. The Company expects that the amount and timing of revenue recognition from our fee-based real estate services referenced above will be generally consistent with our current measurement and pattern of recognition. The Company currently anticipates utilizing the modified retrospective method of adoption on January 1, 2018 and continues to evaluate the adoption impacts of this standard.
In February 2016, the FASB issued ASU No. 2016-02, “Leases (Topic 842)” (“ASU 2016-02”). ASU 2016-02 increases transparency and comparability among organizations by recognizing lease assets and lease liabilities of lessees on the balance sheet and disclosing key information about leasing arrangements. Lessor accounting will remain substantially similar to the current accounting; however, certain refinements were made to conform the standard with the recently issued revenue recognition guidance in ASU 2014-09, specifically related to the allocation and recognition of contract consideration earned from lease and non-lease revenue components. Additionally, certain leasing costs that are eligible to be capitalized as initial direct costs are also limited by ASU 2016-02. The Company expects to adopt this guidance effective January 1, 2019 and will utilize the modified retrospective method of adoption. Substantially all of the Company's revenues are earned from arrangements that are within the scope of ASU 2016-02, thus we anticipate that the timing of recognition and financial statement presentation of certain revenues, including revenues that related to consideration from non-lease components, may be affected. The Company is still assessing the impact of adopting this guidance.
In January 2017, the FASB issued ASU No. 2017-01, “Business Combinations (Topic 805)” (“ASU 2017-01”). ASU 2017-01 clarifies the definition of a business with the objective of adding guidance to assist entities with evaluating whether transactions should be accounted for as acquisitions (or disposals) of assets or businesses. The guidance is effective for periods beginning after December 15, 2017, including interim periods within those periods. The Company will early adopt this standard prospectively as of January 1, 2017 as permitted under the standard.
In February 2017, the FASB issued ASU No. 2017-05, “Other Income—Gains and Losses from the Derecognition of Nonfinancial Assets (Subtopic 610-20)” (“ASU 2017-05”). ASU 2017-05 clarifies the scope of asset derecognition guidance and accounting for partial sales of nonfinancial assets. Partial sales of nonfinancial assets are common in the real estate industry and include transactions in which the seller retains an equity interest in the entity that owns the assets or has an equity interest in the buyer. The guidance is effective for annual reporting periods beginning after December 15, 2017, including interim reporting periods within that reporting period. The Company is currently assessing this guidance for future implementation.
Note 3—Real Estate Related Investments, Net
Included in real estate related investments, net are five office assets located in the Galleria, Greenway and Westchase submarkets of Houston, Texas, comprising 19 buildings and two adjacent parcels of land totaling approximately 8.7 million square feet (unaudited).
98
Balances of major classes of depreciable assets and their respective estimated useful lives are (in thousands):
Asset Category | Useful Life | December 31, 2016 | ||||
Land | Non-depreciable | $ | 417,315 | |||
Buildings and garages | 7 to 40 years | 1,095,815 | ||||
Building improvements | 5 to 40 years | 55,093 | ||||
Tenant improvements | Lesser of useful life or term of lease | 296,445 | ||||
$ | 1,864,668 | |||||
Depreciation expense related to these assets utilizing the straight-line method over the estimated original useful life was $17.0 million for the period from June 29, 2016 (date of capitalization) to December 31, 2016.
The Company is geographically concentrated in Houston, Texas. For the period from June 29, 2016 (date of capitalization) to December 31, 2016, four tenants in the Company's portfolio represented 11.4%, 8.6%, 6.8% and 5.0% of income from office properties, respectively.
Note 4—Receivables and Other Assets
The following represents the composition of Receivables and Other Assets as of December 31, 2016 (in thousands):
December 31, 2016 | |||
Rents and fees receivable | $ | 3,289 | |
Allowance for doubtful accounts | (436 | ) | |
Straight-line rent receivable | 32,000 | ||
Other receivables | 4,761 | ||
Unamortized lease costs, net of accumulated amortization of $8,581 | 44,799 | ||
Prepaid assets | 1,620 | ||
Deferred tax asset, non-current | 3,648 | ||
Other assets | 2,576 | ||
$ | 92,257 | ||
Note 5—Other Intangible Assets, Net
The following table reflects the portion of the purchase price of office properties assigned to other intangible assets, net as discussed in “Note 2—Basis of Presentation and Summary of Significant Accounting Policies” (in thousands):
December 31, 2016 | |||
Above market lease value | $ | 20,555 | |
Accumulated amortization | (4,125 | ) | |
Management contracts | 2,099 | ||
Accumulated amortization | (78 | ) | |
$ | 18,451 | ||
99
Note 6—Capital and Financing Transactions
Notes Payable to Banks, Net
A summary of notes payable to banks, net at December 31, 2016 is as follows (dollars in thousands):
Interest Rate | Initial Maturity | Outstanding Balance | ||||||
$100.0 Million Revolving Credit Facility | 3.8% | 10/06/2019 | $ | — | ||||
$350.0 Million Three-Year Term Loan | 3.7% | 10/06/2019 | 350,000 | |||||
Notes payable to banks outstanding | 350,000 | |||||||
Unamortized debt issuance costs, net | (8,398 | ) | ||||||
Total notes payable to banks, net | $ | 341,602 | ||||||
Credit Facility
In connection with the Separation and the UPREIT Reorganization, on October 6, 2016, the Company and the Operating Partnership, as borrower, entered into a credit agreement providing for (i) the three-year, $100 million senior secured revolving credit facility (the “Revolving Credit Facility”), and (ii) the three-year, $350 million senior secured term loan facility (the “Term Loan” and, together with the Revolving Credit Facility, the “Credit Facility”), with Bank of America, N.A., as Administrative Agent and the lenders party thereto (collectively, the “Lenders”). The Credit Facility has an initial maturity date of October 6, 2019, but is subject to a one-year extension option at the election of the Operating Partnership. The exercise of the extension option requires the payment of an extension fee and the satisfaction of certain other customary conditions. The credit agreement also permits the Operating Partnership to utilize up to $15 million of the Revolving Credit Facility for the issuance of letters of credit. Interest on the Credit Facility will accrue at a rate based on LIBOR or a base rate plus an applicable margin. The Credit Facility will be prepayable at the election of the borrower (upon not less than three business days’ written notice to the administrative agent) without premium or penalty (other than customary breakage fees), and will not require any scheduled repayments of principal prior to the maturity date. The Credit Facility is guaranteed pursuant to a Guaranty Agreement entered into on October 6, 2016, by the Company, all wholly owned material subsidiaries of the Operating Partnership that are not otherwise prohibited from guarantying the Credit Facility, Parkway Properties General Partners, Inc. and Parkway LP.
As of December 31, 2016, no amounts have been drawn on the Revolving Credit Facility, and the Term Loan was fully funded on October 6, 2016 in connection with the Separation and the UPREIT Reorganization, whereby the Company contributed approximately $167 million of the proceeds of the Term Loan, directly or indirectly, to Cousins LP, which used such funds to repay certain indebtedness of Cousins and its subsidiaries, including Legacy Parkway’s previously-existing credit facilities. The Operating Partnership has retained the remaining proceeds of the Term Loan as working capital that will be used for the general corporate purposes of the Operating Partnership.
Mortgage Notes Payable, Net
A summary of mortgage notes payable, net at December 31, 2016 is as follows (dollars in thousands):
Office Properties | Fixed Rate | Maturity Date | December 31, 2016 | ||||
San Felipe Plaza | 4.8% | 12/01/2018 | $ | 106,085 | |||
CityWestPlace III and IV | 5.0% | 03/05/2020 | 88,700 | ||||
Post Oak Central | 4.3% | 10/01/2020 | 178,285 | ||||
Phoenix Tower | 3.9% | 03/01/2023 | 76,561 | ||||
Unamortized premium, net | 2,600 | ||||||
Unamortized debt issuance costs, net | (654 | ) | |||||
Total mortgage notes payable, net | $ | 451,577 | |||||
100
The aggregate annual maturities and weighted average interest rates of mortgage notes payable, net at December 31, 2016 are as follows (dollars in thousands):
Weighted Average Interest Rate | Total Mortgage Maturities | Balloon Payments | Principal Amortization | ||||||||||
2017 | 4.4% | $ | 9,306 | $ | — | $ | 9,306 | ||||||
2018 | 4.8% | 111,960 | 102,402 | 9,558 | |||||||||
2019 | 4.3% | 8,097 | — | 8,097 | |||||||||
2020 | 4.5% | 252,499 | 246,765 | 5,734 | |||||||||
2021 | 3.9% | 2,418 | — | 2,418 | |||||||||
Thereafter | 3.9% | 65,351 | 62,193 | 3,158 | |||||||||
Total principal maturities | 449,631 | $ | 411,360 | $ | 38,271 | ||||||||
Unamortized premium, net | 2,600 | ||||||||||||
Unamortized debt issuance costs, net | (654 | ) | |||||||||||
Total mortgage notes payable, net | 4.5% | $ | 451,577 | ||||||||||
Note 7—Fair Values of Financial Instruments
FASB ASC 820 defines fair value as the price that would be received to sell an asset or paid to transfer a liability in an orderly transaction between market participants at the measurement date. ASC 820 also provides guidance for using fair value to measure financial assets and liabilities. The Codification requires disclosure of the level within the fair value hierarchy in which the fair value measurements fall, including measurements using quoted prices in active markets for identical assets or liabilities (Level 1), quoted prices for similar instruments in active markets or quoted prices for identical or similar instruments in markets that are not active (Level 2), and significant valuation assumptions that are not readily observable in the market (Level 3).
Fair values of financial instruments were as follows (in thousands):
December 31, 2016 | ||||||||
Carrying Amount | Fair Value | |||||||
Financial Assets: | ||||||||
Cash and cash equivalents | $ | 230,333 | $ | 230,333 | ||||
Financial Liabilities: | ||||||||
Notes payable to banks (1) | $ | 350,000 | $ | 349,372 | ||||
Mortgage notes payable (1) | 449,631 | 452,753 | ||||||
(1) The carrying amounts of notes payable to banks and mortgage notes payable represent par values.
The methods and assumptions used to estimate fair value for each class of financial asset or liability are discussed below:
Cash and cash equivalents: The carrying amount for cash and cash equivalents approximates fair value.
Notes payable to banks: The fair value of the Company’s notes payable to banks is estimated by discounting expected cash flows at current market rates. This information is considered a Level 2 input as defined by ASC 820.
Mortgage notes payable: The fair value of mortgage notes payable is estimated by discounting expected cash flows at current market rates. This information is considered a Level 2 input as defined by ASC 820.
Non-financial assets and liabilities recorded at fair value on a non-recurring basis include the following: (1) non-financial assets and liabilities measured at fair value in a business combination and (2) impairment or disposal of long-lived assets measured at fair value. The fair values assigned to the Company’s purchase price assignments utilize Level 2 and Level 3 inputs as defined by ASC 820. The fair value assigned to the long-lived assets for which there could be impairment recorded utilize Level 2 inputs as defined by ASC 820.
101
Note 8—Accounts Payable and Other Liabilities
The following represents the composition of Accounts Payable and Other Liabilities as of December 31, 2016 (in thousands):
December 31, 2016 | |||
Office property payables: | |||
Prepaid rents | $ | 8,546 | |
Security deposits | 3,490 | ||
Accrued lease commissions | 4,584 | ||
Accrued lease incentives | 4,275 | ||
Accrued building improvements | 3,713 | ||
Accrued recoveries | 3,837 | ||
Other accrued expenses and accounts payable | 4,396 | ||
Corporate payables | 7,528 | ||
Deferred tax liability, non-current | 4,336 | ||
Interest payable | 2,514 | ||
$ | 47,219 | ||
Note 9—Commitments and Contingencies
The Company and its subsidiaries are, from time to time, parties to litigation arising from the ordinary course of business. The Company does not believe that any such litigation will materially affect its financial position or operations.
The Company has a 1% limited partnership interest in 2121 Market Street Associates, LP (“2121 Market Street”). A mortgage loan secured by a first trust deed on 2121 Market Street is guaranteed by the Company up to a maximum amount of $14.0 million expiring in December 2022.
Obligations for tenant improvements, lease commissions and lease incentives recorded on the consolidated balance sheet at December 31, 2016 are as follows (in thousands):
Amount | |||
2017 | $ | 44,424 | |
2018 | 8,426 | ||
2019 | 10,668 | ||
2020 | 11,445 | ||
2021 | — | ||
Thereafter | — | ||
Total | $ | 74,963 | |
Note 10—Stockholders’ Equity
The Company’s authorized stock consists of 200,000,000 shares of common stock, par value $0.001 per share, 1,000,000 shares of limited voting stock, par value $0.001 per share, 48,999,950 shares of preferred stock, par value $0.001 per share, and 50 shares of non-voting preferred stock, par value $0.001 per share.
Common Stock
As of the date of the Spin-Off, October 7, 2016, and December 31, 2016, there were 49,110,645 shares of common stock issued and outstanding. All of the shares of the Company’s common stock are duly authorized, fully paid and nonassessable. Subject to the preferential rights of any other class or series of the Company’s stock and the provisions of the Company’s Articles of Amendment and Restatement (the “Charter”) that restrict transfer and ownership of stock, the holders of shares of the Company’s common stock generally are entitled to receive dividends on such stock out of funds available for distribution to the stockholders when, as and if authorized by the Board of Directors of the Company (the “Board”) and declared by the Company.
102
Holders of shares of the Company’s common stock generally have no preference, conversion, exchange, sinking fund, redemption or appraisal rights. Other than TPG VI Pantera Holdings, L.P.’s (“TPG Pantera”) rights pursuant to that certain Stockholders Agreement, dated as of October 7, 2016, by and among the Company, TPG Pantera and TPG VI Management, LLC (“TPG Management,” and together with TPG Pantera, the “TPG Parties”), holders of shares of the Company’s common stock have no preemptive rights to subscribe for any of the Company’s securities.
Limited Voting Stock
As of the date of the Spin-Off, October 7, 2016, and December 31, 2016, there were 858,417 shares of limited voting stock issued and outstanding. All of the outstanding shares of the Company’s limited voting stock are duly authorized, fully paid and nonassessable. Each share of the Company’s limited voting stock is “paired” with an Operating Partnership unit (“OP unit”) of Parkway LP.
Holders of shares of the Company’s limited voting stock are entitled to vote only on certain matters including, the election of directors. Holders of the Company’s limited voting stock vote on such matters together with holders of the Company’s common stock as a single class, except as otherwise required by the Maryland General Corporation Law. Holders of shares of the Company’s limited voting stock are not entitled to any dividends or distributions, including in the event of any liquidation or dissolution.
Preferred Stock
As of date of the Spin-Off, October 7, 2016, and December 31, 2016, there were no shares of preferred stock issued and outstanding. Pursuant to the Company’s Charter, the Company’s Board may from time to time establish and cause the Company to issue one or more classes or series of preferred stock and set the terms, preferences, conversion or other rights, voting powers or rights, restrictions, limitations as to dividends or distributions, qualifications or terms or conditions of redemption of such classes or series.
Non-Voting Preferred Stock
As of the date of the Spin-Off, October 7, 2016, and December 31, 2016, there were 50 shares of non-voting preferred stock issued and outstanding, all owned by Cousins LP. All of the shares of non-voting preferred stock are duly authorized, fully paid and nonassessable.
The Company’s non-voting preferred stock ranks senior to the Company’s common stock with respect to the payment of dividends and distribution of assets upon liquidation, dissolution or winding up of our affairs. Subject to any preferential rights of any other class or series of stock that may rank senior to the non-voting preferred stock in the future, holders of non-voting preferred stock, are entitled to receive, when, as and if authorized by our Board and declared by the Company, a cumulative preferential dividend payable quarterly at the rate of 8.00% per annum per share of their $100,000 liquidation preference (equivalent to a fixed annual amount of $8,000 per share), which dividend shall accrue, accumulate and be payable in accordance with the Company’s Charter.
The non-voting preferred stock does not have any voting rights, except that without approval of two-thirds of the non-voting preferred stock, the Company may not create, authorize, increase or decrease the number of stock senior to the non-voting preferred stock or amend the Company’s Charter or Bylaws to change rights or preferences of the non-voting preferred stock materially and adversely.
Note 11—Share-Based and Long-Term Compensation Plans
In September 2016, the Company adopted the Parkway, Inc. and Parkway Operating Partnership LP 2016 Omnibus Equity Incentive Plan (the “2016 Plan”), pursuant to which the following types of awards may be granted to the Company’s employees, directors and consultants: (i) options, including nonstatutory stock options and incentive stock options; (ii) stock appreciation rights; (iii) restricted shares; (iv) restricted stock units; (v) profits interest units (LTIP units); (vi) dividend equivalents; (vii) other forms of awards payable in or denominated by reference to shares of common stock; or (viii) cash. The 2016 Plan permits the grant of awards with respect to 6,002,596 shares of the Company’s common stock, which is equal to the sum of (i) 5,000,000 shares, plus (ii) any shares of the Company’s common stock issuable pursuant to awards resulting from awards originally granted under the Parkway Properties, Inc. and Parkway Properties LP 2015 Omnibus Equity Incentive Plan (as successor to the Parkway Properties, Inc. and Parkway Properties LP 2013 Omnibus Equity Incentive Plan) that were outstanding immediately prior to the Spin-Off, replaced with awards with respect to shares of Cousins’ common stock pursuant to the Merger Agreement and further replaced with awards with respect to shares of the Company’s common stock pursuant to and as described in that certain Employee
103
Matters Agreement, dated October 5, 2016, by and among the Company, the Operating Partnership, Cousins and certain other parties, which was entered into in connection with the Spin-Off.
Through December 31, 2016, the Company had stock options and RSUs outstanding under the 2016 Plan, each as described below.
Long-Term Equity Incentives
At December 31, 2016, a total of 773,617 shares underlying stock options with an aggregate fair value of $1.2 million had been granted to officers of the Company and former officers of Legacy Parkway and remain outstanding and exercisable under the 2016 Equity Plan, of which 33,011 options were unvested until they vested fully on March 2, 2017. The options have exercise prices that range from $21.91 to $22.00. The unvested stock options are valued at $52,000, which equates to an average price per option of $1.57. The options expire on March 2, 2023.
The following table presents the weighted-average assumptions used to estimate the fair values of the options granted in the periods presented, using the Black-Scholes model:
For the Period From June 29, 2016 (Date of Capitalization) to December 31, 2016 | |
Risk-free interest rate | 1.06% |
Expected volatility | 20% |
Expected life (in years) | 3.2 |
Dividend yield | 4.1% |
Weighted-average estimated fair value of options granted during the year | $1.57 |
At December 31, 2016, a total of 270,815 time-vesting RSUs had been granted to officers of the Company and remain outstanding under the 2016 Equity Plan. The time-vesting RSUs are valued at $5.6 million, which equates to an average price per share of $20.85. A total of 114,490 time-vesting RSU awards will vest on January 1, 2017, 22,467 time-vesting RSU awards will vest in increments of 25% per year on each of the first, second, third and fourth anniversaries of the grant date and 133,858 time-vesting RSU awards will vest in increments of 33% per year on each of the first, second and third anniversaries of the grant date, subject to the grantee’s continued service.
At December 31, 2016, a total of 159,899 performance-vesting RSUs had been granted to officers of the Company and remain outstanding under the 2016 Equity Plan. The performance-vesting RSUs are valued at approximately $1.9 million, which equates to an average price per share of $11.82. Grant date fair values of the performance-vesting RSUs units are estimated using a Monte Carlo simulation model and the resulting expense is recorded regardless of whether the total stockholder return (“TSR”) performance measures are achieved if the required service is delivered. Each performance-vesting RSU will vest based on the attainment of TSR targets during the applicable performance period, subject to the grantee’s continued service.
Total compensation expense related to stock options and RSUs of $3.8 million was recognized in general and administrative expenses on the Company’s consolidated statement of operations during the period from June 29, 2016 (date of capitalization) to December 31, 2016. Total compensation expense related to non-vested awards not yet recognized was $5.0 million at December 31, 2016. The weighted average period over which this expense is expected to be recognized is approximately two years.
Options | Time-Vesting RSUs | Performance-Vesting RSUs | |||||||||||||||
# of Options | Weighted Average Grant-Date Fair Value | # of Stock Units | Weighted Average Grant-Date Fair Value | # of Stock Units | Weighted Average Grant-Date Fair Value | ||||||||||||
Balance at 6/29/2016 | — | $ | — | — | $ | — | — | $ | — | ||||||||
Granted | 773,617 | 1.57 | 270,815 | 20.85 | 159,899 | 11.82 | |||||||||||
Vested | (740,606 | ) | 1.57 | — | — | — | — | ||||||||||
Balance at 12/31/2016 | 33,011 | $ | 1.57 | 270,815 | $ | 20.85 | 159,899 | $ | 11.82 | ||||||||
104
Defined Contribution Plan
The Company maintains a 401(k) plan for its employees. The Company makes matching contributions of 50% of the employee’s contribution (limited to 10% of compensation as defined by the plan) and may also make annual discretionary contributions. The Company’s total expense for this plan was approximately $31,000 for the period from June 29, 2016 to December 31, 2016.
Note 12—Future Minimum Rents
The Company leases properties to tenants under operating leases with various expiration dates extending to 2032. Minimum future rentals on non-cancelable leases at December 31, 2016 (excluding operating expense reimbursements) are as follows (in thousands):
Amount | |||
2017 | $ | 171,757 | |
2018 | 142,426 | ||
2019 | 143,306 | ||
2020 | 123,600 | ||
2021 | 117,788 | ||
Thereafter | 547,895 | ||
Total | $ | 1,246,772 | |
Note 13—Net Loss Per Common Share
As described in “Note 1—Organization,” the financial statements reflect the common shares and units as if they were outstanding for the entire period presented. The computation of basic and diluted EPS is as follows (in thousands, except per share data):
For the Period From June 29, 2016 (Date of Capitalization) to December 31, 2016 | |||
Numerator: | |||
Basic and diluted net loss attributable to common stockholders | $ | (14,316 | ) |
Denominator: | |||
Basic and diluted weighted average shares outstanding | 49,111 | ||
Basic net loss per common share attributable to common stockholders | $ | (0.29 | ) |
Diluted net loss per common share attributable to common stockholders | $ | (0.29 | ) |
The computation of diluted EPS for the period from June 29, 2016 to December 31, 2016 does not include the effect of net loss attributable to noncontrolling interest - unitholders in the numerator and Operating Partnership units and time-vesting RSUs in the denominator as their inclusion would have been anti-dilutive. Terms and conditions of these awards are described in “Note 11—Share-Based and Long-Term Compensation Plans.”
Note 14—Income Taxes
The Company intends to qualify and elect to be taxed as a REIT for U.S. federal income tax purposes commencing with its taxable year ended December 31, 2016. As a REIT, the Company generally will not be subject to corporate level U.S. federal income tax on taxable income it distributes currently to its stockholders.
The Company has elected to treat certain consolidated subsidiaries as Taxable REIT Subsidiaries (“TRSs”), which are tax paying entities for income tax purposes and are taxed separately from the Company. TRSs may participate in non-real estate related activities and/or perform non-customary services for customers and are subject to U.S. federal and state income tax at regular corporate tax rates. The income tax benefit (expense) and related income tax assets and liabilities are based on actual and expected future income.
105
As of December 31, 2016, the Company recorded net deferred tax liabilities of $688,000. Deferred income taxes are provided for income and deductions that are recognized in different years for financial statement and income tax reporting purposes.
The significant components of the net deferred tax assets (liabilities) as of December 31, 2016 are as follows (in thousands):
December 31, 2016 | |||
Deferred tax assets | |||
Capitalizable transaction costs | $ | 591 | |
Contingent consideration | 1,059 | ||
Depreciation | 191 | ||
Loss carryforward | 1,057 | ||
Management contracts | 1,792 | ||
Other | 2 | ||
Deferred tax assets | 4,692 | ||
Deferred tax asset valuation allowance | (1,044 | ) | |
Total deferred tax assets | 3,648 | ||
Deferred tax liabilities | |||
Deferred revenue | (3,615 | ) | |
Management contracts | (718 | ) | |
Other | (3 | ) | |
Total deferred tax liabilities | (4,336 | ) | |
Total deferred tax liabilities, net | $ | (688 | ) |
As of December 31, 2016, the Company had a U.S. federal capital loss carryforward totaling $1.1 million which will expire in 2020. Utilization of this loss is subject to annual limitations. The Company considered all available evidence, including future reversal of existing taxable temporary differences, carryback potential, tax-planning strategies and its ability to generate sufficient taxable income in future years and determined that valuation allowance of $1.0 million was required as of October 6, 2016 (closing date of the Merger) for loss that is not expected to provide future tax benefits. As of December 31, 2016, the valuation allowance of $1.0 million remains unchanged.
As of December 31, 2016, there were no material unrecognized tax benefits, interest or penalties and the Company does not anticipate a significant change to the total amount of unrecognized tax benefits within the next 12 months.
The components of income tax expense for the period from June 29, 2016 (date of capitalization) to December 31, 2016 are as follows (in thousands):
For the period from June 29, 2016 (Date of Capitalization) to December 31, 2016 | |||
Current: | |||
Federal | $ | — | |
State | (318 | ) | |
Total current | (318 | ) | |
Deferred: | |||
Federal | (126 | ) | |
State | (9 | ) | |
Total deferred | (135 | ) | |
Total income tax expense | $ | (453 | ) |
106
The reconciliation of income tax expense computed at the U.S. statutory income tax rate and the income tax expense in the consolidated statement of operations is shown below (dollars in thousands):
For the period from June 29, 2016 (Date of Capitalization) to December 31, 2016 | ||||||
Amount | Percentage | |||||
Income tax expense at U.S. federal statutory rate | $ | 4,783 | 34.0 | % | ||
REIT earnings without income tax provision | (4,901 | ) | (34.8 | )% | ||
State income tax, net of federal tax benefit | (327 | ) | (2.3 | )% | ||
Other | (8 | ) | (0.1 | )% | ||
Total income tax expense | $ | (453 | ) | (3.2 | )% | |
Note 15—Related Party Transactions
Certain of the Company’s executive officers own interests in properties that are managed and leased by Eola. During the period from June 29, 2016 (date of capitalization) to December 31, 2016, the Company recorded approximately $66,000 in management fees and approximately $164,000 in reimbursements related to the management and leasing of these assets.
During the period from June 29, 2016 (date of capitalization) to December 31, 2016, the Company incurred director fees for TPG Pantera–nominated members of the Company’s Board in the aggregate amount of $92,000, which is paid directly to TPG Pantera.
On September 28, 2016, Eola entered into an agreement and side letter with affiliates of the TPG Parties pursuant to which Eola performs property management, accounting and finance services for such TPG Party affiliates at certain assets owned by such TPG Party affiliates (collectively, the “TPG Owner”) that were purchased from the Legacy Parkway on September 27, 2016. The agreement has a one-year term. Pursuant to the agreement and side letter, Eola will receive a monthly management fee equal to approximately 2.5% of the aggregate gross revenues received from the operation of the properties and is reimbursed for certain personnel expenses. Eola recorded $193,000 and $90,000 for management fees and salary reimbursements, respectively, for the period from June 29, 2016 (date of capitalization) to December 31, 2016.
Concurrently with the execution of the Merger Agreement, Legacy Parkway and Parkway LP entered into a letter agreement (the “Thomas Letter Agreement”) with Mr. James A. Thomas, then chairman of the Legacy Parkway board of directors and the current chairman of the Company’s board of directors, and certain unitholders of Parkway LP who are affiliated with Mr. Thomas. Pursuant to the Separation and Distribution Agreement, the Thomas Letter Agreement is binding on the Company. On March 14, 2017, the Operating Partnership and Parkway LP entered into a Debt Guaranty Agreement (the “Debt Guaranty Agreement”) with Mr. Thomas and certain affiliates of Mr. Thomas (the “Thomas Investors”) that implements those provisions of the Thomas Letter Agreement regarding debt guarantee opportunities made available to Mr. Thomas and the Thomas Investors. Consistent with the Thomas Letter Agreement, pursuant to the Debt Guaranty Agreement, the Operating Partnership made available to Mr. Thomas and the Thomas Investors certain debt guarantee opportunities corresponding to specified mortgage loans of the Company, of which Mr. Thomas and the Thomas Investors entered into contribution agreements with respect to $109 million (representing an additional $70 million over their existing $39 million guarantee). In the event these specified mortgage loans become unavailable for guarantee (whether because the Company repays them, sells the corresponding asset, or otherwise), the Company is required to use commercially reasonable efforts to provide a replacement guarantee or contribution opportunity to the extent of the Company’s remaining qualifying debt (but not in excess of $109 million). The Company has agreed to maintain any such debt for the remainder of the five-year period following October 2016, subject to early termination in the event of a going private transaction, sale of all or substantially all of the Company’s assets or certain similar transactions.
Note 16—Selected Quarterly Financial Data (Unaudited)
Summarized quarterly financial data for the period from June 29, 2016 (date of capitalization) to December 31, 2016 is as follows (in thousands, except per share data):
2016 | |||||||
Period from June 29, 2016 (date of capitalization) to September 30, 2016 | Fourth Quarter | ||||||
Revenues (other than gains) | $ | — | $ | 68,931 | |||
Expenses | (5,372 | ) | (70,845 | ) | |||
Operating loss | (5,372 | ) | (1,914 | ) | |||
Interest and other income | — | 1,225 | |||||
Interest expense | — | (8,007 | ) | ||||
Income tax expense | — | (453 | ) | ||||
Net loss | (5,372 | ) | (9,149 | ) | |||
Net loss attributable to noncontrolling interest - unitholders | — | 299 | |||||
Net loss attributable to Parkway, Inc. | (5,372 | ) | (8,850 | ) | |||
Dividends on preferred stock | — | (94 | ) | ||||
Net loss attributable to common stockholders | $ | (5,372 | ) | $ | (8,944 | ) | |
Basic and diluted net loss per common share attributable to common stockholders (1) | $ | (0.11 | ) | $ | (0.18 | ) | |
Dividends per common share (1) | $ | — | $ | — | |||
Weighted average shares outstanding: | |||||||
Basic (1) | 49,111 | 49,111 | |||||
Diluted (1) | 49,111 | 49,111 | |||||
(1) As described in “Note 1—Organization,” the financial statements reflect the common shares and units as if they were outstanding for the entire period presented. | |||||||
Note 17—Subsequent Events
On February 17, 2017, the Company, through its Operating Partnership and certain other subsidiaries, entered into an Omnibus Contribution and Partial Interest Assignment Agreement (the “Contribution Agreement”) with an affiliate of Canada Pension Plan Investment Board (“CPPIB”) and an entity controlled by TH Real Estate Global Asset Management and Silverpeak Real Estate Partners (“TIAA/SP”). Pursuant to the Contribution Agreement, the Company has agreed to sell to these two investors, indirectly through a new joint venture, an aggregate 49% interest in our Greenway Plaza and Phoenix Tower properties. The new joint venture is expected to be owned 51% through subsidiaries of the Operating Partnership (with 1% being held by a subsidiary acting as the general partner and 50% being held by a subsidiary acting as a limited partner) and 24.5% by each of CPPIB and TIAA/SP, each as a limited partner of the joint venture. The Company will serve as general partner and also will provide property management and leasing services to the joint venture.
The Company expects to record an impairment loss of approximately $25 million (unaudited) in the first quarter of 2017 related to the joint venture transaction. Subject to certain closing conditions, the Company expects the closing of the joint venture and associated financing to occur in the second quarter of 2017, subject to extension to an outside date of May 31, 2017, which may be further extended to June 21, 2017 in certain circumstances. As of December 31, 2016, total assets and liabilities of the Greenway Plaza and Phoenix Tower properties were $1.1 billion and $200.8 million, respectively.
Although the Company has not paid any dividends on its common stock as of the date of this Annual Report on Form 10-K, in accordance with its Charter and as authorized by the Board, the Company has declared a quarterly dividend in the amount of $0.10 per share of common stock to holders of record of its common stock on March 16, 2017. The common dividend will be paid on March 30, 2017. In addition, the Company declared a dividend in the amount of $2,000 per share of Series A non-voting preferred stock to Cousins LP, the holder of record of all outstanding shares of such stock. A preferred dividend totaling approximately $100,000 will be paid on March 31, 2017 to the holder of record of Series A non-voting preferred stock on March 17, 2017.
107
SCHEDULE III – REAL ESTATE AND ACCUMULATED DEPRECIATION
December 31, 2016
(In thousands)
Initial Cost to the Company | ||||||||||||||||||||
Description | Encumbrances (1) | Land | Building and Improvements | Subsequent Capitalized Costs | Total Real Estate | |||||||||||||||
Texas | ||||||||||||||||||||
CityWestPlace | $ | 93,295 | $ | 43,322 | $ | 303,764 | $ | 2,810 | $ | 349,896 | ||||||||||
San Felipe Plaza | 109,612 | 5,579 | 162,777 | 2,417 | 170,773 | |||||||||||||||
Phoenix Tower | 71,039 | 8,686 | 71,874 | 1,647 | 82,207 | |||||||||||||||
Greenway Plaza | — | 273,651 | 733,996 | 2,577 | 1,010,224 | |||||||||||||||
Post Oak Central | 177,631 | 86,077 | 163,344 | 2,147 | 251,568 | |||||||||||||||
Total Real Estate Owned | $ | 451,577 | $ | 417,315 | $ | 1,435,755 | $ | 11,598 | $ | 1,864,668 | ||||||||||
(1) | Encumbrances represent face amount of mortgage debt and exclude any premiums or discounts. |
Gross Amount at Which | ||||||||||||||||||||||||||
Carried at Close of Period | ||||||||||||||||||||||||||
Description | Land | Building and Improvements | Total (1) | Accumulated Depreciation | Net Book Value of Real Estate | Year Acquired | Year Constructed | Depreciable Lives (Yrs.) | ||||||||||||||||||
Texas | ||||||||||||||||||||||||||
CityWestPlace | $ | 43,322 | $ | 306,574 | $ | 349,896 | $ | 2,618 | $ | 347,278 | 2016 | 1993-2001 | (2) | |||||||||||||
San Felipe Plaza | 5,579 | 165,194 | 170,773 | 1,639 | 169,134 | 2016 | 1984 | (2) | ||||||||||||||||||
Phoenix Tower | 8,686 | 73,521 | 82,207 | 753 | 81,454 | 2016 | 1984/2011 | (2) | ||||||||||||||||||
Greenway Plaza | 273,651 | 736,573 | 1,010,224 | 119,640 | 890,584 | 2016 | 1969-1981 | (2) | ||||||||||||||||||
Post Oak Central | 86,077 | 165,491 | 251,568 | 34,407 | 217,161 | 2016 | 1974-1980 | (2) | ||||||||||||||||||
Total Real Estate Owned | $ | 417,315 | $ | 1,447,353 | $ | 1,864,668 | $ | 159,057 | $ | 1,705,611 | ||||||||||||||||
(1) | The aggregate cost for federal income tax purposes, without adjustments for gain recognized and/or loss disallowed by Cousins in connection with transactions occurring on October 6, 2016, was approximately $1.6 billion (unaudited). |
(2) | Depreciation of buildings is 7- 40 years from acquisition date. |
108
NOTE TO SCHEDULE III
At December 31, 2016
(In thousands)
A summary of activity for real estate and accumulated depreciation for the period from June 29, 2016 (date of capitalization) to December 31, 2016 is as follows:
Real Estate: | |||
Office Properties: | |||
Balance at June 29, 2016 (Date of Capitalization) | $ | — | |
Contributions from the Spin-Off | 1,854,257 | ||
Improvements | 11,598 | ||
Non-depreciable real estate sold | (1,187 | ) | |
Balance at December 31, 2016 | $ | 1,864,668 | |
Accumulated Depreciation: | |||
Balance at June 29, 2016 (Date of Capitalization) | $ | — | |
Contributions from the Spin-Off | 142,102 | ||
Depreciation expense | 16,955 | ||
Balance at December 31, 2016 | $ | 159,057 | |
109
REPORT OF INDEPENDENT REGISTERED PUBLIC ACCOUNTING FIRM
THE BOARD OF DIRECTORS AND STOCKHOLDERS
PARKWAY, INC.
We have audited the accompanying combined balance sheets of Parkway Houston as of October 5, 2016 and December 31, 2015, and the related combined statements of operations, equity and cash flows for the period from January 1, 2016 to October 5, 2016 and each of the two years in the period ended December 31, 2015. These financial statements are the responsibility of Parkway Houston’s management. Our responsibility is to express an opinion on these financial statements based on our audits.
We conducted our audits in accordance with the standards of the Public Company Accounting Oversight Board (United States). Those standards require that we plan and perform the audit to obtain reasonable assurance about whether the financial statements are free of material misstatement. We were not engaged to perform an audit of Parkway Houston’s internal control over financial reporting. Our audits included consideration of internal control over financial reporting as a basis for designing audit procedures that are appropriate in the circumstances, but not for the purpose of expressing an opinion on the effectiveness of Parkway Houston's internal control over financial reporting. Accordingly, we express no such opinion. An audit includes examining, on a test basis, evidence supporting the amounts and disclosures in the financial statements. An audit also includes assessing the accounting principles used and significant estimates made by management, as well as evaluating the overall financial statement presentation. We believe that our audits provide a reasonable basis for our opinion.
In our opinion, the financial statements referred to above present fairly, in all material respects, the combined financial position of Parkway Houston at October 5, 2016 and December 31, 2015, and the combined results of its operations and its cash flows for the period from January 1, 2016 to October 5, 2016 and each of the two years in the period ended December 31, 2015, in conformity with U.S. generally accepted accounting principles.
/s/ Ernst & Young LLP
Indianapolis, Indiana
March 15, 2017
110
PARKWAY HOUSTON
COMBINED BALANCE SHEETS
(In thousands, except share and per share data)
October 5, 2016 | December 31, 2015 | ||||||
Assets | |||||||
Real estate related investments: | |||||||
Office properties | $ | 831,473 | $ | 818,594 | |||
Accumulated depreciation | (86,517 | ) | (65,941 | ) | |||
Total real estate related investments, net | 744,956 | 752,653 | |||||
Cash and cash equivalents | 13,671 | 11,961 | |||||
Receivables and other assets | 79,423 | 76,300 | |||||
Intangible assets, net | 17,452 | 24,439 | |||||
Management contract intangibles, net | — | 378 | |||||
Total assets | $ | 855,502 | $ | 865,731 | |||
Liabilities | |||||||
Mortgage notes payable, net | $ | 276,441 | $ | 396,901 | |||
Accounts payable and other liabilities | 32,011 | 36,299 | |||||
Below market leases, net of accumulated amortization of $41,778 and $36,175, respectively | 17,862 | 23,465 | |||||
Total liabilities | 326,314 | 456,665 | |||||
Equity | |||||||
Legacy Parkway equity | 529,188 | 409,066 | |||||
Total liabilities and equity | $ | 855,502 | $ | 865,731 | |||
See notes to combined financial statements.
111
PARKWAY HOUSTON
COMBINED STATEMENTS OF OPERATIONS
(In thousands)
Period From January 1 to October 5, | Years Ended December 31, | ||||||||||
2016 | 2015 | 2014 | |||||||||
Revenues | |||||||||||
Income from office properties | $ | 83,249 | $ | 108,507 | $ | 123,172 | |||||
Management company income | 3,835 | 9,891 | 23,971 | ||||||||
Sale of condominium units | — | 11,063 | 16,554 | ||||||||
Total revenues | 87,084 | 129,461 | 163,697 | ||||||||
Expenses | |||||||||||
Property operating expenses | 39,758 | 45,385 | 54,856 | ||||||||
Management company expenses | 3,263 | 9,362 | 27,038 | ||||||||
Cost of sales - condominium units | — | 11,120 | 13,199 | ||||||||
Depreciation and amortization | 30,791 | 55,570 | 64,012 | ||||||||
Impairment loss on management contracts | — | — | 4,750 | ||||||||
General and administrative | 4,880 | 6,336 | 6,917 | ||||||||
Total expenses | 78,692 | 127,773 | 170,772 | ||||||||
Operating income (loss) | 8,392 | 1,688 | (7,075 | ) | |||||||
Other income and expenses | |||||||||||
Interest and other income | 196 | 246 | 244 | ||||||||
Gain on extinguishment of debt | 154 | — | — | ||||||||
Interest expense | (10,010 | ) | (16,088 | ) | (16,252 | ) | |||||
Loss before income taxes | (1,268 | ) | (14,154 | ) | (23,083 | ) | |||||
Income tax (expense) benefit | (1,113 | ) | (1,635 | ) | 180 | ||||||
Net loss | (2,381 | ) | (15,789 | ) | (22,903 | ) | |||||
Net (income) loss attributable to noncontrolling interests | — | 7 | (148 | ) | |||||||
Net loss attributable to Parkway Houston | $ | (2,381 | ) | $ | (15,782 | ) | $ | (23,051 | ) | ||
See notes to combined financial statements.
112
PARKWAY HOUSTON
COMBINED STATEMENTS OF CHANGES IN EQUITY
(In thousands)
Parkway Equity | Noncontrolling Interests | Total Equity | |||||||||
Balance at December 31, 2013 | $ | 396,985 | $ | 3,050 | $ | 400,035 | |||||
Net income (loss) | (23,051 | ) | 148 | (22,903 | ) | ||||||
Distributions to noncontrolling interest holders in properties | — | (2,290 | ) | (2,290 | ) | ||||||
Contributions from Legacy Parkway, net | 6,119 | — | 6,119 | ||||||||
Balance at December 31, 2014 | $ | 380,053 | $ | 908 | $ | 380,961 | |||||
Net loss | (15,782 | ) | (7 | ) | (15,789 | ) | |||||
Distributions to noncontrolling interest holders in properties | — | (901 | ) | (901 | ) | ||||||
Contributions from Legacy Parkway, net | 44,795 | — | 44,795 | ||||||||
Balance at December 31, 2015 | $ | 409,066 | $ | — | $ | 409,066 | |||||
Net loss | (2,381 | ) | — | (2,381 | ) | ||||||
Contributions from Legacy Parkway, net | 122,503 | — | 122,503 | ||||||||
Balance at October 5, 2016 | $ | 529,188 | $ | — | $ | 529,188 | |||||
See notes to combined financial statements.
113
PARKWAY HOUSTON
COMBINED STATEMENTS OF CASH FLOWS
(In thousands)
Period From January 1 to October 5, | Years Ended December 31, | ||||||||||
2016 | 2015 | 2014 | |||||||||
Operating activities | |||||||||||
Net loss | $ | (2,381 | ) | $ | (15,789 | ) | $ | (22,903 | ) | ||
Adjustments to reconcile net loss to cash provided by operating activities: | |||||||||||
Depreciation and amortization of office properties | 30,791 | 55,570 | 64,012 | ||||||||
Amortization of management contract intangibles, net | 378 | 755 | 7,881 | ||||||||
Amortization of below market leases, net | (4,650 | ) | (16,937 | ) | (16,118 | ) | |||||
Amortization of financing costs | 32 | 42 | 42 | ||||||||
Amortization of debt premium, net | (1,701 | ) | (3,992 | ) | (3,940 | ) | |||||
Deferred income tax expense (benefit) | 566 | 363 | (4,763 | ) | |||||||
Non-cash impairment loss on management contracts | — | — | 4,750 | ||||||||
Gain on extinguishment of debt | (154 | ) | — | — | |||||||
Increase in deferred leasing costs | (6,230 | ) | (7,735 | ) | (14,661 | ) | |||||
Changes in operating assets and liabilities: | |||||||||||
Change in condominium units | — | 9,318 | 10,582 | ||||||||
Change in receivables and other assets | (1,841 | ) | (9,369 | ) | (20,396 | ) | |||||
Change in accounts payable and other liabilities | (3,546 | ) | 630 | (1,294 | ) | ||||||
Cash provided by operating activities | 11,264 | 12,856 | 3,192 | ||||||||
Investing activities | |||||||||||
Improvements to real estate | (13,420 | ) | (46,421 | ) | (4,360 | ) | |||||
Cash used in investing activities | (13,420 | ) | (46,421 | ) | (4,360 | ) | |||||
Financing activities | |||||||||||
Principal payments on mortgage notes payable | (118,637 | ) | (6,360 | ) | (3,547 | ) | |||||
Change in Legacy Parkway investment, net | 122,503 | 44,795 | 4,573 | ||||||||
Distributions to noncontrolling interest holders in properties | — | (901 | ) | (2,290 | ) | ||||||
Cash provided by (used in) financing activities | 3,866 | 37,534 | (1,264 | ) | |||||||
Change in cash and cash equivalents | 1,710 | 3,969 | (2,432 | ) | |||||||
Cash and cash equivalents at beginning of period | 11,961 | 7,992 | 10,424 | ||||||||
Cash and cash equivalents at end of period | $ | 13,671 | $ | 11,961 | $ | 7,992 | |||||
Supplemental Cash Flow Information: | |||||||||||
Cash paid for interest | $ | 12,924 | $ | 20,064 | $ | 20,313 | |||||
Cash paid for income taxes | 1,044 | 1,783 | 4,383 | ||||||||
Supplemental schedule of non-cash investing and financing activity: | |||||||||||
Accrued capital expenditures | $ | 594 | $ | — | $ | — | |||||
Contributions from Legacy Parkway, net | — | — | 1,546 | ||||||||
See notes to combined financial statements.
114
PARKWAY HOUSTON
NOTES TO COMBINED FINANCIAL STATEMENTS
October 5, 2016
Note 1—Organization
On April 28, 2016, the board of directors of Cousins Properties Incorporated, a Georgia corporation (“Cousins”), and the board of directors of Parkway Properties, Inc., a Maryland corporation (“Legacy Parkway”), each approved an Agreement and Plan of Merger, dated as of April 28, 2016 (the “Merger Agreement”). On October 6, 2016, pursuant to the Merger Agreement, Legacy Parkway merged with and into Clinic Sub Inc., with Clinic Sub Inc. continuing as the surviving corporation and a wholly owned subsidiary of Cousins (the “Merger”). Immediately following the effective time of the Merger, in accordance with the Merger Agreement, Cousins separated the portion of its combined businesses relating to the ownership of real properties in Houston, Texas, as well as Legacy Parkway’s fee-based real estate services (the “Third-Party Services Business” and together with the Houston real properties, the “Houston Business”), from the remainder of the combined businesses (the “Separation”). In connection with the Separation, Cousins and Legacy Parkway reorganized the combined businesses through a series of transactions (the “Reorganization”) pursuant to which the Houston Business was transferred to Parkway, Inc. (the “Company”). On October 7, 2016, Cousins completed the Spin-Off of the Company, by distributing all of the outstanding shares of common and limited voting stock of the Company to the holders of Cousins common and limited voting preferred stock as of the record date, October 6, 2016 (the “Spin-Off”).
The combined financial statements included herein represent the combined accounts and combined operations of the Houston Business previously owned and operated by Legacy Parkway through October 5, 2016 (“Parkway Houston”).
Note 2—Basis of Presentation and Combination
The accompanying combined financial statements include the accounts of Parkway Houston presented on a combined basis as the ownership interests previously were under common control and ownership of Legacy Parkway during the reported periods. All significant intercompany balances and transactions have been eliminated.
These combined financial statements are derived from the books and records of Legacy Parkway and were carved out from Legacy Parkway at a carrying value reflective of such historical cost in such Legacy Parkway records. Parkway Houston’s historical financial results reflect charges for certain corporate costs and Parkway Houston believes such charges are reasonable; however, such results do not necessarily reflect what Parkway Houston’s expenses would have been had Parkway Houston been operating as an independent, stand-alone public company. Costs of the services that were charged to Parkway Houston were based on either actual costs incurred or a proportion of costs estimated to be applicable to Parkway Houston. The historical combined financial information presented may therefore not be indicative of the results of operations, financial position or cash flows that would have been obtained if Parkway Houston had been an independent, stand-alone public company during the periods presented or of Parkway Houston’s future performance as an independent, stand-alone company.
Parkway Houston is a predecessor, as defined in applicable rules and regulations for the Securities and Exchange Commission, to the Houston Business, which commenced operations on the date of the Spin-Off.
These combined financial statements reflect the consolidation of properties that are wholly owned or properties in which, prior to the Merger, the Separation, the Reorganization and the Spin-off, Legacy Parkway owned less than a 100% interest but that Legacy Parkway controlled. Control of a property is demonstrated by, among other factors, Parkway Houston’s ability to refinance debt and sell the property without the consent of any other partner or owner and the inability of any other partner or owner to replace Legacy Parkway. Eola Capital, LLC (“Eola”), Phoenix Tower, CityWestPlace and San Felipe Plaza were all wholly owned by Legacy Parkway for all periods presented.
Parkway Houston consolidates its Murano residential condominium project which it controls. Parkway Houston’s unaffiliated partner’s interest is reflected on its combined balance sheets under the “Noncontrolling Interests” caption. Parkway Houston’s partner has a stated ownership interest of 27%. Net proceeds from the project will be distributed, to the extent available, based on an order of preferences described in the partnership agreement. Parkway Houston may receive distributions, if any, in excess of its stated 73% ownership interest if certain return thresholds are met.
115
NOTE 3—Summary of Significant Accounting Policies
Use of Estimates
The preparation of financial statements in conformity with accounting principles generally accepted in the United States (“GAAP”) requires management to make estimates and assumptions that affect the reported amounts of assets and liabilities, the disclosure of contingent assets and liabilities at the date of the financial statements and the reported amounts of revenues and expenses during the reporting period. Although Parkway Houston believes the assumptions and estimates made are reasonable and appropriate, as discussed in the applicable sections throughout these combined financial statements, different assumptions and estimates could materially impact reported results. The current economic environment has increased the degree of uncertainty inherent in these estimates and assumptions; therefore, changes in market conditions could impact Parkway Houston’s future operating results. Parkway Houston’s most significant estimates relate to impairments on real estate and other assets and purchase price assignments. Actual results could differ from these estimates.
Real Estate Properties
Real estate properties are carried at cost less accumulated depreciation. Cost includes the carrying amount of Parkway Houston’s investment plus any additional consideration paid, liabilities assumed and improvements made subsequent to acquisition. Depreciation of buildings and building improvements is computed using the straight-line method over the estimated useful lives of the assets. Depreciation of tenant improvements, including personal property, is computed using the straight-line method over the lesser of the useful life or the term of the lease involved. Maintenance and repair expenses are charged to expense as incurred.
Parkway Houston evaluates its real estate assets for impairment upon occurrence of significant adverse changes in its operations to assess whether any impairment indicators are present that affect the recovery of the carrying amount. The carrying amount includes the net book value of tangible and intangible assets and liabilities. Real estate assets are classified as held for sale or held and used. Parkway Houston classifies certain assets as held for sale based on management having the authority and intent of entering into commitments for sale transactions to close in the next 12 months. Parkway Houston considers an office property as held for sale once it has executed a contract for sale, allowed the buyer to complete its due diligence review and received a substantial non-refundable deposit. Until a buyer has completed its due diligence review of the asset, necessary approvals have been received and substantive conditions to the buyer’s obligation to perform have been satisfied, Parkway Houston does not consider a sale to be probable. When Parkway Houston identifies an asset as held for sale, it estimates the net realizable value of such asset and discontinues recording depreciation on the asset. Parkway Houston records assets held for sale at the lower of the carrying amount or fair value less cost to sell. If the fair value of the asset net of estimated selling costs is less than the carrying amount, Parkway Houston records an impairment loss.
With respect to assets classified as held and used, Parkway Houston recognizes an impairment loss if the carrying amount is not recoverable and exceeds the sum of undiscounted future cash flows expected to result from the use and eventual disposition of the asset. Upon impairment, Parkway Houston recognizes an impairment loss to reduce the carrying value of the real estate asset to the estimate of its fair value. The cash flow and fair value estimates are based on assumptions about employing the asset for its remaining useful life. Factors considered in projecting future cash flows include, but are not limited to: existing leases, future leasing and terminations, market rental rates, capital improvements, tenant improvements, leasing commissions, inflation, discount rates, capitalization rates and other known variables, and contractual purchase and sale agreements. This market information is considered a Level 2 or Level 3 input as defined by the Financial Accounting Standards Board’s (“FASB”) Accounting Standards Codification (“ASC”) 820, “Fair Value Measurements and Disclosures”.
Parkway Houston recognizes gains or losses on sales of real estate at times and in amounts determined in accordance with the accounting guidance for sales of real estate. The guidance takes into account the terms of the transaction and any continuing involvement, including in the form of management, leasing of space or financial assistance associated with the properties. If the sales criteria for the full accrual method are not met, then Parkway Houston defers gain recognition and accounts for the transaction by applying the deposit, finance, installment or cost recovery methods, as appropriate.
Purchase Price Assignment
Parkway Houston assigns the purchase price of real estate to tangible and intangible assets and liabilities based on fair value. Tangible assets consist of land, building, garage, building improvements and tenant improvements. Intangible assets and liabilities consist of the value of above and below market leases, lease costs, the value of in-place leases and any value attributable to above or below market debt assumed with the acquisition.
116
Parkway Houston engages independent third-party appraisers to perform the valuations used to determine the fair value of these identifiable tangible and intangible assets. These valuations and appraisals use commonly employed valuation techniques, such as discounted cash flow analyses. Factors considered in these analyses include an estimate of costs during hypothetical expected lease-up periods considering current market conditions and costs to execute similar leases. Parkway Houston also considers information obtained about each property as a result of its pre-acquisition due diligence, marketing and leasing activities in estimating the fair value of the tangible and intangible assets acquired. Parkway Houston includes real estate taxes, insurance and other operating expenses and estimates of lost rentals at market rates during the expected lease-up periods depending on specific local market conditions and the type of property acquired. Additionally, Parkway Houston estimates costs to execute similar leases including leasing commissions, legal and other related expenses.
The fair value of above or below market in-place lease values is the present value of the difference between the contractual amount to be paid pursuant to the in-place lease and the estimated current market lease rate expected over the remaining non-cancelable life of the lease. The capitalized above market lease values are amortized as a reduction of rental income over the remaining term of the respective leases. The portion of the values of the leases associated with below-market renewal options that are likely to be exercised are amortized to rental income over the respective renewal. The capitalized below market lease values are amortized as an increase to rental income over the remaining term of the respective leases. Total amortization for above and below market leases was a net increase of rental income of $5.0 million, $17.1 million and $16.3 million for the period from January 1, 2016 to October 5, 2016 and the years ended December 31, 2015 and 2014, respectively.
As of October 5, 2016, the remaining amortization of above/below market leases, net is projected as a net increase to rental income as follows (in thousands):
Amount | |||
2016 | $ | 1,079 | |
2017 | 3,705 | ||
2018 | 1,946 | ||
2019 | 1,575 | ||
2020 | 1,511 | ||
Thereafter | 6,479 | ||
Total | $ | 16,295 | |
The fair value of in-place leases is the present value associated with re-leasing the in-place lease as if the property was vacant. Factors to be considered include estimates of costs during hypothetical expected lease-up periods considering current market conditions and costs to execute similar leases. In estimating costs, Parkway Houston includes estimates of lost rentals at market rates during the expected lease-up periods. The value of at market in-place leases is amortized as a lease cost amortization expense over the expected life of the lease. Total amortization expense for the value of in-place leases was $6.4 million, $16.7 million and $30.1 million for the period from January 1, 2016 to October 5, 2016 and the years ended December 31, 2015 and 2014, respectively.
As of October 5, 2016, the remaining amortization expense for the value of in-place leases is projected as follows (in thousands):
Amount | |||
2016 | $ | 1,381 | |
2017 | 4,398 | ||
2018 | 2,031 | ||
2019 | 1,454 | ||
2020 | 1,395 | ||
Thereafter | 5,227 | ||
Total | $ | 15,886 | |
A separate component of the fair value of in-place leases is identified for the lease costs. The fair value of lease costs represents the estimated commissions and legal fees paid in connection with the current leases in place. Lease costs are amortized over the non-cancelable terms of the respective leases as amortization expense.
117
In no event does the amortization period for intangible assets exceed the remaining depreciable life of the building. Should a customer terminate its lease, the unamortized portion of the tenant improvement, in-place lease value and lease cost intangibles would be charged to expense. Additionally, the unamortized portion of above market in-place leases would be recorded as a reduction to rental income and the below market in-place lease value would be recorded as an increase to rental income.
Parkway Houston calculates the fair value of mortgage notes payable by discounting the remaining contractual cash flows on each instrument at the current market rate for these borrowings.
Capitalization of Costs
Costs related to planning, developing, leasing and constructing a property, including costs of development personnel working directly on projects under development, are capitalized. In addition, Parkway Houston capitalizes interest to qualifying assets under development based on average accumulated expenditures outstanding during the period. In capitalizing interest to qualifying assets, Parkway Houston first uses the interest incurred on specific project debt, if any, and next uses Parkway Houston’s weighted average interest rate for non-project specific debt. Parkway Houston also capitalizes certain costs of leasing personnel in connection with the completion of leasing arrangements.
Cash Equivalents
Parkway Houston considers all highly liquid investments with a maturity of three months or less when purchased to be cash equivalents.
Restricted Cash
Restricted cash, which is included in receivables and other assets, primarily consists of security deposits held on behalf of Parkway Houston’s tenants as well as capital improvements and real estate tax escrows required under certain loan agreements. There are restrictions on Parkway Houston’s ability to withdraw these funds other than for their specified usage.
Allowance for Doubtful Accounts
Accounts receivable are reduced by an allowance for amounts that Parkway Houston estimates to be uncollectible. The receivable balance is comprised primarily of rent and expense reimbursement income due from the customers. Management evaluates the adequacy of the allowance for doubtful accounts considering such factors as the credit quality of the customers, delinquency of payment, historical trends and current economic conditions. Parkway Houston provides an allowance for doubtful accounts for customer balances that are over 90 days past due and for specific customer receivables for which collection is considered doubtful.
The components of allowance for doubtful accounts for the period from January 1, 2016 to October 5, 2016 and the years ended December 31, 2015 and 2014, respectively, are as follows:
October 5, | December 31, | ||||||||||
Asset Category | 2016 | 2015 | 2014 | ||||||||
Beginning balance: | $ | 98 | $ | 38 | $ | 306 | |||||
Bad debt expense | 106 | 261 | 88 | ||||||||
Write-offs | (79 | ) | (201 | ) | (356 | ) | |||||
Ending balance: | $ | 125 | $ | 98 | $ | 38 | |||||
Amortization of Debt Origination Costs and Leasing Costs
Debt origination costs are deferred and amortized using a method that approximates the effective interest method over the term of the loan. These costs are classified within the combined balance sheets as a direct deduction from the carrying amount of debt within total liabilities. Leasing costs are deferred and amortized using the straight-line method over the term of the respective lease.
118
Fair Value Measurements
Level 1 fair value inputs are quoted prices for identical assets or liabilities in active, liquid and visible markets such as stock exchanges. Level 2 fair value inputs are observable information for similar assets or liabilities in active or inactive markets, and appropriately consider counterparty creditworthiness in the valuations. Level 3 fair value inputs reflect Parkway Houston’s best estimate of inputs and assumptions market participants would use in pricing an asset or liability at the measurement date. These inputs are unobservable in the market and significant to the valuation estimate.
Noncontrolling Interest
A noncontrolling interest in a subsidiary is in most cases an ownership interest in the consolidated entity that should be reported as equity in the consolidated financial statements and separate from the parent company’s equity. In addition, consolidated net income is required to be reported as amounts that include the amounts attributable to both the parent and the noncontrolling interest and the amount of consolidated net income attributable to the parent and the noncontrolling interest are required to be disclosed on the face of the combined statements of operations.
Revenue Recognition
Revenue from real estate rentals is recognized on a straight-line basis over the noncancelable lease term at the inception of each respective lease in accordance with ASC 840, Leases. The cumulative difference between lease revenue recognized under this method and contractual lease payment terms is recorded as straight-line rent receivable on the accompanying balance sheets. The straight-line rent adjustment increased revenue by $4.1 million for the period from January 1, 2016 to October 5, 2016 and by $13.9 million and $6.3 million in 2015 and 2014, respectively.
When Parkway Houston is the owner of the tenant improvements, the leased space is ready for its intended use when the tenant improvements are substantially completed, at which point revenue recognition begins. In limited instances, when the tenant is the owner of the customer improvements, straight-line rent is recognized when the tenant takes possession of the unimproved space.
The leases also typically provide for tenant reimbursement of a portion of common area maintenance, real estate taxes and other operating expenses. Property operating cost recoveries from customers (“expense reimbursements”) are recognized as revenue in the period in which the expenses are incurred. The computation of expense reimbursements is dependent on the provisions of individual customer leases. Most customers make monthly fixed payments of estimated expense reimbursements. Parkway Houston makes adjustments, positive or negative, to expense reimbursement income quarterly to adjust the recorded amounts to Parkway Houston’s best estimate of the final property operating costs based on the most recent annual estimate. After the end of the calendar year, Parkway Houston computes each customer’s final expense reimbursements and issues a bill or credit for the difference between the actual amount and the amounts billed monthly during the year. Differences between actual billed amounts and accrued amounts are considered immaterial.
Management company income represents market-based fees earned from providing management, construction, leasing, brokerage and acquisition services to unconsolidated joint ventures, related parties and third parties. Management fee income is computed and recorded monthly in accordance with the terms set forth in the management service agreements. Leasing and brokerage commissions, as well as salary and administrative fees, are recognized pursuant to the terms of the agreements at the time underlying leases are signed, which is the point at which the earnings process is complete and collection of fees is reasonably assured. Fees relating to the purchase or sale of property are recognized when the earnings process is complete and collection of fees is reasonably assured, which usually occurs at closing. All fees on company-owned properties are eliminated in consolidation. Parkway Houston recognizes fees earned from Legacy Parkway’s unconsolidated joint ventures in management company income.
Parkway Houston has one high-rise condominium project. Under the provisions of FASB ASC 360-20, “Property, Plant and Equipment” subsection “Real Estate and Sales,” revenue and costs for projects are recognized when all parties are bound by the terms of the contract, all consideration has been exchanged, any permanent financing for which the seller is responsible has been arranged and all conditions precedent to closing have been performed. This results in profit from the sale of condominium units recognized at closing. Revenue is recognized on the contract price of individual units. Total estimated costs are allocated to individual units which have closed on a relative value basis.
119
Impairment of Intangible Assets
During 2014, Parkway Houston evaluated certain qualitative factors and determined that it was necessary to apply the two-step quantitative impairment test under ASU 2011-08. During the year ended December 31, 2014, Parkway Houston determined that the undiscounted cash flows indicated that the carrying amounts of certain Eola management contracts were not expected to be recovered and, as a result, Parkway Houston recorded a $4.8 million pre-tax non-cash impairment loss related to these management contracts which resulted in the entire remaining balance of the Eola contracts being written off as of December 31, 2014. During the period from January 1, 2016 to October 5, 2016 and year ended December 31, 2015, no impairment losses were recorded on Parkway Houston’s intangible assets.
Gain on Extinguishment of Debt
When outstanding debt is extinguished, Parkway Houston expenses any prepayment penalties, unamortized premium/discounts and loan costs.
Income Taxes
Legacy Parkway elected to be taxed as a real estate investment trust (“REIT”) under the Internal Revenue Code of 1986, as amended (the “Code”), commencing with its taxable year ended December 31, 1997. To qualify as a REIT, Legacy Parkway was required to meet a number of organizational and operational requirements, including a requirement that it distribute annually at least 90% of its “REIT taxable income,” subject to certain adjustments and excluding any net capital gain to its stockholders. Legacy Parkway believes that it was in compliance with all REIT requirements at October 5, 2016. As a REIT, Legacy Parkway generally was not subject to corporate level federal income tax on taxable income it distributes currently to its stockholders. If Legacy Parkway fails to qualify as a REIT in any taxable year, it will be subject to federal income taxes at regular corporate rates (including any applicable alternative minimum tax) and may not be able to qualify as a REIT for four subsequent taxable years. Even if Legacy Parkway qualifies for taxation as a REIT, Legacy Parkway may be subject to certain state and local taxes on its income and property, and to federal income and excise taxes on its undistributed taxable income. The properties in the combined financial statements were owned directly or indirectly by partnerships, limited partnerships or limited liability companies and as a result, the allocated share of income or loss for each period is included in the income tax returns of the partners. In addition, taxable income from non-REIT activities managed through the taxable REIT subsidiary is subject to federal, state and local income taxes. Legacy Parkway provides for income taxes based on pretax income and applicable tax rates in the various jurisdictions in which it operates. The effective tax rate reflects the impact of earnings attributable to REIT operations and noncontrolling interests for which no U.S. income taxes have been provided.
Segment Reporting
Parkway Houston’s primary business was the ownership and operation of office properties. Parkway Houston has accounted for each office property or groups of related office properties as an individual operating segment. Parkway Houston has aggregated the individual operating segments into a single reporting segment due to the fact that the individual operating segments have similar operating and economic characteristics, such as being leased by the square foot, sharing the same primary operating expenses and ancillary revenue opportunities and being cyclical in economic performance based on current supply and demand conditions. The individual operating segments are also similar in that revenues are derived from the leasing of office space to customers and each office property is managed and operated consistently in accordance with standard operating procedures. The range and type of customer uses of the properties is similar throughout the portfolio regardless of location or class of building and the needs and priorities of the customers do not vary widely from building to building. Therefore, the management responsibilities do not vary widely from location to location based on the size of the building, geographic location or class. The operations of the Management Company are separately presented in the Combined Statements of Operations.
Allocated Costs
The historical financial results for Parkway Houston include certain allocated corporate costs which Parkway Houston believes are reasonable. These costs incurred by Legacy Parkway are reflected as an equity contribution and are estimated to be applicable to Parkway Houston based on an analysis of key metrics such as leasable square feet, personnel hours or expenses that were otherwise specifically identifiable. Such costs do not necessarily reflect what the actual costs would have been if Parkway Houston were operating as a separate stand-alone public company.
120
Reclassifications
Certain reclassifications have been made in the 2015 notes to combined financial statements to conform to the 2016 classifications with no impact on previously reported net loss or equity.
Recent Accounting Pronouncements
As discussed in Note 12—Subsequent Events, Parkway Houston's operations ceased on October 5, 2016, and none of the recent accounting pronouncements impacted Parkway Houston's financial statements and notes. Therefore, this section is not applicable.
Note 4—Real Estate Related Investments, Net
Included in real estate related investment, net are three office assets located in the Galleria, Greenway and Westchase submarkets of Houston, Texas, comprising six buildings and two adjacent parcels of land totaling approximately 3.1 million square feet (unaudited).
Balances of major classes of depreciable assets (in thousands) and their respective estimated useful lives are:
October 5, | December 31, | |||||||||
Asset Category | Estimated Useful Life | 2016 | 2015 | |||||||
Land | Non-depreciable | $ | 106,323 | $ | 106,323 | |||||
Buildings and garages | 40 years | 600,197 | 600,562 | |||||||
Building improvements | 7 to 40 years | 18,464 | 14,426 | |||||||
Tenant improvements | Lesser of useful life or term of lease | 106,489 | 97,283 | |||||||
$ | 831,473 | $ | 818,594 | |||||||
Depreciation expense related to these assets of $20.5 million, $32.0 million and $28.8 million was recognized in the period from January 1, 2016 to October 5, 2016 and in the years ended December 31, 2015 and 2014, respectively.
Contractual Obligations and Minimum Rental Receipts
Obligations for tenant improvement allowances and lease commission costs for leases in place and commitments for building improvements at October 5, 2016 are as follows (in thousands):
2016 | $ | 11,646 | |
2017 | 696 | ||
2018 | 10 | ||
2019 | — | ||
2020 | — | ||
Thereafter | — | ||
Total | $ | 12,352 | |
The following is a schedule by year of future minimum rental receipts under noncancelable leases for office buildings owned at October 5, 2016 (in thousands):
2016 | $ | 21,376 | |
2017 | 82,035 | ||
2018 | 77,687 | ||
2019 | 73,419 | ||
2020 | 70,907 | ||
Thereafter | 477,340 | ||
Total | $ | 802,764 | |
121
Parkway Houston is geographically concentrated in Houston, Texas. For the period from January 1, 2016 to October 5, 2016, four tenants in Parkway Houston's portfolio represented 21.9%, 9.5%, 7.1% and 6.0% of income from office properties, respectively. During the year ended December 31, 2015, four tenants in Parkway Houston's portfolio represented 27.9%, 12.0%, 6.9% and 5.5% of income from office properties, respectively. During the year ended December 31, 2014, four tenants in Parkway Houston's portfolio represented 21.2%, 15.0%, 6.6% and 5.1% of income from office properties, respectively.
Note 5—Receivables and Other Assets
The following represents the composition of Receivables and Other Assets as of October 5, 2016 and December 31, 2015 (in thousands):
October 5, 2016 | December 31, 2015 | ||||||
Rents and fees receivable | $ | 350 | $ | 300 | |||
Allowance for doubtful accounts | (125 | ) | (98 | ) | |||
Straight-line rent receivable | 25,159 | 21,073 | |||||
Other receivables | 1,284 | 3,593 | |||||
Lease costs, net of accumulated amortization of $17,473 and $13,257, respectively | 42,780 | 40,451 | |||||
Escrow and other deposits | 845 | 1,865 | |||||
Prepaid expenses | 825 | 482 | |||||
Cost method investment | 3,500 | 3,500 | |||||
Deferred tax asset, non-current | 4,686 | 4,999 | |||||
Other assets | 119 | 135 | |||||
$ | 79,423 | $ | 76,300 | ||||
Note 6—Intangible Assets, Net
The following table reflects the portion of the purchase price of office properties assigned to intangible assets, as discussed in “Note 3—Summary of Significant Accounting Policies” (in thousands):
October 5, 2016 | December 31, 2015 | ||||||
Lease in place value | $ | 73,064 | $ | 73,064 | |||
Accumulated amortization | (57,178 | ) | (50,787 | ) | |||
Above market lease value | 3,044 | 3,044 | |||||
Accumulated amortization | (1,478 | ) | (882 | ) | |||
$ | 17,452 | $ | 24,439 | ||||
Note 7—Mortgage Notes Payable, Net
A summary of mortgage notes payable at October 5, 2016 and December 31, 2015 is as follows (dollars in thousands):
Fixed | Maturity | October 5, | December 31, | |||||||||
Office Properties | Rate | Date | 2016 | 2015 | ||||||||
Phoenix Tower | 3.9% | 03/01/2023 | $ | 77,067 | $ | 78,555 | ||||||
CityWestPlace I and II | 6.2% | 07/06/2016 | — | 114,460 | ||||||||
CityWestPlace III and IV | 5.0% | 03/05/2020 | 88,978 | 90,334 | ||||||||
San Felipe Plaza | 4.8% | 12/01/2018 | 106,389 | 107,877 | ||||||||
Unamortized premium, net | 4,281 | 5,981 | ||||||||||
Unamortized debt issuance costs, net | (274 | ) | (306 | ) | ||||||||
Total mortgage notes payable, net | $ | 276,441 | $ | 396,901 | ||||||||
On April 6, 2016, Legacy Parkway paid in full the $114.0 million mortgage debt secured by CityWestPlace I and II and recognized a gain on extinguishment of debt of $154,000 during the period from January 1, 2016 to October 5, 2016. This paydown has been reflected as a capital contribution for Parkway Houston.
122
The aggregate annual maturities of mortgage notes payable, net at October 5, 2016 are as follows (dollars in thousands):
Weighted Average Interest Rate | Total Mortgage Maturities | Balloon Payments | Principal Amortization | ||||||||||
Schedule of Mortgage Maturities by Years: | |||||||||||||
2016 | 4.4% | $ | 1,088 | $ | — | $ | 1,088 | ||||||
2017 | 4.5% | 5,670 | — | 5,670 | |||||||||
2018 | 4.8% | 108,166 | 102,402 | 5,764 | |||||||||
2019 | 4.4% | 4,138 | — | 4,138 | |||||||||
2020 | 5.0% | 85,602 | 82,949 | 2,653 | |||||||||
Thereafter | 3.9% | 67,770 | 62,193 | 5,577 | |||||||||
Total principal maturities | 272,434 | $ | 247,544 | $ | 24,890 | ||||||||
Unamortized premium, net | N/A | 4,281 | |||||||||||
Unamortized debt issuance costs, net | N/A | (274 | ) | ||||||||||
Total mortgage notes payable, net | 4.6% | $ | 276,441 | ||||||||||
The fair value of mortgage notes payable was $278.3 million and $394.3 million as of October 5, 2016 and December 31, 2015, respectively. The fair value was determined using Level 2 inputs. Level 2 inputs are observable information for similar items in active or inactive markets and appropriately consider counterparty creditworthiness in the valuations.
Note 8—Accounts Payable and Other Liabilities
The following represents the composition of Accounts Payable and Other Liabilities as of October 5, 2016 and December 31, 2015 (in thousands):
October 5, | December 31, | ||||||
2016 | 2015 | ||||||
Accounts payable | $ | — | $ | 5,911 | |||
Accrued property taxes | 16,279 | 9,300 | |||||
Accrued tenant improvements | 3,862 | 4,346 | |||||
Accrued common area maintenance | 425 | 3,930 | |||||
Other accrued expenses | 1,813 | 2,878 | |||||
Prepaid rents | 6,226 | 5,319 | |||||
Security deposits | 1,250 | 1,052 | |||||
Deferred tax liability | 1,047 | 793 | |||||
Accrued payroll | 742 | 1,248 | |||||
Interest payable | 367 | 1,522 | |||||
$ | 32,011 | $ | 36,299 | ||||
Note 9—Commitments and Contingencies
Parkway Houston and its subsidiaries are, from time to time, parties to litigation arising from the ordinary course of business. Parkway Houston does not believe that any such litigation will materially affect its financial position or operations.
Parkway Houston has a 1% limited partnership interest in 2121 Market Street Associates LLC (“2121 Market Street”), which it acquired in the Thomas Properties Group, Inc. merger transactions. A mortgage loan secured by a first trust deed on 2121 Market Street is guaranteed by Parkway Houston up to a maximum amount of $14.0 million expiring in December 2022.
Note 10—Income Taxes
As a REIT, Legacy Parkway generally was not subject to corporate level U.S. federal income tax on taxable income it distributes currently to its stockholders. If Legacy Parkway fails to qualify as a REIT in any taxable year, it will be subject to U.S. federal income taxes at regular corporate rates (including any applicable alternative minimum tax) and may not be able to qualify as a REIT for four subsequent taxable years. Even if Legacy Parkway qualifies for taxation as a REIT, Legacy Parkway may be subject to certain state and local taxes on its income and property, and to U.S. federal income taxes on its undistributed taxable income.
123
The properties in the combined financial statements were owned directly or indirectly by a limited partnership or limited liability companies and as a result, the allocated share of income or loss for each period is included in the income tax returns of the partners.
Parkway Houston has certain entities as taxable REIT subsidiaries (“TRSs”), which are tax paying entities for income tax purposes and are taxed separately from Parkway Houston. TRSs may participate in non-real estate related activities and/or perform non-customary services for customers and are subject to U.S. federal and state income tax at regular corporate tax rates. The income tax benefit (expense) and related income tax assets and liabilities are based on actual and expected future income.
As of October 5, 2016 and December 31, 2015, Parkway Houston recorded net deferred tax assets of $3.6 million and $4.2 million, respectively, related to the TRSs. Deferred tax assets generally represent items that can be used as a tax deduction in Parkway Houston’s tax returns in future years for which Parkway Houston has already recorded a tax benefit in its combined statements of operations.
The significant components of the net deferred tax assets (liabilities) as of October 5, 2016 and December 31, 2015 are as follows (in thousands):
October 5, | December 31, | ||||||
2016 | 2015 | ||||||
Deferred tax assets | |||||||
Capitalizable transaction costs | $ | 619 | $ | 667 | |||
Contingent consideration | 1,109 | 1,198 | |||||
Management contracts | 1,876 | 2,022 | |||||
Condominium sales | 1,064 | 1,064 | |||||
Other | 15 | 48 | |||||
Total deferred tax assets | 4,683 | 4,999 | |||||
Deferred tax liabilities | |||||||
Cost method investment | (936 | ) | (670 | ) | |||
Other | (108 | ) | (123 | ) | |||
Total deferred tax liabilities | (1,044 | ) | (793 | ) | |||
Total deferred tax assets, net | $ | 3,639 | $ | 4,206 | |||
FASB ASC 740-10-30 “Accounting for Income Taxes” subsection “Initial Measurement,” requires that deferred tax assets be reduced by a valuation allowance if it is more likely than not that some or all of the deferred tax asset will not be realized. In determining whether the deferred tax asset is realizable, Parkway Houston considers all available positive and negative evidence, including future reversal of existing taxable temporary differences, carryback potential, tax-planning strategies and its ability to generate sufficient taxable income in future years. As of October 5, 2016, Parkway Houston concludes that a valuation allowance against its deferred tax asset is not necessary.
The components of income tax benefit (expense) for the period from January 1, 2016 to October 5, 2016 and the years ended December 31, 2015 and 2014 are as follows (in thousands):
Period From January 1 to October 5, | Years Ended December 31, | ||||||||||
2016 | 2015 | 2014 | |||||||||
Current: | |||||||||||
Federal | $ | (188 | ) | $ | (854 | ) | $ | (2,870 | ) | ||
State | (359 | ) | (418 | ) | (1,713 | ) | |||||
Total current | (547 | ) | (1,272 | ) | (4,583 | ) | |||||
Deferred: | |||||||||||
Federal | (514 | ) | 124 | 3,868 | |||||||
State | (52 | ) | (487 | ) | 895 | ||||||
Total deferred | (566 | ) | (363 | ) | 4,763 | ||||||
Total income tax (expense) benefit | $ | (1,113 | ) | $ | (1,635 | ) | $ | 180 | |||
124
The reconciliation of income tax expense computed at the U.S. statutory income tax rate and the income tax expense in the consolidated statements operations is shown below (dollars in thousands):
Period From January 1 to October 5, | Years Ended December 31, | |||||||||||||||||||
2016 | 2015 | 2014 | ||||||||||||||||||
Amount | Percentage | Amount | Percentage | Amount | Percentage | |||||||||||||||
Pre-tax income (loss) from continuing operations | $ | 431 | 34.0 | % | $ | 4,812 | 34.0 | % | $ | 7,848 | 34.0 | % | ||||||||
REIT earnings without income tax provision | (1,149 | ) | (90.6 | )% | (5,596 | ) | (39.5 | )% | (7,003 | ) | (30.3 | )% | ||||||||
Noncontrolling interest | — | — | % | (2 | ) | — | % | 50 | 0.2 | % | ||||||||||
State income tax, net of federal tax benefit | (401 | ) | (31.6 | )% | (510 | ) | (3.6 | )% | (778 | ) | (3.4 | )% | ||||||||
Effect of permanent differences | — | — | % | (6 | ) | — | % | (41 | ) | (0.2 | )% | |||||||||
Valuation allowance | — | — | % | — | — | % | 479 | 2.1 | % | |||||||||||
Other - Peachtree | — | — | % | — | — | % | (422 | ) | (1.8 | )% | ||||||||||
Other | 6 | 0.5 | % | (333 | ) | (2.4 | )% | 47 | 0.2 | % | ||||||||||
Total income tax (expense) benefit | $ | (1,113 | ) | (87.7 | )% | $ | (1,635 | ) | (11.5 | )% | $ | 180 | 0.8 | % | ||||||
FASB ASC 740-10-25, “Accounting for Income Taxes” subsection “Recognition,” clarifies the accounting for uncertainty in income taxes recognized in a company’s financial statements. The interpretation prescribes a recognition threshold and measurement attribute criteria for the financial statement recognition and measurement of a tax position taken or expected to be taken in a tax return. The interpretation also provides guidance on derecognition, classification, interest and penalties, accounting in interim periods, disclosure and transition. Parkway Houston’s policy is to recognize interest and penalties related to unrecognized tax benefits as components of income tax expense. As of October 5, 2016, there were no material unrecognized tax benefits and Parkway Houston does not anticipate a significant change to the total amount of unrecognized tax benefits within the next 12 months.
Note 11—Related Party Transactions
As discussed in Note 1 and Note 2, the accompanying combined financial statements present the operations of Parkway Houston as carved out from the financial statements of Legacy Parkway. Transactions between the entities have been eliminated in the combined presentation. The combined financial statements include payroll costs and benefits for on-site personnel employed by Legacy Parkway. These costs are reflected in property operating expenses on the combined statements of operations. A summary of these for each of the periods presented is as follows (in thousands):
Period From January 1 to October 5, | Years Ended December 31, | ||||||||||
2016 | 2015 | 2014 | |||||||||
Charged to property operating expense: | |||||||||||
Direct payroll charges | $ | 2,454 | $ | 2,747 | $ | 2,823 | |||||
Management fees | 2,173 | 2,298 | 3,087 | ||||||||
Other allocated expenses | 1,149 | 1,637 | 2,393 | ||||||||
Total | $ | 5,776 | $ | 6,682 | $ | 8,303 | |||||
Lease commissions and development fees paid to Legacy Parkway’s personnel and other leasing costs incurred by Parkway Houston are capitalized and amortized over the respective lease term. For the period from January 1, 2016 to October 5, 2016 and the years ended December 31, 2015 and 2014, Parkway Houston capitalized $403,000, $1.6 million and $982,000, respectively, in commissions and other leasing costs to the properties.
The expenses charged to Parkway Houston for these services are not necessarily indicative of the expenses that would have been incurred had Parkway Houston been a separate, independent entity.
On May 18, 2011, Legacy Parkway entered into a contribution agreement pursuant to which Eola contributed its property management company (the “Management Company”) to Legacy Parkway. In connection with the Eola contribution of its Management Company to Legacy Parkway, a subsidiary of Legacy Parkway made a $3.5 million preferred equity investment in an entity 21% owned by Mr. James R. Heistand, and which is included in receivables and other assets on Parkway Houston’s
125
combined balance sheets. This investment provides that Legacy Parkway will be paid a preferred equity return equal to 7% per annum of the preferred equity outstanding. For the period from January 1, 2016 to October 5, 2016 and the years ended December 31, 2015 and 2014, Legacy Parkway received preferred equity distributions on this investment in the aggregate amounts of approximately $187,043, $245,000 and $265,000, respectively. This preferred equity investment was approved by the board of directors of Legacy Parkway, and is recorded as a cost method investment in receivables and other assets on the combined balance sheets.
Certain of Legacy Parkway’s executive officers own interests in properties that are managed and leased by the Management Company. Parkway Houston recorded in management company income $240,500, $398,000 and $3.5 million in management fees and $586,000, $869,000 and $8.8 million in reimbursements related to the management and leasing of these assets for the period from January 1, 2016 to October 5, 2016 and the years ended December 31, 2015 and 2014, respectively.
On September 28, 2016, Eola entered into an agreement and side letter with affiliates of TPG VI Pantera Holdings, L.P. (“TPG Pantera”) and TPG VI Management, LLC (“TPG Management,” and, together with TPG Pantera, the “TPG Parties”) pursuant to which Eola performs property management, accounting and finance services for such TPG Party affiliates at certain assets owned by such TPG Party affiliates (collectively, the “TPG Owner”). The agreement has a one-year term. Pursuant to the agreement and side letter, Eola will receive a monthly management fee equal to approximately 2.5% of the aggregate gross revenues received from the operation of the properties and is reimbursed for certain personnel expenses. Eola has not recorded any management fees or reimbursements related to this agreement for the periods presented.
Note 12—Subsequent Events
The Merger was consummated on October 6, 2016, and the Spin-Off was completed on October 7, 2016.
126
Report of Independent Registered Public Accounting Firm
Shareholders and Board of Directors
Parkway, Inc.
Orlando, Florida
We have audited the accompanying combined balance sheets of Cousins Houston (the “Company”) as of October 6, 2016 and December 31, 2015, and the related combined statements of operations, equity, and cash flows for the period from January 1, 2016 to October 6, 2016 and the years ended December 31, 2015 and 2014. These financial statements are the responsibility of the Company’s management. Our responsibility is to express an opinion on these financial statements based on our audits.
We conducted our audits in accordance with the standards of the Public Company Accounting Oversight Board (United States). Those standards require that we plan and perform the audit to obtain reasonable assurance about whether the financial statements are free of material misstatement. The Company is not required to have, nor were we engaged to perform, an audit of its internal control over financial reporting. Our audits included consideration of internal control over financial reporting as a basis for designing audit procedures that are appropriate in the circumstances, but not for the purpose of expressing an opinion on the effectiveness of the Company’s internal control over financial reporting. Accordingly, we express no such opinion. An audit also includes examining, on a test basis, evidence supporting the amounts and disclosures in the financial statements, assessing the accounting principles used and significant estimates made by management, as well as evaluating the overall financial statement presentation. We believe that our audits provide a reasonable basis for our opinion.
In our opinion, such combined financial statements present fairly, in all material respects, the financial position of Cousins Houston as of October 6, 2016 and December 31, 2015, and the results of its operations and its cash flows for the period from January 1, 2016 to October 6, 2016 and the years ended December 31, 2015 and 2014, in conformity with accounting principles generally accepted in the United States of America.
As discussed in Note 1 to the combined financial statements, the combined financial statements of Cousins Houston include allocations of certain operating expenses from Cousins Properties Incorporated. These costs may not be reflective of the actual costs which would have been incurred had Cousins Houston operated as an independent, stand-alone entity separate from Cousins Properties Incorporated.
/s/ DELOITTE & TOUCHE LLP
Atlanta, Georgia
March 15, 2017
127
COUSINS HOUSTON
COMBINED BALANCE SHEETS
(In thousands)
October 6, 2016 | December 31, 2015 | ||||||
ASSETS | |||||||
Operating Properties, net of accumulated depreciation of $148,523 and $111,949 in 2016 and 2015 respectively | $ | 1,081,712 | $ | 1,086,451 | |||
Cash and cash equivalents | — | 109 | |||||
Deferred rents receivable | 28,211 | 22,798 | |||||
Accounts receivable | 5,693 | 4,549 | |||||
Intangible assets, net of accumulated amortization of $72,909 and $61,567 in 2016 and 2015, respectively | 62,512 | 72,166 | |||||
Other assets | 2,093 | 2,163 | |||||
TOTAL ASSETS | $ | 1,180,221 | $ | 1,188,236 | |||
LIABILITIES AND EQUITY | |||||||
LIABILITIES | |||||||
Note payable | $ | 178,180 | $ | 180,937 | |||
Accounts payable and other liabilities | 43,635 | 47,126 | |||||
Intangible liabilities, net of accumulated amortization of $24,797 and $20,107 in 2016 and 2015, respectively | 36,399 | 41,089 | |||||
Other liabilities | 2,467 | 2,212 | |||||
Total liabilities | 260,681 | 271,364 | |||||
Commitments and contingencies (Note 6) | |||||||
EQUITY | 919,540 | 916,872 | |||||
TOTAL LIABILITIES AND EQUITY | $ | 1,180,221 | $ | 1,188,236 | |||
128
COUSINS HOUSTON
COMBINED STATEMENTS OF OPERATIONS
(in thousands)
Period from January 1, 2016 to October 6, | Years Ended December 31, | ||||||||||
2016 | 2015 | 2014 | |||||||||
Revenues: | |||||||||||
Rental property revenues | $ | 137,374 | $ | 177,890 | $ | 184,536 | |||||
Other | 288 | — | 31 | ||||||||
Total revenues | 137,662 | 177,890 | 184,567 | ||||||||
Costs and Expenses: | |||||||||||
Rental property operating expenses | 58,704 | 74,162 | 79,625 | ||||||||
General and administrative expenses | 6,787 | 6,328 | 7,347 | ||||||||
Depreciation and amortization | 47,345 | 63,791 | 77,760 | ||||||||
Interest expense | 6,021 | 7,988 | 8,127 | ||||||||
Transaction costs | 6,349 | — | — | ||||||||
125,206 | 152,269 | 172,859 | |||||||||
Net Income | $ | 12,456 | $ | 25,621 | $ | 11,708 | |||||
See notes to combined financial statements.
129
COUSINS HOUSTON
COMBINED STATEMENTS OF CHANGES IN EQUITY
For the Period From January 1, 2016 to October 6, 2016 and the Years Ended December 31, 2015 and 2014
(in thousands)
Balance at December 31, 2013 | $ | 936,947 | |
Distributions to Cousins, net | (38,858 | ) | |
Net income | 11,708 | ||
Balance at December 31, 2014 | 909,797 | ||
Distributions to Cousins, net | (18,546 | ) | |
Net income | 25,621 | ||
Balance at December 31, 2015 | 916,872 | ||
Distributions to Cousins, net | (9,788 | ) | |
Net income | 12,456 | ||
Balance at October 6, 2016 | $ | 919,540 | |
See notes to combined financial statements.
130
COUSINS HOUSTON
COMBINED STATEMENTS OF CASH FLOWS
(in thousands)
Period from January 1 to October 6, | Years Ended December 31, | ||||||||||
2016 | 2015 | 2014 | |||||||||
Net income | $ | 12,456 | $ | 25,621 | $ | 11,708 | |||||
Adjustments to reconcile net income to net cash provided by operating activities: | |||||||||||
Depreciation and amortization | 47,345 | 63,791 | 77,760 | ||||||||
Amortization of loan closing costs | 136 | 179 | 177 | ||||||||
Effect of certain non-cash adjustments to rental revenues | (9,479 | ) | (14,626 | ) | (17,895 | ) | |||||
Bad debt expense (recovery) | 112 | (321 | ) | 464 | |||||||
Changes in operating assets and liabilities: | |||||||||||
Accounts receivable and other assets, net | (2,926 | ) | (1,224 | ) | 482 | ||||||
Operating liabilities | (4,977 | ) | 2,975 | 7,524 | |||||||
Net cash provided by operating activities | 42,667 | 76,395 | 80,220 | ||||||||
CASH FLOWS FROM INVESTING ACTIVITIES | |||||||||||
Property improvements and tenant asset expenditures | (30,095 | ) | (55,085 | ) | (37,478 | ) | |||||
Net cash used in investing activities | (30,095 | ) | (55,085 | ) | (37,478 | ) | |||||
CASH FLOWS FROM FINANCING ACTIVITIES | |||||||||||
Distributions to Cousins’ investment, net | (9,788 | ) | (18,546 | ) | (38,858 | ) | |||||
Repayment of note payable | (2,893 | ) | (3,339 | ) | (3,200 | ) | |||||
Net cash used in financing activities | (12,681 | ) | (21,885 | ) | (42,058 | ) | |||||
NET INCREASE (DECREASE) IN CASH AND CASH EQUIVALENTS | (109 | ) | (575 | ) | 684 | ||||||
CASH AND CASH EQUIVALENTS AT BEGINNING OF PERIOD | 109 | 684 | — | ||||||||
CASH AND CASH EQUIVALENTS AT END OF PERIOD | $ | — | $ | 109 | $ | 684 | |||||
SUPPLEMENTAL CASH FLOW INFORMATION: | |||||||||||
Cash paid for interest | $ | 6,407 | $ | 7,821 | $ | 7,960 | |||||
Change in accrued property and tenant asset expenditures | (1,998 | ) | (214 | ) | (731 | ) | |||||
See notes to combined financial statements.
131
COUSINS HOUSTON
NOTES TO COMBINED FINANCIAL STATEMENTS
October 6, 2016
Note 1—Organization and Basis of Presentation
Merger and Spin-Off
On October 6, 2016, Cousins Properties Incorporated (“Cousins”) and Parkway Properties, Inc. (“Parkway”) completed a stock-for-stock merger (the “Merger”) followed on October 7, 2016 by a spin-off (the “Spin-Off”) of the combined Houston-based assets of both companies (the “Houston Business”) into a new publicly-traded real estate investment trust (“REIT”), Parkway, Inc. (“New Parkway”).
Basis of Presentation
The combined financial statements included herein represent the combined accounts and combined operations of the Houston Business owned by Cousins (“Cousins Houston” or the “Company”). The assets and liabilities in these combined financial statements represent historical carrying amounts of the following properties:
Acquisition Date | Number of Office Buildings | Total Square Feet | |||||
Post Oak Central | February 7, 2013 | 3 | 1,280,000 | ||||
Greenway Plaza | September 9, 2013 | 10 | 4,348,000 | ||||
13 | 5,628,000 | ||||||
The Company is a predecessor, as defined in applicable rules and regulations of the Securities and Exchange Commission, to the Houston Business and commenced operations on the date of the Spin-off.
The Company presents its financial statements in accordance with accounting principles generally accepted in the United States (“GAAP”) as outlined in the Financial Accounting Standard Board’s Accounting Standards Codification (the “Codification” or “ASC”). The Codification is the single source of authoritative accounting principles applied by nongovernmental entities in the preparation of financial statements in conformity with GAAP. Intercompany transactions and balances have been eliminated.
For the periods presented, there were no items of other comprehensive income. Therefore, no presentation of comprehensive income is required.
Allocated Costs
The historical financial results for Cousins Houston include certain allocated corporate costs which Cousins Houston believes are reasonable. These costs were incurred by Cousins and estimated to be applicable to Cousins Houston based on proportionate leasable square footage. Such costs do not necessarily reflect what the actual costs would have been if Cousins Houston were operating as a separate stand-alone public company. Additionally, the historical results for Cousins Houston include transaction costs that were incurred by Cousins related to the Spin-Off. These costs are discussed further in Note 3, “Related Party Transactions.”
Note 2—Significant Accounting Policies
Real Estate Assets
Cost Capitalization
Cousins Houston capitalizes costs related to property and tenant improvements, including allocated costs of Cousins’ personnel working directly on projects. Cousins Houston capitalizes direct leasing costs related to leases that are probable of being executed. These costs include commissions paid to outside brokers, legal costs incurred to negotiate and document a lease agreement, and costs incurred by personnel of Cousins that are based on time spent on successful leases. Cousins Houston allocates these costs to individual tenant leases and amortizes them over the related lease term.
132
Impairment
For real estate assets that are considered to be held for sale according to accounting guidance or are distributed to stockholders in a spin-off, Cousins Houston records impairment losses if the fair value of the asset net of estimated selling costs is less than the carrying amount. For those long-lived assets that are held and used according to accounting guidance, management reviews each asset for the existence of any indicators of impairment. If indicators of impairment are present, Cousins Houston calculates the expected undiscounted future cash flows to be derived from such assets. If the undiscounted cash flows are less than the carrying amount of the asset, Cousins Houston reduces the asset to its fair value.
Acquisition of Operating Properties
Cousins Houston records the acquired tangible and intangible assets and assumed liabilities of operating property acquisitions at fair value at the acquisition date. The acquired assets and assumed liabilities for an operating property acquisition generally include but are not limited to: land, buildings and improvements, and identified tangible and intangible assets and liabilities associated with in-place leases, including leasing costs, value of above-market and below-market tenant leases, value of above-market and below-market ground leases, acquired in-place lease values, and tenant relationships, if any.
The fair value of land is derived from comparable sales of land within the same submarket and/or region. The fair value of buildings and improvements, tenant improvements, and leasing costs are based upon current market replacement costs and other relevant market rate information.
The fair value of the above-market or below-market component of an acquired in-place lease is based upon the present value (calculated using a market discount rate) of the difference between (i) the contractual rents to be paid pursuant to the lease over its remaining term and (ii) management’s estimate of the rents that would be paid using fair market rental rates and rent escalations at the date of acquisition over the remaining term of the lease. The amounts recorded for above-market and below-market leases are included in intangible assets and intangible liabilities, respectively, and are amortized on a straight-line basis into rental property operating revenues over the remaining terms of the applicable leases.
The fair value of acquired in-place leases is derived based on management’s assessment of lost revenue and costs incurred for the period required to lease the “assumed vacant” property to the occupancy level when purchased. The amount recorded for acquired in-place leases is included in intangible assets and amortized as an increase to depreciation and amortization expense over the remaining term of the applicable leases.
Depreciation and Amortization
Real estate assets are stated at depreciated cost less impairment losses, if any. Buildings are depreciated over their estimated useful lives, which range from 30 to 42 years. The life of a particular building depends upon a number of factors including whether the building was developed or acquired and the condition of the building upon acquisition. Furniture, fixtures and equipment are depreciated over their estimated useful lives of five years. Tenant improvements, leasing costs and leasehold improvements are amortized over the term of the applicable leases or the estimated useful life of the assets, whichever is shorter. Cousins Houston accelerates the depreciation of tenant assets if it estimates that the lease term will end prior to the termination date. This acceleration may occur if a tenant files for bankruptcy, vacates its premises or defaults in another manner on its lease. Deferred expenses are amortized over the period of estimated benefit. Cousins Houston uses the straight-line method for all depreciation and amortization.
Revenue Recognition
Cousins Houston recognizes contractual revenues from leases on a straight-line basis over the term of the respective lease. In addition, leases typically provide for reimbursement of the tenants’ share of real estate taxes, insurance, and other operating expenses to Cousins Houston. Operating expense reimbursements are recognized as the related expenses are incurred. For the period from January 1, 2016 to October 6, 2016, and the years ended December 31, 2015 and 2014, Cousins Houston recognized $47.9 million, $59.1 million and $59.2 million, respectively, in revenues from tenants related to reimbursement of operating expenses.
Cousins Houston makes valuation adjustments to all tenant-related accounts receivable based upon its estimate of the likelihood of collectability. The amount of any valuation adjustment is based on the tenant’s credit and business risk, history of payment, and other factors considered by management.
133
Income Taxes
Through October 6, 2016, Cousins Houston’s properties were owned by Cousins, which has elected to be taxed as a REIT under the Internal Revenue Code of 1986, as amended (the “Code”). As a REIT, Cousins is not subject to federal income tax provided it distributes annually its adjusted taxable income, as defined in the Code, to stockholders and meets certain other organizational and operating requirements. Accordingly, the combined financial statements of Cousins Houston do not include a provision for federal income tax.
Cash and Cash Equivalents
Cash and cash equivalents include cash and highly-liquid money market instruments with maturities of three months or less.
Segment Disclosure
Cousins Houston is in the business of the ownership, development and management of office real estate. Cousins Houston has aggregated its office operations into one reportable segment. This segment is the aggregation of the aforementioned Cousins Houston office properties as reported to the Chief Operating Decision Maker and is aggregated due to the properties having similar economic and geographic characteristics.
Fair Value Measurements
Level 1 fair value inputs are quoted prices for identical items in active, liquid and visible markets such as stock exchanges. Level 2 fair value inputs are observable information for similar items in active or inactive markets and appropriately consider counterparty creditworthiness in the valuations. Level 3 fair value inputs reflect Cousins Houston’s best estimate of inputs and assumptions market participants would use in pricing an asset or liability at the measurement date. The inputs are unobservable in the market and significant to the valuation estimate. Cousins Houston has no investments for which fair value is measured on a recurring basis using Level 3 inputs. Note 5 includes fair values of debt measured using Level 2 inputs.
Use of Estimates
The preparation of financial statements in conformity with GAAP requires management to make estimates and assumptions that affect the reported amounts of assets and liabilities and disclosure of contingent assets and liabilities at the date of the financial statements and the reported amounts of revenues and expenses during the reporting period. Actual results could differ from those estimates.
Recent Accounting Pronouncements
Cousins Houston's operations ceased on October 6, 2016, and none of the recent accounting pronouncements impacted Cousins Houston's financial statements and notes. Therefore, this section is not applicable.
Note 3—Related Party Transactions
The combined financial statements include direct payroll costs and benefits for on-site personnel employed by Cousins. These costs are reflected in rental property operating expenses on the Combined Statements of Operations. As described in Note 1, also included are costs for certain functions and services performed by Cousins including, but not limited to, corporate-level salaries and other related costs, stock compensation, and other general and administrative costs. These costs were allocated to Cousins Houston based on proportionate leasable square footage which management believes is an appropriate estimate of usage. These costs are reflected as general and administrative expenses on the Combined Statements of Operations. As described in Note 1, also included are transaction costs that were incurred by Cousins related to the Spin-Off. The amounts included are based on the estimated direct costs incurred by Cousins. The expenses allocated to Cousins Houston for these services are not necessarily indicative of the expenses that would have been incurred had Cousins Houston been a separate, independent entity that had otherwise managed these functions. A summary of these costs for each of the periods presented is as follows (in thousands):
134
For the Period Ended October 6, | For the Years Ended December 31, | ||||||||||
2016 | 2015 | 2014 | |||||||||
Charged to property operating expense: | |||||||||||
Direct payroll charges | $ | 5,308 | $ | 6,826 | $ | 6,678 | |||||
Other allocated expenses | 1,501 | 2,043 | 2,178 | ||||||||
Charged to general and administrative expense: | |||||||||||
Office rental expense | 271 | 337 | 329 | ||||||||
Payroll and other expenses | 6,516 | 5,991 | 7,018 | ||||||||
Transaction costs | 6,349 | — | — | ||||||||
Leasing commissions paid to Cousins’ personnel and other leasing costs incurred by Cousins are capitalized and amortized over the respective lease term. For the period from January 1, 2016 to October 6, 2016, and the years ended December 31, 2015 and 2014, the Company incurred and capitalized $1.3 million, $3.8 million, and $2.5 million, respectively, in commissions and other leasing costs.
Note 4—Intangible Assets
Intangible assets on the balance sheets at October 6, 2016 and December 31, 2015 included the following (in thousands):
October 6, 2016 | December 31, 2015 | ||||||
In-place leases, net of accumulated amortization of $69,434 and $58,715 in 2016 and 2015, respectively | $ | 58,580 | $ | 69,300 | |||
Above-market leases, net of accumulated amortization of $3,475 and $2,852 in 2016 and 2015, respectively | 2,244 | 2,866 | |||||
Goodwill | 1,688 | — | |||||
$ | 62,512 | $ | 72,166 | ||||
Net amortization expense related to intangible assets and liabilities was $6.7 million, $11.9 million, and $21.6 million, for the period from January 1 to October 6, 2016, and the years ended December 31, 2015 and 2014, respectively. Over the next five years and thereafter, aggregate amortization of these intangible assets and liabilities is anticipated to be as follows (in thousands):
Below Market Rents | Above Market Rents | In-Place Leases | Total | ||||||||||||
2016 | $ | (1,398 | ) | $ | 104 | $ | 2,928 | $ | 1,634 | ||||||
2017 | (5,808 | ) | 407 | 11,471 | 6,070 | ||||||||||
2018 | (5,471 | ) | 360 | 10,093 | 4,982 | ||||||||||
2019 | (5,202 | ) | 303 | 8,615 | 3,716 | ||||||||||
2020 | (3,470 | ) | 251 | 5,884 | 2,665 | ||||||||||
Thereafter | (15,050 | ) | 819 | 19,589 | 5,358 | ||||||||||
$ | (36,399 | ) | $ | 2,244 | $ | 58,580 | $ | 24,425 | |||||||
Weighted average remaining lease term | 12.0 years | 12.1 years | 10.2 years | 11.0 years | |||||||||||
135
Note 5—Note Payable
In September 2013, the Company entered into a $188.8 million non-recourse mortgage note payable secured by Post Oak Central. The note bears interest at 4.26%, and the maturity date is October 1, 2020. In connection with this note payable, the Company incurred $1.2 million in loan costs. These costs, net of accumulated amortization of $553,000 and $416,000 in 2016 and 2015, respectively, are reflected as a reduction of the loan balance on the accompanying balance sheets. Future principal payments due on the note at October 6, 2016 are as follows (in thousands):
Amount | |||
2016 | $ | 591 | |
2017 | 3,636 | ||
2018 | 3,794 | ||
2019 | 3,959 | ||
2020 | 166,896 | ||
178,876 | |||
Less unamortized debt issuance costs | (696 | ) | |
Balance at October 6, 2016 | $ | 178,180 | |
Fair value of debt is calculated by discounting the debt’s remaining contractual cash flows at estimated rates at which similar loans could have been obtained. The estimate of the current market rate is intended to replicate debt of similar maturity and loan-to-value relationship. These fair value calculations are considered to be Level 2 under the guidelines set forth in ASC 820, as Cousins Houston utilizes market rates for similar type loans from third party brokers. At October 6, 2016 and December 31, 2015, the fair values of this financial instrument and the related discount rate assumptions are summarized as follows ($ in thousands):
October 6, 2016 | December 31, 2015 | ||||||
Carrying value | $ | 178,180 | $ | 180,937 | |||
Fair value | $ | 185,373 | $ | 186,449 | |||
Discount rate assumed in calculating fair value | 3.25 | % | 3.65 | % | |||
Note 6—Commitments And Contingencies
Commitments
The Company had a total of $63.1 million in future obligations under leases to fund tenant improvements at October 6, 2016. Amounts due under these lease commitments are as follows (in thousands):
Amount | |||
2016 | $ | 29,779 | |
2017 | 8,504 | ||
2018 | 8,504 | ||
2019 | 8,174 | ||
2020 | 8,174 | ||
$ | 63,135 | ||
Litigation
The Company is subject to various legal proceedings, claims and administrative proceedings arising in the ordinary course of business, some of which are expected to be covered by liability insurance. Management makes assumptions and estimates concerning the likelihood and amount of any potential loss relating to these matters using the latest information available. The Company records a liability for litigation if an unfavorable outcome is probable and the amount of loss or range of loss can be reasonably estimated. If an unfavorable outcome is probable and a reasonable estimate of the loss is a range, the Company accrues the best estimate within the range. If no amount within the range is a better estimate than any other amount, the Company accrues the minimum amount within the range. If an unfavorable outcome is probable but the amount of the loss cannot be reasonably
136
estimated, the Company discloses the nature of the litigation and indicates that an estimate of the loss or range of loss cannot be made. If an unfavorable outcome is reasonably possible and the estimated loss is material, the Company discloses the nature and estimate of the possible loss of the litigation. The Company does not disclose information with respect to litigation where an unfavorable outcome is considered to be remote or where the estimated loss would not be material. Based on current expectations, such matters, both individually and in the aggregate, are not expected to have a material adverse effect on the liquidity, results of operations, business or financial condition of the Company.
Note 7—Future Minimum Rents
The Company’s leases typically contain escalation provisions and provisions requiring tenants to pay its pro rata share of operating expenses. The leases typically include renewal options and are classified and accounted for as operating leases.
At October 6, 2016, future minimum rents, excluding tenants' pro rata share of operating expenses, to be received under existing non-cancellable leases are as follows (in thousands):
Amount | |||
2016 | $ | 21,945 | |
2017 | 94,533 | ||
2018 | 97,589 | ||
2019 | 91,966 | ||
2020 | 71,500 | ||
Thereafter | 318,438 | ||
$ | 695,971 | ||
137
Item 9. Changes in and Disagreements with Accountants on Accounting and Financial Disclosure.
None.
Item 9A. Controls and Procedures.
Disclosure Controls and Procedures
Our management, with the participation of the Company’s Chief Executive Officer and Chief Financial Officer, has evaluated the effectiveness of the Company’s disclosure controls and procedures as of December 31, 2016. Based on that evaluation, the Chief Executive Officer and Chief Financial Officer concluded that the Company’s disclosure controls and procedures were effective as of December 31, 2016 to ensure that information required to be disclosed by the Company in reports that it files or submits under the Exchange Act is accumulated and communicated to the Company’s management (including the Chief Executive Officer and Chief Financial Officer) to allow timely decisions regarding required disclosure, and is recorded, processed, summarized and reported within the time periods specified in SEC rules and forms.
Internal Control over Financial Reporting
The SEC, as required by Section 404 of the Sarbanes-Oxley Act, adopted rules that generally require every company that files reports with the SEC to evaluate its effectiveness of internal controls over financial reporting. Our management is not required to evaluate the effectiveness of our internal controls over financial reporting until the filing of our Annual Report on Form 10-K for the year ending December 31, 2017 (the “2017 Form 10-K”), due to a transition period established by SEC rules applicable to new public companies. As a result, this Annual Report on Form 10-K does not address whether there have been any changes in internal control over financial reporting. We intend to include an evaluation of our internal controls over financial reporting in our 2017 Form 10-K.
Item 9B. Other Information.
On March 14, 2017, the Operating Partnership and Parkway LP entered into a Debt Guaranty Agreement (the “Debt Guaranty Agreement”) with Mr. James A. Thomas, the chairman of our board of directors, and certain affiliates of Mr. Thomas (the “Thomas Investors”). The Debt Guaranty Agreement is intended to satisfy the obligation of the parties to enter into such an agreement pursuant to the previously disclosed Thomas Letter Agreement, which was entered into in connection with the Merger Agreement.
The Debt Guaranty Agreement implements those provisions of the Thomas Letter Agreement regarding debt guarantee opportunities made available to Mr. Thomas and the Thomas Investors. Consistent with the Thomas Letter Agreement, pursuant to the Debt Guaranty Agreement, the Operating Partnership made available to Mr. Thomas and the Thomas Investors certain debt guarantee opportunities corresponding to specified mortgage loans of the Company, of which Mr. Thomas and the Thomas Investors entered into contribution agreements with respect to $109 million (representing an additional $70 million over their existing $39 million guarantee). In the event these specified mortgage loans become unavailable for guarantee (whether because we repay them, sell the corresponding asset, or otherwise), we are required to use commercially reasonable efforts to provide a replacement guarantee or contribution opportunity to the extent of our remaining qualifying debt (but not in excess of $109 million). The Company has agreed to maintain any such debt for the remainder of the five-year period following October 2016, subject to early termination in the event of a going private transaction, sale of all or substantially all of our assets or certain similar transactions.
The foregoing description of the Debt Guaranty Agreement does not purport to be complete, and is qualified in its entirety by reference to the full text of the Debt Guaranty Agreement, a copy of which is attached hereto as Exhibit 10.48 and incorporated herein by reference.
138
PART III
Item 10. Directors, Executive Officers and Corporate Governance.
The information regarding directors is incorporated herein by reference from the section entitled “Corporate Governance and Board Matters—Director Qualifications and Biographical Information” in the Company’s definitive Proxy Statement (“2017 Proxy Statement”) to be filed pursuant to Regulation 14A of the Exchange Act for the Company’s Annual Meeting of Stockholders to be held on May 23, 2017. The 2017 Proxy Statement will be filed within 120 days after the end of the Company’s fiscal year ended December 31, 2016.
The information regarding executive officers is incorporated herein by reference from the section entitled “Executive Officers” in the Company’s 2017 Proxy Statement.
The information regarding compliance with Section 16(a) of the Exchange Act is incorporated herein by reference from the section entitled “Ownership of Company Stock—Section 16(a) Beneficial Ownership Reporting Compliance” in the Company’s 2017 Proxy Statement.
Information regarding the Company’s code of business conduct and ethics found in the subsection captioned “Available Information” in Item 1 of Part I hereof is incorporated herein by reference into this Item 10.
The information regarding the Company’s audit committee, its members and the audit committee financial experts is incorporated by reference herein from the second paragraph in the section entitled “Corporate Governance and Board Matters—Board Committees and Meeting Data” in the Company’s 2017 Proxy Statement.
Item 11. Executive Compensation.
The information included under the following captions in the Company’s 2017 Proxy Statement is incorporated herein by reference: “Compensation of Executive Officers,” “Corporate Governance and Board Matters—Compensation of Directors” and “Corporate Governance and Board Matters—Compensation Committee Interlocks and Insider Participation.”
Item 12. Security Ownership of Certain Beneficial Owners and Management and Related Stockholder Matters.
Information regarding securities authorized for issuance under equity compensation plans is incorporated herein by reference from the section entitled “Compensation of Executive Officers—Equity Compensation Plan Information” in the Company’s 2017 Proxy Statement.
Information regarding security ownership of certain beneficial owners and management is incorporated herein by reference from the sections entitled “Ownership of Company Stock—Security Ownership of Certain Beneficial Owners” and “Ownership of Company Stock—Security Ownership of Management and Directors” in the Company’s 2017 Proxy Statement.
Item 13. Certain Relationships and Related Transactions, and Director Independence.
The information regarding transactions with related persons and director independence is incorporated herein by reference from the sections entitled “Corporate Governance and Board Matters—Independence” and “Certain Transactions and Relationships” in the Company’s 2017 Proxy Statement.
Item 14. Principal Accountant Fees and Services.
The information regarding principal auditor fees and services and the audit committee’s pre-approval policies are incorporated herein by reference from the section entitled “Audit Committee Matters—Policy for Pre-Approval of Audit and Permitted Non Audit Services” and “Audit Committee Matters—Auditor Fees and Services” in the Company’s 2017 Proxy Statement.
139
PART IV
Item 15. Exhibits and Financial Statement Schedules.
(a)(1) and (2) | Consolidated Financial Statements and Schedules |
Parkway, Inc. | |
Parkway Houston | |
Cousins Houston | |
All other schedules for which provision is made in the applicable accounting regulations of the Securities and Exchange Commission are not required under the related instructions or are inapplicable and therefore have been omitted. | |
(3) | Form 10-K Exhibits required by Item 601 of Regulation S-K: |
140
Exhibit Number | Exhibit Description |
2.1 | Separation, Distribution and Transition Services Agreement, dated October 5, 2016, by and among Cousins Properties Incorporated, Cousins Properties LP, Clinic Sub Inc., Parkway Properties, Inc., Parkway Properties LP, Parkway Properties General Partners, Inc., Parkway, Inc. and Parkway Operating Partnership LP (incorporated by reference to Exhibit 2.1 to the Current Report on Form 8-K filed by the Registrant with the Securities and Exchange Commission on October 6, 2016). |
2.2 | Tax Matters Agreement, dated October 5, 2016, by and among Cousins Properties Incorporated, Cousins Properties LP, Clinic Sub Inc., Parkway Properties, Inc., Parkway Properties LP, Parkway Properties General Partners, Inc., Parkway, Inc. and Parkway Operating Partnership LP (incorporated by reference to Exhibit 2.2 to the Current Report on Form 8-K filed by the Registrant with the Securities and Exchange Commission on October 6, 2016). |
2.3 | Employee Matters Agreement, dated October 5, 2016, by and among Cousins Properties Incorporated, Cousins Properties LP, Clinic Sub Inc., Parkway Properties, Inc., Parkway Properties LP, Parkway Properties General Partners, Inc., Parkway, Inc. and Parkway Operating Partnership LP (incorporated by reference to Exhibit 2.3 to the Current Report on Form 8-K filed by the Registrant with the Securities and Exchange Commission on October 6, 2016). |
2.4 | Omnibus Contribution and Partial Interest Assignment Agreement, dated February 17, 2017, by and among Parkway Operating Partnership LP, certain subsidiaries thereof, CPPIB US RE-A, Inc., and Permian Investor LP (incorporated by reference to Exhibit 2.1 to the Current Report on Form 8-K filed by the Registrant with the Securities and Exchange Commission on February 22, 2017). |
3.1 | Articles of Amendment and Restatement of Parkway, Inc. (incorporated by reference to Exhibit 3.1 to the Current Report on Form 8-K filed by the Registrant with the Securities and Exchange Commission on October 5, 2016). |
3.2 | Amended and Restated Bylaws of Parkway, Inc. (incorporated by reference to Exhibit 3.2 to the Current Report on Form 8-K filed by the Registrant with the Securities and Exchange Commission on October 5, 2016). |
4.1 | Specimen Stock Certificate of Parkway, Inc. (incorporated by reference to Exhibit 4.1 to Amendment No. 3 on Form 10 filed by the Registrant with the Securities and Exchange Commission on September 19, 2016). |
10.1 | Amended and Restated Agreement of Limited Partnership of Parkway Operating Partnership LP, dated October 6, 2016 (incorporated by reference to Exhibit 10.1 to the Current Report on Form 8-K filed by the Registrant with the Securities and Exchange Commission on October 12, 2016). |
10.2 | Second Amended and Restated Agreement of Limited Partnership of Parkway Properties, LP, dated as of February 27, 2013 (incorporated by reference to Exhibit 10.1 to Parkway Properties, Inc.’s Form 8-K filed February 27, 2013). |
10.3 | Amendment No. 1 to the Second Amended and Restated Agreement of Limited Partnership of Parkway Properties LP, dated as of December 19, 2013, between Parkway Properties, Inc. and Parkway Properties General Partners Inc. (incorporated by reference to Exhibit 10.1 to Parkway Properties, Inc.’s Form 8-K filed December 24, 2013). |
10.4 | Amendment No. 2 to the Second Amended and Restated Agreement of Limited Partnership of Parkway Properties LP, dated as of December 31, 2014, between Parkway Properties, Inc. and Parkway Properties General Partners Inc. (incorporated by reference to Exhibit 10.20 to Parkway Properties, Inc.’s Form 10-K for the year ended December 31, 2014). |
10.5 | Amendment No. 3 to the Second Amended and Restated Agreement of Limited Partnership of Parkway Properties LP, dated as of December 31, 2015, between Parkway Properties, Inc. and Parkway Properties General Partners Inc. (incorporated by reference to Exhibit 10.19 to Parkway Properties, Inc.’s Form 10-K for the year ended December 31, 2015). |
10.6 | Amendment No. 4 to the Second Amended and Restated Agreement of Limited Partnership of Parkway Properties LP, as amended, dated October 6, 2016, between Parkway, Inc. and Parkway Properties General Partners, Inc. (incorporated by reference to Exhibit 10.2 to the Current Report on Form 8-K filed by the Registrant with the Securities and Exchange Commission on October 12, 2016). |
10.7* | Letter Agreement, dated April 28, 2016, by and among Parkway Properties, Inc., Parkway Properties LP, James A. Thomas, The Lumbee Clan Trust, Thomas Partners, Inc., Thomas Investment Partners, Ltd. and Thomas-Pastron Family Partnership, L.P (incorporated by reference to Exhibit 10.01 to Parkway Properties, Inc.’s Form 8-K filed April 29, 2016). |
10.8 | Tax Protection Agreement dated as of December 19, 2013 by and among Thomas Properties Group, L.P., James A. Thomas, individually and as Trustee of the Lumbee Clan Trust, and the other persons listed on the signature pages thereto (incorporated by reference to Exhibit 10.2 to Parkway Properties, Inc.’s Form 8-K filed December 24, 2013). |
10.9 | Tax Protection Agreement dated as of October 13, 2004 by and among Thomas Properties Group, L.P., James A. Thomas, individually and as Trustee of the Lumbee Clan Trust, and the persons listed on the signature pages thereto (incorporated by reference to Exhibit F of Exhibit 10.3 to Thomas Properties Group, Inc.’s Quarterly Report on Form 10-Q for the period ended September 30, 2004 filed on November 22, 2004). |
10.10 | Registration Rights Agreement, dated October 13, 2004, by and among Thomas Properties Group, Inc., Thomas Properties Group, LP, and the holders of limited partnership interests of Thomas Properties Group, LP party thereto (incorporated by reference to Exhibit 10.13 to Thomas Properties Group, Inc.’s Form 10-Q for the quarter ended September 30, 2004). |
10.11 | Stockholders Agreement, dated October 7, 2016, by and among Parkway, Inc., TPG VI Pantera Holdings, L.P. and TPG VI Management, LLC (incorporated by reference to Exhibit 10.3 to the Current Report on Form 8-K filed by the Registrant with the Securities and Exchange Commission on October 12, 2016). |
10.12* | Employment Agreement, dated as of July 8, 2013, by and between Parkway Properties, Inc. and James R. Heistand (incorporated by reference to Exhibit 10.1 to Parkway Properties, Inc.’s Form 8-K filed July 12, 2013). |
10.13* | Amendment to Employment Agreement, dated as of June 15, 2015, by and between Parkway Properties, Inc. and James R. Heistand (incorporated by reference to Exhibit 10.1 to Parkway Properties, Inc.’s Form 8-K filed June 17, 2015). |
10.14* | Waiver to Employment Agreement, by and among Parkway Properties, Inc., Cousins Properties Incorporated and James R. Heistand, dated as of April 28, 2016 (incorporated by reference to Exhibit 10.2 to Parkway Properties, Inc.’s Form 8-K filed April 29, 2016). |
141
10.15* | Amendment Number Two to the Employment Agreement, dated as of July 7, 2016, by and between Parkway Properties, Inc. and James R. Heistand (incorporated by reference to Exhibit 10.1 to Parkway Properties, Inc.’s Form 8-K filed July 11, 2016). |
10.16* | Employment Agreement, dated as of December 12, 2016, by and between Parkway, Inc. and James R. Heistand (incorporated by reference to Exhibit 10.1 to the Current Report on Form 8-K filed by the Registrant with the Securities and Exchange Commission on December 13, 2016).* |
10.17* | Employment Agreement, dated as of October 25, 2013, by and between Parkway Properties, Inc. and M. Jayson Lipsey (incorporated by reference to Exhibit 10.2 to Parkway Properties, Inc.’s Form 8-K filed October 31, 2013). |
10.18* | Amendment to Employment Agreement, dated as of June 15, 2015, by and between Parkway Properties, Inc. and M. Jayson Lipsey (incorporated by reference to Exhibit 10.3 to Parkway Properties, Inc.’s Form 8-K filed June 17, 2015). |
10.19* | Waiver to Employment Agreement, by and among Parkway Properties, Inc., Cousins Properties Incorporated and M. Jayson Lipsey, dated as of April 28, 2016 (incorporated by reference to Exhibit 10.3 to Parkway Properties, Inc.’s Form 8-K filed April 29, 2016). |
10.20* | Employment Agreement, dated as of December 12, 2016, by and between Parkway, Inc. and M. Jayson Lipsey (incorporated by reference to Exhibit 10.2 to the Current Report on Form 8-K filed by the Registrant with the Securities and Exchange Commission on December 13, 2016). |
10.21* | Employment Agreement, dated as of December 22, 2014, by and between Parkway Properties, Inc. and Scott E. Francis (incorporated by reference to Exhibit 10.48 to Parkway Properties, Inc.’s Form 10-K for the year ended December 31, 2014). |
10.22* | Amendment to Employment Agreement, dated as of June 15, 2015, by and between Parkway Properties, Inc. and Scott E. Francis (incorporated by reference to Exhibit 10.6 to Parkway Properties, Inc.’s Form 8-K filed June 17, 2015). |
10.23* | Waiver to Employment Agreement, by and among Parkway Properties, Inc., Cousins Properties Incorporated and Scott E. Francis, dated as of April 28, 2016 (incorporated by reference to Exhibit 10.4 to Parkway Properties, Inc.’s Form 8-K filed April 29, 2016). |
10.24* | Employment Agreement, dated as of December 12, 2016, by and between Parkway, Inc. and Scott E. Francis (incorporated by reference to Exhibit 10.3 to the Current Report on Form 8-K filed by the Registrant with the Securities and Exchange Commission on December 13, 2016). |
10.25* | Employment Agreement, dated as of December 22, 2014, by and between Parkway Properties, Inc. and Jason A. Bates (incorporated by reference to Exhibit 10.49 to Parkway Properties, Inc.’s Form 10-K for the year ended December 31, 2014). |
10.26* | Amendment to Employment Agreement, dated as of June 15, 2015, by and between Parkway Properties, Inc. and Jason A. Bates (incorporated by reference to Exhibit 10.5 to Parkway Properties, Inc.’s Form 8-K filed June 17, 2015). |
10.27* | Waiver to Employment Agreement, by and among Parkway Properties, Inc., Cousins Properties Incorporated and Jason A. Bates, dated as of April 28, 2016 (incorporated by reference to Exhibit 10.5 to Parkway Properties, Inc.’s Form 8-K filed April 29, 2016). |
10.28* | Employment Agreement, dated as of December 12, 2016, by and between Parkway, Inc. and Jason A. Bates (filed herewith). |
10.29 | Credit Agreement, dated as of October 6, 2016, by and among Parkway Operating Partnership LP, as Borrower, Parkway, Inc., as Parent, the financial institutions party thereto and their assignees, as Lenders, and Bank of America, N.A., as Administrative Agent, Wells Fargo Bank, National Association, as Syndication Agent, and JPMorgan Chase Bank, N.A., Citizens Bank, National Association, and KeyBank National Association, as Co-Documentation Agents (incorporated by reference to Exhibit 10.4 to the Current Report on Form 8-K filed by the Registrant with the Securities and Exchange Commission on October 12, 2016). |
10.30 | Guaranty, dated as of October 6, 2016, by Parkway, Inc., Parkway Properties General Partners, Inc., Parkway Properties LP and certain subsidiaries of Parkway Operating Partnership LP in favor of Bank of America, N.A., as Administrative Agent (incorporated by reference to Exhibit 10.5 to the Current Report on Form 8-K filed by the Registrant with the Securities and Exchange Commission on October 12, 2016). |
10.31* | Indemnification Agreement, dated October 7, 2016, by and between Parkway, Inc. and James R. Heistand (incorporated by reference to Exhibit 10.6 to the Current Report on Form 8-K filed by the Registrant with the Securities and Exchange Commission on October 12, 2016). |
10.32* | Indemnification Agreement, dated October 7, 2016, by and between Parkway, Inc. and M. Jayson Lipsey (incorporated by reference to Exhibit 10.7 to the Current Report on Form 8-K filed by the Registrant with the Securities and Exchange Commission on October 12, 2016). |
10.33* | Indemnification Agreement, dated October 7, 2016, by and between Parkway, Inc. and Scott E. Francis (incorporated by reference to Exhibit 10.8 to the Current Report on Form 8-K filed by the Registrant with the Securities and Exchange Commission on October 12, 2016). |
10.34* | Indemnification Agreement, dated October 7, 2016, by and between Parkway, Inc. and Jason A. Bates (incorporated by reference to Exhibit 10.9 to the Current Report on Form 8-K filed by the Registrant with the Securities and Exchange Commission on October 12, 2016). |
10.35* | Indemnification Agreement, dated October 7, 2016, by and between Parkway, Inc. and James A. Thomas (incorporated by reference to Exhibit 10.10 to the Current Report on Form 8-K filed by the Registrant with the Securities and Exchange Commission on October 12, 2016). |
10.36* | Indemnification Agreement, dated October 7, 2016, by and between Parkway, Inc. and R. Dary Stone (incorporated by reference to Exhibit 10.11 to the Current Report on Form 8-K filed by the Registrant with the Securities and Exchange Commission on October 12, 2016). |
10.37* | Indemnification Agreement, dated October 7, 2016, by and between Parkway, Inc. and James H. Hance, Jr. (incorporated by reference to Exhibit 10.12 to the Current Report on Form 8-K filed by the Registrant with the Securities and Exchange Commission on October 12, 2016). |
142
10.38* | Indemnification Agreement, dated October 7, 2016, by and between Parkway, Inc. and Craig B. Jones (incorporated by reference to Exhibit 10.13 to the Current Report on Form 8-K filed by the Registrant with the Securities and Exchange Commission on October 12, 2016). |
10.39* | Indemnification Agreement, dated October 7, 2016, by and between Parkway, Inc. and Frank J. Johnson, III (incorporated by reference to Exhibit 10.14 to the Current Report on Form 8-K filed by the Registrant with the Securities and Exchange Commission on October 12, 2016). |
10.40* | Indemnification Agreement, dated October 7, 2016, by and between Parkway, Inc. and Avi Banyasz (incorporated by reference to Exhibit 10.15 to the Current Report on Form 8-K filed by the Registrant with the Securities and Exchange Commission on October 12, 2016).* |
10.41* | Parkway, Inc. and Parkway Operating Partnership LP 2016 Omnibus Equity Incentive Plan (incorporated by reference to Exhibit 10.16 to the Current Report on Form 8-K filed by the Registrant with the Securities and Exchange Commission on October 12, 2016). |
10.42* | Form of Stock Option Award Agreement – Assumed Options under the Parkway, Inc. and Parkway Operating Partnership LP 2016 Omnibus Equity Incentive Plan (incorporated by reference to Exhibit 10.27 to the Company’s Amendment No. 3 on Form 10 filed on September 19, 2016). |
10.43* | Form of Restricted Stock Unit Agreement – Assumed RSU Awards under the Parkway, Inc. and Parkway Operating Partnership LP 2016 Omnibus Equity Incentive Plan (incorporated by reference to Exhibit 10.28 to the Company’s Amendment No. 3 on Form 10 filed on September 19, 2016). |
10.44* | Form of Time-Based Restricted Stock Unit Agreement under the Parkway, Inc. and Parkway Operating Partnership LP 2016 Omnibus Equity Incentive Plan (incorporated by reference to Exhibit 10.4 to the Current Report on Form 8-K filed by the Registrant with the Securities and Exchange Commission on December 13, 2016). |
10.45* | Form of Performance-Based Restricted Stock Unit Agreement under the Parkway, Inc. and Parkway Operating Partnership LP 2016 Omnibus Equity Incentive Plan (incorporated by reference to Exhibit 10.5 to the Current Report on Form 8-K filed by the Registrant with the Securities and Exchange Commission on December 13, 2016). |
10.46 | Contribution Agreement, dated May 27, 2016, by and among Maguire Thomas Partners-Commerce Square II, Ltd., Maguire/Thomas Partners-Philadelphia, Ltd., Thomas Investment Partners, LLC, James A. Thomas as trustee of The Lumbee Clan Trust, Thomas Partners, Inc., and Parkway Properties, L.P. (filed herewith). |
10.47 | Replacement Contribution Agreement, dated May 27, 2016, by and among Maguire Thomas Partners-Commerce Square II, Ltd., Maguire/Thomas Partners-Philadelphia, Ltd., Thomas Investment Partners, LLC, James A. Thomas as trustee of The Lumbee Clan Trust, Thomas Partners, Inc., and Parkway Properties, L.P. (filed herewith). |
10.48 | Debt Guaranty Agreement, dated March 14, 2017, by and among Parkway Operating Partnership LP, Parkway Properties LP, James A. Thomas and certain other affiliates of James A. Thomas (filed herewith). |
21.1 | Subsidiaries of Parkway, Inc. (filed herewith). |
23.1 | Consent of Ernst & Young LLP (filed herewith). |
23.2 | Consent of Ernst & Young LLP (filed herewith). |
23.3 | Consent of Deloitte & Touche LLP (filed herewith). |
31.1 | Certification of Chief Executive Officer pursuant to Rule 13a-14(a)/15d-14(a) of the Securities Exchange Act of 1934, as amended, as adopted pursuant to Section 302 of the Sarbanes-Oxley Act of 2002 (filed herewith). |
31.2 | Certification of Chief Financial Officer pursuant to Rule 13a-14(a)/15d-14(a) of the Securities Exchange Act of 1934, as amended, as adopted pursuant to Section 302 of the Sarbanes-Oxley Act of 2002 (filed herewith). |
32.1 | Certification of Chief Executive Officer pursuant to 18 U.S.C. 1350, as adopted pursuant to Section 906 of the Sarbanes-Oxley Act of 2002 (filed herewith). |
32.2 | Certification of Chief Financial Officer pursuant to 18 U.S.C. 1350, as adopted pursuant to Section 906 of the Sarbanes-Oxley Act of 2002 (filed herewith). |
101** | The following materials from Parkway, Inc.’s Annual Report on Form 10-K for the year ended December 31, 2016, formatted in XBRL (eXtensible Business Reporting Language): (i) consolidated balance sheet of Parkway, Inc., (ii) consolidated statement of operations of Parkway, Inc., (iii) consolidated statement of changes in equity of Parkway, Inc., (iv) consolidated statement of cash flows of Parkway, Inc., (v) the notes to the consolidated financial statements of Parkway, Inc., (vi) combined balance sheets for each of Parkway Houston and Cousins Houston, (vii) combined statements of operations for each of Parkway Houston and Cousins Houston, (viii) combined statements of changes in equity for each of Parkway Houston and Cousins Houston, (ix) combined statements of cash flows for each of Parkway Houston and Cousins Houston, and (x) notes to the combined financial statements of each of Parkway Houston and Cousins Houston.** |
______ | |
* | Denotes a management contract or compensatory plan, contract or arrangement. |
** | Pursuant to Rule 406T of Regulation S-T, the Interactive Data Files on Exhibit 101 hereto are deemed not filed or part of a registration statement or prospectus for purposes of Sections 11 or 12 of the Securities Act of 1933, as amended, are deemed not filed for purposes of Section 18 of the Securities Exchange Act of 1934, as amended, and otherwise are not subject to liability under those sections. |
ITEM 16. Form 10-K Summary.
None.
143
SIGNATURES
Pursuant to the requirements of Section 13 or 15(d) of the Securities Exchange Act of 1934, the Registrant has duly caused this report to be signed on its behalf by the undersigned, thereunto duly authorized.
PARKWAY, INC. | |
Registrant | |
By: /s/ James R. Heistand | |
James R. Heistand | |
President, Chief Executive Officer and Director | |
March 15, 2017 | |
By: /s/ Scott E. Francis | |
Scott E. Francis | |
Executive Vice President, Chief Financial Officer and Chief Accounting Officer | |
March 15, 2017 | |
Pursuant to the requirements of the Securities Exchange Act of 1934, this report has been signed below by the following persons on behalf of the Registrant and in the capacities and on the dates indicated.
/s/ Avi Banyasz | /s/ Craig B. Jones |
Avi Banyasz, Director | Craig B. Jones, Director |
March 15, 2017 | March 15, 2017 |
/s/ James H. Hance Jr. | /s/ R. Dary Stone |
James H. Hance Jr., Director | R. Dary Stone, Director |
March 15, 2017 | March 15, 2017 |
/s/ James R. Heistand | /s/ James A. Thomas |
James R. Heistand | James A. Thomas |
President, Chief Executive Officer and Director | Chairman of the Board and Director |
March 15, 2017 | March 15, 2017 |
/s/ Frank J. Johnson III | |
Frank J. Johnson, Director | |
March 15, 2017 | |
144