Attached files
| file | filename |
|---|---|
| EX-32.2 - EXHIBIT 32.2 - LMI AEROSPACE INC | ex32_2.htm |
| EX-32.1 - EXHIBIT 32.1 - LMI AEROSPACE INC | ex32_1.htm |
| EX-31.2 - EXHIBIT 31.2 - LMI AEROSPACE INC | ex31_2.htm |
| EX-31.1 - EXHIBIT 31.1 - LMI AEROSPACE INC | ex31_1.htm |
| EX-23.1 - EXHIBIT 23.1 - LMI AEROSPACE INC | ex23_1.htm |
| EX-21.1 - EXHIBIT 21.1 - LMI AEROSPACE INC | ex21_1.htm |
UNITED STATES
SECURITIES AND EXCHANGE COMMISSION
WASHINGTON, DC 20549
FORM 10-K
þ | ANNUAL REPORT PURSUANT TO SECTION 13 OR 15(d) OF THE SECURITIES EXCHANGE ACT OF 1934 |
For the fiscal year ended December 31, 2016
¨ | TRANSITION REPORT PURSUANT TO SECTION 13 OR 15(d) OF THE SECURITIES EXCHANGE ACT OF 1934 |
For the transition period from ______________ to ______________
Commission file number 000-24293
LMI AEROSPACE, INC. |
(Exact Name of Registrant as Specified in Its Charter) |
Missouri | 43-1309065 | |
(State or Other Jurisdiction of Incorporation or Organization) | (IRS Employer Identification No.) | |
411 Fountain Lakes Blvd., | ||
St. Charles, Missouri | 63301 | |
(Address of Principal Executive Offices) | (Zip Code) | |
Registrant’s telephone number, including area code (636) 946-6525
Securities registered pursuant to Section 12(b) of the Act:
Title of Each Class | Name of Each Exchange On Which Registered | |
Common stock, $0.02 par value per share | NASDAQ Global Market | |
Securities registered pursuant to Section 12(g) of the Act:
None |
(Title of Class) |
Indicate by check mark if the registrant is a well-known seasoned issuer, as defined in Rule 405 of the Securities Act.
¨ Yes þ No
Indicate by check mark if the registrant is not required to file reports pursuant to Section 13 or Section 15(d) of the Act.
¨ Yes þ No
Note —Checking the box above will not relieve any registrant required to file reports pursuant to Section 13 or 15(d) of the Exchange Act from their obligations under those Sections.
Indicate by check mark whether registrant: (1) has filed all reports required to be filed by Section 13 or 15(d) of the Securities Exchange Act of 1934 during the preceding 12 months (or for such shorter period that the Registrant was required to file such reports), and (2) has been subject to such filing requirements for the past 90 days.
þ Yes ¨ No
Indicate by check mark whether the registrant has submitted electronically and posted on its corporate Web site, if any, every Interactive Data File required to be submitted and posted pursuant to Rule 405 of Regulation S-T (§232.405 of this chapter) during the preceding 12 months (or for such shorter period that the registrant was required to submit and post such files).
þ Yes ¨ No
Indicate by check mark if disclosure of delinquent filers pursuant to Item 405 of Regulation S-K is not contained herein, and will not be contained, to the best of the registrant’s knowledge, in definitive proxy or information statements incorporated by reference in Part III of this Form 10-K or any amendment to this Form 10-K. ¨
Indicate by check mark whether the registrant is a large accelerated filer, an accelerated filer, a non-accelerated filer, or a smaller reporting company. See definitions of “large accelerated filer,” “accelerated filer” and “smaller reporting company” in Rule 12b-2 of the Exchange Act.
Large accelerated filer ¨ | Accelerated filer þ |
Non-accelerated filer ¨ (Do not check if a smaller reporting company) | Smaller reporting company ¨ |
Indicate by check mark whether the registrant is a shell company (as defined in Rule 12b-2 of the Act).
¨ Yes þ No
The aggregate market value of the voting and non-voting common equity held by non-affiliates computed by reference to the price at which the common equity was last sold, or the average bid and asked price of such common equity, as of the last business day of the registrant’s most recently completed second fiscal quarter ended June 30, 2016, was $91,404,316.
There were 13,621,267 shares of common stock outstanding as of March 1, 2017.
DOCUMENTS INCORPORATED BY REFERENCE
Information required by Part III of this Form 10-K is expected to be filed by amendment, or otherwise incorporated by reference from our definitive proxy statement on Schedule 14A for our 2017 Annual Meeting of Shareholders.
2
TABLE OF CONTENTS
Item No. | Page | |
PART I | ||
1 | ||
1A | ||
1B | ||
2 | ||
3 | ||
4 | ||
PART II | ||
5 | ||
6 | ||
7 | ||
7A | ||
8 | ||
9 | ||
9A | ||
9B | ||
PART III | ||
10 | ||
11 | ||
12 | ||
13 | ||
14 | ||
PART IV | ||
15 | ||
Forward-Looking Information
The Private Securities Litigation Reform Act of 1995 provides a “safe harbor” for forward-looking statements. LMI Aerospace, Inc. (“LMI Aerospace”, “we”, “us”, “our” or the “Company”) makes forward-looking statements in this Annual Report on Form 10-K (“Report”) and in the public documents that are incorporated herein by reference, which represent the Company’s expectations or beliefs about future events and financial performance. These forward-looking statements are based on estimates, projections, beliefs and assumptions and are not guarantees of future events or results. Such statements are subject to known and unknown risks, uncertainties and assumptions, including those referred to under “Item 1A. Risk Factors” in this Report and otherwise described in the Company’s periodic filings and current reports filed with the Securities and Exchange Commission (the “SEC”).
All predictions as to future results contain a measure of uncertainty and, accordingly, actual results could differ. Among the factors that could cause actual results to differ from those contemplated, projected or implied by the forward-looking statements (the order of which does not necessarily reflect their relative significance) are:
• | the uncertainties and risks that result from both the announcement of the Transaction (as defined below) and any delay, inability to recover costs associated with the Transaction or the failure to consummate the Transaction; |
• | difficulties with the implementation of the Company’s growth strategy, particularly resulting from unanticipated costs relating to the Company’s manufacture of new parts for its current customers and/or new customers; |
• | effective operational execution to record high production rates, including integrating new people, equipment and processes; |
• | continued decline in demand for design engineering services and continued insourcing of such services by our customers; |
• | the potential impact of changes in United States policies regarding trade partnerships and treaties as well as any tax law changes negatively impacting interest and certain other deductions due to the Company’s foreign production of goods; |
• | competitive pressures, such as pricing, relating to low-cost foreign labor, capital investment to secure new work, and customers requiring discounts to achieve program extensions; |
• | the Company’s ability to accurately estimate its costs under long-term, fixed-price contracts including contracts for design-build programs; |
• | the Company’s ability to comply with its debt covenants and the significant leverage of the Company; |
• | the Company’s ability to stay current with technological changes, such as the development of alternative aerospace materials, changes in manufacturing techniques and new engineering software; |
• | a reduction in the number of suppliers and increases in competition resulting from consolidation within the aerospace industry; |
• | inability to timely deliver new products and within quality specifications; |
• | supply chain performance and support; |
• | the Company’s ability to successfully negotiate asserted and unasserted claims, and in particular claims relating to cost over-runs of work performed under certain customer contracts; |
• | access to and retention of qualified workers and management; |
• | our ability to avoid or recover from cyber-based or other security attacks, information technology failures or other disruptions; |
• | the Company's ability to generate sufficient cash flow to fund interest payments and investment in working capital needs; |
4
• | changes in accounting principles or new accounting standards; |
• | changes in the quality, costs and availability of the Company's raw materials, principally aluminum; |
• | the political environment in Mexico, where the Company has manufacturing operations; |
• | governmental funding for certain military programs that utilize the Company’s products; and |
• | compliance with laws and regulations. |
In light of these risks, uncertainties and assumptions, the forward-looking events discussed may not occur. Accordingly, investors are cautioned not to place undue reliance on the forward-looking statements. Except as required by law, the Company undertakes no obligation to publicly update or revise any forward-looking statements, whether as a result of new information, future events or otherwise. Investors should, however, review additional disclosures made by the Company from time to time in its periodic filings with the SEC.
This Report and the documents incorporated herein by reference should be read completely and with the understanding that the Company’s actual future results may be materially different from what the Company expects. All forward-looking statements made by the Company in this Report and in the Company’s other filings with the SEC are qualified by these cautionary statements.
PART I
ITEM 1. | BUSINESS |
General Overview
LMI Aerospace is a leading supplier of structural assemblies, kits and components, and design engineering services to the aerospace and defense markets. We provide a broad array of manufacturing capabilities, as well as engineering and value-added services to the large commercial, corporate and regional, and military aircraft markets. We also provide prototyping, testing and design capabilities to customers in support of new product development and in-service aircraft. LMI Aerospace is a preferred supplier to aircraft original equipment manufacturers (“OEMs”) and Tier 1 aerospace suppliers. In addition to aerospace products, we produce components and assemblies for laser equipment used by semiconductor equipment manufacturers, electronic and electrical wire harnesses, cable assemblies, and mechanical sub-assemblies for the air and rail traffic control, medical equipment, telecommunications, and heavy equipment industries.
Founded in 1948 as a manufacturer of components for the large commercial aircraft market of the aerospace industry, LMI Aerospace became a publicly-held company in 1998. Historically, our business was primarily dependent on the large commercial aircraft market, specifically with one principal customer. In order to diversify our product and customer base, we implemented an acquisition and marketing strategy in the late 1990’s that has broadened the number of industries to which we sell our products and services and, within the aerospace industry, diversified our customer base to reduce our dependence on any one principal customer.
In July 2007, we expanded our product offering to include Engineering Services by acquiring San Diego, California-based D3 Technologies, Inc. (“D3”), a premier design and engineering services firm. In August 2012, we enhanced our Engineering Services platform by acquiring Kirkland, Washington-based TASS Inc. (“TASS”), a premier after-market engineering and support services firm.
In December 2012, we acquired Kansas City, Missouri-based Valent Aerostructures, LLC ("Valent"), a provider of complex, structural components, major sub-assemblies and machined parts for OEMs and Tier 1 airframe manufacturers in the aerospace and defense industries. Valent provides significant content for several major commercial, business jet and military platforms including the Boeing 737, 747-8, 777, 787, V-22, F-15, F-18 and Gulfstream G650. We believe the acquisition positioned LMI Aerospace as an industry leading aerostructures supplier with significant scale. The resulting increased scale, complementary product offerings and project management capabilities of Valent have allowed us to offer our customers more diversified product and service offerings, deepen our customer relationships and obtain greater leverage of our manufacturing and supply chain
5
network. In addition, we believe Valent’s assembly and complex precision machining capabilities has allowed the Company to compete for larger and more complex assemblies and design-build projects.
Recent Developments
On February 16, 2017, the Company entered into an Agreement and Plan of Merger (the “Merger Agreement”) with Sonaca S.A., a limited liability company validly existing under the laws of Belgium (the “Parent”), Sonaca USA Inc., a Delaware corporation and direct, wholly-owned subsidiary of Parent (“Intermediate Co”), and Luminance Merger Sub, Inc., a Missouri corporation and an indirect, wholly-owned subsidiary of the Parent (the “Sub,” and collectively with Parent and Intermediate Co, the “Parent Entities”), relating to the proposed acquisition of the Company by Parent.
The Merger Agreement provides that, subject to the terms and conditions thereof, Sub will be merged with and into the Company (the “Transaction”) with the Company continuing as the surviving corporation in the Transaction (the “Surviving Corporation”). At the closing of the Transaction (the “Closing”) each outstanding share of common stock of the Company (other than shares owned by the Company or the Parent Entities, and shares whose holders seek appraisal and comply with all related statutory requirements of the General and Business Corporation Law of Missouri) will cease to be outstanding and will be converted into the right to receive $14.00 in cash per share, without interest and subject to any applicable tax withholding (the “Consideration”).
Shareholders of the Company will be asked to vote on the approval of the Merger Agreement at a special shareholders’ meeting that will be held on a date to be announced. The Closing is subject to the approval of the Merger Agreement by the affirmative vote of the holders of at least two-thirds of the outstanding shares of common stock of the Company (the “Shareholder Approval”).
In addition to the Shareholder Approval condition, consummation of the Transaction is subject to various other customary conditions, including (a) the expiration or termination of the waiting period under the Hart-Scott-Rodino Antitrust Improvements Act of 1976, as amended, (b) clearance by the Committee on Foreign Investment in the United States and by the Directorate of Defense Trade Controls under the International Traffic in Arms Regulations, (c) the absence of any order, injunction or law preventing or prohibiting the consummation of the Merger, (d) the accuracy of the representations and warranties contained in the Merger Agreement (subject to certain materiality qualifiers), (e) compliance with covenants and agreements in the Merger Agreement in all material respects, and (f) the absence of a material adverse effect on the Company.
The Merger Agreement contains certain termination rights for both the Company and the Parent Entities, and provides that, upon termination of the Merger Agreement by the Company or Parent upon specified conditions, the Company may be required to pay the Parent a termination fee of either $10 million or $15 million, depending upon the reason for and timing of the termination, and any costs of collection. In addition, subject to certain exceptions and limitations, either party may terminate the Merger Agreement if the Transaction is not consummated by August 16, 2017, subject to possible extension until September 29, 2017 to allow for the completion of certain regulatory approvals or if the Shareholder Approval has not yet been obtained.
The Merger Agreement also contains a “go-shop” provision that, in general, allows the Company to initiate, solicit and encourage, and engage in discussions or negotiations with respect to, an acquisition proposal for the 30-day period after execution of the Merger Agreement. The Company may continue discussions after the go-shop period with any party who made an acquisition proposal during the go-shop period that the Company determines in good faith is or could reasonably be expected to result in a superior proposal. Following the expiration of the go-shop period, the Company will be subject to a customary “no-shop” provision.
Our Strategy
The Company’s strategy highlights its vision, mission and goals with a focus on operational excellence. The key goals of the Company are to substantially grow revenue by winning two significant, strategic work packages per year, drive debt leverage down to enable investment, deliver annual gross margin improvement and integrate our operations into value streams.
In addition, our current strategy focuses on organic growth of all of our businesses coupled with the development of key strategic alliances to expand our overall market offerings. Our high speed and hard metal machining expertise, deepened program management skills and aftermarket support services have allowed us to pursue additional complex assembly and design-build opportunities to capitalize on our strengths.
We believe that OEMs and Tier 1 aerospace suppliers will continue to outsource the design and manufacturing of components, assemblies and sub-systems to fewer preferred suppliers who are capable of meeting increasing market demands for on-time delivery and quality in a cost effective manner. Accordingly, we continue to focus on remaining well positioned to benefit from these trends by:
6
• | Building critical mass and enhanced capabilities to win larger and more complex assembly business as a trusted and aligned supplier to our customers. |
• | Making operational excellence the cornerstone of our competitive advantage. |
• | Providing unique integrated solutions to our aerospace customers through creative and value driven processes throughout the product lifecycle. |
• | Achieving organic growth by executing our long-term business development strategy so that we continue to grow our expertise and sales. |
• | Investing in additional capacity and technology to accommodate customer growth. |
• | Striving for more balance within our various markets, customers and platforms. |
• | Placing the highest priority on serving our external and internal customers with consistent emphasis on quality, delivery performance, integrity, ethical behavior and responsibility to our communities. |
• | Grow our low cost sources of supply through ownership or use of our supply chain to complement the engineering and build capabilities provided by our U.S. offices and factories, thus enabling us to better market to global customers. |
• | Enhancing those business processes necessary to effectively execute complex new development programs. |
• | Deploying an industry leading enterprise resource planning system. |
• | Improving information and facility security, with emphasis on export control requirements. |
• | Investing in developing our work force by providing formal education support, skill training to provide flexibility and capability, and leadership training to enable us to reach our revenue growth targets and provide added management depth. |
We believe these strategic actions will enhance our ability to successfully compete in the future. Additionally, we continue to utilize defined strategic initiatives in our Aerostructures and Engineering Services segments with detailed action plans to further solidify the competitive position of each segment.
Financial Information About Our Business Segments
Financial information with respect to our business segments, including revenues and operating earnings, is contained in Management’s Discussion and Analysis of Financial Condition and Results of Operations in Item 7 below, and in Note 17 of the Notes to Consolidated Financial Statements in Item 8 below.
Description of Business by Segment
We operate in two business segments consisting of our Aerostructures segment and our Engineering Services segment. Our Aerostructures segment fabricates, machines, finishes, integrates, assembles and kits machined and formed close-tolerance aluminum, specialty alloy and composite components and higher-level assemblies for use by the aerospace and defense industries. We also offer our customers value-added services related to the design, production, assembly and distribution of aerospace components and delivery assembly kits directly to customer points of use. We believe these services strengthen our position as a preferred supplier by improving overall production efficiencies and value for our customers.
Our Engineering Services segment provides a complete range of value-driven design, engineering and program management services. This segment supports the full range of aircraft product lifecycles from conceptual design, analysis and certification through production support, fleet support, and service life extensions via a complete turnkey engineering solution to leading OEMs and Tier 1 aerospace suppliers and airline operators. Our team of engineers has extensive experience across multiple disciplines, enabling us to creatively address the needs of our customers. We have the ability to work with customers to launch new programs by assisting with aircraft platform conceptual and preliminary design, engineering release, certification planning support, risk mitigation and producibility trade studies, and the development of high-level program schedules and resource planning. Working with our customers in the early stages better positions us to provide tooling design support in the fabrication stage as well as later modifications and upgrades.
Our Aerostructures and Engineering Services segments are able to combine their experience and expertise to form an integrated team that can provide customers with fully integrated, seamless, innovative and strategic design-build solutions. Design-
7
build projects require close collaboration from conception through production. Our consolidated team is committed to a high level of customer service and works together to ensure each project progresses smoothly through the design-to-production process.
Additional Information
We are a Missouri corporation. Our principal executive offices are located at 411 Fountain Lakes Blvd., St. Charles, Missouri 63301. Our Internet address is www.lmiaerospace.com. Interested readers can access our Annual Reports on Form 10-K, Quarterly Reports on Form 10-Q, Current Reports on Form 8-K, and any amendments to those reports filed or furnished pursuant to Section 13(a) or 15(d) of the Securities Exchange Act of 1934, as amended (the “Exchange Act”). These documents may be accessed free of charge on our corporate website at the following address: http://ir.lmiaerospace.com/sec.cfm. These reports may also be obtained at the SEC’s public reference room at 100 F Street, N.E., Washington, DC 20549 and may be found through the SEC website at www.sec.gov. Such reports are generally available on the day they are filed. The public may obtain information on the operations of the public reference room by calling the SEC at 1-800-SEC-0330. Additionally, we will furnish interested readers a paper copy of such reports, upon request, free of charge. Information contained on or accessible through our corporate website or the SEC’s website is not part of this Report.
Interested readers can access our Code of Ethics and Business Conduct, our Corporate Governance Principles and the charters of the following committees of our Board of Directors: the Audit Committee, the Compensation Committee, and the Corporate Governance and Nominating Committee, free of charge on our corporate website at the following address: http://ir.lmiaerospace.com.
Customers and Products & Services
Customers
Our principal customers are primarily leading OEMs and Tier 1 suppliers in the large commercial, corporate and regional, and military aircraft markets of the aerospace industry. For the year ended December 31, 2016, direct sales to our three largest customers in terms of revenue (Spirit AeroSystems ("Spirit"), Gulfstream Aerospace Corporation ("Gulfstream"), and The Boeing Company ("Boeing")) accounted for a total of approximately 61.3% of our sales. The loss of, or substantial reduction of orders from, any of these customers could materially affect our sales and profitability. See “Item 1A. Risk Factors – Risks Related to Our Company – Sales to a limited number of customers represent a significant portion of our revenue, and our long-term agreements with these customers are generally terminable upon written notice ” and Management’s Discussion and Analysis of Financial Condition and Results of Operations – Results of Operations – Year ended December 31, 2016 compared to year ended December 31, 2015 – Aerostructures Segment in Item 7 below and Note 16 of the Notes to Consolidated Financial Statements in Item 8 below.
We have entered into long-term agreements with many of our customers whereby the customer generally commits to purchase all of its requirements of a particular component from us, subject to termination rights. When operating under these agreements, our customers issue purchase orders or provide a shipment signal to schedule delivery of products at a previously negotiated price. Our products sold outside of long-term agreements are based upon previously negotiated pricing and specific terms and conditions on purchase orders.
Products & Services
Our Aerostructures segment manufactures more than 40,000 products for integration into a variety of aircraft platforms manufactured by leading OEMs and Tier 1 aerospace suppliers. We are the sole-source provider, under long-term agreements, of many of the products that we manufacture. Substantially all of our components and assemblies are based on designs and specifications prepared and furnished by our customers. The primary aerospace products we manufacture and the platforms into which they are integrated, include:
Product & Services | Models |
Aerostructures Segment | |
8
Leading edge assemblies, wing slats and flap skins/components, ailerons, verticals, vanes | Gulfstream Aerospace Corporation: G-280, G-450, G-500, G-550, G-600, G-650 The Boeing Company: 737, 777, 787 Bombardier, Inc.: Learjet 45 & 60, CRJ200/700/900/1000, Global Express Triumph: Gulfstream G-280, G-650 Embraer: KC-390 Honda Jet: HA-420 |
Winglet leading edges and modification kits | Aviation Partners Boeing: 737, 757, 767 FACC AG: Boeing 737, 757 |
Fuselage and wing skin | Gulfstream Aerospace Corporation: G-450, G-500, G-550, G600, G-650 The Boeing Company: 737, 747, 767, 777, 787 Bombardier, Inc.: Learjet 45 & 60, Q400, CRJ200/700/900/1000, Challenger 604/605 |
Helicopter cabin and aft section components and assemblies | Sikorsky Aircraft: UH-60 Black Hawk, MH-60 Seahawk Triumph Group: UH-60 Black Hawk, MH-60 Seahawk |
Wing panels | The Boeing Company: 747 Bombardier, Inc.: CRJ 200/700/900/1000 |
Tail cone assembly | Mitsubishi Aircraft Corporation (“MITAC”): Mitsubishi Regional Jet (“MRJ”) |
Thrust reversers and engine nacelles/cowlings | Gulfstream Aerospace Corporation: G-450, G-650 Boeing Commercial: 737, 747, 777 Boeing Defense: B-52 Buffalo General Electric: Airbus A320 |
Door components, assemblies and floor beams | Gulfstream Aerospace Corporation: G-450 The Boeing Company: 737, 747 Bombardier, Inc.: CRJ1000, C-Series |
Cockpit window frames and landing light lens assemblies | Gulfstream Aerospace Corporation: G-650 The Boeing Company: 737, 747, 767, 777, KC-10 |
Cockpit crew floor and bulkhead structure assemblies | Spirit Aerosystems: Boeing 737 |
Wheel well assemblies | The Boeing Company: 737 Spirit Aerosystems: Boeing 737 |
Detail interior components | Gulfstream Aerospace Corporation: G-450, G-550 The Boeing Company: 737, 747, 767, 777 |
9
Structural sheet metal, machined, milled and extruded components | Gulfstream Aerospace Corporation: G-280,G-450, G-500, G-550, G600, G-650 Triumph Aerostructures – Vought Aircraft Division: Boeing 737, 747, 767, 777, Gulfstream G-450, G-550 Boeing Commercial: 737, 747, 767, 777 Boeing Defense: F-15 Eagle, F/A-18 Hornet, C-17 Globemaster, V-22 Bombardier, Inc.: CRJ 200/700/900/1000, Challenger 604/605, C-Series Spirit AeroSystems: Boeing 737, 777, 787 |
Housings and assemblies for gun turrets | The Boeing Company: AH-64 Apache Alliant Techsystems, Inc .: AH-64 Apache |
Auxiliary power unit components | Gulfstream Aerospace Corporation: G-550 The Boeing Company: V-22 Osprey |
Pylon structures | Honda Jet: HA-420 Boeing Commercial: 737 Spirit Aerosystems: MITAC MRJ, Bombardier C-Series |
Electronic rack assembly | Spirit Aerosystems: Boeing 787 |
Fans, heat exchangers and various assemblies | Cymer, Inc.: ELS 7000, ELS 6010, XLA 100 |
Assemblies and components for rail yard switching equipment | Alstom Signaling |
Our Engineering Services segment provides a complete range of engineering design, analysis, repair, certification and program management services for the aerospace industry. The following table describes some of the engineering services we provide as well as the platforms into which they are integrated:
10
Engineering Services Segment | |
Models | |
Structural design and analysis | |
Wing/wingbox, fixed and moveable leading edges/trailing edges, fuselage, empennage, tail cone design | Boeing Commercial : 777, 747-8, 787-8/-9 Spirit AeroSystems: Boeing 747-8, 787-8, Gulfstream G-280, G-650, Airbus A-350 Triumph Aerostructures - Vought Aircraft Division: Boeing 787-8, Bombardier Global 7000/8000 Lockheed Martin Aeronautics Company: JSF F-35 Bombardier, Inc.: Learjet L-85, C-Series MITAC: MRJ The Spaceship Company: Spaceship II, White Knight II General Dynamics OTS: Gulfstream G650 |
Winglet/wing mod design | Aviation Partners Boeing: 757, 767 Spirit AeroSystems: Gulfstream G-280, G-650 |
Nacelle, engine cowl, thrust reverser design | NORDAM: PD427 Fan Cowl (Hawker 400), Boeing 737 MAX |
Weight improvement engineering | Boeing Commercial: 747-8, 787-8 Spirit AeroSystems: Boeing 787-8, Gulfstream G-280, G-650 Triumph Aerostructures - Vought Aircraft Division: Bombardier Global Express Wing |
Helicopter fuselage, cockpit, cabin frames, skins, longerons, beams | Spirit AeroSystems: Sikorsky CH53K |
Aircraft modification engineering | Boeing Commercial: 747-LCF, 777-F Boeing Defense: F/A-18A/B/C/D Hornet, F/A-18E/F Super Hornet, EA-18G Growler Go-Go: In-flight entertainment Jet2: Structural modifications |
Systems design and integration | Boeing Commercial: 747-8, 787 The Spaceship Company: Spaceship II, White Knight II Arrowhead: COMAC C919, Bombardier Global Express |
Tool design and fabrication | Boeing Commercial: 777, 747-8, 787 Boeing Defense: MMA, P-8A Spirit AeroSystems: Boeing 747-8 Triumph Aerostructures - Vought Aircraft Division: Boeing 787, 747-8, C-17, Northrop Grumman Global Hawk NORDAM: Boeing 737 |
After-market engineering and support services | Boeing Commercial and certain other airlines |
Aviation training system | Northrop Grumman: C-2A Greyhound, E-2C Hawkeye, E-2D Advanced Hawkeye |
Aviation maintenance engineering | Naval Air Station: Coronado, CA |
11
Manufacturing Process
Fabrication
We deliver broad fabrication capabilities ranging from a single-piece component to complex, multiple-quantity orders. Our abilities include coordinate measuring machine inspection, tooling and engineering. We can bend, stretch, draw, stamp, punch and cut a myriad of materials, including aluminum alloys, stainless steel, titanium and other metals in addition to non-metallic materials. We organize our manufacturing facilities by value streams for a particular manufacturing process. Depending on the component, we utilize either a forming process or a machining process. Each value stream is staffed by a team of operators who are supported by a supervisor, lead operators and quality inspectors. Throughout each stage of manufacturing and finishing processes, we collect, maintain and evaluate data, including customer design inputs, process scheduling, material inventory, labor, inspection results and completion and delivery dates. Our information systems employ this data to provide accurate pricing and scheduling information to our customers as well as to establish production standards used to measure internal performance.
We use several different processes in manufacturing components, including:
• | fluid cell press; |
• | sheet metal and extrusion stretch; |
• | skin stretch; |
• | stretch draw; |
• | hot joggle; |
• | machining and turning; |
• | computer numerical control ("CNC") brake forming and turret punch; and |
• | roll forming. |
These processes shape or form aluminum, stainless steel or titanium sheet metal or other metals and non-metals and extrusion, known as a work piece, into components by applying pressure through impact, cutting, stretching or pressing, which causes the work piece to conform to a die. The shapes may be simple with a single angle, bend or curve or may be complex with compound contours having multiple bends and angles. Some processes incorporate heat to soften the metal prior to or during forming.
Machining
Our machining capabilities include high speed mills, routers, lathes and water jets. We operate over 100 CNC machines with RPM’s up to 33,000 and component sizes up to 235 inches. Our machining centers employ over 30 CNC programmers with proficiency in Catia, Unigraphics, Mastercam and Vericut. We produce components using close-tolerance machining methods. These methods involve the machining of various metals, such as stainless steel, aluminum, monel, inconnel, Kevlar, titanium and numerous varieties of steel. We have the capability of machining aluminum and steel in both heat-treated and non-heat-treated conditions.
We machine parts through conventional and CNC machining methods from raw material and forgings. In addition, complex machining of parts is accomplished through the use of engineered tools or programs to produce intricate and close tolerances with very restrictive finish requirements. Each machining facility is also set up to complete turnkey research and development projects to better support customers’ engineering changes.
Value-Added Services
In addition to products, we offer various value-added services that are intended to result in both cost and time savings. These services include:
12
• | finishing; |
• | assembly; |
• | kitting; |
• | distribution; |
• | composite testing services; |
• | integrated testing services; |
• | engineered tool design, fabrication and repair; and |
• | prototyping and manufacturing producibility design. |
Finishing
Our finishing plants are located in Tulsa, Oklahoma, Cuba, Missouri, and Mexicali, Mexico, and together offer chemical milling, chemical conversion coating, painting and polishing of components. Newly acquired automation in robotic spray maskant application in chemical milling operations and laser scribe technology are being used to improve operating efficiencies and improve product quality. We deliver finished products that meet or exceed standards of our commercial, corporate and regional, and military aircraft customers. We have received quality approvals from most major aircraft manufacturers in the United States and Canada. All of our processes are Nadcap accredited and certified to industry aerospace standards.
Assembly
We believe we are an industry leader in the assembly of detail components into large sub-assemblies or finished-assemblies. We apply this critical manufacturing step to a range of products in the commercial and corporate and regional aircraft markets, as well as military aircraft, for both fixed-wing and rotor craft. We implement key technologies, such as robotics drilling, auto-riveting and automation to drive competitiveness and enable high-rate production. The parts for assembly come from supply chain and LMI Aerospace’s fabrication and machining facilities. Assembled products are delivered direct to our customers which include: The Boeing Company, Spirit AeroSystems, Lockheed Martin, Gulfstream Aerospace Corporation, and Triumph Group.
Kitting
In support of our customers’ lean initiatives and best practices, we offer kitting services to help streamline the flow of components to their assembly lines. Our facility in Savannah, Georgia is designed to kit manufactured components and deliver to customer points of use in a just-in-time manner. The location also serves as a warehousing and detail storage facility where finished goods may be stored and kitted to customer specifications upon demand. Savannah has FAA approval for Parts Manufacturer Approval on the Aviation Partners Boeing winglet and Go-Go in-flight entertainment systems programs.
Distribution
We deliver value-added services to our customers through our distribution center located in Tulsa, Oklahoma. This facility is designed with high-density storage systems that support storage and direct shipping of products to our customers’ points of use as well as cut to size programs of raw material for our internal plants. This warehousing and just-in-time delivery supports and conforms to our customers’ lean manufacturing processes. Additionally, we own a fleet of paneled trucks that are utilized for transporting product from our machining/fabrication facilities to our processing facilities, to our assembly facilities and then to our customers.
Composite Testing
Our composites testing organization provides material characterization and certification services for both basic materials as well as structural elements. We utilize technical staff, with significant experience, to support customers like The Boeing Company, Northrop Grumman Corporation, Gulfstream Aerospace, Bombardier, Toray Composites America, Inc., Cytec Industries Inc. and others with U.S. Federal Aviation Administration (“FAA”) certification programs, dynamic testing for full-scale wings, development of material allowables, completion of Quality Assurance testing and other testing services utilizing state-of-the-art Nadcap accredited (SAE 7101, ISO 17052, AC7122) facilities.
13
Composite Manufacturing
Our Everett, Washington facility is Nadcap accredited for Non-metallic manufacturing (AC7118), and is qualified to Sikorsky, Gulfstream and Boeing composites manufacturing specifications. Recent customer qualifications include Boeing BAC5578, BAC5317 and BDS D210 (Qualification of Sources for Composite Parts) for hardware found typically on Boeing commercial and military platforms. Additionally, we are now pursuing qualification to supply continuous Thermoplastic part manufacture for Boeing per BAC5348 and also for the overall aerospace industry.
Integrated Testing Services
Our Composites Technical Center of Excellence integrates engineering expertise in composites development, design, and certification with our composites testing organization to provide turn-key solutions for testing requirements. This coordination allows our customers to define their testing needs and have the engineering and testing of the required components provided as one integrated service.
Engineering Tool Design, Fabrication and Repair
Our tooling organization provides tooling design, technical supervision of contract fabrication and repair services for a wide range of projects from components, small assembly and drill jigs to determinant assembly tooling and planning. We maintain an approved supplier list for our tooling projects. These suppliers have been audited and approved by our quality department and meet quality standards for conformance to customer specifications.
Prototyping and Manufacturing Producibility Design
We provide prototyping and manufacturing producibility services to commercial, corporate and regional and military aircraft customers. These services include manufacturing and inspection planning as well as producibility assessments and prototype support. In addition, we enable part and tool rapid prototyping through additive manufacturing 3D printing. Tools and part simulations have greatly increased the speed to market on designs and functional solutions for customers.
Backlog
We consider backlog to be firm customer orders for future delivery. As a service provider, our Engineering Services segment does not typically utilize backlog to monitor its operations, other than the fixed price backlog for the MRJ and Embraer design-build projects. Our Aerostructures segment’s backlog, together with our Engineering Services segment’s fixed price backlog, is displayed in the following table:
As of December 31, | |||||||
2016 | 2015 | ||||||
($ in millions) | |||||||
Aerostructures | $ | 389.2 | $ | 395.5 | |||
Engineering Services | 1.8 | 2.8 | |||||
Total | $ | 391.0 | $ | 398.3 | |||
Portion deliverable within 12 months | $ | 329.7 | $ | 322.9 | |||
Our customers often modify purchase orders to accelerate or delay delivery dates. The level of unfilled orders at any given time during the year will be materially affected by our customers’ purchasing policies, the timing of our receipt of orders and the speed with which those orders are filled. Moreover, sales during any period may include sales that are not part of the backlog at the end of the prior period. See “Item 1A. Risk Factors – Risks Related to the Company and Industry – We may not realize all of the sales expected from our existing backlog.”
14
Raw Materials and Procurement Practices
We manufacture the majority of our components from aerospace quality aluminum sheet metal, forgings and extrusion. We also use steel, titanium, inconel, monel and other metals to support the balance of our components. We purchase the majority of these materials and hardware through contracts we have negotiated with producers of aluminum products as well as some right to buy contracts with certain customers. These contracts are designed to provide an adequate supply of material at predictable pricing levels. If supply is not available through these agreements, we use a variety of mills and distributors to support our needs. We believe that currently there are adequate alternative sources of supply.
In line with our customers’ demands for more sophisticated and complex products, we have expanded the amount of assembled products we provide. As a result, we have experienced a greater need to subcontract with capable third party suppliers for strategic components. To meet this challenge, we established a procurement management process designed to develop strategic relationships with key suppliers and to manage the supply chain to ensure the timely delivery of quality components.
For the year ended December 31, 2016, we purchased approximately 45.5% of raw materials and procured parts from six suppliers.
Quality Assurance and Control
Our Aerospace Quality Systems, which apply to both of our segments, are consistently reviewed and updated to comply with the current requirements of ISO9001, AS9100 and NADCAP special processes quality requirements. The ongoing review and updating of our processes have allowed our manufacturing facilities with third party ISO9001/AS9100 registrations to maintain those certifications.
Our quality systems include the quality review of work order masters and outside purchase orders to ensure that the flow-down of customer requirements is addressed. The quality review of the work order master also ensures that the necessary inspection operations are properly located within the work order to verify and control the outcome of the fabrication processes. We use an ongoing employee training program and lean manufacturing techniques to assist employees in becoming familiar with any changes in our procedures or special customer requirements. We use an internal auditing program for each of the facilities to ensure that the training is effective and to ensure ongoing compliance with industry and customer- required standards. The internal auditing is provided by quality engineers/auditors located throughout the organization. In addition, we utilize a first part buy-off at each operation during the fabrication and machining processes as well as final inspection of parts to verify compliance with customer configuration requirements.
As part of our quality systems, we also use the AS9102 Rev A standard and associated forms to perform First Article Inspections. Our quality organization maintains our Approved Supplier List (“ASL”) for all facilities. This process includes reviewing surveys, performing on-site audits and monitoring customer ASLs to verify that suppliers are maintaining their customers’ direct approvals.
The deployment of our quality systems and the sharing of best practices is accomplished through a Quality Council composed of management from across the enterprise. The process ensures efficient implementation of customer and industry requirements, as well as increased visibility for changes to the quality system.
In addition, our Engineering Services segment conducts quarterly management review meetings with the segment’s executive level team, analyzing internal processes and performance to ensure that we meet customer expectations with positive measurable results. Suppliers of our Engineering Services segment are approved through our supplier rating system and are maintained in our ASL database. Fabrication suppliers of our Engineering Services segment are reviewed on a continual basis with documented quality performance reviews and quality deliverable reviews. Certification documentation is reviewed through preliminary design reviews and critical design reviews by our engineering department and is routed through our internal quality design verification group for verification and validation of data. Engineering Services sites are required to go through a quality assurance internal audit program every year to ensure the effectiveness of our quality management system structure. Final audit reports are reviewed by the segment’s executive level team, site director, and internal audit team to assess required process improvements.
This attention to quality systems and business processes, as well as our certifications, have allowed us to remain an approved supplier for many of the leading OEMs and Tier 1 suppliers such as Gulfstream Aerospace Corporation, The Boeing Company, Bombardier, Inc., United Technologies Corporation, Spirit AeroSystems, Lockheed Martin Aeronautics Company, Cessna Aircraft Company, Raytheon Company and others.
15
Sales and Marketing
Our Marketing and Business Development ("M&BD") team targets three market sectors: corporate and regional aircraft, large commercial aircraft, and military aircraft. At each of our facilities, customer service representatives establish and maintain a business relationship between customers and our plants with a focus on customer satisfaction.
Awards of new work for the Aerostructures segment are generally processed by a request for quotation (“RFQ”). Upon receipt, the RFQ is reviewed by a team consisting of M&BD, operations, program management, estimating, supply chain, engineering, facility management and other personnel, as required. A bid decision is made if the team determines that the project fits our strategic goals and is within our manufacturing and supply chain management capabilities, and a proposal response is developed. The majority of new programs are awarded on a competitive bid basis. If the project engineering is evolving and the effort spans multiple facilities, a project manager and a support team are assigned. The project team will coordinate customer requirements, schedules and manufacturing approach across the organization. There are multiple levels of communication with our customers that include executive management, program management and operations for clarification of requirements and resolution of issues.
Awards of new work for the Engineering Services segment and for design-build programs generally begin with a customer inquiry in the form of a request for proposal or similar vehicle. Upon receipt, the opportunity is logged, and a cross-functional bid/no-bid decision is facilitated by the M&BD team to assure alignment with Company strategy, capability and capacity. In the event of a bid decision, the proposal response is developed and managed within the M&BD team with assistance from a proposal team consisting of representatives from operations, program management, quality engineering, tooling, estimating and other disciplines as required. The M&BD team also facilitates the cross-functional execution of our business strategy as it pertains to marketing and business development.
The M&BD team also serves as the main focal point for sales and marketing activities relating to the Aerostructures, Engineering Services and design-build programs, working in conjunction with the program management and other Company personnel to ensure seamless customer service and integrated responses to customer inquiries. This team’s main areas of responsibility include establishing and maintaining ongoing business relationships with our customer base, identifying new customer opportunities and managing responses to all proposal activity.
The Aerostructures operations and program management directly engage with existing customers and programs. All internal organizations work together to maintain and expand new and existing customer relationships.
Competition
We believe the aerospace industry competes primarily with respect to quality, delivery, price and contractual terms. Our competitors in the aerospace industry consist of a large, fragmented group of companies, including certain business units or affiliates of our customers. We believe competition within the aerospace industry will increase as a result of further industry consolidation and increased opportunities for foreign sources due to their access to low-cost labor and increasing OEM industrial participation commitments. In all of our market segments, some of our competitors, including business units affiliated with our customers, have financial, production and other resources that are substantially greater than ours. See “Item 1A. Risk Factors – Risks Related to Our Industry – We may not be able to maintain or improve our competitive position because of the intense competition in the markets we serve.”
Governmental Regulations and Environmental Compliance
Our operations are subject to extensive and frequently changing federal, state and local laws and substantial regulation by government agencies, including the U.S. Environmental Protection Agency (“EPA”), the U.S. Occupational Safety and Health Administration (“OSHA”), the Federal Aviation Administration ("FAA") and the U.S. Department of Defense. Among other matters, these agencies impose requirements that:
• | regulate the handling, transportation and disposal of hazardous materials generated or used by us during the normal course of our operations; |
•govern the health and safety of our employees; and
•require that we meet standards and licensing requirements for aerospace components.
16
In addition, we may become liable for the costs of removal or remediation of hazardous substances released on or in our facilities without regard to whether we knew of, or caused, the release of such substances. This extensive regulatory framework imposes significant compliance burdens and risks and, as a result, may substantially affect our operational costs.
Furthermore, we are subject to U.S. Export Regulations, including but not limited to the Export Administration Act (“EAR”) and the Arms Export Control Act (“AECA”) and the associated International Traffic in Arms Regulations (“ITAR”), as well as other federal regulations promulgated by various departments within the U.S. government. See “Item 1A - Risk Factors - Risks Related to Our Industry - Compliance with and changes in environmental, health and safety laws and other laws that regulate the operation of our business and industry standards could increase the cost of production and expose us to regulatory claims.”
In the quarter ended June 30, 2015, Ozark Mountain Technologies, LLC, a wholly-owned subsidiary of the Company (“OMT”), settled allegations of low pH wastewater releases by its facility between 2009 and 2013. As part of a plea agreement, OMT pled guilty to one count of negligently violating the Clean Water Act and paid a criminal fine of $0.7 million. In the quarter ended June 30, 2015, OMT settled allegations made by the Attorney General of the State of Missouri of pollution of state waters, violation of pretreatment regulations and violation of water quality standards claimed to have occurred in 2011 and in July 2015, paid civil penalties of $0.2 million. The fine and civil penalties paid in connection with both settlements were equal to the loss contingencies recorded by the Company at December 31, 2014.
In the third quarter of 2015, the Company resolved a lawsuit (the “Tech Lawsuit”) filed by the former owners of Valent Aerostructures, LLC (“Valent”) and affiliates of such owners (collectively, “Tech Investments”) against the Company for declaratory judgment on various matters resulting from the acquisition of Valent by the Company in December 2012, including the environmental charges against OMT. On November 5, 2015, the parties to the Tech Lawsuit executed the definitive settlement documents. As a result of the settlement: (a) the Tech Lawsuit was dismissed with prejudice on January 12, 2016, (b) $3.1 million of the funds that remained in escrow from the sale were disbursed to the Company and the remaining amount of escrow funds was retained by Tech Investments, (c) Tech Investments assumed an approximate $1.2 million payment obligation of the Company to a predecessor owner of OMT that remained under a purchase agreement the Company acquired as part of the Company’s acquisition of Valent; (d) the locked-up shares representing partial consideration for the purchase price paid by the Company were released to Tech Investments; and (e) all parties entered into a mutual release of certain claims and disputes. The settlement also resulted in the Company assuming other liabilities of $0.5 million, collecting a previously recorded receivable of $0.4 million and recording other expenses of $0.1 million. The net impact of the settlement resulted in a gain of $3.3 million in the third quarter of 2015, which was recorded in selling, general and administrative expenses in the accompanying Consolidated Statements of Operations.
Employees
As of December 31, 2016, we had approximately 1,651 full-time employees, of whom approximately 17 served in executive positions, 209 were engineers and engineering-related personnel, 237 served in administrative positions and 1,188 were engaged in manufacturing operations. None of our employees are subject to a collective bargaining agreement, and we have not experienced any material business interruption as a result of labor disputes since our inception. We believe that we have an excellent relationship with our employees.
We strive to continuously train and educate our employees, which enhances the skill and flexibility of our work force. Through the use of internally developed programs and our tuition reimbursement programs, we seek to attract, develop and retain the personnel necessary to achieve our growth and profitability objectives. Our internally developed programs include formal classroom, on-the-job, hands-on training, and lean manufacturing training developed jointly with external resources.
Seasonality
We do not generally experience any seasonality in the demand for our products.
Foreign Operations
The Company has a manufacturing facility in Mexico and small engineering offices in England and Sri Lanka. The Company's foreign sales were not greater than 10% of its total sales in 2016, 2015 or 2014. The amounts of revenue, profitability and identifiable assets attributable to foreign sales activity were not material when compared with revenue, profitability and identifiable assets attributed to United States domestic operations during 2016, 2015 or 2014. The Company is not subject to any significant foreign currency risks since significantly all sales are made in United States dollars. See “Item 1A - Risk Factors – Risks Related to Our Company – Risks associated with foreign operations could adversely impact us.”
17
ITEM 1A. | RISK FACTORS |
You should carefully consider the following risks and other information contained in or incorporated by reference in this Report when evaluating our business and financial condition. These risks may not be exhaustive and may adversely affect our business, financial condition and operating results.
Risks Related to the Company and Industry
The announcement of our agreement to be acquired by Sonaca could have an adverse effect on our business, operating results and our stock price.
On February 16, 2017, we entered into the Merger Agreement with the Sonaca entities defined therein (the "Sonaca Entities"). Our announcement of having entered into the Merger Agreement could cause a material disruption to our business. Additionally, we are subject to additional risks in connection with the announcement and operations prior to Closing, including, but not limited to, the following:
• | market reaction to the announcement of the Transaction; |
• | disruption to our business, including the continued diversion of significant management and other resources towards the completion of the Transaction; |
• | changes in the respective business, operations, financial position and prospects of either company during the Transaction process; |
• | market assessments of the likelihood that the Transaction will be consummated; |
• | the impact of any legal proceedings that have been or may be instituted against us, our directors, executive officers and others relating to the Transaction; and |
• | our incurrence and continued incurrence of significant costs, expenses and fees for professional services and other costs in connection with the Transaction, many of which are payable by us regardless of whether the Transaction is consummated. |
In addition, the Merger Agreement includes restrictions on the conduct of our business prior to the Closing, generally requiring us to conduct our businesses in the ordinary course, consistent with past practice, and subjecting us to a variety of specified limitations absent prior written consent by the Sonaca Entities. We may find that these and other contractual arrangements in the Merger Agreement may delay, prevent us from or limit our ability to respond effectively to financing needs, competitive pressures, industry developments and future business opportunities that may arise during such period, even if our management and board of directors think they may be advisable.
Moreover, our customers, financial counterparties and other persons with whom we have a business relationship may have uncertainties about the effects of the Transaction. Accordingly, it is possible that some customers, financial counterparties and other persons with whom we have a business relationship may delay or defer certain business decisions or might seek to terminate, change or renegotiate their relationship with us as a result of the Transaction. Similarly, current and prospective employees
18
may experience uncertainty about their future roles with us following completion of the Transaction, which may adversely affect our ability to attract, recruit, and retain employees.
Any of the effects noted above could materially and adversely impact our revenues, earnings and cash flows and other business results and financial condition, as well as the market price of our common stock and our perceived acquisition value, regardless of whether the Transaction is completed.
The delay or failure of the Transaction to be completed may adversely affect our business and our stock price.
Consummation of the Transaction is subject to a number of conditions, including:
• | the approval of the Merger Agreement by the affirmative vote of the holders of at least two-thirds of the outstanding shares of common stock of the Company; |
• | the expiration or termination of the waiting period under the Hart-Scott-Rodino Antitrust Improvements Act of 1976, as amended; |
• | clearance by the Committee on Foreign Investment in the United States and by the Directorate of Defense Trade Controls under the International Traffic in Arms Regulations; |
• | the absence of any order, injunction or law preventing or prohibiting the consummation of the Transaction; |
• | the accuracy of the representations and warranties contained in the Merger Agreement (subject to certain materiality qualifiers); |
• | compliance with covenants and agreements in the Merger Agreement in all material respects; and |
• | the absence of a material adverse effect on the Company. |
There can be no assurance that these conditions to the consummation of the Merger will be satisfied, or that the Merger will be completed on the proposed terms, within the expected timeframe or at all. In addition, other factors, such as the Sonaca Entities’ ability to obtain the financing it needs to consummate the Merger, although such financing is not a condition to Closing, may affect when and whether the Merger will occur.
If the Transaction is significantly delayed or is not completed, our stock price could fall to the extent that our current stock price reflects an assumption that the Transaction will be completed. Furthermore, if the Transaction is significantly delayed or not completed, we may suffer other consequences that could adversely affect our business, results of operations and stock price, including the following:
• | we could be required to pay a termination fee of up to $15 million to the Sonaca Entities under certain circumstances as described in the Merger Agreement; |
• | we would have incurred significant costs in connection with the Transaction that we would be unable to recover; |
• | we may be subject to negative publicity or be negatively perceived by the investment or business communities; |
• | we would not realize any or all of the potential benefits of the Transaction and our shareholders would not realize the 52% premium to the closing price of our common stock on February 16, 2017, which was a factor among many in our board’s decisions to approve the Merger Agreement; |
• | we may be subject to legal proceedings related to any delay or failure to complete the Transaction; |
• | any disruptions to our business resulting from the announcement and pendency of the Transaction, including any adverse changes in our relationships with our customers, suppliers, other business partners and employees, may continue or intensify in the event the Transaction is not consummated; and |
• | we may not be able to take advantage of alternative business opportunities or effectively respond to competitive pressures. |
19
The Merger Agreement limits our ability to pursue alternative transactions, and in certain instances requires payment of a termination fee, which could deter a third party from proposing an alternative transaction.
The Merger Agreement contains provisions that, subject to certain exceptions, limit our ability to initiate, solicit or knowingly encourage, or engage in discussions or negotiations with respect to, or provide non-public information in connection with, a proposal from a third party with respect to an alternative transaction. In addition, under specified circumstances in which the Merger Agreement is terminated, we could be required to pay a termination fee of up to $15 million. It is possible that these or other provisions in the Merger Agreement might discourage a potential competing acquirer that might have an interest in acquiring all or a significant part of our company from considering or proposing an acquisition or might result in a potential competing acquirer proposing to pay a lower per share price to acquire our common stock than it might otherwise have proposed to pay.
Litigation challenging the Merger Agreement may prevent the Transaction from being consummated at all or within the expected timeframe and may result in substantial costs to us.
A class-action lawsuit has been filed against us, our Board of Directors and other parties to the Merger Agreement, challenging our acquisition by the Sonaca Entities. This lawsuit brought by a purported stockholder of LMI Aerospace, Inc. seeks, among other things, to enjoin consummation of the Merger. One of the conditions to the consummation of the Merger is that no governmental entity having jurisdiction over us, the Sonaca Entities, or any of the other parties to the Merger Agreement shall have issued an order, decree or ruling or taken any other material action enjoining or otherwise prohibiting consummation of the Merger substantially on the terms contemplated by the Merger Agreement. As such, if the plaintiff is successful in his effort, then our acquisition by the Sonaca Entities may not be consummated at all or within the expected timeframe.
Future growth based largely in part on anticipated significantly higher production rates depends on our ability to expand production at our manufacturing facilities and effectively execute growing work statements.
Certain large commercial and corporate aircraft manufacturers have announced planned production rate increases for several of their major programs. In some cases, in order to meet these increases in production rates, we are making significant capital expenditures to expand our capacity and improve performance and integrating new people, equipment and processes into our business. If difficulty is experienced with effectively managing these efforts to meet the planned increases in production rates or should we fail to execute effectively, it could cause disruptions in our manufacturing lines or the manufacturing lines of our customers and suppliers, which could have a material adverse impact on our ability to meet commitments to our customers and on our future financial results.
We may experience continued decline in demand for design engineering services.
Due to the current lack of development programs as well as an increase in insourcing of design engineering services by our OEM customers, our Engineering Services business segment has experienced a significant decline in demand in recent years. In 2016, we recorded a pre-tax charge for impairment of goodwill and intangible assets of $28.4 million related to the Engineering Services segment, which followed a $26.4 million non-cash, non-deductible goodwill impairment charge related to Engineering Services in the fourth quarter of fiscal year 2014. Both charges were directly related to the overall decline in demand for engineering. If we are unable to find new sources of revenue for Engineering Services and leverage the capabilities of the segment to a greater extent, we may continue to be impacted by further declines.
We may experience additional costs to import our products manufactured outside the United States as a result of potential changes in trade partnerships, treaties or tax law changes impacting imported goods.
Recent changes in the United States federal government have caused significant uncertainty about the future of trade partnership and treaties, such as the Trans Pacific Partnership Agreement (TPPA) and the North American Free Trade Agreement (NAFTA). The current administration has expressed its desire to or has already taken action against these types of agreements, which have the ability to impact the industry on a macro level in terms of affecting demand for American built aircraft on which the Company has significant content as well as affect the Company more directly in its ability to leverage its lower cost facility in Mexico. Additionally, the tax law changes being considered for proposal could unfavorably impact our tax rate due to the potential for interest to no longer be deductible and certain other deductions being lost due to foreign production of goods.
We may be required to invest additional capital or offer substantial discounts to continue existing partnerships or develop new strategic partnerships with customers.
Many of our customers are moving toward developing strategic, and sometimes risk-sharing, partnerships with their larger suppliers. Each strategic partner provides an array of integrated products and services, including purchasing, warehousing
20
and assembly. We have been designated as a strategic partner by some customers and are striving to become a strategic partner of other customers. In order to maintain our current strategic partnerships and establish new ones, we will likely need to either spend additional capital to secure future partnerships, although we may not have the financial ability to do so or offer substantial price discounts to certain customers, which may negatively affect our profitability on certain contracts or programs.
OEMs in the aerospace industry have significant pricing leverage over suppliers such as us, and may be able to achieve price reductions over time, which could adversely impact our profitability.
There is substantial and continuing pressure from OEMs in the aerospace industry on suppliers such as us to reduce prices for products and services. Such pricing pressure has continued due to excess capacity in the industry and the availability of competitive pricing from businesses in low-cost labor areas. If we are required to provide further price reductions to our customers and are unable to offset these effects through operating cost reductions and efficiencies, our gross margins, profitability and cash flows could be reduced.
We face intense competition and significant pricing pressures in the markets we serve.
Our competitors in the aerospace industry consist of a large fragmented group of companies, including certain business units or affiliates of our customers. We believe that competition within the aerospace industry will continue to increase substantially as a result of industry consolidation, trends favoring greater outsourcing of components and a decrease in the number of preferred suppliers. We also believe foreign aerospace manufacturers and engineering service providers and foreign divisions of domestic aerospace businesses will become an increasing source of competition, due largely to these businesses' access to low-cost labor and the increased prevalence of industry participation commitments, pursuant to which domestic OEMs agree to award production work to manufacturers from a foreign country in order to obtain orders from that country. Some of our competitors have substantially greater financial, production and other resources than we have. These competitors may have:
• | the ability to adapt more quickly to changes in customer requirements and industry conditions or trends; |
• | greater access to capital; |
• | stronger relationships with customers and suppliers; |
• | greater name recognition; and |
• | purchased (or in the future, may purchase) critical suppliers and make them captive causing delays and potential price increases. |
In addition, our major customers may choose not to outsource production of certain products that we currently sell to them due to, among other things, their own labor, equipment, and other capacity utilization considerations. As a result, traditional factors affecting competition, such as price and quality of service, may not weigh significantly when OEMs decide whether to produce a part or service in-house or to outsource.
Due to the size and duration of certain of our long-term contracts, we are required by GAAP to estimate sales and expenses for these contracts in our financial statements, which may cause actual results to differ materially from those estimated under our assumptions or conditions.
Our financial statements are prepared in conformance with generally accepted accounting principles in the United States ("GAAP"). To be compliant with GAAP, we must make estimates and assumptions regarding our contracts that affect the reported amounts of revenue and expenses. Contract accounting requires our use of judgment relating to assessing risks, estimating contract sales and costs, and making assumptions for schedule and technical issues, among other matters. Due to the size and nature of many of our contracts, the estimation of total sales and cost is very complicated and subject to many variables, including development program delays and the expected recovery of deferred cost. Therefore, actual results may differ materially from those estimated.
Sales to a limited number of customers represent a significant portion of our revenue, and our long-term agreements with these customers are generally terminable upon written notice.
For the year ended December 31, 2016, $212.1 million of our aggregate sales were dependent upon relationships with the following three major customers and certain programs related to each: Spirit AeroSystems, Gulfstream Aerospace Corporation, and The Boeing Company. Although a majority of our sales, including sales to these customers, are made pursuant to long-term agreements, these agreements are generally terminable upon advance written notice by the customer and typically do not require
21
the customer to purchase any specific quantity of products. As a result, our sales under these agreements may not continue for the full term of the agreements or sales may not be consistent with historical levels. Additionally, the loss of any one of these customers, a significant reduction in the amount of orders received from any one of these customers, particularly on the Boeing 737 platform, or the failure to receive new program awards from any one of these customers, could cause a significant decrease in our sales and profitability. While we are always seeking out new customer opportunities, we anticipate that a small number of large customers will continue to represent a significant portion of our sales for the foreseeable future.
Recent failures by OEMs to successfully outsource non-core capabilities and services on new platforms may cause our customers to reevaluate outsourcing strategies resulting in fewer machined and fabricated components and assemblies being outsourced.
The Company's failure to meet quality or delivery expectations of customers could adversely affect our business and financial results.
Our customers have increased their expectations with respect to the on-time delivery and quality of our products and we anticipate those expectations to continue into the future. Further, announced delivery rate increases over the next few years coupled with our plans to reduce inventory levels could put additional strain on the Company's quality and delivery performance. If we fail to meet the quality or delivery expectations of our customers, this failure could result in any of the following: significant penalties, liquidated damages, recalls, costs to repair products not meeting our customer requirements, contract termination, management distraction and adverse effects to our production schedules and contract profitability. The loss of one or more of our significant customers could be damaging considering $212.1 million of our aggregate sales for the most recently-ended fiscal year were from three major customers.
Access to funding through the capital markets and debt financing are essential to the execution of our business plan and, if we are unable to continue to obtain such access, we could experience a material adverse effect on our business and financial results.
Our ability to invest in our businesses, fund our operations and contractual commitments and make strategic acquisitions requires access to the capital markets, access to term debt and/or sufficient bank credit lines to support short-term borrowings. If we are unable to continue to access the capital markets and debt financing on terms acceptable to us as a result of, for example, disruption or declines in the capital markets and/or a decline in our financial performance, outlook or credit ratings could cause us to experience difficulties in successfully executing our long-term growth strategy and/or a material adverse effect on our business and financial results.
In addition, our customers may also experience difficulty accessing the credit markets from time to time. As a result, our customers' ability to purchase our products or services may decrease. If our customers' operating and financial performance deteriorates, or if they are unable to make scheduled debt payments or obtain credit, our customers may not be able to pay, or may delay payment of, accounts receivable owed to us. Any inability of customers to pay us for our products and services may adversely affect our results of operations, cash flow, and relationships with lenders and suppliers.
Our future success will depend, to an extent, on our ability to stay current with technological changes, such as the development of alternative aerospace materials, changes in manufacturing techniques and new engineering software to meet the needs of our customers.
We believe that the commercial, military and other markets in which we operate are changing toward more sophisticated materials (e.g. composite technologies), manufacturing techniques and capabilities (e.g. additive manufacturing), some of which could require significant capital investment to employ. We believe our future success depends, to an extent, on our ability to acquire and/or develop expertise in non-metal materials and remain current on new manufacturing technologies and equipment to meet the needs of our customers. The significant cost of new equipment required to exploit certain developing manufacturing techniques and capabilities could be prohibitive. If we are unable to acquire new equipment and/or develop and execute such techniques and capabilities or we are unable to efficiently apply them, we could experience an adverse effect to our business, financial condition or results of operations. Although we are in the process of continuing to expand our development of non-metallic production capabilities and are engaged in development activities exploring the possibilities of alternative manufacturing techniques, we currently do not have significant capacity to produce large quantities of non-metal components or expertise in newer manufacturing methods.
Our products and processes require advanced equipment that is not easily programmed, repaired or replaced; equipment failures that we could experience may cause us to be unable to meet quality or delivery expectations of our customers.
22
Many of our manufacturing processes are dependent on advanced equipment and software. Because sophisticated equipment is often not easily programmed, repaired or replaced, unexpected failures of this equipment could result in production delays or the manufacturing of defective products. We also currently lack redundancy with certain sophisticated equipment which could impact our ability to meet the expectations of our customers with respect to on-time delivery of quality products. Our failure to meet the quality or delivery expectations of our customers could lead to the loss of one or more of our significant customers. However, the significant investment in our equipment and facilities that we have made and expect to make in the future may not exceed our related cost of capital.
We may experience cost over-runs related to orders for new products and changes to existing products, and should we be unsuccessful in negotiating claims, we may be unable to recoup the resulting increased costs.
We generally sell our products under multi-year agreements on a firm fixed-price basis, regardless of variable production costs. As a result, factors such as engineering changes, inaccurate estimating and pricing , manufacturing inefficiencies, start-up costs and increases in the cost of labor, materials or overhead may result in cost over-runs and losses on those agreements. While in the past we have been successful in negotiating these issues with our customers, we cannot guarantee in the future that we will succeed in obtaining customer agreement to re-price a particular product, and we may not be able to recoup previous losses resulting from such issues as incomplete or inaccurate engineering data or out-of-tolerance tooling.
Engineering Services has historically provided the majority of its services under time and material arrangements. However, recent changes in the industry and the design-build programs have resulted in an increasing number of fixed-price arrangements. Fixed-price development work inherently has more uncertainty for us than work pursuant to production or time and material contracts and, therefore, more variability in the estimates of the cost to complete such work. Development programs have very complex designs, and as technical or quality issues arise, we may experience schedule delays and higher costs to complete. Management uses its reasonable judgment to estimate the cost to perform the work and the price that we should charge. While we believe the cost and price estimates incorporated in the financial statements are appropriate, future events could result in either upward or downward adjustments to those estimates. If we underestimate the cost of a project and are unable to adjust the price accordingly, our profit margin will be less than expected, or we could incur a loss on the project.
Our long-term growth strategy depends on our ability to maintain a robust and effective supply-chain management system.
As we pursue our long-term growth strategy, we will be providing to our customers increasingly sophisticated components, assemblies and value-added services under increasing pricing pressure. The increased complexity of our products, the expected increased production rates from our key customers, expected and negotiated customer discounts, and outsourcing of non-core activities and the value-added services we are providing to our customers require us to maintain and manage an efficient, high performing and cost-effective supply chain to assure timely delivery of quality components needed to meet our delivery schedules. Effective management of our supply chain may become more difficult if our customers' production increases. Failure to continue to develop this capability or to procure from our suppliers’ quality components on a timely basis and acceptable pricing could make us non-competitive during the bidding process, decrease customer satisfaction, result in significant costs related to product recalls or charges for rework and thus our competitiveness, and could also result in lost revenue and lower profitability due to contractual penalties or lost sales.
Our long-term success and growth strategy depend on our ability to attract, integrate and retain additional qualified personnel.
Because of the highly specialized and complex nature of our business, our success and future growth also depends on management's ability to attract, hire, train, integrate and retain skilled personnel in all areas of our business. Competition for such personnel is intense, and in some Company locations, labor supply and skill base is limited. Our inability to adequately staff our operations with skilled personnel could render us less efficient and decrease our rate of production. We have written employment agreements with all members of our executive management team, however, the loss of service of one or more of our executive management personnel could result in a loss of skills and/or knowledge, which may hinder our ability to successfully pursue our long-term growth strategy.
We are subject to the cyclical nature of the aerospace industry, and any future downturn in the aerospace industry or general economic conditions could cause our sales and operating income to decrease.
We derive virtually all of our revenue from the sale of services and components for the aerospace industry. Consequently, we are directly affected by certain characteristics of and trends in the aerospace industry or general economic conditions that affect our customers, such as:
• | the relative state of the aerospace industry’s business cycle; |
23
• | new programs in commercial, military, and general aviation, which have historically experienced significant delays and engineering changes that adversely impact our sales, results of operations and cash flow; |
• | fluctuating fuel and labor costs; |
• | intense price competition and regulatory scrutiny; |
• | certain trends, including a decrease in outsourcing by aircraft manufacturers or the failure of projected market growth to materialize or continue; |
• | changes in military budgeting, sequestration and procurement for certain military aircraft; and |
• | military trend toward utilizing more Unmanned Aerial Vehicles, reducing the demand for more traditional military aircraft (e.g. Boeing F-18, General Dynamics F-16 and Lockheed Martin F-35). |
While the aerospace industry as a whole has been experiencing an upcycle for some time, in the event that these characteristics and trends adversely affect customers in the aerospace industry, the overall demand for our products and services could be significantly reduced, thereby decreasing our sales and operating income.
We may be required to record material impairment charges for goodwill and other intangible assets, which would reduce our net income and earnings per share.
Current accounting standards require a periodic review of goodwill and other intangible assets for impairment in value if circumstances indicate that the carrying amount will not be recoverable. In assessing the recoverability of our goodwill and other intangible assets, management is required to make certain critical estimates and assumptions, particularly as to manufacturing efficiency, the achievement of reductions in operating costs, and increased sales and backlog. If any of these or other estimates and assumptions are not realized in the future, we may be required to record impairment charges for goodwill and other intangible assets, which charges would reduce net income and earnings per share.
In the second quarter of 2016, a triggering event occurred when the Company significantly downgraded the full-year 2016 sales and operating income forecast for its Engineering Services business due to continued decline in demand. This downward adjustment to the forecast, combined with lower than expected operating results for the second quarter of 2016, was deemed to be a triggering event requiring an interim impairment evaluation for the Engineering Services reporting unit in accordance with ASC 350. An impairment analysis was performed and determined that the carrying value of related goodwill and intangible assets exceeded its fair value. As a result, a pre-tax, non-cash impairment charge of $28.4 million was recorded in the second quarter of 2016. This charge reduced the net book value of this reporting unit's intangible assets and goodwill to $0.3 million and $0.0 million, respectively.
During the fourth quarter of 2014 and 2013, the Company recorded pre-tax, non-cash, goodwill impairment charges of $26.4 and $73.5 million, respectively, within the Engineering Services segment and Aerostructures segment, respectively.
Goodwill accounts for $62.5 million, or 16.3%, of the Company’s total assets at December 31, 2016. At December 31, 2016, the fair value of our reporting units exceeded or approximated their net book value.
See Critical Accounting Policies under Part II, Item 7, "Management's Discussion and Analysis of Financial Condition and Results of Operations" and Note 1, Summary of Significant Accounting Policies, to the Consolidated Financial Statements under Part II, Item 8, "Financial Statements and Supplementary Data," for additional disclosure related to these items.
Risks associated with foreign operations could adversely impact us.
We operate facilities in Mexico, the United Kingdom and Sri Lanka. Doing business in foreign countries is subject to various risks, including political instability, local economic conditions, foreign government regulatory requirements, trade tariffs and the potentially limited availability of skilled labor in proximity to our facilities. In addition, we have been operating our Mexican facility through a shelter arrangement under a contractual agreement with a Mexican company. If we are unable to renew this agreement in future years on terms satisfactory to us, we may incur increased labor costs and/or experience a disruption in its operations in Mexico. We also benefit from favorable tax treatment from Mexico. Should there be changes to the laws in Mexico taxing assets not previously subject to taxation, our profitability on products manufactured at our Mexico facility could be negatively impacted.
24
If we are unable to protect our information technology infrastructure against service interruptions, data corruption, cyber-based attacks or network security breaches, our operations could be disrupted.
We rely on information technology networks and systems to manage and support a variety of business activities, including procurement and supply chain, engineering support and manufacturing. Our information technology systems may be susceptible to damage, disruptions or shutdowns due to failures during the process of upgrading or replacing software, databases or components of our technology. These systems may also be subject to failures due to: power outages, hardware failures, computer viruses, computer hackers, telecommunication failures, user errors, or even catastrophic events. In addition, security breaches could result in unauthorized disclosure of confidential information. If our information technology systems suffer severe damage, disruption or shutdown and our business continuity plans do not effectively resolve the issues in a timely manner, our manufacturing process could be disrupted, resulting in late deliveries and breached customer contracts. In addition, the costs related to cyber or other security threats or disruptions may not be fully insured or indemnified and could have a material adverse effect on our reputation, results of operations, and financial condition.
Compliance with and changes in environmental, health and safety laws and other laws that regulate the operation of our business and industry standards could increase the cost of production and expose us to regulatory claims.
Our operations are subject to extensive and frequently changing federal, state and local laws and substantial regulation by government agencies, including the U.S. Environmental Protection Agency (“EPA”), the U.S. Occupational Safety and Health Administration (“OSHA”), the Federal Aviation Administration ("FAA"), and the U.S. Department of Defense ("DoD"). Among other matters, these agencies impose requirements that:
• | regulate the operation, handling, transportation and disposal of hazardous materials generated or used by us during the normal course of our operations; |
• | govern the health and safety of our employees; and |
• | require that we meet standards and licensing requirements for aerospace components. |
In particular, we use and generate hazardous waste in our operations. Consequently, we monitor hazardous waste management and applicable environmental permitting and reporting for compliance with applicable laws at our locations in the ordinary course of our business. We may be subject to potential material liabilities relating to any investigation and cleanup of any contamination at our locations or properties where we deliver hazardous waste for handling or disposal and to claims alleging personal injury. In addition, we have incurred, and expect to continue to incur, costs to comply with environmental laws and regulations. The adoption of new laws and regulations, stricter enforcement of existing laws and regulations, the discovery of previously unknown contamination or the imposition of new cleanup requirements could require us to incur costs and become subject to new or increased liabilities that could increase our operating costs and adversely affect the manner in which we conduct our business.
We are also subject to U.S. Export Regulations, including the Arms Export Control Act, associated International Traffic in Arms Regulations and Export Administration Regulations. Failure to comply with such regulations could result in substantial fines, significant time and costs related to training personnel for cause and corrective action, penalties and limit our ability to export certain products.
While we are required to hold FAA certifications only to a limited extent, we typically are required to maintain third-party registrations with respect to industry specification standards, such as AS9100 and NADCAP, for our quality systems and processes. In fact, many individual OEMs and Tier 1 suppliers require certifications or approvals of our work based on third-party registrations in order to engineer and serve the systems and components used in specific aircraft models. If material OEM certifications or approvals were to be revoked or suspended, OEMs might cease purchasing our products.
Moreover, if in the future new or more stringent governmental regulations are adopted, or industry oversight heightened, such action could result in our incurrence of significant additional costs and have an adverse effect on our financial condition or results of operations.
A downgrade, suspension or withdrawal, if any, of the rating assigned by a rating agency to the Company or our notes could adversely affect the price of our common stock and other costs of capital.
25
Our notes have been rated by nationally recognized statistical rating agencies and may be rated by additional rating agencies in the future. We also have corporate ratings assigned by rating agencies. We cannot guarantee that any rating assigned will remain for any given period of time or that a rating will not be lowered or withdrawn entirely by a rating agency if, in that rating agency's judgment, circumstances relating to the basis of the rating, such as adverse changes in our business, so warrant. Any downgrade, suspension or withdrawal of a rating by a rating agency could adversely affect the price of our common stock and other costs of capital.
Decreases in the availability or increases in the cost of our raw materials would increase our operating costs.
Most of our components are manufactured from aluminum products. From time to time, we, and the aerospace components industry as a whole, have experienced shortages in the availability of aerospace quality aluminum. In addition, we utilize certain materials in the manufacture of our non-aerospace products that, in some cases, may be provided by a limited number of suppliers. Raw material shortages could limit our ability to meet our production needs and adversely affect our ability to deliver products to our customers on a timely basis. Also, raw material shortages and capacity constraints at our raw material producers are outside of our control and can cause the price of aluminum to increase. Any significant shortage or price escalation of raw materials such as aluminum could increase our operating costs, which would likely have an adverse impact on our financial results. Composite and machined products have a higher percentage of raw material content and thus, are more susceptible to gross margin impacts. As rate increase on commercial aerospace platforms rise so do the lead times for certain raw material which makes reorder points a critical step in our manufacturing and planning process. One part missed in the process could result in a delivery being delayed and our ability to meet commitments to our customers and our future financial results being jeopardized.
Our facilities are located in regions that are affected by natural disasters.
Several of our facilities are located in regions that have a higher than average risk of earthquake and tornado activity and one of our facilities has experienced damage due to floods. Although we maintain earthquake and flood loss insurance where we deem appropriate, an earthquake, flood or other natural disaster could disrupt our business, result in significant recovery costs and cause our productivity and profits to decrease.
Demand for our defense-related products depends in part upon government spending.
A material portion of our sales, 13.2% in the year ended December 31, 2016, is derived from the military market. The military market is largely dependent upon government budgets, particularly the U.S. defense budget. The funding of government programs is subject to Congressional appropriation and the possibility of sequestration. Although multi-year contracts may be authorized in connection with major procurements, the U.S. Congress generally appropriates funds on a fiscal year basis even though a program may be expected to continue for several years. Consequently, programs, including those that require our components, including the Blackhawk, F-15, and F-18, may be only partially funded or may never enter full-scale production as expected. As a result, future U.S. defense spending may not be allocated to programs that would benefit our business or at the levels we had anticipated. A decrease in levels of defense spending or the government's termination of, or failure to fully fund, one or more of the contracts for the programs in which we participate would adversely impact our sales, cash flow, and growth prospects.
Most U.S. government contracts under which we are subcontracted can be terminated by the U.S. government either for its convenience or if the prime contractor defaults by failing to perform under the contract. In addition, the prime contractor typically has the right to terminate our subcontract for its convenience or if we default by failing to perform under the subcontract. Termination for convenience provisions generally permit us to recover only our costs incurred or committed, plus settlement expenses and a reasonable profit, which may be different from what we bid or our historical profit rates, on the work completed prior to termination. Debarment from participating in government contracts could lead to loss of sales and disruption in our workflow.
We may not realize all of the sales expected from our existing backlog.
As of December 31, 2016, we had approximately $391.0 million of order backlog. As a service provider, our Engineering Services segment does not typically utilize backlog to monitor its operations. We consider backlog to be firm customer orders for future delivery. From time to time, our OEM customers provide projections of components and assemblies that they anticipate purchasing in the future under new and existing programs. These projections are not included in our backlog unless we have received a firm purchase order or commitment from our customers. Our customers may have the right, under certain circumstances and with certain penalties or consequences, to cancel, reduce or defer firm orders that we have in backlog. If our customers cancel, reduce or defer firm orders, we may be protected from certain costs and losses, but our sales will nevertheless be adversely affected.
26
Given the nature of our industry and customers, there is always a risk that orders may be cancelled or rescheduled due to fluctuations in our customers' production and/or sales forecasts, purchasing budgets or inventory management practices. Moreover, our realization of sales from new and existing programs is inherently subject to a number of important risks and uncertainties, including the possibility that our customers will not launch programs on time, or at all, and the number of units that our customers will actually produce may change or the timing of production may be altered. Also, until firm orders are committed, our customers generally have the right to discontinue a program, dual source or replace us with another supplier at any time without penalty. Our failure to realize sales from new and existing programs would adversely impact our revenue; results of operations and cash flow, as a large portion of our operating expenses are relatively fixed.
Operation by end-users of the product platforms into which our components are integrated could expose us to product liability claims.
We may be exposed to possible claims of personal injury, death, grounding costs, property damage or other liabilities that result from the failure or malfunction of a component or assembly fabricated or designed by us. We currently have policies in place for products liability and premises insurance, which we believe provide adequate coverage in amounts and on terms that are generally consistent with industry practice. Nevertheless, to the extent a claim is made against us that is not covered in whole or in part by our current insurance, we may be subject to a material loss. Moreover, any claims that are covered by our policies would likely cause our premiums to increase, and we might not be able to maintain adequate insurance coverage levels in the future. Additionally, since we do not carry product recall insurance we could be subject to recall expenses associated with any product failures determined to be our fault.
We may raise capital, which could result in dilution and cause the stock price of our common stock to decline.
Our business plan anticipates the need for new capital to support the continued development of capabilities, either through internal investment or acquisition. We may raise new capital through debt (including debt securities and/or bank borrowings), the issuance of additional shares of our common stock or the issuance of securities convertible into or exchangeable for shares of our common stock. Should we choose to raise capital by issuing or selling shares of our common stock (or securities convertible into or exchangeable for shares of common stock) for any reason, such issuance will likely have a dilutive effect on the holders of our common stock and/or could have a material negative impact on the market price of our common stock.
Risks Related to our Indebtedness
Our substantial level of indebtedness may adversely affect our cash flow and our ability to operate our business.
As of December 31, 2016, we had $243.3 million of total debt outstanding including notes of $224.2 million, due July 15, 2019. We had no outstanding borrowings under our current revolving credit facility at December 31, 2016.
Our substantial level of indebtedness relative to shareholders’ equity could have important consequences to you, including with respect to our ability to declare and pay a dividend, and significant effects on our business, including the following:
• | we must use a substantial portion of our cash flow from operations to pay interest on the notes and our other indebtedness, which reduces the funds available to use for operations and other purposes including our other financial obligations; |
• | our ability to obtain additional financing for working capital, capital expenditures, strategic acquisitions or general corporate purposes may be impaired; |
• | we could be at a competitive disadvantage compared to our competitors that may have proportionately less debt; |
• | our flexibility in planning for, or reacting to, changes in our business and the industry in which we operate may be limited; |
• | our ability to fund a change of control offer may be limited; and |
• | we may be more vulnerable to economic downturns and adverse developments in our business. |
Our ability to meet our expenses and make debt payments depends on our future performance, which will be affected by financial, business, economic and other factors, many of which we cannot control. Our business may not generate sufficient cash flow from operations in the future, and our currently anticipated growth in sales and cash flow may not be realized, either or both of which could result in our being unable to repay indebtedness, including the notes, or to fund other liquidity needs. If we do not
27
have enough funds, we may be in breach our debt covenants and/or be required to refinance all or part of our then existing debt, sell assets or borrow more funds, which we may not be able to accomplish on terms favorable to us, or at all. In addition, the terms of existing or future debt agreements may restrict us from pursuing any of these alternatives.
The indenture governing the notes imposes significant operating and financial restrictions, which may prevent us from pursuing certain business opportunities and taking certain actions that may be potentially profitable or in our best interests.
The indenture governing the notes imposes, and future debt agreements may impose, operating and financial restrictions on us. These restrictions limit or prohibit, among other things, our ability to:
• | incur or guarantee additional indebtedness or issue certain preferred stock; |
• | make certain investments or acquisitions; |
• | issue stock of subsidiaries; |
• | grant or permit certain liens on our assets; |
• | enter into certain transactions with affiliates; |
• | pay dividends, redeem subordinated debt or make other restricted payments; |
• | merge, consolidate or transfer substantially all of our assets; |
• | transfer, sell or acquire assets, including capital stock of our subsidiaries; and |
• | change the business we conduct. |
These covenants could adversely affect our ability to finance our future operations or capital needs, withstand a future downturn in our business or the economy in general, engage in business activities, including future opportunities that may be in our interest, and plan for or react to market conditions or otherwise execute our business strategies. A breach of any of these covenants could result in a default in respect of the related indebtedness. If a default occurs, the relevant lenders or holders of such indebtedness could elect to declare the indebtedness, together with accrued interest and other fees, to be immediately due and payable and proceed foreclosing on any collateral securing that indebtedness. Acceleration of our other indebtedness could result in a default under the terms of the Indenture. There is no guarantee that we would be able to satisfy our obligations if any of our indebtedness is accelerated.
Due to many factors beyond our control, we may not be able to generate sufficient cash to service all of our indebtedness, including the notes, and meet our other ongoing liquidity needs, and we may be forced to take other actions to satisfy our obligations under our debt agreements, which may not be successful.
Our ability to make scheduled payments on or to refinance our debt obligations, including the notes, and to fund any future capital expenditures and meet our other ongoing liquidity needs depends on our financial condition and operating performance, which are subject to prevailing economic and competitive conditions, fluctuations to such conditions, and to certain financial, business and other factors beyond our control. We may not generate sufficient cash flow from operations in the future and our currently anticipated levels of revenue and cash flow may not be realized, either or both of which could result in our being unable to repay the principal, premium, if any, and interest on our indebtedness, including borrowings under our revolving credit facility and the notes.
If our cash flows and capital resources are insufficient to fund our debt service obligations, we may be forced to reduce or delay investments and capital expenditures, sell assets, seek additional capital or restructure or refinance our indebtedness, including our indebtedness under our new revolving credit facility and the notes. Our ability to restructure or refinance our debt will depend on the condition of the capital markets and our financial condition at such time and may require our lenders’ consent, which we may not be able to obtain. Any refinancing of our debt could be at higher interest rates and may require us to comply with more onerous borrowing covenants, which could further restrict our business operations. In addition, any failure to make payments of principal and interest on our outstanding indebtedness on a timely basis would likely result in a reduction of our credit rating, which could harm our ability to incur additional indebtedness. These alternative measures may not be successful and may not permit us to meet our scheduled debt service obligations.
28
Our current revolving credit facility contains financial covenants and other restrictive covenants that limit our flexibility. We may not be able to comply with these covenants, which could result in the amounts outstanding under our current revolving credit facility becoming immediately due and payable.
Our current revolving credit facility requires us to comply with certain financial covenants based on outstanding amounts. Accordingly, if our financial performance significantly worsens, we could become non-compliant with such covenants. If we fail to meet any covenants in our current revolving credit facility and cannot secure a waiver of such failure, the lenders under current revolving credit facility would be entitled to exercise various rights, including causing any amounts outstanding to become immediately due and payable.
In addition, our current revolving credit facility contains other restrictive covenants, including covenants that limit and in some circumstances prohibit, our ability to, among other things, incur additional debt, sell, lease or transfer our assets, pay dividends, make investments, loans, advances and acquisition, engage in sale-leaseback transactions, guarantee debt or obligations, create liens, enter into transactions with our affiliates and enter into certain merger, consolidation or other reorganization transactions. We would also be subject to requirements to make mandatory prepayments with the net proceeds of certain asset sales and debt issuances, and so long as any such debt issuance is permitted pursuant to the credit facility, there would be no corresponding reduction of the commitment amount. These restrictions could limit our ability to obtain future financing, make acquisitions or needed capital expenditures, withstand the current or future downturns in our business or the economy in general, conduct operations or otherwise take advantage of business opportunities that may arise, any of which could place us at a competitive disadvantage relative to our competitors that have less debt and are not subject to such restrictions.
ITEM 1B. | UNRESOLVED STAFF COMMENTS. |
None.
ITEM 2. | PROPERTIES. |
We operate manufacturing plants and other facilities (including office, distribution, engineering and other service facilities) primarily in the United States and Mexico. We lease nineteen of our manufacturing plants and other facilities and own four. We consider our major operating properties to be in good operating condition and suitable for their current use. We believe that the productive capacity of our plants and other facilities is generally adequate for current operations.
The Company's principal facilities are as follows:
29
Location | Primary Operations Performed | |
St. Charles, Missouri | Assembly | |
Cottonwood Falls, Kansas | Assembly | |
Lenexa, Kansas | Assembly | |
St. Charles, Missouri | Fabrication | |
Auburn, Washington | Fabrication | |
Everett, Washington | Fabrication | |
Mexicali, Mexico | Fabrication | |
Vista, California | Fabrication | |
Wichita, Kansas | Fabrication | |
Tulsa, Oklahoma | Finishing | |
Cuba, Missouri | Finishing | |
Fredonia, Kansas | Machining | |
Sun Valley, California | Machining | |
Washington, Missouri | Machining | |
Wichita, Kansas | Machining | |
Tulsa, Oklahoma | Distribution | |
Savannah, Georgia | Kitting, Distribution | |
Dallas/Fort Worth, Texas | Engineering Services | |
Everett, Washington | Engineering Services | |
San Diego, California | Engineering Services | |
Stansted, Essex, England | Engineering Services | |
Negombo, Sri Lanka | Engineering Services | |
St. Charles, Missouri | Offices | |
ITEM 3. | LEGAL PROCEEDINGS. |
The Company is not a party to any legal proceedings, excluding routine claims and lawsuits arising in the ordinary course of our business. We do not believe such routine claims and lawsuits, individually or in the aggregate, will have a material adverse effect on our business.
ITEM 4. | MINE SAFETY DISCLOSURES. |
Not Applicable.
PART II
ITEM 5. | MARKET FOR REGISTRANT’S COMMON EQUITY, RELATED STOCKHOLDER MATTERS AND ISSUER PURCHASES OF EQUITY SECURITIES. |
Market Information
The Company’s common stock is traded on the NASDAQ Global Market under the symbol “LMIA.” The following table sets forth the range of high and low closing sale prices for the Company’s common stock for the periods indicated during the Company’s past two fiscal years:
30
Period | High | Low | ||||||
Fiscal Year 2016 | ||||||||
1st quarter | $ | 9.89 | $ | 8.51 | ||||
2nd quarter | 8.94 | 7.66 | ||||||
3rd quarter | 8.12 | 7.13 | ||||||
4th quarter | 9.20 | 7.05 | ||||||
Fiscal Year 2015 | ||||||||
1st quarter | 14.62 | 11.95 | ||||||
2nd quarter | 12.43 | 9.85 | ||||||
3rd quarter | 12.08 | 9.68 | ||||||
4th quarter | 11.25 | 9.30 | ||||||
Holders
As of March 1, 2017, there were approximately 148 holders of record of the Company’s common stock.
Dividends
We have not historically declared or paid cash dividends on our common stock, and we do not anticipate paying any cash dividends in the foreseeable future. Our credit facilities prohibit us from declaring a dividend with respect to our common stock. We currently intend to retain our earnings, if any, and reinvest them in the development of our business.
Securities Authorized for Issuance under Equity Compensation Plans
On July 7, 2005, the Company's shareholders approved the LMI Aerospace, Inc. 2005 Long-term Incentive Plan (the “2005 Plan”). The 2005 Plan provided for the grant of non-qualified stock options, incentive stock options, shares of restricted stock, restricted stock units, stock appreciation rights, performance awards, and other stock-based awards and cash bonus awards to employees or directors. Up to 1,200,000 shares of the Company's common stock were authorized for issuance under the 2005 Plan. As of July 7, 2015 the Company was no longer able to grant awards under the 2005 Plan.
On June 24, 2015, the Company's shareholders approved the LMI Aerospace, Inc. 2015 Incentive Compensation Plan (the “2015 Plan”), which became effective on July 1, 2015. Under the 2015 Plan, the Company, through the Compensation Committee of the Board of Directors, may, at its discretion, grant stock options, restricted shares of common stock, and other various stock-based awards to directors, officers, employees and consultants. A total of 750,000 shares of the Company’s common stock have been reserved for issuance under the 2015 Plan.
The following table summarizes information about our equity compensation plans as of December 31, 2016. All outstanding awards relate to the Company’s common stock.
31
Plan Category | Number of securities that remain available for future issuance under equity compensation plans | ||
Equity compensation plans approved by security holders: | |||
2005 Long-Term Incentive Plan | — | ||
2015 Long-Term Incentive Plan | 420,200 | ||
Equity compensation plans not approved by security holders | — | ||
Total | 420,200 | ||
448,665 shares of unvested, restricted stock with a $10.46 per share weighted-average grant date fair market value have been issued under these plans and remain outstanding at December 31, 2016.
The Company made no purchases of its common stock during the year ended December 31, 2016, and the Company does not maintain an active repurchase program.
Performance Graph
Set forth below is a line graph presentation comparing the yearly percentage change in cumulative total shareholder returns since December 31, 2011 on an indexed basis with the Standard & Poors (“S&P”) 500 Index and the S&P Small Cap Aerospace/Defense Index, which is a nationally recognized industry standard index.
The following graph assumes the investment of $100 in LMI Aerospace common stock, the S&P 500 Index and the S&P Small Cap Aerospace/Defense Index as well as the reinvestment of all dividends. There can be no assurance that the performance of the Company’s common stock will continue into the future with a trend that is the same or similar to the trend depicted in the graph below.
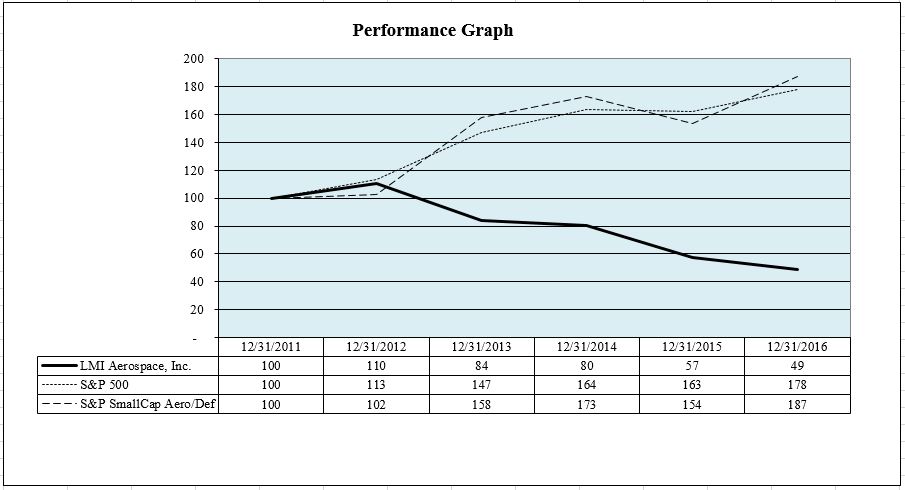
32
ITEM 6. | SELECTED FINANCIAL DATA. |
The selected financial data set forth below for the year ended December 31, 2016, and each of the four preceding fiscal years, should be read in conjunction with “Item 7. Management’s Discussion and Analysis of Financial Condition and Results of Operations,” the consolidated financial statements, related notes and other financial information included herein.
(Dollar amounts in thousands, except share and per share data)
2016 | 2015 | 2014 | 2013 | 2012 (1) | |||||||||||||||
Statement of Operations Data: | |||||||||||||||||||
Net sales | $ | 346,180 | $ | 375,096 | $ | 387,817 | $ | 412,557 | $ | 278,629 | |||||||||
Cost of sales | 286,377 | 306,310 | 312,447 | 332,695 | 210,321 | ||||||||||||||
Gross profit | 59,803 | 68,786 | 75,370 | 79,862 | 68,308 | ||||||||||||||
Selling, general & administrative expenses (2) | 44,541 | 45,678 | 55,204 | 55,862 | 36,891 | ||||||||||||||
Impairment expense (3) | 28,368 | — | 26,439 | 77,750 | — | ||||||||||||||
Contingent consideration write-off (4) | — | — | — | (7,950 | ) | — | |||||||||||||
Acquisition expense (5) | — | — | — | 247 | 5,362 | ||||||||||||||
Restructuring expense (6) | 1,212 | 2,322 | 2,585 | 3,073 | — | ||||||||||||||
(Loss) income from operations | (14,318 | ) | 20,786 | (8,858 | ) | (49,120 | ) | 26,055 | |||||||||||
Other income (expense): | |||||||||||||||||||
Interest expense (7) | (21,171 | ) | (22,439 | ) | (29,280 | ) | (16,962 | ) | (1,771 | ) | |||||||||
Other (expense) income, net | (352 | ) | (236 | ) | 223 | 618 | 356 | ||||||||||||
Total other expense | (21,523 | ) | (22,675 | ) | (29,057 | ) | (16,344 | ) | (1,415 | ) | |||||||||
(Loss) income before income taxes | (35,841 | ) | (1,889 | ) | (37,915 | ) | (65,464 | ) | 24,640 | ||||||||||
(Benefit) provision for income taxes (8) | (734 | ) | 352 | (8,953 | ) | (6,979 | ) | 8,153 | |||||||||||
Net (loss) income | $ | (35,107 | ) | $ | (2,241 | ) | $ | (28,962 | ) | $ | (58,485 | ) | $ | 16,487 | |||||
Amounts per common share: | |||||||||||||||||||
Net (loss) income - per common share | $ | (2.68 | ) | $ | (0.17 | ) | $ | (2.28 | ) | $ | (4.64 | ) | $ | 1.41 | |||||
Net (loss) income - assuming dilution | $ | (2.68 | ) | $ | (0.17 | ) | $ | (2.28 | ) | $ | (4.64 | ) | $ | 1.39 | |||||
Weighted average common shares outstanding | 13,113,901 | 12,869,353 | 12,716,976 | 12,607,833 | 11,701,607 | ||||||||||||||
Weighted average dilutive common shares outstanding | 13,113,901 | 12,869,353 | 12,716,976 | 12,607,833 | 11,839,182 | ||||||||||||||
Other Financial Data: | |||||||||||||||||||
Capital expenditures | $ | 11,813 | $ | 16,599 | $ | 16,690 | $ | 24,149 | $ | 19,529 | |||||||||
Cash provided (used) by operating activities | 14,551 | 32,362 | 49,117 | (8,349 | ) | 8,799 | |||||||||||||
Cash used by investing activities | (11,174 | ) | (16,314 | ) | (13,111 | ) | (22,253 | ) | (235,000 | ) | |||||||||
Cash (used) provided by financing activities | (11,390 | ) | (13,471 | ) | (29,651 | ) | 27,827 | 222,680 | |||||||||||
Gross profit margin | 17.3 | % | 18.3 | % | 19.4 | % | 19.4 | % | 24.5 | % | |||||||||
Balance Sheet Data: | |||||||||||||||||||
Cash and cash equivalents | $ | 2,491 | $ | 10,504 | $ | 7,927 | $ | 1,572 | $ | 4,347 | |||||||||
Working capital | 122,531 | 132,384 | 139,444 | 148,302 | 109,394 | ||||||||||||||
Total assets | 383,632 | 415,980 | 432,614 | 469,691 | 514,768 | ||||||||||||||
Long-term debt, excluding current portion | 237,398 | 247,633 | 259,645 | 277,702 | 245,710 | ||||||||||||||
Shareholders' equity | 85,541 | 117,956 | 118,135 | 144,144 | 200,954 | ||||||||||||||
(1) | Includes the operating results of TASS and Valent subsequent to their acquisition dates of August 7, 2012 and December 28, 2012, respectively and includes related purchase accounting adjustments and debt acquired to finance these acquisitions. |
(2) | In the third quarter of 2015, the Company recorded a net gain of $3,347 related to a legal settlement. |
33
(3) | In the second quarter of 2016, a triggering event occurred when the Company significantly downgraded the full-year 2016 sales and operating income forecast for its Engineering Services business due to continued decline in demand. This downward adjustment to the forecast, combined with lower than expected operating results for the second quarter of 2016, was deemed to be a triggering event requiring an interim impairment evaluation for the Engineering Services reporting unit in accordance with ASC 350. An impairment analysis was performed and determined that the carrying value of related goodwill and intangible assets exceeded its fair value. As a result, a non-cash impairment charge of $28,368 was recorded in the second quarter of 2016. |
During the fourth quarter of fiscal 2014, in accordance with the Company’s accounting policy as described in Note 1 to the Consolidated Financial Statements, the Company performed the annual impairment analysis and determined that carrying value for goodwill for the Engineering Services segment was above its fair value. As a result, a non-cash goodwill impairment charge of $26,439 was recorded in the fourth quarter of 2014.
During the fourth quarter of fiscal 2013, in accordance with the Company’s accounting policy as described in Note 1 to the Consolidated Financial Statements, the Company performed the annual impairment analysis and determined that carrying value for goodwill for Valent was above its fair value. As a result, a non-cash goodwill impairment charge of $73,528 was recorded in the fourth quarter of 2013.
In the second quarter of 2013, a triggering event occurred when the Company started an initiative to rebrand its core engineering business. As result of this initiative, the D3 Technologies name was no longer being used; thus, the $4,222 indefinite lived intangible asset related to that trade name was deemed to be fully impaired.
(See ITEM 7. Management's Discussion and Analysis of Financial Condition and Results of Operations, Critical Accounting Policies, "Goodwill and Intangible Assets" and Note 1, "Goodwill and Intangible Assets").
(4) | In the second quarter of 2013, the Company realized a $7,950 non-cash benefit related to the write-off of the contingent consideration associated with the December 2012 purchase of Valent. The earnings levels required to be achieved by Valent in order for the former owners of Valent to be paid contingent consideration were deemed not likely to be achieved by the required date of December 31, 2013. |
(5) | Includes investment banking, accounting, legal, tax and valuation expenses primarily as a direct result of the TASS and Valent acquisitions. |
(6) | The year ended December 31, 2016 includes $265 related to the relocation of the Wichita sheet metal fabrication operation and $947 related to other employment separation activities. The year ended December 31, 2015 includes $150 related to the closure of the St. Charles machine parts operations, $94 related to the closure of the Coweta, OK manufacturing facility, $496 related to the closure of engineering offices in Greenville, SC and Melbourne Australia, $718 related to other reductions in the engineering services segment and $864 related to other employment separation activities. The year ended December 31, 2014 includes $287 related to the closure of the Precise Machine facility in Forth Worth, TX, $47 related to the relocation of the Savannah machining operations, $228 related to the closure of the St. Charles machine parts operations and $2,023 related to other employment separation activities. The year ended December 31, 2013 includes $453 related to the closure of the Precise Machine facility in Fort Worth, TX and $2,620 related to the separation agreement reached with key members of Valent. |
(7) | The years ended December 31, 2016, 2015, 2014 and 2012 include $156, $215, $8,466 and $580, respectively, for the write-off of debt financing costs related to the modification and termination of certain debt instruments. The year ended December 31, 2014 also includes a charge of $793 related to the termination and settlement interest rate derivatives. |
(8) | The year ended December 31, 2014 includes $8,931 of income tax benefits generated from income tax losses for 2013 and 2014 that the Company decided in 2014 to carry back to prior years. The year ended December 31, 2013 includes a $17,718 valuation charge against deferred tax assets at December 31, 2013 related to the goodwill impairment at Valent noted in (3) above. |
34
ITEM 7. | MANAGEMENT’S DISCUSSION AND ANALYSIS OF FINANCIAL CONDITION AND RESULTS OF OPERATIONS. |
Overview
We are a leading supplier of structural assemblies, kits and components and design engineering services to the aerospace and defense markets. We primarily sell our products and services to the large commercial, corporate and regional, and military aircraft markets. We believe that OEMs and Tier 1 aerospace companies will continue the trend of selecting their suppliers based upon the breadth of more complex and sophisticated design and manufacturing capabilities and value-added services and the ability of their suppliers to manage large production programs.
We are organized into two reportable segments: the Aerostructures segment and the Engineering Services segment. Our Aerostructures segment fabricates, machines, finishes, integrates, assembles and kits machined and formed close tolerance aluminum, specialty alloy, composite components and higher level assemblies for use by the aerospace and defense industries. Our Engineering Services segment provides a complete range of design, engineering and program management services, supporting aircraft product lifecycles from conceptual design, analysis and certification through production support, fleet support, and service life extensions via a complete turnkey engineering solution.
Recent Events
On February 16, 2017, the Company entered into a Merger Agreement with Sonaca S.A. relating to the proposed acquisition of the Company. The Merger Agreement provides that each outstanding share of common stock of the Company will cease to be outstanding at the effective time of the merger and will be converted into the right to receive $14.00 in cash, without interest and subject to any applicable tax withholding. Shareholders of the Company will be asked to vote on the approval of the Merger Agreement at a special shareholders’ meeting that will be held on a date to be announced.
In the second quarter of 2016, a triggering event occurred when the Company significantly downgraded the full-year 2016 sales and operating income forecast for its Engineering Services business due to continued decline in demand. This downward adjustment to the forecast, combined with lower than expected operating results for the second quarter of 2016, was deemed to be a triggering event requiring an interim impairment evaluation for the Engineering Services reporting unit in accordance with ASC 350. An impairment analysis was performed and determined that the carrying value of related goodwill and intangible assets exceeded its fair value. As a result, a non-cash impairment charge of $28.4 million was recorded in the second quarter of 2016. (See Item 7, Management's Discussion and Analysis of Financial Condition and Results of Operations,"Critical Accounting Estimates.")
During the fourth quarter of 2014, the Company performed its annual impairment testing of the Engineering Services segment which resulted in a $26.4 million goodwill impairment charge. (See Item 7, Management's Discussion and Analysis of Financial Condition and Results of Operations,"Critical Accounting Estimates.")
On June 19, 2014, the Company issued $250.0 million in second-priority senior secured notes maturing on July 15, 2019. Obligations under these notes are secured by substantially all of the Company’s assets and bear interest at 7.375%, paid semi-annually in January and July, which commenced in January of 2015. Also, on June 19, 2014, the Company used the proceeds from the issuance of these notes to settle and terminate its existing term loan and also modified its revolving credit agreement. As a result, unamortized debt issuance costs associated with the agreement of $8.3 million were written off and recognized as interest expense. Additional debt issuance costs of $8.3 million were incurred as a result of these transactions and are being amortized over the term of the notes and revolving credit agreement.
In January 2015, the Company entered into a long-term supply agreement with Spirit covering all Boeing, Airbus, Bombardier and Mitsubishi aircraft. This agreement extended the performance period of the statements of work for certain contracts and gives the Company preferred supplier status on certain future contracts. In accordance with the contract terms, the Company made $6.5 million in cash payments of consideration to Spirit in 2015.
Results of Operations
The following table illustrates the percentage of sales to primary industries and markets realized over the last three years.
35
Market | 2016 | 2015 | 2014 | |||||
Large commercial aircraft | 57.0 | % | 52.9 | % | 50.1 | % | ||
Corporate and regional aircraft | 23.2 | % | 26.0 | % | 26.1 | % | ||
Military | 13.2 | % | 13.4 | % | 15.1 | % | ||
Other (1) | 6.6 | % | 7.7 | % | 8.7 | % | ||
Total | 100.0 | % | 100.0 | % | 100.0 | % | ||
(1) Includes technology, testing, rail yard switching equipment and various other products.
Year ended December 31, 2016 compared to year ended December 31, 2015
The following table provides the comparative data for 2016 and 2015:
2016 | |||||||||||||||
Aerostructures | Engineering Services | Elimination | Total | ||||||||||||
($ in millions) | |||||||||||||||
Net sales | $ | 311.1 | $ | 36.3 | $ | (1.2 | ) | $ | 346.2 | ||||||
Cost of sales | 254.4 | 32.9 | (0.9 | ) | 286.4 | ||||||||||
Gross profit | 56.7 | 3.4 | (0.3 | ) | 59.8 | ||||||||||
S, G, & A and other charges (1) | 40.6 | 33.5 | — | 74.1 | |||||||||||
Income (loss) from operations | $ | 16.1 | $ | (30.1 | ) | $ | (0.3 | ) | $ | (14.3 | ) | ||||
(1) Includes $28.4 million in the Engineering Services segment related to goodwill and intangible asset impairment.
2015 | |||||||||||||||
Aerostructures | Engineering Services | Elimination | Total | ||||||||||||
($ in millions) | |||||||||||||||
Net sales | $ | 327.2 | $ | 49.1 | $ | (1.2 | ) | $ | 375.1 | ||||||
Cost of sales | 263.6 | 43.8 | (1.1 | ) | 306.3 | ||||||||||
Gross profit | 63.6 | 5.3 | (0.1 | ) | 68.8 | ||||||||||
S, G, & A and other charges | 39.6 | 8.4 | — | 48.0 | |||||||||||
Income (loss) from operations | $ | 24.0 | $ | (3.1 | ) | $ | (0.1 | ) | $ | 20.8 | |||||
Aerostructures Segment
Net Sales. Net sales were $311.1 million in 2016, a decrease of 4.9% from $327.2 million in 2015. The following table summarizes total sales for the segment and the percentage of total sales represented by the market served for each of the years ended December 31, 2016 and December 31, 2015:
Category | 2016 | % of Total | 2015 | % of Total | ||||||||||
($ in millions) | ||||||||||||||
Large commercial aircraft | $ | 184.5 | 59.3 | % | $ | 176.2 | 53.9 | % | ||||||
Corporate and regional aircraft | 70.3 | 22.6 | % | 84.7 | 25.9 | % | ||||||||
Military | 36.0 | 11.6 | % | 39.2 | 12.0 | % | ||||||||
Other | 20.3 | 6.5 | % | 27.1 | 8.2 | % | ||||||||
Total | $ | 311.1 | 100.0 | % | $ | 327.2 | 100.0 | % | ||||||
Large commercial aircraft generated net sales of $184.5 million in 2016 compared to $176.2 million in 2015, an increase of 4.7%. The most significant increase in revenue in the category was attributable to sales on the Bombardier C-Series platform, which generated revenues of $8.3 million in 2016 compared to $1.3 million in 2015. In addition, sales attributable to increased
36
content and higher production rates on the Boeing 787 platform and sales of wing modification products increased $4.0 million and $3.7 million, respectively, to $31.5 million and $12.7 million, respectively, in 2016. These increases were partially offset by decreases on the Boeing 747 platform, which generated revenue of $5.5 million in 2016 compared to $11.7 million in 2015. In accordance with Boeing's announced deliveries on the 737 program, we expect our sales to increase on this platform in 2017.
Net sales of components for corporate and regional aircraft were $70.3 million during 2016 compared to $84.7 million in 2015, a decrease of 17.0%. Revenues to this market were unfavorably impacted in 2016 by the wind down of mature programs in advance of the start up of developing programs. The decrease in revenue was primarily attributable to overall sales on the Gulfstream G450/G550 and tooling on the G500/600 programs, which generated sales of $12.5 million and $8.9 million, respectively, in 2016 compared to $24.3 million and $12.7 million, respectively, in 2015. We expect sales on the G450/G550 program to continue to decline in 2017.
Military products generated net sales of $36.0 million in 2016 compared to $39.2 million in 2015, a decrease of 8.2%. The decrease is primarily due to reductions in revenue on the Lockheed Martin F-35 and the Boeing F-18 programs of $1.3 million and $1.2 million, respectively, from $2.3 million and $3.8 million, respectively, in 2015 to $1.0 million and $2.6 million, respectively, in 2016.
Other products generated net sales of $20.3 million in 2016 compared to $27.1 million in 2015, a decrease of 25.1%. The decrease is primarily due to a $2.9 million reduction in processing revenue from $6.1 million in 2015 to $3.2 million in 2016.
Cost of Goods Sold. Cost of goods sold for 2016 was $254.4 million (81.8% of net sales) compared to $263.6 million (80.6% of net sales) for 2015. The reduction in cost of goods sold in 2016 was primarily attributable to lower sales volumes, a reduction in incentive compensation expense of $1.5 million and the benefits of lower manufacturing overhead expenses realized from cost savings initiatives implemented in prior periods. The increase in cost of goods sold as a percentage of sales in 2016 was primarily due to unfavorable fixed-cost utilization on lower sales volumes.
Cost of goods sold for the Aerostructures segment consists primarily of direct labor, materials, subcontract costs and manufacturing overhead, including indirect labor costs, depreciation, rent, supplies and other indirect costs.
Gross Profit. Gross profit for 2016 was $56.7 million (18.2% of net sales) compared to $63.6 million (19.4% of net sales) for 2015. Unfavorable product mix and the impact of lower sales contributed to the reduction in gross profit margin in 2016. This decline in gross profit margin was partially offset by benefits realized from restructuring and cost savings activities completed during 2015 in addition to lower incentive compensation costs of $1.5 million.
Selling, General and Administrative Expenses and Other Charges. Selling, general and administrative expenses and other charges were $40.6 million (13.1% of net sales) in 2016 compared to $39.6 million (12.1% of net sales) in 2015. The change in selling, general and administrative expenses primarily relates to a $3.3 million net gain recorded in 2015 related to the settlement of a lawsuit. Excluding the impact of the lawsuit settlement, selling, general and administrative expenses and other charges declined $2.3 million in 2016 when compared to 2015. Salary and related expenses and depreciation expense were lower in 2016 by $3.2 million and $0.8 million, respectively, when compared to 2015. Professional fees increased $1.2 million in 2016 when compared to 2015 primarily related to an enterprise resource planning system project.
Selling, general and administrative expenses for Aerostructures segment consists primarily of labor, rent, depreciation and amortization, professional services and other administrative expenses.
Engineering Services Segment
Net Sales. Net sales were $36.3 million in 2016, a decrease of 26.1% from $49.1 million in 2015. The following table summarizes the segment’s total sales and the percentage of the segment’s total sales represented by the market served for each of the years ended December 31, 2016 and December 31, 2015, respectively:
37
Category | 2016 | % of Total | 2015 | % of Total | ||||||||||
($ in millions) | ||||||||||||||
Large commercial aircraft | $ | 12.9 | 35.5 | % | $ | 22.4 | 45.6 | % | ||||||
Corporate and regional aircraft | 10.7 | 29.5 | % | 13.4 | 27.3 | % | ||||||||
Military | 9.8 | 27.0 | % | 11.1 | 22.6 | % | ||||||||
Other | 2.9 | 8.0 | % | 2.2 | 4.5 | % | ||||||||
Total | $ | 36.3 | 100.0 | % | $ | 49.1 | 100.0 | % | ||||||
Net sales of services for large commercial aircraft were $12.9 million in 2016 compared to $22.4 million in 2015, a decrease of 42.4%. The decrease in this category is partially attributable to a decline in sales related to maintenance and repair services, which contributed revenues of $11.1 million in 2016 compared to $15.6 million in 2015. We believe this trend is likely to continue in 2017 due to OEM customer insourcing. In addition, revenues on the Bombardier C-series and Boeing 747 programs decreased to $1.2 million and $0.0 million, respectively, in 2016 from $5.2 million and $0.5 million, respectively in 2015.
Net sales of services supporting corporate and regional aircraft were $10.7 million during 2016 compared to $13.4 million in 2015, a decrease of 20.1%. The decrease in this category was primarily attributable to the Aerion AS2 program, which contributed revenue of $0.7 million in 2016 compared to $2.9 million in 2015. Sales on the Arrowhead Global Wing program contributed $1.1 million in 2015 and was completed in that year. In 2016 and 2015, net unfavorable revenue adjustments were recognized of $1.3 million and $2.0 million, respectively, which were primarily related to the Mitsubishi Regional Jet program.
Military programs generated net sales in 2016 of $9.8 million compared to $11.1 million in 2015, a decrease of 11.7%. The Lockheed Martin HAVOC and the Bell V280 programs contributed revenues in 2015 of $1.3 million and $0.6 million, respectively. These programs were completed in 2015. In addition, sales on the Boeing F-18 and Embraer KC-390 programs decreased $0.8 million and $0.6 million, respectively, from $7.7 million and $0.7 million, respectively, in 2015 to $6.9 million and $0.1 million, respectively, in 2016. These decreases in revenue were partially offset by an increase of $2.1 million on a new military trainer program.
Sales related to the design and delivery of tooling on various programs supporting commercial aircraft were $2.9 million in 2016 compared to $2.2 million in 2015, an increase of 31.8%. This increase is primarily related to tooling sales on Boeing programs. We expect continued growth in tooling sales in 2017.
Cost of Goods Sold. Cost of goods sold for 2016 was $32.9 million (90.6% of net sales) compared to $43.8 million (89.2% of net sales) for 2015. The decrease in cost of goods sold was primarily due to reductions in direct labor, indirect labor and related fringe benefits of $9.5 million resulting from lower demand for this segment and cost reduction activities completed in 2015.
Cost of goods sold for the Engineering Services segment consists primarily of direct labor, subcontract costs and overhead, including rent, maintenance, and indirect costs.
Gross Profit. Gross profit for this segment was $3.4 million (9.4% of net sales) for 2016 compared to $5.3 million (10.8% of net sales) for 2015. The decrease in gross profit was primarily attributable to the decline in sales and related unfavorable fixed-cost utilization. In 2016 and 2015, net unfavorable revenue adjustments were recognized of $1.3 million and $2.0 million, respectively, which were primarily related to the Mitsubishi Regional Jet program.
Selling, General and Administrative Expenses and Other Charges. Selling, general and administrative expenses and other charges were $33.5 million (92.3% of net sales) in 2016 compared to $8.4 million (17.1% of net sales) for 2015. The change in expense is primarily related to a $28.4 million goodwill and intangible asset impairment charge recognized in 2016. Excluding the impairment expense, selling, general and administrative expenses and other charges declined $3.3 million in 2016 when compared to 2015. Implemented cost reductions contributed to a decrease in salaries and related expense of $1.1 million in 2016 and restructuring charges of $1.2 million in 2015 did not recur in 2016.
Selling, general and administrative expenses for Engineering Services segment consists primarily of labor, rent, depreciation and amortization, professional services and other administrative expenses.
Non-segment Expenses
38
Interest Expense. Interest expense was $21.2 million for 2016 compared to $22.4 million for 2015, the result of overall lower outstanding borrowings and the retirement of $10.0 million of senior secured notes in the third quarter of 2016.
Other Income (Expense), Net. Other expense was $0.4 million for 2016 compared to other expense of $0.2 million for 2015.
Income Tax Expense. Income tax benefit for 2016 was $0.7 million compared to a $0.4 million income tax expense for 2015. During 2016, our effective income tax rate was 2.0% compared to (18.6)% in 2015. Income tax expense in 2015 includes the recognition of a $0.5 million adjustment resulting from an audit of the Company's 2012 and 2013 tax returns by the Internal Revenue Service. The Company continues to have a full valuation allowance against its remaining net deferred tax assets at December 31, 2016.
Year ended December 31, 2015 compared to year ended December 31, 2014
The following table provides the comparative data for 2015 and 2014:
2015 | |||||||||||||||
Aerostructures | Engineering Services | Elimination | Total | ||||||||||||
($ in millions) | |||||||||||||||
Net sales | $ | 327.2 | $ | 49.1 | $ | (1.2 | ) | $ | 375.1 | ||||||
Cost of sales | 263.6 | 43.8 | (1.1 | ) | 306.3 | ||||||||||
Gross profit | 63.6 | 5.3 | (0.1 | ) | 68.8 | ||||||||||
S, G, & A and other charges | 39.6 | 8.4 | — | 48.0 | |||||||||||
Income (loss) from operations | $ | 24.0 | $ | (3.1 | ) | $ | (0.1 | ) | $ | 20.8 | |||||
2014 | |||||||||||||||
Aerostructures | Engineering Services | Elimination | Total | ||||||||||||
($ in millions) | |||||||||||||||
Net sales | $ | 326.0 | $ | 63.4 | $ | (1.6 | ) | $ | 387.8 | ||||||
Cost of sales | 259.0 | 54.9 | (1.5 | ) | 312.4 | ||||||||||
Gross profit | 67.0 | 8.5 | (0.1 | ) | 75.4 | ||||||||||
S, G, & A and other charges (1) | 48.1 | 36.2 | — | 84.3 | |||||||||||
Income (loss) from operations | $ | 18.9 | $ | (27.7 | ) | $ | (0.1 | ) | $ | (8.9 | ) | ||||
(1) Engineering Services segment includes $26.4 million related to goodwill impairment
Aerostructures Segment
Net Sales. Net sales were $327.2 million in 2015, an increase of 0.4% from $326.0 million in 2014. The following table summarizes total sales for the segment and the percentage of total sales represented by the market served for each of the years ended December 31, 2015 and December 31, 2014:
Category | 2015 | % of Total | 2014 | % of Total | ||||||||||
($ in millions) | ||||||||||||||
Large commercial aircraft | $ | 176.2 | 53.9 | % | $ | 162.5 | 49.8 | % | ||||||
Corporate and regional aircraft | 84.7 | 25.9 | % | 87.5 | 26.8 | % | ||||||||
Military | 39.2 | 12.0 | % | 49.1 | 15.1 | % | ||||||||
Other | 27.1 | 8.2 | % | 26.9 | 8.3 | % | ||||||||
Total | $ | 327.2 | 100.0 | % | $ | 326.0 | 100.0 | % | ||||||
39
Large commercial aircraft generated net sales of $176.2 million in 2015 compared to $162.5 million in 2014, an increase of 8.4%. The most significant increase in revenue in the category was attributable to increased content and higher production rates on the Boeing 787 platform, which generated $27.5 million in 2015 compared to $15.0 million in 2014. In addition, sales on Boeing 737, 767 and 777 platforms increased $3.1 million, $1.2 million and $0.7 million, respectively to $98.0 million, $4.7 million and $17.5 million, respectively, in 2015. These increases were partially offset by decreases in the sale of wing modification products which generated revenue of $8.9 million in 2015 compared to $14.7 million in 2014.
Net sales of components for corporate and regional aircraft were $84.7 million during 2015 compared to $87.5 million in 2014, a decrease of 3.2%. The decrease in revenue was primarily attributable to decreases in sales of $7.2 million and $1.3 million, respectively, on the Gulfstream G450/G550 and G280 programs from $31.6 million and $6.8 million, respectively in 2014 to $24.4 million and $5.5 million, respectively, in 2015. These decreases were partially offset by an increase in sales on the Gulfstream G650 and G500/G600 programs, which generated revenue of $33.9 million in 2015 and $12.6 million, respectively, compared to $29.7 million and $11.0 million, respectively, in 2014.
Military products generated net sales of $39.2 million in 2015 compared to $49.1 million in 2014, a decrease of 20.2%. Revenues related to the Black Hawk helicopter decreased to $18.6 million in 2015 from $21.8 million in 2014. In addition, revenues decreased on the Boeing V-22, C-17 and Apache programs by $1.6 million, $1.2 million and $2.7 million, respectively, in 2015 compared to 2014.
Other products generated net sales of $27.1 million in 2015 compared to $26.9 million in 2014, an increase of 0.7%.
Cost of Goods Sold. Cost of goods sold for 2015 was $263.6 million (80.6% of net sales) compared to $259.0 million (79.4% of net sales) for 2014. In 2014, cost of goods sold was favorably impacted by the reversal of a loss reserve of $5.3 million on a long-term contract due to price increases received for engineering changes and improved hardware costs. This reduction in cost of goods sold in 2014 was partially offset by accelerated depreciation of $1.3 million on assets disposed of at several facilities.
Cost of goods sold for the Aerostructures segment consists primarily of direct labor, materials, subcontract costs and manufacturing overhead, including indirect labor costs, depreciation, rent, supplies and other indirect costs.
Gross Profit. Gross profit for 2015 was $63.6 million (19.4% of net sales) compared to $67.0 million (20.6% of net sales) for 2014. Gross profit margin in 2014 was favorably impacted by the $5.3 million loss reserve reversal discussed above on a long-term contract which was partially offset by cost and inefficiencies related to restructuring activities. Gross profit in 2015 was favorably impacted by realized cost savings related to restructuring plans implemented during 2014 and early 2015, offset by the impact of lower production levels.
Selling, General and Administrative Expenses and Other Charges. Selling, general and administrative expenses and other charges were $39.6 million (12.1% of net sales) in 2015 compared to $48.1 million (14.8% of net sales) in 2014. The change in selling, general and administrative expenses primarily relates to a net gain recorded in 2015 related to the settlement of a lawsuit of $3.3 million. Professional services, environmental expense and restructuring charges were lower in 2015 by $0.8 million, $1.2 million and $1.0 million, respectively, when compared to 2014. In addition, 2015 included a $2.0 million reduction in salary and related fringes when compared to 2014, the result of previously implemented cost reduction plans.
Selling, general and administrative expenses for Aerostructures segment consists primarily of labor, rent, depreciation and amortization, professional services and other administrative expenses.
Engineering Services Segment
Net Sales. Net sales were $49.1 million in 2015, a decrease of 22.6% from $63.4 million in 2014. The following table summarizes the segment’s total sales and the percentage of the segment’s total sales represented by the market served for each of the years ended December 31, 2015 and December 31, 2014, respectively:
40
Category | 2015 | % of Total | 2014 | % of Total | ||||||||||
($ in millions) | ||||||||||||||
Large commercial aircraft | $ | 22.4 | 45.6 | % | $ | 31.6 | 49.8 | % | ||||||
Corporate and regional aircraft | 13.4 | 27.3 | % | 13.8 | 21.8 | % | ||||||||
Military | 11.1 | 22.6 | % | 10.1 | 15.9 | % | ||||||||
Other | 2.2 | 4.5 | % | 7.9 | 12.5 | % | ||||||||
Total | $ | 49.1 | 100.0 | % | $ | 63.4 | 100.0 | % | ||||||
Net sales of services for large commercial aircraft were $22.4 million in 2015 compared to $31.6 million in 2014, a decrease of 29.1%. The decrease in this category was primarily attributable to a decline in sales related to the Airbus 350 platform which decreased from $5.2 million in 2014 to $0.2 million in 2015. In addition, sales on various Boeing programs, maintenance and repair revenues and sales on the Goodrich Nacelle program declined $1.4 million, $2.5 million and $1.3 million, respectively, in 2015 compared to 2014. These decreases were partially offset by an increase in revenue on the Bombardier C-Series program of $3.5 million, which contributed $5.4 million in 2015 compared to $1.9 million in 2014.
Net sales of services supporting corporate and regional aircraft were $13.4 million during 2015 compared to $13.8 million in 2014, a decrease of 2.9%. The decrease in sales is primarily attributable to a $7.9 million decrease in sales on the Bombardier Learjet L-85 program that was canceled in late 2014. This decrease was partially offset by an increase in sales on the Bombardier Global 7000 program, which contributed $5.6 million in 2015 compared to $4.4 million in 2014. In addition, sales increased on the Aerion AS2 and Arrowhead Global Wing program by $1.5 million and $1.1 million, respectively, when compared to the prior-year period.
Military programs generated net sales in 2015 of $11.1 million compared to $10.1 million in 2014, an increase of 9.9%. The decrease was primarily attributable to sales on a program with the U.S. Navy of $7.7 million in 2015 compared to $6.2 million in 2014. In addition, the Lockheed Martin HAVOC program, which was new in 2015, generated sales of $1.3 million. These increases were partially offset by reductions on the Bell V-280 program of $2.2 million during 2015 when compared 2014.
Sales related to the design and delivery of tooling on various programs supporting commercial aircraft were $2.2 million in 2015 compared to $7.9 million in 2014, a decrease of 72.2%. Tooling sales on various Boeing programs and sales on a space program decreased $1.6 million and $1.4 million, respectively, in 2015 when compared to 2014.
Cost of Goods Sold. Cost of goods sold for 2015 was $43.8 million (89.2% of net sales) compared to $54.9 million (86.6% of net sales) for 2014. The decrease in cost of goods sold was primarily due to reductions in direct labor, which is the result of lower demand for this segment.
Cost of goods sold for the Engineering Services segment consists primarily of direct labor, subcontract costs and overhead, including rent, maintenance, and indirect costs.
Gross Profit. Gross profit for this segment was $5.3 million (10.8% of net sales) for 2015 compared to $8.5 million (13.4% of net sales) for 2014. The decrease in gross profit was primarily attributable to unfavorable cumulative long-term revenue adjustments in addition to the decline in sales and related unfavorable fixed-cost utilization. In 2015 and 2014, net unfavorable revenue adjustments were recognized of $2.0 million and $1.0 million, respectively, which were primarily related to the Mitsubishi Regional Jet program.
Selling, General and Administrative Expenses and Other Charges. Selling, general and administrative expenses and other charges were $8.4 million (17.1% of net sales) in 2015 compared to $36.2 million (57.1% of net sales) for 2014. The change in expense in is primarily related to a $26.4 million goodwill impairment recognized in 2014. In addition, implemented cost reductions contributed to a decrease in salaries and related expense by $1.5 million, which was partially offset by increases in restructuring expense of $0.7 million in 2015 when compared to 2014. Restructuring expenses recognized in 2015 related to the closure of the Greenville, South Carolina and Melbourne, Australia offices in addition to the elimination of other management positions within this segment.
Selling, general and administrative expenses for Engineering Services segment consists primarily of labor, rent, depreciation and amortization, professional services and other administrative expenses.
41
Non-segment Expenses
Interest Expense. Interest expense was $22.4 million for 2015 compared to $29.3 million for 2014. On June 19, 2014, the Company terminated its previous long-term credit agreement, modified its revolving credit agreement, and issued senior notes. As a result of these transactions, interest expense in 2014 included $9.3 million related to the write-off of debt financing cost and settlement of related interest rate derivatives. Excluding these non-recurring items. overall interest expense increased in 2015 when compared to 2014 as interest rates on our senior secured notes are higher than the rates under our previous credit agreement.
Other Income (Expense), Net. Other expense was $0.2 million for 2015 compared to other income of $0.2 million for 2014.
Income Tax Expense. Income tax expense for 2015 was $0.4 million compared to an income tax benefit of $9.0 million in 2014. During 2015, our effective income tax rate was (18.6)% compared to 23.6% in 2014. The effective tax rate in 2014 includes tax benefits of approximately $2.6 million associated with the decision to carry back the net operating loss recognized in 2013.
Non-GAAP Financial Measures
When viewed with our financial results prepared in accordance with accounting principles generally accepted in the United States of America (“GAAP”) and accompanying reconciliations, we believe earnings before interest, taxes, depreciation and amortization ("EBITDA") and Adjusted EBITDA provide additional useful information to clarify and enhance the understanding of the factors and trends affecting our past performance and future prospects. We define these measures, explain how they are calculated and provide reconciliations of these measures to the most comparable GAAP measure in the tables below. EBITDA, Adjusted EBITDA and the related financial ratios, as presented in this Form 10-K, are supplemental measures of our performance that are not required by, or presented in accordance with, GAAP. They are not a measurement of our financial performance under GAAP and should not be considered as alternatives to net income or any other performance measures derived in accordance with GAAP, or as an alternative to net cash provided by operating activities as measures of our liquidity. The presentation of these measures should not be interpreted to mean that our future results will be unaffected by unusual or nonrecurring items.
We use EBITDA and Adjusted EBITDA non-GAAP operating performance measures internally as complementary financial measures to evaluate the performance and trends of our businesses. We present EBITDA, Adjusted EBITDA and the related financial ratios, as applicable, because we believe that measures such as these provide useful information with respect to our ability to meet our future debt service, capital expenditures, working capital requirements and overall operating performance.
EBITDA and Adjusted EBITDA have limitations as analytical tools, and you should not consider them in isolation or as substitutes for analysis of our results as reported under GAAP. Some of these limitations are:
• | They do not reflect our cash expenditures, future expenditures for capital expenditures or contractual commitments; |
• | They do not reflect changes in, or cash requirements for, our working capital needs; |
• | They do not reflect the significant interest expense or the cash requirements necessary to service interest or principal payments on our debt; |
• | Although depreciation and amortization are non-cash charges, the assets being depreciated and amortized will often have to be replaced in the future, and EBITDA and Adjusted EBITDA do not reflect any cash requirements for such replacements; |
• | They are not adjusted for all non-cash income or expense items that are reflected in our statement of cash flows; |
• | They do not reflect the impact on earnings of charges resulting from matters unrelated to our ongoing operations; and |
• | Other companies in our industry may calculate EBITDA and Adjusted EBITDA differently, limiting their usefulness as comparative measures. |
Because of these limitations, EBITDA, Adjusted EBITDA and the related financial ratios should not be considered as measures of discretionary cash available to us to invest in the growth of our business or as a measure of cash that will be available to us to meet our obligations. You should compensate for these limitations by relying primarily on our GAAP results and use
42
EBITDA and Adjusted EBITDA only as a supplement to this information. See our consolidated financial statements contained in this Report.
However, in spite of the above limitations, we believe that EBITDA and Adjusted EBITDA are useful to an investor in evaluating our results of operations because these measures:
• | Are widely used by investors to measure a company’s operating performance without regard to items excluded from the calculation of such terms, which can vary substantially from company to company depending upon accounting methods and book value of assets, capital structure and the method by which assets were acquired, among other factors; |
• | Help investors evaluate and compare the results of our operations from period to period by removing the effect of our capital structure from our operating performance; and |
• | Are used by our management team for various other purposes in presentations to our Board of Directors as a basis for strategic planning and forecasting. |
Net loss in 2016 included charges for goodwill and intangible asset impairment, restructuring, integration expenses and the write-off of deferred financing costs. Net loss in 2015 included charges for restructuring and integration expenses, the write-off of deferred financing costs and a gain related to the settlement of a lawsuit. Net loss in 2014 included charges for goodwill impairment, restructuring, and integration expenses and the write-off of deferred financing costs. EBITDA and Adjusted EBITDA exclude these charges, as applicable, and provide meaningful information about the operating performance of our businesses apart from interest and tax expenses.
The following financial items have been added back to our net income when calculating EBITDA:
• | Depreciation; |
• | Amortization expense; |
• | Goodwill and intangible asset impairment; |
• | Interest expense; and |
• | Income tax expense. |
The following financial items have been added back to our net income when calculating Adjusted EBITDA:
• | Stock-based compensation; |
• | Integration expenses; |
• | Restructuring expenses; |
• | Gains related to the settlement of a lawsuit; and |
• | Other (net). |
43
For the years ended December 31, 2016, 2015 and 2014, the reconciliations of net loss to EBITDA and Adjusted EBITDA were as follows:
(In Thousands) | Years Ended December 31, | ||||||||||
2016 | 2015 | 2014 | |||||||||
Net loss | $ | (35,107 | ) | $ | (2,241 | ) | $ | (28,962 | ) | ||
Depreciation and amortization (1) | 19,043 | 20,404 | 22,459 | ||||||||
Goodwill and intangible asset impairment (2) | 28,368 | — | 26,439 | ||||||||
Interest expense (3) | 21,171 | 22,439 | 29,280 | ||||||||
Income tax (benefit) expense (4) | (734 | ) | 352 | (8,953 | ) | ||||||
EBITDA | 32,741 | 40,954 | 40,263 | ||||||||
Stock-based compensation (5) | 2,932 | 3,236 | 2,748 | ||||||||
Restructuring expense (6) | 1,212 | 2,322 | 2,585 | ||||||||
Integration expense | 295 | 526 | 818 | ||||||||
Other (net) (7) | 595 | (1,619 | ) | 1,173 | |||||||
Adjusted EBITDA | $ | 37,775 | $ | 45,419 | $ | 47,587 | |||||
(1) | Includes amortization of intangibles and depreciation expense. 2016 and 2015 also include amortization of consideration paid under a long-term supply agreement. |
(2) | In 2016, a triggering event occurred which resulted in the impairment of the goodwill and intangible assets in the Engineering Services reporting unit of $28,368. In 2014, the annual impairment test conducted by the Company resulted in an impairment of goodwill associated with the Engineering Services segment of $26,439. |
(3) | Includes the write-off of deferred financing costs in connection with retirement of senior secured notes of $156 and $215 in 2016 and 2015, respectively. Includes the write-off of deferred financing costs in connection with refinanced credit facilities in 2014 of $8,340. |
(4) | Includes $8,931 of income tax benefits generated from income tax losses for 2013 and 2014 that the Company decided in 2014 to carry back to prior years. |
(5) 2016 includes shared-based expense associated with the LMI Aerospace, Inc. 2005 Long-term Incentive Plan, the LMI Profit Sharing and Savings Plan, and the LMI Aerospace, Inc. 2015 Long-term Incentive Plan. 2015 includes shared-based expense associated with the LMI Aerospace, Inc. 2005 Long-term Incentive Plan, the LMI Profit Sharing and Savings Plan, the LMI Aerospace, Inc. 2015 Long-term Incentive Plan and the Valent Aerostructures, LLC 401(k) Plan. 2014 includes share-based expense associated with the LMI Aerospace, Inc. 2005 Long-term Incentive Plan and the LMI Profit Sharing and Savings Plan. 2015 and 2014 also include expenses associated with share-based payments to settle obligations under a consulting agreement.
(6) | In 2016, restructuring includes costs associated with the relocation of the Wichita, KS sheet metal fabrication operation in addition to other employment separation activities. In 2015, restructuring includes costs associated with the closure of the St. Charles, MO machining operation, Coweta, OK manufacturing facility, and engineering offices in Melbourne, Australia and Greenville, SC, in addition to other employment separation activities. In 2014, restructuring includes costs associated with the Precise Machine facility closure, Savannah, GA machining operations relocation, St. Charles, MO machining operations closure, and other employment separation activities. |
(7) In 2015, the Company recorded a net gain of $3.3 million related to a legal settlement. The gain realized from the settlement offsets environmental expenses, accelerated depreciation and other expenses totaling $1.9 million that were recorded as a favorable adjustment to EBITDA when incurred in prior periods. For consistency, the above table reflects only $1.9 million of the net gain recorded in 2015 as an unfavorable EBITDA adjustment. Includes $1.0 million of environmental expenses in 2014.
44
Liquidity and Capital Resources
The Company's operations generated cash of $14.6 million in 2016. The Company's operations generated cash of $32.4 million in 2015 and generated cash of $49.1 million in 2014. The net operating cash inflow in 2016 was driven by an increase in accounts payable of $13.4 million primarily related to increasing inventory levels to support production ramp ups on key programs and extending payment terms with our vendors.
The net operating cash inflow in 2015 was driven by reductions in product inventory, the collection of $7.0 million in income tax receivables and a $3.1 million net cash legal settlement.
In January of 2015, the Company signed an agreement with Spirit to form a strategically aligned partnership. This agreement extended the performance period of the statements of work for certain contracts with Spirit and gave the Company preferred supplier status on certain future contracts. In accordance with the contract terms, the Company made $6.5 million in cash payments of consideration to Spirit in 2015. Offsetting this increase and excluding the impact of inventory deferrals on long-term contracts, the Company reduced product inventory by $10.8 million in 2015.
In 2015, the Company and the former equity owners of Valent executed definitive settlement documents with respect to the resolution of certain indemnification claims and other disputes involving, among other things, the environmental matters associated with our Cuba, MO facility. Pursuant to the terms of the agreements, $3.1 million of the funds held in escrow related to the acquisition of Valent were disbursed to the Company and the former equity owners of Valent assumed a $1.2 million payment obligation of the Company. The settlement also resulted in the Company assuming other liabilities of $0.5 million, collecting a previously recorded receivable of $0.4 million and recording other expenses of $0.1 million.
The net operating cash inflow in 2014 was primarily driven by reductions in accounts receivable, increases in accrued expenses and overall operational performance. Accounts receivable were favorably impacted by the collection of a $13.5 million milestone payment on the KC-390 program in 2014 for which sales were recognized in 2013. Accrued expenses were favorably impacted by $9.7 million related to debt refinancing that occurred in 2014 and the related change in the timing of interest payments from monthly to semi-annually. The first interest payment under the primary new debt facility, the amount of which was $10.3 million, was paid in January of 2015.
Net cash used for investing activities for the year ended December 31, 2016 was $11.2 million compared to $16.3 million and $13.1 million for the years ended December 31, 2015 and 2014, respectively. We spent $11.8 million in 2016 on capital expenditures, compared to $16.6 million and $16.7 million during 2015 and 2014, respectively, as we normalized capital spending after increasing capital spending in support of anticipated growth and the additional capital needs for our acquired businesses. In 2017, we expect higher levels of capital spending to support planned production ramp-ups.
Cash used by financing activities was $11.4 million in 2016, $13.5 million in 2015 and $29.7 million in 2014. In 2016, the Company used cash to pay $12.7 million in outstanding debt, of which $10.0 million was used to retire second-priority senior secured notes (the "notes"). In 2015, the Company used cash to pay $13.3 million in outstanding debt, of which $10.8 million was used to retire outstanding notes. During 2014, the Company settled its then outstanding term loan with proceeds from the issuance of $250.0 million in notes. Proceeds from the notes also partially funded net payments of $36.0 million against our revolving credit facility. The Company also settled a mortgage of $2.1 million, an equipment loan of $3.1 million and retired $5.0 million of the outstanding notes during 2014. The Company paid $8.0 million in debt financing costs in 2014.
Cash paid for interest was $18.7 million in 2016 compared to $21.3 million in 2015 and $7.4 million in 2014. The decrease in interest paid in 2016 when compared to 2015 is primarily due to the retirement of notes in 2016 and in the second half of 2015. Through June 18, 2014, the Company's primary debt was a term loan that accrued interest at a rate of 4.75%. During the second half of 2014 and throughout 2015 and 2016, the Company's primary debt was notes accruing interest at a rate of 7.375%, which did not require interest payments until January of 2015.
On June 19, 2014, the Company issued $250.0 million in notes maturing on July 15, 2019, of which $224.2 million remain outstanding at December 31, 2016. Also on June 19, 2014, the Company modified its existing revolving credit facility which matures on the earlier of the fifth year anniversary date, July 15, 2019, or the date that is 91 days prior to the maturity date of the notes unless the notes are repaid, refinanced or otherwise satisfied in full. The maturity dates are subject to acceleration upon occurrence of an event of default. An event of default under the revolving credit agreement includes, among other things, failure to pay any material indebtedness, acceleration of payments by any lender prior to scheduled maturity, or judgments rendered against the Company requiring payments at or above certain levels. The credit agreement contains a covenant that requires us to comply with a maximum first priority debt to EBITDA ratio on a quarterly basis. In addition, the agreement also contains certain restrictive covenants that limit and in some circumstances prohibit, our ability to, among other things, incur additional debt, sell,
45
lease or transfer our assets, make investments, guarantee debt or obligations, create liens, and enter into certain merger, consolidation or other reorganization transactions. These restrictive covenants prohibit the Company from paying dividends. These restrictions could limit our ability to obtain future financing, make acquisitions or needed capital expenditures, withstand the current or future downturns in our business or the economy in general, conduct operations or otherwise take advantage of business opportunities that may arise, any of which could place us at a competitive disadvantage relative to our competitors that have less debt and are not subject to such restrictions. At December 31, 2016, the Company was in compliance with all of its covenants and expects to be in compliance with its covenants in future periods. If the Company fails to meet any covenants in the credit facility, the Company would not be in compliance with its credit agreement and the lenders would be entitled to exercise various rights, including causing the amounts outstanding under the revolving credit facility to become immediately due and payable.
The Company expects to meet its ongoing working capital, debt service, and capital expenditure needs presently and for the next twelve months from a combination of cash on hand, cash flow from operating activities and cash available under our revolving credit facility.
The Company, in the ordinary course of business, evaluates strategies to enhance our results of operations, financial position, or liquidity. These strategies may include acquisitions, divestitures, opportunities to reduce costs or increase revenues, and other strategic initiatives to increase stockholder value. We are unable to predict which, if any, of these initiatives will be executed. The execution of these initiatives may have a material impact on our future results of operations, financial position, or liquidity.
Off-Balance Sheet Arrangements
Our off-balance sheet arrangements consist primarily of operating leases as reflected under “Contractual Obligations and Commitments” below.
Contractual Obligations and Commitments
We had the following contractual obligations and commitments for debt and non-cancelable operating lease payments:
Total | Less Than 1 year | 1-3 years | 3 - 5 years | More than 5 years | |||||||||||||||
($ in thousands) | |||||||||||||||||||
Debt (1) | $ | 243,301 | $ | 2,603 | $ | 230,373 | $ | 8,707 | $ | 1,618 | |||||||||
Interest on Long-term debt (2) | $ | 42,966 | 17,158 | 25,233 | 344 | 231 | |||||||||||||
Operating Leases | $ | 40,769 | 7,636 | 13,127 | 9,761 | 10,245 | |||||||||||||
Purchase commitments | $ | 2,754 | 541 | 2,213 | — | — | |||||||||||||
Total | $ | 329,790 | $ | 27,938 | $ | 270,946 | $ | 18,812 | $ | 12,094 | |||||||||
(1) | Includes obligations under capital leases |
(2) | Interest expense based on balances of long-term debt at the end of the period and current effective interest rate. |
46
Critical Accounting Estimates
Certain accounting issues require management estimates and judgments for the preparation of financial statements. We believe that the estimates, assumptions and judgments involved in the accounting policies described below have the greatest potential impact on our financial statements. Therefore, we consider these to be our critical accounting estimates. Our management has discussed the development and selection of these critical accounting estimates with the Audit Committee of our Board of Directors, and the Audit Committee has reviewed our disclosure relating to these estimates. However, these methods, assumptions and estimates could create materially different results under different conditions or using different assumptions.
Inventory. Except for inventories related to long-term contracts accounted for under contract accounting as discussed below, we value our product inventories at the lower of cost or market using actual cost for raw materials and average or standard cost (which approximates actual cost) for work in process, manufactured and purchased components and finished goods. In assessing the ultimate realization of inventories, we make judgments as to future demand requirements based upon customer orders in backlog, historical customer orders, customer and industry analyst estimates of aircraft production rates, and other market data available to us. Additionally, in the aviation industry, these future demand requirements depend on estimates of aircraft lives and the need for spare parts over the course of the aircraft life. Charges are recorded when product lines are discontinued, customer contracts are lost, order activity declines, or future requirements change.
We sell many of our products under fixed-price arrangements. Occasionally, costs of production may exceed the market values of certain products and product families, which require us to adjust our inventory value. In these circumstances, management is required to make estimates of costs not yet incurred to determine the ultimate cost of these products that are in work in process. Changes in the assumptions and estimates of such factors as expected scrap, costs of material, labor and outside services and the amount of labor required to complete the products may result in changes in inventory value.
At times, we accept orders for products where actual production costs differ from our expectations when we quoted the product. Additionally, customers may request engineering changes or quality acceptance changes in products that may alter the cost of products produced by us. In the latter circumstance, we notify the customer of these issues and seek reimbursement for costs incurred to satisfy these requested changes on delivered units, as well as an adjustment to the selling price for future deliveries.
For certain fixed price contracts requiring development or delivery of multiple units of complex product over more than one year, we incur and defer, as part of the inventory, certain costs that are specific to a particular contract and which we expect to recoup as part of the unit cost charged to the customer under the contract. At December 31, 2016, these deferrals include $5.4 million for consideration paid related to an agreement signed with Spirit Aerostructures that is being amortized to as a reduction to sales over the life of the related contracts. See Item 8, Note 4 - "Inventories" in the Notes to our Consolidated Financial Statements. Deferred costs in inventory are charged to cost of product sales ratably as the manufactured units are shipped or costs are incurred pursuant to the contract. Changes in the estimated number of units expected to be delivered under the contracts result in prospective adjustments of the ratable charge-off of deferred inventoriable costs per unit shipped. Should the remaining inventoriable costs plus estimated costs of production of units yet to be shipped under the contract exceed estimated future contract revenues, any resulting loss is recognized in the period it becomes probable and estimable. See Note 1 of the Notes to Consolidated Financial Statements in Item 8 below.
Revenue and Profit Recognition. Except as described below, the Company recognizes revenue for sales of products and related services in accordance with Financial Accounting Standards Board, (“FASB”) Accounting Standards Codification (“ASC”) Topic 605-15 Products and Topic 605-20 Services. The Company sells products under long-term supply contracts and purchase orders where the product is built to customer specifications and on firm purchase orders from the customer. Purchase orders tend to be of a relatively short duration and customers place orders on a periodic basis. Pricing is generally fixed for a length of time and quantities are based on individual purchase orders. Revenue is recognized when title passes and services are rendered, the price is fixed or determinable and collection is reasonably assured. Approximately 80-90% of the total revenue the Company recognizes in any given quarter is accounted for in accordance with Topics 15 and 20. The remainder of revenue is accounted for using percentage of completion accounting methods consistent with the ASC Topic 605-35 Construction -Type and Production-Type Contracts.
The percentage of completion method used to account for contracts depends on the nature of the products provided under the contract. For example, for contracts that require us to perform a significant level of development effort, in comparison to the total value of the contract, sales are recorded using the cost-to-cost method to measure progress toward completion. Under the cost-to-cost method of accounting, we recognize sales and estimated profit as costs are incurred based on the proportion that the incurred costs represent of total estimated costs. For contracts that require us to provide a substantial number of similar items without a significant level of development, we record sales and estimated profit using units of delivery as the basis to measure
47
progress toward completing the contract. Under both methods, profit recognized is based on the total expected profit margin percentage multiplied by revenue recognized to date.
The Company periodically reviews all estimates to complete as required by the authoritative guidance and the estimated total cost and expected gross profit are revised, as appropriate, over the life of the contract. Any revisions to estimated total cost are accounted for as a change in estimate. A cumulative catch-up adjustment is recorded in the period the change in estimated cost to complete the contract is determined. Gross profit in a period that reflects a change in estimate will include (a) a cumulative catch-up adjustment which reflects the adjustment of previously recognized profit associated with all prior period revenue recognized based on the current estimate of gross profit margin, as appropriate, and (b) recognition of the current period costs of sales and related gross profit margin based on the current period sales multiplied by the current estimate of the gross profit margin on the contract.
Should total estimated costs at completion exceed the estimated total revenue, the anticipated full loss on a contract is recognized in the period in which the anticipated loss is determined. The loss is reported as either a reduction of revenue or as a charge to cost of sales. The cumulative gross profit margin recognized on a contract accounted for under the units of delivery method through the end of the current period on a contract with an estimated loss will equal the current estimate of the gross profit margin on the contract multiplied by the contract revenues recognized through the end of the current period plus the provision for the additional loss on contract revenues yet to be recognized. The current period cost of sales on a contract with a loss reserve will equal current period sales, thus, gross profit on those sales will be recognized at a 0% margin. In accordance with ASC 605-35-45-1&2, the provisions for anticipated losses on contracts are accounted for as additional contract cost and recognized as part of cost of sales. Provisions for losses are recorded as a reduction of related contract costs recorded in inventory. Any excess loss provision is recorded as a current liability.
In 2016 and 2015, the Company recognized unfavorable cumulative catch-up adjustments of $1.9 million and $2.8 million, respectively, related to the Mitsubishi Regional Jet design-build program. In 2015, a provision for anticipated loss was established on this contract.
The net favorable cumulative catch-up adjustment recorded in 2014 is primarily due to a contract for which a provision for anticipated loss was established in 2013 for $5.3 million as part of the purchase accounting for the Valent acquisition. During 2014, this contract was amended due to the resolution of several engineering changes that resulted in increased revenue per shipset. In addition, the Company was able to secure more favorable future material costs as engineering design to the related assemblies had stabilized. As a result, contract costs were no longer expected to exceed revenue and the related loss reserve was reversed in 2014. The Company also recorded an unfavorable cumulative catch-up adjustment on the Mitsubishi Regional Jet design-build program in 2014 that resulted in a reduction in revenue of $1.5 million. The Company did not have any contracts in a loss contract position at December 31, 2014.
For contracts accounted for using the percentage of completion method, management’s estimates of total units to be produced, and material, labor and overhead costs on long-term contracts are critical to the Company. Due to the size, length of time and nature of many of our contracts, the estimation of revenue and costs through completion is complicated and subject to many variables.
Total contract revenue estimates are based on negotiated contract prices, customer change orders, claims (when a legal basis exists) and estimated cost to produce the product or service plus a profit in some instances. The contract revenue estimates consider customer purchase orders, projections and industry guidance. In addition, claims and unpriced change orders will impact the estimate of total revenues and profits. In the ordinary course of business, the Company may receive requests from its customers to perform tasks not specified in its contracts. When this occurs on a long-term contract using the cost-to-cost method of percentage of completion accounting, the Company may record revenue for claims or unpriced change orders to be negotiated with customers. As of December 31, 2016, approximately 0.3% of revenue represented amounts associated with claims and unpriced change orders.
Total contract cost estimates are primarily based on our current cost of production, purchase order terms negotiated or estimated by our supply chain. These costs include negotiated or estimated material costs, historical labor performance trends, business base and other economic projections. Factors that influence these estimates include inflationary trends, technical and schedule risk, performance trends, asset utilization, and anticipated labor rates.
The development of contract revenue and gross margin percentages involve utilization of detailed procedures by a team of operational and financial personnel that provide information on the status of the contracts. Estimates of each significant contract’s revenue and cost are reviewed and approved by the team on a quarterly basis. Any approved changes in these estimates are analyzed to determine if they result in recognition of cumulative adjustments to contract profits in the period in which changes are made.
48
Due to the significance of judgment in the estimation process described above, it is possible that materially different margins could be recorded if different assumptions were used or if underlying circumstances change. Changes in underlying assumptions, estimates or circumstances may adversely or positively affect financial performance in future periods.
Goodwill and Intangible Assets. Goodwill is not amortized; rather, it is tested annually in accordance with FASB ASC Topic 350, Intangibles-Goodwill and Other (“ASC 350”). The Company exercises its judgment in evaluating its goodwill and intangible assets for possible impairment. The Company performs goodwill and indefinite-lived intangible asset impairment testing annually in the fourth quarter of each fiscal year as well as whenever events or changes in circumstances during the fiscal year indicate that the carrying amount may not be recoverable. The Company evaluates whether any triggering events have occurred during the fiscal year, such as a significant decrease in expected cash flows at a reporting unit or changes in market or other business conditions that may indicate a potential impairment of goodwill or other intangible assets.
The Company has the option to first assess qualitative factors to determine whether it is more likely than not that the fair value of the reporting unit is less than its carrying amount. If it is, the quantitative tests require comparing recorded values to estimated fair values for the assets under review. If it is not, no additional analysis is required, however the Company may choose to perform a quantitative assessment of the fair value.
The Company's goodwill balances were $62.5 million and $86.8 million at December 31, 2016 and 2015 respectively. Under guidelines established by FASB ASC Topic 280, Segment Reporting (“ASC 280”) the Company operates in two operating segments. However, the Company has recorded its goodwill and conducts testing for potential goodwill impairment at a reporting unit level. The reporting units represent a business for which discrete financial information is available, and segment management regularly reviews the operating results.
In 2016, the Company reorganized the management and organizational structure of the Aerostructures operating segment into two reporting units that combine like manufacturing products and processes. Aerostructures impairment testing was conducted at November 30, 2016 based on these new reporting units defined as Assembly and Machining ("A&M") and Fabrication and Composites ("F&C"). The make-up of these reporting units is not significantly different from those reported in prior periods. Aerostructures impairment testing conducted in 2015 was based on the previously defined reporting units of Valent and Fabrication. The restructuring of reporting units in 2016 involved reassigning some manufacturing facilities previously part of the Fabrication reporting unit and combining them with all of the Valent entities to comprise the A&M reporting unit. The Company assessed whether any of the Fabrication goodwill should be moved to A&M, and based on the relative fair values of the sites involved, no goodwill was reassigned.
Goodwill at December 31, 2016 was $62.5 million, all of which was reported within the Aerostructures operating segment. The majority of this balance, $56.3 million, was related to the acquisition of Valent and was assigned in the A&M reporting unit, with the remainder assigned to the F&C reporting unit. During 2016, as discussed further below, a triggering event occurred which deemed that the goodwill previously reported in the Engineering Services reporting unit was fully impaired.
A quantitative test of the fair values of goodwill and indefinite lived intangibles was conducted for all of the Company's reporting units in 2016. The fair values for goodwill testing are estimated using a combination of the income and market approach unless circumstances indicate that a better estimate of fair value is available. The income approach utilizes the discounted cash flow model (“DCF model”) and the market approach is based on the market data for a group of guideline companies.
Using the DCF model requires the Company to forecast operating cash flows, including future sales growth, operating costs, tax rates, capital spending, and working capital changes. These assumptions may vary significantly among the reporting units. In addition estimates are required for the discount rate and the terminal value. The discount rate represents the expected return on capital and is based on the estimated weighted average cost of capital for a market participant. The discount rate considers the risk inherent in the projections used to estimate the fair value of the reporting unit. This rate takes into account the uncertainty about the expected revenue growth of the reporting unit and expected operating margins as well as the past performance of the reporting unit. The cash flow forecasts of the reporting units are based upon management’s long-term view of the Company’s markets. The Company has not materially changed its methodology for goodwill impairment testing for the years presented. Due to the many variables inherent in the estimation of a reporting unit's fair value and the relative size of the Company's recorded goodwill, differences in assumptions may have a material effect on the results of the Company's impairment analysis.
The Company also used the market approach to estimate the fair value of the reporting unit. The Company utilizes the guideline public company method in which valuation pricing multiples are derived from the market share prices of stocks of companies that are engaged in the same or similar lines of business as the reporting unit, and that are actively traded on a free and open market. The derived multiples are then applied to the reporting unit’s financial metrics producing indications of value, which are correlated to reach a final indication of value.
2016 Impairment Analysis
Engineering Services Reporting unit: In the second quarter of 2016, a triggering event occurred when the Company significantly downgraded the full-year 2016 sales and operating income forecast for its Engineering Services business due to
49
continued decline in demand. This downward adjustment to the forecast, combined with lower than expected operating results for the second quarter of 2016, was deemed to be a triggering event requiring an interim impairment evaluation for the Engineering Services reporting unit in accordance with ASC 350. An impairment analysis was performed and determined that the carrying value of related goodwill was fully impaired. As a result, a non-cash impairment charge of $24,302 was recorded in the second quarter of 2016, which brought the goodwill associated with the reporting unit to $0.
• | Discount rate: The discount rate used in determining the fair value of the reporting unit was 15.4% which was higher than rate of 12.2% used in 2015. The discount rate increase in 2016 was primarily due to the historical earnings volatility of the unit in the last three fiscal periods. |
• | Revenue growth assumptions: Projected annual growth assumptions are based on the Company’s and its peers historical operating performance adjusted for current and expected competitive and economic factors surrounding the aerospace and defense industry (the “industry”). The growth rates used approximated 2.5% per year. The Company used a terminal growth rate of 2.0% to calculate the terminal value in the discounted cash flow analysis. |
• | Operating profit margin assumptions: The forecasted operating profit used in the income approach is expected to decline in the future years as sales growth would not offset inflation. |
• | Working Capital assumptions and capital expenditures: Working capital requirements were forecasted based on the reporting unit’s historical performance. Capital expenditures were forecasted based on current spending plans for the forecast period and are expected to moderate as sales growth slows in the terminal year. |
The Company also used the market approach to estimate the fair value of the reporting unit. The Company used an EBITDA multiple based on the next 12 months of 3.0 and revenue multiples of 0.1 to estimate fair value using a market approach.
Assembly and Machining reporting unit: The Company's 2016 annual step one impairment test did not indicate that the fair value of this reporting unit was below its carrying value. The fair value exceeded the book value by 6.2% at the testing date. The key assumptions used in the step one test are as follows:
• | Discount rate: The discount rate used in determining the fair value of the reporting unit was 11.5%. The the discount rate reflects the use of corporate bond yield rates for securities with a debt rating similar to that of the Company's senior secured notes at December 31, 2016. This corporate bond yield rate was used in the calculation of the risk-free rate. Any discount rate below 12.25% would indicate that the fair value of the reporting unit remains in excess of the carrying value of the unit. |
• | Revenue growth assumptions: Projected annual growth assumptions are based on the Company and its peers historical operating performance adjusted for current and expected competitive and economic factors surrounding the aerospace and defense industry (the “industry”). The growth rate used for the reporting unit approximated 9.9% per year primarily driven by expected increased demand for large commercial aircraft. The Company used a terminal growth rate of 3.0% to calculate the terminal value in the discounted cash flow analysis. |
• | Operating profit margin assumptions: The forecasted operating profit used in the income approach is expected to improve in the future years as a result of leveraging additional sales. |
• | Working Capital assumptions and capital expenditures: Working capital requirements were forecasted based on the reporting unit’s historical performance. Capital expenditures were forecasted based on current spending plans for the forecast period and are expected to moderate as sales growth slows in the terminal year. |
The Company also used the market approach to estimate the fair value of the reporting unit. The Company used EBITDA multiples based on the last 12 months, the next 24 months and a 3 year average historical average to estimate fair value using a market approach. The multiple used in the valuation was approximately 9.4 times EBITDA. This resulted in a market value that was within 6.1% of the estimated fair value using the income approach. If any of these or other related estimates and assumptions are not realized in the future, to the extent the reporting unit cannot generate future cash flows at a level sufficient to recover the net book value, the Company may be required to record impairment charges. The impairment charges would reduce future net income and earnings per share.
Fabrication and Composites reporting unit: The Company's 2016 annual step one impairment test did not indicate that the fair value of this reporting unit was below its carrying value. The fair value exceeded the book value by 50.5% at the testing date. The key assumptions used in the step one test are as follows:
• | Discount rate: The discount rate used in determining the fair value of the reporting unit was 12.5%. The discount rate reflects the use of corporate bond yield rates for securities with a debt rating similar to that of the Company's senior secured notes at December 31, 2016. This corporate bond yield rate was used in the calculation of the risk-free rate. |
• | Revenue growth assumptions: Projected annual growth assumptions are based on the Company and its peers historical operating performance adjusted for current and expected competitive and economic factors surrounding the aerospace and defense industry (the “industry”). The growth rate used for the reporting unit approximated 8.6% per year primarily |
50
driven by expected increased demand for large commercial aircraft. The Company used a terminal growth rate of 3.0% to calculate the terminal value in the discounted cash flow analysis.
• | Operating profit margin assumptions: The forecasted operating profit used in the income approach is expected to improve in the future years as a result of leveraging additional sales. |
• | Working Capital assumptions and capital expenditures: Working capital requirements were forecasted based on the reporting unit’s historical performance. Capital expenditures were forecasted based on current spending plans for the forecast period and are expected to moderate as sales growth slows in the terminal year. |
The Company also used the market approach to estimate the fair value of the reporting unit. The Company used EBITDA multiples based on the last 12 months, the next 24 months and a 3 year average historical average to estimate fair value using a market approach. The multiple used in the valuation was approximately 7.6 times EBITDA. This resulted in a market value that was within 7.5% of the estimated fair value using the income approach. If any of these or other related estimates and assumptions are not realized in the future, to the extent the reporting unit cannot generate future cash flows at a level sufficient to recover the net book value, the Company may be required to record impairment charges. The impairment charges would reduce future net income and earnings per share.
As of December 31, 2016, and in further support of our analysis, our net book value for the entire Company (i.e., shareholders’ equity) was $85.5 million, and our market capitalization was approximately $117.4 million. Additionally, on February 16, 2017, the Company entered into a Plan of Merger with Sonaca S.A. As part of this agreement, shareholders of the Company's common stock will receive $14.00 per share, which implies the estimated fair value of the outstanding equity of the Company is approximately $190.8 million. This excess of implied fair value supports the Company's conclusion that there is no impairment of goodwill at December 31, 2016.
2015 Impairment Analysis
Engineering Services Reporting unit: The Company's 2015 annual step one impairment test indicated that the fair value of this reporting unit exceeded its book value by 8.4% at the testing date. The key assumptions used in the step one test were as follows:
• | Discount rate: The discount rate used in determining the fair value of the reporting unit was 12.2% which was higher than rate of 11.7% used in 2014. The discount rate increase in 2015 was primarily due to the historical earnings volatility of the unit in the last three fiscal periods. |
• | Revenue growth assumptions: Projected annual growth assumptions are based on the Company’s and its peers historical operating performance adjusted for current and expected competitive and economic factors surrounding the aerospace and defense industry (the “industry”). The growth rates used approximated 4.1% per year. The Company used a terminal growth rate of 3.0% to calculate the terminal value in the discounted cash flow analysis. |
• | Operating profit margin assumptions: The forecasted operating profit used in the income approach is expected to improve in the future years as a result of sales growth and a reduction in operating costs resulting from restructuring activities completed in fiscal year 2015. |
• | Working Capital assumptions and capital expenditures: Working capital requirements were forecasted based on the reporting unit’s historical performance. Capital expenditures were forecasted based on current spending plans for the forecast period and are expected to moderate as sales growth slows in the terminal year. |
The Company also used the market approach to estimate the fair value of the reporting unit. The Company used EBITDA multiples based on the last 12 months and for the next 12 months to estimate fair value using a market approach. The multiple used in the valuation was approximately 7.1 times EBITDA. This resulted in a market value that was within 1.8% of the estimated fair value using the income approach.
Valent Reporting unit: The Company's 2015 annual step one impairment test did not indicate that the fair value of this reporting unit was below its carrying value. The fair value exceeded the book value by 17.3% at the testing date. The key assumptions used in the Step One test were as follows:
• | Discount rate: The discount rate used in determining the fair value of the reporting unit was 12.0% which was slightly higher than rate of 11.5% used in 2014. The increase in the discount rate reflects the use of corporate bond yield rates for securities with a debt rating similar to that of the Company's senior secured notes at December 31, 2015. This corporate bond yield rate was used in the calculation of the risk-free rate. |
• | Revenue growth assumptions: Projected annual growth assumptions are based on the Company’s and its peers historical operating performance adjusted for current and expected competitive and economic factors surrounding the aerospace and defense industry (the “industry”). The growth rates used approximated 8.1% per year primarily driven by expected |
51
increased demand for large commercial aircraft. The Company used a terminal growth rate of 3.0% to calculate the terminal value in the discounted cash flow analysis.
• | Operating profit margin assumptions: The forecasted operating profit used in the income approach is expected to improve in the future years as a result of leveraging additional sales. |
• | Working Capital assumptions and capital expenditures: Working capital requirements were forecasted based on the reporting unit’s historical performance. Capital expenditures were forecasted based on current spending plans for the forecast period and are expected to moderate as sales growth slows in the terminal year. |
The Company also used the market approach to estimate the fair value of the reporting unit. The Company used EBITDA multiples based on the last 12 months and for the next 12 months to estimate fair value using a market approach. The multiple used in the valuation was approximately 8.7 times EBITDA. This resulted in a market value that was within 4.3% of the estimated fair value using the income approach.
Fabrication Reporting Unit: The Company performed the annual test of goodwill and indefinite-lived intangible assets for the Fabrication unit by performing a qualitative assessment and concluded it was more likely than not that the fair value of the unit exceeded carrying value, and thus no impairment charge was recorded.
Other Intangibles. Other intangible assets on the Consolidated Balance Sheets were $38.9 million and $46.6 million, at December 31, 2016 and 2015, respectively. Customer-related intangible assets resulted from the acquisitions of Versaform Corporation, Intec, TASS and Valent had original estimated useful lives ranging from five to twenty-two years. Other intangible assets resulting from the acquisition of Intec and Valent had an original estimated useful life of three to six years. The assumptions and judgments used in determining the useful lives of the intangible assets included in the period of time over which the Company expects to use the asset, expected duration of revenue that will be generated from the asset and how relationships with customers will create future propensity to purchase products and services from the Company. Valent intangible assets are amortized using the straight-line method. All other remaining intangibles assets are not material.
We test intangible assets for impairment by assessing the current period cash flows of each asset group. Events or changes in circumstances, including loss of a significant customer, a significant decrease in the level of business with a customer or a long-term contract not being extended, would indicate that the carrying amount of any of these intangible assets may not be recoverable and a change in the remaining useful life could be required. If that is the case, an undiscounted cash flow test is performed and, if necessary, an impairment charge is recognized for the amount by which the carrying amount of these assets exceeds its fair value. Intangible assets relating to the Engineering Services reporting unit were tested during the 2016 Step Two impairment test, as discussed above, and were deemed to be impaired at June 30, 2016, resulting in a charge of $4.1 million. The remaining intangible assets were evaluated for triggering events quarterly by the Company in 2016 and were not deemed to be impaired.
Income Taxes. The objective of accounting for income taxes is to recognize the amount of taxes payable or refundable for the current year and deferred tax liabilities and assets based on the future tax consequences of events that have been recognized in our financial statements or tax returns. Deferred tax assets are also required to be reduced by a valuation allowance if it is more likely than not that some portion or all of the deferred tax asset will not be realized.
We record an income tax expense or benefit based on the net income earned or net loss incurred in each tax jurisdiction and the tax rate applicable to that income or loss. In the ordinary course of business, there are transactions for which the ultimate tax outcome is uncertain. The final tax outcome for these matters may be different from management’s original estimates made in determining the income tax provision. A change to these estimates could impact the effective tax rate and net income or loss subsequent periods.
A valuation allowance, if needed, reduces deferred tax assets to the amount expected to be realized. When determining the amount of net deferred tax assets that are more likely than not to be realized, management assesses all available positive and negative evidence. This evidence includes, but is not limited to, prior earnings history, expected future earnings, carry-back and carry-forward periods and the feasibility of ongoing tax strategies that could potentially enhance the likelihood of the realization of a deferred tax asset. The weight given to the positive and negative evidence is commensurate with the extent the evidence may be objectively verified. As such, it is generally difficult for positive evidence regarding projected future taxable income exclusive of reversing taxable temporary differences to outweigh objective negative evidence of recent financial reporting losses.
Based on these criteria and the relative weighting of both the positive and negative evidence available, and in particular the activity surrounding the Company's losses in 2016, 2015 and 2014, management determined that it was necessary to establish a valuation allowance against all of its net U.S. deferred tax assets at December 31, 2016, 2015 and 2014. This determination was made as the Company entered into a cumulative loss position in the year ended December 31, 2013, due to the recording of a goodwill impairment of $73.5 million related to Valent. The Company remains in a loss position at December 31, 2016. Once the Company entered into a cumulative loss position, it passed the threshold after which there is a presumption that it should no longer rely solely on projected future income when determining whether the deferred tax asset is more likely than not to be realized.
52
While the Company does project future income, the objectively verifiable negative evidence of the recent losses and risk related to those projections outweighs the positive evidence. The remaining valuation allowance, which fully reserves the U.S. net deferred tax asset, was $21.0 million, $14.6 million and $12.7 million at December 31, 2016, 2015 and 2014, respectively.
The Company will continue to monitor its deferred tax position and may adjust the valuation allowance, if necessary, for utilization of the underlying deferred tax assets through current taxable income or as available evidence changes.
Recent Accounting Pronouncements
For information related to recently issued accounting standards, see Note 1 of the Notes to Consolidated Financial Statements in Item 8 below.
ITEM 7A.QUANTITATIVE AND QUALITATIVE DISCLOSURES ABOUT MARKET RISK.
We are exposed to market risks, including interest rates, inflation, and foreign currency exchange rates.
Interest Rate Sensitivity
At December 31, 2016, all of the Company's outstanding debt was at fixed rates. The interest rate associated with the Company's revolving credit agreement, for which no borrowings were outstanding at December 31, 2016, is variable. Borrowings under the revolving facility bear interest at either the LIBOR rate plus a margin of 3.00% to 3.50% or the alternate base rate (“ABR”) which is the highest of the following plus a margin of 2.00% to 2.50%, respectively, with the applicable margins for the revolving credit facility subject to a grid based on the average availability ratio of the Company for the most recently completed quarter:
•Prime rate,
•Federal funds rate plus 0.5%, or,
•The adjusted Eurodollar rate for an interest period of one month plus 1%.
During 2016, our average outstanding revolving debt at variable interest rates was $0.2 million. We estimate that a 1% change in the interest rates of our average floating-rate debt outstanding during the year ended December 31, 2016 would not have materially impacted interest expense. This determination was made by calculating the effect of a hypothetical interest rate change on our floating-rate debt. As of December 31, 2016, we had $243.3 million in carrying value of fixed-rate debt, primarily consisting of senior secured notes payable and Industrial Revenue Bonds, with a fair value of approximately the same.
On June 19, 2014, the Company, in conjunction with the restructuring of its debt facilities, settled all outstanding option and swap derivative contracts.
Inflation Risk
The Company experiences risk related to commodity prices as some of the raw materials and operating supplies are subject to price and supply fluctuations caused by the market. We strive to mitigate the impact of commodity price risk and participate in Boeing and Spirit Aerosystems' collective raw material sourcing contracts, which allow us to obtain raw materials at pre-negotiated rates. This mitigates the exposure to market volatility of certain raw materials used in the aerospace industry. Our supply agreements with The Boeing Company allow us to pass on certain unusual increases in raw material costs to The Boeing Company; however, in limited scenarios, we may not be fully compensated for the increased costs. We have long-term supply agreements with several of our primary suppliers. We do not enter into forward contracts or other financial instruments to hedge commodity price risk; however, we do focus on strategic risk management of all raw material commodities.
Foreign Currency Exchange Risk
Certain of our operations outside of the United States, which are immaterial to the Company's consolidated financial statements, use the related local currency as their functional currency. We translate revenue and expense at average rates of exchange during the period. We translate assets and liabilities at the rates of exchange as of the consolidated balance sheet dates and include foreign currency translation gains and losses as a component of accumulated other comprehensive income. Due to the nature of our operations and our corporate structure, we also have subsidiaries that have transactions in foreign currencies other than their functional currency. We record transaction gains and losses in our consolidated statements of operations related to the recurring re-measurement and settlement of such transactions. A 10% change in foreign currency exchange rates would not have a material impact to our consolidated financial position or results of operations.
53
ITEM 8. | FINANCIAL STATEMENTS AND SUPPLEMENTARY DATA. |
The following financial statements are included in Item 8 of this report:
Financial Statements | Page |
54
Report of Independent Registered Public Accounting Firm
To the Board of Directors and Stockholders of LMI Aerospace, Inc.:
In our opinion, the accompanying consolidated balance sheets and the related consolidated statements of comprehensive income (loss), of shareholders' equity and of cash flows present fairly, in all material respects, the financial position of LMI Aerospace, Inc. and its subsidiaries at December 31, 2016 and 2015, and the results of their operations and their cash flows for each of the three years in the period ended December 31, 2016, in conformity with accounting principles generally accepted in the United States of America. In addition, in our opinion, the financial statement schedule listed in the index appearing under Item 15 presents fairly, in all material respects, the information set forth therein when read in conjunction with the related consolidated financial statements. Also in our opinion, the Company maintained, in all material respects, effective internal control over financial reporting as of December 31, 2016, based on criteria established in Internal Control - Integrated Framework (2013) issued by the Committee of Sponsoring Organizations of the Treadway Commission (COSO). The Company's management is responsible for these financial statements and financial statement schedule, for maintaining effective internal control over financial reporting and for its assessment of the effectiveness of internal control over financial reporting, included in Report of Management Regarding Internal Control Over Financial Reporting appearing under Item 9A. Our responsibility is to express opinions on these financial statements, on the financial statement schedule and on the Company's internal control over financial reporting based on our integrated audits. We conducted our audits in accordance with the standards of the Public Company Accounting Oversight Board (United States). Those standards require that we plan and perform the audits to obtain reasonable assurance about whether the financial statements are free of material misstatement and whether effective internal control over financial reporting was maintained in all material respects. Our audits of the financial statements included examining, on a test basis, evidence supporting the amounts and disclosures in the financial statements, assessing the accounting principles used and significant estimates made by management, and evaluating the overall financial statement presentation. Our audit of internal control over financial reporting included obtaining an understanding of internal control over financial reporting, assessing the risk that a material weakness exists, and testing and evaluating the design and operating effectiveness of internal control based on the assessed risk. Our audits also included performing such other procedures as we considered necessary in the circumstances. We believe that our audits provide a reasonable basis for our opinions.
A company’s internal control over financial reporting is a process designed to provide reasonable assurance regarding the reliability of financial reporting and the preparation of financial statements for external purposes in accordance with generally accepted accounting principles. A company’s internal control over financial reporting includes those policies and procedures that (i) pertain to the maintenance of records that, in reasonable detail, accurately and fairly reflect the transactions and dispositions of the assets of the company; (ii) provide reasonable assurance that transactions are recorded as necessary to permit preparation of financial statements in accordance with generally accepted accounting principles, and that receipts and expenditures of the company are being made only in accordance with authorizations of management and directors of the company; and (iii) provide reasonable assurance regarding prevention or timely detection of unauthorized acquisition, use, or disposition of the company’s assets that could have a material effect on the financial statements.
Because of its inherent limitations, internal control over financial reporting may not prevent or detect misstatements. Also, projections of any evaluation of effectiveness to future periods are subject to the risk that controls may become inadequate because of changes in conditions, or that the degree of compliance with the policies or procedures may deteriorate.
/s/ PricewaterhouseCoopers LLP
Saint Louis, Missouri
March 15, 2017
55
LMI AEROSPACE, INC.
CONSOLIDATED BALANCE SHEETS
(Amounts in thousands, except share and per share data)
December 31, | |||||||
2016 | 2015 | ||||||
Assets | |||||||
Current assets: | |||||||
Cash and cash equivalents | $ | 2,491 | $ | 10,504 | |||
Trade accounts receivable, net | 51,269 | 48,491 | |||||
Inventories | 122,761 | 114,775 | |||||
Prepaid expenses and other current assets | 3,586 | 4,147 | |||||
Total current assets | 180,107 | 177,917 | |||||
Property, plant and equipment, net | 99,515 | 100,969 | |||||
Goodwill | 62,482 | 86,784 | |||||
Intangible assets, net | 38,852 | 46,582 | |||||
Other assets | 2,676 | 3,728 | |||||
Total assets | $ | 383,632 | $ | 415,980 | |||
Liabilities and shareholders’ equity | |||||||
Current liabilities: | |||||||
Accounts payable | $ | 29,378 | $ | 13,156 | |||
Accrued expenses | 25,543 | 30,015 | |||||
Current installments of long-term debt and capital lease obligations | 2,655 | 2,362 | |||||
Total current liabilities | 57,576 | 45,533 | |||||
Long-term debt and capital lease obligations, less current installments | 237,398 | 247,633 | |||||
Other long-term liabilities | 3,117 | 4,322 | |||||
Deferred income taxes | — | 536 | |||||
Total long-term liabilities | 240,515 | 252,491 | |||||
Shareholders’ equity: | |||||||
Common stock, $0.02 par value per share; authorized 28,000,000 shares; issued 13,625,205 and 13,287,688 shares at December 31, 2016 and December 31, 2015, respectively | 273 | 266 | |||||
Preferred stock, $0.02 par value per share; authorized 2,000,000 shares; none issued at either date | — | — | |||||
Additional paid-in capital | 99,955 | 97,617 | |||||
Accumulated other comprehensive loss | (282 | ) | (211 | ) | |||
Treasury stock, at cost, 39,419 shares at December 31, 2015 | — | (418 | ) | ||||
Retained (deficit) earnings | (14,405 | ) | 20,702 | ||||
Total shareholders’ equity | 85,541 | 117,956 | |||||
Total liabilities and shareholders’ equity | $ | 383,632 | $ | 415,980 | |||
See accompanying notes to consolidated financial statements.
56
LMI AEROSPACE, INC.
CONSOLIDATED STATEMENTS OF COMPREHENSIVE INCOME (LOSS)
(Amounts in thousands, except share and per share data)
Year Ended December 31, | |||||||||||
2016 | 2015 | 2014 | |||||||||
Sales and service revenue | |||||||||||
Product sales | $ | 308,089 | $ | 323,611 | $ | 321,284 | |||||
Service revenues | 38,091 | 51,485 | 66,533 | ||||||||
Net sales | 346,180 | 375,096 | 387,817 | ||||||||
Cost of sales and service revenue | |||||||||||
Cost of product sales | 249,227 | 259,610 | 254,775 | ||||||||
Cost of service revenues | 37,150 | 46,700 | 57,672 | ||||||||
Cost of sales | 286,377 | 306,310 | 312,447 | ||||||||
Gross profit | 59,803 | 68,786 | 75,370 | ||||||||
Selling, general and administrative expenses | 44,541 | 45,678 | 55,204 | ||||||||
Goodwill and intangible asset impairment | 28,368 | — | 26,439 | ||||||||
Restructuring expense | 1,212 | 2,322 | 2,585 | ||||||||
(Loss) income from operations | (14,318 | ) | 20,786 | (8,858 | ) | ||||||
Other income (expense): | |||||||||||
Interest expense | (21,171 | ) | (22,439 | ) | (29,280 | ) | |||||
Other, net | (352 | ) | (236 | ) | 223 | ||||||
Total other expense | (21,523 | ) | (22,675 | ) | (29,057 | ) | |||||
Loss before income taxes | (35,841 | ) | (1,889 | ) | (37,915 | ) | |||||
(Benefit) provision for income taxes | (734 | ) | 352 | (8,953 | ) | ||||||
Net loss | (35,107 | ) | (2,241 | ) | (28,962 | ) | |||||
Other comprehensive income (loss): | |||||||||||
Change in foreign currency translation adjustment | (71 | ) | (41 | ) | (98 | ) | |||||
Reclassification adjustment for losses on interest rate hedges included in net earnings, net of tax of $0, $0 and $157 | — | — | 278 | ||||||||
Total comprehensive loss | $ | (35,178 | ) | $ | (2,282 | ) | $ | (28,782 | ) | ||
Amounts per common share: | |||||||||||
Net loss per common share | $ | (2.68 | ) | $ | (0.17 | ) | $ | (2.28 | ) | ||
Net loss per common share assuming dilution | $ | (2.68 | ) | $ | (0.17 | ) | $ | (2.28 | ) | ||
Weighted average common shares outstanding | 13,113,901 | 12,869,353 | 12,716,976 | ||||||||
Weighted average dilutive common shares outstanding | 13,113,901 | 12,869,353 | 12,716,976 | ||||||||
See accompanying notes to consolidated financial statements.
57
LMI AEROSPACE, INC.
CONSOLIDATED STATEMENTS OF SHAREHOLDERS’ EQUITY
(Amounts in thousands, except share data)
Common Stock | Additional Paid-In Capital | Treasury Stock | Retained Earnings (Deficit) | Accumulated Other Comprehensive Income (Loss) | Total Share- holders' Equity | ||||||||||||||||||
Balance at December 31, 2013 | $ | 257 | $ | 92,692 | $ | (202 | ) | $ | 51,904 | $ | (507 | ) | $ | 144,144 | |||||||||
Net loss | — | — | — | (28,962 | ) | — | (28,962 | ) | |||||||||||||||
Other comprehensive gain | — | — | — | — | 337 | 337 | |||||||||||||||||
Issuance of stock | |||||||||||||||||||||||
142,588 shares of restricted stock, net of forfeitures | 4 | (38 | ) | (215 | ) | — | — | (249 | ) | ||||||||||||||
12,175 shares - other share based payments | — | 109 | 58 | — | — | 167 | |||||||||||||||||
401K plan contribution | 1 | 847 | — | — | — | 848 | |||||||||||||||||
Restricted stock compensation | — | 1,850 | — | — | — | 1,850 | |||||||||||||||||
Balance at December 31, 2014 | 262 | 95,460 | (359 | ) | 22,942 | (170 | ) | 118,135 | |||||||||||||||
Net loss | — | — | — | (2,241 | ) | — | (2,241 | ) | |||||||||||||||
Other comprehensive loss | — | — | — | — | (41 | ) | (41 | ) | |||||||||||||||
Issuance of stock | |||||||||||||||||||||||
131,063 shares of restricted stock, net of forfeitures | 3 | (178 | ) | (150 | ) | — | — | (325 | ) | ||||||||||||||
6,791 shares - other share based payments | (7 | ) | 91 | 84 | |||||||||||||||||||
401K plan contribution | 1 | 709 | — | — | — | 710 | |||||||||||||||||
Restricted stock compensation | — | 1,633 | — | — | — | 1,633 | |||||||||||||||||
Other | — | — | — | 1 | — | 1 | |||||||||||||||||
Balance at December 31, 2015 | 266 | 97,617 | (418 | ) | 20,702 | (211 | ) | 117,956 | |||||||||||||||
Net loss | — | — | — | (35,107 | ) | — | (35,107 | ) | |||||||||||||||
Other comprehensive loss | — | — | — | — | (71 | ) | (71 | ) | |||||||||||||||
Issuance of stock | |||||||||||||||||||||||
212,890 shares of restricted stock, net of forfeitures | 4 | (612 | ) | 418 | — | — | (190 | ) | |||||||||||||||
401k plan contribution | 3 | 1,469 | — | — | — | 1,472 | |||||||||||||||||
Restricted stock compensation | — | 1,481 | — | — | — | 1,481 | |||||||||||||||||
Balance at December 31, 2016 | $ | 273 | $ | 99,955 | $ | — | $ | (14,405 | ) | $ | (282 | ) | $ | 85,541 | |||||||||
See accompanying notes to consolidated financial statements.
58
LMI AEROSPACE, INC.
CONSOLIDATED STATEMENTS OF CASH FLOWS
(Amounts in thousands)
Year Ended December 31, | |||||||||||
2016 | 2015 | 2014 | |||||||||
Operating activities: | |||||||||||
Net loss | $ | (35,107 | ) | $ | (2,241 | ) | $ | (28,962 | ) | ||
Adjustments to reconcile net loss to net cash provided by operating activities: | |||||||||||
Depreciation and amortization | 19,043 | 20,404 | 22,459 | ||||||||
Amortization of debt issuance cost | 1,899 | 1,961 | 2,155 | ||||||||
Goodwill and intangible asset impairment | 28,368 | — | 26,439 | ||||||||
Stock-based compensation | 1,481 | 1,717 | 2,018 | ||||||||
Debt issuance cost write-off | — | — | 8,466 | ||||||||
Payments to settle interest rate derivatives | — | — | (793 | ) | |||||||
Deferred taxes | (723 | ) | 78 | 76 | |||||||
Other non-cash items | (84 | ) | (1,005 | ) | 686 | ||||||
Changes in operating assets and liabilities, net of acquired businesses: | |||||||||||
Trade accounts receivable | (2,965 | ) | 9,624 | 14,270 | |||||||
Inventories | (8,610 | ) | (1,047 | ) | (1,101 | ) | |||||
Prepaid expenses and other assets | 975 | 325 | 109 | ||||||||
Current income taxes | 181 | 6,506 | (5,908 | ) | |||||||
Accounts payable | 13,433 | (8,427 | ) | 307 | |||||||
Accrued expenses | (3,340 | ) | 4,467 | 8,896 | |||||||
Net cash provided by operating activities | 14,551 | 32,362 | 49,117 | ||||||||
Investing activities: | |||||||||||
Additions to property, plant and equipment | (11,813 | ) | (16,599 | ) | (16,690 | ) | |||||
Proceeds from sale of equipment | 639 | 285 | 3,579 | ||||||||
Net cash used by investing activities | (11,174 | ) | (16,314 | ) | (13,111 | ) | |||||
Financing activities: | |||||||||||
Proceeds from issuance of debt | 1,465 | — | 250,000 | ||||||||
Principal payments on long-term debt and notes payable | (12,699 | ) | (13,276 | ) | (235,633 | ) | |||||
Advances on revolving line of credit | 60,000 | 99,000 | 66,000 | ||||||||
Payments on revolving line of credit | (60,000 | ) | (99,000 | ) | (102,000 | ) | |||||
Debt issuance costs | (156 | ) | (195 | ) | (8,018 | ) | |||||
Net cash used by financing activities | (11,390 | ) | (13,471 | ) | (29,651 | ) | |||||
Net (decrease) increase in cash and cash equivalents | (8,013 | ) | 2,577 | 6,355 | |||||||
Cash and cash equivalents, beginning of year | 10,504 | 7,927 | 1,572 | ||||||||
Cash and cash equivalents, end of year | $ | 2,491 | $ | 10,504 | $ | 7,927 | |||||
Cash payments for: | |||||||||||
Interest paid | $ | 18,657 | $ | 21,336 | $ | 7,388 | |||||
Income tax refunds received, net | $ | (228 | ) | $ | (6,370 | ) | $ | (3,037 | ) | ||
See accompanying notes to consolidated financial statements.
59
LMI AEROSPACE, INC.
NOTES TO CONSOLIDATED FINANCIAL STATEMENTS
(Dollar amounts in thousands, except share and per share data)
December 31, 2016
1. | ACCOUNTING POLICIES |
Principles of Consolidation
The Consolidated Financial Statements included in this report have been prepared by management of LMI Aerospace, Inc. All significant intercompany balances and transactions have been eliminated in consolidation.
Use of Estimates
The preparation of financial statements in conformity with accounting principles generally accepted in the United States of America requires management to make certain estimates and assumptions. These estimates and assumptions affect the reported amounts in the financial statements and accompanying notes. Actual results could differ from these estimates.
Revenue and Profit Recognition
Except as described below, the Company recognizes revenue for sales of products and related services in accordance with Financial Accounting Standards Board, (“FASB”) Accounting Standards Codification (“ASC”) Topic 605-15 Products and Topic 605-20 Services. The Company sells products under long term supply contracts and purchase orders where the product is built to the customer specifications based on firm purchase orders from the customer. The purchase orders tend to be of a relatively short duration and customers place orders on a periodic basis. The pricing is generally fixed for some length of time and the quantities are based on individual purchase orders. Revenue is recognized when title passes and services are rendered, the price is fixed or determinable, and collection is reasonably assured. Approximately 80.0% to 90.0% of the total revenue the Company recognized in any given year is accounted for in accordance with Topics 15 and 20. The remainder of the revenue is accounted for using methods consistent with ASC Topic 605-35 Construction-Type and Production-Type Contracts.
The percentage of completion method used to account for contracts depends on the nature of the products provided under the contract. For example, for contracts that require us to perform a significant level of development effort, in comparison to the total value of the contract, sales are recorded using the cost-to-cost method to measure progress toward completion. Under the cost-to-cost method of accounting, we recognize sales and estimated profit as costs are incurred based on the proportion that the incurred costs represent of total estimated costs. For contracts that require us to provide a substantial number of similar items without a significant level of development, we record sales and estimated profit using units of delivery as the basis to measure progress toward completing the contract. Under both methods, profit recognized is based on the total expected profit margin percentage multiplied by revenue recognized to date.
The Company periodically reviews all estimates to complete as required by the authoritative guidance and the estimated total cost and expected gross profit are revised as required over the life of the contract. Any revisions to the estimated total revenue or cost are accounted for as a change in estimate. A cumulative catch-up adjustment is recorded in the period the change in estimated cost to complete the contract is determined.
In addition, should total estimated costs at completion exceed the estimated total revenue, any anticipated loss is recognized in the period in which the anticipated loss is determined. The loss is reported either as a reduction of revenue or as a component of cost of sales. During 2016 and 2015, the Company recorded losses on a cost-to-cost program of $1,903 and $2,763, respectively, which included provisions for anticipated future loss of $722 and $476, respectively. At December 31, 2013, the Company had a contract accounted for using the units of delivery method which was acquired during the Valent acquisition and where estimated costs exceeded the total contract revenue. The provision for anticipated loss was established in 2013 for $5,267 and was treated as a measurement period change and as such increased the goodwill related to the Valent acquisition. During the third quarter of 2014, a change was agreed to that resulted in the favorable settlement of an unpriced change order related to this contract. In addition, the Company secured more favorable future material pricing with respect to this contract as engineering changes to the related assemblies had stabilized. As a result, contract costs were no longer expected to exceed revenue and the remaining related loss reserve was reversed, resulting in a favorable cumulative catch up adjustment of $5,267 in the year ended December 31, 2014. The reversal was recorded in the cost of goods sold section of the Consolidated Statements of Comprehensive Income (Loss).
Cumulative catch-up adjustments had the following impact to operating income in the years presented:
60
LMI AEROSPACE, INC.
NOTES TO CONSOLIDATED FINANCIAL STATEMENTS
(Dollar amounts in thousands, except share and per share data)
December 31, 2016
2016 | 2015 | 2014 | |||||||||
Favorable adjustments | $ | 1,342 | $ | 1,308 | $ | 5,720 | |||||
Unfavorable adjustments | (2,483 | ) | (2,954 | ) | (1,719 | ) | |||||
Net operating income adjustments | $ | (1,141 | ) | $ | (1,646 | ) | $ | 4,001 | |||
Unfavorable cumulative catch-up adjustments of $1,903, $2,763 and $1,479 were recorded in 2016, 2015 and 2014, respectively, related to the Mitsubishi Regional Jet design build program which has experienced higher than expected development costs. A loss provision for this contract was established in 2015 and the contract remains in a loss position at December 31, 2016. The adjustments related to this program was recorded as a reduction to revenue in the Consolidated Statements of Comprehensive Income (Loss).
Favorable adjustments recorded in 2014 are primarily associated with the aforementioned Valent contract of $5,267. The adjustments related to this program was recorded as a reduction to cost of sales in the Consolidated Statements of Comprehensive Income (Loss).
Contract accounting requires management to estimate contract revenues and costs, and make assumptions related to production schedule and total units to be produced, among other matters. Due to the size, length of time and nature of many of our contracts, the estimation of total sales and cost is very complicated and subject to many variables, including development program delays and the expected recovery of deferred cost. Claims and unpriced change orders can also impact the estimate of total revenues and profits. In the ordinary course of business, the Company may receive requests from its customers to perform tasks not specified in its contracts. When this occurs on a long-term contract using the cost-to-cost method of percentage of completion accounting, the Company may record revenue for claims or unpriced change orders to be negotiated with customers. The Company's revenue recognized in 2016 contained $933 that represented amounts associated with claims and unpriced change orders.
The development of a contract revenue and gross margin percentage involves utilization of detailed procedures by a team of operational and financial personnel that provides information on the status of the contracts. Total contract cost estimates are largely based our current cost of production, purchase order terms negotiated or estimated by our supply chain. Estimates of revenue and costs associated with each significant contract are reviewed and approved by the team on a quarterly basis.
Due to the significance of the judgment in the estimation process described above, it is possible that materially different margins could be recorded if we used different assumptions or if the underlying circumstances were to change.
Pre-Production Costs under Long-Term Supply Contracts
The Company may incur design and development costs prior to the production phase of contracts that are outside the scope of the contract accounting method. These pre-production costs are generally related to costs the Company incurs to design and build tooling that is owned by the customer. The Company receives the non-cancellable right to use these tools to build the parts as specified in a contractual agreement and therefore has capitalized these costs. In certain instances, the Company enters into agreements with its customers that provide it a contractual guarantee for reimbursement of design and engineering services incurred prior to the production phase of a contract. Due to the contractual guarantee, the Company capitalizes the costs of these services. The pre-production costs are amortized to cost of sales over the shorter of the life of the contractual agreement or the related tooling.
Cash and Cash Equivalents
Cash and cash equivalents include cash on hand, deposits in transit and all highly liquid investment instruments with an initial maturity of three months or less.
Inventories
61
LMI AEROSPACE, INC.
NOTES TO CONSOLIDATED FINANCIAL STATEMENTS
(Dollar amounts in thousands, except share and per share data)
December 31, 2016
The Company’s inventories are stated at the lower of cost or market and utilize actual costs for raw materials and average or standard cost (which approximates actual cost) for work in process, manufactured and purchased components and finished goods. The Company evaluates the inventory carrying value and reduces the carrying costs based on customer activity, estimated future demand, price deterioration, and other relevant information. The Company’s customer demand is unpredictable and may fluctuate due to factors beyond the Company’s control. In addition, inventoried costs include capitalized contract costs relating to programs and contracts with long-term production cycles, a portion of which is not expected to be realized within one year. See further discussion regarding deferred long-term contract costs under “Revenue and Profit Recognition” and “Pre-Contract and Pre-Production Costs under Long-Term Supply Contracts.”
Allowance for Doubtful Accounts
The allowance for doubtful accounts receivable reflects the Company’s best estimate of probable losses inherent in its accounts receivable. The basis used to determine this value is derived from historical experience, specific allowances for known troubled customers and other known information.
Property, Plant and Equipment
Property, plant and equipment are stated at cost. Depreciation is calculated using the straight-line method over the estimated useful lives of the related assets. Leasehold improvements are amortized using the straight-line method over the shorter of the lease term or the estimated useful lives of the assets. Estimated useful lives for buildings, machinery and equipment, and purchased software are 20 to 40 years, 3 to 20 years and 3 to 10 years, respectively. Amortization incurred under capital leases is reported with depreciation expense.
Long Lived Assets
Long lived assets held and used are reviewed for impairment based on future undiscounted cash flows whenever events or changes in circumstances indicate that the carrying value of an asset may not be recoverable.
Goodwill and Intangible Assets
The Company’s acquisitions involve the purchase of tangible and intangible assets and the assumption of certain liabilities. As part of the purchase price allocation, the Company allocates the purchase price to the tangible assets acquired and liabilities assumed based on estimated fair market values, and the remainder of the purchase price is allocated to intangibles and goodwill. Goodwill and intangible assets with indefinite lives are not amortized but are subject to an impairment assessment at least annually in relation to their fair value. Under guidelines established by FASB ASC Topic 280, the Company operates in two operating segments. However, the Company has recorded its goodwill and conducts testing for potential goodwill impairment at a reporting unit level. The reporting units represent a business for which discrete financial information is available, and segment management regularly reviews the operating results. As part of this process, the Company first assesses qualitatively whether it is necessary to perform the quantitative test. The qualitative assessment involves evaluating relevant events or circumstances to determine whether it is more likely than not that the fair value of the reporting unit is less than its carrying amount. If it is, the Company can bypass the quantitative assessment of goodwill. If it is not, or if the Company has elected to bypass the qualitative assessment process, the quantitative assessment of goodwill utilizes a two-step process, where the carrying value of the reporting unit is compared to its fair value. If the carrying value is less than the fair value, no impairment exists, and the second step is not performed. However, if the carrying value is greater than the fair value, the second step is performed. An impairment charge would be recognized for the amount that the carrying value of the goodwill exceeds its fair value. The fair values for goodwill testing are estimated using a combination of the income and market approach unless circumstances indicate that a better estimate of fair value is available. The income approach utilizes the discounted cash flow model (“DCF model”) and the market approach is based on the market data for a group of guideline companies.
Deferred Gain on Sale of Real Estate
In December 2006, the Company entered into an agreement with a third party to sell and lease back certain of its real estate properties for $10,250. The amount of the sale price in excess of book value for these properties of $4,242 was deferred and is being amortized to rent expense over the 18 year term of the leases on a straight-line basis. At December 31, 2016 and
62
LMI AEROSPACE, INC.
NOTES TO CONSOLIDATED FINANCIAL STATEMENTS
(Dollar amounts in thousands, except share and per share data)
December 31, 2016
2015, the unamortized deferred gain of $1,906 and $2,140, respectively, was reflected in Accrued Expenses and Other Long-Term Liabilities in the Consolidated Balance Sheet.
Share-Based Compensation
The Company recognizes compensation expense for share-based payment transactions in the financial statements at their fair value. The expense is measured at the grant date, based on the calculated fair value of the share-based award, and is recognized over the requisite service period (generally the vesting period of the equity award).
Income Taxes
Provisions for federal and state income taxes are calculated on reported net income/loss before income taxes based on current tax law and also include, in the current period, the cumulative effect of any changes in tax rates from those used previously in determining deferred tax assets and liabilities. Such provisions differ from the amounts currently receivable or payable because certain items of income and expense are recognized in different time periods for financial reporting purposes than for income tax purposes. Significant judgment is required in determining income tax provisions and evaluating tax positions.
A valuation allowance, if needed, reduces deferred tax assets to the amount expected to be realized. When determining the amount of net deferred tax assets that are more likely than not to be realized, management assesses all available positive and negative evidence. This evidence includes, but is not limited to, prior earnings history, expected future earnings, carry-back and carry-forward periods and the feasibility of ongoing tax strategies that could potentially enhance the likelihood of the realization of a deferred tax asset. The weight given to the positive and negative evidence is commensurate with the extent the evidence may be objectively verified. As such, it is generally difficult for positive evidence regarding projected future taxable income exclusive of reversing taxable temporary differences to outweigh objective negative evidence of recent financial reporting losses.
Based on these criteria and the relative weighting of both the positive and negative evidence available, and in particular the activity surrounding the Company's significant loss in 2013, management determined that it was necessary to establish a valuation allowance against all of its net U.S. deferred tax assets at December 31, 2013. This determination was made as the Company entered into a cumulative loss position over the three year period ended December 31, 2013 primarily due to recording a goodwill impairment of $73,528 related to Valent. Once the Company entered into a cumulative loss position it had passed the threshold after which there is a presumption that a company should no longer rely solely on projected future income in determining whether the deferred tax asset is more likely than not to be realized. The Company has remained in a cumulative loss position at December 31, 2016, 2015 and 2014. The Company will continue to monitor its deferred tax position and may adjust the valuation allowance, if necessary, for utilization of the underlying deferred tax assets through current taxable income or as available evidence changes. At December 31, 2016, 2015 and 2014, the Company's deferred tax assets remained under a valuation allowance.
The accounting for uncertainty in income taxes requires a more-likely-than-not threshold for financial statement recognition and measurement of tax positions taken or expected to be taken in a tax return. The Company records a liability for the difference between the benefit recognized and measured for financial statement purposes and the tax position taken or expected to be taken on our tax return. To the extent that management’s assessment of such tax positions changes, the change in estimate is recorded in the period in which the determination is made.
The Company’s unrecognized tax benefits as of December 31, 2016 and 2015 are immaterial. The Company expects no significant increases or decreases in unrecognized tax benefits due to changes in tax positions within one year of December 31, 2016. The Company has no material interest or penalties relating to income taxes recognized in the Consolidated Statement of Comprehensive Income (Loss) as of December 31, 2016, 2015 or 2014. As of December 31, 2016, returns for calendar 2015 remain subject to examination by the Internal Revenue Service and returns for 2013 through 2015 remain subject to examination by various state tax jurisdictions.
Financial Instruments
Fair values of the Company’s long-term obligations approximate their carrying values as the applicable interest rates approximate the current market rates or have variable rate characteristics. The Company’s other financial instruments have fair values that approximate their respective carrying values due to their short maturities.
63
LMI AEROSPACE, INC.
NOTES TO CONSOLIDATED FINANCIAL STATEMENTS
(Dollar amounts in thousands, except share and per share data)
December 31, 2016
Recent Accounting Pronouncements
In May 2014, the Financial Accounting Standards Board (“FASB”) issued Accounting Standards Update (“ASU”) No. 2014-09, Revenue from Contracts with Customers (Topic 606). The new standard is effective for reporting periods beginning after December 15, 2017 and the Company plans to adopt the standard in the first quarter of 2018. The standard supersedes existing revenue recognition guidance, including industry-specific guidance, and provides companies with a single revenue recognition model for recognizing revenue from contracts with customers. The standard requires revenue to be recognized when promised goods or services are transferred to customers in amounts that reflect the consideration to which the company expects to be entitled in exchange for those goods or services. The two permitted transition methods under the new standard are the full retrospective method, in which case the standard would be applied to each prior reporting period presented, or the modified retrospective method, in which case the cumulative effect of applying the standard would be recognized at the date of initial application. The adoption of the new standard may have a material impact on our income statement and balance sheet but we have not completed the quantification of that impact at this time.
The Company performed a preliminary review of its significant contracts and have identified differences that would result from applying the new standard to those contracts. Based on this review, we currently expect that the timing of the recognition of revenue and related costs may change for a significant portion of our business. Some of our contracts on which we currently recognize revenue when risk of loss is transferred to the customer may recognize revenue as costs are incurred under the new standard. In addition, some long-term production contracts for which we currently recognize cost at an average expected margin over the life of the contract may recognize costs attributable to each individual unit as control is transferred to the customer. under the new standard. Adoption of the new standard will not change the total amount of revenue recognized on these contracts, only the timing of when revenue is recognized. These changes also have the potential to significantly alter the amount of deferred contract costs in inventory reported on our balance sheet.
The Company is currently evaluating the transition method to be used and is implementing changes to business processes, systems and controls to support adoption of the standard.
In February 2016, the FASB issued ASU 2016-02, "Leases." The standard requires lessees to recognize a lease liability and a lease asset for all leases, including operating leases, with a term greater than 12 months on its balance sheet. The new standard also expands the required quantitative and qualitative disclosures surrounding leases. The provisions of this new guidance are effective as of the beginning of the Company’s first quarter of 2019. This new standard will be applied using a modified retrospective transition approach for leases existing at, or entered into after, the beginning of the earliest comparative period presented in the financial statements. The Company is currently evaluating the effect of this standard on its consolidated financial statements.
In March 2016, the FASB issued ASU 2016-09, "Improvements to Employee Share-Based Payment Accounting," which amends Accounting Standards Codification (“ASC”) Topic 718, Compensation – Stock Compensation. The standard requires excess tax benefits or deficiencies for share-based payments be recorded in the period shares vest as income tax expense or benefit, rather than within Additional Paid-in Capital. Cash flows related to excess tax benefits will be included in operating activities and will no longer be separately classified as a financing activity. The new standard is effective for reporting periods beginning after December 15, 2016 and early adoption is permitted. The Company plans to adopt the new standard effective January 1, 2017 and no material impact on our financial statements is expected.
In August 2016, the FASB issued ASU 2016-15, "Statement of Cash Flows (Topic 230), Classification of Certain Cash Receipts and Cash Payments." The guidance addresses the classification of cash flow related to (1) debt prepayment or extinguishment costs, (2) settlement of zero-coupon debt instruments or other debt instruments with coupon rates that are insignificant in relation to the effective interest rate of the borrowing, (3) contingent consideration payments made after a business combination, (4) proceeds from the settlement of insurance claims, (5) proceeds from the settlement of corporate-owned life insurance, including bank-owned life insurance, (6) distributions received from equity method investees and (7) beneficial interests in securitization transactions. The guidance also clarifies how the predominance principle should be applied when cash receipts and cash payments have aspects of more than one class of cash flows. The guidance will generally be applied retrospectively and is effective for financial statements issued for annual reporting periods beginning after December 15, 2017. Early application is permitted and the Company plans to adopt the new standard effective January 1, 2017. We are currently evaluating the impact of this standard on our consolidated statement of cash flows.
64
LMI AEROSPACE, INC.
NOTES TO CONSOLIDATED FINANCIAL STATEMENTS
(Dollar amounts in thousands, except share and per share data)
December 31, 2016
All other issued but not yet effective accounting pronouncements are not expected to have a material impact on our Consolidated Financial Statements.
2. | ASSETS AND LIABILITIES MEASURED AT FAIR VALUE |
Fair value is the price that would be received from selling an asset or paid to transfer a liability in an orderly transaction between market participants at the measurement date. A fair value hierarchy gives the highest priority to unadjusted quoted prices in active markets for identical assets or liabilities (level 1 measurements) and the lowest priority to unobservable inputs (level 3 measurements). The three levels of the fair value hierarchy are described below:
Level 1: | Quoted prices in active markets for identical assets or liabilities. |
Level 2: | Observable inputs other than Level 1 prices, such as quoted prices for similar assets or liabilities; quoted prices in markets that are not active; or other inputs that are observable or can be corroborated by observable market data for substantially the full term of the assets or liabilities. |
Level 3: | Unobservable inputs that are supported by little or no market activity and that are significant to the fair value of the assets or liabilities. |
The asset or liability’s fair value measurement level within the fair value hierarchy is based on the lowest level of any input that is significant to the fair value measurement. The valuation techniques used need to maximize the use of observable inputs and minimize the use of unobservable inputs. There have been no changes in the methodologies used at December 31, 2016. There were no transfers between levels during 2016 and 2015.
Assets and Liabilities at Fair Value | 2016 | ||||||||||||||||||
as of December 31, 2016 | Total | ||||||||||||||||||
Total | (Level 1) | (Level 2) | (Level 3) | Losses | |||||||||||||||
Non-recurring Fair Value Measurements: | |||||||||||||||||||
Asset: | |||||||||||||||||||
Intangible assets, net (1) | $ | 38,852 | $ | — | $ | — | $ | 38,852 | $ | (4,066 | ) | ||||||||
Goodwill (2) | $ | 62,482 | $ | — | $ | — | $ | 62,482 | $ | (24,302 | ) | ||||||||
(1) The fair values of intangibles relating to the acquisition of Valent was determined by third parties in connection with the purchase and recorded at those values. The intangibles relating to the Engineering Services reporting unit were deemed impaired during 2016 and a $4,066 impairment charge was recorded in the Consolidated Statements of Comprehensive Income (Loss) for the year ended December 31, 2016.
(2) The Company performed its annual impairment analysis of goodwill related to the Aerostructures reporting units during the fourth quarter of 2016 and determined no adjustments to the carrying value were necessary. The value of the goodwill relating to the Engineering Services reporting unit was deemed impaired during 2016 and a $24,302 impairment charge was recorded in the Consolidated Statements of Comprehensive Income (Loss) for the year ended December 31, 2016.
65
LMI AEROSPACE, INC.
NOTES TO CONSOLIDATED FINANCIAL STATEMENTS
(Dollar amounts in thousands, except share and per share data)
December 31, 2016
2015 | |||||||||||||||||||
Assets and Liabilities at Fair Value | Total | ||||||||||||||||||
as of December 31, 2015 | Gains | ||||||||||||||||||
Total | (Level 1) | (Level 2) | (Level 3) | (Losses) | |||||||||||||||
Non-recurring Fair Value Measurements: | |||||||||||||||||||
Asset: | |||||||||||||||||||
Intangible assets, net (1) | $ | 46,582 | $ | — | $ | — | $ | 46,582 | $ | — | |||||||||
Goodwill (2) | $ | 86,784 | $ | — | $ | — | $ | 86,784 | $ | — | |||||||||
(1) The fair values of intangibles relating to the acquisitions of TASS and Valent were determined by third parties in connection with the purchase and recorded at those values.
(2) The Company performed its annual impairment analysis of goodwill during the fourth quarter of 2015 and determined no adjustments to the carrying value were necessary.
3. | ACCOUNTS RECEIVABLE NET |
Accounts receivable, net consists of the following:
December 31, | |||||||
2016 | 2015 | ||||||
Trade receivables | $ | 44,927 | $ | 42,307 | |||
Unbilled revenue | 4,318 | 4,869 | |||||
Other receivables | 2,372 | 1,561 | |||||
51,617 | 48,737 | ||||||
Less: Allowance for doubtful accounts | (348 | ) | (246 | ) | |||
Accounts receivable, net | $ | 51,269 | $ | 48,491 | |||
Under long-term contract accounting unbilled revenue on long-term contracts arise when the sales or revenues based on performance attainment, though appropriately recognized, cannot be billed yet under terms of the contract as of the balance sheet date. Accounts receivable which the Company expects to collect after December 31, 2017 are not material.
4. | INVENTORIES |
Inventories consist of the following:
December 31, | |||||||
2016 | 2015 | ||||||
Raw materials | $ | 12,822 | $ | 12,513 | |||
Work in progress | 23,795 | 22,681 | |||||
Manufactured and purchased components | 20,922 | 19,224 | |||||
Finished goods | 28,346 | 28,169 | |||||
Product inventory | 85,885 | 82,587 | |||||
Capitalized contract costs | 36,876 | 32,188 | |||||
Total inventories | $ | 122,761 | $ | 114,775 | |||
66
LMI AEROSPACE, INC.
NOTES TO CONSOLIDATED FINANCIAL STATEMENTS
(Dollar amounts in thousands, except share and per share data)
December 31, 2016
Capitalized contract costs include $5,373 and $5,970 at December 31, 2016 and 2015, respectively, related to an agreement the Company signed with Spirit Aerostructures ("Spirit"). This agreement extended the performance period of the statements of work for certain contracts with Spirit and gave the Company preferred supplier status on certain future contracts. In accordance with the contract terms, the Company made $6,500 in cash payments of consideration to Spirit in 2015 which was recorded as an increase to capitalized contract costs in inventory in the Consolidated Balance Sheet. This consideration is being amortized as a reduction to revenue over the life of the related contracts.
The increase in capitalized contract costs in 2016 relates primarily to four early-stage long-term contracts. The Company expects these costs will not be realized within one year but believes these amounts will be fully recovered over the life of the related contracts.
The following table illustrates the market to which capitalized contract cost at December 31, 2016 and December 31, 2015 related:
December 31, | |||||||
2016 | 2015 | ||||||
Large commercial aircraft | $ | 10,852 | $ | 11,528 | |||
Corporate and regional aircraft | 21,081 | 16,721 | |||||
Military | 4,943 | 3,939 | |||||
Total capitalized contract cost | $ | 36,876 | $ | 32,188 | |||
In accordance with ASC 605-35-45-1&2, the provisions for anticipated losses on contracts are accounted for as additional contract cost and recognized as part of cost of sales. Provisions for losses are recorded as a reduction of related contract costs recorded in inventory. At December 31, 2016 and 2015, the Company had no contracts with loss reserves accounted for as a reduction of inventory.
5. | PROPERTY, PLANT AND EQUIPMENT |
Depreciation expense (including amortization expense on software) recorded by the Company totaled $14,755, $15,494 and $17,934 for 2016, 2015 and 2014, respectively.
December 31, | |||||||
2016 | 2015 | ||||||
Land | $ | 960 | $ | 1,108 | |||
Buildings and improvements | 27,567 | 27,779 | |||||
Machinery and equipment | 137,899 | 129,222 | |||||
Leasehold improvements | 13,748 | 13,373 | |||||
Software and other | 8,510 | 8,507 | |||||
Construction in progress | 13,569 | 11,687 | |||||
Total gross property, plant and equipment | 202,253 | 191,676 | |||||
Less accumulated depreciation | (102,738 | ) | (90,707 | ) | |||
Total net property, plant and equipment | $ | 99,515 | $ | 100,969 | |||
See discussion in Note 8 to the Consolidated Financial Statements regarding property, plant and equipment recorded associated with capital leases.
67
LMI AEROSPACE, INC.
NOTES TO CONSOLIDATED FINANCIAL STATEMENTS
(Dollar amounts in thousands, except share and per share data)
December 31, 2016
6. | GOODWILL AND INTANGIBLE ASSETS |
Goodwill
The following table summarizes the net carrying amount of goodwill by segment at December 31, 2016 and 2015, respectively:
Engineering | |||||||||||||||||||||||
Aerostructures | Services | Total | |||||||||||||||||||||
2016 | 2015 | 2016 | 2015 | 2016 | 2015 | ||||||||||||||||||
Balance at December 31, | |||||||||||||||||||||||
Gross Goodwill | $ | 141,953 | $ | 141,953 | $ | 50,741 | $ | 50,741 | $ | 192,694 | $ | 192,694 | |||||||||||
Accumulated impairment loss | (79,471 | ) | (79,471 | ) | (50,741 | ) | (26,439 | ) | (130,212 | ) | (105,910 | ) | |||||||||||
Net Goodwill | $ | 62,482 | $ | 62,482 | $ | — | $ | 24,302 | $ | 62,482 | $ | 86,784 | |||||||||||
The net goodwill balance in the Aerostructures segment is related to the acquisitions of Valent and Intec, which account for $56,288 and $6,194, respectively, at both December 31, 2016 and 2015. The annual impairment analysis performed in the fourth quarter of 2016 determined that the fair value for the goodwill in Aerostructures exceeded its carrying value.
In the second quarter of 2016, a triggering event occurred when the Company significantly downgraded the full-year 2016 sales and operating income forecast for its Engineering Services business due to continued decline in demand. This downward adjustment to the forecast, combined with lower than expected operating results for the second quarter of 2016, was deemed to be a triggering event requiring an interim impairment evaluation for the Engineering Services reporting unit in accordance with ASC 350. An impairment analysis was performed and determined that the carrying value of related goodwill was fully impaired. As a result, a non-cash impairment charge of $24,302 was recorded in the second quarter of 2016, which brought the goodwill associated with the reporting unit to $0.
During the fourth quarter of fiscal 2014, in accordance with the Company's accounting policy as described in Note 1 to the Consolidated Financial Statements, the Company performed its annual impairment analysis on the Engineering Services reporting unit and determined that the carrying value of goodwill was above its fair value. As a result, a goodwill impairment charge of $26,439 was recorded.
Of the gross goodwill recorded by the Company, 26.3% is not deductible for tax purposes.
Intangible Assets
Intangible assets primarily consist of trademarks and customer intangibles resulting from the acquisitions of Versaform Corporation, D3, Intec, TASS, and Valent. The trademarks resulted from the acquisitions of Intec, TASS, and Valent are fully amortized at December 31, 2016. Customer intangibles have a remaining weighted average useful life of 15.9 years and other intangible assets have a remaining weighted average useful life of 2.1 years. The carrying values were as follows:
December 31, | |||||||
2016 | 2015 | ||||||
Trademarks | $ | 778 | $ | 778 | |||
Customer intangible assets | 68,991 | 68,991 | |||||
Other | 1,274 | 1,274 | |||||
Accumulated amortization | (32,191 | ) | (24,461 | ) | |||
Intangible assets, net | $ | 38,852 | $ | 46,582 | |||
The aforementioned triggering event within the Engineering Services reporting unit related to goodwill also resulted an impairment charge of $4,066 related to customer intangible assets in 2016.
68
LMI AEROSPACE, INC.
NOTES TO CONSOLIDATED FINANCIAL STATEMENTS
(Dollar amounts in thousands, except share and per share data)
December 31, 2016
Intangibles amortization expense for 2016, 2015 and 2014 was $3,664, $4,359 and $4,524, respectively.
The estimated annual amortization expense for intangible assets is as follows:
Year ending December 31, | |||
2017 | $ | 3,087 | |
2018 | 2,854 | ||
2019 | 2,627 | ||
2020 | 2,531 | ||
2021 | 2,482 | ||
Thereafter | 25,271 | ||
$ | 38,852 | ||
7. | ACCRUED EXPENSES |
Accrued expenses consist of the following:
December 31, | |||||||
2016 | 2015 | ||||||
Accrued interest | $ | 7,792 | $ | 8,020 | |||
Receipts in excess of cost on long-term production contracts | 4,782 | 5,097 | |||||
Accrued payroll | 2,367 | 2,481 | |||||
Accrued bonus | 570 | 3,698 | |||||
Accrued vacation | 1,886 | 1,913 | |||||
Accrued employee benefits | 2,863 | 3,075 | |||||
Accrued operating lease obligations | 2,350 | 2,475 | |||||
Accrued professional fees | 767 | 1,104 | |||||
Accrued restructuring | 285 | 255 | |||||
Other | 1,881 | 1,897 | |||||
Total accrued expenses | $ | 25,543 | $ | 30,015 | |||
8. | LONG-TERM DEBT AND CAPITAL LEASE OBLIGATIONS |
Long-term debt and capital lease obligations consist of the following:
69
LMI AEROSPACE, INC.
NOTES TO CONSOLIDATED FINANCIAL STATEMENTS
(Dollar amounts in thousands, except share and per share data)
December 31, 2016
December 31, | |||||||
2016 | 2015 | ||||||
Second priority senior secured notes at a fixed rate of 7.375% at December 31, 2016 and December 31, 2015 | $ | 224,175 | $ | 234,175 | |||
Missouri IRBs at fixed rate of 2.80% at December 31, 2016 and December 31, 2015 | 6,456 | 6,901 | |||||
Capital Leases, at fixed rates ranging from 3.00% to 4.50% at December 31, 2016 and 3.00% to 7.73% at December 31, 2015 | 10,293 | 11,708 | |||||
Notes payable, principal and interest payable monthly, at fixed rates, from 2.45% to 5.00% at December 31, 2016 and from 2.45% to 2.56% at December 31, 2015 | 2,377 | 1,750 | |||||
Debt issuance cost | (3,248 | ) | (4,539 | ) | |||
Total debt | 240,053 | 249,995 | |||||
Less current installments | 2,655 | 2,362 | |||||
Total long-term debt and capital lease obligations | $ | 237,398 | $ | 247,633 | |||
On June 19, 2014, the Company issued $250,000 in second-priority senior secured notes maturing on July 15, 2019. The Company recorded these notes at cost. The estimated fair value of these notes, based on the last market price transaction in the year ended December 31, 2016 of 1.0075, was $225,856. During 2014, 2015, and 2016 the Company repurchased and retired $5,000, $10,825, and $10,000 respectively, of the outstanding notes at a premium of 1.125%, 0.0%, and 1.875% respectively, plus accrued interest. Obligations under these notes are secured by substantially all of the Company’s assets and bear interest at 7.375%, paid semi-annually in January and July. In addition, on June 19, 2014, the Company modified its revolving credit agreement.
The modified agreement provides for a revolving credit facility of up to $90,000. Under the agreement, the co-collateral agents may establish a reserve against the facility. At December 31, 2016, the reserve established was $15,000, which reduced the maximum availability to $75,000. Based on the amount of eligible assets at December 31, 2016 and considering outstanding letters of credit of $1,525, available borrowings were further reduced to $49,728. The maximum amount, less reserves, available for borrowing at levels below $30,000 are based on a sum of 45% of eligible receivables, 30% of eligible inventories and an additional amount of eligible equipment up to 20% of total borrowings under the facility. The maximum amount, less reserves, available for borrowing at levels above $30,000 are based on a sum of 75% of eligible receivables, 45% of eligible inventories and an additional amount of eligible equipment up to 20% of total borrowings under the facility. Borrowings under the facility are secured by a first lien on substantially all of the Company’s assets and bear interest at either the LIBOR rate plus a margin of 3.00% to 3.50% or the alternate base rate (“ABR”) which is the highest of the following plus a margin of 2.00% to 2.50%, respectively, with the applicable margins for the revolving credit facility subject to a grid based on the average availability ratio of the Company for the most recently completed quarter:
•Prime rate,
•Federal funds rate plus 0.5%, or,
•The adjusted Eurodollar rate for an interest period of one month plus 1%.
For the year ended December 31, 2016, the average debt outstanding on the revolving credit facility was $164 which accrued interest at an average rate of 5.80%. No amounts were outstanding on the revolving credit facility at December 31, 2016 or December 31, 2015.
The Company is required to pay a commitment fee of between 0.375% and 0.5% per annum on the unused portion of the revolving credit facility, depending on the average revolver usage during the period as compared to the total available borrowings under the facility. At December 31, 2016, the commitment fee required was 0.5%.
The revolving credit loan facility matures on the earlier of the fifth year anniversary date, July 15, 2019, or the date that is 91 days prior to the maturity date of the senior secured notes unless the notes are repaid, refinanced or otherwise satisfied in full. The maturity dates are subject to acceleration upon occurrence of an event of default. An event of default under the revolving credit agreement includes, among other things, failure to pay any material indebtedness, acceleration of payments by any lender prior to scheduled maturity, or judgments rendered against the Company requiring payments at or above certain levels.
70
LMI AEROSPACE, INC.
NOTES TO CONSOLIDATED FINANCIAL STATEMENTS
(Dollar amounts in thousands, except share and per share data)
December 31, 2016
The credit agreement contains a covenant that requires us to comply with a maximum first priority debt to EBITDA ratio on a quarterly basis. In addition, the agreement also contains certain restrictive covenants that limit and in some circumstances prohibit, our ability to, among other things, incur additional debt, sell, lease or transfer our assets, make investments, guarantee debt or obligations, create liens, and enter into certain merger, consolidation or other reorganization transactions. These restrictive covenants prohibit the Company from paying dividends. These restrictions could limit our ability to obtain future financing, make acquisitions or needed capital expenditures, withstand the current or future downturns in our business or the economy in general, conduct operations or otherwise take advantage of business opportunities that may arise, any of which could place us at a competitive disadvantage relative to our competitors that have less debt and are not subject to such restrictions.
At December 31, 2016, the Company was in compliance with all of its covenants and expects to be in compliance with its covenants in future periods. If the Company fails to meet any covenants in the credit facility, the Company would not be in compliance with its credit agreement and the lenders would be entitled to exercise various rights, including causing the amounts outstanding under the revolving credit facility to become immediately due and payable.
A portion of the Company's debt and capital leases related to buildings and equipment that were underwritten to service underlying Industrial Revenue Bonds (“IRBs”) with the City of Washington, Missouri and Fredonia, Kansas. Monthly payments are scheduled in an amount sufficient to service the total principal and interest of the underlying bonds. Interest ranges from 2.80% to 4.50% and mature between September 2020 and June 2032. In addition, the Company's debt at December 31, 2015 includes a capital lease of $232 related to the building in Coweta, Oklahoma. This capital lease was settled in cash in January of 2016. In 2015, a debt of the Company of $1,167 was assumed by a third-party as the result of a lawsuit settlement.
The Company has also entered into various notes payable and capital lease agreements for the purchase of certain equipment. The notes are secured by certain equipment and payable in monthly installments including interest ranging from 2.45% to 5.00% through February 2023.
The gross amount of assets recorded under capital leases totaled $14,558 as of December 31, 2016 and is included in the related property, plant and equipment categories. The long-term debt and capital lease payment obligations including the current portion thereof required in each of the next five years and thereafter are as follows:
Year ending December 31, | Long-Term Debt (1) | Capital Leases | |||||
2017 | $ | 1,061 | $ | 1,915 | |||
2018 | 1,094 | 2,176 | |||||
2019 | 225,183 | 2,450 | |||||
2020 | 5,211 | 2,304 | |||||
2021 | 177 | 1,208 | |||||
Thereafter | 282 | 1,554 | |||||
Total | 233,008 | 11,607 | |||||
Less: imputed interest | — | (1,314 | ) | ||||
Total | $ | 233,008 | $ | 10,293 | |||
(1) Includes principal only
Debt issuance costs of $8,348 were incurred as a result of the 2014 refinancing transactions and are being amortized over the term of the notes and revolving credit agreement, which is five years. The Company has appropriately split the deferred financing fees incurred in connection with its debt and will amortize the fees over their respective terms. As the Company repurchases and retires second-priority senior secured notes, the associated unamortized debt issuance costs are written-off and amortized as interest expense.
71
LMI AEROSPACE, INC.
NOTES TO CONSOLIDATED FINANCIAL STATEMENTS
(Dollar amounts in thousands, except share and per share data)
December 31, 2016
9. | DERIVATIVE FINANCIAL INSTRUMENTS |
On June 19, 2014, the Company terminated and settled its interest rate derivatives in conjunction with the settlement of its then existing credit agreement, which had a variable interest rate. This settlement resulted in a charge of $793 to interest expense in the Consolidated Statements of Comprehensive Income (Loss) in the year ended December 31, 2014. Prior to this termination and in compliance with the credit agreement, the Company purchased option and swap derivative contracts to hedge against the potential impact on earnings from an increase in market interest rates associated with the interest payments on its variable rate term credit facility. The objective of the hedge transactions was to reduce the variability of cash flows due to changes in the designated benchmark interest rate on the term debt. The Company had no derivative financial instruments recorded in the Consolidated Balance Sheet at December 31, 2016, 2015 or 2014.
The Company designated and accounted for these swaps and purchased options as cash flow hedges of interest rate risk. The Company reported the gain or loss, net of taxes, from the effective portion of the hedge as a component of Accumulated Other Comprehensive Income (“AOCI”) deferring it and reclassifying it into earnings in the same period or periods in which the hedged transaction affects earnings and in the same line item on the Consolidated Statements of Comprehensive Income (Loss) as the impact of the hedged transaction. The cumulative amounts reported in AOCI related to these derivatives were reclassified from AOCI to interest expense on the Consolidated Statements of Comprehensive Income (Loss) in the quarter ended June 30, 2014. The Company did not use these derivative instruments for trading or speculative purposes.
The following amounts are included in AOCI and earnings for the years ended December 31, 2016, December 31, 2015 and December 31, 2014:
Net of Tax | ||||||||
Derivatives in Cash Flow Hedging Relationship | Effective portion of (Gain) Loss Recognized in AOCI on Derivative | Effective Portion of (Gain) Loss Reclassified from AOCI into Earnings | ||||||
Year ended December 31, 2016 | ||||||||
Interest rate derivatives | $ | — | $ | — | ||||
Year ended December 31, 2015 | ||||||||
Interest rate derivatives | $ | — | $ | — | ||||
Year ended December 31, 2014 | ||||||||
Interest rate derivatives | $ | — | $ | 278 | ||||
10. | (LOSS) EARNINGS PER COMMON SHARE |
Basic net income per common share is based upon the weighted average number of common shares outstanding. Diluted net income per common share is based upon the weighted average number of common shares outstanding, including the dilutive effect of restricted stock, using the treasury stock method.
The following table shows a reconciliation of the numerators and denominators used in calculating basic and diluted earnings per share.
72
LMI AEROSPACE, INC.
NOTES TO CONSOLIDATED FINANCIAL STATEMENTS
(Dollar amounts in thousands, except share and per share data)
December 31, 2016
Year ended December 31, | |||||||||||
2016 | 2015 | 2014 | |||||||||
Numerators | |||||||||||
Net loss | $ | (35,107 | ) | $ | (2,241 | ) | $ | (28,962 | ) | ||
Denominators | |||||||||||
Weighted average common shares - basic | 13,113,901 | 12,869,353 | 12,716,976 | ||||||||
Dilutive effect of restricted stock | — | — | — | ||||||||
Weighted average common shares - diluted | 13,113,901 | 12,869,353 | 12,716,976 | ||||||||
Basic earnings per share | $ | (2.68 | ) | $ | (0.17 | ) | $ | (2.28 | ) | ||
Diluted earnings per share | $ | (2.68 | ) | $ | (0.17 | ) | $ | (2.28 | ) | ||
For the twelve months ended December 31, 2016, December 31, 2015 and December 31, 2014, 94,408, 159,875 and 153,249 shares, respectively, are not included in the calculation of diluted earnings per share, as their inclusion would have been anti-dilutive. These securities could be dilutive in future periods.
11. | COMMITMENTS AND CONTINGENCIES |
The Company leases certain facilities and equipment under various non-cancelable operating lease agreements that expire at various dates through 2025. At December 31, 2016, the future minimum lease payments under operating leases with initial non-cancelable terms in excess of one year are as follows:
2017 | $ | 7,636 | |
2018 | 7,255 | ||
2019 | 5,872 | ||
2020 | 5,057 | ||
2021 | 4,704 | ||
Thereafter | 10,245 | ||
Total | $ | 40,769 | |
Rent expense totaled $7,479, $7,753 and $8,396 in 2016, 2015 and 2014, respectively.
The Company has entered into employment agreements with certain members of senior management, the terms of which expire on December 31, 2019. The terms of these agreements include non-compete and non-disclosure provisions, and provide for defined severance payments in the event of termination without cause and termination or resignation with good reason following a change in control.
Legal Contingencies
The Company has been named as a defendant in certain pending lawsuits in the normal course of business (the “Pending Lawsuits”). In the opinion of management, after consulting with legal counsel, the losses, if any, resulting from the Pending Lawsuits is not expected to have a material effect on the Company’s future financial position, results of operations or cash flows.
In the quarter ended June 30, 2015, Ozark Mountain Technologies, LLC, a wholly-owned subsidiary of the Company (“OMT”), settled allegations of low pH wastewater releases by its facility between 2009 and 2013. As part of a plea agreement, OMT pled guilty to one count of negligently violating the Clean Water Act and paid a criminal fine of $694. In the quarter ended June 30, 2015, OMT settled allegations made by the Attorney General of the State of Missouri of pollution of state waters, violation of pretreatment regulations and violation of water quality standards claimed to have occurred in 2011 and in July 2015, paid civil penalties of $175. The fine and civil penalties paid in connection with both settlements were equal to the loss contingencies recorded by the Company at December 31, 2014.
73
LMI AEROSPACE, INC.
NOTES TO CONSOLIDATED FINANCIAL STATEMENTS
(Dollar amounts in thousands, except share and per share data)
December 31, 2016
In the third quarter of 2015, the Company resolved a lawsuit (the “Tech Lawsuit”) filed by the former owners of Valent Aerostructures, LLC (“Valent”) and affiliates of such owners (collectively, “Tech Investments”) against the Company for declaratory judgment on various matters resulting from the acquisition of Valent by the Company in December 2012, including the environmental charges against OMT. On November 5, 2015, the parties to the Tech Lawsuit executed the definitive settlement documents. As a result of the settlement: (a) the Tech Lawsuit was dismissed with prejudice on January 12, 2016, (b) $3,109 of the funds that remained in escrow from the sale were disbursed to the Company and the remaining amount of escrow funds was retained by Tech Investments, (c) Tech Investments assumed an approximate $1,167 payment obligation of the Company to a predecessor owner of OMT that remained under a purchase agreement the Company acquired as part of the Company’s acquisition of Valent; (d) locked-up shares representing partial consideration for the purchase price paid by the Company were released to Tech Investments; and (e) all parties entered into a mutual release of certain claims and disputes. The settlement also resulted in the Company assuming other liabilities of $500, collecting a previously recorded receivable of $389 and recording other expenses of $40. The net impact of the settlement resulted in a gain of $3,347 which is recorded in selling, general and administrative expenses in the accompanying Consolidated Statements of Operations, for the year ended December 31, 2015.
12. | DEFINED CONTRIBUTION PLANS |
The Company sponsors the LMI Profit Sharing and Savings Plan (the "Plan"), which covers virtually all of its employees. The Plan includes both 401(k) and profit sharing components under which the Company may make discretionary contributions. The Company’s contributions to the Plan are determined and approved by the Board of Directors and may be settled in cash or shares of LMI common stock. In 2016, 2015, and 2014, Company contributions under the Plan were made in stock.
Matching contributions under the 401(k) component of the Plan are based upon a percentage of employee contributions. For the years ended December 31, 2016 and 2015, the Company made 401(k) contributions up to a maximum of 3.0% or 5.0% of eligible annual wages per employee. The applicable percent of eligible wages for each participant was determined by the operating segment to which the employee belonged. Matching contributions to the Plan made in 2016 and 2015 are vested to the employee over four years at 25% per annum. For the year ended December 31, 2014, the Company made matching contributions of 50% for each one dollar contributed by each participant up to a maximum employer matching contribution of $1 per employee. Matching contributions made in 2014 were immediately vested.
Profit sharing contributions made by the Company vest over time and are fully vested after six years. No profit sharing contributions were made in 2016, 2015, or 2014.
The Company recognized costs for 401(k) matching contributions under the Plan totaling $1,451, $1,519, and $729 in 2016, 2015, and 2014, respectively.
At December 31, 2014, the Company also sponsored the Valent 401(k) plan (the "Valent Plan.") The Valent Plan was merged into the Plan effective June 4, 2015 and was subsequently terminated. Under the Valent Plan, the Company could contribute a discretionary matching contribution. The exact percentage, if any, was determined each year and could not exceed 3.0% of a participant’s compensation for the year. During 2014, the Company recognized expense under the Valent Plan of $848, equating to 100% of the first 3.0% of participant compensation.
74
LMI AEROSPACE, INC.
NOTES TO CONSOLIDATED FINANCIAL STATEMENTS
(Dollar amounts in thousands, except share and per share data)
December 31, 2016
13. | STOCK-BASED COMPENSATION |
On July 7, 2005, the Company’s shareholders approved the LMI Aerospace, Inc. 2005 Long-term Incentive Plan (the “2005 Plan”). The 2005 Plan provided for the grant of non-qualified stock options, incentive stock options, shares of restricted stock, restricted stock units, stock appreciation rights, performance awards and other share-based grants and cash bonus awards to employees and directors. All share-based grants or awards issued under the 2005 Plant are subject to a time-based vesting schedule. As of July 7, 2015 the Company was no longer able to grant awards under the 2005 Plan.
All outstanding share-based grants are in the form of restricted stock. A summary of the activity for non-vested awards under the 2005 Plan is presented below:
2016 | ||||||
Restricted Stock Awards | Shares | Weighted Average Grant Date Fair Value | ||||
Outstanding at January 1 | 253,434 | $ | 14.54 | |||
Granted | — | — | ||||
Vested | (53,846 | ) | 17.89 | |||
Forfeited | (31,038 | ) | 14.19 | |||
Outstanding at December 31 | 168,550 | $ | 13.53 | |||
Stock compensation expense related to awards granted under the 2005 Plan was $485, $1,284 and $1,850 for the years ended December 31, 2016, 2015 and 2014, respectively. Total unrecognized compensation costs related to non-vested share-based awards granted under the 2005 Plan were $513 and $1,762 as of December 31, 2016 and December 31, 2015, respectively. These costs were expected to be recognized over a weighted average period of 1.2 and 1.6 years as of December 31, 2016 and 2015, respectively. The fair value of awards that vested during the years ended December 31, 2016, 2015 and 2014, based on the market price on vesting date, was $527, $1,559 and $1,083, respectively.
On June 24, 2015, the Company's shareholders approved the LMI Aerospace, Inc. 2015 Incentive Compensation Plan (the “2015 Plan”), which became effective on July 1, 2015. Under the 2015 Plan, the Company, through the Compensation Committee of the Board of Directors, may, at its discretion, grant stock options, restricted shares of common stock, and other various stock-based awards to directors, officers, employees and consultants. A total of 750,000 shares of the Company’s common stock have been reserved for issuance under the 2015 Plan.
All outstanding share-based grants are in the form of restricted stock. A summary of the activity for non-vested awards under the 2015 Plan is presented below:
2016 | ||||||
Restricted Stock Awards | Shares | Weighted Average Grant Date Fair Value | ||||
Outstanding at January 1 | 61,801 | $ | 9.79 | |||
Granted | 277,552 | 8.50 | ||||
Vested (1) | (55,672 | ) | 9.79 | |||
Forfeited | (9,553 | ) | 9.43 | |||
Outstanding at December 31 | 274,128 | $ | 8.46 | |||
(1) Excludes 6,129 shares for which service requirements are met that remain subject to deferral at December 31, 2016 pursuant to the LMI Aerospace, Inc. Non-Qualified Deferred Compensation Plan for Senior Executives and Outside Directors.
75
LMI AEROSPACE, INC.
NOTES TO CONSOLIDATED FINANCIAL STATEMENTS
(Dollar amounts in thousands, except share and per share data)
December 31, 2016
Compensation expense related to awards granted under the 2015 Plan was $992 and $303 for the years ended December 31, 2016 and 2015, respectively. Total unrecognized compensation costs related to non-vested share-based awards granted under the 2015 Plan were $1,510 and $303 as of December 31, 2016 and 2015, respectively. These costs were expected to be recognized over a weighted average period of 1.8 and 0.5 years as of December 31, 2016 and 2015, respectively. The fair value of awards that vested during the years ended December 31, 2016 and 2015, based on the market price on vesting date, was $528 and $0, respectively.
14. | INCOME TAXES |
Net deferred tax (liabilities)/assets at December 31, were as follows:
December 31, | |||||||
2016 | 2015 | ||||||
Deferred tax assets | $ | 42,336 | $ | 35,730 | |||
Deferred tax liabilities | (21,309 | ) | (21,625 | ) | |||
Valuation allowance | (21,027 | ) | (14,641 | ) | |||
Net deferred tax liabilities | $ | — | $ | (536 | ) | ||
Based on our current and anticipated future pre-tax earnings, we believe it is more likely than not that our federal and state deferred tax assets, including benefits related to net operating loss carry forwards, will not be realized based on the measurement standards required under ASC 740, Accounting for Income Taxes. We evaluated all significant available positive and negative evidence, including the existence of losses in the current and prior year in assessing the continuing need for a valuation allowance. The temporary differences between the tax basis of assets and liabilities and their financial reporting amounts that give rise to the deferred income tax assets and liabilities are as follows:
December 31, | |||||||
2016 | 2015 | ||||||
Goodwill and intangible assets | $ | 13,812 | $ | 13,267 | |||
Inventories | 2,658 | 2,569 | |||||
NOL carry forwards | 17,808 | 10,529 | |||||
Tax credit carry forwards | 2,904 | 2,354 | |||||
Stock award | 819 | 827 | |||||
Gain on sale of real estate | 698 | 783 | |||||
Obligation under operating leases | 822 | 835 | |||||
Accrued vacation | 504 | 504 | |||||
Accrued bonus | 64 | 649 | |||||
Other | 710 | 426 | |||||
Long-term contract costs | (13,496 | ) | (11,781 | ) | |||
Depreciation | (6,276 | ) | (6,857 | ) | |||
Valuation allowance | (21,027 | ) | (14,641 | ) | |||
Net deferred tax liabilities | $ | — | $ | (536 | ) | ||
The Company’s income tax (benefit) provision attributable to income before taxes consisted of the following for the years ended December 31, 2016, 2015 and 2014.
76
LMI AEROSPACE, INC.
NOTES TO CONSOLIDATED FINANCIAL STATEMENTS
(Dollar amounts in thousands, except share and per share data)
December 31, 2016
2016 | 2015 | 2014 | |||||||||
Federal: | |||||||||||
Current | $ | (24 | ) | $ | 304 | $ | (9,173 | ) | |||
Deferred | (676 | ) | (14 | ) | 155 | ||||||
(700 | ) | 290 | (9,018 | ) | |||||||
State: | |||||||||||
Current | (11 | ) | 55 | 21 | |||||||
Deferred | (23 | ) | 7 | 44 | |||||||
(34 | ) | 62 | 65 | ||||||||
(Benefit) provision for income taxes | $ | (734 | ) | $ | 352 | $ | (8,953 | ) | |||
The current federal benefit in 2014 reflects the Company's decision to carry back its 2013 and 2014 tax losses to prior years in order to obtain tax refunds. The Company collected an income tax receivable of $6,527 in the fourth quarter of 2015 related to this carry back.
The reconciliation of income tax provision (benefit) computed at the U.S. federal statutory tax rates to income tax (benefit) provision is presented below:
2016 | 2015 | 2014 | |||||||||
Federal tax benefit | $ | (12,544 | ) | $ | (661 | ) | $ | (13,270 | ) | ||
State and local taxes, net of federal benefit | (464 | ) | (114 | ) | 358 | ||||||
Non-deductible goodwill impairment | 6,296 | — | 9,254 | ||||||||
Valuation allowance | 6,386 | 1,809 | (5,294 | ) | |||||||
Tax audit adjustment | (24 | ) | 306 | — | |||||||
Research and experimental and other tax credits | (550 | ) | (1,174 | ) | (503 | ) | |||||
Other | 166 | 186 | 502 | ||||||||
(Benefit) provision for income taxes | $ | (734 | ) | $ | 352 | $ | (8,953 | ) | |||
At December 31, 2016, the Company had federal and state net operating loss and tax credit carry forwards with values of $17,044 and $3,668, respectively. The federal net operating losses begin to expire in the year 2034 and the state net operating losses expire in the years 2023 through 2035.
15. | RESTRUCTURING |
The Company committed to and implemented various restructuring plans in 2014, 2015 and 2016. Included in those plans were the the relocation of the machining operations in Savannah, Georgia and St. Charles, Missouri, and the relocation of the sheet-metal fabrication operation in Wichita, Kansas to other facilities within the Company. In addition, the Company closed its Melbourne, Australia and Greenville, South Carolina engineering offices, eliminated additional management positions within the Engineering Services segment and closed its Coweta, Oklahoma and Fort Worth, Texas manufacturing facilities. Other employment separation activities, which were primarily severance related, were also implemented as part of the Company's overall reorganization and cost reduction initiatives. The expense associated with these plans was reflected in the selling, general, and administrative section on a separate line of the Condensed Consolidated Statements of Comprehensive Income (Loss). The following table summarizes the incurred charges associated with these restructuring activities:
77
LMI AEROSPACE, INC.
NOTES TO CONSOLIDATED FINANCIAL STATEMENTS
(Dollar amounts in thousands, except share and per share data)
December 31, 2016
Year ended December 31, | ||||||||||||
2016 | 2015 | 2014 | ||||||||||
Fort Worth facility closure | $ | — | $ | — | $ | 287 | ||||||
Savannah machining operations relocation | — | — | 47 | |||||||||
St. Charles machine parts operations relocation | — | 150 | 228 | |||||||||
Coweta machining facility closure | — | 94 | — | |||||||||
Greenville office closure | (26 | ) | 449 | — | ||||||||
Australia office closure | — | 47 | — | |||||||||
Wichita sheet metal fabrication operations relocation | 265 | — | — | |||||||||
Other employment separation activities | 973 | 1,582 | 2,023 | |||||||||
Total | $ | 1,212 | $ | 2,322 | $ | 2,585 | ||||||
Expense incurred by segment: | ||||||||||||
Aerostructures | $ | 1,218 | $ | 1,108 | $ | 2,074 | ||||||
Engineering Services | (6 | ) | 1,214 | 511 | ||||||||
Total | $ | 1,212 | $ | 2,322 | $ | 2,585 | ||||||
The Company expects to incur no additional expenses associated with the above restructuring activities.
In addition to the expenses detailed in the table above, the Company incurred additional project expenses of $295, $1,265 and $1,361 in the years ended December 31, 2016, 2015 and 2014, respectively, related to the integration of work affected by these restructuring plans and accelerated depreciation of assets disposed of at affected facilities.
Cash payments associated with these restructuring plans of $1,182, $2,806 and $2,268 were made in the years ended December 31, 2016, 2015 and 2014, respectively.
Employee | |||||||||||
Severance | Other | Total | |||||||||
Accrued restructuring balance as of December 31, 2014 | $ | 739 | $ | — | $ | 739 | |||||
Accrual additions | 2,194 | 128 | 2,322 | ||||||||
Cash payments | (2,771 | ) | (35 | ) | (2,806 | ) | |||||
Accrued restructuring balance as of December 31, 2015 | $ | 162 | $ | 93 | $ | 255 | |||||
Accrual additions | 1,238 | (26 | ) | 1,212 | |||||||
Cash payments | (1,115 | ) | (67 | ) | (1,182 | ) | |||||
Accrued restructuring balance as of December 31, 2016 | $ | 285 | $ | — | $ | 285 | |||||
Accrued restructuring of $285 at December 31, 2016 is expected to be paid in the first quarter of 2017.
16. | CUSTOMER AND SUPPLIER CONCENTRATION |
Direct sales to our top three customers, Spirit AeroSystems, Gulfstream Aerospace Corporation, and The Boeing Company accounted for 38.4%, 11.7% and 11.2% of our total revenues in 2016, respectively. These revenues are reported by both the Aerostructures and Engineering Services segments. Accounts receivable balances related to these customers were 31.8%, 12.3%, and 8.5%, of the accounts receivable balance at December 31, 2016, respectively.
Direct sales to our top three customers, Spirit AeroSystems, Gulfstream Aerospace Corporation and The Boeing Company, accounted for 34.7%, 14.2% and 11.6% of our total revenues in 2015, respectively. These revenues are reported by both the Aerostructures and Engineering Services segments. Accounts receivable balances related to these customers were 28.6%, 15.5% and 10.2% of the accounts receivable balance at December 31, 2015, respectively.
Direct sales to our top three customers, Spirit AeroSystems, Gulfstream Aerospace Corporation, and The Boeing Company, accounted for 34.3%, 15.0%, and 10.6% of our total revenues in 2014, respectively. These revenues are reported by both the Aerostructures and Engineering Services segments. Accounts receivable balances related to these customers were 33.3%, 13.1% and 7.4% of the accounts receivable balance at December 31, 2014, respectively.
The Company did not have any sales to a foreign country greater than 10% of its total sales in 2016, 2015 and 2014. The amounts of profitability and identifiable assets attributable to foreign sales activity are not material when compared with revenue, profitability, and identifiable assets attributed to United States domestic operations during 2016, 2015 and 2014.
The Company purchased approximately 45.5%, 45.9% and 49.6% of the raw materials and procured parts from its largest six suppliers in 2016, 2015, and 2014, respectively.
17. | BUSINESS SEGMENT INFORMATION |
The Company is organized into two reportable segments: the Aerostructures segment and the Engineering Services segment. The Aerostructures segment fabricates, machines, finishes, integrates, assembles and kits formed and machined close tolerance aluminum, specialty alloy and composite components for use by the aerospace and defense industries. The Engineering Services segment provides a complete range of design, engineering and program management services supporting aircraft lifecycles from conceptual design, analysis and certification through production support, fleet support and service life extensions via a complete turnkey engineering solution.
Corporate assets, liabilities and expenses related to the Company’s corporate offices, with the exception of interest expense and income taxes, primarily support the Aerostructures segment. The table below presents information by segment on the same basis used within the Company to evaluate segment performance:
78
LMI AEROSPACE, INC.
NOTES TO CONSOLIDATED FINANCIAL STATEMENTS
(Dollar amounts in thousands, except share and per share data)
December 31, 2016
December 31, | |||||||||||
2016 | 2015 | 2014 | |||||||||
Net sales: | |||||||||||
Aerostructures | $ | 311,131 | $ | 327,230 | $ | 326,025 | |||||
Engineering Services | 36,301 | 49,096 | 63,404 | ||||||||
Eliminations | (1,252 | ) | (1,230 | ) | (1,612 | ) | |||||
$ | 346,180 | $ | 375,096 | $ | 387,817 | ||||||
Gross profit: | |||||||||||
Aerostructures | $ | 56,774 | $ | 63,584 | $ | 67,042 | |||||
Engineering Services | 3,372 | 5,286 | 8,428 | ||||||||
Eliminations | (343 | ) | (84 | ) | (100 | ) | |||||
$ | 59,803 | $ | 68,786 | $ | 75,370 | ||||||
(Loss) income from operations: | |||||||||||
Aerostructures | $ | 16,153 | $ | 23,993 | $ | 18,977 | |||||
Engineering Services (1) | (30,128 | ) | (3,123 | ) | (27,731 | ) | |||||
Eliminations | (343 | ) | (84 | ) | (104 | ) | |||||
$ | (14,318 | ) | $ | 20,786 | $ | (8,858 | ) | ||||
Depreciation, amortization and certain other non-cash charges (credits): | |||||||||||
Aerostructures | $ | 18,069 | $ | 18,551 | $ | 20,223 | |||||
Engineering Services (1) | 29,342 | 1,853 | 28,675 | ||||||||
$ | 47,411 | $ | 20,404 | $ | 48,898 | ||||||
(1) Includes charges of $4,066 for intangible asset impairment and $24,302 for goodwill impairment in 2016. Includes charges of $26,439 for goodwill impairment in 2014.
December 31, | |||||||||||
2016 | 2015 | 2014 | |||||||||
Interest expense: | |||||||||||
Aerostructures | $ | 807 | $ | 957 | $ | 1,041 | |||||
Engineering Services | 33 | 43 | 41 | ||||||||
Corporate (1) | 20,331 | 21,439 | 28,198 | ||||||||
$ | 21,171 | $ | 22,439 | $ | 29,280 | ||||||
79
LMI AEROSPACE, INC.
NOTES TO CONSOLIDATED FINANCIAL STATEMENTS
(Dollar amounts in thousands, except share and per share data)
December 31, 2016
(1) Includes $8,466 related to the write-off of deferred financing costs and $793 related to the settlement of debt derivatives associated with the Company's refinancing of its debt in 2014.
December 31, | |||||||||||
2016 | 2015 | 2014 | |||||||||
Capital expenditures: | |||||||||||
Aerostructures | $ | 11,748 | $ | 16,348 | $ | 16,504 | |||||
Engineering Services | 65 | 251 | 186 | ||||||||
$ | 11,813 | $ | 16,599 | $ | 16,690 | ||||||
December 31, | |||||||
2016 | 2015 | ||||||
Total assets: | |||||||
Aerostructures | $ | 377,214 | $ | 379,873 | |||
Engineering | 6,418 | 36,107 | |||||
$ | 383,632 | $ | 415,980 | ||||
18. | QUARTERLY FINANCIAL DATA (UNAUDITED) |
The results of any single quarter are not necessarily indicative of the Company’s results for the full year. Earnings per share data is computed independently for each of the periods presented. As a result, the sum of the earnings per share amounts for each quarter may not equal earnings per share for the year.
2016 | First (1) | Second (2) | Third | Fourth (3) | |||||||||||
Net sales | $ | 87,331 | $ | 83,993 | $ | 89,673 | $ | 85,183 | |||||||
Gross profit (3) | $ | 16,230 | $ | 15,535 | $ | 15,846 | $ | 12,192 | |||||||
Net (loss) income (1,2,3) | $ | (1,759 | ) | $ | (29,900 | ) | $ | 309 | $ | (3,757 | ) | ||||
Amounts per common share: | |||||||||||||||
Net (loss) income | $ | (0.14 | ) | $ | (2.28 | ) | $ | 0.02 | $ | (0.29 | ) | ||||
Net (loss) income - assuming dilution | $ | (0.14 | ) | $ | (2.28 | ) | $ | 0.02 | $ | (0.29 | ) | ||||
2015 | First (4) | Second (5) | Third (6) | Fourth (7) | |||||||||||
Net sales | $ | 92,475 | $ | 97,550 | $ | 95,633 | $ | 89,438 | |||||||
Gross profit (6,7) | $ | 17,197 | $ | 18,770 | $ | 16,626 | $ | 16,193 | |||||||
Net (loss) income (4,5,6,7) | $ | (1,465 | ) | $ | 378 | $ | 34 | $ | (1,188 | ) | |||||
Amounts per common share: | |||||||||||||||
Net (loss) income | $ | (0.11 | ) | $ | 0.03 | $ | — | $ | (0.09 | ) | |||||
Net (loss) income - assuming dilution | $ | (0.11 | ) | $ | 0.03 | $ | — | $ | (0.09 | ) | |||||
(1) Included in the net loss for the the first quarter of 2016 were $947 of restructuring expenses.
(2) | Included in the net loss for the the second quarter of 2016 was a $28,368 charge for goodwill and intangible asset impairment related to the Engineering Services reporting unit and $241 of restructuring expenses. |
80
LMI AEROSPACE, INC.
NOTES TO CONSOLIDATED FINANCIAL STATEMENTS
(Dollar amounts in thousands, except share and per share data)
December 31, 2016
(3) | Gross profit in the fourth quarter of 2016 includes an unfavorable cumulative catch-up adjustment of $1,741 related to a long-term contract. |
(4) Included in the net loss for the the first quarter of 2015 were $275 of restructuring expenses.
(5) | Included in the net income for the the second quarter of 2015 were $518 of restructuring expenses. |
(6) | Gross profit in the third quarter of 2015 includes an unfavorable adjustment of $1,738 related to a long-term contract for which a forward loss reserve was established. Net income for the the third quarter of 2015 also included a net gain of $3,325 related to a legal settlement and $1,575 of restructuring expenses. |
(7) Gross profit in the fourth quarter of 2015 includes an unfavorable cumulative catch-up adjustment of $1,010 related to a long-term contract. Net loss for the fourth quarter of 2015 also includes a restructuring benefit of $46.
19. CONDENSED CONSOLIDATING FINANCIAL INFORMATION
LMI Aerospace, Inc. excluding its subsidiaries (“LMIA”) is the parent company, issuer and obligor of the second-priority senior notes due July 15, 2019 (the “Notes”). The payment obligations of LMIA under the Notes are guaranteed and secured by LMIA and all of its subsidiaries other than minor subsidiaries as further described below.
These Notes are guaranteed on a second-priority senior secured basis, jointly and severally, by LMIA (“Guarantor Parent”) and all of its existing and future 100% owned subsidiaries (collectively, the “Guarantor Subsidiaries”) other than minor subsidiaries. Such guaranties are full and unconditional. LMIA conducts substantially all of its business through and derives virtually all of its income from its subsidiaries. Therefore, its ability to make required principal and interest payments with respect to its indebtedness depends on the earnings of subsidiaries and its ability to receive funds from its subsidiaries.
The Notes are secured on a second-priority basis by liens on substantially all of LMIA’s and the Guarantor Subsidiaries’ assets, subject to certain exceptions and permitted liens. The liens securing the Notes are contractually subordinated to the liens that secure indebtedness under the revolving credit facility as a result of the lien subordination provisions of the intercreditor agreement to the extent of the value of the collateral securing such indebtedness as well as being subordinated by other existing indebtedness, including industrial revenue bonds, capital leases and other notes payable, to the extent of the value of the collateral that secures such existing indebtedness. As a consequence of this lien subordination and existing indebtedness the notes and the guarantees are effectively subordinated to the extent of the value of the collateral that secures them. Decisions regarding the maintenance and release of the collateral secured by the collateral agreement are made by the lenders under the modified revolving credit facility, and neither the indenture trustee nor the holders of the Notes have control of decisions regarding the release of collateral.
We have not presented separate financial statements and separate disclosures have not been provided concerning the Guarantor Subsidiaries due to the presentation of condensed consolidating financial information set forth in this Note, consistent with the Securities and Exchange Commission (the “SEC”) rules governing reporting on guarantor financial information.
Supplemental condensed consolidating financial information of the Company, including such information for the Guarantor Subsidiaries, is presented below. Investments in subsidiaries are presented using the equity method of accounting. The principal elimination entries eliminate investments in subsidiaries and inter-company balances and transactions.
81
LMI AEROSPACE, INC.
NOTES TO CONSOLIDATED FINANCIAL STATEMENTS
(Dollar amounts in thousands, except share and per share data)
December 31, 2016
CONDENSED CONSOLIDATING BALANCE SHEET
December 31, 2016
(Amounts in thousands)
LMIA(Guarantor Parent) | Guarantor Subsidiaries | Consolidating/Eliminating Entries | Consolidated | ||||||||||||
Assets | |||||||||||||||
Current assets: | |||||||||||||||
Cash and cash equivalents | $ | 2,382 | $ | 109 | $ | — | $ | 2,491 | |||||||
Trade accounts receivable, net | 660 | 50,609 | — | 51,269 | |||||||||||
Intercompany receivables | 244,792 | 312,332 | (557,124 | ) | — | ||||||||||
Inventories | — | 122,761 | — | 122,761 | |||||||||||
Prepaid expenses and other current assets | 1,548 | 2,038 | — | 3,586 | |||||||||||
Total current assets | 249,382 | 487,849 | (557,124 | ) | 180,107 | ||||||||||
Property, plant and equipment, net | 6,490 | 93,025 | — | 99,515 | |||||||||||
Investments in subsidiaries | 375,738 | — | (375,738 | ) | — | ||||||||||
Goodwill | — | 62,482 | — | 62,482 | |||||||||||
Intangible assets, net | — | 38,852 | — | 38,852 | |||||||||||
Other assets | 1,790 | 886 | — | 2,676 | |||||||||||
Total assets | $ | 633,400 | $ | 683,094 | $ | (932,862 | ) | $ | 383,632 | ||||||
Liabilities and shareholders’ equity | |||||||||||||||
Current liabilities: | |||||||||||||||
Accounts payable | $ | 410 | $ | 28,968 | $ | — | $ | 29,378 | |||||||
Accrued expenses | 13,912 | 11,631 | — | 25,543 | |||||||||||
Intercompany Payables | 310,644 | 246,480 | (557,124 | ) | — | ||||||||||
Current installments of long-term debt and capital lease obligations | 89 | 2,566 | — | 2,655 | |||||||||||
Total current liabilities | 325,055 | 289,645 | (557,124 | ) | 57,576 | ||||||||||
Long-term debt and capital lease obligations, less current installments | 221,101 | 16,297 | — | 237,398 | |||||||||||
Other long-term liabilities | 1,703 | 1,414 | — | 3,117 | |||||||||||
Total long-term liabilities | 222,804 | 17,711 | — | 240,515 | |||||||||||
Total shareholders’ equity | 85,541 | 375,738 | (375,738 | ) | 85,541 | ||||||||||
Total liabilities and shareholders’ equity | $ | 633,400 | $ | 683,094 | $ | (932,862 | ) | $ | 383,632 | ||||||
82
LMI AEROSPACE, INC.
NOTES TO CONSOLIDATED FINANCIAL STATEMENTS
(Dollar amounts in thousands, except share and per share data)
December 31, 2016
CONDENSED CONSOLIDATING BALANCE SHEET
December 31, 2015
(Amounts in thousands)
LMIA(Guarantor Parent) | Guarantor Subsidiaries | Consolidating/Eliminating Entries | Consolidated | ||||||||||||
Assets | |||||||||||||||
Current assets: | |||||||||||||||
Cash and cash equivalents | $ | 10,251 | $ | 253 | $ | — | $ | 10,504 | |||||||
Trade accounts receivable, net | 1,220 | 47,271 | — | 48,491 | |||||||||||
Intercompany receivables | 196,496 | 203,128 | (399,624 | ) | — | ||||||||||
Inventories | — | 114,775 | — | 114,775 | |||||||||||
Prepaid expenses and other current assets | 2,224 | 1,923 | — | 4,147 | |||||||||||
Total current assets | 210,191 | 367,350 | (399,624 | ) | 177,917 | ||||||||||
Property, plant and equipment, net | 5,430 | 95,539 | — | 100,969 | |||||||||||
Investments in subsidiaries | 387,868 | — | (387,868 | ) | — | ||||||||||
Goodwill | — | 86,784 | — | 86,784 | |||||||||||
Intangible assets, net | — | 46,582 | — | 46,582 | |||||||||||
Other assets | 2,135 | 1,593 | — | 3,728 | |||||||||||
Total assets | $ | 605,624 | $ | 597,848 | $ | (787,492 | ) | $ | 415,980 | ||||||
Liabilities and shareholders’ equity | |||||||||||||||
Current liabilities: | |||||||||||||||
Accounts payable | $ | 1,393 | $ | 11,763 | $ | — | $ | 13,156 | |||||||
Accrued expenses | 17,009 | 13,006 | — | 30,015 | |||||||||||
Intercompany Payables | 237,548 | 162,076 | (399,624 | ) | — | ||||||||||
Current installments of long-term debt and capital lease obligations | 85 | 2,277 | — | 2,362 | |||||||||||
Total current liabilities | 256,035 | 189,122 | (399,624 | ) | 45,533 | ||||||||||
Long-term debt and capital lease obligations, less current installments | 229,752 | 17,881 | — | 247,633 | |||||||||||
Other long-term liabilities | 1,881 | 2,441 | — | 4,322 | |||||||||||
Deferred income taxes | — | 536 | — | 536 | |||||||||||
Total long-term liabilities | 231,633 | 20,858 | — | 252,491 | |||||||||||
Total shareholders’ equity | 117,956 | 387,868 | (387,868 | ) | 117,956 | ||||||||||
Total liabilities and shareholders’ equity | $ | 605,624 | $ | 597,848 | $ | (787,492 | ) | $ | 415,980 | ||||||
83
LMI AEROSPACE, INC.
NOTES TO CONSOLIDATED FINANCIAL STATEMENTS
(Dollar amounts in thousands, except share and per share data)
December 31, 2016
CONSOLIDATED STATEMENTS OF COMPREHENSIVE INCOME (LOSS)
December 31, 2016
(Amounts in thousands, except share and per share data)
LMIA(Guarantor Parent) | Guarantor Subsidiaries | Consolidating/Eliminating Entries | Consolidated | ||||||||||||
Sales and service revenue | |||||||||||||||
Product sales | $ | (170 | ) | $ | 307,954 | $ | 305 | $ | 308,089 | ||||||
Service revenues | 40,864 | 38,217 | (40,990 | ) | 38,091 | ||||||||||
Net sales | 40,694 | 346,171 | (40,685 | ) | 346,180 | ||||||||||
Cost of sales and service revenue | |||||||||||||||
Cost of product sales | 86 | 248,836 | 305 | 249,227 | |||||||||||
Cost of service revenues | 42,749 | 35,391 | (40,990 | ) | 37,150 | ||||||||||
Cost of sales | 42,835 | 284,227 | (40,685 | ) | 286,377 | ||||||||||
Gross profit | (2,141 | ) | 61,944 | — | 59,803 | ||||||||||
Selling, general and administrative expenses | — | 44,541 | — | 44,541 | |||||||||||
Restructuring expense | 431 | 781 | — | 1,212 | |||||||||||
Goodwill and intangible asset impairment | — | 28,368 | — | 28,368 | |||||||||||
Loss from operations | (2,572 | ) | (11,746 | ) | — | (14,318 | ) | ||||||||
Other income (expense): | |||||||||||||||
Interest expense | (20,336 | ) | (835 | ) | — | (21,171 | ) | ||||||||
Other, net | 5 | (357 | ) | — | (352 | ) | |||||||||
(Loss) income from equity investments in subsidiaries | (12,275 | ) | — | 12,275 | — | ||||||||||
Total other (expense) income | (32,606 | ) | (1,192 | ) | 12,275 | (21,523 | ) | ||||||||
(Loss) income before income taxes | (35,178 | ) | (12,938 | ) | 12,275 | (35,841 | ) | ||||||||
Benefit for income taxes | — | (734 | ) | — | (734 | ) | |||||||||
Net (loss) income | (35,178 | ) | (12,204 | ) | 12,275 | (35,107 | ) | ||||||||
Other comprehensive (loss) income: | |||||||||||||||
Change in foreign currency translation adjustment | — | (71 | ) | — | (71 | ) | |||||||||
Total comprehensive (loss) income | $ | (35,178 | ) | (12,275 | ) | $ | 12,275 | $ | (35,178 | ) | |||||
84
LMI AEROSPACE, INC.
NOTES TO CONSOLIDATED FINANCIAL STATEMENTS
(Dollar amounts in thousands, except share and per share data)
December 31, 2016
CONSOLIDATED STATEMENTS OF COMPREHENSIVE INCOME (LOSS)
December 31, 2015
(Amounts in thousands, except share and per share data)
LMIA(Guarantor Parent) | Guarantor Subsidiaries | Consolidating/Eliminating Entries | Consolidated | ||||||||||||
Sales and service revenue | |||||||||||||||
Product sales | $ | 239 | $ | 323,337 | $ | 35 | $ | 323,611 | |||||||
Service revenues | 36,184 | 51,720 | (36,419 | ) | 51,485 | ||||||||||
Net sales | 36,423 | 375,057 | (36,384 | ) | 375,096 | ||||||||||
Cost of sales and service revenue | |||||||||||||||
Cost of product sales | 248 | 259,327 | 35 | 259,610 | |||||||||||
Cost of service revenues | 35,952 | 47,166 | (36,418 | ) | 46,700 | ||||||||||
Cost of sales | 36,200 | 306,493 | (36,383 | ) | 306,310 | ||||||||||
Gross profit | 223 | 68,564 | (1 | ) | 68,786 | ||||||||||
Selling, general and administrative expenses | — | 45,678 | — | 45,678 | |||||||||||
Restructuring expense | 340 | 1,982 | — | 2,322 | |||||||||||
(Loss) income from operations | (117 | ) | 20,904 | (1 | ) | 20,786 | |||||||||
Other income (expense): | |||||||||||||||
Interest expense | (21,449 | ) | (990 | ) | — | (22,439 | ) | ||||||||
Other, net | — | (236 | ) | — | (236 | ) | |||||||||
Income (loss) from equity investments in subsidiaries | 19,284 | — | (19,284 | ) | — | ||||||||||
Total other expense | (2,165 | ) | (1,226 | ) | (19,284 | ) | (22,675 | ) | |||||||
(Loss) income before income taxes | (2,282 | ) | 19,678 | (19,285 | ) | (1,889 | ) | ||||||||
Provision for income taxes | — | 352 | — | 352 | |||||||||||
Net (loss) income | (2,282 | ) | 19,326 | (19,285 | ) | (2,241 | ) | ||||||||
Other comprehensive (loss) income: | |||||||||||||||
Change in foreign currency translation adjustment | — | (41 | ) | — | (41 | ) | |||||||||
Total comprehensive (loss) income | $ | (2,282 | ) | $ | 19,285 | $ | (19,285 | ) | $ | (2,282 | ) | ||||
85
LMI AEROSPACE, INC.
NOTES TO CONSOLIDATED FINANCIAL STATEMENTS
(Dollar amounts in thousands, except share and per share data)
December 31, 2016
CONSOLIDATED STATEMENTS OF COMPREHENSIVE INCOME (LOSS)
December 31, 2014
(Amounts in thousands, except share and per share data)
LMIA(Guarantor Parent) | Guarantor Subsidiaries | Consolidating/Eliminating Entries | Consolidated | ||||||||||||
Sales and service revenue | |||||||||||||||
Product sales | $ | 466 | $ | 321,286 | $ | (468 | ) | $ | 321,284 | ||||||
Service revenues | 36,181 | 66,543 | (36,191 | ) | 66,533 | ||||||||||
Net sales | 36,647 | 387,829 | (36,659 | ) | 387,817 | ||||||||||
Cost of sales and service revenue | |||||||||||||||
Cost of product sales | 699 | 254,544 | (468 | ) | 254,775 | ||||||||||
Cost of service revenues | 35,998 | 57,864 | (36,190 | ) | 57,672 | ||||||||||
Cost of sales | 36,697 | 312,408 | (36,658 | ) | 312,447 | ||||||||||
Gross profit | (50 | ) | 75,421 | (1 | ) | 75,370 | |||||||||
Selling, general and administrative expenses | 792 | 54,412 | — | 55,204 | |||||||||||
Goodwill and intangible asset impairment | — | 26,439 | — | 26,439 | |||||||||||
Restructuring expense | 1,012 | 1,573 | — | 2,585 | |||||||||||
Loss from operations | (1,854 | ) | (7,003 | ) | (1 | ) | (8,858 | ) | |||||||
Other (expense) income: | |||||||||||||||
Interest expense | (28,224 | ) | (1,056 | ) | — | (29,280 | ) | ||||||||
Other, net | 11 | 212 | — | 223 | |||||||||||
(Loss) income from equity investments in subsidiaries | (8,860 | ) | — | 8,860 | — | ||||||||||
Total other (expense) income | (37,073 | ) | (844 | ) | 8,860 | (29,057 | ) | ||||||||
(Loss) income before income taxes | (38,927 | ) | (7,847 | ) | 8,859 | (37,915 | ) | ||||||||
(Benefit) provision for income taxes | (9,867 | ) | 914 | — | (8,953 | ) | |||||||||
Net (loss) income | (29,060 | ) | (8,761 | ) | 8,859 | (28,962 | ) | ||||||||
Other comprehensive (loss) income: | |||||||||||||||
Change in foreign currency translation adjustment | — | (98 | ) | — | (98 | ) | |||||||||
Reclassification adjustment for losses on interest rate hedges included in net earnings | 278 | — | — | 278 | |||||||||||
Total comprehensive (loss) income | $ | (28,782 | ) | $ | (8,859 | ) | $ | 8,859 | $ | (28,782 | ) | ||||
86
LMI AEROSPACE, INC.
NOTES TO CONSOLIDATED FINANCIAL STATEMENTS
(Dollar amounts in thousands, except share and per share data)
December 31, 2016
CONDENSED CONSOLIDATING STATEMENTS OF CASH FLOWS
For the Year ended December 31, 2016
(Amounts in thousands)
LMIA(Guarantor Parent) | Guarantor Subsidiaries | Consolidating/Eliminating Entries | Consolidated | ||||||||||||
Operating activities: | |||||||||||||||
Net (loss) income | $ | (35,178 | ) | $ | (12,204 | ) | $ | 12,275 | $ | (35,107 | ) | ||||
Adjustments for non-cash items | 16,955 | 45,304 | (12,275 | ) | 49,984 | ||||||||||
Net changes in operating assets and liabilities, net of acquired businesses | (1,566 | ) | 1,240 | — | (326 | ) | |||||||||
Intercompany activity | 24,800 | (24,800 | ) | — | — | ||||||||||
Net cash provided by operating activities | 5,011 | 9,540 | — | 14,551 | |||||||||||
Investing activities: | |||||||||||||||
Additions to property, plant and equipment | (2,639 | ) | (9,174 | ) | — | (11,813 | ) | ||||||||
Proceeds from sale of equipment | — | 639 | — | 639 | |||||||||||
Net cash used by investing activities | (2,639 | ) | (8,535 | ) | — | (11,174 | ) | ||||||||
Financing activities: | |||||||||||||||
Proceeds from issuance of debt | — | 1,465 | — | 1,465 | |||||||||||
Principal payments on long-term debt and notes payable | (10,085 | ) | (2,614 | ) | — | (12,699 | ) | ||||||||
Advances on revolving line of credit | 60,000 | — | — | 60,000 | |||||||||||
Payments on revolving line of credit | (60,000 | ) | — | — | (60,000 | ) | |||||||||
Payments for debt issuance cost | (156 | ) | — | — | (156 | ) | |||||||||
Net cash used by financing activities | (10,241 | ) | (1,149 | ) | — | (11,390 | ) | ||||||||
Net (decrease) in cash and cash equivalents | (7,869 | ) | (144 | ) | — | (8,013 | ) | ||||||||
Cash and cash equivalents, beginning of year | 10,251 | 253 | — | 10,504 | |||||||||||
Cash and cash equivalents, end of year | $ | 2,382 | $ | 109 | $ | — | $ | 2,491 | |||||||
87
LMI AEROSPACE, INC.
NOTES TO CONSOLIDATED FINANCIAL STATEMENTS
(Dollar amounts in thousands, except share and per share data)
December 31, 2016
CONDENSED CONSOLIDATING STATEMENTS OF CASH FLOWS
For the Year ended December 31, 2015
(Amounts in thousands)
LMIA(Guarantor Parent) | Guarantor Subsidiaries | Consolidating/Eliminating Entries | Consolidated | ||||||||||||
Operating activities: | |||||||||||||||
Net (loss) income | $ | (2,282 | ) | $ | 19,326 | $ | (19,285 | ) | $ | (2,241 | ) | ||||
Adjustments for non-cash items | (14,546 | ) | 18,416 | 19,285 | 23,155 | ||||||||||
Net changes in operating assets and liabilities, net of acquired businesses | 10,420 | 1,028 | — | 11,448 | |||||||||||
Intercompany activity | 22,874 | (22,874 | ) | — | — | ||||||||||
Net cash provided by operating activities | 16,466 | 15,896 | — | 32,362 | |||||||||||
Investing activities: | |||||||||||||||
Additions to property, plant and equipment | (1,903 | ) | (14,696 | ) | — | (16,599 | ) | ||||||||
Proceeds from sale of equipment | — | 285 | — | 285 | |||||||||||
Net cash (used) by investing activities | (1,903 | ) | (14,411 | ) | — | (16,314 | ) | ||||||||
Financing activities: | |||||||||||||||
Principal payments on long-term debt and notes payable | (11,160 | ) | (2,116 | ) | — | (13,276 | ) | ||||||||
Advances on revolving line of credit | 99,000 | — | — | 99,000 | |||||||||||
Payments on revolving line of credit | (99,000 | ) | — | — | (99,000 | ) | |||||||||
Payments for debt issuance cost | (210 | ) | 15 | — | (195 | ) | |||||||||
Net cash used by financing activities | (11,370 | ) | (2,101 | ) | — | (13,471 | ) | ||||||||
Net increase (decrease) in cash and cash equivalents | 3,193 | (616 | ) | — | 2,577 | ||||||||||
Cash and cash equivalents, beginning of year | 7,058 | 869 | — | 7,927 | |||||||||||
Cash and cash equivalents, end of year | $ | 10,251 | $ | 253 | $ | — | $ | 10,504 | |||||||
88
LMI AEROSPACE, INC.
NOTES TO CONSOLIDATED FINANCIAL STATEMENTS
(Dollar amounts in thousands, except share and per share data)
December 31, 2016
CONDENSED CONSOLIDATING STATEMENTS OF CASH FLOWS
For the Year ended December 31, 2014
(Amounts in thousands)
LMIA(Guarantor Parent) | Guarantor Subsidiaries | Consolidating/Eliminating Entries | Consolidated | ||||||||||||
Operating activities: | |||||||||||||||
Net (loss) income | $ | (29,060 | ) | $ | (8,761 | ) | $ | 8,859 | $ | (28,962 | ) | ||||
Adjustments for non-cash items | 21,714 | 46,496 | (8,859 | ) | 59,351 | ||||||||||
Net changes in operating assets and liabilities, net of acquired businesses | 19,977 | (1,249 | ) | — | 18,728 | ||||||||||
Intercompany activity | 17,663 | (17,663 | ) | — | — | ||||||||||
Net cash used by operating activities | 30,294 | 18,823 | — | 49,117 | |||||||||||
Investing activities: | |||||||||||||||
Additions to property, plant and equipment | (715 | ) | (15,975 | ) | — | (16,690 | ) | ||||||||
Proceeds from sale of equipment | 2,558 | 1,021 | — | 3,579 | |||||||||||
Net cash provided (used) by investing activities | 1,843 | (14,954 | ) | — | (13,111 | ) | |||||||||
Financing activities: | |||||||||||||||
Proceeds from issuance of debt | 250,000 | — | — | 250,000 | |||||||||||
Principal payments on long-term debt and notes payable | (231,466 | ) | (4,167 | ) | — | (235,633 | ) | ||||||||
Advances on revolving line of credit | 66,000 | — | — | 66,000 | |||||||||||
Payments on revolving line of credit | (102,000 | ) | — | — | (102,000 | ) | |||||||||
Payments for debt issuance cost | (8,018 | ) | — | — | (8,018 | ) | |||||||||
Net cash used by financing activities | (25,484 | ) | (4,167 | ) | — | (29,651 | ) | ||||||||
Net increase (decrease) in cash and cash equivalents | 6,653 | (298 | ) | — | 6,355 | ||||||||||
Cash and cash equivalents, beginning of year | 405 | 1,167 | — | 1,572 | |||||||||||
Cash and cash equivalents, end of year | $ | 7,058 | $ | 869 | $ | — | $ | 7,927 | |||||||
20. SUBSEQUENT EVENTS
On February 16, 2017, the Company entered into an Agreement and Plan of Merger (the “Merger Agreement”) with Sonaca S.A., a limited liability company validly existing under the laws of Belgium (the “Parent”), Sonaca USA Inc., a Delaware corporation and direct, wholly-owned subsidiary of Parent (“Intermediate Co”), and Luminance Merger Sub, Inc., a Missouri corporation and an indirect, wholly-owned subsidiary of the Parent (the “Sub,” and collectively with Parent and Intermediate Co, the “Parent Entities”), relating to the proposed acquisition of the Company by Parent.
The Merger Agreement provides that, subject to the terms and conditions thereof, Sub will be merged with and into the Company (the “Merger”) with the Company continuing as the surviving corporation in the Merger (the “Surviving Corporation”). At the effective time of the Merger (the “Effective Time”) each outstanding share of common stock of the Company (other than shares owned by the Company or the Parent Entities, and shares whose holders seek appraisal and comply with all related statutory requirements of the General and Business Corporation Law of Missouri) will cease to be outstanding and will be converted into the right to receive $14.00 in cash, without interest and subject to any applicable tax withholding (the “Merger Consideration”).
Shareholders of the Company will be asked to vote on the approval of the Merger Agreement at a special shareholders’ meeting that will be held on a date to be announced. The closing of the Merger is subject to the approval of the Merger Agreement by the affirmative vote of the holders of at least two-thirds of the outstanding shares of common stock of the Company (the “Shareholder Approval”).
89
LMI AEROSPACE, INC.
NOTES TO CONSOLIDATED FINANCIAL STATEMENTS
(Dollar amounts in thousands, except share and per share data)
December 31, 2016
In addition to the Shareholder Approval condition, consummation of the Merger is subject to various customary conditions, including (a) the expiration or termination of the waiting period under the Hart-Scott-Rodino Antitrust Improvements Act of 1976, as amended, (b) clearance by the Committee on Foreign Investment in the United States and by the Directorate of Defense Trade Controls under the International Traffic in Arms Regulations, (c) the absence of any order, injunction or law preventing or prohibiting the consummation of the Merger, (d) the accuracy of the representations and warranties contained in the Merger Agreement (subject to certain materiality qualifiers), (e) compliance with covenants and agreements in the Merger Agreement in all material respects, and (f) the absence of a material adverse effect on the Company.
The Merger Agreement contains certain termination rights for both the Company and the Parent Entities, and provides that, upon termination of the Merger Agreement by the Company or Parent upon specified conditions, the Company may be required to pay the Parent a termination fee of either $10,000 or $15,000, depending upon the reason for and timing of the termination, and any costs of collection. In addition, subject to certain exceptions and limitations, either party may terminate the Merger Agreement if the Merger is not consummated by August 16, 2017, subject to possible extension until September 29, 2017 to allow for the completion of certain regulatory approvals or if the Shareholder Approval has not yet been obtained.
The Merger Agreement also contains a “go-shop” provision that, in general, allows the Company to initiate, solicit and encourage, and engage in discussions or negotiations with respect to, an acquisition proposal for the 30-day period after execution of the Merger Agreement. The Company may continue discussions after the go-shop period with any party who made an acquisition proposal during the go-shop period that the Company determines in good faith is or could reasonably be expected to result in a superior proposal. Following the expiration of the go-shop period, the Company will be subject to a customary “no-shop” provision.
The Transaction, if it were to be completed, could further limit the Company’s utilization of accumulated net operating losses, for federal income tax purposes. The Company has not performed a Section 382 study to determine if its net operating loss carryforwards could be adversely impacted by the Transaction.
90
LMI AEROSPACE, INC.
SCHEDULE II - VALUATION AND QUALIFYING ACCOUNTS
(Dollar amounts in thousands)
December 31, 2016
Beginning Balance | Charge to Cost/ Expense | Other Charge to Cost/ Expense | Write-offs net of Recoveries | Ending Balance | ||||||||||||||||
Reserve for Accounts Receivable | ||||||||||||||||||||
Year ended December 31, 2014 | $ | 180 | $ | 309 | $ | — | $ | (25 | ) | $ | 464 | |||||||||
Year ended December 31, 2015 | $ | 464 | $ | 53 | $ | — | $ | (271 | ) | $ | 246 | |||||||||
Year ended December 31, 2016 | $ | 246 | $ | 116 | $ | — | $ | (14 | ) | $ | 348 | |||||||||
Income Tax Valuation Allowance | ||||||||||||||||||||
Year ended December 31, 2014 (1) | $ | 18,137 | $ | — | $ | (5,461 | ) | $ | — | $ | 12,676 | |||||||||
Year ended December 31, 2015 (2) | $ | 12,676 | $ | 1,965 | $ | — | $ | — | $ | 14,641 | ||||||||||
Year ended December 31, 2016 (2) | $ | 14,641 | $ | 6,386 | $ | — | $ | — | $ | 21,027 | ||||||||||
(1) Favorable adjustment of $5,461 resulted from the Company's decision to carry back the 2013 net operating tax loss to prior years.
(2) Expected net operating losses on federal and state income tax returns resulted in increases in the income tax valuation allowance.
91
ITEM 9. | CHANGES IN AND DISAGREEMENTS WITH ACCOUNTANTS ON ACCOUNTING AND FINANCIAL DISCLOSURE. |
None.
ITEM 9A. | CONTROLS AND PROCEDURES. |
Our management, under the supervision and with the participation of our Chief Executive Officer and Chief Financial Officer, carried out an evaluation of the effectiveness of the design and operation of the Company’s disclosure controls and procedures (as defined by Rule 13a-15(e) promulgated under the Exchange Act), as of December 31, 2016. Based upon and as of the date of this evaluation, our Chief Executive Officer and Chief Financial Officer have concluded that such disclosure controls and procedures were effective to ensure that the information required to be disclosed by the Company in the reports that it files or submits under the Exchange Act (a) is recorded, processed, summarized and reported within the time period specified in the SEC’s rules and forms and (b) is accumulated and communicated to the Company's management, including its principal executive and principal financial officers, as appropriate to allow timely decisions regarding required disclosure.
Report of Management Regarding Internal Control Over Financial Reporting
The management of LMI Aerospace is responsible for the preparation, integrity, and fair presentation of the consolidated financial statements included in this Report. The consolidated financial statements and notes included in this Report have been prepared in conformity with accounting principles generally accepted in the United States of America and necessarily include some amounts that are based on management’s best estimates and judgments.
In order to produce reliable financial statements, management, under the supervision and with the participation of the Company’s Principal Executive Officer and Principal Financial Officer, is responsible for establishing and maintaining adequate internal control over financial reporting, as such term is defined in Rule 13a-15(f) promulgated under the Exchange Act. Management evaluates the effectiveness of internal control over financial reporting and tests for reliability of recorded financial information through a program of ongoing internal audits. Any system of internal control, no matter how well designed, has inherent limitations, including the possibility that a control can be circumvented or overridden and misstatements due to error or fraud may occur and not be detected. Also, because of changes in conditions, internal control effectiveness may vary over time. Accordingly, even an effective system of internal control will provide only reasonable assurance with respect to financial statement preparation.
Management, under the supervision and with the participation of the Company’s Principal Executive Officer and Principal Financial Officer, assessed the Company’s internal control over financial reporting as of December 31, 2016, as required by Section 404 of the Sarbanes-Oxley Act of 2002, based on the criteria for effective internal control over financial reporting described in the “Internal Control-Integrated Framework,” adopted by the Committee of Sponsoring Organizations of the Treadway Commission 2013. Based on this assessment, management believes that, as of December 31, 2016, the Company’s internal control over financial reporting was effective.
PricewaterhouseCoopers LLP, our independent registered public accounting firm, has issued an audit report on our internal control over financial reporting which is included in Item 8.
Changes in Internal Control Over Financial Reporting
No change in our internal control over financial reporting occurred during the three month period ending December 31, 2016, that has materially affected, or is reasonably likely to materially affect, our internal control over financial reporting.
92
ITEM 9B. | OTHER INFORMATION. |
None.
PART III
ITEM 10. | DIRECTORS, EXECUTIVE OFFICERS AND CORPORATE GOVERNANCE. |
The information required by Item 401 of Regulation S-K and the information regarding compliance with Section 16(a) of the Exchange Act required by Item 405 of Regulation S-K is expected to be filed by amendment to this 10-K filing. The amendment to this 10-K filing will be filed with the SEC within 120 days after the close of our fiscal year ended December 31, 2016, and is incorporated herein by reference.
ITEM 11. | EXECUTIVE COMPENSATION. |
The information required by Item 402 of Regulation S-K regarding the compensation of the Company’s directors and executive officers is expected to be filed by amendment to this 10-K filing. The amendment to this 10-K filing will be filed with the SEC within 120 days after the close of our fiscal year ended December 31, 2016, and is incorporated herein by reference.
The information required by Item 407(e)(4) and (e)(5) of Regulation S-K is expected to be filed by amendment, but otherwise is incorporated by reference from the information that will be contained in an amendment to this 10-K filing. The amendment to this 10-K filing will be filed with the SEC within 120 days after the close of our fiscal year ended December 31, 2016, and such information is incorporated herein by reference.
ITEM 12. | SECURITY OWNERSHIP OF CERTAIN BENEFICIAL OWNERS AND MANAGEMENT AND RELATED STOCKHOLDER MATTERS. |
The information required by Item 403 of Regulation S-K regarding the security ownership of our beneficial owners and our management and the information required by Item 201(d) of Regulation S-K regarding our equity compensation plans is expected to be filed by amendment to this 10-K filing. The amendment to this 10-K filing will be filed with the SEC within 120 days after the close of our fiscal year ended December 31, 2016, and is incorporated herein by reference.
93
ITEM 13. | CERTAIN RELATIONSHIPS AND RELATED TRANSACTIONS, AND DIRECTOR INDEPENDENCE. |
The information required by Item 404(a) of Regulation S-K regarding director independence and Item 404 regarding transactions with related persons is expected to be filed by amendment, is expected to be filed by amendment to this 10-K filing. The amendment to this 10-K filing will be filed with the SEC within 120 days after the close of our fiscal year ended December 31, 2016, and is incorporated herein by reference.
ITEM 14. | PRINCIPAL ACCOUNTANT FEES AND SERVICES. |
The information contained under the caption “Fees Billed by Independent Registered Public Accounting Firm” pursuant to Regulation 14A for the Company’s 2017 Annual Meeting of Shareholders will be contained in an amendment to this 10-K filing. The amendment, to this 10-K filing will be filed with the SEC within 120 days after the close of our fiscal year ended December 31, 2016, and such information is incorporated herein by reference.
94
PART IV
ITEM 15. | EXHIBITS AND FINANCIAL STATEMENT SCHEDULES. |
1. | For a list of the Consolidated Financial Statements of the Company included as part of this report, see the index at Item 8. |
2. | Other than Schedule II - Valuation and Qualifying Accounts, all schedules have been omitted as the required information is not present in sufficient amounts or the required information is included elsewhere in the Consolidated Financial Statement or notes thereto. |
3. | Exhibits: |
(a.) | See Exhibit Index (each management contract or compensatory plan or arrangement listed therein is identified). |
(b) | See Exhibit Index below. |
(c) | Other than Schedule II - Valuation and Qualifying Accounts, all schedules have been omitted as the required information is not present in sufficient amounts or the required information is included elsewhere in the Consolidated Financial Statement or notes thereto. |
95
SIGNATURES
Pursuant to the requirements of Section 13 or 15(d) of the Securities Exchange Act of 1934, the registrant has duly caused this report to be signed on its behalf by the undersigned, thereunto duly authorized, in the County of St. Charles and State of Missouri on the 15th day of March, 2017.
LMI AEROSPACE, INC. | ||
By: | /s/ Daniel G. Korte | |
Daniel G. Korte | ||
Chief Executive Officer | ||
Pursuant to the requirements of the Securities Exchange Act of 1934, this report has been signed below by the following persons on behalf of the registrant and in the capacities and as of the dates indicated.
Signature | Title | Date | ||
/s/ Daniel G. Korte | March 15, 2017 | |||
Daniel G. Korte | President, Chief Executive Officer and Director (Principal Executive Officer) | |||
/s/ Clifford C. Stebe, Jr. | March 15, 2017 | |||
Clifford C. Stebe, Jr. | Chief Financial Officer and Chief Accounting Officer | |||
/s/ Gerald E. Daniels | March 15, 2017 | |||
Gerald E. Daniels | Chairman of the Board and Director | |||
/s/ Sanford S. Neuman | March 15, 2017 | |||
Sanford S. Neuman | Director | |||
/s/ Gregory L. Summe | March 15, 2017 | |||
Gregory L. Summe | Director | |||
/s/ Lawrence J. Resnick | March 15, 2017 | |||
Lawrence J. Resnick | Director | |||
/s/ John M. Roeder | March 15, 2017 | |||
John M. Roeder | Director | |||
/s/ John S. Eulich | March 15, 2017 | |||
John S. Eulich | Director | |||
/s/ Judith W. Northup | March 15, 2017 | |||
Judith W. Northup | Director | |||
/s/ Steven K. Schaffer | March 15, 2017 | |||
Steven K. Schaffer | Director | |||
96
EXHIBIT INDEX
Exhibit Number | Description | |
2.1 | Agreement and Plan of Merger dated February 16, 2017, among the Registrant, Sonaca S.A, Sonaca USA Inc., and Luminance Merger Sub, Inc. dated as of February 16, 2017, previously filed as Exhibit 2.1 to the Registrant's Form 8-K filed on February 17, 2017 and incorporated herein by reference. | |
3.1 | Restated Articles of the Registrant previously filed as Exhibit 3.1 to the Registrant’s Form S-1 (File No. 333-51357) dated as of April 29, 1998 (the “Form S-1”) and incorporated herein by reference. | |
3.2 | Amended and Restated By-Laws of the Registrant previously filed as Exhibit 3.2 to the Form S-1 and incorporated herein by reference. | |
3.3 | Amendment to Restated Articles of Incorporation dated as of July 9, 2001 previously filed as Exhibit 3.3 to the Registrant’s Form 10-K for the fiscal year ended December 31, 2001 and filed April 1, 2002 and incorporated herein by reference. | |
3.4 | Amendment to the Registrant’s Amended and Restated Bylaws previously filed as Exhibit 3.1 to the Registrant’s Form 8-K filed June 26, 2009 and incorporated herein by reference. | |
3.5 | Amendment to the Registrant’s Amended and Restated Bylaws previously filed as Exhibit 3.1 to the Registrant’s Form 8-K filed May 6, 2015 and incorporated herein by reference. | |
3.6 | Amendment to the Registrant’s Amended and Restated Bylaws previously filed as Exhibit 3.1 to the Registrant’s Form 8-K filed February 17, 2017 and incorporated herein by reference. | |
4.1 | Form of the Registrant’s Common Stock Certificate previously filed as Exhibit 4.1 to the Form S-1 and incorporated herein by reference. | |
4.2 | Indenture dated as of June 19, 2014, by and among the Company, the Guarantors named therein, and U.S. Bank National Association, as Indenture Trustee and as Collateral Agent previously filed as Exhibit 4.1 to the Registrant’s Form 8-K filed on June 20, 2014 and incorporated herein by reference. | |
4.3 | Forms of 7.375% Senior Secured Notes due 2019 (included as exhibits to the Indenture identified in Exhibit 4.2). | |
4.4 | Notes Collateral Agreement dated as of June 19, 2014, by and among the Company, the domestic Guarantors, and U.S. Bank National Association, as Collateral Agent, previously filed as Exhibit 4.3 to the Registrant’s Form 8-K filed on June 20, 2014 and incorporated herein by reference. | |
4.5 | Notes Intellectual Property Security Agreement dated as of June 19, 2014, by and among the Company, certain Guarantors named therein, and U.S. Bank National Association, as Collateral Agent, previously filed as Exhibit 4.4 to the Registrant’s Form 8-K filed on June 20, 2014 and incorporated herein by reference. | |
4.6 | Registration Rights Agreement dated as of June 19, 2014, by and among the Company, the Guarantors named therein and RBC Capital Markets, LLC, on behalf of itself and as representative of the other initial purchasers named therein, previously filed as Exhibit 4.5 to the Registrant’s Form 8-K filed on June 20, 2014 and incorporated herein by reference. | |
4.7 | Intercreditor Agreement dated as of June 19, 2014, by and between Royal Bank of Canada, as First-Lien Collateral Agent, and U.S. Bank National Association, as Second-Lien Collateral Agent previously filed as Exhibit 4.6 to the Registrant’s Form 8-K filed on June 20, 2014 and incorporated herein by reference. | |
97
10.1 | Lease Agreement dated December 7, 2005 between Inmobiliaria LA Rumorosa S.A. de C.V. and Ivemsa S.A. de C.V., including all amendments, for the premises located at A.V. Eucalipto, #2351, Col. Rivera, Modulo Cy D, C.P. 21259, Mexicali, Baja California, Mexico and previously filed as Exhibit 10.2 to the Registrant’s Form 10-K for the fiscal year ended December 31, 2008 and filed March 16, 2009 and incorporated herein by reference. | |
10.2 | Lease Agreement dated May 19, 2008 between Precise Machine Company and Acquiport DFWIP, Inc. for the premises located at 14813 Trinity Blvd., Fort Worth, Texas and previously filed as Exhibit 10.3 to the Registrant’s Form 10-K for the fiscal year ended December 31, 2008 and filed March 16, 2009 and incorporated herein by reference. | |
10.3 | Lease Agreement dated May 2, 2006 between LMI Finishing, Inc. and Port Partnership, LLP for the premises located at 5270 N. Skiatook, Catoosa, Oklahoma and filed as Exhibit 10.4 to the Registrant’s Form 10-K for the fiscal year ended December 31, 2008 and filed March 16, 2009 and incorporated herein by reference. | |
10.4 | Lease Agreement dated September 4, 2003 between Registrant and Kole Warehouses, including all amendments, for the premises located at 101 Coleman, Savannah, Georgia and previously filed as Exhibit 10.5 to the Registrant’s Form 10-K for the fiscal year ended December 31, 2008 and filed March 16, 2009 and incorporated herein by reference, as restated by that certain Restated Lease Agreement dated as of September 14, 2012 between Kole Warehouses, Inc. and LMI Kitting, LLC. | |
10.5 | Lease Agreement dated March 24, 1997, including all amendments, between D3 Technologies, Inc. and H.G. Fenton Company for the premises located at 4838 Ronson Court, San Diego, California and previously filed as Exhibit 10.6 to the Registrant’s Form 10-K for the fiscal year ended December 31, 2008 and filed March 16, 2009 and incorporated herein by reference. | |
10.6 | Lease Agreement dated February 13, 2007 between LMI Finishing, Inc. and Angelo Gordon, successor in interest to CIT CRE LLC, for the premises located at 2104 N. 170 th St. East, Tulsa, Oklahoma and previously filed as Exhibit 10.8 to the Registrant’s Form 10-K for the fiscal year ended December 31, 2008 and filed March 16, 2009 and incorporated herein by reference. | |
10.7 | Lease Agreement dated May 6, 1997 between the Registrant and Victor Enterprises, LLC, including all amendments, for the premises located at 101 Western Avenue S., Auburn, Washington previously filed as Exhibit 10.10 to the Form S-1/A and incorporated herein by reference. | |
10.8 | Lease Agreement dated February 1, 1995 between the Registrant and RFS Investments for the premises located at 2621 West Esthner Court, Wichita, Kansas previously filed as Exhibit 10.11 to the Form S-1/A and incorporated herein by reference. | |
10.9+ | Profit Sharing and Savings Plan and Trust, restated effective January 1, 2009, including amendments previously filed as Exhibit 10.12 to the Form S-1/A and incorporated herein by reference. | |
10.10 | Business Reformation Agreement between Leonard’s Metal, Inc. and Lockheed Martin Aeronautics Company dated September 21, 2001 previously filed as Exhibit 10.1 to the Registrant’s Form 10-Q filed November 14, 2001 and incorporated by reference. | |
10.11 | Lease Agreement dated April 2, 2001 between Peter Holz and Anna L. Holz, Trustees of the Peter and Anna L. Holz Trust dated 2/8/89, including all amendments, as to an undivided one-half interest, and Ernest R. Star and Linda Ann Zoettl, Trustees under the Ernest L. Star and Elizabeth H. Star 1978 Trust dated August 25, 1978, as to an undivided one-half interest, and Metal Corporation (now Tempco Engineering, Inc.) for the premises located at 11011-11021 Olinda Street, Sun Valley, California previously filed as Exhibit 10.27 to the Registrant’s Form 10-K for the fiscal year ended December 31, 2001 filed April 1, 2002 and incorporated herein by reference. | |
10.12 | Lease Agreement dated April 2, 2001 between Tempco Engineering, Inc. and Metal Corporation for the premises located at 8866 Laurel Canyon Blvd., Sun Valley, California previously filed as Exhibit 10.28 to the Registrant’s Form 10-K for the fiscal year ended December 31, 2001 filed April 1, 2002 and incorporated herein by reference. | |
98
10.13 | Lease Agreement between Versaform Corp. and Nonar Enterprises, including all amendments, dated September 12, 2003 for the premises located at 1345 Specialty Drive Suites A-E, 1391 Specialty Drive Suite B, 1351 Specialty Drive and 1377 Specialty Drive, Suites A, B, and C, Vista, California previously filed as Exhibit 10.1 to the Registrant’s Form 10-Q filed November 14, 2003 and incorporated herein by reference. | |
10.14+ | LMI Aerospace, Inc. 2005 Long-Term Incentive Plan previously filed as Exhibit 10.1 in the Registrant’s Form 8-K filed July 13, 2005 and incorporated herein by reference. | |
10.15 | General Terms Agreement between Spirit AeroSystems, Inc. (Tulsa Facility) and Registrant dated October 14, 2005 previously filed as Exhibit 10.1 to the Registrant’s Form 10-Q filed May 18, 2006 and incorporated herein by reference. | |
10.16 | Special Business Provisions between Spirit AeroSystems, Inc. and Registrant dated April 19, 2006 previously filed as Exhibit 10.2 to the Registrant’s Form 10-Q filed May 18, 2006 and incorporated herein by reference | |
10.17 | Lease Agreement between Leonard’s Metal, Inc. and Welsh Fountain Lakes, L.L.C., including all amendments dated June 9, 2006, for the premises located at 401-411 Fountain Lakes Blvd., St. Charles, Missouri previously filed as Exhibit 10.1 to the Registrant’s Form 8-K filed June 15, 2006 and incorporated herein by reference. | |
10.18 | Memorandum of Agreement effective as of December 22, 2010 between Registrant and Gulfstream Aerospace Corporation previously filed as Exhibit 10.1 to the Registrant’s Form 10-Q filed November 13, 2006 and incorporated herein by reference. | |
10.19 | Lease Agreement between Leonard’s Metal, Inc. and Angelo Gordon, successor in interest to CIT CRE LLC, dated as of December 28, 2006, including all amendments, for the premises located at 2629-2635 Esthner Court, Wichita, Kansas, 3600 Mueller Road, St. Charles, Missouri, and 3030-3050 North Highway 94, St. Charles, Missouri previously filed as Exhibit 10.3 to the Registrant’s Form 8-K filed January 3, 2007 and incorporated herein by reference. | |
10.20 | Lease Agreement dated January 16, 2009 between Integrated Holdings, LLC and Integrated Technologies, Inc. for the premises located at 1910 Merrill Creek Parkway, Everett, WA 98203 and previously filed as Exhibit 10.2 of the Registrant’s Form 10-Q filed May 11, 2009 and incorporated herein by reference. | |
10.21 | Lease Agreement dated August 19, 2011 between D3 Technologies Inc. and JLM & Associates, LLC for the premises located at 1045 Keys Drive, Greenville, South Carolina, 29615, and filed herewith. | |
10.22 | Lease Agreement dated July 15, 2012 between the City of Coweta and Accu-Tec Enterprises, Ltd., regarding the real property commonly referred to as 26730 East 111th Street South, Coweta, Oklahoma including the Estoppel Certificate, dated November 9, 2009, executed by the city of Coweta. | |
10.23 | Lease Agreement dated April 1, 2012 between City of Fredonia, KS and Valent Aerostructures, LLC, previously filed as Exhibit 10.38 to the Registrant’s Form 10-K filed March 15, 2013 and incorporated herein by reference. | |
10.24 | Lease, dated October 11, 2001, as amended by the First Amendment to Lease, dated July 17, 2003, the Second Amendment to Lease, dated November 15, 2003, the Third Amendment to Lease, dated December 31, 2008, the Fourth Amendment to Lease, dated March 1, 2010, and the Fifth Amendment to Lease, dated May 24, 2011, between College Crossing Associates, LLC (as successor to Welsh Lenexa II, LLC) and Valent Aerostructures-Lenexa, LLC (as successor to CT Systems, L.LC. as successor to Cable-Tech Industries, L.L.C.), regarding certain real property located at 11064 Strang Line Road, Lenexa, Kansas. | |
10.25 | Sublease Agreement dated September 3, 2010 between Washington Civic Industrial Corp. and Valent Aerostructures, LLC, regarding certain real property located at 6325 Avantha Drive, Washington, Missouri 63090. | |
99
10.26 | General contract provisions of Spirit Aerosystems, Inc and Master Order Agreements, Special Business Provisions, Customer Specific Supplemental Terms and other contracts that contain additional general terms between Spirit Aerosystems, Inc and Valent Aerostructures, LLC or a subsidiary thereof. | |
10.27+ | Form of Incentive Restricted Stock Award Agreement between LMI. Aerospace, Inc. and Daniel J. Korte previously filed as Exhibit 10.1 to the Registrant’s Form 8-K filed March 20, 2014 and incorporated herein by reference. | |
10.28+ | LTI Restricted Stock Award Agreement dated March 14, 2014 between Registrant and Daniel J. Korte previously filed as Exhibit 10.2 to the Registrant’s Form 8-K filed March 20, 2014 and incorporated herein by reference. | |
10.29 | Credit Agreement dated as of June 19, 2014, by and among the Company, the Guarantors named therein, the lenders party thereto, Royal Bank of Canada, as Administrative Agent and Co-Collateral Agent, and Wells Fargo Bank, National Association, as Syndication Agent and Co-Collateral Agent (including the forms of Revolver Collateral Agreement, Guarantee Agreement and Revolver Intellectual Property Security Agreement attached as exhibits thereto), previously filed as Exhibit 10.1 to the Registrant’s Form 8-K filed on June 20, 2014 and incorporated herein by reference. | |
10.30 | Amendment No. 1, dated as of September 18, 2014, to the Credit Agreement dated as of June 19, 2014, by and among the Company, the Guarantors named therein, the lenders party thereto, Royal Bank of Canada, as Administrative Agent and Co-Collateral Agent, and Wells Fargo Bank, National Association, as Syndication Agent and Co-Collateral Agent, previously filed as Exhibit 10.1 to the Registrant’s Form 8-K filed on September 18, 2014 and incorporated herein by reference. | |
10.31+ | Employment Agreement between Registrant and Joseph DeMartino, dated July 31, 2014, previously filed as Exhibit 10.1 to the Registrant’s Form 8-K filed on August 6, 2014 and incorporated herein by reference. | |
10.32+ | Restricted Stock Award Agreement between Registrant and Jennifer Alfaro dated February 2, 2015, previously filed as Exhibit 10.2 to the Registrant’s Form 8-K filed on February 9, 2015 and incorporated herein by reference. | |
10.33+ | LMI Aerospace, Inc. 2015 Incentive Plan previously filed as Exhibit 10.1 in the Registrant’s Form 8-K filed June 30, 2015 and incorporated herein by reference. | |
10.34+* | Restricted Stock Award Agreement between Registrant and Daniel G. Korte dated July 1, 2015 (performance based vesting), previously filed as Exhibit 10.1 to the Registrant’s Quarterly Report on Form 10-Q filed on August 7, 2015, and incorporated herein by reference. | |
10.35+ | Restricted Stock Award Agreement between Registrant and Daniel G. Korte dated July 1, 2015 (time based vesting), previously filed as Exhibit 10.2 to the Registrant’s Quarterly Report on Form 10-Q filed on August 7, 2015, and incorporated herein by reference. | |
10.36 | Confidential Settlement Agreement and Mutual Release dated November 5, 2015 by and among Tech Investments, LLC, Tech Investments II, LLC, Charles M. Newell, individually and as the Sellers’ Representative for and on behalf of the former members of Valent Aerostructures, LLC, and the Registrant filed herewith. | |
10.37+ | Employment Agreement between Registrant and Daniel G. Korte effective January 1, 2017, the form of which was previously filed as Exhibit 10.1 to the Registrant’s Form 8-K filed on January 6, 2017 and incorporated herein by reference. | |
10.38+ | Employment Agreement between Registrant and Clifford C. Stebe, effective January 1, 2017, the form of which was previously filed as Exhibit 10.1 to the Registrant’s Form 8-K filed on January 6, 2017 and incorporated herein by reference. | |
10.39+ | Employment Agreement between Registrant and Jay P. Inman, effective January 1, 2017, the form of which was previously filed as Exhibit 10.1 to the Registrant’s Form 8-K filed on January 6, 2017 and incorporated herein by reference. | |
100
10.40+ | Employment Agreement between Registrant and Keith M. Schrader, effective January 1, 2017, the form of which was previously filed as Exhibit 10.1 to the Registrant’s Form 8-K filed on January 6, 2017 and incorporated herein by reference. | |
10.41+ | Employment Agreement between Registrant and Jennifer Alfaro, effective January 1, 2017, the form of which was previously filed as Exhibit 10.1 to the Registrant’s Form 8-K filed on January 6, 2017 and incorporated herein by reference. | |
14 | Code of Ethics and Business Conduct, previously filed as Exhibit 14 to the Registrant’s Form 10-Q filed November 6, 2015 and incorporated by reference. | |
21.1 | List of Subsidiaries of the Registrant filed herewith. | |
23.1 | Consent of PricewaterhouseCoopers LLP filed herewith. | |
101 | Financial information from the Company’s Form 10-K for the fiscal year ended December 31, 2016, formatted in XBRL (Extensible Business Reporting Language) | |
+ | Management contract or compensatory plan or arrangement required to be filed as exhibit to this report. |
* | The Company has received confidential treatment of the redacted portions of this exhibit pursuant to Rule 24b-2, under the Exchange Act and has separately filed a complete copy of this exhibit with the SEC. |
101