Attached files
| file | filename |
|---|---|
| EX-32.1 - EX-32.1 - Heritage Insurance Holdings, Inc. | hrtg-ex321_8.htm |
| EX-31.2 - EX-31.2 - Heritage Insurance Holdings, Inc. | hrtg-ex312_6.htm |
| EX-31.1 - EX-31.1 - Heritage Insurance Holdings, Inc. | hrtg-ex311_9.htm |
| EX-23.1 - EX-23.1 - Heritage Insurance Holdings, Inc. | hrtg-ex231_7.htm |
F7780
UNITED STATES
SECURITIES AND EXCHANGE COMMISSION
Washington, D.C. 20549
|
☒ |
ANNUAL REPORT PURSUANT TO SECTION 13 OR 15(d) OF THE SECURITIES EXCHANGE ACT OF 1934 |
For the Year Ended December 31, 2016
OR
|
☐ |
TRANSITION REPORT PURSUANT TO SECTION 13 OR 15(d) OF THE SECURITIES EXCHANGE ACT OF 1934 |
For the Transition Period From to
Commission File Number 001-36462
Heritage Insurance Holdings, Inc.
|
Delaware |
|
45-5338504 |
|
(STATE OF INCORPORATION) |
|
(I.R.S. ID) |
2600 McCormick Drive, Suite 300, Clearwater, Florida 33759
(727) 362-7200
Securities registered pursuant to Section 12(b) of the Act:
|
Title of Each Class |
|
|
Name of Each Exchange on Which Registered |
|
Common Stock, par value $0.0001 per share |
|
|
New York Stock Exchange |
Securities registered pursuant to Section 12(g) of the Act:
None
Indicate by check mark if the registrant is a well-known seasoned issuer, as defined in Rule 405 of the Securities Act. Yes ☐ No ☒
Indicate by check mark if the registrant is not required to file reports pursuant to Section 13 or Section 15(d) of the Exchange Act. Yes ☐ No ☒
Indicate by check mark whether the registrant (1) has filed all reports required to be filed by Section 13 or 15(d) of the Securities Exchange Act of 1934 during the preceding 12 months (or for such shorter period that the registrant was required to file such reports), and (2) has been subject to such filing requirements for the past 90 days. Yes ☒ No ☐
Indicate by check mark whether the registrant has submitted electronically and posted on its corporate Web site, if any, every Interactive Data File required to be submitted and posted pursuant to Rule 405 of Regulation S-T (§232.405 of this chapter) during the preceding 12 months (or for such shorter period that the registrant was required to submit and post such files). Yes ☒ No ☐
Indicate by check mark if disclosure of delinquent filers pursuant to Item 405 of Regulation S-K (§229.405 of this chapter) is not contained herein, and will not be contained, to the best of registrant’s knowledge, in definitive proxy or information statements incorporated by reference in Part III of this Form 10-K or any amendment to this Form 10-K. ☐
Indicate by check mark whether the registrant is a large accelerated filer, an accelerated filer, a non-accelerated filer, or a smaller reporting company. See the definitions of “large accelerated filer,” “accelerated filer” and “smaller reporting company” in Rule 12b-2 of the Exchange Act.
|
Large accelerated filer |
|
☐ |
|
Accelerated filer |
|
☒ |
|
|
|
|
|
|
|
|
|
Non-accelerated filer |
|
☐ (Do not check if a smaller reporting company) |
|
Smaller reporting company |
|
☐ |
Indicate by check mark whether the registrant is a shell company (as defined in Rule 12b-2 of the Exchange Act). Yes ☐ No ☒
The aggregate market value of the Registrant’s common stock held by non-affiliates was $244,038,590 on June 30, 2016, computed on the basis on the closing sale price of the Registrant’s common stock on the New York Stock Exchange on that date.
As of March 1, 2017, the number of shares outstanding of the Registrant’s common stock was 29,740,441.
DOCUMENTS INCORPORATED BY REFERENCE
Portions of the Registrant’s Proxy Statement for its Annual Meeting of Stockholders are incorporated by reference into Part III of this Annual Report on Form 10-K, provided that if such Proxy Statement is not filed with the Securities and Exchange Commission within 120 days after the end of the fiscal year covered by this Form 10-K, an amendment to this Form 10-K shall be filed no later than the end of such 120-day period.
HERITAGE INSURANCE HOLDINGS, INC.
FORM 10-K
FOR THE FISCAL YEAR ENDED DECEMBER 31, 2016
Table of Contents
|
|
|
|
|
Page |
|
|
|
|
||
|
|
|
|||
|
Item 1. |
|
|
1 |
|
|
Item 1A. |
|
|
16 |
|
|
Item 1B. |
|
|
29 |
|
|
Item 2. |
|
|
29 |
|
|
Item 3. |
|
|
29 |
|
|
Item 4. |
|
|
29 |
|
|
|
|
|
|
|
|
|
|
|||
|
Item 5. |
|
|
30 |
|
|
Item 6. |
|
|
31 |
|
|
Item 7. |
|
Management’s Discussion and Analysis of Financial Condition and Results of Operations |
|
32 |
|
Item 7A. |
|
|
48 |
|
|
Item 8. |
|
|
50 |
|
|
Item 9. |
|
Changes in and Disagreements with Accountants on Accounting and Financial Disclosure |
|
90 |
|
Item 9A. |
|
|
90 |
|
|
Item 9B. |
|
|
91 |
|
|
|
|
|
|
|
|
|
|
|||
|
Item 10. |
|
|
91 |
|
|
Item 11. |
|
|
91 |
|
|
Item 12. |
|
Security Ownership of Certain Beneficial Owners and Management and Related Stockholder Matters |
|
91 |
|
Item 13. |
|
Certain Relationships and Related Transactions, and Director Independence |
|
91 |
|
Item 14. |
|
|
92 |
|
|
|
|
|
|
|
|
|
|
|||
|
Item 15. |
|
|
92 |
|
|
Item 16. |
|
|
94 |
|
|
|
|
|
|
|
|
|
95 |
|||
|
|
|
|
||
This Annual Report on Form 10-K contains forward-looking statements within the meaning of the federal securities laws. These forward-looking statements include, but are not limited to, statements regarding: our core strategy; our growth, results of operations or liquidity; statements concerning projections, predictions, expectations, estimates or forecasts as to our business, financial and operational results and future economic performance; statements of management’s goals and objectives; projections of revenue, earnings, capital structure and other financial items; assumptions underlying statements regarding us and our business; and other similar expressions concerning matters that are not historical facts. These forward-looking statements are subject to risks and uncertainties that could cause actual results and events to differ. A detailed discussion of these and other risks and uncertainties that could cause actual results and events to differ materially from such forward-looking statements is included throughout this filing and particularly in Item 1A: "Risk Factors" and Item 7 “Management’s Discussion and Analysis of Financial Condition and Results of Operations” set forth in this Annual Report on Form 10-K. All forward-looking statements included in this document are based on information available to us on the date hereof, and we assume no obligation to revise or publicly release any revision to any such forward-looking statement, except as may otherwise be required by law.
These statements are based on current expectations, estimates and projections about the industry and market in which we operate, and management’s beliefs and assumptions. Without limiting the generality of the foregoing, words such as “may,” “will,” “expect,” “believe,” “anticipate,” “intend,” “could,” “would,” “estimate,” or “continue” or the negative variations thereof or comparable terminology are intended to identify forward-looking statements. Forward-looking statements are not guarantees of future performance and involve certain known and unknown risks and uncertainties that could cause actual results to differ materially from those expressed or implied by such statements. The risks and uncertainties include, without limitation:
|
|
• |
our limited operating history; |
|
|
• |
the possibility that actual losses may exceed reserves; |
|
|
• |
the concentration of our business in Florida and Hawaii; |
|
|
• |
our exposure to catastrophic events; |
|
|
• |
the fluctuation in our results of operations; |
|
|
• |
increased costs of reinsurance, non-availability of reinsurance, and non-collectability of reinsurance; |
|
|
• |
increased competition, competitive pressures, and market conditions; |
|
|
• |
our failure to accurately price the risks we underwrite; |
|
|
• |
inherent uncertainty of our models and our reliance on such model as a tool to evaluate risk; |
|
|
• |
the failure of our claims department to effectively manage or remediate claims; |
|
|
• |
low renewal rates and failure of such renewals to meet our expectations; |
|
|
• |
our failure to execute our growth strategy; |
|
|
• |
failure of our information technology systems and unsuccessful development and implementation of new technologies; |
|
|
• |
we do not have significant redundancy in our operations; |
|
|
• |
our failure to attract and retain qualified employees and independent agents or our loss of key personnel; |
|
|
• |
our inability to generate investment income; |
|
|
• |
our inability to maintain our financial stability rating; |
|
|
• |
effects of emerging claim and coverage issues relating to legal, judicial, environmental and social conditions; |
|
|
• |
the failure of our risk mitigation strategies or loss limitation methods; and |
|
|
• |
changes in regulations and our failure to meet increased regulatory requirements. |
Additional risks and uncertainties not currently known to us or that we currently deem to be immaterial also may materially adversely affect our business, financial condition or operating results.
The forward-looking statements speak only as of the date on which they are made, and, except as required by law, we undertake no obligation to update any forward-looking statement to reflect events or circumstances after the date on which the statement is made or to reflect the occurrences of anticipated events. In addition, we cannot assess the impact of each factor on our business or the extent to which any factor, or combination of factors, may cause actual results to differ materially from those contained in the forward-looking statements. Consequently, you should not place undue reliance on forward-looking statements.
Our Business
Heritage Insurance Holdings, Inc., (“we”, “our”, “us” and “Heritage Insurance”) is a property and casualty insurance holding company that provides personal and commercial residential insurance. We are headquartered in Clearwater, Florida and, through our subsidiaries, Heritage Property & Casualty Insurance Company (“Heritage P&C”) and Zephyr Insurance Company (“Zephyr”), we write personal residential insurance for single-family homeowners and condominium owners, and rental property insurance in the states of Florida, Hawaii, North Carolina and South Carolina. We also provide commercial residential insurance for Florida properties and are also licensed in the states of Alabama, Georgia and Mississippi. We are vertically integrated and control or manage substantially all aspects of insurance underwriting, customer service, actuarial analysis, distribution and claims processing and adjusting. We are led by an experienced senior management team with an average of 30 years of insurance industry experience. We began operations in August 2012, and in December 2012 we began selectively assuming policies from Citizens Property Insurance Corporation (“Citizens”), a Florida state-supported insurer, through participation in a legislatively established “depopulation program” designed to reduce the state’s risk exposure by encouraging private companies to assume insurance policies from Citizens. We also write policies outside the Citizens depopulation program, which we refer to as voluntary policies. At December 31, 2016, approximately 53% of our policies in force were assumed from Citizens. Heritage P&C and Zephyr are currently rated “A” (“Exceptional”) or better by Demotech, Inc. (“Demotech”), a rating agency specializing in evaluating the financial stability of insurers.
In addition to Heritage P&C, our other subsidiaries include: Heritage Property & Casualty Insurance Company (“Heritage P&C”), which provides personal and commercial residential insurance; Heritage MGA, LLC, the managing general agent that manages substantially all aspects of our Florida insurance subsidiary’s business; Contractors’ Alliance Network, LLC (“CAN”), our vendor network manager for Florida claims which includes BRC Restoration Specialists, Inc. (“BRC”), our provider of restoration, emergency and recovery services; Zephyr Acquisition Company (“ZAC”) and its wholly-owned subsidiary, Zephyr Insurance Company, Inc. (“Zephyr”), our provider for writing insurance policies for residential wind insurance within the State of Hawaii; Skye Lane Properties, LLC, our property management subsidiary; First Access Insurance Group, LLC, our retail agency; Osprey Re Ltd. (“Osprey”), our reinsurance subsidiary that provides a portion of the reinsurance protection purchased by our insurance subsidiaries; and Heritage Insurance Claims, LLC, an inactive subsidiary reserved for future development. The assets of BRC, a building restoration company, were acquired and merged into CAN in 2015. The assets of SVM Restoration Services Inc. (“SVM”), a water mitigation company, were acquired and merged into CAN in 2014. 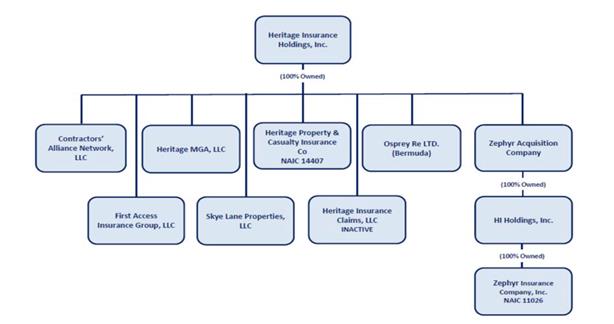
Our Company
Our company was initially formed as a Florida limited liability company in 2012. On January 1, 2014, we formed a Delaware limited liability company, also named Heritage Insurance Holdings, LLC, and merged with it in order to domicile the Company in
1
Delaware. Effective May 22, 2014, Heritage Insurance Holdings, LLC converted into a Delaware corporation named Heritage Insurance Holdings, Inc.
Our primary products are personal and commercial residential insurance, which at December 31, 2016 were offered in Florida, North Carolina, South Carolina and Hawaii. Our Florida domiciled insurance company, Heritage P&C, is authorized by each of the respective state insurance departments in Florida, North Carolina, South Carolina, George, Alabama and Mississippi. Our Hawaii domiciled insurance company, Zephyr, writes business only in Hawaii and is authorized by the Hawaii Insurance Division. We conduct our operations under one business segment.
As of December 31, 2016, we had 319,676 personal residential policies in force, representing $516.7 million of annualized premium and 3,625 commercial residential policies in force, representing $118.6 million of annualized premium. Approximately 53% of our personal policies and 53% of our commercial policies as of December 31, 2016 were assumed from Citizens. For the years ended December 31, 2016, 2015, and 2014, we had gross premiums written of $626.7 million, $586.1 million and $436.4 million, respectively, and net income of $33.9 million, $92.5 million and $47.1 million, respectively. At December 31, 2016 and 2015, we had total assets of $1 billion and $837.4 million, respectively, and total stockholders’ equity of $358 million and $357 million, respectively.
As of December 31, 2016, Citizens had approximately 456,000 insurance policies, of which approximately 440,000 were personal residential policies and approximately 5,900 were commercial residential policies. We have selectively assumed personal residential policies from Citizens in 27 separate assumption transactions between December 2012 and May 2016. In October 2014 we completed our first commercial residential assumption transaction. During 2016, approximately 11,900 policies were assumed from Citizens. Given the reduced policy count at Citizens resulting from the depopulation program, we do not expect to continue to assume policies from Citizens in the foreseeable future.
Recent Developments
On December 15, 2016, the Company issued $79.5 million in Senior Secured Notes (“Secured Notes”) due 2023 to six accredited investors. Proceeds will be used to participate opportunistically in mergers and acquisitions, to make strategic investments and for general corporate purposes. In connection with the issuance of the Notes, the Company incurred $6.6 million in debt issuance costs. Debt issuance costs are reflected on the consolidated balance sheet as a contra long-term liability, and amortized using the imputed interest method over the life of the underlying debt instrument. For tax purposes, the debt issuance costs are generally amortized over the life of the debt using the straight-line method. See Note 11 — “Note Payable” to our consolidated financial statements under Item 8 of this Annual Report on Form 10-K.
On August 28, 2016 and October 1, 2016, Hurricanes Hermine and Matthew struck Florida. These were the first hurricanes to affect Florida since the 2004/2005 hurricane seasons. The impact to our 2016 net income was $13.4 million. Losses for Hurricanes Matthew and Hermine are estimated to be $18.8 million and $3 million, respectively, before tax. Our reinsurance coverage for the season could exceed $3.1 billion in total with up to $2 billion for a first event. Our Florida retention for our reinsurance coverage is $40 million. Thus, there were no recoveries from reinsurers related to the Hurricanes Hermine and Matthew in 2016.
On March 21, 2016, the Company acquired 100% of the outstanding stock of ZAC and its wholly-owned subsidiary, Zephyr, in exchange for approximately $110.3 million net of cash acquired. Zephyr is a specialty property insurance provider that offers policies for residential customers in Hawaii that cover the peril of windstorm losses caused by a hurricane. This acquisition furthers the Company’s strategic push to diversify business operations and achieve potential reinsurance synergies while expanding growth opportunities outside of Florida. The acquisition provides Heritage with an immediate presence in Hawaii with Zephyr holding approximately 30% of the wind-only market share in the state. The purchase price for the acquisition was approximately $134 million.
On September 14, 2015, the Company announced that the Board of Directors authorized a $20 million share repurchase program through December 31, 2016 under which purchases may be made from time to time in the open market, or through privately negotiated transactions, block transactions or other techniques, as determined by the Company’s management. On May 4, 2016, the Board of Directors authorized an additional stock repurchase of up to $50 million of the Company’s common stock through December 31, 2017. For the year ended December 31, 2016, the Company had purchased through open market or private transactions an aggregate of 1,759,330 shares at a total cost of $25.6 million and had available to purchase under the program $44.4 million.
On March 1, 2016, the Company’s Board of Directors declared a $0.05 per share quarterly cash dividends payable on April 5, 2016, to stockholders of record on March 15, 2016. On May 4, 2016, the Company announced the Board of Directors had declared a second quarter dividend of $0.06 per share to stockholders of record as of June 15, 2016. The dividend was paid on July 1, 2016. On August 1, 2016, the Company announced that its Board of Directors declared a third quarter dividend of $0.06 per common share. The dividend was paid on October 03, 2016. On November 8, 2016, the Company announced that its Board of Directors has declared a quarterly cash dividend on the Company’s common stock of $0.06 per share. The fourth quarter dividend of $0.06 per share was paid on January 4, 2017 to stockholders of record as of December 15, 2016. The declaration and payment of any future dividends will
2
be subject to the discretion of the Board of Directors and will depend on a variety of factors including the Company’s financial condition and results of operations.
In August 2015, the Company announced that it received its Certificate of Authority (“COA”) to write property and casualty insurance in the state of North Carolina, which marked the beginning of the Heritage P&C multi-state expansion. In 2016, Heritage P&C also received its COA in South Carolina, Georgia, Alabama and Mississippi. The Company currently actively writes business in Florida, Hawaii, North Carolina, South Carolina, and in 2017 began writing policies in Georgia.
In July 2015, the Company acquired substantially all of the assets of BRC, a Florida based provider of restoration services and emergency and recovery assistance. At closing, Company paid $6 million in cash and 79,850 shares of the Company’s common stock valued at $2 million.
Our Strategy
From our inception until December 31, 2015, a substantial portion of our new business was generated from policies we assumed from Citizens and Sunshine State Insurance Company (“SSIC”). The renewal of these assumed policies, new voluntary business, and renewals of voluntary policies and from our newly acquired Zephyr business comprises our revenue for 2016. We intend to continue to grow profitably by undertaking the following:
Mergers and Acquisitions and/or Making Strategic Investments
We successfully closed strategic acquisitions in each of 2014, 2015 and 2016. This includes the acquisition of substantially all of the assets of SVM and BRC, acquisition of the SSIC policies, and acquisition of the stock of ZAC. The acquisitions of SVM and BRC provided unique claims adjusting and repair resources to better serve our policyholders and better manage loss costs. At December 31, 2016, we had 19,680 SSIC policies in force with an annualized premium of $34.7 million. The acquisition of Zephyr provided an immediate presence in the state of Hawaii with approximately $58 million in annual voluntary premium and a strategic diversification to our platform as well as leveraged reinsurance synergies. We recently closed a private placement of senior secured notes, which provides net proceeds of over $70 million of resources to make strategic investments. These activities demonstrate our commitment and capability to successfully identify, finance, and execute mergers and acquisitions to effectively grow our business.
Expand to New Geographic Markets
Heritage P&C became authorized to write property business in Florida, North Carolina, South Carolina, Georgia, Alabama, and Mississippi and is actively writing in North Carolina and South Carolina. We intend to explore opportunities to enter other states where we can utilize our underwriting and claims expertise to attract and manage profitable business. We believe further increasing our geographic diversification is an important factor in reducing our potential risk of loss from any single catastrophic event, reducing our per policy reinsurance costs and providing an additional arena for future growth beyond our existing market. In addition, through our acquisition of Zephyr we acquired over 70,000 policies in the state of Hawaii. For example, we entered into a marketing agreement with National General Insurance Company and began writing homeowners insurance through their distribution network in early 2016 in the state of North Carolina.
Increase Our Premium in Force in Florida
We have significantly expanded our marketing efforts in Florida. We intend to increase the number of profitable voluntary personal lines policies through expansion of strategic relationships with our independent agent distribution network and other producers of personal lines property insurance in Florida. We currently write commercial residential business in the state of Florida only and we anticipate expansion of our commercial residential business in the state. We may also expand market share through strategic opportunities to acquire profitable business from private insurers. We do not anticipate continuing to assume policies from Citizens.
Optimize Our Reinsurance Program
We will continue to obtain what we believe to be the most appropriate levels and sources of reinsurance. We believe that the significant additional capital entering portions of the reinsurance market provides us with the opportunity to obtain favorable pricing and contract terms and conditions, including multi-year commitments, which comprise a significant portion of our 2016-2017 reinsurance program. For the 2014, 2015 and 2016 hurricane seasons, we entered into fully collateralized multi-year catastrophe reinsurance agreements funded through the issuance of a total of $727.5 million principal amount of catastrophe bonds, and we will continue evaluating such cost-efficient alternatives to traditional reinsurance. Additionally, we will continue to meet certain of our reinsurance needs through the use of our reinsurance subsidiary, Osprey, which helps to manage our reinsurance expense and reduces our reliance on third-party reinsurance.
3
Efficiently Manage Losses and Loss Adjustment Expenses
We are committed to proactively managing our losses and loss adjustment expenses through prudent underwriting performing critical aspects of claims adjusting through our employees, and the use of internal claims adjustment and repair services. In March 2014, we acquired the largest vendor in the CAN network, which we believe has allowed us to expand our in-house mitigation and restoration services. Additionally, the 2015 acquisition of assets of BRC provides us with additional resources and capabilities to perform restoration services in-house, as well as provide construction resources after a catastrophic event. We have additional contracted resources to adjust claims and mitigate losses which were deployed after Hurricanes Hermine and Matthew. The multitude of internal and external resources allowed us to deliver timely service to our policyholders and better manage claims costs
Effectively Manage the Bottom Line
In addition to our proactive efforts to manage losses and loss adjustment expenses, we will continue to be proactive with respect to technology to better serve our agents and policyholders, streamline our processes, manage systems implementation costs, and focus on efficiency.
Our Competitive Strengths
We believe that our growth to date and our ability to capitalize on our future growth prospects are a result of the following competitive strengths of our business:
Experienced Management Team With a Long History in the Residential Property Insurance Market
We have a deep and experienced executive management team led by Bruce Lucas, Chairman and Chief Executive Officer, Richard Widdicombe, President, Steven Martindale, Chief Financial Officer, and Ernesto Garateix, Chief Operating Officer. Our senior management team includes twelve insurance professionals, which averages 30 years of insurance industry experience, has extensive experience in the personal and commercial residential insurance market, particularly in Florida, has built longstanding relationships with key participants in the insurance industry and is supported by a group of highly qualified individuals with industry expertise, including a Chief Actuary with more than 37 years of industry experience.
Strong, Conservative Capital Structure
As of December 31, 2016, we had stockholders’ equity of $358 million. As of December 31, 2016, Heritage P&C and Zephyr had policyholder surplus, as defined by statutory accounting principles, of $200 million and $76 million, respectively. We believe that these levels of surplus places us among the best capitalized insurance companies focusing primarily on the Florida personal residential insurance market and the Hawaii wind-only residential market and is in excess of the minimum capital levels required by our insurance regulators and Demotech for similarly rated in-state insurance companies.
Selective Underwriting and Policy Acquisition Criteria
We believe our proprietary data analytics capabilities and underwriting processes has allowed us to better select the insurance policies we assumed from the Citizens depopulation program, leading to strong profitability and reduced risk. These analytics and underwriting processes also contribute to successful underwriting of our voluntary business. Our data analytics are embedded in the underwriting process and are used for strategic expansion into new product lines and states. We choose to minimize our exposure to or avoid certain types of coverage if we believe there is significant risk of loss, including coverage for sink-hole related losses in high-risk areas.
Unique Claims Servicing Model and Superior Customer Service
We believe that the vertical integration of our claims adjustment, water mitigation, and repair services provides us with a competitive advantage. Through our management of both claims adjusting and repair services, we are generally able to begin the adjustment and mitigation process much earlier than most competitors, thus reducing our loss adjustment expenses and ultimate loss payouts. A significant number of our repair technicians are participating in training and certification programs to become licensed claims adjusters (ten are licensed), allowing us to capture additional efficiencies. We also believe our unique model provides a superior level of customer service for our policyholders, enhancing our reputation and increasing the likelihood that our policyholders will renew their policies with us.
4
Relationships with Highly Rated Reinsurers
We manage our exposure to catastrophic events through, among other things, the purchase of reinsurance. Our relationships with highly rated reinsurers have been developed as a result of our management team’s industry experience and reputation for selective underwriting. Our financial strength, underwriting results and the long-term relationships between our management team and our reinsurance partners help improve the cost-effectiveness of our reinsurance program.
Relationships with Independent Agents and National Underwriters
We have developed relationships with a network of approximately 1,900 independent insurance agents. We believe we have been able to build this network due to our reputation for financial stability, commitment to our markets and integrity in the underwriting and claims process. We have entered into strategic relationships with national insurers and agencies that no longer write substantial personal residential insurance in some of the states in which we do business, which provides us access to their network of agents.
Our Competition
The market for residential property insurance is highly competitive in many of the states in which we do business. We compete to varying degrees with insurers including large national carriers, state-sponsored homeowners’ insurance entities, and single state or regional carriers. We believe Heritage differentiates itself from many competitors with our service levels, financial resources, streamlined processes, and vertical integration which provides loss mitigation and repair services.
Products and Distribution
We market and write personal lines voluntary policies through a network of approximately 1,900 independent agents. We intend to pursue additional voluntary business from agents in our existing independent agent network, expand our independent agent network and seek additional opportunities to use insurer-affiliated agents to offer our personal residential policies in the states in which we are licensed. We had 150,998 voluntary personal residential policies (47.3% of our total policies in force) as of December 31, 2016. Our growth strategy centers on the voluntary market as well as opportunistic acquisitions.
We currently write commercial residential business only in the state of Florida. We market and write commercial residential voluntary policies through a network of approximately 400 independent agents. We intend to pursue additional voluntary business from these agents in our existing independent agent network, expand our independent agent network and seek additional opportunities to increase our commercial residential policies in Florida. We started writing voluntary policies in October 2014. At December 31, 2016, we had 1,714 voluntary policies. The commercial voluntary market is a major component of our corporate growth strategy. At December 31, 2016 and 2015, commercial business represented 18.7% and 19.2%, respectively, of the premium in force.
In order to limit our potential exposure to individual risks and catastrophic events, we purchase significant reinsurance from third party reinsurers. Purchasing reinsurance is an important part of our risk strategy, and premiums paid (or ceded) to reinsurers is one of our largest costs. We have strong relationships with reinsurers which we believe are a result of our management’s industry experience and reputation for selective underwriting and effective claim management. For each of the twelve months beginning June 1, 2015 and 2016, we purchased catastrophe reinsurance from the following sources: (i) the Florida Hurricane Catastrophe Fund, a state-mandated catastrophe fund (“FHCF”), (ii) private reinsurers, all of which were rated “A-” or higher by A.M. Best Company, Inc. (“A.M. Best”) or Standard & Poor’s Financial Services LLC (“S&P”) or were fully collateralized, (iii) sponsorship of multiple catastrophe bonds that provide $728 million of principal limit that can be drawn upon over a three year period, and (iv) our wholly-owned reinsurance subsidiary, Osprey. In addition to purchasing catastrophe reinsurance, we also purchased property risk reinsurance which limits our net exposure in the event of a severe non-catastrophe loss impacting a single location or risk to $1 million. We also utilize facultative reinsurance to supplement our per risk reinsurance program where our capacity needs dictate. See “-Reinsurance – 2016 – 2017 Catastrophe Reinsurance Program”.
Our insurance regulators requires all insurance companies, like us, to have a certain amount of capital reserves and reinsurance coverage in order to cover losses upon the occurrence of a catastrophic event. Our reinsurance programs for each of the twelve months beginning June 1, 2015 and 2016 provides reinsurance in excess of regulatory requirements, which are based on the probable maximum loss that we would incur from an individual catastrophic event estimated to occur once every 100 years based on our portfolio of insured risks. We also purchase reinsurance coverage to protect against the potential for multiple catastrophic events occurring in the same year.
We test the sufficiency of our reinsurance program by subjecting our personal and commercial residential exposures to statistical testing using the AIR U.S. Hurricane Model, which replicates the most severe hurricanes to have occurred historically in states in which we conduct business, individual storms of severity in excess of such historical levels, and the historical calendar years
5
in which the most severe multiple catastrophic events have occurred. For example, the 2004 calendar year, in which four large catastrophic hurricanes made landfall in Florida, is considered to be the worst catastrophic year in Florida’s recorded history. Assuming the reoccurrence of the 2004 calendar year events, the probable after tax net loss to us in 2016, based on the coverage for our 2016-2017 reinsurance program, would be $40.3 million (after tax, net of all reinsurance recoveries and including our retention through Osprey). This loss would have represented 11.3% of our stockholders’ equity at December 31, 2016.
While a significant hurricane has not made landfall in Hawaii since 1992, Hurricane Iniki caused a combined estimated property damage of over $1.8 billion. Assuming the reoccurrence of Hurricane Iniki, the probable after tax net loss to us in 2016, based on the coverage for our 2016-2017 reinsurance program, would be $19.5 million (after tax, net of all reinsurance recoveries and including our retention through Osprey). This loss would have represented 5.4% of our stockholders’ equity at December 31, 2016.
We closely manage all aspects of our claims adjustment process. Claims are initially reviewed by our managers and staff adjusters, who determine the extent of the loss and the resources needed to adjust each claim. In the case of a catastrophic event, we have contracted with multiple large national claims adjusting firms to assist our adjusters with the increased volume of claims and ensure timely responses to our policyholders. In March 2014, we completed the acquisition of the assets and personnel of our main water mitigation services vendor and created our wholly-owned subsidiary, CAN. This acquisition has allowed us to better service our Florida based customers and expand our mitigation and restoration services. We utilize CAN to manage mitigation and restoration services for our customers. CAN primarily handles water damage-related claims, which comprised approximately 48.7% of our losses and loss adjustment expenses through December 31, 2016. We also leverage our 2015 acquisition, BRC, to manage and provide restoration services to CAN customers for all types of claims. BRC has provided services for non-insurance related projects but we expect to shift toward BRC handling only affiliated insurance claims. We believe our approach to claims handling results in a higher level of customer service and reduces our losses and loss adjustment expenses.
Our Market
Nearly 90% of our premium in force is generated from properties located in the State of Florida. According to the U.S. Census Bureau, at July 1, 2016, Florida was the third largest U.S. state with an estimated population of approximately 21 million people. The University of Florida Bureau of Economic and Business Research estimates that Florida is expected to reach a population of approximately 26 million people by 2040, an increase of 30% from 2015. Property ownership and development represent key drivers of the Florida economy.
The states in which we do business are exposed to an increased risk of hurricanes during the entire six months of the Atlantic and Pacific hurricane season, which spans from June 1 through November 30. Florida experienced two hurricanes in 2016. Eight hurricanes in 2004 and 2005, including Hurricanes Charley, Katrina, Rita and Wilma, caused a combined estimated property damage of over $110 billion, a significant portion of which occurred in Florida. While a significant hurricane has not made landfall in Hawaii since 1992, when Hurricane Iniki caused a combined estimated property damage of over $1.8 billion. As a result, personal residential insurance and claims servicing are vitally important to our policyholders.
According to data compiled by the Florida Office of Insurance Regulations (“FLOIR”), which excludes State Farm Florida Insurance Company, Citizens was the largest residential insurance carrier in Florida as of September 30, 2016, with a market share of approximately 9.1% based on total in force direct premiums written for personal and commercial residential insurance. As of the same date, we ranked third in Florida within this market, with a market share of approximately 5.8%. Through December 31, 2015, 100% of our business was generated in Florida and our growth was largely through our depopulation efforts. We assumed approximately 12,000 policies from Citizens in 2016 with the last assumption in May 2016. Assuming further access to capital and reinsurance support, we believe we have the opportunity to significantly expand the size of our voluntary personal and commercial residential insurance business. In 2016, we expanded Heritage P&C’s certificate of authority to write property and casualty insurance in the states of North Carolina, South Carolina, and in Georgia in 2017. Our acquisition of Zephyr adds approximately 70,000 policies to the Company. In recent years, the property and casualty insurance market has experienced a substantial increase in the availability of property catastrophe reinsurance resulting from the increased supply of capital from non-traditional insurance providers, including private capital and hedge funds. This increased capital supply, has reduced the cost of property catastrophe reinsurance, directly benefitting purchasers of this reinsurance, including us.
Underwriting
Our underwriters evaluate and accept only those risks that they believe will enable us to achieve an underwriting profit. In order to achieve underwriting profitability on a consistent basis, we focus on (1) the suitability of the risk to be assumed or written, (2) the adequacy of the premium with regard to the risk to be assumed or written and (3) the geographic distribution of existing policies for our business.
6
All of our personal lines underwriting is performed internally with our experienced staff in Florida and Hawaii. Our underwriters use our proprietary data analytics capabilities, which include a number of automated processes, to analyze a number of risk evaluation factors, including the age, construction, location and value of the residence and the premiums to be received from insuring the residence. New technological advances in computer generated geographical mapping afford us an enhanced perspective as to geographic concentrations of policyholders. When considering the geographic distribution of existing policies, our underwriters may consider the number of other properties we insure within the same region, county, city and zip code. We also consider the cost of reinsurance when assessing the adequacy of the premium with regard to the risk to be assumed or written. The underwriting criteria that we consider will continue to evolve as our business grows and expands.
We also review our expiring policies to determine whether those risks continue to meet our underwriting guidelines. If a given policy no longer meets our underwriting guidelines, we will take appropriate action regarding that policy, including raising premium rates or, to the extent permitted by applicable law and our assumption agreements with Citizens, not offering to renew the policy.
Policy Administration
We have engaged West Point Underwriters, Inc. and Majesco Mastec, providers of web-based software solutions and insurance personnel, to provide us with policy administration services for our business, including processing, billing and policy maintenance. The software is able to adapt to a variety of forms and rates, handle the administration of an increasing number of policies as our Company grows and expands, and provide detailed information about our book of business to our internal underwriters so that they can adjust our underwriting criteria as necessary. The software provides us with daily updates regarding the insurance policies that we have issued. The systems also allow us to provide renewal notices, late payment notices, cancellation notices, endorsements and policies to our policyholders in a timely fashion.
Claims Administration
We closely manage all aspects of the claims process, from processing the initial filing to providing remediation services for Florida claims through our wholly-owned subsidiary, CAN. When a policyholder contacts us to report a claim, members of our claims department create a claim file and aggregate the appropriate supporting documentation. Claims are then reviewed by our managers and staff adjusters, who assess the extent of the loss, including through on-site investigations, and determine the resources needed to adjust each claim. Our claims are generally adjusted by our staff claims professionals, except in the case of a catastrophic event for which we have contracted with several large national claims adjusting firms to assist our adjusters with the increased volume of claims and ensure timely responses to our policyholders. We currently leverage our CAN vendor network to provide repair and remediation services to Florida policyholders; this model could be expanded to other states
We perform or supervise the services rendered to our policyholders at all stages of the claims process, which we believe allows us to reduce cost and provide a high level of customer service to our policyholders. We have in-house resources as well as outsourced vendor relationships for water mitigation and rebuilding after a loss for our Florida policyholders. We have outsourced vendor relationships to provide these services to our policyholders outside of Florida. To encourage our Florida policyholders to allow us to manage their claims from beginning to end, we developed our Platinum Program. Under the Platinum Program, participating customers receive a 10% discount on their claim deductible, and we obtain control over inspection, claims adjusting and repair services, with the repair services being managed by either CAN or one of our contracted vendors. In March 2014, we acquired the largest vendor in the CAN network, which has allowed us to expand our in-house mitigation and restoration services. In August 2015, we acquired BRC to allow us to further expand our restoration services. These resources help to mitigate some of the impact of Assignment of Benefit challenges primarily found in South Florida.
Citizens Assumption Transactions
As of December 31, 2016, we have selectively assumed, net of cancellations, an aggregate of approximately 230,000 policies through participation in the Citizens depopulation program. Citizens generally offers depopulations on a monthly basis. From December 2012 through May 2016, we participated in 27 depopulations. Given the current population of policies written by Citizens, we do not anticipate participating in the depopulation program for the foreseeable future.
In order to be eligible to participate in an assumption transaction, we first apply to FLOIR for approval to assume a specified number of policies. On the effective date of assumption transactions, Citizens transfers to us the unearned premiums for the policies that have not opted out of the assumption transaction. A policyholder may also opt-out during the 30-day period following the effective date of the assumption transaction. If a policyholder opts-out during such period, we return the applicable unearned premiums to Citizens.
Under the terms of our typical assumption agreement with Citizens, we assume all liability and obligation for losses under the assumed policies arising on or after the effective date of the assumption transaction, and we directly service all policyholder claims
7
related to such losses. All terms and conditions of the assumed policies, including coverage and rates, remain unchanged for the remainder of the policy term. Citizens remains liable for all losses under the assumed policies arising prior to the effective date of the assumption transaction and is solely responsible for servicing all policyholder claims related to such losses.
We strive to retain these policies by offering competitive rates and efficient claims handling to our policyholders. In 2016, we renewed approximately 84% and 78% of the personal lines and commercial lines policies we assumed from Citizens, respectively.
Liability For Losses and Loss Adjustment Expenses
Our liability for losses and loss adjustment expenses represents our preliminary estimated lability of (i) claims that have been incurred, but not yet paid (case reserves), (ii) claims that have been incurred but not yet reported to us (“IBNR”), and (iii) loss adjustment expenses (“LAE”) which are intended to cover the ultimate cost of settling claims, including investigation and defense of lawsuits resulting from such claims.
Considerable time can pass between the occurrence of an insured loss, the reporting of the loss and the payment of that loss. Our liability for losses and LAE, which we believe represents the best estimate at a given point in time based on facts, circumstances and historical trends then known, may necessarily be adjusted to reflect additional facts that become available during the loss settlement period. We continually review and adjust our estimated losses as necessary based on industry development trends, evolving claims experience and new information obtained.
For a discussion and summary of the activity in the liability for losses and LAE for the years ended December 31, 2016, 2015 and 2014, see Note 10 — “Reserve for Unpaid Losses” to our consolidated financial statements under Item 8 of this Annual Report on Form 10-K.
Loss Development
Our liability for losses and loss adjustment expenses (“LAE”) represents estimated costs ultimately required to settle all claims for a given period. The following table illustrates development of the estimated liability for losses and LAE as of December 31 for the years 2012 (inception) through 2016 (in thousands):
|
|
|
For the Years Ended December 31, |
|
|||||||||||||||||
|
|
|
2012 |
|
|
2013 |
|
|
2014 |
|
|
2015 |
|
|
2016 |
|
|||||
|
Original liability for losses and LAE1 |
|
$ |
1,243 |
|
|
$ |
19,344 |
|
|
$ |
51,469 |
|
|
$ |
83,722 |
|
|
$ |
140,137 |
|
|
Re-estimated losses and LAE2 as of: |
|
|
|
|
|
|
|
|
|
|
|
|
|
|
|
|
|
|
|
|
|
1 year later |
|
$ |
798 |
|
|
$ |
19,121 |
|
|
$ |
46,184 |
|
|
$ |
102,512 |
|
|
$ |
— |
|
|
2 years later |
|
$ |
757 |
|
|
$ |
16,846 |
|
|
$ |
46,324 |
|
|
$ |
— |
|
|
$ |
— |
|
|
3 years later |
|
$ |
784 |
|
|
$ |
16,740 |
|
|
$ |
— |
|
|
$ |
— |
|
|
$ |
— |
|
|
4 years later |
|
$ |
797 |
|
|
$ |
— |
|
|
$ |
— |
|
|
$ |
— |
|
|
$ |
— |
|
|
Cumulative redundancy (deficiency) 3 |
|
$ |
446 |
|
|
$ |
2,604 |
|
|
$ |
5,145 |
|
|
$ |
(18,790 |
) |
|
$ |
— |
|
|
Cumulative amount of liability paid as of: |
|
|
|
|
|
|
|
|
|
|
|
|
|
|
|
|
|
|
|
|
|
1 year later |
|
$ |
548 |
|
|
$ |
12,052 |
|
|
$ |
27,265 |
|
|
$ |
65,065 |
|
|
$ |
— |
|
|
2 years later |
|
$ |
627 |
|
|
$ |
13,472 |
|
|
$ |
37,236 |
|
|
$ |
— |
|
|
$ |
— |
|
|
3 years later |
|
$ |
689 |
|
|
$ |
14,946 |
|
|
$ |
— |
|
|
$ |
— |
|
|
$ |
— |
|
|
4 years later |
|
$ |
766 |
|
|
$ |
— |
|
|
$ |
— |
|
|
$ |
— |
|
|
$ |
— |
|
|
Gross premiums earned |
|
$ |
6,055 |
|
|
$ |
139,959 |
|
|
$ |
311,514 |
|
|
$ |
524,740 |
|
|
$ |
640,518 |
|
|
(1) |
Represents management’s original best estimated liability of (i) unpaid claims, (ii) incurred but not reported (“IBNR”) and (iii) loss adjustment expenses (“LAE”). |
|
(2) |
Represents the re-estimated liabilities in later years of unpaid claims, IBNR and loss adjustment expenses in the respective years. |
|
(3) |
Represents the difference between the latest re-estimate and the original estimate. A redundancy means the original estimate is higher than the current estimate whereas a deficiency means that the original estimate is lower than the current estimate. |
8
Our business depends upon the use, development and implementation of integrated technology systems. These systems enable us to provide a high level of service to agents and policyholders by processing business efficiently, communicating and sharing data with agents, providing a variety of methods for the payment of premiums and allowing for the accumulation and analysis of information for our management. We believe the availability and use of these technology systems has resulted in improved service to agents and customers, increased efficiencies in processing our multi-state insurance business and lower operating costs.
We also license software from third parties, including West Point Underwriters, Majesco Mastec and AIR Worldwide, Inc. (“AIR”). AIR’s catastrophe modeling software enables us to optimize our insurance portfolio to manage our reinsurance costs. We also own or license other technology systems used by our insurance company affiliates. These technology systems consist primarily of an integrated central processing computer, a series of server-based computer networks, a back-up server and various Internet-based communications systems.
Reinsurance
In order to limit our potential exposure to catastrophic events, we purchase significant reinsurance from third party reinsurers and sponsor catastrophe bonds (Citrus Re). We also purchase property per risk reinsurance and facultative coverage for non-catastrophe related to losses in excess of $1 million. Purchasing reinsurance is an important part of our risk strategy, and premiums paid (or ceded) to reinsurers is one of our largest cost components. Reinsurance involves transferring, or “ceding”, a portion of the risk exposure on policies we write to another insurer, known as a reinsurer. To the extent that our reinsurers are unable to meet the obligations they assume under our reinsurance agreements, we remain liable for the entire insured loss. See in Part I, Item 1A “Risk Factors”. We may not be able to collect reinsurance amounts due to us from the reinsurers with which we have contracted.
Our reinsurance agreements are short-term, prospective contracts. We record an asset, prepaid reinsurance premiums, and a liability, reinsurance payable, for the entire contract amount upon commencement of our new reinsurance agreements. We amortize our reinsurance premiums over the 12-month contract period, which is June 1 through May 31.
In the event that we incur losses and loss adjustment expenses recoverable under our reinsurance program, we record amounts recoverable from our reinsurers on paid losses plus an estimate of amounts recoverable on unpaid losses. The estimate of amounts recoverable on unpaid losses is a function of our liability for unpaid losses associated with the reinsured policies; therefore, the amount changes in conjunction with any changes to our estimate of unpaid losses. As a result, a reasonable possibility exists that an estimated recovery may change significantly in the near term from the amounts included in our consolidated financial statements.
Our insurance regulators requires all insurance companies, like us, to have a certain amount of capital and reinsurance coverage in order to cover losses and loss adjustment expenses upon the occurrence of a catastrophic event. Our 2016-2017 reinsurance program provides reinsurance in excess of our state regulator requirements, which are based on the probable maximum loss that we would incur from an individual catastrophic event estimated to occur once in every 100 years based on our portfolio of insured risks. The nature, severity and location of the event giving rise to such a probable maximum loss differs for each insurer depending on the insurer’s portfolio of insured risks, including, among other things, the geographic concentration of insured value within such portfolio. As a result, a particular catastrophic event could be a one-in-100 year loss event for one insurance company while having a greater or lesser probability of occurrence for another insurance company. We also purchase reinsurance coverage to protect against the potential for multiple catastrophic events occurring in the same year.
2016 - 2017 Reinsurance Program
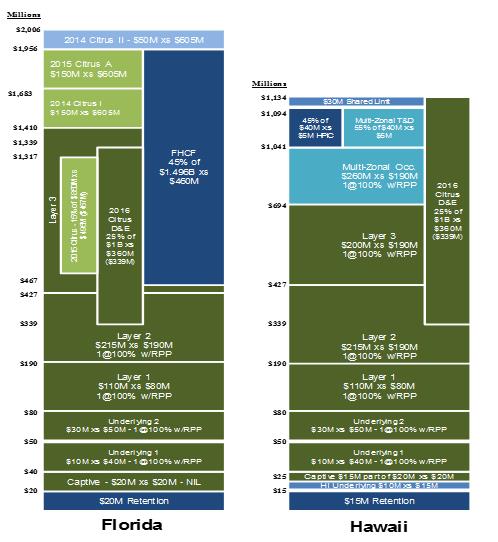
The Company placed its reinsurance program for the period from June 1, 2016 through May 31, 2017 during the second quarter of 2016. This reinsurance program incorporates the catastrophe risk of our two insurance subsidiaries, Heritage P&C, a Florida based insurer and Zephyr, a Hawaii based insurer, into one reinsurance structure. The programs are incorporated into one reinsurance structure and are allocated amongst traditional reinsurers, catastrophe bonds issued by Citrus Re Ltd., a Bermuda special purpose insurer formed in 2014 (“Citrus Re”), and the Florida Hurricane Catastrophe Fund (“FHCF”). Coverage is shared by both insurers unless otherwise noted. The 2016-2017 reinsurance program provides, including retention, first event coverage up to $1.9 billion in Florida, first event coverage up to $1.1 billion in Hawaii, and multiple event coverage up to $3 billion.
The reinsurance program, which is segmented into layers of coverage, protects the Company for excess property catastrophe losses and loss adjustment expenses. The Company’s 2016-2017 reinsurance program incorporates the mandatory coverage required by law to be placed with FHCF, which is available only for Florida catastrophe risk. For the 2016 hurricane season, the Company reduced its selected participation percentage in the FHCF from 75% to 45%. The Company also purchased private reinsurance below, alongside and above the FHCF layer, as well as aggregate reinsurance coverage. The following describes the various layers of the Company’s June 1, 2016 to May 31, 2017 reinsurance program.
9
|
|
event strikes Hawaii, the Company has a primary retention of the first $30 million of losses and loss adjustment expenses, of which Osprey is responsible for $15 million. If a second catastrophic event strikes Florida, Heritage P&C’s primary retention decreases to $15 million and the remainder of the losses are ceded to third parties. If a second event strikes Hawaii, Zephyr’s primary retention decreases to $5 million. In the second event only for a loss exceeding $190 million, there is an additional Company co-participation of 5.4% subject to a maximum co-participation of $11.6 million. Heritage P&C and Zephyr each have a $5 million primary retention for events beyond the second catastrophic event. Osprey has no primary retention beyond the first catastrophic event in Florida or Hawaii. Additionally, Osprey is responsible for payment of up to $5.3 million of reinstatement premium, depending on the amount of losses incurred. |
|
|
• |
Shared Layers above retention and below FHCF. Immediately above the retention, the Company has purchased $374 million of reinsurance from third party reinsurers. Through the payment of a reinstatement premium, the Company is able to reinstate the full amount of this reinsurance one time. To the extent that $374 million or a portion thereof is exhausted in a first catastrophic event, the Company has purchased reinstatement premium protection insurance to pay the required premium necessary for the reinstatement of this coverage. |
|
|
• |
FHCF Layer. The Company’s FHCF program provides coverage for Florida events only and includes an estimated maximum provisional limit of 45% of $1.5 billion, in excess of its retention of $460 million. The limit and retention of the FHCF coverage is subject to upward or downward adjustment based on, among other things, submitted exposures to FHCF by all participants. The Company has purchased coverage alongside from third party reinsurers and through reinsurance agreements with Citrus Re. To the extent the FHCF coverage is adjusted, this private reinsurance with third party reinsurers and Citrus Re will adjust to fill in any gaps in coverage up to the reinsurers’ aggregate limits for this layer. The FHCF coverage cannot be reinstated once exhausted, but it does provide coverage for multiple events. |
|
|
• |
Layers alongside the FHCF. The Florida reinsurance program includes third party layers alongside the FHCF. These include 2015 C and 2015 B series catastrophe bonds, which cover Florida only for the 2016 season, and 2016 D and 2016 E catastrophe bond series issued by Citrus Re, which total $377.5 million of coverage, as discussed below, as well as a traditional reinsurance layer providing $200 million of coverage. Through a reinstatement, the Company is able to reinstate the full amount of the $200 million of reinsurance one time. These 2016 catastrophe bonds and the traditional reinsurance layer provide coverage for both Florida and Hawaii catastrophe losses. |
|
|
• |
2016 Class D and E Notes: During February 2016, Heritage P&C and Zephyr entered into two catastrophe reinsurance agreements with Citrus Re. The agreements provide for three years of coverage from catastrophic losses caused by named storms, including hurricanes, beginning on June 1, 2016. Heritage P&C and Zephyr pay a periodic premium to Citrus Re during this three-year risk period. Citrus Re issued an aggregate of $250 million of principal-at-risk variable notes due February 2019 to fund the reinsurance trust account and its obligations to Heritage P&C and Zephyr under the reinsurance agreements. The Class D notes provide $150 million of coverage and the Class E notes provide $100 million of coverage. The Class D and Class E notes provide reinsurance coverage for a sliver of the catastrophe coverage that had previously been provided by the FHCF. The limit of coverage is fully collateralized by a reinsurance trust account for the benefit of Heritage P&C and Zephyr. The maturity date of the notes may be extended up to two additional years to satisfy claims for catastrophic events occurring during the three-year term of the reinsurance agreements. |
10
Layers above the FHCF - Florida program
|
|
• |
2015 Class A Notes: During April 2015, Heritage P&C entered into catastrophe reinsurance agreements with Citrus Re. The 2015 notes do not provide coverage for Zephyr for the 2016 hurricane season. The agreements provide for three years of coverage from catastrophic losses caused by named storms, including hurricanes, beginning on June 1, 2015. Heritage P&C pays a periodic premium to Citrus Re during this three-year risk period. Citrus Re issued principal-at-risk variable notes due April 2018 to fund the reinsurance trust account and its obligations to Heritage P&C under the reinsurance agreements. The Class A notes provide $150 million of coverage for a layer above the FHCF. The limit of coverage is fully collateralized by a reinsurance trust account for the benefit of Heritage P&C. The maturity date of the notes may be extended up to two additional years to satisfy claims for catastrophic events occurring during the three-year term of the reinsurance agreements. |
|
|
• |
2014 Class A Notes: Coverage immediately below and above the 2015 Class A notes is provided by the 2014 reinsurance agreements entered into with Citrus Re. The first contract with Citrus Re provides $150 million of coverage immediately below 2015 Class A, and the second contract provides an additional $50 million of coverage which sits immediately above 2015 Class A. During April 2014, Heritage P&C entered into two catastrophe reinsurance agreements with Citrus Re. The 2014 notes do not provide coverage for Zephyr for the 2016 hurricane season. The agreements provide for three years of coverage from catastrophe losses caused by certain named storms, including hurricanes, beginning on June 1, 2014. The limit of coverage of $200 million is fully collateralized by a reinsurance trust account for the benefit of Heritage P&C. Heritage P&C pays a periodic premium to Citrus Re during this three-year risk period. Citrus Re issued $200 million of principal-at-risk variable notes due April 2017 to fund the reinsurance trust account and its obligations to Heritage P&C under the reinsurance agreements. The maturity date of the notes may be extended up to two additional years to satisfy claims for catastrophic events occurring during the three-year term of the reinsurance agreements. |
|
|
• |
Multi-Zonal Layers – The Company purchased additional layers which provide coverage for Florida for a second event and both first and second event coverage for Hawaii. The first event coverage for Hawaii is a counterpart to the Florida-only catastrophe bond layers and FHCF layer. There is a total of $282 million of reinsurance coverage purchased on this basis, with $260 million having a prepaid reinstatement. The multi-zonal occurrence layer provides first and second event coverage of $260 million for Hawaii and second event coverage of $260 million for Florida. A top and drop multi-zonal layer provides first and subsequent event coverage of $22 million for Hawaii and second or subsequent event coverage of $22 million for Florida. |
|
|
• |
Aggregate Coverage. In addition to what is described above, much of the reinsurance is structured in a way to provide aggregate coverage. $682 million of limit is structured on this basis. To the extent that this coverage is not fully exhausted in the first catastrophic event, it provides coverage commencing at its reduced retention for second and subsequent events where underlying coverage has been previously exhausted. $460 million has a reinstatement, which is prepaid. |
For a first catastrophic event striking Florida, our reinsurance program provides coverage for $2 billion of losses and loss adjustment expenses, including our retention, and we are responsible for all losses and loss adjustment expenses in excess of such amount. For a first catastrophic event striking Hawaii, our reinsurance program provides coverage for $1.1 billion of losses and loss adjustment expenses, including our retention, and we are responsible for all losses and loss adjustment expenses in excess of such amount. For subsequent catastrophic events, our total available coverage depends on the magnitude of the first event, as we may have coverage remaining from layers that were not previously fully exhausted. $860 million of limit purchased in 2016 includes a reinstatement, with $825 million being prepaid. In total, we have purchased $3.1 billion of potential reinsurance coverage, including our retention, for multiple catastrophic events. Our ability to access this coverage, however, will be subject to the severity and frequency of such events. Hurricane losses in North Carolina and South Carolina would be covered under the Florida program with
11
the exception of the FHCF and the series 2014 and 2015 CAT bonds. Management deemed this reinsurance protection to be sufficient given the level of catastrophe exposure in 2016 for North Carolina and South Carolina.
In placing our 2016-2017 reinsurance program, we sought to capitalize on favorable reinsurance pricing and mitigate uncertainty surrounding the future cost of our reinsurance by negotiating multi-year arrangements. The $727.5 million of aggregate coverage we have purchased from Citrus Re Ltd, which includes the 2014 Class A & B notes, the 2015 Class A, B, and C notes, and the 2016 Class D & E notes extends $200 million until May of 2017, $277.5 million for another two-year period and $250 million for a three-year period. To the extent coverage is all or partially exhausted before the end of three years, it cannot be reinstated. In the aggregate, multi-year coverage from Citrus Re Ltd accounts for approximately 42% of our purchases of private reinsurance for the 2016 hurricane season. The terms of each of the multi-year coverage arrangements described above are subject to adjustment depending on, among other things, the size and composition of our portfolio of insured risks in future periods.
Assuming the reoccurrence of Hurricane Andrew, which is considered to be the most catastrophic single event in Florida’s recorded history, the probable maximum net loss to us in 2016, assuming the reinsurance coverage described above, would be $24.8 million (after tax, net of all reinsurance recoveries and including our retention through Osprey). This loss would have represented 6.9% of our stockholders’ equity at December 31, 2016. We estimate that, based on our portfolio of insured risks as of August 31, 2016, Hurricane Andrew would have represented a catastrophic event likely to occur approximately once every 49 years and would have exhausted approximately 56.6% of our first event expected reinsurance coverage.
For the twelve months ending May 31, 2017, we purchased reinsurance from the following sources: (i) FHCF, (ii) Citrus Re Ltd, (iii) 23 third-party private reinsurers, all of which were rated “A-” or higher by A.M. Best or S&P and (iv) our wholly-owned reinsurance subsidiary, Osprey. Allianz Global Corporate & Specialty SE provides approximately 38% of our third-party reinsurance program, including Citrus Re catastrophe bonds. The chart below lists our third-party reinsurers with A.M. Best and S&P ratings:
12
|
AM Best |
S&P |
|
|
Aeolus Re Ltd |
Fully Collateralized |
|
|
American Standard Insurance Company of Wisconsin |
A |
NR |
|
Amlin AG (Bermuda Branch) |
A |
A |
|
Aquilo/CatCo |
Fronted by AM Best "A+" Paper |
|
|
Aspen Re |
A |
A |
|
Axis Specialty Limited |
A+ |
A+ |
|
Chubb Tempest1 |
A++ |
AA |
|
Cincinnati Re |
A+ |
A+ |
|
Citrus Re |
Fully Collateralized |
|
|
Coriolis Capital (obo Horseshoe Re) |
Fully Collateralized |
|
|
DaVinci Re |
A |
AA- |
|
Everest Reinsurance Company |
A+ |
A+ |
|
Fermat Capital Management, LLC |
Fully Collateralized |
|
|
Fidelis Insurance Bermuda Limited |
A- |
NR |
|
General Insurance Corporation of India |
A- |
NR |
|
Hannover Re (Bermuda) Ltd |
A+ |
AA- |
|
Hiscox Insurance Co (Bermuda) Limited |
A |
A |
|
Insurance Company of the West |
A- |
NR |
|
ILS Capital |
Fully Collateralized |
|
|
Lancashire Insurance Company Limited |
A |
A- |
|
Lloyd's |
A |
A |
|
Markel Bermuda Limited |
A |
A |
|
Nephila Capital Ltd |
Fully Collateralized |
|
|
New India |
A- |
NR |
|
Odyssey Reinsurance Company |
A |
A- |
|
Osprey Re |
Fully Collateralized |
|
|
Partner Reinsurance Co Ltd |
A |
A+ |
|
Pillar Capital |
Fully Collateralized |
|
|
Qatar Reinsurance Company Limited |
A |
A |
|
Renaissance Reinsurance Limited |
A+ |
AA- |
|
Satec |
Fronted by AM Best "A+" Paper |
|
|
Securis |
Fully Collateralized |
|
|
Swiss Reinsurance America Corporation |
A+ |
AA- |
|
Taiping Reinsurance Co, Ltd. |
A |
A |
|
Tokio Millennium Re AG |
A++ |
A+ |
|
Transatlantic Reinsurance Company |
A |
A+ |
|
XL Catlin |
A |
A+ |
Investments
Our investments are managed by seven third-party asset managers. We have designed our investment policy to provide a balance between current yield, conservation of capital and the liquidity requirements of our operations. As such, our investable assets are primarily held in cash and bonds with relatively short durations. Our investment policy sets guidelines that provide for a well-diversified investment portfolio that is compliant with Florida and Hawaii statutes that emphasizes quality and preservation of capital. The policy limits investments in common and preferred stocks to 15% of each of our insurance company affiliates’ admitted assets, with no more than 10% in either class. Our bond portfolio must have a minimum weighted average portfolio quality of A, with only $1 million invested in below investment grade bonds. No more than 2% of admitted assets can be invested in any one issuer, excluding government-related securities. Investments in commercial mortgages cannot exceed 10% of admitted assets. Prohibited investments include short sales and margin purchases, oil, gas, mineral or other types of leases, speculative uses of futures and options, unrated corporate securities, non-US denominated securities, convertible securities high risk CMO instruments, repurchase agreements, securities lending transactions and speculative foreign currency valuation transactions. Our investment policy, which may change from time to time, is approved by our Investment Committee and is reviewed on a regular basis in order to ensure that our investment policy evolves in response to changes in the financial market. See Note 3 to our consolidated financial statements for the year ended December 31, 2016 included elsewhere in this Annual Report.
As of December 31, 2016, we held $105.8 million in cash and cash equivalents and $603 million in securities, which were comprised of $571 million in bonds, $14.5 million in preferred stocks and $17.5 million in common stock.
Government Regulation
The insurance industry is extensively regulated. Our insurance company subsidiaries are subject to the laws and regulations of the states in which they do business. The insurance regulatory statutes and rules provide for regulation of virtually all aspects of the business of insurance companies. The states in which we conduct business, like many states, have adopted several model laws and
13
regulations as promulgated by the NAIC. State statutes and administrative rules generally require each insurance company that is part of a holding company group to register with the department of insurance in its state of domicile and to furnish information concerning the operations of the companies within the holding company system which may materially affect the operations, management or financial condition of the insurers within the group. As part of its registration, each insurance company must identify material agreements, relationships and transactions with affiliates, including without limitation loans, investments, asset transfers, transactions outside of the ordinary course of business, certain management, service, and cost sharing agreements, reinsurance transactions, dividends and consolidated tax allocation agreements. In some instances, individual state insurance laws and regulations are even more stringent that those promulgated by the NAIC or other states.
We are subject to regulations administered by a department of insurance in each state in which we do business. These regulations relate to, among other things:
|
|
• |
the content and timing of required notices and other policyholder information; |
|
|
• |
the amount of premiums the insurer may assume or write in relation to its surplus (writing ratios); |
|
|
• |
the amount and nature of reinsurance a company is required to purchase; |
|
|
• |
participation in guaranty funds and other statutorily created markets or organizations; |
|
|
• |
business operations and claims practices; |
|
|
• |
approval of policy forms and premium rates; |
|
|
• |
standards of solvency, including risk-based capital measurements; |
|
|
• |
licensing of insurers and their products; |
|
|
• |
restrictions on the nature, quality and concentration of investments; |
|
|
• |
restrictions on the ability of insurance company subsidiaries to pay dividends to insurance holding companies; |
|
|
• |
restrictions on transactions between insurance companies and their affiliates; |
|
|
• |
restrictions on the size of risks insurable under a single policy; |
|
|
• |
requiring deposits for the benefit of policyholders; |
|
|
• |
requiring certain methods of accounting; |
|
|
• |
periodic examinations of our operations and finances; |
|
|
• |
the form and content of records of financial condition required to be filed; and |
|
|
• |
requiring reserves. |
The State of Florida imposed certain additional solvency related requirements as a condition of receiving a certificate of authority for our Florida insurance company subsidiary. This includes a requirement for a higher level of statutory surplus ($18 million), required pre-approval for any dividends paid by our Florida insurance company subsidiary until July 31, 2017, and limitations of dividends paid by our parent company prior to July 31, 2015. Finally, we are subject to consent orders setting conditions for FLOIR’s approval of the Citizens assumption transactions in which we have participated. We are required by consent order to comply with the assumption agreements entered into with Citizens at the time of each assumption transaction, which requires that for the assumed policies, we must offer to renew each policy for a minimum of three years. We are in full compliance with all consent orders issued with regard to Citizens’ depopulation program.
State regulators where we are and may become licensed and offer insurance products conduct periodic examinations of the affairs of insurance companies and require the filing of annual and other reports relating to financial condition, holding company issues and other matters. These regulatory authorities also conduct periodic examinations into insurers’ business practices. Additionally, we are subject to assessments levied by governmental and quasi-governmental entities from the states in which we conduct business.
Employees
As of December 31, 2016, we had 311 employees, 308 of whom are full time and three part time employees. We have approximately 30 active consultants. We are not a party to any collective bargaining agreement and have not experienced any work stoppages or strikes as a result of labor disputes. We consider relations with our employees to be satisfactory.
14
Heritage Insurance Holdings Inc.’s, Annual Reports on Form 10-K, Quarterly Reports on Form 10-Q, Current Reports on Form 8-K and amendments to reports filed pursuant to Sections 13(a) and 15(d) of the Securities Exchange Act of 1934, as amended (the “Exchange Act”) are made available, free of charge, on or through the “Investor Relations” portion of our Internet website https://heritagepci.com. Reports filed with or furnished to the SEC will also be available as soon as reasonably practicable after they are filed with or furnished to the SEC and are available over the internet at the SEC’s website at http://www.sec.gov.
15
Set forth below are certain risk factors that could harm our business, results of operations and financial condition. You should carefully read the following risk factors, together with the financial statements, related notes and other information contained in this Annual Report on Form 10-K. Our business, financial condition and operating results may suffer if any of the following risks are realized. If any of these risks or uncertainties occur, the trading price of our common stock could decline and you might lose all or part of your investment. This Annual Report on Form 10-K contains forward-looking statements that contain risks and uncertainties. Please refer to the discussion of “Forward-Looking Statements” of this Annual Report in connection with your consideration of the risk factors and other important factors that may affect future results described herein.
Risks Related to Our Business
We have a limited operating history, and our business and future prospects are difficult to evaluate.
We began operations in August 2012 and wrote our first policy in November 2012. Due to our limited operating history, our ability to execute our business strategy is materially uncertain and our operations and prospects are subject to all risks inherent in a developing business enterprise. Our limited operating history also makes it difficult to evaluate our long term commercial viability. As a new business, we must work to establish and develop successful operating procedures, hire staff, tailor and fine-tune our information management and other systems, maintain adequate control of our expenses, develop business relationships, implement our marketing strategies (and adapt and modify them as needed), establish a positive image and reputation in the community, and take any other steps necessary to conduct our business. As a result of these challenges, it is possible that we may not be successful in implementing our business strategy or completing the development of the infrastructure necessary to expand our business.
Our loss reserves are estimates and may be inadequate to cover our actual liability for losses, causing our results of operations to be adversely affected.
We maintain reserves to cover our estimated ultimate liabilities for losses and loss adjustment expenses, also referred to as loss reserves. We have a limited operating history and a limited loss history which may negatively impact our ability to accurately establish loss reserves. Our current loss reserves are based primarily on our historical data and statistical projections of what we believe the resolution and administration of claims will cost based on facts and circumstances then known to us. As a company with limited operating history, our claims experience and our experience with the risks related to certain claims is inherently limited. We use company historical data to the extent it is available and rely on industry historical data which may not be indicative of future periods. As a result, our projections and our estimates may be inaccurate, which in turn may cause our actual losses to exceed our loss reserves. If our actual losses exceed our loss reserves, our financial results, our ability to expand our business and to compete in the property and casualty insurance industry may be negatively affected.
Factors that affect unpaid losses and loss adjustment expenses include the estimates made on a claim-by-claim basis known as “case reserves” coupled with bulk estimates known as “incurred but not yet reported” (or “IBNR”). Periodic estimates by management of the ultimate costs required to resolve all claims are based on our analysis of historical data and estimations of the impact of numerous factors such as (i) per claim information, (ii) industry and company historical loss experience and development patterns, (iii) legislative enactments, judicial decisions, legal developments in the awarding of damages and changes in political attitudes, and (iv) trends in general economic conditions, including the effects of inflation. Management revises its estimates based on the results of its analysis. This process assumes that past experience, adjusted for the effects of current developments and anticipated trends, is an appropriate basis for estimating the ultimate resolution of all claims. There is no precise method for subsequently evaluating the impact of any specific factor on the adequacy of the reserves because the eventual redundancy or deficiency is affected by multiple factors.
Because of the inherent uncertainties in the reserving process, we cannot be certain that our reserves will be adequate to cover our actual losses and loss adjustment expenses. If our reserves for unpaid losses and loss adjustment expenses are less than actual losses and loss adjustment expenses, we will be required to increase our reserves with a corresponding reduction in our net income in the period in which the deficiency is identified. Future loss experience substantially in excess of our reserves for unpaid losses and loss adjustment expenses could substantially harm our results of operations and financial condition.
Because a large portion of our insurance business was conducted in Florida and Hawaii as of December 31, 2016, any single catastrophic event, or a series of such events, or other condition affecting losses in Florida or Hawaii could adversely affect our financial condition and results of operations.
16
As of December 31, 2016, 98% of our premium in force related to business in Florida and Hawaii. The distribution of our policies is generally consistent with that of the population in Florida and Hawaii and is therefore more concentrated in densely-populated coastal areas. A single catastrophic event, or a series of such events, destructive weather pattern, general economic trend, regulatory development or other condition specifically affecting Florida or Hawaii, particularly the more densely populated areas of those states, could have a disproportionately adverse impact on our business, financial condition and results of operations. While we actively manage our exposure to catastrophic events through our underwriting process and the purchase of reinsurance, the fact that our business is concentrated in Florida and Hawaii subjects us to increased exposure to certain catastrophic events and destructive weather patterns such as hurricanes, tropical storms and tornadoes. Changes in the prevailing regulatory, legal, economic, political, demographic and competitive environment, and other conditions in the states in which we conduct business could also make it less attractive for us to do business and would have a more pronounced effect on our business than it would on other insurance companies that are more geographically diversified than we are. Since our business is concentrated in this manner, the occurrence of one or more catastrophic events or other conditions affecting losses in Florida and Hawaii could have an adverse effect on our business, financial condition and results of operations.
We have exposure to unpredictable catastrophes, which can materially and adversely affect our financial results.
We write insurance policies that cover homeowners, condominium owners and commercial residential buildings for losses that result from, among other things, catastrophes. We are therefore subject to losses, including claims under policies we have assumed or written, arising out of catastrophes that may have a significant effect on our business, results of operations and financial condition. A significant catastrophe, or a series of catastrophes, could also have an adverse effect on our reinsurers. Catastrophes can be caused by various events, including hurricanes, tropical storms, tornadoes, earthquakes, hailstorms, explosions, power outages, fires and by man-made events, such as terrorist attacks. The incidence and severity of catastrophes are inherently unpredictable. The extent of losses from a catastrophe is a function of both the total amount of insured exposure in the area affected and the severity of the event. Our policyholders are currently concentrated in Florida and Hawaii, which are especially subject to adverse weather conditions such as hurricanes and tropical storms. Therefore, although we attempt to manage our exposure to catastrophes through our underwriting process and the purchase of reinsurance protection, an especially severe catastrophe or series of catastrophes could exceed our reinsurance protection and may have a material adverse impact on our results of operations and financial condition. In total, for the period from June 1, 2016 through May 31, 2017, we have purchased $3 billion of reinsurance coverage, including our retention, for multiple catastrophic events. Our ability to access this coverage, however, is subject to the severity and frequency of such events. We may experience significant losses and loss adjustment expenses in excess of our retention.
Our results of operations may fluctuate significantly based on industry factors.
The insurance business historically has been a cyclical industry characterized by periods of intense price competition due to excess underwriting capacity, as well as periods when shortages of capacity permitted an increase in pricing. As premium levels increase, there may be new entrants to the market, which could then lead to increased competition, a significant reduction in premium rates, less favorable policy terms and fewer opportunities to underwrite insurance risks, which could have a material adverse effect on our results of operations and cash flows. In addition to these considerations, changes in the frequency and severity of losses suffered by insureds and insurers, including changes resulting from multiple and/or catastrophic hurricanes, may affect the cycles of the insurance business significantly. We cannot predict whether market conditions will improve, remain constant or deteriorate. Negative market conditions may impair our ability to write insurance at rates that we consider appropriate relative to the risk assumed. If we cannot write insurance at appropriate rates, our business would be materially and adversely affected.
In addition, the uncertainties inherent in the reserving process, together with the potential for unforeseen developments, including changes in laws and the prevailing interpretation of policy terms, may result in losses and loss adjustment expenses materially different from the reserves initially established. Changes to prior year reserves will affect current underwriting results by increasing net income if the prior year reserves prove to be redundant or by decreasing net income if the prior year reserves prove to be insufficient. We are not allowed to record contingency reserves to account for expected future losses. As a result, we expect volatility in operating results in periods in which significant loss events occur because generally accepted accounting principles do not permit insurers or reinsurers to reserve for loss events until they have occurred and are expected to give rise to a claim. We anticipate that claims arising from future events may require the establishment of substantial reserves from time to time.
Our results of operations have shifted from our historic participation in the Citizens depopulation program to an expectation that we will not continue to participate in the program.
We may not be able to collect reinsurance amounts due to us from the reinsurers with which we have contracted.
Reinsurance is a method of transferring part of an insurance company’s risk under an insurance policy to another insurance company. To the extent that our reinsurers are unable to meet the obligations they assume under our reinsurance agreements, we
17
remain liable for the entire insured loss. We use reinsurance arrangements to limit and manage the amount of risk we retain, to stabilize our underwriting results and to increase our underwriting capacity. Our ability to recover amounts due from reinsurers under the reinsurance treaties we currently have in effect is subject to the reinsurance company’s ability and willingness to pay and to meet its obligations to us. We attempt to select financially strong reinsurers with an A.M. Best or S&P rating of “A-” or better or we require the reinsurer to fully collateralize its exposure. While we monitor from time to time their financial condition, we also rely on our reinsurance broker and rating agencies in evaluating our reinsurers’ ability to meet their obligations to us.
Our reinsurance coverage in any given year may be concentrated with one or a limited group of reinsurers. For the twelve months ending May 31, 2017, Allianz Global Corporate & Specialty SE provided approximately 18.9% of our third-party reinsurance coverage, including Citrus Re Catastrophe Bonds, which are fully collateralized. Any failure on the part of any one reinsurance company to meet its obligations to us could have a material adverse effect on our financial condition or results of operations.
All residential insurance companies that write business in Florida, including us, are required to obtain reinsurance through FHCF, and this coverage comprises a substantial portion of our reinsurance program for our Florida insured properties. The limit and retention of the FHCF coverage is subject to upward or downward adjustment based on, among other things, submitted exposures to FHCF by all participants. We have purchased private reinsurance alongside our FHCF layer to fill in gaps in coverage that may result from the adjustment of the limit or retention of our FHCF coverage; however, such reinsurance would not cover any losses we may incur as a result of FHCF’s inability to pay the full amount of our claims. If a catastrophic event occurs in Florida, FHCF may not have sufficient funds to pay all of its claims from insurance companies in full or in a timely manner. This could result in significant financial, legal and operational challenges to our Company. In the event of a catastrophic loss, FHCF’s ability to pay may be dependent upon its ability to issue bonds in amounts that would be required to meet its reinsurance obligations. There can be no assurance that FHCF will be able to do this. While we believe FHCF currently has adequate capital and financing capacity to meet its reinsurance obligations, there can be no assurance that it will be able to meet its obligations in the future, and any failure to do so could have a material adverse effect on our liquidity, financial condition and results of operations.
Reinsurance coverage may not be available to us in the future at commercially reasonable rates or at all.
The cost of reinsurance is subject to prevailing market conditions beyond our control such as the amount of capital in the reinsurance market, as well as the frequency and magnitude of natural and man-made catastrophes. We cannot be assured that reinsurance will remain continuously available to us in the amounts we consider sufficient and at prices acceptable to us. As a result, we may determine to increase the amount of risk we retain or look for other alternatives to reinsurance, which could in turn have a material adverse effect on our financial position, results of operations and cash flows.
Increased competition, competitive pressures, industry developments and market conditions could affect the growth of our business and adversely impact our financial results.
The property and casualty insurance industry in the states in which we do business is cyclical and, during times of increased capacity, highly competitive. We compete not only with other stock companies, but also with state governmental insurance entities, mutual companies, other underwriting organizations and alternative risk sharing mechanisms. Our principal lines of business are written by numerous other insurance companies. Competition for any one account may come from very large, well-established national companies, smaller regional companies, other specialty insurers in our field and other companies that write insurance. Some of these competitors have greater financial resources, larger agency networks and greater name recognition than we do. We compete for business not only on the basis of price, but also on the basis of financial strength, types of coverages offered, and availability of coverage desired by customers, commission structure and quality of service. We may have difficulty continuing to compete successfully on any of these bases in the future. Competitive pressures coupled with market conditions may affect our rate of premium growth and financial results.
In addition, industry developments could further increase competition in our industry. These developments could include:
|
|
• |
an influx of new capital in the marketplace as existing companies attempt to expand their businesses and new companies attempt to enter the insurance business as a result of better premium pricing and/or policy terms; |
|
|
• |
an increase in programs in which state-sponsored entities provide property insurance in catastrophe-prone areas; |
|
|
• |
changes in state regulatory climates; and |
|
|
• |
the passage of federal proposals for an optional federal charter that would allow some competing insurers to operate under regulations different or less stringent than those applicable to us. |
18
These developments and others could make the property and casualty insurance marketplace more competitive by increasing the supply of insurance available. If competition limits our ability to write new business at adequate rates, our future results of operations would be adversely affected.
Our success depends on our ability to accurately price the risks we underwrite.
Our results of operations and financial condition depend on our ability to underwrite and set premium rates accurately for a wide variety of risks. Rate adequacy is necessary to generate sufficient premiums to pay losses, loss adjustment expenses, reinsurance costs and underwriting expenses and to earn a profit. In order to price our products accurately, we must collect and properly analyze a substantial amount of data; develop, test and apply appropriate rating formulas; closely monitor and timely recognize changes in trends; and project both severity and frequency of losses with reasonable accuracy. Our ability to successfully perform these tasks, and as a result price our products accurately, is subject to a number of risks and uncertainties, some of which are outside our control, including:
|
|
• |
the availability of sufficient reliable data and our ability to properly analyze available data; |
|
|
• |
regulatory delays in approving filed rate changes; |
|
|
• |
the uncertainties that inherently characterize estimates and assumptions; |
|
|
• |
our selection and application of appropriate rating and pricing techniques; |
|
|
• |
changes in legal standards, claim resolution practices, and restoration costs; and |
|
|
• |
legislatively imposed consumer initiatives. |
In addition, we could underprice risks, which would negatively affect our profit margins. We could also overprice risks, which could reduce the number of policies we write and our competitiveness. In either event, our profitability could be materially and adversely affected.
The inherent uncertainty of models and our reliance on such models as a tool to evaluate risk may have an adverse effect on our financial results.
We license analytic and modeling software from third parties to facilitate our pricing, assess our risk exposure and determine our reinsurance needs. Given the inherent uncertainty of modeling techniques and the application of such techniques, these models and databases may not accurately address the emergence of a variety of matters which might impact our exposure to losses. Accordingly, these models may understate the exposures we are assuming and our financial results may be adversely impacted, perhaps significantly.
The failure of our claims department to effectively manage or remediate claims could adversely affect our insurance business, financial results and capital requirements.
We rely on our claims department and any outsourced claims resources to facilitate and oversee the claims adjustment process for our policyholders. Many factors could affect the ability of our claims department to effectively manage claims by our policyholders, including:
|
|
• |
the accuracy of our adjusters as they make their assessments and submit their estimates of damages; |
|
|
• |
the training, background and experience of our claims representatives; |
|
|
• |
the ability of our claims department to ensure consistent claims handling; |
|
|
• |
the ability of our claims department to translate the information provided by adjusters into acceptable claims resolutions; and |
|
|
• |
the ability of our claims department to maintain and update its claims handling procedures and systems as they evolve over time based on claims and geographical trends in claims reporting. |
Any failure to effectively manage the claims adjustment process, including failure to pay claims accurately, could lead to material litigation, undermine our reputation in the marketplace, impair our corporate image and negatively affect our financial results.
Additionally, in the final stage of the claims process for Florida claims, we leverage CAN’s vendor network to provide repair and remediation services to the policyholder. If such services are not performed properly, we may face liability. Although we maintain professional liability insurance to cover losses arising from our repair and remediation services, there can be no assurances that such
19
coverage is adequate. In addition, our failure to timely and properly remediate claims, or the perception of such failure, may damage our reputation and adversely affect our ability to renew existing policies or write new policies.
If actual renewals of our existing contracts do not meet expectations, our premiums written in future years and our future results of operations could be materially adversely affected.
Our insurance policies are written for a one-year term. We make assumptions about the renewal of our prior year’s contracts, including for purposes of determining the amount of reinsurance we purchase. If actual renewals do not meet expectations or if we choose not to write on a renewal basis because of pricing conditions, our premiums written in future years and our future operations would be materially adversely affected, and we may purchase reinsurance beyond what we believe is the most appropriate level.
We may not be able to effectively execute our growth strategy.
We have and intend to continue to invest significant time and resources to develop and market geographic expansion, new lines of business and/or products and services and we may not achieve the return on our investment that we expect. Initial timetables for the introduction and development of geographic expansion, new lines of business and/or new products or services may not be achieved and price and profitability targets may not prove feasible. External factors, such as compliance with regulations, competitive alternatives, and shifting customer preferences may also impact the successful implementation of our business plan. Such external factors and requirements may increase our costs and potentially affect the speed with which we will be able to pursue new market opportunities. There can be no assurance that we will be successful in bringing new insurance products or geographic expansion to our marketplace. Additionally, any geographic expansion, new line of business and/or new product or service could have a significant impact on the effectiveness of our system of internal controls. Failure to successfully manage these risks could have a material adverse effect on our business, results of operations and financial condition.
Our growth strategy involves expansion of our business to states outside of our existing markets. Geographic diversification may be hindered by the fact that we have a limited operating history, and we may be unable to satisfy requirements imposed by state regulators and other third parties.
If we are unable to expand our business because our capital must be used to pay greater than anticipated claims, our financial results may suffer. Further, we may require additional capital in the future which may not be available or may only be available on unfavorable terms.
Our future growth and future capital requirements will depend on our ability to expand the number of insurance policies we write, to expand the kinds of insurance products we offer and to expand the geographic markets in which we do business, all balanced by the business risks we choose to assume and cede. All of these growth initiatives require capital. Our existing sources of funds include possible sales of common or preferred stock, incurring debt and our earnings from operations and investments. Unexpected catastrophic events in our coverage areas, such as the hurricanes, may result in greater claims losses than anticipated, which could require us to limit or halt our growth while we redeploy our capital to pay these unanticipated claims unless we are able to raise additional capital.
To the extent that our present capital is insufficient to meet future operating requirements or to cover losses, we may need to raise additional funds through financings or curtail our growth. Based on our current operating plan, we believe that our current capital together with our anticipated retained income will support our operations. However, we cannot provide any assurance in that regard, since many factors will affect the amount and timing of our capital needs, including our growth and profitability, the availability and cost of reinsurance, as well as possible acquisition opportunities, market disruptions and other unforeseeable developments. If we require additional capital, it is possible that equity or debt financing may not be available on acceptable terms or at all. In the case of equity financings, dilution to our stockholders could result, and in any case such securities may have rights, preferences and privileges that are senior to those of existing stockholders. If we cannot obtain adequate capital on favorable terms or at all, our business, financial condition or results of operations could be materially adversely affected.
Heritage Insurance depends on the ability of its subsidiaries to generate and transfer funds to meet its debt obligations.
Heritage Insurance does not have significant revenue generating operations of its own. Our ability to make scheduled payments on our debt obligations depends on the financial condition and operating performance of our subsidiaries. If the funds we receive from our subsidiaries, some of which are subject to regulatory restrictions on the payment of distributions, are insufficient to meet our debt obligations, we may be required to raise funds through the issuance of additional debt or equity securities, reduce or suspend dividend payments, or sell assets.
20
Our information technology systems, or those of our key service providers, may fail or suffer a loss of security which could adversely affect our business.
Our insurance business is highly dependent upon the successful and uninterrupted functioning of our computer and data processing systems. We rely on these systems to perform actuarial and other modeling functions necessary for writing business, as well as to handle our policy administration process (i.e., handling and adjusting claims, the printing and mailing of our policies, endorsements, renewal notices, etc.). The successful operation of our systems depends on a continuous supply of electricity. The failure of these systems or disruption in the supply of electricity could interrupt our operations and result in a material adverse effect on our business.
The development and expansion of our insurance business is dependent upon the successful development and implementation of advanced technology, including modeling, underwriting and information technology systems. Because we intend to expand our business by writing additional voluntary policies, expansion to new geographic areas and entering into new lines of business, we are enhancing our information technology systems to handle and process an increased volume of policies. Additionally, we have engaged service providers to provide us with policy and other administration services for certain of our policies and we intend to continue to utilize third party systems as our policy count grows. The failure of any of these systems to function as planned could slow our growth and adversely affect our future business volume and results of operations. In addition, we have licensed certain systems and data from third parties. We cannot be certain that we will have access to these, or comparable systems, or that our technology or applications will continue to operate as intended. Moreover, we cannot be certain that we would be able to replace these systems without slowing our underwriting response time. A major defect or failure in our internal controls or information technology systems could result in management distraction, harm to our reputation, a loss or delay of revenues or increased expense.
In addition, a security breach of our computer systems could damage our reputation or result in liability. We retain confidential business and policyholder information in our computer systems. We may be required to spend significant capital and other resources to protect against security breaches or to alleviate problems caused by such breaches. It is critical that our facilities and infrastructure remain secure. Despite the implementation of security measures, our infrastructure may be vulnerable to physical break-ins, computer viruses, programming errors, attacks by third parties or similar disruptive problems. In addition, we could be subject to liability if hackers were able to penetrate our network security or otherwise misappropriate confidential information.
The development and implementation of new technologies will require an additional investment of our capital resources in the future.
Frequent technological changes, new products and services and evolving industry standards are all influencing the insurance business. We believe that the development and implementation of new technologies will require additional investment of our capital resources in the future. We have not determined, however, the amount of resources and the time that this development and implementation may require, which may result in short-term, unexpected interruptions to our business, or may result in a competitive disadvantage in price and/or efficiency, as we endeavor to develop or implement new technologies.
We do not have significant redundancy in our operations.
We conduct our business primarily from offices located in western and southern Florida and Hawaii where hurricanes could damage our facilities or interrupt our power supply. The loss or significant impairment of functionality in these facilities for any reason could have a material adverse effect on our business, as we do not have significant redundancies to replace our facilities if functionality is impaired. We contract with a third party vendor to maintain complete daily backups of our systems, however, we have not fully tested our plan to recover data in the event of a disaster.
We may be unable to attract and retain qualified employees.
We depend on our ability to attract and retain experienced underwriting talent and other skilled employees who are knowledgeable about our business. If the quality of our underwriters and other personnel decreases, we may be unable to maintain our current competitive position in the specialized markets in which we operate and be unable to expand our operations, which could adversely affect our results.
The loss of, or failure to attract, key personnel could have a more significant impact on our business as compared to some of our competitors that are larger or have longer operating histories. We believe that our ability to grow and fully execute our business plan will depend in large part on our ability to attract and retain additional skilled and qualified personnel and to expand, train and manage our employees. We may not be successful in doing so, because the competition for experienced personnel in the insurance industry is intense.
21
We are dependent on key executives, the loss of whom could adversely affect our business.
Our future success depends to a significant extent on the efforts of our senior management. We believe there are only a limited number of available and qualified executives with substantial experience in our industry. Accordingly, the loss of the services of one or more of the members of our senior management could delay or prevent us from fully implementing our business strategy and, consequently, significantly and negatively affect our business.
Currently, we only maintain key man life insurance with respect to Bruce Lucas, our Chairman and Chief Executive Officer. If any other member of senior management dies or becomes incapacitated, or leaves the company to pursue employment opportunities elsewhere, we would be solely responsible for locating an adequate replacement for such senior management and for bearing any related cost. To the extent that we are unable to locate an adequate replacement or are unable to do so within a reasonable period of time, our business may be significantly and negatively affected.
Our financial results may be negatively affected by the fact that a portion of our income is generated by the investment of our company’s capital, premiums and loss reserves.
A portion of our income is, and likely will continue to be, generated by the investment of our capital, premiums and loss reserves. The amount of income so generated is a function of our investment policy, available investment opportunities and the amount of available cash invested. We are also constrained by investment limitations required by our state insurance regulators. At December 31, 2016, approximately 85% of our total investments, cash and cash equivalents was invested in fixed-maturity and equity securities with the balance in cash and cash equivalents. We may, under certain circumstances, be required to liquidate our investments in securities at prices below book value, which may adversely affect our financial results. We currently hold all of our cash in accounts with four financial institutions and, as a result of this concentration, a portion of the balances in such accounts exceeds the FDIC insurance limits. While we monitor and adjust the balances in our accounts as appropriate, these balances could be impacted if any of these financial institutions fail and could be subject to other adverse conditions in the financial markets.
We may alter our investment policy to accept higher levels of risk with the expectation of higher returns. Fluctuating interest rates and other economic factors make it impossible to estimate accurately the amount of investment income that will be realized. In fact, we may realize losses on our investments.
Our inability to maintain our financial stability rating may have a material adverse effect on our competitive position, the marketability of our product offerings, and our liquidity, operating results and financial condition.
Financial stability ratings are important factors in establishing the competitive position of insurance companies and can have a significant effect on an insurance company’s business. Many insurance buyers, agents, brokers and secured lenders use the ratings assigned by rating agencies to assist them in assessing the financial stability and overall quality of the companies from which they are considering purchasing insurance or in determining the financial stability of the company that provides insurance. Each of our insurance companies currently maintain a Demotech rating of “A” (“Exceptional”) or higher. These financial stability ratings provide an objective baseline for assessing solvency and should not be interpreted as (and are not intended to serve as) an assessment of, a recommendation to buy, sell, or hold, any securities of an insurance company or its parent holding company, including shares of our common stock.
On an ongoing basis, rating agencies review the financial performance and condition of insurers and can downgrade or change the outlook on an insurer’s ratings due to, for example, a change in an insurer’s statutory capital, a reduced confidence in management or a host of other considerations that may or may not be under the insurer’s control. All ratings are subject to continuous review; therefore, the retention of these ratings cannot be assured. A downgrade in any of these ratings could have a material adverse effect on our competitive position, the marketability of our product offerings and our ability to grow in the marketplace.
The effects of emerging claim and coverage issues on our business are uncertain.
Loss frequency and severity in the property and casualty insurance industry in general and for our multi-peril personal lines business has continued to increase in recent years, principally driven by litigation and assignment of benefits. In addition, many legal actions and proceedings have been brought on behalf of classes of complainants, which can increase the size of judgments. The propensity of policyholders and third party claimants to litigate and the willingness of courts to expand causes of loss and the size of awards may render the loss reserves of our insurance subsidiaries inadequate for current and future losses. In addition, as industry practices and social and other environmental conditions change, unexpected and unintended issues related to claims and coverage may emerge. These issues may adversely affect our business by either extending coverage beyond our underwriting intent or by increasing the number or size of claims. In some instances, these changes may not become apparent until sometime after we have issued insurance policies that are affected by the changes. As a result, the full extent of liability under our insurance policies may not be known at the time such policies are issued or renewed, and our financial position and results of operations may be adversely affected.
22
The failure of the risk mitigation strategies we utilize could have a material adverse effect on our financial condition or results of operations.
We utilize a number of strategies to mitigate our risk exposure including:
|
|
• |
employing proper underwriting procedures; |
|
|
• |
carefully evaluating the terms and conditions of our policies; |
|
|
• |
geographic diversification; and |
|
|
• |
ceding insurance risk to reinsurance companies. |
However, there are inherent limitations in all of these tactics. No assurance can be given that an event or series of unanticipated events will not result in loss levels which could have a material adverse effect on our financial condition or results of operations.
Lack of effectiveness of exclusions and other loss limitation methods in the insurance policies we assume or write could have a material adverse effect on our financial condition or our results of operations.
Various provisions of our policies, such as limitations or exclusions from coverage which are designed to limit our risks, may not be enforceable in the manner we intend. In addition, the policies we issue contain conditions requiring the prompt reporting of claims to us and our right to decline coverage in the event of a violation of that condition. While our insurance product exclusions and limitations reduce the loss exposure to us and help eliminate known exposures to certain risks, it is possible that a court or regulatory authority could nullify or void an exclusion or limitation, or legislation could be enacted modifying or barring the use of such endorsements and limitations in a way that would adversely affect our loss experience, which could have a material adverse effect on our financial condition or results of operations.
We rely on independent agents to write voluntary insurance policies for us, and if we are not able to attract and retain independent agents, our revenues would be negatively affected.
We write voluntary personal and commercial insurance policies through a network of independent agents. Of our network of approximately 1,800 Florida independent agents, approximately 40% are affiliated with nine large agency networks with which we have entered into master agency agreements. Of our network of approximately 75 Hawaii independent agents, approximately 60% are affiliated with three large multi-producer agencies. As of December 31, 2016, voluntary policies written through independent agents, including the policies we acquired from SSIC, constituted approximately 47.2% of our total policies in force and represented approximately $249 million in annualized premiums. Our strategic focus is to grow the number of voluntary policies throughout the states in which we are licensed, which will further increase our reliance on our network of independent agents. In fact, in the future, we may rely on independent agents to be the primary source for our property insurance policies. If any of our independent agents cease writing policies for us, or if any of our master agency agreements are terminated, we may suffer a reduction in the amount of products we are able to sell, which would negatively impact our results.
Many of our competitors also rely on independent agents. As a result, we must compete with other insurers for independent agents’ business. Our competitors may offer a greater variety of insurance products, lower premiums for insurance coverage, or higher commissions to their agents. If our products, pricing and commissions do not remain competitive, we may find it more difficult to attract business from independent agents to sell our products.
Changing climate conditions may adversely affect our financial condition, profitability or cash flows.
Climate change, to the extent it produces extreme changes in temperatures and changes in weather patterns, could affect the frequency or severity of weather events. Further, it could reduce the affordability and availability of personal residential insurance, which could have an effect on pricing. Changes in weather patterns could also affect the frequency and severity of other natural catastrophe events to which we may be exposed.
If we are unable to implement and maintain effective internal controls over financial reporting, investors may lose confidence in the accuracy and completeness of our financial reports and the market price of our common stock may be negatively affected.
As a public company, we are required to maintain internal controls over financial reporting and to report any material weaknesses in such internal controls. A material weakness is a deficiency, or a combination of deficiencies, in internal control over financial reporting, such that there is a reasonable possibility that a material misstatement of a company’s annual or interim financial statements will not be prevented or detected on a timely basis. Section 404 of the Sarbanes-Oxley Act of 2002 (the “Sarbanes-Oxley
23
Act”) requires that we evaluate and determine the effectiveness of our internal controls over financial reporting and, provide a management report on the internal controls over financial reporting.
We have designed and implemented the internal controls over financial reporting in compliance with the Sarbanes-Oxley Act requirements. In the future, we may discover areas of our internal controls that need improvement. If we or our independent registered public accounting firm discover a material weakness, the disclosure of that fact, even if quickly remediated, could reduce the market’s confidence in our financial statements and harm our stock price. We may not be able to effectively and timely implement necessary control changes and employee training to ensure continued compliance with the Sarbanes-Oxley Act and other regulatory and reporting requirements. If we fail to maintain effective internal controls, we could be subject to regulatory scrutiny and sanctions and investors could lose confidence in the accuracy and completeness of our financial reports.
We are an “emerging growth company” and we cannot be certain if the reduced disclosure and other requirements applicable to emerging growth companies will make our common stock less attractive to investors.
We are an “emerging growth company,” as defined in the JOBS Act, and we currently and may in the future take advantage of certain exemptions from various reporting requirements that are applicable to other public companies that are not “emerging growth companies” including, but not limited to, not being required to comply with the auditor attestation requirements of Section 404 of the Sarbanes-Oxley Act with respect to our internal control over financial reporting, reduced disclosure obligations regarding executive compensation in our periodic reports and proxy statements, and exemptions from the requirements of holding a nonbinding advisory vote on executive compensation and stockholder approval of any golden parachute payments not previously approved. We may take advantage of these provisions for up to five years from our initial public offering or such earlier time that we are no longer an “emerging growth company.” We would cease to be an “emerging growth company” upon the earliest to occur of: (i) the last day of the year in which we have more than $1 billion in annual revenues; (ii) the date we qualify as a “large accelerated filer,” with at least $700 million of equity securities; (iii) the issuance, in any three-year period, by our company of more than $1 billion in non-convertible debt securities held by non-affiliates; and (iv) the last day of the year ending after the fifth anniversary of our initial public offering. We may choose to take advantage of some but not all of these reduced reporting and other burdens. To the extent we take advantage of any of the reduced reporting burdens in this annual report or in future filings, the information that we provide our security holders may be different than you might get from other public companies in which you hold equity interests. We cannot predict if investors will find our common stock less attractive because we may rely on these exemptions. If some investors find our common stock less attractive as a result, there may be a less active trading market for our common stock and our stock price may be more volatile.
In addition, Section 107 of the JOBS Act provides that an “emerging growth company” can take advantage of the extended transition period provided in Section 7(a)(2)(B) of the Securities Act for complying with new or revised accounting standards. In other words, an “emerging growth company” can delay the adoption of certain accounting standards until those standards would otherwise apply to private companies. We have chosen to “opt-out” of such extended transition period, however, and, as a result, we will comply with new or revised accounting standards on the relevant dates on which adoption of such standards is required for non-emerging growth companies. Section 107 of the JOBS Act provides that our decision to opt-out of the extended transition period for complying with new or revised accounting standards is irrevocable.
Risks Related to Regulation of our Insurance Operations
We are subject to extensive regulation which may reduce our profitability or limit our growth. Moreover, if we fail to comply with these regulations, we may be subject to penalties, including fines and suspensions, which may adversely affect our financial condition and results of operations.
We are subject to extensive state regulation. Our insurance company affiliates are subject to supervision and regulation that is primarily designed to protect our policyholders rather than our stockholders, and such regulation is imposed by both states in which we are domiciled and the states in which they do business. These regulations relate to, among other things, the approval of policy forms and premium rates, our conduct in the marketplace, our compliance with solvency and financial reporting requirements, transactions with our affiliates, and limitations on the amount of business we can write, the amount of dividends we can pay to stockholders, and the types of investments we can make. Insurance holding company regulations generally provide that transactions between an insurance company and its affiliates must be fair and reasonable, and must be clearly and accurately disclosed in the records of the respective parties, with expenses and payments allocated between the parties in accordance with customary accounting practices. Many types of transactions between an insurance company and its affiliates, such as transfers of assets, loans, reinsurance agreements, service agreements, certain dividend payments by the insurance company and certain other material transactions, may be subject to prior approval by, or prior notice to, state regulatory authorities. If we are unable to obtain the requisite prior approval for a specific transaction, we would be precluded from taking the action, which could adversely affect our operations. These regulatory requirements may adversely affect or inhibit our ability to achieve some or all of our business objectives. In addition, regulatory
24
authorities also may conduct periodic examinations into insurers’ business practices. These reviews may reveal deficiencies in our insurance operations or differences between our interpretations of regulatory requirements and those of the regulators.
State insurance regulations also frequently impose notice or approval requirements for the acquisition of specified levels of ownership in the insurance company or insurance holding company. For example, Florida law requires that a person may not, individually or in conjunction with any affiliated person of such person, acquire directly or indirectly, conclude a tender offer or exchange offer for, enter into any agreement to exchange securities for, or otherwise finally acquire 5% or more of the outstanding voting securities of a Florida domiciled stock insurer or of a controlling company, unless it is in compliance with certain notice and approval requirements. Such restriction may inhibit our ability to grow our business or achieve our business objectives.
Further, regulatory authorities have relatively broad discretion to deny or revoke licenses for various reasons, including the violation of regulations. In some instances, we follow practices based on our interpretations of regulations or practices that we believe may be generally followed by the industry. These practices may turn out to be different from the interpretations of regulatory authorities. If we do not have the requisite licenses and approvals or do not comply with applicable regulatory requirements, insurance regulatory authorities could preclude or temporarily suspend us from carrying on some or all of our activities or otherwise penalize us. This could adversely affect our ability to operate our business.
Heritage P&C is subject to additional regulation imposed by consent orders entered into with FLOIR in connection with our formation.
In addition to compliance with statutes and regulations, Florida routinely places additional restrictions on new insurers as a condition of receiving their certificate of authority. These restrictions are typically memorialized in a consent order entered into between FLOIR and the insurer applying for a certificate of authority. We are subject to such a consent order. We have, in certain cases, agreed to higher or more stringent restrictions than are otherwise required under Florida law. The material restrictions we have agreed to include:
|
|
• |
Florida law requires a residential property writer to maintain surplus of the greater of $15 million or 10% of its liabilities. Pursuant the consent order, we agreed to establish a minimum capital and surplus of $18 million. |
|
|
• |
Florida law restricts the ratio of premiums written to policyholder surplus to 10 to 1 on a gross basis and 4 to 1 on a net of reinsurance basis. Pursuant to the consent order, we agreed to not exceed the projected premiums in the plan of operation submitted with our original application for licensure without the prior written approval of FLOIR during 2012, 2013 and 2014. As part of the FLOIR approval process for the various Citizens assumption transactions in which we have participated, we have received approval to exceed these projected premiums. |
|
|
• |
Florida law places no restrictions on the parent of an insurer, or other upstream entities, with regard to the payment of dividends. Pursuant to the consent order, we agreed to not make any distributions to stockholders prior to July 31, 2015, except such distributions as are required to offset stockholders’ tax obligations resulting from the ownership of our equity or such distributions as may be approved by FLOIR in advance and in writing. |
|
|
• |
Florida law allows an insurer to pay certain dividends to stockholders without approval of FLOIR. Pursuant to the consent order, we agreed that, until July 31, 2017, Heritage P&C would pay only those dividends that have been approved in advance and in writing by FLOIR. |
In addition, we are subject to several consent orders setting conditions upon FLOIR’s approval of the various Citizens assumption transactions in which we have participated. For example, beginning with our June 2013 assumption transaction, we are required to offer to renew each assumed policy for a minimum of three years and limit rate increases for wind only policies where renewals are capped at 100% to 110% of the previous expiring Heritage premium.
In the event we are unable to comply with the additional regulation imposed by these consent orders, it may adversely affect our ability to operate our business.
Changes in regulation may reduce our profitability and limit our growth.
We are subject to extensive regulation in the states in which we conduct business. The National Association of Insurance Commissioners (“NAIC”) and state insurance regulators are constantly reexamining existing laws and regulations, generally focusing on modifications to holding company regulations, interpretations of existing laws and the development of new laws.
From time to time, states consider and/or enact laws that may alter or increase state authority to regulate insurance companies and insurance holding companies. States also consider and/or enact laws that impact the competitive environment and marketplace for property and casualty insurance. Our insurance company subsidiaries currently transact insurance multiple states. The political environment in some states has sometimes led to aggressive regulation of property and casualty insurance companies. For example, in 2007, Florida enacted legislation that led to rate levels in the private insurance market that we believe, in many instances in the past,
25
were inadequate to cover the related underwriting risk. This same legislation required Citizens to reduce its premium rates and begin competing against private insurers in the Florida residential property insurance market. Florida lawmakers may continue to enact or retain legislation that suppresses the rates of Citizens, further adversely impacting the private insurance market and increasing the likelihood that it must levy assessments on private insurance companies and ultimately on Florida consumers. These and other aspects of the political environment in jurisdictions where we operate may reduce our profitability, limit our growth, or otherwise adversely affect our operations.
During the past several years, various regulatory and legislative bodies have adopted or proposed new laws or regulations to address the cyclical nature of the insurance industry, catastrophic events and insurance capacity and pricing. These regulations include (i) the creation of “market assistance plans” under which insurers are induced to provide certain coverages, (ii) restrictions on the ability of insurers to rescind or otherwise cancel certain policies in mid-term or to nonrenew policies at their scheduled expirations, (iii) advance notice requirements or limitations imposed for certain policy non-renewals, (iv) limitations upon or decreases in rates permitted to be charged, (v) expansion of governmental involvement in the insurance market and (vi) increased regulation of insurers’ policy administration and claims handling practices.
Currently, the federal government does not directly regulate the insurance business. However, in recent years the state insurance regulatory framework has come under increased federal scrutiny. Congress and some federal agencies from time to time investigate the current condition of insurance regulation in the United States to determine whether to impose federal regulation or to allow an optional federal charter, similar to banks. In addition, changes in federal legislation and administrative policies in several areas, including changes in the Gramm-Leach-Bliley Act, financial services regulation and federal taxation, can significantly impact the insurance industry and us.
We cannot predict with certainty the effect any enacted, proposed or future state or federal legislation or NAIC initiatives may have on the conduct of our business. Furthermore, there can be no assurance that the regulatory requirements applicable to our business will not become more stringent in the future or result in materially higher costs than current requirements, or that creation of a federal insurance regulatory system will not adversely affect our business or disproportionately benefit our competitors. Changes in the regulation of our business may reduce our profitability, limit our growth or otherwise adversely affect our operations.
Our insurance subsidiaries are subject to minimum capital and surplus requirements, and our failure to meet these requirements could subject us to regulatory action.
Our insurance subsidiaries are subject to risk-based capital standards and other minimum capital and surplus requirements imposed under applicable state laws. The risk-based capital standards, based upon the Risk-Based Capital Model Act adopted by the NAIC, require our insurance subsidiaries to report the results of risk-based capital calculations to state regulators and the NAIC. These risk-based capital standards provide for different levels of regulatory attention depending upon the ratio of an insurance company’s total adjusted capital, as calculated in accordance with NAIC guidelines, to its authorized control level risk-based capital. Authorized control level risk-based capital is determined using the NAIC’s risk-based capital formula, which measures the minimum amount of capital that an insurance company needs to support its overall business operations.
An insurance company with total adjusted capital that is less than 200% of its authorized control level risk-based capital is at a company action level, which would require the insurance company to file a risk-based capital plan that, among other things, contains proposals of corrective actions the company intends to take that are reasonably expected to result in the elimination of the company action level event. Additional action level events occur when the insurer’s total adjusted capital falls below 150%, 100%, and 70% of its authorized control level risk-based capital. The lower the percentage, the more severe the regulatory response, including, in the event of a mandatory control level event (total adjusted capital falls below 70% of the insurer’s authorized control level risk-based capital), placing the insurance company into receivership. As of December 31, 2016, our insurance subsidiaries each maintained a risk-based capital ratio of over 300%.
In addition, our insurance subsidiaries are required to maintain certain minimum capital and surplus and to limit its written premiums to specified multiples of its capital and surplus. Our insurance subsidiaries could exceed these ratios if their volume increases faster than anticipated or if their surplus declines due to catastrophe or non-catastrophe losses or excessive underwriting and operational expenses.
Any failure by our insurance subsidiaries to meet the applicable risk-based capital or minimum statutory capital requirements or the writings ratio limitations imposed by state law could subject our insurance subsidiaries to further examination or corrective action imposed by state regulators, including limitations on our writing of additional business, state supervision or liquidation.
Any changes in existing risk-based capital requirements, minimum statutory capital requirements, or applicable writings ratios may require us to increase our statutory capital levels, which we may be unable to do.
26
Regulation limiting rate increases and requiring us to participate in loss sharing may decrease our profitability.
From time to time, political dispositions affect the insurance market, including efforts to effectively suppress rates at a level that may not allow us to reach targeted levels of profitability. Despite efforts to remove politics from insurance regulation, facts and history demonstrate that public policymakers, when faced with untoward events and adverse public sentiment, can act in ways that impede a satisfactory correlation between rates and risk. Such acts may affect our ability to obtain approval for rate changes that may be required to attain rate adequacy along with targeted levels of profitability and returns on equity. Our ability to afford reinsurance required to reduce our catastrophe risk may be dependent upon the ability to adjust rates for our cost.
Additionally, we are required to participate in guaranty funds for insolvent insurance companies. The funds periodically assess losses against all insurance companies doing business in the state. Our operating results and financial condition could be adversely affected by any of these factors.
Risks Relating to Ownership of Our Common Stock
The price of our common stock may fluctuate significantly, and you could lose all or part of your investment.
Volatility in the market price of our common stock may prevent you from being able to sell your shares at or above the price you paid for them. The market price for our common stock could fluctuate significantly for various reasons, including:
|
|
• |
our operating and financial performance and prospects; |
|
|
• |
our quarterly or annual earnings or those of other companies in our industry; |
|
|
• |
the public’s reaction to our press releases, our other public announcements and our filings with the SEC; |
|
|
• |
changes in, or failure to meet, earnings estimates or recommendations by research analysts who track our common stock or the stock of other companies in our industry; |
|
|
• |
the failure of research analysts to cover our common stock; |
|
|
• |
general economic, industry and market conditions; |
|
|
• |
strategic actions by us, our customers or our competitors, such as acquisitions or restructurings; |
|
|
• |
new laws or regulations or new interpretations of existing laws or regulations applicable to our business; |
|
|
• |
changes in accounting standards, policies, guidance, interpretations or principles; |
|
|
• |
material litigation or government investigations; |
|
|
• |
changes in general conditions in the U.S. and global economies or financial markets, including those resulting from war, incidents of terrorism or responses to such events; |
|
|
• |
changes in key personnel; |
|
|
• |
sales of common stock by us, our principal stockholders or members of our management team; |
|
|
• |
the granting or exercise of employee stock options; |
|
|
• |
volume of trading in our common stock; and |
|
|
• |
impact of the facts described elsewhere in “Risk Factors.” |
In addition, in recent years, the stock market has regularly experienced significant price and volume fluctuations. This volatility has had a significant impact on the market price of securities issued by many companies, including companies in our industry. The changes frequently appear to occur without regard to the operating performance of the affected companies. Hence, the price of our common stock could fluctuate based upon factors that have little or nothing to do with us and these fluctuations could materially reduce our share price.
We may not continue to pay dividends on our common stock.
In the fourth quarter of 2015 and for each quarter of 2016, our Board of Directors declared a quarterly cash dividend on our common stock; however, we can provide no assurance or guarantee that we will continue to pay dividends in the future. Therefore, investors who purchase our common stock may only realize a return on their investment if the value of our common stock appreciates. The declaration and payment of any future dividends will be at the discretion of our Board of Directors and will be dependent upon
27
our profits, financial requirements and other factors including regulatory restrictions on the payment of dividends from our subsidiaries, general business conditions and such other factors as our Board of Directors considers relevant.
We may not continue our stock repurchase program
On September 14, 2015, the Company announced that our Board of Directors authorized a $20 million share repurchase program under which purchases may be made from time to time in the open market, or through privately negotiated transactions, block transactions or other techniques, as determined by the Company’s management. In May 2016, the Board of Directors authorized an additional stock repurchase of up to $50 million of the Company’s common stock through December 31, 2017. For the year ended December 31, 2016, the Company had purchased through open market or private transactions an aggregate of 1,759,330 shares at a total cost of $25.6 million. The declaration and payment of any future dividends will be at the discretion of our Board of Directors and will be dependent upon our profits, financial requirements and other factors including regulatory restrictions on the payment of dividends from our subsidiaries, general business conditions and such other factors as our Board of Directors considers relevant. Therefore, investors who purchase our common stock may only realize a return on their investment if the value of our common stock appreciates.
Certain provisions of our certificate of incorporation and our bylaws may make it difficult for stockholders to change the composition of our board of directors and may discourage hostile takeover attempts that some of our stockholders may consider to be beneficial.
Certain provisions of our certificate of incorporation and bylaws may have the effect of delaying or preventing changes in control if our board of directors determines that such changes in control are not in the best interests of us and our stockholders. The provisions in such certificate of incorporation and bylaws include, among other things, the following:
|
|
• |
the ability of our board of directors to issue shares of preferred stock and to determine the price and other terms, including preferences and voting rights, of those shares without stockholder approval; |
|
|
• |
stockholder action can only be taken at a special or regular meeting and not by written consent; |
|
|
• |
advance notice procedures for nominating candidates to our board of directors or presenting matters at stockholder meetings; and |
|
|
• |
allowing only our board of directors to fill vacancies on our board of directors. |
We have elected in our certificate of incorporation not to be subject to Section 203 of the DGCL, an anti-takeover law. In general, Section 203 prohibits a publicly held Delaware corporation from engaging in a business combination, such as a merger, with a person or group owning 15% or more of the corporation’s voting stock for a period of three years following the date the person became an interested stockholder, unless (with certain exceptions) the business combination or the transaction in which the person became an interested stockholder is approved in a prescribed manner. Accordingly, we will not be subject to any anti-takeover effects of Section 203.
While these provisions have the effect of encouraging persons seeking to acquire control of our company to negotiate with our board of directors, they could enable the board of directors to hinder or frustrate a transaction that some, or a majority, of the stockholders might believe to be in their best interests, including an acquisition that would result in a price per share at a premium over the market price, and, in that case, may prevent or discourage attempts to remove and replace incumbent directors.
These provisions may frustrate or prevent any attempts by our stockholders to replace or remove our current management by making it more difficult for stockholders to replace members of our board of directors, which is responsible for appointing the members of our management.
Applicable insurance laws may make it difficult to effect a change of control of our company.
State insurance holding company laws require prior approval by the state insurance department of any change of control of an insurer that is domiciled in that respective state. “Control” is generally defined as the possession, direct or indirect, of the power to direct or cause the direction of the management and policies of a company, whether through the ownership of voting securities, by contract or otherwise. Control is generally presumed to exist through the direct or indirect ownership of 10% or more of the voting securities of a domestic insurance company or any entity that controls a domestic insurance company. These laws may discourage potential acquisition proposals and may delay, deter or prevent a change of control of us, including through transactions, and in particular unsolicited transactions, that some or all of our stockholders might consider to be desirable.
28
Any issuance of preferred stock could make it difficult for another company to acquire us or could otherwise adversely affect holders of our common stock, which could depress the price of our common stock.
Our board of directors has the authority to issue preferred stock and to determine the preferences, limitations and relative rights of shares of preferred stock and to fix the number of shares constituting any series and the designation of such series, without any further vote or action by our stockholders. Our preferred stock could be issued with voting, liquidation, dividend and other rights superior to the rights of our common stock. The potential issuance of preferred stock may delay or prevent a change in control of us, discouraging bids for our common stock at a premium over the market price, and adversely affect the market price and the voting and other rights of the holders of our common stock.
Our business and stock price may suffer as a result of our limited public company operating experience. In addition, if securities or industry analysts do not publish research or publish inaccurate or unfavorable research about our business, our stock price and trading volume could decline.
We completed our initial public offering in May 2014. Our limited public company operating experience may make it difficult to forecast and evaluate our future prospects. If we are unable to execute our business strategy, either as a result of our inability to effectively manage our business in a public company environment or for any other reason, our business, prospects, financial condition and results of operations may be harmed. In addition, if no or very few securities or industry analysts cover of our company, the trading price for our stock would be negatively impacted. If one or more of the analysts who covers us downgrades our stock or publishes inaccurate or unfavorable research about our business, our stock price would likely decline. If one or more of these analysts ceases coverage of us or fails to publish reports on us regularly, demand for our stock could decrease, which could cause our stock price and trading volume to decline.
None
We, through Skye Lane, our wholly-owned subsidiary, own a two-building 14-acre campus located in Clearwater, Florida. We also purchased the BRC facility in Safety Harbor, Florida. Approximately 84% of the property in Clearwater is occupied by unaffiliated tenants.
We are subject to routine legal proceedings in the ordinary course of business. We believe that the ultimate resolution of these matters will not have a material adverse effect on our business, financial condition or results of operations.
Not applicable
29
|
Item 5. |
Market For Registrant’s Common Equity, Related Stockholder Matters and Issuer Purchases of Equity Securities |
Our common stock trades on the New York Stock Exchange (“NYSE”) under the symbol “HRTG”. The following table sets forth the high and low sale prices as reported on the NYSE, and the amount of our dividends declarations, for 2016 and 2015, respectively. These reported prices reflect inter-dealer prices without adjustments for retail markups, markdowns or commissions.
|
Year |
|
Quarter |
|
High |
|
|
Low |
|
|
Dividends paid per share |
|
|||
|
2016 |
|
First |
|
$ |
21.42 |
|
|
$ |
14.72 |
|
|
$ |
0.05 |
|
|
|
|
Second |
|
$ |
15.96 |
|
|
$ |
11.56 |
|
|
$ |
0.06 |
|
|
|
|
Third |
|
$ |
15.10 |
|
|
$ |
11.50 |
|
|
$ |
0.06 |
|
|
|
|
Fourth |
|
$ |
16.48 |
|
|
$ |
11.25 |
|
|
$ |
0.06 |
|
|
|
|
|
|
|
|
|
|
|
|
|
|
|
|
|
|
|
|
|
|
|
|
|
|
|
|
|
|
|
|
|
|
Year |
|
Quarter |
|
High |
|
|
Low |
|
|
Dividends paid per share |
|
|||
|
2015 |
|
First |
|
$ |
22.80 |
|
|
$ |
18.58 |
|
|
$ |
— |
|
|
|
|
Second |
|
$ |
23.23 |
|
|
$ |
19.88 |
|
|
$ |
— |
|
|
|
|
Third |
|
$ |
27.28 |
|
|
$ |
16.81 |
|
|
$ |
— |
|
|
|
|
Fourth |
|
$ |
24.98 |
|
|
$ |
18.73 |
|
|
$ |
0.05 |
|
The closing sale price of our common stock as reported on the NYSE on March 1, 2017 was $15.31 per share. As of such date there were 33 holders of record of our common stock based on information provided by our transfer agent.
Dividends
The declaration and payment of dividends will be at the discretion of our Board of Directors and will depend on profits, financial requirements and other factors, such as legal and regulatory restrictions on the payment of dividends, overall business condition and other elements the Board of Directors considers relevant.
The following table represents the frequency and amount of the cash dividends declared on our common stock for the two most recent fiscal years.
|
Declaration Date |
|
Date of Record |
|
Payment Date |
|
Per Share Amount |
|
|
|
12/18/2015 |
|
12/31/2015 |
|
1/13/2016 |
|
$ |
0.05 |
|
|
3/3/2016 |
|
3/15/2016 |
|
4/5/2016 |
|
$ |
0.06 |
|
|
5/5/2016 |
|
6/15/2016 |
|
7/1/2016 |
|
$ |
0.06 |
|
|
8/4/2016 |
|
9/15/2016 |
|
10/3/2016 |
|
$ |
0.06 |
|
|
11/9/2016 |
|
12/15/2016 |
|
1/4/2017 |
|
$ |
0.06 |
|
Share Repurchase Plan
In September 2015, our Board of Directors approved a plan to repurchase up to $20 million of common shares under which we may purchase shares of common stock in open market purchases, block transactions and privately negotiated transactions in accordance with applicable federal securities laws. In May 2016, the Board of Directors authorized an additional stock repurchase of up to $50 million of the Company’s common stock through December 31, 2017. See Note 19 — “Equity” to our consolidated financial statements under Item 8 of this Annual Report on Form 10-K.
Securities Authorized for Issuance under Equity Compensation Plan
For information regarding the securities authorized for issuance under our equity compensation plans, refer to “Security Ownership of Certain Beneficial Owners and Management and Related Stockholders Matters” included in Part III, Item 12 of this Annual Report.
The table below summarizes the number of shares of common stock repurchased during the year ended December 31, 2016 under the repurchase plan approved by our Board of Directors in September 2015 (dollar amounts in thousands, except share and per share amounts):
30
|
|
Total Number of Shares Purchased |
|
|
Average Price Paid Per Share (1) |
|
|
Total Number of Shares Purchased as Part of Publicly Announced Plans or Programs |
|
|
Dollar Value of Shares that May Yet be Purchased Under the Plans or Programs (a) |
|
|||||
|
March 1 - March 31 |
|
|
612,300 |
|
|
$ |
15.66 |
|
|
|
612,300 |
|
|
|
10,377,513 |
|
|
May 1 - May 31 |
|
|
213,355 |
|
|
$ |
13.71 |
|
|
|
213,355 |
|
|
|
57,437,597 |
|
|
June 1 - June 30 |
|
|
314,634 |
|
|
$ |
12.73 |
|
|
|
314,634 |
|
|
|
53,437,600 |
|
|
August 1 - August 31 |
|
|
115,000 |
|
|
$ |
13.75 |
|
|
|
115,000 |
|
|
|
51,852,706 |
|
|
September 1 - September 30 |
|
|
169,377 |
|
|
$ |
14.23 |
|
|
|
169,377 |
|
|
|
49,437,582 |
|
|
November 1 - November 30 |
|
|
334,664 |
|
|
$ |
14.88 |
|
|
|
334,664 |
|
|
|
44,437,596 |
|
|
|
(1) |
Represents the balance before commissions and fees at the end of each period. |
The following selected consolidated financial data should be read in conjunction with Item 7 – Management’s Discussion and Analysis of Financial Condition Results of Operations and our consolidated financial statements and the related notes appearing in Item 8 – Financial Statements and Supplementary Data of this Annual Report. The consolidated statements of income data for the years ended December 31, 2016, 2015, and 2014 and the consolidated balance sheet data at December 31, 2016 and 2015 are derived from our audited consolidated financial statements appearing in Item 8 of this Annual Report on Form 10-K. The consolidated statements of income data for the years ended December 31, 2012 and 2013 and the consolidated balance sheet data at December 31, 2014, 2013 and 2012 are derived from our audited consolidated financial statements that are not included in this Annual Report on Form 10-K. The historical results are not necessarily indicative of the results to be expected in any future period.
|
Statements of Operations Data: |
|
|
|
|
|
|
|
|
|
|
|
|
|
|
|
|
|
|
|
|
|
|
|
Year Ended December 31, |
|
|
|
|
|
|||||||||||||
|
|
|
2016 |
|
|
2015 |
|
|
2014 |
|
|
2013 |
|
|
August 7, 2012 (inception) to December 31, 2012 |
|
|||||
|
|
|
(In thousands, except per share data) |
|
|||||||||||||||||
|
Revenue: |
|
|
|
|
|
|
|
|
|
|
|
|
|
|
|
|
|
|
|
|
|
Gross premiums written |
|
$ |
626,704 |
|
|
$ |
586,098 |
|
|
$ |
436,407 |
|
|
$ |
218,537 |
|
|
$ |
43,384 |
|
|
Gross premiums earned |
|
|
640,518 |
|
|
|
524,740 |
|
|
|
311,514 |
|
|
|
139,959 |
|
|
|
5,719 |
|
|
Ceded premiums |
|
|
(228,797 |
) |
|
|
(148,472 |
) |
|
|
(87,902 |
) |
|
|
(44,800 |
) |
|
|
(120 |
) |
|
Net premiums earned |
|
|
411,721 |
|
|
|
376,268 |
|
|
|
223,612 |
|
|
|
95,159 |
|
|
|
5,599 |
|
|
Net investment income and realized gains |
|
|
10,914 |
|
|
|
8,929 |
|
|
|
4,153 |
|
|
|
726 |
|
|
|
27 |
|
|
Other revenue |
|
|
16,323 |
|
|
|
9,595 |
|
|
|
6,055 |
|
|
|
28,947 |
|
|
|
4 |
|
|
Total revenue |
|
|
438,958 |
|
|
|
394,792 |
|
|
|
233,820 |
|
|
|
124,832 |
|
|
|
5,630 |
|
|
Expenses: |
|
|
|
|
|
|
|
|
|
|
|
|
|
|
|
|
|
|
|
|
|
Loss and loss adjustment expenses |
|
|
238,862 |
|
|
|
141,191 |
|
|
|
89,560 |
|
|
|
38,501 |
|
|
|
1,402 |
|
|
Other operating expenses |
|
|
143,693 |
|
|
|
103,311 |
|
|
|
70,008 |
|
|
|
30,870 |
|
|
|
8,835 |
|
|
Total expenses |
|
|
382,555 |
|
|
|
244,502 |
|
|
|
159,568 |
|
|
|
69,371 |
|
|
|
10,237 |
|
|
Income before income taxes |
|
|
56,403 |
|
|
|
150,290 |
|
|
|
74,252 |
|
|
|
55,461 |
|
|
|
(4,607 |
) |
|
Provision for income taxes |
|
|
22,538 |
|
|
|
57,778 |
|
|
|
27,155 |
|
|
|
21,248 |
|
|
|
859 |
|
|
Net income |
|
$ |
33,865 |
|
|
$ |
92,512 |
|
|
$ |
47,097 |
|
|
$ |
34,213 |
|
|
$ |
(5,466 |
) |
|
Earnings per share: |
|
|
|
|
|
|
|
|
|
|
|
|
|
|
|
|
|
|
|
|
|
Basic |
|
$ |
1.14 |
|
|
$ |
3.08 |
|
|
$ |
1.92 |
|
|
$ |
2.39 |
|
|
$ |
(0.87 |
) |
|
Diluted |
|
$ |
1.14 |
|
|
$ |
3.05 |
|
|
$ |
1.82 |
|
|
$ |
2.36 |
|
|
$ |
(0.87 |
) |
|
Ratios to gross premiums earned: |
|
|
|
|
|
|
|
|
|
|
|
|
|
|
|
|
|
|
|
|
|
Gross loss ratio |
|
|
37.3 |
% |
|
|
26.9 |
% |
|
|
28.7 |
% |
|
|
27.5 |
% |
|
|
24.5 |
% |
|
Gross expense ratio |
|
|
22.4 |
% |
|
|
19.7 |
% |
|
|
22.5 |
% |
|
|
22.0 |
% |
|
|
154.5 |
% |
|
Combined ratio |
|
|
95.4 |
% |
|
|
74.9 |
% |
|
|
79.4 |
% |
|
|
81.6 |
% |
|
|
81.1 |
% |
31
|
|
|
|
|
|
|
|
|
|
|
|
|
|
|
|
|
|
|
|
|
|
|
|
|
As of December 31, |
|
|||||||||||||||||
|
|
|
2016 |
|
|
2015 |
|
|
2014 |
|
|
2013 |
|
|
2012 |
|
|||||
|
|
|
(In thousands) |
|
|||||||||||||||||
|
Cash and invested assets |
|
$ |
708,799 |
|
|
$ |
636,373 |
|
|
$ |
491,640 |
|
|
$ |
201,236 |
|
|
$ |
76,940 |
|
|
Prepaid reinsurance premiums |
|
$ |
106,609 |
|
|
$ |
78,517 |
|
|
$ |
43,148 |
|
|
$ |
31,252 |
|
|
$ |
597 |
|
|
Deferred policy acquisition costs |
|
$ |
42,779 |
|
|
$ |
34,800 |
|
|
$ |
24,370 |
|
|
$ |
9,765 |
|
|
$ |
32 |
|
|
Total Assets |
|
$ |
1,033,244 |
|
|
$ |
837,398 |
|
|
$ |
615,031 |
|
|
$ |
281,978 |
|
|
$ |
81,864 |
|
|
Unpaid loss and loss adjustment expense |
|
$ |
140,137 |
|
|
$ |
83,722 |
|
|
$ |
51,469 |
|
|
$ |
19,344 |
|
|
$ |
1,393 |
|
|
Unearned premiums |
|
$ |
318,024 |
|
|
$ |
302,493 |
|
|
$ |
241,136 |
|
|
$ |
116,243 |
|
|
$ |
37,665 |
|
|
Note payable |
|
$ |
72,905 |
|
|
$ |
— |
|
|
$ |
— |
|
|
$ |
— |
|
|
$ |
— |
|
|
Reinsurance payable |
|
$ |
96,667 |
|
|
$ |
60,210 |
|
|
$ |
17,113 |
|
|
$ |
29,591 |
|
|
$ |
8,987 |
|
|
Total Liabilities |
|
$ |
675,285 |
|
|
$ |
480,845 |
|
|
$ |
359,942 |
|
|
$ |
181,073 |
|
|
$ |
53,745 |
|
|
Total Stockholders' Equity |
|
$ |
357,959 |
|
|
$ |
356,553 |
|
|
$ |
255,089 |
|
|
$ |
79,984 |
|
|
$ |
28,119 |
|
The following discussion and analysis of our financial condition and results of operations should be read in conjunction with our consolidated financial statements and related notes appearing elsewhere in this Annual Report. This discussion and analysis contains forward-looking statements that involve risks, uncertainties and assumptions. The actual results may differ materially from those anticipated in these forward-looking statements as a result of certain factors, including, but not limited to, those which are not within our control.
Overview: We are a property and casualty insurance holding company headquartered in Clearwater, Florida and, through our insurance subsidiaries, we provide personal residential insurance for single-family homeowners and condominium owners, and rental property insurance in the states of Florida, Hawaii, North Carolina and South Carolina. We provide commercial residential insurance in Florida and are also licensed in the states of Georgia, Alabama and Mississippi. We are vertically integrated and control or manage substantially all aspects of insurance underwriting, customer service, actuarial analysis, distribution and claims processing and adjusting. We are led by an experienced senior management team with an average of 30 years of insurance industry experience. Heritage P&C and Zephyr are both currently rated “A” (“Exceptional”) or better by Demotech, Inc. (“Demotech”), a rating agency specializing in evaluating the financial stability of insurers.
In addition to Heritage P&C and Zephyr P&C, our other subsidiaries include: Heritage MGA, LLC, the managing general agent that manages substantially all aspects of our insurance subsidiaries business; Contractors’ Alliance Network, LLC, (“CAN”) our Florida vendor network manager that also houses with BRC Restoration Specialists (“BRC”) our provider of restoration, emergency and recovery services; Skye Lane Properties, LLC, our property management subsidiary; First Access Insurance Group, LLC, our retail agency; Osprey Re Ltd (“Osprey”); our reinsurance subsidiary that provides a portion of the reinsurance protection purchased by our insurance subsidiaries; and Heritage Insurance Claims, LLC an inactive subsidiary reserved for future development.
We intend the discussion of our financial condition and results of operations that follows to provide information that will assist the reader in understanding our consolidated financial statements, the changes in certain key items in those financial statements from year to year, and the primary factors that accounted for those changes, as well as how certain accounting principles, policies and estimates affect our consolidated financial statements. This discussion should be read in conjunction with our consolidated financial statements and the related notes that appear elsewhere in this document.
Discussion of our business and overall financial results, and other highlights related to our results of operations for the periods presented.
Financial Results Highlights for the Year Ended December 31, 2016
|
|
• |
There were 323,301 policies in-force at December 31, 2016, of which approximately 52.9% were assumed from Citizens, 22.7% were acquired in connection with the Zephyr acquisition, 6.0% were assumed from SSIC and 18.4% were from Heritage P&C voluntary sales |
|
|
• |
Gross premiums written of $626.7 million and total revenue of $439 million |
|
|
• |
Net premiums earned of $411.7 million |
|
|
• |
Net income of $33.9 million |
32
|
|
• |
Cash, cash equivalents and investments of $708.8 million, with total assets of $1 billion |
Consolidated Results of Operations
The following table summarizes our results of operations for the periods indicated (in thousands, except per share amounts):
|
|
|
Year Ended December 31, |
|
|||||||||
|
|
|
2016 |
|
|
2015 |
|
|
2014 |
|
|||
|
|
|
(in thousands) |
|
|||||||||
|
REVENUE: |
|
|
|
|
|
|
|
|
|
|
|
|
|
Gross premiums written |
|
$ |
626,704 |
|
|
$ |
586,098 |
|
|
$ |
436,407 |
|
|
Change in gross unearned premiums |
|
|
13,814 |
|
|
|
(61,358 |
) |
|
|
(124,893 |
) |
|
Gross premiums earned |
|
|
640,518 |
|
|
|
524,740 |
|
|
|
311,514 |
|
|
Ceded premiums |
|
|
(228,797 |
) |
|
|
(148,472 |
) |
|
|
(87,902 |
) |
|
Net premiums earned |
|
|
411,721 |
|
|
|
376,268 |
|
|
|
223,612 |
|
|
Net investment income |
|
|
9,181 |
|
|
|
7,421 |
|
|
|
3,849 |
|
|
Net realized gains |
|
|
1,733 |
|
|
|
1,508 |
|
|
|
304 |
|
|
Other revenue |
|
|
16,323 |
|
|
|
9,595 |
|
|
|
6,055 |
|
|
Total revenue |
|
$ |
438,958 |
|
|
$ |
394,792 |
|
|
$ |
233,820 |
|
|
|
|
|
|
|
|
|
|
|
|
|
|
|
|
EXPENSES: |
|
|
|
|
|
|
|
|
|
|
|
|
|
Losses and loss adjustment expenses |
|
|
238,862 |
|
|
|
141,191 |
|
|
|
89,560 |
|
|
Policy acquisition costs |
|
|
84,421 |
|
|
|
57,186 |
|
|
|
36,510 |
|
|
General and administrative expenses |
|
|
58,910 |
|
|
|
46,125 |
|
|
|
33,498 |
|
|
Interest expense |
|
|
362 |
|
|
|
— |
|
|
|
— |
|
|
Total expenses |
|
|
382,555 |
|
|
|
244,502 |
|
|
|
159,568 |
|
|
Income before income taxes |
|
|
56,403 |
|
|
|
150,290 |
|
|
|
74,252 |
|
|
Provision for income taxes |
|
|
22,538 |
|
|
|
57,778 |
|
|
|
27,155 |
|
|
Net income |
|
$ |
33,865 |
|
|
$ |
92,512 |
|
|
$ |
47,097 |
|
|
|
|
|
|
|
|
|
|
|
|
|
|
|
|
Earnings per share |
|
|
|
|
|
|
|
|
|
|
|
|
|
Basic |
|
$ |
1.14 |
|
|
$ |
3.08 |
|
|
$ |
1.92 |
|
|
Diluted |
|
$ |
1.14 |
|
|
$ |
3.05 |
|
|
$ |
1.82 |
|
|
|
|
|
|
|
|
|
|
|
|
|
|
|
|
Selected Other Data |
|
|
|
|
|
|
|
|
|
|
|
|
|
Book value per share |
|
$ |
12.41 |
|
|
$ |
11.71 |
|
|
$ |
8.56 |
|
|
Growth in book value per share |
|
|
6.0 |
% |
|
|
36.8 |
% |
|
|
18.9 |
% |
|
Return on average equity |
|
|
9.5 |
% |
|
|
30.2 |
% |
|
|
26.5 |
% |
Key Components of our Results of Operations
Revenue
Gross premiums written. Gross premiums written represent, with respect to a period, the sum of assumed premiums written (premiums from policies that we assumed from Citizens, net of opt-outs, as well as policies acquired from SSIC) plus direct premiums written (premiums from subsequent renewals of Citizens’ policies and voluntary policies written during the period, net of any midterm cancellations), in each case prior to ceding premiums to reinsurers.
Gross premiums earned. Gross premiums earned represent the total premiums earned during a period from policies assumed from Citizens, net of opt-outs, as well as policies acquired from SSIC, subsequent renewals of such policies and voluntary policies. Premiums associated with assumed policies are earned ratably over the remaining term of the policy and premiums associated with voluntary and renewed policies are earned ratably over the twelve-month term of the policy.
Ceded premiums. Ceded premiums represent the cost of our reinsurance during a period. We recognize the cost, excluding premiums ceded to Osprey, of our reinsurance program ratably over the twelve month term of the arrangement. In most cases, our reinsurance contracts are effective June 1 and run through May 31 of the following year.
33
Net premiums earned. Net premiums earned reflect gross premiums earned less ceded premiums during the period.
Net investment income. Net investment income represents interest earned from fixed maturity securities, short term securities and other investments, dividends on equity securities, and the gains or losses from the sale of investments.
Other revenue. Other revenue represents rental income due under non-cancelable leases for space at the Company’s commercial property in Clearwater, Florida that we acquired in April 2013, and all policy and pay-plan fees. We charge policyholders a policy fee on each policy written; these fees are not subject to refund, and the Company recognizes the income immediately when collected. The Company also charges pay-plan fees to policyholders that pay its premiums in more than one installment and record the fees as income when collected. In addition, the Company records revenue earned from its restoration subsidiary for non-insurance construction as services performed using the percentage of completion method. We do not expect the revenue generated from non-insurance contracts to be material in nature and non-insurance construction revenue is expected to decline in 2017.
Expenses
Losses and loss adjustment expenses. Losses and loss adjustment expenses reflect losses paid, expenses paid to resolve claims, such as fees paid to adjusters, attorneys and investigators, and changes in our reserves for unpaid losses and loss adjustment expenses during the period, in each case net of losses ceded to reinsurers. Our reserves for unpaid losses and loss adjustment expenses represent the estimated ultimate cost of resolving all reported claims plus all losses we incurred related to insured events that we assume have occurred as of the reporting date, but that policyholders have not yet reported to us (which are commonly referred to as incurred but not reported, or “IBNR”). We estimate our reserves for unpaid losses using individual case-based estimates for reported claims and actuarial estimates for IBNR losses. We continually review and adjust our estimated losses as necessary based on industry development trends, our evolving claims experience and new information obtained. If our unpaid losses and loss adjustment expenses are considered deficient or redundant, we increase or decrease the liability in the period in which we identify the difference and reflect the change in our current period results of operations.
Policy acquisition costs. Policy acquisition costs consist of the following items: (i) commissions paid to outside agents at the time of policy issuance, (ii) policy administration fees paid to a third-party administrator at the time of policy issuance, (iii) premium taxes and (iv) inspection fees. We recognize policy acquisition costs ratably over the term of the underlying policy. Until renewed, policies assumed from Citizens have no associated policy acquisition costs. Policy acquisition costs also include the costs to acquire the SSIC policies. We recognize these costs ratably over the term of the unearned premium acquired in the transaction.
General and administrative expenses. General and administrative expenses include compensation and related benefits, professional fees, office lease and related expenses, information system expenses, corporate insurance, and other general and administrative costs.
Provision for income taxes. Provision for income taxes historically consisted of income taxes associated with our subsidiaries that are taxed as corporations. On May 22, 2014, we converted from a limited liability company to a corporation. As a corporation, we are subject to typical corporate U.S. federal and state income tax rates which we expect to result in a statutory tax rate of approximately 38.575% under current tax law.
Ratios
Ceded premium ratio. Our ceded premium ratio represents ceded premiums as a percentage of gross premiums earned.
Gross loss ratio. Our gross loss ratio represents losses and loss adjustment expenses as a percentage of gross premiums earned.
Net loss ratio. Our net loss ratio represents losses and loss adjustment expenses as a percentage of net premiums earned.
Gross expense ratio. Our gross expense ratio represents policy acquisition costs and general and administrative expenses as a percentage of gross premiums earned.
Net expense ratio. Our net expense ratio represents policy acquisition costs and general and administrative expenses as a percentage of net premiums earned.
Combined ratios. Our combined ratio on a gross basis represents the sum of ceded premiums, losses and loss adjustment expenses, policy acquisition costs and general and administrative expenses as a percentage of gross premiums earned. Our combined ratio on a net basis represents the sum of losses and loss adjustment expenses, policy acquisition costs and general and administrative expenses as a percentage of net premiums earned.
34
The combined ratio is the key measure of underwriting performance traditionally used in the property and casualty industry. A combined ratio under 100% generally reflects profitable underwriting results.
Due to the impact our reinsurance costs have on net premiums earned from period to period, our management believes the combined ratio on a gross basis is more relevant in assessing overall performance.
Results of Operations – Year Ended December 31, 2016 Compared to Year Ended December 31, 2015
Revenue
Gross premiums written
Gross premiums written increased to $626.7 million for the year ended December 31, 2016 from $586.1 million for the year ended December 31, 2015. The increase in gross premiums written relates primarily to the additional premium generated by the acquisition of Zephyr on March 21, 2016. A full year of revenue associated with the Zephyr transaction will be realized in 2017.
Gross premiums earned
Gross premiums earned increased to $640.5 million for the year ended December 31, 2016 from $524.7 million for the year ended December 31, 2015. 60% of the increase relates to Heritage P&C and 40% relates to the acquisition of Zephyr. Heritage P&C’s increase is primarily due to the impact of policies assumed from Citizens during 2015, particularly the assumptions that occurred in the second half of the year. Heritage P&C’s premium in force increased throughout 2015; a greater portion of the 2015 written premium was earned in 2016 as the policies were in force throughout 2016 and only part of 2015.
Ceded premiums
Ceded premiums increased to $228.8 million for the year ended December 31, 2016 from $148.5 million for the year ended December 31, 2015. The increase in ceded premiums correlates to the increase in policies in force, including an increase in Florida commercial residential business and the addition of Florida and Hawaii wind only policies, which have a higher cost of reinsurance, partially offset by reinsurance synergies on the combined multistate program. On June 1, 2016, we placed a new catastrophe reinsurance program for the 2016 hurricane season, as described in our audited consolidated financial statements included elsewhere in this Form 10-K. Due to our significant growth, including commercial residential and wind only business in Florida and the acquisition of ZAC in Hawaii, we purchased approximately $3 billion of total coverage compared to approximately $2.2 billion of total coverage in 2015. The cost of the catastrophe coverage for the 2016 program was approximately $247 million compared to approximately $180 million for the 2015 program. The costs of the annual reinsurance are amortized over the twelve months beginning June 1. Accordingly, the reinsurance costs for the year ended December 31, 2016 are significantly higher than for the year ended December 31, 2015.
Net premiums earned
Net premiums earned increased to $411.7 million for the year ended December 31, 2016 from $376.3 million for the year ended December 31, 2015. The increase in net premiums earned in the comparable periods is primarily attributable to the increase in the number of policies in force during the year ended December 31, 2016 as compared to the year ended December 31, 2015, including the growth in policy count experienced in the second half of 2015 partially offset by increased ceded earned premiums.
Net investment income
Net investment income, inclusive of net realized investment gains and losses, increased to $10.9 million for the year ended December 31, 2016 from $8.9 million for the year ended December 31, 2015. The increase in net investment income is due to the increase in invested assets from $400.1 million at December 31, 2015 to $603 million at December 31, 2016. The increase resulted primarily from policy growth and the acquisition of Zephyr.
Other revenue
Other revenue increased to $16 million for the year ended December 31, 2016 from $9.6 million for the year ended December 31, 2015. The increase in other revenue between the comparable periods is primarily attributable to the policy fees and pay plan fees generated by our growing portfolio of policies, including the renewal of policies previously assumed from Citizens, coupled with policy fee and pay plan income associated with Zephyr. Revenue earned from non-insurance claims generated by our restoration subsidiary also contributed to the increase.
35
Total revenue increased to $439 million for the year ended December 31, 2016 to $394.8 million for the year ended December 31, 2015. The increase in total revenue was due primarily to the growth in gross premiums earned by Heritage P&C due to timing of the increase in premium written during 2015 as well as the increase in the number of policies in force associated with the Zephyr acquisition, partially offset by the increased ceded premiums earned.
Expenses
Losses and loss adjustment expenses
Losses and loss adjustment expenses increased to $238.9 million for the year ended December 31, 2016 from $141.2 million for the year ended December 31, 2015. The increase in losses and loss adjustment expenses resulted primarily from non-catastrophe unfavorable development on prior year loss reserves, an increase in our non-catastrophe loss ratio, the impact of Hurricanes Hermine and Matthew and growth of our business. Losses and loss adjustment expenses for the year ended December 31, 2016 includes losses paid of $157.6 million and a $56.4 million increase in unpaid losses and loss adjustment expenses, which includes the addition of $36.8 million of IBNR reserves. As of December 31, 2016, we reported $140.1 million in unpaid losses and loss adjustment expenses, which included $83.6 million attributable to IBNR, or 59.7% of total reserves for unpaid losses and loss adjustment expenses.
The Company’s losses incurred during the years ended December 31, 2016 and 2015 reflect a prior year deficiency of $18.8 million and a redundancy of $5.3 million, respectively, associated with management’s best estimate of the actuarial loss and LAE reserves with consideration given to Company specific historical loss experiences. Substantially all of the unfavorable development in 2016 was from personal lines. Also, a majority of the unfavorable development in 2016 has been isolated to the tri-county region of Florida (the counties of Miami-Dade, Broward and Palm Beach). Most of the unfavorable development in 2016 came from the second, third and fourth quarters of 2015, primarily related to claims involving litigation and claims that were represented by attorneys, public adjusters or others (sometimes referred to as Assignment of Benefits). At December 31, 2015, we estimated that the personal lines ultimate loss and LAE ratio, which includes the associated IBNR would be 34.5% for the loss (accident) year 2015. As of December 31, 2016 we have revised the estimated personal lines ultimate loss ratio to be 39% for the loss year 2015, based on the re-estimation of IBNR, a 4.5 percentage point increase.
Additionally, the increase in losses and loss adjustment expenses resulted from the impact of 2016 weather events, including two named hurricanes and to the continued challenges, especially in South Florida, related to the assignment of benefit and litigated claims activity. Approximately $22 million of the increase relates to Hurricanes Hermine and Matthew. Approximately $40 million of the increase relates to elevated non-hurricane weather losses that occurred during the first quarter of 2016 and the assignment of benefit and litigation issues. Approximately $16 million of the increase in losses and loss adjustment expenses is attributable to the growth of our business.
Policy acquisition costs
Policy acquisition costs increased to $84.4 million for the year ended December 31, 2016 from $57.2 million for the year ended December 31, 2015. Approximately $9 million of the increase is attributable to the inclusion of policy acquisition costs, including amortization of certain intangibles associated with the acquisition of Zephyr. The remainder of the increase relates to the renewal of policies assumed from Citizens as well as new voluntary policies written during 2016, which have associated commissions and administration fees paid to outside agents and administrators at the time of policy issuance, premium taxes and inspection fees, none of which are associated with policies assumed from Citizens prior to their renewal. The impact of amortization of certain intangible costs associated with the Zephyr transaction increased the policy acquisition ratio by approximately 1% from 2015.
General and administrative expenses
General and administrative expenses increased to $58.9 million for the year ended December 31, 2016 from $46.1 million for the year ended December 31, 2015. The increase in 2016 was due to general and administrative expenses associated with Zephyr of approximately $4 million coupled with the growth in our infrastructure to manage the growing number of policies which results in greater costs associated with our personnel, enhancement of IT systems facilities and overall business activity. General and administrative expenses in 2016 includes amortization of certain intangible costs associated with the Zephyr acquisition.
Provision for income taxes
Provision for income taxes was $22.5 million and $57.8 million for the years ended December 31, 2016 and 2015, respectively. Our effective tax rates for the years ended December 31, 2016 and 2015 were 40% and 38.5%, respectively. The increase in the effective tax rate is primarily a result of permanent items as more fully described in Note 12 – Income Taxes to our consolidated
36
financial statements included elsewhere in this Form 10-K. The tax rate is further impacted overall due to the magnitude of pre-tax income which amplifies the impact of effective tax rate items due to lower income levels compared to the prior year.
Net Income
For the year ended December 31, 2016, we generated net income of $33.9 million, or $1.14 earnings per diluted common share, compared to net income of $92.5 million, or $3.05 earnings per diluted common share, for the year ended December 31, 2015. The weighted average shares outstanding on a diluted basis decreased from 30.3 million shares to 29.6 million shares as of December 31, 2016, primarily due to shares purchased under our Repurchase Program. The decrease in net income is primarily due to the increase in the ceded premium ratio and the increase in our 2016 loss ratio. The primary driver for the increase in the ceded premium ratio is described below. The primary drivers for the increase in the loss ratio derived from unfavorable development on prior year loss reserves coupled with the impact of Hurricanes Hermine and Matthew and current market conditions in Florida, especially South Florida, by which assignment of benefits claims and attorney represented claims have escalated and driven up loss costs. Additionally unfavorable loss development from the prior loss year was recorded in 2016 while favorable development for 2014 was recorded in 2015. The acquisition of ZAC was completed on March 21, 2016.
Ratios – Year Ended December 31, 2016 Compared to Year Ended December 31, 2015
Due to the impact our reinsurance costs have on net premiums earned from period to period, our management believes the ratios discussed below are more meaningful when viewed on a gross basis.
|
|
|
Year Ended December 31, |
|
|||||
|
|
|
2016 |
|
|
2015 |
|
||
|
Ratios to Gross Premiums Earned: |
|
(unaudited) |
|
|||||
|
Ceded premium ratio |
|
|
35.7 |
% |
|
|
28.3 |
% |
|
Loss ratio |
|
|
37.3 |
% |
|
|
26.9 |
% |
|
Expense ratio |
|
|
22.4 |
% |
|
|
19.7 |
% |
|
Combined ratio |
|
|
95.4 |
% |
|
|
74.9 |
% |
|
|
|
|
|
|
|
|
|
|
|
Ratios to Net Premiums Earned: |
|
|
|
|
|
|
|
|
|
Loss ratio |
|
|
58.0 |
% |
|
|
37.5 |
% |
|
Expense ratio |
|
|
34.8 |
% |
|
|
27.5 |
% |
|
Combined ratio |
|
|
92.8 |
% |
|
|
65.0 |
% |
Ceded premium ratio
Our ceded premium ratio increased to 35.7% for the year ended December 31, 2016 compared to 28.3% for the year ended December 31, 2015. The ceded premium ratio for the year ended December 30, 2015 benefited significantly from large Citizens depopulation activity in the fourth quarter of 2014 and first quarter of 2015, for which we incurred no additional reinsurance costs until June 1, 2015. Additionally, the 2016 reinsurance program, which was effective June 1, 2016, included coverage for an increase in commercial residential policies and the addition of Zephyr and Heritage wind only polices, all of which have a higher ceded premium ratio.
Gross loss ratio
Our gross loss ratio increased to 37.3% for the year ended December 31, 2016 from 26.9% for the year ended December 31, 2015, as a result of severe weather activity, primarily in the first quarter, Hurricanes Hermine and Matthew, unfavorable development on prior year loss reserves and current market conditions for Florida personal lines multi-peril business with respect to litigated and attorney represented claims, particularly in the tri-county area in South Florida. Additionally, favorable development on 2014 losses was recorded in 2015, while unfavorable development in 2015 losses was recorded in 2016.
Net loss ratio
Our net loss ratio increased to 58.0% for the year ended December 31, 2016 from 37.5% for the year ended December 31, 2015, primarily as a result of the items discussed above combined with the increase in the ceded premium ratio.
37
Our gross expense ratio increased to 22.4% for the year ended December 31, 2016 from 19.7% for the year ended December 31, 2015, primarily due to the larger Citizens take-out activity favorably impacting the prior year acquisition costs, coupled with an increase in the general and administration expense ratio. Amortization of intangibles associated with the Zephyr transaction added 1.1% to the gross expense ratio.
Net expense ratio
Our net expense ratio increased to 34.8% for the year ended December 31, 2016 from 27.5% for the year ended December 31, 2015, primarily due to the increase in the gross expense ratio discussed above, coupled with the higher ceded premium ratio.
Combined ratio
Our combined ratio on a gross basis increased to 95.4% for the year ended December 31, 2016 from 74.9% for the year ended December 31, 2015. Our combined ratio on a net basis increased to 92.8% for the year ended December 31, 2016 from 65% for the year ended December 31, 2015. The increase in the combined ratio is the result of the significant benefit to our ceded premium ratio and acquisition expense ratio for the year ended December 30, 2015 from the much larger Citizens take-outs in the fourth quarter of 2014 and first quarter of 2015, reducing the 2015 reinsurance and acquisition expense ratio, and the much higher gross loss ratio in the year ended December 30, 2016 due to the severe weather activity, unfavorable prior year development, and a higher loss ratio due to the current market conditions in Florida previously discussed.
Results of Operations – Year Ended December 31, 2015 Compared to Year Ended December 31, 2014
Revenue
Gross premiums written
Gross premiums written increased to $586.1 million for the year ended December 31, 2015 from $436.4 million for the year ended December 31, 2014. The increase in gross premiums written was due to the renewal of a significant number of policies previously assumed from Citizens and SSIC, the growing number of new voluntary policies written and the assumption of approximately 68,200 personal residential policies from Citizens, as well as approximately 100 commercial residential policies from Citizens in 2015. Of our gross premiums written for the year ended December 31, 2015, $487.6 million represents direct premiums written and $98.5 million represents assumed premiums written. Of the $487.6 million of direct premiums written, renewals of policies previously assumed from Citizens accounted for $393.5 million and renewals of policies previously assumed from SSIC accounted for $41.4 million, while voluntary business accounted for $92.7 million. The assumed premiums written of $98.5 million was comprised of policies assumed from Citizens.
Gross premiums earned
Gross premiums earned increased to $524.7 million for the year ended December 31, 2015 from $311.5 million for the year ended December 31, 2014. Our policies in force as of December 31, 2015 and 2014 were approximately 257,100 and 209,400, respectively, and this increase had a favorable impact on our gross premiums earned. Additionally, we experienced significant growth during the second half of 2014, including the acquisition of SSIC policies in June 2014 and the introduction of commercial residential business during the fourth quarter of 2014. This business generated earned premiums for the full year for 2015, while only generating earned premiums for partial year of 2014. Gross earned premiums from commercial residential was $97.2 million for 2015, as compared to $18.9 million for 2014.
Ceded premiums
Ceded premiums increased to $148.5 million for the year ended December 31, 2015 from $87.9 million for the year ended December 31, 2014. The increase in ceded premiums is primarily a result of the significant increase in the policies in force noted above, in particular the introduction of commercial residential business which has higher reinsurance costs as measured against gross earned premium than personal residential. The increase in ceded premiums was partially offset by lower reinsurance costs due to favorable reinsurance market conditions and the availability of lower cost reinsurance related to $477.5 million of catastrophe bonds issued by Citrus Re, and improved geographic spread of risk.
38
Net premiums earned increased to $376.3 million for the year ended December 31, 2015 from $223.6 million for the year ended December 31, 2014. The increase in net premiums earned in the comparable periods is primarily attributable to the increase in the number of policies in force during the year ended December 31, 2015 as compared to the year ended December 31, 2014, the growth in policy count experienced in the second half of 2014, partially offset by increased ceded earned premiums.
Net investment income
Net investment income, inclusive of net realized investment gains and losses, increased to $8.9 million for the year ended December 31, 2015 from $4.2 million for the year ended December 31, 2014. The increase in net investment income is due to the increase in invested assets to $400.1 million at December 31, 2015 from $331.2 million at December 31, 2014. The increase resulted primarily from policy growth and an increase in net realized gains to $1.5 million in 2015 from $0.3 million in 2014, resulting from the Company being reactive to market conditions.
Other revenue
Other revenue increased to $9.6 million for the year ended December 31, 2015 from $6.1 million for the year ended December 31, 2014. The increase in other revenue between the comparable periods is primarily attributable to the policy fees generated by our growing portfolio of new and renewed policies. Also, the rental income received pursuant to non-cancelable leases for our commercial property in Clearwater, Florida, and revenue earned from non-insurance claims generated by our restoration subsidiary contributed to the increase.
Total revenue
Total revenue increased to $394.8 million for the year ended December 31, 2015 from $233.8 million for the year ended December 31, 2014. The increase in total revenue was due primarily to the growth in net premiums earned resulting from the significant increase in the number of policies in force throughout the year ended December 31, 2015 as compared to the prior year.
Expenses
Losses and loss adjustment expenses
Losses and loss adjustment expenses increased to $141.2 million for the year ended December 31, 2015 from $89.6 million for the year ended December 31, 2014. The increase in losses and loss adjustment expenses resulted primarily from an increase in the number of policies in force between the respective periods, partially offset by a 1.8 percentage point decrease in the gross loss ratio. Losses and loss adjustment expenses for the year ended December 31, 2015 include losses paid of $57.5 million and a $32.3 million increase in unpaid losses and loss adjustment expenses, including the addition of $16.8 million of IBNR reserves. As of December 31, 2015, we reported $83.7 million in unpaid losses and loss adjustment expenses which included $46.9 million attributable to IBNR, or 56% of total reserves for unpaid losses and loss adjustment expenses.
Policy acquisition costs
Policy acquisition costs increased to $57.2 million for the year ended December 31, 2015 from $36.5 million for the year ended December 31, 2014. The increase is primarily attributable to the significant increase in new and renewed policies, which have associated commissions and administration fees paid to outside agents and administrators at the time of policy issuance, premium taxes and inspection fees, none of which are associated with policies assumed from Citizens prior to their renewal. This was partially offset by the fact that, $7.6 million of the $10 million SSIC policy acquisition fee was amortized during the year ended December 31, 2014, compared to only $2.4 million during the year ended December 31, 2015.
General and administrative expenses
General and administrative expenses increased to $46.1 million for the year ended December 31, 2015 from $33.5 million for the year ended December 31, 2014. The increase in 2015 was due primarily to the growth in our infrastructure resulting in greater costs associated with our personnel, facilities and overall business activity.
39
Provision for income taxes was $57.8 million and $27.2 million for the years ended December 31, 2015 and 2014, respectively. Our effective tax rates for the years ended December 31, 2015 and 2014 were 38.6% and 36.6%, respectively. The increase in the effective tax rate is a result of prior period adjustments and more favorable permanent differences in 2014.
Net Income
For the year ended December 31, 2015 we generated net income of $92.5 million, or $3.05 earnings per diluted common share, compared to net income of $47.1 million, or $1.82 earnings per diluted common share, for the year ended December 31, 2014. The weighted average shares outstanding on a diluted basis increased from 25.8 million shares to 30.3 million shares as of December 31, 2015, primarily due to the issuance of IPO shares mid-year 2014 causing 2014 diluted shares to be lower.
Ratios – Year Ended December 31, 2015 Compared to Year Ended December 31, 2014
Due to the impact our reinsurance costs have on net premiums earned from period to period, our management believes the ratios discussed below are more meaningful when viewed on a gross basis.
|
|
|
Year Ended December 31, |
|
|||||
|
|
|
|
|
|||||
|
|
|
2015 |
|
|
2014 |
|
||
|
Ratios to Gross Premiums Earned: |
|
(unaudited) |
|
|||||
|
Ceded premium ratio |
|
|
28.3 |
% |
|
|
28.2 |
% |
|
Loss ratio |
|
|
26.9 |
% |
|
|
28.7 |
% |
|
Expense ratio |
|
|
19.7 |
% |
|
|
22.5 |
% |
|
Combined ratio |
|
|
74.9 |
% |
|
|
79.4 |
% |
|
|
|
|
|
|
|
|
|
|
|
Ratios to Net Premiums Earned: |
|
|
|
|
|
|
|
|
|
Loss ratio |
|
|
37.5 |
% |
|
|
40.1 |
% |
|
Expense ratio |
|
|
27.5 |
% |
|
|
31.3 |
% |
|
Combined ratio |
|
|
65.0 |
% |
|
|
71.4 |
% |
Ceded premium ratio
Our ceded premium ratio was relatively unchanged at 28.3% for the year ended December 31, 2015 compared to 28.2% for the year ended December 31, 2014.
Gross loss ratio
Our gross loss ratio decreased to 26.9% for the year ended December 31, 2015 from 28.7% for the year ended December 31, 2014, primarily due to the introduction of commercial residential business during the quarter ended December 31, 2014, which has a significantly lower loss ratio then personal residential. Commercial residential represented 18.5% of total gross earned premiums in 2015 compared to 6.1% in 2014.
Net loss ratio
Our net loss ratio decreased to 37.5% for the year ended December 31, 2015 from 40.1% for the year ended December 31, 2014, primarily as a result of the increase in commercial residential business in 2015.
Gross expense ratio
Our gross expense ratio decreased to 19.7% for the year ended December 31, 2015 from 22.5% for the year ended December 31, 2014, primarily as a result of general and administrative expenses increasing at significantly slower pace than gross premiums earned.
Net expense ratio
Our net expense ratio decreased to 27.5% for the year ended December 31, 2015 from 31.3% for the year ended December 31, 2014, primarily as a result of general and administration expenses increasing at significantly slower pace than gross premiums earned.
40
Our combined ratio on a gross basis decreased to 74.9% for the year ended December 31, 2015 from 79.4% for the year ended December 31, 2014. Our combined ratio on a net basis decreased to 65% for the year ended December 31, 2015 from 71.4% for the year ended December 31, 2014. The changes in our combined ratio, on both a gross and net basis, are primarily as a result of the improvement of the loss and expense ratios to earned premiums, as discussed above.
Liquidity and Capital Resources
As of December 31, 2016, we had $105.8 million of cash and cash equivalents, which primarily consisted of cash and money market accounts. We intend to hold substantial cash balances during hurricane season to meet seasonal liquidity needs and the collateral requirements of Osprey, our captive reinsurance company described below. We also had $20.9 million in restricted cash to meet our contractual obligations related to the Catastrophe bonds issued by Citrus Re.
Osprey is required to maintain a collateral trust account equal to the risk that it assumes from our insurance company affiliates, less amounts collateralized through a letter of credit. As of December 31, 2016, $12.8 million was held in Osprey’s trust account, $12.7 million was collateralized with a letter of credit, and there was a net premium receivable from Heritage P&C of $14.6 million which was paid on February 7, 2017. At December 31, 2016, Osprey provided $20 million excess $20 million of reinsurance coverage to Heritage P&C and Zephyr and $20 million excess $0 to Heritage P&C under two different reinsurance programs.
Although we can provide no assurances, we believe that we maintain sufficient liquidity to pay our insurance company affiliate’s claims and expenses, as well as to satisfy commitments in the event of unforeseen events such, inadequate premium rates, or reserve deficiencies. We maintain a comprehensive reinsurance program at levels management considers adequate to diversify risk and safeguard our financial position.
As of December 31, 2016, we had 28,840,443 shares of common stock outstanding, options to purchase 1,149,923 shares of common stock, at a weighted average price of $16.28 and 900,000 unvested shares of restricted common stock, reflecting total paid-in capital of $205.7 million as of such date.
We believe our current capital resources, together with cash provided from our operations, will be sufficient to meet currently anticipated working capital requirements. We cannot provide assurance, however, that such will be the case in the future.
On December 15, 2016, we issued Senior Notes in the aggregate principal amount of $79.5 million which consisted of a 7 year term note payable to 6 accredited investors. See Note 11 — “Note Payable” to our consolidated financial statements under Item 8 of this Annual Report on Form 10-K.
Statement of Cash Flows
The net increases (decreases) in cash and cash equivalents are summarized in the following table:
|
|
|
For the Year Ended December 31, |
|
|||||||||||||||||
|
|
|
2016 |
|
|
2015 |
|
|
2014 |
|
|
2016 vs 2015 Change |
|
|
2015 vs 2014 Change |
|
|||||
|
Net cash provided by (used in): |
|
(in thousands) |
|
|||||||||||||||||
|
Operating activities |
|
$ |
75,130 |
|
|
$ |
153,121 |
|
|
$ |
194,196 |
|
|
$ |
(77,991 |
) |
|
$ |
(41,075 |
) |
|
Investing activities |
|
|
(249,416 |
) |
|
|
(86,964 |
) |
|
|
(200,047 |
) |
|
|
(162,452 |
) |
|
|
113,083 |
|
|
Financing activities |
|
|
43,826 |
|
|
|
9,639 |
|
|
|
101,273 |
|
|
|
34,187 |
|
|
|
(91,634 |
) |
|
Net increase (decrease) in cash and cash equivalents |
|
$ |
(130,460 |
) |
|
$ |
75,796 |
|
|
$ |
95,422 |
|
|
$ |
(206,256 |
) |
|
$ |
(19,626 |
) |
Operating Activities
Net cash provided by operating activities for December 31, 2016 was $75.1 million as compared to $153.1 million cash provided during the year ended December 31, 2015. The decrease resulted primarily from the timing of assumed premium payments from Citizens, reinsurance premium payments, claim payments, and tax deposit payments.
Investing Activities
Net cash used in investing activities for the year ended December 31, 2016 was $249.4 million as compared to $86.9 million for the year ended December 31, 2015, reflecting the investment of funds provided by operating activities including the acquisition of Zephyr.
41
Net cash provided by financing activities for the year ended December 31, 2016 was $43.8 million, as compared to $9.6 million for the year ended December 31, 2015. In December 2016, the Company entered into a debt arrangement providing net proceeds in the amount of $77.9 million. This was partially offset by payment of dividends to shareholders and purchase of treasury stock in 2016.
Taxation
Deferred Tax Liability and Current Tax Receivable
In prior years we reported a deferred tax asset arising from the portion (20%) of unearned premiums that are otherwise recognized as taxable income in advance of being earned for financial reporting purposes. In 2016, there was a shift to a deferred tax liability. The deferred tax liability is created from purchase accounting for the Zephyr acquisition which created temporary differences due to the timing of tax deductions related to the purchased intangibles. In prior years we reported a net deferred tax asset which was driven primarily by the deferred tax asset arising from the portion (20%) of unearned premiums that are otherwise recognized as taxable income in advance of being earned for financial reporting purposes which was partially offset by deferred tax liabilities associated with policy acquisition costs deferred and amortized for financial statement purposes, but deducted currently for tax. In 2016, the Company reported a net deferred tax liability. The change from 2015 was primarily driven by an increase in deferred tax liabilities associated with Zephyr purchased intangibles for which the Company has no tax basis. Furthermore, the Company had recorded deferred tax liabilities associated with partnership investments for which the book basis is greater than the corresponding tax basis largely due to accelerated taxable losses being recorded in the current year. Our current year income taxes recoverable reflects excess estimated tax deposits over the tax to be remitted to the US Treasury. The excess payments are largely the result of the estimation process required by the Internal Revenue Service throughout the year to pay estimated quarterly deposits which indicated larger annualized tax liability than was actually realized at December 31. Our current year income taxes recoverable reflect this temporary difference between taxable income and earned income reported in our financial statements.
Conversion to a Corporation
On May 22, 2014, Heritage Insurance Holdings, Inc. was converted from a limited liability company to a corporation. As a limited liability company, Heritage Insurance was treated as a partnership for tax purposes, and accordingly was not subject to entity-level federal or state income taxation. Our income tax provision generally consists of income taxes payable by our separate subsidiaries that are taxed as corporations and which have been taxed as such since our inception. As such, our effective tax rate as a limited liability company has historically been driven primarily by the taxable income recognized by our subsidiaries. As a corporation, we are subject to typical corporate U.S. federal and state income tax rates which we generally expect to result in a statutory tax rate of approximately 38.575% under current tax law.
Contractual Obligations and Commitments
The following table summarizes our material contractual obligations and commitments as of December 31, 2016:
|
|
|
Total |
|
|
Less than 1 year |
|
|
1-3 Years |
|
|
3-5 years |
|
|
More than 5 years |
|
|||||
|
|
|
(in thousands) |
|
|||||||||||||||||
|
Long-term debt (1) |
|
$ |
124,495 |
|
|
$ |
7,390 |
|
|
$ |
24,437 |
|
|
$ |
25,407 |
|
|
$ |
67,261 |
|
|
Reinsurance contracts |
|
|
96,667 |
|
|
|
96,667 |
|
|
|
— |
|
|
|
— |
|
|
|
— |
|
|
Total |
|
$ |
221,162 |
|
|
$ |
104,057 |
|
|
$ |
24,437 |
|
|
$ |
25,407 |
|
|
$ |
67,261 |
|
|
|
1. |
Amount differs from the balance presented on the consolidated balance sheet at December 31, 2016 because the long term debt amount above includes interest and excludes issuance costs. |
Critical Accounting Policies and Estimates
The preparation of our consolidated financial statements requires us to make judgments and estimates that may have a significant impact upon our financial results. Note 1, under Item 8, Financial Statements and Supplementary Data — Notes to Consolidated Financial Statements, of this Annual Report contains a summary of our significant accounting policies, many of which require the use of estimates and assumptions. We believe that the following areas are particularly subject to management’s judgments and estimates and could materially affect our results of operations and financial position.
42
Premiums. We recognize direct and assumed premiums written as revenue, net of ceded amounts, on a daily pro rata basis over the contract period of the related policies that are in force. For any portion of premiums not earned at the end of the reporting period, we record an unearned premium liability.
Premiums receivable represents amounts due from our policyholders for billed premiums and related policy fees. We perform a policy-level evaluation to determine the extent to which the balance of the premium receivable exceeds the balance of the unearned premium. We then age any resulting exposure based on the last date the policy was billed to the policyholder, and we establish an allowance account for credit losses for any amounts outstanding for more than 90 days. When we receive payments on amounts previously charged off, we credit bad debt expense in the period we receive the payment. Balances in premiums receivable and the associated allowance account are removed upon cancellation of the policy due to non-payment. We recorded an allowance of $0 and $250,000 for uncollectible premiums at December 31, 2016 and 2015, respectively.
When we receive premium payments from policyholders prior to the effective date of the related policy, we record an advance premium liability. On the policy effective date, we reduce the advance premium liability and record the premiums as described above.
Reserves for Unpaid Losses and Loss Adjustment Expenses. Reserves for unpaid losses and loss adjustment expenses, also referred to as loss reserves, represent the most significant accounting estimate inherent in the preparation of our financial statements. These reserves represent management’s best estimate of the amount we will ultimately pay for losses and loss adjustment expenses and we base the amount upon the application of various actuarial reserve estimation techniques as well as considering other material facts and circumstances known at the balance sheet date.
We establish two categories of loss reserves as follows:
|
|
• |
Case reserves—When a claim is reported, we establish an initial estimate of the losses that will ultimately be paid on the reported claim. Our initial estimate for each claim is based upon the judgment of our claims professionals who are familiar with property and liability losses associated with the coverage offered by our policies. Then, our claims personnel perform an evaluation of the type of claim involved, the circumstances surrounding each claim and the policy provisions relating to the loss and adjust the reserve as necessary. As claims mature, we increase or decrease the reserve estimates as deemed necessary by our claims department based upon additional information we receive regarding the loss, the results of on-site reviews and any other information we gather while reviewing the claims. |
|
|
• |
IBNR reserves—Our IBNR reserves include true IBNR reserves plus “bulk” reserves. True IBNR reserves represent amounts related to claims for which a loss occurred on or before the date of the financial statements but which have not yet been reported to us. Bulk reserves represent additional amounts that cannot be allocated to particular claims, but which are necessary to estimate ultimate losses on known claims. We estimate our IBNR reserves by projecting our ultimate losses using industry accepted actuarial methods and then deducting actual loss payments and case reserves from the projected ultimate losses. We review and adjust our IBNR reserves on a quarterly basis based on information available to us at the balance sheet date. |
When we establish our reserves, we analyze various factors such as the evolving historical loss experience of the insurance industry as well as our experience, claims frequency and severity, our business mix, our claims processing procedures, legislative enactments, judicial decisions and legal developments in imposition of damages, and general economic conditions, including inflation. A change in any of these factors from the assumptions implicit in our estimates will cause our ultimate loss experience to be better or worse than indicated by our reserves, and the difference could be material. Due to the interaction of the foregoing factors, there is no precise method for evaluating the impact of any one specific factor in isolation, and an element of judgment is ultimately required. Due to the uncertain nature of any future projections, the ultimate amount we will pay for losses will be different from the reserves we record.
We determine our ultimate loss reserves by selecting an estimate within a relevant range of indications that we calculate using generally accepted actuarial techniques. Our selection of the point estimate is influenced by the analysis of our paid losses and incurred losses since inception, as well as industry information relevant to the population of exposures drawn from Citizens.
Our chief actuary evaluated the adequacy of our reserves as of December 31, 2016 and concluded that total reserves ranging from a low of $129.4 million to a high of 145.9 million would meet the requirements of the insurance laws of Florida, be consistent with reserves computed in accordance with accepted loss reserving standards and principles, and make a reasonable provision for all unpaid loss and loss adjustment expense obligations under the terms of our contracts and agreements. In addition to $56.5 million of recorded case reserves, we recorded $83.6 million of IBNR reserves as of December 31, 2016 to achieve overall gross reserves of $140.1 million.
43
The process of establishing our reserves is complex and inherently imprecise, as it involves using judgment that is affected by many variables. We believe a reasonably likely change in almost any of the factors we evaluate as part of our loss reserve analysis could have an impact on our reported results, financial position and liquidity.
The following table quantifies the pro forma impact of hypothetical changes in our loss reserves on our net income, stockholders’ equity and liquidity as of and for the year ended December 31, 2016 (in thousands).
|
|
|
Actual |
|
|
Low Estimate |
|
|
% Change from Actual |
|
|
High Estimate |
|
|
% Change from Actual |
|
|||||
|
Loss Reserves |
|
$ |
140,137 |
|
|
$ |
129,388 |
|
|
|
|
|
|
$ |
145,944 |
|
|
|
|
|
|
|
|
|
|
|
|
|
|
|
|
|
|
|
|
|
|
|
|
|
|
|
|
Impact on: |
|
|
|
|
|
|
|
|
|
|
|
|
|
|
|
|
|
|
|
|
|
Net income |
|
$ |
33,865 |
|
|
$ |
40,469 |
|
|
|
19.5 |
% |
|
$ |
30,299 |
|
|
|
-10.5 |
% |
|
Stockholders’ equity |
|
$ |
357,959 |
|
|
$ |
364,562 |
|
|
|
1.8 |
% |
|
$ |
354,392 |
|
|
|
-1.0 |
% |
|
Cash, cash equivalents and investments |
|
$ |
708,799 |
|
|
$ |
708,799 |
|
|
|
— |
|
|
$ |
708,799 |
|
|
|
— |
|
|
Adjusted cash, cash equivalents and investments |
|
$ |
622,720 |
|
|
$ |
629,322 |
|
|
|
1.1 |
% |
|
$ |
619,152 |
|
|
|
-0.6 |
% |
|
(1) |
Adjusted cash, cash equivalents and investments is intended to present a measure of future liquidity and consists of cash, cash equivalents and investments, less loss reserves, net of taxes, assuming a 38.575% tax rate. |
Policy Acquisition Costs. We incur policy acquisition costs that vary with, and are directly related to, the production of new business. Policy acquisition costs consist of the following four items: (i) commissions paid to outside agents at the time of policy issuance, (ii) policy administration fees paid to a third-party administrator at the time of policy issuance, (iii) premium taxes and (iv) inspection fees. We capitalize policy acquisition costs to the extent recoverable, then we amortize those costs over the contract period of the related policy.
At each reporting date, we determine whether we have a premium deficiency. A premium deficiency would result if the sum of our expected losses, deferred policy acquisition costs and policy maintenance costs (such as costs to store records and costs incurred to collect premiums and pay commissions) exceeded our related unearned premiums plus investment income. Should we determine that a premium deficiency exists, we would write off the unrecoverable portion of deferred policy acquisition costs.
Reinsurance. We follow industry practice of reinsuring a portion of our risks. Reinsurance involves transferring, or “ceding”, all or a portion of the risk exposure on policies we write to another insurer, known as a reinsurer. To the extent that our reinsurers are unable to meet the obligations they assume under our reinsurance agreements, we remain liable for the entire insured loss.
Our reinsurance agreements are short-term, prospective contracts. We record an asset, prepaid reinsurance premiums, and a liability, reinsurance payable, for the entire contract amount upon commencement of our new reinsurance agreements. We amortize our prepaid reinsurance premiums over the 12-month contract period.
In the event that we incur losses recoverable under our reinsurance program, we record amounts recoverable from our reinsurers on paid losses plus an estimate of amounts recoverable on unpaid losses. The estimate of amounts recoverable on unpaid losses is a function of our liability for unpaid losses associated with the reinsured policies; therefore, the amount changes in conjunction with any changes to our estimate of unpaid losses. In the event that we incur losses recoverable under the reinsurance program, the estimate of amounts recoverable from reinsurers on unpaid losses may change at any point in the future because of its relation to our reserves for unpaid losses.
We estimate uncollectible amounts receivable from reinsurers based on an assessment of factors including the creditworthiness of the reinsurers and the adequacy of collateral obtained, where applicable. We recorded no uncollectible amounts under our reinsurance program or bad debt expense related to reinsurance for the years ended December 31, 2016 and December 31, 2015.
Investments. We currently classify all of our investments in fixed maturity securities and equity securities as available-for-sale, and report them at fair value. We classified our investment in a mortgage loan as held to maturity and report it at amortized cost. Subsequent to our acquisition of available-for-sale securities, we record changes in value through the date of disposition as unrealized holding gains and losses, net of tax effects, and include them as a component of other comprehensive income. We include realized gains and losses, which we calculate using the specific-identification method for determining the cost of securities sold, in net income. We amortize any premium or discount on investments over the remaining maturity period of the related investments using the effective interest method, and we report the amortization in net investment income. We recognize dividends and interest income when earned.
44
Quarterly, we perform an assessment of our investments to determine if any are “other-than-temporarily” impaired. An investment is impaired when the fair value of the investment declines to an amount less than the cost or amortized cost of that investment. As part of our assessment process, we determine whether the impairment is temporary or “other-than-temporary”. We base our assessment on both quantitative criteria and qualitative information, considering a number of factors including, but not limited to: how long the security has been impaired; the amount of the impairment; whether, in the case of equity securities, we intend to hold, and have the ability to hold, the security for a period sufficient for us to recover our cost basis, or whether, in the case of debt securities, we intend to sell the investment or it is more likely than not that we will have to sell the investment before we recover the amortized cost; the financial condition and near-term prospects of the issuer; whether the issuer is current on contractually-obligated interest and principal payments; key corporate events pertaining to the issuer and whether the market decline was affected by macroeconomic conditions.
If we were to determine that an equity security has incurred an “other-than-temporary” impairment, we would permanently reduce the cost of the security to fair value and recognize an impairment charge. If a debt security loan is impaired and we either intend to sell the security loan or it is more likely than not that we will have to sell the security loan before we are able to recover the amortized cost, then we would record the full amount of the impairment in our net income.
A large portion of our investment portfolio consists of fixed maturity securities, which may be adversely affected by changes in interest rates as a result of governmental monetary policies, domestic and international economic and political conditions and other factors beyond our control. A rise in interest rates would decrease the net unrealized holding gains of our investment portfolio, offset by our ability to earn higher rates of return on funds reinvested. Conversely, a decline in interest rates would increase the net unrealized holding gains of our investment portfolio, offset by lower rates of return on funds reinvested.
Fair Value. Fair value is the price that would be received to sell an asset or paid to transfer a liability in an orderly transaction between market participants (an exit price). When reporting the fair values of the Company’s financial instruments, the Company prioritizes those fair value measurements into one of three levels based on the nature of the inputs, as follows:
|
• |
Level 1—Assets and liabilities with values based on unadjusted quoted prices for identical assets or liabilities in an active market that the Company is able to access; |
|
• |
Level 2—Asset and liabilities with values based on quoted prices for similar assets or liabilities in active markets; quoted prices for identical or similar assets in markets that are not active; or valuation models with inputs that are observable, directly or indirectly for substantially the term of the asset or liability. |
|
• |
Level 3—Assets and liabilities with values that are based on prices or valuation techniques that require inputs that are both unobservable and significant to the overall fair value measurement. Unobservable inputs reflect the Company’s estimates of the assumptions that market participants would use in valuing the assets and liabilities. |
We estimate the fair value of our investments using the closing prices on the last business day of the reporting period, obtained from active markets. For securities for which quoted prices in active markets are unavailable, we use observable inputs such as quoted prices in inactive markets, quoted prices in active markets for similar instruments, benchmark interest rates, broker quotes and other relevant inputs. We do not have any investments in our portfolio which require us to use unobservable inputs. Our estimates of fair value reflect the interest rate environment that existed as of the close of business on December 31, 2016 and December 31, 2015. Changes in interest rates subsequent to December 31, 2016 may affect the fair value of our investments.
The carrying amounts for the following financial instruments approximate their fair values at December 31, 2016 and December 31, 2015 because of their short-term nature: cash and cash equivalents, accrued investment income, premiums receivable, reinsurance payable, and accounts payable and accrued expenses.
Our non-financial assets, such as goodwill, purchased intangible assets, and property and equipment are carried at cost until there are indicators of impairment, and are recorded at fair value only when an impairment charge is recognized.
Stock-Based Compensation. We recognize compensation expense under ASC 718 for stock-based payments based on the fair value of the awards. The Company grants stock options at exercise prices equal to the fair market value of the Company’s stock on the dates the options are granted. The options have a maximum term of ten years from the date of grant and vest primarily in equal annual installments over a range of one to five year periods following the date of grant for employee options. If a participant’s employment relationship ends, the participant’s vested awards will remain exercisable for the shorter of a period of 30 days or the period ending on the latest date on which such award could have been exercisable. The fair value of each option grant is separately estimated for each grant date. The fair value of each option is amortized into compensation expense on a straight-line basis between the grant date for the award and each vesting date. The Company estimates the fair value of all stock option awards as of the date of the grant by applying the Black-Scholes-Merton multiple-option pricing valuation model. The application of this valuation model involves assumptions that
45
are judgmental and highly sensitive in the determination of compensation expense. The fair value of restricted stock awards are estimated by the market price at the date of grant and amortized on a straight-line basis to expense over the period of vesting. We recorded $3.1 million, $2.6 million and $3.3 million of stock-based compensation in 2016, 2015 and 2014, respectively.
Long-term Debt and Debt issuance costs. On December 15, 2016, the Company entered into a Senior Secured Note (the “Notes”) with six accredited investors. The Notes has a total debt capacity of $80.0 million. The Company received net proceeds from the Note of $77.9 million. The Notes have a maturity date of December 15, 2023 and bear interest at a rate equal to a three-month average of LIBOR plus 8.75% per annum. The Company incurred 2% of gross proceeds in debt issuance costs or $1.6 million which consist of fees and expenses incurred in connection with the Note issuance, including legal, accounting and other related fees and a 6% one-time finders’ fee of $4.8 million. The debt issuance costs are amortized using the effective interest method over the terms of the debt issuance. The amortization expense is included in interest expense in the Company’s Consolidated Statements of Income and Comprehensive Income. Under the guidance of ASU No. 2015-03, the debt financing costs related to recognized debt liabilities is required to be presented on our balance sheet as a direct reduction, or contra liability, from the carrying value of the debt. At December 31, 2016, the Company has recorded on its balance sheet the net debt liability of $72.9 million. For the years ended December 31, 2016 and 2015, the Company capitalized $6.6 million and $0, in total capitalized debt insurance costs, respectively.
Interest. Costs associated with the refinancing or issuance of debt, as well as debt discounts or premiums, are recorded as interest over the term of its related debt. The Company may enter into interest rate exchange agreements; the amount to be paid or received under such agreements is accrued and recognized over the life of the agreements as an adjustment to interest expense.
Income taxes. On May 22, 2014, the Company converted from a limited liability company to a corporation. As a limited liability company, the Company was treated as a partnership for tax purposes, and accordingly was not subject to entity-level federal or state income taxation. The Company’s income tax provision generally consisted of income taxes payable by its separate subsidiaries that are taxed as corporations. As such, the Company’s effective tax rate as a limited liability company has historically been driven primarily by the taxable income recognized with respect to gross premiums written. As a corporation, the Company is subject to typical corporate U.S. federal and state income tax rates on a consolidated basis which it expects to result in a statutory tax rate of approximately 38.575% under current tax law.
We recognize deferred tax assets and liabilities for the future tax consequences attributable to differences between the financial statement carrying amounts of existing assets and liabilities and their respective tax bases. We measure deferred tax assets and liabilities using enacted tax rates expected to apply to taxable income in the years in which we expect to recover or settle those temporary differences. Should a change in tax rates occur, we recognize the effect on deferred tax assets and liabilities in operations in the period that includes the enactment date. Realization of our deferred income tax assets depends upon our generation of sufficient future taxable income.
We recognize the financial statement benefit of a tax position only after determining that the relevant tax authority would more likely than not sustain the position following an audit. For tax positions meeting the more likely than not threshold, the amount recognized in the consolidated financial statements is the largest benefit that has a greater than 50% likelihood of being realized upon ultimate settlement with the relevant taxing authority.
We record any income tax penalties and income tax-related interest as income tax expense in the period incurred. We did not incur any material tax penalties or income tax-related interest during the years ended December 31, 2016, 2015 and 2014.
Recent Accounting Pronouncements Adopted
In April 2015, the Financial Accounting Standards Board (“FASB”) issued guidance for Simplifying the Presentation of Debt Issuance Costs. This guidance requires debt issuance costs (deferred financing costs) related to a recognized debt liability to be presented on the balance sheet as a direct deduction from the related debt liability, similar to the presentation of debt discounts. The update is effective for fiscal years beginning after December 15, 2015 and interim periods within those fiscal years. Additionally, in August 2015, the FASB issued additional guidance, which provides further clarification on the same topic and states that the SEC would not object to the deferral and presentation of debt issuance costs as an asset and subsequent amortization of the deferred costs over the term of the line-of-credit arrangement, regardless of whether there are any outstanding borrowings on the line-of-credit arrangement. This guidance does not have a material effect on our consolidated financial statements as it results only in a reclassification on the Consolidated Statements of Assets and Liabilities. Accordingly, there was no impact on net asset value or net increase in net assets resulting from operations as a result of adoption of this guidance.
In May 2015, issued guidance addressing enhanced disclosure requirements for insurers relating to short-duration insurance contract claims and the unpaid claims liability rollforward for short-duration contracts. The disclosures are intended to provide users of financial statements with more transparent information about an insurance entity’s initial claim estimates and subsequent
46
adjustments to those estimates, the methodologies and judgments used to estimate claims, and the timing, frequency, and severity of claims. The guidance is effective for annual reporting periods beginning after December 15, 2015. Early application is permitted. The Company adopted this guidance effective January 1, 2016. The adoption of this guidance results in additional disclosures but did not impact the Company’s results of operations, financial position or liquidity.
Recent Accounting Pronouncements Not Yet Effective
The Company describes the recent pronouncements that have had or may have a significant effect on its financial statements or on its disclosures. The Company does not discuss recent pronouncements that a) are not anticipated to have an impact on, or b) are unrelated to its financial condition, results of operations, or related disclosures. For accounting pronouncements not yet adopted, refer to “Note 1. Basis of Presentation, Nature of Business and Significant Accounting Policies and Practices” in the notes to the consolidated financial statements.
Seasonality of our Business
Our insurance business is seasonal as hurricanes typically occur during the period from June 1 through November 30 each year. With our reinsurance program effective on June 1 each year, any variation in the cost of our reinsurance, whether due to changes to reinsurance rates or changes in the total insured value of our policy base will occur and be reflected in our financial results beginning June 1 of each year, subject to certain adjustments.
Off-Balance Sheet Arrangements
We obtained a $12.7 million irrevocable letter of credit from a financial institution to secure Osprey’s obligations arising from our reinsurance program. We collateralized this letter of credit facility with otherwise unencumbered real estate. The letter of credit terminates on May 31, 2017.
JOBS Act
We qualify as an “emerging growth company” under the JOBS Act. Section 107 of the JOBS Act provides that an emerging growth company can take advantage of the extended transition period provided in Section 7(a)(2)(B) of the Securities Act for complying with new or revised accounting standards. In other words, an emerging growth company can delay the adoption of certain accounting standards until those standards would otherwise apply to private companies. We have irrevocably elected not to avail ourselves of this extended transition period and, as a result, we will adopt new or revised accounting standards on the relevant dates on which adoption of such standards is required for other public companies.
We are in the process of evaluating the benefits of relying on other exemptions and reduced reporting requirements provided by the JOBS Act. Subject to certain conditions set forth in the JOBS Act, if as an emerging growth company we choose to rely on such exemptions, we may not be required to, among other things, (i) provide an auditor’s attestation report on our systems of internal controls over financial reporting pursuant to Section 404 of the Sarbanes-Oxley Act of 2002, (ii) provide all of the compensation disclosure that may be required of non-emerging growth public companies under the Dodd-Frank Wall Street Reform and Consumer Protection Act, (iii) comply with any requirement that may be adopted by the Public Company Accounting Oversight Board regarding mandatory audit firm rotation or a supplement to the auditor’s report providing additional information about the audit and the financial statements (auditor discussion and analysis), and (iv) disclose certain executive compensation-related items such as the correlation between executive compensation and performance and comparisons of the Chief Executive Officer’s compensation to median employee compensation. These exemptions will apply until we no longer meet the requirements of being an emerging growth company. We will remain an emerging growth company until the earlier of (1) the last day of the year (a) following the fifth anniversary of the completion of our initial public offering, (b) in which we have total annual gross revenue of at least $1 billion or (c) in which we are deemed to be a large accelerated filer, which means the market value of our common stock that is held by non-affiliates exceeds $700 million as of the last business day of our prior second quarter, and (2) the date on which we have issued more than $1 billion in non-convertible debt during the prior three-year period.
Impact of Inflation and Changing Prices
The consolidated financial statements and related data presented herein have been prepared in accordance with generally accepted accounting principles which require the measurement of financial position and operating results in terms of historical dollars without considering changes in the relative purchasing power of money over time due to inflation. Our primary assets are monetary in nature. As a result, interest rates have a more significant impact on our performance than the effects of the general levels of inflation. Interest rates do not necessarily move in the same direction or with the same magnitude as the cost of paying losses and LAE.
47
Insurance premiums are established before we know the amount of loss and LAE and the extent to which inflation may affect such expenses. Consequently, we attempt to anticipate the future impact of inflation when establishing rate levels. While we attempt to charge adequate rates, we may be limited in raising our premium levels for competitive and regulatory reasons. Inflation also affects the market value of our investment portfolio and the investment rate of return. Any future economic changes which result in prolonged and increasing levels of inflation could cause increases in the dollar amount of incurred loss and LAE and thereby materially adversely affect future liability requirements.
Our investment portfolios at December 31, 2016 included fixed-maturity and equity securities, the purposes of which are not for trading or speculation. Our main objective is to maximize after-tax investment income and maintain sufficient liquidity to meet policyholder obligations while minimizing market risk which is the potential economic loss from adverse fluctuations in securities’ prices. We consider many factors including credit ratings, investment concentrations, regulatory requirements, anticipated fluctuation of interest rates, durations and market conditions in developing investment strategies. Investment securities are managed by a group of nationally recognized asset managers and are overseen by the investment committee appointed by our board of directors. Our investment portfolios are primarily exposed to interest rate risk, credit risk and equity price risk. We classify our fixed-maturity and equity securities as available-for-sale and report any unrealized gains or losses, net of deferred income taxes, as a component of other comprehensive income within our stockholders’ equity. As such, any material temporary changes in their fair value can adversely impact the carrying value of our stockholders’ equity.
Interest Rate Risk
Our fixed-maturity securities are sensitive to potential losses resulting from unfavorable changes in interest rates. We manage the risk by analyzing anticipated movement in interest rates and considering our future capital needs.
The following table illustrates the impact of hypothetical changes in interest rates to the fair value of our fixed-maturity securities at December 31, 2016 (in thousands):
|
Hypothetical Change in Interest rates |
|
Estimated Fair Value After Change |
|
|
Change In Estimated Fair Value |
|
|
Percentage Increase (Decrease) in Estimated Fair Value |
|
|||
|
300 basis point increase |
|
$ |
515,571 |
|
|
$ |
(55,440 |
) |
|
|
(10 |
)% |
|
200 basis point increase |
|
$ |
534,048 |
|
|
$ |
(36,963 |
) |
|
|
(6 |
)% |
|
100 basis point increase |
|
$ |
552,529 |
|
|
$ |
(18,482 |
) |
|
|
(3 |
)% |
|
100 basis point decrease |
|
$ |
589,635 |
|
|
$ |
18,624 |
|
|
|
3 |
% |
|
200 basis point decrease |
|
$ |
606,742 |
|
|
$ |
35,731 |
|
|
|
6 |
% |
|
300 basis point decrease |
|
$ |
616,578 |
|
|
$ |
45,567 |
|
|
|
8 |
% |
Credit risk can expose us to potential losses arising principally from adverse changes in the financial condition of the issuer of our fixed maturities. We mitigate this risk by investing in fixed-maturities that are generally investment grade and by diversifying our investment portfolio to avoid concentrations in any single issuer or market sector.
48
The following table presents the composition of our fixed-maturity portfolio by rating at December 31, 2016 (in thousands):
|
Comparable Rating |
|
Amortized Cost |
|
|
% of Total Amortized Cost |
|
|
Fair Value |
|
|
% of Total Fair Value |
|
||||
|
AAA |
|
$ |
223,540 |
|
|
|
39 |
% |
|
$ |
221,563 |
|
|
|
39 |
% |
|
AA+ |
|
$ |
64,060 |
|
|
|
11 |
% |
|
$ |
62,892 |
|
|
|
11 |
% |
|
AA |
|
$ |
70,242 |
|
|
|
12 |
% |
|
$ |
69,192 |
|
|
|
12 |
% |
|
AA- |
|
$ |
44,276 |
|
|
|
8 |
% |
|
$ |
43,606 |
|
|
|
8 |
% |
|
A+ |
|
$ |
47,733 |
|
|
|
8 |
% |
|
$ |
47,107 |
|
|
|
8 |
% |
|
A |
|
$ |
48,132 |
|
|
|
9 |
% |
|
$ |
47,832 |
|
|
|
8 |
% |
|
A- |
|
$ |
35,385 |
|
|
|
6 |
% |
|
$ |
35,317 |
|
|
|
6 |
% |
|
BBB+ |
|
$ |
30,300 |
|
|
|
5 |
% |
|
$ |
30,414 |
|
|
|
5 |
% |
|
BBB |
|
$ |
7,414 |
|
|
|
1 |
% |
|
$ |
7,367 |
|
|
|
1 |
% |
|
BBB- |
|
$ |
2,613 |
|
|
|
1 |
% |
|
$ |
2,551 |
|
|
|
1 |
% |
|
BB+ |
|
$ |
491 |
|
|
|
0 |
% |
|
$ |
465 |
|
|
|
0 |
% |
|
BB- |
|
$ |
1,104 |
|
|
|
0 |
% |
|
$ |
1,107 |
|
|
|
0 |
% |
|
B |
|
$ |
476 |
|
|
|
0 |
% |
|
$ |
472 |
|
|
|
0 |
% |
|
NA and NR |
|
$ |
1,145 |
|
|
|
0 |
% |
|
$ |
1,126 |
|
|
|
0 |
% |
|
Total |
|
$ |
576,911 |
|
|
|
100 |
% |
|
$ |
571,011 |
|
|
|
100 |
% |
Our equity investment portfolio at December 31, 2016 consists of common stocks and redeemable and nonredeemable preferred stocks. We may incur potential losses due to adverse changes in equity security prices. We manage this risk primarily through industry and issuer diversification and asset allocation techniques.
The following table illustrates the composition of our equity portfolio at December 31, 2016 (in thousands):
|
|
|
|
|
|
|
% of Total |
|
|
|
|
|
Estimated Fair Value |
|
|
Estimated Fair value |
|
||
|
Stocks by sector: |
|
|
|
|
|
|
|
|
|
Financial |
|
$ |
4,214 |
|
|
|
13 |
% |
|
Energy |
|
|
12,905 |
|
|
|
41 |
% |
|
Other |
|
|
14,688 |
|
|
|
46 |
% |
|
Subtotal |
|
$ |
31,807 |
|
|
|
100 |
% |
|
Mutual Funds and ETF By type: |
|
|
|
|
|
|
|
|
|
Equity |
|
$ |
164 |
|
|
|
0 |
% |
|
Subtotal |
|
|
164 |
|
|
|
0 |
% |
|
Total |
|
$ |
31,971 |
|
|
|
100 |
% |
Foreign Currency Exchange Risk
At December 31, 2016, we did not have any material exposure to foreign currency related risk.
49
HERITAGE INSURANCE HOLDINGS, INC.
INDEX OF CONSOLIDATED FINANCIAL STATEMENTS
|
|
|
Page |
|
|
|
|
|
|
51 |
|
|
|
|
|
|
Consolidated Balance Sheets as of December 31, 2016 and December 31, 2015 |
|
52 |
|
|
|
|
|
|
53 |
|
|
|
|
|
|
|
54 |
|
|
|
|
|
|
Consolidated Statements of Cash Flows for the Years Ended December 31, 2016, 2015 and 2014 |
|
55 |
|
|
|
|
|
|
56 |
50
REPORT OF INDEPENDENT REGISTERED PUBLIC ACCOUNTING FIRM
Board of Directors and Shareholders
Heritage Insurance Holdings Inc.
We have audited the accompanying consolidated balance sheets of Heritage Insurance Holdings, Inc. (a Delaware corporation) and subsidiaries (the “Company”) as of December 31, 2016 and 2015, and the related consolidated statements of income and comprehensive income, changes in stockholders’ equity, and cash flows for each of the three years in the period ended December 31, 2016. These financial statements are the responsibility of the Company’s management. Our responsibility is to express an opinion on these financial statements based on our audits.
We conducted our audits in accordance with the standards of the Public Company Accounting Oversight Board (United States). Those standards require that we plan and perform the audit to obtain reasonable assurance about whether the financial statements are free of material misstatement. We were not engaged to perform an audit of the Company’s internal control over financial reporting. Our audits included consideration of internal control over financial reporting as a basis for designing audit procedures that are appropriate in the circumstances, but not for the purpose of expressing an opinion on the effectiveness of the Company’s internal control over financial reporting. Accordingly, we express no such opinion. An audit also includes examining, on a test basis, evidence supporting the amounts and disclosures in the financial statements, assessing the accounting principles used and significant estimates made by management, as well as evaluating the overall financial statement presentation. We believe that our audits provide a reasonable basis for our opinion.
In our opinion, the consolidated financial statements referred to above present fairly, in all material respects, the financial position of Heritage Insurance Holdings, Inc. and subsidiaries as of December 31, 2016 and 2015, and the results of their operations and their cash flows for each of the three years in the period ended December 31, 2016 in conformity with accounting principles generally accepted in the United States of America.
/s/ GRANT THORNTON LLP
Tampa, Florida
March 15, 2017
51
HERITAGE INSURANCE HOLDINGS, INC.
(In thousands, except share and per share data)
|
|
|
December 31, |
|
|||||
|
|
|
2016 |
|
|
2015 |
|
||
|
ASSETS |
|
|
|
|
|
|
|
|
|
Fixed maturity securities, available for sale, at fair value (amortized cost of $576,911 and $370,967 in 2016 and 2015, respectively) |
|
$ |
571,011 |
|
|
$ |
371,783 |
|
|
Equity securities, available for sale, at fair value (cost of $34,190 and $32,439 in 2016 and 2015, respectively) |
|
|
31,971 |
|
|
|
28,313 |
|
|
Total investments |
|
|
602,982 |
|
|
|
400,096 |
|
|
Cash and cash equivalents |
|
|
105,817 |
|
|
|
236,277 |
|
|
Restricted cash |
|
|
20,910 |
|
|
|
13,085 |
|
|
Accrued investment income |
|
|
4,764 |
|
|
|
3,409 |
|
|
Premiums receivable, net |
|
|
42,720 |
|
|
|
30,565 |
|
|
Prepaid reinsurance premiums |
|
|
106,609 |
|
|
|
78,517 |
|
|
Income taxes receivable |
|
|
10,713 |
|
|
|
— |
|
|
Deferred income taxes |
|
|
— |
|
|
|
7,964 |
|
|
Deferred policy acquisition costs, net |
|
|
42,779 |
|
|
|
34,800 |
|
|
Property and equipment, net |
|
|
17,179 |
|
|
|
17,111 |
|
|
Intangibles, net |
|
|
26,542 |
|
|
|
2,120 |
|
|
Goodwill |
|
|
46,454 |
|
|
|
8,028 |
|
|
Other assets |
|
|
5,775 |
|
|
|
5,426 |
|
|
Total Assets |
|
$ |
1,033,244 |
|
|
$ |
837,398 |
|
|
|
|
|
|
|
|
|
|
|
|
LIABILITIES AND STOCKHOLDERS' EQUITY |
|
|
|
|
|
|
|
|
|
Unpaid losses and loss adjustment expenses |
|
$ |
140,137 |
|
|
$ |
83,722 |
|
|
Unearned premiums |
|
|
318,024 |
|
|
|
302,493 |
|
|
Reinsurance payable |
|
|
96,667 |
|
|
|
60,210 |
|
|
Note payable, net of issuance costs |
|
|
72,905 |
|
|
|
— |
|
|
Deferred income taxes |
|
|
3,003 |
|
|
|
— |
|
|
Income tax payable |
|
|
— |
|
|
|
2,092 |
|
|
Advance premiums |
|
|
18,565 |
|
|
|
12,138 |
|
|
Accrued compensation |
|
|
4,303 |
|
|
|
2,305 |
|
|
Other liabilities |
|
|
21,681 |
|
|
|
17,885 |
|
|
Total Liabilities |
|
$ |
675,285 |
|
|
$ |
480,845 |
|
|
Commitments and contingencies (Note 14) |
|
|
|
|
|
|
|
|
|
|
|
|
|
|
|
|
|
|
|
Stockholders’ Equity: |
|
|
|
|
|
|
|
|
|
Common stock, $0.0001 par value, 50,000,000 shares authorized, 29,740,441 shares issued and 28,840,443 outstanding at December 31, 2016 and 30,441,410 issued and outstanding at December 31, 2015 |
|
|
3 |
|
|
|
3 |
|
|
Additional paid-in capital |
|
|
205,727 |
|
|
|
202,628 |
|
|
Accumulated other comprehensive loss |
|
|
(5,018 |
) |
|
|
(2,033 |
) |
|
Treasury stock, at cost, 1,759,330 shares at December 31, 2016 |
|
|
(25,562 |
) |
|
|
— |
|
|
Retained earnings |
|
|
182,809 |
|
|
|
155,955 |
|
|
Total Stockholders' Equity |
|
|
357,959 |
|
|
|
356,553 |
|
|
Total Liabilities and Stockholders' Equity |
|
$ |
1,033,244 |
|
|
$ |
837,398 |
|
The accompanying notes are an integral part of these consolidated financial statements.
52
HERITAGE INSURANCE HOLDINGS, INC.
CONSOLIDATED STATEMENTS OF INCOME AND COMPREHENSIVE INCOME
(In thousands, except share and per share data)
|
|
|
For the Year Ended December 31, |
|
|||||||||
|
|
|
2016 |
|
|
2015 |
|
|
2014 |
|
|||
|
REVENUES: |
|
|
|
|
|
|
|
|
|
|
|
|
|
Gross premiums written |
|
$ |
626,704 |
|
|
$ |
586,098 |
|
|
$ |
436,407 |
|
|
Change in gross unearned premiums |
|
|
13,814 |
|
|
|
(61,358 |
) |
|
|
(124,893 |
) |
|
Gross premiums earned |
|
|
640,518 |
|
|
|
524,740 |
|
|
|
311,514 |
|
|
Ceded premiums |
|
|
(228,797 |
) |
|
|
(148,472 |
) |
|
|
(87,902 |
) |
|
Net premiums earned |
|
|
411,721 |
|
|
|
376,268 |
|
|
|
223,612 |
|
|
Net investment income |
|
|
9,181 |
|
|
|
7,421 |
|
|
|
3,849 |
|
|
Net realized gains |
|
|
1,733 |
|
|
|
1,508 |
|
|
|
304 |
|
|
Other revenue |
|
|
16,323 |
|
|
|
9,595 |
|
|
|
6,055 |
|
|
Total revenues |
|
|
438,958 |
|
|
|
394,792 |
|
|
|
233,820 |
|
|
EXPENSES: |
|
|
|
|
|
|
|
|
|
|
|
|
|
Losses and loss adjustment expenses |
|
|
238,862 |
|
|
|
141,191 |
|
|
|
89,560 |
|
|
Policy acquisition costs |
|
|
84,421 |
|
|
|
57,186 |
|
|
|
36,510 |
|
|
General and administrative expenses |
|
|
58,910 |
|
|
|
46,125 |
|
|
|
33,498 |
|
|
Total expenses |
|
|
382,193 |
|
|
|
244,502 |
|
|
|
159,568 |
|
|
Operating income |
|
|
56,765 |
|
|
|
150,290 |
|
|
|
74,252 |
|
|
Interest expense, net |
|
|
321 |
|
|
|
— |
|
|
|
— |
|
|
Amortization of debt issuance costs |
|
|
41 |
|
|
|
— |
|
|
|
— |
|
|
Income before income taxes |
|
|
56,403 |
|
|
|
150,290 |
|
|
|
74,252 |
|
|
Provision for income taxes |
|
|
22,538 |
|
|
|
57,778 |
|
|
|
27,155 |
|
|
Net income |
|
|
33,865 |
|
|
|
92,512 |
|
|
|
47,097 |
|
|
OTHER COMPREHENSIVE INCOME: |
|
|
|
|
|
|
|
|
|
|
|
|
|
Change in net unrealized (losses) gains on investments |
|
|
(3,120 |
) |
|
|
(4,606 |
) |
|
|
4,395 |
|
|
Reclassification adjustment for net realized investment gain |
|
|
(1,733 |
) |
|
|
(1,508 |
) |
|
|
(304 |
) |
|
Income tax (expense) benefit related to items of other comprehensive income |
|
|
1,868 |
|
|
|
2,358 |
|
|
|
(1,578 |
) |
|
Total comprehensive income |
|
$ |
30,880 |
|
|
$ |
88,756 |
|
|
$ |
49,610 |
|
|
Weighted average shares outstanding |
|
|
|
|
|
|
|
|
|
|
|
|
|
Basic |
|
|
29,632,171 |
|
|
|
30,056,491 |
|
|
|
24,568,876 |
|
|
Diluted |
|
|
29,634,349 |
|
|
|
30,326,468 |
|
|
|
25,816,560 |
|
|
Earnings per share |
|
|
|
|
|
|
|
|
|
|
|
|
|
Basic |
|
$ |
1.14 |
|
|
$ |
3.08 |
|
|
$ |
1.92 |
|
|
Diluted |
|
$ |
1.14 |
|
|
$ |
3.05 |
|
|
$ |
1.82 |
|
The accompanying notes are an integral part of these consolidated financial statements.
53
HERITAGE INSURANCE HOLDINGS, INC.
CONSOLIDATED STATEMENTS OF CHANGES IN STOCKHOLDERS’ EQUITY
(In thousands, except share and per share data)
|
|
|
Common Stock |
|
|
|
|
|
|
|
|
|
|
|
|
|
|
|
|
|
|
|
|
|
|||||
|
|
|
Shares |
|
|
Amount |
|
|
Additional Paid-In Capital |
|
|
Retained Earnings |
|
|
Treasury Stock |
|
|
Accumulated Other Comprehensive Income (Loss) |
|
|
Total Stockholders' Equity |
|
|||||||
|
Balance at December 31, 2013 |
|
|
14,007,150 |
|
|
$ |
1 |
|
|
$ |
62,849 |
|
|
$ |
17,924 |
|
|
$ |
— |
|
|
$ |
(790 |
) |
|
$ |
79,984 |
|
|
Temporary equity reclassified to equity |
|
|
2,338,350 |
|
|
|
— |
|
|
|
20,921 |
|
|
|
— |
|
|
|
— |
|
|
|
— |
|
|
|
20,921 |
|
|
Issuance of equity |
|
|
17,850 |
|
|
|
— |
|
|
|
88 |
|
|
|
— |
|
|
|
— |
|
|
|
— |
|
|
|
88 |
|
|
Net unrealized change in investments, net of tax |
|
|
— |
|
|
|
— |
|
|
|
— |
|
|
|
— |
|
|
|
— |
|
|
|
2,513 |
|
|
|
2,513 |
|
|
Issuance of common stock equity in initial public offering and private placement, net of discount fee and direct costs of issuance of $6,530 |
|
|
6,909,091 |
|
|
|
1 |
|
|
|
69,469 |
|
|
|
— |
|
|
|
— |
|
|
|
— |
|
|
|
69,470 |
|
|
Issuance of common stock to underwriters for over allotment, net of discount fee and direct costs of issuance of $700 |
|
|
900,000 |
|
|
|
— |
|
|
|
9,200 |
|
|
|
— |
|
|
|
— |
|
|
|
— |
|
|
|
9,200 |
|
|
Exercise of warrants |
|
|
5,622,519 |
|
|
|
1 |
|
|
|
22,514 |
|
|
|
— |
|
|
|
— |
|
|
|
— |
|
|
|
22,515 |
|
|
Stock-based compensation |
|
|
— |
|
|
|
— |
|
|
|
3,301 |
|
|
|
— |
|
|
|
— |
|
|
|
— |
|
|
|
3,301 |
|
|
Net income |
|
|
— |
|
|
|
— |
|
|
|
— |
|
|
|
47,097 |
|
|
|
— |
|
|
|
— |
|
|
|
47,097 |
|
|
Balance at December 31, 2014 |
|
|
29,794,960 |
|
|
|
3 |
|
|
|
188,342 |
|
|
|
65,021 |
|
|
|
— |
|
|
|
1,723 |
|
|
|
255,089 |
|
|
Net unrealized change in investments, net of tax |
|
|
— |
|
|
|
— |
|
|
|
— |
|
|
|
— |
|
|
|
— |
|
|
|
(3,756 |
) |
|
|
(3,756 |
) |
|
Issuance of 79,850 shares of stock in connection with the acquisition of BRC Restoration |
|
|
79,850 |
|
|
|
— |
|
|
|
2,000 |
|
|
|
— |
|
|
|
— |
|
|
|
— |
|
|
|
2,000 |
|
|
Exercise of stock options and warrants |
|
|
566,600 |
|
|
|
— |
|
|
|
8,900 |
|
|
|
— |
|
|
|
— |
|
|
|
— |
|
|
|
8,900 |
|
|
Stock-based compensation |
|
|
— |
|
|
|
— |
|
|
|
2,647 |
|
|
|
— |
|
|
|
— |
|
|
|
— |
|
|
|
2,647 |
|
|
Excess tax benefit on stock-based compensation |
|
|
— |
|
|
|
— |
|
|
|
739 |
|
|
|
— |
|
|
|
— |
|
|
|
— |
|
|
|
739 |
|
|
Dividends declared on common stock |
|
|
— |
|
|
|
— |
|
|
|
— |
|
|
|
(1,578 |
) |
|
|
— |
|
|
|
— |
|
|
|
(1,578 |
) |
|
Net income |
|
|
— |
|
|
|
— |
|
|
|
— |
|
|
|
92,512 |
|
|
|
— |
|
|
|
— |
|
|
|
92,512 |
|
|
Balance at December 31, 2015 |
|
|
30,441,410 |
|
|
|
3 |
|
|
|
202,628 |
|
|
|
155,955 |
|
|
|
— |
|
|
|
(2,033 |
) |
|
|
356,553 |
|
|
Net unrealized change in investments, net of tax |
|
|
— |
|
|
|
— |
|
|
|
— |
|
|
|
— |
|
|
|
— |
|
|
|
(2,985 |
) |
|
|
(2,985 |
) |
|
Stock buy-back |
|
|
(1,759,330 |
) |
|
|
— |
|
|
|
— |
|
|
|
— |
|
|
|
(25,562 |
) |
|
|
— |
|
|
|
(25,562 |
) |
|
Shares tendered for income tax withholding |
|
|
(66,637 |
) |
|
|
— |
|
|
|
(977 |
) |
|
|
— |
|
|
|
— |
|
|
|
— |
|
|
|
(977 |
) |
|
Stock-based compensation on vested restricted stock |
|
|
225,000 |
|
|
|
— |
|
|
|
4,815 |
|
|
|
— |
|
|
|
— |
|
|
|
— |
|
|
|
4,815 |
|
|
Dividends declared on common stock |
|
|
— |
|
|
|
— |
|
|
|
— |
|
|
|
(7,011 |
) |
|
|
— |
|
|
|
— |
|
|
|
(7,011 |
) |
|
Excess tax expense on stock-based compensation |
|
|
— |
|
|
|
— |
|
|
|
(739 |
) |
|
|
— |
|
|
|
— |
|
|
|
— |
|
|
|
(739 |
) |
|
Net income |
|
|
— |
|
|
|
— |
|
|
|
— |
|
|
|
33,865 |
|
|
|
— |
|
|
|
— |
|
|
|
33,865 |
|
|
Balance at December 31, 2016 |
|
|
28,840,443 |
|
|
$ |
3 |
|
|
$ |
205,727 |
|
|
$ |
182,809 |
|
|
$ |
(25,562 |
) |
|
$ |
(5,018 |
) |
|
$ |
357,959 |
|
|
|
|
|
|
|
|
|
|
|
|
|
|
|
|
|
|
|
|
|
|
|
|
|
|
|
|
|
|
|
The accompanying notes are an integral part of these consolidated financial statements.
54
HERITAGE INSURANCE HOLDINGS, INC.
CONSOLIDATED STATEMENTS OF CASH FLOWS
(In thousands)
|
|
|
For the Year Ended December 31, |
|
|||||||||
|
|
|
2016 |
|
|
2015 |
|
|
2014 |
|
|||
|
OPERATING ACTIVITIES |
|
|
|
|
|
|
|
|
|
|
|
|
|
Net income |
|
$ |
33,865 |
|
|
$ |
92,512 |
|
|
$ |
47,097 |
|
|
Adjustments to reconcile net income to net cash provided by operating activities: |
|
|
|
|
|
|
|
|
|
|
|
|
|
Stock-based compensation |
|
|
4,815 |
|
|
|
2,647 |
|
|
|
3,301 |
|
|
Amortization of bond discount |
|
|
8,016 |
|
|
|
6,246 |
|
|
|
2,531 |
|
|
Depreciation and amortization |
|
|
8,976 |
|
|
|
1,350 |
|
|
|
777 |
|
|
Bad debt expense |
|
|
— |
|
|
|
(250 |
) |
|
|
250 |
|
|
Net realized gains |
|
|
(1,733 |
) |
|
|
(1,508 |
) |
|
|
(304 |
) |
|
Deferred income taxes, net of acquired |
|
|
3,103 |
|
|
|
1,016 |
|
|
|
(3,764 |
) |
|
Changes in operating assets and liabilities: |
|
|
|
|
|
|
|
|
|
|
|
|
|
Accrued investment income |
|
|
(1,355 |
) |
|
|
(792 |
) |
|
|
(1,646 |
) |
|
Premiums receivable, net |
|
|
(10,754 |
) |
|
|
(10,287 |
) |
|
|
(9,931 |
) |
|
Restricted cash |
|
|
(7,825 |
) |
|
|
(8,746 |
) |
|
|
(4,339 |
) |
|
Prepaid reinsurance premiums |
|
|
(23,300 |
) |
|
|
(35,369 |
) |
|
|
(11,896 |
) |
|
Reinsurance premiums receivable |
|
|
— |
|
|
|
— |
|
|
|
5,337 |
|
|
Income taxes receivable |
|
|
(10,713 |
) |
|
|
— |
|
|
|
5,073 |
|
|
Deferred policy acquisition costs, net |
|
|
(7,979 |
) |
|
|
(10,430 |
) |
|
|
(14,605 |
) |
|
Other assets |
|
|
177 |
|
|
|
(2,594 |
) |
|
|
(2,554 |
) |
|
Unpaid losses and loss adjustment expenses |
|
|
56,415 |
|
|
|
32,253 |
|
|
|
32,125 |
|
|
Unearned premiums |
|
|
(13,814 |
) |
|
|
61,358 |
|
|
|
124,893 |
|
|
Reinsurance payable |
|
|
36,457 |
|
|
|
43,097 |
|
|
|
(12,478 |
) |
|
Income taxes payable |
|
|
(2,092 |
) |
|
|
(10,716 |
) |
|
|
10,003 |
|
|
Accrued compensation |
|
|
779 |
|
|
|
1,863 |
|
|
|
(63 |
) |
|
Advance premiums |
|
|
4,336 |
|
|
|
6,995 |
|
|
|
1,314 |
|
|
Other liabilities |
|
|
(2,244 |
) |
|
|
(15,524 |
) |
|
|
23,075 |
|
|
Net cash provided by operating activities |
|
|
75,130 |
|
|
|
153,121 |
|
|
|
194,196 |
|
|
INVESTING ACTIVITIES |
|
|
|
|
|
|
|
|
|
|
|
|
|
Proceeds from sales and maturities of investments available for sale |
|
|
180,190 |
|
|
|
151,307 |
|
|
|
38,738 |
|
|
Purchases of investments available for sale |
|
|
(317,666 |
) |
|
|
(237,946 |
) |
|
|
(231,070 |
) |
|
Proceeds from sale of investment in mortgage loan |
|
|
— |
|
|
|
6,849 |
|
|
|
(786 |
) |
|
Acquisition of a business, net of cash acquired |
|
|
(110,319 |
) |
|
|
(6,000 |
) |
|
|
— |
|
|
Cost of property and equipment acquired |
|
|
(1,621 |
) |
|
|
(1,174 |
) |
|
|
(6,929 |
) |
|
Net cash used in investing activities |
|
|
(249,416 |
) |
|
|
(86,964 |
) |
|
|
(200,047 |
) |
|
FINANCING ACTIVITIES |
|
|
|
|
|
|
|
|
|
|
|
|
|
Proceeds from issuance of equity and redeemable shares |
|
|
— |
|
|
|
— |
|
|
|
88 |
|
|
Proceeds from debt, net of issuance costs |
|
|
77,910 |
|
|
|
— |
|
|
|
— |
|
|
Excess tax (expense) benefit on stock-based compensation |
|
|
(739 |
) |
|
|
739 |
|
|
|
— |
|
|
Shares tendered for income tax withholding |
|
|
(977 |
) |
|
|
— |
|
|
|
— |
|
|
Purchase of treasury stock |
|
|
(25,562 |
) |
|
|
— |
|
|
|
— |
|
|
Dividends |
|
|
(6,806 |
) |
|
|
— |
|
|
|
— |
|
|
Proceeds from issuance of equity from initial public offering, net of discount fee and expense |
|
|
— |
|
|
|
— |
|
|
|
78,670 |
|
|
Proceeds from exercise of stock options and warrants |
|
|
— |
|
|
|
8,900 |
|
|
|
22,515 |
|
|
Net cash provided by financing activities |
|
|
43,826 |
|
|
|
9,639 |
|
|
|
101,273 |
|
|
(Decrease)/increase in cash and cash equivalents |
|
|
(130,460 |
) |
|
|
75,796 |
|
|
|
95,422 |
|
|
Cash and cash equivalents, beginning of period |
|
|
236,277 |
|
|
|
160,481 |
|
|
|
65,059 |
|
|
Cash and cash equivalents, end of period |
|
$ |
105,817 |
|
|
$ |
236,277 |
|
|
$ |
160,481 |
|
|
Supplemental Cash Flows Information: |
|
|
|
|
|
|
|
|
|
|
|
|
|
Income taxes paid, net |
|
$ |
31,912 |
|
|
$ |
68,824 |
|
|
$ |
13,038 |
|
|
Temporary equity reclassified to equity |
|
$ |
— |
|
|
$ |
— |
|
|
$ |
20,921 |
|
|
Supplemental Disclosure of Non-Cash Investing and Financing Activities |
|
|
|
|
|
|
|
|
|
|
|
|
|
Issuance of shares for consideration in the acquisition of a business |
|
$ |
— |
|
|
$ |
2,000 |
|
|
$ |
— |
|
The accompanying notes are an integral part of these consolidated financial statements.
55
HERITAGE INSURANCE HOLDINGS, INC.
NOTES TO CONSOLIDATED FINANCIAL STATEMENTS
|
Note 1. |
Basis of Presentation, Nature of Business and Significant Accounting Policies and Practices |
Business Description
Heritage Insurance Holdings, Inc. (the “Company”, “we”, “our”, “us”) was initially formed as a Florida limited liability company in 2012. On January 1, 2014, the Company formed a Delaware limited liability company, also named Heritage Insurance Holdings, LLC and merged with it in order to domicile the Company in Delaware. Effective May 22, 2014, Heritage Insurance Holdings, LLC converted into a Delaware corporation named Heritage Insurance Holdings, Inc. As used in these consolidated financial statements, the terms “the Company”, “we”, “our” and “us” also refer to Heritage Insurance Holdings, LLC and its consolidated subsidiaries prior to our conversion to a Delaware corporation.
Our insurance subsidiaries are Heritage Property & Casualty Insurance Company (“Heritage P&C”) and Zephyr Insurance Company (“Zephyr”). Our other subsidiaries include: Heritage MGA, LLC (“MGA”), the managing general agent that manages substantially all aspects of our insurance subsidiaries’ business; Contractors’ Alliance Network, LLC, our vendor network manager, which includes BRC Restoration Specialists, Inc., our restoration service; Skye Lane Properties, LLC, our property management subsidiary; First Access Insurance Group, LLC, our retail agency; Osprey Re Ltd,; our reinsurance subsidiary that provides a portion of the reinsurance protection purchased by our insurance subsidiaries; and Zephyr Acquisition Company (“ZAC”) and its wholly-owned subsidiary Heritage Insurance Claims, LLC, an inactive subsidiary reserved for future development.
Our primary products are personal and commercial residential insurance, which we currently offer in Florida, North Carolina, South Carolina, Georgia and through the Zephyr acquisition, Hawaii. We conduct our operations under a single reporting segment.
Basis of Presentation
The consolidated financial statements include the accounts of Heritage Insurance Holdings, Inc. and its wholly-owned subsidiaries. The accompanying consolidated financial statements include the accounts of the Company and all other entities in which the Company has a controlling financial interest (none of which are variable interest entities). All intercompany accounts and transactions have been eliminated in consolidation.
The Company qualifies as an “emerging growth company” as defined in Section 2(a)(19) of the Securities Act, as modified by the Jumpstart Our Business Startups Act of 2012 (the “JOBS Act”). As a result, the Company is eligible for certain exemptions from various reporting requirements applicable to other public companies that are not emerging growth companies. The Company intends to continue to take advantage of some, but not all, of the exemptions available to emerging growth companies until such time that it is no longer an emerging growth company. The Company has, however, irrevocably elected not to take advantage of the extended transition period afforded by the JOBS Act for the implementation of new or revised accounting standards. As a result, the Company will comply with new or revised accounting standards on the relevant dates on which adoption of such standards is required for non-emerging growth companies.
Use of Estimates
The preparation of consolidated financial statements in conformity with United States Generally Accepted Accounting Principles (“U.S. GAAP”) requires us to make estimates and assumptions about future events that affect the amounts reported in our consolidated financial statements and accompanying notes. We evaluate our estimates on an ongoing basis when updated information related to such estimates becomes available. We base our estimates on historical experience and information available to us at the time these estimates are made. Actual results could differ materially from these estimates.
Cash and Cash Equivalents
The Company’s cash and cash equivalents include demand deposits with financial institutions and short-term, highly-liquid financial instruments with original maturities of three months or less when purchased. The carrying amounts reported in the consolidated balance sheets for interest bearing deposits approximate their fair value because of the short maturity of these financial instruments.
56
Certain prior year amounts have been reclassified to conform to current year presentation. Such classifications include goodwill and intangibles from other assets in the accompanying consolidated balance sheets.
Restricted Cash
As of December 31, 2016 and 2015, restricted cash was $20.9 million and $13.1 million, respectively. Heritage P&C holds approximately $19.3 million relating to a reinsurance agreement with an entity that issued catastrophe (“CAT”) bonds, as Heritage P&C is contractually required to deposit two installments of reinsurance premiums into a trust account.
Investments
The Company classifies all of its investments in fixed maturity securities and equity securities as available-for-sale, and reports them at fair value. Subsequent to its acquisition of available-for-sale securities, the Company records changes in value through the date of disposition as unrealized holding gains and losses, net of tax effects, and includes them as a component of other comprehensive income. The Company includes realized gains and losses, which it calculates using the specific-identification method for determining the cost of securities sold, in net income. The Company amortizes any premium or discount on fixed maturities over the remaining maturity period of the related securities using the effective interest method, and reports the amortization in net investment income. The Company recognizes dividends and interest income when earned.
Quarterly, the Company performs an assessment of its investments to determine if any are “other-than-temporarily” impaired. An investment is impaired when the fair value of the investment declines to an amount less than the cost or amortized cost of that investment. As part of the assessment process, the Company determines whether the impairment is temporary or “other-than-temporary”. The Company bases its assessment on both quantitative criteria and qualitative information, considering a number of factors including, but not limited to: how long the security has been impaired; the amount of the impairment; whether, in the case of equity securities, the Company intends to hold, and have the ability to hold, the security for a period sufficient for us to recover our cost basis, or whether, in the case of debt securities and participations in mortgage loans, the Company intends to sell the investment or it is more likely than not that the Company will have to sell the investment before it recovers the amortized cost or cost; the financial condition and near-term prospects of the issuer; whether the issuer is current on contractually-obligated interest and principal payments; key corporate events pertaining to the issuer and whether the market decline was affected by macroeconomic conditions.
If the Company were to determine that an equity security has incurred an “other-than-temporary” impairment, the Company would permanently reduce the cost of the security to fair value and recognize an impairment charge in its consolidated statements of operations and comprehensive income. If a debt security or participation in a commercial mortgage loan was impaired and the Company either intends to sell the investment or it is more likely than not that the Company will have to sell the investment before it is able to recover the amortized cost or cost, then the Company would record the full amount of the impairment in its consolidated statement of operations and other comprehensive income.
A large portion of the Company’s investment portfolio consists of fixed maturity securities, which may be adversely affected by changes in interest rates as a result of governmental monetary policies, domestic and international economic and political conditions and other factors beyond its control. A rise in interest rates would decrease the net unrealized holding gains of our investment portfolio, offset by the Company’s ability to earn higher rates of return on funds reinvested. Conversely, a decline in interest rates would increase the net unrealized holding gains of our investment portfolio, offset by lower rates of return on funds reinvested.
Accumulated other comprehensive income consists solely of unrealized gains and loss investments and is presented net of income tax.
Fair Value
Fair value is the price that would be received to sell an asset or paid to transfer a liability in an orderly transaction between market participants (an exit price). When reporting the fair values of the Company’s financial instruments, the Company prioritizes those fair value measurements into one of three levels based on the nature of the inputs, as follows:
|
• |
Level 1—Assets and liabilities with values based on unadjusted quoted prices for identical assets or liabilities in an active market that the Company is able to access; |
|
• |
Level 2—Asset and liabilities with values based on quoted prices for similar assets or liabilities in active markets; quoted prices for identical or similar assets in markets that are not active; or valuation models with inputs that are observable, directly or indirectly for substantially the term of the asset or liability. |
57
The Company estimates the fair value of its investments using the closing prices on the last business day of the reporting period, obtained from active markets such as the NYSE and NASDAQ. For securities for which quoted prices in active markets are unavailable, the Company uses observable inputs such as quoted prices in inactive markets, quoted prices in active markets for similar instruments, benchmark interest rates, broker quotes and other relevant inputs. The Company does not have any investments in its portfolio which require the use of unobservable inputs. The Company’s estimate of fair value reflects the interest rate environment that existed as of the close of business on December 31, 2016. Changes in interest rates subsequent to December 31, 2016 may affect the fair value of the Company’s investments.
The Company believes the carrying amounts of its cash and cash equivalents, accounts receivable, accounts payable, accrued expenses, and other current liabilities approximate their fair values at December 31, 2016 and December 31, 2015, due to the immediate or short term maturity of these instruments. The Company believes the carrying value of notes payable approximates fair value due to the recent nature of the transaction and its variable market rate of interest.
The Company’s non-financial assets, such as goodwill and property, plant and equipment are carried at cost until there are indicators of impairment, and are recorded at fair value only when an impairment charge is recognized.
Premiums
The Company records assumed premiums written (premiums from policies that the Company assumed from Sunshine State Insurance Company (“SSIC”) and from Citizens Property Insurance Corporation (“Citizens”), net of opt-outs and direct premiums written (premiums from subsequent renewals of Citizens’ and SSIC policies and voluntary policies written during the period) as revenue, net of ceded amounts, on a daily pro rata basis over the contract period of the related policies that are in force. For any portion of premiums not earned at the end of the reporting period, the Company records an unearned premium liability. As a one-time only transaction on June 27, 2014, the Company assumed approximately $58.9 million of annualized premiums from SSIC. The Company acquired 32,000 SSIC policies and as of December 31, 2016 have approximately 19,600 of those policies in force.
Premiums receivable represents amounts due from our policyholders for billed premiums and related policy fees. We perform a policy-level evaluation to determine the extent to which the balance of premiums receivable exceeds the balance of unearned premiums. We then age any resulting exposure based on the last date the policy was billed to the policyholder, and we establish an allowance for credit losses for any amounts outstanding for more than 90 days. When we receive payments on amounts previously charged off, we reduce bad debt expense in the period we receive the payment. Balances in premiums receivable and the associated allowance account are removed upon cancellation of the policy due to non-payment. We recorded no allowance for the years ended December 31, 2016 and 2015, respectively. Bad debt expense recovery related to uncollectible premiums was $0, $(250) thousand and $250 thousand for the years ended December 31, 2016, 2015 and 2014, respectively.
When the Company receives premium payments from policyholders prior to the effective date of the related policy, the Company records an advance premiums liability. On the policy effective date, the Company reduces the advance premium liability and records the premiums as described above.
Policy Acquisition Costs
The Company incurs policy acquisition costs that vary with, and are directly related to, the production of new business. Policy acquisition costs consist of the following four items: (i) commissions paid to outside agents at the time of policy issuance; (ii) policy administration fees paid to a third-party administrator at the time of policy issuance; (iii) premium taxes; and (iv) inspection fees. The Company capitalizes policy acquisition costs to the extent recoverable, then the Company amortizes those costs over the contract period of the related policy.
At each reporting date, the Company determines whether it has a premium deficiency. A premium deficiency would result if the sum of the Company’s expected losses, deferred policy acquisition costs, and policy maintenance costs (such as costs to store records and costs incurred to collect premiums and pay commissions) exceeded the Company’s related unearned premiums plus investment income. Should the Company determine that a premium deficiency exists, the Company would write off the unrecoverable portion of deferred policy acquisition cost.
58
Long-Lived Assets—Property and Equipment
Property and equipment is stated at cost less accumulated depreciation and amortization. Depreciation is calculated on a straight-line basis over the estimated useful lives as follows: building—40 years; computer hardware and software 3—years; office and furniture equipment—3 to 7 years. Leasehold improvements are amortized over the shorter of the lease term or the asset’s useful life. Expenditures for improvements are capitalized to the property accounts. Replacements and maintenance and repairs that do not improve or extend the life of the respective assets are expensed as incurred.
Business Acquisition
The application of the purchase method of accounting for business combinations requires the use of significant estimates and assumptions in determining the fair value of assets acquired and liabilities assumed in order to properly allocate the fair value of the acquired business. The estimates of the fair value of the assets acquired and liabilities assumed are based upon assumptions believed to be reasonable using established valuation techniques that consider a number of factors and when appropriate, valuations performed by independent third party appraisers. Assets acquired and liabilities assumed in connection with business combinations are recorded based on their respective fair values at the date of acquisition.
Goodwill and Intangible Assets
Goodwill represents the excess of costs over the fair value of net assets acquired. Goodwill is subject to evaluation for impairment using a fair value based test. This evaluation is performed annually, during the fourth quarter or more frequently if facts and circumstances warrant. The Company uses a qualitative approach to test goodwill for impairment by first assessing qualitative factors to determine whether it is more-likely-than-not that the fair value of a reporting unit is less than its carrying amount as a basis for determining whether it is necessary to perform the two-step goodwill impairment test. The Company applies this qualitative approach as of October 1 annually to any and all reporting units. If required following the qualitative assessment, the first step in the goodwill impairment test involves comparing the fair value of each of a reporting unit to the carrying value of a reporting unit. If the carrying value of a reporting unit exceeds the fair value of the reporting unit, the Company is required to proceed to the second step. In the second step, the fair value of the reporting unit would be allocated to the assets (including unrecognized intangibles) and liabilities of the reporting unit, with any residual representing the implied fair value of goodwill. An impairment loss would be recognized if, and to the extent that, the carrying value of goodwill exceeded the implied value. The Company reviews amortizable intangible assets for impairment whenever events or circumstances indicate that carrying amounts may not be recoverable. If the Company concludes that impairment exists, the carrying amount is reduced to fair value.
Impairment of Long-Lived Assets Including Intangible Assets Subject to Amortization
The Company assesses the recoverability of long-lived assets when events or circumstances indicate that the assets might have become impaired. The Company determines whether the assets can be recovered from undiscounted future cash flows and, if not recoverable, the Company recognizes impairment to reduce the carrying value to fair value. Recoverability of long lived assets is dependent upon, among other things, the Company’s ability to maintain profitability, so as to be able to meet its obligations when they become due. No impairment was recognized in any period presented.
Unpaid Losses and Loss Adjustment Expenses
The Company’s reserves for unpaid losses and loss adjustment expenses represent the estimated ultimate cost of settling all reported claims plus all claims we incurred related to insured events that have occurred as of the reporting date, but that policyholders have not yet reported to the Company (incurred but not reported, or “IBNR”).
The Company estimates its reserves for unpaid losses and loss adjustment expenses using individual case-based estimates for reported claims and actuarial estimates for IBNR losses. The Company continually reviews and adjusts its estimated losses as necessary based on industry development trends, the Company’s evolving claims experience and new information obtained. If the Company’s unpaid losses and loss adjustment expenses are considered to be deficient or redundant, the Company increases or decreases the liability in the period in which it identifies the difference and reflects the change in its current period results of operations. Though the Company’s estimate of the ultimate cost of settling all reported and unreported claims may change at any point in the future, a reasonable possibility exists that its estimate may vary significantly in the near term from the estimated amounts included in the Company’s consolidated financial statements.
The Company reports its reserves for unpaid losses and loss adjustment expenses gross of the amounts related to unpaid losses recoverable from reinsurers and reports losses net of amounts ceded to reinsurers. The Company does not discount its loss reserves for financial statement purposes.
59
Other revenue represents rental income due under non-cancelable leases for space at the Company’s commercial property in Clearwater, Florida that was acquired in April 2013, and all policy and pay-plan fees. Our insurance affiliates charge policyholders a policy fee on each policy written; these fees are not subject to refund, and the Company recognizes the income immediately when collected. The Company also charges pay-plan fees to policyholders that pay its premiums in more than one installment and records the fees as income when collected. In addition, the Company records revenue earned from its restoration subsidiary for non-insurance construction as services are performed.
Reinsurance
The Company follows industry practice of reinsuring a portion of our risks. Reinsurance involves transferring, or “ceding”, all or a portion of the risk exposure on policies the Company writes to another insurer, known as a reinsurer. To the extent that the Company’s reinsurers are unable to meet the obligations they assume under the Company’s reinsurance agreements, the Company remains liable for the entire insured loss.
The Company’s reinsurance agreements are short-term, prospective contracts. The Company records an asset, prepaid reinsurance premiums, and a liability, reinsurance payable, for the entire contract amount upon commencement of new reinsurance agreements. The Company amortizes its prepaid reinsurance premiums over the 12-month contract period.
In the event that the Company incurs losses recoverable under its reinsurance program, the Company records amounts recoverable from its reinsurers on paid losses plus an estimate of amounts recoverable on unpaid losses. The estimate of amounts recoverable on unpaid losses is a function of the Company’s liability for unpaid losses associated with the reinsured policies; therefore, the amount changes in conjunction with any changes to the estimate of unpaid losses. Given that an estimate of amounts recoverable from reinsurers on unpaid losses may change at any point in the future because of its relation to the Company’s reserves for unpaid losses, a reasonable possibility exists that an estimated recovery may change significantly from initial estimates.
The Company estimates uncollectible amounts receivable from reinsurers based on an assessment of factors including the creditworthiness of the reinsurers and the adequacy of collateral obtained, where applicable. The Company recorded no uncollectible amounts under its reinsurance program or bad debt expense related to reinsurance for the years ended December 31, 2016, 2015 and 2014.
Assessments
Guaranty fund and other insurance-related assessments imposed upon the Company are recorded as policy acquisition costs in the period the regulatory agency imposes the assessment. To recover Florida Insurance Guaranty Association (“FIGA”)/Hawaii Insurance Guaranty Association (“HIGA”) assessments, the Company in turn submits a plan for recoupment to the Insurance Commissioner for approval and upon approval, begins collecting a policy surcharge that will allow it to collect the prior years assessments over a 12-month period, based on an estimate of the number of policies the Company expects to write. The Company then submits an information only filing, pursuant to Florida Statute 631.57(3)(h)/Hawaii Statute 431:16-115(b), to the insurance regulatory authority requesting formal approval of the policy FIGA/HIGA surcharge. The process may be repeated in successive 12-month periods until the Company recoups all assessments. The Company records the recoveries as revenue in the period that it collects the cash. While current regulations allow the Company to recover from policyholders the amount of assessments imposed upon the Company, the Company’s payment of the assessments and recoveries may not offset each other in the same year. There were no such assessments during the periods presented.
The Company collects other assessments imposed upon policyholders as a policy surcharge and records the amounts collected as a liability until the Company remits the amounts to the regulatory agency that imposed the assessment.
Accrued Bonus Compensation
Our Board of Directors determined in 2013 that the bonus pool based on earnings before interest, taxes, depreciation and amortization (“EBITDA”) was appropriate. For the year ended December 31, 2016 the Board of Directors approved an EBITDA bonus of approximately $4.4 million to be paid to officers and employees of which approximately $800 thousand was paid out in cash as of December 31, 2016. For the year ended December 31, 2015, the Company recognized employee bonus compensation expense of approximately $14.1 million, which the Company paid out in cash of approximately $12.1 million as of December 31, 2015 and the remainder during 2016. For the year ended December 31, 2014, the company recognized employee bonus compensation of $7.2 million.
60
On December 15, 2016, the Company issued $79.5 million in Senior Secured Notes to six accredited investors. In connection with the issuance of debt the Company incurred $6.6 million in debt issuance costs. Debt issuance costs is reflected on the balance sheet as a net of note payable, and amortized using the effective interest method over the life of the underlying debt instrument.
Income Taxes
On May 22, 2014, the Company converted from a limited liability company to a corporation. As a limited liability company, the Company was treated as a partnership for tax purposes, and accordingly was not subject to entity-level federal or state income taxation. The Company’s income tax provision generally consisted of income taxes payable by its separate subsidiaries that are taxed as corporations. As such, the Company’s effective tax rate as a limited liability company was historically driven primarily by the taxable income recognized by its taxable subsidiaries. As a corporation, the Company is subject to typical corporate U.S. federal and state income tax rates on a consolidated basis which it expects to result in a combined federal and state statutory tax rate of approximately 38.575% under current tax law.
The Company recognizes deferred tax assets and liabilities for the future tax consequences attributable to differences between the financial statement carrying amounts of existing assets and liabilities and their respective tax bases. The Company measures deferred tax assets and liabilities using enacted tax rates expected to apply to taxable income in the years in which it expects to recover or settle those temporary differences. Should a change in tax rates occur, the Company recognizes the effect on deferred tax assets and liabilities in operations in the period that includes the enactment date. Realization of the Company’s deferred income tax assets depends upon our generation of sufficient future taxable income.
The Company recognizes the financial statement benefit of a tax position only after determining that the relevant tax authority would more likely than not sustain the position following an audit. For tax positions meeting the more likely than not threshold, the amount recognized in the consolidated financial statements is the largest benefit that has a greater than 50% likelihood of being realized upon ultimate settlement with the relevant taxing authority.
The Company records any income tax penalties and income-tax-related interest as income tax expense in the period incurred. The Company did not incur any material tax penalties or income-tax-related interest for the years ended December 31, 2016, 2015, and 2014, respectively.
Stock-Based Compensation
The Company measures stock-based compensation at the grant date based on the fair value of the award and recognizes stock-based compensation expense over the requisite vesting period. Determining the fair value of stock option awards requires judgment, including estimating stock price volatility, forfeiture rates and expected option life. Restricted stock awards are valued based on the fair value of the stock on the grant date and the related compensation expense is recognized over the vesting period.
Advertising Costs
The Company expenses all advertising costs when it incurs those costs. For the years ended December 31, 2016, 2015 and 2014, the Company incurred advertising costs of $94 thousand $27 thousand, and $14 thousand, respectively.
Earnings Per Share
The Company reports both basic earnings per share and diluted earnings per share. To calculate basic earnings per share, the Company divides net income attributable to common shareholders by the weighted-average number of shares outstanding during the period, including vested restricted shares. The Company calculates diluted earnings per share by dividing net income attributable to common shareholders by the weighted-average number of shares, and the effect of share equivalents, and vested and unvested restricted shares outstanding during the period using the treasury stock method to calculate common stock equivalents.
61
The Company’s current operations subject us to the following concentrations of risk:
|
|
• |
Revenue—The Company writes residential property and liability policies exclusively. |
|
|
• |
Geographic—The Company writes its premium in Florida, North Carolina, South Carolina and Hawaii, with approximately 90% of the premium written in Florida. |
|
|
• |
Group concentration of credit risk—All of the Company’s reinsurers engage in similar activities and have similar economic characteristics that could cause their ability to repay us to be similarly affected by changes in economic or other conditions. |
|
|
• |
Credit risk—The Company chooses to deposit all its cash at twelve financial institutions. |
The Company mitigates its geographic and group concentrations of risk by entering into reinsurance contracts with highly rated, financially-stable reinsurers, and by securing irrevocable letters of credit from reinsurers when necessary.
With regard to cash, the Company had $123.4 million and $243.7 million in excess of Federal Deposit Insurance Corporation (“FDIC”) insurance limits at December 31, 2016 and December 31, 2015, respectively. Deposits held in non- interest-bearing transaction accounts are combined with interest-bearing accounts and are insured up to $250 thousand.
Accounting Pronouncements
The Company describes below recent pronouncements that may have a significant effect on its consolidated financial statements or on its disclosures upon future adoption. The Company does not discuss recent pronouncements that are not anticipated to have an impact on, or are unrelated to, its financial condition, results of operations, or related disclosures.
In January 2017, the Financial Accounting Standards Board (“FASB”) issued updated guidance on goodwill impairment testing requiring entities to calculate the implied fair value of goodwill through a hypothetical purchase price allocation. Under the updated guidance, impairment will now be recognized as the amount by which a reporting unit’s carrying value exceeds its fair value. The standard is effective for us in the first quarter of 2020 on a prospective basis with early adoption permitted. The Company does not expect the adoption of this standard will have a material impact on the consolidated financial statements.
In November 2016, the FASB issued guidance regarding the presentation of changes in restricted cash in the statement of cash flows. The updated guidance is effective for the Company in the first quarter of 2018 with early adoption permitted. The updated guidance should be applied retrospectively, unless it is impracticable to do so, at which point the guidance should be applied prospectively. The Company currently recognizes changes in restricted cash in operating activities on the consolidated statement of cash flows. Upon adoption of this updated guidance, such changes will be reflected in the same manner as other cash and cash equivalents.
In August 2016, the FASB issued guidance clarifying the classification of certain cash receipts and cash payments that will make eight targeted changes to how cash receipts and cash payments are presented and classified in the statement of cash flows. This updated guidance is effective on January 1, 2018, and will require adoption on a retrospective basis with early adoption permitted. The Company has not experienced any transactions that are within the scope of this guidance and accordingly will evaluate the effect of this guidance further if and when any such transactions occur.
In June 2016, the FASB issued guidance on the accounting for credit losses of financial instruments that are measured at amortized cost, including held to maturity securities and reinsurance recoverables, by applying an approach based on the current expected credit losses. The estimate of expected credit losses should consider historical information, current information, as well as reasonable and supportable forecasts, including estimates of prepayments. The allowance for credit losses is a valuation account that is deducted from the amortized cost basis of the financial asset in order to present the net carrying value at the amount expected to be collected on the financial asset on the consolidated balance sheet. The guidance also amends the current accounting for other-than-temporary impairment model by requiring an estimate of the expected credit loss only when the fair value is below the amortized cost of the asset. The length of time the fair value of an available for sale debt security has been below the amortized cost will no longer impact the determination of whether a potential credit loss exists. The available for sale debt security model will also require the use of a valuation allowance as compared to the current practice of writing down the asset. The standard is effective for the Company in the first quarter of 2020 with early adoption permitted in the first quarter of 2019. The Company is in the early stages of evaluating the effect that the updated standard will have on its consolidated financial statements and related disclosures.
62
In March 2016, the FASB issued guidance which requires recognition of the excess tax benefits or deficiencies of share-based awards through net income rather than through additional paid in capital. Additionally, the guidance allows for an election to account for forfeitures related to share-based payments either as they occur or through an estimation method. The Company will adopt this guidance beginning with the first quarter of 2017 and will recognize the excess tax benefits (deficiencies) within our results of operations. The calculation of the excess tax benefits and deficiencies is based on the difference between the market value of a stock award at the date of vesting, or at the time of exercise for a stock option, compared to the grant date fair value recognized as compensation expense in the consolidated statements of operations. The Company has determined that the financial statements in future periods will be affected by this new guidance principally when excess tax benefit or deficiencies occur, given that all such future items will be recognized as income tax benefits or expense in the consolidated statements of income and comprehensive income. The value of such transactions is not currently determinable because such amounts will vary based upon the value of the Company’s common stock on the date of vesting of restricted stock or exercise of stock options. Additionally, the amounts recognized will be presented as operating activities in the consolidated statement of cash flows, whereas such amounts are currently classified as financing activities.
In February 2016, the FASB issued guidance that affects the recognition, measurement, presentation and disclosure of leases. The new guidance requires substantially all leases to be reported on the balance sheet as right-to-use assets and lease liabilities, as well as additional disclosures. The standard is effective as of January 1, 2019, and early adoption is permitted. While the Company has limited leasing activities, the Company is in the early stages of evaluating the impact of the new guidance on its consolidated financial statements.
In January 2016, the FASB issued guidance that affects the recognition, measurement, presentation, and disclosure of financial instruments. The guidance requires equity investments to be measured at fair value with changes in fair value recognized through net income (other than those accounted for under equity method of accounting or those that result in consolidation of the investee) and an assessment of a valuation allowance on deferred tax assets related to unrealized losses of available for sale debt securities in combination with other deferred tax assets. The standard is effective for the Company in the first quarter of 2018. The Company is in the early stages of evaluating the effect that the updated standard will have on its consolidated financial statements and related disclosures. The effect of adopting this guidance will be principally affected by the level of unrealized gains or losses associated with equity investments with readily determinable market values. Such unrealized gains or losses will be recognized upon adoption as a cumulative-effect adjustment with future unrealized gains or losses reflected in the statement of income and comprehensive income. Refer to Note 3 for the current status of such unrealized gains and losses levels that are currently recognized as other comprehensive income.
In May 2014, the FASB issued an accounting standard that supersedes most existing revenue recognition guidance. The standard excludes from its scope the accounting for insurance contracts, leases, financial instruments, and certain other agreements that are governed under other GAAP guidance, but could affect the revenue recognition for certain of our claims management and risk control services. The updated guidance requires an entity to recognize revenue as performance obligations are met, in order to reflect the transfer of promised goods or services to customers in an amount that reflects the consideration the entity is entitled to receive for those goods or services. This guidance is not applicable to insurance contracts. The standard is effective for the Company in the first quarter of 2018 with early adoption permitted. Accordingly, while the Company is in the early stages of evaluating the effect of adopting this new guidance, the Company believes the application of this guidance will be less complex in relation to any non-insurance contracts.
No other new accounting pronouncement issued or effective during the fiscal year had or is expected to have a material impact on our consolidated financial statements or disclosures.
|
Note 2. |
Business Acquisition |
On July 31, 2015, the Company acquired BRC Restoration Specialists, Inc., a Florida based provider of restoration services and emergency and recovery assistance for a purchase price in aggregate of $8 million in cash and common stock. The Company issued 79,850 shares of its common stock to BRC at a fair value of $2.0 million as part of the purchase price and paid in cash $6.0 million. For the purchase price allocation the Company utilized a third party to calculate the valuation. The purchase consideration for the BRC acquisition has been allocated to the estimated fair market value of the net assets acquired, including approximately $2.2 million in identifiable intangibles assets (brand, customer relations and non-compete), and a residual amount of goodwill of approximately $5.7 million.
On March 21, 2016, the Company acquired 100% of the outstanding stock of ZAC and its wholly-owned subsidiary, Zephyr, in exchange for approximately $110.3 million, net of cash acquired. Zephyr is a specialty property insurance provider that offers policies for residential customers in Hawaii that only cover the peril of windstorm-hurricane events.
63
The purchase consideration for this acquisition has been allocated to the estimated fair market value of the net assets acquired, including approximately $31.8 million in identifiable intangibles assets (primarily value of business acquired (“VOBA”), customer relationships and trade name), and a residual amount of goodwill of approximately $38.4 million. This acquisition furthers the Company’s strategic push to diversify business operations and achieve potential reinsurance synergies while expanding growth opportunities outside of Florida.
During the quarter ended December 31, 2016, the Company finalized its purchase price allocation during the measurement period. The facts and circumstances that existed at the date of the acquisition, if known, would have affected the measurement of the amounts recognized at that date. In accordance with ASC 805, Business Combinations, measurement period adjustments are not included in current earnings, but recognized as of the date of the acquisition with a corresponding adjustment to goodwill resulting from the change in preliminary amounts. As a result, the Company adjusted the preliminary allocation of the purchase price initially recorded at the acquisition date to reflect these measurement period adjustments.
Based on the finalized valuation report received during the quarter ended December 31, 2016, the Company revised the preliminary purchase allocation for ZAC as disclosed in the first quarter of 2016. As a result, $1.8 million was recorded to reduce goodwill offset by an increase of $42 thousand in intangible assets and an increase of $2.6 million relating to VOBA, and corresponding increase of deferred tax liability of $1.0 million
The table below details the purchase consideration and allocation of assets and liabilities assumed for the ZAC acquisition:
|
Purchase Consideration |
|
|
|
|
Cash, net of cash acquired |
$ |
110,319 |
|
|
|
|
|
|
|
Assets acquired |
|
|
|
|
Investments |
$ |
76,543 |
|
|
Premiums and agent's receivable |
|
1,403 |
|
|
Other assets |
|
526 |
|
|
Prepaid reinsurance premiums |
|
4,792 |
|
|
Intangible assets – value of business acquired |
|
7,600 |
|
|
Intangible assets |
|
24,245 |
|
|
Total assets acquired |
$ |
115,109 |
|
|
Total liabilities assumed |
$ |
(43,216 |
) |
|
|
|
|
|
|
Net assets acquired |
$ |
71,893 |
|
|
Goodwill |
|
38,426 |
|
|
Total purchase price |
$ |
110,319 |
|
At December 31, 2015, the Company recorded goodwill and intangibles, net in Other assets.
The following table summarizes the results of the acquired ZAC operations since the acquisition date that have been included within our consolidated statement of operations.
|
(in thousands) |
March 21, 2016 to December 31, 2016 |
|
|
|
Total revenue |
$ |
27,537 |
|
|
Net income |
$ |
8,900 |
|
The following table (all amounts in thousands, except for per share data) provides supplemental unaudited pro forma consolidated information for the years ended December 31, 2016 and 2015, as if ZAC had been acquired as of January 1, 2015. The unaudited pro forma consolidated financial statements are presented solely for informational purposes and are not necessarily indicative of the consolidated results of operations that might have been achieved had the transaction been completed as of the date indicated, nor are they meant to be indicative of any anticipated consolidated future results of operations that the combined company will experience after the transaction.
64
|
For the Years Ended December 31, |
|
||||||
|
|
2016 |
|
|
2015 |
|
||
|
|
(unaudited) |
|
|||||
|
Revenue |
$ |
447,780 |
|
|
$ |
432,070 |
|
|
Net income |
$ |
36,817 |
|
|
$ |
104,722 |
|
|
Basic, earnings per share |
$ |
1.24 |
|
|
$ |
3.48 |
|
|
Diluted, earnings per share |
$ |
1.24 |
|
|
$ |
3.45 |
|
|
Note 3. |
Investments |
The following table details the difference between cost or adjusted/amortized cost and estimated fair value, by major investment category, at December 31, 2016 and December 31, 2015:
|
|
|
Cost or Adjusted / Amortized Cost |
|
|
Gross Unrealized Gains |
|
|
Gross Unrealized Losses |
|
|
Fair Value |
|
||||
|
|
|
(In thousands) |
|
|||||||||||||
|
December 31, 2016 |
|
|
|
|
|
|
|
|
|
|
|
|
|
|
|
|
|
U.S. government and agency securities |
|
$ |
107,968 |
|
|
$ |
29 |
|
|
$ |
449 |
|
|
$ |
107,548 |
|
|
States, municipalities and political subdivisions |
|
|
281,935 |
|
|
|
298 |
|
|
|
4,872 |
|
|
|
277,361 |
|
|
Special revenue |
|
|
53,726 |
|
|
|
29 |
|
|
|
759 |
|
|
|
52,996 |
|
|
Industrial and miscellaneous |
|
|
129,687 |
|
|
|
535 |
|
|
|
577 |
|
|
|
129,645 |
|
|
Redeemable preferred stocks |
|
|
3,595 |
|
|
|
15 |
|
|
|
149 |
|
|
|
3,461 |
|
|
Total fixed maturities |
|
|
576,911 |
|
|
|
906 |
|
|
|
6,806 |
|
|
|
571,011 |
|
|
Nonredeemable preferred stocks |
|
|
14,935 |
|
|
|
40 |
|
|
|
460 |
|
|
|
14,515 |
|
|
Equity securities |
|
|
19,255 |
|
|
|
1,197 |
|
|
|
2,996 |
|
|
|
17,456 |
|
|
Total equity securities |
|
|
34,190 |
|
|
|
1,237 |
|
|
|
3,456 |
|
|
|
31,971 |
|
|
Total investments |
|
$ |
611,101 |
|
|
$ |
2,143 |
|
|
$ |
10,262 |
|
|
$ |
602,982 |
|
|
|
|
Cost or Adjusted / Amortized Cost |
|
|
Gross Unrealized Gains |
|
|
Gross Unrealized Losses |
|
|
Fair Value |
|
||||
|
|
|
(In thousands) |
|
|||||||||||||
|
December 31, 2015 |
|
|
|
|
|
|
|
|
|
|
|
|
|
|
|
|
|
U.S. government and agency securities |
|
$ |
25,474 |
|
|
$ |
16 |
|
|
$ |
387 |
|
|
$ |
25,103 |
|
|
States, municipalities and political subdivisions |
|
|
184,145 |
|
|
|
2,107 |
|
|
|
137 |
|
|
|
186,115 |
|
|
Special revenue |
|
|
42,593 |
|
|
|
19 |
|
|
|
204 |
|
|
|
42,408 |
|
|
Industrial and miscellaneous |
|
|
115,313 |
|
|
|
294 |
|
|
|
932 |
|
|
|
114,675 |
|
|
Redeemable preferred stocks |
|
|
3,442 |
|
|
|
61 |
|
|
|
21 |
|
|
|
3,482 |
|
|
Total fixed maturities |
|
|
370,967 |
|
|
|
2,497 |
|
|
|
1,681 |
|
|
|
371,783 |
|
|
Nonredeemable preferred stocks |
|
|
12,443 |
|
|
|
338 |
|
|
|
43 |
|
|
|
12,738 |
|
|
Equity securities |
|
|
19,996 |
|
|
|
398 |
|
|
|
4,819 |
|
|
|
15,575 |
|
|
Total equity securities |
|
|
32,439 |
|
|
|
736 |
|
|
|
4,862 |
|
|
|
28,313 |
|
|
Total investments |
|
$ |
403,406 |
|
|
$ |
3,233 |
|
|
$ |
6,543 |
|
|
$ |
400,096 |
|
Special revenue instruments include U.S. government associated mortgage backed securities.
65
The Company calculates the gain or loss realized on the sale of investments by comparing the sales price (fair value) to the cost or adjusted/amortized cost of the security sold. The Company determines the cost or adjusted/amortized cost of the security sold using the specific-identification method. The following tables detail the Company’s realized gains (losses) by major investment category as of December 31, 2016 and 2015, respectively:
|
|
|
2016 |
|
|
2015 |
|
||||||||||
|
|
|
Gains (Losses) |
|
|
Fair Value at Sale |
|
|
Gains (Losses) |
|
|
Fair Value at Sale |
|
||||
|
|
|
(In thousands) |
|
|||||||||||||
|
Year Ended December 31, |
|
|
|
|
|
|
|
|
|
|
|
|
|
|
|
|
|
Fixed maturities |
|
$ |
2,782 |
|
|
$ |
70,728 |
|
|
$ |
1,318 |
|
|
$ |
78,161 |
|
|
Equity securities |
|
|
108 |
|
|
|
8,337 |
|
|
|
448 |
|
|
|
24,100 |
|
|
Total realized gains |
|
|
2,890 |
|
|
|
79,065 |
|
|
|
1,766 |
|
|
|
102,261 |
|
|
Fixed maturities |
|
|
(253 |
) |
|
|
15,496 |
|
|
|
(133 |
) |
|
|
13,343 |
|
|
Equity securities |
|
|
(904 |
) |
|
|
5,098 |
|
|
|
(125 |
) |
|
|
1,616 |
|
|
Total realized losses |
|
|
(1,157 |
) |
|
|
20,594 |
|
|
|
(258 |
) |
|
|
14,959 |
|
|
Net realized gains |
|
$ |
1,733 |
|
|
$ |
99,659 |
|
|
$ |
1,508 |
|
|
$ |
117,220 |
|
The table below summarizes the Company’s fixed maturities at December 31, 2016 by contractual maturity periods. Actual results may differ as issuers may have the right to call or prepay obligations, with or without penalties, prior to the contractual maturity of those obligations.
|
|
|
December 31, 2016 |
|
|||||||||||||
|
|
|
Cost or Amortized Cost |
|
|
Percent of Total |
|
|
Fair Value |
|
|
Percent of Total |
|
||||
|
|
|
(In thousands) |
|
|
|
|
|
|
(In thousands) |
|
|
|
|
|
||
|
Due in one year or less |
|
$ |
158,517 |
|
|
|
28 |
% |
|
$ |
158,496 |
|
|
|
28 |
% |
|
Due after one year through five years |
|
|
173,221 |
|
|
|
30 |
% |
|
|
172,309 |
|
|
|
30 |
% |
|
Due after five years through ten years |
|
|
145,299 |
|
|
|
25 |
% |
|
|
142,259 |
|
|
|
25 |
% |
|
Due after ten years |
|
|
99,874 |
|
|
|
17 |
% |
|
|
97,947 |
|
|
|
17 |
% |
|
Total |
|
$ |
576,911 |
|
|
|
100 |
% |
|
$ |
571,011 |
|
|
|
100 |
% |
|
|
|
December 31, 2015 |
|
|||||||||||||
|
|
|
Cost or Amortized Cost |
|
|
Percent of Total |
|
|
Fair Value |
|
|
Percent of Total |
|
||||
|
|
|
(In thousands) |
|
|
|
|
|
|
(In thousands) |
|
|
|
|
|
||
|
Due in one year or less |
|
$ |
34,162 |
|
|
|
9 |
% |
|
$ |
34,165 |
|
|
|
9 |
% |
|
Due after one year through five years |
|
|
146,616 |
|
|
|
40 |
% |
|
|
146,211 |
|
|
|
40 |
% |
|
Due after five years through ten years |
|
|
79,380 |
|
|
|
21 |
% |
|
|
79,887 |
|
|
|
21 |
% |
|
Due after ten years |
|
|
110,809 |
|
|
|
30 |
% |
|
|
111,520 |
|
|
|
30 |
% |
|
Total |
|
$ |
370,967 |
|
|
|
100 |
% |
|
$ |
371,783 |
|
|
|
100 |
% |
The following table summarizes the Company’s net investment income by major investment category for the years ended December 31, 2016, 2015 and 2014, respectively:
|
|
|
For the Year Ended December 31, |
|
|||||||||
|
|
|
2016 |
|
|
2015 |
|
|
2014 |
|
|||
|
|
|
(In thousands) |
|
|||||||||
|
Fixed maturities |
|
$ |
8,709 |
|
|
$ |
6,960 |
|
|
$ |
3,100 |
|
|
Equity securities |
|
|
1,955 |
|
|
|
1,811 |
|
|
|
1,159 |
|
|
Cash, cash equivalents and short-term investments |
|
|
226 |
|
|
|
258 |
|
|
|
181 |
|
|
Other investments |
|
|
21 |
|
|
|
259 |
|
|
|
243 |
|
|
Net investment income |
|
|
10,911 |
|
|
|
9,289 |
|
|
|
4,683 |
|
|
Investment expenses |
|
|
1,730 |
|
|
|
1,868 |
|
|
|
834 |
|
|
Net investment income, less investment expenses |
|
$ |
9,181 |
|
|
$ |
7,421 |
|
|
$ |
3,849 |
|
During the Company’s quarterly evaluations of its securities for impairment, the Company determined that none of its investments in debt and equity securities that reflected an unrealized loss position were other-than-temporarily impaired. The issuers of the debt securities in which the Company invests continue to make interest payments on a timely basis and have not suffered any credit rating reductions. The Company does not intend to sell, nor is it likely that it would be required to sell, the debt securities before the Company recovers its amortized cost basis. All the issuers of the equity securities it owns had near-term prospects that indicated
66
the Company could recover its cost basis, and the Company also has the ability and the intent to hold these securities until the value equals or exceeds its cost.
The following table presents an aging of the Company’s unrealized investment losses by investment class as of December 31, 2016 and December 31, 2015:
|
|
|
Less Than Twelve Months |
|
|
Twelve Months or More |
|
||||||||||||||||||
|
|
|
Number of Securities |
|
|
Gross Unrealized Losses |
|
|
Fair Value |
|
|
Number of Securities |
|
|
Gross Unrealized Losses |
|
|
Fair Value |
|
||||||
|
|
|
(In thousands) |
|
|||||||||||||||||||||
|
December 31, 2016 |
|
|
|
|
|
|
|
|
|
|
|
|
|
|
|
|
|
|
|
|
|
|
|
|
|
U.S. government and agency securities |
|
|
35 |
|
|
$ |
448 |
|
|
$ |
24,649 |
|
|
|
2 |
|
|
$ |
1 |
|
|
$ |
200 |
|
|
States, municipalities and political subdivisions |
|
|
265 |
|
|
|
4,869 |
|
|
|
220,034 |
|
|
|
2 |
|
|
|
3 |
|
|
|
1,497 |
|
|
Industrial and miscellaneous |
|
|
161 |
|
|
|
571 |
|
|
|
56,996 |
|
|
|
2 |
|
|
|
6 |
|
|
|
974 |
|
|
Special revenue |
|
|
189 |
|
|
|
631 |
|
|
|
44,712 |
|
|
|
11 |
|
|
|
129 |
|
|
|
1,828 |
|
|
Redeemable preferred stocks |
|
|
19 |
|
|
|
143 |
|
|
|
2,425 |
|
|
|
1 |
|
|
|
6 |
|
|
|
212 |
|
|
Total fixed maturities |
|
|
669 |
|
|
|
6,662 |
|
|
|
348,816 |
|
|
|
18 |
|
|
|
145 |
|
|
|
4,711 |
|
|
Nonredeemable preferred stocks |
|
|
77 |
|
|
|
439 |
|
|
|
11,298 |
|
|
|
5 |
|
|
|
20 |
|
|
|
234 |
|
|
Equity securities |
|
|
26 |
|
|
|
191 |
|
|
|
2,542 |
|
|
|
29 |
|
|
|
2,805 |
|
|
|
7,317 |
|
|
Total equity securities |
|
|
103 |
|
|
$ |
630 |
|
|
$ |
13,840 |
|
|
|
34 |
|
|
$ |
2,825 |
|
|
$ |
7,551 |
|
|
Total |
|
|
772 |
|
|
$ |
7,292 |
|
|
$ |
362,656 |
|
|
|
52 |
|
|
$ |
2,970 |
|
|
$ |
12,262 |
|
|
|
|
Less Than Twelve Months |
|
|
Twelve Months or More |
|
||||||||||||||||||
|
|
|
Number of Securities |
|
|
Gross Unrealized Losses |
|
|
Fair Value |
|
|
Number of Securities |
|
|
Gross Unrealized Losses |
|
|
Fair Value |
|
||||||
|
|
|
(In thousands) |
|
|||||||||||||||||||||
|
December 31, 2015 |
|
|
|
|
|
|
|
|
|
|
|
|
|
|
|
|
|
|
|
|
|
|
|
|
|
U.S. government and agency securities |
|
|
19 |
|
|
$ |
385 |
|
|
$ |
19,849 |
|
|
|
2 |
|
|
$ |
3 |
|
|
$ |
397 |
|
|
States, municipalities and political subdivisions |
|
|
14 |
|
|
|
50 |
|
|
|
10,979 |
|
|
|
1 |
|
|
|
3 |
|
|
|
164 |
|
|
Industrial and miscellaneous |
|
|
141 |
|
|
|
870 |
|
|
|
73,312 |
|
|
|
5 |
|
|
|
61 |
|
|
|
1,318 |
|
|
Special revenue |
|
|
134 |
|
|
|
279 |
|
|
|
60,203 |
|
|
|
10 |
|
|
|
9 |
|
|
|
1,646 |
|
|
Redeemable preferred stocks |
|
|
9 |
|
|
|
21 |
|
|
|
950 |
|
|
|
— |
|
|
|
— |
|
|
|
— |
|
|
Total fixed maturities |
|
|
317 |
|
|
|
1,605 |
|
|
|
165,293 |
|
|
|
18 |
|
|
|
76 |
|
|
|
3,525 |
|
|
Nonredeemable preferred stocks |
|
|
19 |
|
|
|
29 |
|
|
|
1,560 |
|
|
|
5 |
|
|
|
14 |
|
|
|
250 |
|
|
Equity securities |
|
|
48 |
|
|
|
2,975 |
|
|
|
8,416 |
|
|
|
20 |
|
|
|
1,844 |
|
|
|
2,680 |
|
|
Total equity securities |
|
|
67 |
|
|
$ |
3,004 |
|
|
$ |
9,976 |
|
|
|
25 |
|
|
$ |
1,858 |
|
|
$ |
2,930 |
|
|
Total |
|
|
384 |
|
|
$ |
4,609 |
|
|
$ |
175,269 |
|
|
|
43 |
|
|
$ |
1,934 |
|
|
$ |
6,455 |
|
The Company is required to maintain assets on deposits with various regulatory authorities to support its insurance and reinsurance operations.
|
Note 4. |
Goodwill and Other Intangible Assets |
As of December 31, 2016 and December 31, 2015 goodwill was $46.5 million and $8 million, respectively, and intangible assets were $26.5 million and $2.1 million, respectively. The Company has determined the useful life of the value of business acquired (see Note 2) to be one year. The Company has determined the useful life of the other intangible assets to range between 2-15 years. The Company has recorded $175 thousand relating to an insurance license and classified as an indefinite lived intangible which is subject to annual impairment testing.
Goodwill
67
|
|
Goodwill |
|
||
|
|
|
(in thousands) |
|
|
|
Balance as of December 31, 2014 |
|
$ |
2,350 |
|
|
Goodwill acquired |
|
|
5,678 |
|
|
Impairment |
|
— |
|
|
|
Balance as of December 31, 2015 |
|
$ |
8,028 |
|
|
Goodwill acquired |
|
|
38,426 |
|
|
Impairment |
|
— |
|
|
|
Balance as of December 31, 2016 |
|
$ |
46,454 |
|
Other intangible assets
Our intangible assets resulted primarily from the acquisition of Zephyr and consist of brand, agent relationships, renewal rights, customer relations, trade names, non-compete and insurance license. Finite-lived intangibles assets are amortized over their useful lives from one to fifteen years.
The tables below detail the finite-lived intangible assets, net as of December 31, 2016 and 2015, respectively (amounts in thousands):
|
December 31, 2016 |
Weighted -average Amortization (years) |
|
|
Gross Carrying Amount |
|
|
Accumulated Amortization |
|
|
Intangible Assets, net (1) |
|
||||
|
Brand |
|
15 |
|
|
$ |
1,210 |
|
|
$ |
(114 |
) |
|
$ |
1,096 |
|
|
Agent relationships |
|
12 |
|
|
|
4,800 |
|
|
|
(300 |
) |
|
|
4,500 |
|
|
Renewal rights |
|
15 |
|
|
|
16,600 |
|
|
|
(830 |
) |
|
|
15,770 |
|
|
Customer relations |
|
10 |
|
|
|
870 |
|
|
|
(123 |
) |
|
|
747 |
|
|
Trade names |
|
10 |
|
|
|
2,000 |
|
|
|
(150 |
) |
|
|
1,850 |
|
|
Value of business acquired |
|
1 |
|
|
|
7,600 |
|
|
|
(5,700 |
) |
|
|
1,900 |
|
|
Non-compete |
|
2.5 |
|
|
|
790 |
|
|
|
(286 |
) |
|
|
504 |
|
|
Total intangible assets |
|
|
|
|
$ |
33,870 |
|
|
$ |
(7,503 |
) |
|
$ |
26,367 |
|
|
|
(1) |
Excludes insurance license valued at $175 thousand and classified as an indefinite lived intangible which is subject to annual impairment testing and not amortized. |
|
December 31, 2015 |
Weighted -average Amortization (years) |
|
Gross Carrying Amount |
|
|
Accumulated Amortization |
|
|
Intangible Assets, net |
|
|||
|
Brand |
15 |
|
$ |
1,210 |
|
|
$ |
(34 |
) |
|
$ |
1,176 |
|
|
Customer relations |
10 |
|
|
870 |
|
|
|
(36 |
) |
|
|
834 |
|
|
Non-compete |
5 |
|
|
120 |
|
|
|
(10 |
) |
|
|
110 |
|
|
Total intangible assets |
|
|
$ |
2,200 |
|
|
$ |
(80 |
) |
|
$ |
2,120 |
|
Estimated annual pretax amortization of intangible assets for each of the next five years and thereafter is as follows (in thousands):
|
Year |
|
Amount (1) |
|
|
|
2017 |
|
$ |
4,133 |
|
|
2018 |
|
|
1,982 |
|
|
2019 |
|
|
1,898 |
|
|
2020 |
|
|
1,888 |
|
|
2021 |
|
|
1,875 |
|
|
Thereafter |
|
|
14,591 |
|
|
|
|
$ |
26,367 |
|
|
|
(1) |
Excludes insurance license valued at $175 thousand classified as an indefinite lived intangible which is subject to annual impairment testing and not amortized. |
68
Amortization expense of intangible assets was $7.4 million and $80 thousand for the year ended December 31, 2016 and 2015, respectively.
|
Note 5. |
Earnings Per Share |
The following table sets forth the computation of basic and diluted EPS for the periods indicated.
|
|
|
For the Year Ended December 31, |
|
|||||||||
|
|
|
2016 |
|
|
2015 |
|
|
2014 |
|
|||
|
Basic earnings per share: |
|
|
|
|
|
|
|
|
|
|
|
|
|
Net income attributable to common stockholders (000's) |
|
$ |
33,865 |
|
|
$ |
92,512 |
|
|
$ |
47,097 |
|
|
Weighted average shares outstanding |
|
|
29,632,171 |
|
|
|
30,056,491 |
|
|
|
24,568,876 |
|
|
Basic earnings per share: |
|
$ |
1.14 |
|
|
$ |
3.08 |
|
|
$ |
1.92 |
|
|
|
|
|
|
|
|
|
|
|
|
|
|
|
|
Diluted earnings per share: |
|
|
|
|
|
|
|
|
|
|
|
|
|
Net income attributable to common stockholders (000's) |
|
$ |
33,865 |
|
|
$ |
92,512 |
|
|
$ |
47,097 |
|
|
Weighted average shares outstanding |
|
|
29,632,171 |
|
|
|
30,056,491 |
|
|
|
24,568,876 |
|
|
Weighted average dilutive shares |
|
|
2,178 |
|
|
|
269,977 |
|
|
|
1,247,684 |
|
|
Total weighted average dilutive shares |
|
|
29,634,349 |
|
|
|
30,326,468 |
|
|
|
25,816,560 |
|
|
Diluted earnings per share: |
|
$ |
1.14 |
|
|
$ |
3.05 |
|
|
$ |
1.82 |
|
|
Note 6. |
Fair Value Measurements |
For the Company’s investments in U.S. government securities that do not have prices in active markets, agency securities, state and municipal governments, and corporate bonds, the Company obtains the fair values from its third-party valuation service and we evaluate the relevant inputs, assumptions, methodologies and conclusions associated with such valuations. The valuation service calculates prices for the Company’s investments in the aforementioned security types on a month-end basis by using several matrix-pricing methodologies that incorporate inputs from various sources. The model the valuation service uses to price U.S. government securities and securities of states and municipalities incorporates inputs from active market makers and inter-dealer brokers. To price corporate bonds and agency securities, the valuation service calculates non-call yield spreads on all issuers, uses option-adjusted yield spreads to account for any early redemption features, then adds final spreads to the U.S. Treasury curve as of quarter end. The inputs the valuation service uses in their calculations are not quoted prices in active markets, but are observable inputs, and therefore represent Level 2 inputs.
The following table presents information about the Company’s assets measured at fair value on a recurring basis. The Company assesses the levels for the investments at each measurement date, and transfers between levels are recognized on the actual date of the event or change in circumstances that caused the transfer in accordance with the Company’s accounting policy regarding the recognitions of transfers between levels of the fair value hierarchy. For the years ended December 31, 2016 and 2015, there were no transfers in or out of Level 1, 2, and 3.
|
December 31, 2016 |
|
Total |
|
|
Level 1 |
|
|
Level 2 |
|
|
Level 3 |
|
||||
|
|
|
(in thousands) |
|
|||||||||||||
|
Fixed maturities investments: |
|
|
|
|
|
|
|
|
|
|
|
|
|
|
|
|
|
U.S. government and agency securities |
|
$ |
107,548 |
|
|
$ |
103,997 |
|
|
$ |
3,551 |
|
|
$ |
— |
|
|
States, municipalities and political subdivisions |
|
|
277,361 |
|
|
|
— |
|
|
|
277,361 |
|
|
|
— |
|
|
Special revenue |
|
|
52,996 |
|
|
|
— |
|
|
|
52,996 |
|
|
|
— |
|
|
Industrial and miscellaneous |
|
|
129,645 |
|
|
|
— |
|
|
|
129,645 |
|
|
|
— |
|
|
Redeemable preferred stocks |
|
|
3,461 |
|
|
|
3,461 |
|
|
|
— |
|
|
|
— |
|
|
Total fixed maturities investments |
|
$ |
571,011 |
|
|
$ |
107,458 |
|
|
$ |
463,553 |
|
|
$ |
— |
|
|
Nonredeemable preferred stocks |
|
|
14,515 |
|
|
|
14,515 |
|
|
|
— |
|
|
|
— |
|
|
Equity securities |
|
|
17,456 |
|
|
|
17,456 |
|
|
|
— |
|
|
|
— |
|
|
Total equity securities |
|
$ |
31,971 |
|
|
$ |
31,971 |
|
|
$ |
— |
|
|
$ |
— |
|
|
Total investments |
|
$ |
602,982 |
|
|
$ |
139,429 |
|
|
$ |
463,553 |
|
|
$ |
— |
|
69
|
December 31, 2015 |
|
Total |
|
|
Level 1 |
|
|
Level 2 |
|
|
Level 3 |
|
||||
|
|
|
(in thousands) |
|
|||||||||||||
|
Assets: |
|
|
|
|
|
|
|
|
|
|
|
|
|
|
|
|
|
Certificate of deposits (1) |
|
$ |
3,300 |
|
|
$ |
3,300 |
|
|
$ |
— |
|
|
$ |
— |
|
|
Fixed maturities investments: |
|
|
|
|
|
|
|
|
|
|
|
|
|
|
|
|
|
U.S. government and agency securities |
|
$ |
25,103 |
|
|
$ |
22,361 |
|
|
$ |
2,742 |
|
|
$ |
— |
|
|
States, municipalities and political subdivisions |
|
|
186,115 |
|
|
|
— |
|
|
|
186,115 |
|
|
|
— |
|
|
Special revenue |
|
|
42,408 |
|
|
|
— |
|
|
|
42,408 |
|
|
|
— |
|
|
Industrial and miscellaneous |
|
|
114,675 |
|
|
|
— |
|
|
|
114,675 |
|
|
|
— |
|
|
Redeemable preferred stocks |
|
|
3,482 |
|
|
|
3,482 |
|
|
|
— |
|
|
|
— |
|
|
Total fixed maturities investments |
|
$ |
375,083 |
|
|
$ |
29,143 |
|
|
$ |
345,940 |
|
|
$ |
— |
|
|
Nonredeemable preferred stocks |
|
|
12,738 |
|
|
|
12,738 |
|
|
|
— |
|
|
|
— |
|
|
Equity securities |
|
|
15,575 |
|
|
|
15,575 |
|
|
|
— |
|
|
|
— |
|
|
Total equity securities |
|
$ |
28,313 |
|
|
$ |
28,313 |
|
|
$ |
— |
|
|
$ |
— |
|
|
Total investments |
|
$ |
403,396 |
|
|
$ |
57,456 |
|
|
$ |
345,940 |
|
|
$ |
— |
|
|
|
|
|
|
|
|
|
|
|
|
|
|
|
|
|
|
|
|
|
(1) |
Includes commercial paper with a maturity of three months or less at the time of purchase of $3.3 million classified in cash and cash equivalents. |
We believe the carrying amounts of our cash and cash equivalents, accounts receivable, accounts payable, accrued expenses, and other current liabilities approximate their fair values at December 31, 2016 and December 31, 2015, due to the immediate or short term maturity of these instruments. We believe the carrying value of notes payable approximates fair value due to the recent nature of the transaction and its variable market rate of interest.
Non-recurring fair value measurements
Assets and liabilities that are measured at fair value on a non-recurring basis include intangible assets and goodwill which are recognized at fair value during the period in which an acquisition is completed, from updated estimates and assumptions during the measurement period, or when they are considered to be impaired. These non-recurring fair value measurements, primarily for intangible assets acquired, were based on Level 3 unobservable inputs. During 2016 these non-recurring fair values inputs consisted of customer relations, non-compete, brand name and goodwill. In the event of an impairment, we determine the fair value of the goodwill and intangible assets using a combination of a discounted cash flow approach and market approaches, which contain significant unobservable inputs and therefore is considered a Level 3 fair value measurement. The unobservable inputs in the analysis generally include future cash flow projections and a discount rate.
There were no non-recurring fair value adjustments to intangible assets and goodwill during 2016, 2015 and 2014 except for certain fair value measurements during 2016 and 2015 following the acquisition of Zephyr and BRC, respectively. The measurement period may be up to one year from the acquisition date. We record any measurement period adjustments to the fair value of assets acquired and liabilities assumed, with the corresponding offset to goodwill.
|
Note 7. |
Property and Equipment |
Property and equipment, net consists of the following at December 31, 2016 and 2015 (in thousands):
|
|
|
December 31, 2016 |
|
|
December 31, 2015 |
|
||
|
|
|
(In thousands) |
|
|||||
|
Land |
|
$ |
2,582 |
|
|
$ |
2,582 |
|
|
Building |
|
|
10,301 |
|
|
|
9,599 |
|
|
Computer hardware and software |
|
|
3,113 |
|
|
|
2,502 |
|
|
Office furniture and equipment |
|
|
759 |
|
|
|
634 |
|
|
Tenant and leasehold improvements |
|
|
3,334 |
|
|
|
3,300 |
|
|
Vehicle fleet |
|
|
842 |
|
|
|
693 |
|
|
Total, at cost |
|
|
20,931 |
|
|
|
19,310 |
|
|
Less: accumulated depreciation and amortization |
|
|
3,752 |
|
|
|
2,199 |
|
|
Property and equipment, net |
|
$ |
17,179 |
|
|
$ |
17,111 |
|
70
Depreciation expense for the years ended December 31, 2016, 2015 and 2014 was $1.6 million, $1.3 million, $0.8 million, respectively. The Company’s real estate consists of 14 acres of land, four buildings with a gross area of 191,000 square feet and a parking garage.
The Company currently leases space to non-affiliates and occupies space in one of the buildings.
Expected annual rental income due under non-cancellable operating leases for our real estate properties is as follows (in thousands):
|
Year |
|
Amount |
|
|
|
January 1 to December 31, 2017 |
|
$ |
2,604 |
|
|
January 1 to December 31, 2018 |
|
|
2,643 |
|
|
January 1 to December 31, 2019 |
|
|
2,492 |
|
|
January 1 to December 31, 2020 |
|
|
2,498 |
|
|
January 1 to December 31, 2021 |
|
|
2,551 |
|
|
Thereafter |
|
|
3,632 |
|
|
|
|
$ |
16,420 |
|
|
Note 8. |
Deferred Policy Acquisition Costs |
The Company defers certain costs in connection with written policies, called Deferred Policy Acquisition Costs (“DPAC”), net of corresponding amounts of ceded reinsurance commissions, called Deferred Reinsurance Ceding Commissions (“DRCC”). Net DPAC is amortized over the effective period of the related insurance policies.
The Company anticipates that its DPAC costs will be fully recoverable in the near term. The table below depicts the activity with regard to DPAC for the years ended December 31, 2016 and 2015:
|
|
|
For the Year Ended December 31, |
|
|||||
|
|
|
2016 |
|
|
2015 |
|
||
|
|
|
(In thousands) |
|
|||||
|
Beginning Balance |
|
$ |
34,800 |
|
|
$ |
24,370 |
|
|
Policy acquisition costs deferred |
|
|
92,400 |
|
|
|
67,616 |
|
|
Amortization |
|
|
(84,421 |
) |
|
|
(57,186 |
) |
|
Ending Balance |
|
$ |
42,779 |
|
|
$ |
34,800 |
|
|
Note 9. |
Reinsurance |
The Company’s reinsurance program is designed, utilizing the Company’s risk management methodology, to address its exposure to catastrophes or large non-catastrophic losses. The Company’s program provides reinsurance protection for catastrophes including hurricanes, tropical storms and tornadoes. The Company’s reinsurance agreements are part of its catastrophe management strategy, which is intended to provide its stockholders an acceptable return on the risks assumed in its property business, and to reduce variability of earnings, while providing protection to the Company’s policyholders.
2016 - 2017 Reinsurance Program
The Company placed its reinsurance program for the period from June 1, 2016 through May 31, 2017 during the second quarter of 2016. This reinsurance program incorporates the catastrophe risk of our two insurance subsidiaries, Heritage P&C, a Florida based insurer and Zephyr, a Hawaii based insurer, into one reinsurance structure. The programs are incorporated into one reinsurance structure and are allocated amongst traditional reinsurers, catastrophe bonds issued by Citrus Re Ltd., a Bermuda special purpose insurer formed in 2014 (“Citrus Re”), and the Florida Hurricane Catastrophe Fund (“FHCF”).Coverage is shared by both insurers unless otherwise noted. The 2016-2017 reinsurance program provides, including retention, first event coverage up to $1.9 billion in Florida, first event coverage up to $1.1 billion in Hawaii, and multiple event coverage up to $3.1 billion.
The reinsurance program, which is segmented into layers of coverage, protects the Company for excess property catastrophe losses and loss adjustment expenses. The Company’s 2016-2017 reinsurance program incorporates the mandatory coverage required by law to be placed with FHCF, which is available only for Florida catastrophe risk. For the 2016 hurricane season, the Company reduced its selected participation percentage in the FHCF from 75% to 45%. The Company also purchased private reinsurance below,
71
alongside and above the FHCF layer, as well as aggregate reinsurance coverage. The following describes the various layers of the Company’s June 1, 2016 to May 31, 2017 reinsurance program.
|
|
• |
The Company’s Retention. If a first catastrophic event strikes Florida, the Company has a primary retention of the first $40 million of losses and loss adjustment expenses, of which Osprey is responsible for $20 million. If a first catastrophic event strikes Hawaii, the Company has a primary retention of the first $30 million of losses and loss adjustment expenses, of which Osprey is responsible for $15 million. If a second event strikes Florida, Heritage P&C’s primary retention decreases to $15 million and the remainder of the losses are ceded to third parties. If a second event strikes Hawaii, Zephyr’s primary retention decreases to $5 million. In the second event only for a loss exceeding $190 million, there is an additional Company co-participation of 5.4% subject to a maximum co-participation of $11.6 million. Heritage P&C and Zephyr each have a $5 million primary retention for events beyond the second catastrophic event. Osprey has no primary retention beyond the first catastrophic event in Florida or Hawaii. Additionally, Osprey is responsible for payment of up to $5.3 million of reinstatement premium, depending on the amount of losses incurred. |
|
|
• |
Shared Layers above retention and below FHCF. Immediately above the retention, the Company has purchased $374 million of reinsurance from third party reinsurers. Through the payment of a reinstatement premium, the Company is able to reinstate the full amount of this reinsurance one time. To the extent that $374 million or a portion thereof is exhausted in a first catastrophic event, the Company has purchased reinstatement premium protection insurance to pay the required premium necessary for the reinstatement of this coverage. |
|
|
• |
FHCF Layer. The Company’s FHCF program provides coverage for Florida events only and includes an estimated maximum provisional limit of 45% of $1.5 billion, in excess of its retention of $460 million. The limit and retention of the FHCF coverage is subject to upward or downward adjustment based on, among other things, submitted exposures to FHCF by all participants. The Company has purchased coverage alongside from third party reinsurers and through reinsurance agreements with Citrus Re. To the extent the FHCF coverage is adjusted, this private reinsurance with third party reinsurers and Citrus Re will adjust to fill in any gaps in coverage up to the reinsurers’ aggregate limits for this layer. The FHCF coverage cannot be reinstated once exhausted, but it does provide coverage for multiple events. |
|
|
• |
Layers alongside the FHCF. The Florida reinsurance program includes third party layers alongside the FHCF. These include 2015 C and 2015 B series catastrophe bonds, which cover Florida only for the 2016 season, and 2016 D and 2016 E catastrophe bond series issued by Citrus Re, which total $377.5 million of coverage, as discussed below, as well as a traditional reinsurance layer providing $200 million of coverage. Through a reinstatement, the Company is able to reinstate the full amount of the $200 million of reinsurance one time. These 2016 catastrophe bonds and the traditional reinsurance layer provide coverage for both Florida and Hawaii catastrophe losses. |
|
|
• |
2016 Class D and E Notes: During February 2016, Heritage P&C and Zephyr entered into two catastrophe reinsurance agreements with Citrus Re. The agreements provide for three years of coverage from catastrophic losses caused by named storms, including hurricanes, beginning on June 1, 2016. Heritage P&C and Zephyr pay a periodic premium to Citrus Re during this three-year risk period. Citrus Re issued an aggregate of $250 million of principal-at-risk variable notes due February 2019 to fund the reinsurance trust account and its obligations to Heritage P&C and Zephyr under the reinsurance agreements. The Class D notes provide $150 million of coverage and the Class E notes provide $100 million of coverage. The Class D and Class E notes provide reinsurance coverage for a sliver of the catastrophe coverage that had previously been provided by the FHCF. The limit of coverage is fully collateralized by a reinsurance trust account for the benefit of Heritage P&C and Zephyr. The maturity date of the notes may be extended up to two additional years to satisfy claims for catastrophic events occurring during the three-year term of the reinsurance agreements. |
72
Layers above the FHCF - Florida program
|
|
• |
2015 Class A Notes: During April 2015, Heritage P&C entered into catastrophe reinsurance agreements with Citrus Re. The 2015 notes do not provide coverage for Zephyr for the 2016 hurricane season. The agreements provide for three years of coverage from catastrophic losses caused by named storms, including hurricanes, beginning on June 1, 2015. Heritage P&C pays a periodic premium to Citrus Re during this three-year risk period. Citrus Re issued principal-at-risk variable notes due April 2018 to fund the reinsurance trust account and its obligations to Heritage P&C under the reinsurance agreements. The Class A notes provide $150 million of coverage for a layer above the FHCF. The limit of coverage is fully collateralized by a reinsurance trust account for the benefit of Heritage P&C. The maturity date of the notes may be extended up to two additional years to satisfy claims for catastrophic events occurring during the three-year term of the reinsurance agreements. |
|
|
• |
2014 Class A Notes: Coverage immediately below and above the 2015 Class A notes is provided by the 2014 reinsurance agreements entered into with Citrus Re. The first contract with Citrus Re provides $150 million of coverage immediately below 2015 Class A, and the second contract provides an additional $50 million of coverage which sits immediately above 2015 Class A. During April 2014, Heritage P&C entered into two catastrophe reinsurance agreements with Citrus Re. The 2014 notes do not provide coverage for Zephyr for the 2016 hurricane season. The agreements provide for three years of coverage from catastrophe losses caused by certain named storms, including hurricanes, beginning on June 1, 2014. The limit of coverage of $200 million is fully collateralized by a reinsurance trust account for the benefit of Heritage P&C. Heritage P&C pays a periodic premium to Citrus Re during this three-year risk period. Citrus Re issued $200 million of principal-at-risk variable notes due April 2017 to fund the reinsurance trust account and its obligations to Heritage P&C under the reinsurance agreements. The maturity date of the notes may be extended up to two additional years to satisfy claims for catastrophic events occurring during the three-year term of the reinsurance agreements. |
|
|
• |
Multi-Zonal Layers – The Company purchased additional layers which provide coverage for Florida for a second event and both first and second event coverage for Hawaii. The first event coverage for Hawaii is a counterpart to the Florida-only catastrophe bond layers and FHCF layer. There is a total of $282 million of reinsurance coverage purchased on this basis, with $260 million having a prepaid reinstatement. The multi-zonal occurrence layer provides first and second event coverage of $260 million for Hawaii and second event coverage of $260 million for Florida. A top and drop multi-zonal layer provides first and subsequent event coverage of $22 million for Hawaii and second or subsequent event coverage of $22 million for Florida. |
|
|
• |
Aggregate Coverage. In addition to what is described above, much of the reinsurance is structured in a way to provide aggregate coverage. $682 million of limit is structured on this basis. To the extent that this coverage is not fully exhausted in the first catastrophic event, it provides coverage commencing at its reduced retention for second and subsequent events where underlying coverage has been previously exhausted. $460 million has a reinstatement, which is prepaid. |
73
For a first catastrophic event striking Florida, our reinsurance program provides coverage for $1.9 billion of losses and loss adjustment expenses, including our retention, and we are responsible for all losses and loss adjustment expenses in excess of such amount. For a first catastrophic event striking Hawaii, our reinsurance program provides coverage for $1.1 billion of losses and loss adjustment expenses, including our retention, and we are responsible for all losses and loss adjustment expenses in excess of such amount. For subsequent catastrophic events, our total available coverage depends on the magnitude of the first event, as we may have coverage remaining from layers that were not previously fully exhausted. $860 million of limit purchased in 2016 includes a reinstatement, with $825 million being prepaid. In total, we have purchased $3 billion of potential reinsurance coverage, including our retention, for multiple catastrophic events. Our ability to access this coverage, however, will be subject to the severity and frequency of such events.
2015 – 2016 Reinsurance Program
During the second quarter of 2015, the Company placed its reinsurance program for the period from June 1, 2015 through May 31, 2016. The Company’s 2015-2016 reinsurance program incorporated the mandatory coverage required by law to be placed with FHCF. For the 2015 hurricane season, the Company selected 75% participation in the FHCF. The Company also purchased private reinsurance below, alongside and above the FHCF layer, as well as aggregate reinsurance coverage. The following describes the various layers of the Company’s June 1, 2015 to May 31, 2016 reinsurance program.
|
|
• |
The Company’s Retention. For the first catastrophic event, the Company had a primary retention of the first $35 million of losses and loss adjustment expenses, of which Osprey was responsible for $20 million. For a second event, Heritage P&C’s primary retention decreased to $5 million and Osprey is responsible for $10 million. To the extent that there is reinsurance coverage remaining, Heritage P&C has a $5 million primary retention for events beyond the second catastrophic event. Osprey had no primary retention beyond the second catastrophic event. |
|
|
• |
Layers Below FHCF. Immediately above the Company’s retention, the Company purchased $440 million of reinsurance from third party reinsurers. Through the payment of a reinstatement premium, the Company was able to reinstate the full amount of this reinsurance one time. To the extent that $440 million or a portion thereof was exhausted in a first catastrophic event, the Company had purchased reinstatement premium protection insurance to pay the required premium necessary for the reinstatement of this coverage. A portion of this coverage wrapped around the FHCF and provided coverage alongside and above the FHCF. |
|
|
• |
FHCF Layer. The Company’s FHCF coverage included an estimated maximum provisional limit of 75% of $920 million, or $690 million, in excess of its retention and private reinsurance of $336 million. The limit and retention of the FHCF coverage was subject to upward or downward adjustment based on, among other things, submitted exposures to FHCF by all participants. The Company had purchased coverage alongside from third party reinsurers and through reinsurance agreements with Citrus Re. To the extent the FHCF coverage was adjusted, this private reinsurance with third party reinsurers and Citrus Re would adjust to fill in any gaps in coverage up to the reinsurers’ aggregate limits for this layer. The FHCF coverage could not be reinstated once exhausted, but it did provide coverage for multiple events. |
|
|
• |
CAT Bond Layer alongside the FHCF. During April 2015 Heritage P&C entered into three catastrophe reinsurance agreements with Citrus Re. The agreements provided for three years of coverage from catastrophic losses caused by named storms, including hurricanes, beginning on June 1, 2015. Heritage P&C paid periodic premiums to Citrus Re during the three-year risk period. Citrus Re issued an aggregate of $277.5 million of principal-at-risk variable notes due April 2017 to fund the reinsurance trust account and its obligations to Heritage P&C under the reinsurance agreements. These notes were issued in three classes. The Class A notes provide $150 million of coverage for the layer immediately above the FHCF. The Class B notes provided $97.5 million of coverage, and the Class C notes provided $30 million of coverage. The Class B and Class C notes provided reinsurance coverage for a sliver of the catastrophe coverage that had previously been provided by the FHCF. The limit of coverage was fully collateralized by a reinsurance trust account for the benefit of Heritage P&C. The maturity date of the notes may be extended up to two additional years to satisfy claims for catastrophic events occurring during the three-year term of the reinsurance agreements. |
74
|
|
• |
Aggregate Coverage. In addition to the layers described above, the Company also purchased $125 million of aggregate reinsurance coverage for losses and loss adjustment expenses in excess of $1.7 billion for a first catastrophic event. To the extent that this coverage was not fully exhausted in the first catastrophic event, it provided coverage commencing at its reduced retention for second and subsequent events and where underlying coverage had been previously exhausted. There was no reinstatement of the aggregate reinsurance coverage once exhausted, but it did provide coverage for multiple events. |
For a first catastrophic event, our 2015-2016 reinsurance program provided coverage for $1.8 billion of losses and loss adjustment expenses, including our retention, and were responsible for all losses and loss adjustment expenses in excess of such amount. For subsequent catastrophic events, our total available coverage depended on the magnitude of the first event, as we may have had coverage remaining from layers that were not previously fully exhausted. We also purchased reinstatement premium protection insurance to provide an additional $440 million of coverage. Our aggregate reinsurance layer also provided coverage for second and subsequent events to the extent not exhausted in prior events. In total, we purchased $2.3 billion of reinsurance coverage, including our retention, for multiple catastrophic events for the 2015-2016 hurricane season
Property Per Risk Coverage
The Company also purchased property per risk coverage for losses and loss adjustment expenses in excess of $1 million per claim. The limit recovered for an individual loss is $9 million and total limit for all losses is $27 million. There are two reinstatements available with additional premium due based on the amount of the layer exhausted. In addition, the Company purchased facultative reinsurance in excess of $10 million for any commercial properties it insured that the total insured value exceeded $10 million.
2014 – 2015 Reinsurance Program
During the second quarter of 2014, the Company placed its reinsurance program for the period from June 1, 2014 through May 31, 2015. The Company’s 2014-2015 reinsurance program incorporated the mandatory coverage required by law to be placed with FHCF. The Company also purchased private reinsurance below, alongside and above the FHCF layer, as well as aggregate reinsurance coverage. The following describes the various layers of the Company’s June 1, 2014 to May 31, 2015 reinsurance program.
|
|
• |
The Company’s Retention. For the first catastrophic event, the Company had a primary retention of the first $15 million of losses and loss adjustment expenses, of which Osprey was responsible for $6 million. For a second event, Heritage P&C’s primary retention decreased to $2 million and Osprey was responsible for $4 million. To the extent that there was reinsurance coverage remaining, Heritage P&C had a $2 million primary retention for events beyond the third catastrophic event. Osprey had no primary retention beyond the second catastrophic event. |
|
|
• |
Layers Below FHCF. Immediately above the Company’s retention, the Company purchased $185 million of reinsurance from third party reinsurers. Through the payment of a reinstatement premium, the Company was able to reinstate the full amount of this reinsurance one time. To the extent that $185 million or a portion thereof was exhausted in a first catastrophic event, the Company purchased reinstatement premium protection insurance to pay the required premium necessary for the reinstatement of this coverage. A portion of this coverage wrapped around the FHCF and provided coverage alongside the FHCF. |
|
|
• |
FHCF Layer. The Company’s FHCF coverage included an estimated maximum provisional limit of 90% of $484 million, or $436 million, in excess of its retention and private reinsurance of $181 million. The limit and retention of the FHCF coverage was subject to upward or downward adjustment based on, among other things, submitted exposures to FHCF by all participants. The Company purchased coverage alongside from third party reinsurers. The layer alongside was in the amount of $48 million. To the extent the FHCF coverage was adjusted, this private reinsurance would adjust to fill in any gaps in coverage up to the reinsurers’ aggregate limits for this layer. The FHCF coverage could not be reinstated once exhausted, but it did provide coverage for multiple events. |
75
|
|
• |
Aggregate Coverage. In addition to the layers described above, the Company purchased $105 million of aggregate reinsurance coverage for losses and loss adjustment expenses in excess of $825 million for a first catastrophic event. To the extent that this coverage was not fully exhausted in the first catastrophic event, it provided coverage commencing at its reduced retention levels for second and subsequent events and where underlying coverage had been previously exhausted. There was no reinstatement of the aggregate reinsurance coverage once exhausted, but it did provide coverage for multiple events. Osprey provided $20 million of protection in the layer above $940 million. |
For a first catastrophic event, the Company’s 2014-2015 reinsurance program provided coverage for $990 million of losses and loss adjustment expenses, including its retention, and the Company was responsible for all losses and loss adjustment expenses in excess of such amount. For subsequent catastrophic events, the Company’s total available coverage depended on the magnitude of the first event, as the Company may have had coverage remaining from layers that were not previously fully exhausted. The Company purchased reinstatement premium protection insurance to provide an additional $185 million of coverage. The Company’s aggregate reinsurance layer also provided coverage for second and subsequent events to the extent not exhausted in prior events.
Assumption Transactions and Assumed Premiums Written
The following table depicts written premiums, earned premiums and losses, showing the effects that the Company’s assumption transactions have on these components of the Company’s consolidated statements of income and comprehensive income:
|
|
|
For the Year Ended December 31, |
|
|||||||||
|
|
|
2016 |
|
|
2015 |
|
|
2014 |
|
|||
|
|
|
(In thousands) |
|
|||||||||
|
Premium written: |
|
|
|
|
|
|
|
|
|
|
|
|
|
Direct |
|
$ |
618,932 |
|
|
$ |
487,583 |
|
|
$ |
283,295 |
|
|
Assumed |
|
|
7,772 |
|
|
|
98,515 |
|
|
|
153,112 |
|
|
Ceded |
|
|
(252,113 |
) |
|
|
(183,841 |
) |
|
|
(99,798 |
) |
|
Net premium written |
|
$ |
374,591 |
|
|
$ |
402,257 |
|
|
$ |
336,609 |
|
|
Change in unearned premiums: |
|
|
|
|
|
|
|
|
|
|
|
|
|
Direct |
|
$ |
(29,480 |
) |
|
$ |
(103,138 |
) |
|
$ |
(80,617 |
) |
|
Assumed |
|
|
43,294 |
|
|
|
41,780 |
|
|
|
(44,276 |
) |
|
Ceded |
|
|
23,316 |
|
|
|
35,369 |
|
|
|
11,896 |
|
|
Net decrease (increase) |
|
$ |
37,130 |
|
|
$ |
(25,989 |
) |
|
$ |
(112,997 |
) |
|
Premiums earned: |
|
|
|
|
|
|
|
|
|
|
|
|
|
Direct |
|
$ |
589,452 |
|
|
$ |
384,445 |
|
|
$ |
202,678 |
|
|
Assumed |
|
|
51,066 |
|
|
|
140,295 |
|
|
|
108,836 |
|
|
Ceded |
|
|
(228,797 |
) |
|
|
(148,472 |
) |
|
|
(87,902 |
) |
|
Net premiums earned |
|
$ |
411,721 |
|
|
$ |
376,268 |
|
|
$ |
223,612 |
|
|
Losses and LAE incurred: |
|
|
|
|
|
|
|
|
|
|
|
|
|
Direct |
|
$ |
214,362 |
|
|
$ |
107,552 |
|
|
$ |
64,686 |
|
|
Assumed |
|
|
26,361 |
|
|
|
33,639 |
|
|
|
24,874 |
|
|
Ceded |
|
|
(1,861 |
) |
|
|
— |
|
|
|
— |
|
|
Net losses and LAE incurred |
|
$ |
238,862 |
|
|
$ |
141,191 |
|
|
$ |
89,560 |
|
76
The following table highlights the effects that the Company’s assumption transactions have on unpaid losses and loss adjustment expenses and unearned premiums:
|
|
|
For the Year Ended December 31, |
|
|||||||||
|
|
|
2016 |
|
|
2015 |
|
|
2014 |
|
|||
|
|
|
(In thousands) |
|
|||||||||
|
Unpaid losses and loss adjustment expenses: |
|
|
|
|
|
|
|
|
|
|
|
|
|
Direct |
|
$ |
119,339 |
|
|
$ |
60,223 |
|
|
$ |
34,420 |
|
|
Assumed |
|
|
20,798 |
|
|
|
23,499 |
|
|
|
17,049 |
|
|
Gross unpaid losses and LAE |
|
$ |
140,137 |
|
|
$ |
83,722 |
|
|
$ |
51,469 |
|
|
Unearned premiums: |
|
|
|
|
|
|
|
|
|
|
|
|
|
Direct |
|
$ |
317,579 |
|
|
$ |
258,754 |
|
|
$ |
155,617 |
|
|
Assumed |
|
|
445 |
|
|
|
43,739 |
|
|
|
85,519 |
|
|
Gross unearned premiums |
|
|
318,024 |
|
|
|
302,493 |
|
|
|
241,136 |
|
|
Ceded |
|
|
(106,609 |
) |
|
|
(78,517 |
) |
|
|
(43,148 |
) |
|
Net unearned premiums |
|
$ |
211,415 |
|
|
$ |
223,976 |
|
|
$ |
197,988 |
|
|
Note 10. |
Reserve For Unpaid Losses |
The Company determines the reserve for unpaid losses on an individual-case basis for all incidents reported. The liability also includes amounts for which are commonly referred to as incurred but not reported, or “IBNR”, claims as of the balance sheet date.
The table below summarizes the activity related to the Company’s reserve for unpaid losses:
|
|
|
For the Year Ended December 31, |
|
|||||||||
|
|
|
2016 |
|
|
2015 |
|
|
2014 |
|
|||
|
|
|
|
||||||||||
|
Balance, beginning of period |
|
$ |
83,722 |
|
|
$ |
51,469 |
|
|
$ |
19,344 |
|
|
Less: reinsurance recoverable on paid losses |
|
|
— |
|
|
|
— |
|
|
|
— |
|
|
Net balance, beginning of period |
|
|
83,722 |
|
|
|
51,469 |
|
|
|
19,344 |
|
|
Incurred related to: |
|
|
|
|
|
|
|
|
|
|
|
|
|
Current year |
|
|
220,071 |
|
|
|
146,484 |
|
|
|
89,783 |
|
|
Prior years |
|
|
18,791 |
|
|
|
(5,293 |
) |
|
|
(223 |
) |
|
Total incurred |
|
|
238,862 |
|
|
|
141,191 |
|
|
|
89,560 |
|
|
Paid related to: |
|
|
|
|
|
|
|
|
|
|
|
|
|
Current year |
|
|
120,626 |
|
|
|
81,673 |
|
|
|
45,618 |
|
|
Prior years |
|
|
62,407 |
|
|
|
27,265 |
|
|
|
11,817 |
|
|
Total paid |
|
|
183,033 |
|
|
|
108,938 |
|
|
|
57,435 |
|
|
Net balance, end of period |
|
|
139,551 |
|
|
|
83,722 |
|
|
|
51,469 |
|
|
Plus: reinsurance recoverable on unpaid losses |
|
|
586 |
|
|
|
— |
|
|
|
— |
|
|
Balance, end of period |
|
$ |
140,137 |
|
|
$ |
83,722 |
|
|
$ |
51,469 |
|
The Company writes insurance in the states of Florida, North Carolina, South Carolina, Hawaii and Georgia, which could be exposed to hurricanes or other natural catastrophes. Although the occurrence of a major catastrophe could have a significant effect on our monthly or quarterly results, such an event is unlikely to be so material as to disrupt our overall normal operations. However, the Company is unable to predict the frequency or severity of any such events that may occur in the near term or thereafter. The Company believes that the reserve for unpaid losses reasonably represents the amount necessary to pay all claims and related expenses which may arise from incidents that have occurred as of the balance sheet date.
The Company’s losses incurred for the years ended December 31, 2016 and 2015 reflecting a prior year deficiency of $18.8 million and a redundancy of $5.3 million, respectively, associated with management’s best estimate of the actuarial loss and LAE reserves with consideration given to Company specific historical loss experience. Most of the unfavorable development was from personal lines. Also, most of the unfavorable emergence came from the second, third and fourth quarters of 2015, primarily related to claims involving litigation and claims that were represented by attorneys, public adjusters or others (sometimes referred to as Assignment of Benefits). Also, a majority of the unfavorable development in 2016 has been isolated to the tri-county region of Florida (the counties of Miami-Dade, Broward and Palm Beach).
77
The Company writes insurance in the states of Florida, North Carolina, South Carolina and Hawaii, which could be exposed to hurricanes or other natural catastrophes. The occurrence of a major catastrophe could have a significant effect on the Company’s yearly results and cause a temporary disruption of the normal operations of the Company. However, the Company is unable to predict the frequency or severity of any such events that may occur in the near term or thereafter.
The following is information about incurred and paid claims development as of December 31, 2016, net of reinsurance, as well as cumulative claim frequency and the total of incurred-but-not-reported liabilities plus expected development on reported claims included within the net incurred claims amounts.
|
Incurred Loss and Allocated Loss Adjustment Expenses, Net of Reinsurance |
|
|||||||||||||||||||||||||||
|
(in thousands, except number of claims) |
|
|||||||||||||||||||||||||||
|
|
|
|
|
|
|
|
|
|
|
|
|
|
|
|
|
|
|
|
|
|
|
|
|
|
|
|
|
|
|
Unaudited |
|
|
|
|
|
|
|
|
|
|
|
|
|
|||||||||||||||
|
Accident year |
|
2012 |
|
|
2013 |
|
|
2014 |
|
|
2015 |
|
|
2016 |
|
|
Net IBNR Reserves |
|
|
Reported Claims |
|
|||||||
|
2012 |
|
$ |
1,396 |
|
|
$ |
851 |
|
|
$ |
811 |
|
|
$ |
784 |
|
|
$ |
797 |
|
|
$ |
6 |
|
|
|
125 |
|
|
2013 |
|
|
|
|
|
|
37,005 |
|
|
|
35,819 |
|
|
|
37,212 |
|
|
|
37,090 |
|
|
|
531 |
|
|
|
3,607 |
|
|
2014 |
|
|
|
|
|
|
|
|
|
|
91,839 |
|
|
|
86,508 |
|
|
|
86,634 |
|
|
|
2,155 |
|
|
|
7,770 |
|
|
2015 |
|
|
|
|
|
|
|
|
|
|
|
|
|
|
141,125 |
|
|
|
159,899 |
|
|
|
13,637 |
|
|
|
11,068 |
|
|
2016 |
|
|
|
|
|
|
|
|
|
|
|
|
|
|
|
|
|
|
207,183 |
|
|
|
65,884 |
|
|
|
14,603 |
|
|
|
|
|
|
|
|
|
|
|
|
|
|
|
|
Total |
|
|
$ |
491,603 |
|
|
$ |
82,213 |
|
|
|
|
|
|
|
Cumulative Paid Losses and Allocated Loss Adjustment Expenses, Net of Reinsurance |
|
|||||||||||||||||||
|
|
|
|
|
|
|
|
|
|
|
|
|
|
|
|
|
|
|
|
|
|
|
Unaudited |
|
|
|
|
|
|||||||||||||||
|
Accident year |
|
2012 |
|
|
2013 |
|
|
2014 |
|
|
2015 |
|
|
2016 |
|
|||||
|
2012 |
|
$ |
12 |
|
|
$ |
615 |
|
|
$ |
695 |
|
|
$ |
756 |
|
|
$ |
766 |
|
|
2013 |
|
|
|
|
|
|
18,625 |
|
|
|
29,023 |
|
|
|
32,414 |
|
|
|
35,322 |
|
|
2014 |
|
|
|
|
|
|
|
|
|
|
47,408 |
|
|
|
70,932 |
|
|
|
79,341 |
|
|
2015 |
|
|
|
|
|
|
|
|
|
|
|
|
|
|
76,310 |
|
|
|
130,267 |
|
|
2016 |
|
|
|
|
|
|
|
|
|
|
|
|
|
|
|
|
|
|
107,771 |
|
|
|
|
|
|
|
|
|
|
|
|
|
|
|
|
Total |
|
|
$ |
353,467 |
|
|
|
Reconciliation of Reserve Balances to Liability for Unpaid Loss and Loss Adjustment Expenses |
|
|||||
|
|
|
|
|
|
|
|
|
Unpaid Loss and Allocated Loss Adjustment Expense, Net of Reinsurance |
|
|
|
$ |
138,136 |
|
|
Ceded Unpaid Loss and Allocated Loss Adjustment Expense |
|
|
|
|
586 |
|
|
Unpaid Unallocated Loss Adjustment Expense |
|
|
|
|
1,415 |
|
|
Unpaid losses and loss adjustment expenses |
|
|
|
$ |
140,137 |
|
|
Average Annual Percentage Payout of Incurred Claims by Age, Net of Reinsurance as of December 31, 2016 |
|
|||||||||||||||||||||||
|
|
|
|
|
|
|
|
|
|
|
|
|
|
|
|
|
|
|
|
|
|
|
|
|
|
|
|
|
Year - 1 |
|
|
Year - 2 |
|
|
Year - 3 |
|
|
Year - 4 |
|
|
Year - 5 |
|
|
Thereafter |
|
||||||
|
Percentage |
|
|
53% |
|
|
|
29% |
|
|
|
9% |
|
|
|
4% |
|
|
|
1% |
|
|
|
4% |
|
|
Note 11. |
Note Payable |
On December 15, 2016, we issued Senior Secured Notes (“Secured Notes”) in the aggregate amount of $79.5 million, 7-year term note payable to six accredited investors. The Secured Notes bears interest of 8.75% plus 0.95% of the three month average of LIBOR. Principal and interest is paid quarterly, interest payments commence on March 15, 2017, the quarterly principal payments commence on December 31, 2018. At December 31, 2016, we owed $72.9 million, net of issuance costs. In addition, the Company incurred approximately $6.6 million of debt issuance costs
Long-term debt at December 31, 2016, consisted of the following:
78
|
Principal |
|
|
Unamortized Debt Issuance Costs |
|
|||
|
|
(in thousands) |
|
|||||
|
Senior Secured Notes, due December 15, 2023 (interest computed at 8.75% plus 3 month Libor average, at December 31, 2016) |
$ |
79,500 |
|
|
$ |
6,595 |
|
The Secured Notes contain customary restrictive covenants relating to merger, modification of the indenture, subordination, issuance of debt securities and sale of assets, the most significant of which include limitations with respect to certain designated subsidiaries on the incurrence of additional indebtedness or guarantees secured by any security interest on any shares of their capital stock. The Secured Notes covenants also limit the Company’s ability to sell or otherwise dispose of any shares of capital stock of such designated subsidiaries. The Secured Notes do not have the benefit of any sinking funds. They also contain customary limitations and lien provisions as well as customary events of default provisions, which breached, could result in the accelerated maturity of the Secured Notes. The Company was in compliance with the senior notes covenants for the year ended December 31, 2016.
Subject to replacement capital covenant, the Secured Notes may be redeemable, in whole or in part, at any time on or after December 15, 2018, based on the quarterly payment date, at the following redemption prices (as a percentage of outstanding principal amount of the notes to be redeemed) plus accrued and unpaid interest and principal of the Secured Notes: 2018 – 103%; 2019 – 102%; 2020 – 101% and thereafter at 100%. If there is a change in control offer that Holder has the right to require the Company to purchase such Holder’s Secured Notes based on the redemption terms stated above.
The effective interest rate, taking into account the stated interest expense and amortization of debt issuance costs, approximates 9.7%.
Expected annual principal payments due by Heritage Insurance under the Senior Secured Note agreement is as follows:
|
Year |
|
Amount |
|
|
|
|
|
(in thousands) |
|
|
|
2017 |
|
$ |
— |
|
|
2018 |
|
|
1,988 |
|
|
2019 |
|
|
7,465 |
|
|
2020 |
|
|
6,746 |
|
|
2021 |
|
|
6,097 |
|
|
Thereafter |
|
|
57,204 |
|
|
|
|
$ |
79,500 |
|
As of December 31, 2016, we recorded interest expense on debt liabilities and amortization of debt issuance costs of $321 thousand and $41 thousand, respectively.
|
Note 12. |
Income Taxes |
The following table summarizes the provision for income taxes:
|
|
|
For the Year Ended December 31, |
|
|||||||||
|
|
|
2016 |
|
|
2015 |
|
|
2014 |
|
|||
|
|
|
(In thousands) |
|
|||||||||
|
Federal: |
|
|
|
|
|
|
|
|
|
|
|
|
|
Current |
|
$ |
16,575 |
|
|
$ |
48,524 |
|
|
$ |
26,440 |
|
|
Deferred |
|
|
2,735 |
|
|
|
970 |
|
|
|
(3,219 |
) |
|
Provision for Federal income tax expense |
|
|
19,310 |
|
|
|
49,494 |
|
|
|
23,221 |
|
|
State: |
|
|
|
|
|
|
|
|
|
|
|
|
|
Current |
|
|
2,893 |
|
|
|
8,238 |
|
|
|
4,479 |
|
|
Deferred |
|
|
335 |
|
|
|
46 |
|
|
|
(545 |
) |
|
Provision for State income tax expense |
|
|
3,228 |
|
|
|
8,284 |
|
|
|
3,934 |
|
|
Provision for income taxes |
|
$ |
22,538 |
|
|
$ |
57,778 |
|
|
$ |
27,155 |
|
79
The following table sets forth the components of income before income taxes for the years ended December 31, 2016, 2015 and 2014 (in thousands):
|
|
|
2016 |
|
|
2015 |
|
|
2014 |
|
|||
|
Pass-through entities (Through May 22, 2014) |
|
$ |
— |
|
|
$ |
— |
|
|
$ |
2,668 |
|
|
Non-pass through entities |
|
|
56,403 |
|
|
|
150,290 |
|
|
|
71,584 |
|
|
Income before income taxes |
|
$ |
56,403 |
|
|
$ |
150,290 |
|
|
$ |
74,252 |
|
The actual income tax expense differs from the expected income tax expense computed by applying the combined applicable effective federal and state tax rates to income before the provision for income taxes as follows:
|
|
|
For the Year Ended December 31, |
|
|||||||||
|
|
|
2016 |
|
|
2015 |
|
|
2014 |
|
|||
|
Expected income tax expense at federal rate |
|
|
35.0 |
% |
|
|
35.0 |
% |
|
|
35.0 |
% |
|
State tax expense, net of federal tax benefits |
|
|
3.7 |
% |
|
|
3.6 |
% |
|
|
3.6 |
% |
|
Permanent items |
|
|
1.4 |
% |
|
|
-1.0 |
% |
|
|
0.0 |
% |
|
Other |
|
|
-0.1 |
% |
|
|
0.9 |
% |
|
|
-2.0 |
% |
|
Reported income tax expense |
|
|
40.0 |
% |
|
|
38.5 |
% |
|
|
36.6 |
% |
The effective income tax rate differs from the statutory income tax rate in 2016, 2015 and 2014 primarily due to state income taxes and the fact that a portion of the Company’s consolidated pre-tax income through May 22, 2014 was earned at our limited liability companies that had elected to be taxed under the Partnership provisions of the Internal Revenue Code. Accordingly, all income or losses and applicable tax credits generated by these entities through that date are reported on the common shareholders’ individual tax returns, and no federal income taxes were recorded by the Company prior to May 22, 2014.
Deferred income taxes reflect the net tax effects of temporary differences between the carrying amounts of assets and liabilities for financial reporting purposes and the amounts used for income tax purposes.
The table below summarizes the significant components of our net deferred tax assets (liabilities):
|
|
|
For the Year Ended December 31, |
|
|||||
|
|
|
2016 |
|
|
2015 |
|
||
|
Deferred tax assets: |
|
(In thousands) |
|
|||||
|
Unearned premiums |
|
$ |
17,209 |
|
|
$ |
17,979 |
|
|
Tax-related discount on loss reserve |
|
|
1,829 |
|
|
|
1,140 |
|
|
Unrealized loss |
|
|
3,113 |
|
|
|
1,277 |
|
|
Stock-based compensation |
|
|
1,604 |
|
|
|
1,617 |
|
|
Prepaid expenses |
|
|
1,482 |
|
|
|
— |
|
|
Other |
|
|
312 |
|
|
|
256 |
|
|
Total deferred tax asset |
|
|
25,549 |
|
|
|
22,269 |
|
|
Deferred tax liabilities: |
|
|
|
|
|
|
|
|
|
Deferred acquisition costs |
|
|
16,377 |
|
|
|
13,424 |
|
|
Unrealized gain |
|
|
— |
|
|
|
— |
|
|
Property and equipment |
|
|
355 |
|
|
|
473 |
|
|
Basis in purchased investments |
|
|
1,697 |
|
|
|
— |
|
|
Basis in purchased intangibles |
|
|
9,791 |
|
|
|
— |
|
|
Other |
|
|
332 |
|
|
|
408 |
|
|
Total deferred tax liabilities |
|
|
28,552 |
|
|
|
14,305 |
|
|
Less: valuation allowance |
|
|
— |
|
|
|
— |
|
|
Net deferred tax (liability) asset |
|
$ |
(3,003 |
) |
|
$ |
7,964 |
|
In assessing the net carrying amount of deferred tax assets, we consider whether it is more likely than not that we will not realize some portion or all of the deferred tax assets. The ultimate realization of deferred tax assets depends upon the generation of future taxable income during the periods in which those temporary differences become deductible. We consider the scheduled reversal of deferred tax liabilities, projected future taxable income and tax planning strategies in making this assessment. The remaining goodwill
80
from asset purchases that is deductible for tax purposes over the future years totaled $7 million and $7.6 million for the years ended December 31, 2016 and 2015, respectively.
The statute of limitations related to our federal and state income tax returns remains open from our first filings for 2013 through 2015. For the 2014 tax year, the federal income tax return was examined by the tax authority resulting no material adjustment. Currently, no taxing authorities are examining any of our federal or state income tax returns.
The reinsurance affiliate, which is based in Bermuda, made an irrevocable election under section 953(d) of the U.S. Internal Revenue Code of 1986, as amended, to be treated as a domestic insurance company for U.S. Federal income tax purposes. As a result of this election, our reinsurance subsidiary is subject to United States income tax as if it were a U.S. corporation.
As of December 31, 2016, the Company had no uncertain tax positions or unrecognized tax benefits that, if recognized, would impact the effective income tax rate.
|
Note 13. |
Statutory Accounting and Regulations |
State laws and regulations, as well as national regulatory agency requirements, govern the operations of all insurers such as our insurance subsidiaries. The various laws and regulations require that insurers maintain minimum amounts of statutory surplus and risk-based capital; restrict insurers’ ability to pay dividends; restrict the allowable investment types and investment mixes, and subject the Company’s insurers to assessments.
The Company’s insurance subsidiaries are required to file with state insurance regulatory authorities an “Annual Statement” which reports, among other items, net income and surplus as regards policyholders, which is called stockholder’s equity under GAAP. Combined results of the Company’s insurance subsidiaries reported statutory net income of $567 thousand and $45.6 million for the years ended December 31, 2016 and 2015, respectively. The Company’s insurance subsidiaries must maintain capital and surplus ratios or balances as determined by the regulatory authority of the states in which they are domiciled. Heritage P&C is required to maintain capital and surplus equal to the greater of $15 million or 10% of their respective liabilities. Zephyr is required to maintain a deposit of $750 thousand in a federally insured financial institution. The Company’s combined statutory surplus was $276 million and $216.6 million at December 31, 2016 and December 31, 2015, respectively. State law also requires the Company’s insurance subsidiaries to adhere to prescribed premium-to-capital surplus ratios, with which the Company is in compliance. At December 31, 2016, our insurance subsidiaries met the financial and regulatory requirements of the states in which they do business.
In 2014, the Florida legislature passed Senate Bill 1308, which was signed into law by the Governor. Among other things, this bill incorporates the National Association of Insurance Commissioners (“NAIC”) recommendations with regard to expansion of the regulation of insurers to include non-insurance entity affiliates. Specifically, the new law permits the Office of Insurance Regulation to examine affiliated entities within an insurance holding company system in order to ascertain the financial condition of the insurer. The law also provides for certain disclosures with regard to enterprise risk, which are satisfied by the provision of related information filed with the SEC. This legislation was designed to bolster regulation for insurer solvency and governance and became effective January 1, 2015.
The NAIC published risk-based capital guidelines for insurance companies that are designed to assess capital adequacy and to raise the level of protection that statutory surplus provides for policy holders. Most states, including Florida, have enacted the NAIC guidelines as statutory requirements, and insurers having less statutory surplus than required will be subject to varying degrees of regulatory action, depending on the level of capital inadequacy. State insurance regulatory authorities could require an insurer to cease operations in the event the insurer fails to maintain the required statutory capital.
The level of required risk-based capital (“RBC”) is calculated and reported annually. There are five outcomes to the RBC calculation set forth by the NAIC which are as follows:
|
1. |
No Action Level—If RBC is greater than 200%, no further action is required. |
|
2. |
Company Action Level—If RBC is between 150%-200%, the insurer must prepare a report to the regulator outlining a comprehensive financial plan that identifies conditions that contributed to the insurer’s financial condition and proposes corrective actions. |
|
3. |
Regulatory Action Level—If RBC is between 100%-150%, the state insurance commissioner is required to perform any examinations or analyses to the insurer’s business and operations that he or she deems necessary as well as issuing appropriate corrective orders. |
81
|
5. |
Mandatory Control Level—If RBC is less than 70%, the regulator is required to take steps to place the insurer under its control regardless of the level of capital and surplus. |
At December 31, 2016, the ratio of adjusted capital to authorized control level risk based capital for each of our insurance company subsidiaries was above 300%.
State law for Florida and Hawaii permits an insurer to pay dividends or make distributions out of that part of statutory surplus derived from net operating profit and net realized capital gains. The law further provides calculations to determine the amount of dividends or distributions that can be made without the prior approval of the insurance regulatory authority and the amount of dividends or distributions that would require prior approval of the insurance regulatory authority. Statutory risk-based capital requirements may further restrict our insurance subsidiaries ability to pay dividends or make distributions if the amount of the intended dividend or distribution would cause statutory surplus to fall below minimum risk-based capital requirements. However, the consent order authorizing our commencement of operations precludes us from paying dividends without the prior approval of FLOIR until July 31, 2017.
Florida law limits an insurer’s investment in equity instruments and also restricts investments in medium to low quality debt instruments. The Company was in compliance with all investment restrictions at December 31, 2016 and 2015.
Governmental agencies or certain quasi-governmental entities can levy assessments upon the Company in the states in which the Company writes policies. See Note 1 for a description of how the Company recovers assessments imposed upon it.
Governmental agencies or certain quasi-governmental entities can also levy assessments upon policyholders, and the Company collects the amount of the assessments from policyholders as surcharges for the benefit of the assessing agency. There are currently no assessments to be collected from policyholders and remitted to any governmental or quasi-governmental entities. If an assessment becomes levied the Company would multiply the premium written on each policy by these assessment percentages to determine the additional amount that it will collect from the policyholder and remit to the assessing agencies.
The Company reported its insurance subsidiaries’ assets, liabilities and results of operations in accordance with GAAP, which varies from statutory accounting principles prescribed or permitted by state laws and regulations, as well as by general industry practices. The following items are principal differences between statutory accounting and GAAP:
|
• |
Statutory accounting requires that the Company excluded certain assets, called non-admitted assets, from the balance sheet. |
|
• |
Statutory accounting requires the Company to expense policy acquisition costs when incurred, while GAAP allows the Company to defer and amortize policy acquisition costs over the estimated life of the policies. |
|
• |
Statutory accounting dictates how much of a deferred income tax asset the Company can admit on a statutory balance sheet. |
|
• |
Statutory accounting requires that the Company record certain investments at cost or amortized cost, while the Company records other investments at fair value; however, GAAP requires that we record all available for sale investments at fair value. |
|
• |
Statutory accounting requires that surplus notes, also known as surplus debentures, be recorded in statutory surplus, while GAAP requires the Company to record surplus notes as a liability. |
|
• |
Statutory accounting allows bonds to be carried at amortized cost or fair value based on the rating received from the Securities Valuation Office of the NAIC, while they are recorded at fair value for GAAP if designated as available for sale. |
|
• |
Statutory accounting allows ceding commission income to be recognized when written if the cost of acquiring and renewing the associated business exceeds the ceding commissions, but under GAAP such income is deferred and recognized over the coverage period. |
|
• |
Statutory accounting requires that unearned premiums and loss reserves be presented net of related reinsurance rather than on a gross basis under GAAP. |
82
|
• |
Statutory accounting requires an additional admissibility test outlined in Statements on Statutory Accounting Principles, No. 101 and the change in deferred income tax is reported directly in capital and surplus, rather than being reported as a component of income tax expense under GAAP. |
The table below reconciles the Company’s consolidated GAAP net income to statutory net income of its insurance subsidiaries (in thousands):
|
|
|
For the Year Ended December 31, |
|
|||||||||
|
|
|
2016 |
|
|
2015 |
|
|
2014 |
|
|||
|
|
|
|
|
|
|
|
|
|
|
|
|
|
|
Consolidated GAAP net income |
|
$ |
33,865 |
|
|
$ |
92,512 |
|
|
$ |
47,097 |
|
|
Increase (decrease) due to: |
|
|
|
|
|
|
|
|
|
|
|
|
|
Deferred income taxes |
|
|
6,069 |
|
|
|
1,755 |
|
|
|
(3,764 |
) |
|
Deferred policy acquisition costs |
|
|
(7,979 |
) |
|
|
(10,430 |
) |
|
|
(14,605 |
) |
|
Surplus note interest |
|
— |
|
|
|
(347 |
) |
|
|
(1,445 |
) |
|
|
Non-statutory subsidiaries |
|
|
(32,874 |
) |
|
|
(36,569 |
) |
|
|
(16,788 |
) |
|
Investment basis difference |
|
|
540 |
|
|
— |
|
|
— |
|
||
|
Pre-acquisition income |
|
|
3,755 |
|
|
— |
|
|
— |
|
||
|
Equity compensation |
|
|
(2,107 |
) |
|
|
(1,074 |
) |
|
|
(1,106 |
) |
|
Allowance for doubtful accounts |
|
— |
|
|
|
(250 |
) |
|
|
250 |
|
|
|
Other |
|
|
(702 |
) |
|
— |
|
|
|
199 |
|
|
|
Statutory net income of insurance subsidiaries |
|
$ |
567 |
|
|
$ |
45,597 |
|
|
$ |
9,838 |
|
The Company’s reinsurance subsidiary, Osprey, which was incorporated on April 23, 2013, is licensed as a Class 3a Insurer under The Bermuda Insurance Act 1978 and related regulations. Osprey is required to maintain statutory capital and surplus of at least $1.0 million and maintain liquid resources or have access to liquid resources equal to its maximum obligation for which it is responsible under the terms of any reinsurance arrangement to which it is a party. In May 2013, the Company contributed $1.7 million in cash to Osprey. Osprey secures its reinsurance obligations to our insurance subsidiaries with an irrevocable letter of credit in the amount of $12.7 million. These resources, in addition to premiums ceded to it by our insurance subsidiaries are sufficient to comply with regulatory requirements as of December 31, 2016. Bermuda’s standard for financial statement reporting is U.S. GAAP.
|
Note 14. |
Commitments and Contingencies |
The Company is involved in claims-related legal actions arising in the ordinary course of business. The Company accrues amounts resulting from claims-related legal actions in unpaid losses and loss adjustment expenses during the period that it determines an unfavorable outcome becomes probable and it can estimate the amounts. Management makes revisions to its estimates based on its analysis of subsequent information that the Company receives regarding various factors, including: (i) per claim information; (ii) company and industry historical loss experience; (iii) judicial decisions and legal developments in the awarding of damages; and (iv) trends in general economic conditions, including the effects of inflation. When determinable, the Company discloses the range of possible losses in excess of those accrued and for reasonably possible losses.
|
Note 15. |
Other Liabilities |
At December 31, 2016 and 2015, Other liabilities included approximately $0.2 million and $4.9 million related to amounts owed to Citizens for policies assumed by the Company, where the policyholder subsequently opted-out of the assumption program. Also, included in other liabilities for the years ended December 31, 2016 and 2015 was $6.2 million and $5.8 million for commission payables, $5.6 million and $3.9 million for accounts payable and other payables, and $6.9 million and $0 for payments in connection with the issuance of debt, $1.8 million and $1.6 million for dividends payable and $1 million and $1.2 million for unearned revenue, respectively.
83
For the year ended December 31, 2016, the Company recognized employee bonus compensation expense of approximately $4.4 million based on EBITDA goals, which the Company paid out in cash of approximately $0.8 million as of December 31, 2016. For the year ended December 31, 2015, the Company recognized employee bonus compensation expense of approximately $14.1 million, which the Company paid out in cash of approximately $12.1 million as of December 31, 2015 and the remainder was paid in 2016. For the year ended December 31, 2014, the Company accrued bonuses of $7.2 million based on 8.5% of earnings before interest, taxes, depreciation and amortization, which was paid out in cash as of December 31, 2014
|
Note 17. |
Related Party Transactions |
The Company has been party to various related party transactions involving certain of its officers, directors and significant stockholders as set forth below. The Company has entered into these arrangements without obligation to continue its effect in the future and the associated expense was immaterial to its results of operations or financial position as of December 31, 2016, 2015 and 2014.
|
|
• |
The Company has entered into an agreement with a real estate management company controlled by one of its directors to manage its Clearwater office space. Management services are provided at a fixed fee, plus ordinary and necessary out of pocket expenses. Fees for additional services, such as the oversight of construction activity, are provided for on an as-needed basis. For the years ended December 31, 2016, 2015 and 2014, the Company paid the management service company approximately $118 thousand, $113 thousand and $93thousand, respectively. |
|
|
• |
The Company leased the space that it had occupied through March 2014 at 700 Central Avenue, Ste. 500 St. Petersburg, Florida from a real estate management company controlled by a stockholder. The Company leased the space without obligation to continue doing so in the future. For the years ended December 31, 2016, 2015 and 2014 the Company incurred rent expense of approximately $0, $0 and $70 thousand respectively. |
|
Note 18. |
Employee Benefit Plan |
The Company provides a 401(k) plan for its employees. The Company contributes 3% of employees’ salary, up to the maximum allowable contribution, regardless of the employees’ level of participation in the plan. For the years ended December 31, 2016 and 2015, the Company’s contributions to the plan on behalf of the participating employees were $685 thousand and $276 thousand respectively.
The Company provides for its employees a partially self-insured healthcare plan and benefits. For the years ended December 31, 2016 and 2015, the Company incurred medical premium costs in the aggregate of $2.4 million and $1.4 million, respectively. The Company also recorded approximately $309 thousand as unpaid claims as of December 31, 2016. A stop loss reinsurance policy caps the maximum loss that could be incurred by the Company under the self-insured plan. The Company’s stop loss coverage per employee is $60 thousand for which any excess cost would be covered by the reinsurer. There is an aggregate limit for losses of $1.5 million which would provide up to $1 million of coverage. Any excess of the $1.5 million retention and the $1 million of aggregate coverage would be borne by the Company. The aggregate stop loss commences once our expenses exceed 125% of the annual aggregate expected claims.
|
Note 19. |
Equity |
The total amount of authorized capital stock consists of 50,000,000 shares of common stock and 5,000,000 shares of preferred stock. As of December 31, 2016, the Company had 28,840,443 shares of common stock outstanding, 1,759,330 treasury shares of common stock and 900,000 unvested restricted common stock issued reflecting total paid-in capital of $205.7 million as of such date.
Common Stock
Holders of common stock are entitled to one vote for each share held on all matters subject to a vote of stockholders, subject to the rights of holders of any outstanding preferred stock. Accordingly, holders of a majority of the shares of common stock entitled to vote in any election of directors may elect all of the directors standing for election, subject to the rights of holders of any outstanding preferred stock. Holders of common stock will be entitled to receive ratably any dividends that the board of directors may declare out of funds legally available therefor, subject to any preferential dividend rights of outstanding preferred stock. Upon the Company’s liquidation, dissolution or winding up, the holders of common stock will be entitled to receive ratably its net assets available after the payment of all debts and other liabilities and subject to the prior rights of holders of any outstanding preferred stock. Holders of common stock have no preemptive, subscription, redemption or conversion rights. There are no redemption or sinking fund provisions
84
applicable to the common stock. All outstanding shares of the Company’s capital stock (excluding restricted stock) are fully paid and nonassessable.
Stock Repurchase Program
On September 14, 2015, the Company announced that the Company’s Board of Directors, authorized a stock repurchase program authorizing the Company to repurchase up to $20 million of the Company’s common stock. On May 4, 2016, the Board of Directors authorized an additional stock repurchase of up to $50 million of the Company’s common stock through December 31, 2017. For the year ended December 31, 2016, the Company has purchased in aggregate 1,759,330 shares of common stock at a cost of $25.6 million through open market or private transactions.
Dividends
For the year ended December 31, 2016, we recorded quarterly cash dividends of approximately $7 million as follows:
|
|
|
Quarter Ended |
|
|||||||||||||
|
|
|
March 31, 2016 |
|
|
June 30, 2016 |
|
|
September 30, 2016 |
|
|
December 31, 2016 |
|
||||
|
Cash dividend per common share |
|
$ |
0.05 |
|
|
$ |
0.06 |
|
|
$ |
0.06 |
|
|
$ |
0.06 |
|
|
Total cash dividends paid |
|
$ |
1,578,320 |
|
|
$ |
1,840,455 |
|
|
$ |
1,808,505 |
|
|
$ |
1,784,426 |
|
|
Record date |
|
March 15, 2016 |
|
|
June 15, 2016 |
|
|
September 15, 2016 |
|
|
December 15, 2016 |
|
||||
|
Payment date |
|
April 5, 2016 |
|
|
July 1, 2016 |
|
|
October 3, 2016 |
|
|
January 4, 2017 |
|
||||
On December 17, 2015, the Company announced a cash dividend of $0.05 per share or $1.5 million on the Company’s common stock, payable on January 13, 2016 to stockholders of record as of the close of business on December 31, 2015.
On March 2, 2017, the Company’s Board of Directors declared a $0.06 per share quarterly dividend payable on April 4, 2017, to shareholders of record March 15, 2017.
Cash dividends declared on our outstanding weighted average number of basic common shares for the periods presented were approximately as follows:
|
|
|
For the Years Ended December 31, |
|
|||||
|
|
|
2016 |
|
|
2015 |
|
||
|
Cash dividends per common share |
|
$ |
0.23 |
|
|
$ |
0.05 |
|
|
Note 20. |
Stock-Based Compensation |
The Company has adopted the Heritage Insurance Holdings, Inc., Omnibus Incentive Plan (the “Plan”) effective on May 22, 2014. The Plan authorized 2,981,737 shares of common stock for issuance under the Plan for future grants.
At December 31, 2016 and 2015, there were 170,814 shares available for grant under the Plan.
The Company recognizes compensation expense under ASC 718 for its stock-based payments based on the fair value of the awards. The Company grants stock options at exercise prices equal to the fair market value of the Company’s stock on the dates the options are granted. The options have a maximum term of ten years from the date of grant and vest primarily in equal annual installments over a range of one to five year periods following the date of grant for employee options. If a participant’s employment relationship ends, the participant’s vested awards will remain exercisable for the shorter of a period of 30 days or the period ending on the latest date on which such award could have been exercisable. The fair value of each option grant is separately estimated for each grant date. The fair value of each option is amortized into compensation expense on a straight-line basis between the grant date for the award and each vesting date. The Company estimates the fair value of all stock option awards as of the date of the grant by applying the Black-Scholes-Merton multiple-option pricing valuation model. The application of this valuation model involves assumptions that are judgmental and highly sensitive in the determination of compensation expense.
Stock Options
On September 24, 2014, the Company granted options to purchase 359,000 shares to certain employees and directors. No stock options were granted in the years ending December 31, 2015 and 2016. These options were awarded with the strike price set at the fair market value at the grant date, and vested on March 15, 2015 with an expiration date of September 24, 2017. The fair value of each
85
option grant, which was $2.70 per option granted in 2014, was estimated on the date of grant using the Black-Scholes option-pricing model. The fair value of options vested during the year ended December 31, 2014 was $2.5 million.
On December 2, 2014, the Company granted options to purchase 1,326,923 shares to certain employees and directors. The employee options were awarded with the strike price set at the fair market value at the grant date, and vest at 50 percent upon grant and 50 percent on April 30, 2015 with an expiration date of December 2, 2017. The directors’ options were awarded with the strike price set at the fair market value at the grant date, and vest quarterly commencing on January 1, 2015 with an expiration date of December 2, 2017. The fair value of each option grant, which ranged from $3.07 to $3.54 per option granted in 2014, is estimated on the date of grant using the Black-Scholes option-pricing model. The fair value options that vested as of December 31, 2015 was $2.7 million.
The following table provides the assumptions utilized in the Black-Scholes model for options granted during the year ended December 31, 2014. No options were granted during the years ended December 31, 2016 and 2015.
|
|
|
December 2, 2014 |
|
|
September 24, 2014 |
|
||
|
Weighted-average risk-free interest rate |
|
|
0.51 |
|
|
|
0.42 |
|
|
Expected term of option in years |
|
|
1.60 |
|
|
|
1.70 |
|
|
Weighted-average volatility |
|
|
35.56 |
% |
|
|
36.47 |
% |
|
Dividend yield |
|
|
0 |
% |
|
|
0 |
% |
|
Weighted average grant date fair value per share |
|
$ |
3.19 |
|
|
$ |
2.70 |
|
A summary of information related to stock options outstanding at December 31, 2016 is as follows:
|
|
|
Shares |
|
|
Weighted-Average Grant Date Fair Value |
|
||
|
|
|
|
|
|
|
|
|
|
|
Balance at December 31, 2014 |
|
|
1,685,923 |
|
|
|
|
|
|
Granted |
|
|
— |
|
|
|
|
|
|
Exercised |
|
|
(536,000 |
) |
|
$ |
4.29 |
|
|
Forfeited |
|
|
— |
|
|
|
|
|
|
Balance at December 31, 2015 |
|
|
1,149,923 |
|
|
$ |
2.99 |
|
|
Granted |
|
|
— |
|
|
|
|
|
|
Exercised |
|
|
— |
|
|
|
|
|
|
Balance at December 31, 2016 |
|
|
1,149,923 |
|
|
$ |
2.99 |
|
|
Vested and exercisable as of December 31, 2016 |
|
|
1,149,923 |
|
|
$ |
2.99 |
|
|
|
|
|
|
Options Outstanding |
|
|
Options Exercisable |
|
||||||||||||||||||
|
Range of Exercise Price |
|
|
Number Outstanding |
|
|
Average Remaining Contractual Life (in years) |
|
|
Weighted Average Exercise Price |
|
|
Number Exercisable |
|
|
Average Remaining Contractual Life (in years) |
|
|
Weighted Average Exercise Price |
|
|||||||
|
$ |
14.02 |
|
|
|
243,000 |
|
|
|
0.75 |
|
|
$ |
14.02 |
|
|
|
243,000 |
|
|
|
0.75 |
|
|
$ |
14.02 |
|
|
|
16.89 |
|
|
|
906,923 |
|
|
|
1.00 |
|
|
|
16.89 |
|
|
|
906,923 |
|
|
|
1.00 |
|
|
|
16.89 |
|
|
$ |
16.28 |
|
|
|
1,149,923 |
|
|
|
0.88 |
|
|
$ |
16.28 |
|
|
|
1,149,923 |
|
|
|
0.88 |
|
|
$ |
16.28 |
|
No compensation expense was recognized for stock options granted above during the year December 31, 2016. The Company has recognized $1.9 million and $3.3 million of compensation expense during the years ended December 31, 2015 and 2014 relative to the stock options granted above.
Restricted Stock
The Company has also granted shares of its common stock subject to certain restrictions under the Plan. Restricted stock awards granted to employees vest in equal installments generally over a five year period from the grant date subject to the recipient’s continued employment. The fair value of restricted stock awards are estimated by the market price at the date of grant and amortized on a straight-line basis to expense over the period of vesting. Recipients of restricted stock awards have the right to receive dividends. No restricted stock was granted during the year ended December 31, 2016. Restricted stock activity during the year ended December 31, 2016 is as follows:
86
|
|
|
|
|
|
Weighted-Average |
|
||
|
|
|
|
|
|
|
Grant-Date Fair |
|
|
|
|
|
Number of shares |
|
|
Value per Share |
|
||
|
Non-vested, at December 31, 2015 |
|
|
1,125,000 |
|
|
$ |
21.40 |
|
|
Granted |
|
|
— |
|
|
|
— |
|
|
Vested |
|
|
(158,363 |
) |
|
$ |
14.67 |
|
|
Canceled and forfeited |
|
|
(66,637 |
) |
|
$ |
14.67 |
|
|
Non-vested, at December 31, 2016 |
|
|
900,000 |
|
|
$ |
18.82 |
|
Awards are being amortized to expense over the five year vesting period. Relating to the restricted stock the Company recognized $3.8 million and $749 thousand of compensation expense for the years ended December 31, 2016 and 2015, respectively. At December 31, 2016, there was approximately $18.5 million, representing unrecognized compensation expense related to the non-vested restricted stock. The Company expects to recognize the remaining compensation expense over a weighted average period of 3.9 years.
The following table summarizes information about deferred tax benefits recognized and tax benefits realized to restricted stock awards and related paid dividends, and the fair value of vested restricted stock for the year ended December 31, 2016 and 2015, respectively.
|
For the Year Ended December 31, |
|
2016 |
|
|
2015 |
|
||
|
Deferred tax benefit recognized |
|
$ |
— |
|
|
$ |
76 |
|
|
Tax benefit realized for restricted stock and paid dividends |
|
|
— |
|
|
|
357 |
|
|
Fair value of vested restricted stock |
|
|
3,301 |
|
|
|
— |
|
|
Note 21. |
Condensed Financial Information of Heritage Insurance Holdings, Inc. |
The following summarizes the major categories of Heritage Insurance Holdings, Inc.’s financial statements (in thousands, except share and per share data):
|
|
|
As of December 31, |
|
|||||
|
|
|
2016 |
|
|
2015 |
|
||
|
|
|
(In thousands) |
|
|||||
|
ASSETS |
|
|
|
|
|
|
|
|
|
Fixed maturity securities, available for sale, at fair value |
|
$ |
77,922 |
|
|
$ |
— |
|
|
Cash and cash equivalents |
|
|
7,368 |
|
|
|
36,762 |
|
|
Investment in and advances to subsidiaries |
|
|
334,983 |
|
|
|
312,047 |
|
|
Other assets |
|
|
19,055 |
|
|
|
7,355 |
|
|
Total Assets |
|
$ |
439,328 |
|
|
$ |
356,164 |
|
|
LIABILITIES AND STOCKHOLDERS' EQUITY |
|
|
|
|
|
|
|
|
|
Other liabilities |
|
|
81,369 |
|
|
|
349 |
|
|
Total Liabilities |
|
$ |
81,369 |
|
|
$ |
349 |
|
|
Total Stockholders' Equity |
|
$ |
357,959 |
|
|
$ |
355,815 |
|
|
Total Liabilities and Stockholders' Equity |
|
$ |
439,328 |
|
|
$ |
356,164 |
|
87
|
|
|
For the Year Ended December 31, |
|
|||||||||
|
|
|
2016 |
|
|
2015 |
|
|
2014 |
|
|||
|
|
|
(In thousands, except share and per share amounts) |
|
|||||||||
|
Revenue: |
|
|
|
|
|
|
|
|
|
|
|
|
|
Other revenue |
|
$ |
1,403 |
|
|
$ |
1,129 |
|
|
$ |
1,896 |
|
|
Total revenue |
|
|
1,403 |
|
|
|
1,129 |
|
|
|
1,896 |
|
|
Expenses: |
|
|
|
|
|
|
|
|
|
|
|
|
|
General and administrative expense |
|
|
11,558 |
|
|
|
9,036 |
|
|
|
6,649 |
|
|
Amortization of debt issuance cost |
|
|
41 |
|
|
— |
|
|
— |
|
||
|
Interest expense, net |
|
|
321 |
|
|
— |
|
|
— |
|
||
|
Total expenses |
|
$ |
11,920 |
|
|
$ |
9,036 |
|
|
$ |
6,649 |
|
|
Loss before income taxes and equity in net income of subsidiaries |
|
|
(10,517 |
) |
|
|
(7,907 |
) |
|
|
(4,753 |
) |
|
Benefit from income taxes |
|
|
— |
|
|
|
(2,227 |
) |
|
|
(801 |
) |
|
Loss before equity in net income of subsidiaries |
|
|
(10,517 |
) |
|
|
(5,680 |
) |
|
|
(3,952 |
) |
|
Equity in net income of subsidiaries |
|
|
2,034 |
|
|
|
98,192 |
|
|
|
51,049 |
|
|
Net income |
|
$ |
(8,483 |
) |
|
$ |
92,512 |
|
|
$ |
47,097 |
|
|
|
|
For the Year Ended December 31, |
|
|||||||||
|
|
|
2016 |
|
|
2015 |
|
|
2014 |
|
|||
|
|
|
(In thousands) |
|
|||||||||
|
Net cash (used in) provided by operating activities |
|
$ |
(6,045 |
) |
|
$ |
7,196 |
|
|
$ |
1,280 |
|
|
Investing Activities |
|
|
|
|
|
|
|
|
|
|
|
|
|
Purchases of investment available for sale |
|
|
(77,910 |
) |
|
|
— |
|
|
|
— |
|
|
Dividends received from subsidiaries |
|
|
85,096 |
|
|
|
21,400 |
|
|
|
16,099 |
|
|
Investments and advances to subsidiaries |
|
|
(74,361 |
) |
|
|
(32,400 |
) |
|
|
(98,469 |
) |
|
Net cash used in investing activities |
|
|
(73,220 |
) |
|
|
(3,804 |
) |
|
|
(82,370 |
) |
|
Financing Activities |
|
|
|
|
|
|
|
|
|
|
|
|
|
Proceeds from issuance of equity from IPO and private placement, net of discount fee and direct costs of issuance |
|
|
— |
|
|
|
— |
|
|
|
78,670 |
|
|
Proceeds from exercise of stock options and warrants |
|
|
— |
|
|
|
8,900 |
|
|
|
22,515 |
|
|
Proceeds from issuance of note payable, net of issuance costs |
|
|
77,910 |
|
|
|
— |
|
|
|
— |
|
|
Proceeds from issuance of equity and redeemable shares |
|
|
— |
|
|
|
— |
|
|
|
88 |
|
|
Excess tax (expense) benefit on stock-based compensation |
|
|
(739 |
) |
|
|
739 |
|
|
|
— |
|
|
Shares tendered for income tax withholdings |
|
|
(977 |
) |
|
|
— |
|
|
|
— |
|
|
Purchase of treasury stock |
|
|
(25,562 |
) |
|
|
— |
|
|
|
— |
|
|
Dividends |
|
|
(6,806 |
) |
|
|
— |
|
|
|
— |
|
|
Net cash provided by financing activities |
|
|
43,826 |
|
|
|
9,639 |
|
|
|
101,273 |
|
|
(Decrease)/increase in cash and cash equivalents |
|
|
(29,394 |
) |
|
|
5,835 |
|
|
|
20,183 |
|
|
Cash and cash equivalents, beginning of period |
|
|
36,762 |
|
|
|
30,927 |
|
|
|
10,744 |
|
|
Cash and cash equivalents, end of year |
|
$ |
7,368 |
|
|
$ |
36,762 |
|
|
$ |
30,927 |
|
88
The following table provides a summary of unaudited quarterly results for the periods presented (in thousands, except per share data):
|
For the year ended December 31, 2016 |
|
First Quarter |
|
|
Second Quarter |
|
|
Third Quarter |
|
|
Fourth Quarter |
|
||||
|
Net premiums earned |
|
$ |
106,342 |
|
|
$ |
108,918 |
|
|
$ |
101,555 |
|
|
$ |
94,906 |
|
|
Investment income |
|
$ |
2,037 |
|
|
$ |
2,223 |
|
|
$ |
2,326 |
|
|
$ |
2,595 |
|
|
Total revenues |
|
$ |
111,565 |
|
|
$ |
115,281 |
|
|
$ |
109,306 |
|
|
$ |
102,806 |
|
|
Total expenses |
|
$ |
99,525 |
|
|
$ |
85,524 |
|
|
$ |
90,694 |
|
|
$ |
106,450 |
|
|
Net income |
|
$ |
7,423 |
|
|
$ |
18,368 |
|
|
$ |
10,930 |
|
|
$ |
(2,856 |
) |
|
Basic earnings per share |
|
$ |
0.24 |
|
|
$ |
0.62 |
|
|
$ |
0.37 |
|
|
$ |
(0.09 |
) |
|
Diluted earnings per share |
|
$ |
0.24 |
|
|
$ |
0.62 |
|
|
$ |
0.37 |
|
|
$ |
(0.09 |
) |
|
|
|
|
|
|
|
|
|
|
|
|
|
|
|
|
|
|
|
For the year ended December 31, 2015 |
|
First Quarter |
|
|
Second Quarter |
|
|
Third Quarter |
|
|
Fourth Quarter |
|
||||
|
Net premiums earned |
|
$ |
101,489 |
|
|
$ |
94,846 |
|
|
$ |
82,361 |
|
|
$ |
97,572 |
|
|
Investment income |
|
$ |
1,633 |
|
|
$ |
2,090 |
|
|
$ |
1,973 |
|
|
$ |
1,725 |
|
|
Total revenues |
|
$ |
105,128 |
|
|
$ |
99,088 |
|
|
$ |
89,244 |
|
|
$ |
101,332 |
|
|
Total expenses |
|
$ |
56,836 |
|
|
$ |
58,098 |
|
|
$ |
61,529 |
|
|
$ |
68,039 |
|
|
Net income |
|
$ |
30,056 |
|
|
$ |
25,400 |
|
|
$ |
16,813 |
|
|
$ |
20,243 |
|
|
Basic earnings per share |
|
$ |
1.01 |
|
|
$ |
0.85 |
|
|
$ |
0.56 |
|
|
$ |
0.66 |
|
|
Diluted earnings per share |
|
$ |
1.00 |
|
|
$ |
0.84 |
|
|
$ |
0.55 |
|
|
$ |
0.66 |
|
|
Note 23. |
Subsequent Events |
On March 2, 2017, the Company’s Board of Directors declared a $0.06 per share quarterly cash dividends totaling approximately $1.9 million payable on April 4, 2017, to stockholders of record on March 15, 2017.
89
None
Evaluation of Disclosure Controls and Procedures
We maintain disclosure controls and procedures (as defined in Exchange Act Rule 13a-15(e)) that are designed to assure that information required to be disclosed in our Exchange Act reports is recorded, processed, summarized and reported within the time periods specified in the SEC’s rules and forms, and that such information is accumulated and communicated to management, including our Chief Executive Officer and Chief Financial Officer, as appropriate, to allow timely decisions regarding required disclosures.
As required by Exchange Act Rule 13a-15(b), as of the end of the period covered by this Annual Report, under the supervision and with the participation of our Chief Executive Officer and Chief Financial Officer, we evaluated the effectiveness of our disclosure controls and procedures. Based on this evaluation, our Chief Executive Officer and Chief Financial Officer concluded that our disclosure controls and procedures were effective as of December 31, 2016.
Limitations on Effectiveness of Controls
Our management, including our Chief Executive Officer and Chief Financial Officer, do not expect that our disclosure controls and procedures will prevent all errors and fraud. In designing and evaluating the disclosure controls and procedures, management recognized that any controls and procedures, no matter how well designed and operated, can provide only reasonable, not absolute, assurance of achieving the desired control objectives. Further, the design of a control system must reflect the fact that there are resource constraints, and management necessarily was required to apply its judgment in evaluating the cost-benefit relationship of possible controls and procedures. Because of the inherent limitations in all control systems, no evaluation of controls can provide absolute assurance that all control issues and instances of fraud, if any, within the Company have been detected. These inherent limitations include the realities that judgments in decision-making can be faulty, and that breakdowns can occur because of simple error or mistake. Additionally, controls can be circumvented by the individual acts of some persons, by collusion of two or more people, or by management’s override of the control.
The design of any system of controls also is based in part upon certain assumptions about the likelihood of future events, and there can be no assurance that any design will succeed in achieving its stated goals under all potential future conditions. Over time, controls may become inadequate because of changes in conditions, or the degree of compliance with the policies or procedures may deteriorate. Because of the inherent limitations in a cost-effective control system, misstatements due to error or fraud may occur and not be detected.
Management’s Report on Internal Control Over Financial Reporting
Our management is responsible for establishing and maintaining adequate internal control over financial reporting as defined in Rules 13a-15(f) and 15d-15(f) under the Exchange Act. Internal control over financial reporting is a process designed under the supervision and with the participation of our management, including our principal executive officer and principle financial officer, to provide reasonable assurance regarding the reliability of financial reporting and the preparation of financial statements for external purposes in accordance with accounting principles generally accepted in the United States of America.
As of December 31, 2016, our management assessed the effectiveness of our internal control over financial reporting using the criteria set forth by the Committee of Sponsoring Organizations of the Treadway Commission in Internal Control-Integrated Framework, or 2013 Framework. Based on this assessment, our management concluded that, as of December 31, 2016, our internal control over financial reporting was effective based on those criteria.
Changes in Internal Control Over Financial Reporting
There has been no change in our internal controls over financial reporting during our most recent quarter that has materially affected, or is reasonably likely to materially affect, our internal control over financial reporting.
90
Not applicable.
Information regarding directors of the Company standing for election at the 2017 annual stockholders meeting is incorporated in this Item 10 by reference to the descriptions in the Proxy Statement under the captions “Corporate Governance – Proposal 1. Election of Directors.”
Information regarding our audit committee and audit committee financial experts is incorporated in this Item 10 by reference to the information under the caption “Corporate Governance – Board Meetings and Committees” in the Proxy Statement.
Information regarding compliance with Section 16(a) of the Securities Exchange Act of 1934 is incorporated in this Item 10 by reference to “Stock Ownership Information – Section 16(a) Beneficial Ownership Reporting Compliance” in the Proxy Statement.
Information regarding executive officers of the Company is incorporated in this Item 10 by reference to Part I, Item 1 of this report under the caption “Executive Officers of the Registrant.”
The information regarding executive compensation is incorporated herein by reference to our definitive Proxy Statement for the 2017 Annual Meeting of our Stockholders to be filed with the SEC within 120 days after the end of our fiscal year ended December 31, 2016.
|
Item 12. |
Security Ownership of Certain Beneficial Owners and Management and Related Stockholder Matters |
Information regarding security ownership of certain beneficial owners and management is incorporate in this Item 12 by reference to the sections of the Proxy Statement with the following captions:
|
|
• |
Stock Ownership Information – Security Ownership of Directors and Executive Officers |
|
|
• |
Stock Ownership Information – Security Ownership of Certain Beneficial Owners |
The following table includes information as of December 31, 2016, with respect to the Company’s equity compensation plans:
|
Plan Category |
|
No. of Securities to be Issued upon Exercise of Outstanding Options and Rights |
|
|
Weighted-Average Exercise Price of Outstanding Options and Rights |
|
|
No. of Securities Remaining Available for Future Issuance under Equity Compensation Plan (Excluding Securities in Column (a)) |
|
|||
|
|
|
(a) |
|
|
(b) |
|
|
(c) |
|
|||
|
Equity Compensation Plan Approved by Shareholders (1) |
|
|
2,049,923 |
|
(2) |
$ |
15.46 |
|
|
|
170,814 |
|
|
|
|
|
|
|
|
|
|
|
|
|
|
|
1. Consists of the Omnibus Incentive Plan adopted on May 22, 2014.
2. As of December 31, 2016, 900,000 shares of restricted stock and 1,149,923 stock options were outstanding. The weighted-average exercise price of outstanding options and rights does not take into account the restricted stock, which have no exercise price.
The information regarding certain relationship and related transactions, and director independence is incorporated herein by reference to our definitive Proxy Statement for the 2017 Annual Meeting of our Stockholders to be filed with the SEC within 120 days after the end of our fiscal year ended December 31, 2016.
91
Information regarding principal accountant fees and services is incorporated herein by reference to our definitive Proxy Statement for the 2017 Annual Meeting of our Stockholders to be filed with the SEC within 120 days after the end of our fiscal year ended December 31, 2016.
The following documents are filed as part of this Annual Report on Form 10-K:
|
(a) |
The following documents are filed as part of this report. |
|
(1) |
Financial Statements |
The following consolidated financial statements of the Company and the reports of independent auditors thereon are filed with this report:
Report of Independent Registered Public Accounting Firm (Grant Thornton LLP)
Consolidated Balance Sheets
Consolidated Statements of Operations and Comprehensive Income
Consolidated Statements of Changes in Stockholders’ Equity
Consolidated Statements of Cash Flows
Notes to Consolidated Financial Statements
|
(2) |
Financial Statement Schedules |
All financial statement schedules have been omitted because the required information is not present or not present in amounts sufficient to require the submission of schedules, or because the information required is included in our Consolidated Financial Statements and Notes thereto.
|
(3) |
List of Exhibits |
The Following is a list of exhibits filed or incorporated by reference as part of this Annual Report on Form 10-K
|
Exhibit Number |
|
Description |
|
|
|
|
|
3.1 |
|
Certificate of Incorporation of Heritage Insurance Holdings, Inc. (incorporated by reference to Exhibit 3.1 to the Company’s Quarterly Report on Form 10-Q filed on August 6, 2014) |
|
|
|
|
|
3.2 |
|
By-laws of Heritage Insurance Holdings, Inc. (incorporated by reference to Exhibit 3.2 to the Company’s Quarterly Report on Form 10-Q filed on August 6, 2014) |
|
|
|
|
|
4.1 |
|
Form of Stock Certificate (Incorporated by reference to Exhibit 4.1 to the Company’s Registration Statement on Form S-1 (File No. 333-195409) filed on April 30, 2014) |
|
|
|
|
|
4.2 |
|
Form of Warrant (Incorporated by reference to Exhibit 4.2 to the Company’s Registration Statement on Form S-1 (File No. 333-195409) filed on April 30, 2014) |
|
|
|
|
|
10.1 |
|
Property Catastrophe Excess of Loss Reinsurance Contract, effective June 1, 2013, issued to Heritage Property & Casualty Insurance Company by the Subscribing Reinsurers (incorporated by reference to Exhibit 10.1 to the Company’s Quarterly Report on Form 10-Q filed on August 6, 2014) |
|
|
|
|
|
10.2 |
|
Catastrophe Excess of Loss and Aggregate Reinsurance Contract, effective June 1, 2013, issued to Heritage Property & Casualty Insurance Company by the Subscribing Reinsurers (incorporated by reference to Exhibit 10.2 to the Company’s Quarterly Report on Form 10-Q filed on August 6, 2014) |
|
|
|
|
|
10.3 |
|
Second Aggregate Catastrophic Excess of Loss Reinsurance Contract, effective June 1, 2013, issued to Heritage Property & Casualty Insurance Company by the Subscribing Reinsurers (incorporated by reference to Exhibit 10.3 to the Company’s Quarterly Report on Form 10-Q filed on August 6, 2014) |
|
|
|
|
92
93
|
* |
Filed herewith |
|
** |
Furnished herewith |
|
+ |
Portions of this exhibit (indicated by asterisks) have been omitted pursuant to a request for confidential treatment, and this exhibit has been filed separately with the SEC. |
None
94
Pursuant to the requirements of Section 13 or 15(d) of the Securities Exchange Act of 1934, the registrant has duly caused this report to be signed on its behalf by the undersigned, thereunto duly authorized.
|
|
|
|
HERITAGE INSURANCE HOLDINGS, INC. (Registrant) |
||
|
|
|
|
|
|
|
|
Date: |
March 15, 2017 |
|
By: |
|
/s/ BRUCE LUCAS |
|
|
|
|
|
|
Chairman and Chief Executive Officer |
|
|
|
|
|
|
(on behalf of the Registrant and as Principal Executive Officer) |
POWERS OF ATTORNEY
KNOW ALL BY THESE PRESENT, that each person whose signature appears below constitutes and appoints Bruce Lucas as his true and lawful attorney-in-fact and agent, he with full power of substitution and resubstitution, for him and in his name, place and stead, in any and all capacities, to sign any and all amendments to this report, and to file the same, with all exhibits thereto, and other documents in connection therewith, with the Securities and Exchange Commission, granting unto said attorneys-in-fact and agents, full power and authority to do and perform each and every act and thing requisite or necessary to be done in and about the premises, as fully to all intents and purposes as he might or could do in person, hereby ratifying and confirming all that said attorneys-in-fact and agents, or any of them, or their substitute or substitutes, may lawfully do or cause to be done by virtue hereof.
Pursuant to the requirements of the Securities Exchange Act of 1934, this report has been signed below by the following persons on behalf of the registrant and in the capacities and on the dates indicated.
|
Signature |
|
Title |
|
Date |
|
|
|
|
|
|
|
/s/ BRUCE LUCAS |
|
|
|
|
|
Bruce Lucas |
|
Chairman and Chief Executive Officer |
|
March 15, 2017 |
|
|
|
|
|
|
|
/s/ STEVEN MARTINDALE |
|
|
|
|
|
Steven Martindale |
|
Chief Financial Officer |
|
March 15, 2017 |
|
|
|
|
|
|
|
/s/ RICHARD WIDDICOMBE |
|
|
|
|
|
Richard Widdicombe |
|
President and Director |
|
March 15, 2017 |
|
|
|
|
|
|
|
/s/ PANAGIOTIS APOSTOLOU |
|
|
|
|
|
Panagiotis Apostolou |
|
Director |
|
March 15, 2017 |
|
|
|
|
|
|
|
/s/ TRIFON HOUVARDAS |
|
|
|
|
|
Trifon Houvardas |
|
Director |
|
March 15, 2017 |
|
|
|
|
|
|
|
/s/ NICHOLAS PAPPAS |
|
|
|
|
|
Nicholas Pappas |
|
Director |
|
March 15, 2017 |
|
|
|
|
|
|
|
/s/ JOSEPH VATTAMATTAM |
|
|
|
|
|
Joseph Vattamattam |
|
Director |
|
March 15, 2017 |
|
|
|
|
|
|
|
/s/ IRINI BARLAS |
|
|
|
|
|
Irini Barlas |
|
Director |
|
March 15, 2017 |
|
|
|
|
|
|
|
/s/ VIJAY WALVEKAR |
|
|
|
|
|
Vijay Walvekar |
|
Director |
|
March 15, 2017 |
|
|
|
|
|
|
|
/s/ JAMES MASIELLO |
|
|
|
|
|
James Masiello |
|
Director |
|
March 15, 2017 |
95