Attached files
| file | filename |
|---|---|
| 8-K - 8-K - FRANKLIN FINANCIAL SERVICES CORP /PA/ | fraf-20170315x8k.htm |
OTCQX Banks Virtual Conference March 15, 2017
Forward Looking Statements In order for you to better understand the business of the Company – where we have been and where we want to go – our remarks today (those of the Company officers who will speak or respond to questions) will include forward looking statements related to anticipated financial performance, future operating results, business prospects, new products, and similar matters. These statements represent our best judgment, based upon present circumstances and the information now available to us, of what we think may occur in the future – and, of course, it is possible that actual results may differ materially from those we envision today. For a more complete discussion on the subject of forward looking statements, including a list of some of the risk factors that might adversely affect future operating results, we refer you to the section entitled “Forward Looking Statements” which appears in our annual report on Form 10-K as filed with the Securities and Exchange Commission. 2
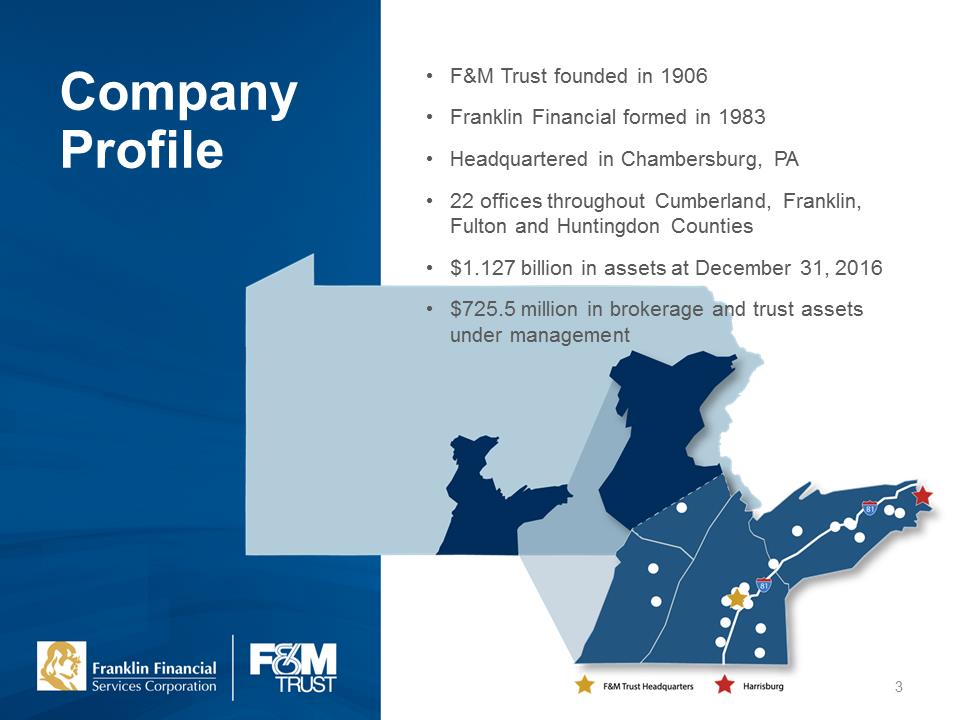
•F&M Trust founded in 1906 •Franklin Financial formed in 1983 •Headquartered in Chambersburg, PA •22 offices throughout Cumberland, Franklin, Fulton and Huntingdon Counties •$1.127 billion in assets at December 31, 2016 •$725.5 million in brokerage and trust assets under management 3
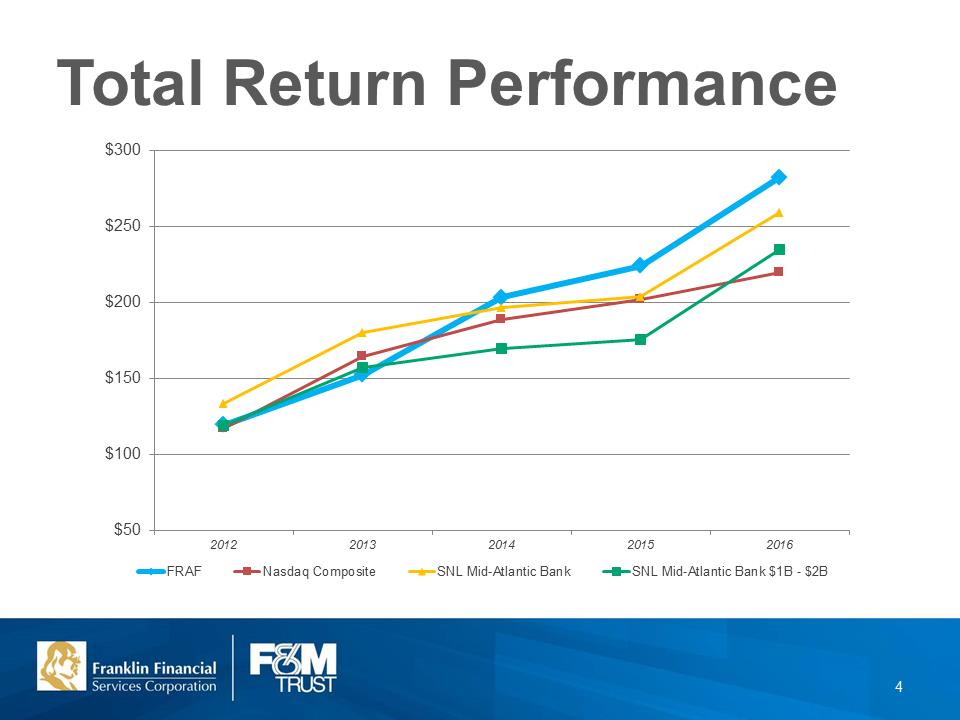
$50 $100 $150 $200 $250 $300 2012 2013 2014 2015 2016 FRAF Nasdaq Composite SNL Mid-Atlantic Bank SNL Mid-Atlantic Bank $1B - $2B Total Return Performance 4
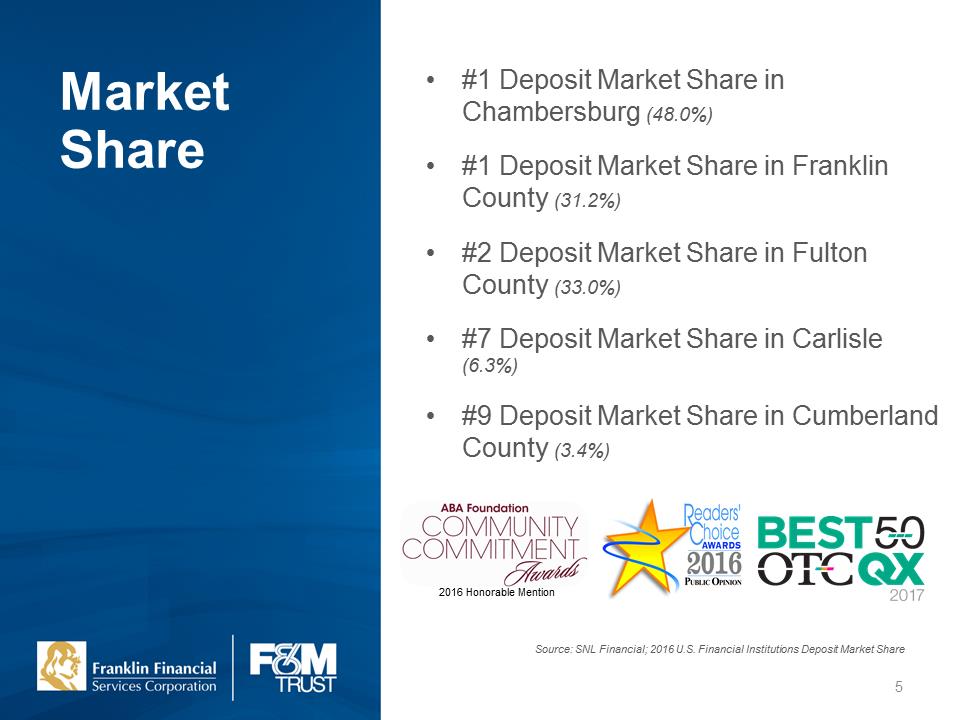
Market Share •#1 Deposit Market Share in Chambersburg (48.0%) •#1 Deposit Market Share in Franklin County (31.2%) •#2 Deposit Market Share in Fulton County (33.0%) •#7 Deposit Market Share in Carlisle (6.3%) •#9 Deposit Market Share in Cumberland County (3.4%) Source: SNL Financial; 2016 U.S. Financial Institutions Deposit Market Share 5
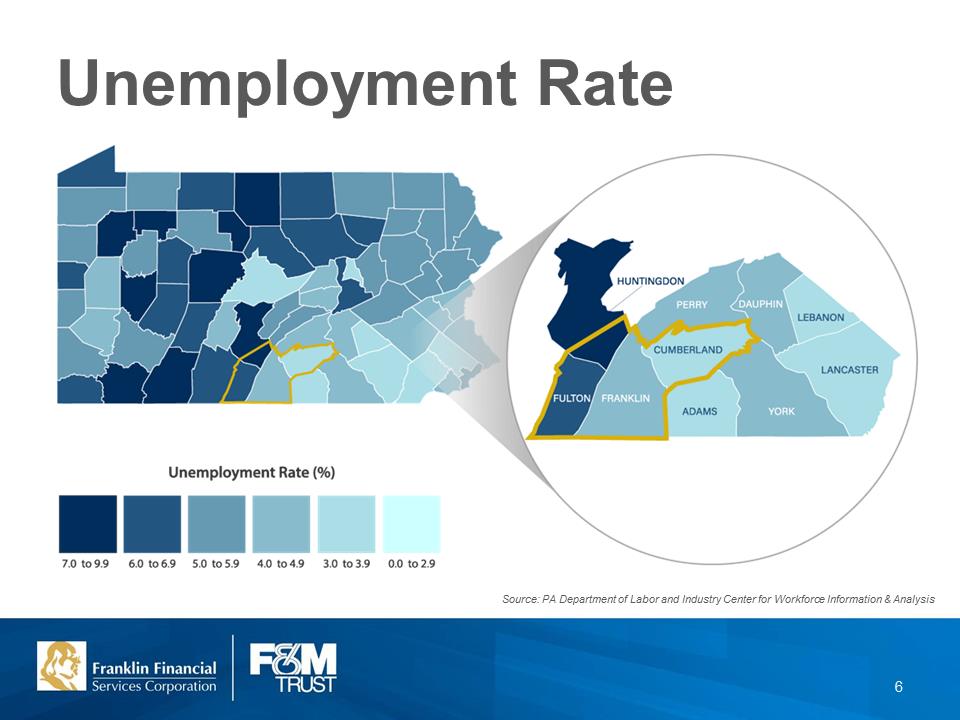
Source: PA Department of Labor and Industry Center for Workforce Information & Analysis 6
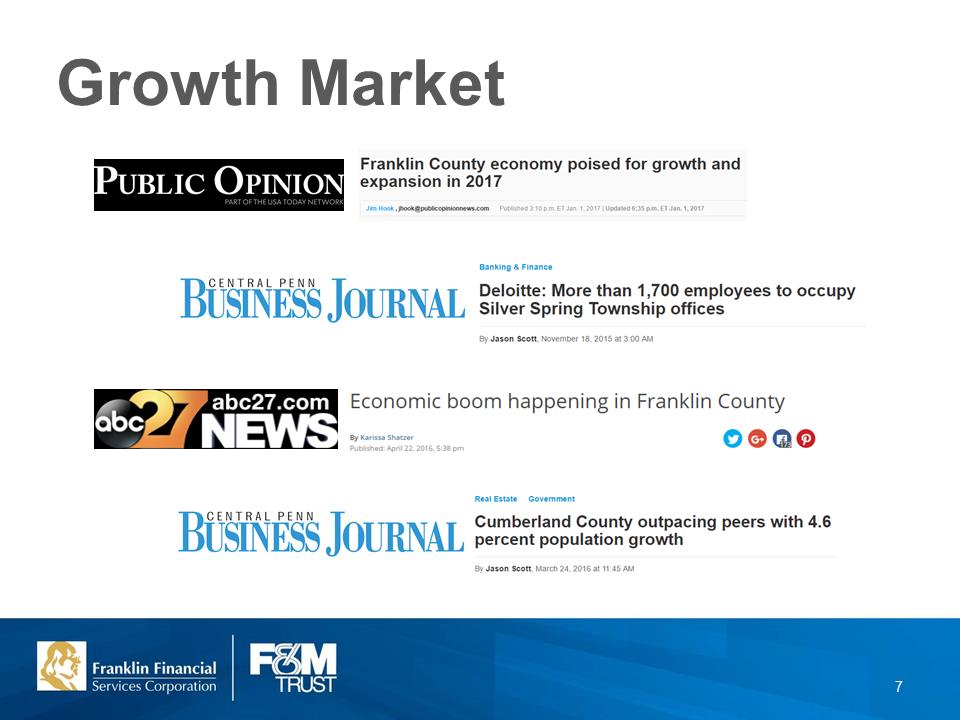
Growth Market 7
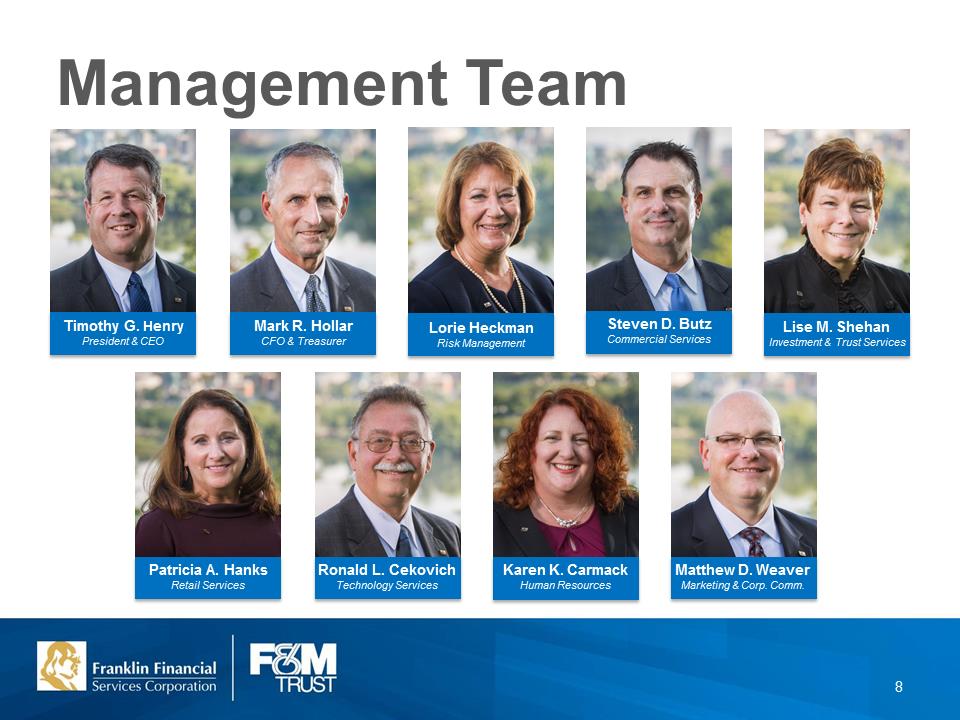
Management Team: Timothy G. Henry President & CEO, Mark R. Hollar CFO & Treasurer, Lorie Heckman Risk Management, Steven D. Butz Commercial Services, Lise M. Shehan Investment & Trust Services, Patricia A. Hanks Retail Services, Ronald L. Cekovich Technology Services, Karen K. Carmack Human Resources, Matthew D. Weaver Marketing & Corp. Comm. 8
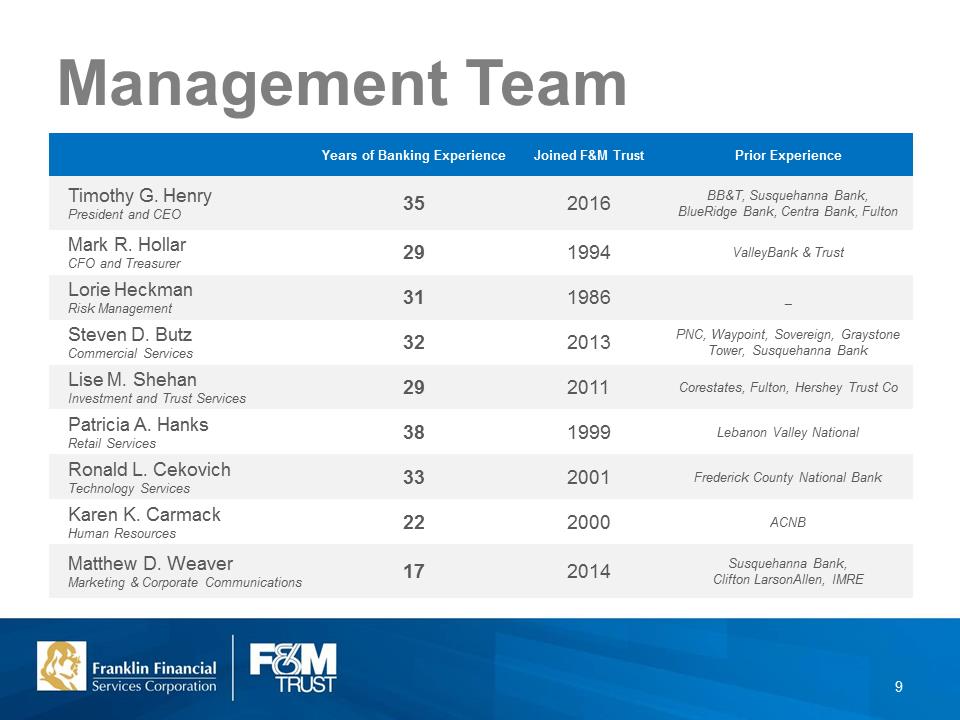
Management: Team Years of Banking Experience, Joined F&M Trust, Prior Experience Timothy G. Henry President and CEO 35 2016 BB&T, Susquehanna Bank, BlueRidge Bank, Centra Bank, Fulton Mark R. Hollar CFO and Treasurer 29 1994 ValleyBank & Trust Lorie Heckman Risk Management 31 1986 _ Steven D. Butz Commercial Services 32 2013 PNC, Waypoint, Sovereign, Graystone Tower, Susquehanna Bank Lise M. Shehan Investment and Trust Services 29 2011 Corestates, Fulton, Hershey Trust Co Patricia A. Hanks Retail Services 38 1999 Lebanon Valley National Ronald L. Cekovich Technology Services 33 2001 Frederick County National Bank Karen K. Carmack Human Resources 22 2000 ACNB Matthew D. Weaver Marketing & Corporate Communications 17 2014 Susquehanna Bank, Clifton LarsonAllen, IMRE 9
2017 Strategic Initiatives •Strategic Loan Growth •Protection of Net Interest Margin •Expansion of Investment & Trust Services •Emphasis on Utilization of Multiple Delivery Channels •Focus on Enhancing Our Sales and Service Culture 10
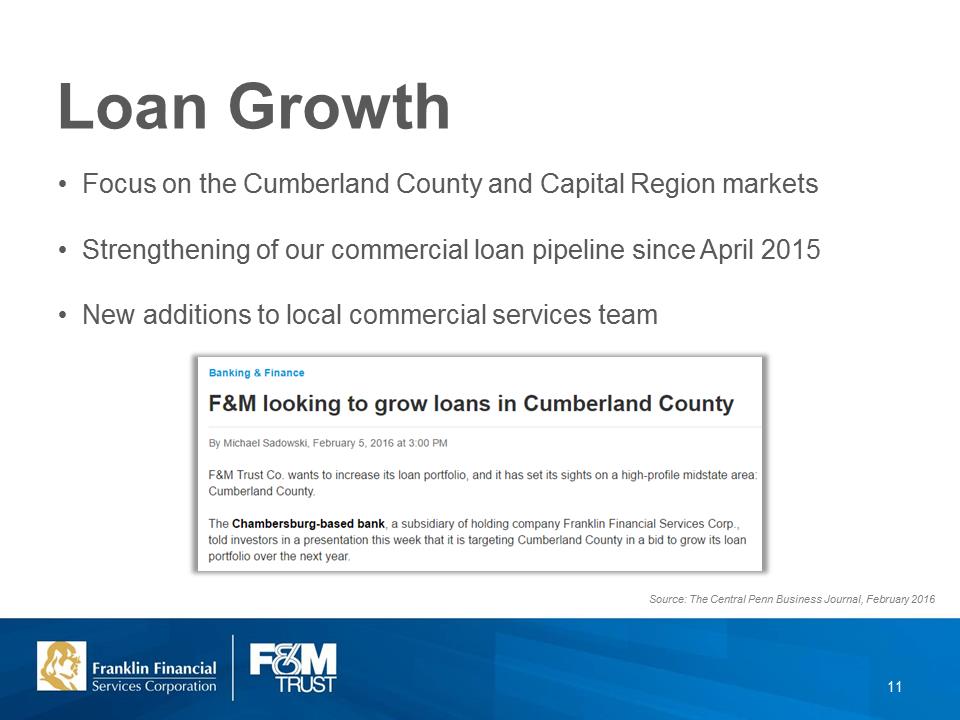
Loan Growth Source: The Central Penn Business Journal, February 2016 •Focus on the Cumberland County and Capital Region markets •Strengthening of our commercial loan pipeline since April 2015 •New additions to local commercial services team 11
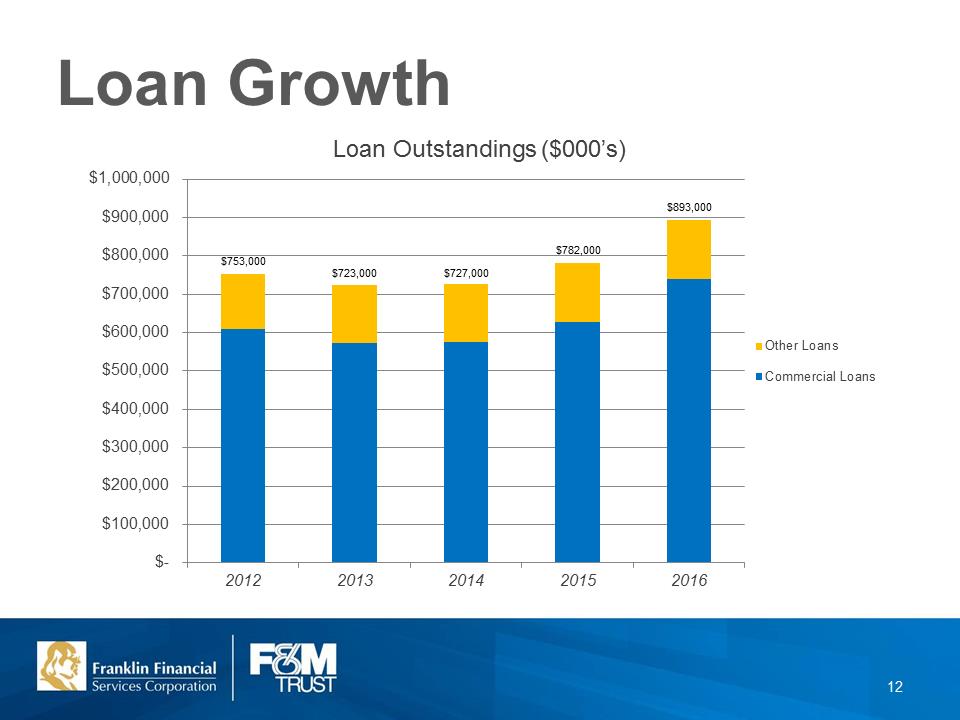
$- $100,000 $200,000 $300,000 $400,000 $500,000 $600,000 $700,000 $800,000 $900,000 $1,000,00020122013201420152016Loan Outstandings ($000’s) Other Loans Commercial Loans Loan Growth 12
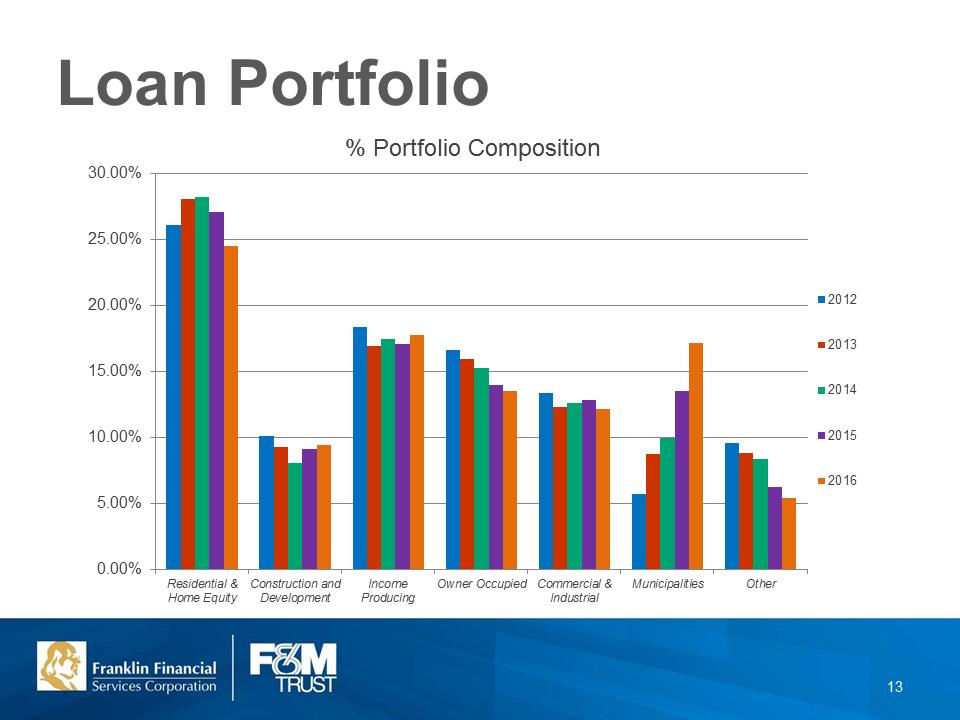
$753,000 $723,000 $727,000 $782,000 893,000 0.00% 5.00% 10.00% 15.00% 20.00% 25.00% 30.00% Residential & Home Equity Construction and Development Income Producing Owner Occupied Commercial & Industrial Municipalities Other % Portfolio Composition 2012 2013 2014 2015 2016 Loan Portfolio 13
Net Interest Margin •Implementing strategies to improve deposit growth •Creation of Business Banking team with focus on core deposits •Restructured Treasury Management function to include additional resources in Cumberland County / Capital Region •Continuing to introduce Universal Banker concept to select Community Office locations •Community Office Managers responsible for multiple offices 14
Investment & Trust Services •Trust powers since our incorporation in 1906 •Fully integrated trust, investment, insurance and brokerage services, focused exclusively on client needs •Over 300 years of combined financial services experience among our professional staff members •Additional resources in Cumberland, Franklin and Fulton Counties to focus on portfolio expansion and new relationships •42.8% of total non-interest income 15
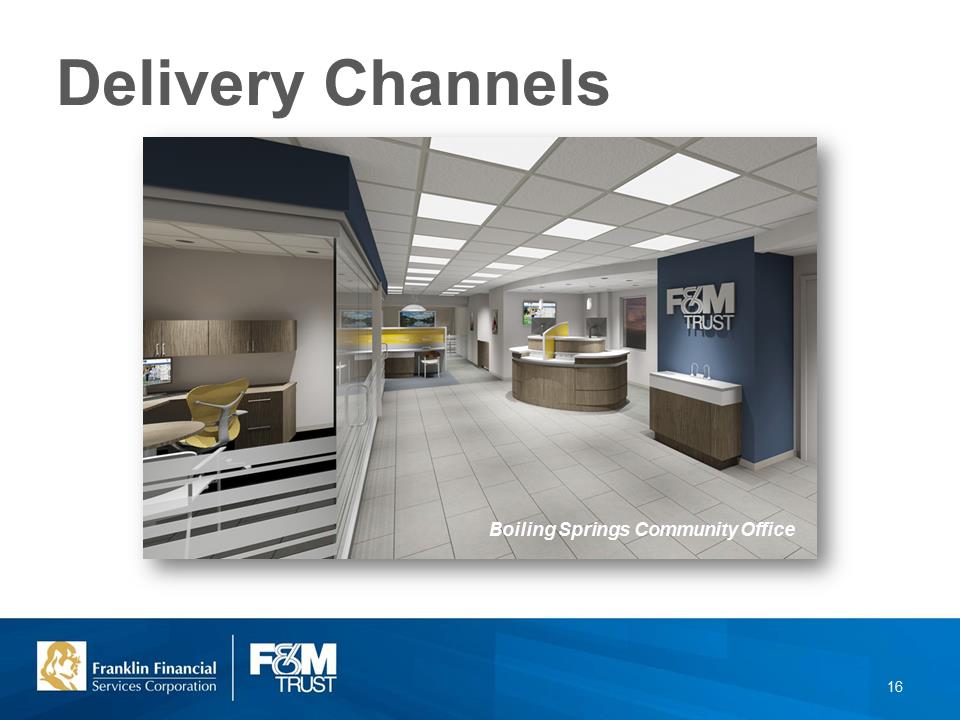
Delivery Channels Boiling Springs Community Office 16
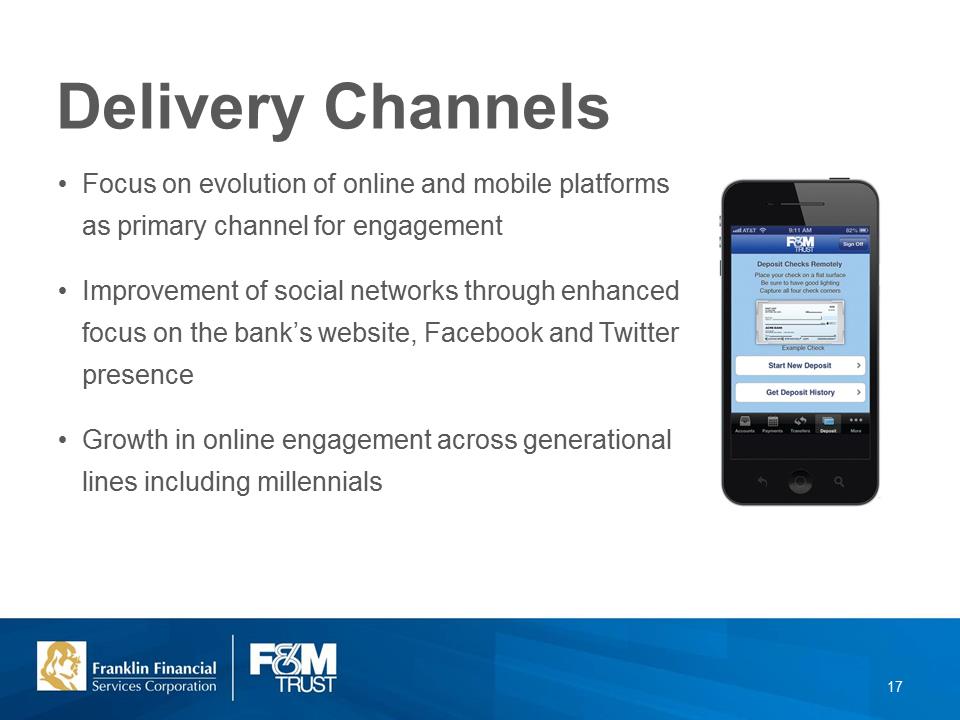
Delivery Channels •Focus on evolution of online and mobile platforms as primary channel for engagement •Improvement of social networks through enhanced focus on the bank’s website, Facebook and Twitter presence •Growth in online engagement across generational lines including millennials 17
Sales and Service Culture •Integrated process to continue building sales and service culture •Assessment of sales training program showing quantifiable results •Introduction of “Reach for M.O.R.E.” initiative to improve service levels with external and internal customers 18
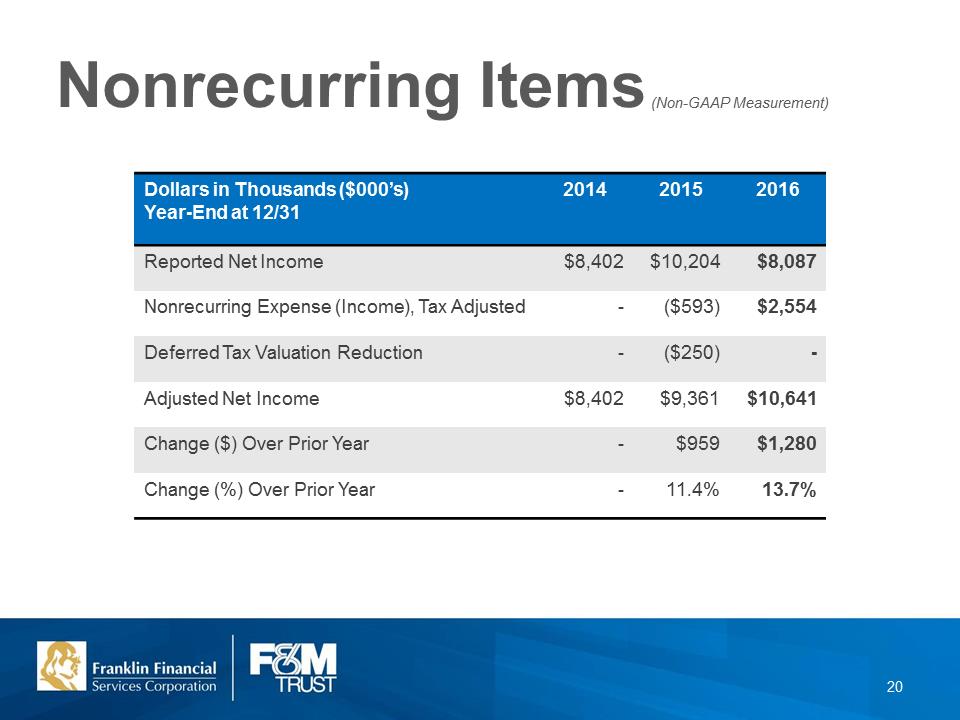
Nonrecurring Items (Non-GAAP Measurement) Dollars in Thousands ($000’s) Year-End at 12/31 2014 2015 2016 Reported Net Income $8,402 $10,204 $8,087 Nonrecurring Expense (Income), Tax Adjusted - ($593) $2,554 Deferred Tax Valuation Reduction - ($250) - Adjusted Net Income $8,402 $9,361 $10,641 Change ($) Over Prior Year - $959 $1,280 Change (%) Over Prior Year - 11.4% 13.7% 20
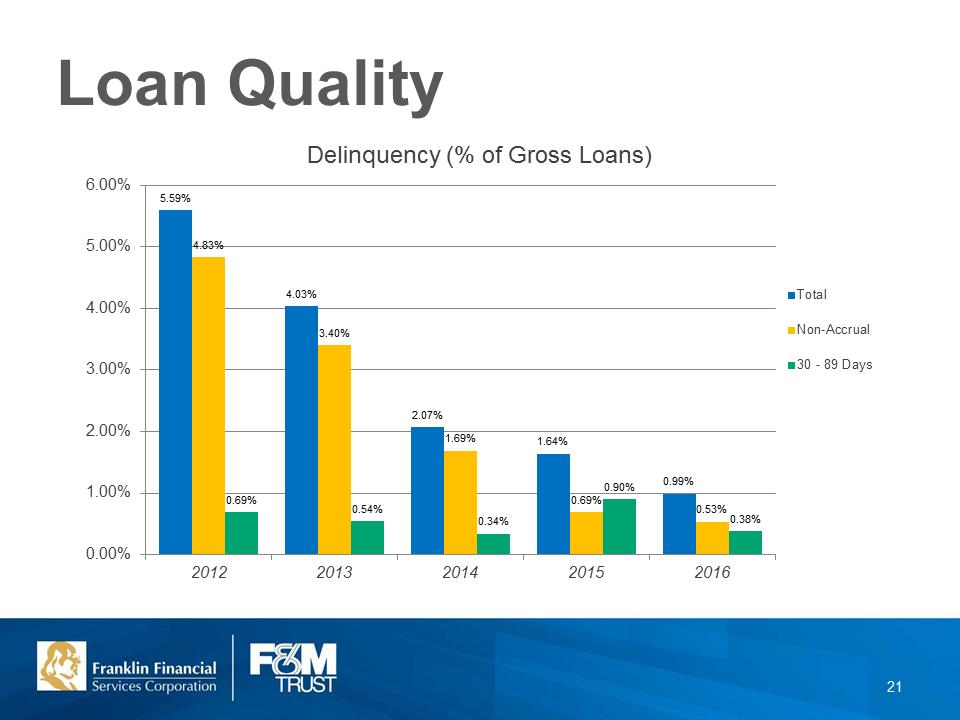
5.59% 4.03% 2.07% 1.64% 0.99% .83% .40% 1.69% 0.69% 0.53% 0.69% 0.54% 0.34% .90% .38% 0.00% 1.00% 2.00% 3.00% 4.00% 5.00% 6.00% 2012 2013 2014 2015 2016 Delinquency (% of Gross Loans) Total Non-Accrual 30 - 89 Days Loan Quality 21
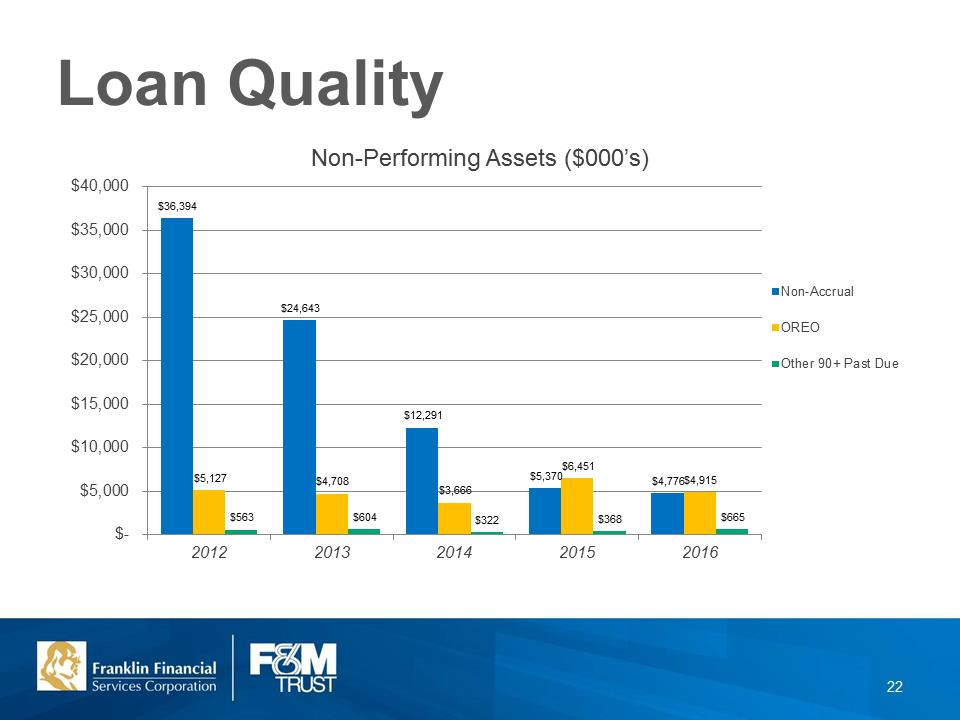
$36,394 $24,643 $12,291 $5,370 $4,776 $5,127 $4,708 $3,666 $6,451 $4,915 $563 $604 $322 $368 $665 $- $5,000 $10,000 $15,000 $20,000 $25,000 $30,000 $35,000 $40,0002012 2013 2014 2015 2016 Non-Performing Assets ($000’s) Non-Accrual OREO Other 90+ Past Due Loan Quality 22
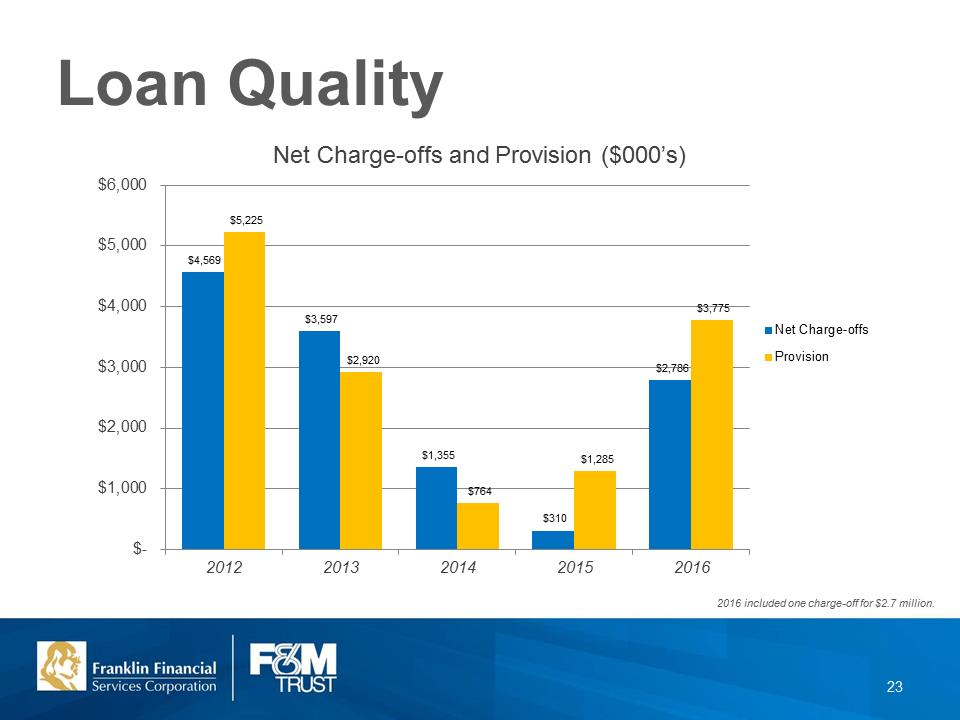
$4,569 $3,597 $1,355 $310 $2,786 $5,225 $2,920 $764 $1,285 $3,775 $- $1,000 $2,000 $3,000 $4,000 $5,000 $6,000 2012 2013 2014 2015 2016 Net Charge-offs and Provision ($000’s) Net Charge-offs Provision Loan Quality 2016 included one charge-off for $2.7 million. 23
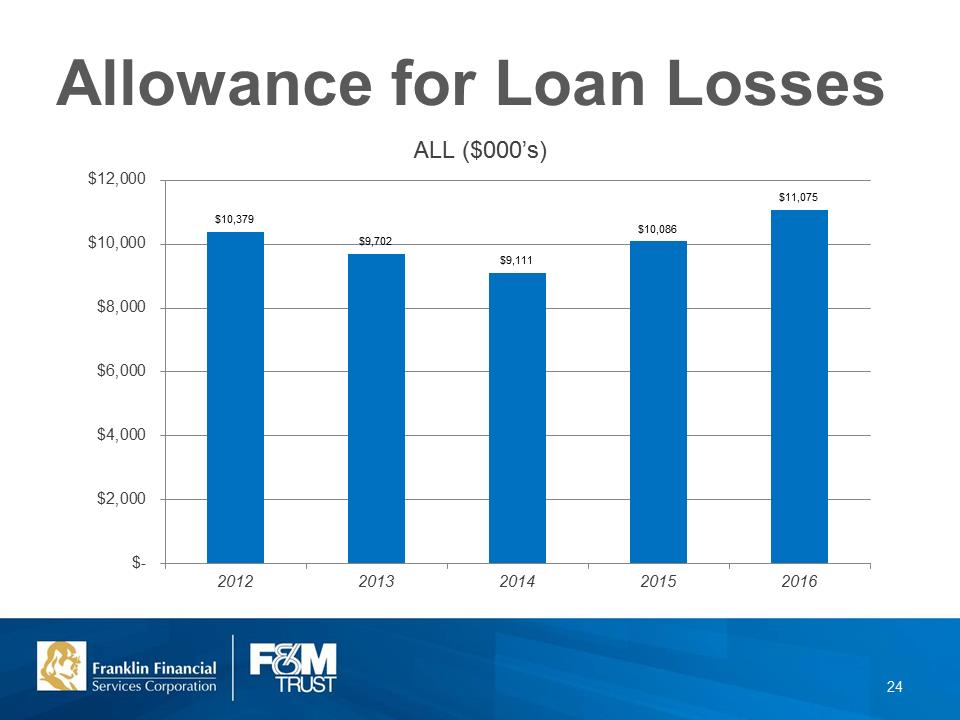
$10,379 $9,702 $9,111 $10,086 $11,075 $- $2,000 $4,000 $6,000 $8,000 $10,000 $12,000 2012 2013 2014 2015 2016 ALL ($000’s) Allowance for Loan Losses 24
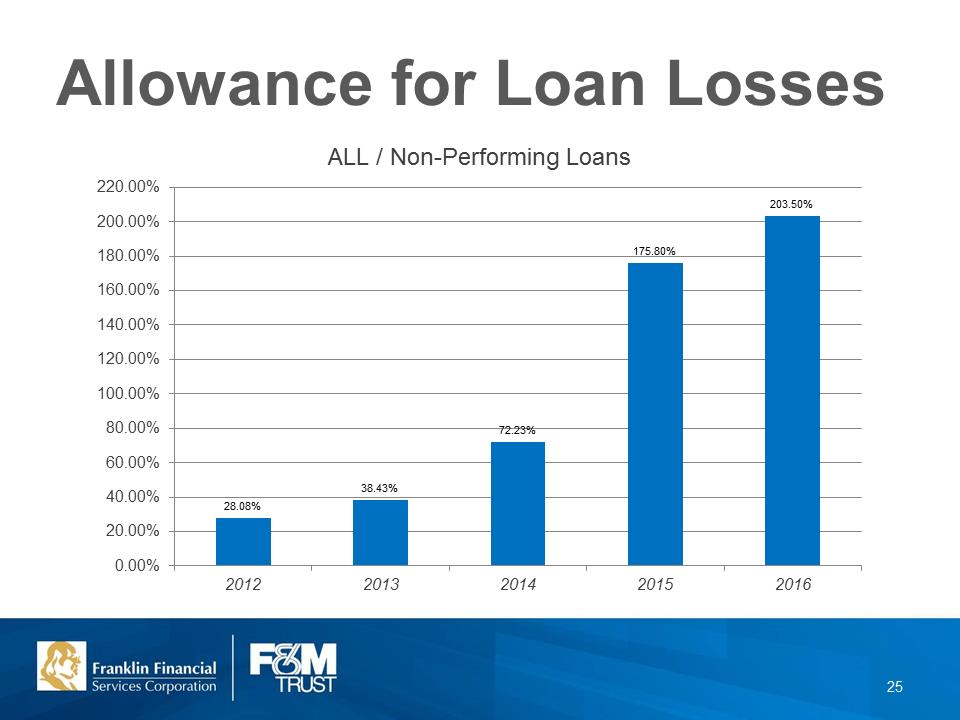
28.08% 38.43% 72.23% 175.80% 203.50% 0.00% 20.00% 40.00% 60.00% 80.00% 100.00% 120.00% 140.00% 160.00% 180.00% 200.00% 220.00% 2012 2013 2014 2015 2016 ALL / Non-Performing Loans Allowance for Loan Losses 25
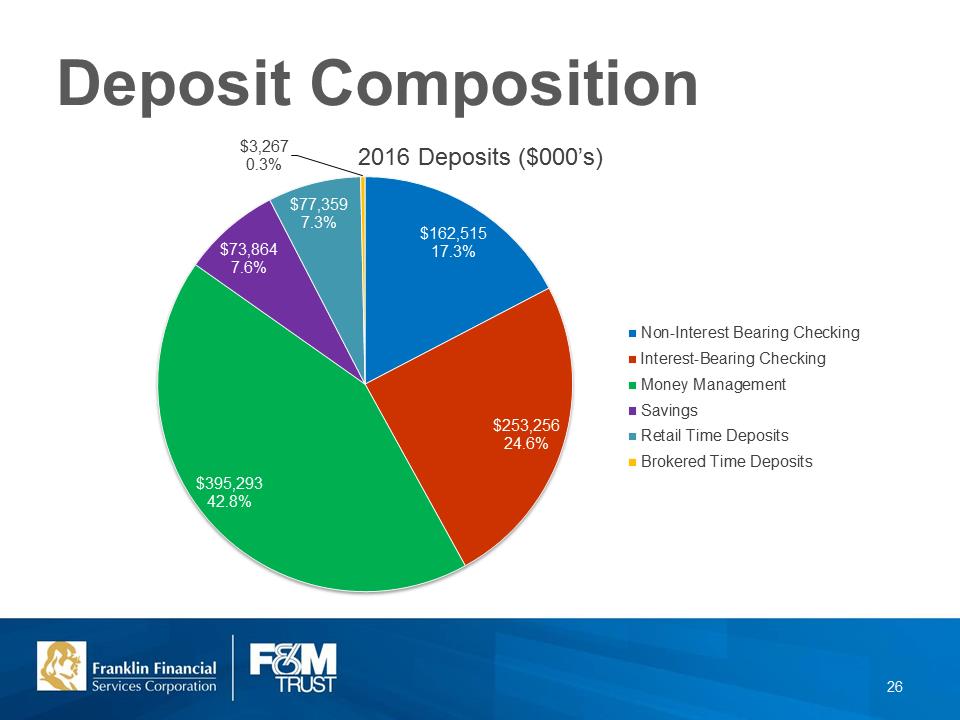
$162,515 17.3% $253,256 24.6% $395,293 42.8% $73,864 7.6% $77,359 7.3% $3,267 0.3% 2016 Deposits ($000’s) Non-Interest Bearing Checking Interest-Bearing Checking Money Management Savings Retail Time Deposits Brokered Time Deposits Deposit Composition 26
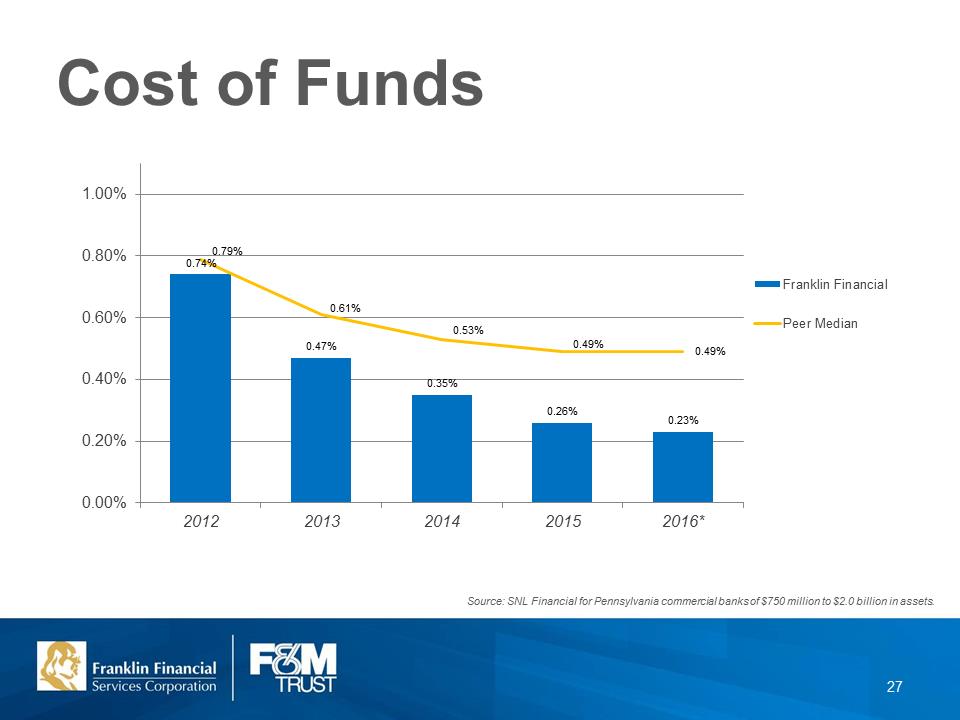
0.74% 0.47% 0.35% 0.26% 0.23% 0.79% 0.61% 0.53% 0.49% 0.49% 0.00% 0.20% 0.40% 0.60% 0.80% 1.00% 2012 2013 2014 2015 2016* Franklin Financial Peer Median Cost of Funds Source: SNL Financial for Pennsylvania commercial banks of $750 million to $2.0 billion in assets. 27
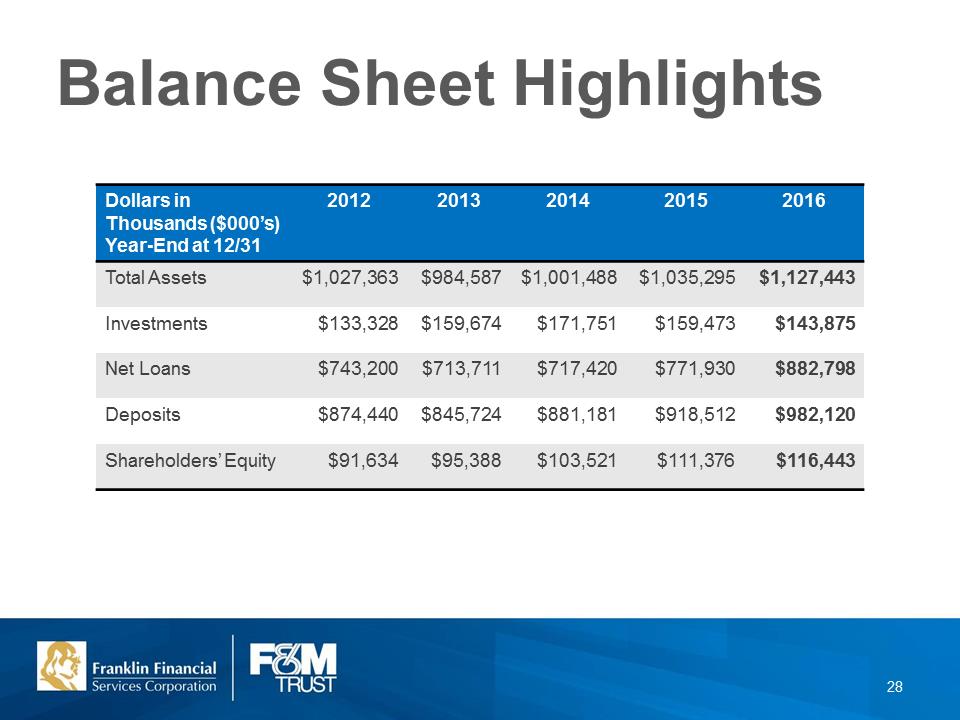
Dollars in Thousands ($000’s) Year-End at 12/31 2012 2013 2014 2015 2016 Total Assets $1,027,363 $984,587 $1,001,488 $1,035,295 $1,127,443 Investments $133,328 $159,674 $171,751 $159,473 $143,875 Net Loans $743,200 $713,711 $717,420 $771,930 $882,798 Deposits $874,440 $845,724 $881,181 $918,512 $982,120 Shareholders’ Equity $91,634 $95,388 $103,521 $111,376 $116,443 Balance Sheet Highlights 28
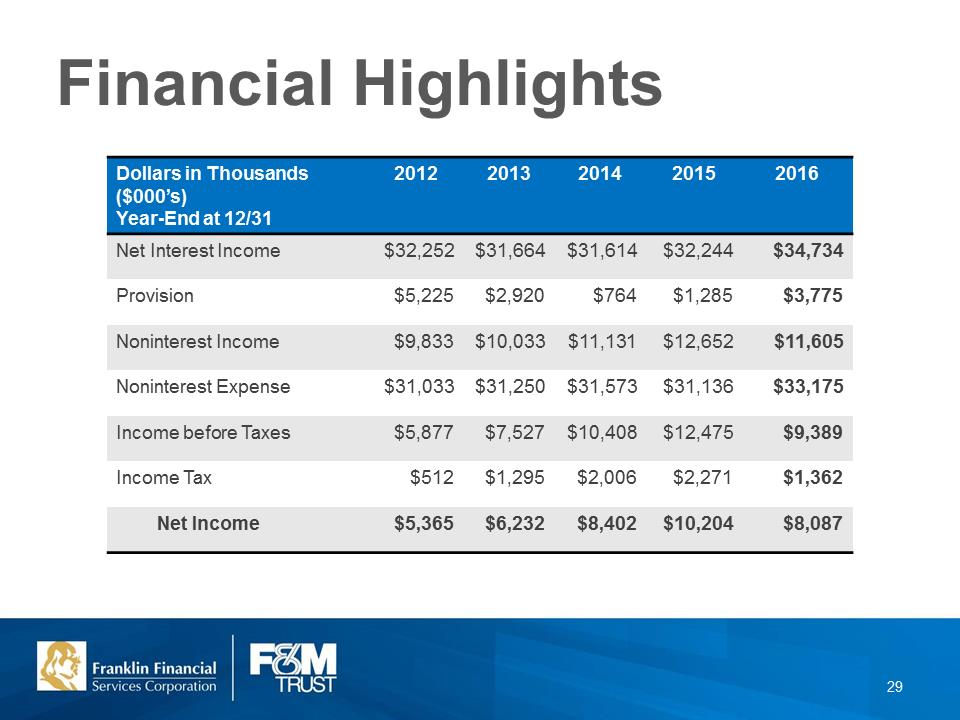
Dollars in Thousands ($000’s) Year-End at 12/31 2012 2013 2014 2015 2016 Net Interest Income $32,252 $31,664 $31,614 $32,244 $34,734 Provision $5,225 $2,920 $764 $1,285 $3,775 Noninterest Income $9,833 $10,033 $11,131 $12,652 $11,605 Noninterest Expense $31,033 $31,250 $31,573 $31,136 $33,175 Income before Taxes $5,877 $7,527 $10,408 $12,475 $9,389 Income Tax $512 $1,295 $2,006 $2,271 $1,362 Net Income $5,365 $6,232 $8,402 $10,204 $8,087 Financial Highlights 29
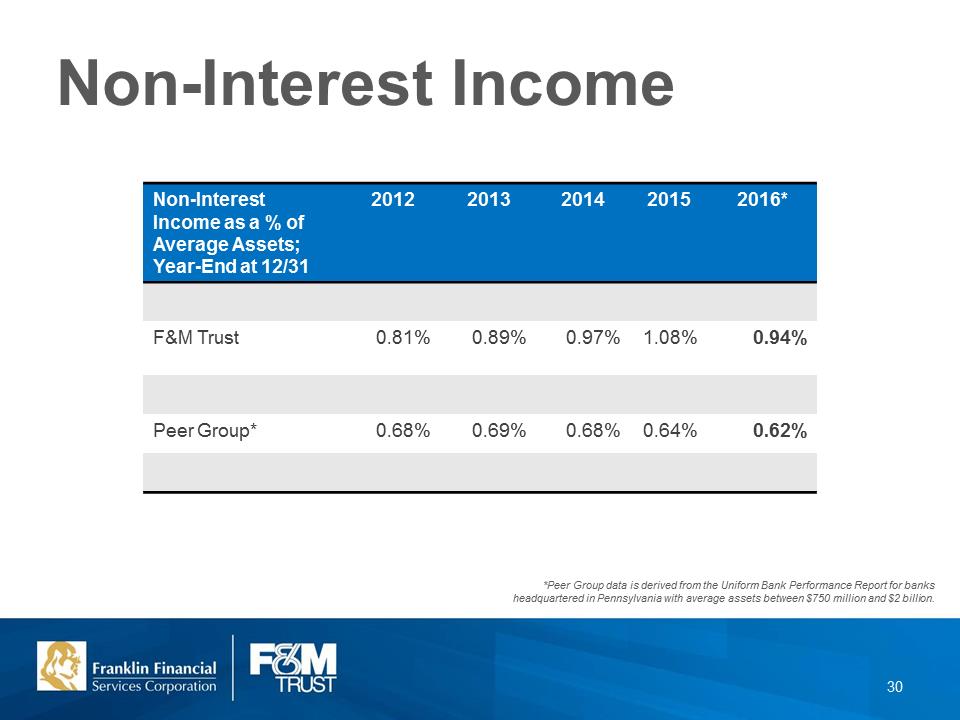
Non-Interest Income as a % of Average Assets; Year-End at 12/31 2012 2013 2014 2015 2016* F&M Trust 0.81% 0.89% 0.97% 1.08% 0.94% Peer Group* 0.68% 0.69% 0.68% 0.64% 0.62% Non-Interest Income *Peer Group data is derived from the Uniform Bank Performance Report for banks headquartered in Pennsylvania with average assets between $750 million and $2 billion. 30
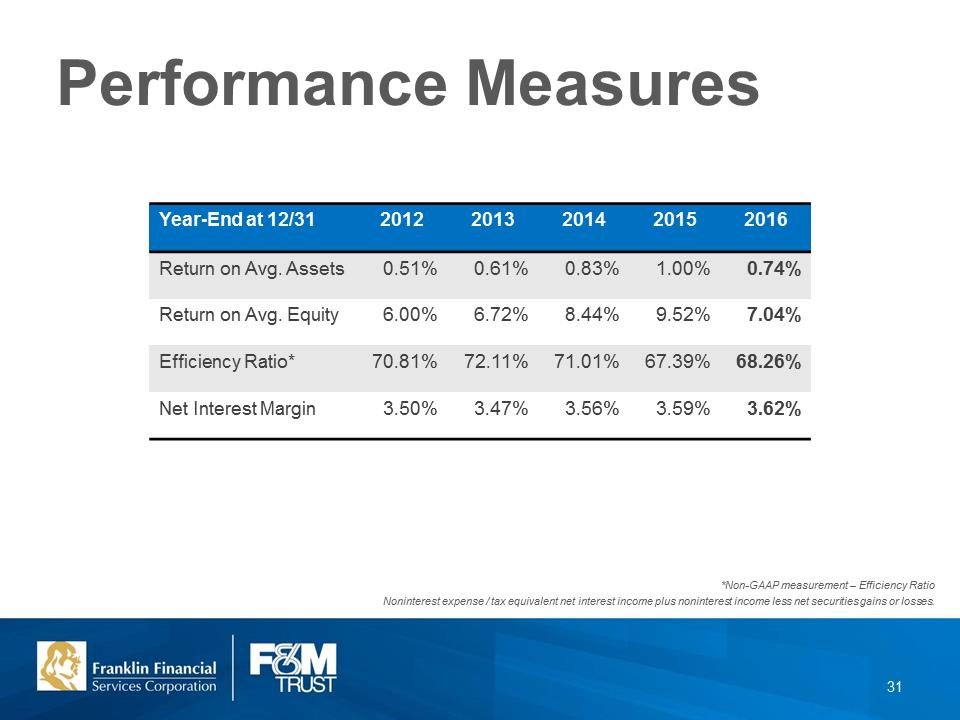
Year-End at 12/31 2012 2013 2014 2015 2016 Return on Avg. Assets 0.51% 0.61% 0.83% 1.00% 0.74% Return on Avg. Equity 6.00% 6.72% 8.44% 9.52% 7.04% Efficiency Ratio* 70.81% 72.11% 71.01% 67.39% 68.26% Net Interest Margin 3.50% 3.47% 3.56% 3.59% 3.62% Performance Measures *Non-GAAP measurement – Efficiency Ratio Noninterest expense / tax equivalent net interest income plus noninterest income less net securities gains or losses. 31
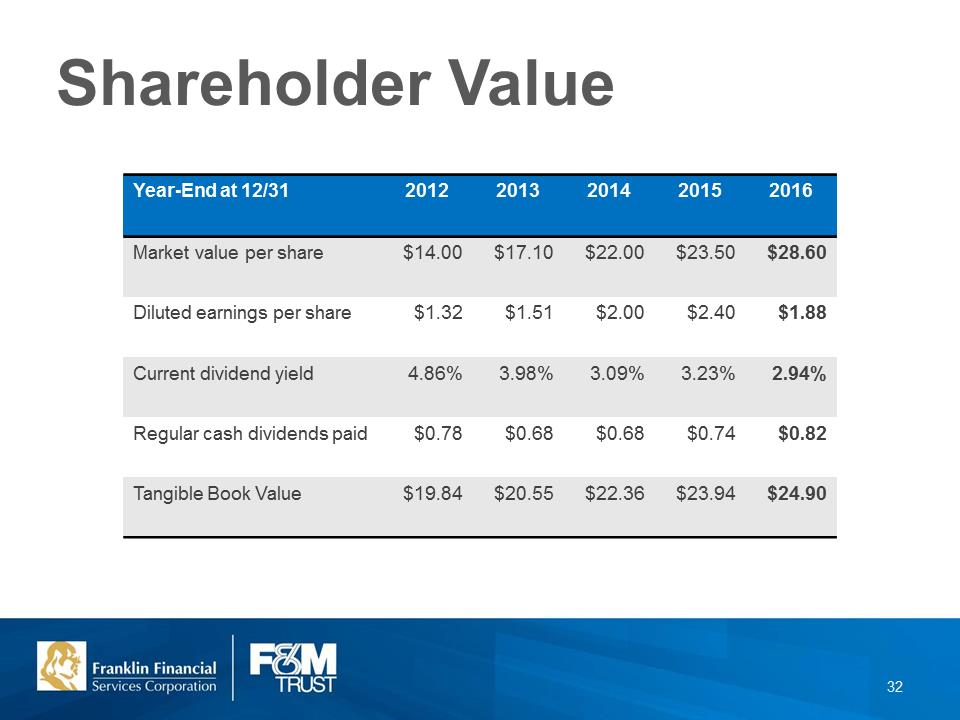
Year-End at 12/31 2012 2013 2014 2015 2016 Market value per share $14.00 $17.10 $22.00 $23.50 $28.60 Diluted earnings per share $1.32 $1.51 $2.00 $2.40 $1.88 Current dividend yield 4.86% 3.98% 3.09% 3.23% 2.94% Regular cash dividends paid $0.78 $0.68 $0.68 $0.74 $0.82 Tangible Book Value $19.84 $20.55 $22.36 $23.94 $24.90 Shareholder Value 32
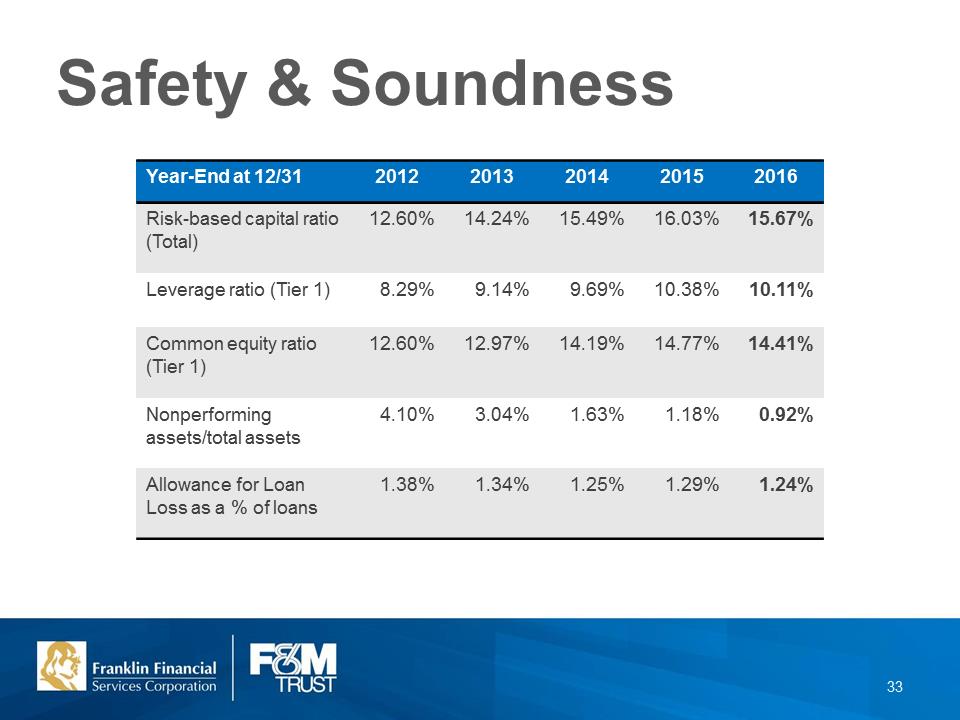
Year-End at 12/31 2012 2013 2014 2015 2016 Risk-based capital ratio (Total) 12.60% 14.24% 15.49% 16.03% 15.67% Leverage ratio (Tier 1) 8.29% 9.14% 9.69% 10.38% 10.11% Common equity ratio (Tier 1) 12.60% 12.97% 14.19% 14.77% 14.41% Nonperforming assets/total assets 4.10% 3.04% 1.63% 1.18% 0.92% Allowance for Loan Loss as a % of loans 1.38% 1.34% 1.25% 1.29% 1.24% Safety & Soundness 33
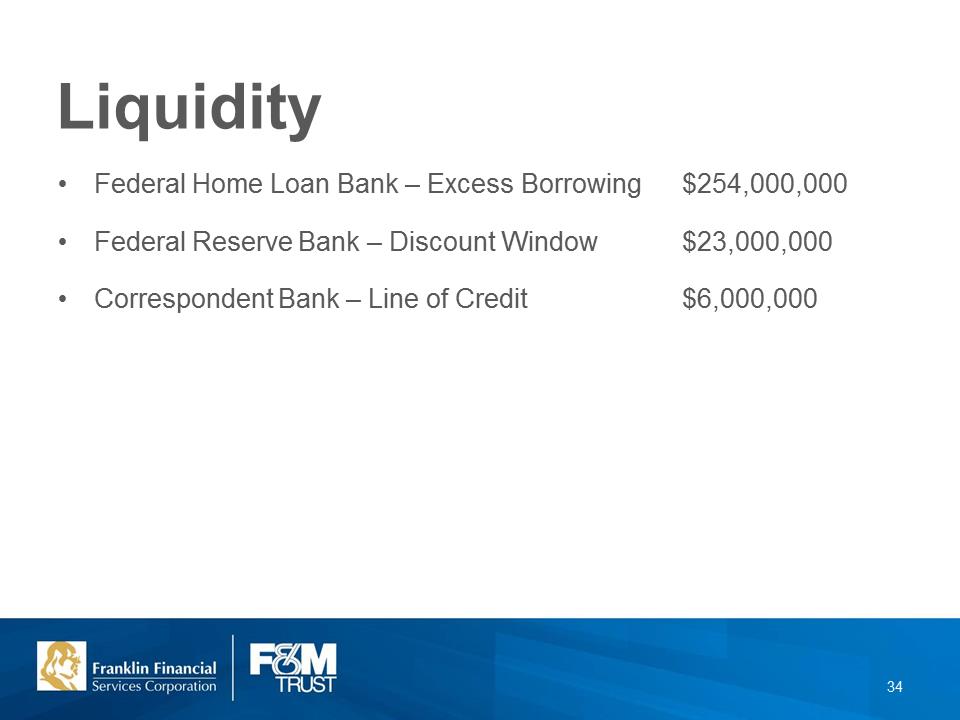
Liquidity •Federal Home Loan Bank – Excess Borrowing $254,000,000 •Federal Reserve Bank – Discount Window $23,000,000 •Correspondent Bank – Line of Credit $6,000,000 34
Stock Symbol: FRAF (OTCQX) www.franklinfin.com www.fmtrustonline.com 35