Attached files
| file | filename |
|---|---|
| 8-K - 8-K - WhiteHorse Finance, Inc. | v461733_8k.htm |
Exhibit 99.1
Investor Presentation March 2017 WhiteHorse Finance, Inc. NASDAQ: WHF

1 References in this presentation to “WHF”, “we”, “us”, “our” and “the Company” refer to WhiteHorse Finance, Inc. Some of the statements in this presentation constitute forward - looking statements, which relate to future events or the Company’ s future performance or financial condition. The forward - looking statements contained in this presentation involve risks and uncertainti es, including statements as to: the Company’s future operating results; changes in political, economic or industry conditions, the interest r ate environment or conditions affecting the financial and capital markets, which could result in changes to the value of the Company’s assets; t he Company’s business prospects and the prospects of its prospective portfolio companies; the impact of investments that the Company expec ts to make; the impact of increased competition; the Company’s contractual arrangements and relationships with third parties; the dependence of the Company’s future success on the general economy and its impact on the industries in which the Company invests; the ability of the Compa ny’ s prospective portfolio companies to achieve their objectives; the relative and absolute performance of the Company’s investment adviser; t he Company’s expected financings and investments; the adequacy of the Company’s cash resources and working capital; the timing of cash flo ws, if any, from the operations of the Company’s prospective portfolio companies; and the impact of future acquisitions and divestitures. Such forward - looking statements may include statements preceded by, followed by or that otherwise include the words “may,” “migh t,” “will,” “intend,” “should,” “could,” “can,” “would,” “expect,” “believe,” “estimate,” “anticipate,” “predict,” “potential,” “plan” or si milar words. The Company has based the forward - looking statements included in this presentation on information available to us on the date of this presentation, and the Company assumes no obligation to update any such forward - looking statements. Actual results could differ materially from those implied or expressed in the Company’s forward - looking statements for any reason, and future results could differ materiall y from historical performance. Although the Company undertakes no obligation to revise or update any forward - looking statements, whether as a res ult of new information, future events or otherwise, you are advised to consult any additional disclosures that are made directly to you or through reports that the Company in the future may file with the Securities and Exchange Commission, including annual reports on Form 10 - K, quarterly reports on Form 10 - Q and current reports on Form 8 - K. For a further discussion of factors that could cause the Company’s future results to differ materially from any forward - looking statements, see the section entitled “Risk Factors” in the annual report on Form 10 - K. Forward Looking Statements
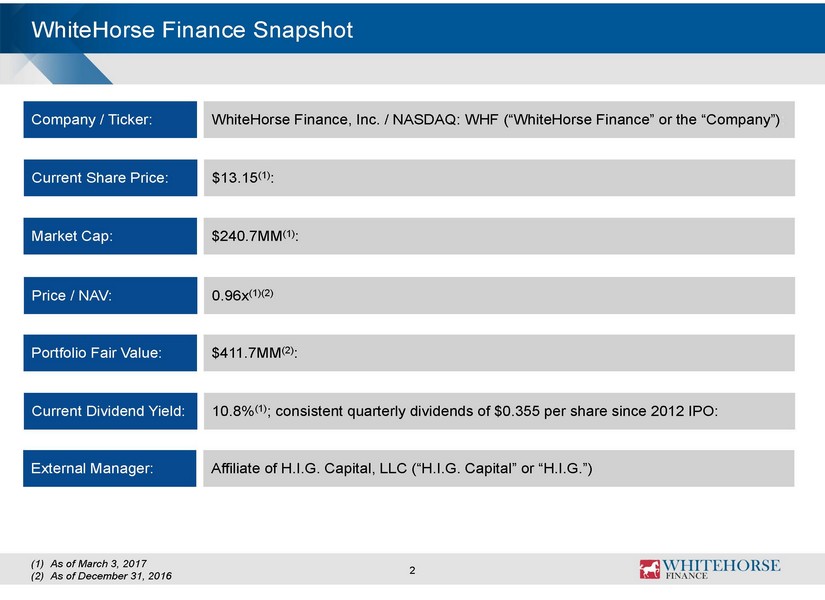
2 WhiteHorse Finance Snapshot Company / Ticker: WhiteHorse Finance, Inc. / NASDAQ: WHF (“WhiteHorse Finance” or the “Company”) : Current Share Price: $ 13.15 (1 ) : Market Cap: $ 240.7MM (1 ) : Price / NAV: 0.96x (1 )(2) Portfolio Fair Value: $ 411.7MM (2 ) : Current Dividend Yield: 10.8% ( 1) ; consistent quarterly dividends of $0.355 per share since 2012 IPO: (1) As of March 3 , 2017 (2) As of December 31, 2016 External Manager: Affiliate of H.I.G. Capital, LLC (“H.I.G. Capital” or “H.I.G.”)
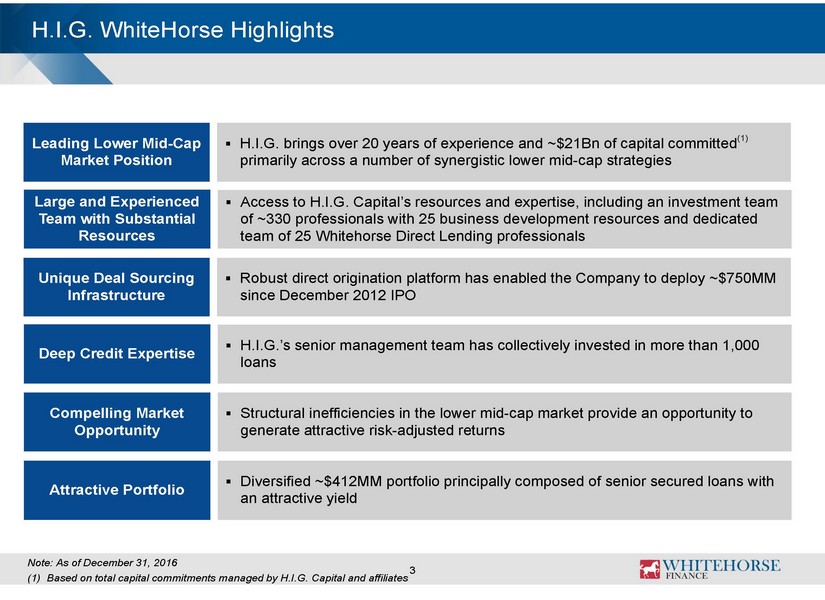
3 H.I.G. WhiteHorse Highlights Leading Lower Mid - Cap Market Position ▪ H.I.G. brings over 20 years of experience and ~$21Bn of capital committed (1) primarily across a number of synergistic lower mid - cap strategies Unique Deal Sourcing Infrastructure ▪ Robust direct origination platform has enabled the Company to deploy ~$750MM since December 2012 IPO Deep Credit Expertise ▪ H.I.G.’s senior management team has collectively invested in more than 1,000 loans Compelling Market Opportunity ▪ Structural inefficiencies in the lower mid - cap market provide an opportunity to generate attractive risk - adjusted returns Attractive Portfolio ▪ Diversified ~$412MM portfolio principally composed of senior secured loans with an attractive yield Note: As of December 31, 2016 (1) Based on total capital commitments managed by H.I.G. Capital and affiliates Large and Experienced Team with Substantial Resources ▪ Access to H.I.G. Capital’s resources and expertise, including an investment team of ~ 330 professionals with 25 business development resources and dedicated team of 25 Whitehorse Direct Lending professionals

▪ Consistent, “better than market” deal flow generated through H.I.G.’s proprietary sourcing network - Proprietary deal sourcing consisting of sponsored and non - sponsored opportunities - Experienced team able to underwrite more complex non - sponsored opportunities ▪ Over 1,000 opportunities reviewed and approximately $750MM invested since December 2012 IPO ▪ 25 Whitehorse deal professionals dedicated to sourcing and underwriting for WHF plus 25 person business development team seeks opportunities from H.I.G .’s proprietary database of over 20,000 contacts Proprietary Deal Sourcing Network 4 WhiteHorse Finance Overview Investment Strategy ▪ Generate attractive risk - adjusted returns through debt investments in performing lower mid - cap companies ▪ Primarily target directly - originated senior secured loans sourced through both WhiteHorse Finance and H.I.G.’s deal flow network ▪ Opportunistically invest in credits where the Company possesses an advantage through H.I.G. Capital Secure Investment Portfolio ▪ 100% of all WHF loans are senior secured loans as of 12/31/2016 ▪ Portfolio has significant downside protection with meaningful value coverage ▪ Diligently structured with tight covenants and broad lender rights Note: As of December 31, 2016 unless otherwise noted
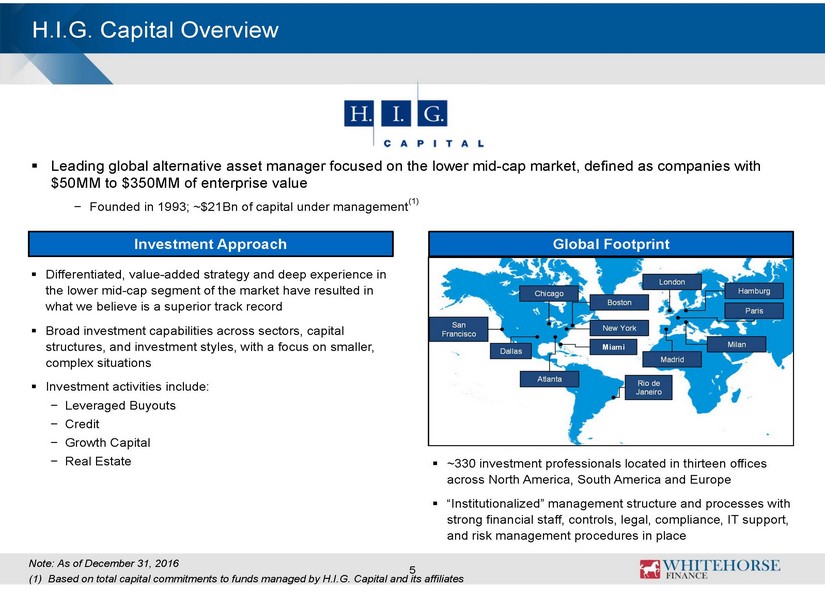
Note: As of December 31, 2016 (1) Based on total capital commitments to funds managed by H.I.G. Capital and its affiliates 5 H.I.G. Capital Overview ▪ Leading global alternative asset manager focused on the lower mid - cap market, defined as companies with $50MM to $350MM of enterprise value − Founded in 1993; ~$21Bn of capital under management (1) ▪ Differentiated, value - added strategy and deep experience in the lower mid - cap segment of the market have resulted in what we believe is a superior track record ▪ Broad investment capabilities across sectors, capital structures, and investment styles, with a focus on smaller, complex situations ▪ Investment activities include: − Leveraged Buyouts − Credit − Growth Capital − Real Estate ▪ ~ 330 investment professionals located in thirteen offices across North America, South America and Europe ▪ “Institutionalized” management structure and processes with strong financial staff, controls, legal, compliance, IT support, and risk management procedures in place Investment Approach Global Footprint Miami New York Boston Chicago San Francisco Dallas Rio de Janeiro London Madrid Milan Hamburg Paris Atlanta
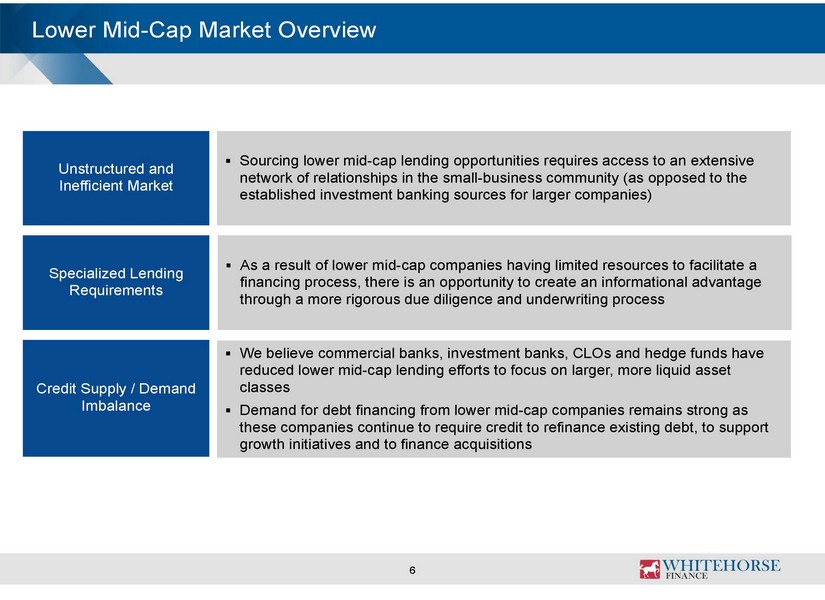
6 Lower Mid - Cap Market Overview Unstructured and Inefficient Market ▪ Sourcing lower mid - cap lending opportunities requires access to an extensive network of relationships in the small - business community (as opposed to the established investment banking sources for larger companies) Specialized Lending Requirements ▪ As a result of lower mid - cap companies having limited resources to facilitate a financing process, there is an opportunity to create an informational advantage through a more rigorous due diligence and underwriting process Credit Supply / Demand Imbalance ▪ We believe commercial banks, investment banks, CLOs and hedge funds have reduced lower mid - cap lending efforts to focus on larger, more liquid asset classes ▪ Demand for debt financing from lower mid - cap companies remains strong as these companies continue to require credit to refinance existing debt, to support growth initiatives and to finance acquisitions
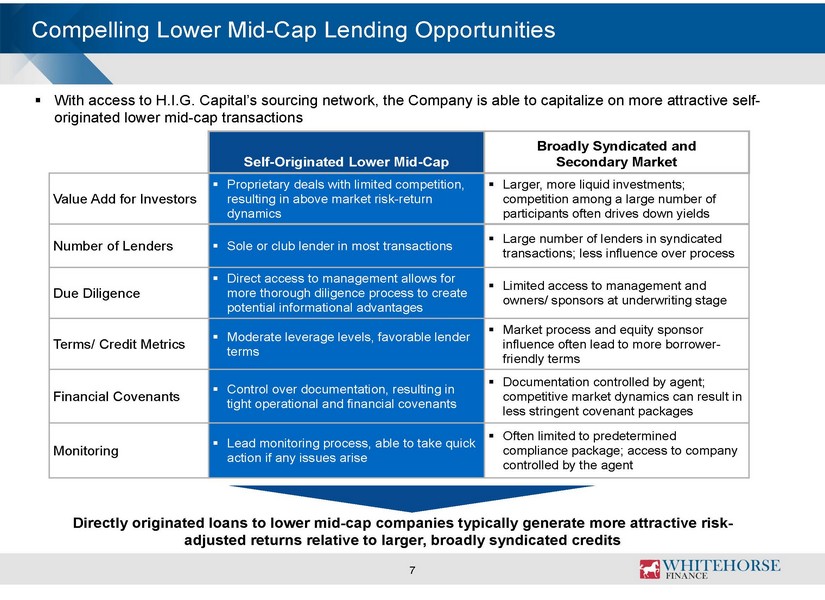
7 Self - Originated Lower Mid - Cap Broadly Syndicated and Secondary Market Value Add for Investors ▪ Proprietary deals with limited competition, resulting in above market risk - return dynamics ▪ Larger, more liquid investments; competition among a large number of participants often drives down yields Number of Lenders ▪ Sole or club lender in most transactions ▪ Large number of lenders in syndicated transactions; less influence over process Due Diligence ▪ Direct access to management allows for more thorough diligence process to create potential informational advantages ▪ Limited access to management and owners/ sponsors at underwriting stage Terms/ Credit Metrics ▪ Moderate leverage levels, favorable lender terms ▪ Market process and equity sponsor influence often lead to more borrower - friendly terms Financial Covenants ▪ Control over documentation, resulting in tight operational and financial covenants ▪ Documentation controlled by agent; competitive market dynamics can result in less stringent covenant packages Monitoring ▪ Lead monitoring process, able to take quick action if any issues arise ▪ Often limited to predetermined compliance package; access to company controlled by the agent Compelling Lower Mid - Cap Lending Opportunities ▪ With access to H.I.G. Capital’s sourcing network, the Company is able to capitalize on more attractive self - originated lower mid - cap transactions Directly originated loans to lower mid - cap companies typically generate more attractive risk - adjusted returns relative to larger, broadly syndicated credits
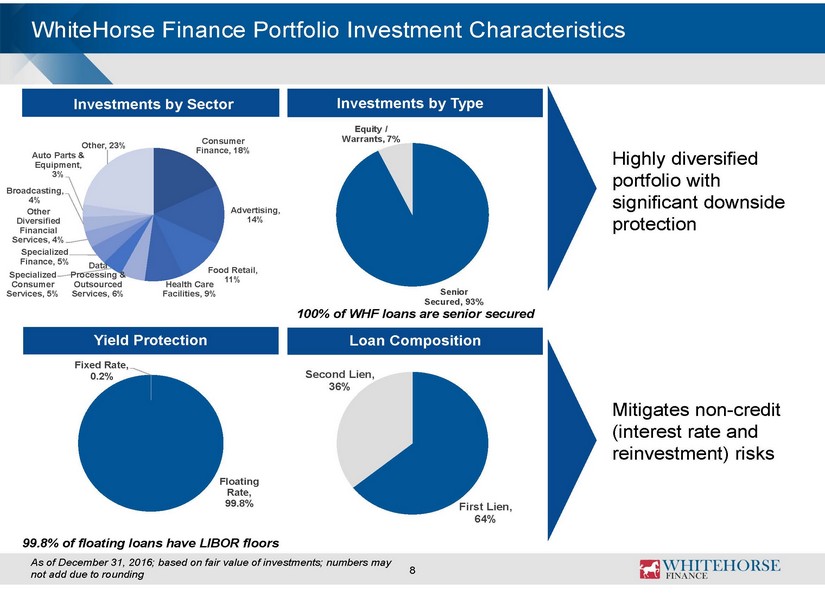
8 WhiteHorse Finance Portfolio Investment Characteristics Investments by Sector Investments by Type As of December 31, 2016; based on fair value of investments; numbers may not add due to rounding Yield Protection Loan Composition 100% of WHF loans are senior secured 99.8% of floating loans have LIBOR floors Highly diversified portfolio with significant downside protection Mitigates non - credit (interest rate and reinvestment) risks Senior Secured , 93% Equity / Warrants , 7% Fixed Rate, 0.2% Floating Rate, 99.8% Consumer Finance, 18% Advertising, 14% Food Retail, 11% Health Care Facilities, 9% Data Processing & Outsourced Services, 6% Specialized Consumer Services, 5% Specialized Finance, 5% Other Diversified Financial Services, 4% Broadcasting, 4% Auto Parts & Equipment, 3% Other, 23% First Lien, 64% Second Lien, 36%
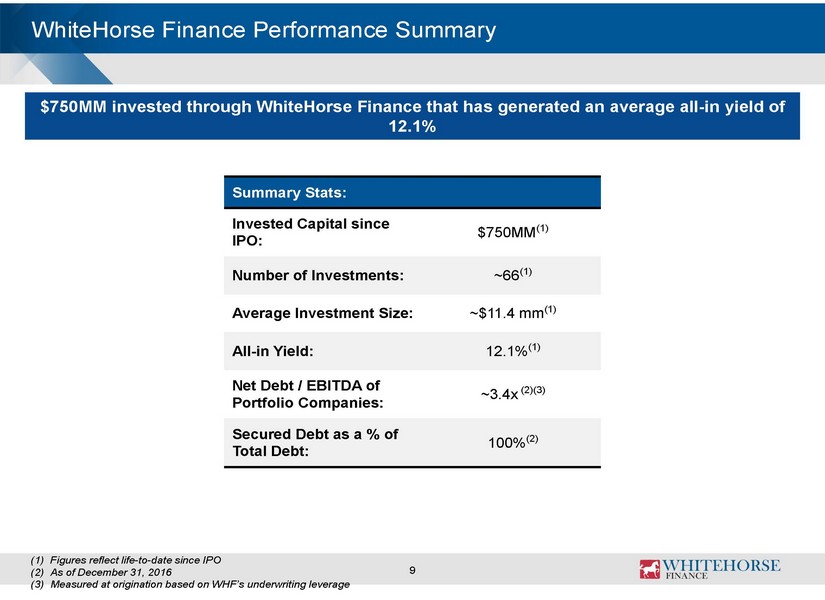
WhiteHorse Finance Performance Summary Summary Stats: Invested Capital since IPO: $750MM Number of Investments: ~ 66 Average Investment Size: ~$ 11.1 mm All - in Yield : 11.8% Net Debt / EBITDA of Portfolio Companies: ~ 3.4x (1) Secured Debt as a % of Total Debt : 100% $750MM invested through WhiteHorse Finance that has generated an average all - in yield of 11.8% Note: As of December 31, 2016 unless stated otherwise (1) Measured at origination based on WHF’s underwriting leverage 9
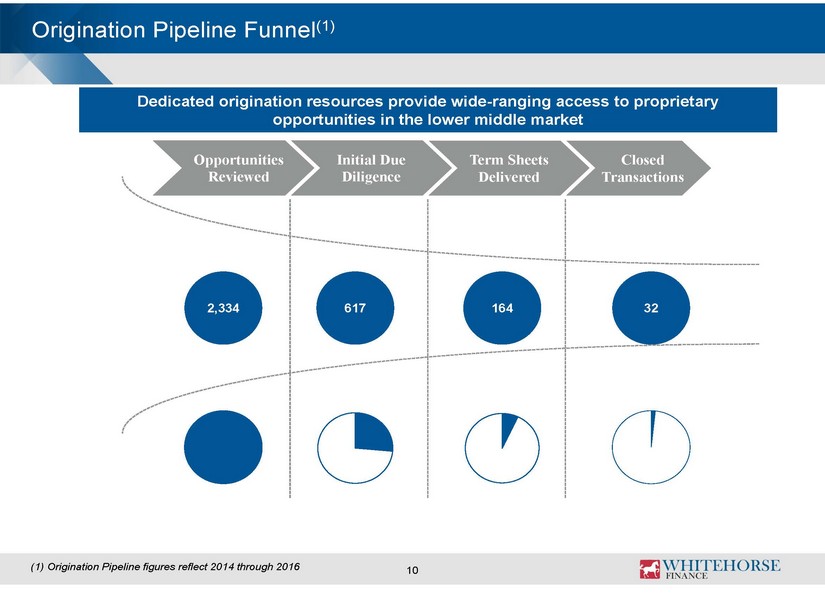
Origination Pipeline Funnel (1) Dedicated origination resources provide wide - ranging access to proprietary opportunities in the lower middle market Opportunities Reviewed Initial Due Diligence Term Sheets Delivered Closed Transactions 10 164 2,334 32 617 (1) Origination Pipeline figures reflect 2014 through 2016
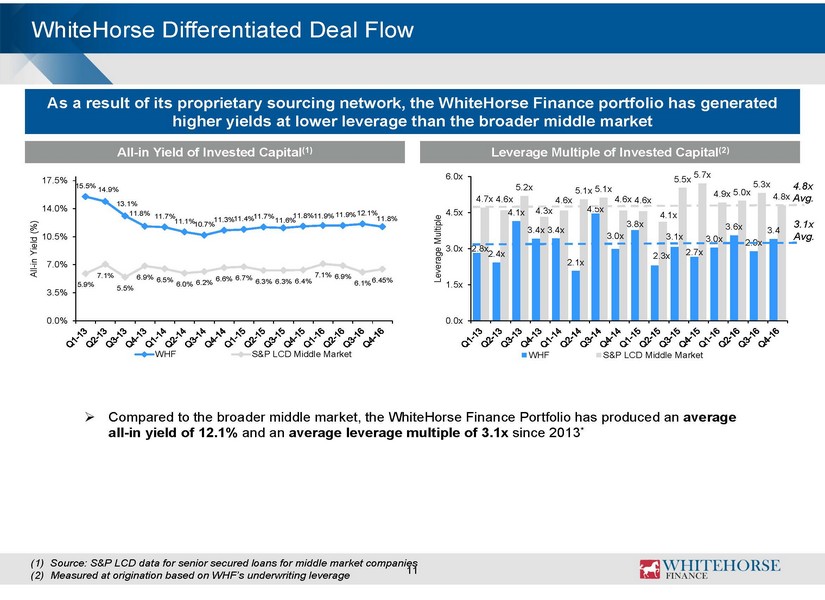
WhiteHorse Differentiated Deal Flow As a result of its proprietary sourcing network, the WhiteHorse Finance portfolio has generated higher yields at lower leverage than the broader middle market All - in Yield of Invested Capital (1) Leverage Multiple of Invested Capital (2) » Compared to the broader middle market, the WhiteHorse Finance Portfolio has produced an average all - in yield of 11.8% and an average leverage multiple of 3.1x since 2013 * 11 (1) Source : S&P LCD data for senior secured loans for middle market companies (2) Measured at origination based on WHF’s underwriting leverage 11.9% 14.9% 13.1% 11.8% 11.7% 11.1% 10.7% 11.3% 11.4% 11.7% 11.6% 11.8% 11.9% 11.9% 12.1% 11.8% 5.9% 7.1% 5.5% 6.9% 6.5% 6.0% 6.2% 6.6% 6.7% 6.3% 6.3% 6.4% 7.1% 6.9% 6.1% 6.45% 0.0% 3.5% 7.0% 10.5% 14.0% 17.5% All - in Yield (%) WHF S&P LCD Middle Market 2.8x 2.4x 4.1x 3.4x 3.4x 2.1x 4.5x 3.0x 3.8x 2.3x 3.1x 2.7x 3.0x 3.6x 2.9x 3.4 4.7x 4.6x 5.2x 4.3x 4.6x 5.1x 5.1x 4.6x 4.6x 4.1x 5.5x 5.7x 4.9x 5.0x 5.3x 4.8x 0.0x 1.5x 3.0x 4.5x 6.0x Leverage Multiple WHF S&P LCD Middle Market 4.8x Avg. 3.1x Avg.
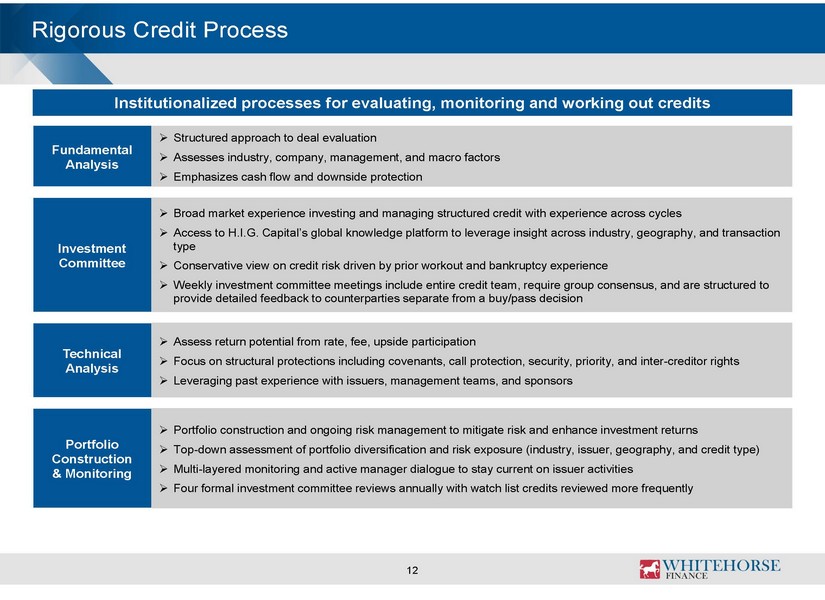
Rigorous Credit Process Institutionalized processes for evaluating, monitoring and working out credits Fundamental Analysis » Structured approach to deal evaluation » Assesses industry, company, management, and macro factors » Emphasizes cash flow and downside protection Investment Committee » Broad market experience investing and managing structured credit with experience across cycles » Access to H.I.G. Capital’s global knowledge platform to leverage insight across industry, geography, and transaction type » Conservative view on credit risk driven by prior workout and bankruptcy experience » Weekly investment committee meetings include entire credit team, require group consensus, and are structured to provide detailed feedback to counterparties separate from a buy/pass decision Technical Analysis » Assess return potential from rate, fee, upside participation » Focus on structural protections including covenants, call protection, security, priority, and inter - creditor rights » Leveraging past experience with issuers, management teams, and sponsors Portfolio Construction & Monitoring » Portfolio construction and ongoing risk management to mitigate risk and enhance investment returns » Top - down assessment of portfolio diversification and risk exposure (industry, issuer, geography, and credit type) » Multi - layered monitoring and active manager dialogue to stay current on issuer activities » Four formal investment committee reviews annually with watch list credits reviewed more frequently 12
13 Appendix
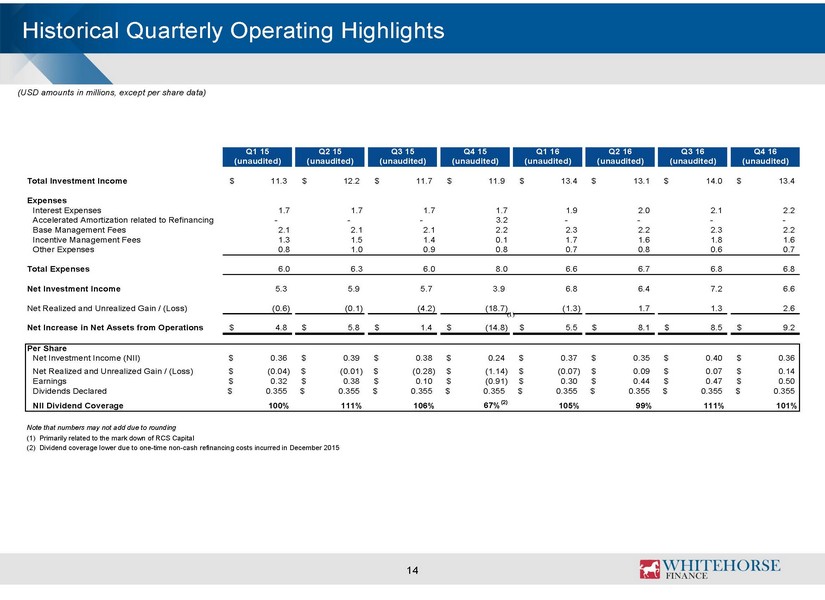
14 Historical Quarterly Operating Highlights (USD amounts in millions, except per share data) (1) Q1 15 Q2 15 Q3 15 Q4 15 Q1 16 Q2 16 Q3 16 Q4 16 (unaudited) (unaudited) (unaudited) (unaudited) (unaudited) (unaudited) (unaudited) (unaudited) Total Investment Income 11.3$ 12.2$ 11.7$ 11.9$ 13.4$ 13.1$ 14.0$ 13.4$ Expenses Interest Expenses 1.7 1.7 1.7 1.7 1.9 2.0 2.1 2.2 Accelerated Amortization related to Refinancing 0.0 0 0 3.2 - - - - Base Management Fees 2.1 2.1 2.1 2.2 2.3 2.2 2.3 2.2 Incentive Management Fees 1.3 1.5 1.4 0.1 1.7 1.6 1.8 1.6 Other Expenses 0.8 1 0.9 0.8 0.7 0.8 0.6 0.7 Total Expenses 6.0 6.3 6.0 8.0 6.6 6.7 6.8 6.8 Net Investment Income 5.3 5.9 5.7 3.9 6.8 6.4 7.2 6.6 Net Realized and Unrealized Gain / (Loss) (0.6) (0.1) (4.2) (18.7) (1.3) 1.7 1.3 2.6 Net Increase in Net Assets from Operations 4.8$ 5.8$ 1.4$ (14.8)$ 5.5$ 8.1$ 8.5$ 9.2$ Per Share Net Investment Income (NII) 0.36$ 0.39$ 0.38$ 0.24$ 0.37$ 0.35$ 0.40$ 0.36$ Net Realized and Unrealized Gain / (Loss) (0.04)$ (0.01)$ (0.28)$ (1.14)$ (0.07)$ 0.09$ 0.07$ 0.14$ Earnings 0.32$ 0.38$ 0.10$ (0.91)$ 0.30$ 0.44$ 0.47$ 0.50$ Dividends Declared 0.355$ 0.355$ 0.355$ 0.355$ 0.355$ 0.355$ 0.355$ 0.355$ NII Dividend Coverage 100% 111% 106% 67% (2) 105% 99% 111% 101% (1) Primarily related to the mark down of RCS Capital (2) Divdend coverage lower due to one-time non-cash refinancing costs incurred in December 2015

15 Historical Quarterly Balance Sheet Highlights (USD amounts in millions, except per share data) Q1 15 Q2 15 Q3 15 Q4 15 Q1 16 Q2 16 Q3 16 Q4 16 (unaudited) (unaudited) (unaudited) (unaudited) (unaudited) (unaudited) (unaudited) (unaudited) Assets Investments at Fair Value 391.3$ 387.5$ 376.1$ 415.3$ 417.2$ 400.9$ 402.9$ 411.7$ Cash and Equivalents (1) 17.6 27.3 25.9 22.8 21.1 44.1 23.7 28.9 Other Assets 12.3 7.5 7.1 7.1 4.5 4.4 4.4 5.6 Total Assets 421.2$ 422.3$ 409.1$ 445.2$ 442.8$ 449.4$ 430.9$ 446.2$ Liabilities Debt 185.5 185.5 173.5 187.0 186.7 191.4 170.4 182.3 Other Liabilities 10.9 11.5 14.2 14.1 13.0 13.3 13.8 14.5 Total Liabilities 196.4 197.0 187.7 201.1 199.7 204.7 184.1 196.8 Total Net Assets 224.8 225.3 221.4 244.1 243.1 244.7 246.8 249.4 Total Liabilities and Net Assets 421.2$ 422.3$ 409.1$ 445.2$ 442.8$ 449.4$ 430.9$ 446.2$ Net Asset Value per Share 15.00$ 15.03$ 14.77$ 13.33$ 13.28$ 13.37$ 13.48$ 13.63$ Leverage Ratio (2) 0.83x 0.82x 0.78x 0.77x 0.78x 0.79x 0.70x 0.74x Net Leverage Ratio (3) 0.73x 0.70x 0.68x 0.68x 0.69x 0.61x 0.61x 0.63x (1) Includes Restricted Cash (2) Calculated as Total Debt divided by Total Net Assets (3) Net Leverage Ratio is defined as debt outstanding plus any amounts payable for investments purchases less cash and receivables for investments sold, divided by total net assets
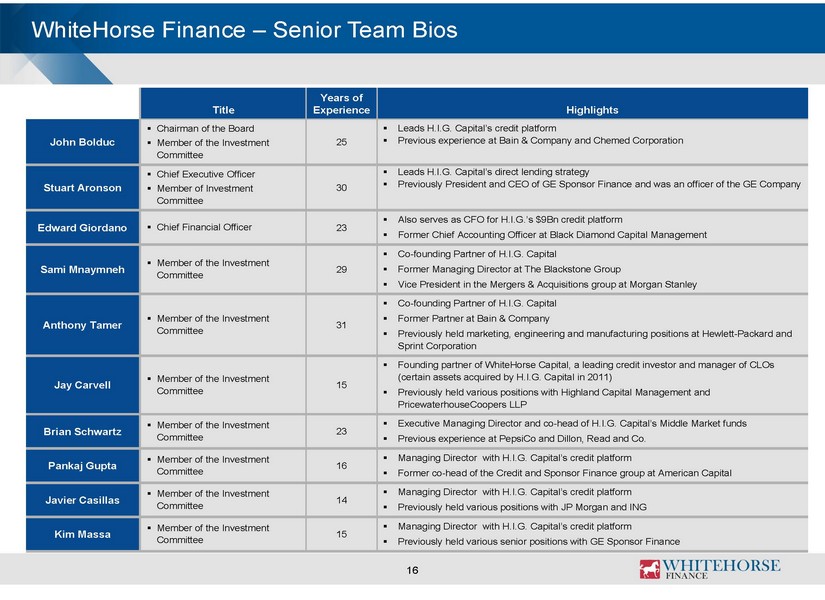
16 WhiteHorse Finance – Senior Team Bios Title Years of Experience Highlights John Bolduc ▪ Chairman of the Board ▪ Member of the Investment Committee 25 ▪ Leads H.I.G. Capital’s c redit platform ▪ Previous experience at Bain & Company and Chemed Corporation Stuart Aronson ▪ Chief Executive Officer ▪ Member of Investment Committee 30 ▪ Leads H.I.G. Capital’s direct lending strategy ▪ Previously President and CEO of GE Sponsor Finance and was an officer of the GE Company Edward Giordano ▪ Chief Financial Officer 23 ▪ Also serves as CFO for H.I.G.’s $9Bn credit platform ▪ Former Chief Accounting Officer at Black Diamond Capital Management Sami Mnaymneh ▪ Member of the Investment Committee 29 ▪ Co - founding Partner of H.I.G. Capital ▪ Former Managing Director at The Blackstone Group ▪ Vice President in the Mergers & Acquisitions group at Morgan Stanley Anthony Tamer ▪ Member of the Investment Committee 31 ▪ Co - founding Partner of H.I.G. Capital ▪ Former Partner at Bain & Company ▪ Previously held marketing, engineering and manufacturing positions at Hewlett - Packard and Sprint Corporation Jay Carvell ▪ Member of the Investment Committee 15 ▪ Founding partner of WhiteHorse Capital, a leading credit investor and manager of CLOs (certain assets acquired by H.I.G. Capital in 2011) ▪ Previously held various positions with Highland Capital Management and PricewaterhouseCoopers LLP Brian Schwartz ▪ Member of the Investment Committee 23 ▪ Executive Managing Director and co - head of H.I.G. Capital’s Middle Market funds ▪ Previous experience at PepsiCo and Dillon, Read and Co. Pankaj Gupta ▪ Member of the Investment Committee 16 ▪ Managing Director with H.I.G. Capital’s credit platform ▪ Former co - head of the Credit and Sponsor Finance group at American Capital Javier Casillas ▪ Member of the Investment Committee 14 ▪ Managing Director with H.I.G. Capital’s credit platform ▪ Previously held various positions with JP Morgan and ING Kim Massa ▪ Member of the Investment Committee 15 ▪ Managing Director with H.I.G. Capital’s credit platform ▪ Previously held various senior positions with GE Sponsor Finance