Attached files
| file | filename |
|---|---|
| 8-K - 8-K - CRU PHOSPHATES 2017 (MARCH 2017) - MOSAIC CO | a8-kcrupresentationmarch20.htm |

Walt Precourt
Senior Vice President – Phosphates
CRU Phosphates 2017
Tampa, FL
March 14, 2017
The Global Outlook:
A View From Florida
Exhibit 99.1

2
Safe Harbor
This document contains forward-looking statements within the meaning of the Private Securities Litigation Reform Act of 1995. Such statements include, but
are not limited to, statements about our proposed acquisition of the global phosphate and potash operations of Vale S.A. (“Vale”) conducted through Vale
Fertilizantes S.A. (the “Transaction”) and the anticipated benefits and synergies of the proposed Transaction, other proposed or pending future transactions
or strategic plans and other statements about future financial and operating results. Such statements are based upon the current beliefs and expectations of
The Mosaic Company’s management and are subject to significant risks and uncertainties. These risks and uncertainties include but are not limited to risks
and uncertainties arising from the possibility that the closing of the proposed Transaction may be delayed or may not occur, including delays or risks arising
from any inability to obtain governmental approvals of the Transaction on the proposed terms and schedule, any inability of Vale to achieve certain other
specified regulatory and operational milestones or to successfully complete the transfer of the Cubatão business to Vale and its affiliates in a timely manner,
and the ability to satisfy any of the other closing conditions; our ability to secure financing, or financing on satisfactory terms and in amounts sufficient to
fund the cash portion of the purchase price without the need for additional funds from other liquidity sources; difficulties with realization of the benefits of the
proposed Transaction, including the risks that the acquired business may not be integrated successfully or that the anticipated synergies or cost or capital
expenditure savings from the Transaction may not be fully realized or may take longer to realize than expected, including because of political and economic
instability in Brazil or changes in government policy in Brazil; the predictability and volatility of, and customer expectations about, agriculture, fertilizer, raw
material, energy and transportation markets that are subject to competitive and other pressures and economic and credit market conditions; the level of
inventories in the distribution channels for crop nutrients; the effect of future product innovations or development of new technologies on demand for our
products; changes in foreign currency and exchange rates; international trade risks and other risks associated with Mosaic’s international operations and
those of joint ventures in which Mosaic participates, including the risk that protests against natural resource companies in Peru extend to or impact the Miski
Mayo mine, the ability of the Wa’ad Al Shamal Phosphate Company (also known as MWSPC) to obtain additional planned funding in acceptable amounts
and upon acceptable terms, the timely development and commencement of operations of production facilities in the Kingdom of Saudi Arabia, the future
success of current plans for MWSPC and any future changes in those plans; difficulties with realization of the benefits of our long term natural gas based
pricing ammonia supply agreement with CF Industries, Inc., including the risk that the cost savings initially anticipated from the agreement may not be fully
realized over its term or that the price of natural gas or ammonia during the term are at levels at which the pricing is disadvantageous to Mosaic; customer
defaults; the effects of Mosaic’s decisions to exit business operations or locations; changes in government policy; changes in environmental and other
governmental regulation, including expansion of the types and extent of water resources regulated under federal law, carbon taxes or other greenhouse gas
regulation, implementation of numeric water quality standards for the discharge of nutrients into Florida waterways or efforts to reduce the flow of excess
nutrients into the Mississippi River basin, the Gulf of Mexico or elsewhere; further developments in judicial or administrative proceedings, or complaints that
Mosaic’s operations are adversely impacting nearby farms, business operations or properties; difficulties or delays in receiving, increased costs of or
challenges to necessary governmental permits or approvals or increased financial assurance requirements; resolution of global tax audit activity; the
effectiveness of Mosaic’s processes for managing its strategic priorities; adverse weather conditions affecting operations in Central Florida, the Mississippi
River basin, the Gulf Coast of the United States or Canada, and including potential hurricanes, excess heat, cold, snow, rainfall or drought; actual costs of
various items differing from management’s current estimates, including, among others, asset retirement, environmental remediation, reclamation or other
environmental regulation, Canadian resources taxes and royalties, or the costs of the MWSPC, its existing or future funding and Mosaic’s commitments in
support of such funding; reduction of Mosaic’s available cash and liquidity, and increased leverage, due to its use of cash and/or available debt capacity to
fund financial assurance requirements and strategic investments; brine inflows at Mosaic’s Esterhazy, Saskatchewan, potash mine or other potash shaft
mines; other accidents and disruptions involving Mosaic’s operations, including potential mine fires, floods, explosions, seismic events, sinkholes or
releases of hazardous or volatile chemicals; and risks associated with cyber security, including reputational loss, as well as other risks and uncertainties
reported from time to time in The Mosaic Company’s reports filed with the Securities and Exchange Commission. Actual results may differ from those set
forth in the forward-looking statements.

3
Topics
▪ What’s Driving the Current Rally
▪ A Look Beyond 2017
▪ The Evolution of the North American Industry
▪ What’s New at Mosaic

4
What’s Driving the Current Rally

5
The 2017 Rally
300
325
350
375
400
425
450
475
500
525
550
Jan-13 Jan-14 Jan-15 Jan-16 Jan-17
$ Tonne
DAP/MAP Prices
Published Weekly Spot Prices
DAP NOLA MAP BrazilSource: Argus FMB
175
200
225
250
275
300
325
350
Jan-13 Jan-14 Jan-15 Jan-16 Jan-17
$ Tonne
Benchmark DAP Stripping Margin
Calculated from Published Weekly Spot Prices
Source: Argus FMB
6
Fundamental Drivers
▪ Buying rush in a rising market
− Continued positive agronomic and economic demand drivers
− Low channel inventories worldwide
− Large uncovered commitments for upcoming application season
▪ Decline in Chinese export availability
− Peak domestic shipments (part of the demand story)
− Lower domestic production
• Unprofitable production economics
• More stringent environmental regulations (Blue Skies)
▪ Jumps in raw materials costs
▪ Loading delays in Morocco
7
First Half Outlook – Key Features
▪ Momentum expected to continue
− More upside than downside risk
• Strong shipment prospects
• Lower Chinese exports
• Little raw materials cost relief
• Ongoing shipping delays from Jorf Lasfar
• No material production from new capacity
8
Second Half Outlook – Key Features
▪ Tilting toward continued tight S/D balance
− Several uncertainties, but . . .
− Key swing factors at this point look positive
• Shipments expected to remain strong in the second half
• Chinese exports projected to drop to ~8.0 million tonnes
• Raw materials costs forecast to ease later this year
• Output from new facilities likely less than current expectations
9
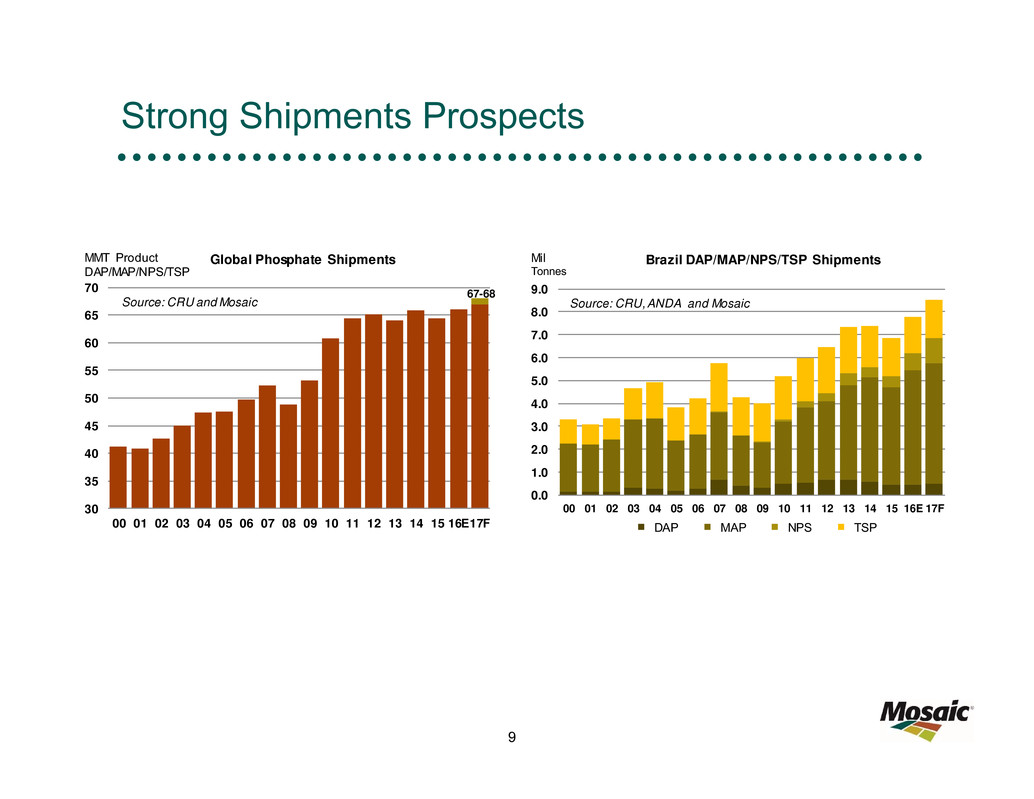
Strong Shipments Prospects
67-68
30
35
40
45
50
55
60
65
70
00 01 02 03 04 05 06 07 08 09 10 11 12 13 14 15 16E17F
Global Phosphate ShipmentsMMT Product
DAP/MAP/NPS/TSP
Source: CRU and Mosaic
0.0
1.0
2.0
3.0
4.0
5.0
6.0
7.0
8.0
9.0
00 01 02 03 04 05 06 07 08 09 10 11 12 13 14 15 16E 17F
Brazil DAP/MAP/NPS/TSP Shipments
DAP MAP NPS TSP
Mil
Tonnes
Source: CRU, ANDA and Mosaic

10
Continued Positive Demand Drivers
0.40
0.50
0.60
0.70
0.80
0.90
1.00
10 11 12 13 14 15 16 17
Plant Nutrient Affordability
Plant Nutrient Price Index / Crop Price Index
Affordability Metric Average 2010-15
Source: WeeklyPrice Publications, CME, USDA, AAPFCO, Mosaic
8.00
9.00
10.00
11.00
12.00
13.00
S O N D J F M A M J J A
US$ BU
New Crop Soybean Price
Daily Close of the Nov Contract (Sep 1 - Aug 31)
2017 2016 2014
Source: CME
1,900
2,100
2,300
2,500
2,700
2,900
3,100
3,300
3,500
Sep-15 Jan-16 May-16 Sep-16 Jan-17
Rngts
Tonne
Source: CRB
Malaysian Palm Oil Prices
Daily Close of Nearby Option
55.0
57.5
60.0
62.5
65.0
67.5
70.0
72.5
75.0
77.5
80.0
Sep-15 Jan-16 May-16 Sep-16 Jan-17
US$
CWT
Source: NYMEX
Cotton Prices
Daily Close of Nearby Option

11
Lower Chinese Exports
4
5
6
7
8
9
10
11
12
2010 2011 2012 2013 2014 2015 2016 2017F
Mil Tonnes
Source: China Customs and Mosaic
China DAP/MAP/TSP Exports
Actual 2017 Forecast Range
4
5
6
7
8
9
10
11
12
2013 2014 2015 2016 2017
Mil Tonnes
Source: China Customs
China DAP/MAP/TSP Exports
12-Month Rolling Total

12
Will the Cost Run-Up Run Out of Gas?
50
75
100
125
150
175
200
300
400
500
600
700
Jan-13 Jan-14 Jan-15 Jan-16 Jan-17
Sulphur
$ / LT
Ammonia
$ / Tonne
Weekly Raw Materials Prices
c&f Tampa
Ammonia Sulphur
Source: Argus FMB

13
2017 Outlook Topic of March Issue of Market Mosaic
Available at:
www.mosaicco.com/resources/market_mosaic.htm

14
A Look Beyond 2017

15
Five-Year Outlook – Key Features
▪ A positive demand outlook
− Underpinned by constructive long term agricultural fundamentals
− Global phosphate demand forecast to increase ~2% per year
− More consistent and broad-based growth expected
▪ Few new projects expected after 2018
− Little in the pipeline outside Morocco and Saudi Arabia
− Next wave of OCP and Ma’aden capacity on line after 2021
▪ A restructuring of the Chinese industry
− Central planners likely asking:
Why are we depleting our non-renewable phosphate rock resources, upgrading them into final products at a
loss, disrupting our environment in the process, and supplying India and others with cheap phosphate?
− Production and exports expected to stabilize at lower levels
− A focus on profitability and sustainability

16
Positive Demand Outlook
40
45
50
55
60
65
70
75
05 06 07 08 09 10 11 12 13 14 15 16E 17F 21F
Global Phosphate Shipments
Actual High Forecast Low Forecast Likely Forecast CRU - Jan 2017
MMT DAP/MAP/NPS/TSP
Source: Mosaic and CRU Phosphate Outlook January 2017
Global Phosphate Shipments
Mosaic Scenario CRU
Mil Tonnes DAP/MAP/NPS/TSP Low Likely High Jan 2017
2005 Shipments na 47.5 na 47.6
2011 Shipments na 64.4 na 64.0
Change 2005-10 na 16.8 na 16.5
CAGR 2005-10 na 5.2% na 5.1%
2016 Shipment Estimate na 66.1 na 65.0
Change 2011-16 na 1.7 na 1.0
CAGR 2011-16 na 0.5% na 0.3%
2021 Forecast 71.5 73.1 74.5 69.5
Change 2016-21 5.4 7.0 8.4 4.4
CAGR 2016-21 1.6% 2.0% 2.4% 1.3%
Source: Mosaic and CRU Phosphate Outlook January 2017

17
Demand Forecasts by Region
-2.4%
-3.7%
-2.6%
4.6%
1.4%
2.7%
4.5%
5.4%
5.4%
-3 -2 -1 0 1 2 3
China
India
Africa
Mideast/Other
North America
Europe/FSU
Other Latin Am
Brazil
Other Asia + Oceania
MMT DAP/MAP/TSP
(Percentage is CAGR)
Change in Phosphate Shipments 2016 vs. 2011
Source: Mosaic and CRU Phosphate Outlook January 2017
-0.6%
1.3%
0.3%
1.2%
0.8%
6.7%
3.1%
4.3%
3.7%
-3.0 -2.0 -1.0 0.0 1.0 2.0 3.0
Mideast/Other
Other Latin Am
China
Europe/FSU
North America
Africa
Other Asia + Oceania
Brazil
India
MMT DAP/MAP/TSP
(Percentage is CAGR)
Change in Phosphate Shipments 2021F vs. 2016
Source: Mosaic and CRU Phosphate Outlook January 2017
-2.4%
-3.7%
-2.6%
4.6%
1.4%
2.7%
4.5%
5.4%
5.4%
-2 -1 0 1 2 3 4 5 6 7 8 9 10
Mideast/Other
Other Asia + Oceania
Europe/FSU
Other Latin Am
Africa
North America
Brazil
India
China
MMT DAP/MAP/TSP
(Percentage is CAGR)
Change in Phosphate Shipments 2011 vs. 2005
Source: Mosaic and CRU Phosphate Outlook January 2017

18
Supply/Demand Balance
-3.0
-2.0
-1.0
0.0
1.0
2.0
3.0
4.0
5.0
6.0
7.0
16 17 18 19 20 21
Mil Tonnes
DAP/MAP/NPS/TSP
Source: CRU and Mosaic
Cumulative Change in Capacity by Region
2016-21
China Rest of World Morocco Saudi Arabia
-2.0
-1.0
0.0
1.0
2.0
3.0
4.0
5.0
6.0
7.0
8.0
9.0
16 17 18 19 20 21
Mil Tonnes
DAP/MAP/NPS/TSP
Source: CRU and Mosaic
Cumulative Change in Capacity vs. Demand
2016-21
Capacity Demand - Mosaic Demand - CRU

19
The Evolution of the North American Industry

20
The Evolution of the North American Industry
▪ A smaller but still large industry today
▪ A less important role in the growing global market
▪ A regional focus on the freight-advantaged Americas
▪ A product focus on innovative premium products
▪ Continuous efforts to enhance productivity/efficiency

21
A Smaller North American Industry
15%
20%
25%
30%
35%
40%
45%
50%
0
2
4
6
8
10
12
14
85 90 95 00 05 10 15
Pct of Total
Mil Tonnes
P2O5
Source: CRU
North America Phosphoric Acid Production
Production Share of World Total
0%
10%
20%
30%
40%
50%
60%
70%
0
2
4
6
8
10
12
14
85 90 95 00 05 10 15
Pct of Total
Mil Tonnes
DAP/MAP/TSP
Source: CRU
North America Phosphate Exports
Exports Share of World Total
0
5
10
15
20
25
30
35
40
45
1995 2000 2005 2010 2015
Mil Tonnes
P2O5
Source: CRU
Phosphoric Acid Production
Rest of World China

22
The Evolution of the North American Industry
Acid Capacity (mmt P2O5)
Percent NA Capacity
12
20
12.3
4
12
8.8
5.4
61%
1.9
22%
0.8
9%
0.7
8%
18
21
10.9
Firms:
Facilities:
Acid Capacity (mmt P2O5):
Source: IFA, IFDC and Mosaic

23
What’s New at Mosaic

24
A Long List of Exciting Initiatives
▪ Completed the integration of the CF phosphate operations
▪ Enhancing efficiencies and optimizing operations
▪ Obtaining permits for our next generation rock mines
▪ Harvesting value from our ADM Brazil acquisition
▪ Ramping up MicroEssentials® capacity at New Wales
▪ Commissioned our new sulphur melter at New Wales in 2016
▪ Awaiting the launch of a tug/barge to transport ammonia from CF
Industries Louisiana facilities to our Florida phosphate operations
▪ Working to close the Vale Fertilizantes acquisition
▪ Planning to capture synergies from the Vale acquisition
Walt Precourt
Senior Vice President – Phosphate Operations
CRU Phosphates 2017
Tampa, FL
March 14, 2017
The Global Outlook:
A View From Florida
Thank You!
