Attached files
| file | filename |
|---|---|
| EX-99.1 - EX-99.1 - Hawaiian Telcom Holdco, Inc. | hcom-20161231ex991142f2d.htm |
| EX-32.2 - EX-32.2 - Hawaiian Telcom Holdco, Inc. | hcom-20161231ex3225d754d.htm |
| EX-32.1 - EX-32.1 - Hawaiian Telcom Holdco, Inc. | hcom-20161231ex32157ddf9.htm |
| EX-31.2 - EX-31.2 - Hawaiian Telcom Holdco, Inc. | hcom-20161231ex3124b676d.htm |
| EX-31.1 - EX-31.1 - Hawaiian Telcom Holdco, Inc. | hcom-20161231ex311a7e673.htm |
| EX-23.1 - EX-23.1 - Hawaiian Telcom Holdco, Inc. | hcom-20161231ex2315c430c.htm |
| EX-21.1 - EX-21.1 - Hawaiian Telcom Holdco, Inc. | hcom-20161231ex211fec696.htm |
UNITED STATES
SECURITIES AND EXCHANGE COMMISSION
Washington, D.C. 20549
FORM 10‑K
|
(Mark one) |
|
|
☒ |
ANNUAL REPORT PURSUANT TO SECTIONS 13 OR 15(d) OF THE SECURITIES EXCHANGE ACT OF 1934 |
|
For the fiscal year ended December 31, 2016 |
|
|
OR |
|
|
☐ |
TRANSITION REPORT PURSUANT TO SECTION 13 OR 15(d) OF THE SECURITIES EXCHANGE ACT OF 1934 |
Commission File No. 001‑34686
HAWAIIAN TELCOM HOLDCO, INC.
(Exact name of registrant as specified in its charter)
|
Delaware |
16‑1710376 |
1177 Bishop Street
Honolulu, Hawaii 96813
(Address of principal executive offices) (Zip Code)
808‑546‑4511
(Registrant’s telephone number, including area code)
Securities to be registered pursuant to Section 12(b) of the Act: None
Securities to be registered pursuant to Section 12(g) of the Act:
|
Common Stock, par value $0.01 per share |
|
The NASDAQ Stock Market, LLC |
|
(Title of class) |
|
(Name of each exchange on which registered) |
Indicate by check mark if the registrant is a well‑known seasoned issuer as defined in Rule 405 of the Securities Act. Yes ☐ No ☒
Indicate by check mark if the registrant is not required to file reports pursuant to Section 13 or Section 15(d) of the Act. Yes ☐ No ☒
Indicate by check mark whether the registrant (1) has filed all reports required to be filed by Section 13 or 15 (d) of the Securities Exchange Act of 1934 during the preceding 12 months (or for such shorter period that the registrant was required to file such reports), and (2) has been subject to such filing requirements for the past 90 days. Yes ☒ No ☐
Indicate by check mark whether the registrant has submitted electronically and posted on its corporate website, if any, every Interactive Data File required to be submitted and posted pursuant to Rule 405 of Regulation S‑T (§ 232.405 of this chapter) during the preceding 12 months (or for such shorter period that the registrant was required to submit and post such files). Yes ☒ No ☐
Indicate by check mark if disclosure of delinquent filers pursuant to Item 405 of Regulation S‑K is not contained herein, and will not be contained, to the best of registrant’s knowledge, in definitive proxy or information statements incorporated by reference in Part III of this Form 10‑K or any amendment to this Form 10‑K. ☐
Indicate by check mark whether the registrant is a large accelerated filer, an accelerated filer, a non‑accelerated filer or a smaller reporting company. See the definitions of “large accelerated filer,” “accelerated filer” and “smaller reporting company” in Rule 12b‑2 of the Exchange Act.
|
Large Accelerated Filer ☐ |
Accelerated Filer ☒ |
Non‑Accelerated Filer ☐ |
Smaller Reporting Company ☐ |
Indicate by check mark whether the registrant is a shell company (as defined in Rule 12b‑2 of the Exchange Act). Yes ☐ No ☒
The aggregate market value of the registrant’s common stock held by non‑affiliates as of June 30, 2016 was $123,893,946.
Indicate by check mark whether the registrant has filed all documents and reports required to be filed by Section 12, 13 or 15(d) of the Securities Exchange Act of 1934 subsequent to the distribution of securities under a plan confirmed by a court. Yes ☒ No ☐
As of March 1, 2017, 11,513,279 shares of the registrant’s common stock, $0.01 par value, were outstanding.
DOCUMENTS INCORPORATED BY REFERENCE
Portions of registrant’s Proxy Statement (Part III of Form 10‑K)
HAWAIIAN TELCOM HOLDCO, INC.
i
GLOSSARY OF TERMS
Defined below are certain terms used in this report:
|
Term |
|
Definition |
|
AAIS |
|
Assignment, activation and inventory system |
|
ADM |
|
Add‑drop multiplexer |
|
AIN |
|
Advanced intelligent network |
|
ATM |
|
Asynchronous transfer mode |
|
AWAS |
|
Automated workforce administration system |
|
BAiO |
|
Business All‑in‑One |
|
CAF |
|
Connect America Fund |
|
CLEC |
|
Competitive local exchange carrier |
|
Communications Act |
|
Communications Act of 1934, as amended |
|
CPE |
|
Customer premises equipment |
|
CSRIC |
|
Reliability and Interoperability Council |
|
DEU/DEUCE |
|
Data exchange utility and connection engine systems |
|
FCC |
|
Federal Communications Commission |
|
FTTN |
|
Fiber‑to‑the‑node |
|
FTTP |
|
Fiber‑to‑the‑premise |
|
GPON |
|
Gigabit Passive Optical Network |
|
HPUC |
|
Hawaii Public Utilities Commission |
|
HSI |
|
High‑speed Internet |
|
IBEW |
|
International Brotherhood of Electrical Workers Local 1357 |
|
ILEC |
|
Incumbent local exchange carriers |
|
IP‑VPN |
|
Internet protocol Virtual Private Network |
|
IP |
|
Internet protocol |
|
ISDN |
|
Integrated service digital network |
|
ISP |
|
Internet Service Providers |
|
LATA |
|
Local Access Transport Area |
|
LQP |
|
Loop qualification system |
|
MDU |
|
Multi‑dwelling units |
|
MPLS |
|
Multiprotocol Label Switching |
|
MVNO |
|
Mobile virtual network operator |
|
NIST |
|
National Institute of Standards and Technology |
|
NOC |
|
Network Operations Center |
|
Oceanic |
|
Oceanic Time Warner |
|
PBRSU |
|
Performance‑based restricted stock units |
|
PBX |
|
Private‑branch exchange |
|
QoS |
|
Quality of service |
|
RBOC |
|
Regional Bell operating companies |
|
RSN |
|
Regional Sports Network |
|
ROADM |
|
Reconfigurable optical add‑drop multiplexer |
|
OAM |
|
Operations, administration and maintenance |
|
SDH |
|
Synchronous digital hierarchy |
|
SLC |
|
Subscriber line charges |
|
SONET |
|
Synchronous Optical Network |
|
STP |
|
Signal transfer points |
|
SystemMetrics |
|
SystemMetrics Corporation |
|
TDM |
|
Time Division Multiplexing |
|
UNE |
|
Unbundled network element |
|
UNE‑P |
|
Unbundled network element platform |
|
VoIP |
|
Voice over Internet Protocol |
|
VDSL2 |
|
Very High Bit Rate Digital Subscriber Line Generation 2 |
|
Wavecom |
|
Wavecom Solutions Corporation |
|
WATS |
|
Wide Area Telephone Service |
ii
Forward‑Looking Statements
This Annual Report on Form 10‑K contains certain statements that constitute forward‑looking statements within the meaning of the Private Securities Litigation Reform Act of 1995. In particular, any statement, projection or estimate that includes or references the words “believes”, “anticipates”, “intends”, “expects”, or any similar expression falls within the safe harbor of forward‑looking statements contained in the Reform Act. These forward‑looking statements are subject to certain risks and uncertainties that could cause actual results to differ materially from our historical experience and our present expectations or projections. Forward‑ looking statements by us are based on estimates, projections, beliefs, and assumptions of management and are not guarantees of future performance. Such forward‑looking statements may be contained in this Form 10‑K under “Item 1A—Risk Factors” and “Item 7—Management’s Discussion and Analysis of Financial Condition and Results of Operations” and elsewhere. In light of these risks, uncertainties and assumptions, you should not place undue reliance on any forward‑looking statements. Additional risks that we may currently deem immaterial or that are not currently known to us could also cause the forward‑looking events discussed in this Form 10‑K not to occur as described. Except as otherwise required by applicable securities laws, we undertake no obligation to publicly update or revise any forward‑looking statements, whether as a result of new information, future events, changed circumstances or any other reason after the date of this Form 10‑K.
Risks, uncertainties and other important factors that could cause actual results to differ materially from those described in forward‑looking statements and from historical results include, but are not limited to, the following:
|
· |
failures in our critical back office systems and IT infrastructure; |
|
· |
breach of our data security systems; |
|
· |
increases in the amount of capital expenditures required to execute our business plan; |
|
· |
the loss of certain outsourcing agreements, or the failure of any third party to perform under these agreements; |
|
· |
adverse changes to applicable laws and regulations; |
|
· |
the failure to adequately adapt to technological changes in the telecommunications industry, including changes in consumer technology preferences; |
|
· |
adverse economic conditions in Hawaii; |
|
· |
the availability of lump sum distributions under our union pension plan; |
|
· |
limitations on the ability to utilize net operating losses due to an ownership change under Internal Revenue Code Section 382; |
|
· |
the inability to service our indebtedness; |
|
· |
limitations imposed on our business from restrictive covenants in our credit agreements; |
|
· |
severe weather conditions and natural disasters; |
|
· |
network disruptions or other delays or interruptions of service; and |
|
· |
failure to renegotiate programming contracts with television content providers. |
iii
Business Overview
Hawaiian Telcom Holdco, Inc. (the Company) is the largest full service provider of communications services and products in Hawaii. We operate two primary business segments:
Telecommunications. This segment provides local telephone service including voice and data transport, enhanced custom calling features, network access, directory assistance and private lines. In addition, the Telecommunications segment provides high speed Internet, long distance services, next generation television service, next generation Internet protocol (IP) based network services, customer premises equipment, data solutions, managed services, billing and collection, wireless services, and pay telephone services. Our services are offered on all of Hawaii’s major islands, except for our next generation television service, which currently is available only on the island of Oahu. As of December 31, 2016, our telecommunications operations served approximately 296,000 voice access lines, 19,000 business Voice over Internet Protocol (VoIP) lines, 111,000 high-speed Internet lines, and 42,000 video subscribers.
Data Center Services. This segment consists of data center services including colocation and virtual private cloud.
See “—Segments and Sources of Revenue” below and “Segment Information” in the notes to the financial statements for information regarding revenues and total assets for each business segment.
History and Organizational Structure
General
The Company was incorporated in Delaware in 2004. Originally incorporated in Hawaii in 1883 as Mutual Telephone Company, our Hawaiian Telcom, Inc. subsidiary has a strong heritage of over 133 years as Hawaii’s communications carrier. From 1967 to May 1, 2005, we operated as a division of Verizon Communications Inc. (Verizon) or its predecessors. On May 2, 2005, the Verizon businesses conducted in Hawaii were reorganized and consolidated (2005 Reorganization) into Hawaiian Telcom Communications, Inc., a Delaware corporation and wholly owned subsidiary of the Company. As a result of the 2005 Reorganization, we became a stand-alone provider of communications services, operating as Hawaiian Telcom, Inc. and Hawaiian Telcom Services Company, Inc., both wholly owned subsidiaries of Hawaiian Telcom Communications, Inc.
On December 1, 2008, the Company, Hawaiian Telcom Communications, Inc., Hawaiian Telcom, Inc., Hawaiian Telcom Services Company, Inc. and certain other affiliates (collectively, the Debtors) filed voluntary petitions for relief under chapter 11 of the U.S. Bankruptcy Code in order to facilitate a balance sheet restructuring. The Debtors’ chapter 11 Plan of Reorganization became effective, and the Company and other Debtors emerged from chapter 11, on October 28, 2010.
Hawaiian Telcom, Inc., a Hawaii corporation, is the incumbent local exchange carrier (“ILEC”) in Hawaii and operates our regulated local exchange carrier business. Hawaiian Telcom Services Company, Inc., a Delaware corporation, operates other businesses including Internet, television, advanced communications and network services, managed services, data center services including colocation and virtual private cloud, cloud‑based services, long distance and wireless businesses. SystemMetrics Corporation, a wholly‑owned subsidiary of Hawaiian Telcom Services Company, Inc. and a Hawaii corporation, provides data center services including colocation and virtual private cloud. Wavecom Solutions Corporation, a wholly‑owned subsidiary of Hawaiian Telcom, Inc. and a Hawaii corporation, provides voice, data and converged services.
1
Industry Overview
The telecommunications industry is comprised of companies involved in the transmission of voice, data and video communications over various media and through various technologies. There are two predominant types of local telephone service providers, or carriers, in the telecommunications industry: incumbent local exchange carriers (ILECs) and competitive local exchange carriers (CLECs). An ILEC refers to the regional Bell operating companies (RBOCs), which were the local telephone companies created from the breakup of AT&T in 1984, as well as small and midsize independent telephone companies, such as Hawaiian Telcom, Inc., Cincinnati Bell Inc. and Consolidated Communications, Inc., which sell local telephone service. These ILECs were the traditional monopoly providers of local telephone service prior to the passage of the Telecommunications Act of 1996. In contrast, a CLEC is a competitor to local telephone companies that has been granted permission by a state regulatory commission to offer local telephone service in an area already served by an ILEC.
Over the last decade, the U.S. telecommunications industry has undergone significant structural changes as many of the largest service providers have achieved growth through acquisitions and mergers, while others have restructured or entered bankruptcy to obtain protection from creditors. In addition, the Telecommunications industry continues to see changes in consumer behavior as products and services continue to evolve. Despite these changes, the demand for telecommunications services as a whole, particularly data services, has remained strong, and telecommunications companies increasingly bundle services and provide integrated offerings for customers. Hawaii’s telecommunications industry remains active, and demand for telecommunications services overall remains strong, due in part to the State’s geographic isolation. Hawaii is connected to the mainland United States and Asia via cable and several satellite networks.
Our Business Strategy
Our primary objective is to become the number one service provider of innovative “Always OnSM” communications, information and entertainment solutions to the people and businesses of Hawaii. The key elements of our business strategy are to grow our business with a focus on delivering superior service to our customers, which includes the following:
|
· |
Leverage our broadband network. Our broadband network is the foundation for our services to our customers, and we continue to expand its footprint and invest in advanced technology platforms that support advanced communications and network services. We completed the build‑out of our Multiprotocol Label Switching (MPLS) core network statewide and continue to deploy both fiber‑to‑the‑node (FTTN) and fiber‑to‑the‑premise (FTTP) access technologies to enhance and expand the speed and reach of our broadband network. We are deploying high‑speed technologies such as Very High Bit Rate Digital Subscriber Line Generation 2 (VDSL2), Gigabit Passive Optical Network (GPON), and Metro Ethernet to deliver new broadband services such as our next‑generation television to consumers, Voice over Internet Protocol (VoIP), Internet protocol Virtual Private Network (IP‑VPN), managed services, data center services, including colocation and virtual private cloud, and cloud‑based services to businesses. In both customer segments, we continue to enhance our services by adding new service options, features and functionality. |
|
· |
Drive a customer‑ and sales‑focused organization. Our customer operations team allows us to more effectively focus on customer satisfaction and successful delivery of our services, with the ultimate goal of delivering a consistent and comprehensive customer experience. |
|
· |
Deliver new and innovative products and services to attract and retain customers. We have successfully added, and expect to continue to add, new products and services to our customer offerings. We offer a full range of services, including voice, Internet, television, data, customer premises equipment (CPE), wireless, advanced communications and network services, managed services, data center services including colocation and virtual private cloud, and cloud based services supported by the reach and reliability of our network and Hawaii’s only 24x7 state of the art network operations center. We believe our suite of next-generation data and IP based services, such as our Fiber-to-the Business Internet, business VoIP, IP VPN |
2
services, and cloud applications better positions us to compete for new customers and drive winback opportunities while also allowing us to improve retention of existing customers by migrating them from legacy services. Our next generation television service, Hawaiian Telcom TV, is an important growth component for our consumer products portfolio and critical to our strategy to win the home and capture a share of the significant television and entertainment market opportunity. |
|
· |
Improve operating profitability and capital efficiencies. We strive to maintain a disciplined approach to managing operating expenses and capital spending. Our focus on driving operational improvements in our business has resulted in cost savings, and we continue to identify initiatives that we believe will further improve our cost structure. In addition, we continue to review and renegotiate contracts with key IT and outsource suppliers, which has led to additional cost savings. We manage our capital expenditures to optimize returns through disciplined planning and targeted investment of capital. Our strategy is to continue making strategic investments in our business in order to position the Company for long‑term growth. |
In furtherance of the Company’s growth strategy, we continue to make important investments that further our business objectives:
|
· |
In September 2013, we completed the acquisition of SystemMetrics Corporation (SystemMetrics), a leading provider of data center services in the State of Hawaii. The acquisition increased the scale and scope of our existing data center operations by adding a state‑of‑the art facility in Honolulu with 6,500 square feet of data center capacity and room for expansion. SystemMetrics complements our existing portfolio of business service offerings and enables us to further diversify our revenue base. |
|
· |
In August 2014, the Company joined a consortium of national and international companies to build and operate the Southeast Asia to United States (SEA-US) trans Pacific submarine cable system connecting Indonesia, the Philippines, Guam, Hawaii and the mainland United States. The cost to construct the system is expected to be approximately $235 million. The Company will pay $25 million over the multi-year construction period, with the majority to be paid at periodic milestones in 2016 and 2017, for a fractional ownership in the system, of which $16.6 million has been incurred through December 31, 2016. As part of this project, the Company has agreed to construct a cable landing station in Makaha, Hawaii, and to provide cable landing services to SEA-US. Management expects the system to be completed in the second half of 2017, and will provide an initial 20 Tbps of capacity using state of the art 100Gbps technology to accommodate the statewide increase in data consumption. |
Our Competitive Strengths
We believe the following are among our core competitive strengths and enable us to differentiate ourselves in the marketplace and help us successfully execute our business strategy:
|
· |
Strong Local Presence. We have been serving Hawaii’s communities for over 132 years and employ approximately 1,300 employees statewide. Each year, we donate to various local charities and our employees volunteer thousands of hours of community service. Moreover, we believe we are able to understand our customers’ needs because our employees share many of those same needs. We also share Hawaii’s history, heritage, and strive to be an example of Hawaii’s unique values. Because we are locally managed, we believe we are more responsive to Hawaii’s consumers and businesses. |
|
· |
Growth‑Oriented Product Portfolio. We are the only communications service provider in our market that can provide the same broad array of services to both consumers and business customers that includes voice, Internet, data, CPE, wireless, advanced communications and IP‑based network services, managed services, data center services including colocation and virtual private cloud, and cloud‑based services. Our expanding service suite, including high‑quality enhanced data networking services such as our business VoIP and IP‑VPN services, our managed services, and our cloud applications are targeted at the key growth areas in our marketplace. Our next‑generation television service, employing Ericsson Mediaroom™, is |
3
targeted at capturing a share of the significant video and entertainment market opportunity and also promotes pull-through sales of Internet service. |
|
· |
Advanced Network Infrastructure. We own one of the State’s most extensive and reliable communications networks, including one of the largest fiber optic cable networks in Hawaii. Our statewide MPLS backbone is one of the largest IP networks in Hawaii and allows us to deliver advanced IP‑based services to over 99% of the State’s population. Our network is supported by Hawaii’s only 24x7 state‑of‑the‑art network operations center. We continue to expand our fiber network and to enhance and expand the speed and reach of our broadband network, which we believe will enable us to offer new products and services that will generate growth in our business and allow us to compete more effectively in the marketplace. |
|
· |
Strong Management Team. We have assembled an experienced management team that we believe is well‑qualified to lead our Company and execute our strategy. Our management team has significant operational experience in the telecommunications industry combined with extensive knowledge of our local market, which we believe will continue to be a critical driver of our success going forward. |
Our Products and Services
Telecommunications
We generally classify our operations and related products and services into three core customer channels: Business, Consumer, and Wholesale. Presented below is an overview of the products and services we offer in each customer channel.
Business Channel
Data Services
We provide a broad portfolio of data services, which we believe are a key growth area driven by demand for increasing bandwidth and more advanced data solutions from business customers. We offer a range of broadband services including High-Speed Internet access, an asymmetrical broadband service geared toward small and medium-sized business customers, with speeds up to 1 Gigabits per second (Gbps) depending on the customer’s location, and Dedicated Internet Access (DIA), a symmetrical Internet access delivered over Ethernet with speeds up to 10 Gbps.
The role of business communication providers is evolving. Consistent with this, we have expanded into application centric, advanced communications and network services. Our services include Routed Network Service, a high performance IP virtual private networking service for business customers; Enhanced Internet Protocol Data Service, a multipoint switched Ethernet service; and Hosted PBX, a business VoIP service that provides businesses with a complete, converged communication solution in a hosted package.
In addition to advanced communications and network services, we continue to provide special access tariff services such as frame relay, a shared wide area network service, and dedicated private lines. See “—Regulation” for further discussion of special access.
Voice Services
Voice services include basic local phone and long distance services for business customers. We provide basic local services generally for a fixed monthly recurring charge and can be enhanced with a variety of value added services such as call waiting, caller ID, voice messaging, three way calling, call forwarding and speed dialing. Value added services may be purchased individually or as part of a package offering for a monthly recurring charge. The rates that can be charged to customers for basic local and certain other services are regulated by the HPUC. We charge business customers higher rates to recover a portion of the costs of providing local service to residential customers, as is customary in the industry. See “—Regulation” for further discussion of regulatory matters.
4
Equipment and Managed Services
We have resale relationships and certifications with a number of branded technology vendors, which allows us to competitively sell and install a wide variety of telecommunications equipment such as key, PBX, and other hardware solutions. In addition, we provide managed services as an end to end solution that manages, monitors, and supports a business’s network, CPE, and corporate data security. As business networks become more complex, the amount of time and capital businesses must spend to support their networks increases accordingly. Our managed services enable customers to focus on their core business by leaving the day to day management of their networks to us. Our managed services product portfolio consists of managed network and security services, IT professional services, and security consulting.
Consumer Channel
Video Services
We introduced our next-generation television service on the island of Oahu in July 2011. Our Hawaiian Telcom TV service is 100% digital with hundreds of local, national, international and music channels including high-definition, premium, Pay Per View channels and Video on Demand service. During 2016, we continued to invest in our network to provide integrated digital video, high-speed Internet and voice services to new and existing customers by adding 12,000 new households enabled for our TV service (“HHE”) bringing the total number of HHE to 202,000 as of the end of 2016. The addition of new HHE in our single family home footprint is expected to subside beginning in 2017. Our IPTV service is expected to be a critical growth component for our consumer products portfolio and an anticipated anchor of our service bundling strategy. With television, we are now able to bundle digital video, high-speed Internet and voice services in certain areas of the island of Oahu.
Internet Services
We provide high-speed Internet access to our residential customers with speeds up to 1 Gbps in the FTTP footprint. For customers who order speeds of 50 Mbps or higher, we also offer Wi-Fi Plus, a premium program that provides customized solutions to maximize customers’ in-home Wi-Fi experience.
Voice Services
Consumer voice services include basic local telephone and long distance services. We provide additional value-added features such as call waiting, caller ID, voice messaging, three way calling, call forwarding and speed dialing. We also offer a variety of long distance plans, including rate plans based on minutes of use, flexible or unlimited long distance calling services. The rates that can be charged to customers for basic local and certain other services are regulated by the HPUC.
Wholesale Channel
We provide special access or network transport services to our wholesale customers, network operators and other telecommunications carriers. Special access services include IP-based private networks, Ethernet, as well as Synchronous Optical Network (SONET), and Time Division Multiplexing (TDM) transport services. See “—Regulation” for further discussion of special access. In addition, we also provide wireless backhaul, or fiber-to-the-tower connections to support the growing demand for wireless broadband.
Other
Other services include interstate and intrastate switched access for the origination, transport and termination of long distance calls (see “—Regulation” for further discussion of access charges), Connect America Fund support (see “—Regulation” for further discussion of universal service), operator services, billing and collection services and space
5
and power rents for colocation services. We also provide other services including public pay telephone services at approximately 3,100 locations throughout the State of Hawaii.
In addition, we offer wireless services pursuant to a mobile virtual network operator (MVNO) services agreement with Sprint Spectrum, L.P. (Sprint). That agreement allows us to resell Sprint wireless services, including access to Sprint’s nationwide personal communication service (PCS) wireless network to residential and business customers in Hawaii under the Hawaiian Telcom® brand name. The services agreement with Sprint was renewed in May 2015 for a 3-year term which expires in May 2018.
Data Center Services
We provide colocation and virtual private cloud data center services to our business customers. Colocation enables our customers to install and remotely operate their IT equipment. Virtual private cloud services include the use of shared virtualized computing resources and a variety of customer control features and services, including back up data storage and cloud-based network security. We also offer a complete cloud service portfolio that includes Desktop-as-a-Service product, Microsoft® Office 365 suite of cloud-based Software-as-a-Service products, along with Infrastructure-as-a-Service and Security-as-a-Service. In addition, we provide related professional services, including planning, design, implementation and support services, to enable our customers to better manage and transition between their IT solutions. We consider data center services as part of our business channel.
Markets and Customers
Telecommunications
We have been a telecommunications provider in Hawaii for more than 133 years. Our market consists of 86 central offices serving an area of approximately 6,263 square miles on the islands of Oahu, Maui, Hawaii, Kauai, Molokai and Lanai. We are the incumbent provider of local exchange services within this area and own the State’s most extensive local telecommunications network, with approximately 299,000 local access lines served as of December 31, 2016, of which 45% served residential customers, 54% served business customers, and the remaining 1% served other customers.
Our market is characterized by high population density, with approximately 70% of the state’s population concentrated on Oahu over an area of approximately 598 square miles, or approximately 1,700 persons per square mile. In addition, approximately 34% of the households in Hawaii reside in multi dwelling units (MDUs)—approximately 44% on Oahu—compared with approximately 26% in the U.S. overall. This concentration of customers and commerce provides opportunities to leverage our network infrastructure to deliver products and services efficiently and in a cost effective manner and to market and sell our services more effectively. Given Hawaii’s geographic isolation and the diversity of its population, Hawaii residents and businesses may have telecommunications needs that are different from those on the mainland United States. Furthermore, in 2015, the median household income in Hawaii was estimated to exceed the national median household income by approximately $16,000. For the foregoing reasons, our strategy is to leverage the distinctive qualities of the Hawaii market to develop customized, local marketing strategies.
Our business marketplace is dominated by several key industries. The federal government accounts for approximately 12% of gross state product. With the U.S. Pacific Command, one of the largest U.S. unified service commands, based in Hawaii, the federal government, collectively through its many departments and agencies, is one of our largest customers. Similarly, Hawaii state and local government, collectively through their many departments and agencies, constitutes a significant part of our business. The hospitality industry and financial institutions also account for a significant portion of our business. The operations of these leading sectors are communications intensive, and we believe that they are dependent on our modern, reliable services. Hawaii’s small business market (in the aggregate) is also a key driver of Hawaii’s economy—approximately 95% of the companies in Hawaii employ fewer than 50 employees, and these businesses make up a market of approximately 37,000 businesses. We believe that these business customers represent an underserved segment that we are targeting aggressively with new product and service offerings.
6
Data Center Services
We believe there is a significant growth opportunity to provide data center services, including colocation and virtual private cloud, to businesses across the State of Hawaii. There are two important trends driving the growth in the adoption of data center services—the increasing use of cloud based technologies by business customers to run their most important business functions, and the increasing demand for outsourced solutions. At present, the percentage of businesses in Hawaii that use colocation and virtual private cloud services is small compared to utilization in similarly sized mainland U.S. markets.
Competition
The telecommunications industry is highly competitive. We experience competition from many communications service providers, including the local cable operator Oceanic Time Warner (Oceanic), wireless carriers, long distance providers, competitive local exchange carriers, Internet service providers, Internet information providers, over‑the‑top hybrid voice providers, and other companies that offer network services and managed enterprise solutions. Many of these companies have a strong market presence, brand recognition, and existing customer relationships, all of which contribute to competition that may affect our future revenue growth. We expect competition to intensify as a result of the entrance of new competitors and the rapid development of new technologies, products and services.
Oceanic, a subsidiary of Time Warner Cable Inc., the second largest cable operator in the United States, is the Company’s most significant competitor. Approximately 70% of the occupied households on Oahu that subscribe to television service subscribe to Oceanic’s cable television service. Oceanic also has the majority share of the high speed Internet market in Hawaii, which it uses as a platform to offer voice services utilizing VoIP technology, and markets its cable, high speed Internet, and voice services through competitive bundled offerings. In addition, Oceanic (now marketing business products under “Spectrum Business”) has targeted communications service offerings to small and medium sized businesses. Oceanic competes aggressively with the Company on products, pricing and marketing. In 2016, Charter Communications acquired Time Warner Cable Inc. but Oceanic continued to operate business-as-usual. In April 2017, Charter is expected to introduce its products and pricing in Hawaii.
Wireless communications services continue to constitute a significant source of competition with traditional wireline phone service, especially as wireless carriers expand and improve their network coverage and continue to lower their prices. As a result, many customers have chosen to completely forego use of traditional wireline phone service and instead rely solely on wireless services. We anticipate the wireless substitution trend will continue, and could pose additional threat to our high speed Internet product, particularly if wireless service rates continue to decline and the wireless service providers are able to deliver faster data speeds. Over the top hybrid providers, such as Skype and Magic Jack, also offer the capability to provide local voice and long distance calls using an Internet equipped personal computer.
The advanced communications and network services business, as well as the managed services, data center services including colocation and virtual private cloud, and cloud based services businesses, are highly competitive due to the absence of significant barriers to entry. The emergence of non-traditional, application centric players in the market is redefining the role of service providers in these fields.
We are uniquely positioned in the State to bundle data center services with network, managed services, data communications equipment and support services for an end to end, statewide solution. Due to the high cost of commercial real estate in the State of Hawaii, there is a limited inventory of colocation data center space available for Hawaii businesses. There are numerous other providers of cloud based software, including system integrators in Hawaii and web based service providers, that offer software subscriptions and virtual machines on cloud based servers housed in data centers on the mainland U.S. and internationally. However, such out of state solutions raise concerns regarding response latency, the higher cost of private network connectivity from Hawaii and data security.
We employ a number of strategies to combat the competitive pressures we face. Our strategies are focused on preserving and generating new revenues through customer retention, upgrading and upselling services to existing customers, new customer growth, winbacks of former customers, new product and feature deployment, and by managing
7
our profitability and cash flow through targeted reductions in operating expenses and efficient deployment of capital. We believe the key to success in these strategies is the continued enhancement and expansion in the speed and reach of our broadband network, which we believe will enable us to offer new products and services that will generate growth in our business and allow us to compete more effectively in the marketplace. Another key to success is a focus on enhancing the customer experience, as we believe exceptional customer service will differentiate us from our competition. Customers expect industry leading service from their service providers. As technologies and services evolve, the requirement of the carrier to excel in this area is crucial for customer retention.
Network Architecture and Technology
Our strategy is to enhance and expand the most technologically advanced broadband communications network in the state of Hawaii and to position ourselves as a key hub for critical trans-Pacific traffic. Pursuing such a strategy has enabled us, among other things, to continue being the market leader in Hawaii for advanced communications and network services and managed and cloud-based services. In 2016, we invested approximately $79 million in our network including significant expenditures to expand the reach, capacity, and resiliency of our IP-based packet and broadband network. Significant strides were made in 2016 to add hundreds of miles to our fiber network and continuing our transformation toward an optical, IP-based broadband network. Additionally, we believe that our commitment to the SEA-US trans-pacific submarine cable system will enable us to expand data connectivity beyond Hawaii to both the Asia/Pacific and Continental U.S. locations.
MPLS and Transport Network
We believe that our statewide MPLS network is unmatched in Hawaii in reach, capacity, security, resiliency, and reliability. Consisting of two provider core routers, eight provider edge routers, and 39 service edge routers meshed throughout the island chain, we offer a wide range of Layer 2 and Layer 3 MPLS services with many advanced features, including advanced traffic engineering support of intelligent QoS (Quality of Service) Service OAM (operations, administration, and management) capabilities, multiple access technologies, standards based routing protocols, Internet access across a single physical connection, and up to 100Gb Ethernet access. Driven by continued high bandwidth demands from our high-speed Internet service, next-generation television service, wireless backhaul, and other retail and wholesale business requirements, in 2016 we continued to expand our next generation network with the introduction of a provider core architecture that simplifies our overall network while increasing scale and maintaining the level of resiliency expected by our customers. These interconnected platforms combine wave division multiplexing (WDM) transport, reconfigurable optical add-drop multiplexers (ROADM), and centralized carrier Ethernet switching in a single converged device helping us to meet the growing bandwidth needs at a more affordable price. Our current backbone infrastructure consists of two border routers with diverse trans-Pacific links to mainland carriers, along with expanded peering and content caching arrangements with global providers to reduce latency and buffering to our customers. In 2017, we plan to continue to expand bandwidth capacity in the border and core sections of our MPLS network to accommodate increased demand and utilize our trans-pacific submarine cable system for direct connections to the world’s leading internet carriers.
Our telecommunication infrastructure includes more than 16,000 sheath miles of fiber optic cable and copper wire distribution lines. Submarine and deep-sea fiber optic cables connect the islands of Kauai, Oahu, Maui, Molokai, Lanai and Hawaii, while digital microwave radios provide backup inter island connections. In addition to our owned or leased interisland cables between Oahu, Kauai, Maui, Hawaii, Molokai, and Lanai, we are connected by trans-Pacific fiber optic cables to the U.S. Mainland, which provide ring diversity to protect our communications between the islands and high-speed broadband links in and out of the State.
Voice Network
We continue to add services and features via our VoIP application servers to provide Hawaii businesses the communication tools they need to compete locally and globally. In 2016, we extended our VoIP platform with Unified Collaboration (UC) features such as Instant Messaging and Presence.
8
As of December 31, 2016, we operated 99 local base and remote switches and five tandem switches on the islands of Hawaii, Kauai, Lanai, Maui, Molokai and Oahu. All of our legacy access lines are served by digital switches provided predominantly by Nokia (formerly Alcatel-Lucent) and Genband.
Network Optimization Initiatives
To lower on going operational costs and to adjust our capacity to account for legacy revenue attrition, we optimized portions of our network. We exited two legacy Wavecom leased sites, shut down our oldest WDM network consisting of five nodes, and exited two Hawaiian Telcom radio facilities. We expect to increase the pace of optimizing our legacy network infrastructure in 2017.
Access Infrastructure
In 2016, we continued our aggressive investment to transform our access network to a high-speed, fiber-based broadband network and now have approximately 202,000 households enabled on our next generation broadband network. An additional 3,900 business addresses are also on our GPON network. GPON is a FTTP solution providing a complete fiber connection to businesses allowing for transmission speeds of over 1 Gbps. Continued deployment of FTTP solutions will serve new (greenfield) MDU, single family subdivision developments, and targeted business corridors. By laying fiber and utilizing various passive optical network components from these developments to our central offices, we can further leverage the capabilities of our MPLS backbone, provide higher bandwidth services to our customers, including our television service, and reduce maintenance costs. We also continued to expand our fiber network deeper into neighborhoods, shortening over 1,400 customer loops in 2016 to 3,000 feet or less using FTTN technology, expanded our fiber networks to approximately 491 cell sites across the state of Hawaii to provide backhaul services to our wireless carrier customers, and fine-tuned our FTTP access infrastructure to accommodate 1 Gbps download speed internet bandwidth in selected areas on all major islands. These network enhancements allowed the increased penetration and expansion of higher broadband services including our television service. In 2016, we concluded our NGN build to residential addresses on Oahu. Our 2017 plans includes further expansion of our next-generation broadband network in business areas.
In 2016, we concluded Phase I of the federal Connect America Fund (CAF) program to provide high speed data services to a total of approximately 1,800 underserved and unserved locations on the island of Hawaii. Our 2017 plans include a continuation of expansion of providing broadband to additional CAF-eligible areas as part of our Phase II federal grant.
Next-Generation Television Service
The implementation of IP-based television service is driving one of the largest network transformations in the telecommunications industry. We introduced our next-generation television service on the island of Oahu in July 2011, deploying the service to both copper-fed and fiber-fed customers and converting entire MDU complexes to our new service. Utilizing Ericsson Mediaroom™ middleware, we provide a wide range of content and multimedia services over our IP based network and provide our customers with new viewing experiences and applications, such as Whole Home DVR (Digital Video Recorder), instant channel change, brilliant picture and sound quality, and over 80 TV Everywhere apps that allow customers to view content on mobile devices. We continue to see strong demand for our television service.
Network Surveillance and Operations
Our statewide network infrastructure is monitored and managed by our Network Operations Center (NOC) located in Honolulu. The eNOC provides surveillance 24x7, 365 days-a-year, for our statewide network consisting of 86 central offices, TV head-end facility, associated interoffice facilities, microwave radio towers, and E911 facilities. Our network infrastructure for voice, data, and video is monitored proactively with state-of-the-art performance and fault management systems. Customer networks are also monitored proactively by our Managed Services team. We have a customer service center which also operates on a 24x7, 365 days-a-year basis to handle customer inquiries and repairs, and provide call completion services. All customer installations and repairs requiring a field technician are offered
9
during extended hours and coordinated by our Dispatch Center. All construction activity, for both outside and inside plant, is coordinated by our engineering operations team located at our main office on Oahu.
In addition to our network infrastructure, we operate a wide range of equipment from large boom trucks to small passenger vehicles, mobile generators, and other miscellaneous trailers, tools and test equipment. We own or lease most of our administrative and maintenance facilities, central offices, remote switching platforms, and transport and distribution network facilities. With limited exception, our assets are located exclusively in the state of Hawaii.
Information Technology and Support Systems
Our IT-related initiatives continue to be aimed at delivering advanced technologies to our customers as well as delivering a superior customer service experience. Our systems have evolved and we continue to focus our strategy towards customer-centric architectures. This approach focuses on delivering end-to-end system solutions based on customer improvement initiatives integrated into product development. The service delivery mechanisms are comprised of a mixture of commercial off-the-shelf-systems, internally designed and developed systems that are purpose built for functions unique to our product offerings, and select niche applications that offer optimal capabilities and flexibility at the network layer.
As part of our ongoing commitment to customer service, we implemented improvements in 2016 to our customer contact center systems with the implementation of a 360° customer view and a significant upgrade to the latest IVR/ACD technology. In addition, in 2016 we provided our sales force with new system capabilities in support of our next generation network for quicker quoting.
We continue to focus efforts on flow-through automation from order entry through billing, and in 2016 we continued to implement improvements which reduced manual processing of complex orders, increased productivity, and enhanced overall data quality. We made further improvements in 2016 through consolidation of order entry process and systems. We improved our field dispatch and fiber provisioning systems to increase installation efficiency of our next generation network. In 2017, we plan to continue to make improvements through version upgrades of our existing Business Order entry systems, IVR/ACD, and our provisioning and inventory management applications.
As is the case with other telecommunications companies, we are an on-going target for cyber criminals. In response, we have aggressively pursued initiatives to reduce our cyber security related risks. In 2016, we adopted the National Institute of Standards and Technology (NIST) Cybersecurity Framework to guide our current and future cybersecurity standards, policies, guidelines and practices. Using this framework, we implemented a unified security management infrastructure to consolidate our cybersecurity threat detection and intelligence in addition to deploying additional security control points to improve our security posture. We continue to provide our employees, contractors and vendors awareness including evolution of our corporate cybersecurity communications and policies. Hawaiian Telcom also provides cybersecurity awareness to our customers and the Hawaii community in general. In 2017, we continued our investment in security access, control points and systems as our Information Technology evolved in the areas of mobility and cloud services. In addition, we continue to leverage government resources at the federal, state and local levels to enhance the cybersecurity of Hawaiian Telcom’s network and services. These and other investments reflect our on-going commitment to securing our information assets and protecting sensitive data in our information systems.
Employees
As of December 31, 2016, we employed approximately 1,300 full‑time employees in Hawaii. Of the total employees, approximately 55% were represented by the International Brotherhood of Electrical Workers (IBEW) Local 1357 pursuant to a five‑year collective bargaining agreement that expires at the end of 2017. Negotiations on a new collective bargaining agreement are expected to begin on or before May 1, 2017. We believe that management currently has a constructive relationship with the represented and non‑ represented employee group.
10
Insurance
We have insurance to cover risks incurred in the ordinary course of business, including errors and omissions, cyber liability, general liability, property coverage (which includes business interruption), director and officers and employment practices liability, auto, crime, fiduciary and worker’s compensation insurance in amounts typical of similar operators in our industry and with reputable insurance providers. Central office equipment, buildings, furniture and fixtures and certain operating and other equipment are insured under a blanket property insurance program. This program provides substantial coverage against “all risks” of loss including fire, windstorm, flood, earthquake, and other perils not specifically excluded by the terms of the policies. As is typical in the telecommunications industry, we are self‑insured for damage or loss to certain of our transmission facilities, including our buried, undersea and above‑ground transmission lines. We believe that our insurance coverage is adequate; however, the incurrence of substantial uninsured liabilities due to damage or loss to such facilities could have a material adverse effect on our financial results.
Regulation
Federal and State Regulation of Telecommunications Services
Our telephone operations generally are subject to the jurisdiction of the FCC with respect to interstate services and the HPUC with respect to intrastate services. The following summary does not purport to describe all current and proposed applicable federal and state regulation.
Competition
We face increasing competition in all areas of our business. Regulatory changes brought on by the 1996 amendments to the Communications Act, regulatory and judicial actions, and the development of new technologies, products and services have created opportunities for alternative telecommunication service providers, many of which are subject to fewer regulatory constraints than our ILEC. We are unable to predict definitively the impact that the ongoing changes in the telecommunications industry will ultimately have on our business, results of operations or financial condition. The financial impact will depend on several factors, including the timing, extent and success of competition in our markets, the timing and outcome of various regulatory proceedings and any appeals, the timing, extent and success of our pursuit of new opportunities resulting from the amendments to the Communications Act and technological advances, and any changes in the state or federal laws or regulations governing communications.
Universal Service
As a provider of interstate telecommunications, we are required to contribute to federal universal service programs. The FCC adjusts the contribution amount quarterly and may increase or decrease this amount depending on demand for support and the total base of contributors. We previously drew Interstate Access Support of approximately $1.9 million annually from this funding, which was phased out in 2015 after we accepted Connect America Fund (CAF) Phase II support, as further described below.
In November 2011, the FCC released its “Connect America Fund” Order which adopted a number of proposals relating to reforming existing universal service support mechanisms. Among other things, the Order transformed the FCC’s universal service and intercarrier compensation systems into a new Connect America Fund (CAF), which funds broadband deployment in census blocks that the FCC has determined are unserved by an unsubsidized wireline competitor. For price cap carriers such as our subsidiary Hawaiian Telcom, Inc., CAF Phase II support is distributed pursuant to a forward looking cost model. In August 2015, we notified the FCC that we would accept CAF Phase II support which amounts to $4.4 million in annual funding for six years for the calendar years 2015-2020. Under the terms of CAF Phase II, we will offer broadband service at 10 Mbps downstream and 1 Mbps upstream or better to approximately 11,000 eligible locations in high-cost areas in the State of Hawaii and will provide voice and broadband services at reasonable rates. In addition, the FCC previously awarded Hawaiian Telcom, Inc. approximately $400,000 in CAF Phase I Round 1 support and approximately $1 million in CAF Phase I Round 2 support. Broadband deployment obligations for Rounds 1 and 2 have been completed. The FCC is expected to issue additional clarifications relating to CAF Phase II including the methodology for measuring broadband speeds but we do not know if this will impact our
11
ability to meet the program obligations and result in a loss of some of the support if program obligations are not fully met in a timely manner.
Government Regulation of Retail Rates
The FCC and the HPUC are the two agencies that regulate our telecommunications services. In general, the FCC regulates interstate service, and the HPUC regulates intrastate service. The HPUC has, slowly over time, reduced its rate regulation of some of our services. The HPUC classifies all regulated telecommunications services as fully competitive, partially competitive, or non‑competitive.
In 2009 and 2010, the Hawaii State Legislature required the HPUC to treat all intrastate retail telecommunications services, including intrastate toll (i.e., inter island), central exchange (Centrex), most residential and business local exchange services, integrated service digital network (ISDN) private lines and special assemblies, and directory assistance, as “fully competitive” under the HPUC’s rules with certain qualifications. HPUC approval and cost support filings are no longer required to establish or reduce rates or to bundle service offerings; however, all service offerings must be priced above the service’s long run incremental cost, and the HPUC can require cost support demonstrating compliance with its costing rules at any time. The HPUC retains the ability to suspend and investigate any offering. In 2012, the Hawaii State Legislature further leveled the regulatory playing field by providing us with pricing flexibility to increase tariffed intrastate rates for any retail telecommunications service without approval from the HPUC with the exception of basic exchange service. (i.e., single line residential and single line business services), which continue to require HPUC approval. Competitive forces, however, may cause us to be unable to raise our local rates in the future.
The classification of retail local exchange intrastate services as fully competitive and the ability to bundle the services with other fully or partially competitive services or other services that are not within the HPUC’s jurisdiction enable us to charge a discounted rate for bundled service offerings and have helped us to be more competitive.
State and Federal Regulation of Long Distance Services
We are subject to certain conditions imposed by the HPUC and the FCC on the manner in which we conduct our long distance operations. For example, we are prohibited from joint ownership of local and long‑distance telephone transmission or switching facilities. The HPUC is responsible for ensuring that our ILEC does not discriminate against other long distance providers.
Federal Requirements
As an ILEC, we are subject to federal laws governing a number of access and interconnection requirements, other competitive obligations. Among other things, an ILEC must negotiate in good faith with other carriers requesting interconnection and access to unbundled network elements (UNEs) and must offer its competitors access to UNEs, such as local loops and inter office transport, at regulated rates. The FCC also has limited our obligation to unbundle fiber facilities to multiple dwelling units, such as apartment buildings, and to homes and offices deployed in FTTC and FTTP arrangements. In addition, federal law regulates competitors’ requests to colocate facilities within our central offices and to have access to our subscriber list information in order to produce competing directories. The FCC also has imposed specific rules regarding the manner and time within which a customer’s telephone number must be ported to a competing carrier’s service, and has strict guidelines prohibiting the ILEC’s use of this information for any other purposes.
Interstate and Intrastate Access Charges
The rates that we can charge for interstate access are regulated by the FCC. The FCC has made various reforms to the existing rate structure for access charges, which, combined with greater competition, have caused the aggregate amount of access charges paid by long distance carriers to decrease over time.
Our interstate and intrastate access charge levels have been and will continue to be fundamentally affected by the FCC’s reform of intercarrier compensation, described below.
12
Federal Framework for Intercarrier Compensation
In its “Connect America Fund” Order (see “—Universal Service” above) that reformed universal service, the FCC also fundamentally restructured the regulatory regime for intercarrier compensation, which consists of state and interstate access charges and local reciprocal compensation. Among other things, this comprehensive reform unifies state and interstate intercarrier charges in certain circumstances, provides a mechanism to replace intercarrier revenues lost through rate unification, and resolves prospectively a number of outstanding disputes among carriers regarding interconnection and compensation obligations. In particular, the FCC’s order required that price-cap carriers reduce interstate and intrastate terminating switched access rates to $.0007 over a six year phase-down period. The FCC also required that most intercarrier compensation be eliminated, and that a system of “bill & keep” replace it whereby the carrier would have to seek recovery of its costs entirely from its own end users. In the interim, the FCC capped most existing intercarrier compensation rates and established a phase down of those rates over a six-year period for price cap companies such as Hawaiian Telcom, Inc. To partially offset the resulting decrease in revenues, the Commission authorized Hawaiian Telcom, Inc. to assess its end user customers a limited recovery charge that would increase over the time period during which intercarrier compensation rates decline, then would be phased out over a three-year period beginning in 2017. Finally, the FCC decided that interstate access charges should apply to VoIP or other Internet protocol based service providers on a prospective basis, subject to the same interim phase down requirements described above. The FCC found that carriers should have the opportunity to make up for any loss of revenues either through the established recovery mechanisms or through the sale of additional services, such as broadband and television services.
Hawaiian Telcom, Inc. has implemented the first five phases of the intercarrier compensation reform, offsetting a portion of the resulting revenue loss through the FCC-authorized monthly recurring access recovery charge for certain classes of customers.
In a separate proceeding, the FCC found that Internet bound traffic is not subject to reciprocal compensation under Section 251(b)(5) of the Communications Act. Instead, the FCC established a federal rate cap for this traffic, which is and will remain $0.0007 per minute until the FCC decides otherwise.
Special Access
The FCC has adopted rules for special access services that provide for pricing flexibility and ultimately the removal of services from price regulation when prescribed competitive thresholds are met. We currently have pricing flexibility for certain special access services offered throughout our territory. In the first quarter of 2015, Hawaiian Telcom, as a provider of dedicated special access services, complied with the FCC’s order for a mandatory special access data collection by filing detailed information concerning carrier services provided to enterprise and wholesale customers, including special access services. The FCC has used the data collected to evaluate competition in the market for special access services and to help the FCC decide whether to modify the special access pricing rules for price cap carriers, including whether the pricing flexibility rules should be modified or eliminated. The FCC has compiled the data and our economic consultant, hired by a consortium in which we participate with six other price cap carriers, has submitted their findings that competition in the special access market is robust and that pricing flexibility should be continued. We also filed comments in support of these findings with respect to the Hawaii market. In late 2016, the FCC Chairman circulated an Order that would have reduced BDS prices for certain legacy services over three years but this order was not voted on and it is uncertain when this proceeding will be concluded or what impact it will have on providers of dedicated special access services, especially in light of the pending change in the FCC Chairperson.
In October 2015, the FCC initiated an investigation into the terms and conditions of the special access service pricing plans of four large price cap carriers (AT&T, CenturyLink, Frontier, and Verizon). Issues designated for investigation included whether the following practices were just and reasonable practices under the Communications Act (Act): (1) percentage commitments based on a purchaser’s historical or existing levels of purchases; (2) shortfall fees; (3) upper percentage thresholds; (4) overage penalties; (5) certain long-term commitments; and (6) early-termination fees. The investigation also considered whether certain commercial agreements should be subject to the filing requirements of the Act and whether the special access pricing plans inhibit the transition from TDM-based special access to IP-based
13
services. In May 2016 the FCC ordered the affected carriers to remove such provisions from their tariffs by July 1, 2016. We do not know if and when we may be required to remove similar provisions from our tariffs.
Federal Regulatory Classification of Broadband and Internet Services
The FCC has been considering whether, and under what circumstances, services that employ Internet protocol are “telecommunications services” subject to regulations that apply to other telecommunications services, but it has not definitively ruled on the issue and instead has made a series of decisions addressing specific services and regulations.
In March 2006, a request of Verizon that sought forbearance from Title II regulation for certain advanced broadband special access services was deemed granted by operation of law. This forbearance grant was applicable to us since Hawaiian Telcom, Inc. was part of Verizon when the original Verizon petition for forbearance was filed. This action permitted us to deregulate covered advanced broadband special access services, giving us greater flexibility in our pricing and terms and conditions for eligible services. In October 2011, tw telecom of hawaii l.p. and others filed a petition requesting the FCC to reverse in part the forbearance deemed granted to Verizon. We filed comments in opposition to the petition. In November 2012, the Ad Hoc Telecommunications Users Committee and others filed a petition requesting the FCC to reverse in part the forbearance for Verizon and other grants of forbearance by the FCC related to advanced broadband special access services. There is no definite timeframe for an FCC decision on these petitions, which may be addressed as part of the special access proceeding.
In December 2010, the FCC adopted “net neutrality” rules, termed “open Internet” rules that would bar Internet service providers from blocking or slowing Web content sent to homes and businesses. The rules continue to treat broadband Internet access services under the FCC’s Title I authority, but adopted as rules the existing guidelines applicable to Internet service providers. The FCC also adopted three additional rules concerning blocking, non discrimination, and transparency. The anti-discrimination and no blocking rules were vacated by a federal court of appeals, but the public disclosure requirement remains in place.
In February 2015, the FCC reclassified broadband service, both fixed and mobile, from its longstanding status as a Title I information service to a Title II common carrier telecommunications service. While reasonable network management is permitted, the open Internet order bans blocking legal content/applications, throttling lawful traffic and paid prioritization or “fast lanes”, expands transparency rules and creates a general conduct rule to bar broadband Internet service providers from unreasonably interfering with or disadvantaging the ability of consumers and edge providers to reach and communicate with each other. Further, the FCC granted new authority to address Internet interconnection issues arising in the exchange of traffic between mass market broadband providers and other networks and services such as edge providers. While the order grants forbearance from many Title II provisions such as rate regulation or tariffs, last mile unbundling, burdensome filing requirements/accounting standards, USF contributions, and any new taxes or fees, uncertainty looms concerning continued forbearance in future years. All the new rules will be effective the first quarter of 2017, but Congress is considering adopting open Internet legislation to prevent Title II regulation of broadband services, and there are indications that the FCC may also reassess its reclassification of broadband service to a Title II common carrier telecommunications service given the pending changes at the FCC. We do not know what the final outcome of these actions will be, or how our broadband services may be affected.
Video Services Regulation
Through our Hawaiian Telcom Services Company, Inc. subsidiary, we began to provide television service on the island of Oahu in July 2011. We are regulated as a cable TV operator under federal and state law. As the non‑dominant video service provider in the state of Hawaii, we face the risk that we will be unable to obtain access to programming that we need in order to compete with Oceanic Time Warner (Oceanic), the dominant cable TV provider in the state. Some of this programming is owned by the parent company of Oceanic, which may or may not be required to provide access to us under the FCC’s program access rules.
In October 2012, the FCC issued an order lifting the program access rule ban on exclusive contracts between any cable operator and any cable‑affiliated programming vendor. It also issued a separate notice seeking comment on whether (1) to establish a rebuttable presumption that an exclusive contract for a cable‑affiliated Regional Sports
14
Network (RSN) is an unfair act; (2) it should establish a standstill provision during an RSN‑related complaint; and (3) the presumptions for RSNs should be extended to a cable‑affiliated national sports network. The FCC found a preemptive prohibition on exclusive contracts is no longer necessary and that a case‑by‑case process will remain in place to assess the impact of individual exclusive contracts. The FCC order provides a 45‑day answer period for all complaints and a six‑month deadline for it to act on a complaint alleging a denial of programming. The order also incorporates safeguards regarding RSNs, by establishing a rebuttable presumption that an exclusive contract involving a cable‑affiliated RSN has the “purpose or effect” of “significantly hindering or preventing” the complainant from providing television services, placing the burden of proof on the distributor.
In December 2012, the FCC granted a complaint filed by the Mauna Kea Broadcasting Company with the FCC seeking to place its over-the-air broadcasting station KLEI TV on both Oceanic’s and our television systems. The order required us to place KLEI TV on channel 6, which is already occupied by another programming station. Both Oceanic and Hawaiian Telcom Services Company, Inc. have filed a petition for reconsideration of this decision, which effectively stays the mandate of the order until all appeals are resolved. We cannot predict when or how the FCC will resolve this petition.
In June 2015, Charter Communications Inc. filed applications with the FCC, HPUC and Hawaii State Department of Commerce and Consumer Affairs (“DCCA”) Cable TV Division for approval of the merger of Charter Communications, Inc. ("Charter") and Time Warner Cable Inc. (TWC), which owns Oceanic, the dominant cable TV provider in Hawaii. In this same transaction, Charter is also merging with Advance/Newhouse Partnership (“Advance”), which provides video services through Bright House Networks, LLC in six states, excluding Hawaii. We filed comments with the FCC and DCCA that given Oceanic’s large market share in both the video and broadband markets, conditions specific to the Hawaii market should be placed on the acquisition so that the merger will not further stifle competition and harm the video programming and wired broadband markets in Hawaii. Final approval of the transaction with limited non-Hawaii specific conditions was granted in May 2016.
In October 2016, the FCC adopted a Broadband Privacy order that requires broadband Internet service providers (ISPs) to obtain “opt-in” permission before using or sharing information about the sites their customers visit on the Internet and their online communications but allows the ISPs to use non-sensitive information on an opt-out basis—that is, unless the consumer takes affirmative action to object. The order also imposes data security and breach notification requirements, as well as transparency requirements regarding notice of information collection, how it is used, who it is shared with, and customer options for granting or denying permission. Privacy information must be “persistently” available on the ISP’s website or mobile app.
The order abandons the three-tier usage-based privacy framework for broadband ISPs in favor of an approach that bases privacy obligations on the sensitivity of the information being used or shared and in some areas is inconsistent with the FTC’s technology-neutral privacy regime. The FCC’s order is subject to numerous petitions for reconsideration. We do not know what the final outcome will be, or how our broadband services may be affected.
Other Federal and State Regulatory Proceedings
The FCC has been exploring whether to modify its rules requiring utilities to provide telecommunications carriers and cable television companies with access to their poles, ducts, and rights of way. In April 2011, the FCC adopted new pole attachment rules that, among other things, require access to poles and conduit within a shorter period of time, and further limit make ready costs. In addition, these new rules change the rates for pole attachments by mandating that broadband attachers pay pole attachment rates that are closer to existing cable TV rates, than higher rates applicable to telecommunications carriers. These rules also for the first time allow telephone companies to demand reasonable rates from utility pole owners. These rules tend to increase the burdens and costs of pole and conduit owners such as us. The rules were upheld on appeal in February 2013. In December 2015, the FCC further revised the formula for calculating pole attachment rates for telecommunications carriers. The change will ensure that pole attachment rates for telecommunications attachers, including providers of broadband Internet access service (BIAS), approximate the rates for cable attachers. In November 2013, the FCC adopted rules to improve the reliability and resiliency of 911 communications networks nationwide by requiring that 911 service providers take reasonable measures to provide reliable 911 service, as evidenced by an annual certification. Providers can comply with this requirement by either
15
implementing certain industry backed “best practices”, or by implementing alternative measures that are reasonably sufficient to ensure reliable 911 service. As a 911 service provider, Hawaiian Telcom Inc. filed its annual certification that it was 100% compliant by October 2016 with the new 911 communications networks reliability and resiliency standards.
In August 2015, the FCC adopted rules concerning the transition from the copper-based Time Division Multiplexing (TDM) network to a fiber-based Internet Protocol (IP) network. To address backup power requirements for residential consumers of IP based voice and data services that replace the traditional telephony used to dial 911, effective February 2016, prior to switching facilities-based, fixed, residential voice services from copper, which is line-powered, to fiber, Hawaiian Telcom must educate affected residential subscribers on the impact of this switch, and offer these subscribers the option to purchase a backup power solution that provides at least eight hours of standby power during a commercial power outage. Within three years, in accordance with FCC requirements, Hawaiian Telcom is required to offer at least one option that provides a minimum of 24 hours standby power. The purpose of the requirement is to ensure consumers can make calls to 911 in the event of a power outage.
In a separate proceeding, the FCC also adopted rules governing the retirement of copper loops and the discontinuance of legacy services used as a wholesale input. Among other things, ILECs will be required to: (1) provide interconnecting entities at least six months’ advance notice of proposed copper retirement; and (2) consider the impact of their actions on the end-users of carrier-customers when discontinuing, reducing, or impairing a service used as a wholesale input. In order to receive authority to discontinue, reduce, or impair either special access services at DS1 speed and above or commercial wholesale platform service, ILECs will also be required to provide competing carriers with wholesale access to their IP services on reasonably comparable rates, terms, and conditions. The FCC’s order is subject to a court appeal and it is uncertain when this will be resolved.
In October 2015, Black Diamond Capital Management, LLC, (“Black Diamond”) which through two of its managed investment funds, collectively owns approximately 24.1% of the total outstanding common stock of Hawaiian Telcom Holdco, Inc. (Holdco), filed an application with the HPUC requesting approval to increase its ownership up to 33% of the outstanding common stock of Holdco. Under state law, no more than twenty-five percent of the issued and outstanding voting stock of a corporation organized under the laws of the State and who owns, controls, operates, or manages a public utility shall be held, by any single foreign corporation or any single nonresident alien, or held by any person, unless prior written approval is obtained from the HPUC. Hawaiian Telcom supported Black Diamond’s request based on the Standstill and Support Agreement between Black Diamond and Hawaiian Telcom. In May 2016, the HPUC granted Black Diamond approval, with conditions, to increase its ownership up to 31.5% of the outstanding common stock of the Company.
In December 2015, the FCC, responding to a forbearance petition filed by USTelecom in late 2014, released an order removing certain regulatory requirements for legacy voice services that are no longer relevant in today's marketplace. The FCC granted forbearance from FCC rules regarding the unbundling of 64 kbps voice-grade channels. The FCC's rules previously required unbundling of such channels in order to provide narrowband services over fiber where an ILEC retires a copper loop it has overbuilt with FTTP or FTTC. The FCC granted forbearance, subject to a narrow, targeted "grandfathering" condition, under which incumbents must maintain access to unbundled 64 kbps channels that are in use as of the adopted date of the order. The FCC also granted forbearance from rules requiring ILECs to provide access to newly-deployed entrance conduit in “greenfield” (new developments) situations to competitive LECs at regulated rates. The FCC, however, denied forbearance for “brownfield” situations (existing developments) because that concluded that ILECs have a "pre-existing advantage" in brownfield deployments that merited different treatment. The removal of these requirements helps to level the playing field in the increasingly competitive telecommunications market by relieving us of some of the outdated obligations to provide competitive access.
Environmental, Health and Safety Regulations
We are subject to various environmental, health and safety laws and regulations that govern our operations and may adversely affect our costs. Some of our properties use, or may have used in the past, on‑site facilities or underground storage tanks for the storage of hazardous materials that could create the potential for the release of
16
hazardous substances or contamination of the environment. We cannot predict with any certainty our future capital expenditure requirements for environmental regulatory compliance, although we have not currently identified any of our facilities as requiring material expenditures for environmental remediation or to achieve compliance with environmental regulations.
Available Information
We make available, through the Investor Relations link on our website at www.hawaiiantel.com, under “SEC Filings,” our annual reports on Form 10‑K, quarterly reports on Form 10‑Q, current reports on Form 8‑K, and amendments to those reports, free of charge as soon as reasonably practicable after we electronically file or furnish them to the U.S. Securities and Exchange Commission. The charters for the committees of our Board of Directors (Audit, Compensation, Executive, and Nominating and Governance Committees), as well as our Code of Business Conduct and any amendments and waivers thereto, also can be found on the Investor Relations site, under “Corporate Governance.” The contents of our website are not incorporated into this Annual Report on Form 10‑K.
You should carefully consider the risks described below as well as the other information contained in this Form 10‑K. Any of the following risks could materially adversely affect our business, financial condition or results of operations.
Risks Relating to our Business
Our business faces a variety of financial, operating and market risks, including the following:
The telecommunications industry is increasingly competitive, and we may have difficulty competing effectively.
All sectors of the telecommunications industry are competitive. Competition in the markets in which we operate could, among other things:
|
· |
reduce our customer base; |
|
· |
require us to lower prices charged to customers in order to compete; or |
|
· |
require us to increase marketing expenditures and the use of discounting and promotional campaigns. |
Any of these events could have a material adverse effect on our business and financial results.
Wireline Services. As the ILEC, we face competition from resellers, local providers who lease UNEs from us, from facilities‑based providers of local telephone services, and from providers of VoIP services.
We have historically faced access line losses as a result of competition and substitution of traditional wireline services with wireless services. Access line losses have been faced by the industry as a whole, and we cannot assure you that access line losses will not continue in the future. In particular, the increasing penetration of high‑speed Internet and VoIP could lead to further primary and secondary access line losses.
Interconnection duties are governed, in part, by telecommunications rules and regulations related to the UNEs that must be provided. These rules and regulations remain subject to ongoing modifications. Our business is subject to extensive governmental regulation, and applicable legislation and regulations and changes to them could adversely affect our business. However, we received some regulatory relief in 2009 when the Hawaii State Legislature passed Act 180, which classified retail local exchange intrastate services as fully competitive. While HPUC approval and cost support filings are no longer required to establish or modify rates or to bundle service offerings, HPUC approval is required to raise the rate that existed for the retail service in the tariff at the time of implementation of Act 180. In addition, while
17
cellular wireless services initially complemented traditional local exchange and long distance services, existing and emerging wireless and IP technologies are increasingly competitive with local exchange and, particularly, long distance services in some or all of our service areas.
Internet Services. We expect that the Internet access services business will continue to be highly competitive due to the absence of significant barriers to entry. We currently compete with a number of established online services companies, inter‑exchange carriers and cable companies. Competition is particularly intense for broadband services.
Managed Services. We face numerous competitors that vary based on the type of managed services being offered. Other network service providers provide some form of managed network service monitoring capability. Numerous voice and data equipment vendors provide management of the installed equipment either at an individual location or across multiple networked locations. Competitive managed IP and network security services are offered by various firms that specialize in this area.
Data Center and Cloud‑Based Services. There currently is a limited inventory of colocation data center space available in Hawaii. However, there are numerous other providers of cloud‑based software, including system integrators in Hawaii and web‑based service providers, that offer software subscriptions and virtual machines on cloud‑based servers housed in data centers on the U.S. mainland and internationally.
Advanced Communications and Network Services. These advanced services businesses are highly competitive. Many non‑traditional players have emerged in the business communications market, attracted by the absence of significant barriers to entry. Many of these non‑traditional players are capable of focusing on highly specialized areas of the market.
Next‑Generation Television Service. We launched our television service on the island of Oahu in July 2011. The market for television services in Hawaii is dominated by Oceanic. On the island of Oahu, approximately 70% of occupied households that subscribe to television service subscribe to Oceanic’s cable service. There is no assurance we will be able to compete successfully against Oceanic. In particular, the costs to acquire programming is a significant and increasing cost, and there is no assurance our content acquisition costs will be in line with Oceanic’s such that we can remain competitive. Direct broadcast satellite companies currently are not significant competitors, but this could change in the future.
Wireless Services. We provide wireless telecommunications services by use of a mobile virtual network operator (MVNO) model in which we resell another carrier’s facilities‑based wireless services under the Hawaiian Telcom® brand name. The market in Hawaii for wireless telecommunications services is subject to intense competition. In addition, our wireless business may be less profitable than the wireless businesses of other telecommunications companies due to our use of a MVNO model.
We have made and expect to continue to make material capital expenditures in connection with improvements to our network and other facilities. Unforeseen increases in the amount of capital expenditures required to execute our current business plan could have a material adverse effect on our business and financial results.
We have made and expect to continue to make a significant amount of capital expenditures to, among other things, enhance the capabilities of our network, such as that required to provide digital video service, enhance the functionality of our existing IT systems, and support the deployment of new products and services. We intend to fund these capital expenditures and expenses with operating cash flows and funds available to us under our credit facilities. Increases in the amount of capital expenditures and expenses required to upgrade our network and other facilities above those contemplated by our current business plan, could cause our cash flows and available financing to be insufficient to fund such capital expenditures and operating expenses and have a material adverse effect on our business and financial results.
18
Failures in our critical back‑office systems and IT infrastructure could have a material adverse effect on our business and financial results.
We operate our own back‑office and IT infrastructure, including business processes, software applications (such as billing systems, corporate finance systems, human resources and payroll systems and customer relationship management systems), and hardware that are vital to our operations. Failures in our back‑office systems and IT infrastructure could have a material adverse effect on our business and financial results.
Our success will depend on our ability to attract and retain qualified management and other personnel.
Our success depends upon the talents and efforts of our senior management team. The loss of any member of our senior management team, due to retirement or otherwise, and the inability to attract and retain highly qualified technical and management personnel in the future, could have a material adverse effect on our business, financial condition, results of operations, liquidity and/or the market price of our outstanding securities.
Approximately half of our workforce is represented by a labor union and therefore subject to a collective bargaining agreement, which expires at the end of 2017. The inability to enter into a new collective bargaining agreement on favorable terms could have a material adverse effect on our business, financial condition, results of operations, liquidity and/or the market price of our outstanding securities.
As of December 31, 2016, approximately half of our employees were covered by a collective bargaining agreement with the International Brotherhood of Electrical Workers Local 1357 (“IBEW”) that expires at the end of 2017. The inability to negotiate and enter into a new collective bargaining agreement on favorable terms could result in an increase in our operating expenses or covered employees could strike or engage in other collective behaviors. If unionized workers were to engage in a strike, we could experience a significant disruption of our operations or higher ongoing labor costs, either of which could have a material adverse effect on our business, financial condition, results of operations, liquidity and/or the market price of our outstanding securities. Future renegotiation of these and other labor agreements or the provisions of such labor agreements could adversely impact our service reliability and significantly increase our costs for healthcare, pension plans, wages and other benefits, which could have a material adverse impact on our business, financial condition, results of operations, liquidity and/or the market price of our outstanding securities.
An IT and/or network security breach may lead to unauthorized use or disabling of our network, theft of customer data, unauthorized use or publication of our intellectual property and/or confidential business information and could have a material adverse effect on our business and financial results.
We are subject to cyber and other data security risks. This risk may be heightened as we expand our managed services, data center services, and cloud based services. We seek to effectively prevent, detect and respond to all cyber-attacks, but, in some cases, we might be unaware of an incident or its magnitude. Significant security failures could result in the theft, loss, damage, unauthorized use or publication of our intellectual property and/or confidential business information; the theft, loss, damage, unauthorized use or publication of our customers’ personally identifiable information, intellectual property and/or confidential business information; or the unauthorized use or disabling of our network elements. While we have technology and information security processes and cybersecurity risk managment in place to mitigate these risks and respond to any incidents, there is no assurance these measures will be adequate to prevent an incident, including incidents involving sophisticated criminal organizations and nation-state actors. A disabling of our network elements or a loss of confidential or proprietary data or other data security breaches could materially and adversely affect our customers, employees and vendors, damage our reputation among customers and the public, disrupt operations, and subject us to possible financial losses, any of which could have a material adverse effect on our financial condition and results of operations and our ability to expand our services.
19
A network disruption could cause delays or interruptions of service, which could cause us to lose customers.
To be successful, we will need to continue to provide our customers with reliable and uninterrupted service over our expanded network. Disruptions in our service could occur as a result of events that are beyond our control. Some of the risks to our network and infrastructure include, without limitation:
|
· |
physical damage to our transmission network including poles, cable and access lines; |
|
· |
widespread power surges or outages; |
|
· |
software defects in critical systems; and |
|
· |
damage or disruption inflicted by third parties, whether intentionally or unintentionally, upon the network or our other infrastructure. |
From time to time, in the ordinary course of business, we have experienced and in the future may experience short disruptions in our service due to factors such as cable damage, inclement weather and service failures of our third‑party service providers. We could experience more significant disruptions in the future. In addition, certain portions of our network may lack adequate redundancy to allow for expedient recovery of service to affected customers. Disruptions may cause interruptions in service or reduced capacity for customers, either of which could cause us to lose customers and incur expenses, which could have a material adverse effect on our business, financial condition, results of operations, liquidity and/or the market price of our outstanding securities.
We rely on several material outsourcing agreements to operate our business. The loss of certain of these agreements, or the failure of any third party to perform under certain of these agreements, could have a material adverse effect on our business and financial results.
Several critical services necessary to operate our business are provided by third‑party service providers. For example, we have entered into agreements with Accenture and other third parties for the provision of, among other things, critical printing, billing, and IT services.
Upon expiration or termination of these agreements, we may not be able to replace the services provided to us in a timely manner or on terms and conditions, including service levels and cost, favorable to us, or at all. The failure of these third‑party service providers to satisfy their obligations under their agreements with us, without a suitable replacement, could have a material adverse effect on our business and financial results. Additionally, if these third‑party service providers were to seek U.S. bankruptcy law protection, our agreements with such service providers, and such service providers’ ability to provide the services under those agreements, could be adversely impacted, and although we may have a claim for damages against the bankruptcy estate, the claim may or may not be paid in the bankruptcy proceeding.
Our business is subject to extensive governmental regulation. Applicable legislation and regulations and changes to them could adversely affect our business and financial results.
We operate in a heavily regulated industry, and most of our revenues come from the provision of services regulated by the FCC and the HPUC. Laws and regulations applicable to us and our competitors may be, and have been, challenged in the courts and could be changed by federal or state legislative initiative, judicial review or regulatory agencies at any time. We cannot predict the impact of future developments or changes to the regulatory environment or the impact such developments or changes would have on us.
The “Connect America Fund” Order adopted by the FCC in November 2011 comprehensively reformed both the universal service program and intercarrier compensation and has had a significant impact on us. See “—Universal Service” above for a discussion of the impact of the Order on the universal service program, and “—Federal Framework for Intercarrier Compensation” above for a discussion of the impact of the Order on intercarrier compensation. Changes
20
in other FCC policies under review also could have a significant impact on us by increasing our obligations and/or reducing our revenue.
In February 2015, the FCC reclassified broadband service, both fixed and mobile, from its longstanding status as a Title I information service to a Title II common carrier telecommunications service. Although it is too early to determine with any certainty how the order will affect our broadband services, the order could result in additional costs and reduced margins in our broadband business. See “Federal Regulatory Classification of Broadband and Internet Services”.
State government regulation also is a source of business uncertainty. We cannot predict whether state proceedings will be initiated or the possible outcome of such proceedings at this time.
The HPUC could limit the ability of Hawaiian Telcom, Inc., one of the Company’s indirect operating subsidiaries, to distribute funds or assets to its parent company.
All of our operations are conducted through our subsidiaries. Any revenue we may receive is derived from distributions from such subsidiaries. Hawaiian Telcom, Inc., one of our indirect operating subsidiaries, is subject to HPUC regulatory authority which could potentially limit the ability of Hawaiian Telcom, Inc. to distribute funds or assets to its parent company. The inability of any of our regulated subsidiaries to make a distribution would, thus, limit the ability and amount of funds available for us to make a distribution to our stockholders.
A reduction by the HPUC or the FCC of the rates we charge our customers would reduce our revenues and could reduce our earnings.
The rates we charge our local telephone customers are based, in part, on a rate‑of‑return authorized by the HPUC on capital invested in our network. These authorized rates, as well as allowable investment and expenses, are subject to review and change by the HPUC at any time. If the HPUC orders us to reduce our rates, our revenues would be reduced and our earnings also could be reduced absent corresponding reductions in costs or offsetting revenue increases in other segments. We cannot assure you that our rates will remain at their current levels. The HPUC order received in connection with the 2007 sale of our directories publishing business imposed a condition requiring the imputation of revenues. Specifically, a directory publishing revenue credit in the annual amount of $42.6 million per year must be added as regulated revenues into the calculation of Hawaiian Telcom, Inc.’s earnings from 2008 to 2022 in all future rate cases, alternative form of regulation proceedings, or other proceedings before the HPUC investigating Hawaiian Telcom, Inc.’s earnings or financial performance. This condition may adversely affect our ability to obtain rate increases in the future.
Also, our local exchange service competitors may gain a competitive advantage based on rules which favor competitors. For example, competitors have the ability to purchase our services at discounted rates set by the HPUC and to resell them at rates that are not subject to the level of regulatory scrutiny generally faced by us. Additionally, as a result of the state regulators permitting our competitors to intervene in rate‑setting proceedings, there is a potential that such competitors could obtain business sensitive information about us during such proceedings.
The FCC approves tariffs for interstate access and subscriber line charges, both of which are components of our network access revenue. The FCC currently is considering whether to restrain special access pricing by carriers like us subject to price caps on interstate rates. The “Connect America Fund” Order that the FCC adopted in November 2011 reduces switched interstate access charges for carriers like us over a period of six years but allows us to recover some of the foregone revenue from our end users. It is possible we may be required to recover more revenue through subscriber line charges or forego this revenue altogether. This could reduce our revenue or impair our competitive position.
21
If we do not adapt to technological changes in the telecommunications industry, we could lose customers and market share.
The telecommunications industry is subject to rapid and significant changes in technology, frequent new product and service introductions and evolving industry standards which could reduce the competitiveness of our services. Adapting to technological developments could require unbudgeted upgrades or the procurement of additional products that could be expensive and time consuming to implement. If we fail to adapt successfully to technological changes or fail to obtain access to important new technologies, we could lose customers and be limited in our ability to attract new customers and sell new services to our existing customers.
Our business may be adversely affected if we cannot continue to license or enforce the intellectual property rights on which our business depends.
We rely on patent, copyright, trademark and trade secret laws and licenses and other agreements with our employees, customers, suppliers and other parties to establish and maintain our intellectual property rights in technology and the products and services used in our operations. Also, because of the rapid pace of technological change, we develop our own technologies, products and services and rely on technologies developed or licensed by third parties. However, any of our intellectual property rights could be challenged or invalidated, or such intellectual property rights may not be sufficient to permit us to take advantage of current industry trends or otherwise to provide competitive advantages, which could result in costly redesign efforts, discontinuance of certain product or service offerings or other competitive harm. We may not be able to obtain or continue to obtain licenses from these third parties on reasonable terms, if at all. In addition, claims of intellectual property infringement could require us to enter into royalty or licensing agreements on unfavorable terms, incur substantial monetary liability or be enjoined preliminarily or permanently from further use of the intellectual property in question, which could require us to change our business practices or offerings and limit our ability to compete effectively. Even unsuccessful claims can be time‑consuming and costly to defend and may divert management’s attention and resources away from our businesses. In recent years, the number of intellectual property infringement claims has been increasing in the communications industry and this could negatively impact us as a company.
The failure to renegotiate programming contracts with television content providers on acceptable terms or at all could have a material adverse effect on our business and results of operations.
We expect television content costs to continue to be one of our largest operating costs associated with providing television service. In recent years, the cable industry has experienced rapid increases in the cost of programming, especially the costs for sports programming and for local broadcast station retransmission content.
Programming costs are generally assessed on a per-subscriber basis, and therefore, are related directly to the number of subscribers to which the programming is provided. Our relatively small base of subscribers limits our ability to negotiate lower per-subscriber programming costs. As our programming contracts with content providers expire, there can be no assurance that they will be renewed on acceptable terms or that they will be renewed at all, in which case we may be unable to provide such programming as part of our video services packages. The loss of this content could have a material adverse effect on our business and results of operations.
The geographic concentration of our operations in Hawaii make our business susceptible to local economic and regulatory conditions and consumer trends, and an economic downturn, recession or unfavorable legislative or regulatory action affecting Hawaii could have a disproportionate and material adverse effect on our business, financial condition, results of operations, liquidity and/or the market price of our outstanding securities.
Substantially all of our customers and operations are located in Hawaii. Because of Hawaii’s geographic isolation, the successful operation and growth of our businesses is dependent on favorable economic and regulatory conditions in the state. The Hawaii economy, in turn, is dependent upon many factors, including:
|
· |
the level of government and military spending; |
22
|
· |
the legal, regulatory and political environment; |
|
· |
the strength of the Hawaii tourism industry, which is in turn dependent on global economic conditions principally those in the U.S. mainland and Pacific rim; |
|
· |
the availability and cost of skilled labor; |
|
· |
the continued growth in services industries; and |
|
· |
the absence of hurricanes or other natural disasters and terrorism incidents. |
The customer base for telecommunications services in Hawaii is small and geographically concentrated. The population of Hawaii is approximately 1.4 million, approximately 70% of whom live on the island of Oahu. Any adverse economic conditions affecting Oahu, or Hawaii generally, could materially impair our ability to operate our business. Labor shortages or increased labor costs in Hawaii could also have a material adverse effect on our business.
Limitations on our ability to use NOL carryforwards, and other factors requiring us to pay cash to satisfy our tax liabilities in future periods, may affect our ability to fund our operations, make capital expenditures and repay our indebtedness.
We currently have a material amount of net operating loss (“NOL”) carryforwards and so‑called “built‑in losses,” all of which we intend to use in the future to reduce our federal and state taxable income. In the event that an “ownership change” were to occur with respect to our stock, it is possible that our ability to use our NOLs and built‑in losses would become subject to an annual limitation. An ownership change could occur with respect to our stock merely as a result of one or more “5‑percent shareholders” buying or selling our shares, even if no one person were to acquire a controlling percentage of our stock. Although we will monitor transfers of our stock, there can be no assurance that we will not suffer an ownership change with substantial adverse tax consequences.
Our indebtedness could adversely affect our financial condition.
We have a significant amount of indebtedness. We maintain a Term Loan in the amount of $290 million and a revolving credit facility which may be drawn in an amount up to $30 million (Revolving Credit Facility), each with a first priority lien on all assets.
The debt service requirements of our indebtedness could:
|
· |
make it more difficult for us to satisfy the service requirements of our other obligations, including pension funding obligations, investments required to maintain and upgrade our network and service fleet, investments required to introduce and deploy new products and services, as well as the operating costs of our businesses; |
|
· |
increase our vulnerability to general adverse economic and industry conditions; |
|
· |
require us to dedicate a higher than desired portion of our cash flow from operations to payments on our indebtedness, thereby reducing the availability of our cash flow to fund working capital, capital expenditures, research and development efforts and other general corporate purposes; |
|
· |
limit our flexibility in planning for, or reacting to, changes in our business and the industry in which we operate; |
|
· |
make it difficult to secure credit terms with our vendors; |
|
· |
place us at a competitive disadvantage compared to our competitors that have less debt; and |
23
|
· |
limit our ability to borrow additional funds. |
In addition, the terms of our Term Loan and Revolving Credit Facility contain financial and other restrictive covenants that limit our ability to engage in activities that may be in our long‑term best interests and restrict the payment of dividends. Our failure to comply with those covenants could result in an event of default which, if not cured or waived, could result in the acceleration of all of our debts.
The Term Loan matures in 2019. We generally do not expect to generate the necessary cash flow to repay our Term Loan in its entirety by the maturity date and such repayment in full is dependent upon the ability to refinance the Term Loan on reasonable terms. The ability to refinance the indebtedness on reasonable terms before the maturity date cannot be assured.
On February 24, 2017, we entered into a Credit Agreement with CoBank, ACB, and certain other lenders that are a party thereto that is expected to close on or about May 3, 2017 (the “New Facility”). The Company plans to use a part of the proceeds of the New Facility to retire our existing Term Loan, but there is no assurance that we will successfully close the New Facility.
To service our indebtedness and fund capital expenditures, we will require a significant amount of cash. Our ability to generate cash depends on many factors beyond our control.
Our ability to make payments on and to refinance our current indebtedness and to fund planned capital expenditures will depend on our ability to generate cash in the future. This, to a certain extent, is subject to general economic, financial, competitive, legislative, regulatory and other factors that are beyond our control.
We cannot assure you that our business will generate sufficient cash flow from operations or that future borrowings will be available to us in an amount sufficient to enable us to pay our indebtedness or to fund our other liquidity needs. We will likely need to refinance all or a portion of our indebtedness on or before maturity. We cannot assure you that we will be able to refinance any of our indebtedness on commercially reasonable terms or at all.
Restrictive covenants in the agreements governing our indebtedness restrict our ability to operate our business and pursue our business strategies, and a breach of such covenants may result in the acceleration of our long‑ term debt maturities.
The restrictive covenants in the Term Loan, Revolving Credit Facility and under the New Facility limit our ability, among other things, to:
|
· |
incur additional indebtedness; |
|
· |
pay dividends or make distributions in respect of our capital stock or to make certain other restricted payments or investments; |
|
· |
sell assets, including capital stock of subsidiaries; |
|
· |
consolidate, merge, sell or otherwise dispose of all or substantially all of our assets; |
|
· |
enter into transactions with our affiliates; |
|
· |
invest in new products and services or make capital expenditures; and |
|
· |
incur liens. |
In addition, the restrictive covenants may prohibit us from prepaying our other indebtedness and require us to maintain compliance with specified financial ratios. Our ability to comply with these ratios may be affected by events beyond our control.
24
Severe weather conditions and natural disasters which occur in Hawaii could have a material adverse effect on our operations and financial results.
From time to time, Hawaii experiences severe weather conditions such as high winds and heavy rainfall, and natural disasters such as earthquakes, volcanic eruptions and tsunami, which can overwhelm our employees, disrupt our services and severely damage our property. Such disruptions in service and damage to property could materially decrease our revenues and materially increase our expenses. In 2014, Hawaii experienced two hurricanes and a volcanic eruption which adversely affected our financial results. In 2015, seven hurricanes and six tropical storms passed near Hawaii, resulting in record rainfall which damaged infrastructure and adversely affected our financial results. In 2016, one tropical storm and two hurricanes either made landfall or passed near Hawaii causing heavy rainfall and high surf. While these events did not have a material adverse effect on our operating results or financial condition, we cannot assure you that these types of events will not become more common or severe in the future or not result in material harm to the Company’s business, financial condition, results of operations, liquidity and/or the market price of our securities. Moreover, it is impossible to predict the extent to which climate change could cause extreme weather conditions to become more frequent or more extreme.
Concentration of ownership among stockholders may prevent new investors from influencing significant corporate decisions.
Based on Schedules 13D and 13G, and Forms 4 filed by the respective holders, as of December 31, 2016, two of our stockholders collectively (with their affiliates) own approximately 45% of our outstanding common stock. Each of these two stockholder groups filed a Schedule 13D in 2015 indicating that it may, among other things, engage in communications with our representatives or other stockholders of the Company, purchase additional shares of Company common stock or propose directors for our Board of Directors. In 2016, we entered into a Nomination, Standstill and Support Agreement with our largest stockholder, Black Diamond Capital Management, L.L.C. (“BD”), and a Nomination, Standstill and Support Agreement(collectively, the Standstill Agreements) with our second largest beneficial stockholder, Twin Haven Capital Partners, L.L.C., Twin Haven Special Opportunities Fund III, L.P., Twin Haven Special Opportunities Partners III, L.L.C., Twin Haven Special Opportunities Fund IV, L.P. and Twin Haven Special Opportunities Partners IV, L.L.C. (collectively, Twin Haven). Pursuant to each of the Standstill Agreements, among other things, we agreed to nominate one designee of each of BD and Twin Haven to our Board of Directors at each of the next three annual meetings of stockholders. In return, each of BD and Twin Haven has agreed during the three-year term, among other things, to refrain from taking certain actions with respect to us and our securities (including soliciting proxies, proposing any sale transaction or tender offer, seeking representation on our Board of Directors in excess of one designee, or acquiring additional shares of Company common stock beyond an agreed-upon level) and, subject to limited exceptions, to vote all of its shares in accordance with the recommendation of our Board of Directors on any matter submitted for stockholder approval. Although the Standstill Agreements limit BD’s and Twin Haven’s influence over us, each of our major stockholders still has significant influence on the outcome of matters requiring stockholder approval, even if these stockholders are not acting in a coordinated manner, including the election of directors and significant corporate transactions, such as mergers, consolidations or the sale of substantially all of our assets. This concentration of ownership may make some transactions more difficult or impossible without the support of these stockholders, or more likely with the support of these stockholders, and may have the effect of delaying or preventing a change of control, including a merger, consolidation or other business combination involving us, or discouraging a potential acquirer from making a tender offer or otherwise attempting to obtain control, even if that change of control may otherwise benefit our other stockholders.
Future sales or the possibility of future sales of a substantial amount of our common stock may depress the price of our common stock.
Future sales, or the availability for sale in the public market, of substantial amounts of our common stock could adversely affect the prevailing market price of our common stock and could impair our ability to raise capital through future sales of equity securities. The market price of our common stock could decline as a result of sales of a large number of shares of our common stock in the market or the perception that these sales could occur. Additionally, the high concentration of ownership of our stock could increase the risk that such a large block sale could occur. These sales,
25
or the possibility that these sales may occur, may also make it more difficult for us to obtain additional capital by selling equity securities in the future at a time and at a price that we deem appropriate.
Item 1B. Unresolved Staff Comments.
None
We own our corporate headquarters, which is located in 1177 Bishop Street, Honolulu, Hawaii 96813 and consists of over 465,000 square feet of office space. We also have other properties consisting primarily of approximately 124 owned (including part‑owned) and approximately 57 leased or licensed real estate properties, including our administrative facilities and facilities for call centers, customer service sites for the television business, switching equipment, fiber optic networks, microwave radio and cable and wire facilities, cable head‑end equipment, coaxial distribution networks, routers and servers used in our telecommunications business, as well as a state‑of‑the‑art data center facility with up to 6,500 square feet of data center capacity and room for expansion. See Item 1, “Business—Network Architecture and Technology.” For purposes of Hawaii state law, we are classified as a public utility and, accordingly, do not pay any property taxes on properties used in providing telecommunication services. Substantially all of our assets (including those of our subsidiaries) are pledged for the Term Loan.
We are involved in various claims, legal actions and regulatory proceedings arising from time to time in the ordinary course of business. In the opinion of management, the ultimate disposition of the legal matters in which the Company is currently involved will not have a material adverse effect on our combined financial position, results of operations or cash flows.
Item 4. Mine Safety Disclosures
Not applicable.
26
Item 5. Market for Registrant’s Common Equity, Related Stockholder Matters and Issuer Purchases of Equity Securities.
Market Information
Our Common Stock trades on The NASDAQ Stock Market under the symbol “HCOM”. The holders of our Common Stock are entitled to one vote per share on any matter to be voted upon by stockholders. The following table sets forth the high and low sales prices of our Common Stock for the period from January 1, 2015 through December 31, 2016:
|
|
|
Market Price |
|
||||
|
|
|
High |
|
Low |
|
||
|
2016 |
|
|
|
|
|
|
|
|
First Quarter |
|
$ |
25.26 |
|
$ |
20.75 |
|
|
Second Quarter |
|
$ |
24.66 |
|
$ |
19.14 |
|
|
Third Quarter |
|
$ |
24.09 |
|
$ |
21.28 |
|
|
Fourth Quarter |
|
$ |
25.50 |
|
$ |
20.11 |
|
|
2015 |
|
|
|
|
|
|
|
|
First Quarter |
|
$ |
27.45 |
|
$ |
25.80 |
|
|
Second Quarter |
|
$ |
27.96 |
|
$ |
24.92 |
|
|
Third Quarter |
|
$ |
26.06 |
|
$ |
20.46 |
|
|
Fourth Quarter |
|
$ |
25.97 |
|
$ |
20.51 |
|
Holders
As of March 1, 2017, there were 36 holders of record of our Common Stock and approximately 3,450 beneficial owners.
Dividends
We have not declared or paid any dividends on our Common Stock. Our Term Loan and Revolving Credit Facility limit our ability to declare or pay dividends.
Securities Authorized for Issuance Under Equity Compensation Plans.
Securities authorized for issuance under equity compensation plans as of December 31, 2016 included:
|
|
|
|
|
|
|
Number of securities |
|
|
|
|
|
|
|
|
remaining available for |
|
|
|
|
Number of securities |
|
|
|
future issuance under |
|
|
|
|
to be issued upon |
|
Weighted-average |
|
equity compensation |
|
|
|
|
exercise of |
|
exercise price of |
|
plans (excluding |
|
|
|
|
outstanding options, |
|
outstanding options, |
|
securities reflected in |
|
|
Plan Category |
|
warrants and rights(2) |
|
warrants and rights |
|
column(a)) |
|
|
|
|
(a) |
|
(b) |
|
(c) |
|
|
Equity Compensation Plans Approved by Security Holders |
|
— |
|
— |
|
— |
|
|
Equity Compensation Plans not Approved by Security Holders(1)(2) |
|
272,167 |
|
— |
|
638,496 |
|
|
Total |
|
272,167 |
|
— |
|
638,496 |
|
27
|
(1) |
The 2010 Equity Incentive Plan was authorized by the Plan of Reorganization. Under the 2010 Equity Incentive Plan, the securities remaining available for future issuance may be issued either as restricted stock, restricted stock units, stock appreciation rights, stock options, or other stock or stock‑based awards. |
|
(2) |
For performance‑based restricted stock units granted in 2016, amounts reflected in this table assume payout in shares at 156.25% of target. The actual number of shares issued can range from 0% to 156.25% of target depending upon achievement of applicable performance goals. |
Sale of Unregistered Securities
None.
Purchases of Equity Securities by the Issuer and Affiliated Purchasers
None.
28
Stockholder Return Performance Graph
The graph below compares the cumulative total stockholder return on our Common Stock with the cumulative total return on the Standards & Poor’s (S&P) 500 Stock Index, and the NASDAQ Telecommunications Index for the five years ending December 31, 2016, assuming an initial investment of $100 with reinvestment of dividends.
COMPARISON OF CUMULATIVE TOTAL RETURN
Among Hawaiian Telecom Holdco, Inc., S&P 500 and NASDAQ Telecommunications
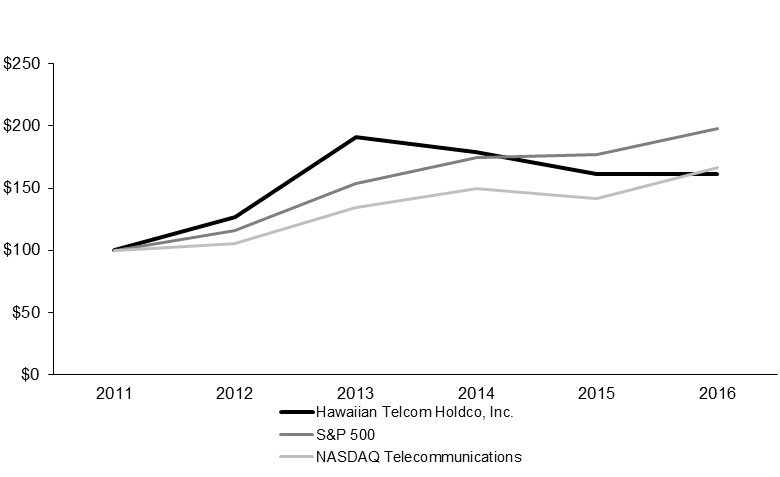
|
|
|
At December 31, |
||||||||||||||||
|
|
|
2011 |
|
2012 |
|
2013 |
|
2014 |
|
2015 |
|
2016 |
||||||
|
Hawaiian Telcom Holdco, Inc. |
|
$ |
100.00 |
|
$ |
126.62 |
|
$ |
190.71 |
|
$ |
179.03 |
|
$ |
161.43 |
|
$ |
160.91 |
|
S&P 500 |
|
$ |
100.00 |
|
$ |
116.00 |
|
$ |
153.57 |
|
$ |
174.60 |
|
$ |
177.01 |
|
$ |
198.18 |
|
NASDAQ Telecommunications |
|
$ |
100.00 |
|
$ |
105.48 |
|
$ |
134.25 |
|
$ |
149.71 |
|
$ |
141.77 |
|
$ |
166.70 |
The foregoing performance graph and related information shall not be deemed “soliciting material” or to be “filed” with the SEC, nor shall such information be incorporated by reference into any future filings under the Securities Act of 1933 or the Securities Exchange Act of 1934, each as amended, except to the extent we specifically incorporate it by reference into such filing.
29
Item 6. Selected Financial Data
The following selected financial data should be read in conjunction with “Management’s Discussion and Analysis of Financial Condition and Results of Operations” and our consolidated financial statements and related notes thereto included elsewhere in this annual report.
Selected Financial Data (dollars in thousands, except per share amounts)
|
|
|
Year Ended December 31, |
|
|||||||||||||
|
|
|
2016 |
|
2015 |
|
2014 |
|
2013 |
|
2012 |
|
|||||
|
Statements of income data (1): |
|
|
|
|
|
|
|
|
|
|
|
|
|
|
|
|
|
Operating revenues |
|
$ |
392,963 |
|
$ |
393,413 |
|
$ |
390,739 |
|
$ |
391,150 |
|
$ |
385,498 |
|
|
Depreciation and amortization |
|
|
89,916 |
|
|
87,879 |
|
|
78,014 |
|
|
77,301 |
|
|
70,908 |
|
|
Operating income |
|
|
18,792 |
|
|
19,262 |
|
|
30,471 |
|
|
41,771 |
|
|
45,856 |
|
|
Interest expense |
|
|
17,095 |
|
|
16,786 |
|
|
16,496 |
|
|
18,875 |
|
|
22,183 |
|
|
Income tax provision (benefit) (2) |
|
|
591 |
|
|
1,357 |
|
|
5,910 |
|
|
8,782 |
|
|
(91,382) |
|
|
Net income |
|
|
1,106 |
|
|
1,100 |
|
|
8,099 |
|
|
10,488 |
|
|
109,982 |
|
|
Earnings per common share— |
|
|
|
|
|
|
|
|
|
|
|
|
|
|
|
|
|
Basic |
|
$ |
0.10 |
|
$ |
0.10 |
|
$ |
0.76 |
|
$ |
1.01 |
|
$ |
10.74 |
|
|
Diluted |
|
|
0.10 |
|
|
0.10 |
|
|
0.72 |
|
|
0.95 |
|
|
10.32 |
|
|
Statements of cash flow data—net cash provided by (used in)(3): |
|
|
|
|
|
|
|
|
|
|
|
|
|
|
|
|
|
Operating activities |
|
$ |
90,088 |
|
$ |
90,596 |
|
$ |
90,490 |
|
$ |
76,961 |
|
$ |
86,460 |
|
|
Investing activities |
|
|
(97,841) |
|
|
(98,229) |
|
|
(96,243) |
|
|
(85,030) |
|
|
(85,310) |
|
|
Financing activities |
|
|
(5,238) |
|
|
1,335 |
|
|
(3,363) |
|
|
(9,373) |
|
|
(16,220) |
|
|
Balance Sheets data (as of end of period): |
|
|
|
|
|
|
|
|
|
|
|
|
|
|
|
|
|
Cash and cash equivalents |
|
$ |
15,821 |
|
$ |
30,312 |
|
$ |
39,885 |
|
$ |
49,551 |
|
$ |
66,993 |
|
|
Property, plant and equipment, net |
|
|
595,997 |
|
|
579,107 |
|
|
565,956 |
|
|
524,375 |
|
|
507,197 |
|
|
Total assets |
|
|
803,921 |
|
|
799,695 |
|
|
796,724 |
|
|
771,724 |
|
|
780,667 |
|
|
Long term debt (4) |
|
|
284,699 |
|
|
286,046 |
|
|
287,179 |
|
|
288,388 |
|
|
290,985 |
|
|
Stockholders’ equity |
|
|
304,914 |
|
|
307,699 |
|
|
304,534 |
|
|
313,012 |
|
|
276,860 |
|
|
(1) |
The Company acquired SystemMetrics Corporation on September 30, 2013 and Wavecom Solutions Corporation on December 31, 2012. The results of operations are included in the above financial information from the acquisition date. |
|
(2) |
As of December 31, 2012, the Company released its valuation allowance resulting in an income tax benefit of $91.4 million for the year ended December 31, 2012. |
|
(3) |
In 2016, the Company adopted a new accounting standard modifying the presentation of restricted cash in the statements of cash flow. The statements of cash flow data has been revised for the application of the new standard for all periods presented. See Note 2 to the consolidated financial statements. |
|
(4) |
Long‑term debt includes the related current portion and is net of debt issuance costs and original issue discount. |
30
Item 7. Management’s Discussion and Analysis of Financial Condition and Results of Operations
Background
In the following discussion and analysis of financial condition and results of operations, unless the context otherwise requires, “we,” “us” or the “Company” refers, collectively, to Hawaiian Telcom Holdco, Inc. and its subsidiaries.
The statements in the discussion and analysis regarding industry outlook, our expectations regarding the future performance of our business and the other non‑historical statements in the discussion and analysis are forward‑looking statements. These forward‑looking statements are subject to numerous risks and uncertainties, including, but not limited to, the risks and uncertainties described in Item 1A, “Risk Factors.” Our actual results may differ materially from those contained in any forward‑looking statements. You should read the following discussion together with Item 6, “Selected Financial Data” and our consolidated financial statements and related notes thereto included elsewhere in this annual report. We undertake no obligation to update publicly any forward looking statements for any reason even if new information becomes available or other events occur in the future.
Segments and Sources of Revenue
We operate in two reportable segments (telecommunication and data center services) based on how resources are allocated and performance is assessed by our chief operating decision maker. Our chief operating decision maker is our Chief Executive Officer.
Telecommunications
The telecommunication segment derives revenue from the following sources in three main customer channels:
Business Channel
Business data services include high bandwidth data products such as Ethernet and Dedicated Internet Access along with traditional High-Speed Internet (“HSI”) for business customers and VoIP. Business VoIP, also referred to as BVoIP, is a unified hosted communications solution for business that includes digital voice services bundled with internet service.
Voice services include local telephone service for business customers. These revenues include monthly charges for basic service and enhanced calling features such as voice mail, caller ID and 3-way calling. Voice also includes long distance services and subscriber line charges prescribed by the Federal Communication Commission and imposed on voice customers.
Equipment and managed services includes installation and maintenance of business customer premise equipment as well as managed service for customer telephone and IT networks.
Consumer Channel
Video services are marketed as Hawaiian Telcom TV which includes digital television as well as advanced entertainment services. High-Speed Internet services are provided to residential customers as well. Voice services include basic local phone and long distance services, as well as enhanced features.
Wholesale Channel
Wholesale revenue represents wholesale carrier data services provided to both wireline and wireless carriers.
31
Other
We receive revenue from various other sources such as wireless services which includes the sale of wireless handsets and other wireless accessories, and switched carrier access which compensates us for origination, transport and termination of calls for long distance and other interexchange carriers. Also included in other revenue is government subsidies generally to provide service in rural or isolated areas.
Data Center Services
The data center services segment provides physical colocation, virtual colocation and various related telephony services. We consider data center services as part of our business channel.
Results of Operations for the Years Ended December 31, 2016, 2015 and 2014
Operating Revenues
The following tables summarize our volume information (lines or subscribers) as of December 31, 2016, 2015 and 2014, and our operating revenues for the years ended December 31, 2016, 2015 and 2014.
Volume information includes certain information by lines. The line counts represent the number of billed units as of the end of the period as reflected in the records of our primary billing system. The separation of units by the business and consumer channel is based on the customer account designation in the billing system which is generally consistent with how revenue information is separated by channel. Business data lines represent digital subscriber lines used to provide internet services. Video service subscribers are determined with a count of individual customers as reflected in our primary billing system as of period end. For bulk contracts for multi dwelling units, we count individual residences subject to the bulk contract. Video homes enabled is estimated based on a count of single family homes and homes in multi dwelling units that are able to obtain our television service as of the period end.
Volume Information
|
|
|
|
|
|
|
|
|
2016 vs 2015 |
|
2015 vs 2014 |
|
||||
|
|
|
December 31, |
|
Change |
|
Change |
|
||||||||
|
|
|
2016 |
|
2015 |
|
2014 |
|
Number |
|
Percentage |
|
Number |
|
Percentage |
|
|
Business |
|
|
|
|
|
|
|
|
|
|
|
|
|
|
|
|
Data lines |
|
19,596 |
|
20,081 |
|
19,589 |
|
(485) |
|
(2.4) |
% |
492 |
|
2.5 |
% |
|
BVoIP lines |
|
19,091 |
|
16,749 |
|
12,898 |
|
2,342 |
|
14.0 |
% |
3,851 |
|
29.9 |
% |
|
Voice access lines |
|
160,829 |
|
168,058 |
|
175,636 |
|
(7,229) |
|
(4.3) |
% |
(7,578) |
|
(4.3) |
% |
|
|
|
|
|
|
|
|
|
|
|
|
|
|
|
|
|
|
Consumer |
|
|
|
|
|
|
|
|
|
|
|
|
|
|
|
|
Video subscribers |
|
41,557 |
|
35,876 |
|
28,124 |
|
5,681 |
|
15.8 |
% |
7,752 |
|
27.6 |
% |
|
Internet lines |
|
91,089 |
|
93,002 |
|
92,875 |
|
(1,913) |
|
(2.1) |
% |
127 |
|
0.1 |
% |
|
Voice access lines |
|
135,363 |
|
151,996 |
|
169,488 |
|
(16,633) |
|
(10.9) |
% |
(17,492) |
|
(10.3) |
% |
|
Homes enabled for video |
|
202,000 |
|
190,000 |
|
160,000 |
|
12,000 |
|
6.3 |
% |
30,000 |
|
18.8 |
% |
32
Operating Revenues (dollars in thousands)
|
|
|
For the Year Ended |
|
|
|
|
|
|
||||
|
|
|
December 31, |
|
Change |
|
|||||||
|
|
|
2016 |
|
2015 |
|
Amount |
|
Percentage |
|
|||
|
Business |
|
|
|
|
|
|
|
|
|
|
|
|
|
Data services |
|
$ |
59,363 |
|
$ |
49,327 |
|
$ |
10,036 |
|
20.3 |
% |
|
Voice services |
|
|
87,136 |
|
|
93,722 |
|
|
(6,586) |
|
(7.0) |
% |
|
Data center services |
|
|
12,435 |
|
|
11,094 |
|
|
1,341 |
|
12.1 |
% |
|
Equipment and managed services |
|
|
21,729 |
|
|
20,546 |
|
|
1,183 |
|
5.8 |
% |
|
|
|
|
180,663 |
|
|
174,689 |
|
|
5,974 |
|
3.4 |
% |
|
Consumer |
|
|
|
|
|
|
|
|
|
|
|
|
|
Video services |
|
|
40,558 |
|
|
33,666 |
|
|
6,892 |
|
20.5 |
% |
|
Internet services |
|
|
28,993 |
|
|
32,687 |
|
|
(3,694) |
|
(11.3) |
% |
|
Voice services |
|
|
73,388 |
|
|
79,273 |
|
|
(5,885) |
|
(7.4) |
% |
|
|
|
|
142,939 |
|
|
145,626 |
|
|
(2,687) |
|
(1.8) |
% |
|
Wholesale carrier data |
|
|
53,664 |
|
|
56,430 |
|
|
(2,766) |
|
(4.9) |
% |
|
Other |
|
|
15,697 |
|
|
16,668 |
|
|
(971) |
|
(5.8) |
% |
|
|
|
$ |
392,963 |
|
$ |
393,413 |
|
$ |
(450) |
|
(0.1) |
% |
Business Channel
The Company continues to transform its business channel by replacing traditional voice services with next generation strategic services. The Company considers strategic service revenues in the business channel to include business data services and data center services. Business strategic revenues for the year ended December 31, 2016 represent 40% of the total business channel revenues compared to 35% in the prior year.
Business data services, including internet and BVoIP, for the year ended December 31, 2016 increased compared to the prior year primarily due to non-recurring fees associated with one large institutional customer. For the year ended December 31, 2016 and 2015, business data services revenue from this customer amounted to $6.2 million and $1.1 million, respectively, including non-recurring fee revenue. We anticipate less revenue from this customer in 2017 as the recognition of revenue on certain upfront billed amounts ended with the fixed contract term on June 30, 2016. In addition, during the year ended December 31, 2016, we recognized the remaining balance of deferred up-front charges of $0.8 million when another institutional customer terminated the related services. In general, the demand for data services continues to rise as reflected in the growth in BVoIP lines.
Continued competition in the telecommunications industry has increasingly resulted in customers using technologies other than traditional phone lines for voice and data. Business customers are moving local voice services to VoIP technology. Generally, VoIP technology is less expensive than traditional wireline phone service, requiring us to respond with more competitive bundled unified service such as our BVoIP product.
The decrease in voice service revenues for the business channel for the year ended December 31, 2016 compared to the year ended December 31, 2015 was caused primarily by the decline of voice access lines. Business voice access lines decreased 4.3% as of December 31, 2016 compared to 2015. The decline in traditional voice access lines was partially offset by an increase in BVoIP lines of 14%.
Data center services revenues for the year ended December 31, 2016 increased when compared to the prior year period as a result of year-over-year increased Ethernet, security and hardware sales. Data center services is deemed a separate business segment. However, we consider this an integral part of our business channel.
Equipment and managed services sales increased for the year ended December 31, 2016 when compared to the prior year because of large contract installations for certain commercial and institutional customers. Revenue from equipment sales varies from period to period based on the volume of large installation projects.
33
Consumer Channel
The Company continues to transform its consumer channel by replacing traditional voice services with next generation strategic services. The Company considers strategic service revenues in the consumer channel to include video and internet services. Consumer strategic revenues increased $3.2 million for the year ended December 31, 2016 and now represent 49% of the total consumer channel revenues compared to 46% in the prior year.
Video services revenue increased for the year ended December 31, 2016 compared to the prior year due to an increase in video subscribers of 5,681 as well as in increase in the rates charged subscribers.
Internet revenues for the year ended December 31, 2016 decreased compared to the prior year as a result of the combined effect of competitive pricing and decline in internet subscribers.
The decrease in voice services revenue for the year ended December 31, 2016 compared to the year ended December 31, 2015 was caused primarily by a decline in voice access lines. Consumer voice access lines decreased 10.9% during the year which contributed an estimated $8.7 million to the decline in consumer voice services revenue. Residential customers are increasingly using wireless services in place of traditional wireline phone services as well as using VoIP technology offered by cable competitors.
In an effort to slow the rate of internet and voice line loss, we are continuing retention and acquisition programs, and are increasingly focusing efforts on bundling of services. We have instituted various “saves” campaigns designed to focus on specific circumstances where we believe customer churn is controllable. These campaigns include targeted offers to “at risk” customers as well as other promotional tools designed to enhance customer retention. We also emphasize win back and employee referral programs. Additionally, we are intensifying our efforts relative to developing tools and training to enhance our customer service capability to improve customer retention and growth.
Wholesale and Other Channel
Wholesale carrier revenue decreased for the year ended December 31, 2016 compared to the prior year as certain carriers have replaced older legacy circuits with more cost effective higher bandwidth solutions.
Other revenue decreased for the year ended December 31, 2016 compared to the year ended December 31, 2015 because of a decline in ancillary services. There has been a reduction in marketing effort on certain ancillary products, such as wireless, as we focus on other telecommunication and data center services.
34
Operating Revenues (dollars in thousands)
|
|
|
For the Year Ended |
|
|
|
|
|
|
||||
|
|
|
December 31, |
|
Change |
|
|||||||
|
|
|
2015 |
|
2014 |
|
Amount |
|
Percentage |
|
|||
|
Business |
|
|
|
|
|
|
|
|
|
|
|
|
|
Data services |
|
$ |
49,327 |
|
$ |
44,832 |
|
$ |
4,495 |
|
10.0 |
% |
|
Voice services |
|
|
93,722 |
|
|
98,936 |
|
|
(5,214) |
|
(5.3) |
% |
|
Data center services |
|
|
11,094 |
|
|
10,737 |
|
|
357 |
|
3.3 |
% |
|
Equipment and managed services |
|
|
20,546 |
|
|
19,324 |
|
|
1,222 |
|
6.3 |
% |
|
|
|
|
174,689 |
|
|
173,829 |
|
|
860 |
|
0.5 |
% |
|
Consumer |
|
|
|
|
|
|
|
|
|
|
|
|
|
Video services |
|
|
33,666 |
|
|
23,810 |
|
|
9,856 |
|
41.4 |
% |
|
Internet services |
|
|
32,687 |
|
|
31,024 |
|
|
1,663 |
|
5.4 |
% |
|
Voice services |
|
|
79,273 |
|
|
87,263 |
|
|
(7,990) |
|
(9.2) |
% |
|
|
|
|
145,626 |
|
|
142,097 |
|
|
3,529 |
|
2.5 |
% |
|
Wholesale carrier data |
|
|
56,430 |
|
|
57,771 |
|
|
(1,341) |
|
(2.3) |
% |
|
Other |
|
|
16,668 |
|
|
17,042 |
|
|
(374) |
|
(2.2) |
% |
|
|
|
$ |
393,413 |
|
$ |
390,739 |
|
$ |
2,674 |
|
0.7 |
% |
Business Channel
Business data services revenue for the year ended December 31, 2015 increased when compared to the prior year as demand for data services continued to grow as reflected in the growth in data lines and BVoIP lines.
The decrease in voice services revenues for the year ended December 31, 2015 compared to the prior year period was caused primarily by the decline of voice access lines from 2014 to 2015 because of the same factors discussed previously for the decline from 2015 to 2016. Business voice access lines decreased 4.3% during the period for an estimated $4.3 million impact.
Data center services revenues for the year ended December 31, 2015 increased when compared to the prior year period as a result of year-over-year increased virtual colocation services.
Equipment and managed services sales for the year ended December 31, 2015 compared to the year ended December 31, 2014 increased because of large contract installations for certain institutional customers.
Consumer Channel
Video service revenue increased for the year ended December 31, 2015 compared to the prior year due to an increase in video subscribers of 7,752 as well as in increase in the rates charged subscribers.
Internet services revenue for the year ended December 31, 2015 increased when compared to the prior year as a result of a rate increase and as more customers were subject to premium pricing on higher bandwidth offerings. Consumer internet lines did not change significantly between December 31, 2015 and December 31, 2014.
The decrease in voice services revenues for the consumer channel for the year ended December 31, 2015 compared to the prior year period was caused primarily by the decline of voice access lines from 2014 to 2015 because of the same factors discussed previously for the decline from 2015 to 2016. Residential voice access lines decreased 10.3% during the period for an estimated $9.0 million impact.
35
Wholesale and Other Channel
Wholesale carrier revenue for the year ended December 31, 2015 compared to the prior year period decreased as certain carriers have replaced older legacy circuits with more cost effective alternatives.
Other revenue was impacted by government subsidies from the Universal Service Fund which increased for the year ended December 31, 2015 compared to the prior year by $2.5 million. In conjunction with reforming the Universal
Service Fund, the Federal Communications Commission (“FCC”) established the Connect America Fund (“CAF”) which provides incremental support to broadband service providers. CAF Phase II is the long-term component of the program. In August 2015, we notified the FCC that we are accepting CAF Phase II support which amounts to $4.4 million in annual funding. This support was retroactive through the beginning of 2015, net of certain other receipts from the Universal Service Fund, and will continue for six years. Under the terms of the CAF Phase II, we will offer broadband service at 10 Mbps downstream and 1 Mbps upstream or better to approximately 11,000 eligible locations in high-cost areas in the State of Hawaii and will provide voice and broadband services at reasonable rates. For the year ended December 31, 2015, we recognized $3.3 million in CAF Phase II subsidies as revenue in the consolidated statement of income.
Other revenues declined for the year ended December 31, 2015 compared to the year ended December 31, 2014, despite the increase in government subsidies, as there has been a reduction in marketing effort on certain ancillary products, such as wireless, as we focus on other telecommunication and data center services.
Operating Costs and Expenses
The following table summarizes our costs and expenses for 2016 compared to the costs and expenses for 2015 (dollars in thousands):
|
|
|
For the Year Ended |
|
|
|
|
|
|
||||
|
|
|
December 31, |
|
Change |
|
|||||||
|
|
|
2016 |
|
2015 |
|
Amount |
|
Percentage |
|
|||
|
Cost of revenues (exclusive of depreciation and amortization) |
|
$ |
165,835 |
|
$ |
162,474 |
|
$ |
3,361 |
|
2.1 |
% |
|
Selling, general and administrative expenses |
|
|
118,420 |
|
|
123,798 |
|
|
(5,378) |
|
(4.3) |
% |
|
Depreciation and amortization |
|
|
89,916 |
|
|
87,879 |
|
|
2,037 |
|
2.3 |
% |
|
|
|
$ |
374,171 |
|
$ |
374,151 |
|
$ |
20 |
|
0.0 |
% |
|
|
|
|
|
|
|
|
|
|
|
|
|
|
|
By segment — |
|
|
|
|
|
|
|
|
|
|
|
|
|
Telecommunications |
$ |
361,002 |
$ |
362,158 |
$ |
(1,156) | (0.3) |
% |
||||
|
Data center |
13,169 | 11,993 | 1,176 | 9.8 |
% |
|||||||
|
$ |
374,171 |
$ |
374,151 |
$ |
20 | 0.0 |
% |
|||||
The Company’s total headcount as of December 31, 2016 was 1,290 compared to 1,315 as of December 31, 2015. Employee related costs are included in both cost of revenues and selling, general and administrative expenses.
Cost of revenues consists of costs we incur to provide our products and services including those for operating and maintaining our networks, installing and maintaining customer premise equipment, and cost of services sold directly associated with various products. Costs of revenue for the year ended December 31, 2016 increased when compared to the prior year because of higher content costs for Hawaiian Telcom TV of $6.8 million as we add subscribers. These increases were offset by lower electricity charges of $1.9 million on lower rates and usage from various power saving initiatives. In addition, wages were lower by $1.9 million related to less time needed for rain related repairs and efficiencies in the use of our workforce.
Selling, general and administrative expenses include costs related to sales and marketing, information systems and other administrative functions. The decrease for the year ended December 31, 2016 compared to the prior year period was due to lower pension costs of $4.7 million. There was a significantly higher volume of retirements involving
36
lump sum pension settlements in 2015 resulting in much higher pension settlement losses being recognized in 2015. The balance of the decrease is due to various cost savings measures initiated during 2016.
Depreciation and amortization for the year ended December 31, 2016 was higher by $2.0 million than the prior year due to asset additions to support growth in the business for next-generation services such as video, and higher speed internet and data.
The cause of the change in operating costs and expenses for the telecommunications segment for the year ended December 31, 2016 compared to the same period in 2015 are the same as those explaining changes in costs and expenses for all segments discussed above.
The increase in operating costs and expenses for the data center services segment for the year ended December 31, 2016 compared to the year ended December 31, 2015 is due to greater direct costs of services of $1.0 million with increased service volumes.
The following table summarizes our costs and expense for the year ended December 31, 2015 compared to the year ended December 31, 2014 (dollars in thousands).
|
|
|
For the Year Ended |
|
|
|
|
|
|
||||
|
|
|
December 31, |
|
Change |
|
|||||||
|
|
|
2015 |
|
2014 |
|
Amount |
|
Percentage |
|
|||
|
Cost of revenues (exclusive of depreciation and amortization) |
|
$ |
162,474 |
|
$ |
166,280 |
|
$ |
(3,806) |
|
(2.3) |
% |
|
Selling, general and administrative expenses |
|
|
123,798 |
|
|
115,974 |
|
|
7,824 |
|
6.7 |
% |
|
Depreciation and amortization |
|
|
87,879 |
|
|
78,014 |
|
|
9,865 |
|
12.6 |
% |
|
|
|
$ |
374,151 |
|
$ |
360,268 |
|
$ |
13,883 |
|
3.9 |
% |
|
|
|
|
|
|
|
|
|
|
|
|
|
|
|
By segment — |
|
|
|
|
|
|
|
|
|
|
|
|
|
Telecommunications |
|
$ |
362,158 |
|
$ |
349,319 |
|
$ |
12,839 |
|
3.7 |
% |
|
Data center |
|
|
11,993 |
|
|
10,949 |
|
|
1,044 |
|
9.5 |
% |
|
|
|
$ |
374,151 |
|
$ |
360,268 |
|
$ |
13,883 |
|
3.9 |
% |
The Company’s total headcount as of December 31, 2015 was 1,315 compared to 1,361 as of December 31, 2014. Employee related costs are included in both cost of revenues and selling, general and administrative expenses.
Costs of revenue for the year ended December 31, 2015 decreased when compared to the prior year due to lower wages and benefits of $4.5 million on lower headcount. In addition, costs declined on lower electricity charges of $5.3 million on lower rates and usage from various power saving initiatives. These decreases were offset by increased content costs for Hawaiian Telcom TV of $5.8 million as we add subscribers.
Selling, general and administrative expenses increased for the year ended December 31, 2015 compared to the prior year period was due to the pension settlement loss of $8.1 million. The settlement loss occurred due to a large number of retirements in 2015.
Depreciation and amortization for the year ended December 31, 2015 was higher by $9.9 million than the same period in the prior year due to asset additions to support growth in the business for next-generation services such as video, and higher speed internet and data.
The cause of the change in operating costs and expenses for the telecommunications segment for the year ended December 31, 2015 compared to the same period in 2014 are the same as those above explaining changes in costs and expenses for all segments.
The increase in operating costs and expenses for the data center services segment for the year ended December 31, 2015 compared to the year ended December 31, 2014 is due to greater costs for leased circuits of $0.5 million with
37
increased service volumes. In addition, for 2015, depreciation increased $0.5 million on asset additions to our data center made to support expected business growth.
Other Income and (Expense)
The following table summarizes other income (expense) for the years ended December 31, 2016 and 2015 (dollars in thousands).
|
|
|
For the Year Ended |
|
|
|
|
|
|
||||
|
|
|
December 31, |
|
Change |
|
|||||||
|
|
|
2016 |
|
2015 |
|
Amount |
|
Percentage |
|
|||
|
Interest expense |
|
$ |
(17,095) |
|
$ |
(16,786) |
|
$ |
(309) |
|
1.8 |
% |
|
Interest income and other |
|
|
— |
|
|
(19) |
|
|
19 |
|
(100.0) |
% |
|
|
|
$ |
(17,095) |
|
$ |
(16,805) |
|
$ |
(290) |
|
1.7 |
% |
Interest expense for the year ended December 31, 2016 compared to the prior year increased due to the term loan amendment entered into in May 2016 which resulted in a higher interest rate and certain financing costs expensed as part of the amendment process. Interest capitalized amounted to $1.6 million and $1.1 million for the years ended December 31, 2016 and 2015, respectively.
The following table summarizes other income (expense) for the years ended December 31, 2015 and 2014 (dollars in thousands).
|
|
|
For the Year Ended |
|
|
|
|
|
|
||||
|
|
|
December 31, |
|
Change |
|
|||||||
|
|
|
2015 |
|
2014 |
|
Amount |
|
Percentage |
|
|||
|
Interest expense |
|
$ |
(16,786) |
|
$ |
(16,496) |
|
$ |
(290) |
|
1.8 |
% |
|
Interest income and other |
|
|
(19) |
|
|
34 |
|
|
(53) |
|
(155.9) |
% |
|
|
|
$ |
(16,805) |
|
$ |
(16,462) |
|
$ |
(343) |
|
2.1 |
% |
Interest expense for the year ended December 31, 2015 compared to the same period in the prior year increased due to new installment financing incurred at the end of 2014. Interest capitalized amounted to $1.1 million for both the years ended December 31, 2015 and 2014.
Income Tax
We had effective tax rates of 34.8% and 55.2% for the years ended December 31, 2016 and 2015, respectively. We had effective tax rates of 55.2% and 42.2% for the years ended December 31, 2015 and 2014, respectively. We consider a variety of factors in determining the effective tax rate, including the U.S. federal statutory rate, expected nondeductible expenses and estimated state taxes. The rate for the year ended December 31, 2015 was higher than both the prior and subsequent year as certain permanent differences between financial reporting and income tax income, in particular related to the deduction limitation for compensation, were proportionately larger relative to the pretax income in that year.
As of December 31, 2016, net operating losses available for carry forward through 2036 amounted to $166.5 million for federal purposes and $172.5 million for state purposes. Availability of net operating losses in future periods may be subject to additional limitations if there is a deemed change in control for income tax reporting purposes. Such change in control will be determined for income tax reporting purposes based on cumulative changes in stock ownership over a defined period.
We have recognized significant deferred income tax assets related to net operating losses available for carry forward and for differences between income for financial and tax reporting purposes. If there is a decline in the level of actual future or forecasted earnings, the conclusion regarding the need for a valuation allowance may change in future periods resulting in the establishment of a valuation allowance for some or all of our deferred income tax assets.
38
Liquidity and Capital Resources
As of December 31, 2016, we had cash of $15.8 million. From an ongoing operating perspective, our cash requirements going into 2017 consist of supporting the development and introduction of new products, capital expenditure projects, pension funding obligations and other changes in working capital. A combination of cash‑on‑hand, cash generated from operating activities and available financing will be used to fund our cash requirements.
We continue to focus on improving operating results, including efforts to simplify product offerings, improve our customer service experience and increase our revenue enhancement activities. There can be no assurance that these actions will result in improved overall cash flow. We continue to have sizable retirement obligations for our existing employee base. Any sustained declines in the value of pension trust assets or relatively high levels of pension lump sum benefit payments, such as those paid in 2015, will increase the magnitude of future plan contributions.
Agreements with the HPUC and the debt agreements of Hawaiian Telcom Communications, Inc. limit the ability of our subsidiaries to pay dividends to the parent company and restrict the net assets of all of our subsidiaries. This can limit our ability to pay dividends to our shareholders. As the parent company has no operations, debt or other obligations, this restriction has no other immediate impact on our operations.
Cash Flows
Our primary source of funds continues to be cash generated from operations. We use the net cash generated from operations to fund network expansion and modernization to facilitate enhanced services. We expect that our capital spending requirements will continue to be financed through internally generated funds. We also expect to use cash generated in future periods for debt service. Additional debt or equity financing may be needed to fund additional development activities or to maintain our capital structure to ensure financial flexibility.
Net cash provided by operating activities amounted to $90.1 million for 2016 and $90.6 million for 2015. Cash provided by operations was comparable between years. Net cash provided by operating activities was also comparable for the years ended December 31, 2015 and 2014.
Cash used in investing activities for 2016 was comprised of capital expenditures of $97.8 million which was comparable to capital expenditures of $99.0 million in 2015. In 2016, there was a continued emphasis on building out of our next generation network to support new products such as Hawaiian Telcom TV as well as higher speed internet. The level of capital expenditures for 2017 is expected to be less than 2016 as we scale back capital on certain elements of our network expansion initiatives focusing on those directly related to sales opportunities.
Cash used in investing activities included capital expenditures of $99.0 million and $96.7 million for the years ended December 31, 2015 and 2014, respectively. The increase was because of continued emphasis of building out of our next generation network to support new products such as Hawaiian Telcom TV as well as higher speed internet.
Cash used in financing activities for each of the three years ended December 31, 2016 was related primarily to the repayment of our debt and satisfaction of other obligations. In addition, during the year ended December 31, 2015, we received $6.9 million upon the exercise of warrants for cash. During the year ended December 31, 2014, we sold most of our radio towers for $2.9 million. The sale agreement includes a leaseback by us for a minimum of 10 years to allow us to continue to use the towers for radio equipment. We accounted for the sale as a financing transaction.
Outstanding Debt and Financing Arrangements
As of December 31, 2016, we had outstanding $290.1 million in aggregate long‑term debt and an undrawn $30.0 million revolving line of credit.
Our bank credit facilities contain various negative and affirmative covenants that restrict, among other things, incurrence of additional indebtedness, payment of dividends, redemptions of stock, other distributions to shareholders and sales of assets. In addition, there are financial covenants which have the following metrics as of December 31, 2016:
39
interest coverage with minimum allowed ratio of 4.50:1 of earnings before interest, taxes, depreciation and amortization to interest expense; leverage with maximum allowed ratio of 3.00:1 of indebtedness to earnings before interest, taxes, depreciation and amortization; and a maximum level of annual capital expenditures of $105.0 million. We were in compliance with these covenants as of December 31, 2016.
In February 2017, we entered into a delayed draw credit agreement for new term loans and a new revolving credit facility. The new facility provides a commitment to fund repayment of the existing term loan and replacement of the existing revolving credit facility in May 2017. Included in the new facility is a term loan for $90.0 million with a maturity in 2022 and another term loan for $230.0 million with a maturity in 2023. The agreement also provides for a new line of credit for $30.0 million with a maturity in 2022.
With our new debt structure, we do not expect to generate the necessary cash flows from operations to repay the facility in its entirety by the maturity dates of 2022 and 2023. Repayment is dependent on our ability to refinance the credit facility in the future at reasonable terms. The ability to refinance the indebtedness at reasonable terms before maturity cannot be assured.
Contractual Obligations
The following table sets forth our long‑term debt and contractual obligations for the next several years. The term loan facility and debt interest obligation are based on the balance and provisions of the term loan as of December 31, 2016. Pension funding obligations are based on known fixed funding. Additional obligations are expected in future periods. Obligations are as follows (dollars in thousands):
|
|
|
|
|
|
2018 and |
|
2020 and |
|
2022 and |
|
|
|
|
|||
|
|
|
2017 |
|
2019 |
|
2021 |
|
Thereafter |
|
Total |
|
|||||
|
Term loan facility |
|
$ |
3,000 |
|
$ |
287,138 |
|
$ |
— |
|
$ |
— |
|
$ |
290,138 |
|
|
Debt interest |
|
|
15,173 |
|
|
22,465 |
|
|
— |
|
|
— |
|
|
37,638 |
|
|
Pension funding obligations |
|
|
4,804 |
|
|
— |
|
|
— |
|
|
— |
|
|
4,804 |
|
|
Operating leases |
|
|
2,208 |
|
|
3,474 |
|
|
2,816 |
|
|
5,478 |
|
|
13,976 |
|
|
Supplier contracts |
|
|
16,786 |
|
|
14,848 |
|
|
— |
|
|
— |
|
|
31,634 |
|
|
Other installment contracts |
|
|
2,797 |
|
|
2,495 |
|
|
1,999 |
|
|
7,103 |
|
|
14,394 |
|
|
Total |
|
$ |
44,768 |
|
$ |
330,420 |
|
$ |
4,815 |
|
$ |
12,581 |
|
$ |
392,584 |
|
We do not maintain any off balance sheet financing or other arrangements.
40
Critical Accounting Policies and Estimates
The preparation of consolidated financial statements in conformity with accounting principles generally accepted in the United States of America requires management to make estimates and assumptions that affect amounts reported in consolidated financial statements. Changes in these estimates and assumptions are considered reasonably possible and may have a material effect on the consolidated financial statements and thus actual results could differ from the amounts reported and disclosed herein. The following is a summary of certain policies considered critical by management.
Goodwill and Indefinite‑Lived Intangible Assets
Goodwill and intangible assets not subject to amortization are tested for impairment annually, or when events or changes in circumstances indicate that the asset might be impaired. For goodwill, a two‑step impairment test is performed. The first step compares the fair value of a reporting unit with its carrying amount, including goodwill. If the carrying value of a reporting unit exceeds its fair value, the second step of the impairment test is performed to measure the amount of impairment loss. The second step compares the implied fair value of the reporting unit goodwill with the carrying amount of that goodwill. The implied fair value is determined by allocating the fair value of a reporting unit to all of the assets and liabilities of that unit as if the reporting unit had been acquired in a business combination. The excess of the fair value of a reporting unit over the amounts assigned to its assets and liabilities is the implied fair value of goodwill. If the carrying amount of the reporting unit goodwill is in excess of the implied fair value of that goodwill, then an impairment loss is recognized equal to that excess. For indefinite‑lived intangible assets, the impairment test consists of a comparison of the fair value of the intangible asset with its carrying value. If the carrying value of an indefinite‑lived intangible asset exceeds its fair value, an impairment loss is recognized in an amount equal to that excess. Fair value is an estimate based on either an approach using market capitalization or on the present value of an expected range of future cash flows.
The expected range of future cash flows is based on internal forecasts developed utilizing management’s knowledge of the business and the anticipated effects of market forces. The use of different assumptions or estimates of future cash flows could produce different impairment amounts (or none at all) for goodwill and indefinite‑lived intangible assets. A significant amount of judgment is involved in developing these internal forecasts and determining if an impairment has occurred. Assumptions and estimates that could generate an impairment loss include lower-than-expected future cash flows resulting from slower than anticipated revenue growth or lower than anticipated profitability. Any adverse changes in the projected cash flows could affect our conclusions as to the recoverability of goodwill and may result in an impairment loss.
Goodwill subject to impairment testing at December 31, 2016 amounted to $10.5 million for the data center services reporting unit and $1.6 million for the telecommunications unit. For both reporting units the fair value of the reporting unit was above the carrying value allowing us to conclude there is no impairment in goodwill at this time. Significant assumptions which are reasonably possible of changing in future periods relate to control premiums used for the market capitalization approach and to projection of future cash flows used for determining the reporting unit value for goodwill impairment evaluation and for determining the brand name value for the indefinite-lived intangible asset impairment evaluation. For the brand name intangible assets, future cash flows were estimated using a relief of royalty method using an assumed royalty rate of one percent applied to projected revenues. In addition, the discount rates used are based on the estimated weighted average cost of capital which is subject to change based on various economic factors.
The discount rate is one of the more significant assumptions used to value both goodwill and indefinite-lived intangible assets. For the intangible asset impairment, a one percent increase in the discount rate would reduce the estimated fair value of the intangible asset by over 10 percent.
41
Impairment of Long‑Lived Assets and Definite‑Lived Intangibles
We assess the recoverability of long‑lived assets, including property, plant and equipment and definite‑lived intangible assets, whenever events or changes in circumstances indicate that the carrying amount of an asset may not be recoverable. In such cases, if the sum of the expected cash flows, undiscounted and without interest, resulting from use of the asset is less than the carrying amount, an impairment loss is recognized based on the difference between the carrying amount and the fair value of the assets. When determining future cash flow estimates, we consider historical operating results, as adjusted to reflect current and anticipated operating conditions. Estimating future cash flows requires significant judgment by us in such areas as future economic conditions, industry specific conditions and necessary capital expenditures. The use of different assumptions or estimates for future cash flows could produce different impairment amounts (or none at all) for long‑lived assets, including identifiable intangible assets subject to amortization. Significant assumptions which are reasonably possible of changing in future periods relate to projection of future cash flows generated by the long‑lived assets which are dependent on projections of company‑wide profitability and capital expenditures for maintaining our network in future periods. In addition, estimates of the cash generating useful lives are also critical to such evaluations.
Revenue Recognition
We recognize revenue when evidence of an arrangement exists, the earnings process is complete and collectability is reasonably assured. We recognize service revenues based upon usage of our local exchange network and facilities and contract fees. In general, fixed fees for local telephone, Internet access, television, data center services and certain other services are billed one month in advance and recognized the following month when earned. Revenue from other products that are not fixed fee or that exceed contracted amounts is recognized when such services are provided.
Amounts billed to customers for activating wireline service are deferred and recognized over the average customer relationship. The costs associated with activating such services are deferred and recognized as an operating expense over the same period. Costs in excess of revenues are recognized as expense in the period in which activation occurs. Other charges for activation are generally deferred and recognized in revenue over the contract term.
Universal Service revenue subsidies, such as Connect America Fund Phase II, are government‑sponsored support received in association with providing service in mostly rural, high‑cost areas. These revenues are typically calculated by the government agency responsible for administering the support program. These revenues are recognized as granted by the government agency.
Telecommunication systems and structured cabling project revenues are recognized on a percentage completion basis, generally based on the relative portion of costs incurred to total estimated costs of a project, except for short duration projects which are recognized upon completion of the project. Maintenance services are recorded when the service is provided.
Allowance for Doubtful Accounts
Our allowance for doubtful accounts reflects reserves for customer receivables to reduce receivables to amounts expected to be collected. In estimating uncollectible amounts, management considers factors such as current overall economic conditions, industry‑specific economic conditions, historical customer performance and anticipated customer performance. While we believe our process effectively addresses our exposure for doubtful accounts, changes in economic, industry or specific customer conditions may require adjustment to the allowance for doubtful accounts recognized by us.
Income Taxes
Management calculates the income tax provision, current and deferred income taxes along with the valuation allowance based upon various complex estimates and interpretations of income tax laws and regulations. Valuation allowances are recognized to reduce deferred tax assets to the amount that will more likely than not be realized. The most significant assumption in this process are projections of future income which are reasonably possible of changing in future periods.
42
Employee‑Related Benefits
We incur certain employee‑related costs associated with pensions and post‑ retirement health care benefits. In order to measure the expense associated with these employee‑related benefits, management must make a variety of estimates, including discount rates used to measure the present value of certain liabilities, assumed rates of return on assets set aside to fund these expenses, employee turnover rates, anticipated mortality rates and anticipated healthcare costs. The estimates used by management are based on our historical experience, as well as current facts and circumstances. We use third‑party specialists to assist management in appropriately measuring the expenses associated with these employee‑related benefits. Different estimates could result in our recognizing different amounts of expense over different time periods.
The discount rate used for determining the year‑end benefit plan obligation was calculated using a weighting of expected benefit payments and rates associated with high‑quality U.S. corporate bonds for each year of expected payment to derive a single estimated rate at which the benefits could be effectively settled. A change in the estimated discount rate would have a direct inverse impact on the recorded employee benefit obligation liability. Based on past experience, relatively small changes in the discount rate do not have a significant impact on the pension and other postretirement benefit cost but a substantial change in the rate is likely to have a large impact.
The estimated return on plan assets was based on historical trends combined with long‑term expectations. In selecting the rate of return on plan assets for purposes of determining net periodic benefit cost, we considered economic forecasts for the types of investments held by the plans (primarily equity and fixed income investments), and the plans’ asset allocations. While primary emphasis was on the economic forecasts of long‑term returns, consideration was given to the past performance of the plans’ assets. The assumption is based on consideration of all inputs, with a focus on long‑term trends to avoid short‑term market influences. Assumptions are not changed unless structural trends in the underlying economy are identified, our asset strategy changes, or there are significant changes in other inputs. The method for selecting the expected return on plan assets did not change from prior periods.
Item 7A. Quantitative and Qualitative Disclosures About Market Risk
As of December 31, 2016, our floating rate obligations consisted of $290.1 million of debt outstanding under our term loan facility. Accordingly, our earnings and cash flow are affected by changes in interest rates. Based on our borrowings at December 31, 2016 and assuming a 1.0 percentage point increase or decrease in the average interest rate under these borrowings, we estimate that our annual interest expense would increase or decrease by approximately $2.9 million.
43
Item 8. Financial Statements and Supplementary Data
Index to Financial Statements
44
Management’s Annual Report on Internal Control over Financial Reporting
Management of Hawaiian Telcom Holdco, Inc. (the “Company”), including the Chief Executive Officer and the Chief Financial Officer, is responsible for establishing and maintaining adequate internal control over financial reporting, as defined in Rules 13a‑15(f) and 15d‑15(f) of the Securities Exchange Act of 1934, as amended. The Company’s internal controls were designed to provide assurance as to the reliability of its financial reporting and the preparation and presentation of the consolidated financial statements for external purposes in accordance with accounting principles generally accepted in the United States and includes those policies and procedures that (1) pertain to the maintenance of records that, in reasonable detail, accurately and fairly reflect the transactions and dispositions of the assets of the Company; (2) provide assurance that transactions are recorded as necessary to permit preparation of financial statements in accordance with generally accepted accounting principles, and that receipts and expenditures of the Company are being made only in accordance with authorizations of management and directors of the Company; and (3) provide assurance regarding prevention or timely detection of unauthorized acquisition, use or disposition of the Company’s assets that could have a material effect on the financial statements.
The Company conducted an evaluation of the effectiveness of its internal control over financial reporting based on the criteria in Internal Control—Integrated Framework (2013) issued by the Committee of Sponsoring Organizations of the Treadway Commission. This evaluation included review of the documentation of controls, evaluation of the design effectiveness of controls, testing of the operating effectiveness of controls and a conclusion on this evaluation. There are inherent limitations in the effectiveness of any system of internal control over financial reporting; however, based on the evaluation, management has concluded the Company’s internal control over financial reporting was effective as of December 31, 2016.
The Company’s independent registered public accounting firm has audited the accompanying consolidated financial statements and the Company’s internal control over financial reporting. The reports of the independent registered public accounting firm are included in this Annual Report on Form 10‑K on the following pages.
|
/s/ Scott K. Barber |
|
/s/ Dan T. Bessey |
|
Scott K. Barber |
|
Dan T. Bessey |
|
Chief Executive Officer |
|
Senior Vice President and Chief Financial Officer |
|
March 14, 2017 |
|
March 14, 2017 |
45
Report of Independent Registered Public Accounting Firm
To the Board of Directors and Stockholders of
Hawaiian Telcom Holdco, Inc.
Honolulu, Hawaii
We have audited the accompanying consolidated balance sheets of Hawaiian Telcom Holdco, Inc. and subsidiaries (the “Company”) as of December 31, 2016 and 2015, and the related consolidated statements of income, comprehensive income (loss), changes in stockholders’ equity, and cash flows for each of the three years in the period ended December 31, 2016. These financial statements are the responsibility of the Company’s management. Our responsibility is to express an opinion on these financial statements based on our audits.
We conducted our audits in accordance with the standards of the Public Company Accounting Oversight Board (United States). Those standards require that we plan and perform the audit to obtain reasonable assurance about whether the financial statements are free of material misstatement. An audit includes examining, on a test basis, evidence supporting the amounts and disclosures in the financial statements. An audit also includes assessing the accounting principles used and significant estimates made by management, as well as evaluating the overall financial statement presentation. We believe that our audits provide a reasonable basis for our opinion.
In our opinion, such consolidated financial statements present fairly, in all material respects, the financial position of Hawaiian Telcom Holdco, Inc. and subsidiaries as of December 31, 2016 and 2015, and the results of their operations and their cash flows for each of the three years in the period ended December 31, 2016, in conformity with accounting principles generally accepted in the United States of America.
We have also audited, in accordance with the standards of the Public Company Accounting Oversight Board (United States), the Company’s internal control over financial reporting as of December 31, 2016, based on the criteria established in Internal Control—Integrated Framework (2013) issued by the Committee of Sponsoring Organizations of the Treadway Commission and our report dated March 14, 2017 expressed an unqualified opinion on the Company’s internal control over financial reporting.
/s/ DELOITTE & TOUCHE LLP
Honolulu, Hawaii
March 14, 2017
46
Report of Independent Registered Public Accounting Firm
To the Board of Directors and Stockholders of
Hawaiian Telcom Holdco, Inc.
Honolulu, Hawaii
We have audited the internal control over financial reporting of Hawaiian Telcom Holdco, Inc. and subsidiaries (the “Company”) as of December 31, 2016, based on criteria established in Internal Control—Integrated Framework (2013) issued by the Committee of Sponsoring Organizations of the Treadway Commission. The Company’s management is responsible for maintaining effective internal control over financial reporting and for its assessment of the effectiveness of internal control over financial reporting, included in the accompanying Management’s Annual Report on Internal Control over Financial Reporting. Our responsibility is to express an opinion on the Company’s internal control over financial reporting based on our audit.
We conducted our audit in accordance with the standards of the Public Company Accounting Oversight Board (United States). Those standards require that we plan and perform the audit to obtain reasonable assurance about whether effective internal control over financial reporting was maintained in all material respects. Our audit included obtaining an understanding of internal control over financial reporting, assessing the risk that a material weakness exists, testing and evaluating the design and operating effectiveness of internal control based on the assessed risk, and performing such other procedures as we considered necessary in the circumstances. We believe that our audit provides a reasonable basis for our opinion.
A company’s internal control over financial reporting is a process designed by, or under the supervision of, the company’s principal executive and principal financial officers, or persons performing similar functions, and effected by the company’s board of directors, management, and other personnel to provide reasonable assurance regarding the reliability of financial reporting and the preparation of financial statements for external purposes in accordance with generally accepted accounting principles. A company’s internal control over financial reporting includes those policies and procedures that (1) pertain to the maintenance of records that, in reasonable detail, accurately and fairly reflect the transactions and dispositions of the assets of the company; (2) provide reasonable assurance that transactions are recorded as necessary to permit preparation of financial statements in accordance with generally accepted accounting principles, and that receipts and expenditures of the company are being made only in accordance with authorizations of management and directors of the company; and (3) provide reasonable assurance regarding prevention or timely detection of unauthorized acquisition, use, or disposition of the company’s assets that could have a material effect on the financial statements.
Because of the inherent limitations of internal control over financial reporting, including the possibility of collusion or improper management override of controls, material misstatements due to error or fraud may not be prevented or detected on a timely basis. Also, projections of any evaluation of the effectiveness of the internal control over financial reporting to future periods are subject to the risk that the controls may become inadequate because of changes in conditions, or that the degree of compliance with the policies or procedures may deteriorate.
In our opinion, the Company maintained, in all material respects, effective internal control over financial reporting as of December 31, 2016, based on the criteria established in Internal Control—Integrated Framework (2013) issued by the Committee of Sponsoring Organizations of the Treadway Commission.
We have also audited, in accordance with the standards of the Public Company Accounting Oversight Board (United States), the consolidated financial statements as of and for the year ended December 31, 2016 of the Company and our report dated March 14, 2017 expressed an unqualified opinion on those financial statements.
/s/ DELOITTE & TOUCHE LLP
Honolulu, Hawaii
March 14, 2017
47
Hawaiian Telcom Holdco, Inc.
Consolidated Statements of Income
(Dollars in thousands, except per share amounts)
|
|
|
|
For the Year Ended December 31, |
|
|||||||
|
|
|
|
2016 |
|
2015 |
|
2014 |
|
|||
|
Operating revenues |
|
|
$ |
392,963 |
|
$ |
393,413 |
|
$ |
390,739 |
|
|
Operating expenses: |
|
|
|
|
|
|
|
|
|
|
|
|
Cost of revenues (exclusive of depreciation and amortization) |
|
|
|
165,835 |
|
|
162,474 |
|
|
166,280 |
|
|
Selling, general and administrative |
|
|
|
118,420 |
|
|
123,798 |
|
|
115,974 |
|
|
Depreciation and amortization |
|
|
|
89,916 |
|
|
87,879 |
|
|
78,014 |
|
|
Total operating expenses |
|
|
|
374,171 |
|
|
374,151 |
|
|
360,268 |
|
|
Operating income |
|
|
|
18,792 |
|
|
19,262 |
|
|
30,471 |
|
|
Other income (expense): |
|
|
|
|
|
|
|
|
|
|
|
|
Interest expense |
|
|
|
(17,095) |
|
|
(16,786) |
|
|
(16,496) |
|
|
Interest income and other |
|
|
|
— |
|
|
(19) |
|
|
34 |
|
|
Total other expense |
|
|
|
(17,095) |
|
|
(16,805) |
|
|
(16,462) |
|
|
Income before income tax provision |
|
|
|
1,697 |
|
|
2,457 |
|
|
14,009 |
|
|
Income tax provision |
|
|
|
591 |
|
|
1,357 |
|
|
5,910 |
|
|
Net income |
|
|
$ |
1,106 |
|
$ |
1,100 |
|
$ |
8,099 |
|
|
Net income per common share - |
|
|
|
|
|
|
|
|
|
|
|
|
Basic |
|
|
$ |
0.10 |
|
$ |
0.10 |
|
$ |
0.76 |
|
|
Diluted |
|
|
$ |
0.10 |
|
$ |
0.10 |
|
$ |
0.72 |
|
|
Weighted average shares used to compute net income per common share - |
|
|
|
|
|
|
|
|
|
|
|
|
Basic |
|
|
|
11,503,296 |
|
|
10,977,341 |
|
|
10,591,351 |
|
|
Diluted |
|
|
|
11,555,997 |
|
|
11,386,303 |
|
|
11,308,051 |
|
See accompanying notes to consolidated financial statements.
48
Hawaiian Telcom Holdco, Inc.
Consolidated Statements of Comprehensive Income (Loss)
(Dollars in thousands)
|
|
|
For the Year Ended December 31, |
|
|||||||
|
|
|
2016 |
|
2015 |
|
2014 |
|
|||
|
Net income |
|
$ |
1,106 |
|
$ |
1,100 |
|
$ |
8,099 |
|
|
Other comprehensive income (loss): |
|
|
|
|
|
|
|
|
|
|
|
Unrealized holding gain (loss) on investments arising during period |
|
|
— |
|
|
64 |
|
|
(4) |
|
|
Retirement plan loss |
|
|
(9,437) |
|
|
(8,863) |
|
|
(31,124) |
|
|
Income tax benefit on comprehensive loss |
|
|
3,607 |
|
|
3,358 |
|
|
11,897 |
|
|
Other comprehensive loss, net of tax |
|
|
(5,830) |
|
|
(5,441) |
|
|
(19,231) |
|
|
Comprehensive loss |
|
$ |
(4,724) |
|
$ |
(4,341) |
|
$ |
(11,132) |
|
See accompanying notes to consolidated financial statements.
49
Hawaiian Telcom Holdco, Inc.
(Dollars in thousands, except per share information)
|
|
|
December 31, |
|
||||
|
|
|
2016 |
|
2015 |
|
||
|
Assets |
|
|
|
|
|
|
|
|
Current assets |
|
|
|
|
|
|
|
|
Cash and cash equivalents |
|
$ |
15,821 |
|
$ |
30,312 |
|
|
Receivables, net |
|
|
33,377 |
|
|
32,736 |
|
|
Material and supplies |
|
|
8,090 |
|
|
8,499 |
|
|
Prepaid expenses |
|
|
4,093 |
|
|
4,068 |
|
|
Other current assets |
|
|
7,229 |
|
|
2,102 |
|
|
Total current assets |
|
|
68,610 |
|
|
77,717 |
|
|
Property, plant and equipment, net |
|
|
595,997 |
|
|
579,107 |
|
|
Intangible assets, net |
|
|
32,728 |
|
|
34,828 |
|
|
Goodwill |
|
|
12,104 |
|
|
12,104 |
|
|
Deferred income taxes, net |
|
|
92,171 |
|
|
89,896 |
|
|
Other assets |
|
|
2,311 |
|
|
6,043 |
|
|
Total assets |
|
$ |
803,921 |
|
$ |
799,695 |
|
|
Liabilities and Stockholders’ Equity |
|
|
|
|
|
|
|
|
Current liabilities |
|
|
|
|
|
|
|
|
Current portion of long-term debt |
|
$ |
3,000 |
|
$ |
3,000 |
|
|
Accounts payable |
|
|
53,506 |
|
|
44,841 |
|
|
Accrued expenses |
|
|
15,293 |
|
|
14,491 |
|
|
Advance billings and customer deposits |
|
|
15,013 |
|
|
17,551 |
|
|
Other current liabilities |
|
|
6,327 |
|
|
5,932 |
|
|
Total current liabilities |
|
|
93,139 |
|
|
85,815 |
|
|
Long-term debt |
|
|
281,699 |
|
|
283,046 |
|
|
Employee benefit obligations |
|
|
105,930 |
|
|
104,597 |
|
|
Other liabilities |
|
|
18,239 |
|
|
18,538 |
|
|
Total liabilities |
|
|
499,007 |
|
|
491,996 |
|
|
Commitments and contingencies (Note 13) |
|
|
|
|
|
|
|
|
Stockholders’ equity |
|
|
|
|
|
|
|
|
Common stock, par value of $0.01 per share, 245,000,000 shares authorized and 11,513,279 and 11,466,398 shares issued and outstanding at December 31, 2016 and 2015, respectively |
|
|
115 |
|
|
115 |
|
|
Additional paid-in capital |
|
|
179,958 |
|
|
178,019 |
|
|
Accumulated other comprehensive loss |
|
|
(35,218) |
|
|
(29,388) |
|
|
Retained earnings |
|
|
160,059 |
|
|
158,953 |
|
|
Total stockholders’ equity |
|
|
304,914 |
|
|
307,699 |
|
|
Total liabilities and stockholders’ equity |
|
$ |
803,921 |
|
$ |
799,695 |
|
See accompanying notes to consolidated financial statements.
50
Hawaiian Telcom Holdco, Inc.
Consolidated Statements of Cash Flows
(Dollars in thousands)
|
|
|
For the Year Ended |
|
|||||||
|
|
|
December 31, |
|
|||||||
|
|
|
2016 |
|
2015 |
|
2014 |
|
|||
|
Cash flows from operating activities: |
|
|
|
|
|
|
|
|
|
|
|
Net income |
|
$ |
1,106 |
|
$ |
1,100 |
|
$ |
8,099 |
|
|
Adjustments to reconcile net income to net cash provided by operating activities: |
|
|
|
|
|
|
|
|
|
|
|
Depreciation and amortization |
|
|
89,916 |
|
|
87,879 |
|
|
78,014 |
|
|
Deferred financing amortization |
|
|
2,068 |
|
|
1,922 |
|
|
1,855 |
|
|
Employee retirement benefits |
|
|
(8,103) |
|
|
(3,634) |
|
|
(12,078) |
|
|
Provision for uncollectible receivables |
|
|
4,031 |
|
|
3,648 |
|
|
3,590 |
|
|
Stock based compensation |
|
|
2,303 |
|
|
1,584 |
|
|
4,174 |
|
|
Deferred income taxes |
|
|
1,332 |
|
|
1,958 |
|
|
6,851 |
|
|
Changes in operating assets and liabilities: |
|
|
|
|
|
|
|
|
|
|
|
Receivables |
|
|
(4,672) |
|
|
(3,722) |
|
|
(1,731) |
|
|
Material and supplies |
|
|
409 |
|
|
838 |
|
|
(386) |
|
|
Prepaid expenses and other current assets |
|
|
(153) |
|
|
9 |
|
|
(104) |
|
|
Accounts payable and accrued expenses |
|
|
3,935 |
|
|
(9,973) |
|
|
3,882 |
|
|
Advance billings and customer deposits |
|
|
(1,038) |
|
|
8,565 |
|
|
(1,436) |
|
|
Other current liabilities |
|
|
(344) |
|
|
(759) |
|
|
(296) |
|
|
Other |
|
|
(702) |
|
|
1,181 |
|
|
56 |
|
|
Net cash provided by operating activities |
|
|
90,088 |
|
|
90,596 |
|
|
90,490 |
|
|
Cash flows from investing activities: |
|
|
|
|
|
|
|
|
|
|
|
Capital expenditures |
|
|
(97,841) |
|
|
(99,034) |
|
|
(96,706) |
|
|
Proceeds on sale of investments |
|
|
— |
|
|
805 |
|
|
463 |
|
|
Net cash used in investing activities |
|
|
(97,841) |
|
|
(98,229) |
|
|
(96,243) |
|
|
Cash flows from financing activities: |
|
|
|
|
|
|
|
|
|
|
|
Proceeds from exercise of warrant |
|
|
— |
|
|
6,870 |
|
|
— |
|
|
Proceeds from installment financing |
|
|
2,155 |
|
|
2,780 |
|
|
4,336 |
|
|
Repayment of capital lease and installment financing |
|
|
(3,341) |
|
|
(4,217) |
|
|
(3,179) |
|
|
Repayment of debt |
|
|
(3,000) |
|
|
(3,000) |
|
|
(3,000) |
|
|
Refinancing and loan amendment costs |
|
|
(688) |
|
|
(150) |
|
|
— |
|
|
Taxes paid related to net share settlement of equity awards |
|
|
(364) |
|
|
(948) |
|
|
(1,520) |
|
|
Net cash provided by (used in) financing activities |
|
|
(5,238) |
|
|
1,335 |
|
|
(3,363) |
|
|
Net change in cash, cash equivalents and restricted cash |
|
|
(12,991) |
|
|
(6,298) |
|
|
(9,116) |
|
|
Cash, cash equivalents and restricted cash, beginning of period |
|
|
34,137 |
|
|
40,435 |
|
|
49,551 |
|
|
Cash, cash equivalents and restricted cash, end of period |
|
$ |
21,146 |
|
$ |
34,137 |
|
$ |
40,435 |
|
See accompanying notes to consolidated financial statements.
51
Hawaiian Telcom Holdco, Inc.
Consolidated Statements of Changes in Stockholders’ Equity
(Dollars in thousands, except share information)
|
|
|
|
|
|
|
|
|
|
|
Accumulated |
|
|
|
|
|
|
|
|
|
|
|
|
|
|
|
|
Additional |
|
Other |
|
|
|
|
Total |
|
|||
|
|
|
Common Stock |
|
Paid-In |
|
Comprehensive |
|
Retained |
|
Stockholders’ |
|
|||||||
|
|
|
Shares |
|
Amount |
|
Capital |
|
Loss |
|
Earnings |
|
Equity |
|
|||||
|
Balance, January 1, 2014 |
|
10,495,856 |
|
$ |
105 |
|
$ |
167,869 |
|
$ |
(4,716) |
|
$ |
149,754 |
|
$ |
313,012 |
|
|
Stock based compensation |
|
— |
|
|
— |
|
|
4,174 |
|
|
— |
|
|
— |
|
|
4,174 |
|
|
Exercise of warrant |
|
73,422 |
|
|
1 |
|
|
(1) |
|
|
— |
|
|
— |
|
|
— |
|
|
Common stock issued for stock compensation plans, net of shares withheld and withholding paid for employee taxes |
|
104,014 |
|
|
1 |
|
|
(1,521) |
|
|
— |
|
|
— |
|
|
(1,520) |
|
|
For the Year Ended December 31, 2014: |
|
|
|
|
|
|
|
|
|
|
|
|
|
|
|
|
|
|
|
Net income |
|
— |
|
|
— |
|
|
— |
|
|
— |
|
|
8,099 |
|
|
8,099 |
|
|
Other comprehensive loss, net of tax |
|
— |
|
|
— |
|
|
— |
|
|
(19,231) |
|
|
— |
|
|
(19,231) |
|
|
Balance, December 31, 2014 |
|
10,673,292 |
|
|
107 |
|
|
170,521 |
|
|
(23,947) |
|
|
157,853 |
|
|
304,534 |
|
|
Stock based compensation |
|
— |
|
|
— |
|
|
1,584 |
|
|
— |
|
|
— |
|
|
1,584 |
|
|
Exercise of warrant |
|
719,075 |
|
|
7 |
|
|
6,863 |
|
|
— |
|
|
— |
|
|
6,870 |
|
|
Common stock issued for stock compensation plans, net of shares withheld and withholding paid for employee taxes |
|
74,031 |
|
|
1 |
|
|
(949) |
|
|
— |
|
|
— |
|
|
(948) |
|
|
For the Year Ended December 31, 2015: |
|
|
|
|
|
|
|
|
|
|
|
|
|
|
|
|
|
|
|
Net income |
|
— |
|
|
— |
|
|
— |
|
|
— |
|
|
1,100 |
|
|
1,100 |
|
|
Other comprehensive loss, net of tax |
|
— |
|
|
— |
|
|
— |
|
|
(5,441) |
|
|
— |
|
|
(5,441) |
|
|
Balance, December 31, 2015 |
|
11,466,398 |
|
|
115 |
|
|
178,019 |
|
|
(29,388) |
|
|
158,953 |
|
|
307,699 |
|
|
Stock based compensation |
|
— |
|
|
— |
|
|
2,303 |
|
|
— |
|
|
— |
|
|
2,303 |
|
|
Common stock issued for stock compensation plans, net of shares withheld and withholding paid for employee taxes |
|
46,881 |
|
|
— |
|
|
(364) |
|
|
— |
|
|
— |
|
|
(364) |
|
|
For the Year Ended December 31, 2016: |
|
— |
|
|
|
|
|
|
|
|
|
|
|
|
|
|
|
|
|
Net income |
|
— |
|
|
— |
|
|
— |
|
|
— |
|
|
1,106 |
|
|
1,106 |
|
|
Other comprehensive loss, net of tax |
|
— |
|
|
— |
|
|
— |
|
|
(5,830) |
|
|
— |
|
|
(5,830) |
|
|
Balance, December 31, 2016 |
|
11,513,279 |
|
$ |
115 |
|
$ |
179,958 |
|
$ |
(35,218) |
|
$ |
160,059 |
|
$ |
304,914 |
|
See accompanying notes to consolidated financial statements.
52
Hawaiian Telcom Holdco, Inc.
Notes to Consolidated Financial Statements
1. Description of Business
Business Description
Hawaiian Telcom Holdco, Inc. and subsidiaries (the “Company”) is the incumbent local exchange carrier for the State of Hawaii with an integrated telecommunications network. The Company offers a variety of telecommunication services to residential and business customers in Hawaii including local telephone, network access and data transport, long distance, internet, television and wireless phone service. The Company also provides communications equipment sales and maintenance, data center colocation and network managed services.
The communication services the Company provides are subject to regulation by the Public Utilities Commission of the State of Hawaii (“HPUC”) with respect to intrastate rates and services and other matters, and the State of Hawaii Department of Commerce and Consumer Affairs with respect to television. Certain agreements with the HPUC limit the amount of dividends and other distributions the Company may pay as well as place restrictions on certain transactions affecting the operations and capital structure of the Company. The Federal Communication Commission (“FCC”) regulates rates that the Company charges long‑distance carriers and other end‑user subscribers for interstate access services and interstate traffic.
Organization
The Company has one direct wholly‑owned subsidiary, Hawaiian Telcom Communications, Inc. which has two direct wholly‑owned subsidiaries – Hawaiian Telcom, Inc. and Hawaiian Telcom Services Company, Inc. Hawaiian Telcom, Inc. operates the regulated incumbent local exchange carrier and Hawaiian Telcom Services Company, Inc. operates all other businesses.
2. Summary of Significant Accounting Policies
The accompanying consolidated financial statements of the Company have been prepared by the Company in accordance with accounting principles generally accepted in the United States of America and pursuant to the rules and regulations of the U.S. Securities and Exchange Commission (“SEC”) and, in the opinion of management, includes all adjustments necessary for a fair presentation of the results of operations, comprehensive income (loss), financial position and cash flows for each period presented.
Use of Estimates
The preparation of financial statements in conformity with accounting principles generally accepted in the United States of America requires management to make estimates and assumptions that affect the reported amounts of assets and liabilities and disclosure of contingent assets and liabilities at the date of the financial statements and the reported amounts of revenue and expenses during the reporting periods. Actual results could differ from those estimates.
Principles of Consolidation
The consolidated financial statements of the Company include the results of operations, financial position, and cash flows of Hawaiian Telcom Holdco, Inc. and its wholly owned subsidiaries. All intercompany balances and transactions have been eliminated in consolidation.
53
Revenue Recognition
Revenue is recognized when evidence of an arrangement exists, the earnings process is complete and collectibility is reasonably assured. The prices for certain services are filed in tariffs with the regulatory body that exercises jurisdiction over the services.
Basic local service, enhanced calling features such as caller ID, special access circuits, long‑distance flat rate calling plans, most data services, internet, television, data center colocation and wireless services are billed one month in advance. Revenue for these services is recognized in the month services are rendered. The portion of advance‑billed services associated with services that will be delivered in a subsequent period is deferred and recorded as a liability in advance billings and customer deposits.
Amounts billed to customers for activating wireline service are deferred and recognized over the average customer relationship. The costs associated with activating such services are deferred and recognized as an operating expense over the same period. Costs in excess of revenues are recognized as expense in the period in which activation occurs. Other charges for activation are generally deferred and recognized in revenue over the contract term.
Revenues for providing usage based services, such as per‑minute long‑distance service, access charges billed to long‑distance companies for originating and terminating long‑distance calls on the Company’s network and video on demand, are billed in arrears. Revenues for these services are based on actual rated usage and, where necessary, historical usage patterns, and are recognized in the month services are rendered.
For long-term indefeasible right of use, or IRU, contracts for fiber circuit capacity, the Company may receive up-front payments for services to be delivered for a period of up to 25 years. In these situations, the Company defers the revenue and amortizes it on a straight-line basis to earnings over the term of the contract.
Universal Service revenue subsidies, including those related to Connect America Fund Phase II, are government‑sponsored support received in association with providing service in mostly rural, high‑cost areas. These revenues are typically calculated by the government agency responsible for administering the support program. These revenues are recognized as granted by the government agency.
Telecommunication systems and structured cabling project revenues are recognized on a percentage completion basis, generally based on the relative portion of costs incurred to total estimated costs of a project, except for short duration projects which are recognized upon completion of the project. Maintenance services are recorded when the service is provided.
With respect to arrangements with multiple deliverables, the Company determines whether more than one unit of accounting exists in an arrangement. To the extent that the deliverables are separable into multiple units of accounting, total consideration is allocated to the individual units of accounting based on their relative fair value, determined by the price of each deliverable when it is regularly sold on a stand‑alone basis. Revenue is recognized for each unit of accounting as delivered or as service is performed depending on the nature of the deliverable comprising the unit of accounting.
Taxes Collected from Customers
The Company presents taxes collected from customers and remitted to governmental authorities on a gross basis, including such amounts in the Company’s reported operating revenues and selling, general and administrative expenses. Such amounts represent primarily Hawaii state general excise taxes and HPUC fees. Such taxes and fees amounted to $8.4 million, $8.2 million and $7.5 million for the years ended December 31, 2016, 2015 and 2014, respectively.
54
Cash and Cash Equivalents
Cash and cash equivalents include cash and money market accounts with maturities at acquisition of three months or less. The majority of cash balances at December 31, 2016 are held in one bank in demand deposit accounts.
Supplemental Non‑Cash Investing and Financing Activities
Accounts payable included $26.1 million, $20.6 million and $21.2 million at December 31, 2016, 2015 and 2014, respectively, for additions to property, plant and equipment.
Receivables
The Company recognizes accounts receivable net of an allowance for doubtful accounts. The Company makes estimates of the uncollectibility of its accounts receivable by specifically analyzing accounts receivable and historic bad debts, customer concentrations, customer creditworthiness, current economic trends and changes in its customer payment terms when evaluating the adequacy of the allowance for doubtful accounts. After multiple attempts at collection of delinquent accounts, the balance due is deemed uncollectible and charged against the allowance.
Material and Supplies
Material and supplies which consist mainly of cable, supplies and replacement parts, are stated at the lower of cost, determined principally by the average cost method, or net realizable value.
Property and Depreciation
Property, plant and equipment are carried at cost. Depreciation has been calculated using the composite remaining life method and straight-line depreciation. The composite method depreciates the remaining net investment in telephone plant over remaining economic asset lives by asset category. This method requires periodic review and revision of depreciation rates. The average economic lives utilized for assets are as follows: building – 18 to 34 years; cable and wire – 11 to 37 years; switching and circuit equipment – 6 to 15 years; and other property – 4 to 17 years.
Software
The Company capitalizes the costs associated with externally acquired software for internal use. Project costs associated with internally developed software are segregated into three project stages: preliminary project stage, application development stage and post‑implementation stage. Costs associated with both the preliminary project stage and post‑implementation stage are expensed as incurred. Costs associated with the application development stage are capitalized. Software maintenance and training costs are expensed as incurred. Capitalized software is generally amortized on a straight‑line method basis over its useful life, not to exceed five years.
Goodwill and Other Intangible Assets
Goodwill and other indefinite‑lived intangible assets are not amortized. Such assets are reviewed annually, or more frequently under various conditions, for impairment. The goodwill impairment test involves a two‑step process. The first step, identifying a potential impairment, compares the fair value of a reporting unit with its carrying amount, including goodwill. If the carrying value of the reporting unit exceeds its fair value, the second step will need to be conducted. The second step, measuring the impairment loss, compares the implied fair value of the reporting unit goodwill with the carrying amount of that goodwill. Any excess of the reporting unit goodwill carrying value over the respective implied fair value is recognized as an impairment loss. The Company performs its annual impairment test during the fourth quarter, primarily using a market valuation and discounted cash flows methodology.
Intangible assets with definite lives, including the value assigned to the customer base, are being amortized over the remaining estimated lives. For customer relationship intangibles, amortization is calculated using a declining balance method in relation to estimated retention lives of acquired customers.
55
Impairment of Long‑Lived Assets
The Company assesses the recoverability of long‑lived assets, including property, plant and equipment and definite‑lived intangible assets, whenever events or changes in circumstances indicate that the carrying amount of an asset may not be recoverable. In such cases, if the sum of the expected cash flows, undiscounted and without interest, resulting from use of the asset are less than the carrying amount, an impairment loss is recognized based on the difference between the carrying amount and the fair value of the assets.
Debt Issuance
Deferred financing costs and original issue discount are amortized over the term of the related debt issuance using the effective interest method and presented as a direct deduction of the carrying amount of the debt.
Income Taxes
Deferred tax assets and liabilities are determined based on the differences between the financial reporting and tax bases of assets and liabilities at each balance sheet date using enacted tax rates expected to be in effect in the year the differences are expected to reverse. Valuation allowances are recognized to reduce deferred tax assets to the amount that will more likely than not be realized.
The Company recognizes interest and penalties related to unrecognized tax benefits within income tax expense in the accompanying consolidated statements of income.
Employee Benefit Plans
Pension and postretirement health and life insurance benefits earned during the year as well as interest on projected benefit obligations are accrued currently. Actuarial gains and losses are amortized over the average remaining expected life of participants deemed inactive.
Maintenance and Repairs
The cost of maintenance and repairs, including the cost of replacing minor items not constituting substantial betterments, is charged to expense as these costs are incurred.
Advertising
Advertising costs are expensed as incurred. Advertising expense amounted to $6.1 million, $5.9 million and $6.1 million for the years ended December 31, 2016, 2015 and 2014, respectively.
Stock Based Compensation
The Company measures and recognizes the compensation expense for all share-based awards made to employees and directors based on estimated fair values. The fair value of restricted stock units is generally based on the closing price of the Company’s common stock on the date of grant. The fair value of market-based stock awards is estimated using a statistical pricing model as of the date of grant. Because stock-based compensation expense is based on awards ultimately expected to vest, it has been reduced for forfeitures.
Earnings per Share
Basic earnings per share is based on the weighted effect of all common shares issued and outstanding, and is calculated by dividing earnings by the weighted average shares outstanding during the period. Diluted earnings per share is calculated by dividing earnings, adjusted for the effect, if any, from assumed conversion of all potentially dilutive common shares outstanding, by the weighted average number of common shares used in the basic earnings per share
56
calculation plus the number of common shares that would be issued assuming conversion of all potentially dilutive common shares outstanding. The denominator used to compute basic and diluted earnings per share is as follows:
|
|
|
For the Year Ended |
|
||||
|
|
|
December 31, |
|
||||
|
|
|
2016 |
|
2015 |
|
2014 |
|
|
Basic earnings per share - weighted average shares |
|
11,503,296 |
|
10,977,341 |
|
10,591,351 |
|
|
Effect of dilutive securities: |
|
|
|
|
|
|
|
|
Employee and director restricted stock units |
|
52,701 |
|
83,727 |
|
143,787 |
|
|
Warrants |
|
— |
|
325,235 |
|
572,913 |
|
|
Diluted earnings per share - weighted average shares |
|
11,555,997 |
|
11,386,303 |
|
11,308,051 |
|
For the years ended December 31, 2016, 2015 and 2014, all antidilutive restricted stock units excluded from the computation of weighted average dilutive shares outstanding were not significant.
Recently Adopted Accounting Pronouncements
In November 2016, the Financial Accounting Standards Board (“FASB”) issued an accounting standard modifying the presentation of restricted cash in the statement of cash flows. The new standard requires restricted cash be included with cash and cash equivalents when reconciling the beginning-of-period and end-of-period total amounts shown on the statement of cash flows. The Company adopted the standard effective upon issuance. The consolidated statement of cash flows for the year ended December 31, 2016 reflects application of the new standard. Retrospective application is required so the consolidated statement of cash flows for the years ended December 31, 2015 and December 31, 2014 were revised to reflect application of the new standard. This resulted in the following increases (decreases) to the total amounts previously reported in the consolidated statements of cash flows (dollars in thousands):
|
|
|
|
For the Year Ended |
|
||||
|
|
|
|
December 31, |
|
||||
|
|
|
|
2015 |
|
2014 |
|
||
|
Cash flows from operating activities: |
||||||||
|
Changes in operating assets and liabilities: |
||||||||
|
Prepaid expenses and other current assets |
$ |
— |
$ |
400 | ||||
|
Advance billings and customer deposits |
3,500 |
— |
||||||
|
Other |
175 | (313) | ||||||
|
Net cash provided by operating activities |
3,675 | 87 | ||||||
|
Cash flows from investing activities: |
||||||||
|
Funds released from restricted cash account |
(400) |
— |
||||||
|
Proceeds on sale of investments |
— |
463 | ||||||
|
Net cash used in investing activities |
(400) | 463 | ||||||
|
Net change in cash, cash equivalents and restricted cash |
3,275 | 550 | ||||||
|
Cash, cash equivalents and restricted cash, beginning of period |
550 |
— |
||||||
|
Cash, cash equivalents and restricted cash, end of period |
$ |
3,825 |
$ |
550 | ||||
57
The following is a reconciliation of cash, cash equivalents and restricted cash reported in the consolidated balance sheets to the total of such amounts in the consolidated statements of cash flows (dollars in thousands):
|
|
|
|
December 31, |
|
||||
|
|
|
|
2016 |
|
2015 |
|
||
|
Cash and cash equivalents |
|
|
$ |
15,821 |
|
$ |
30,312 |
|
|
Restricted cash included in other current assets |
|
|
|
|
|
|
|
|
|
Escrow deposits for capacity sales |
|
|
|
5,000 |
|
|
— |
|
|
Restricted cash included in other assets |
|
|
|
|
|
|
|
|
|
Escrow deposits for capacity sales |
|
|
|
— |
|
|
3,500 |
|
|
Other |
|
|
|
325 |
|
|
325 |
|
|
Total cash, cash equivalents and restricted cash |
|
|
$ |
21,146 |
|
$ |
34,137 |
|
The escrow deposits for capacity sales are more fully described in Note 13. The restriction on the escrow deposit is expected to be removed in 2017 so the restricted cash amount is reflected in other current assets as of December 31, 2016.
Recently Issued Accounting Pronouncements
In May 2014, the FASB issued a new accounting standard which provides guidance for revenue recognition which was most recently amended in May 2016. The new accounting standard will supersede the current revenue recognition requirements and most industry-specific guidance. The standard’s core principle is that a company will recognize revenue when it transfers promised goods or services to customers in an amount that reflects the consideration to which the company expects to be entitled in exchange for those goods or services. The new standard, along with the amendments which must be adopted at the same time as the new standard, is effective for the Company in the first quarter of 2018 with either full retrospective or modified retrospective adoption permitted. The modified retrospective approach requires a cumulative effect adjustment to retained earnings as of the beginning of the first reporting period for which the new accounting guidance is effective. Early adoption is allowed from the first quarter of 2017. The Company is currently evaluating the impact of the adoption of this accounting standard on the Company’s consolidated financial statements and financial statement disclosures. As this process is still ongoing, the final effect of adoption is not yet fully known. The Company has concluded that it will adopt the new standard in the first quarter of 2018. In conjunction with its efforts to prepare for adoption, the Company is focusing its analysis on timing of revenue recognition including for sales of certain telecommunications equipment. In addition, the Company is evaluating the need to modify its presentation of certain revenue related assets and liabilities in its consolidated balance sheet upon adoption of the new standard.
In August 2014, the FASB issued an accounting standard with new guidance on management’s responsibility to evaluate whether there is substantial doubt about an entity’s ability to continue as a going concern and to provide related disclosures. Management must evaluate whether it is probable that known conditions or events, considered in the aggregate, would raise substantial doubt about the entity’s ability to continue as a going concern within one year after the date that the financial statements are issued. If such conditions or events are identified, the standard requires management’s mitigation plans to alleviate the doubt or a statement of the substantial doubt about the entity’s ability to continue as a going concern to be disclosed in the financial statements. The standard is effective for fiscal years and interim periods beginning after December 15, 2016 applied on a prospective basis with early adoption permitted. The Company is not expecting a significant impact from adoption of this accounting standard.
In February 2016, the FASB issued a new standard which revises the accounting for leases. The new standard is effective for the Company in the first quarter of 2019. The standard requires a dual approach for lessee accounting under which a lessee would account for leases as finance leases or operating leases. Both finance leases and operating leases will result in the lessee recognizing a right-of-use asset and a corresponding lease liability. For finance leases, the lessee would recognize interest expense and amortization of the right-of-use asset and for operating leases the lessee would recognize lease expense on a straight-line basis. The standard requires use of a modified retrospective transition approach beginning with the earliest period presented in the period of transition. The Company is currently assessing the impact that adoption of this guidance will have on its consolidated financial statements.
58
In March 2016, the FASB issued a new standard that simplifies the accounting for employee share-based payment transactions. The new standard impacts the accounting for related income taxes, forfeitures and statutory tax withholding requirements as well as the classification of certain related payments in the statement of cash flows. The new accounting guidance is effective for the Company in the first quarter of 2017 with early adoption permitted. The adoption method required is specified as retrospective, modified retrospective or prospective for each of the various accounting provisions impacted by this new standard. The Company will account for forfeitures on its share-based transactions as they occur beginning January 1, 2017. The impact of the modified retrospective adoption of this provision is not expected to be significant. In addition, the Company will begin accounting for excess tax benefits and tax deficiencies on share-based awards as income tax expense or benefit in its consolidated statement of income beginning January 1, 2017.
In June 2016, the FASB issued amended guidance on accounting for the impairment of financial instruments. The standard requires adoption of an impairment model known as the current expected credit loss model that is based on expected losses rather than incurred losses. For the Company, it is anticipated this will impact primarily the accounting for credit losses on trade receivables. The new standard is effective for the Company in the first quarter of 2020 with early adoption permitted from the first quarter of 2019. The provisions of the new standard expected to impact the Company must be adopted using the modified retrospective approach. The Company is evaluating the effect of the guidance on the Company’s consolidated financial statements and financial statement disclosures.
In January 2017, the FASB revised the accounting for goodwill impairments by eliminating the second step from the goodwill impairment test. Instead, if the carrying amount of a reporting unit exceeds the fair value, an impairment loss is recognized in an amount equal to that excess, limited to the total amount of goodwill allocated to that reporting unit. The modified standard is effective for annual and any interim impairment tests for periods beginning after December 15, 2019. Early adoption is allowed for annual and any interim impairment tests occurring after January 1, 2017. The Company is not expecting a significant impact from adoption of this modified accounting standard.
3. Receivables, Net
Receivables consisted of the following (dollars in thousands):
|
|
|
|
December 31, |
|
||||
|
|
|
|
2016 |
|
2015 |
|
||
|
Customers and other |
|
|
$ |
37,408 |
|
$ |
36,667 |
|
|
Allowance for doubtful accounts |
|
|
|
(4,031) |
|
|
(3,931) |
|
|
|
|
|
$ |
33,377 |
|
$ |
32,736 |
|
The Company grants credit to customers in the normal course of business. At December 31, 2016 and 2015, the Company did not have customer balances representing more than 10% of total receivables. During the years ended December 31, 2016, 2015 and 2014, the Company had no customers that represented more than 10% of total revenues.
The following is a summary of activity for the allowance for doubtful accounts (dollars in thousands):
|
|
|
|
|
|
Additional |
|
|
|
|
|
|
||
|
|
|
|
|
|
Charges to |
|
Deductions |
|
|
|
|
||
|
|
|
Beginning |
|
Costs and |
|
from |
|
Ending |
|
||||
|
|
|
Balance |
|
Expenses |
|
Allowance |
|
Balance |
|
||||
|
January 1 to December 31, 2016 |
|
$ |
3,931 |
|
$ |
4,031 |
|
$ |
(3,931) |
|
$ |
4,031 |
|
|
January 1 to December 31, 2015 |
|
|
3,755 |
|
|
3,648 |
|
|
(3,472) |
|
|
3,931 |
|
|
January 1 to December 31, 2014 |
|
|
3,942 |
|
|
3,590 |
|
|
(3,777) |
|
|
3,755 |
|
59
4. Property, Plant and Equipment
Property, plant and equipment consisted of the following (dollars in thousands):
|
|
|
|
December 31, |
|
||||
|
|
|
|
2016 |
|
2015 |
|
||
|
Land |
|
|
$ |
67,278 |
|
$ |
67,278 |
|
|
Buildings |
|
|
|
115,775 |
|
|
114,351 |
|
|
Central office equipment |
|
|
|
208,004 |
|
|
194,707 |
|
|
Outside communications plant |
|
|
|
412,244 |
|
|
377,042 |
|
|
Other equipment, vehicles and furniture |
|
|
|
87,849 |
|
|
74,377 |
|
|
Construction in progress |
|
|
|
55,606 |
|
|
32,595 |
|
|
Software |
|
|
|
78,547 |
|
|
66,704 |
|
|
Other |
|
|
|
10,834 |
|
|
10,873 |
|
|
Property, plant and equipment cost |
|
|
|
1,036,137 |
|
|
937,927 |
|
|
Less accumulated depreciation |
|
|
|
440,140 |
|
|
358,820 |
|
|
|
|
|
$ |
595,997 |
|
$ |
579,107 |
|
Depreciation expense amounted to $87.8 million, $85.4 million and $75.1 million for the years ended December 31, 2016, 2015 and 2014, respectively.
5. Goodwill and Other Intangible Assets
The gross carrying amount and accumulated amortization of the identifiable intangible assets are as follows (dollars in thousands):
|
|
|
December 31, 2016 |
|
December 31, 2015 |
|
||||||||||||||
|
|
|
Gross |
|
|
|
|
Net |
|
Gross |
|
|
|
|
Net |
|
||||
|
|
|
Carrying |
|
Accumulated |
|
Carrying |
|
Carrying |
|
Accumulated |
|
Carrying |
|
||||||
|
|
|
Value |
|
Amortization |
|
Value |
|
Value |
|
Amortization |
|
Value |
|
||||||
|
Subject to amortization: |
|
|
|
|
|
|
|
|
|
|
|
|
|
|
|
|
|
|
|
|
Customer relationships |
|
$ |
21,709 |
|
$ |
16,299 |
|
$ |
5,410 |
|
$ |
21,709 |
|
$ |
14,238 |
|
$ |
7,471 |
|
|
Trade name and other |
|
|
320 |
|
|
302 |
|
|
18 |
|
|
320 |
|
|
263 |
|
|
57 |
|
|
|
|
|
22,029 |
|
|
16,601 |
|
|
5,428 |
|
|
22,029 |
|
|
14,501 |
|
|
7,528 |
|
|
Not subject to amortization: |
|
|
|
|
|
|
|
|
|
|
|
|
|
|
|
|
|
|
|
|
Brand name |
|
|
27,300 |
|
|
— |
|
|
27,300 |
|
|
27,300 |
|
|
— |
|
|
27,300 |
|
|
|
|
|
27,300 |
|
|
— |
|
|
27,300 |
|
|
27,300 |
|
|
— |
|
|
27,300 |
|
|
|
|
$ |
49,329 |
|
$ |
16,601 |
|
$ |
32,728 |
|
$ |
49,329 |
|
$ |
14,501 |
|
$ |
34,828 |
|
60
Amortization expense amounted to $2.1 million, $2.5 million and $2.9 million for the years ended December 31 2016, 2015 and 2014, respectively. Estimated amortization expense for the next five years and thereafter is as follows (dollars in thousands):
|
Year ended December 31, |
|
|
|
|
|
2017 |
|
$ |
1,703 |
|
|
2018 |
|
|
1,307 |
|
|
2019 |
|
|
930 |
|
|
2020 |
|
|
574 |
|
|
2021 |
|
|
270 |
|
|
Thereafter |
|
|
644 |
|
|
|
|
$ |
5,428 |
|
In conjunction with the acquisition of SystemMetrics Corporation in 2013, the Company recognized goodwill of $10.5 million which is attributed to the data center services segment. In conjunction with the 2012 acquisition of Wavecom Solutions Corporation, the Company recognized goodwill amounting to $1.6 million which is included in the telecommunications segment.
6. Accrued Expenses and Other Current Liabilities
Accrued expenses consisted of the following (dollars in thousands):
|
|
|
December 31, |
|
||||
|
|
|
2016 |
|
2015 |
|
||
|
Salaries and benefits |
|
$ |
11,662 |
|
$ |
12,185 |
|
|
Interest |
|
|
2,583 |
|
|
1,262 |
|
|
Other taxes |
|
|
1,048 |
|
|
1,044 |
|
|
|
|
$ |
15,293 |
|
$ |
14,491 |
|
Other current liabilities consisted of the following (dollars in thousands):
|
|
|
December 31, |
|
||||
|
|
|
2016 |
|
2015 |
|
||
|
Other postretirement benefits, current |
|
$ |
3,332 |
|
$ |
2,929 |
|
|
Installment financing contracts, current |
|
|
2,157 |
|
|
1,849 |
|
|
Other |
|
|
838 |
|
|
1,154 |
|
|
|
|
$ |
6,327 |
|
$ |
5,932 |
|
61
7. Long‑Term Debt
Long‑Term debt consists of the following (dollars in thousands):
|
|
|
Interest Rate |
|
|
|
|
|
|
||||
|
|
|
at December 31, |
|
Final |
|
|
December 31, |
|
||||
|
|
|
2016 |
|
Maturity |
|
|
2016 |
|
2015 |
|
||
|
Term loan |
|
5.25 |
% |
June 6, 2019 |
|
|
$ |
290,138 |
|
$ |
293,138 |
|
|
Debt issue costs and original issue discount |
|
|
|
|
|
|
|
(5,439) |
|
|
(7,092) |
|
|
|
|
|
|
|
|
|
|
284,699 |
|
|
286,046 |
|
|
Current |
|
|
|
|
|
|
|
3,000 |
|
|
3,000 |
|
|
Noncurrent |
|
|
|
|
|
|
$ |
281,699 |
|
$ |
283,046 |
|
The term loan outstanding at December 31, 2016 provides for interest at the Alternate Base Rate, a rate which is indexed to the prime rate with certain adjustments as defined, plus a margin of 3.25% or a Eurocurrency rate on deposits of one, two, three or six months but no less than 1.00% per annum plus a margin of 4.25%. The Company has selected the Eurocurrency rate as of December 31, 2016 resulting in an interest rate currently at 5.25%. The interest rate margin is subject to a further increase of 0.25% should there be a downgrade in the Company’s credit rating.
The term loan provides for interest payments no less than quarterly. In addition, quarterly principal payments of $0.8 million are required. The balance of the loan is due at maturity on June 6, 2019. The Company must prepay, generally within three months after year end, up to 75% of excess cash flow, as defined. The percent of excess cash flow required is dependent on the Company’s leverage ratio. Excess cash flow payments due for the years ended December 31, 2016, 2015 and 2014 were not significant. The Company must also make prepayments on loans in the case of certain events such as large asset sales.
In May 2016, the Company amended the term loan allowing for a revised leverage ratio financial covenant. The amendment modifies the maximum allowed leverage ratio, as defined, for the four consecutive fiscal quarters ended from June 30, 2016 to September 30, 2017 to 3.00:1.00, from December 31, 2017 to September 30, 2018 to 2.75:1.00, and from December 31, 2018 and each subsequent quarter to 2.50:1.00. In conjunction with the amendment, the Company paid a fee to the lenders of $0.4 million and such fee was deferred as financing related costs. The Company concluded that the amended lenders’ term loans were not substantially different than the lenders’ term loans prior to amendment. In addition, the Company paid an arrangement fee and legal costs amounting to $0.3 million. Such fees were expensed as incurred in 2016.
The Company has a revolving credit facility which was extended on April 9, 2015 to mature on December 6, 2018. The facility has an available balance of $30.0 million with no amounts drawn at any time through December 31, 2016. A commitment fee is payable quarterly to the lender under the facility. Interest on amounts outstanding is based on, at the Company’s option, the bank prime rate plus a margin of 3.0% to 6.0% or the Eurocurrency rate for one, two, three or six month periods plus a margin of 4.0% to 5.5%. The margin is dependent on the Company’s leverage, as defined in the agreement, at the time of the borrowing.
The obligations under the bank facilities are guaranteed by the Company and each subsidiary with certain exceptions. In addition, the bank credit facilities are collateralized by substantially all of the Company’s assets.
The bank credit facilities contain various negative and affirmative covenants that restrict, among other things, incurrence of additional indebtedness, payment of dividends, redemptions of stock, other distributions to shareholders and sales of assets. In addition, there are financial covenants consisting of an interest coverage ratio, leverage ratio and a maximum level of capital expenditures.
62
New Financing in 2017
In February 2017, the Company entered into a delayed draw credit agreement for new term loans and a new revolving credit facility. The new facility provides a commitment to fund repayment of the existing term loan and replacement of the existing revolving credit in May 2017. Included in the new facility is a term loan for $90.0 million with quarterly principal payments of $1.1 million with the balance due at maturity in May 2022. Interest, payable at least quarterly, is at the Alternate Base Rate plus a margin of 2.75% or a Eurocurrency rate plus a margin of 3.75%. In addition, the facility provides for a second term loan for $230.0 million with quarterly principal payments of $1.4 million for the first eight quarters and $2.9 million per quarter thereafter with the balance due at maturity in May 2023. Interest, payable at least quarterly, is at the Alternate Base Rate plus a margin of 3.00% or a Eurocurrency rate plus a margin of 4.00%. In addition, the agreement provides for a line of credit in the amount of $30.0 million with maturity in May 2022. Interest on the line of credit is at the Alternate Base Rate plus a margin of 2.75% or a Eurocurrency rate plus a margin of 3.75%. The interest rate margins on the facility are subject to a decrease of 0.25% with a defined improvement in the Company’s leverage ratio.
Capitalized Interest
Interest capitalized by the Company amounted to $1.6 million, $1.1 million and $1.1 million for the years ended December 31, 2016, 2015 and 2014, respectively.
Maturities
The maturities of the existing debt at December 31, 2016 are as follows (dollars in thousands):
|
Year ended December 31, |
|
|
|
|
|
2017 |
|
$ |
3,000 |
|
|
2018 |
|
|
3,000 |
|
|
2019 |
|
|
284,138 |
|
|
|
|
$ |
290,138 |
|
63
8. Employee Benefit Plans
Pension and Other Postretirement Benefits
The Company sponsors a defined benefit pension plan, with benefits frozen as of March 1, 2012, and postretirement health and life insurance benefits for union employees. The Company also sponsors a cash balance pension plan for nonunion employees, with benefits frozen as of April 1, 2007, and certain management employees receive postretirement health and life insurance under grandfathered provisions of a terminated plan. In January 2017, the Company amended the postretirement health benefits plan for certain management employees by implementing a cap on the amount of the premium subsidy at 2017 levels. This curtailment of benefits will be recognized for financial reporting purposes in 2017.
The change in projected benefit obligation, change in plan assets, funded status and weighted average actuarial assumptions were as follows (dollars in thousands):
|
|
|
Pension Benefits |
|
|
Other Postretirement Benefits |
|
||||||||
|
|
|
December 31, |
|
|
December 31, |
|
||||||||
|
|
|
2016 |
|
2015 |
|
|
2016 |
|
2015 |
|
||||
|
Change in projected benefit obligation: |
|
|
|
|
|
|
|
|
|
|
|
|
|
|
|
Obligation at beginning of period |
|
$ |
203,455 |
|
$ |
248,505 |
|
|
$ |
60,749 |
|
$ |
59,830 |
|
|
Service cost |
|
|
— |
|
|
— |
|
|
|
1,104 |
|
|
1,088 |
|
|
Interest cost |
|
|
7,347 |
|
|
8,073 |
|
|
|
2,637 |
|
|
2,355 |
|
|
Actuarial (gain) loss |
|
|
3,686 |
|
|
6,699 |
|
|
|
11,036 |
|
|
(765) |
|
|
Benefits paid |
|
|
(11,172) |
|
|
(59,822) |
|
|
|
(1,737) |
|
|
(1,759) |
|
|
Obligation at end of period |
|
|
203,316 |
|
|
203,455 |
|
|
|
73,789 |
|
|
60,749 |
|
|
Change in plan assets: |
|
|
|
|
|
|
|
|
|
|
|
|
|
|
|
Fair value of plan assets at beginning of period |
|
|
156,678 |
|
|
206,309 |
|
|
|
— |
|
|
— |
|
|
Actual return on plan assets |
|
|
13,032 |
|
|
852 |
|
|
|
— |
|
|
— |
|
|
Employer contributions |
|
|
9,305 |
|
|
9,339 |
|
|
|
1,737 |
|
|
1,759 |
|
|
Benefits paid |
|
|
(11,172) |
|
|
(59,822) |
|
|
|
(1,737) |
|
|
(1,759) |
|
|
Fair value of plan assets at end of period |
|
|
167,843 |
|
|
156,678 |
|
|
|
— |
|
|
— |
|
|
Funded status: |
|
|
|
|
|
|
|
|
|
|
|
|
|
|
|
Plan assets less than projected benefit obligation |
|
$ |
(35,473) |
|
$ |
(46,777) |
|
|
$ |
(73,789) |
|
$ |
(60,749) |
|
|
Amounts recognized on balance sheet: |
|
|
|
|
|
|
|
|
|
|
|
|
|
|
|
Other current liabilities |
|
$ |
— |
|
$ |
— |
|
|
$ |
(3,332) |
|
$ |
(2,929) |
|
|
Employee benefit obligation, noncurrent |
|
|
(35,473) |
|
|
(46,777) |
|
|
|
(70,457) |
|
|
(57,820) |
|
|
Net amount recognized |
|
$ |
(35,473) |
|
$ |
(46,777) |
|
|
$ |
(73,789) |
|
$ |
(60,749) |
|
|
Actuarial loss recognized in accumulated other comprehensive income (loss) |
|
$ |
(36,919) |
|
$ |
(37,945) |
|
|
$ |
(20,040) |
|
$ |
(9,577) |
|
|
Actuarial assumptions: |
|
|
|
|
|
|
|
|
|
|
|
|
|
|
|
Measurement date |
|
|
12/31/2016 |
|
|
12/31/2015 |
|
|
|
12/31/2016 |
|
|
12/31/2015 |
|
|
Discount rate ranges from a low of |
|
|
3.81 |
% |
|
4.09 |
% |
|
|
4.03 |
% |
|
4.32 |
% |
|
Discount rate ranges to a high of |
|
|
3.85 |
% |
|
4.10 |
% |
|
|
4.25 |
% |
|
4.56 |
% |
|
Assumed health care cost trend rate, current |
|
|
NA |
|
|
NA |
|
|
|
7.25 |
% |
|
7.50 |
% |
|
Assumed health care cost trend rate, ultimate |
|
|
NA |
|
|
NA |
|
|
|
5.00 |
% |
|
5.00 |
% |
|
Assumed health care cost trend rate, ultimate year |
|
|
NA |
|
|
NA |
|
|
|
2026 |
|
|
2026 |
|
During the year ended December 31, 2016, the Company’s union pension plan paid lump-sum benefits to plan participants in full settlement of obligations due amounting to $7.1 million. This resulted in the recognition of a loss amounting to $1.3 million for the year ended December 31, 2016. During the year ended December 31, 2015, the Company’s pension plans paid lump-sum benefits to plan participants in full settlement of obligations due amounting to $55.9 million. This resulted in the recognition of a loss amounting to $8.1 million for the year ended December 31, 2015.
64
The estimated amount of the actuarial loss to be amortized from accumulated other comprehensive income (loss) during 2017 is $0.5 million for pension benefits and $1.5 million for other postretirement benefits.
The Company accrues the service costs of pension and postretirement benefits over the period from the date of hire until the date the employee becomes fully eligible for benefits. The following provides the components of benefit costs and weighted average actuarial assumptions for the years ended December 31, 2016, 2015 and 2014 (dollars in thousands):
Pension Benefits
|
|
|
|
|
For the For the Year Ended |
|
|||||||||
|
|
|
|
|
December 31, |
|
|||||||||
|
|
|
|
|
2016 |
|
|
2015 |
|
|
2014 |
|
|||
|
Interest cost |
|
|
|
$ |
7,347 |
|
|
$ |
7,994 |
|
|
$ |
8,844 |
|
|
Expected asset return |
|
|
|
|
(10,172) |
|
|
|
(12,565) |
|
|
|
(12,664) |
|
|
Amortization of loss |
|
|
|
|
574 |
|
|
|
186 |
|
|
|
135 |
|
|
Net periodic benefit income |
|
|
|
|
(2,251) |
|
|
|
(4,385) |
|
|
|
(3,685) |
|
|
Settlement loss |
|
|
|
|
1,277 |
|
|
|
8,088 |
|
|
|
— |
|
|
Total benefit (income) expense |
|
|
|
$ |
(974) |
|
|
$ |
3,703 |
|
|
$ |
(3,685) |
|
|
Actuarial assumptions: |
|
|
|
|
|
|
|
|
|
|
|
|
|
|
|
Discount rate ranges from a low of |
|
|
|
|
3.28 |
% |
|
|
3.54 |
% |
|
|
4.40 |
% |
|
Discount rate ranges to a high of |
|
|
|
|
4.10 |
% |
|
|
4.09 |
% |
|
|
4.62 |
% |
|
Expected return on plan assets |
|
|
|
|
7.00 |
% |
|
|
7.25 |
% |
|
|
7.25 |
% |
Other Postretirement Benefits
|
|
|
For the For the Year Ended |
|
|||||||||
|
|
|
December 31, |
|
|||||||||
|
|
|
2016 |
|
|
2015 |
|
|
2014 |
|
|||
|
Service cost |
|
$ |
1,104 |
|
|
$ |
1,088 |
|
|
$ |
897 |
|
|
Interest cost |
|
|
2,637 |
|
|
|
2,355 |
|
|
|
2,384 |
|
|
Amortization of loss |
|
|
573 |
|
|
|
588 |
|
|
|
60 |
|
|
Total benefit expense |
|
$ |
4,314 |
|
|
$ |
4,031 |
|
|
$ |
3,341 |
|
|
Actuarial assumptions: |
|
|
|
|
|
|
|
|
|
|
|
|
|
Discount rate range from a low of |
|
|
4.32 |
% |
|
|
3.97 |
% |
|
|
4.75 |
% |
|
Discount rate range to a high of |
|
|
4.56 |
% |
|
|
4.15 |
% |
|
|
5.01 |
% |
|
Assumed health care cost trend rate, current |
|
|
7.50 |
% |
|
|
6.75 |
% |
|
|
7.00 |
% |
|
Assumed health care cost trend rate, ultimate |
|
|
5.00 |
% |
|
|
5.00 |
% |
|
|
5.00 |
% |
|
Assumed health care cost trend rate, ultimate year |
|
|
2026 |
|
|
|
2022 |
|
|
|
2022 |
|
The measurement date for all plans was December 31, 2016, 2015 and 2014. At December 31, 2016 and 2015, the accumulated benefit obligation was the same as the projected benefit obligation.
The Company based its selection of an assumed discount rate for 2017 net periodic benefit cost and December 31, 2016 disclosure on a cash flow matching analysis that utilized bond information provided from a bond index for all non-callable, high quality bonds (i.e., rated AA- or better) as of December 31, 2016. The matching of bond income to anticipated benefit cash flows and the basic methods of selecting the assumed discount rate and expected return on plan assets at December 31, 2016 did not change from December 31, 2015.
In selecting the expected rate of return on plan assets of 7.00% for 2017 net periodic benefit cost, the Company considered economic forecasts for the types of investments held by the plans (primarily equity and fixed income investments), the plans’ asset allocations and the past performance of the plans’ assets. The expected rate of return on plan assets was based on various factors including historical experience and long-term inflation assumptions. The Company’s expected long-term rate of return on plan assets is determined using the target allocation of assets which is
65
based on the goal of earning the highest rate of return while maintaining risk at acceptable levels. The plan strives to have assets sufficiently diversified so that adverse or unexpected results from a security class will not have a significant adverse impact on the entire portfolio.
The Company’s overall investment strategy is to primarily invest for long‑term growth with sufficient investments available to fund near‑term benefit payments. The Company aims for diversification of asset types, fund strategies and fund managers. The target allocations for plan assets are 65 percent equity securities and 35 percent fixed income securities. Equity securities primarily include investments in equity funds and common stock of individual companies. Together these investments are diversified in both large and small cap companies located in the United States and internationally. Fixed income securities are in funds that invest in bonds of companies from diversified industries, mortgage‑backed securities and U.S. Treasuries.
Accounting standards establish a fair value hierarchy when measuring the fair value of pension plan assets. The three levels of inputs within the hierarchy are defined as follows. Level 1 is quoted prices for identical assets or liabilities in active markets. Level 2 is significant other observable inputs other than level 1 prices such as quoted prices for similar assets or liabilities; quoted prices in markets that are not active; or other inputs that are observable or can be corroborated by observable market data. Level 3 is significant unobservable inputs that reflect the Company’s own assumptions as to how market participants would price an asset.
The fair values of the Company’s pension plan assets at December 31, 2016 and 2015, based on trading values or fund net asset value, by asset category and basis of valuation, are as follows (dollars in thousands):
|
|
|
Quoted Prices |
|
|
|
|
|
|
|
|
|
|
|
|
|
|
in Active |
|
Significant |
|
|
|
|
|
|
|
||
|
|
|
Markets for |
|
Other |
|
Significant |
|
|
|
|
|||
|
|
|
Identical |
|
Observable |
|
Unobservable |
|
|
|
|
|||
|
|
|
Assets |
|
Inputs |
|
Inputs |
|
|
|
|
|||
|
|
|
(Level 1) |
|
(Level 2) |
|
(Level 3) |
|
Total |
|
||||
|
2016 |
|
|
|
|
|
|
|
|
|
|
|
|
|
|
Common stocks - domestic large cap |
|
$ |
10,201 |
|
$ |
— |
|
$ |
— |
|
$ |
10,201 |
|
|
Equity funds - large cap index |
|
|
— |
|
|
93,576 |
|
|
— |
|
|
93,576 |
|
|
Fixed income funds - diversified bond |
|
|
— |
|
|
63,613 |
|
|
— |
|
|
63,613 |
|
|
Short term investment funds |
|
|
— |
|
|
453 |
|
|
— |
|
|
453 |
|
|
|
|
$ |
10,201 |
|
$ |
157,642 |
|
$ |
— |
|
$ |
167,843 |
|
|
2015 |
|
|
|
|
|
|
|
|
|
|
|
|
|
|
Common stocks - domestic large cap |
|
$ |
8,954 |
|
$ |
— |
|
$ |
— |
|
$ |
8,954 |
|
|
Equity funds - large cap index |
|
|
— |
|
|
85,874 |
|
|
— |
|
|
85,874 |
|
|
Fixed income funds - diversified bond |
|
|
— |
|
|
61,300 |
|
|
— |
|
|
61,300 |
|
|
Short term investment funds |
|
|
— |
|
|
550 |
|
|
— |
|
|
550 |
|
|
|
|
$ |
8,954 |
|
$ |
147,724 |
|
$ |
— |
|
$ |
156,678 |
|
The fair values of the financial instruments shown in the table above represent the Company’s best estimates of the amounts that would be received upon sale of those assets in an orderly transaction between market participants at that date. Those fair value measurements maximize the use of observable inputs. However, in situations where there is little, if any, market activity for the asset at the measurement date, the fair value measurement reflects the Company’s judgments about the assumptions that market participants would use in pricing the asset. Those judgments are developed by the Company based on the best information available in the circumstances.
The Company used the following valuation methodologies for assets measured at fair value. There have been no changes in the methodologies used at December 31, 2016 and 2015.
Common stocks (Level 1) were valued at the closing price reported on the active market on which the individual securities are traded.
66
Fixed income funds, equity funds, and short term investment funds (Level 2) were valued as follows. Fixed income funds are valued based on yields currently available on comparable securities of issuers with similar credit ratings. Equity funds and short term investment funds include commingled equity funds that are not open to public investment and are valued at the net asset value per share.
All contributions made were as required by law. The Company expects to contribute $4.8 million to its defined benefit pension plans in 2017. The Company expects to contribute $3.3 million to its other postretirement benefit plans in 2017.
The Company projects that its plans will make the following benefit payments for the years ended December 31 (dollars in thousands):
|
|
|
|
|
|
Other |
|
|
|
|
|
Pension Plans |
|
Postretirement |
|
||
|
|
|
Benefits Paid |
|
Benefits Paid |
|
||
|
2017 |
|
$ |
36,396 |
|
$ |
3,332 |
|
|
2018 |
|
|
16,592 |
|
|
3,637 |
|
|
2019 |
|
|
13,013 |
|
|
3,749 |
|
|
2020 |
|
|
13,261 |
|
|
3,872 |
|
|
2021 |
|
|
12,470 |
|
|
3,938 |
|
|
2022 through 2026 |
|
|
59,733 |
|
|
19,560 |
|
|
|
|
$ |
151,465 |
|
$ |
38,088 |
|
Assumed health care costs trend rates have a significant impact on the amounts reported for other postretirement benefits. A one‑percentage point change in the assumed health care cost trend rates would have the following annual effects (dollars in thousands):
|
|
|
1-Percentage |
|
1-Percentage |
|
||
|
|
|
Point Increase |
|
Point Decrease |
|
||
|
Effect on total of service and interest costs components |
|
$ |
335 |
|
$ |
(264) |
|
|
Effect on postretirement benefit obligation |
|
|
7,012 |
|
|
(5,524) |
|
401(k) Plan
The Company participates in two 401(k) employee savings plans that allow for voluntary contributions into designated investment funds by eligible employees with the Company matching employee contributions, up to a maximum of 10% of compensation for union employees and 6% of compensation for non-union employees. Company contributions were $5.1 million, $5.0 million and $5.1 million for the years ended December 31, 2016, 2015 and 2014, respectively.
67
9. Income Taxes
The components of the income tax provision are as follows (dollars in thousands):
|
|
|
For the Year Ended |
|
|||||||
|
|
|
December 31, |
|
|||||||
|
|
|
2016 |
|
2015 |
|
2014 |
|
|||
|
Current |
|
|
|
|
|
|
|
|
|
|
|
Federal |
|
$ |
— |
|
$ |
— |
|
$ |
— |
|
|
State and local |
|
|
(741) |
|
|
(601) |
|
|
(941) |
|
|
|
|
|
(741) |
|
|
(601) |
|
|
(941) |
|
|
Deferred |
|
|
|
|
|
|
|
|
|
|
|
Federal |
|
|
1,160 |
|
|
1,726 |
|
|
6,081 |
|
|
State and local |
|
|
172 |
|
|
232 |
|
|
770 |
|
|
|
|
|
1,332 |
|
|
1,958 |
|
|
6,851 |
|
|
Total income tax provision |
|
$ |
591 |
|
$ |
1,357 |
|
$ |
5,910 |
|
The income tax provision differs from the amounts determined by applying the statutory federal income tax rate of 34% to the income before income tax provision for the following reasons (dollars in thousands):
|
|
|
For the Year Ended |
|
|||||||
|
|
|
December 31, |
|
|||||||
|
|
|
2016 |
|
2015 |
|
2014 |
|
|||
|
Income tax at federal rate |
|
$ |
577 |
|
$ |
835 |
|
$ |
4,763 |
|
|
Increase (decrease) resulting from: |
|
|
|
|
|
|
|
|
|
|
|
State income taxes, net of federal income tax |
|
|
101 |
|
|
104 |
|
|
592 |
|
|
Permanent difference for compensation limitation |
|
|
— |
|
|
637 |
|
|
595 |
|
|
Expense not deductible for tax |
|
|
292 |
|
|
98 |
|
|
415 |
|
|
Tax credit included in taxable income |
|
|
283 |
|
|
252 |
|
|
327 |
|
|
Other permanent differences |
|
|
20 |
|
|
110 |
|
|
47 |
|
|
Capital goods excise tax credit |
|
|
(741) |
|
|
(601) |
|
|
(942) |
|
|
Other, net |
|
|
74 |
|
|
54 |
|
|
51 |
|
|
Change in valuation allowance |
|
|
(15) |
|
|
(132) |
|
|
62 |
|
|
Total income tax provision |
|
$ |
591 |
|
$ |
1,357 |
|
$ |
5,910 |
|
Deferred income taxes consisted of the following (dollars in thousands):
|
|
|
December 31, |
|
||||
|
|
|
2016 |
|
2015 |
|
||
|
Deferred tax liabilities: |
|
|
|
|
|
|
|
|
Property and equipment |
|
$ |
46,965 |
|
$ |
46,636 |
|
|
Other basis differences |
|
|
533 |
|
|
542 |
|
|
|
|
|
47,498 |
|
|
47,178 |
|
|
Deferred tax assets: |
|
|
|
|
|
|
|
|
Net operating loss and credit carryforwards |
|
|
66,580 |
|
|
55,043 |
|
|
Intangible assets |
|
|
30,913 |
|
|
41,678 |
|
|
Expenses deferred for tax |
|
|
5,347 |
|
|
5,638 |
|
|
Employee benefits |
|
|
33,434 |
|
|
31,423 |
|
|
Other basis differences |
|
|
3,730 |
|
|
3,642 |
|
|
|
|
|
140,004 |
|
|
137,424 |
|
|
Valuation allowance |
|
|
(335) |
|
|
(350) |
|
|
|
|
|
139,669 |
|
|
137,074 |
|
|
Deferred tax asset, net |
|
$ |
92,171 |
|
$ |
89,896 |
|
68
As of December 31, 2016, net operating losses available for carry forward through 2036 amounted to $166.5 million for federal purposes and $172.5 million for state purposes. Availability of net operating losses in future periods may be subject to additional limitations if there is a deemed change in control for income tax reporting purposes. Such change in control will be determined for income tax reporting purposes based on future changes in stock ownership. In addition to the net operating losses disclosed previously, there was $1.4 million and $1.4 million of excess tax deductions available at December 31, 2016 and 2015, respectively, related to employee stock expense for which a benefit will be recorded to additional paid-in capital when realized.
The valuation allowance is related to charitable loss carry forwards subject to deduction limitations. If there is a decline in the level of actual future or forecasted earnings, the conclusion regarding the need for a valuation allowance may change in future periods resulting in the establishment of a valuation allowance for some or all of the deferred income tax assets. The following is a summary of activity for the valuation allowance (dollars in thousands):
|
|
|
|
|
|
Charge (Credit) |
|
|
|
|
|
|
|
|
|
|
|
to Income Tax |
|
|
|
|
|
|
|
|
Beginning |
|
Expense or |
|
Ending |
|
|||
|
|
|
Balance |
|
Equity |
|
Balance |
|
|||
|
January 1 to December 31, 2016 |
|
$ |
350 |
|
$ |
(15) |
|
$ |
335 |
|
|
January 1 to December 31, 2015 |
|
|
482 |
|
|
(132) |
|
|
350 |
|
|
January 1 to December 31, 2014 |
|
|
420 |
|
|
62 |
|
|
482 |
|
The Company evaluates its tax positions for liability recognition. As of December 31, 2016, 2015 and 2014, the Company had no unrecognized tax benefit. No interest or penalties related to tax assessments were recognized in the Company’s consolidated statements of income for the years ended December 31, 2016, 2015 or 2014. All tax years from 2013 remain open for both federal and Hawaii state purposes.
10. Stockholder’s Equity
Warrants
In 2010, the Company issued warrants to purchase 1,481,055 shares of common stock for $14.00 per share. The warrants to purchase shares could be exercised from January 26, 2011 to the maturity on October 28, 2015. The warrants could be exercised on a cashless basis whereby a portion of the exercised warrants are tendered in lieu of payment for the exercise price. During the years ended December 31, 2015 and 2014, warrants were exercised on a cashless basis resulting in the issuance of 228,316 and 73,422 shares of common stock, respectively. In addition, during the year ended December 31, 2015, another 490,759 warrants were exercised for cash consideration of $6.9 million.
Equity Incentive Plan
The Compensation Committee of the Company’s Board of Directors may grant awards under the Company’s equity incentive plan in the form of incentive stock options, non‑qualified stock options, stock appreciation rights, restricted stock, restricted stock units and other stock‑based awards. The maximum number of shares issuable under the equity incentive plan is 1,400,000 shares with 638,000 shares remaining to be issued at December 31, 2016. All grants under the equity incentive plan will be issued at the fair value of the Company’s common stock on date of grant.
As of December 31, 2016, all awards were restricted stock units.
Restricted Stock Units
Restricted stock units are generally subject to forfeiture if employment terminates prior to release of the restrictions. The Company expenses the cost of restricted stock units, which is determined to be the fair market value of the shares at the date of grant, ratably over the period during which the restrictions lapse.
69
Restricted stock units have service, performance and market conditions for vesting. Those with service conditions vest in equal installments on each of the first through fourth anniversaries of the date of grant except for those granted to directors which vest over one year. Those with performance and market conditions vest in installments over four years based on the achievement of goals established by the Compensation Committee of the Company’s Board of Directors.
Activity with respect to outstanding restricted stock units for the years ended December 31, 2016, 2015 and 2014 was as follows:
|
|
|
|
|
Weighted- |
|
|
|
|
|
|
|
Average |
|
|
|
|
|
|
|
Grant-Date Fair |
|
|
|
|
|
Shares |
|
Value per Share |
|
|
|
Nonvested at January 1, 2014 |
|
260,734 |
|
$ |
18 |
|
|
Granted |
|
155,146 |
|
|
31 |
|
|
Vested |
|
(157,794) |
|
|
21 |
|
|
Forfeited |
|
(12,334) |
|
|
25 |
|
|
Nonvested at December 31, 2014 |
|
245,752 |
|
|
27 |
|
|
Granted |
|
140,909 |
|
|
26 |
|
|
Vested |
|
(110,623) |
|
|
28 |
|
|
Forfeited |
|
(101,520) |
|
|
26 |
|
|
Nonvested at December 31, 2015 |
|
174,518 |
|
|
26 |
|
|
Granted |
|
127,360 |
|
|
25 |
|
|
Vested |
|
(62,651) |
|
|
25 |
|
|
Forfeited |
|
(12,537) |
|
|
25 |
|
|
Nonvested at December 31, 2016 |
|
226,690 |
|
$ |
25 |
|
|
|
|
|
|
|
|
|
As of December 31, 2016, there was $3.7 million of unrecognized share-based compensation expense related to nonvested restricted stock unit awards expected to vest. The cost is expected to be recognized over a weighted-average period of two years.
The Company recognized compensation expense of $2.3 million, $1.6 million and $4.2 million for the years ended December 31, 2016, 2015 and 2014, respectively. For the year ended December 31, 2016, the Company had granted restricted stock units with market conditions. The Company valued those units for expense recognition purposes using a Monte Carlo simulation model with an expected volatility for the Company’s shares of 24.1%, a risk free return of 0.85% and no expected dividends.
The fair value as of the vesting date for the restricted stock units that vested during the years ended December 31, 2016, 2015 and 2014 was $1.0 million, $2.6 million and $3.9 million, respectively. Upon vesting, unit holders have the option to net share-settle to cover the required withholding tax and the remaining amount is converted into an equivalent number of shares of common stock. The total shares withheld were 15,772, 36,592 and 53,775 for the years ended December 31, 2016, 2015 and 2014, respectively, and were based on the value of the restricted stock units as determined by the Company’s closing stock price on the date of vesting. Total payments for the employees’ tax obligations to the tax authorities was $0.4 million, $0.9 million and $1.5 million for the years ended December 31, 2016, 2015 and 2014, respectively. Other than reimbursements for tax withholdings, there was no cash received under the restricted stock unit arrangements. In 2014, the terms of certain restricted stock units were modified which resulted in the restricted stock units vesting as of the date of the modification. The Company recognized the incremental value of $0.6 million as additional expense in 2014.
70
Performance Based Stock Compensation
The Company has a performance based compensation plan. The incentive compensation is settled in March of each year for the prior year services and is based on Company performance relative to certain company specific metrics. The Company recognizes the expense during the performance period based on the expected compensation amount. The compensation for the performance period ended December 31, 2015 was settled in cash in March 2016. Beginning for the 2016 performance period, a specified portion of the compensation amount for certain employees will be settled in Company shares based on the share price at the date of settlement. Upon settlement, employees will net share-settle to cover the required withholding tax and the remaining amount is converted into an equivalent number of shares of common stock. The performance based compensation to be settled in stock amounted to $0.6 million for the year ended December 31, 2016.
11. Leases
The Company leases certain facilities and equipment for use in the Company’s operations under several operating agreements. Certain of the leases provide for escalation or renegotiation of rental rates, and for extension of lease terms. Total rent expense for the Company amounted to $4.6 million, $4.5 million and $5.1 million for the years ended December 31, 2016, 2015 and 2014, respectively.
Information on the aggregate minimum rental commitments under non-cancelable operating leases is as follows (dollars in thousands):
|
Years ended, December 31: |
|
|
|
|
|
2017 |
|
$ |
2,208 |
|
|
2018 |
|
|
1,749 |
|
|
2019 |
|
|
1,725 |
|
|
2020 |
|
|
1,697 |
|
|
2021 |
|
|
1,119 |
|
|
Thereafter |
|
|
5,478 |
|
|
|
|
$ |
13,976 |
|
12. Accumulated Other Comprehensive Income (Loss)
The components of accumulated other comprehensive income (loss) are as follows (dollars in thousands):
|
|
|
Unrealized |
|
Defined Benefit |
|
|
|
|
||
|
|
|
Gain (Loss) on |
|
Postretirement |
|
|
|
|
||
|
|
|
Investments |
|
Plans |
|
Total |
|
|||
|
January 1, 2014 |
|
$ |
(60) |
|
$ |
(4,656) |
|
$ |
(4,716) |
|
|
Other comprehensive loss for 2014, net of tax |
|
|
(4) |
|
|
(19,227) |
|
|
(19,231) |
|
|
December 31, 2014 |
|
|
(64) |
|
|
(23,883) |
|
|
(23,947) |
|
|
Other comprehensive income (loss) for 2015, net of tax |
|
|
64 |
|
|
(5,505) |
|
|
(5,441) |
|
|
December 31, 2015 |
|
|
— |
|
|
(29,388) |
|
|
(29,388) |
|
|
Other comprehensive loss for 2016, net of tax |
|
|
— |
|
|
(5,830) |
|
|
(5,830) |
|
|
December 31, 2016 |
|
$ |
— |
|
$ |
(35,218) |
|
$ |
(35,218) |
|
71
Reclassifications out of accumulated other comprehensive income (loss) for the years ended December 31, 2016, 2015 and 2014 were as follows (dollars in thousands):
|
|
|
For the Year Ended |
|
|||||||
|
|
|
December 31, |
|
|||||||
|
|
|
2016 |
|
2015 |
|
2014 |
|
|||
|
Retirement plans |
|
|
|
|
|
|
|
|
|
|
|
Amortization of loss and settlement loss |
|
$ |
2,424 |
|
$ |
8,862 |
|
$ |
195 |
|
|
Income tax provision on comprehensive income |
|
|
921 |
|
|
3,368 |
|
|
74 |
|
|
Total |
|
$ |
1,503 |
|
$ |
5,494 |
|
$ |
121 |
|
The amortization of loss and settlement loss were recognized primarily in selling, general and administrative expense for all three periods presented.
13. Commitments and Contingencies
Long‑Term Fixed Supplier Commitments
The Company has entered into agreements with various entities under long-term fixed contractual commitments primarily for technology related construction and services. Annual fixed fee commitments for agreements in effect at December 31, 2016, amounted to the following (dollars in thousands):
|
Years ended, December 31: |
|
|
|
|
|
2017 |
|
$ |
16,786 |
|
|
2018 |
|
|
11,536 |
|
|
2019 |
|
|
3,312 |
|
|
|
|
$ |
31,634 |
|
Under the long-term agreements, the Company incurred costs amounting to $23.0 million, $12.8 million and $9.3 million for the years ended December 31, 2016, 2015 and 2014, respectively.
Trans-Pacific Submarine Cable
In August 2014, the Company joined several other telecommunication companies to form a consortium to build and operate a trans-Pacific submarine cable system. The total system cost is $235 million and is primarily composed of a supply contract with the lead contractor. The Company will invest $25 million over the multi-year construction period for a fractional ownership in the system. The fixed fee component of the investment is included in the above fixed fee commitments. The Company will recognize its fractional share of the cost. In addition, the Company will construct a cable landing station in Hawaii and provide cable landing services. The system is expected to be completed in the second half of 2017. As of December 31, 2016, the Company had incurred costs of $16.6 million primarily to the cable contractor for construction with all such costs capitalized to telephone plant under construction.
The Company will have excess capacity on its share of the trans-Pacific cable that it will make available to other carriers for a fee. The Company has contracted and expects to enter into additional contracts with other carriers for long-term indefeasible right of use, or IRU, agreements for fiber circuit capacity. The Company may receive up-front payments for services to be delivered over a period of up to 25 years. The Company has entered into agreements for the sale of capacity for $27.0 million plus fees to activate assigned capacity, and for operations and maintenance. As of December 31, 2016, the Company had received up-front payments of $7.2 million. As provided for in one of the agreements, funds of $5.0 million were held in escrow. The funds in escrow will be released to the Company when the trans-Pacific cable is ready for service. The restricted cash is reflected in other current assets in the consolidated balance sheet at December 31, 2016. A liability to provide services in the future for all up-front payments is included in advance billings and customer deposits and other liabilities. The Company will recognize revenue for the circuit, beginning upon activation of the services, on a straight-line basis over the contract term.
72
Connect America Fund Phase II
In conjunction with reforming the Universal Service Fund, the Federal Communications Commission (“FCC”) established the Connect America Fund (“CAF”) which provides incremental support to broadband service providers. CAF Phase II is the long-term component of the program. In August 2015, the Company notified the FCC that it is accepting CAF Phase II support which amounts to $4.4 million in annual funding. Support is retroactive through the beginning of 2015, net of certain other receipts from the Universal Service Fund, and will continue for six years. Under the terms of CAF Phase II, the Company will offer broadband service at 10 Mbps downstream and 1 Mbps upstream or better to approximately 11,000 eligible locations in high-cost areas in the State of Hawaii and will provide voice and broadband services at reasonable rates. For the years ended December 31, 2016 and 2015, the Company recognized $4.4 and $3.3 million, respectively, in CAF Phase II funding as revenue in the consolidated income statement.
Other Installment Contracts
The Company has various other fixed installment contacts generally in conjunction with acquisition of assets. These agreements generally have a component representing interest at fixed rates in addition to principal. As of December 31, 2016, the commitments were as follows (dollars in thousands):
|
Years ended, December 31: |
|
|
|
|
|
2017 |
|
$ |
2,797 |
|
|
2018 |
|
|
1,264 |
|
|
2019 |
|
|
1,231 |
|
|
2020 |
|
|
1,018 |
|
|
2021 |
|
|
981 |
|
|
Thereafter |
|
|
7,103 |
|
|
|
|
|
14,394 |
|
|
Less amount representing interest |
|
|
(3,545) |
|
|
Present value |
|
|
10,849 |
|
|
Current reflected in other current liabilities |
|
|
2,157 |
|
|
Noncurrent reflected in other liabilities |
|
$ |
8,692 |
|
Collective Bargaining Agreement
The Company has a collective bargaining agreement with the International Brotherhood of Electrical Workers Local 1357 (“IBEW”) that expires on December 31, 2017. The agreement covers approximately half of the Company’s workforce.
73
Joint-Owned Utility Poles
Each of the electric utilities for the four counties in the State of Hawaii have separate agreements with the Company for the joint ownership and maintenance of utility poles along with other third parties, such as the State of Hawaii. The agreements set forth various circumstances requiring pole removal, installation and replacement and the sharing of costs among the joint pole owners. The agreements allow for the cost of work done by one joint pole owner to be shared by the other joint pole owners based on the apportionment of costs in the agreements. Generally, the electric utilities have maintained, replaced and installed the majority of the jointly-owned poles and have billed the other joint pole owners for their respective share of the costs. The Company has a disagreement with the common owner of the utilities in three of the counties regarding the amount the utilities are requesting for their share of the capitalized costs.
For one of the three utilities referenced above, a dispute resolution process is proceeding as specified by the joint pole agreement. For another of the utilities, a complaint for payment was filed by the utility with the State court in 2016. Management of the Company believes the amount recognized in the Company’s consolidated financial statements for amounts due the utilities are reflective of what is owed and a reasonable estimate of the final settlement to be reached with the utilities.
Litigation
The Company is involved in litigation arising in the normal course of business. The outcome of litigation is not expected to have a material adverse impact on the Company’s consolidated financial statements.
14. Fair Value of Financial Instruments
The following method and assumptions were used to estimate the fair value of each class of financial instruments for which it is practical to estimate the fair value.
Cash and cash equivalents, accounts receivable and accounts payable – The carrying amount approximates fair value. The valuation is based on settlements of similar financial instruments all of which are short-term in nature and generally settled at or near cost. Cash and cash equivalents are measured at Level 1.
Investment securities – The fair value of investment securities was based on quoted market prices. Investment securities were included in other assets on the consolidated balance sheets.
Debt – The fair value of debt is based on the value at which debt is trading among holders.
The estimated fair value of financial instruments is as follows (dollars in thousands):
|
|
|
Carrying |
|
Fair |
|
||
|
|
|
Value |
|
Value |
|
||
|
December 31, 2016 |
|
|
|
|
|
|
|
|
Liabilities - long-term debt (carried at cost) |
|
|
284,699 |
|
|
293,765 |
|
|
December 31, 2015 |
|
|
|
|
|
|
|
|
Liabilities - long-term debt (carried at cost) |
|
|
286,046 |
|
|
291,306 |
|
74
Fair Value Measurements
The objective of the fair value measurement is to estimate the price at which an orderly transaction to sell the asset or to transfer the liability would take place between market participants at the measurement date under current market conditions.
Accounting standards establish a fair value hierarchy that prioritizes the inputs used to measure fair value. The hierarchy gives the highest priority to unadjusted quoted prices in active markets for identical assets or liabilities (Level 1 measurement) and the lowest priority to unobservable inputs (Level 3 measurement). Liabilities carried at amortized cost with fair value disclosure on a recurring basis represent long-term debt. A summary is as follows (dollars in thousands):
|
|
|
December 31, |
|
||||
|
|
|
2016 |
|
2015 |
|
||
|
Liability value measurements using: |
|
|
|
|
|
|
|
|
Quoted prices in active markets for identical liabilities (Level 1) |
|
$ |
— |
|
$ |
— |
|
|
Significant other observable inputs (Level 2) |
|
|
293,765 |
|
|
291,306 |
|
|
Significant unobservable inputs (Level 3) |
|
|
— |
|
|
— |
|
|
|
|
$ |
293,765 |
|
$ |
291,306 |
|
15. Cash Flow Information
Supplemental cash flow information is as follows:
|
|
|
For the Year Ended |
|
|||||||
|
|
|
December 31, |
|
|||||||
|
|
|
2016 |
|
2015 |
|
2014 |
|
|||
|
Cash paid during the year: |
|
|
|
|
|
|
|
|
|
|
|
Income taxes paid |
|
$ |
— |
|
$ |
— |
|
$ |
— |
|
|
Interest paid, net of amounts capitalized |
|
|
13,706 |
|
|
16,178 |
|
|
14,667 |
|
|
Non-cash investing activities - capital assets acquired under installment contracts |
|
|
1,309 |
|
|
90 |
|
|
6,005 |
|
75
16. Segment Information
The Company operates in the two reportable segments of telecommunications and data center services. This conclusion is based on how resources are allocated and performance is assessed by the Chief Executive Officer, the Company’s chief operating decision maker. The telecommunications segment provides local voice services, video, high‑speed internet and long distance voice services. In addition, the segment provides network access which includes data transport. Various related telephony services are provided including equipment and managed services. The data center colocation segment provides physical colocation, virtual colocation and various related telephony services. The following table provides operating financial information for the Company’s reportable segments for the years ended December 31, 2016, 2015 and 2014 and as of December 31, 2016 and 2015 (dollars in thousands):
|
|
|
Tele- |
|
|
|
Intersegment |
|
|
|
|
|||
|
|
|
communications |
|
Data Center |
|
Elimination |
|
Total |
|
||||
|
2016 |
|
|
|
|
|
|
|
|
|
|
|
|
|
|
Operating revenues |
|
$ |
382,676 |
|
$ |
12,435 |
|
$ |
(2,148) |
|
$ |
392,963 |
|
|
Depreciation and amortization |
|
|
87,787 |
|
|
2,129 |
|
|
— |
|
|
89,916 |
|
|
Operating income (loss) |
|
|
19,526 |
|
|
(734) |
|
|
— |
|
|
18,792 |
|
|
Capital expenditures |
|
|
102,427 |
|
|
946 |
|
|
— |
|
|
103,373 |
|
|
Assets |
|
|
780,930 |
|
|
22,991 |
|
|
— |
|
|
803,921 |
|
|
2015 |
|
|
|
|
|
|
|
|
|
|
|
|
|
|
Operating revenues |
|
$ |
383,767 |
|
$ |
11,094 |
|
$ |
(1,448) |
|
$ |
393,413 |
|
|
Depreciation and amortization |
|
|
85,643 |
|
|
2,236 |
|
|
— |
|
|
87,879 |
|
|
Operating income (loss) |
|
|
20,161 |
|
|
(899) |
|
|
— |
|
|
19,262 |
|
|
Capital expenditures |
|
|
97,838 |
|
|
604 |
|
|
— |
|
|
98,442 |
|
|
Assets |
|
|
777,139 |
|
|
22,556 |
|
|
— |
|
|
799,695 |
|
|
2014 |
|
|
|
|
|
|
|
|
|
|
|
|
|
|
Operating revenues |
|
$ |
381,013 |
|
$ |
10,737 |
|
$ |
(1,011) |
|
$ |
390,739 |
|
|
Depreciation and amortization |
|
|
76,325 |
|
|
1,689 |
|
|
— |
|
|
78,014 |
|
|
Operating income (loss) |
|
|
30,683 |
|
|
(212) |
|
|
— |
|
|
30,471 |
|
|
Capital expenditures |
|
|
103,588 |
|
|
118 |
|
|
— |
|
|
103,706 |
|
|
Assets |
|
|
772,168 |
|
|
24,556 |
|
|
— |
|
|
796,724 |
|
Intersegment revenue represents network access services provided by the telecommunications segment for data center colocation. For the years ended December 31, 2016, 2015 and 2014, total operating income above reconciles to the consolidated statement of income as follows:
|
|
|
For the Year Ended December 31, |
|
|||||||
|
|
|
2016 |
|
2015 |
|
2014 |
|
|||
|
Operating income |
|
$ |
18,792 |
|
$ |
19,262 |
|
$ |
30,471 |
|
|
Corporate other expense |
|
|
17,095 |
|
|
16,805 |
|
|
16,462 |
|
|
Income before income tax provision |
|
$ |
1,697 |
|
$ |
2,457 |
|
$ |
14,009 |
|
The following table provides information on the Company’s revenue, net of intersegment eliminations, by product group (dollars in thousands):
|
|
|
|
|
|||||||
|
|
|
For the Year Ended December 31, |
|
|||||||
|
|
|
2016 |
|
2015 |
|
2014 |
|
|||
|
Local voice and other retail services |
|
$ |
326,864 |
|
$ |
325,889 |
|
$ |
322,231 |
|
|
Wholesale carrier data services |
|
|
53,664 |
|
|
56,430 |
|
|
57,771 |
|
|
Data center |
|
|
12,435 |
|
|
11,094 |
|
|
10,737 |
|
|
|
|
$ |
392,963 |
|
$ |
393,413 |
|
$ |
390,739 |
|
76
In 2014, the data center services segment sold equipment for $0.4 million to a technology company that is a wholly-owned investment of an officer of the data center services segment.
17. Quarterly Financial Information (Unaudited)
The Company’s quarterly operating results are presented in the following table (dollars in thousands, except per share amounts):
|
|
|
|
|
|
|
|
|
|
|
|
Earnings |
|
Earnings |
|
||
|
|
|
|
|
|
|
Net |
|
(Loss) |
|
(Loss) |
|
|||||
|
|
|
Operating |
|
Operating |
|
Income |
|
per share - |
|
per share - |
|
|||||
|
|
|
Revenues |
|
Income |
|
(Loss) |
|
basic |
|
diluted |
|
|||||
|
Year Ended December 31, 2016: |
|
|
|
|
|
|
|
|
|
|
|
|
|
|
|
|
|
First Quarter |
|
$ |
98,794 |
|
$ |
4,500 |
|
$ |
154 |
|
$ |
0.01 |
|
$ |
0.01 |
|
|
Second Quarter |
|
|
99,541 |
|
|
6,889 |
|
|
1,445 |
|
|
0.13 |
|
|
0.13 |
|
|
Third Quarter |
|
|
97,848 |
|
|
3,703 |
|
|
(279) |
|
|
(0.02) |
|
|
(0.02) |
|
|
Fourth Quarter |
|
|
96,780 |
|
|
3,700 |
|
|
(214) |
|
|
(0.02) |
|
|
(0.02) |
|
|
Total |
|
$ |
392,963 |
|
$ |
18,792 |
|
$ |
1,106 |
|
$ |
0.10 |
|
$ |
0.10 |
|
|
Year Ended December 31, 2015: |
|
|
|
|
|
|
|
|
|
|
|
|
|
|
|
|
|
First Quarter |
|
$ |
97,114 |
|
$ |
5,919 |
|
$ |
975 |
|
$ |
0.09 |
|
$ |
0.09 |
|
|
Second Quarter |
|
|
96,187 |
|
|
5,260 |
|
|
455 |
|
|
0.04 |
|
|
0.04 |
|
|
Third Quarter |
|
|
100,905 |
|
|
4,195 |
|
|
105 |
|
|
0.01 |
|
|
0.01 |
|
|
Fourth Quarter |
|
|
99,207 |
|
|
3,888 |
|
|
(435) |
|
|
(0.04) |
|
|
(0.04) |
|
|
Total |
|
$ |
393,413 |
|
$ |
19,262 |
|
$ |
1,100 |
|
$ |
0.10 |
|
$ |
0.10 |
|
The quarterly results of operations for the year ended December 31, 2016 include pension settlement losses (see Note 8) for the third and fourth quarters amounting to $0.5 million and $0.8 million, respectively. The quarterly results of operations for the year ended December 31, 2015 include pension settlement losses for the first, second, third and fourth quarters amounting to $0.9 million, $1.4 million, $4.1 million and $1.7 million, respectively. In addition, in the third quarter of 2015, the Company recognized $2.2 million in CAF Phase II funding as revenue (see Note 13).
18. Restricted Net Assets and Parent Company Condensed Financial Information
Agreements with the HPUC and the debt agreements of Hawaiian Telcom Communications, Inc. limit the ability of the Company’s subsidiaries to pay dividends to the parent company and restrict the net assets of all of the Company’s subsidiaries.
The following condensed financial information for Hawaiian Telcom Holdco, Inc. reflects parent company financial information only. Such financial information should be read in conjunction with the consolidated financial statements of the Company.
77
The parent company has accounted for its investment in its consolidated subsidiary on the equity method of accounting. No dividends were paid by the subsidiaries to the parent company at any time during the existence of the parent company.
Hawaiian Telcom Holdco, Inc.
(Parent Company Only)
Condensed Statements of Income and Comprehensive Income (Loss)
(Dollars in Thousands)
|
|
|
For the For the Year Ended |
|
|||||||
|
|
|
December 31, |
|
|||||||
|
|
|
2016 |
|
2015 |
|
2014 |
|
|||
|
Equity in earnings of Hawaiian Telcom Communications, Inc. |
|
$ |
1,106 |
|
$ |
1,100 |
|
$ |
8,099 |
|
|
Income tax expense |
|
|
— |
|
|
— |
|
|
— |
|
|
Net income |
|
|
1,106 |
|
|
1,100 |
|
|
8,099 |
|
|
Other comprehensive loss, net of tax |
|
|
(5,830) |
|
|
(5,441) |
|
|
(19,231) |
|
|
Comprehensive loss |
|
$ |
(4,724) |
|
$ |
(4,341) |
|
$ |
(11,132) |
|
Hawaiian Telcom Holdco, Inc.
(Parent Company Only)
Condensed Balance Sheets
(Dollars in Thousands)
|
|
|
December 31, |
|
||||
|
|
|
2016 |
|
2015 |
|
||
|
Assets |
|
|
|
|
|
|
|
|
Investment in Hawaiian Telcom Communications, Inc. |
|
$ |
304,914 |
|
$ |
307,699 |
|
|
Total assets |
|
$ |
304,914 |
|
$ |
307,699 |
|
|
Stockholders’ Equity |
|
|
|
|
|
|
|
|
Common stock, par value $0.01 per share, 245,000,000 shares authorized and 11,513,279 and 11,466,398 shares issued and outstanding |
|
$ |
115 |
|
$ |
115 |
|
|
Additional paid-in capital |
|
|
179,958 |
|
|
178,019 |
|
|
Accumulated other comprehensive loss |
|
|
(35,218) |
|
|
(29,388) |
|
|
Retained earnings |
|
|
160,059 |
|
|
158,953 |
|
|
Total stockholders’ equity |
|
$ |
304,914 |
|
$ |
307,699 |
|
Hawaiian Telcom Holdco, Inc.
(Parent Company Only)
Condensed Statements of Cash Flows
(Dollars in Thousands)
|
|
|
For the For the Year Ended |
|
|||||||
|
|
|
December 31, |
|
|||||||
|
|
|
2016 |
|
2015 |
|
2014 |
|
|||
|
Net income |
|
$ |
1,106 |
|
$ |
1,100 |
|
$ |
8,099 |
|
|
Undistributed earnings of Hawaiian Telcom Communications, Inc. |
|
|
(1,106) |
|
|
(1,100) |
|
|
(8,099) |
|
|
Net cash provided by operating activities, net change in cash and ending balance of cash |
|
$ |
— |
|
$ |
— |
|
$ |
— |
|
78
Item 9. Change In and Disagreements with Accountants on Accounting and Financial Disclosure
None
Item 9A. Controls and Procedures
Conclusion Regarding the Effectiveness of Disclosure Controls and Procedures
Scott K. Barber, Chief Executive Officer, and Dan T. Bessey, Chief Financial Officer, have evaluated the disclosure controls and procedures of Hawaiian Telcom Holdco, Inc. (the “Company”) as of December 31, 2016. Based on their evaluations, as of December 31, 2016, they have concluded that the disclosure controls and procedures (as defined in Rules 13a‑15(e) and 15d‑15(e) under the Securities Exchange Act of 1934, as amended) were effective in ensuring that information required to be disclosed by the Company in reports the Company files or submits under the Securities Exchange Act of 1934:
|
(1) |
is recorded, processed, summarized, and reported within the time periods specified in the Securities and Exchange Commission rules and forms, and |
|
(2) |
is accumulated and communicated to the Company’s management, including the Company’s principal executive and principal financial officers, or persons performing similar functions, as appropriate to allow timely decisions regarding required disclosure. |
Changes in Internal Control over Financial Reporting
There have been no changes in internal control over financial reporting during the quarter ended December 31, 2016 that have materially affected, or are reasonably likely to materially affect, the Company’s internal control over financial reporting.
Annual Report on Internal Control over Financial Reporting
Management of Hawaiian Telcom Holdco, Inc. (the “Company”) has prepared an annual report on internal control over financial reporting. The Company’s independent registered public accounting firm has rendered an opinion on the Company’s internal control over financial reporting. Management’s report, together with the opinion of the independent registered public accounting firm, is set forth in Part II, Item 8 of this report.
79
Item 10. Directors, Executive Officers and Corporate Governance.
A. Directors
For information about the Directors and corporate governance of the Company, see the section captioned “Election of Directors” in the Company’s Proxy Statement for its 2017 Annual Meeting of Stockholders (“2017 Proxy Statement”), which section is incorporated herein by reference.
B. Executive Officers and Key Employees
The following table provides information regarding our executive officers and other key employees as of March 1, 2017:
|
Name |
|
Age |
|
Position(s) |
|
|
Officers |
|
|
|
|
|
|
Scott K. Barber |
|
56 |
|
President, Chief Executive Officer and Director |
|
|
Dan T. Bessey |
|
51 |
|
Senior Vice President and Chief Financial Officer |
|
|
John T. Komeiji |
|
63 |
|
Senior Vice President, Chief Administrative Officer and General Counsel |
|
|
Kevin T. Paul |
|
61 |
|
Senior Vice President—Technology |
|
|
Amy S. Aapala |
|
44 |
|
Vice President—Information Technology Systems and Order Management |
|
|
Jason K. Fujita |
|
41 |
|
Vice President—Consumer Sales and Product Marketing |
|
|
Paul G. Krueger |
|
52 |
|
Vice President—Business Sales and Product Marketing |
|
|
Benjamin L. Morgan |
|
43 |
|
Vice President—Customer Care |
|
|
Sunshine P. W. Topping |
|
46 |
|
Vice President—Human Resources |
|
|
Gregory Chamberlain |
|
58 |
|
Vice President—Network Operations |
|
Scott K. Barber became President and Chief Executive Officer of the Company in June 2015, and a Director in May 2015. Prior to becoming our Chief Executive Officer, Mr. Barber served as our Chief Operating Officer since January 2013, where he was responsible for overseeing day-to-day operations of the Company’s technology, sales, marketing, customer service, customer care, business operations, and business development teams. Prior to joining us, Mr. Barber was Vice President of Operations of Consolidated Communications, an Illinois based telecommunications company, since July 2012, during which time he led field and network operations teams across six states. Prior to joining Consolidated Communications, Mr. Barber held various executive positions at SureWest Communications beginning 1994, most recently as Chief Operating Officer from 2011 to 2012.
Dan T. Bessey became our Senior Vice President and Chief Financial Officer in May 2015. Prior to joining us, Mr. Bessey served as the Chief Financial Officer of Cesca Therapeutics Inc., a biotechnology company, from March 2014. Prior to that, Mr. Bessey served as Vice President and Chief Financial Officer of SureWest Communications, a telecommunications company, from 2008 to 2013. Before becoming Chief Financial Officer of SureWest Communications, Mr. Bessey served in a number of key financial leadership roles within the company, including Vice President of Finance, Controller and Director of Corporate Finance beginning in 1995. Prior to joining SureWest Communications, Mr. Bessey was with Ernst & Young LLP. Mr. Bessey is a Certified Public Accountant and has a B.S. degree in Business Administration with a concentration in Accountancy from California State University – Sacramento, where he graduated Magna Cum Laude.
John T. Komeiji became our Senior Vice President and General Counsel in June 2008 and is responsible for our legal, government affairs, support services, external affairs, and as of November 2010, human resources and labor relations. Prior to joining us, Mr. Komeiji was senior partner at Watanabe Ing & Komeiji LLP from 1998 to June 2008, where his practice focused on litigation of complex commercial, personal injury and professional liability matters. He is the past president of the Hawaii State Bar Association and has served on the American Bar Association’s Standing Committee on Lawyer Competence.
80
Kevin T. Paul became our Senior Vice President—Technology in August 2011 and is responsible for the architecture, engineering, development, test and support of our network and systems. Mr. Paul has held leadership technology roles for over 25 years. Prior to joining us, he served in various capacities at Level 3 Communications since 2000, including as Vice President of Content Engineering & Development from January 2009 to July 2011, where he had responsibility for the architecture, engineering, development, test and tier IV support of Level 3’s CDN and VYVX services, and Vice President of Network Integration from November 2005 to December 2008, where he had responsibility for network due diligence, integration, planning and execution.
Amy S. Aapala became our Vice President—Information Technology Systems and Order Management effective February 15, 2016, and is responsible for our order management systems, data center and desktop services. She joined us in 2005, having previously served as our Vice President—Customer Service from March 2013 until February 2016, Executive Director‑Field Operations from December 2011 to March 2013 and Executive Director‑OMS Operations from January 2011 to December 2011. Ms. Aapala has more than 18 years of experience in the telecommunications industry. Prior to joining us, Ms. Aapala worked as a consultant for The Carlyle Group and in senior management positions in billing and customer service with various telecommunications companies.
Jason K. Fujita became our Vice President—Consumer Sales and Product Marketing in November 2013. He previously served as our Vice President—Consumer Sales from August 2012. Mr. Fujita is in charge of our customer contact centers as well as our public communications, wireless, Hawaiian Telcom TV and multiple dwelling unit sales, and consumer product marketing. He began his career with us in 1997, having most recently served as Executive Director—Consumer and Business Sales from April 2012 to August 2012 and Director—Contact Centers from May 2009 to April 2012.
Paul G. Krueger became our Vice President—Business Sales and Product Marketing in November 2013. He previously served as our Vice President—Business and Wholesale Sales from October 2012. Mr. Krueger is in charge of our business sales, business sales operations, sales engineering, sales planning and performance analysis, wholesale markets, and business product marketing. With more than 20 years in the telecommunications industry, he previously served in various capacities at SureWest Communications beginning 1995, most recently as Executive Director of business sales from 2008 to September 2012.
Benjamin L. Morgan became our Vice President—Customer Care in March 2014. He is responsible for our Customer CARE, 911 operations, Managed Services Operations teams and Network Reliability department, which includes the Network Operations Center (eNOC), Tier 2 Technical Support, Data Center Operations, TV Head End Operations and internal Help Desk teams. Mr. Morgan joined us in October 2011 as Director of Customer Care. In March 2012, he took on an expanded role as Executive Director—Customer Care. With more than 15 years of technology and telecommunications experience, he previously held management and senior management positions at Speakeasy Inc., which merged with Covad Communications and MegaPath to form a new MegaPath Corporation in 2010, most recently as Vice President—Voice Services.
Sunshine P. W. Topping joined Hawaiian Telcom as Vice President—Human Resources in June 2015. She oversees the Company’s HR, benefits, employment and HR information systems (HRIS), labor relations, and organizational development and training functions. She previously served as Chief Human Resources Strategy Officer for ‘ike (from 2014-2015), was Senior Director of Recruitment for Hawaiian Airlines between 2011-2014. She also served on the honorable Governor Neil Abercrombie’s cabinet as Director of the Human Resources Department for the state of Hawaii. She has 20 years of Human Resources experience, starting in 1996 as a Labor Relations specialist for The Boeing Company.
81
Greg Chamberlain became our Vice President—Network Operations in March 2016. Mr. Chamberlain oversees technical installation, repair and construction projects, central office and dispatch operations and network support services. Prior to joining Hawaiian Telcom in 2013, Mr. Chamberlain served as Executive Director of Network Engineering at SureWest Broadband, now known as Consolidated Communications, where he oversaw the deployment and management of key services such as Voice-over-Internet-Protocol (VoIP), Internet Service Providers, servers and data centers. Prior to this, he served as Director of Network Operations for WINfirst (Western Integrated Networks), a Denver-based communications company. Mr. Chamberlain has 35 years of experience in the telecommunications industry.
Item 11. Executive Compensation
For information about executive compensation, see the section captioned “Compensation of the Named Executive Officers and Directors” in the Company’s 2017 Proxy Statement, which section is incorporated herein by reference.
Item 12. Security Ownership of Certain Beneficial Owners and Management and Related Stockholder Matters.
See the section captioned “Security Ownership of Certain Stockholders, Directors and Executive Officers” in the Company’s 2017 Proxy Statement, which section is incorporated herein by reference.
Item 13. Certain Relationships and Related Transactions, and Director Independence
See the sections captioned “Certain Relationships and Related Transactions” and “Director Independence” in the Company’s 2017 Proxy Statement, which sections are incorporated herein by reference.
Item 14. Principal Accounting Fees and Services.
See the section captioned “Ratification of the Selection of Deloitte & Touche LLP as the Company’s Independent Registered Public Accounting Firm for 2017” in the Company’s 2017 Proxy Statement, which section is incorporated herein by reference.
82
Item 15. Exhibits, Financial Statement Schedules.
(a)The following documents are being filed as part of this report.
|
1. |
Consolidated Financial Statements. Financial statements and supplementary data required by this Item 15 are set forth at the pages indicated in Item 8 above. |
|
2. |
Financial Statement Schedules. All schedules for which provision is made in the applicable accounting regulations of the SEC are not required under the related instructions, are inapplicable or not material, or the information called for thereby is otherwise included in the financial statements and therefore has been omitted. |
|
3. |
Exhibits required by Item 601 of Regulation S‑K. |
|
Exhibit No. |
|
Description of Exhibit |
| 2.1 |
|
Plan of Reorganization, dated December 30, 2009, confirmed by the Bankruptcy Court (incorporated by reference to Exhibit 2.1 of the Registrant’s Form 10‑12B, File No. 1‑34686, filed with the SEC on April 7, 2010). |
|
|
|
|
| 3.1 |
|
Amended and Restated Certificate of Incorporation of Hawaiian Telcom Holdco, Inc., filed October 28, 2010 with The State of Delaware (incorporated by reference to Exhibit 3.1 of the Registrant’s Form 10‑12G, File No. 0‑54196, filed with the SEC on November 16, 2010). |
|
|
|
|
| 3.2 |
|
Amended and Restated Bylaws of Hawaiian Telcom Holdco, Inc. effective May 1, 2015 (incorporated by reference to Exhibit 3.2 of the Registrant’s Form 10-Q, File No. 01-34686, filed with the SEC on May 4, 2015). |
|
|
|
|
| 4.1 |
|
Form of Common Stock Certificate (incorporated by reference to Exhibit 4.6 of the Registrant’s Form 10‑12G, File No. 0‑54196, filed with the SEC on November 16, 2010). |
|
|
|
|
| 10.1 |
|
Supply Chain Services Agreement by and between Hawaiian Telcom Communications, Inc. and KGP Logistics, Inc. (KGP) dated December 7, 2009 (incorporated by reference to Exhibit 10.3 of the Registrant’s Form 10‑12B, File No. 1‑34686, filed with the SEC on April 7, 2010). |
|
|
|
|
| 10.2 |
|
Intellectual Property Agreement between GTE Corporation, Hawaiian Telcom Holdco, Inc., Verizon HoldCo LLC and Hawaiian Telcom Communications, Inc., dated May 2, 2005 (incorporated by reference to Exhibit 10.11 of Hawaiian Telcom Communications, Inc.’s Form S‑4, File No. 333‑131152, filed with the SEC on January 19, 2006). |
|
|
|
|
| 10.3 |
|
Verizon Proprietary Software License Agreement between GTE Corporation and Hawaiian Telcom Communications, Inc., effective as of May 2, 2005 (incorporated by reference to Exhibit 10.12 of Hawaiian Telcom Communications, Inc.’s Form S‑4, File No. 333‑131152, filed with the SEC on January 19, 2006). |
|
|
|
|
| 10.4 |
|
Amendment No. 1, dated March 5, 2007, to the Verizon Proprietary Software License Agreement between GTE Corporation and Hawaiian Telcom Communications, Inc., effective as of May 2, 2005 (incorporated by reference to Exhibit 10.17 of Hawaiian Telcom Communications, Inc.’s Form 10‑K, File No. 333‑131152, filed with the SEC on April 2, 2007). |
|
|
|
|
| 10.5 |
|
Production Agreement between Dataprose, Inc. and Hawaiian Telcom Communications, Inc., dated as of October 15, 2005 (incorporated by reference to Exhibit 10.24 of Hawaiian Telcom Communications, Inc.’s Form S‑4, File No. 333‑131152, filed with the SEC on January 19, 2006). |
83
|
Exhibit No. |
|
Description of Exhibit |
|
|
|
|
| 10.6 |
|
Amendment No. 1 to the Production Agreement between Dataprose, Inc. and Hawaiian Telcom Communications, Inc., dated February 1, 2006 (incorporated by reference to Exhibit 10.29 of Hawaiian Telcom Communications, Inc.’s Amendment No. 1 to Form S‑4, File No. 333‑131152, filed with the SEC on March 31, 2006). |
|
|
|
|
| 10.7 |
|
Amended and Restated Master Application Services Agreement effective as of March 13, 2009, by and between Hawaiian Telcom Communications, Inc. and Accenture LLP (incorporated by reference to Exhibit 10.14 of the Registrant’s Form 10‑12B, File No. 1‑34686, filed with the SEC on April 7, 2010). |
|
|
|
|
|
10.9* |
|
Amended and Restated Employment Offer Letter, effective as of June 12, 2015, by and between Scott K. Barber and Hawaiian Telcom Holdco, Inc. (incorporated by reference to Exhibit 10.9 on the Registrant’s Form 10-Q, File No. 1 34686, filed with the SEC on August 4, 2015). |
|
|
|
|
| 10.11 |
|
Credit Agreement, dated as of February 29, 2012, among Hawaiian Telcom Communications, Inc., as borrower, Hawaiian Telcom Holdco, Inc., the lenders party thereto, and Credit Suisse AG, Cayman Islands Branch, as administrative agent and collateral agent (incorporated by reference to Exhibit 10.1 of the Registrant’s Form 10‑Q, File No. 1‑34686, filed with the SEC on May 10, 2012). |
|
|
|
|
| 10.12 |
|
Amendment No. 1 dated June 6, 2013 to the Credit Agreement, dated as of February 29, 2012, among Hawaiian Telcom Communications, Inc., as borrower, Hawaiian Telcom Holdco, Inc., the lenders party thereto, and Credit Suisse AG, Cayman Islands Branch, as administrative agent and collateral agent (incorporated by reference to Exhibit 10.1 of the Registrant’s Form 10‑Q, File No. 1‑34686, filed with the SEC on August 5, 2013). |
|
|
|
|
| 10.13 |
|
Guarantee and Collateral Agreement, dated as of February 29, 2012, among Hawaiian Telcom Holdco, Inc., Hawaiian Telcom Communications, Inc., the subsidiaries of Hawaiian Telcom Communications, Inc. identified therein, and Credit Suisse AG, Cayman Islands Branch, as collateral agent (incorporated by reference to Exhibit 10.2 of the Registrant’s Form 10‑Q, File No. 1‑34686, filed with the SEC on May 10, 2012). |
|
|
|
|
| 10.14 |
|
Amended and Restated Revolving Line of Credit Agreement, dated as of October 3, 2011, by and among Hawaiian Telcom Communications, Inc., First Hawaiian Bank, as agent, and each of the lenders from time to time party thereto (incorporated by reference to Exhibit 10.1 of the Registrant’s Form 8‑K, File No. 1‑34686, filed with the SEC on October 6, 2011). |
|
|
|
|
| 10.15 |
|
Amended and Restated Guaranty, dated as of October 3, 2011, by and among Hawaiian Telcom Holdco, Inc., Hawaiian Telcom, Inc., Hawaiian Telcom Services Company, Inc., and First Hawaiian Bank (incorporated by reference to Exhibit 10.2 of the Registrant’s Form 8‑K, File No. 1‑34686, filed with the SEC on October 6, 2011). |
|
|
|
|
|
10.16* |
|
Hawaiian Telcom 2010 Equity Incentive Plan, dated as of October 29, 2010 (incorporated by reference to Exhibit 10.31 of the Registrant’s Form 10‑12G, File No. 0‑54196, filed with the SEC on November 16, 2010). |
|
|
|
|
|
10.17* |
|
Form of Restricted Stock Unit Agreement for Executives Pursuant to the Hawaiian Telcom 2010 Equity Incentive Plan beginning with the 2017 Restricted Stock Unit grants (incorporated by reference to Exhibit 10.3 of the Registrant’s Form 10-Q, File No. 01-34686 filed with the SEC on November 3, 2016). |
|
|
|
|
|
10.18* |
|
Form of Restricted Stock Unit Agreement for the CEO pursuant to the Hawaiian Telcom 2010 Equity Incentive Plan (incorporated by reference to Exhibit 10.33 of the Registrant’s Form 10‑12G, File No. 0‑54196, filed with the SEC on November 16, 2010). |
|
|
|
|
84
|
Exhibit No. |
|
Description of Exhibit |
|
10.19* |
|
Form of Restricted Stock Unit Agreement for Non‑Employee Directors pursuant to the Hawaiian Telcom 2010 Equity Incentive Plan (incorporated by reference to Exhibit 10.2 of the Registrant’s Form 10‑Q, File No. 1‑34686, filed with the SEC on May 6, 2013). |
|
|
|
|
|
10.20* |
|
Form of Amendment effective as of March 10, 2014 to Restricted Stock Unit Agreements (incorporated by reference to Exhibit 10.25 of the Registrant’s Form 10‑K, File No. 1‑34686, filed with the SEC on March 13, 2014). |
|
|
|
|
|
10.21* |
|
Amended and Restated Hawaiian Telcom Performance Compensation Plan, dated effective as of March 3, 2016 (incorporated by reference to Exhibit 10.12 of the Registrant’s Form 10-Q, File No. 01-34686, filed with the SEC on May 5, 2016). |
|
|
|
|
|
10.22* |
|
Hawaiian Telcom Holdco, Inc. Executive Severance Plan, amended and restated effective November 1, 2016 (incorporated by reference to Exhibit 10.1 of the Registrant’s Form 10-Q, File No. 01-34686 filed with the SEC on November 3, 2016). |
|
|
|
|
|
10.23* |
|
Employment Offer Letter, dated May 6, 2014, by and between John T. Komeiji and Hawaiian Telcom Holdco, Inc. (incorporated by reference to Exhibit 10.1 of the Registrant’s Form 10‑Q, File No. 1‑34686, filed with the SEC on May 7, 2014).
|
|
10.24* |
|
Employment Offer Letter, dated May 6, 2014, by and between Kevin T. Paul and Hawaiian Telcom Holdco, Inc. (incorporated by reference to Exhibit 10.2 of the Registrant’s Form 10‑Q, File No. 1‑34686, filed with the SEC on May 7, 2014).
|
|
10.25
10.26* |
|
Third Amendment to Amended and Restated Revolving Line of Credit Agreement, dated as of April 9, 2015, by and among Hawaiian Telcom Communications, Inc., First Hawaiian Bank, as agent, and each of the lenders from time to time party thereto (incorporated by reference to Exhibit 10.25 of the Registrant’s Form 10-Q, File No. 01-34686, filed with the SEC on May 4, 2015).
Employment Offer Letter, effective as of May 1, 2015, by and between Dan T. Bessey and Hawaiian Telcom Holdco, Inc (incorporated by reference to Exhibit 10.26 of the Registrant’s Form 10-Q, File No. 01-34686, filed with the SEC on May 4, 2015). |
|
|
|
|
| 10.27 |
|
Nomination, Standstill and Support Agreement and Confidentiality Agreement, dated February 25, 2016, by and between Hawaiian Telcom Holdco, Inc. and Black Diamond Capital Management, L.L.C. (incorporated by reference to Exhibit 10.1 of the Registrant’s Form 8-K, File No. 01-34686 filed with the SEC on February 25, 2016).
|
| 10.28 |
|
Nomination, Standstill and Support Agreement and Confidentiality Agreement, dated as of March 14, 2016, by and between Hawaiian Telcom Holdco, Inc. and Twin Haven Special Opportunities Fund III, L.P., Twin Haven Special Opportunities Partners III, L.L.C., Twin Haven Special Opportunities Fund IV, L.P., Twin Haven Special Opportunities Partners IV, L.L.C. and Twin Haven Capital Partners, L.L.C. (incorporated by reference to Exhibit 10.1 of the Registrant’s Form 8-K, File No. 01-34686 filed with the SEC on March 14, 2016). |
|
|
|
|
| 10.29 |
|
Amendment No. 2 dated May 3, 2016 to the Credit Agreement, dated as of February 29, 2012, among Hawaiian Telcom Communications, Inc., as borrower, Hawaiian Telcom Holdco, Inc., the lenders party thereto, and Credit Suisse AG, Cayman Islands Branch, as administrative agent and collateral agent (incorporated by reference to Exhibit 10.12 of the Registrant’s Form 10-Q, File No. 1-34686, filed with the SEC on May 5, 2016).
|
|
10.30* |
|
Form of Change of Control Agreement between Hawaiian Telcom Holdco, Inc. and Each of the Named Executive Officers (incorporated by reference to Exhibit 10.2 of the Registrant’s Form 10-Q, File No. 01-34686 filed with the SEC on November 3, 2016). |
85
|
Exhibit No. |
|
Description of Exhibit |
|
|
|
|
| 10.31 |
|
Credit Agreement dated as of February 24, 2017 among Hawaiian Telcom Communications, Inc., as the Borrower, the Guarantors party thereto, CoBank ACB, in its capacity as Administrative Agent for the Secured Parties, a Joint Lead Arranger, Bookrunner, an Issuing Lender and Swing Line Lender, Fifth Third Bank, as a Joint Lead Arranger and Co-Syndication Agent, and MUFG Union Bank, as a Joint Lead Arranger and Co-Syndication Agent, and the Lenders who are a party thereto (incorporated by reference to Exhibit 10.1 of the Registrant’s Form 8-K, File No. 01-34686, filed with the SEC on February 27, 2017). |
|
|
|
|
| 21.1 |
|
List of Subsidiaries. |
|
|
|
|
| 23.1 |
|
Consent of Deloitte & Touche LLP dated March 14, 2017. |
|
|
|
|
| 31.1 |
|
Certification of Chief Executive Officer pursuant to Section 302 of the Sarbanes‑Oxley Act of 2002. |
|
|
|
|
| 31.2 |
|
Certification of Chief Financial Officer pursuant to Section 302 of the Sarbanes‑Oxley Act of 2002. |
|
|
|
|
| 32.1 |
|
Certification of Chief Executive Officer pursuant to Section 906 of the Sarbanes‑Oxley Act of 2002. |
|
|
|
|
| 32.2 |
|
Certification of Chief Financial Officer pursuant to Section 906 of the Sarbanes‑Oxley Act of 2002. |
|
|
|
|
| 99.1 |
|
Earnings Release dated March 14, 2017.
|
|
101.INS# |
|
XBRL Instance Document |
|
|
|
|
|
101.SCH# |
|
XBRL Taxonomy Extension Schema Document |
|
|
|
|
|
101.CAL# |
|
XBRL Taxonomy Extension Calculation Linkbase Document |
|
|
|
|
|
101.DEF# |
|
XBRL Taxonomy Extension Definition Linkbase Document |
|
|
|
|
|
101.LAB# |
|
XBRL Taxonomy Extension Label Linkbase Document |
|
|
|
|
|
101.PRE# |
|
XBRL Taxonomy Extension Presentation Linkbase Document |
*Identifies each management contract or compensatory plan or arrangement.
86
87
Pursuant to the requirements of Section 13 or 15(d) of the Securities Exchange Act of 1934, the registrant has duly caused this report to be signed on its behalf by the undersigned, thereunto duly authorized.
|
|
Hawaiian Telcom Holdco, Inc. |
|
|
|
|
|
|
|
|
|
|
Date: March 14, 2017 |
By: |
/s/ Scott K. Barber |
|
|
|
Scott K. Barber |
|
|
|
Chief Executive Officer |
|
|
|
|
|
Date: March 14, 2017 |
By: |
/s/ Dan T. Bessey |
|
|
|
Dan T. Bessey |
|
|
|
Senior Vice President and Chief Financial Officer |
Pursuant to the requirements of the Securities Exchange Act of 1934, this report has been signed below by the following persons on behalf of the registrant and in the capacities and on the dates indicated:
|
Signature |
|
Title |
|
Date |
|
/s/ Scott K. Barber |
|
Chief Executive Officer |
|
March 14, 2017 |
|
Scott K. Barber |
|
(Principal Executive Officer) and Director |
|
|
|
|
|
|
|
|
|
/s/ Dan T. Bessey |
|
Chief Financial Officer (Principal Financial Officer and |
|
March 14, 2017 |
|
Dan T. Bessey |
|
Principal Accounting Officer) |
|
|
|
|
|
|
|
|
|
/s/ Kurt M. Cellar |
|
Director |
|
March 14, 2017 |
|
Kurt M. Cellar |
|
|
|
|
|
|
|
|
|
|
|
/s/ Meredith J. Ching |
|
Director |
|
March 14, 2017 |
|
Meredith J. Ching |
|
|
|
|
|
|
|
|
|
|
|
/s/ Walter A. Dods, Jr. |
|
Director |
|
March 14, 2017 |
|
Walter A. Dods, Jr. |
|
|
|
|
|
|
|
|
|
|
|
/s/ N. John Fontana III |
|
Director |
|
March 14, 2017 |
|
N. John Fontana III |
|
|
|
|
|
|
|
|
|
|
|
/s/ Richard A. Jalkut |
|
Director |
|
March 14, 2017 |
|
Richard A. Jalkut |
|
|
|
|
|
|
|
|
|
|
|
/s/ Steven C. Oldham |
|
Director |
|
March 14, 2017 |
|
Steven C. Oldham |
|
|
|
|
|
|
|
|
|
|
|
/s/ Robert B. Webster |
|
Director |
|
March 14, 2017 |
|
Robert B. Webster |
|
|
|
|
|
|
|
|
|
|
|
/s/ Eric K. Yeaman |
|
Director |
|
March 14, 2017 |
|
Eric K. Yeaman |
|
|
|
|
88