Attached files
| file | filename |
|---|---|
| EX-32.2 - EX-32.2 - Fluent, Inc. | cogt-ex322_7.htm |
| EX-32.1 - EX-32.1 - Fluent, Inc. | cogt-ex321_6.htm |
| EX-31.2 - EX-31.2 - Fluent, Inc. | cogt-ex312_8.htm |
| EX-31.1 - EX-31.1 - Fluent, Inc. | cogt-ex311_9.htm |
| EX-23.3 - EX-23.3 - Fluent, Inc. | cogt-ex233_240.htm |
| EX-23.2 - EX-23.2 - Fluent, Inc. | cogt-ex232_161.htm |
| EX-23.1 - EX-23.1 - Fluent, Inc. | cogt-ex231_12.htm |
| EX-21.1 - EX-21.1 - Fluent, Inc. | cogt-ex211_13.htm |
| EX-10.39 - EX-10.39 - Fluent, Inc. | cogt-ex1039_919.htm |
UNITED STATES
SECURITIES AND EXCHANGE COMMISSION
Washington, D.C. 20549
FORM 10-K
(Mark One)
|
☒ |
ANNUAL REPORT PURSUANT TO SECTION 13 OR 15 (d) OF THE SECURITIES EXCHANGE ACT OF 1934 |
For the fiscal year ended December 31, 2016
OR
|
☐ |
TRANSITION REPORT PURSUANT TO SECTION 13 OR 15(d) OF THE SECURITIES EXCHANGE ACT OF 1934 |
For the transition period from to
Commission File Number: 001-37893
COGINT, INC.
(Exact name of registrant as specified in its charter)
|
Delaware |
|
77-0688094 |
|
(State or other jurisdiction of incorporation or organization) |
|
(I.R.S. Employer Identification No.) |
2650 North Military Trail, Suite 300,
Boca Raton, Florida 33431
(Address of principal executive offices) (Zip Code)
Registrant’s telephone number, including area code: (561) 757-4000
Securities registered pursuant to Section 12(b) of the Act:
|
Title of each class |
|
Name of each exchange on which registered |
|
Common Stock, $0.0005 par value per share |
|
The NASDAQ Stock Market LLC |
Securities registered pursuant to Section 12(g) of the Act: None
Indicate by check mark if the registrant is a well-known seasoned issuer, as defined in Rule 405 of the Securities Act. Yes ☐ No ☒
Indicate by check mark if the registrant is not required to file reports pursuant to Section 13 or Section 15(d) of the Act. Yes ☐ No ☒
Indicate by check mark whether the registrant (1) has filed all reports required to be filed by Section 13 or 15(d) of the Securities Exchange Act of 1934 during the preceding 12 months (or for such shorter period that the registrant was required to file such reports), and (2) has been subject to such filing requirements for the past 90 days. Yes ☒ No ☐
Indicate by check mark whether the registrant has submitted electronically and posted on its corporate Website, if any, every Interactive Data file required to be submitted and posted pursuant to Rule 405 of Regulation S-T (§232.405 of this chapter) during the preceding 12 months (or for such shorter period that the registrant was required to submit and post such files). Yes ☒ No ☐
Indicate by check mark if disclosure of delinquent filers pursuant to Item 405 of Regulation S-K (§229.405 of this chapter) is not contained herein, and will not be contained, to the best of registrant’s knowledge, in definitive proxy or information statements incorporated by reference in Part III of this Form 10-K or any amendment to this Form 10-K. ☐
Indicate by check mark whether the registrant is a large accelerated filer, an accelerated filer, a non-accelerated filer, or a smaller reporting company. See the definitions of “large accelerated filer,” “accelerated filer” and “smaller reporting company” in Rule 12b-2 of the Exchange Act.
|
Large accelerated filer |
|
☐ |
|
Accelerated filer |
|
☒ |
|
|
|
|
|
|
|
|
|
Non-accelerated filer |
|
☐ (Do not check if a smaller reporting company) |
|
Smaller reporting company |
|
☐ |
Indicate by check mark whether the registrant is a shell company (as defined in Rule 12b-2 of the Act) Yes ☐ No ☒
On June 30, 2016, the last business day of the registrant’s most recently completed second fiscal quarter, the aggregate market value (based on the closing per share sales price of its common stock on that date) of the voting stock held by non-affiliates of the registrant was approximately $83.0 million.
The number of shares outstanding of the registrant’s common stock, as of March 6, 2017, was 53,792,218.
DOCUMENTS INCORPORATED BY REFERENCE
Portions of the registrant’s Proxy Statement relating to its 2017 Annual Meeting of Stockholders to be filed with the SEC within 120 days after the end of the fiscal year ended December 31, 2016 are incorporated herein by reference in Part III of this Annual Report on Form 10-K.
TABLE OF CONTENTS FOR FORM 10-K
|
|
|
1 |
|
|
|
|
|
|
|
ITEM 1. |
|
1 |
|
|
ITEM 1A. |
|
11 |
|
|
ITEM 1B. |
|
24 |
|
|
ITEM 2. |
|
24 |
|
|
ITEM 3. |
|
24 |
|
|
ITEM 4. |
|
26 |
|
|
|
|
|
|
|
|
|
27 |
|
|
|
|
|
|
|
ITEM 5. |
|
27 |
|
|
ITEM 6. |
|
29 |
|
|
ITEM 7. |
|
MANAGEMENT’S DISCUSSION AND ANALYSIS OF FINANCIAL CONDITION AND RESULTS OF OPERATIONS. |
31 |
|
ITEM 7A. |
|
45 |
|
|
ITEM 8. |
|
46 |
|
|
ITEM 9. |
|
CHANGES IN AND DISAGREEMENTS WITH ACCOUNTANTS ON ACCOUNTING AND FINANCIAL DISCLOSURE. |
46 |
|
ITEM 9A. |
|
46 |
|
|
ITEM 9B. |
|
47 |
|
|
|
|
|
|
|
|
|
48 |
|
|
|
|
|
|
|
ITEM 10. |
|
48 |
|
|
ITEM 11. |
|
48 |
|
|
ITEM 12. |
|
SECURITY OWNERSHIP OF CERTAIN BENEFICIAL OWNERS AND MANAGEMENT AND RELATED STOCKHOLDER MATTERS. |
48 |
|
ITEM 13. |
|
CERTAIN RELATIONSHIPS AND RELATED TRANSACTIONS, AND DIRECTOR INDEPENDENCE. |
48 |
|
ITEM 14. |
|
48 |
|
|
|
|
|
|
|
|
|
49 |
|
|
|
|
|
|
|
ITEM 15. |
|
49 |
|
|
ITEM 16. |
|
53 |
|
|
|
|
|
|
|
|
|
54 |
i
This business description should be read in conjunction with our audited consolidated financial statements and accompanying notes thereto appearing elsewhere in this Annual Report on Form 10-K for the year ended December 31, 2016 (the “2016 Form 10-K”), which are incorporated herein by this reference.
Company Overview
Cogint, Inc. (“we,” “us,” “our,” “cogint,” or the “Company”), a Delaware corporation, is a data and analytics company providing cloud-based mission-critical information and performance marketing solutions to enterprises in a variety of industries. cogint’s mission is to transform data into intelligence utilizing our proprietary technology platforms to solve complex problems for our clients. Harnessing the power of data fusion and powerful analytics, we transform data into intelligence, in a fast and efficient manner, so that our clients can spend their time on what matters most, running their organizations with confidence. Through our intelligent platforms, CORETM and Agile Audience EngineTM, we uncover the relevance of disparate data points to deliver end-to-end, ROI-driven results for our customers. Our analytical capabilities enable us to build comprehensive datasets in real-time and provide insightful views of people, businesses, assets and their interrelationships. We empower clients across markets and industries to better execute all aspects of their business, from managing risk, identifying fraud and abuse, ensuring legislative compliance, and debt recovery, to identifying and acquiring new customers. With the goal of reducing the cost of doing business and enhancing the consumer experience, our solutions enable our clients to optimize overall decision-making and to have a holistic view of their customers.
We provide unique and compelling solutions essential to the daily workflow of organizations within both the public and private sectors. Our cloud-based data fusion and customer acquisition technology platforms, combined with our massive database consisting of public-record, proprietary and publicly-available data, as well as a unique repository of self-reported information on millions of consumers, enables the delivery of differentiated products and solutions used for a variety of essential functions throughout the customer life cycle. These essential functions include customer identification and authentication, investigation and validation, and customer acquisition and retention.
The Company operates through two reportable segments: (i) Information Services and (ii) Performance Marketing. For additional information relating to our segments, see Note 16, “Segment Information” in our Notes to Consolidated Financial Statements.
Information Services—Leveraging leading-edge technology, proprietary algorithms, and massive datasets, and through intuitive and powerful analytical applications, we provide solutions to organizations within the risk management and consumer marketing industries. CORE is our next generation data fusion platform, providing mission-critical information about individuals, businesses and assets to a variety of markets and industries. Through machine learning and advanced analytics, our Information Services segment uses the power of data fusion to ingest and analyze data at a massive scale. The derived information from the data fusion process ultimately serves to generate unique solutions for banking and financial services companies, insurance companies, healthcare companies, law enforcement and government, the collection industry, law firms, retail, telecommunications companies, corporate security and investigative firms. In addition, our data acquisition solutions enable clients to rapidly grow their customer databases by using self-declared consumer insights to identify, connect with, and acquire first-party consumer data and multi-channel marketing consent at massive scale.
Built in a secure payment card industry (PCI) compliant environment, our cloud-based next generation technology delivers greater than four 9s of service uptime. By leveraging our proprietary infrastructure design within the cloud, we currently operate in six datacenters spread geographically across the U.S. and are able to dynamically and seamlessly scale as needed. Using our intelligent framework, and leveraging a microservices architecture where appropriate, we reduce operational cost and complexity, thus delivering superior performance at greatly reduced costs compared to traditional datacenter architectures. Since the release of our CORE platform in May 2016, we have added billions of data records and continue to add over a billion records per month on average. Our average query response time for a comprehensive profile is less than 250 milliseconds versus competitive platforms that measure comprehensive profile response times in seconds.
Performance Marketing—Our Agile Audience Engine drives our Performance Marketing segment, which provides solutions to help brands, advertisers and marketers find the right customers in every major business-to-consumer (B2C) vertical, including internet and telecommunications, financial services, health and wellness, consumer packaged goods, careers and education, and retail and entertainment. We deterministically target consumers across various marketing channels and devices, through the user-supplied acquisition of personally identifiable information on behalf of our clients, such as email addresses, other identifying information and
1
responses to dynamically populated survey questions. Additionally, 80% of our consumer interaction comes from mobile, a highly-differentiated characteristic compared to our competitors whose platforms are not mobile-first.
We own hundreds of media properties, through which we engage millions of consumers everyday with interactive content, such as job postings, cost savings, surveys, promotions and sweepstakes that generate over 800,000 survey respondents and over 7 million compiled survey responses a day. Our owned media properties alone have created a database of approximately 130 million U.S. adults with detailed profiles, including 224 million unique email addresses, across over 75 million households. With meaningful people-based interaction that focuses on consumer behavior and declared first-party data, leveraged on a mobile-centric platform that provides seamless omni-channel capabilities, we have the ability to target and develop comprehensive consumer profiles that redefine the way advertisers view their most valuable customers.
For the years ended December 31, 2016, 2015 and 2014, we had revenue of $186.8 million, $14.1 million and $0.8 million, gross profit of $53.0 million, $3.8 million and $0.5 million, a net loss of $29.1 million, $84.5 million and $0.6 million, and adjusted EBITDA of $15.0 million, negative $6.6 million and negative $0.4 million, respectively. Adjusted EBITDA is a non-GAAP financial measure equal to net loss, the most directly comparable financial measure based on US GAAP, adding back net loss from discontinued operations, interest expense, income tax benefit, depreciation and amortization, share-based payments, and other adjustments, as noted in the tables included in “Use and Reconciliation of Non-GAAP Financial Measures” of Item 7, “Management’s Discussion and Analysis of Financial Condition and Results of Operations.”
Our Markets
The target markets for our data and analytical solutions today consist primarily of businesses within the risk management and consumer marketing industries.
International Data Corporation, a global provider of market intelligence and advisory services, estimates, in an October 2016 study, that worldwide business analytics services and software spending will be $130.1 billion in 2016 and is expected to be $203.0 billion in the year 2020, representing a CAGR of 11.7% from 2016—2020. The big data and analytics sector continues to grow at an accelerated pace due to the proliferation of data generated by technological advancements and changing consumer behavior. Continued, rapid adoption and use of smartphones and other mobile devices, social media and online purchasing channels, and the necessity of organizations to sort through this sea of data to glean actionable intelligence to support their daily operations, serve as key drivers of the sector’s growth.
Risk management and fraud analytics has become increasingly important not only in the banking and financial services sectors but across multiple other industries and use cases. According to the market research company MarketsAndMarkets, the North American risk analytics software market was projected to be $8.6 billion in 2016. Data fusion analytics and the information derived therefrom is now the primary service product for risk management associated with key purchasers such as banking and financial services companies, insurance companies, healthcare companies, law enforcement and government, collection agencies, law firms, retail, telecommunications companies and private investigative firms. Primary use cases include, but are not limited to, obtaining information on consumers, businesses and assets (and their interrelationships) to facilitate the location of individuals and assets, identity verification, and to support criminal, legal, financial, insurance, and corporate investigations, due diligence and the assessment of counterparty risk.
According to the Interactive Advertising Bureau (IAB)’s “Internet Advertising Revenue Report, 2016 first half results,” total digital ad spend in the U.S. was $32.7 billion for the first half of 2016, a 19.1% increase over the first half 2015. Mobile was the leading ad format accounting for 45% of revenues, and performance-based advertising was the leading pricing model accounting for 65% of total U.S. digital advertising spending.
Consumer marketing, which consists of paid advertising, public relations, sales strategy, customer communications and market research, is a multi-trillion-dollar global industry. Digital marketing is the fastest growing subset of this marketplace, with performance marketing being the most dominant format utilized across the industry. Advertisers prefer performance marketing because they only pay when specific actions are completed by consumers in response to their ads, such as making purchases, filling out information request forms, or clicking through to websites. In addition, performance marketing campaigns that target registered and validated consumers are referred to as “people-based” marketing campaigns, and are gaining favor over cookie-based campaigns which target anonymous site visitors. People-based performance marketing campaigns improve the effectiveness of advertising, increase return on ad spend, and facilitate the deterministic targeting of consumers across digital channels such as display, social, search, video and addressable television.
According to eMarketer’s, a leading market research company, worldwide spend on paid media will climb to $542.6 billion in 2016 and is expected to grow to $674.2 billion by 2020, representing a CAGR of 5.6%. Ad spend sector growth is attributable to the
2
growing diversity in media content and sources, and although growth will vary by region, North America is projected to remain the number one advertising region in the world.
Companies in all industries are inundated with data sourced from a growing number of digital mediums including e-commerce, mobile and social media, which provide new information on a daily basis. Companies struggle to parse through the data available to them to make decisions in real-time that improve scale and efficiency while helping them achieve and exceed their strategic goals. Our platforms and analytical capabilities directly address these issues in an industry agnostic manner to solve complex problems in a robust and growing marketplace.
Key Challenges Facing our Customers
We believe our solutions address the challenges that the industry faces today, which include:
Actionable Big Data Insights Through A Single Platform—As the velocity and volume of data continues to grow exponentially, enterprises have become overwhelmed with data and their inability to glean intelligence from such data to derive successful business decisions in real-time. Customers demand full-suite, turn-key solutions that are agile, flexible, and available on-demand in order to gain the speed, scale and insight necessary to drive their business models. As the breadth and depth of data increases, providers will need to deploy new technologies that enable both the ingestion of data at massive scale in real-time, irrespective of structure or form, and the analytics components necessary to function across multiple channels. The continued digitization of human interactions, and the corresponding availability of the data resulting therefrom, is driving demand for data capture, management and analysis software. As a result, customers are looking for flexible and efficient solutions to fuse disparate sets of not only transactional data but also demographic, ethnographic and behavioral data as well, in order to provide insights that are truly actionable.
Engaging Customers Across All Devices—According to the IAB, mobile advertising in the U.S. totaled $15.5 billion for the first half of 2016, a 89% increase from first half 2015. This impressive growth demonstrates to advertisers the importance of mobile interaction as they search for ways to engage consumers and effectively gather critical data. Developing capabilities to acquire data from all devices and creating omni-channel advertising campaigns are both costly and complex. Traditional cookie-based targeting has proven less effective as support for cookies on mobile devices is infrequent or non-existent, ushering in the need for newer approaches for reaching consumers across devices. Developing a full solution is complex and many offerings in the marketplace struggle to adequately address this growing need.
Pricing Methodology—Historically, internet advertising has been sold on a cost-per-impression (CPM) model where an advertiser is charged each time an advertisement is displayed, regardless of user engagement with the advertisement. This dated methodology has made it difficult to truly gauge the effectiveness of advertising campaigns, and determine the actual costs associated with successful user engagement. Today’s advertising landscape now has several options for pricing advertisements, including the historical CPM method, as well as cost-per-click (CPC) which is most common in search advertising, cost-per-action (CPA), and hybrid models that may combine aspects of the various models. With chief marketing officers increasingly accountable for demonstrating concrete return on their marketing investments, CPA and CPC models are more favorable alternatives to CPM-based offerings.
Cost and Performance Pressures—As our customers face constant cost pressures, they need to continually improve the value they receive from their information solutions. Whether it is marketing campaign spend or managing risk, consumers and customers are increasingly more sophisticated, requiring enhanced performance in order to satisfy their business objectives. Improving performance can mean delivering the right advertisement to the right consumer at the right time, or providing the most intuitive information as rapidly as possible to capitalize on opportunities or reduce risk. Superior data fusion with unique data sources delivers customers an advantage as they cope with these pressures.
Difficult Delivery of Solutions for Complex Problems and Data Analytics at Scale—The larger and more complex a campaign or dataset, the more difficult it is to sustain the same level of performance and insight. The highly-fragmented nature of the internet display landscape, proliferation of data and lack of robust technology limits the ability to target the correct users on the correct device at the correct time and on the correct portal. There is an inherent need for solutions that allow advertisers to deliver high-performing campaigns regardless of size and duration.
Our Competitive Strengths
We believe our leading-edge technology platforms, massive database of holistic views of consumers, and dynamic and intuitive solutions deliver differentiated capabilities to our customers. Our solutions enable our customers to make more informed inquiries regarding their problems and better decisions to solve their most complex problems. We believe the following competitive strengths will continue to deliver an unrivaled value proposition that further drives our differentiation:
3
Transformative and Innovative Technology Platforms—Through the convergence of our platforms, CORE and Agile Audience Engine, we offer a comprehensive suite of information solutions. Our cloud-based, data and industry agnostic platform, CORE, allows us to assimilate, structure, and fuse billions of disparate records to create comprehensive views of individuals and to present these views in real-time via analytical applications. We believe our platform’s speed, power, and scalability are key differentiators in the marketplace. Our Agile Audience Engine enables brands to target, engage, qualify, and communicate with relevant consumers across mobile, web and in-app content environments. Furthermore, we utilize proprietary targeting algorithms and a dynamic survey module to match consumers with the most relevant advertisers, content, and media across all devices. We optimize campaigns by leveraging each advertiser’s performance data. Most valuable customer profiles (MVCs), as determined by factors such as individual-level engagement with ads and/or conversion or purchasing histories, are used to fuel lookalike modeling enabling the targeting of individuals who share similar attributes to those MVCs. This results in broadening the scale of acquisition campaigns and enhancing campaign performance.
Massive Database of Holistic Views of Consumers—Data is the lifeblood of our technology platforms. We leverage our CORE and Agile Audience Engine platforms to build massive proprietary datasets and apply analytics in real-time to provide actionable insights. Our Information Services data is compiled from a myriad of online and offline sources, both structured and unstructured, including public record data, publicly-available data, and proprietary data. Public record data includes personally identifiable information, as well as property, identity, bankruptcy, lien, judgment, automotive, phone and other information aggregated from companies specializing in data aggregation, public record repositories, and publicly-available sources. Proprietary data includes data internally generated by proprietary algorithms and analytic processes as well as data which is compiled through our owned media properties, including valuable self-reported consumer information collected through voluntary surveys, promotions and contests. Through next-generation machine learning technology and proprietary algorithms, we efficiently ingest these datasets, structure them into common form, and utilize the process of data fusion to connect or fuse the data so as to create an actionable, real-time view of the data for various use cases, delivering greater intelligence to our customers and enhancing their decision-making capabilities across all markets and industries.
In addition, our technology platforms and systems enable us to collect four distinct types of user data:
|
• |
Meta-data—information gleaned by the system such as the user’s IP address, browser type, operating system, and, for mobile connected devices, the device model, device ID, browser, and mobile carrier; |
|
• |
Demographic data—self-reported user information such as name, address, gender, email address and telephone number; |
|
• |
Ethnographic data—user responses to dynamically curated and served survey questions; and, |
|
• |
Behavioral data—purchase history, interests, likes and dislikes, preferences and frequencies. |
We also use our public record database and third-party services in order to verify and supplement collected data. This data is stored and analyzed, and can be further enhanced in real-time when consumers respond to dynamically populated survey questions, enabling precise targeting and profiling for ad serving and customer acquisition purposes. By using the system and the insights gained, we can develop deep and relevant insights into each individual consumer.
Our platforms and user volume has enabled us to accumulate a massive, owned data warehouse, which contains:
|
• |
First party data on over 130 million consumers; |
|
|
• |
224 million unique email addresses; |
|
|
• |
3.0 billion survey responses and growing by more than 7 million responses a day; and, |
|
|
• |
More than 800,000 unique user registrations per day. |
|
People-based Platform Enabling Deterministic, Omni-channel Marketing—Our collection of holistic information serves as the genesis for our operations and the key foundation to providing actionable consumer data. Through our data-centric approach to analyzing consumer characteristics and intent, we are capable of producing highly-deterministic advertisements across multiple devices, including desktops, laptops, smartphones and tablets. By analyzing a consumer’s characteristics and integrating that data into our Agile Audience Engine, we are able to create comprehensive profiles that deliver highly-relevant and targeted advertisements on the most effective medium based on the consumer’s habits.
Performance Driven Pricing Model that Drives Heightened Return—On—Investment—We recognize performance marketing revenue when the conversions are generated based on predefined user actions such as a click, a registration, an app install or a coupon print. As a result, our revenue is synonymous with customer success, and we only get paid when a user engages with our advertisements. By using a performance-driven pricing model, we enjoy a number of advantages, including increased efficiencies, the ability to exceed ROI projections for customers, and optimized marketing budget allocations limited only on our ability to deliver
4
results. Our performance-driven pricing model presents unique opportunities to work within uncapped marketing budgets which in turn create recurring revenue streams from clients who depend on our solutions. Many of our partners view our Performance Marketing solutions as cost of sales and are incentivized to continue utilizing our solutions that directly drive consumer engagement and revenues.
Predictive Solutions For Complex Advertising Needs—Our proprietary, predictive software algorithm identifies, in real-time, consumers likely to be receptive to our customers’ advertisements, thereby focusing marketing spend on the most efficient and effective channel. Additionally, through targeting and optimization, we provide distinctive solutions that aim to serve the needs of our clients and provide them with the deepest insights possible, in order to make more informed decisions. Through our dynamic surveys, we are able to collect self-reported data from 800,000 consumers every day and learn valuable information that would otherwise be unavailable. This symbiotic relationship allows us to capture extremely timely and meaningful information that ultimately shapes the insights we create. Using this information, we are able to curate custom databases and audience clusters in real-time, layered with additional data from our Information Services segment to create a truly customized and unique dataset for our customers. We aim to fuse self-reported data with transactional public record data, in order to create the most comprehensive view of an individual or business. Our ability to capture as well as integrate data from these two sources allows us to establish a lasting competitive advantage. The marriage of these two complementary data sources in addition to our analytic capabilities is highly unique and differentiated in the market.
Our Platforms and Solutions
cogint’s CORE and Agile Audience Engine platforms combine the best of both worlds to provide mission-critical information and performance marketing solutions. Our dynamic solutions provide unlimited potential to solve complex problems through customization, vast aggregation of data and ability to ingest any dataset. The marriage of our CORE and Agile Audience Engine platforms allows us to ingest, fuse, and customize datasets of self-reported, transactional and public record data. The exchange and fusion of data and capabilities across industry verticals equally benefit both our Information Services and Performance Marketing segments.
The Company’s operations are organized in two reportable segments: (i) Information Services and (ii) Performance Marketing.
(i) Information Services—Leveraging leading-edge technology, proprietary algorithms, and massive datasets, and through intuitive and powerful analytical applications, we provide industry-agnostic analytical solutions for businesses within the risk management and consumer marketing industries. These businesses use our services to acquire new customers, identify cross-selling opportunities, collect debt, verify consumer identities, investigate fraud and abuse, mitigate risk, and to connect and analyze online, offline, customer and partner data to better know their customers. The core capabilities and technology systems in our Information Services segment allow us to serve multiple industries and solve a broad range of business issues. Solutions within our Information Services segment include:
|
• |
CORE—our advanced analytical platform, providing mission-critical solutions to a variety of markets and industries. Our primary investigative solution, idiCORETM, provides instant, comprehensive views of individuals, businesses, assets and their interrelationships, to multiple industries, including law enforcement, government, financial services, insurance, and corporate risk for purposes such as identity verification, risk assessment, fraud detection, and compliance. |
5
(ii) Performance Marketing—Provides solutions to help brands, advertisers and marketers find the right customers in every major B2C vertical, including internet and telecommunications, financial services, health and wellness, consumer packaged goods, careers and education, and retail and entertainment. We deterministically target consumers across various marketing channels and devices, through the user-supplied acquisition of personally identifiable information on behalf of our clients, such as email addresses, other identifying information and responses to dynamically populated survey questions. Solutions within our Performance Marketing segment include:
|
• |
Audience Solutions—empowering clients to target their ads with precision and drive qualified prospects at scale. Marketers can leverage our proprietary media network or activate our first-party data across the digital ecosystem to drive traffic to their websites, only paying when consumers take specified actions. |
|
• |
Mobile User Acquisition Solutions—offers marketers the precision targeting capabilities of our Agile Audience Engine combined with unique mobile web media inventory to reach qualified audiences of consumers with the highest propensity to download mobile applications and become high lifetime value users. |
Our Sales, Distribution and Marketing
Inside Sales—Our inside sales team cultivates relationships, and ultimately closes business, with their end-user markets. These professionals are relationship-based sellers with experience in identifying clients’ needs and clearly explaining and defining products that provide solutions to those needs.
Strategic Sales—While the majority of our direct sales efforts are supported through professional inside sales staff, major accounts within certain industries require a more personal, face-to-face sales approach. We continue to expand this team to meet the demand of the markets.
Distributors, Resellers, and Strategic Partners—In conjunction with direct-to-client sales efforts, we engage value-added distributors, resellers, and strategic partners that have a significant foothold in many of the industries that we have not historically served, as well as to further penetrate those industries that we do serve. This allows us to rapidly penetrate these markets while also significantly reducing overhead associated with direct sales and support efforts.
Marketing—We have implemented several methods to market our products, including participation in trade shows and seminars, advertising, public relations, distribution of sales literature and product specifications and ongoing communication with prospective clients, distributors, resellers, strategic partners and our installed base of current clients.
Our Strategy
We are committed to developing unique technology and using our analytical capabilities to deliver solutions that transform the way organizations view data. We are advancing our business through a “three-prong,” strategic approach:
|
• |
The Risk Management Industry—providing actionable intelligence in support of such use cases as the verification and authentication of consumer identities, due diligence, prevention of fraud and abuse, legislative compliance, and debt collection. |
|
• |
The Consumer Marketing Industry—deploying advanced data analytics to better identify and segment consumers in support of highly-scalable, people-based marketing, resulting in increased customer acquisition and retention. |
|
• |
Custom Analytics—enabling the public and private sectors to leverage our advanced data fusion platform and analytical applications to obtain insight essential to decision-making processes throughout each client organization. |
We will remain focused on building the business organically and will continue to devote resources to the following to ensure that we are well positioned within the industry.
Add New Customers and Verticals by Expanding Our Core Data Fusion Technology—We believe that our robust data fusion platform, highly-scalable systems and expansive user database affords us numerous opportunities to leverage our technology into the following areas:
6
|
• |
Owned CRM—develop a robust strategy and products designed to retarget consumers and drive greater CLV leveraging to company-owned, higher-margin channels including permission-based email marketing, push notifications, text messaging and telephone marketing. |
|
• |
Data Products—monetize our proprietary data assets outside our own platform by delivering ad targeting and consumer insights solutions (e.g., development of custom audiences for targeting in specific verticals such as finance and insurance). |
|
• |
Market Research—monetize our proprietary survey module by gathering consumer insights for B2C brands and marketing service providers. Surveys can be utilized for internal product strategy development as well as for external thought leadership (white papers, etc.) |
Continuous Advancement of Our Technology and Data to Cross-sell and Up-sell—We strongly believe that our ability to continually innovate and invest resources into our technology and data is a key foundation to our success. In addition to improving our predictive software and underlying technology platforms, we also aim to provide new solutions from our data repository in an effort to offer the greatest value to our clients. We believe this allocation of resources will augment our value proposition for both existing and prospective clients. As we invest in our technology platforms and data assets, we will always do so with a view towards providing solutions that deliver scalability, functionality and interoperability. Our technology platforms operate at significant scale and are programmed to functionally deliver reliable and accurate information through our machine learning algorithms whose performance accelerates with each new item of data about a user, creating a perpetual series of network effects. As a result of our ability to process transactional data, self-reported data, and other proprietary datasets at massive scale, we are focused on creating a dynamic platform that maximizes interoperability and continues to drive growth opportunities within our installed customer base.
Expanding our Sales Team to Enter New International Markets—We intend to continue to grow our existing sales team. Increased sales capability will enable us to work with more direct advertisers, target specific industry verticals, and realize margin upside. Additionally, we believe that a larger sales force provides significant opportunities for us to grow in the U.S. market as well enter and expand operations in new geographic markets, such as Europe and Asia.
Selective Acquisitions—In addition to organic growth, we may, in the future, make acquisitions of businesses or technologies that advance our objectives and that enhance shareholder value. We are focused on identifying complementary technologies and businesses that advance our “three-prong” strategic approach. The acquisition of Fluent, LLC (“Fluent”) in December 2015 is an example of serving as our entry into the consumer marketing industry while offering a multitude of beneficial synergies. The acquisition provides greater diversity of customers, markets, products, and revenues generated therefrom, within the significantly larger addressable market of the consumer marketing industry. Further, the acquisition presents substantial revenue growth opportunities within the U.S. through new markets, cross-selling opportunities, the application of our data fusion technology to the consumer marketing industry, the enhancement of existing products and solutions, the development and commercialization of new products and solutions, and the increased aggregation and fusion of consumer data, including our massive first-party consumer database, creating more robust consumer profiles to be utilized for both risk management and consumer marketing, among other uses. While we maintain our long-term strategy of increasing revenue, gaining market share and enhancing shareholder value through internal development and organic growth, we will continually seek to identify and pursue acquisition opportunities that fit within our strategy.
Grow Direct and Indirect Channels—Ownership of personally identifiable information including valid primary email addresses on over 90% of our consumer database facilitates the deterministic targeting of those consumers across multiple platforms and devices, extending our reach across email, mobile, display, search, social, and eventually addressable television. We intend to grow our owned media properties and increase our partnerships with third-party publishers to further our reach and scale in the market.
Our Competition
Competition in the big data and analytics sector centers on innovation, product stability, pricing and customer service. The market for our products and services is highly competitive and is subject to constant change. We compete on the basis of differentiated solutions, analytical capabilities, integration with our clients’ technology, client relationships, service stability, innovation and price. We believe we are well-positioned to effectively compete on all fronts.
In our Information Services segment, our competitors vary widely in size and nature of the products and services they offer. There are a large number of competitors who offer competing products and services in specialized areas, such as fraud prevention, risk management and decisioning solutions. We believe our next-generation data fusion technology, analytical capabilities, robust
7
database, and intelligent design of our cloud-based infrastructure will allow us to differentiate ourselves from our competition in flexibility, capability, service and price.
In our Performance Marketing segment, our traditional competitors have been database marketing services providers, online and traditional media companies, and advertising agencies. We believe the competitive landscape is changing and becoming more complex. We believe our ad-serving and data and customer acquisition technology platform enables our clients to better target, engage, qualify, and communicate with relevant consumers, in a more profitable manner, across mobile, web and in-app content environments than our competitors.
Some of our competitors have substantially greater financial, technical, sales and marketing resources, better name recognition and a larger customer base. Even if we introduce advanced products that meet evolving customer requirements in a timely manner, there can be no assurance that our new products will gain market acceptance.
Certain companies in the big data and analytics sector have expanded their product lines or technologies in recent years as a result of acquisitions. Further, more companies have developed products which conform to existing and emerging industry standards and have sought to compete on the basis of price. We anticipate increased competition from large data and analytics vendors. Increased competition in the big data and analytics sector could result in significant price competition, reduced profit margins or loss of market share, any of which could have a material adverse effect on our business, operating results and financial condition. There can be no assurance that we will be able to compete successfully in the future with current or new competitors.
Concentration of Customers
One customer, included in our Performance Marketing segment, accounted for 12% of the Company’s total revenue for the year ended December 31, 2016. Such customer, however, manages the ad platforms of leading search engines and represents a consortium of advertisers, which limits overall concentration risk.
Our Intellectual Property
Our success and ability to compete in the market is highly dependent upon our proprietary technology. We rely primarily upon a combination of patent, copyright, trademark and trade secret laws, as well as other intellectual property laws, and confidentiality procedures and contractual agreements, such as non-disclosure agreements, to protect our proprietary technology. We recently filed a patent application on our proprietary ad serving and customer acquisition platform and system. We have also entered into various agreements with our suppliers, resellers and certain clients to limit the disclosure of, and access to, sensitive proprietary information. There can be no assurance that the steps taken to protect our intellectual property will be adequate to prevent misappropriation of such technology or that our competitors will not independently develop technologies that are substantially equivalent or superior to our technology.
We use data acquired through licensing rights from approximately 20 providers. The loss of any one of these providers could have an immediate near-term impact on our financial position, results of operations, and liquidity. We rely on declarative, first-party data supplied by our users and supplemented and verified with third-party data sources.
Regulatory Matters
Our business is subject to various federal, state, and local laws, rules, and regulations, including, without limitation, the Driver’s Privacy Protection Act (18 U.S.C. §§ 2721- 2725) (“DPPA”), the Gramm-Leach-Bliley Act (15 U.S.C. §§ 6801- 6809) (“GLBA”), the Health Insurance Portability and Accountability Act (“HIPAA”), the Federal Trade Commission Act (the “FTC Act”), the Telephone Consumer Protection Act (“TCPA”), and the CAN SPAM Act of 2003 (“CAN-SPAM Act”). A change in any one of a number of the laws, rules, or regulations applicable to our business and/or the enactment of future legislation could have a material adverse effect on our financial condition and our ability to provide products or services to its customers.
Our Performance Marketing segment is subject to a variety of federal, state, and local laws, rules and regulations applicable to online advertising, commercial email marketing, telemarketing and privacy, including, but not limited to, the FTC Act, TCPA, Do Not Call Implementation Act, CAN-SPAM Act, Telemarketing Sales Rule (“TSR”) and California Business & Professions Code § 17529 (the “California Anti- Spam Act”). These laws, rules and regulations are constantly changing and keeping our business in compliance with or bringing our business into compliance with new laws may be costly, affect our revenue and harm our financial results.
8
We believe with change in the Administration and the replacement of the heads of the Federal Communications Commission (the “FCC”), the FTC, and the Consumer Protection Division of the FTC, that the regulatory environment for our business may be more business friendly than previously was the case, though it is certainly too early to gauge the impact with any certainty.
Seasonality
Our results are subject to seasonal fluctuation. Historically, certain products within our Information Services segment experience strength during the second and third quarters, while other products, including within our Performance Marketing segment, tend to be strongest in the fourth quarter, due to holiday advertising budgets, which traditionally carry over into the first quarter.
Our Employees
We employ approximately 200 persons as of December 31, 2016. None of our employees are represented by a labor organization, and none are party to any collective bargaining agreement. We have not experienced any work stoppages and consider our relations with our employees to be good. Competition in the recruiting of personnel in the big data and analytics sector is intense. We believe that our future success will depend in part on our continued ability to hire, motivate and retain qualified sales and marketing, executive and administrative and technical personnel. To date, we have not experienced significant difficulties in attracting or retaining qualified employees.
Company Evolution
Previously, we provided advertising services in the out-of-home advertising industry in China under the name Tiger Media, Inc. (“Tiger Media”). On March 21, 2015, Tiger Media completed the acquisition of The Best One, Inc. (“TBO”). In the transaction, TBO became a wholly owned subsidiary of Tiger Media, with TBO changing its name to IDI Holdings, LLC and Tiger Media changing its name to IDI, Inc. TBO was a holding company engaged in the acquisition of operating businesses and the acquisition and development of technology assets across various industries. Previously, on October 2, 2014, TBO acquired 100% of the membership interests of Interactive Data. Historically, Interactive Data provided data solutions and services to the Accounts Receivable Management industry, consisting primarily of collection agencies, collection law firms, and debt buyers, for location and identity verification, legislative compliance and debt recovery. Interactive Data now serves the entirety of the risk management industry. Through leading-edge, proprietary technology, advanced systems architecture, and a massive data repository, Interactive Data addresses the rapidly growing need for actionable intelligence.
On December 9, 2015, we completed the acquisition of Fluent with certain transactions effective December 8, 2015. Fluent, founded in 2010, is a leader in people-based digital marketing and customer acquisition, serving over 500 leading consumer brands and direct marketers. Fluent’s proprietary audience data and robust ad-serving technology enables marketers to acquire their best customers, with precision, at a massive scale. Leveraging compelling content, unique first-party data assets, and real-time survey interaction with customers, Fluent has helped marketers acquire millions of new prospective customers since its inception.
On June 8, 2016, we acquired Q Interactive, LLC (“Q Interactive”), a subsidiary of Selling Source, LLC. Q Interactive was founded in 1994 as Interactive Coupon Marketing Group and provides performance-based digital marketing solutions for advertisers and publishers. We believe the acquisition of Q Interactive is in line with our strategy to bolster our market leadership in performance marketing by adding client relationships as well as technology capabilities.
On September 14, 2016, we issued a press release announcing a transfer from the NYSE MKT to The NASDAQ Global Market (the “NASDAQ”) on September 26, 2016 under a new symbol “COGT” and rebranding to a new name, Cogint, Inc. We believe a listing on the NASDAQ and rebranding under Cogint, Inc. better reflects our commitment and expertise in driving technology innovations in order to shape the future of the data fusion industry.
Available Information
cogint’s principal executive offices are located at 2650 North Military Trail, Suite 300, Boca Raton, Florida 33431 and our telephone number is (561) 757-4000. Our Internet website is www.cogint.com. The website address provided in this 2016 Form 10-K is not intended to function as a hyperlink and information obtained on the websites is not and should not be considered part of this 2016 Form 10-K and is not incorporated by reference in this 2016 Form 10-K or any filing with the Securities and Exchange Commission (the “SEC”). Our Annual Report on Form 10-K, Quarterly Reports on Form 10-Q, Current Reports on Form 8-K, and amendments to reports filed or furnished pursuant to Sections 13(a) and 15(d) of the Securities Exchange Act of 1934, as amended, are available, free of charge, on cogint’s Investor Relations website at www.cogint.com as soon as reasonably practicable after we electronically file such material with, or furnish it to, the SEC. You may also read and copy any materials we file with the SEC at the SEC’s Public Reference Room at 100 F Street, NE, Washington, DC 20549. You may obtain information on the operation of the Public Reference
9
Room by calling the SEC at 1-800-SEC-0330. The SEC also maintains an Internet website located at http://www.sec.gov that contains the information we file or furnish electronically with the SEC.
Management Team
Our management team has a track record of strong performance and significant expertise in the markets we serve. We have built the leading companies in our industry, creating significant shareholder value. We continue to attract and retain experienced management talent for our business. Our team has deep knowledge of the big data and analytics sector and the online marketing and digital advertising industry, and expertise across the various industries that we serve. Our team has overseen the expansion of our proprietary technology platforms, while managing ongoing initiatives and the strategic acquisition of synergistic businesses and technologies. As a result, we are well positioned to continue to successfully drive growth both organically and through acquisitions.
Recent Developments
On January 18, 2017, the Company’s management and Board of Directors approved the plan to merge and fully integrate Q Interactive’s business into Fluent (the “Integration”), with Q Interactive becoming a wholly-owned subsidiary of Fluent. We expect little or no customer or revenue attrition associated with the Integration. As a result of the cost synergies we will achieve through the Integration, we expect to realize annualized savings in our operating expenses of approximately $4.5 million beginning in the second quarter of 2017. We estimate an aggregate of $0.9 million in restructuring costs associated with the Integration, which we expect to incur in 2017. Also, we estimate an impairment loss on intangible assets of $3.6 million, including primarily trade names and acquired proprietary technology, acquired in the Q Interactive Acquisition, to be recognized in the first quarter of 2017.
On January 19, 2017, Fluent entered into an Amendment No. 3 to Credit Agreement ("Amendment No. 3"), amending Fluent's Term Loan facility dated as of December 8, 2015. The Amendment No. 3, among other things, provides for a new term loan in the principal amount of $15.0 million ("Incremental Term Loan"), subject to the terms and conditions of the Amendment No. 3, and modifies certain other provisions set forth in the Credit Agreement, including certain financial covenants and related definitions. The entire Incremental Term Loan was received on February 1, 2017. The Incremental Term Loan and Fluent's existing $45.0 million Term Loan (collectively, the "Term Loans") are guaranteed by the Company and the other direct and indirect subsidiaries of the Company, and are secured by substantially all of the assets of the Company and its direct and indirect subsidiaries, including Fluent, in each case, on an equal and ratable basis. The Term Loans accrue interest at the rate of: (a) either, at Fluent's option, LIBOR (subject to a floor of 0.50%) plus 10.5% per annum, or base rate plus 9.5% per annum, payable in cash, plus (b) 1% per annum, payable, at Fluent's option, in either cash or in-kind. Principal amortization of the Term Loans will be $0.7 million per quarter, payable at the end of each calendar quarter, commencing on March 31, 2017. The Term Loans mature on December 8, 2020.
Executive Officers
Our executive officers are as follows:
|
Name |
|
Position |
|
Michael Brauser |
|
Executive Chairman of the Board |
|
Derek Dubner |
|
Chief Executive Officer, Interim President and Director |
|
Daniel MacLachlan |
|
Chief Financial Officer |
|
Harry Jordan |
|
Chief Operating Officer |
|
Jeff Dell |
|
Chief Information Officer |
Mr. Michael Brauser, 61, has served as a director of the Company and our Executive Chairman since June 2015. Since 2003, Mr. Brauser has been the manager of, and an investor with, Marlin Capital Partners, LLC, a private investment company. From 1999 to 2002, he served as president and chief executive officer of Naviant, Inc. (eDirect, Inc.), an internet marketing company. He also was a founder of Seisint, Inc. (eData.com, Inc.). Mr. Brauser served as co-chairman of the board of directors of InterCLICK (now a part of Yahoo Inc.), from August 2007 to December 2011. Mr. Brauser also served as co-chairman of the board of directors of ChromaDex Corp., an innovative natural products company, from October 2011 to February 2015.
Mr. Derek Dubner, 45, presently serves as the Chief Executive Officer, Interim President, and as a member of the Board since March 2015, as well as Chief Executive Officer of Interactive Data, a Company subsidiary. Mr. Dubner served as our Co-Chief Executive Officer from March 2015 until March 2016, when he was appointed our Chief Executive Officer. Mr. Dubner has over 15 years of experience in the data fusion industry. Mr. Dubner has served as the Chief Executive Officer of Company subsidiary The Best One, Inc. (“TBO”), a holding company engaged in the acquisition of operating businesses and the acquisition and development of technology assets across various industries, and its subsidiary, Interactive Data, since October 2014. Prior to TBO, Mr. Dubner served
10
as General Counsel of TransUnion Risk and Alternative Data Solutions, Inc. (“TRADS”) from December 2013 to June 2014. Mr. Dubner served as General Counsel and Secretary of TLO, LLC (“TLO”), an information solutions provider, from inception in 2009 through December 2013.
Mr. Daniel MacLachlan, 38, has served as the Chief Financial Officer of the Company since March 2016 and brings over a decade of experience as the chief financial officer of data-driven technology companies. Mr. MacLachlan served as an Independent Director, Audit and Compensation Committee Chairman for Vapor Corp., a U.S.-based distributor and retailer of vaporizers, e-liquids and electronic cigarettes, from April 2015 through April 2016. From October 2014 until early February 2015, Mr. MacLachlan served as the Chief Financial Officer of TBO. Prior to TBO, Mr. MacLachlan served in the roles of Director of Finance and Chief Financial Officer for TRADS, after it acquired substantially all of the assets of TLO, through a 363 sale process in December 2013. Mr. MacLachlan was the Chief Financial Officer of TLO since its inception in 2009. From 2005 to 2009, Mr. MacLachlan served as the Chief Financial Officer of JARI Research Corporation (“JARI”), a partnership with the Mayo Clinic advancing proprietary cancer therapeutic technology using targeted radioactive therapy. Prior to JARI, Mr. MacLachlan served as a Special Agent in the Federal Bureau of Investigation (FBI) specializing in the criminal investigation of public corruption and civil rights violations.
Mr. Harry Jordan, 50, has served as the Chief Operating Officer of the Company since August 2016. Mr. Jordan served as consultant for GOOD2GO, a consumer services company from January 2016 through June 2016. From September 2015 through December 2015, Mr. Jordan served as an independent consultant and the Acting Chief Operating Officer of MDLIVE, a leading telehealth provider. From June 2015 through October 2015, Mr. Jordan served as an independent consultant to Health Business Group (HBG), a leading boutique strategy consulting firm focused on the health care industry. From January 2015 through May 2015, Mr. Jordan served as a private investor. From January 2013 through December 2014, Mr. Jordan served as Senior Vice President, Health Care for Reed Elsevier’s LexisNexis Risk Solutions, a leading provider in the data fusion industry. Mr. Jordan served in a number of positions of increasing responsibility at Lexis Nexis from April 2004 through January 2013.
Mr. Jeff Dell, 45, has served as our Chief Information Officer since September 2016 and served as our Interim Chief Information Officer from June 2016 through September 2016. From July 2015 through May 2016, Mr. Dell served as our VP Information Security. From June 2012 to June 2015, Mr. Dell served as Founder and Chief Executive Officer of Endurance Tracker, Inc., a sports-based data analytics solution. From August 2009 to May 2012, Mr. Dell served as Lead Architect at Tripwire, Inc. From October 2008 to August 2009, Mr. Dell served as Chief Information Security Officer of TLO. From September 2003 to August 2009, Mr. Dell served as Founder and Chief Executive Officer of Activeworx, Inc., a leading information security data analytics company. From January 2001 to August 2003, Mr. Dell served as Chief Information Security Officer of Seisint, Inc., a leading provider in the data fusion industry.
Our business, financial condition, operating results, and cash flows may be impacted by a number of factors, many of which are beyond our control, including those set forth below and elsewhere in this 2016 Form 10-K, the occurrence of any one of which could have a material adverse effect on our actual results.
Risks Relating to Our Business
We have a history of losses and negative cash flow from operations which makes our future results uncertain.
Since inception, we have incurred operating losses and negative cash flow from operations. We need to generate greater revenue from the sale of our products and services if we are to achieve and sustain profitability. If we are unable to generate greater revenue, we may not be able to achieve profitability or generate positive cash flow from operations in the future.
Our products and services are highly technical and if they contain undetected errors, our business could be adversely affected and we may have to defend lawsuits or pay damages in connection with any alleged or actual failure of our products and services.
Our products and services are highly technical and complex. Our products and services have contained and may contain one or more undetected errors, defects or security vulnerabilities. Some errors in our products and services may only be discovered after a product or service has been used by end customers. Any errors or security vulnerabilities discovered in our products after commercial release could result in loss of revenues or delay in revenue recognition, or loss of customers, any of which could adversely affect our business and results of operations. In addition, we could face claims for product liability or breach of personally identifiable information. Defending a lawsuit, regardless of its merit, is costly and may divert management’s attention. In addition, if our business liability insurance coverage is inadequate or future coverage is unavailable on acceptable terms or at all, our financial condition could be harmed.
11
Because our networks and information technology systems are critical to our success, if unauthorized persons hack into our systems or our systems otherwise cease to function properly, our operations could be adversely affected and we could lose revenues or proprietary information, all of which could materially adversely affect our business.
As our business is conducted largely online, it is dependent on our networks being accessible and secure. If an actual or perceived breach of network security occurs, regardless of whether the breach is attributable to our network security controls, the market perception of the effectiveness of our network security could be harmed resulting in loss of current and potential end user customers, data suppliers, or cause us to lose potential value-added resellers. Our business is largely dependent on our customer-facing websites and our websites may be inaccessible because of service interruptions or subject to hacking or computer attacks. Because the techniques used by computer hackers to access or sabotage networks change frequently and generally are not recognized until launched against a target, we may be unable to anticipate these techniques. If an actual or perceived breach were to occur, we cannot assure you that we would not lose revenue or not sustain operating losses as a result.
We also rely heavily on large information technology databases and the ability to provide services using that information. A party who is able to breach the security measures on our networks could misappropriate either our proprietary information or the personal information of consumers that we collect, or otherwise cause interruptions or malfunctions to our operations. Hacking of computer data systems is a growing problem throughout the United States. If we grow and obtain more visibility, we may be more vulnerable to hacking. Moreover, the increased use of mobile devices also increases the risk of intentional and unintentional theft or disclosure of data including personally identifiable information. We may be unable to anticipate all of these vulnerabilities and implement adequate preventative measures and, in some cases, we may not be able to immediately detect a security incident. Any security incident may also result in a misappropriation of our proprietary information or that of our users, clients, and third-party publishers, which could result in legal and financial liability, as well as harm to our reputation.
We may be required to expend significant capital and other resources to protect against such threats or to alleviate problems caused by breaches in security. Additionally, any server interruptions, break-downs or system failures, including failures which may be attributable to events within our control, could increase our future operating costs and cause us to lose business. We maintain insurance policies covering losses relating to our network systems or other assets. However, these policies may not cover the entire cost of a claim. Any future disruptions in our information technology systems, whether caused by hacking or otherwise, may have a material adverse effect on our future results.
Privacy concerns relating to our data collection practices and any perceived or actual unauthorized disclosure of personally identifiable information, whether through breach of our network by an unauthorized party, employee theft, misuse, or error could harm our reputation, impair our ability to attract website visitors and to attract and retain clients, result in a loss of confidence in the security of our products and services, or subject us to claims or litigation arising from damages suffered by consumers, and thereby harm our business and results of operations. In addition, we could incur significant costs for which our insurance policies may not adequately cover and cause us to expend significant resources in protecting against security breaches and complying with the multitude of state, federal and foreign laws regarding data privacy and data breach notification obligations.
We must adequately protect our intellectual property in order to prevent loss of valuable proprietary information.
We rely primarily upon a combination of patent, copyright, trademark and trade secret laws, as well as other intellectual property laws, and confidentiality procedures and contractual agreements, such as non-disclosure agreements, to protect our proprietary technology. However, unauthorized parties may attempt to copy or reverse-engineer aspects of our products or services or to obtain and use information that we regard as proprietary. Policing unauthorized use of our products or services is difficult, and we cannot be certain that the steps we have taken will prevent misappropriation of our intellectual property. If the protection of our intellectual property proves to be inadequate or unenforceable, others may be able to use our proprietary developments without compensation to us, resulting in potential cost advantages to our competitors.
Some of our systems and technologies are not covered by any copyright, patent or patent application. We cannot guarantee that: (i) our intellectual property rights will provide us with a competitive advantage; (ii) our ability to assert our intellectual property rights against potential competitors or to settle current or future disputes will be effective; (iii) our intellectual property rights will be enforced in jurisdictions where competition may be intense or where legal protection may be weak; (iv) any of the patent, trademark, copyright, trade secret or other intellectual property rights that we presently employ in our business will not lapse or be invalidated, circumvented, challenged, or abandoned; (v) competitors will not design around our protected systems and technology; or (vi) that we will not lose the ability to assert our intellectual property rights against others.
Policing unauthorized use of our proprietary rights can be difficult and costly. Litigation, while it may be necessary to enforce or protect our intellectual property rights, could result in substantial costs and diversion of resources and management attention and could
12
adversely affect our business, even if we are successful on the merits. In addition, others may independently discover trade secrets and proprietary information, and in such cases we could not assert any trade secret rights against such parties.
We depend, in part, on strategic alliances, joint ventures and acquisitions to grow our business. If we are unable to make strategic acquisitions and develop and maintain these strategic alliances and joint ventures, our growth may be adversely affected.
An important focus of our business is to identify business partners who can enhance our services, enable us to develop solutions that differentiate us from our competitors, drive users to our websites and monetize our data. We have entered into several alliance agreements or license agreements with respect to certain of our datasets and services and may enter into similar agreements in the future. These arrangements may require us to restrict our use of certain of our technologies or datasets among certain customer industries, restrict content on our websites or grant licenses on terms that ultimately may prove to be unfavorable to us, any of which could adversely affect our business, financial condition or results of operations. Relationships with our alliance agreement partners may include risks due to incomplete information regarding the marketplace and commercial strategies of our partners, and our alliance agreements or other licensing agreements may be the subject of contractual disputes. If we or our alliance agreements’ partners are not successful in maintaining or commercializing the alliance agreements’ services, such commercial failure could adversely affect our business.
If we consummate any future acquisitions, we will be subject to the risks inherent in identifying, acquiring and operating a newly acquired business.
On March 21, 2015, we acquired IDI Holdings and transformed the nature of our business. IDI Holdings, in turn, had acquired Interactive Data, its core business, in October 2014 shortly following IDI Holdings’ incorporation. On December 8, 2015, we acquired Fluent, a company that had greater revenues and headcount than cogint prior to the acquisition. On June 8, 2016, we acquired Q Interactive. We may, in the future, acquire additional businesses, which we believe could complement or expand our current business or offer growth opportunities. We may experience difficulties in identifying potential acquisition candidates that complement our current business at appropriate prices, or at all. We cannot assure you that our acquisition strategy will be successful. We may spend significant management time and resources in analyzing and negotiating acquisitions or investments that are not consummated. Furthermore, the ongoing process of integrating an acquired business is distracting, time consuming, expensive, and requires continuous optimization and allocation of resources. Additionally, if we use stock as consideration, this would dilute our existing shareholders and if we use cash, this would reduce our liquidity and impact our financial flexibility. We may seek debt financing for particular acquisitions, which may not be available on commercially reasonable terms, or at all. We face the risks associated with the business acquisition strategy, including:
|
• |
the potential disruption of our existing businesses, including the diversion of management attention and the redeployment of resources; |
|
• |
entering new markets or industries in which we have limited prior experience; |
|
• |
our failure in due diligence to identify key issues specific to the businesses we seek to acquire or the industries or other environments in which they operate, or, failure to protect against contingent liabilities arising from those issues; |
|
• |
unforeseen, hidden or fraudulent liabilities; |
|
• |
our difficulties in integrating, aligning and coordinating organizations which will likely be geographically separated and may involve diverse business operations and corporate cultures; |
|
• |
our difficulties in integrating, aligning and coordinating organizations which will likely be geographically separated and may involve diverse business operations and corporate cultures; |
|
• |
our difficulties in integrating and retaining key management, sales, research and development, production and other personnel; |
|
• |
the potential loss of key employees, customers or distribution partners of the acquired businesses; |
|
• |
our difficulties in incorporating the acquired business into our organization; |
|
• |
the potential loss of customers, distributors or suppliers; |
|
• |
our difficulties in integrating or expanding information technology systems and other business processes to accommodate the acquired business; |
|
• |
the risks associated with integrating financial reporting and internal control systems, including the risk that significant deficiencies or material weaknesses may be identified in acquired entities; |
|
• |
the potential for future impairments of goodwill and other intangible assets if the acquired business does not perform as expected; |
13
|
• |
our successfully operating the acquired business. |
If we cannot overcome these challenges, we may not realize actual benefits from past and future acquisitions, which will impair our overall business results. If we complete an investment or acquisition, we may not realize the anticipated benefits from the transaction.
Our business is subject to various governmental regulations, laws and orders, compliance with which may cause us to incur significant expenses or reduce the availability or effectiveness of our solutions, and the failure to comply with which could subject us to civil or criminal penalties or other liabilities.
Our businesses are subject to regulation under the GLBA, DPPA, HIPAA, FTC Act, TCPA, CAN-SPAM Act and various other federal, state and local laws and regulations. These laws and regulations, which generally are designed to protect the privacy of the public and to prevent the misuse of personal information available in the marketplace and prevent deceptive practices in advertising and online marketing and telemarketing are complex, change frequently and have tended to become more stringent over time. We have already incurred significant expenses in our attempt to ensure compliance with these laws.
These U.S. federal and state and foreign laws and regulations, which can be enforced by government entities or, in some cases, private parties, are constantly evolving and can be subject to significant change. Keeping our business in compliance with or bringing our business into compliance with new laws may be costly, and may affect our revenue and/or harm our financial results. In addition, the application, interpretation, and enforcement of these laws and regulations are often uncertain, particularly in the new and rapidly evolving industry in which we operate, and may be interpreted and applied inconsistently from jurisdiction to jurisdiction and inconsistently with our current policies and practices. Parts of our business, which rely on third party publishers to drive traffic to our sites, could be adversely impacted if we or any of our third-party publishers or our clients violate applicable laws. In addition, new laws or regulations or changes in enforcement of existing laws or regulations applicable to our clients could affect the activities or strategies of such clients and, therefore, lead to reductions in their level of business with us.
The following legal and regulatory developments also could have a material adverse effect on our business, financial condition or results of operations:
|
|
• |
amendment, enactment or interpretation of laws and regulations that restrict the access and use of personal information and reduce the availability or effectiveness of our solutions or the supply of data available; |
|
|
• |
changes in cultural and consumer attitudes in favor of further restrictions on information collection and sharing, which may lead to regulations that prevent full utilization of our solutions; |
|
|
• |
failure of data suppliers or customers to comply with laws or regulations, where mutual compliance is required; |
|
|
• |
failure of our solutions to comply with current laws and regulations; and |
|
|
• |
failure of our solutions to adapt to changes in the regulatory environment in an efficient, cost-effective manner. |
Changes in applicable legislation or regulations that restrict or dictate how we collect, maintain, combine and disseminate information could adversely affect our business, financial condition or results of operations. In the future, we may be subject to significant additional expense to ensure continued compliance with applicable laws and regulations and to investigate, defend or remedy actual or alleged violations.
We supply data to call center clients for telemarketing which may subject them to claims under the TCPA, which has become a fertile source for both individual and class action lawsuits and regulatory actions. We have expended considerable resources to comply with the TCPA and incurred additional costs to insure against TCPA-related claims and have not experienced material losses from TCPA claims. Our failure to adhere to or successfully implement appropriate processes and procedures in response to and to defend against TCPA related claims could result in legal and monetary liability, significant fines and penalties, or damage to our reputation in the marketplace, any of which could have a material adverse effect on our business, financial condition, and/or results of operations.
In connection with our third-party publishers’ email campaigns to generate traffic for our websites, we are subject to various state and Federal laws regulating commercial email communications, including the CAN-SPAM Act and the California Anti-Spam Act. If we or any of our third-party publishers fail to comply with any provisions of these laws or regulations, we could be subject to regulatory investigation, enforcement actions, and litigation and claims. Any negative outcomes from such regulatory actions or litigation or claims, including monetary penalties or damages, could have a material adverse effect on our financial condition, results of operation, and reputation.
14
The outcome of litigation, inquiries, investigations, examinations or other legal proceedings in which we are involved, in which we may become involved, or in which our customers or competitors are involved could subject us to significant monetary damages or restrictions on our ability to do business.
Legal proceedings arise frequently as part of the normal course of our business. These may include individual consumer cases, class action lawsuits and inquiries, investigations, examinations, regulatory proceedings or other actions brought by federal (e.g., the FTC) or state (e.g., state attorneys general) authorities or by consumers. The scope and outcome of these proceedings is often difficult to assess or quantify. Plaintiffs in lawsuits may seek recovery of large amounts and the cost to defend such litigation may be significant. There may also be adverse publicity and uncertainty associated with investigations, litigation and orders (whether pertaining to us, our customers or our competitors) that could decrease customer acceptance of our services or result in material discovery expenses. In addition, a court-ordered injunction or an administrative cease-and-desist order or settlement may require us to modify our business practices or may prohibit conduct that would otherwise be legal and in which our competitors may engage. Many of the technical and complex statutes to which we are subject, including state and federal financial privacy requirements, may provide for civil and criminal penalties and may permit consumers to maintain individual or class action lawsuits against us and obtain statutorily prescribed damages. Additionally, our customers might face similar proceedings, actions or inquiries which could affect their business and, in turn, our ability to do business with those customers. A discussion of our current material legal proceedings is included in the “Legal Proceedings” section of this 2016 Form 10-K.
While we do not believe that the outcome of any pending or threatened legal proceeding, investigation, examination or supervisory activity will have a material adverse effect on our financial position, such events are inherently uncertain and adverse outcomes could result in significant monetary damages, penalties or injunctive relief against us. Furthermore, we review legal proceedings and claims on an ongoing basis and follow appropriate accounting guidance, including ASC 450, when making accrual and disclosure decisions. We establish accruals for those contingencies where the incurrence of a loss is probable and can be reasonably estimated, and we disclose the amount accrued and the amount of a reasonably possible loss in excess of the amount accrued, if such disclosure is necessary for our financial statements to not be misleading. To estimate whether a loss contingency should be accrued by a charge to income, we evaluate, among other factors, the degree of probability of an unfavorable outcome and the ability to make a reasonable estimate of the amount of the loss. We do not record liabilities when the likelihood that the liability has been incurred is probable, but the amount cannot be reasonably estimated. Based upon present information, we determined that there were no matters that required an accrual as of our most recent balance sheet date, December 31, 2016. We estimate that adverse rulings in pending litigation matters could result in a possible loss of between $3.0 million and $6.0 million.
Our relationships with key customers may be materially diminished or terminated.
We have established relationships with a number of customers, many of whom could unilaterally terminate their relationship with us or materially reduce the amount of business they conduct with us at any time. Market competition, customer requirements, customer financial condition and customer consolidation through mergers or acquisitions also could adversely affect our ability to continue or expand these relationships. There is no guarantee that we will be able to retain or renew existing agreements, maintain relationships with any of our customers on acceptable terms or at all or collect amounts owed to us from insolvent customers. The loss of one or more of our major customers could adversely affect our business, financial condition and results of operations.
If we lose the services of key personnel, it could adversely affect our business.
Our future success depends, in part, on our ability to attract and retain key personnel. Our future also depends on the continued services of Michael Brauser, our Executive Chairman, Derek Dubner, our Chief Executive Officer, Ole Poulsen, our Chief Science Officer, Ryan Schulke, CEO of Fluent, Mathew Conlin, President of Fluent, and other key employees in all areas of our organization, each of whom is important to the management of certain aspects of our business and operations and the development of our strategic direction, and each of whom may be difficult to replace. We carry “key man” life insurance policies on Mr. Dubner and Mr. Schulke in the amount of $10.0 million each, the beneficiary of which is HIG Whitehorse, the holder of our $60.0 million term loans pursuant to the Credit Agreement (“Credit Agreement”) dated December 8, 2015, as amended. The loss of the services of these key individuals and the process to replace these individuals would involve significant time and expense and could significantly delay or prevent the achievement of our business objectives.
Risks Relating to Our Information Services Segment
If we fail to respond to rapid technological changes in the big data and analytics sector, we may lose customers and/or our products and/or services may become obsolete.
The big data and analytics sector is characterized by rapidly changing technology, frequent product introductions, and continued evolution of new industry standards. As a result, our success depends upon our ability to develop and introduce in a timely manner
15
new products and services and enhancements to existing products and services that meet changing customer requirements and evolving industry standards. The development of technologically advanced product solutions is a complex and uncertain process requiring high levels of innovation, rapid response and accurate anticipation of technological and market trends. We cannot assure you that it will be able to identify, develop, manufacture, market or support new or enhanced products and services successfully in a timely manner. Further, we or our competitors may introduce new products or services or product enhancements that shorten the life cycle of existing products or services or cause existing products or services to become obsolete.
Our revenues are concentrated in the U.S. market across a broad range of industries. When these industries or the broader financial markets experience a downturn, demand for our services and revenues may be adversely affected.
Our customers, and therefore our business and revenues, sometimes depend on favorable macroeconomic conditions and are impacted by the availability of credit, the level and volatility of interest rates, inflation, employment levels, consumer confidence and housing demand. In addition, a significant amount of our revenues are concentrated among certain industries. Our customer base suffers when financial markets experience volatility, illiquidity and disruption, which has occurred in the past and which could reoccur. Such market developments, and the potential for increased and continuing disruptions going forward, present considerable risks to our business and operations. Changes in the economy have resulted, and may continue to result, in fluctuations in volumes, pricing and operating margins for our services. For example, the banking and financial market downturn that began to affect U.S. businesses in 2008 caused a greater focus on expense reduction by customers of businesses similar to ours. If businesses in these industries experience economic hardship, we cannot assure you that we will be able to generate future revenue growth. These types of disruptions could lead to a decline in the volumes of services we provide our customers and could negatively impact our revenue and results of operations.
We could lose our access to data sources which could prevent us from providing our services.
Our services and products depend extensively upon continued access to and receipt of data from external sources, including data received from customers, strategic partners and various government and public records repositories. In some cases, we compete with our data providers. Our data providers could stop providing data, provide untimely data or increase the costs for their data for a variety of reasons, including a perception that our systems are insecure as a result of a data security breach, budgetary constraints, a desire to generate additional revenue or for regulatory or competitive reasons. We could also become subject to increased legislative, regulatory or judicial restrictions or mandates on the collection, disclosure or use of such data, in particular if such data is not collected by our providers in a way that allows us to legally use the data. If we were to lose access to this external data or if our access or use were restricted or were to become less economical or desirable, our ability to provide services could be negatively impacted, which would adversely affect our reputation, business, financial condition and results of operations. We cannot provide assurance that we will be successful in maintaining our relationships with these external data source providers or that we will be able to continue to obtain data from them on acceptable terms or at all. Furthermore, we cannot provide assurance that we will be able to obtain data from alternative sources if our current sources become unavailable.
We face intense competition from both start-up and established companies that may have significant advantages over us and our products.
The market for our products and services is intensely competitive. There are numerous companies competing with us in various segments of the big data and analytics sector, and their products and services may have advantages over our products and services in areas such as conformity to existing and emerging industry standards, performance, price, ease of use, scalability, reliability, flexibility, product features and technical support.
Our principal competitors in the big data and analytics sector include Palantir, RELX Group (LexisNexis), TransUnion, Thomson Reuters, Acxiom, and Alliance Data. Current and potential competitors may have one or more of the following significant advantages:
|
• |
greater financial, technical and marketing resources; |
|
• |
better name recognition; |
|
• |
more comprehensive solutions; |
|
• |
better or more extensive cooperative relationships; and |
|
• |
larger customer base. |
We cannot assure you that we will be able to compete successfully with our existing or new competitors. Some of our competitors may have, in relation to us, one or more of the following: longer operating histories, longer-standing relationships with end-user customers and greater customer service, public relations and other resources. As a result, these competitors may be able to more
16
quickly develop or adapt to new or emerging technologies and changes in customer requirements, or devote greater resources to the development, promotion and sale of their products and services. Additionally, it is likely that new competitors or alliances among existing competitors could emerge and rapidly acquire significant market share.
There may be further consolidation in our end-customer markets, which may adversely affect our revenues.
There has been, and we expect there will continue to be, merger, acquisition and consolidation activity in our customer markets. If our customers merge with, or are acquired by, other entities that are not our customers, or that use fewer of our services, our revenue may be adversely impacted. In addition, industry consolidation could affect the base of recurring transaction-based revenue if consolidated customers combine their operations under one contract, since many of our contracts provide for volume discounts. In addition, our existing customers might leave certain geographic markets, which would no longer require them to purchase certain products from us and, consequently, we would generate less revenue than we currently expect.
To the extent the availability of free or relatively inexpensive consumer and/or business information increases, the demand for some of our services may decrease.
Public and commercial sources of free or relatively inexpensive consumer and business information have become increasingly available and this trend is expected to continue. Public and commercial sources of free or relatively inexpensive consumer and/or business information may reduce demand for our services. To the extent that our customers choose not to obtain services from us and instead rely on information obtained at little or no cost from these public and commercial sources, our business, financial condition and results of operations may be adversely affected.
If our newer products do not achieve market acceptance, revenue growth may suffer.
Our Information Services products have been in the market place for a limited period of time and may have longer sales cycles than competitive products. Accordingly, we may not achieve the meaningful revenue growth needed to sustain operations. We cannot provide any assurances that sales of our newer products will continue to grow or generate sufficient revenues to sustain our business. If we are unable to recognize revenues due to longer sales cycles or other problems, our results of operations could be adversely affected.
We have not yet received broad market acceptance for our newer products. We cannot assure you that our present or future products will achieve market acceptance on a sustained basis. In order to achieve market acceptance and achieve future revenue growth, we must introduce complementary products, incorporate new technologies into existing product lines and design, and develop and successfully commercialize higher performance products in a timely manner. We cannot assure you that we will be able to offer new or complementary products that gain market acceptance quickly enough to avoid decreased revenues during current or future product introductions or transitions.
Our products and services can have long sales and implementation cycles, which may result in substantial expenses before realizing any associated revenues.
The sale and implementation of our products and services to large companies and government entities typically involves a lengthy education process and a significant technical evaluation and commitment of capital and other resources. This process is also subject to the risk of delays associated with customers’ internal budgeting and other procedures for approving capital expenditures, and testing and accepting new technologies that affect key operations. As a result, sales and implementation cycles for our products and services can be lengthy, and we may expend significant time and resources before we receive any revenues from a customer or potential customer. Our quarterly and annual operating results could be adversely affected if orders forecast for a specific customer and for a particular period are not realized.
Consolidation in the big data and analytics sector may limit market acceptance of our products and services.
Several of our competitors have acquired companies with complementary technologies in the past. We expect consolidation in the industries we serve to continue in the future. These acquisitions may permit our competitors to accelerate the development and commercialization of broader product lines and more comprehensive solutions than we currently offer. Acquisitions of vendors or other companies that with whom we have a strategic relationship by our competitors may limit our access to commercially significant technologies. Further, business combinations are creating companies with larger market shares, customer bases, sales forces, product offerings and technology and marketing expertise, which may make it more difficult for us to compete.
17
We may incur substantial expenses defending the Company against claims of infringement.
There are numerous patents held by many companies relating to the design and manufacture of data and analytics solutions. Third parties may claim that our products and/or services infringe on their intellectual property rights. Any claim, with or without merit, could consume management’s time, result in costly litigation, cause delays in sales or implementation of products or services or require entry into royalty or licensing agreements. In this respect, patent and other intellectual property litigation is becoming increasingly more expensive in terms of legal fees, expert fees and other expenses. Royalty and licensing agreements, if required and available, may be on terms unacceptable to us or detrimental to our business. Moreover, a successful claim of product infringement against us or our failure or inability to license the infringed or similar technology on commercially reasonable terms could seriously harm our business.
Risks Related to Our Performance Marketing Segment
We operate in an industry that is still developing and has a relatively new business model that is continually evolving, which makes it difficult to evaluate our business and prospects.
Our Performance Marketing segment derives nearly all of its revenue from the sale of online marketing and media services, which is a still developing industry that has undergone rapid and dramatic changes in its relatively short history and which is characterized by rapidly-changing Internet media and advertising technology, evolving industry standards, regulatory uncertainty, and changing user and client demands. As a result, we face risks and uncertainties such as:
|
• |
its still-developing industry and relatively new business model; |
|
• |
changes in the economic condition, market dynamics, regulatory enforcement or legislative environment affecting its, its third-party publishers’, and its clients’ businesses; |
|
• |
its dependence on the availability and affordability of quality media from third-party publishers; |
|
• |
its dependence on Internet search companies to attract Internet visitors; |
|
• |
its ability to compete in its industry; |
|
• |
its ability to manage cyber security risks and costs associated with maintaining a robust security infrastructure; |
|
• |
its inability to monetize users accessing its sites on mobile devices at the same levels as was achieved from users accessing its sites from PCs; |
|
• |
its ability to develop new services, enhancements and features to meet new demands from its clients; and |
|
• |
its ability to comply with and avoid regulatory scrutiny in a rapidly evolving legal and regulatory environment. |
If we are unable to address these risks, our business, results of operations, and prospects may be adversely affected.
An increasing percentage of our users are accessing our websites from their mobile devices. Our ability to remain competitive with the shift to mobile devices is critical to maintaining our revenues and margins.
A greater percentage of our users are accessing our websites from their mobile devices. We will need to ensure our websites continue to perform well as more consumers shift their online interactions from desktop computers to smartphones, tablets, wearables, and other next generation platforms and devices. While we design and build our websites “mobile first,” as more of our users access our websites from mobile devices, the monetization of our online marketing services and content on these mobile devices might not be as lucrative for us compared to those on desktop and laptop computers. If we fail to develop the monetization of the mobile versions of our websites effectively, our business and results of operations may be adversely affected.
We are dependent on third-party publishers for a significant portion of visitors to our websites. Any decline in the supply of media available through these websites or increase in the price of this media could cause our revenue to decline or increase the cost to acquire visitors to our websites.
A significant portion of our revenue is attributable to visitor traffic originating from third-party publishers. Third-party publishers can change the media inventory they make available to us at any time and place significant restrictions on our content offerings. These restrictions may limit the websites that we can promote or prohibit advertisements from specific clients or specific industries, or restrict the use of certain creative content or formats. If a third-party publisher decides not to make media inventory available to us, or decides to demand a higher revenue share or places significant restrictions on the use of such inventory, we may not be able to find
18
media inventory from other websites that satisfy our requirements in a timely and cost-effective manner. In addition, the number of competing online marketing service providers and advertisers that acquire inventory from websites continues to increase. Consolidation of Internet advertising networks and third-party publishers could eventually lead to a concentration of desirable inventory on websites or networks owned by a small number of persons, which could limit the supply or impact the pricing of inventory available to us. We cannot provide assurance that we will be able to acquire media inventory that meets our performance, price, and quality requirements, in which our business and results of operations may be adversely affected.
We also purchase media directly from ad networks, search engines and platforms that provide us the ability to access media (inventory) from a range of websites. Many of these publishers also have their own guidelines on acceptable content, advertisements and the types of advertisers and websites that can advertise on their properties. These guidelines change frequently and the changes are often unpublished. If we are restricted from buying media from these platforms, ad networks and/or search engines, our results could be adversely affected.
We depend on Internet search providers for a portion of the visitors to our websites. Changes in search engine algorithms applicable to our websites’ placements in paid search result listings may cause the number of visitors to our websites to decrease, and as a result, cause our revenue to decline.
Our success depends on our ability to attract online visitors to its websites and monetize them in a cost-effective manner. We use paid search listings from search engine providers such as Google, Bing and Yahoo! by bidding on particular keywords and other strategies. The search engine operators use a quality score which is determined by the relevancy of the ad to the keyword bid on, the click-through rates of the ad, and the amount bid, to determine the placement of the ad in the search results listings. The search engine providers frequently change the algorithms and bidding rules and may exclude certain sites they deem unacceptable from bidding on paid search listings. We may fail to optimally manage our paid listings or operate our websites in a manner that does not run afoul of the search engine requirements. In that case, our business and results of operations may be adversely affected.
Our operations have grown dramatically over the past years which may make it difficult to effectively manage any future growth and scale our products quickly enough to meet our clients’ needs while maintaining profitability.
We have historically experienced growth in our operations. This growth has placed, and any future growth will continue to place, significant demands on our management and our operational and financial infrastructure. Growth, if any, may make it more difficult for us to accomplish the following:
|
• |
successfully scale our technology to accommodate a larger business and integrate acquisitions; |
|
• |
maintain our standing with key vendors, including Internet search companies and third-party publishers; |
|
• |
maintain our client service standards; |
|
• |
develop and improve our operational, financial and management controls and maintaining adequate reporting systems and procedures; and |
|
• |
hire, train and manage additional staff needed to manage future growth. |
Our future success depends in part on the efficient performance of our software and technology infrastructure. As the numbers of websites, Internet users and the amount of data collected increases, our technology infrastructure may not be able to meet the increased demand. Unexpected constraints on our technology infrastructure could lead to slower website response times or system failures and adversely affect the availability of websites and the level of user responses received, which could result in the loss of clients or revenue or harm to our business and/or results of operations.
In addition, our systems, procedures, processes, and controls may be inadequate to support our future operations. The improvements required to manage growth may require us to make significant expenditures, and reallocate valuable management resources. We may spend substantial amounts to secure hosting and other technical services and data storage, upgrade our technology and network infrastructure to handle increased traffic on our owned-and-operated websites and roll out new products and services. This expansion could be expensive and complex and could result in inefficiencies or operational failures. If we do not implement this expansion successfully, or if we experience inefficiencies and/or operational failures during our implementation, the quality of our products and services and our users’ experience could decline. This could damage our reputation and cause us to lose current and potential users and clients. The costs associated with these adjustments to our architecture could harm our operating results. Accordingly, if we fail to effectively manage growth, our operating performance will suffer, and we may lose clients, key vendors and key personnel.
We will need to expand our workforce to meet the needs of our business. We operate in a specialized niche of the online advertising and data acquisition marketplace and finding experienced qualified applicants and training them can prove challenging. If we are
19
unable to hire, train and effectively manage a sufficient number of new employees, we may not be able to capitalize on opportunities and/or may not be able to continue to grow our business at past levels.
Historically, our quarterly and annual results of operations have rapidly increased due to several favorable factors, some of which are beyond our control. Moreover, we are one of the larger players in our market segment. Because of these factors, we may not be able to increase our market share and/or sustain our recent rapid growth. Our inability to sustain our growth could cause our performance and outlook to be below the expectations of securities analysts and investors.
As a result of changes in our business model and the need for increased investments and expenditures for certain businesses, products, services, and technologies, we may fail to maintain our margins, attract new clients, or grow our revenues.
We have invested in new businesses, products, markets, services and technologies and plan to expand our work force to meet the needs of revenue growth. Based on our experience, new websites, products and services have lower margins than more established websites, products and services. If we are unsuccessful in our optimization efforts for new websites and products, we may fail to maintain our margins, attract new clients or grow our revenues.
If we fail to compete effectively against other online marketing and media companies and other competitors, we could lose clients and our revenue may decline.
The market for online marketing is intensely competitive, and we expect this competition to continue and to increase in the future, both from existing competitors and, given the relatively low barriers to entry into the market, from new competitors. We compete both for clients and for limited high-quality media. We compete for clients on the basis of a number of factors, including return on investment of client’s marketing spending, price, and client service.
We compete with Internet and traditional media companies for a share of clients’ overall marketing budgets, including:
|
• |
offline and online advertising agencies; |
|
• |
major Internet portals and search engine companies with advertising networks; |
|
• |
other online marketing service providers, including online affiliate advertising networks and industry-specific portals or email marketing companies; |
|
• |
third-party publishers with their own sales forces that sell their online marketing services directly to clients; |
|
• |
in-house marketing groups and activities at current or potential clients; |
|
• |
offline direct marketing agencies; |
|
• |
mobile and social media; and |
|
• |
television, radio, and print companies. |
Competition for web traffic among websites and search engines, as well as competition with traditional media companies, has resulted and may continue to result in significant increases in media pricing, declining margins, reductions in revenue, and loss of market share. In addition, if we expand the scope of our services, we may compete with a greater number of websites, clients, and traditional media companies across an increasing range of different services, including in vertical markets where competitors may have advantages in expertise, brand recognition, and other areas. Major internet search companies such as Google, Yahoo! and Microsoft as well as social media platforms such as Facebook have significant numbers of direct sales personnel and substantial proprietary advertising inventory and web traffic that provide a significant competitive advantage. The trend toward consolidation in online marketing may also affect pricing and availability of media inventory and web traffic. Many of our current and potential competitors also enjoy other competitive advantages over us, such as longer operating histories, greater brand recognition, larger client bases, greater access to advertising inventory on high-traffic websites, and greater financial, technical, and marketing resources. As a result, we may not be able to compete successfully. The online advertising marketplace is increasingly analytically driven and if the performance of our advertising services is not better than other marketing service providers’ offerings, we could lose clients and market share.
20
A reduction in online marketing spend by our clients, a loss of clients or lower advertising yields may seriously harm our business, financial condition, and results of operations. In addition, a substantial portion of our revenue is generated from a limited number of clients and, if we lose a major client, our revenue will decrease and our business and prospects may be harmed.
We rely on clients’ marketing spend on our owned-and-operated websites. We have historically derived, and expects to continue to derive, a significant portion of our revenue through the delivery of targeted advertisements, applications, installs and actions and the delivery of qualified customers. One component of our platform that we use to generate client interest is our system of monetization tools, which is designed to match users with client offerings in a manner that optimizes revenue yield and end-user experience. Clients will stop spending marketing funds on our owned-and-operated websites if their investments do not generate actions or qualified users cost effectively. If our yield-optimized monetization techniques to effectively target and match advertisements to our client offerings fail to increase revenue or return on investment for our clients, our clients could curtail their advertising spend with us or cease using our services altogether.
Furthermore, our top 40 advertisers account for a substantial portion of our revenue, among which, one of our advertisers accounts for 12% of our revenue. Such customer, however, manages the ad platforms of leading search engines and represents a consortium of advertisers, which limits overall concentration risk. Our advertising clients can generally terminate their agreements with us at any time on little or no prior notice. Clients may also fail to renew their agreements or reduce their level of business with us, leading to lower revenue.
Third-party publishers or vendors may engage in unauthorized or unlawful acts that could subject us to significant liability or cause us to lose clients.
We generate a significant portion of our web visitors from online media that we purchase from third-party publishers. While we actively monitor our publishers’ activities, we cannot police all such behavior. Any activity by third-party publishers that clients view as potentially damaging to their brands, whether or not permitted by our contracts with our clients, could harm our relationship with the client and cause the client to terminate its relationship with us, resulting in a loss of revenue. In addition, we may also face liability for any failure of our third-party publishers or vendors to comply with regulatory requirements. Users or customers may complain about the content of publisher ads which may expose us to lawsuits and regulatory scrutiny. The law is unsettled on the extent of liability that an advertiser in our position has for the activities of third-party publishers or vendors. We could be subject to costly litigation and, if we are unsuccessful in defending, could incur damages for the unauthorized or unlawful acts of third-party publishers or vendors.
If we fail to continually enhance and adapt our products and services to keep pace with rapidly changing technologies and industry standards, we may not remain competitive and could lose clients or advertising inventory.
The online media and marketing industry is characterized by rapidly changing standards, changing technologies, frequent new product and service introductions, and changing user and client demands. The introduction of new technologies and services embodying new technologies and the emergence of new industry standards and practices could render our existing technologies and services obsolete and unmarketable or require unanticipated investments in technology. We continually make enhancements and other modifications to our proprietary technologies, and these changes may contain design or performance defects that are not readily apparent. If our proprietary technologies fail to achieve their intended purpose or are less effective than technologies used by our competitors, our business could be harmed.
Our future success will depend in part on our ability to successfully adapt to these rapidly changing online media formats and other technologies. If we fail to adapt successfully, we could lose clients or advertising inventory.
We are exposed to credit risk from and have payment disputes with our advertisers and agency clients and may not be able to collect on amounts owed to us.
Many of our advertising clients are thinly capitalized and pose credit risks. While we run credit checks on our clients, we may nevertheless have difficulty collecting on all amounts owed to it. Some of our clients may challenge the determination of amounts we believe they owe or may refuse to pay because of performance related claims. In these circumstances, we may have difficulty collecting on amounts we believe are owed.
A portion of our client business is sourced through advertising agencies. In many cases, agencies are not required to pay us unless and until they are paid by the underlying client. In addition, many agencies are thinly capitalized and have or may develop high-risk credit profiles. If an agency became insolvent, or if an underlying client does not pay the agency, we may be required to write off accounts receivable as bad debt.
21
Damage to our reputation could harm our business, financial condition and results of operations.
Our business is dependent on attracting a large number of visitors to our websites and providing subscribers, inquiries, clicks, calls, applications, and customers to our clients, which depends in part on our reputation within the industry and with our clients. Certain other companies within our industry regularly engage in activities that others may view as unlawful or inappropriate. These activities by third parties may be seen as indicative of participants in our industry and may therefore harm the reputation of all participants in our industry, including us.
Our ability to attract potential users and, thereby, clients, also depends in part on users receiving incentives, job listings, prizes, samples and other content as well as attractive offers from our clients. If our users are not satisfied with the content of our websites or our clients’ offerings, our reputation and therefore our ability to attract additional clients and users could be harmed.
In addition, from time to time, we may be subject to investigations, inquiries or litigation by various regulators, which may harm our reputation regardless of the outcome of any such action.
Any damage to our reputation, including from publicity from legal proceedings against us or companies that work within our industry, governmental proceedings, consumer class action litigation, or the disclosure of information security breaches or private information misuse, may adversely affect our business, financial condition and results of operations.
Our quarterly revenue and results of operations may fluctuate significantly from quarter to quarter due to fluctuations in advertising spending, including seasonal and cyclical effects.
In addition to other factors that cause our results of operations to fluctuate, results may also be subject to seasonal fluctuation. Furthermore, advertising spend on the Internet, similar to traditional media, tends to be cyclical and discretionary as a result of factors beyond our control, including budgetary constraints and buying patterns of clients, as well as economic conditions affecting the Internet and media industry. Poor macroeconomic conditions could decrease our clients’ advertising spending and thereby have a material adverse effect on our business, financial condition, and operating results.
Limitations on our ability to collect and use data derived from user activities, as well as new technologies that block our ability to deliver Internet-based advertising, could significantly diminish the value of our services and have an adverse effect on our ability to generate revenue.
When a user visits our websites, we use technologies to collect information and use registration data provided by users and user response to our dynamically populated survey questions to collect additional user information to create a robust user profile which we use in our targeted ad serving and customer data acquisition services. The use of personal information is the subject of litigation, regulatory scrutiny and industry self-regulatory activities, including the discussion of “do-not-track” technologies and guidelines.
Technologies, tools, software and applications (including new and enhanced web browsers) have been developed, and are likely to continue to be developed, that can block or allow users to opt out of display, search, and Internet-based advertising and content, or shift the location where advertising appears on pages so that our advertisements do not show up in the most monetizable places on its pages or are obscured. Recently, app developers have developed ad blocking apps for smartphones and other mobile devices which may hinder marketing activities to smartphone users. As a result, the adoption of such technologies, tools, software, and applications could reduce the number of display and search advertisements that we are able to deliver and/or our ability to deliver Internet-based advertising and this, in turn, could reduce our results of operations.
Interruptions, failures or defects in our data collection systems, as well as privacy concerns and regulatory changes or enforcement actions affecting us or our data partners’ ability to collect user data, could also limit our ability to analyze data from, and thereby optimize, our clients’ marketing campaigns. If our access to data is limited in the future, we may be unable to provide effective technologies and services to clients and may lose clients and revenue.
As a creator and a distributor of Internet content, we face potential liability and expenses for legal claims based on the nature and content of the materials that we create or distribute. If we are required to pay damages or expenses in connection with these legal claims, our results of operations and business may be harmed.
We display original content and third-party content on our websites and in our marketing messages. As a result, we face potential liability based on a variety of theories, including defamation, negligence, deceptive advertising, copyright or trademark infringement. We are also exposed to risk that content provided by third parties is inaccurate or misleading, and for material posted to our websites by users and other third parties. These claims could divert management time and attention away from our business and result in
22
significant costs to investigate and defend, regardless of the merit of these claims. In addition, if we become subject to these types of claims and are not successful in our defense, we may be forced to pay substantial damages.
We could lose clients if we fail to detect click-through or other fraud on advertisements in a manner that is acceptable to our clients.
We are exposed to the risk of fraudulent clicks or actions on our websites or our third-party publishers’ websites, which could lead our clients to become dissatisfied with our campaigns, and in turn, lead to loss of clients and related revenue. Click-through fraud occurs when an individual click on an ad displayed on a website, or an automated system is used to create such clicks, with the intent of generating the revenue share payment to the publisher rather than viewing the underlying content. Action fraud occurs when online lead forms are completed with false or fictitious information in an effort to increase a publisher’s compensable actions. From time to time, we have experienced fraudulent clicks or actions. We do not charge our clients for fraudulent clicks or actions when they are detected, and such fraudulent activities could negatively affect our profitability or harm our reputation. If fraudulent clicks or actions are not detected, the affected clients may experience a reduced return on their investment in our marketing programs, which could lead the clients to become dissatisfied with our campaigns, and in turn, lead to loss of clients and related revenue. Additionally, we have, from time to time, had to, and in the future may have to, terminate relationships with publishers who we believe to have engaged in fraud. Termination of such relationships entails a loss of revenue associated with the legitimate actions or clicks generated by such publishers.
Risks Related to Our Common Stock
Our stock price has been and may continue to be volatile, and the value of an investment in our common stock may decline.
The trading price of our common stock has been and is likely to continue to be highly volatile and could be subject to wide fluctuations in response to various factors, some of which are beyond our control. These factors could include:
|
• |
additions or departures of key personnel; |
|
• |
changes in governmental regulations or in the status of our regulatory approvals; |
|
• |
changes in earnings estimates or recommendations by securities analysts; |
|
• |
any major change in our board or management; |
|
• |
general economic conditions and slow or negative growth of our markets; and |
|
• |
political instability, natural disasters, war and/or events of terrorism. |
From time to time, we estimate the timing of the accomplishment of various commercial and other product development goals or milestones. Also, from time to time, we expect that we will publicly announce the anticipated timing of some of these milestones. All of these milestones are based on a variety of assumptions. The actual timing of these milestones can vary dramatically compared to our estimates, in some cases for reasons beyond our control. If we do not meet these milestones as publicly announced, our stock price may decline.
In addition, the stock market has experienced extreme price and volume fluctuations that have often been unrelated or disproportionate to the operating performance of publicly traded companies. Broad market and industry factors may seriously affect the market price of companies’ stock, including ours, regardless of actual operating performance. These fluctuations may be even more pronounced in the trading market for our stock. In addition, in the past, following periods of volatility in the overall market and the market price of a particular company’s securities, securities class action litigation has often been instituted against these companies. This litigation, if instituted against us, could result in substantial costs and a diversion of our management’s attention and resources.
Future issuances of shares of our common stock in connection with acquisitions or pursuant to our stock incentive plans could have a dilutive effect on your investment.
During 2015, 2016 and through the date hereof, we issued 47,120,841 shares of our common stock in connection with acquisitions, vesting of awards made under our 2008 Share Incentive Plan and our 2015 Stock Incentive Plan (the "Plans" collectively), or for other business purposes, as well as an additional 16,866,696 shares underlying awards made under the Plans and other compensatory arrangements that will vest and deliver through 2019. In addition, in connection with our acquisition of Q Interactive, we may issue additional shares of common stock (the “Q Interactive Earnout Shares”) if Q Interactive achieves an earn-out target, which, as of December 31, 2016, would be 2,730,489 shares. Based on management’s assessment, we conclude that it is extremely likely that Q Interactive will meet the Earn-out Target. Future acquisitions may involve the issuance of our common stock as payment, in part or in
23
full, for the business or assets acquired. The benefits derived by us from an acquisition might not exceed the dilutive effect of the acquisition. Pursuant to the Plans, our board of directors may grant stock options, restricted stock units (“RSUs”), or other equity awards to our directors and employees. When these awards vest or are exercised, the issuance of shares of common stock underlying these awards may have a dilutive effect on our common stock.
The concentration of our stock ownership may limit individual stockholder ability to influence corporate matters.
As of December 31, 2016, officers and directors of the Company and its affiliates owned 64% of the Company’s common stock on a fully diluted basis. As a result, these stockholders may be in a position to exert significant influence over all matters requiring stockholder approval, including the election of directors and determination of significant corporate actions. The interests of these stockholders may not always coincide with the interests of other stockholders, and these stockholders may act in a manner that advances their interests and not necessarily those of other stockholders, and might affect the prevailing market price for our securities.
In addition, the Company has entered into a Stockholders’ Agreement (the “Stockholders’ Agreement”), with certain officers and directors of the Company and its affiliates, solely in their respective capacities as stockholders of the Company. Under the Stockholders’ Agreement, the parties thereto agreed to vote in a certain manner on specified matters, including an agreement to vote in favor of each party’s duly approved nominees for the Board.
We expect that we may need additional capital in the future; however, such capital may not be available to us on reasonable terms, if at all, when or as we require additional funding. If we issue additional shares of our common stock or other securities that may be convertible into, or exercisable or exchangeable for, our common stock, our existing stockholders would experience further dilution.
Although we expect that we may need additional capital in the future, we cannot be certain that it will be available to us on acceptable terms when required, or at all. Disruptions in the global equity and credit markets may limit our ability to access capital. To the extent that we raise additional funds by issuing equity securities, our shareholders would experience dilution, which may be significant and could cause the market price of our common stock to decline significantly. Any debt financing, if available, may restrict our operations. If we are unable to raise additional capital when required or on acceptable terms, we may have to significantly delay, scale back or discontinue certain operations. Any of these events could significantly harm our business and prospects and could cause our stock price to decline.
None.
cogint’s headquarters are located at 2650 North Military Trail, Suite 300, Boca Raton, Florida 33431, where it leases 25,315 rentable square feet of office space in accordance with a 91-month lease entered into in December 2014, and the subsequent first amendment, effective in January 2017, to the lease agreement. Our Fluent offices are located at 33 Whitehall Street, New York, New York 10004 where we lease 16,889 rentable square feet of office space under a sublease which expires on November 30, 2017. Fluent is actively exploring options to find suitable space when its sublease expires.
Other than as described below, the Company is not currently a party to any legal proceeding, investigation or claim which, in the opinion of the management, is likely to have a material adverse effect on the business, financial condition, results of operations or cash flows. Legal fees associated with such legal proceedings, are expensed as incurred. For capitalized Purchased IP litigation costs, the Company has written off the balance into the operating expenses as write-off of intangible assets during the year ended December 31, 2016. We review legal proceedings and claims on an ongoing basis and follow appropriate accounting guidance, including ASC 450, when making accrual and disclosure decisions. We establish accruals for those contingencies where the incurrence of a loss is probable and can be reasonably estimated, and we disclose the amount accrued and the amount of a reasonably possible loss in excess of the amount accrued, if such disclosure is necessary for our financial statements to not be misleading. To estimate whether a loss contingency should be accrued by a charge to income, we evaluate, among other factors, the degree of probability of an unfavorable outcome and the ability to make a reasonable estimate of the amount of the loss. We do not record liabilities when the likelihood that the liability has been incurred is probable, but the amount cannot be reasonably estimated. Based upon present information, we
24
determined that there were no matters that required an accrual as of the balance sheet date, December 31, 2016. The Company estimates that adverse rulings in pending litigation matters could result in a possible loss of between $3.0 million and $6.0 million.
On October 27, 2014, TransUnion Risk and Alternative Data Solutions, Inc. (“TRADS”) filed a Complaint for Declaratory Judgment against Interactive Data, among other parties, in the U.S. Bankruptcy Court, Southern District of Florida (the “Court”), regarding a dispute over ownership of certain intellectual property to which both TRADS and Company subsidiary TBO have asserted competing ownership claims. TBO asserted that it purchased this intellectual property from Ole Poulsen (“Poulsen”), the Company’s Chief Science Officer (“Purchased IP”). TRADS has since dropped Interactive Data as a party, and added TBO and Ole Poulsen. On June 10, 2015, over TRADS’ objections, the Court granted TBO’s motion to expand the scope of discovery to include, among other things, whether TRADS is a good faith purchaser of any of the Purchased IP, free of any fraud or misconduct by or on behalf of TRADS, and whether there was a fraud on the Court by TRADS. On February 22, 2016, TBO and Mr. Poulsen filed a motion for summary judgment seeking judgment in their favor on all claims based upon, among other things, TRADS having committed a fraud on the Court. On April 20, 2016, the Court denied the motion for summary judgment. Trial took place on May 16 and 17, 2016 and June 15, 22-24 and 27, 2016. The parties submitted post-trial memoranda to the Court on July 12, 2016.
On August 18, 2016, the Court entered a trial order (“Trial Order”) and final judgment (the “Final Judgment”) in favor of TRADS finding the Purchased IP is owned by TRADS, and ordering the Company, TBO and Poulsen to turn over all copies of the Purchased IP in their possession. The Court also ordered the Company and TBO to pay TRADS’ attorneys’ fees and costs, in an amount to be determined at a later time by the Court.
On October 7, 2016, TRADS filed a motion seeking its attorneys’ fees and costs. A preliminary hearing was initially set on this motion for October 18, 2016, and then continued until November 15, 2016. On November 15, 2016, the bankruptcy court again continued the motion to December 20, 2016 and again continued to February 15, 2017, and again continued to April 4, 2017. TBO intends to file an opposition to the attorneys’ fee motion and/or the bill of costs.
The Company, TBO and Poulsen have appealed the Court’s ruling to the United States District Court, Southern District of Florida (“Federal District Court”), and on October 11, 2016, filed a motion for stay of the Final Judgment pending appeal in the Federal District Court. By stipulation of the parties, TRADS agreed not to enforce the turnover of the Purchased IP until at least October 27, 2016, while the stay motion was briefed. On October 25, 2016, the Company, TBO and Poulsen filed an emergency motion for an interim stay of the Final Judgment until the stay motion filed October 11, 2016 could be resolved. The Federal District Court granted the interim stay and on November 8, 2016 held a hearing on whether to keep the stay in effect while the appeal is pending. On December 14, 2016, the Federal District Court denied TBO and Poulsen’s motion for stay of the final judgment pending appeal, however, the judge stayed the effectiveness of that order for seven days to allow TBO to appeal the stay ruling to the Eleventh Circuit Court of Appeals. The order further provided that the effectiveness of the order would be further delayed until the Eleventh Circuit Court of Appeals ruled on a request for stay. In December 2016, the Company, TBO and Poulsen filed notices of appeal to the Eleventh Circuit Court of Appeals seeking review of the District Court’s orders denying their motions for stay pending appeal. TRADS moved to dismiss the appeal of the stay ruling to the Eleventh Circuit for lack of jurisdiction. On February 28, 2017, the Eleventh Circuit ruled that while it did not have jurisdiction over the appeals, before the district court finally adjudicated the appeals, it had inherent power to consider the stay motions. The Eleventh Circuit denied the stay motions but ruled that the Company “has established that it has strong likelihood of succeeding in its argument that the judgment incorrectly identifies it as The Best One, Inc.’s legal successor entity…” TBO and Poulsen have complied with the orders, with Poulsen turning over the Purchased IP to TRADS. The Eleventh Circuit returned the case to the District Court until completion of the appeal before that court.
As a result of the Trial Order and Final Judgment, as of September 30, 2016, the Company has written off $4.1 million of intangible assets for both the Purchased IP and capitalized legal costs incurred and paid in defending the claims. An adverse ruling on the award of attorneys’ fees and costs could have an immediate near-term impact on the Company’s financial position, results of operations, and liquidity. As of the date hereof, this case is ongoing.
On October 23, 2014, TRADS filed a Complaint and Motion for Temporary Injunction, in the Fifteenth Judicial Circuit Court in and for Palm Beach County, Florida, against James Reilly, then President and Chief Operating Officer of the Company, seeking relief for alleged violation of a noncompetition agreement. On February 5, 2015, after the presentation of TRADS’ case, the court denied TRADS’ motion for a temporary injunction to prohibit Mr. Reilly from continuing employment with TBO. TRADS appealed that order, and on December 2, 2015, the Fourth District Court of Appeal reversed the order denying the temporary injunction and remanded for Mr. Reilly to present his case opposing the preliminary injunction. The evidentiary hearing on TRADS’ motion took place on May 4 and 5, 2016. On July 1, 2016, a temporary injunction was entered against Mr. Reilly. On July 15, 2016, Mr. Reilly filed a notice of appeal, appealing the trial court’s injunction order to the Fourth District Court of Appeal. On October 3, 2016, Mr. Reilly filed an answer, affirmative defenses, and counterclaim asserting claims against TRADS for fraudulent and negligent misrepresentation. TRADS responded to the counterclaim on November 16, 2016 by filing a motion to dismiss. On October 5, 2016, the Fourth District Court of Appeal affirmed the trial court’s injunction order. On February 17, 2017, the court heard TRADS’ motion
25
to dismiss, granted the motion without prejudice, and gave leave to Mr. Reilly to amend his answer, affirmative defenses, and counterclaim alleging TRADS’ fraudulent and negligent misrepresentation. On February 28, 2017, Mr. Reilly filed a motion to amend the temporary injunction. That motion was heard by the court on March 9, 2017. The court has not yet ruled on that motion. Mr. Reilly filed his amended answer, affirmative defenses and counterclaim on March 6, 2017. TRADS’ response to the counterclaim is due on March 21, 2017. An adverse ruling could have an immediate near-term impact on the Company’s financial position, results of operations, and liquidity. As of the date of this report, this case is ongoing.
On July 28, 2015, TRADS filed a Complaint and Motion for Preliminary Injunction in the United States District Court, Southern District of Florida, against Surya Challa, former Vice President of Technology of TBO, seeking relief for an alleged violation of a noncompetition agreement. The hearing on TRADS’ Motion for Preliminary Injunction was held on February 19, 2016. On March 23, 2016, the court denied TRADS’ motion for preliminary injunction. On April 22, 2016, TRADS filed a notice of appeal seeking review of the trial court’s order denying the motion for preliminary injunction. On September 23, 2016, the district court judge entered an order staying the case pending appeal. On December 16, 2016, Challa filed a motion to dismiss the appeal as moot because he is no longer employed by the Company. On January 12, 2017, the Eleventh Circuit Court of Appeals issued an opinion affirming the district court’s order denying TRADS’ motion for preliminary injunction. The Eleventh Circuit also denied Challa’s motion to dismiss the appeal as moot. Trial is scheduled during the two-week period commencing May 15, 2017. As of the date of this report, this case is ongoing. An adverse ruling could have an immediate near-term impact on the Company’s financial position, results of operations, and liquidity.
On August 10, 2016, the Company filed a lawsuit against TransUnion and related parties alleging tortious interference with its prospective business relationship with Datamyx, LLC (“Datamyx”). The complaint was amended on October 18, 2016. The Company alleges that it was in negotiations to acquire Datamyx, and a definitive transaction was imminent, when TransUnion interfered with the proposed Datamyx acquisition solely as an act of malice in order to damage the Company. As a result of the interference, Datamyx abruptly terminated negotiations with the Company and was ultimately acquired by another suitor. As of the date hereof, this case is ongoing.
The Company has been made aware of a lawsuit filed by TRADS against the Company alleging trademark infringement. As of the filing date of this 2016 Form 10-K, the Company has not been served with such lawsuit.
In addition to the foregoing, we may be involved in litigation from time to time in the ordinary course of business. We do not believe that the ultimate resolution of any such matters will have a material adverse effect on our business, financial condition, results of operations or cash flows. However, the results of such matters cannot be predicted with certainty and we cannot assure you that the ultimate resolution of any legal or administrative proceeding or dispute will not have a material adverse effect on our business, financial condition, results of operations and cash flows.
Not Applicable.
26
|
ITEM 5. |
MARKET FOR REGISTRANT’S COMMON EQUITY, RELATED STOCKHOLDER MATTERS AND ISSUER PURCHASES OF EQUITY SECURITIES. |
Our common stock is listed on The NASDAQ Global Market (the “NASDAQ”) under the symbol “COGT.” Before September 26, 2016, our common stock was listed on the NYSE MKT under the symbol “IDI.” On March 19, 2015, we effected a one-for-five reverse split of our issued and outstanding common stock (“Reverse Stock Split”). Trading of our common stock on a post-Reverse Stock Split adjusted basis began at the opening of business on the morning of March 20, 2015. All historic share and per share information, including earnings per share, in this 2016 Form 10-K have been adjusted to reflect the Reverse Stock Split. The table below sets forth, for the respective periods indicated, the high and low prices for our common stock as reported on the NASDAQ and NYSE MKT, as applicable.
|
|
|
Bid Prices |
|
|||||
|
|
|
High |
|
|
Low |
|
||
|
2016 |
|
|
|
|
|
|
|
|
|
First Quarter |
|
$ |
7.34 |
|
|
$ |
3.78 |
|
|
Second Quarter |
|
$ |
5.92 |
|
|
$ |
4.23 |
|
|
Third Quarter |
|
$ |
6.22 |
|
|
$ |
4.50 |
|
|
Fourth Quarter |
|
$ |
5.25 |
|
|
$ |
2.90 |
|
|
2015 |
|
|
|
|
|
|
|
|
|
First Quarter |
|
$ |
7.48 |
|
|
$ |
3.75 |
|
|
Second Quarter |
|
$ |
11.75 |
|
|
$ |
6.10 |
|
|
Third Quarter |
|
$ |
12.80 |
|
|
$ |
5.14 |
|
|
Fourth Quarter |
|
$ |
10.71 |
|
|
$ |
5.75 |
|
We paid no dividends or made any other distributions in respect of our common stock during our fiscal years ended December 31, 2016 and 2015, and we have no plans to pay any dividends or make any other distributions in the future. Our Credit Agreement prohibits us from paying dividends on our equity securities, other than dividends on common stock which accrue (but are not paid in cash) or are paid in kind, or dividends on preferred stock which accrue (but are not paid in cash) or are paid in kind.
On March 6, 2017, the closing price of our common stock was $3.55 per share as reported on the NASDAQ. As of March 6, 2017, there were 53,792,218 shares of our common stock issued and outstanding. As of March 6, 2017, there were 106 record holders of our common stock.
Performance Graph
The following graph and table track the return on our common stock with that of the NASDAQ Composite Index and the NASDAQ Computer & Data Processing Index (the "2016 Indices") for the five years ended December 31, 2016, other than for the NYSE Arca Technology Index as noted below. As a result of our move during 2016 from the NYSE MKT to the NASDAQ Global Market, we have changed the indices used in this graph and table since our Annual Report on Form 10-K for the year ended December 31, 2015 (the "2015 Form 10-K"), we have included data from the indices used in the 2015 Form 10-K, which were the NYSE Composite Index and the NYSE Arca Technology Index (the “2015 Indices”) along with data from the 2016 Indices. The data assumes the value of the investment in our common stock, and the 2015 and 2016 Indices was $100 on January 1, 2012 and that all dividends were reinvested. Information relating to the NYSE Arca Technology Index was through December 31, 2015, the last date the information was easily accessible and widely recognized. The information reflected in the graph and table is not intended to forecast future performance of our common stock and may not be indicative of future performance.
27
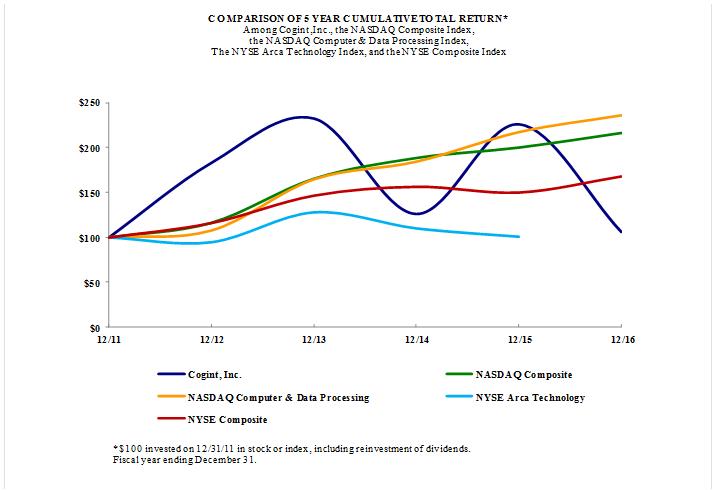
|
|
|
12/11 |
|
|
12/12 |
|
|
12/13 |
|
|
12/14 |
|
|
12/15 |
|
|
12/16 |
|
||||||
|
Cogint, Inc. |
|
|
100.00 |
|
|
|
182.89 |
|
|
|
232.31 |
|
|
|
126.15 |
|
|
|
225.85 |
|
|
|
106.15 |
|
|
NASDAQ Composite |
|
|
100.00 |
|
|
|
116.41 |
|
|
|
165.47 |
|
|
|
188.69 |
|
|
|
200.32 |
|
|
|
216.54 |
|
|
NASDAQ Computer & Data Processing |
|
|
100.00 |
|
|
|
107.40 |
|
|
|
164.63 |
|
|
|
184.38 |
|
|
|
217.43 |
|
|
|
236.23 |
|
|
NYSE Arca Technology |
|
|
100.00 |
|
|
|
94.56 |
|
|
|
127.83 |
|
|
|
110.05 |
|
|
|
100.74 |
|
|
|
|
|
|
NYSE Composite |
|
|
100.00 |
|
|
|
115.99 |
|
|
|
146.47 |
|
|
|
156.36 |
|
|
|
149.97 |
|
|
|
167.87 |
|
Recent Sale of Unregistered Securities
On December 15, 2016, we issued 200,000 shares previously held in treasury to Monroe Capital, LLC. These treasury shares represented the net shares withheld from vested and delivered RSUs previously granted to certain employees of the Company. The shares were sold at a price of $3.00 per share, the proceeds of which were used to pay employee withholding taxes, in a private placement exempt from registration pursuant to Section 4(a)(2) of the Securities Act of 1933, as amended, and Regulation D thereunder.
Securities Authorized for Issuance Under Equity Compensation Plans
The following table summarizes compensation plans under which our equity securities are authorized for issuance as of December 31, 2016.
28
|
|
|
|
|
|
|
|
|
|
Number of securities |
|
||
|
|
|
|
|
|
|
|
|
|
|
remaining available |
|
|
|
|
|
|
|
|
|
|
|
|
|
for future issuance |
|
|
|
|
|
Number of securities to |
|
|
Weighted-average |
|
|
under equity |
|
|||
|
|
|
be issued upon exercise |
|
|
exercise price of |
|
|
compensation plans |
|
|||
|
|
|
of outstanding options, |
|
|
outstanding options, |
|
|
(excluding securities |
|
|||
|
|
|
warrants and rights |
|
|
warrants and rights (1) |
|
|
reflected in column (a)) |
|
|||
|
Plan category |
|
(a) |
|
|
(b) |
|
|
(c) |
|
|||
|
Equity compensation plans approved by security holders |
|
|
6,880,030 |
|
|
$ |
10.25 |
|
|
|
5,736,310 |
|
|
Equity compensation plans not approved by security holders |
|
|
- |
|
|
|
- |
|
|
|
- |
|
|
Total |
|
|
6,880,030 |
|
|
$ |
10.25 |
|
|
|
5,736,310 |
|
|
(1) |
The weighted-average exercise price does not reflect the shares that will be issued in connection with the vesting of RSUs, since RSUs have no exercise price. |
ITEM 6.SELECTED FINANCIAL DATA.
The following selected consolidated financial data should be read in conjunction with the consolidated financial statements and notes thereto and “Management’s Discussion and Analysis of Financial Condition and Results of Operations” appearing elsewhere in this 2016 Form 10-K. The fiscal year financial information included in the table below is derived from our audited consolidated financial statements. Historical results are not necessarily indicative of future results.
|
|
|
Year Ended December 31, |
|
|||||||||
|
(In thousands, except share and per share data) |
|
2016 |
|
|
2015 (1) |
|
|
2014 (2) |
|
|||
|
Statements of Operations: |
|
|
|
|
|
|
|
|
|
|
|
|
|
Revenue |
|
$ |
186,836 |
|
|
$ |
14,091 |
|
|
$ |
817 |
|
|
Loss from operations |
|
$ |
(34,038 |
) |
|
$ |
(44,400 |
) |
|
$ |
(777 |
) |
|
Net loss from continuing operations |
|
$ |
(29,086 |
) |
|
$ |
(42,585 |
) |
|
$ |
(610 |
) |
|
Net loss from discontinued operations attributable to cogint |
|
$ |
- |
|
|
$ |
(41,950 |
) |
|
$ |
- |
|
|
Net loss attributable to cogint |
|
$ |
(29,086 |
) |
|
$ |
(84,535 |
) |
|
$ |
(610 |
) |
|
Basic and diluted loss per share (3) |
|
|
|
|
|
|
|
|
|
|
|
|
|
Continuing operations |
|
$ |
(0.65 |
) |
|
$ |
(3.27 |
) |
|
$ |
(0.14 |
) |
|
Discontinued operations |
|
|
- |
|
|
|
(3.22 |
) |
|
|
- |
|
|
|
|
$ |
(0.65 |
) |
|
$ |
(6.48 |
) |
|
$ |
(0.14 |
) |
|
Weighted average shares used in computation of loss per share - Basic and diluted |
|
|
44,536,906 |
|
|
|
13,036,082 |
|
|
|
4,501,041 |
|
|
Statements of Cash Flows: |
|
|
|
|
|
|
|
|
|
|
|
|
|
Net cash provided by (used in) operating activities |
|
|
2,099 |
|
|
|
(10,673 |
) |
|
|
(474 |
) |
|
(1) |
Financial data of Fluent, LLC, a subsidiary acquired by the Company on December 8, 2015, for the period from December 9, 2015 to December 31, 2015 were included in the Consolidated Statements of Operations. |
|
(2) |
As IDI Holdings, LLC, the accounting acquirer of the merger consummated effective as of March 21, 2015, was incorporated on September 22, 2014, the comparative figures for the year ended December 31, 2014 were from the date of inception through December 31, 2014. |
|
(3) |
Loss per share tables may contain summation differences due to rounding. |
|
|
|
December 31, |
|
|||||||||
|
(In thousands) |
|
2016 |
|
|
2015 |
|
|
2014 |
|
|||
|
Balance sheets: |
|
|
|
|
|
|
|
|
|
|
|
|
|
Total assets |
|
$ |
311,911 |
|
|
$ |
289,192 |
|
|
$ |
13,315 |
|
|
Long-term debt, net, including promissory notes payable to certain shareholders, net |
|
$ |
45,878 |
|
|
$ |
48,668 |
|
|
$ |
- |
|
|
Total shareholders' equity |
|
$ |
229,649 |
|
|
$ |
205,895 |
|
|
$ |
12,107 |
|
29
|
|
|
Year Ended December 31, |
|
|||||||||
|
(In thousands) |
|
2016 |
|
|
2015 |
|
|
2014 |
|
|||
|
Adjusted EBITDA (1) |
|
|
|
|
|
|
|
|
|
|
|
|
|
Adjusted EBITDA |
|
$ |
14,973 |
|
|
$ |
(6,648 |
) |
|
$ |
(390 |
) |
|
(1) |
See “Use of Non-GAAP Financial Measures” set forth in Item 7, “Management’s Discussion and Analysis of Financial Conditions and Results of Operations,” for a discussion of our use of adjusted EBITDA and a reconciliation to net loss, the most directly comparable GAAP financial measure. |
30
You should read the following discussion in conjunction with our consolidated financial statements and related notes included in this Annual Report on Form 10-K (“2016 Form 10-K”). This 2016 Form 10-K contains certain forward-looking statements within the meaning of the Private Securities Litigation Reform Act of 1995 (“PSLRA”), Section 27A of the Securities Act of 1933, as amended (the “Securities Act”), and Section 21E of the Securities Exchange Act of 1934, as amended, (the “Exchange Act”), about our expectations, beliefs, or intentions regarding our business, financial condition, results of operations, strategies, or prospects. You can identify forward-looking statements by the fact that these statements do not relate strictly to historical or current matters. Rather, forward-looking statements relate to anticipated or expected events, activities, trends, or results as of the date they are made. Because forward-looking statements relate to matters that have not yet occurred, these statements are inherently subject to risks and uncertainties that could cause our actual results to differ materially from any future results expressed or implied by the forward-looking statements. Many factors could cause our actual activities or results to differ materially from the activities and results anticipated in forward-looking statements. These factors include those contained in Part I, “Item 1A. Risk Factors” of this 2016 Form 10-K. We do not undertake any obligation to update forward-looking statements, except as required by law. We intend that all forward-looking statements be subject to the safe harbor provisions of PSLRA. These forward-looking statements are only predictions and reflect our views as of the date they are made with respect to future events and financial performance.
Overview
Cogint, Inc. (“we,” “us,” “our,” “cogint,” or the “Company”), formerly known as IDI, Inc., a Delaware corporation, is a data and analytics company providing cloud-based mission-critical information and performance marketing solutions to enterprises in a variety of industries. cogint’s mission is to transform data into intelligence utilizing our proprietary technology platforms to solve complex problems for our clients. Harnessing the power of data fusion and powerful analytics, we transform data into intelligence, in a fast and efficient manner, so that our clients can spend their time on what matters most, running their organizations with confidence. Through our intelligent platforms, CORETM and Agile Audience EngineTM, we uncover the relevance of disparate data points to deliver end-to-end, ROI-driven results for our customers. Our analytical capabilities enable us to build comprehensive datasets in real-time and provide insightful views of people, businesses, assets and their interrelationships. We empower clients across markets and industries to better execute all aspects of their business, from managing risk, identifying fraud and abuse, ensuring legislative compliance, and debt recovery, to identifying and acquiring new customers. With the goal of reducing the cost of doing business and enhancing the consumer experience, our solutions enable our clients to optimize overall decision-making and to have a holistic view of their customers.
We provide unique and compelling solutions essential to the daily workflow of organizations within both the public and private sectors. Our cloud-based data fusion and customer acquisition technology platforms, combined with our massive database consisting of public-record, proprietary and publicly-available data, as well as a unique repository of self-reported information on millions of consumers, enables the delivery of differentiated products and solutions used for a variety of essential functions throughout the customer life cycle. These essential functions include customer identification and authentication, investigation and validation, and customer acquisition and retention.
The Company operates through two reportable segments: (i) Information Services and (ii) Performance Marketing. For additional information relating to our segments, see Note 16, “Segment Information,” in our Notes to Consolidated Financial Statements.
Information Services—Leveraging leading-edge technology, proprietary algorithms, and massive datasets, and through intuitive and powerful analytical applications, we provide solutions to organizations within the risk management and consumer marketing industries. CORE is our next generation data fusion platform, providing mission-critical information about individuals, businesses and assets to a variety of markets and industries. Through machine learning and advanced analytics, our Information Services segment uses the power of data fusion to ingest and analyze data at a massive scale. The derived information from the data fusion process ultimately serves to generate unique solutions for banking and financial services companies, insurance companies, healthcare companies, law enforcement and government, the collection industry, law firms, retail, telecommunications companies, corporate security and investigative firms. In addition, our data acquisition solutions enable clients to rapidly grow their customer databases by using self-declared consumer insights to identify, connect with, and acquire first-party consumer data and multi-channel marketing consent at massive scale.
Built in a secure Payment Card Industry (PCI) compliant environment, our cloud-based next generation technology delivers greater than four 9s of service uptime. By leveraging our proprietary infrastructure design within the cloud, we currently operate in six datacenters spread geographically across the U.S. and are able to dynamically and seamlessly scale as needed. Using our intelligent
31
framework and leveraging a micro services architecture where appropriate, we reduce operational cost and complexity, thus delivering superior performance at greatly reduced costs compared to traditional datacenter architectures. Since the release of our CORE platform in May 2016, we have added billions of data records and continue to add approximately over a billion records per month on average. Our average query response time for a comprehensive profile is less than 250 milliseconds versus competitive platforms that measure comprehensive profile response times in seconds.
Performance Marketing—Our Agile Audience Engine drives our Performance Marketing segment, which provides solutions to help brands, advertisers and marketers find the right customers in every major business-to-consumer (B2C) vertical, including internet and telecommunications, financial services, health and wellness, consumer packaged goods, careers and education, and retail and entertainment. We deterministically target consumers across various marketing channels and devices, through the user- supplied acquisition of personally identifiable information on behalf of our clients, such as email addresses, other identifying information and responses to dynamically-populated survey questions. Additionally, 80% of our consumer interaction comes from mobile, a highly-differentiated characteristic compared to our competitors whose platforms are not mobile-first.
We own hundreds of media properties, through which we engage millions of consumers everyday with interactive content, such as job postings, cost savings, surveys, promotions and sweepstakes that generate over 800,000 registrations and over 7.5 million compiled survey responses a day. Our owned media properties alone have created a database of approximately 130 million U.S. adults with detailed profiles, including 224 million unique email addresses, across over 75 million households. With meaningful, people-based interaction that focuses on consumer behavior and declared first-party data, leveraged on a mobile-centric platform that provides seamless omni-channel capabilities, we have the ability to target and develop comprehensive consumer profiles that redefine the way advertisers view their most valuable customers.
Previously, we provided advertising services in the out-of-home advertising industry in China under the name Tiger Media, Inc. (“Tiger Media”). On March 21, 2015, Tiger Media completed the acquisition of The Best One, Inc. (“TBO”). In the transaction, TBO became a wholly owned subsidiary of Tiger Media, with TBO changing its name to IDI Holdings, LLC and Tiger Media changing its name to IDI, Inc, now known as Cogint, Inc. TBO was a holding company engaged in the acquisition of operating businesses and the acquisition and development of technology assets across various industries. Previously, on October 2, 2014, TBO acquired 100% of the membership interests of Interactive Data, LLC (“Interactive Data”). Historically, Interactive Data provided data solutions and services to the Accounts Receivable Management industry, consisting primarily of collection agencies, collection law firms, and debt buyers, for location and identity verification, legislative compliance and debt recovery. Interactive Data now serves the entirety of the risk management industry. Through leading-edge, proprietary technology, advanced systems architecture, and a massive data repository, Interactive Data addresses the rapidly growing need for actionable intelligence.
On December 9, 2015, we completed the acquisition of Fluent, LLC (“Fluent”) with certain transactions effective December 8, 2015 (the “Fluent Acquisition”). Fluent, founded in 2010, is a leader in people-based digital marketing and customer acquisition, serving over 500 leading consumer brands and direct marketers. Fluent’s proprietary audience data and robust ad-serving technology enables marketers to acquire their best customers, with precision, at a massive scale. Leveraging compelling content, unique first-party data assets, and real-time survey interaction with customers, Fluent has helped marketers acquire millions of new prospective customers since its inception.
On June 8, 2016, we acquired Q Interactive (“Q Interactive”) (the “Q Interactive Acquisition”), a subsidiary of Selling Source, LLC. Q Interactive was founded in 1994 as Interactive Coupon Marketing Group and provides performance based digital marketing solutions for advertisers and publishers. We believe the acquisition of Q Interactive is in line with our strategy to bolster our market leadership in performance marketing by adding client relationships as well as technology capabilities.
On September 14, 2016, we issued a press release announcing a transfer from the NYSE MKT to The NASDAQ Global Market (the “NASDAQ”) on September 26, 2016 under a new symbol “COGT” and rebranding to a new name, Cogint, Inc. We believe a listing on the NASDAQ and rebranding under Cogint, Inc. better reflects our commitment and expertise in driving technology innovations in order to shape the future of the data fusion industry.
In order for the Company to continue to develop new products, grow its existing business and expand into additional markets, we must generate and sustain sufficient operating profits and cash flow in future periods. This will require us to generate additional sales from current products and new products currently under development. We have begun building out our sales organization to drive current products and to introduce new products into the market place. We will incur increased compensation expenses for our sales and marketing, executive and administrative, and infrastructure related persons as we increase headcount in the next 12 months.
32
Industry Trends and Uncertainties
Operating results are affected by the following factors that impact the big data and analytics sector in the United States:
|
|
• |
The macroeconomic conditions, including the availability of affordable credit and capital, interest rates, inflation, employment levels and consumer confidence, influences our revenues. Macroeconomic conditions also have a direct impact on overall technology, marketing and advertising expenditures in the U.S. As marketing budgets are often more discretionary in nature, they are easier to reduce in the short term as compared to other corporate expenses. Future widespread economic slowdowns in any of the industries or markets our clients serve could reduce the technology and marketing expenditures of our clients and prospective customers. |
|
|
• |
Our revenues are also significantly influenced by industry trends, including the demand for business analytics services in the industries we serve. Companies are increasingly relying on business analytics and big-data technologies to help process data in a cost-efficient manner. As customers have gained the ability to rapidly aggregate data generated by their own activities, they are increasingly expecting access to real-time data and analytics from their service providers as well as solutions that fully integrate into their workflows. The increasing number and complexity of regulations centered around data and provision of information services makes operations for businesses in the big data and analytic sector more challenging. |
|
|
• |
The enactment of new or amended legislation or industry regulations pertaining to consumer or private sector privacy issues could have a material adverse impact on information and marketing services. Legislation or industry regulations regarding consumer or private sector privacy issues could place restrictions upon the collection, sharing and use of information that is currently legally available, which could materially increase our cost of collecting and maintaining some data. These types of legislation or industry regulations could also prohibit us from collecting or disseminating certain types of data, which could adversely affect our ability to meet our clients’ requirements and our profitability and cash flow targets. |
Company Specific Trends and Uncertainties
Our operating results are also directly affected by company-specific factors, including the following:
|
|
• |
Some of our competitors have substantially greater financial, technical, sales and marketing resources, better name recognition and a larger customer base. Even if we introduce advanced products that meet evolving customer requirements in a timely manner, there can be no assurance that our new products will gain market acceptance. |
|
|
• |
Certain companies in the big data and analytics sector have expanded their product lines or technologies in recent years as a result of acquisitions. Further, more companies have developed products which conform to existing and emerging industry standards and have sought to compete on the basis of price. We anticipate increased competition from large data and analytics vendors. Increased competition in the big data and analytics sector could result in significant price competition, reduced profit margins or loss of market share, any of which could have a material adverse effect on our business, operating results and financial condition. There can be no assurance that we will be able to compete successfully in the future with current or new competitors. |
Critical Accounting Policies and Estimates
Management’s discussion and analysis of financial condition and results of operations are based upon cogint’s consolidated financial statements, which have been prepared in accordance with accounting principles generally accepted in the United States (“US GAAP”). The preparation of these financial statements requires cogint to make estimates and judgments that affect the reported amounts of assets, liabilities, revenues and expenses, and related disclosure of contingent assets and liabilities. On an ongoing basis, cogint evaluates its estimates, including those related to the allowance for doubtful receivables, useful lives of intangible assets, recoverability of the carrying amounts of goodwill and intangible assets, accounting for business combinations, and the assessment of contingent obligations. We base our estimates on historical experience and on various other assumptions that are believed to be reasonable under the circumstances, the results of which form the basis for making judgments about the carrying values of assets and liabilities that are not readily apparent from other sources. Actual results may differ from these estimates under different assumptions or conditions.
33
We believe the following critical accounting policies govern our more significant judgments and estimates used in the preparation of our consolidated financial statements.
Revenue Recognition
We provide information services and performance marketing services, and generally recognize revenue when persuasive evidence of an arrangement exists, delivery has occurred or a service has been rendered, the price is fixed or determinable and collection is reasonably assured.
Information services revenue is generated from the risk management industry and consumer marketing industry. Information services revenue generated from the risk management industry is generally recognized on (a) a transactional basis determined by the customers’ usage, (b) a monthly fee or (c) a combination of both. Revenues pursuant to contracts containing a monthly fee are recognized ratably over the contract period, which is generally one year. Revenues pursuant to transactions determined by the customers’ usage are recognized when the transaction is complete. Information services revenue generated from the consumer marketing industry is generally recognized when related services are delivered, in accordance with terms detailed in the agreements. These terms typically call for a specific transactional unit price per record delivered based on predefined qualifying characteristics specified by the customer. These records are tracked in real time by the Company’s systems, reported, recorded, and regularly reconciled against advertiser data either in real time or at various contractually defined periods, whereupon the number of qualified records during such specified period are finalized and adjustments, if any, to revenue are made. Additional revenues are generated through revenue-sharing agreements with marketers who target offers to users provided by the Company from the Company’s owned and operated sites.
Performance marketing revenue is recognized when the conversions are generated based on predefined user actions (for example, a click, a registration, an app install or a coupon print) subject to certain qualifying characteristics specified by the customer, in accordance with terms detailed in advertiser agreements and/or the attendant insertion orders. These terms typically call for a specific transactional unit price per conversion generated. These conversions are tracked in real time by the Company’s systems, reported, recorded, and regularly reconciled against advertiser data either in real time or at various contractually defined periods, whereupon the number of qualified conversions during such specified period are finalized and adjustments, if any, to revenue are made.
Customer payments received in excess of the amount of revenue recognized are recorded as deferred revenue in the consolidated balance sheets, and are recognized as revenue when the services are rendered. As of December 31, 2016, deferred revenue totaled $0.3 million, all of which is expected to be realized in 2017.
The Company sells its products or provides services to customers with normal payment terms ranging from due upon receipt to 60 days. Rarely does the Company extend payment terms beyond their normal terms.
Allowances for Doubtful Accounts
The Company maintains allowance for doubtful accounts for estimated losses resulting from the inability of its customers to make required payments. Management determines whether an allowance needs to be provided for an amount due from a customer depending on the aging of the individual balances receivable, recent payment history, contractual terms and other qualitative factors such as status of business relationship with the customer. Historically, the Company’s estimates for doubtful accounts have not differed materially from actual results. The amount of the allowance for doubtful accounts was $0.8 million and $0.3 million as of December 31, 2016 and 2015, respectively.
Income Taxes
The Company applies ASC subtopic 740-10 for recording the provision for income taxes. ASC 740-10 requires the use of the asset and liability method of accounting for income taxes. Under the asset and liability method, deferred tax assets and liabilities are computed based upon the difference between the financial statement and income tax basis of assets and liabilities using the enacted tax rate applicable when the related asset or liability is expected to be realized or settled. Deferred income tax expenses or benefits are based on the changes in the asset or liability each period. If available evidence suggests that it is more likely than not that some portion or all of the deferred tax assets will not be realized, a valuation allowance is required to reduce the deferred tax assets to the amount that is more likely than not to be realized. As of December 31, 2016, the Company has a valuation allowance of $1.9 million. Future changes in such valuation allowance are included in the provision for deferred income taxes in the period of change.
The Company applies ASC Topic 740, “Income Taxes.” ASC 740 clarifies the accounting for uncertain tax positions. This interpretation requires that an entity recognizes in the consolidated financial statements the impact of a tax position, if that position is more likely than not of being sustained upon examination, based on the technical merits of the position. Recognized income tax
34
positions are measured at the largest amount that is greater than 50% likely of being realized. Changes in recognition or measurement are reflected in the period in which the change in judgment occurs. The Company’s accounting policy is to accrue interest and penalties related to uncertain tax positions, if and when required, as interest expense and a component of other expenses, respectively, in the consolidated statements of operations.
Goodwill
In accordance with ASC Topic 350, “Intangibles - Goodwill and Other,” goodwill is tested at least annually for impairment, or when events or changes in circumstances indicate that the carrying amount of such assets may not be recoverable, by assessing qualitative factors or performing a quantitative analysis in determining whether it is more likely than not that its fair value exceeds the carrying value.
On October 1, 2016, we performed a quantitative Step One assessment. A quantitative Step One assessment involved determining the fair value of each reporting unit using market participant assumptions. If we believe that the carrying value of a reporting unit with goodwill exceeds its estimated fair value, we will perform a quantitative Step Two assessment. Step Two compares the carrying value of the reporting unit to the fair value of all of the assets and liabilities of the reporting unit (including any unrecognized intangibles) as if the reporting unit was acquired in a business combination. If the carrying amount of a reporting unit’s goodwill exceeds the implied fair value of its goodwill, an impairment loss is recognized in an amount equal to the excess. The results of our Step One assessment proved that the estimated fair value of each reporting unit exceeds the carrying value, and therefore a Step Two assessment was not performed. We concluded that goodwill was not impaired as of December 31, 2016 and 2015.
For purposes of reviewing impairment and the recoverability of goodwill, we must make various assumptions regarding estimated future cash flows and other factors in determining the fair values of the reporting unit.
Impairment of long-lived assets
Finite-lived intangible assets are amortized over their respective useful lives and, along with other long-lived assets, are evaluated for impairment periodically whenever events or changes in circumstances indicate that their related carrying amounts may not be recoverable in accordance with ASC Topic 360-10-15, “Impairment or Disposal of Long-Lived Assets.” In evaluating long-lived assets for recoverability, including finite-lived intangibles and property and equipment, the Company uses its best estimate of future cash flows expected to result from the use of the asset and eventual disposition in accordance with ASC Topic 360-10-15. To the extent that estimated future undiscounted cash inflows attributable to the asset, less estimated future undiscounted cash outflows, are less than the carrying amount, an impairment loss is recognized in an amount equal to the difference between the carrying value of such asset and its fair value. Assets to be disposed of and for which there is a committed plan of disposal, whether through sale or abandonment, are reported at the lower of carrying value or fair value less costs to sell.
Asset recoverability is an area involving management judgment, requiring assessment as to whether the carrying value of assets can be supported by the undiscounted future cash flows. In calculating the future cash flows, certain assumptions are required to be made in respect of highly uncertain matters such as revenue growth rates, gross margin percentages and terminal growth rates. In September 2016, the Company wrote off the remaining balance of Purchased IP and capitalized litigation costs of $4.1 million, as a result of an unfavorable ruling in relation to a litigation matter.
Share-based Compensation
We measure share-based compensation expenses in connection with our share-based awards based on the estimated fair value of the awards on the date of grant, net of estimated forfeitures, and recognize them as compensation expenses over the service period for such awards expected to vest. Therefore, we only recognize compensation cost for those awards expected to vest over the service period of the award.
The fair value of restricted stock units (“RSUs”) is determined based on the number of shares granted and the quoted price of our common stock and fair value of share options is estimated on the date of grant using a Black-Scholes model. We estimate the forfeiture rate based on our historical experience of forfeitures. We estimate the volatility of our shares on the date of grant utilizing the historical volatility of our publicly-traded shares. We estimate the risk-free interest rate based on rates in effect for United States government bonds with terms similar to the expected terms of the stock options, at the time of grant. We estimate the expected terms by taking into account the contractual terms and historical exercise patterns. The estimated number of stock awards that will ultimately vest requires judgment, and to the extent actual results or updated estimates differ from our current estimates, such amount will be recorded as a cumulative adjustment in the period estimates are revised. Changes in our estimates and assumptions may cause us to realize material changes in share-based compensation expenses in the future.
35
We have issued share-based awards with performance-based vesting criteria. Achievement of the milestones must be probable before we begin recording share-based compensation expense. At each reporting date, we review the likelihood that these awards will vest and if the vesting is deemed probable, we begin to recognize compensation expense at that time. In the period that achievement of the performance-based criteria is deemed probable, US GAAP requires the immediate recognition of all previously unrecognized compensation since the original grant date. As a result, compensation expense recorded in the period that achievement is deemed probable could include a substantial amount of previously unrecorded compensation expense related to the prior periods. If ultimately performance goals are not met, for any share-based awards where vesting was previously deemed probable, previously recognized compensation cost will be reversed.
Recently Issued Accounting Standards
See Item 8 of Part II, “Financial Statements and Supplementary Data – Note 2. Summary of significant accounting policies - (t) Recently issued accounting standards.”
Fourth Quarter Financial Highlights
For the three months ended December 31, 2016, as compared to the three months ended December 31, 2015:
|
• |
Total revenue increased to $54.2 million from $10.8 million. |
|
• |
Information Service revenue increased to $16.2 million from $3.1 million. |
|
• |
Performance Marketing revenue increased to $38.0 million from $7.7 million. |
|
• |
Gross profit margin increased to 33% from 21%. |
|
• |
Net loss improved to $5.4 million from a net loss of $32.6 million. |
|
• |
Adjusted EBITDA improved to $6.3 million from a loss of $2.3 million. |
For the three months ended December 31, 2016, as compared to the three months ended September 30, 2016:
|
• |
Total revenue increased to $54.2 million from $52.2 million. |
|
• |
Information Service revenue increased to $16.2 million from $14.8 million. |
|
• |
Performance Marketing revenue increased to $38.0 million from $37.4 million. |
|
• |
Gross profit margin increased to 33% from 24%. |
|
• |
Net loss improved to $5.4 million from a net loss of $9.7 million. |
|
• |
Adjusted EBITDA increased to $6.3 million from $3.2 million. |
Full Year Financial Highlights
For the year ended December 31, 2016, as compared to the year ended December 31, 2015:
|
• |
Total revenue increased to $186.8 million from $14.1 million. |
|
• |
Information Service revenue increased to $55.4 million from $6.4 million. |
|
• |
Performance Marketing revenue increased to $131.4 million from $7.7 million. |
|
• |
Gross profit margin increased to 28% from 27%. |
|
• |
Net loss improved to $29.1 million from $84.5 million. |
|
• |
Net cash provided by operating activities improved to $2.1 million from net cash used in operating activities of $10.7 million. |
|
• |
Adjusted EBITDA improved to $15.0 million from a loss of $6.6 million. |
36
Within our Information Services segment:
|
• |
Leveraging our Agile Audience Engine, we now interact with over 800,000 consumers daily, generating more than 7 million consumer insights per day and 225 million insights monthly. |
|
• |
Comprehensive database includes holistic views of greater than 95% of U.S. population, including unique data assets comprising 130 million self-reported consumer profiles up from 120 million, 224 million unique email addresses up from 150 million, across 75 million households, up from 63 million households. |
|
• |
Increased demand for our targeted acquisition solutions, leveraging our unique ability to build custom audiences in real-time and deliver specific insights that support stronger ROI for our customers’ digital marketing executions. |
|
• |
idiCORE™ continues to expand in the marketplace, landing key customer wins with head-to-head data tests against our competitors, and winning on speed, accuracy and price. |
|
• |
Added thousands of users currently utilizing idiCORE in their daily workflow; these users represent a variety of industries within the risk management space, including financial services, law firms, collections, government and investigative companies. |
Within our Performance Marketing segment:
|
• |
Increased profitability resulting from the maturing of strategic growth verticals, Mobile Apps and Career & Education, optimization of media spend, and activation of new media channels utilizing our rapidly growing first-party data asset. |
|
• |
Powered by our Agile Audience Engine’s targeting capabilities, Mobile Apps generated revenue of $7.1 million in the fourth quarter 2016, a greater than 50% increase over third quarter 2016. |
|
• |
Career & Education vertical, focused on the “Gig Economy” and providing performance marketing and recruitment solutions to some of the world’s fastest growing brands in ride sharing, food and beverage delivery and home and personal care, grew revenue to $3.3 million in the fourth quarter 2016, a greater than 25% increase over third quarter 2016. |
|
• |
Increased activity on emerging mediums, delivering strong results for our clients by activating our data on new channels, including Social, Search and Programmatic, Email, Push Notifications, SMS and Call-based platforms. |
|
• |
Successful launch of our new Pay Per Call ad format, receiving positive customer feedback and indication of adoption across a range of verticals. |
Use and Reconciliation of Non-GAAP Financial Measures
Management evaluates the financial performance of our business on a variety of key indicators, including adjusted EBITDA. Adjusted EBITDA is a non-GAAP financial measure equal to net loss, the most directly comparable financial measure based on US GAAP, adding back net loss from discontinued operations, interest expense, income tax benefit, depreciation and amortization, share-based payments, and other adjustments, as noted in the tables below.
|
|
|
Year Ended December 31, |
|
|||||||||
|
(In thousands) |
|
2016 |
|
|
2015 |
|
|
2014 |
|
|||
|
Net loss attributable to cogint |
|
$ |
(29,086 |
) |
|
$ |
(84,535 |
) |
|
$ |
(610 |
) |
|
Net loss from discontinued operations attributable to cogint |
|
|
- |
|
|
|
41,950 |
|
|
|
- |
|
|
Interest expense, net |
|
|
7,593 |
|
|
|
468 |
|
|
|
- |
|
|
Income tax benefit |
|
|
(14,042 |
) |
|
|
(16,583 |
) |
|
|
(167 |
) |
|
Depreciation and amortization |
|
|
12,631 |
|
|
|
841 |
|
|
|
17 |
|
|
Share-based payments |
|
|
29,249 |
|
|
|
34,160 |
|
|
|
23 |
|
|
Contingent earn out costs |
|
|
- |
|
|
|
14,300 |
|
|
|
- |
|
|
Non-cash loss on exchange of warrants |
|
|
1,273 |
|
|
|
- |
|
|
|
- |
|
|
Write-off of Purchased IP and capitalized litigation costs |
|
|
4,055 |
|
|
|
- |
|
|
|
- |
|
|
Acquisition-related costs |
|
|
488 |
|
|
|
1,268 |
|
|
|
182 |
|
|
Non-recurring legal and litigation costs |
|
|
2,588 |
|
|
|
1,483 |
|
|
|
165 |
|
|
Non-recurring fund raising costs |
|
|
224 |
|
|
|
- |
|
|
|
- |
|
|
Adjusted EBITDA |
|
$ |
14,973 |
|
|
$ |
(6,648 |
) |
|
$ |
(390 |
) |
37
|
|
Three Months Ended |
|
||||||||||
|
(In thousands) |
|
December 31, 2016 |
|
|
September 30, 2016 |
|
|
December 31, 2015 |
|
|||
|
Net loss attributable to cogint |
|
$ |
(5,386 |
) |
|
$ |
(9,744 |
) |
|
$ |
(32,639 |
) |
|
Interest expense, net |
|
|
2,032 |
|
|
|
1,880 |
|
|
|
465 |
|
|
Income tax benefit |
|
|
(2,523 |
) |
|
|
(4,493 |
) |
|
|
(16,724 |
) |
|
Depreciation and amortization |
|
|
3,519 |
|
|
|
3,507 |
|
|
|
708 |
|
|
Share-based payments |
|
|
7,308 |
|
|
|
7,318 |
|
|
|
30,508 |
|
|
Contingent earn out costs |
|
|
- |
|
|
|
- |
|
|
|
14,300 |
|
|
Write-off of Purchased IP and capitalized litigation costs |
|
|
- |
|
|
|
4,055 |
|
|
|
- |
|
|
Acquisition-related costs |
|
|
57 |
|
|
|
(146 |
) |
|
|
891 |
|
|
Non-recurring legal and litigation costs |
|
|
1,095 |
|
|
|
779 |
|
|
|
235 |
|
|
Non-recurring fund raising costs |
|
|
224 |
|
|
|
- |
|
|
|
- |
|
|
Adjusted EBITDA |
|
$ |
6,326 |
|
|
$ |
3,156 |
|
|
$ |
(2,256 |
) |
We present adjusted EBITDA as a supplemental measure of our operating performance because we believe it provides useful information to our investors as it eliminates the impact of certain items that we do not consider indicative of our cash operations and ongoing operating performance. In addition, we use it as an integral part of our internal reporting to measure the performance of our reportable segments, evaluate the performance of our senior management and measure the operating strength of our business.
Adjusted EBITDA is a measure frequently used by securities analysts, investors and other interested parties in their evaluation of the operating performance of companies similar to ours and is an indicator of the operational strength of our business. Adjusted EBITDA eliminates the uneven effect across all reportable segments of considerable amounts of non-cash depreciation and amortization and the non-cash effect of share-based payments.
Adjusted EBITDA is not intended to be a performance measure that should be regarded as an alternative to, or more meaningful than, either operating income or net income as indicators of operating performance or to cash flows from operating activities as a measure of liquidity. The way we measure adjusted EBITDA may not be comparable to similarly titled measures presented by other companies, and may not be identical to corresponding measures used in our various agreements.
Results of Operations
Year ended December 31, 2016 compared to the year ended December 31, 2015
For accounting purposes, IDI Holdings, LLC was the accounting acquirer, and acquired Tiger Media on March 21, 2015. As such, only results of operations during the period after March 22, 2015 of Tiger Media are included into the consolidated financial statements of cogint for the year ended December 31, 2015. The Company disposed of all assets and liabilities related to its Chinese and British Virgin Islands based subsidiaries (collectively, the “Advertising Business”) in 2015, and the operating results of the Advertising Business for the year ended December 31, 2015 were reflected as discontinued operations.
On December 8, 2015, the Company completed the acquisition of Fluent, LLC (“Fluent”) (the “Fluent Acquisition”). The results of operations of Fluent are included in the Company’s consolidated financial statements for the year ended December 31, 2016, while only the period subsequent to the acquisition were included for the year ended December 31, 2015. On June 8, 2016, the Company completed the acquisition of Q Interactive, LLC (“Q Interactive”) (the “Q Interactive Acquisition”). The results of operations of Q Interactive beginning on June 8, 2016 are included in the Company’s consolidated financial statements for the year ended December 31, 2016.
Revenue. Total revenue increased $172.7 million to $186.8 million for the year ended December 31, 2016, from $14.1 million for the year ended December 31, 2015. The increase was mainly attributable to the Fluent Acquisition effective on December 8, 2015 and the Q Interactive Acquisition effective on June 8, 2016. Revenue generated from our Information Services segment and Performance Marketing segment were $55.4 million and $131.4 million, respectively, for the year ended December 31, 2016, versus $6.4 million and $7.7 million, respectively, for the year ended December 31, 2015.
Gross profit. Gross profit margin was 28% and 27% for the years ended December 31, 2016 and 2015, respectively. The increase in gross profit margin was attributed to lower data costs relative to revenue, mainly a result of the following:
38
|
construct of our data costs is a flat-fee, unlimited usage model, we expect that our gross profit margin will continue to increase as a percentage of sales in our Information Services segment over the coming years as we increase our revenue. We saw the beginning of this for the year ended December 31, 2016, compared to 2015, mainly a result of our consumer marketing business leveraging greater optimization of our consumer traffic through data rich media buying, reducing our costs to acquire the data relative to revenue. |
|
• |
In our Performance Marketing segment, gross profit as a percentage of revenue is impacted by several factors, including the cost to acquire traffic primarily from the purchase of impressions from publishers or third-party intermediaries, such as advertising exchanges, the competitive landscape associated with purchasing that inventory, and our ability to manage the quality and liquidity of the inventory. We generated a constant gross profit margin for the year ended December 31, 2016, compared to 2015. |
Historically, the relative mix of revenue derived from our Performance Marketing and Information Services segment produces a consolidated average gross margin between 26% and 32%. Historically, at scale, the Information Services segment will trend with average gross margins between 70% and 85%. As a result, we expect our combined gross margin to increase over the next twelve months as our Information Services revenue begins to scale.
Sales and marketing expenses. Sales and marketing expenses increased $13.4 million to $16.3 million for the year ended December 31, 2016, from $2.9 million for the year ended December 31, 2015. The increase was mainly a result of the Fluent Acquisition and the expansion of our sales organization. Sales and marketing expenses consist of marketing and promotion, salaries and benefits, traveling expenses, share-based compensation expenses, and transportation and other expenses, incurred by our sales team, which are expected to increase in the future following the growth of revenue and the Company’s continuous efforts to expand its sales organization. Included in sales and marketing expenses was non-cash share-based compensation expenses of $2.3 million for the year ended December 31, 2016, versus $0.3 million for the year ended December 31, 2015.
General and administrative expenses. General and administrative expenses increased $9.6 million to $54.1 million for the year ended December 31, 2016, from $44.5 million for the year ended December 31, 2015. The increase in general and administrative expenses was mainly attributable to the Fluent Acquisition effective on December 8, 2015. The amounts mainly consisted of non-cash share-based payments of $26.9 million and $33.9 million, professional fees of $8.1 million and $4.2 million, acquisition-related costs of $0.5 million and $1.3 million, and employee salaries and benefits of $12.0 million and $2.0 million, for the years ended December 31, 2016 and 2015, respectively.
Depreciation and amortization. Depreciation and amortization expenses increased $11.8 million to $12.6 million for the year ended December 31, 2016, from $0.8 million for the year ended December 31, 2015. The increase in depreciation and amortization in 2016 was mainly attributable to the amortization of intangible assets resulting from the Fluent Acquisition and the Q Interactive Acquisition.
Write-off of intangible assets. The write-off of intangible assets of $4.1 million for the year ended December 31, 2016 represented the write-off of the remaining balance of Purchased IP and capitalized litigation costs as a result of an unfavorable ruling in relation to the Purchased IP litigation. There was no write-off of intangible assets recognized in continuing operations for the year ended December 31, 2015.
Interest expense, net. Interest expense, net, of $7.6 million and $0.5 million for the years ended December 31, 2016 and 2015, respectively, represented the interest expense and amortization of debt issuance costs associated with the term loan in the amount of $45.0 million (“Term Loan”) and promissory notes payable to certain stockholders in the amount of $10 million (“Promissory Notes”), pursuant to agreements entered in December 2015 in connection with the Fluent Acquisition, with an aggregate long-term debt balance, including the current portion of long-term debt, of $50.0 million as of December 31, 2016.
Contingent earn out costs. Contingent earn out costs of $14.3 million for the year ended December 31, 2015 represented one-time non-cash costs related to the earn out shares issued to certain investors (as discussed in Note 4, Acquisitions, included in Notes to Consolidated Financial Statements), pursuant to amendments to TBO Merger Agreement.
Other expenses, net. Other expenses of $1.5 million for the year ended December 31, 2016 mainly represented non-cash loss on exchange of warrants previously issued to certain stockholders of the Company.
Income taxes. Income tax benefit of $14.0 million and $16.6 million was recognized for the years ended December 31, 2016 and 2015, respectively, which was mainly attributable to the deferred tax recognized as a result of the federal and state net operating loss and temporary differences. In addition, a valuation allowance on the deferred tax assets of $1.9 million was recognized for the year ended December 31, 2016.
39
Net loss from continuing operations. We had a loss from continuing operations of $29.1 million and $42.6 million, including $29.2 million and $34.2 million of non-cash share-based payments, respectively. In addition, $14.0 million and $16.6 million of income tax benefit arising primarily from the increase in our net operating loss carryforwards were recorded for the years ended December 31, 2016 and 2015, respectively. As a result of the foregoing, net loss from continuing operations decreased $13.5 million in 2016 as compared to 2015.
Net loss from discontinued operations attributable to cogint. As a result of the plan to discontinue the Advertising Business in 2015, a net loss from discontinued operations attributable to cogint of $42.0 million was recognized for the year ended December 31, 2015. There were no discontinued operations for the year ended December 31, 2016.
Net loss attributable to cogint. A net loss of $29.1 million and $84.5 million was recognized for the years ended December 31, 2016 and 2015, respectively, as a result of the foregoing.
Year ended December 31, 2015 compared to the year ended December 31, 2014
For accounting purposes, IDI Holdings was the accounting acquirer, and acquired Tiger Media on March 21, 2015. As such, only results of operations during the period from March 22, 2015 to December 31, 2015 of Tiger Media were included into the consolidated financial statements of IDI for the year ended December 31, 2015. The Company has disposed of all assets and liabilities related to the Advertising Business as of December 31, 2015, and the operating results of the Advertising Business for the year ended December 31, 2015 are reflected as Discontinued Operations.
On December 8, 2015, the Company completed the acquisition of Fluent. The results of operations of Fluent for the period from December 9, 2015 to December 31, 2015 are included into the Company’s consolidated financial statements for the year ended December 31, 2015.
In addition, as IDI Holdings, the accounting acquirer, was formed on September 22, 2014, and the comparative figures during the corresponding periods in 2014 are not material and are not discussed in this section.
Mainly due to the factors mentioned above, significant changes in results of operations were noted for the year ended December 31, 2015, in comparison with the year ended December 31, 2014.
Revenue. Total revenue increased $13.3 million to $14.1 million for the year ended December 31, 2015, from $0.8 million for the year ended December 31, 2014. The increase was a result of the acquisition of Fluent effective December 8, 2015, which included the results of operations of Fluent for the period from December 9, 2015 through December 31, 2015. In addition, as IDI Holdings, the accounting acquirer of the reverse merger consummated effective as of March 21, 2015, was incorporated on September 22, 2014, the comparative figures of the Company for the corresponding period in 2014 were from September 22, 2014, the date of inception, through December 31, 2014. The Information Services segment contributed $6.4 million for the year ended December 31, 2015, versus $0.8 million for the year ended December 31, 2014. The Performance Marketing segment contributed $7.7 million for the year ended December 31, 2015, versus $0 for the year ended December 31, 2014. We had no related results of operations in the Performance Marketing segment prior to the Fluent Acquisition.
Gross profit. Gross profit ratio was 27% and 59% for the years ended December 31, 2015 and 2014, respectively. The decrease in gross profit ratio was mainly the result of the following:
|
|
• |
In the Information Services segment, gross profit as a percentage of revenue is impacted by several factors, including increases in transactional-based data costs, timing and acquisition of flat-fee data licensing agreements, the mix of those data costs, changes in channels of distribution, sales volume, pricing strategies, and fluctuations in sales of integrated third-party products. As we continued to leverage additional data sets in anticipation of additional product lines, we incurred an increase in the cost of revenues relative to our current sales. As we continue to move the construct of our data costs towards a flat-fee data licensing agreements model, we will begin to see our gross profit margin increase as a percentage of sales in our Information Services segment. |
|
|
• |
In our Performance Marketing segment, as a result of the acquisition of Fluent effective December 8, 2015, we generated a lower gross profit ratio vis-a-vie the Company’s overall ratio for the year ended December 31, 2014, as we had no related results of operations in the Performance Marketing segment prior to the Fluent Acquisition. |
Sales and marketing expenses. Sales and marketing expenses increased $2.6 million to $2.9 million for the year ended December 31, 2015, from $0.3 million for the year ended December 31, 2014. The increase was a result of the acquisition of Fluent effective December 8, 2015, and the fact that the comparative figures for the Company for the corresponding period in 2014 were from
40
September 22, 2014, the date of inception, through December 31, 2014. Sales and marketing expenses consist of marketing and promotion, salaries and benefits, traveling expenses, share-based compensation expenses, and transportation and other expenses, incurred by our selling and distribution team, which are expected to increase in the future following the growth of revenue and the Company’s efforts to expand its sales organization. Included in sales and marketing expenses was non-cash share-based compensation expenses of $0.3 million and $0 for the years ended December 31, 2015 and 2014, respectively.
General and administrative expenses. General and administrative expenses increased $43.6 million to $44.5 million for the year ended December 31, 2015, from $0.9 million for the year ended December 31, 2014. The figures mainly consisted of non-cash share-based compensation expenses of $33.9 million and $0, professional fees of $4.2 million and $0.5 million, acquisition-related costs of $1.3 million and $0.2 million, and employee salaries and benefits of $2.0 million and $0.3 million, for the years ended December 31, 2015 and 2014, respectively. In addition, the increase was also attributable to the acquisition of Fluent effective December 8, 2015, and the fact that the comparative figures for the Company for the corresponding period in 2014 were from September 22, 2014, the date of inception, through December 31, 2014.
Depreciation and amortization. Depreciation and amortization expenses increased $0.8 million to $0.8 million for the year ended December 31, 2015. The increase in depreciation and amortization in 2015 was mainly attributable to the amortization of intangible assets resulting from the acquisition of Fluent, and the fact that the comparative figures for the Company for the corresponding period in 2014 were from September 22, 2014, the date of inception, through December 31, 2014.
Contingent earn out costs. Contingent earn out costs of $14.3 million for the year ended December 31, 2015 represented one-time non-cash costs related to the earn out shares issued to certain investors (as discussed in Note 4, Acquisitions, included in Notes to Consolidated Financial Statements), pursuant to amendments to TBO Merger Agreement.
Net loss from continuing operations. We had a loss from continuing operations of $42.6 million and $0.6 million, including $34.2 million and $0 of non-cash share-based compensation expenses, and $16.6 million and $0.2 million of income taxes benefits arising primarily from the recognition of deferred tax assets, for the years ended December 31, 2015 and 2014, respectively.
Net loss from discontinued operations attributable to cogint. As a result of the disposal of all assets and liabilities related to the Advertising Business, we recognized a net loss of $42.0 million for the year ended December 31, 2015. The net loss includes a non-cash loss on disposal of the discontinued operations of $41.1 million, which includes the write-offs of goodwill, intangible assets and long-term deferred assets, the employee compensation expenses and lease agreements early termination compensation expenses.
Net loss attributable to cogint. A net loss of $84.5 million and $0.6 million was recognized for the years ended December 31, 2015 and 2014, respectively, as a result of the foregoing.
Effect of Inflation
The rates of inflation experienced in recent years have had no material impact on our financial statements. We attempt to recover increased costs by increasing prices for our services, to the extent permitted by contracts and competition.
Liquidity and Capital Resources
Cash Flows provided by (used in) Operating Activities. For the year ended December 31, 2016, net cash provided by operating activities was $2.1 million, which was mainly due to the operating income of $7.0 million, after the adjustments of non-cash items of $36.1 million. Net cash used in operating activities of $10.7 million for the year ended December 31, 2015 was mainly attributable to net loss incurred from continuing operations.
Cash Flows used in Investing Activities. Net cash used in investing activities for the year ended December 31, 2016 was $12.0 million, which was mainly due to an aggregate of $10.2 million of software developed for internal use and capitalized litigation costs. Net cash used in investing activities for the year ended December 31, 2015 of $93.8 million was mainly due to the cash paid for the Fluent Acquisition of $93.3 million and an aggregate of $3.1 million of software developed for internal use and capitalized litigation costs, which were offset by the cash proceeds of $3.6 million as a result of the reverse acquisition of Tiger Media on March 21, 2015.
Cash Flows provided by Financing Activities. Net cash provided by financing activities for the year ended December 31, 2016 was $6.6 million, which was mainly due to the net proceeds from the registered direct offerings of $10.1 million, which was offset by the repayments of long-term debt of $2.3 million. Net cash provided by financing activities for the year ended December 31, 2015 of $111.9 million was the result of the following financing arrangements: (1) a registered direct offering of $10.0 million to an institutional investor in July 2015; (2) sales of Series B Preferred shares (“Series B Preferred”) and warrants to certain investors, including Frost Gamma Investment Trust, for an aggregate of $50.0 million in November 2015; (3) the Term Loan of $45.0 million
41
from three financial institutions pursuant to a Credit Agreement on December 8, 2015; and (4) an aggregate of $10.0 million Promissory Notes from certain investors in December 2015.
As of December 31, 2016, the Company had non-cancellable operating lease commitments of $3.7 million, and material commitments under non-cancellable data licensing agreements of $16.7 million. For the year ended December 31, 2016, the Company funded its operations through the use of available cash and proceeds from the registered direct offerings.
The Company reported net loss of $29.1 million for the year ended December 31, 2016, as compared to $84.5 million for the year ended December 31, 2015. As of December 31, 2016, the Company had an accumulated deficit of $114.2 million.
As of December 31, 2016, the Company had cash and cash equivalents of approximately $10.1 million, of which, $5.2 million was held by Fluent, a decrease of $3.4 million from $13.5 million as of December 31, 2015. A portion of this cash held by Fluent may be used by Fluent only for general operating purposes. Based on projections of growth in revenue and operating results in the coming year, and the $15.0 million Incremental Term Loan (as defined below) entered into in January 2017, the Company believes that it will have sufficient cash resources to finance its operations and expected capital expenditures for the next twelve months. Subject to revenue growth, the Company may have to continue to raise capital through the issuance of additional equity and/or debt, which, if the Company is able to obtain, could have the effect of diluting stockholders. Any equity or debt financings, if available at all, may be on terms which are not favorable to the Company. If the Company’s operations do not generate positive cash flow in the upcoming year, or if it is not able to meet the debt covenants specified in the Credit Agreement, as amended, or if it is not able to obtain additional equity or debt financing on terms and conditions acceptable to it, if at all, it may be unable to implement its business plan, or even continue its operations.
The Company may explore the possible acquisition of businesses, products and/or technologies that are complementary to its existing business. The Company is continuing to identify and prioritize additional technologies, which it may wish to develop internally or through licensing or acquisition from third parties. While the Company may engage from time to time in discussions with respect to potential acquisitions, there can be no assurances that any such acquisitions will be made or that the Company will be able to successfully integrate any acquired business. In order to finance such acquisitions and working capital, it may be necessary for us to raise additional funds through public or private financings. Any equity or debt financings, if available at all, may be on terms which are not favorable to us and, in the case of equity financings, may result in dilution to stockholders.
We financed approximately $55.0 million of the cash portion of the purchase price of the Fluent Acquisition with the proceeds from the Term Loan and Promissory Notes described herein. As of December 31, 2016, the Term Loan has an outstanding principal balance, plus PIK interest, of $43.2 million, and Promissory Notes, plus PIK interest, totaled $11.1 million. All obligations under the Term Loan mature on December 8, 2020 and our Promissory Notes are due six months after payment in full of our Term Loan. The Credit Agreement governing the Term Loan contains restrictive covenants which impose limitations on the way we conduct our business, including limitations on the amount of additional debt we are able to incur and restricts our ability to make certain investments and other restricted payments, including certain intercompany payments of cash and other property. Fluent, the borrower under the Credit Agreement, entered into a Limited Consent and Amendment No. 1 to Credit Agreement dated June 8, 2016 and Limited Consent and Amendment No. 2 to Credit Agreement dated September 30, 2016. These two amendments, among other things, modify certain covenant provisions set forth in the Credit Agreement. The Limited Consent and Amendment No. 2 to Credit Agreement also requires the Company to deliver to the administrative agent, on or prior to October 7, 2016, (i) amended and restated warrants amending the strike price of the warrants to purchase 200,000 shares of common stock, dated December 8, 2015, currently held by the Administrative Agent (the “Whitehorse Warrants”), from $8.00 per share to $5.08 per share, and (ii) new warrants to purchase 100,000 shares of common stock (“New Whitehorse Warrants”) on terms and conditions substantially similar to the Whitehorse Warrants, as amended and restated, with a per share strike price also equal to $5.08. The restrictive covenants in the Credit Agreement, as amended, may limit our strategic and financing options and our ability to return capital to our stockholders through dividends or stock buybacks. Furthermore, we still may need to incur additional debt to meet future financing needs.
On January 19, 2017, Fluent entered into an Amendment No. 3 to Credit Agreement ("Amendment No. 3"), amending Fluent's Term Loan facility dated as of December 8, 2015. The Amendment No. 3, among other things, provides for a new term loan in the principal amount of $15.0 million ("Incremental Term Loan"), subject to the terms and conditions of the Amendment No. 3, and modifies certain other provisions set forth in the Credit Agreement, including certain financial covenants and related definitions. The entire Incremental Term Loan was funded on February 1, 2017. The Incremental Term Loan and Fluent's existing $45 million Term Loan (collectively, the "Term Loans") are guaranteed by the Company and the other direct and indirect subsidiaries of the Company, and are secured by substantially all of the assets of the Company and its direct and indirect subsidiaries, including Fluent, in each case, on an equal and ratable basis. The Term Loans accrue interest at the rate of: (a) either, at Fluent's option, LIBOR (subject to a floor of 0.50%) plus 10.5% per annum, or base rate plus 9.5% per annum, payable in cash, plus (b) 1% per annum, payable, at Fluent's option, in either cash or in-kind. Principal amortization of the Term Loans will be $0.7 million per quarter, payable at the end of each calendar quarter, commencing on March 31, 2017. The Term Loans mature on December 8, 2020.
42
The Credit Agreement, as amended, requires us to maintain and comply with certain financial and other covenants. We cannot assure you that we will be able to maintain compliance with such financial or other covenants. Our failure to comply with these covenants could result in an event of default which, if not cured or waived, could result in the acceleration of all of our indebtedness, which would materially adversely affect our financial health if we are unable to access sufficient funds to repay all the outstanding amounts. Moreover, if we are unable to meet our debt obligations as they come due, we could be forced to restructure or refinance such obligations, seek additional equity financing or sell assets, which we may not be able to do on satisfactory terms, or at all. In addition, the Credit Agreement includes certain mandatory prepayment provisions, including annual prepayments of the Term Loans with a portion of our excess cash flow. As long as the Term Loans remain outstanding, the restrictive covenants and mandatory prepayment provisions could impair our ability to expand or pursue our business strategies or obtain additional funding. At December 31, 2016, the Company was in compliance with the covenants under the Credit Agreement, as amended.
Contractual Obligations
As of December 31, 2016, the Company has the following future contractual obligation:
|
(In thousands) |
|
2017 |
|
|
2018 |
|
|
2019 |
|
|
2020 |
|
|
2021 |
|
|
2022 and thereafter |
|
|
Total |
|
|||||||
|
Lease agreements |
|
$ |
857 |
|
|
$ |
431 |
|
|
$ |
415 |
|
|
$ |
427 |
|
|
$ |
440 |
|
|
$ |
1,163 |
|
|
$ |
3,733 |
|
|
Data license agreements |
|
|
4,155 |
|
|
|
4,298 |
|
|
|
4,105 |
|
|
|
3,270 |
|
|
|
900 |
|
|
|
- |
|
|
|
16,728 |
|
|
Debt |
|
|
8,888 |
|
|
|
6,795 |
|
|
|
6,589 |
|
|
|
40,073 |
|
|
|
17,432 |
|
|
|
- |
|
|
|
79,777 |
|
|
Contingent consideration payable in stock |
|
|
10,225 |
|
|
|
- |
|
|
|
- |
|
|
|
- |
|
|
|
- |
|
|
|
- |
|
|
|
10,225 |
|
|
Employment agreements |
|
|
2,581 |
|
|
|
361 |
|
|
|
97 |
|
|
|
22 |
|
|
|
- |
|
|
|
- |
|
|
|
3,061 |
|
|
Total |
|
$ |
26,706 |
|
|
$ |
11,885 |
|
|
$ |
11,206 |
|
|
$ |
43,792 |
|
|
$ |
18,772 |
|
|
$ |
1,163 |
|
|
$ |
113,524 |
|
The lease agreements represent future minimum rental payments under non-cancellable operating leases having initial or remaining lease terms of more than one year. The data license agreements of $16.7 million represent material data purchase commitment under non-cancellable data licensing agreements. Debt of $79.8 million represent the payments of principal and interest of the Term Loan and Promissory Notes, pursuant to related agreements entered into on December 8, 2015. Contingent consideration payable in stock represents the fair value of earn-out shares associated with the Q Interactive Acquisition, payable in 2017. Employment agreements represent related agreements reached with certain executives, including our Executive Chairman, Chief Executive Officer and Chief Financial Officer, etc., which provide for compensation and certain other benefits and for severance payments under certain circumstances.
Off-Balance Sheet Arrangements
We do not have any outstanding off-balance sheet guarantees, interest rate swap transactions or foreign currency forward contracts. In addition, we do not engage in trading activities involving non-exchange traded contracts. In our ongoing business, we do not enter into transactions involving, or otherwise form relationships with, unconsolidated entities or financials partnerships that are established for the purpose of facilitating off-balance sheet arrangements or other contractually narrow or limited purposes.
FORWARD-LOOKING STATEMENTS
This 2016 Form 10-K contains certain “forward-looking statements” within the meaning of the PSLRA, Section 27A of the Securities Act of 1933, as amended (the “Securities Act”), and Section 21E of the Securities Exchange Act of 1934, as amended (the “Exchange Act”). Such forward-looking statements contain information about our expectations, beliefs or intentions regarding our product development and commercialization efforts, business, financial condition, results of operations, strategies or prospects. You can identify forward-looking statements by the fact that these statements do not relate strictly to historical or current matters. Rather, forward-looking statements relate to anticipated or expected events, activities, trends or results as of the date they are made. Because forward-looking statements relate to matters that have not yet occurred, these statements are inherently subject to risks and uncertainties that could cause our actual results to differ materially from any future results expressed or implied by the forward-looking statements.
Many factors could cause our actual activities or results to differ materially from the activities and results anticipated in forward-looking statements. These factors include the following:
|
|
• |
We have a history of losses and negative cash flow from operations which makes our future results uncertain. |
43
|
|
• |
Because our networks and information technology systems are critical to our success, if unauthorized persons hack into our systems or our systems otherwise cease to function properly, our operations could be adversely affected and we could lose revenues or proprietary information, all of which could materially adversely affect our business. |
|
|
• |
We must adequately protect our intellectual property in order to prevent loss of valuable proprietary information. |
|
|
• |
We depend, in part, on strategic alliances, joint ventures and acquisitions to grow our business. If we are unable to make strategic acquisitions and develop and maintain these strategic alliances and joint ventures, our growth may be adversely affected. |
|
|
• |
If we consummate any future acquisitions, we will be subject to the risks inherent in identifying, acquiring and operating a newly acquired business. |
|
|
• |
Our business is subject to various governmental regulations, laws and orders, compliance with which may cause us to incur significant expenses or reduce the availability or effectiveness of our solutions, and the failure to comply with which could subject us to civil or criminal penalties or other liabilities. |
|
|
• |
The outcome of litigation, inquiries, investigations, examinations or other legal proceedings in which we are involved, in which we may become involved, or in which our customers or competitors are involved could subject us to significant monetary damages or restrictions on our ability to do business. |
|
|
• |
Our relationships with key customers may be materially diminished or terminated. |
|
|
• |
If we lose the services of key personnel, it could adversely affect our business. |
|
|
• |
If we fail to respond to rapid technological changes in the big data and analytics sector, we may lose customers and/or our products and/or services may become obsolete. |
|
|
• |
Our revenues are concentrated in the U.S. market across a broad range of industries. When these industries or the broader financial markets experience a downturn, demand for our services and revenues may be adversely affected. |
|
|
• |
We could lose our access to data sources which could prevent us from providing our services. |
|
|
• |
We face intense competition from both start-up and established companies that may have significant advantages over us and our products. |
|
|
• |
There may be further consolidation in our end-customer markets, which may adversely affect our revenues. |
|
|
• |
To the extent the availability of free or relatively inexpensive consumer and/or business information increases, the demand for some of our services may decrease. |
|
|
• |
If our newer products do not achieve market acceptance, revenue growth may suffer. |
|
|
• |
Our products and services can have long sales and implementation cycles, which may result in substantial expenses before realizing any associated revenues. |
|
|
• |
Consolidation in the big data and analytics sector may limit market acceptance of our products and services. |
|
|
• |
We may incur substantial expenses defending against claims of infringement. |
|
|
• |
We operate in an industry that is still developing and has a relatively new business model that is continually evolving, which makes it difficult to evaluate our business and prospects. |
|
|
• |
An increasing percentage of our users are accessing our websites from their mobile devices. Our ability to remain competitive with the shift to mobile devices is critical to maintaining our revenues and margins. |
|
|
• |
We are dependent on third-party publishers for a significant portion of visitors to our websites. Any decline in the supply of media available through these websites or increase in the price of this media could cause our revenue to decline or increase the cost to acquire visitors to our websites. |
|
|
• |
We depend on Internet search providers for a portion of the visitors to our websites. Changes in search engine algorithms applicable to our websites’ placements in paid search result listings may cause the number of visitors to our websites to decrease, and as a result, cause our revenue, to decline. |
44
|
|
• |
As a result of changes in our business model and the need for increased investments and expenditures for certain businesses, products, services, and technologies, we may fail to maintain our margins, attract new clients, or grow our revenues. |
|
|
• |
If we fail to compete effectively against other online marketing and media companies and other competitors, we could lose clients and our revenue may decline. |
|
|
• |
A reduction in online marketing spend by our clients, a loss of clients or lower advertising yields may seriously harm our business, financial condition, and results of operations. In addition, a substantial portion of our revenue is generated from a limited number of clients and, if we lose a major client, our revenue will decrease and our business and prospects may be harmed. |
|
|
• |
Third-party publishers or vendors may engage in unauthorized or unlawful acts that could subject us to significant liability or cause us to lose clients. |
|
|
• |
If we fail to continually enhance and adapt our products and services to keep pace with rapidly changing technologies and industry standards, we may not remain competitive and could lose clients or advertising inventory. |
|
|
• |
We are exposed to credit risk from and have payments disputes with our advertisers and agency clients and may not be able to collect on amounts owed to us. |
|
|
• |
Damage to our reputation could harm our business, financial condition and results of operations. |
|
|
• |
Our quarterly revenue and results of operations may fluctuate significantly from quarter to quarter due to fluctuations in advertising spending, including seasonal and cyclical effects. |
|
|
• |
If the market for online marketing services fails to continue to develop, our success may be limited, and our revenue may decrease. |
|
|
• |
Limitations on our ability to collect and use data derived from user activities, as well as new technologies that block our ability to deliver Internet-based advertising, could significantly diminish the value of our services and have an adverse effect on our ability to generate revenue. |
|
|
• |
As a creator and a distributor of Internet content, we face potential liability and expenses for legal claims based on the nature and content of the materials that we create or distribute. If we are required to pay damages or expenses in connection with these legal claims, our results of operations and business may be harmed. |
|
|
• |
Our stock price has been and may continue to be volatile, and the value of an investment in our common stock may decline. |
|
|
• |
Future issuances of shares of our common stock in connection with acquisitions or pursuant to our stock incentive plan could have a dilutive effect on your investment. |
|
|
• |
The concentration of our stock ownership may limit individual stockholder ability to influence corporate matters. |
We expect that we may need additional capital in the future; however, such capital may not be available to us on reasonable terms, if at all, when or as we require additional funding. If we issue additional shares of our common stock or other securities that may be convertible into, or exercisable or exchangeable for, our common stock, our existing stockholders would experience further dilution.
ITEM 7A.QUANTITATIVE AND QUALITATIVE DISCLOSURES ABOUT MARKET RISK
We are exposed to market risk for the effect of interest rate changes. Information relating to quantitative and qualitative disclosures about market risk is set forth below and in Item 7 of Part II, “Management’s Discussion and Analysis of Financial Condition and Results of Operations—Liquidity and Capital Resources.” To date, we have not used derivative instruments to mitigate the impact of our market risk exposures. We have also not used, nor do we intend to use, derivatives for trading or speculative purposes.
Interest Rate Risk
We are exposed to market risk related to changes in interest rates. Our investments are considered cash equivalents and primarily consist of money market mutual funds. As of December 31, 2016, we had cash and cash equivalents of $10.1 million. The carrying amount of our cash and cash equivalents reasonably approximates fair value, due to the fact that we can redeem such investment freely. The primary objectives of our investment activities are the preservation of capital, the fulfillment of liquidity needs and the fiduciary control of cash and investments. We do not enter into investments for trading or speculative purposes. Our investments are
45
exposed to market risk due to a fluctuation in interest rates, which may affect our interest income and the fair market value of our investments. Due to the short-term nature of our investment portfolio, we do not expect our operating results or cash flows to be materially affected by a sudden change in market interest rates.
As of December 31, 2016, we have long-term debts, in aggregate of $50.0 million, including current portion of long-term debts. Our $45.0 million Term Loan accrues interest at LIBOR (with a floor of 0.5%) plus 10.5% per annum, payable in cash, plus an additional 1.0% per annum payable, at Fluent’s election, in-kind or in cash. Interest under the Term Loan is payable monthly, including monthly compounding of PIK interest. In addition, we also have long-term Promissory Notes of $10.0 million in total with a rate of interest of 10% per annum, which interest is capitalized monthly by adding to the outstanding principal amount of such Promissory Notes. The fair value of our debt will generally fluctuate with movements of interest rates, increasing in periods of declining rates of interest and declining in periods of increasing rates of interest.
A hypothetical 10% increase in interest rates relative to our current interest rates would not have a material impact on the fair value of all of our outstanding long-term debts, net. Changes in interest rates would, however, affect operating results and cash flows, because of the variable rate nature of the Term Loan. A hypothetical 10% increase or decrease in overall interest rates as of December 31, 2016 would result in an impact to interest expense for 2017 by $0.5 million.
Our Consolidated Financial Statements and the Notes thereto, together with the report thereon of our independent registered public accounting firm are filed as part of this report, beginning on page F-1.
None.
Disclosure Controls and Procedures
The Company’s management, with the participation of the Company’s Chief Executive Officer and Chief Financial Officer, evaluated the effectiveness of the Company’s disclosure controls and procedures (as defined in Exchange Act Rules 13a-15(e) and 15d–15(e)) as of the end of the period covered by this 2016 Form 10-K. Based upon that evaluation, the Company’s Chief Executive Officer and Chief Financial Officer concluded that the Company’s disclosure controls and procedures were effective as of the end of the period covered by this 2016 Form 10-K.
Management’s Annual Report on Internal Control over Financial Reporting
The Company’s management is responsible for establishing and maintaining adequate internal control over financial reporting. Internal control over financial reporting is a process designed to provide reasonable assurance regarding the reliability of financial reporting and the preparation of financial statements for external purposes in accordance with generally accepted accounting principles.
A company’s internal control over financial reporting includes those policies and procedures that (i) pertain to the maintenance of records that in reasonable detail accurately and fairly reflect the transactions and dispositions of the assets of the Company; (ii) provide reasonable assurance that transactions are recorded as necessary to permit preparation of financial statements in accordance with generally accepted accounting principles, and that receipts and expenditures of the Company are being made only in accordance with authorizations of management and directors of the Company; and (iii) provide reasonable assurance regarding prevention or timely detection of unauthorized acquisition, use or disposition of the Company’s assets that could have a material effect on the financial statements.
Because of its inherent limitations, internal control over financial reporting may not prevent or detect misstatements. Also, projections of any evaluation of effectiveness to future periods are subject to the risk that controls may become inadequate because of changes in conditions, or that the degree of compliance with the policies or procedures may deteriorate.
46
Management, under the supervision of and with the participation of the Company’s Chief Executive Officer and Chief Financial Officer, conducted an assessment of the effectiveness of the Company’s internal control over financial reporting based on the criteria set forth by the Committee of Sponsoring Organizations (COSO) of the Treadway Commission in Internal Control-Integrated Framework (2013). Based on the Company's evaluation under the framework in Internal Control—Integrated Framework, management concluded that the Company's internal control over financial reporting was effective as of December 31, 2016.
During the year ended December 31, 2016, the Company acquired Q Interactive. See Note 4, “Acquisitions,” of the Notes to Consolidated Financial Statements, for additional information. As permitted by the Securities and Exchange Commission, management elected to exclude Q Interactive from its assessment of internal control over financial reporting as of December 31, 2016. Q Interactive in aggregate constitutes 8% of the Company’s consolidated total assets as of December 31, 2016 and 12% of the Company’s consolidated revenue for the year ended December 31, 2016.
Grant Thornton LLP, an independent registered public accounting firm, audited the Company’s consolidated financial statements included in this 2016 Form 10-K. A copy of their report is included in Item 8, “Financial Statements and Supplementary Data,” of this 2016 Form 10-K. Grant Thornton LLP has issued their attestation report on management’s internal control over financial reporting, which is also included in Item 8, “Financial Statements and Supplementary Data,” of this 2016 Form 10-K.
Changes in Internal Control over Financial Reporting
There have been no changes in our internal control over financial reporting in management’s evaluation during the fourth quarter of 2016 that materially affected, or are reasonably likely to materially affect, our internal control over financial reporting.
None.
47
The information required by this Item is incorporated by reference to the definitive proxy statement for our 2017 Annual Meeting of Stockholders to be filed with the SEC within 120 days of December 31, 2016.
The information required by this Item is incorporated by reference to the definitive proxy statement for our 2017 Annual Meeting of Stockholders to be filed with the SEC within 120 days of December 31, 2016.
|
ITEM 12. |
SECURITY OWNERSHIP OF CERTAIN BENEFICIAL OWNERS AND MANAGEMENT AND RELATED STOCKHOLDER MATTERS. |
The information required by this Item is incorporated by reference to the definitive proxy statement for our 2017 Annual Meeting of Stockholders to be filed with the SEC within 120 days of December 31, 2016.
The information required by this Item is incorporated by reference to the definitive proxy statement for our 2017 Annual Meeting of Stockholders to be filed with the SEC within 120 days of December 31, 2016.
The information required by this Item is incorporated by reference to the definitive proxy statement for our 2017 Annual Meeting of Stockholders to be filed with the SEC within 120 days of December 31, 2016.
48
(a) List of documents filed as part of this report:
1. Financial Statements: The information required by this item is contained in Item 8 of this Form 10-K.
2. Financial Statement Schedules: The information required by this item is included in the consolidated financial statements contained in Item 8 of this Form 10-K.
3. Exhibits: The following exhibits are filed as part of, or incorporated by reference into, this Form 10-K.
|
Exhibit No. |
|
Description |
|
2.1 |
|
Merger Agreement and Plan of Reorganization by and among The Best One, Inc., Tiger Media, Inc., TBO Acquisition, LLC, and Derek Dubner, solely in his capacity as representative, dated December 14, 2014 (incorporated by reference to Exhibit 4.1 to the Company’s Current Report on Form 6-K filed December 18, 2014). |
|
|
|
|
|
2.2 |
|
First Amendment to Merger Agreement and Plan of Reorganization by and among The Best One, Inc., Tiger Media, Inc., TBO Acquisition, LLC, and Derek Dubner, solely in his capacity as representative, dated December 18, 2014 (incorporated by reference to Exhibit 4.2 to the Company’s Current Report on Form 6-K filed December 18, 2014). |
|
|
|
|
|
2.3 |
|
Second Amendment to Merger Agreement and Plan of Reorganization by and among The Best One, Inc., Tiger Media, Inc., TBO Acquisition, LLC, and Derek Dubner, solely in his capacity as representative, dated February 13, 2015 (incorporated by reference to Exhibit 4.1 to the Company’s Current Report on Form 6-K filed on February 13, 2015). |
|
|
|
|
|
2.4 |
|
Asset Purchase Agreement by and between Tiger Media, Inc. and Symbol Media (incorporated by reference to Exhibit 99.2 of the Schedule 13D filed by Tan Wei Han on June 26, 2013). |
|
|
|
|
|
2.5 |
|
Agreement and Plan of Merger dated as of November 16, 2015, by and among IDI, Inc., Fluent, Inc., the existing stockholders of Fluent, Inc., Fluent Acquisition I, Inc., Fluent Acquisition II, LLC and Ryan Schulke, solely in his capacity as representative of Sellers. (incorporated by reference to Exhibit 2.1 to the Company’s Current Report on Form 8-K filed November 19, 2015). |
|
|
|
|
|
2.6 |
|
Amendment No. 1 to Agreement and Plan of Merger dated December 8, 2015, by and among IDI, Inc., Fluent, Inc., the existing stockholders of Fluent, Inc., Fluent Acquisition I, Inc., Fluent Acquisition II, LLC and Ryan Schulke, solely in his capacity as representative of Sellers (incorporated by reference to Exhibit 2.2 to the Company’s Current Report on Form 8-K filed December 10, 2015). |
|
|
|
|
|
2.7 |
|
Membership Interest Purchase Agreement (incorporated by reference to Exhibit 2.1 to the Company’s Current Report on Form 8-K filed on June 8, 2016). |
|
|
|
|
|
3.1 |
|
Certificate of Domestication (incorporated by reference to Exhibit 3.1 to the Company’s Current Report on Form 8-K filed March 26, 2015). |
|
|
|
|
|
3.2 |
|
Certificate of Incorporation (incorporated by reference to Exhibit 3.2 to the Company’s Current Report on Form 8-K filed March 26, 2015). |
|
|
|
|
|
3.3 |
|
Certificate of Designation of Series A Non-Voting Convertible Preferred Stock (incorporated by reference to Exhibit 3.4 to the Company’s Current Report on Form 8-K filed March 26, 2015). |
|
|
|
|
|
3.4 |
|
Certificate of Ownership and Merger Merging IDI, Inc., a Delaware corporation, with and into Tiger Media, Inc., a Delaware Corporation (incorporated by reference to Exhibit 3.1 to the Company’s Current Report on Form 8-K filed May 1, 2015). |
|
|
|
|
|
3.5 |
|
Certificate of Designation of Series B Non-Voting Convertible Preferred Stock (incorporated by reference to Exhibit 3.1 to the Company’s Current Report on Form 8-K filed November 19, 2015). |
|
|
|
|
|
3.6 |
|
Amendment to Certificate of Designation of Series A Non-Voting Convertible Preferred Stock (incorporated by reference to Exhibit 3.1 to the Company’s Current Report on Form 8-K filed on March 17, 2016). |
|
|
|
|
49
|
|
Certificate of Amendment to the Certificate of Incorporation of IDI, Inc. (incorporated by reference to Exhibit 3.1 to the Company’s Current Report on Form 8-K filed on September 26, 2016). |
|
|
|
|
|
|
3.8 |
|
Amended and Restated Bylaws of Cogint, Inc. (incorporated by reference to Exhibit 3.2 to the Company’s Current Report on Form 8-K filed on September 26, 2016). |
|
|
|
|
|
4.1 |
|
Form of Common Stock Certificate (incorporated by reference to Exhibit 4.1 of the Company’s Current Report on Form S-3 filed July 10, 2015). |
|
|
|
|
|
4.2 |
|
Warrant issued to Intracoastal Capital, LLC, as amended, dated July 23, 2015 (incorporated by reference to Exhibit 4.2 to the Company’s Quarterly Report on Form 10-Q filed November 16, 2015). |
|
|
|
|
|
4.3 |
|
Securities Purchase Agreement dated as of November 16, 2015, by and between IDI, Inc. and Frost Gamma Investments Trust (incorporated by reference to Exhibit 4.1 to the Company’s Current Report on Form 8-K filed November 19, 2015). |
|
|
|
|
|
4.4 |
|
Warrant issued to Frost Gamma Investments Trust, dated as of November 16, 2015 (incorporated by reference to Exhibit 4.2 to the Company’s Current Report on Form 8-K filed November 19, 2015). |
|
|
|
|
|
4.5 |
|
Stock Purchase Agreement dated as of November 16, 2015, by and between IDI, Inc. and Frost Gamma Investments Trust (incorporated by reference to Exhibit 4.3 to the Company’s Current Report on Form 8-K filed November 19, 2015). |
|
|
|
|
|
4.6 |
|
Warrant issued to Whitehorse Finance, Inc., dated as of December 8, 2015 (incorporated by reference to Exhibit 4.1 to the Company’s Current Report on Form 8-K filed December 10, 2015). |
|
|
|
|
|
4.7 |
|
Warrant issued to H.I.G. Whitehorse SMA ABF, Inc., dated as of December 8, 2015 (incorporated by reference to Exhibit 4.2 to the Company’s Current Report on Form 8-K filed December 10, 2015). |
|
|
|
|
|
4.8 |
|
Warrant issued to Whitehorse Holdings II, LLC, dated as of December 8, 2015 (incorporated by reference to Exhibit 4.3 to the Company’s Current Report on Form 8-K filed December 10, 2015). |
|
|
|
|
|
4.9 |
|
Promissory Note made by IDI, Inc. in favor of Frost Gamma Investments Trust, dated as of December 8, 2015, with accompanying Fee Letter (incorporated by reference to Exhibit 4.4 of the Company’s Current Report on Form 8-K filed December 10, 2015). |
|
|
|
|
|
4.10 |
|
Promissory Note made by IDI, Inc. in favor of Michael Brauser, dated as of December 8, 2015, with accompanying Fee Letter (incorporated by reference to Exhibit 4.5 of the Company’s Current Report on Form 8-K filed December 10, 2015). |
|
|
|
|
|
4.11 |
|
Promissory Note made by IDI, Inc. in favor of Barry Honig, dated as of December 8, 2015, with accompanying Fee Letter (incorporated by reference to Exhibit 4.6 of the Company’s Current Report on Form 8-K filed December 10, 2015). |
|
|
|
|
|
4.12 |
|
Subordination Agreement, dated December 8, 2015, by and among IDI, Inc., Fluent, LLC, substantially all of the direct and indirect subsidiaries of IDI, Inc., Frost Gamma Investments Trust, Michael Brauser, Barry Honig, and Whitehorse Finance, Inc. (incorporated by reference to Exhibit 4.7 of the Company’s Current Report on Form 8-K filed December 10, 2015). |
|
|
|
|
|
4.13 |
|
Stockholders’ Agreement, dated as of December 8, 2015, by and among IDI, Inc., the selling stockholders of Fluent, Inc., Frost Gamma Investments Trust, James Reilly, Derek Dubner, Marlin Capital Investments, LLC, and Michael Brauser. (incorporated by reference to Exhibit 4.8 to the Company’s Current Report on Form 8-K filed December 10, 2015). |
|
|
|
|
|
4.14 |
|
Registration Rights Agreement, dated as of December 8, 2015, by and among IDI, Inc. and the selling stockholders of Fluent, Inc. (incorporated by reference to Exhibit 4.9 to the Company’s Current Report on Form 8-K filed December 10, 2015). |
|
|
|
|
|
4.15 |
|
Form of Warrant (incorporated by reference to Exhibit 4.1 to the Company’s Current Report on Form 8-K filed on May 18, 2016). |
|
|
|
|
|
4.16 |
|
Form of New Warrant (incorporated by reference to Exhibit 4.2 to the Company’s Current Report on Form 8-K filed on May 18, 2016). |
|
|
|
|
50
|
|
Form of Common Stock Certificate of Cogint, Inc. (incorporated by reference to Exhibit 4.1 to the Company’s Current Report on Form 8-K filed on September 26, 2016). |
|
|
|
|
|
|
4.18 |
|
Form of Amended and Restated Existing Warrant (incorporated by reference to Exhibit 4.1 to the Company’s Current Report on Form 8-K filed on October 6, 2016). |
|
|
|
|
|
4.19 |
|
Form of New Warrant (incorporated by reference to Exhibit 4.2 to the Company’s Current Report on Form 8-K filed on October 6, 2016). |
|
|
|
|
|
4.20 |
|
Form of Purchasers’ warrant (incorporated by reference to Exhibit 4.1 to the Company’s Current Report on Form 8-K filed on November 23, 2016). |
|
|
|
|
|
4.21 |
|
Form of Chardan Capital warrant (incorporated by reference to Exhibit 4.2 to the Company’s Current Report on Form 8-K filed on November 23, 2016). |
|
|
|
|
|
10.1 |
|
Tiger Media, Inc. (fka SearchMedia Holdings Limited) Amended and Restated 2008 Share Incentive Plan (incorporated by reference to Exhibit 10.13 of the Company’s Current Report on Form 8-K dated November 5, 2009 (File No. 333-158336)).+ |
|
|
|
|
|
10.2 |
|
Amendment to Tiger Media, Inc. Amended and Restated 2008 Share Incentive Plan effective September 13, 2011 (incorporated by reference to Exhibit 4.3 of the Company’s Annual Report on Form 20-F dated April 19, 2013 (File No. 333-158336)).+ |
|
|
|
|
|
10.3 |
|
Amendment to Tiger Media, Inc. Amended and Restated 2008 Share Incentive Plan effective December 14, 2012 (incorporated by reference to Exhibit 4.4 of the Company’s Annual Report on Form 20-F dated April 19, 2013 (File No. 333-158336)).+ |
|
|
|
|
|
10.4 |
|
Tiger Media, Inc. Form of Stock Option Agreement for Employees (incorporated by reference to Exhibit 4.8 of the Company’s Annual Report on Form 20-F dated April 19, 2013 (File No. 333-158336)).+ |
|
|
|
|
|
10.5 |
|
Tiger Media, Inc. Form of Stock Option Agreement for Non-Employees (incorporated by reference to Exhibit 4.9 of the Company’s Annual Report on Form 20-F dated April 19, 2013 (File No. 333-158336)). |
|
|
|
|
|
10.6 |
|
Amendment to the Tiger Media, Inc. Amended and Restated 2008 Share Incentive Plan effective December 17, 2013 (incorporated by reference to Exhibit 4.4 of the Company’s Annual Report on Form 20-F dated March 31, 2014 (File No. 333-158336)).+ |
|
|
|
|
|
10.7 |
|
Form of Lock-Up Agreement (incorporated by reference to Exhibit 10.1 to the Company’s Current Report on Form 8-K filed March 26, 2015). |
|
|
|
|
|
10.8 |
|
Employment Agreement dated as of November 16, 2015 between IDI, Inc. and Michael Brauser (incorporated by reference to Exhibit 10.1 to the Company’s Current Report on Form 8-K filed November 19, 2015).+ |
|
|
|
|
|
10.9 |
|
Employment Agreement dated as of September 30, 2014 between The Best One, Inc. and Derek Dubner, as amended by that certain amendment to Employment Agreement dated as of March 17, 2015 (incorporated by reference to Exhibit 10.2 to the Company’s Current Report on Form 8-K filed March 26, 2015).+ |
|
|
|
|
|
10.10 |
|
Second Amendment to Employment Agreement dated as of November 16, 2015 between IDI, Inc. and Derek Dubner (incorporated by reference to Exhibit 10.2 to the Company’s Current Report on Form 8-K filed November 19, 2015).+ |
|
|
|
|
|
10.11 |
|
Employment Agreement dated as of October 2, 2014 between The Best One, Inc. and James Reilly, as amendment by that certain amendment to Employment Agreement dated as of March 17, 2015 (incorporated by reference to Exhibit 10.1 to the Company’s Current Report on Form 8-K filed June 22, 2015).+ |
|
|
|
|
|
10.12 |
|
Second Amendment to Employment Agreement dated as of November 16, 2015 between IDI, Inc. and James Reilly (incorporated by reference to Exhibit 10.3 to the Company’s Current Report on Form 8-K filed November 19, 2015).+ |
|
|
|
|
|
10.13 |
|
Restricted Stock Unit Agreement dated as of September 30, 2014 between Derek Dubner and The Best One, Inc., (incorporated by reference to Exhibit 10.3 to the Company’s Current Report on Form 8-K filed March 26, 2015).+ |
|
|
|
|
|
10.14 |
|
Securities Purchase Agreement dated as of July 23, 2015 between IDI, Inc. and Intercoastal Capital, LLC (incorporated by reference to Exhibit 10.1 to the Company’s Current Report on Form 8-K filed July 28, 2015). |
|
|
|
|
51
|
|
Placement Agent Agreement dated July 23, 2015 between IDI, Inc. and Chardan Capital Markets, LLC (incorporated by reference to Exhibit 10.2 to the Company’s Current Report on Form 8-K filed July 28, 2015). |
|
|
|
|
|
|
10.16 |
|
Form of Indemnification Agreement (incorporated by reference to Exhibit 10.4 to the Company’s Quarterly Report on Form 10-Q filed August 14, 2015). |
|
|
|
|
|
10.17 |
|
Form of Restricted Stock Unit Agreement with three year vesting, under IDI Inc.’s 2015 Stock Incentive Plan (incorporated by reference to Exhibit 10.5 to the Company’s Quarterly Report on Form 10-Q filed August 14, 2015).+ |
|
|
|
|
|
10.18 |
|
Form of Restricted Stock Unit Agreement with four year vesting, under IDI Inc.’s 2015 Stock Incentive Plan (incorporated by reference to Exhibit 10.6 to the Company’s Quarterly Report on Form 10-Q filed August 14, 2015).+ |
|
|
|
|
|
10.19 |
|
Form of Stock Option Agreement under IDI Inc.’s 2015 Stock Incentive Plan (incorporated by reference to Exhibit 10.7 to the Company’s Quarterly Report on Form 10-Q filed August 14, 2015).+ |
|
|
|
|
|
10.20 |
|
Business Consulting Services Agreement dated October 13, 2014, between The Best One, Inc. and Marlin Capital Investments, LLC (incorporated by reference to Exhibit 10.11 to the Company’s Annual Report on Form 10-K filed April 15, 2015). |
|
|
|
|
|
10.21 |
|
Form of Non-Plan Restricted Stock Unit Agreement dated as of September 30, 2014 (incorporated by reference to Exhibit 10.2 to the Company’s Registration Statement on Form S-8 filed on August 14, 2015). |
|
|
|
|
|
10.22 |
|
Form of Non-Plan Restricted Stock Unit Agreement dated as of October 2, 2014 (incorporated by reference to Exhibit 10.3 to the Company’s Registration Statement on Form S-8 filed on August 14, 2015). |
|
|
|
|
|
10.23 |
|
Contract for Services dated as of August 24, 2015 between IDI, Inc. and DAB Management Group Inc. (incorporated by reference to Exhibit 10.5 to the Company’s Quarterly Report on Form 10-Q filed November 16, 2015). |
|
|
|
|
|
10.24 |
|
2015 Stock Incentive Plan (incorporated by reference to the Company’s Definitive Proxy Statement on Schedule 14A filed on April 30, 2015). |
|
|
|
|
|
10.25 |
|
Credit Agreement dated December 8, 2015, by and among the Company, Fluent Acquisition I, Inc., Fluent, Inc., and Fluent Acquisition II, LLC (now known as Fluent, LLC), the persons party thereto from time to time as guarantors, the financial institutions party thereto from time to time as lenders, and Whitehorse Finance, Inc., as the administrative agent (incorporated by reference to Exhibit 10.1 to the Company’s Current Report on Form 8-K filed December 10, 2015). |
|
|
|
|
|
10.26 |
|
Employment Agreement dated as of July 21, 2014 between Tiger Media, Inc. and Jacky Wang (incorporated by reference to Exhibit 10.26 to the Company’s Annual Report on Form 10-K filed March 18, 2016).+ |
|
|
|
|
|
10.27 |
|
Employment Agreement between Daniel MacLachlan and The Best One, Inc., effective October 2, 2014, as amended (incorporated by reference to Exhibit 10.1 to the Company’s Current Report on Form 8-K filed on April 4, 2016).+ |
|
|
|
|
|
10.28 |
|
Limited Consent and Amendment to Credit Agreement (incorporated by reference to Exhibit 10.1 to the Company’s Current Report on Form 8-K filed on June 8, 2016). |
|
|
|
|
|
10.29 |
|
Securities Purchase Agreement, dated as of May 17, 2016 (incorporated by reference to Exhibit 10.1 to the Company’s Current Report on Form 8-K filed on May 18, 2016). |
|
|
|
|
|
10.30 |
|
Placement Agent Agreement, dated as of May 17, 2016 (incorporated by reference to Exhibit 10.2 to the Company’s Current Report on Form 8-K filed on May 18, 2016). |
|
|
|
|
|
10.31 |
|
Exchange Agreement, dated as of May 18, 2016 (incorporated by reference to Exhibit 10.3 to the Company’s Current Report on Form 8-K filed on May 18, 2016). |
|
|
|
|
|
10.32 |
|
Limited Consent and Amendment No. 2 to Credit Agreement, dated September 30, 2016, by and among Cogint, Inc., Fluent, LLC, the other borrowers party thereto, Whitehorse Finance, Inc., as administrative agent, and the other lenders party thereto (incorporated by reference to Exhibit 10.1 to the Company’s Quarterly Report on Form 10-Q filed November 3, 2016). |
|
|
|
|
|
10.33 |
|
Second Amendment to MacLachlan Employment Agreement, dated October 4, 2016, , by Cogint, Inc. and Daniel MacLachlan. (incorporated by reference to Exhibit 10.2 to the Company’s Quarterly Report on Form 10-Q filed November 3, 2016).+ |
|
|
|
|
52
|
|
Securities Purchase Agreement, dated as of November 23, 2016 (incorporated by reference to Exhibit 10.1 to the Company’s Current Report on Form 8-K filed on November 23, 2016). |
|
|
|
|
|
|
10.35 |
|
Placement Agent Agreement, dated as of November 22, 2016 (incorporated by reference to Exhibit 10.2 to the Company’s Current Report on Form 8-K filed on November 23, 2016). |
|
|
|
|
|
10.36 |
|
Amendment to IDI, Inc. 2015 Stock Incentive Plan effective June 1, 2016 (incorporated by reference to Exhibit 10.2 to the Company's Registration Statement Form S-8 filed on June 3, 2016).+ |
|
|
|
|
|
10.37 |
|
Restricted Stock Unit Agreement with Michael Brauser (incorporated by reference to Exhibit 10.4 to the Company's Registration Statement Form S-8 filed June 3, 2016).+ |
|
|
|
|
|
10.38 |
|
Restricted Stock Unit Agreement with Dr. Phillip Frost (incorporated by reference to Exhibit 10.5 to the Company's Registration Statement Form S-8 filed June 3, 2016).+ |
|
|
|
|
|
10.39 |
|
Amendment No. 3 to Credit Agreement, dated as of January 19, 2017, by and among Cogint, Inc., Fluent, LLC, the other borrowers party thereto, Whitehorse Finance, Inc., as administrative agent, and the other lenders party thereto.* |
|
|
|
|
|
14.1 |
|
Code of Ethics (incorporated by reference to Exhibit 14.1 to the Company’s Current Report on Form 8-K filed on September 26, 2016). |
|
|
|
|
|
21.1 |
|
Subsidiaries of Cogint, Inc.* |
|
|
|
|
|
23.1 |
|
Consent of Grant Thornton LLP * |
|
|
|
|
|
23.2 |
|
Consent of RBSM LLP* |
|
|
|
|
|
23.3 |
|
Consent of EisnerAmper LLP* |
|
|
|
|
|
31.1 |
|
Certification of Chief Executive Officer filed pursuant to Exchange Act Rules 13a-14(a) and 15d-14(a) of the Securities and Exchange Act of 1934 as adopted pursuant to Section 302 of the Sarbanes-Oxley Act of 2002.* |
|
|
|
|
|
31.2 |
|
Certification of Chief Financial Officer filed pursuant to Exchange Act Rules 13a-14(a) and 15d-14(a) of the Securities and Exchange Act of 1934 as adopted pursuant to Section 302 of the Sarbanes-Oxley Act of 2002.* |
|
|
|
|
|
32.1 |
|
Certification by Chief Executive Officer pursuant to 18 U.S.C. Section 1350, as adopted pursuant to Section 906 of the Sarbanes-Oxley Act of 2002.** |
|
|
|
|
|
32.2 |
|
Certification by Chief Financial Officer pursuant to 18 U.S.C. Section 1350, as adopted pursuant to Section 906 of the Sarbanes-Oxley Act of 2002.** |
|
|
|
|
|
99.1 |
|
Consolidated Financial Statements of Fluent, Inc. for the period from January 1, 2015 through December 8, 2015 (incorporated by reference to Exhibit 99.1 to the Company's Annual Report on Form 10-K filed on March 18, 2016). |
|
|
|
|
|
99.2 |
|
Fluent, Inc. audited consolidated financial statements for the year ended December 31, 2014 (incorporated by reference to Exhibit 99.2 to the Company's Current Report on Form 8-K filed on December 2, 2015). |
|
|
|
|
|
101.INS |
|
XBRL Instance Document* |
|
101.SCH |
|
XBRL Taxonomy Extension Schema Document* |
|
101.CAL |
|
XBRL Taxonomy Extension Calculation Linkbase Document* |
|
101.DEF |
|
XBRL Taxonomy Extension Definition Linkbase Document* |
|
101.LAB |
|
XBRL Taxonomy Extension Label Linkbase Document* |
|
101.PRE |
|
XBRL Taxonomy Extension Presentation Linkbase Document* |
|
|
|
|
|
+ |
|
Management contract or compensatory plan or arrangement |
|
* |
|
Filed herewith |
|
** |
|
Furnished herewith |
Registrants may voluntarily include a summary of information required by Form 10-K under this Item 16. The Company has elected not to include such summary information.
53
Pursuant to the requirements of Section 13 or 15(d) of the Securities Exchange Act of 1934, the registrant has duly caused this report to be signed on its behalf by the undersigned, thereunto duly authorized.
|
March 14, 2017 |
|
|
|
|
COGINT, INC. |
|
|
|
|
|
|
|
|
|
|
|
By: |
|
/s/ Michael Brauser |
|
|
|
|
|
|
Michael Brauser |
|
|
|
|
|
|
Executive Chairman |
|
|
|
|
|
|
|
|
|
|
|
By: |
|
/s/ Daniel MacLachlan |
|
|
|
|
|
|
Daniel MacLachlan |
|
|
|
|
|
|
Chief Financial Officer |
|
|
|
|
|
|
|
|
|
|
|
By: |
|
/s/ Jacky Wang |
|
|
|
|
|
|
Jacky Wang |
|
|
|
|
|
|
Chief Accounting Officer |
Pursuant to the requirements of the Securities Exchange Act of 1934, this report has been signed below by the following persons on behalf of the registrant and in the capacities and on the dates indicated.
|
Signature |
|
Title |
|
Date |
|
|
|
|
|
|
|
/s/ Michael Brauser |
|
Executive Chairman |
|
March 14, 2017 |
|
Michael Brauser |
|
(Principal Executive Officer) |
|
|
|
|
|
|
|
|
|
/s/ Phillip Frost |
|
Vice Chairman |
|
March 14, 2017 |
|
Dr. Phillip Frost |
|
|
|
|
|
|
|
|
|
|
|
/s/ Derek Dubner |
|
Chief Executive Officer and Director |
|
March 14, 2017 |
|
Derek Dubner |
|
|
|
|
|
|
|
|
|
|
|
/s/ Daniel MacLachlan |
|
Chief Financial Officer |
|
March 14, 2017 |
|
Daniel MacLachlan |
|
(Principal Financial Officer) |
|
|
|
|
|
|
|
|
|
/s/ Jacky Wang |
|
Chief Accounting Officer |
|
March 14, 2017 |
|
Jacky Wang |
|
(Principal Accounting Officer) |
|
|
|
|
|
|
|
|
|
/s/ Steven D. Rubin |
|
Director |
|
March 14, 2017 |
|
Steven D. Rubin |
|
|
|
|
|
|
|
|
|
|
|
/s Ryan Schulke |
|
Director |
|
March 14, 2017 |
|
Ryan Schulke |
|
|
|
|
|
|
|
|
|
|
|
/s/ Robert N. Fried |
|
Director |
|
March 14, 2017 |
|
Robert N. Fried |
|
|
|
|
|
|
|
|
|
|
|
/s/ Peter Benz |
|
Director |
|
March 14, 2017 |
|
Peter Benz |
|
|
|
|
|
|
|
|
|
|
|
/s/ Robert Swayman |
|
Director |
|
March 14, 2017 |
|
Robert Swayman |
|
|
|
|
|
|
|
|
|
|
|
/s/ Donald Mathis |
|
Director |
|
March 14, 2017 |
|
Donald Mathis |
|
|
|
|
54
ITEM 8. FINANCIAL STATEMENTS AND SUPPLEMENTARY DATA
Index to Financial Statements
F-1
REPORT OF INDEPENDENT REGISTERED PUBLIC ACCOUNTING FIRM
Board of Directors and Shareholders
Cogint, Inc. (formerly IDI, Inc.)
We have audited the internal control over financial reporting of Cogint, Inc. (formerly IDI, Inc.) (a Delaware corporation) and subsidiaries (the “Company”) as of December 31, 2016, based on criteria established in the 2013 Internal Control—Integrated Framework issued by the Committee of Sponsoring Organizations of the Treadway Commission (COSO). The Company’s management is responsible for maintaining effective internal control over financial reporting and for its assessment of the effectiveness of internal control over financial reporting, included in the accompanying Management’s Annual Report on Internal Control over Financial Reporting (“Management’s Report”). Our responsibility is to express an opinion on the Company’s internal control over financial reporting based on our audit. Our audit of, and opinion on, the Company’s internal control over financial reporting does not include the internal control over financial reporting of Q Interactive, LLC, a wholly-owned subsidiary, whose financial statements reflect total assets and revenues constituting 8 and 12 percent, respectively, of the related consolidated financial statement amounts as of and for the year ended December 31, 2016. As indicated in Management’s Report, Q Interactive, LLC, was acquired during 2016. Management’s assertion on the effectiveness of the Company’s internal control over financial reporting excluded internal control over financial reporting of Q Interactive, LLC.
We conducted our audit in accordance with the standards of the Public Company Accounting Oversight Board (United States). Those standards require that we plan and perform the audit to obtain reasonable assurance about whether effective internal control over financial reporting was maintained in all material respects. Our audit included obtaining an understanding of internal control over financial reporting, assessing the risk that a material weakness exists, testing and evaluating the design and operating effectiveness of internal control based on the assessed risk, and performing such other procedures as we considered necessary in the circumstances. We believe that our audit provides a reasonable basis for our opinion.
A company’s internal control over financial reporting is a process designed to provide reasonable assurance regarding the reliability of financial reporting and the preparation of financial statements for external purposes in accordance with generally accepted accounting principles. A company’s internal control over financial reporting includes those policies and procedures that (1) pertain to the maintenance of records that, in reasonable detail, accurately and fairly reflect the transactions and dispositions of the assets of the company; (2) provide reasonable assurance that transactions are recorded as necessary to permit preparation of financial statements in accordance with generally accepted accounting principles, and that receipts and expenditures of the company are being made only in accordance with authorizations of management and directors of the company; and (3) provide reasonable assurance regarding prevention or timely detection of unauthorized acquisition, use, or disposition of the company’s assets that could have a material effect on the financial statements.
Because of its inherent limitations, internal control over financial reporting may not prevent or detect misstatements. Also, projections of any evaluation of effectiveness to future periods are subject to the risk that controls may become inadequate because of changes in conditions, or that the degree of compliance with the policies or procedures may deteriorate.
In our opinion, the Company maintained, in all material respects, effective internal control over financial reporting as of December 31, 2016, based on criteria established in the 2013 Internal Control—Integrated Framework issued by COSO.
We also have audited, in accordance with the standards of the Public Company Accounting Oversight Board (United States), the consolidated financial statements of the Company as of and for the year ended December 31, 2016, and our report dated March 14, 2017 expressed an unqualified opinion on those financial statements.
|
/s/ GRANT THORNTON LLP |
|
Fort Lauderdale, Florida |
|
March 14, 2017 |
F-2
REPORT OF INDEPENDENT REGISTERED PUBLIC ACCOUNTING FIRM
Board of Directors and Shareholders
Cogint, Inc. (formerly IDI, Inc.)
We have audited the accompanying consolidated balance sheets of Cogint, Inc. (formerly IDI, Inc.) (a Delaware corporation) and subsidiaries (the “Company”) as of December 31, 2016 and 2015, and the related consolidated statements of operations and comprehensive loss, changes in shareholders’ equity, and cash flows for the years then ended. These financial statements are the responsibility of the Company’s management. Our responsibility is to express an opinion on these financial statements based on our audits.
We conducted our audits in accordance with the standards of the Public Company Accounting Oversight Board (United States). Those standards require that we plan and perform the audit to obtain reasonable assurance about whether the financial statements are free of material misstatement. An audit includes examining, on a test basis, evidence supporting the amounts and disclosures in the financial statements. An audit also includes assessing the accounting principles used and significant estimates made by management, as well as evaluating the overall financial statement presentation. We believe that our audits provide a reasonable basis for our opinion.
In our opinion, the consolidated financial statements referred to above present fairly, in all material respects, the financial position of Cogint, Inc. (formerly IDI, Inc.) and subsidiaries as of December 31, 2016 and 2015, and the results of their operations and their cash flows for the years then ended in conformity with accounting principles generally accepted in the United States of America.
We also have audited, in accordance with the standards of the Public Company Accounting Oversight Board (United States), the Company’s internal control over financial reporting as of December 31, 2016, based on criteria established in the 2013 Internal Control—Integrated Framework issued by the Committee of Sponsoring Organizations of the Treadway Commission (COSO), and our report dated March 14, 2017 expressed an unqualified opinion.
|
/s/ GRANT THORNTON LLP |
|
|
|
Fort Lauderdale, Florida |
|
March 14, 2017 |
F-3
REPORT OF INDEPENDENT REGISTERED PUBLIC ACCOUNTING FIRM
To the Board of Directors
IDI HOLDINGS, LLC
We have audited the accompanying consolidated balance sheet of IDI HOLDINGS, LLC. (formerly known as The Best One, Inc.) as of December 31, 2014, and the related consolidated statement of operations, statement of shareholders’ equity and cash flows for the period from September 22, 2014 (inception) through December 31, 2014. The Company’s management is responsible for these financial statements. Our responsibility is to express an opinion on these consolidated financial statements based on our audit.
We conducted our audit in accordance with the standards of the Public Company Accounting Oversight Board (United States). Those standards require that we plan and perform the audit to obtain reasonable assurance about whether the financial statements are free of material misstatement. The Company is not required to have, nor were we engaged to perform, an audit of its internal control over financial reporting. Our audit included consideration of internal control over financial reporting as a basis for designing audit procedures that are appropriate in the circumstances, but not for the purpose of expressing an opinion on the effectiveness of the Company’s internal control over financial reporting. Accordingly, we express no such opinion. An audit also includes examining, on a test basis, evidence supporting the amounts and disclosures in the financial statements, assessing the accounting principles used and significant estimates made by management, as well as evaluating the overall financial statement presentation. We believe that our audit provides a reasonable basis for our opinion.
In our opinion, the financial statements referred to above present fairly, in all material respects, the consolidated financial position of IDI HOLDINGS, LLC as of December 31, 2014, and the results of its operations and its cash flows for the period from September 22, 2014 (Inception) through December 31, 2014 in conformity with accounting principles generally accepted in the United States of America.
/s/ RBSM LLP
New York, New York
March 18, 2016
F-4
(Amounts in thousands, except share data)
|
|
|
December 31, 2016 |
|
|
December 31, 2015 |
|
||
|
ASSETS: |
|
|
|
|
|
|
|
|
|
Current assets: |
|
|
|
|
|
|
|
|
|
Cash and cash equivalents |
|
$ |
10,089 |
|
|
$ |
13,462 |
|
|
Accounts receivable, net of allowance for doubtful accounts of $790 and $318 at December 31, 2016 and 2015, respectively |
|
|
30,958 |
|
|
|
21,224 |
|
|
Prepaid expenses and other current assets |
|
|
2,053 |
|
|
|
2,931 |
|
|
Total current assets |
|
|
43,100 |
|
|
|
37,617 |
|
|
Property and equipment, net |
|
|
1,350 |
|
|
|
1,062 |
|
|
Intangible assets, net |
|
|
98,531 |
|
|
|
87,445 |
|
|
Goodwill |
|
|
166,256 |
|
|
|
161,753 |
|
|
Other non-current assets |
|
|
2,674 |
|
|
|
1,315 |
|
|
Total assets |
|
$ |
311,911 |
|
|
$ |
289,192 |
|
|
LIABILITIES AND SHAREHOLDERS’ EQUITY: |
|
|
|
|
|
|
|
|
|
Current liabilities: |
|
|
|
|
|
|
|
|
|
Trade accounts payable |
|
$ |
14,725 |
|
|
$ |
8,863 |
|
|
Accrued expenses and other current liabilities |
|
|
6,981 |
|
|
|
9,160 |
|
|
Deferred revenue |
|
|
318 |
|
|
|
783 |
|
|
Current portion of long-term debt |
|
|
4,135 |
|
|
|
2,250 |
|
|
Total current liabilities |
|
|
26,159 |
|
|
|
21,056 |
|
|
Promissory notes payable to certain shareholders, net |
|
|
10,748 |
|
|
|
9,618 |
|
|
Long-term debt, net |
|
|
35,130 |
|
|
|
39,050 |
|
|
Contingent consideration payable in stock |
|
|
10,225 |
|
|
|
- |
|
|
Deferred tax liabilities |
|
|
- |
|
|
|
13,573 |
|
|
Total liabilities |
|
|
82,262 |
|
|
|
83,297 |
|
|
Shareholders' equity: |
|
|
|
|
|
|
|
|
|
Convertible Series A preferred stock—$0.0001 par value 10,000,000 shares authorized; 0 and 4,871,802 shares issued and outstanding at December 31, 2016 and 2015, respectively |
|
|
- |
|
|
|
- |
|
|
Convertible Series B preferred stock—$0.0001 par value 10,000,000 shares authorized; 0 and 450,962 shares issued and outstanding at December 31, 2016 and 2015, respectively |
|
|
- |
|
|
|
- |
|
|
Common stock—$0.0005 par value 200,000,000 shares authorized; 53,717,996 and 15,709,786 shares issued at December 31, 2016 and 2015, respectively; and 53,557,761 and 15,709,786 shares outstanding at December 31, 2016 and 2015, respectively |
|
|
27 |
|
|
|
8 |
|
|
Treasury stock, at cost, 160,235 and 0 shares at December 31, 2016 and 2015, respectively |
|
|
(531 |
) |
|
|
- |
|
|
Additional paid-in capital |
|
|
344,384 |
|
|
|
291,032 |
|
|
Accumulated deficit |
|
|
(114,231 |
) |
|
|
(85,145 |
) |
|
Total shareholders’ equity |
|
|
229,649 |
|
|
|
205,895 |
|
|
Total liabilities and shareholders’ equity |
|
$ |
311,911 |
|
|
$ |
289,192 |
|
See notes to consolidated financial statements
F-5
CONSOLIDATED STATEMENTS OF OPERATIONS AND COMPREHENSIVE LOSS
(Amounts in thousands, except share data)
|
|
|
Year Ended December 31, |
|
|||||||||
|
|
|
2016 |
|
|
2015 |
|
|
2014 |
|
|||
|
Revenue |
|
$ |
186,836 |
|
|
$ |
14,091 |
|
|
$ |
817 |
|
|
Cost of revenues (exclusive of depreciation and amortization) |
|
|
133,798 |
|
|
|
10,253 |
|
|
|
337 |
|
|
Gross profit |
|
|
53,038 |
|
|
|
3,838 |
|
|
|
480 |
|
|
Operating expenses: |
|
|
|
|
|
|
|
|
|
|
|
|
|
Sales and marketing expenses |
|
|
16,296 |
|
|
|
2,925 |
|
|
|
325 |
|
|
General and administrative expenses |
|
|
54,094 |
|
|
|
44,472 |
|
|
|
915 |
|
|
Depreciation and amortization |
|
|
12,631 |
|
|
|
841 |
|
|
|
17 |
|
|
Write-off of intangible assets |
|
|
4,055 |
|
|
|
- |
|
|
|
- |
|
|
Total operating expenses |
|
|
87,076 |
|
|
|
48,238 |
|
|
|
1,257 |
|
|
Loss from operations |
|
|
(34,038 |
) |
|
|
(44,400 |
) |
|
|
(777 |
) |
|
Other income (expense): |
|
|
|
|
|
|
|
|
|
|
|
|
|
Interest expense, net |
|
|
(7,593 |
) |
|
|
(468 |
) |
|
|
- |
|
|
Contingent earn out costs |
|
|
- |
|
|
|
(14,300 |
) |
|
|
- |
|
|
Other expenses, net |
|
|
(1,497 |
) |
|
|
- |
|
|
|
- |
|
|
Total other expense |
|
|
(9,090 |
) |
|
|
(14,768 |
) |
|
|
- |
|
|
Loss from continuing operations before income taxes |
|
|
(43,128 |
) |
|
|
(59,168 |
) |
|
|
(777 |
) |
|
Income taxes |
|
|
(14,042 |
) |
|
|
(16,583 |
) |
|
|
(167 |
) |
|
Net loss from continuing operations |
|
|
(29,086 |
) |
|
|
(42,585 |
) |
|
|
(610 |
) |
|
Discontinued operations: |
|
|
|
|
|
|
|
|
|
|
|
|
|
Pretax loss from operations of discontinued operations |
|
|
- |
|
|
|
(1,236 |
) |
|
|
- |
|
|
Pretax loss on disposal of discontinued operations |
|
|
- |
|
|
|
(41,095 |
) |
|
|
- |
|
|
Income taxes |
|
|
- |
|
|
|
127 |
|
|
|
- |
|
|
Net loss from discontinued operations |
|
|
- |
|
|
|
(42,458 |
) |
|
|
- |
|
|
Less: Non-controlling interests |
|
|
- |
|
|
|
(508 |
) |
|
|
- |
|
|
Net loss from discontinued operations attributable to cogint |
|
|
- |
|
|
|
(41,950 |
) |
|
|
- |
|
|
Net loss attributable to cogint |
|
$ |
(29,086 |
) |
|
$ |
(84,535 |
) |
|
$ |
(610 |
) |
|
Loss per share |
|
|
|
|
|
|
|
|
|
|
|
|
|
Basic and diluted |
|
|
|
|
|
|
|
|
|
|
|
|
|
Continuing operations |
|
$ |
(0.65 |
) |
|
$ |
(3.27 |
) |
|
$ |
(0.14 |
) |
|
Discontinued operations |
|
|
- |
|
|
|
(3.22 |
) |
|
|
- |
|
|
|
|
$ |
(0.65 |
) |
|
$ |
(6.48 |
) |
|
$ |
(0.14 |
) |
|
Weighted average number of shares outstanding - |
|
|
|
|
|
|
|
|
|
|
|
|
|
Basic and diluted |
|
|
44,536,906 |
|
|
|
13,036,082 |
|
|
|
4,501,041 |
|
|
Comprehensive (loss) income: |
|
|
|
|
|
|
|
|
|
|
|
|
|
Net loss attributable to cogint |
|
$ |
(29,086 |
) |
|
$ |
(84,535 |
) |
|
$ |
(610 |
) |
|
Foreign currency translation adjustment: |
|
|
|
|
|
|
|
|
|
|
|
|
|
Unrealized |
|
|
- |
|
|
|
(130 |
) |
|
|
- |
|
|
Realized upon the disposal of discontinued operations |
|
|
- |
|
|
|
130 |
|
|
|
- |
|
|
Net comprehensive loss |
|
$ |
(29,086 |
) |
|
$ |
(84,535 |
) |
|
$ |
(610 |
) |
See notes to consolidated financial statements
F-6
CONSOLIDATED STATEMENTS OF CHANGES IN SHAREHOLDERS’ EQUITY
(Amounts in thousands, except share data)
|
|
|
Convertible Series A preferred stock |
|
|
Convertible Series B preferred stock |
|
|
Common stock |
|
|
Treasury stock |
|
|
Additional paid-in |
|
|
Accumulated other |
|
|
Accumulated |
|
|
Non-controlling |
|
|
Total Shareholders' |
|
|||||||||||||||||||||||||
|
|
|
Shares |
|
|
Amount |
|
|
Shares |
|
|
Amount |
|
|
Shares |
|
|
Amount |
|
|
Shares |
|
|
Amount |
|
|
capital |
|
|
comprehensive loss |
|
|
deficit |
|
|
interests |
|
|
equity |
|
|||||||||||||
|
Balance as at September 22, 2014 (inception) |
|
|
- |
|
|
$ |
- |
|
|
|
- |
|
|
$ |
- |
|
|
|
1,000,001 |
|
|
$ |
- |
|
|
|
- |
|
|
$ |
- |
|
|
$ |
- |
|
|
$ |
- |
|
|
$ |
- |
|
|
$ |
- |
|
|
$ |
- |
|
|
Issuance of shares, net of offering costs |
|
|
4,965,302 |
|
|
|
- |
|
|
|
- |
|
|
|
- |
|
|
|
5,312,709 |
|
|
|
3 |
|
|
|
- |
|
|
|
- |
|
|
|
12,691 |
|
|
|
- |
|
|
|
- |
|
|
|
- |
|
|
|
12,694 |
|
|
Issuance of common shares as a result of acquisition |
|
|
- |
|
|
|
- |
|
|
|
- |
|
|
|
- |
|
|
|
284,445 |
|
|
|
- |
|
|
|
- |
|
|
|
- |
|
|
|
- |
|
|
|
- |
|
|
|
- |
|
|
|
- |
|
|
|
- |
|
|
Share-based compensation expense |
|
|
- |
|
|
|
- |
|
|
|
- |
|
|
|
- |
|
|
|
- |
|
|
|
- |
|
|
|
- |
|
|
|
- |
|
|
|
23 |
|
|
|
- |
|
|
|
- |
|
|
|
- |
|
|
|
23 |
|
|
Net loss |
|
|
- |
|
|
|
- |
|
|
|
- |
|
|
|
- |
|
|
|
- |
|
|
|
- |
|
|
|
- |
|
|
|
- |
|
|
|
- |
|
|
|
- |
|
|
|
(610 |
) |
|
|
- |
|
|
|
(610 |
) |
|
Balance as at December 31, 2014 |
|
|
4,965,302 |
|
|
$ |
- |
|
|
|
- |
|
|
$ |
- |
|
|
|
6,597,155 |
|
|
$ |
3 |
|
|
|
- |
|
|
$ |
- |
|
|
$ |
12,714 |
|
|
$ |
- |
|
|
$ |
(610 |
) |
|
$ |
- |
|
|
$ |
12,107 |
|
|
Issuance of common shares as a result of the reverse acquisition |
|
|
- |
|
|
|
- |
|
|
|
- |
|
|
|
- |
|
|
|
7,291,299 |
|
|
|
4 |
|
|
|
- |
|
|
|
- |
|
|
|
44,108 |
|
|
|
- |
|
|
|
- |
|
|
|
- |
|
|
|
44,112 |
|
|
Additions as a result of the reverse acquisition |
|
|
- |
|
|
|
- |
|
|
|
- |
|
|
|
- |
|
|
|
- |
|
|
|
- |
|
|
|
- |
|
|
|
- |
|
|
|
- |
|
|
|
- |
|
|
|
- |
|
|
|
425 |
|
|
|
425 |
|
|
Vesting of restricted stock units |
|
|
- |
|
|
|
- |
|
|
|
- |
|
|
|
- |
|
|
|
382,300 |
|
|
|
- |
|
|
|
- |
|
|
|
- |
|
|
|
- |
|
|
|
- |
|
|
|
- |
|
|
|
- |
|
|
|
- |
|
|
Issuance of common shares upon cashless exercise of warrants |
|
|
- |
|
|
|
- |
|
|
|
- |
|
|
|
- |
|
|
|
20,122 |
|
|
|
- |
|
|
|
- |
|
|
|
- |
|
|
|
- |
|
|
|
- |
|
|
|
- |
|
|
|
- |
|
|
|
- |
|
|
Issuance of common shares upon a direct offering to an institutional investor, net of issuance costs of $600 |
|
|
- |
|
|
|
- |
|
|
|
- |
|
|
|
- |
|
|
|
1,280,410 |
|
|
|
1 |
|
|
|
- |
|
|
|
- |
|
|
|
9,399 |
|
|
|
- |
|
|
|
- |
|
|
|
- |
|
|
|
9,400 |
|
|
Issuance of Series B Preferred upon sales of securities to certain investors, net of issuance costs of $220 |
|
|
- |
|
|
|
- |
|
|
|
149,925 |
|
|
|
- |
|
|
|
- |
|
|
|
- |
|
|
|
- |
|
|
|
- |
|
|
|
49,780 |
|
|
|
- |
|
|
|
- |
|
|
|
- |
|
|
|
49,780 |
|
|
Issuance of Series B Preferred related to promissory notes |
|
|
- |
|
|
|
- |
|
|
|
1,000 |
|
|
|
- |
|
|
|
- |
|
|
|
- |
|
|
|
- |
|
|
|
- |
|
|
|
413 |
|
|
|
- |
|
|
|
- |
|
|
|
- |
|
|
|
413 |
|
|
Issuance of Series B Preferred in relation to Fluent acquisition |
|
|
- |
|
|
|
- |
|
|
|
300,037 |
|
|
|
- |
|
|
|
- |
|
|
|
- |
|
|
|
- |
|
|
|
- |
|
|
|
123,766 |
|
|
|
- |
|
|
|
- |
|
|
|
- |
|
|
|
123,766 |
|
|
Conversion of Series A Preferred shares into common shares |
|
|
(93,500 |
) |
|
|
- |
|
|
|
- |
|
|
|
- |
|
|
|
93,500 |
|
|
|
- |
|
|
|
- |
|
|
|
- |
|
|
|
- |
|
|
|
- |
|
|
|
- |
|
|
|
- |
|
|
|
- |
|
|
Issuance of common shares to vendors for services rendered |
|
|
- |
|
|
|
- |
|
|
|
- |
|
|
|
- |
|
|
|
45,000 |
|
|
|
- |
|
|
|
- |
|
|
|
- |
|
|
|
433 |
|
|
|
- |
|
|
|
- |
|
|
|
- |
|
|
|
433 |
|
|
Share-based compensation expense |
|
|
- |
|
|
|
- |
|
|
|
- |
|
|
|
- |
|
|
|
- |
|
|
|
- |
|
|
|
- |
|
|
|
- |
|
|
|
34,533 |
|
|
|
- |
|
|
|
- |
|
|
|
- |
|
|
|
34,533 |
|
|
Contingent earn out costs |
|
|
- |
|
|
|
- |
|
|
|
- |
|
|
|
- |
|
|
|
- |
|
|
|
- |
|
|
|
- |
|
|
|
- |
|
|
|
14,300 |
|
|
|
- |
|
|
|
- |
|
|
|
- |
|
|
|
14,300 |
|
|
Net loss attributable to cogint |
|
|
- |
|
|
|
- |
|
|
|
- |
|
|
|
- |
|
|
|
- |
|
|
|
- |
|
|
|
- |
|
|
|
- |
|
|
|
- |
|
|
|
- |
|
|
|
(84,535 |
) |
|
|
- |
|
|
|
(84,535 |
) |
|
Net loss attributable to non-controlling interests |
|
|
- |
|
|
|
- |
|
|
|
- |
|
|
|
- |
|
|
|
- |
|
|
|
- |
|
|
|
- |
|
|
|
- |
|
|
|
- |
|
|
|
- |
|
|
|
- |
|
|
|
(508 |
) |
|
|
(508 |
) |
|
Foreign currency translation adjustment |
|
|
- |
|
|
|
- |
|
|
|
- |
|
|
|
- |
|
|
|
- |
|
|
|
- |
|
|
|
- |
|
|
|
- |
|
|
|
- |
|
|
|
(130 |
) |
|
|
- |
|
|
|
- |
|
|
|
(130 |
) |
|
Changes as a result of the disposal of discontinued operations |
|
|
- |
|
|
|
- |
|
|
|
- |
|
|
|
- |
|
|
|
- |
|
|
|
- |
|
|
|
- |
|
|
|
- |
|
|
|
- |
|
|
|
130 |
|
|
|
- |
|
|
|
83 |
|
|
|
213 |
|
|
Issuance of warrants in relation to term loan |
|
|
- |
|
|
|
- |
|
|
|
- |
|
|
|
- |
|
|
|
- |
|
|
|
- |
|
|
|
- |
|
|
|
- |
|
|
|
1,586 |
|
|
|
- |
|
|
|
- |
|
|
|
- |
|
|
|
1,586 |
|
|
Balance as at December 31, 2015 |
|
|
4,871,802 |
|
|
$ |
- |
|
|
|
450,962 |
|
|
$ |
- |
|
|
|
15,709,786 |
|
|
$ |
8 |
|
|
$ |
- |
|
|
$ |
- |
|
|
$ |
291,032 |
|
|
$ |
- |
|
|
$ |
(85,145 |
) |
|
$ |
- |
|
|
$ |
205,895 |
|
|
Issuance of contingent earn out shares |
|
|
1,800,220 |
|
|
|
- |
|
|
|
- |
|
|
|
- |
|
|
|
900,108 |
|
|
|
- |
|
|
|
- |
|
|
|
- |
|
|
|
- |
|
|
|
- |
|
|
|
- |
|
|
|
- |
|
|
|
- |
|
|
Conversion of Series A preferred stock into common stock |
|
|
(6,672,022 |
) |
|
|
- |
|
|
|
- |
|
|
|
- |
|
|
|
6,672,022 |
|
|
|
3 |
|
|
|
- |
|
|
|
- |
|
|
|
(3 |
) |
|
|
- |
|
|
|
- |
|
|
|
- |
|
|
|
- |
|
F-7
See notes to consolidated financial statements
F-8
CONSOLIDATED STATEMENTS OF CASH FLOWS
(Amounts in thousands, except share data)
|
|
|
Year Ended December 31, |
|
|||||||||
|
|
|
2016 |
|
|
2015 |
|
|
2014 |
|
|||
|
CASH FLOWS FROM OPERATING ACTIVITIES: |
|
|
|
|
|
|
|
|
|
|
|
|
|
Net loss |
|
$ |
(29,086 |
) |
|
$ |
(84,535 |
) |
|
$ |
(610 |
) |
|
Less: Loss from discontinued operations, net of tax |
|
|
- |
|
|
|
(41,950 |
) |
|
|
- |
|
|
Adjustments to reconcile net loss to net cash provided by (used in) operating activities: |
|
|
|
|
|
|
|
|
|
|
|
|
|
Depreciation and amortization |
|
|
12,631 |
|
|
|
841 |
|
|
|
17 |
|
|
Non-cash interest expenses and related amortization |
|
|
2,519 |
|
|
|
151 |
|
|
|
- |
|
|
Share-based payments |
|
|
29,249 |
|
|
|
34,160 |
|
|
|
23 |
|
|
Non-cash contingent earn out costs |
|
|
- |
|
|
|
14,300 |
|
|
|
- |
|
|
Non-cash loss on exchange of warrants |
|
|
1,273 |
|
|
|
- |
|
|
|
- |
|
|
Write-off of Purchased IP and capitalized litigation costs |
|
|
4,055 |
|
|
|
- |
|
|
|
- |
|
|
Provision for bad debts |
|
|
772 |
|
|
|
213 |
|
|
|
105 |
|
|
Deferred income tax benefit |
|
|
(14,129 |
) |
|
|
(16,460 |
) |
|
|
(270 |
) |
|
Changes in assets and liabilities of continuing operations, net of the effects of acquisitions: |
|
|
|
|
|
|
|
|
|
|
|
|
|
Accounts receivable |
|
|
(5,833 |
) |
|
|
(893 |
) |
|
|
(138 |
) |
|
Prepaid expenses and other current assets |
|
|
2,095 |
|
|
|
(1,574 |
) |
|
|
(139 |
) |
|
Other non-current assets |
|
|
(1,359 |
) |
|
|
(513 |
) |
|
|
(38 |
) |
|
Trade accounts payable |
|
|
3,565 |
|
|
|
142 |
|
|
|
86 |
|
|
Accrued expenses and other current liabilities |
|
|
(3,136 |
) |
|
|
1,642 |
|
|
|
414 |
|
|
Amounts due to related parties |
|
|
- |
|
|
|
(66 |
) |
|
|
52 |
|
|
Deferred revenue |
|
|
(517 |
) |
|
|
306 |
|
|
|
24 |
|
|
Net cash provided by (used in) operating activities from continuing operations |
|
|
2,099 |
|
|
|
(10,336 |
) |
|
|
(474 |
) |
|
Net cash used in operating activities from discontinued operations |
|
|
- |
|
|
|
(337 |
) |
|
|
- |
|
|
Net cash provided by (used in) operating activities |
|
|
2,099 |
|
|
|
(10,673 |
) |
|
|
(474 |
) |
|
CASH FLOWS FROM INVESTING ACTIVITIES: |
|
|
|
|
|
|
|
|
|
|
|
|
|
Purchase of property and equipment |
|
|
(762 |
) |
|
|
(662 |
) |
|
|
(85 |
) |
|
Purchase of intangible assets |
|
|
- |
|
|
|
(250 |
) |
|
|
(27 |
) |
|
Capitalized costs included in intangible assets |
|
|
(10,164 |
) |
|
|
(3,065 |
) |
|
|
(186 |
) |
|
Proceeds from reverse acquisition |
|
|
- |
|
|
|
3,569 |
|
|
|
- |
|
|
Acquisition, net of cash acquired |
|
|
(50 |
) |
|
|
(93,276 |
) |
|
|
(5,926 |
) |
|
Deposits as collateral |
|
|
(1,050 |
) |
|
|
- |
|
|
|
- |
|
|
Net cash used in investing activities from continuing operations |
|
|
(12,026 |
) |
|
|
(93,684 |
) |
|
|
(6,224 |
) |
|
Net cash used in investing activities from discontinued operations |
|
|
- |
|
|
|
(121 |
) |
|
|
- |
|
|
Net cash used in investing activities |
|
|
(12,026 |
) |
|
|
(93,805 |
) |
|
|
(6,224 |
) |
|
CASH FLOWS FROM FINANCING ACTIVITIES: |
|
|
|
|
|
|
|
|
|
|
|
|
|
Proceeds from issuance of shares, net of issuance costs |
|
|
10,079 |
|
|
|
59,180 |
|
|
|
12,694 |
|
|
Proceeds for debt obligations |
|
|
- |
|
|
|
55,000 |
|
|
|
- |
|
|
Debt costs |
|
|
(682 |
) |
|
|
(2,236 |
) |
|
|
- |
|
|
Repayments of long-term debt |
|
|
(2,250 |
) |
|
|
- |
|
|
|
- |
|
|
Taxes paid related to net share settlement of vesting of restricted stock units |
|
|
(1,193 |
) |
|
|
- |
|
|
|
- |
|
|
Sale of treasury stock |
|
|
600 |
|
|
|
- |
|
|
|
- |
|
|
Net cash provided by financing activities |
|
|
6,554 |
|
|
|
111,944 |
|
|
|
12,694 |
|
|
Net (decrease) increase in cash and cash equivalents |
|
$ |
(3,373 |
) |
|
$ |
7,466 |
|
|
$ |
5,996 |
|
|
Cash and cash equivalents at beginning of period |
|
|
13,462 |
|
|
|
5,996 |
|
|
|
- |
|
|
Cash and cash equivalents at end of period |
|
$ |
10,089 |
|
|
$ |
13,462 |
|
|
$ |
5,996 |
|
|
SUPPLEMENTAL DISCLOSURE INFORMATION |
|
|
|
|
|
|
|
|
|
|
|
|
|
Cash paid for interest |
|
$ |
3,795 |
|
|
$ |
3 |
|
|
$ |
- |
|
|
Cash paid (refunded) for income taxes |
|
$ |
87 |
|
|
$ |
(123 |
) |
|
$ |
- |
|
|
Share-based compensation expenses capitalized in intangible assets |
|
$ |
1,154 |
|
|
$ |
363 |
|
|
$ |
- |
|
|
Issuance of common stock to a vendor for services rendered |
|
$ |
146 |
|
|
$ |
- |
|
|
$ |
- |
|
|
Fair value of acquisition consideration: |
|
|
|
|
|
|
|
|
|
|
|
|
|
- the reverse acquisition with Tiger Media |
|
$ |
- |
|
|
$ |
44,112 |
|
|
$ |
- |
|
|
- Fluent acquisition |
|
$ |
- |
|
|
$ |
123,766 |
|
|
$ |
- |
|
|
- Q Interactive acquisition |
|
$ |
21,431 |
|
|
$ |
- |
|
|
$ |
- |
|
|
Warrants issued in relation to the term loan |
|
$ |
492 |
|
|
$ |
1,586 |
|
|
$ |
- |
|
|
Series B Preferred issued in relation to the promissory notes |
|
$ |
- |
|
|
$ |
413 |
|
|
$ |
- |
|
See notes to consolidated financial statements
F-9
NOTES TO CONSOLIDATED FINANCIAL STATEMENTS
(Amounts in thousands, except share data)
1. Principal activities and organization
(a) Principal activities
Cogint, Inc. (“we,” “us,” “our,” “cogint,” or the “Company”), formerly known as IDI, Inc., a Delaware corporation, is a data and analytics company providing cloud-based mission-critical information and performance marketing solutions to enterprises in a variety of industries. Our mission is to transform data into intelligence utilizing our proprietary technology platforms to solve complex problems for our clients. Harnessing the power of data fusion and powerful analytics, we transform data into intelligence, in a fast and efficient manner, so that our clients can spend their time on what matters most, running their organizations with confidence. Through our intelligent platforms, CORE™ and Agile Audience Engine™, we uncover the relevance of disparate data points to deliver end-to-end, ROI-driven results for our customers. Our analytical capabilities enable us to build comprehensive datasets in real-time and provide insightful views of people, businesses, assets and their interrelationships. We empower clients across markets and industries to better execute all aspects of their business, from managing risk, identifying fraud and abuse, ensuring legislative compliance, and debt recovery, to identifying and acquiring new customers. With the goal of reducing the cost of doing business and enhancing the consumer experience, our solutions enable our clients to optimize overall decision-making and to have a holistic view of their customers.
We provide unique and compelling solutions essential to the daily workflow of organizations within both the public and private sectors. Our cloud-based data fusion and customer acquisition technology platforms, combined with our massive database consisting of public-record, proprietary and publicly- available data, as well as a unique repository of self-reported information on millions of consumers, enables the delivery of differentiated products and solutions used for a variety of essential functions throughout the customer life cycle. These essential functions include customer identification and authentication, investigation and validation, and customer acquisition and retention. The Company operates through two reportable segments: (i) Information Services and (ii) Performance Marketing.
(b) Organization
Tiger Media
Previously, we provided advertising services in the out-of-home advertising industry in China under the name Tiger Media, Inc. (“Tiger Media”), a Cayman Islands exempted company. On June 30, 2015, the Company’s Board of Directors approved the plan to discontinue its Advertising Business (defined below). In 2015, the Company has disposed of all assets and liabilities related to its Advertising Business.
TBO
The Best One, Inc. (“TBO”) is a holding company incorporated on September 22, 2014 in the State of Florida, which was formed to be engaged in the acquisition of operating businesses and the acquisition and development of valuable and proprietary technology assets across various industries. On October 2, 2014, TBO acquired 100% of the membership interests of Interactive Data, LLC (“Interactive Data”), a Georgia limited liability company and Interactive Data became a wholly-owned subsidiary of TBO (“Interactive Data Acquisition”). TBO accounted for the acquisition as a forward merger with TBO as both the legal and accounting acquirer. It was concluded that Interactive Data was not the predecessor accounting entity. Interactive Data is a data solutions provider, historically delivering data products and services to the Accounts Receivable Management (“ARM”) industry for location and identity verification, legislative compliance and debt recovery.
TBO Merger with Tiger Media
On March 21, 2015 (the “Effective Date of TBO Merger”), Tiger Media and TBO Acquisition, LLC, a Delaware limited liability company and a wholly-owned subsidiary of Tiger Media (“TBO Merger Sub”), completed a merger (the “TBO Merger”) with TBO, pursuant to the terms and conditions of the Merger Agreement and Plan of Reorganization, as amended (the “TBO Merger Agreement”) dated as of December 14, 2014.
Before the TBO Merger, on March 19, 2015, Tiger Media effected a one-for-five reverse stock split (the “Reverse Split”). The principal effect of the Reverse Split was to decrease the number of outstanding shares of each of Tiger Media’s ordinary shares.
F-10
Except for de minimus adjustments for the treatment of fractional shares, the Reverse Split did not have any dilutive effect on Tiger Media shareholders and the relative voting and other rights that accompany the shares were not affected by the Reverse Split. In addition, the proportion of shares owned by shareholders relative to the number of shares authorized for issuance remained the same because the authorized number of shares was decreased in proportion to the Reverse Split from 1,000,000,000 shares to 200,000,000 shares. The authorized number of preferred shares was not affected by the Reverse Split and remained at 10,000,000. Also before the Merger, on March 20, 2015, Tiger Media completed its domestication from the Cayman Islands to Delaware as a Delaware corporation (the “Domestication”). Following the Domestication and the Reverse Split, on March 21, 2015, TBO merged into TBO Merger Sub, with TBO Merger Sub continuing as the surviving company and a wholly-owned subsidiary of Tiger Media.
On April 8, 2015, TBO Merger Sub’s entity name was changed to IDI Holdings, LLC (“IDI Holdings”), which is a wholly owned subsidiary of the Company. On April 30, 2015, Tiger Media changed its name to IDI, Inc.
For accounting purposes, the Company recognized the TBO Merger in accordance with Accounting Standards Codification (“ASC”) Topic 805-40, “Reverse Acquisitions.” Accordingly, the Company has been recognized as the accounting acquiree in the TBO Merger, with IDI Holdings being the accounting acquirer, and the Company’s consolidated financial statements for the reporting periods from January 1, 2015 through March 21, 2015 being those of IDI Holdings, rather than those of the Company. The Company’s consolidated financial statements for the periods since March 22, 2015, the day after which the TBO Merger was consummated, recognize Tiger Media and IDI Holdings as a consolidated group for accounting and reporting purposes, albeit with a carryover capital structure inherited from Tiger Media (attributable to the legal structure of the transaction).
Disposal of Advertising Business
As a result of the TBO Merger, and although it was the Company’s intention to continue to operate and further develop its Advertising Business (as defined below) both in China and the United States as of the Effective Date of TBO Merger, on June 30, 2015, in connection with the continuing shift in the Company’s focus towards the data fusion industry via its consolidated subsidiaries, the Company’s Board of Directors approved a plan under which the Company discontinued the operations of its Chinese and British Virgin Islands based subsidiaries (collectively, the “Advertising Business”). The purpose of the plan was to focus the Company’s resources on the data fusion industry, where the Company believes the opportunities for future growth are substantially greater. Additionally, due to the continuing negative cash flow from operations of the Advertising Business, the Company elected not to invest further in this business. As of December 31, 2015, the Company had disposed of all assets and liabilities related to its Advertising Business.
Fluent Acquisition
On December 8, 2015 (the “Effective Date of Fluent Acquisition”), the Company completed the acquisition of Fluent Inc (the “Fluent Acquisition”), pursuant to an Agreement and Plan of Merger (the “Fluent Merger Agreement”) entered into on November 16, 2015. On December 9, 2015, Fluent Acquisition II, LLC, the surviving entity during the Fluent Acquisition, changed its name to Fluent, LLC (“Fluent”). The Company is the legal and accounting acquirer of the Fluent Acquisition. Fluent is a leader in people-based digital marketing and customer acquisition.
Q Interactive Acquisition
On June 8, 2016 (the “Effective Date of Q Interactive Acquisition”), the Company completed the acquisition of Q Interactive, LLC (“Q Interactive”) (the “Q Interactive Acquisition”), pursuant to a Membership Interest Purchase Agreement with Selling Source, LLC (“Selling Source”), the seller, pursuant to which the Company acquired all of the issued and outstanding membership interests in Q Interactive. Q Interactive, a Delaware limited liability company, provides performance based digital marketing solutions for advertisers and publishers.
Refer to Note 4, “Acquisitions,” and Note 5, “Discontinued Operations,” to the consolidated financial statements for the details of the acquisitions and disposal of Advertising Business, respectively.
All share data for all periods have been retroactively restated to reflect cogint’s one-for-five Reverse Split, which was effective on March 19, 2015, as discussed above.
F-11
2. Summary of significant accounting policies
(a) Basis of preparation and liquidity
The accompanying consolidated financial statements of the Company have been prepared in accordance with accounting principles generally accepted in the United States (“US GAAP”).
The Company reported a net loss of $29,086, $42,585 and $610 from continuing operations, and a net loss of $0, $41,950 and $0 from discontinued operations, for the years ended December 31, 2016, 2015 and 2014, respectively. Net cash provided by operating activities was $2,099 for the year ended December 31, 2016, while net cash used in operating activities was $10,673 and $474 for the years ended December 31, 2015 and 2014, respectively. As of December 31, 2016, the Company had an accumulated deficit of $114,231.
As of December 31, 2016, the Company had available cash of $10,089, a decrease of $3,373 from $13,462 as of December 31, 2015. Based on projections of growth in revenue and operating results in the coming year, and the additional debt capital of $15,000 in January 2017, the Company believes that it will have sufficient cash resources to finance its operations and expected capital expenditures for the next twelve months.
Reclassifications
Certain prior period items, including promissory notes payable to certain shareholders, have been reclassified to conform to the current period presentation.
Principles of consolidation
The consolidated financial statements include the financial statements of the Company and its subsidiaries. All significant transactions among the Company and its subsidiaries have been eliminated upon consolidation.
(b) Use of estimates
The preparation of consolidated financial statements in accordance with US GAAP requires the Company’s management to make estimates and assumptions relating to the reported amounts of assets and liabilities and the disclosure of contingent assets and liabilities at the date of the consolidated financial statements and the reported amounts of revenue and expenses during the reporting periods. Significant items subject to such estimates and assumptions include the allowance for doubtful accounts, useful lives of intangible assets, recoverability of the carrying amount of goodwill and intangible assets, valuation of assets and liabilities acquired in a business combination, income tax provision, and the assessment of contingent obligations. These estimates are often based on complex judgments and assumptions that management believes to be reasonable but are inherently uncertain and unpredictable. Actual results could differ from these estimates.
(c) Cash and cash equivalents
Cash and cash equivalents consist of cash on hand and bank deposits with original maturities of three months or less, which are unrestricted as to withdrawal and use.
The Company’s cash and bank deposits were held in major financial institutions located in the United States, which management believes have high credit ratings. The cash and bank deposits held in the United States, denominated in USD, amounted to $10,089 and $13,462 as of December 31, 2016 and 2015, respectively. As of December 31, 2016, among the total cash and cash equivalents, $5,213 was held by Fluent and a portion of this cash may be used by Fluent only for general operating purposes.
Financial instruments and related items, which potentially subject the Company to concentrations of credit risk, consist principally of cash investments. The Company places its temporary cash instruments with well-known financial institutions within the United States, and, at times, may maintain balances in United States banks in excess of the $250 thousand dollar US Federal Deposit Insurance Corporation insurance limit. The Company monitors the credit ratings of the financial institutions to mitigate this risk.
(d) Accounts receivable
Accounts receivable are due from customers and are generally unsecured, which consist of amounts earned but not yet collected. None of the Company’s accounts receivable bear interest.
F-12
The allowance for doubtful accounts is management’s best estimate of the amount of probable credit losses in the Company’s existing accounts receivable. Management determines the allowance based on reviews of customer-specific facts and economic conditions. Account balances are charged off against the allowance after all means of collection have been exhausted and the potential for recovery is considered remote. The Company does not have any off-balance-sheet credit exposure related to its customers. The amount of the allowance for doubtful accounts was $790 and $318 as of December 31, 2016 and 2015, respectively.
(e) Property and equipment
Property and equipment are stated at cost, net of accumulated depreciation or amortization. Expenditures for maintenance, repairs, and minor renewals are charged to expense in the period incurred. Betterments and additions are capitalized. Property and equipment are depreciated on the straight-line basis over the estimated useful lives of the assets. Leasehold improvements are depreciated over the shorter of their estimated useful lives or lease terms that are reasonably assured. The estimated useful lives of property and equipment are as follows:
|
|
|
|
|
|
|
Computer and network equipment |
|
|
5-7 years |
|
|
Furniture, fixtures and office equipment |
|
|
3-5 years |
|
|
Leasehold improvements |
|
|
4-7 years |
|
When items of property and equipment are retired or otherwise disposed of, loss/income is charged or credited for the difference between the net book value and proceeds received thereon.
(f) Business combination
The Company records acquisitions pursuant to ASC 805 – Business Combinations. We allocate the fair value of purchase consideration to the tangible assets acquired, liabilities assumed and intangible assets acquired based on their estimated fair values. The excess of the fair value of purchase consideration over the fair values of these identifiable assets and liabilities is recorded as goodwill. Such valuations require management to make significant estimates and assumptions especially with respect to intangible assets. Significant estimates in valuing certain intangible assets include, but are not limited to, future expected cash flows from acquired intangible assets, useful lives and discount rates. Management’s estimates of fair value are based upon assumptions we believe to be reasonable, but which are inherently uncertain and unpredictable and, as a result, actual results may differ from estimates. During the measurement period, we may record adjustments to the assets acquired and liabilities assumed, with the corresponding offset to goodwill. Upon the conclusion of the measurement period, any subsequent adjustments are recorded to earnings.
(g) Intangible assets other than goodwill
The Company’s intangible assets are initially recorded at the capitalized actual costs incurred, their acquisition cost, or fair value if acquired as part of a business combination, and amortized on a straight-line basis over their respective estimated useful lives, which are the periods over which the assets are expected to contribute directly or indirectly to the future cash flows of the Company. The Company’s intangible assets represent purchased intellectual property and capitalized litigation costs, software developed for internal use, acquired proprietary technology, customer relationships, trade names, domain names, databases and non-competition agreements, including those resulting from the acquisitions. Intangible assets have estimated useful lives of 2-20 years.
In accordance with ASC Topic 350-40, “Software — internal use software,” the Company capitalizes eligible costs, including salaries and staff benefits, share-based compensation expenses, traveling expenses incurred by relevant employees, and other relevant costs of developing internal-use software that are incurred in the application development stage when developing or obtaining software for internal use. The Company begins the amortization of those costs when the products become commercially viable.
(h) Goodwill
Goodwill represents the difference between the purchase price and the estimated fair value of the net assets acquired when accounted for by the purchase method of accounting. As of December 31, 2016, the goodwill balance relates to the October 2, 2014 acquisition of Interactive Data by IDI Holdings, the Fluent Acquisition effective on December 8, 2015, and the Q Interactive Acquisition effective on June 8, 2016.
In accordance with ASC Topic 350, “Intangibles - Goodwill and Other,” goodwill is tested at least annually for impairment, or when events or changes in circumstances indicate that the carrying amount of such assets may not be recoverable, by assessing qualitative
F-13
factors or performing a quantitative analysis in determining whether it is more likely than not that its fair value exceeds the carrying value.
On October 1, 2016, we performed a quantitative Step One assessment on both of our reporting units. A quantitative Step One assessment involved determining the fair value of each reporting unit using market participant assumptions. If we believe that the carrying value of a reporting unit with goodwill exceeds its estimated fair value, we will perform a quantitative Step Two assessment. Step Two compares the carrying value of the reporting unit to the fair value of all of the assets and liabilities of the reporting unit (including any unrecognized intangibles) as if the reporting unit was acquired in a business combination. If the carrying amount of a reporting unit’s goodwill exceeds the implied fair value of its goodwill, an impairment loss is recognized in an amount equal to the excess. The results of our Step One assessment proved that the estimated fair value of the reporting units exceed their carrying value, and therefore a Step Two assessment was not performed. We concluded that goodwill was not impaired as of December 31, 2016 and 2015.
For purposes of reviewing impairment and the recoverability of goodwill, we must make various assumptions regarding estimated future cash flows and other factors in determining the fair values.
(i) Impairment of long-lived assets
Finite-lived intangible assets are amortized over their respective useful lives and, along with other long-lived assets, are evaluated for impairment periodically whenever events or changes in circumstances indicate that their related carrying amounts may not be recoverable in accordance with ASC Topic 360-10-15, “Impairment or Disposal of Long-Lived Assets.” In evaluating long-lived assets for recoverability, including finite-lived intangibles and property and equipment, the Company uses its best estimate of future cash flows expected to result from the use of the asset and eventual disposition in accordance with ASC Topic 360-10-15. To the extent that estimated future undiscounted cash inflows attributable to the asset, less estimated future undiscounted cash outflows, are less than the carrying amount, an impairment loss is recognized in an amount equal to the difference between the carrying value of such asset and its fair value. Assets to be disposed of and for which there is a committed plan of disposal, whether through sale or abandonment, are reported at the lower of carrying value or fair value less costs to sell. The Company evaluated its long-lived assets for recoverability and determined no impairment was necessary.
Asset recoverability is an area involving management judgment, requiring assessment as to whether the carrying value of assets can be supported by the undiscounted future cash flows. In calculating the future cash flows, certain assumptions are required to be made in respect of highly uncertain matters such as revenue growth rates, gross margin percentages and terminal growth rates. We concluded there was no impairment on our long-lived assets as of December 31, 2015. In September 2016, the Company wrote off the remaining balance of Purchased IP and capitalized litigation costs of $4,055, as a result of an unfavorable ruling in relation to a litigation matter.
(j) Fair value of financial instruments
ASC Topic 820, “Fair Value Measurements and Disclosures” establishes a three-tier fair value hierarchy, which prioritizes the inputs used in measuring fair value. The hierarchy prioritizes the inputs into three levels based on the extent to which inputs used in measuring fair value are observable in the market.
These tiers include:
|
|
• |
Level 1 – defined as observable inputs such as quoted prices in active markets; |
|
|
• |
Level 2 – defined as inputs other than quoted prices in active markets that are either directly or indirectly observable; and |
|
|
• |
Level 3 – defined as unobservable inputs in which little or no market data exists, therefore requiring an entity to develop its own assumptions. |
The fair value of the Company’s cash and cash equivalents, and receivables and payables approximate their carrying amount because of the short-term nature of these instruments. We regard the fair value of the long-term debt to approximate their carrying amounts as of December 31, 2016 based on the current interest rates for similar debt instruments. This fair value assessment represents Level 2 measurements. We used the probability-weighted method to determine the fair value of the contingent consideration payable in stock as of December 31, 2016, and this fair value assessment represents Level 3 measurements.
F-14
The Company provides information services and performance marketing services, and generally recognizes revenue when persuasive evidence of an arrangement exists, delivery has occurred or a service has been rendered, the price is fixed or determinable and collection is reasonably assured.
Information services revenue is generated from the risk management industry and consumer marketing industry. Information service revenue generated from the risk management industry is generally recognized on (a) a transactional basis determined by the customers’ usage, (b) a monthly fee or (c) a combination of both. Revenues pursuant to contracts containing a monthly fee are recognized ratably over the contract period, which is generally 1 year. Revenues pursuant to transactions determined by the customers’ usage are recognized when the transaction is complete. Information service revenue generated from consumer marketing industry is generally recognized when related services are delivered, in accordance with terms detailed in the agreements. These terms typically call for a transactional unit price per record delivered based on predefined qualifying characteristics specified by the customer. These records are tracked in real time by the Company’s systems, reported, recorded, and regularly reconciled against advertiser data either in real time or at various contractually defined periods, whereupon the number of qualified records during such specified period are finalized and adjustments, if any, to revenue are made. Additional revenues are generated through revenue-sharing agreements with marketers who target offers to users provided by the Company from its owned and operated sites.
Performance marketing revenue is recognized when the conversions are generated based on predefined user actions (for example, a click, a registration, an app install or a coupon print) subject to certain qualifying characteristics specified by the customer, in accordance with terms detailed in advertiser agreements and/or the attendant insertion orders. These terms typically call for a specific transactional unit price per conversion generated. These conversions are tracked in real time by the Company’s systems, reported, recorded, and regularly reconciled against advertiser data either in real time or at various contractually defined periods, whereupon the number of qualified conversions during such specified period are finalized and adjustments, if any, to revenue are made.
Costs associated with separately priced customer service contracts are expensed as incurred.
Customer payments received in excess of the amount of revenue recognized are recorded as deferred revenue in the consolidated balance sheets, and are recognized as revenue when the services are rendered. As of December 31, 2016 and 2015, deferred revenue totaled $318 and $783, respectively, all of which is expected to be realized in the following year.
(l) Cost of revenues (exclusive of depreciation and amortization)
Our cost of revenues primarily include data acquisition costs, media costs and other cost of revenues. Data acquisition costs consist primarily of the cost to acquire data either on a transactional basis or through flat-fee data licensing agreements, including unlimited usage agreements, and is used primarily to power solutions in our Information Services segment. Media costs consist primarily of the cost to acquire traffic through the purchase of impressions or clicks from publishers or third-party intermediaries, such as advertising exchanges, and is used primarily to power solutions in our Performance Marketing segment. Other cost of revenues includes expenses related to third-party infrastructure fees.
(m) Advertising and promotion costs
Advertising and promotion costs are charged to operations as incurred. Advertising and promotion costs, included in sales and marketing expenses amounted to $4,027, $388 and $38 for the years ended December 31, 2016, 2015 and 2014, respectively.
(n) Share-based payments
The Company accounts for share-based payments to employees in accordance with ASC Topic 718, “Compensation—Stock Compensation.” Under ASC Topic 718, the Company measures the cost of employee services received in exchange for an award of equity instruments based on the grant-date fair value of the award and generally recognizes the costs on a straight-line basis over the period the employee is required to provide service in exchange for the award, which generally is the vesting period. For awards with performance conditions, we begin recording share-based compensation expenses when achieving the performance criteria is probable.
The estimated number of stock awards that will ultimately vest requires judgment, and to the extent actual results or updated estimates differ from our current estimates, such amount will be recorded as a cumulative adjustment in the period estimates are revised. Changes in our estimates and assumptions may cause us to realize material changes in share-based compensation expenses in the future. We consider many factors when estimating expected forfeitures, including employee level, economic conditions, time remaining to vest, and historical forfeiture experience.
F-15
The Company accounts for share-based payments to non-employees in accordance with ASC Topic 505-50, “Equity-Based Payments to Non-Employees.” Under ASC Topic 505-50, share-based payment transactions with nonemployees shall be measured at the fair value of the consideration received or the fair value of the equity instruments issued, whichever is more reliably measurable. In the event that the fair value of the equity instruments issued in a share-based payment transaction with nonemployees is more reliably measurable than the fair value of the consideration received, the transaction shall be measured based on the fair value of the equity instruments issued by the Company.
(o) Income taxes
Income taxes are accounted for under the asset and liability method. Deferred tax assets and liabilities are recognized for the future tax consequences attributable to differences between the financial statement carrying amounts of existing assets and liabilities and their respective tax bases and operating loss and tax credit carry forwards. Deferred tax assets and liabilities are measured using enacted tax rates expected to apply to taxable income in the years in which those temporary differences are expected to be recovered or settled.
The effect on deferred tax assets and liabilities of a change in tax rates or laws is recognized in income in the period that the change in tax rates or laws is enacted. A valuation allowance is provided to reduce the amount of deferred tax assets if it is considered more likely than not that some portion or all of the deferred tax assets will not be realized.
The Company applies ASC Topic 740, “Income Taxes.” ASC 740 clarifies the accounting for uncertain tax positions. This interpretation requires that an entity recognizes in the consolidated financial statements the impact of a tax position, if that position is more likely than not of being sustained upon examination, based on the technical merits of the position. Recognized income tax positions are measured at the largest amount that is greater than 50% likely of being realized. Changes in recognition or measurement are reflected in the period in which the change in judgment occurs. The Company’s accounting policy is to accrue interest and penalties related to uncertain tax positions, if and when required, as interest expense and a component of other expenses, respectively, in the consolidated statements of operations.
(p) Loss per share
Basic loss per share is computed by dividing net loss by the weighted average number of common shares outstanding during the periods. Diluted loss per share reflects the potential dilution that could occur if securities or other contracts to issue common stock were exercised or converted into common stock and is calculated using the treasury stock method for stock options and unvested shares. Common equivalent shares are excluded from the calculation in the loss periods as their effects would be anti-dilutive.
On March 19, 2015, the Company effected the Reverse Split. The principal effect of the Reverse Split was to decrease the number of outstanding shares of the Company’s common shares. All per share amounts and shares outstanding for all the periods presented have been retroactively restated to reflect the Reverse Split.
(q) Contingencies
In the ordinary course of business, the Company is subject to loss contingencies that cover a wide range of matters. An estimated loss from a loss contingency such as a legal proceeding or claim is accrued if it is probable that a liability has been incurred and the amount of the loss can be reasonably estimated. In determining whether a loss should be accrued, the Company evaluates, among other factors, the degree of probability and the ability to make a reasonable estimate of the amount of loss.
(r) Segment reporting
The Company has two operating segments, Information Services and Performance Marketing, as defined by ASC Topic 280, “Segment Reporting.” As of December 31, 2015, the Company has disposed of all assets and liabilities related to its Advertising Business, and the related results of operations were recorded as discontinued operations.
(s) Significant concentrations and risks
Concentration of Credit Risk
Assets that potentially subject the Company to significant concentration of credit risk primarily consist of cash and cash equivalents, and accounts receivable. As of December 31, 2016 and 2015, all of the Company’s cash and cash equivalents were deposited in financial institutions located in the United States, which management believes are of high credit quality. Accounts receivable are typically unsecured and are derived from revenue earned from customers. The risk with respect to accounts receivable is mitigated by credit evaluations the Company performs on its customers and its ongoing monitoring process of outstanding balances.
F-16
During the years ended December 31, 2016 and 2015, the Company recognized revenue from one major customer, accounting for 12% and 14% of the total consolidated revenue, respectively. Such customer, however, manages the ad platforms of leading search engines and represents a consortium of advertisers, which limits overall concentration risk. During the year ended December 31, 2014, there was no individual customer that accounted for more than 10% of the total revenue.
As of December 31, 2016, there was no individual customer that accounted for more than 10% of the Company’s accounts receivable, while as of December 31, 2015, the same customer as mentioned above, accounted for 17% of the Company’s accounts receivable.
Concentration of Suppliers
One media supplier accounted for 15% and 11% of the total cost of revenues during the years ended December 31, 2016 and 2015, respectively. Four data suppliers accounted for 30%, 19%, 11% and 11% of the total cost of revenues for the year ended December 31, 2014.
As of December 31, 2016, there was no individual vendor that accounted for more than 10% of the of the Company’s total trade accounts payable, while as of December 31, 2015, two media suppliers accounted for 16% and 12% of the Company’s total trade accounts payable.
(t) Recently issued accounting standards
In May 2014, Financial Accounting Standards Board (“FASB”) issued Accounting Standards Update (“ASU”) No. 2014-09 (“ASU 2014-09”), “Revenue from Contracts with Customers (Topic 606).” The standard’s core principle is that a company will recognize revenue when it transfers promised goods or services to customers in an amount that reflects the consideration to which the company expects to be entitled in exchange for those goods or services. In August 2015, FASB issued ASU No. 2015-14, “Revenue from Contracts with Customers (Topic 606): Deferral of the Effective Date,” which delays the effective date of ASU 2014-09 by one year. FASB also agreed to allow entities to choose to adopt the standard as of the original effective date. In March 2016, FASB issued ASU No. 2016-08, “Revenue from Contracts with Customers (Topic 606): Principal versus Agent Considerations (Reporting Revenue Gross versus Net)” (“ASU 2016-08”), which clarifies the implementation guidance on principal versus agent considerations. The guidance includes indicators to assist an entity in evaluating whether it controls the good or the service before it is transferred to the customer. The new revenue recognition standard will be effective for public entities for annual reporting periods beginning after December 15, 2017, and interim periods therein, that is, the first quarter of 2018. The new standard also permits two methods of adoption: retrospectively to each prior reporting period presented (full retrospective method), or retrospectively with the cumulative effect of initially applying the guidance recognized at the date of initial application (the modified retrospective method). We currently do not plan to early adopt ASU 2014-09, and we anticipate adopting the standard using the modified retrospective method. We plan to have our preliminary assessment on the impact this guidance will have on our consolidated financial statements and related disclosures in early 2017.
In August 2014, FASB issued ASU No. 2014-15 (“ASU 2014-15”), “Disclosure of Uncertainties about an Entity’s Ability to Continue as a Going Concern,” which provides guidance on management’s responsibility in evaluating whether there is substantial doubt about a company’s ability to continue as a going concern and to provide related footnote disclosures. ASU 2014-15 is effective for annual periods ending after December 15, 2016 with early adoption permitted. We adopted ASU 2014-15 for the year ended December 31, 2016, and it does not have a material impact on our consolidated financial statements.
In September 2015, FASB issued ASU No. 2015-16 (“ASU 2015-16”), “Business Combinations (Topic 805): Simplifying the Accounting for Measurement-Period Adjustments,” which replaces the requirement that an acquirer in a business combination account for measurement period adjustments retrospectively with a requirement that an acquirer recognize adjustments to the provisional amounts that are identified during the measurement period in the reporting period in which the adjustment amounts are determined. ASU 2015-16 requires that the acquirer record, in the same period’s financial statements, the effect on earnings of changes in depreciation, amortization, or other income effects, if any, as a result of the change to the provisional amounts calculated as if the accounting had been completed at the acquisition date. ASU 2015-16 is effective for fiscal years beginning after December 15, 2015, including interim periods within those fiscal years. The guidance is to be applied prospectively to adjustments to provisional amounts that occur after the effective date of the guidance, with earlier application permitted for financial statement that have not been issued. We adopted ASU 2015-16 during the three months ended March 31, 2016. We are still evaluating the purchase price allocation related to the acquisition of Q Interactive, LLC, and we do not expect it will have a material impact on our consolidated financial statements.
In February 2016, FASB issued ASU No. 2016-02 (“ASU 2016-02”), “Leases (Topic 842),” which generally requires companies to recognize operating and financing lease liabilities and corresponding right-of-use assets on the balance sheet. This guidance will be
F-17
effective in the first quarter of 2019 on a modified retrospective basis and early adoption is permitted. We are still evaluating the effect that this guidance will have on our consolidated financial statements and related disclosures.
In March 2016, FASB issued ASU No. 2016-09 (“ASU 2016-09”), “Compensation-Stock Compensation (Topic 718): Improvement to Employee Share-based Payment Accounting,” which simplifies the accounting for share-based payment transactions, including the income tax consequences, an option to recognize gross share-based compensation expense with actual forfeitures recognized as they occur, as well as certain classifications on the statement of cash flows. This guidance will be effective in the first quarter of 2017, and early adoption is permitted. We do not plan to early adopt ASU 2016-09 and we do not expect that it will have a material impact on our consolidated financial statements.
In August 2016, FASB issued ASU No. 2016-15 (“ASU 2016-15”), “Statement of Cash Flows (Topic 230): Classification of Certain Cash Receipts and Cash Payments,” which provides guidance for certain cash flow issues, including contingent consideration payments made after a business combination and debt prepayment or debt extinguishment costs etc. The guidance will be effective for fiscal years beginning after December 15, 2017, and interim periods within those fiscal years, and early adoption is permitted. We will evaluate the impact of ASU 2016-15 on our condensed consolidation financial statements in 2017.
Except for the ASUs noted above, other ASUs are not expected to have a material impact on the consolidated financial statements upon adoption.
3. Loss per share
The information related to basic and diluted loss per share for the years ended December 31, 2016, 2015 and 2014 is as follows:
|
|
|
Year Ended December 31, |
|
|||||||||
|
(In thousands) |
|
2016 |
|
|
2015 |
|
|
2014 (1) |
|
|||
|
Numerator: |
|
|
|
|
|
|
|
|
|
|
|
|
|
Net loss from continuing operations |
|
$ |
(29,086 |
) |
|
$ |
(42,585 |
) |
|
$ |
(610 |
) |
|
Net loss from discontinued operations attributable to cogint |
|
|
- |
|
|
|
(41,950 |
) |
|
|
- |
|
|
Net loss |
|
$ |
(29,086 |
) |
|
$ |
(84,535 |
) |
|
$ |
(610 |
) |
|
Denominator: |
|
|
|
|
|
|
|
|
|
|
|
|
|
Weighted average shares outstanding - Basic and diluted |
|
|
44,536,906 |
|
|
|
13,036,082 |
|
|
|
4,501,041 |
|
|
Loss per share: (2) |
|
|
|
|
|
|
|
|
|
|
|
|
|
Basic and diluted: |
|
|
|
|
|
|
|
|
|
|
|
|
|
Continuing operations |
|
$ |
(0.65 |
) |
|
$ |
(3.27 |
) |
|
$ |
(0.14 |
) |
|
Discontinued operations |
|
|
- |
|
|
|
(3.22 |
) |
|
|
- |
|
|
|
|
$ |
(0.65 |
) |
|
$ |
(6.48 |
) |
|
$ |
(0.14 |
) |
|
(1) |
As IDI Holdings, the accounting acquirer of the merger consummated effective as of March 21, 2015, was incorporated on September 22, 2014, the comparative financial figures for the year ended December 31, 2014 were from September 22, 2014, the date of inception, through December 31, 2014. |
|
(2) |
Earnings per share tables may contain summation differences due to rounding. |
4. Acquisitions
Q Interactive Acquisition
To expand and strengthen the Company’s business in the consumer marketing industry, on June 8, 2016, the Company entered into and consummated the transactions contemplated by a Membership Interest Purchase Agreement with Selling Source, pursuant to which the Company acquired all of the membership interests in Q Interactive.
As consideration for the Membership Interests, after preliminary adjustment for Q Interactive’s net working capital at closing, the Company issued to Selling Source 2,369,190 shares of the Company’s common stock, par value $0.0005 per share. Selling Source may receive additional consideration for the Membership Interests if 2016 gross revenue of Q Interactive equals or exceeds $25,000 (the “Earn-out Target”). Such additional consideration, if earned, would be paid in either of the following ways, at the seller’s option, no earlier than the one-year anniversary of the closing date (the “Q Interactive Earn-out Shares”): (i) 1,200,000 shares of common
F-18
stock (subject to adjustment for certain capital events) or (ii) that number of shares of common stock equal to $10,000, in the aggregate, as determined by the volume weighted average price of the common stock for the ten trading days immediately preceding Selling Source’s receipt of a statement prepared by the Company stating the Earn-out Target has been achieved. Based on management’s preliminary assessment, we concluded that it was extremely likely that Q Interactive would meet the Earn-out Target, and the estimated fair value of the Q Interactive Earn-out Shares is $10,000. As of December 31, 2016, after certain measurement period adjustments, including the finalization of the closing working capital adjustment, the net balance of contingent consideration payable in stock of $10,225 was recognized. The contingent consideration payable in stock is expected to be settled in 2017, however, it is classified as a non-current liability in the consolidated balance sheet due to the fact that this liability will be settled with the Company’s common stock.
The following table summarizes the preliminary purchase price allocation and the fair value of the net assets acquired and liabilities assumed (marked to market), and the resulting amount of goodwill in the Q Interactive Acquisition (the legal and accounting acquiree) at the Effective Date of the Q Interactive Acquisition.
|
(In thousands) |
|
|
|
|
|
Assets acquired: |
|
|
|
|
|
Accounts receivable |
|
$ |
4,673 |
|
|
Prepaid expenses and other current assets |
|
|
213 |
|
|
Property and equipment |
|
|
73 |
|
|
Intangible assets: |
|
|
|
|
|
Customer relationships |
|
|
4,900 |
|
|
Trade names |
|
|
1,700 |
|
|
Proprietary technology |
|
|
2,150 |
|
|
Databases |
|
|
4,800 |
|
|
Non-competition agreements |
|
|
1,040 |
|
|
Total intangible assets |
|
|
14,590 |
|
|
|
|
|
19,549 |
|
|
Liabilities assumed: |
|
|
|
|
|
Trade accounts payable |
|
|
2,297 |
|
|
Accrued expenses and other current liabilities |
|
|
1,153 |
|
|
Deferred revenue |
|
|
52 |
|
|
|
|
|
3,502 |
|
|
Goodwill |
|
|
5,384 |
|
|
Total consideration |
|
$ |
21,431 |
|
The intangible assets acquired in the Q Interactive Acquisition are amortized on a straight-line basis over the estimated useful lives. The useful lives for customer relationships, trade names, proprietary technology, databases and non-competition agreements are 10 years, 20 years, 5 years, 5 years and 2 years, respectively, and the weighted average useful life for these acquired intangible assets with definite useful lives is 8 years.
Goodwill from the Q Interactive Acquisition principally relates to intangible assets that do not qualify for separate recognition, including the assembled workforce and synergies. Goodwill is tax deductible for income tax purposes and was assigned to the Information Services and Performance Marketing reporting segments in the amount of $1,765 and $3,619, respectively.
The fair value of assets acquired and liabilities assumed from the Q Interactive Acquisition was based on a preliminary valuation and our estimates and assumptions are subject to change within the measurement period. The primary area of the purchase price not yet finalized is related to contingent consideration. Measurement period adjustments will be applied to the period that the adjustment is identified in our consolidated financial statements.
Pro forma disclosure for Q Interactive Acquisition (unaudited)
The following table includes the unaudited pro forma results for the years ended December 31, 2016, 2015 and 2014 of the combined companies as though the Q Interactive Acquisition had been completed as of the beginning of the periods being presented.
F-19
|
|
Year Ended December 31, |
|
||||||||||
|
(In thousands) |
|
2016 |
|
|
2015 (1) |
|
|
2014 (1)(2) |
|
|||
|
Revenue |
|
$ |
200,347 |
|
|
$ |
190,781 |
|
|
$ |
28,528 |
|
|
Loss from continuing operations before income taxes |
|
|
(43,062 |
) |
|
|
(58,951 |
) |
|
|
(34,622 |
) |
|
Net loss attributable to cogint |
|
|
(28,733 |
) |
|
|
(85,881 |
) |
|
|
(23,885 |
) |
|
Basic and diluted loss per share |
|
$ |
(0.63 |
) |
|
$ |
(5.57 |
) |
|
$ |
(3.48 |
) |
|
(1) |
For the comparative pro forma results for years ended December 31, 2015 and 2014, we also assumed the Fluent Acquisition (as defined below) had been completed as of the beginning of the periods being presented. |
|
(2) |
As IDI Holdings, the accounting acquirer of the merger consummated effective as of March 21, 2015, was incorporated on September 22, 2014, the combined comparative pro forma figures of both IDI and Fluent in 2014 were from September 22, 2014, the date of inception, through December 31, 2014. |
The unaudited pro forma financial information is presented for informational purposes only, and may not necessarily reflect our future results of operations or what the results of operations would have been had we owned and operated each company as of the beginning of the periods presented.
Fluent Acquisition
To accelerate the Company’s strategy to apply its next generation data fusion technology to not only the risk management industry, but also as an advanced data analytics platform to the consumer marketing industry, on December 8, 2015, the Company completed the Fluent Acquisition, pursuant to the Fluent Merger Agreement.
Cogint, Inc. is the legal and accounting acquirer in the Fluent Acquisition.
Pursuant to the Fluent Merger Agreement, the Company acquired 100% of the outstanding stock of Fluent from the sellers for the following consideration: (i) 15,001,850 shares of the Company’s common stock, par value $0.0005, with the fair value of $123.8 million, determined by multiplying the Company’s market stock price by the total shares of common stock, and (ii) approximately $99.3 million in cash. The following table summarizes the purchase price allocation and the fair value of the net assets acquired and liabilities assumed (marked to market), and the resulting amount of goodwill in the Fluent Acquisition at the Effective Date of Fluent Acquisition.
F-20
|
(In thousands) |
|
|
|
|
|
Assets acquired: |
|
|
|
|
|
Cash and cash equivalents |
|
$ |
6,013 |
|
|
Accounts receivable |
|
|
20,250 |
|
|
Prepaid expenses and other current assets |
|
|
691 |
|
|
Property and equipment |
|
|
242 |
|
|
Intangible assets: |
|
|
|
|
|
Customer relationships |
|
|
30,086 |
|
|
Trade names |
|
|
16,357 |
|
|
Domain names |
|
|
191 |
|
|
Proprietary technology |
|
|
11,382 |
|
|
Databases |
|
|
26,492 |
|
|
Non-competition agreements |
|
|
728 |
|
|
Total intangible assets |
|
|
85,236 |
|
|
Other non-current assets |
|
|
763 |
|
|
|
|
|
113,195 |
|
|
Liabilities assumed: |
|
|
|
|
|
Accounts payable and accrued expenses |
|
|
10,653 |
|
|
Liability for employee incentive-based compensation plan |
|
|
4,000 |
|
|
Deferred revenue |
|
|
314 |
|
|
Deferred tax liabilities |
|
|
30,800 |
|
|
|
|
|
45,767 |
|
|
Goodwill |
|
|
155,645 |
|
|
Total consideration |
|
$ |
223,073 |
|
|
Including: |
|
|
|
|
|
Cash consideration |
|
$ |
99,266 |
|
|
Fair value of common stock, as converted, issued |
|
|
123,807 |
|
|
Total consideration |
|
$ |
223,073 |
|
The intangible assets acquired in the Fluent Acquisition are amortized on a straight-line basis over the estimated useful lives. The useful lives for customer relationships, trade names, domain names, proprietary technology, databases and non-competition agreements are 7 years, 20 years, 20 years, 5 years, 10 years, and 5 years, respectively, and the weighted average useful life for these acquired intangible assets is 10 years.
Goodwill from the Fluent Acquisition principally relates to intangible assets that do not qualify for separate recognition, including the assembled workforce and synergies. Goodwill is not tax deductible for income tax purposes and was assigned to the Information Services and Performance Marketing reporting segments of $37,185 and $118,461, respectively.
TBO Merger with Tiger Media
To expand Tiger Media’s business into data and analytics industry, on March 21, 2015, the Effective Date of TBO Merger, Tiger Media and TBO Merger Sub, completed the merger with TBO, pursuant to the terms and conditions of the TBO Merger Agreement, as specified in Note 1(b) – Organization,
For accounting purposes, the Company recognized the TBO Merger in accordance with ASC Topic 805-40, “Reverse Acquisitions.”
Under the acquisition method of accounting, the assets (including identifiable intangible assets) and liabilities of Tiger Media prior to the TBO Merger as of the Effective Date were recorded at their respective fair values and added to those of IDI Holdings. Any excess of purchase price over the fair value of the net assets were recorded as goodwill. Financial statements of the Company issued after the TBO Merger would reflect these fair values and would not be restated retroactively to reflect the historical financial position or results of operations of Tiger Media.
Under the reverse acquisition, the accounting acquiree, the Company, issued equity shares to the owners of the accounting acquirer, IDI Holdings. The consideration transferred by IDI Holdings for its interest in the Company is based on the number of equity interests IDI Holdings would have had to issue to give the owners of the Company the same percentage equity interest in the combined entity that results from the reverse acquisition. The fair value of the number of equity interests calculated in that way can be used as the fair
F-21
value of consideration transferred in exchange for the Company. Certain shareholders of IDI Holdings also have the right to receive additional shares subject to an earn-out (as discussed in Note 14 below). The earn out conditions were deemed probable upon the effective date of the Fluent acquisition and because the measurement had closed, the Company recorded a $14,300 charge. The following table summarizes the purchase price allocation and the fair value of the net assets acquired and liabilities assumed (marked to market), and the resulting amount of goodwill in the acquisition of Tiger Media (the accounting acquiree) at the Effective Date of TBO Merger.
|
(In thousands) |
|
|
|
|
|
Assets acquired: |
|
|
|
|
|
Cash and cash equivalents |
|
$ |
3,569 |
|
|
Accounts receivable |
|
|
1,808 |
|
|
Other current assets |
|
|
326 |
|
|
Property and equipment |
|
|
1,419 |
|
|
Intangible assets, net |
|
|
4,280 |
|
|
Long-term deferred expenses |
|
|
586 |
|
|
|
|
|
11,988 |
|
|
Liabilities assumed: |
|
|
|
|
|
Accounts payable |
|
|
1,519 |
|
|
Accrued expenses and other payables |
|
|
736 |
|
|
Acquisition consideration payable |
|
|
464 |
|
|
Amounts due to related parties |
|
|
124 |
|
|
Deferred revenue |
|
|
80 |
|
|
|
|
|
2,923 |
|
|
Non-controlling interests |
|
|
425 |
|
|
Goodwill |
|
|
35,472 |
|
|
Total consideration |
|
$ |
44,112 |
|
Goodwill from the acquisition principally relates to the assembled workforce and the synergy effects.
As all assets and liabilities related to the Advertising Business have been disposed as of December 31, 2015 for $0, all goodwill was written off in 2015 and no pro forma financial information was disclosed for the year ended December 31, 2015.
Interactive Data Acquisition
In order to enter the data and analytics industry, leveraging Interactive Data’s technology infrastructure to allow for penetration into the ARM marketplace, as specified in Note 1(b) – Organization, on October 2, 2014, IDI Holdings acquired 100% of the membership interests of Interactive Data for $6,320 of cash and 284,445 shares of common share. IDI Holdings accounted for the acquisition as a forward merger with IDI Holdings as both the legal and accounting acquirer. It was concluded that Interactive Data was not the predecessor accounting entity. For accounting purposes, the Company recognized the Interactive Data Acquisition in accordance with ASC Topic 805. The Company’s consolidated financial statements for the year ended December 31, 2014 included Interactive Data’s operating results for the period from October 3, 2014 through December 31, 2014. The purchase price allocation is summarized as follows:
|
(In thousands) |
|
|
|
|
|
Assets acquired: |
|
|
|
|
|
Working capital, net |
|
$ |
426 |
|
|
Property and equipment, net |
|
|
229 |
|
|
Intangible assets, net |
|
|
339 |
|
|
Deferred tax assets |
|
|
99 |
|
|
Goodwill |
|
|
5,227 |
|
|
Total consideration |
|
$ |
6,320 |
|
5. Discontinued operations
As mentioned in Note 2 - Organization, on June 30, 2015, the Company’s Board of Directors approved the plan to discontinue the Advertising Business. The Company recognized the transactions in accordance with ASC Topic 205-20, “Discontinued Operations.”
F-22
The Company has disposed of all assets and liabilities related to its Advertising Business, by the disposal of its equity interests in the Advertising Business to an independent third party in 2015 for $0.
The following financial information presents the results of operations of the Advertising Business for the year ended December 31, 2015.
|
|
|
Year Ended |
|
|
|
(In thousands) |
|
December 31, 2015 |
|
|
|
Revenue |
|
$ |
218 |
|
|
Pretax loss from operations of discontinued operations |
|
$ |
(1,236 |
) |
|
Pretax loss on disposal of discontinued operations |
|
|
(41,095 |
) |
|
Income tax expenses |
|
|
127 |
|
|
Less: Non-controlling interests |
|
|
(508 |
) |
|
Net loss from discontinued operations attributable to cogint |
|
$ |
(41,950 |
) |
Included in the net loss from discontinued operations, the Company recorded a loss on disposal of the Advertising Business of $41,095 for the year ended December 31, 2015, the majority of which are non-cash charges, pursuant to the following:
|
|
|
Year Ended |
|
|
|
(In thousands) |
|
December 31, 2015 |
|
|
|
Write-off of goodwill |
|
$ |
(35,472 |
) |
|
Write-off of intangible assets |
|
|
(4,080 |
) |
|
Write-off of long-term deferred assets |
|
|
(517 |
) |
|
Lease agreements early termination compensation expenses |
|
|
(1,211 |
) |
|
Employee severance compensation expenses |
|
|
(191 |
) |
|
Gain on write-off of acquisition consideration payable |
|
|
463 |
|
|
Loss on disposal of equity interests |
|
|
(87 |
) |
|
Loss on disposal of discontinued operations |
|
$ |
(41,095 |
) |
6. Accounts receivable, net
Accounts receivable, net consist of the following:
|
(In thousands) |
|
December 31, 2016 |
|
|
December 31, 2015 |
|
||
|
Accounts receivable |
|
$ |
31,748 |
|
|
$ |
21,542 |
|
|
Less: Allowance for doubtful accounts |
|
|
(790 |
) |
|
|
(318 |
) |
|
Total accounts receivable, net |
|
$ |
30,958 |
|
|
$ |
21,224 |
|
The movement of allowance for doubtful accounts is shown below:
|
|
|
Year Ended December 31, |
|
|||||||||
|
(In thousands) |
|
2016 |
|
|
2015 |
|
|
2014 |
|
|||
|
Beginning balance |
|
|
318 |
|
|
|
105 |
|
|
|
- |
|
|
Charges to expenses |
|
|
772 |
|
|
|
213 |
|
|
|
105 |
|
|
Write-offs |
|
|
(300 |
) |
|
|
- |
|
|
|
- |
|
|
Ending balance |
|
$ |
790 |
|
|
$ |
318 |
|
|
$ |
105 |
|
Provision for bad debts of $772, $213 and $105 was provided for the years ended December 31, 2016, 2015 and 2014, respectively.
F-23
7. Property and equipment, net
Property and equipment, net consist of the following:
|
(In thousands) |
|
December 31, 2016 |
|
|
December 31, 2015 |
|
||
|
Computer and network equipment |
|
$ |
918 |
|
|
$ |
562 |
|
|
Furniture, fixtures and office equipment |
|
|
624 |
|
|
|
544 |
|
|
Leasehold improvements |
|
|
510 |
|
|
|
111 |
|
|
Total cost of property and equipment |
|
|
2,052 |
|
|
|
1,217 |
|
|
Less: accumulated depreciation and amortization |
|
|
(702 |
) |
|
|
(155 |
) |
|
Property and equipment, net |
|
$ |
1,350 |
|
|
$ |
1,062 |
|
Depreciation of property and equipment of $547, $143 and $11 was recorded for the years ended December 31, 2016, 2015 and 2014, respectively.
8. Intangible assets, net
Intangible assets other than goodwill consist of the following:
|
(In thousands) |
|
Amortization period |
|
December 31, 2016 |
|
|
December 31, 2015 |
|
||
|
Gross amount: |
|
|
|
|
|
|
|
|
|
|
|
Purchased IP and capitalized litigation costs |
|
10 years |
|
$ |
- |
|
|
$ |
1,659 |
|
|
Software developed for internal use |
|
3-10 years |
|
|
11,438 |
|
|
|
2,571 |
|
|
Acquired proprietary technology |
|
5 years |
|
|
13,532 |
|
|
|
10,716 |
|
|
Customer relationships |
|
7-10 years |
|
|
34,986 |
|
|
|
30,875 |
|
|
Trade names |
|
20 years |
|
|
18,057 |
|
|
|
16,357 |
|
|
Domain names |
|
20 years |
|
|
191 |
|
|
|
191 |
|
|
Databases |
|
5-10 years |
|
|
31,292 |
|
|
|
25,052 |
|
|
Non-competition agreements |
|
2-5 years |
|
|
1,768 |
|
|
|
728 |
|
|
|
|
|
|
|
111,264 |
|
|
|
88,149 |
|
|
Accumulated amortization: |
|
|
|
|
|
|
|
|
|
|
|
Purchased IP and capitalized litigation costs |
|
|
|
|
- |
|
|
|
(34 |
) |
|
Software developed for internal use |
|
|
|
|
(505 |
) |
|
|
(50 |
) |
|
Acquired proprietary technology |
|
|
|
|
(2,660 |
) |
|
|
(133 |
) |
|
Customer relationships |
|
|
|
|
(4,840 |
) |
|
|
(272 |
) |
|
Trade names |
|
|
|
|
(916 |
) |
|
|
(50 |
) |
|
Domain names |
|
|
|
|
(10 |
) |
|
|
(1 |
) |
|
Databases |
|
|
|
|
(3,354 |
) |
|
|
(155 |
) |
|
Non-competition agreements |
|
|
|
|
(448 |
) |
|
|
(9 |
) |
|
|
|
|
|
|
(12,733 |
) |
|
|
(704 |
) |
|
Net intangible assets: |
|
|
|
|
|
|
|
|
|
|
|
Purchased IP and capitalized litigation costs |
|
|
|
|
- |
|
|
|
1,625 |
|
|
Software developed for internal use |
|
|
|
|
10,933 |
|
|
|
2,521 |
|
|
Acquired proprietary technology |
|
|
|
|
10,872 |
|
|
|
10,583 |
|
|
Customer relationships |
|
|
|
|
30,146 |
|
|
|
30,603 |
|
|
Trade names |
|
|
|
|
17,141 |
|
|
|
16,307 |
|
|
Domain names |
|
|
|
|
181 |
|
|
|
190 |
|
|
Databases |
|
|
|
|
27,938 |
|
|
|
24,897 |
|
|
Non-competition agreements |
|
|
|
|
1,320 |
|
|
|
719 |
|
|
|
|
|
|
$ |
98,531 |
|
|
$ |
87,445 |
|
The amount associated with Purchased IP and capitalized litigation costs, included in the Information Services segment, is mainly related to the intellectual property purchased by the Company’s subsidiary, TBO, from Ole Poulsen (“Purchased IP”) pursuant to the Intellectual Property Purchase Agreement dated October 14, 2014 and related legal and other costs incurred and paid in defending the Company’s claims to the Purchased IP against TransUnion Risk and Alternative Data Solutions, Inc. (“TRADS”). In 2016, the Company wrote off the remaining balance of Purchased IP and capitalized litigation costs of $4,055, which is reflected in the operating expenses as write-off of intangible assets in the consolidated statements of operations for the year ended December 31,
F-24
2016, as a result of an unfavorable ruling in relation to the litigation. See Note 18, “Commitment and contingencies,” for additional information regarding the litigation involving the Purchased IP.
The gross amount associated with software developed for internal use mainly represents capitalized costs of internally developed software. The amounts relating to acquired proprietary technology, customer relationships, trade names, domain names, databases, and non-competition agreements all represent the fair values of intangible assets acquired as a result of the Fluent Acquisition and the Q Interactive Acquisition.
Amortization expenses of $12,084, $698 and $6 were included in depreciation and amortization expenses for the years ended December 31, 2016, 2015 and 2014, respectively. As of December 31, 2016, intangible assets of $4,576, included in the gross amounts of software developed for internal use, have not started amortization, as they have not yet been put into use.
The Company capitalized $11,318 and $3,428 during the years ended December 31, 2016 and 2015, with $8,867 and $2,230 related to internally developed software, and $2,451 and $1,198 related to purchased intellectual property litigation costs, respectively.
As of December 31, 2016, estimated amortization expenses related to the Company’s intangible assets for 2017 through 2022 and thereafter are as follows:
|
(In thousands) |
|
|
|
|
|
Year |
|
December 31, 2016 |
|
|
|
2017 |
|
$ |
13,860 |
|
|
2018 |
|
|
13,901 |
|
|
2019 |
|
|
13,592 |
|
|
2020 |
|
|
13,150 |
|
|
2021 |
|
|
9,942 |
|
|
2022 and thereafter |
|
|
34,086 |
|
|
Total |
|
$ |
98,531 |
|
9. Goodwill
Goodwill represents the cost in excess of the fair value of the net assets acquired in a business combination. As of December 31, 2016, the balance of goodwill includes $5,227 as a result of the acquisition of Interactive Data effective on October 2, 2014, $155,645 as a result of the Fluent Acquisition effective on December 8, 2015, and $5,384 as a result of the Q Interactive Acquisition effective on June 8, 2016. The following table presents the changes in the amount of goodwill for the years ended December 31, 2016 and 2015.
|
(In thousands) |
|
|
|
|
|
Balance as of January 1, 2015 |
|
$ |
5,227 |
|
|
Addition as a result of TBO Merger with Tiger Media |
|
|
35,472 |
|
|
Write-off of goodwill resulted from the disposal of the Advertising Business |
|
|
(35,472 |
) |
|
Addition as a result of Fluent acquisition |
|
|
156,526 |
|
|
Balance as of December 31, 2015 |
|
|
161,753 |
|
|
Decrease as a result of adjustments to the Fluent Acquisition |
|
|
(881 |
) |
|
Addition as a result of the Q Interactive Acquisition |
|
|
5,384 |
|
|
Balance as of December 31, 2016 |
|
$ |
166,256 |
|
In accordance with ASC Topic 350, “Intangibles - Goodwill and Other,” goodwill is tested at least annually for impairment, or when events or changes in circumstances indicate that the carrying amount of such assets may not be recoverable, by assessing qualitative factors or performing a quantitative analysis in determining whether it is more likely than not that its fair value exceeds the carrying value. We performed our annual goodwill impairment test on October 1, 2016 which resulted in no impairment of goodwill.
As of December 31, 2016, there are no events or changes in circumstances to indicate that goodwill is impaired.
F-25
10. Accrued expenses and other current liabilities
Accrued expenses and other current liabilities consist of the following:
|
(In thousands) |
|
December 31, 2016 |
|
|
December 31, 2015 |
|
||
|
Liability for employee incentive-based compensation plan |
|
$ |
- |
|
|
$ |
4,000 |
|
|
Employees compensation expenses |
|
|
2,530 |
|
|
|
3,325 |
|
|
Professional fees payable |
|
|
2,954 |
|
|
|
823 |
|
|
Accrued interest expenses |
|
|
231 |
|
|
|
316 |
|
|
Insurance payable |
|
|
227 |
|
|
|
- |
|
|
Advertising and marketing expenses payable |
|
|
174 |
|
|
|
- |
|
|
Deferred rent |
|
|
113 |
|
|
|
235 |
|
|
Miscellaneous expenses payable |
|
|
752 |
|
|
|
461 |
|
|
Total |
|
$ |
6,981 |
|
|
$ |
9,160 |
|
The liability for employee incentive-based compensation plan represents the deferred payout of employee incentive-based compensation assumed upon the acquisition of Fluent, which was paid in 2016.
11. Long-term debt, net
Long-term debt, net, including promissory notes payable to certain shareholders, net, as of December 31, 2016, consist of the following:
|
|
|
12% term loan, |
|
|
10% promissory notes, |
|
|
|
|
|
||
|
(In thousands) |
|
due 2020 |
|
|
due 2021 |
|
|
Total |
|
|||
|
Principal amount |
|
$ |
42,750 |
|
|
|
10,000 |
|
|
$ |
52,750 |
|
|
Less: unamortized debt issuance costs |
|
|
3,964 |
|
|
|
384 |
|
|
|
4,348 |
|
|
Add: PIK interest accrued to the principal balance |
|
|
479 |
|
|
|
1,132 |
|
|
|
1,611 |
|
|
Long-term debt, net |
|
|
39,265 |
|
|
|
10,748 |
|
|
|
50,013 |
|
|
Less: Current portion of long-term debt |
|
|
4,135 |
|
|
|
- |
|
|
|
4,135 |
|
|
Long-term debt, net (non-current) |
|
$ |
35,130 |
|
|
$ |
10,748 |
|
|
$ |
45,878 |
|
Long-term debt, net, including promissory notes payable to certain shareholders, net, as of December 31, 2015, consist of the following:
|
|
|
12% term loan, |
|
|
10% promissory notes, |
|
|
|
|
|
||
|
(In thousands) |
|
due 2020 |
|
|
due 2021 |
|
|
Total |
|
|||
|
Principal amount |
|
$ |
45,000 |
|
|
|
10,000 |
|
|
$ |
55,000 |
|
|
Less: unamortized debt issuance costs |
|
|
3,729 |
|
|
|
449 |
|
|
|
4,178 |
|
|
Add: PIK interest accrued to the principal balance |
|
|
29 |
|
|
|
67 |
|
|
|
96 |
|
|
Long-term debt, net |
|
|
41,300 |
|
|
|
9,618 |
|
|
|
50,918 |
|
|
Less: Current portion of long-term debt |
|
|
2,250 |
|
|
|
- |
|
|
|
2,250 |
|
|
Long-term debt, net (non-current) |
|
$ |
39,050 |
|
|
$ |
9,618 |
|
|
$ |
48,668 |
|
Term Loan
On December 8, 2015, Fluent entered into an agreement (“Credit Agreement”) with certain financial institutions, for a term loan in the amount of $45.0 million (“Term Loan”), with Whitehorse Finance, Inc. acting as the agent (the “Term Loan Agent”). Fluent’s obligations in respect of the Term Loan are guaranteed by the Company and substantially all of the other direct and indirect subsidiaries of the Company. The obligations of Fluent and the obligations of the guarantors are secured by substantially all of such entities’ assets. The Credit Agreement has a term of five years.
The Term Loan accrues interest at LIBOR (with a floor of 0.5%) plus 10.5% per annum, payable in cash, plus an additional 1.0% per annum payable, at Fluent’s election, in-kind or in cash. Interest under the Term Loan is payable monthly, including monthly compounding of paid-in-kind interest.
F-26
Payments of principal in the amount of $563 each are due on the last day of each quarter during the term of the Credit Agreement, commencing March 31, 2016. Additionally, 50% of excess cash flow of Fluent and its subsidiaries for the immediately preceding fiscal year is required to be paid towards the Term Loan obligations, commencing with the fiscal year ending December 31, 2016. As of December 31, 2016, an additional amount of $1,885 was reclassified into current portion of long-term debt in the consolidated balance sheet, resulting from the excess cash flow as mentioned above. The Credit Agreement provides for certain other customary mandatory prepayments upon certain events. The Credit Agreement provides for certain prepayment premiums during the first 4 years of the Term Loan, provided that the prepayment premiums are not applicable to scheduled payments of principal, the required excess cash flow payments and certain other required prepayments.
In connection with the Term Loan, on December 8, 2015, the Company issued to the Term Loan Agent and its affiliates warrants (the “Whitehorse Warrants”) to purchase, in aggregate, 200,000 shares of common stock. The Whitehorse Warrants are exercisable at any time (i) following the date of approval for listing of the common stock issuable upon exercise of the Whitehorse Warrants on the NYSE MKT and (ii) prior to the ten year anniversary of the date of issuance of the Whitehorse Warrants at $8.00 per share. If the Company has a public equity offering, certain adjustments are available.
Pursuant to the Limited Consent and Amendment No. 2 to Credit Agreement entered into on September 30, 2016 (the “Amendment No. 2”), the exercise price of the Whitehorse Warrants was amended to $5.08 from $8.00, and the Company also issued additional new warrants to purchase 100,000 shares of common stock (“New Whitehorse Warrants”), with an exercise price of $5.08 per share and an expiration date of September 30, 2026. As a result of the amended and newly issued warrants, an aggregate of $492 was recognized as debt issuance costs and additional paid-in capital.
The fair value of warrants issued to the Term Loan Agent and its affiliates of $492 and $1,586 were recognized as debt costs for the years ended December 31, 2016 and 2015, respectively. At December 31, 2016 and 2015, the balance was $1,679 and $1,564, respectively. We estimate the fair value of such warrants on the date of grant using a Black-Scholes pricing model, applying the following assumptions, and amortize the fair value to interest expense over the term of the Term Loan using the interest method:
|
|
|
Year Ended December 31, |
|
|||||
|
|
|
2016 |
|
|
2015 |
|
||
|
Expected term (in years) |
|
10 |
|
|
10 |
|
||
|
Risk-free interest rate |
|
|
1.56 |
% |
|
|
2.24 |
% |
|
Expected volatility |
|
|
90.47 |
% |
|
|
114.33 |
% |
|
Expected dividend yield |
|
|
0.00 |
% |
|
|
0.00 |
% |
The Credit Agreement, as amended, contains customary representations and warranties, covenants (including certain financial covenants), and events of default, upon the occurrence of which the Term Loan Agent may accelerate the obligations under the Credit Agreement. Certain restrictive covenants impose limitations on the way we conduct our business, including limitations on the amount of additional debt we are able to incur and restricts our ability to make certain investments and other restricted payments, including certain intercompany payments of cash and other property. The financial covenants include the requirement that the Company and its subsidiaries attain certain quarterly minimum EBITDA thresholds, Fluent and its subsidiaries attain certain quarterly minimum EBITDA thresholds, Fluent and its subsidiaries meet certain leverage ratios on a quarterly basis, Fluent and its subsidiaries meet certain fixed charge coverage ratios on a quarterly basis, and Fluent and its subsidiaries maintain at all times cash and cash equivalent balances of at least $2.0 million (or such lesser amount agreed to by the Term Loan Agent), in the aggregate. As of December 31, 2016, the Company was in compliance with the financial covenant requirements.
Promissory Notes
On December 8, 2015, the Company entered into and consummated the promissory notes financing (the “Promissory Notes”) with each of Frost Gamma Investment Trust (“Frost Gamma”), an affiliate of Phillip Frost, M.D., the Vice Chairman of the Company’s Board of Directors, Michael Brauser, the Executive Chairman of the Board of Directors, and another investor (the “Promissory Note Investors”), pursuant to which the Company issued Promissory Notes of $5.0 million to Frost Gamma, $4.0 million to Michael Brauser, and $1.0 million to another investor, for an aggregate financing in the amount of $10.0 million. The Promissory Note Investors received (i) a promissory note in the principal amount equal to the amount of their respective promissory notes, with a rate of interest of 10% per annum, which interest shall be capitalized monthly by adding to the outstanding principal amount of such Promissory Notes, and (ii) a grant of 100 shares of Series B Preferred for each $1.0 million increment of their respective Promissory Notes, with a total of 1,000 shares of Series B Preferred granted (“Promissory Note Shares”), pursuant to fee letter agreements. Each share of Series B Preferred shall automatically convert into 50 shares of common stock on the Conversion Date, as defined below in Note 14. Under the terms of the Promissory Notes, the Company is required to repay the principal amounts thereof, with all accrued interest thereon, on the date that is six months after the repayment of all amounts due under the Credit Agreement, except that the Company may repay the Promissory Notes earlier from the proceeds of a round of public equity financing.
F-27
The fair value of Promissory Note Shares of $413 was calculated by multiplying the closing common stock market price of the Company on December 8, 2015 of $8.45, with the total shares granted, as converted, which was recognized as debt costs, and the unamortized debt costs as at December 31, 2016 and 2015 was $350 and $409, respectively.
In connection with the Promissory Notes, on December 8, 2015, the Company, each lender under the Promissory Notes, and the Term Loan Agent, etc. entered into a Subordination Agreement (the “Subordination Agreement”), pursuant to which the debt under the Promissory Notes was made expressly subordinate to the debt under the Credit Agreement. In addition, the Subordination Agreement restricts the terms of the Promissory Notes, including certain modifications of such terms, and the ability of any lender under the Promissory Notes to take certain actions with respect to the obligations arising under the Promissory Notes. The terms of the Subordination Agreement shall remain in effect until such time that all obligations under the Credit Agreement are paid in full.
The net balance of Promissory Notes was presented as promissory notes payable to certain shareholders, net, in the consolidated balance sheet.
Maturities
Excluding potential additional principal payments due on the Term Loans based on excess cash flows for the immediately preceding fiscal year, as mentioned above, scheduled future maturities of total debts as of December 31, 2016, were as follows:
|
(In thousands) |
|
|
|
|
|
Year |
|
|
|
|
|
2017 |
|
$ |
4,135 |
|
|
2018 |
|
|
2,250 |
|
|
2019 |
|
|
2,250 |
|
|
2020 |
|
|
34,115 |
|
|
2021 |
|
|
10,000 |
|
|
Total maturities |
|
|
52,750 |
|
|
Add: Accrued PIK interest, added to the principal |
|
|
1,611 |
|
|
Less: Unamortized debts issuance costs |
|
|
(4,348 |
) |
|
Total |
|
$ |
50,013 |
|
Fair value
As mentioned above, the Company’s long-term debt outstanding as at December 31, 2016 represented 1) the Term Loan pursuant to a Credit Agreement on December 8, 2015, with interest at LIBOR (with a floor of 0.5%) plus 10.5% per annum, and 2) Promissory Notes pursuant to the agreements effective December 8, 2015, with a rate of interest of 10% per annum. By considering the relatively stable interest rates, and the fact that the Term Loan has a variable interest rate, we regard the fair values of the long-term debt to approximate their carrying amount as of December 31, 2016.
12. Contingent consideration payable in stock
Contingent consideration payable in stock as of December 31, 2016 represented the fair value of Q Interactive Earn-out Shares payable to Selling Source. Refer to details as discussed in Note 4, “Acquisitions.”
13. Income taxes
The Company is subject to federal and state income taxes in the United States. The benefit for income taxes on loss from continuing operations consisted of the following:
F-28
|
|
|
Year Ended December 31, |
|
|||||||||
|
(In thousands) |
|
2016 |
|
|
2015 |
|
|
2014 |
|
|||
|
Current |
|
|
|
|
|
|
|
|
|
|
|
|
|
Federal |
|
$ |
- |
|
|
$ |
(123 |
) |
|
$ |
- |
|
|
State |
|
|
87 |
|
|
|
- |
|
|
|
- |
|
|
|
|
|
87 |
|
|
|
(123 |
) |
|
|
- |
|
|
Deferred |
|
|
|
|
|
|
|
|
|
|
|
|
|
Federal |
|
|
(14,278 |
) |
|
|
(15,771 |
) |
|
|
(167 |
) |
|
State |
|
|
(1,732 |
) |
|
|
(689 |
) |
|
|
- |
|
|
Valuation allowance |
|
|
1,881 |
|
|
|
- |
|
|
|
- |
|
|
|
|
|
(14,129 |
) |
|
|
(16,460 |
) |
|
|
(167 |
) |
|
Income tax benefit |
|
$ |
(14,042 |
) |
|
$ |
(16,583 |
) |
|
$ |
(167 |
) |
The Company’s effective income tax benefit differed from the statutory federal income tax rate of 34.0% for the years ended December 31, 2016, 2015 and 2014. For the year ended December 31, 2016, this difference is mainly the result of the valuation allowance applied against the Company’s deferred tax assets and state income taxes. For the year ended December 31, 2015, this difference is primarily due to state income taxes and one-time contingent earn out costs related to shares issued pursuant to the TBO Merger Agreement. For the year ended December 31, 2014, this difference is primarily due to the permanent differences. A reconciliation was shown as follows:
|
|
|
Year Ended December 31, |
|
|||||||||||||||||||||
|
(In thousands) |
|
2016 |
|
|
2015 |
|
|
2014 |
|
|||||||||||||||
|
Tax on continuing operating loss before income taxes |
|
$ |
(14,663 |
) |
|
|
34.0 |
% |
|
$ |
(20,117 |
) |
|
|
34.0 |
% |
|
$ |
(264 |
) |
|
|
34.0 |
% |
|
Effect of state taxes (net of federal tax benefit) |
|
|
(1,645 |
) |
|
|
3.8 |
% |
|
|
(1,800 |
) |
|
|
3.0 |
% |
|
|
(7 |
) |
|
|
0.9 |
% |
|
Non-deductible contingent earn out costs |
|
|
- |
|
|
|
0.0 |
% |
|
|
4,862 |
|
|
|
-8.2 |
% |
|
|
- |
|
|
|
0.0 |
% |
|
Non-deductible acquisition costs |
|
|
433 |
|
|
|
-1.0 |
% |
|
|
366 |
|
|
|
-0.6 |
% |
|
|
101 |
|
|
|
-13.0 |
% |
|
Other permanent differences |
|
|
124 |
|
|
|
-0.3 |
% |
|
|
185 |
|
|
|
-0.3 |
% |
|
|
3 |
|
|
|
-0.4 |
% |
|
Others |
|
|
(172 |
) |
|
|
0.4 |
% |
|
|
(79 |
) |
|
|
0.1 |
% |
|
|
- |
|
|
|
0.0 |
% |
|
Valuation allowance |
|
|
1,881 |
|
|
|
-4.4 |
% |
|
|
- |
|
|
|
0.0 |
% |
|
|
- |
|
|
|
0.0 |
% |
|
Income tax benefit |
|
$ |
(14,042 |
) |
|
|
32.5 |
% |
|
$ |
(16,583 |
) |
|
|
28.0 |
% |
|
$ |
(167 |
) |
|
|
21.5 |
% |
Components of deferred tax assets and liabilities consist of the following:
|
(In thousands) |
|
December 31, 2016 |
|
|
December 31, 2015 |
|
||
|
Deferred tax assets: |
|
|
|
|
|
|
|
|
|
Net operating loss carryforwards |
|
$ |
8,041 |
|
|
$ |
4,619 |
|
|
Share-based compensation |
|
|
21,503 |
|
|
|
12,069 |
|
|
Liability for employee incentive-based compensation plan |
|
|
- |
|
|
|
1,528 |
|
|
Accounts receivable |
|
|
392 |
|
|
|
530 |
|
|
Accrued expenses and other current liabilities |
|
|
43 |
|
|
|
136 |
|
|
Others |
|
|
11 |
|
|
|
- |
|
|
|
|
|
29,990 |
|
|
|
18,882 |
|
|
Valuation allowance |
|
|
(1,881 |
) |
|
|
- |
|
|
|
|
|
28,109 |
|
|
|
18,882 |
|
|
Deferred tax liabilities: |
|
|
|
|
|
|
|
|
|
Intangible assets |
|
$ |
27,962 |
|
|
$ |
31,743 |
|
|
Property and equipment |
|
|
117 |
|
|
|
239 |
|
|
Prepaid expenses and other current assets |
|
|
- |
|
|
|
412 |
|
|
Internal Revenue Code Sec. 481 adjustment |
|
|
30 |
|
|
|
61 |
|
|
|
|
|
28,109 |
|
|
|
32,455 |
|
|
Net deferred tax liability |
|
$ |
- |
|
|
$ |
(13,573 |
) |
F-29
As of December 31, 2016, the Company had federal and state net operating loss carryforwards of $22,682 and $18,566, respectively, which begin to expire in 2034. The Company’s net operating losses may be subject to annual Section 382 limitations due to ownership changes that could impact the future realization. As a result of certain realization requirements of ASC 718, “Compensation — Stock Compensation,” the table of deferred tax assets and liabilities shown above does not include certain deferred tax assets as of December 31, 2016 and 2015 that arose directly from tax deductions related to equity compensation that are greater than the compensation recognized for financial reporting. Equity will be increased by $301 if and when such deferred tax assets are ultimately realized or upon adoption of ASU 2016-09 as of January 1, 2017. The Company uses ASC 740 ordering when determining when excess tax benefits have been realized.
ASC 740 requires a valuation allowance to reduce the deferred tax assets reported if, based on the weight of the evidence, it is more likely than not that some or all of the deferred tax assets will not be realized. On a periodic basis, management evaluates and determines the amount of valuation allowance required and adjusts such valuation allowance accordingly. Primarily due to cumulative pre-tax losses in 2014, 2015, and 2016, management determined a valuation allowance of $1,881 was necessary as of December 31, 2016 to reduce the deferred tax assets to the amount that is more likely than not to be realized.
The Company assesses its income tax positions and records tax benefits for all years subject to examination based upon its evaluation of the facts, circumstances and information available at the reporting date. For those tax positions where it is more-likely-than-not that a tax benefit will be sustained, the Company has recorded the largest amount of tax benefit with a greater than 50% likelihood of being realized upon ultimate settlement with a taxing authority that has full knowledge of all relevant information. For those income tax positions where it is not more-likely-than-not that a tax benefit will be sustained, no tax benefit has been recognized in the Company’s financial statements.
The Company continually evaluates expiring statutes of limitations, audits, proposed settlements, changes in tax law and new authoritative rulings. All of the Company’s income tax filings since inception remain open for tax examinations.
A reconciliation of the gross amounts of unrecognized tax benefits, excluding accrued interest and penalties, for the year ended December 31, 2016 (no such items for the years ended December 31, 2015 and 2014), is as follows:
|
|
|
Year Ended |
|
|
|
(In thousands) |
|
December 31, 2016 |
|
|
|
Unrecognized tax benefits, opening |
|
$ |
- |
|
|
Gross increase - tax position in prior period |
|
|
1,668 |
|
|
Unrecognized tax benefits, ending balance |
|
$ |
1,668 |
|
In our tax return filed for the year ended December 31, 2015, a loss of $4,375, resulted from the disposal of Advertising Business, was included. This uncertain tax position of $1,668 is reflected as a reduction in deferred tax assets. Based on management’s assessment, no tax benefit has been recognized for the loss mentioned above. This unrecognized tax benefit, if recognized, would favorably affect the Company’s annual effective tax rate before application of any valuation allowance. The Company has not accrued any interest or penalties as of December 31, 2016 with respect to its uncertain tax positions.
The Company does not anticipate a significant increase or reduction in unrecognized tax benefits within the next twelve months.
14. Common shares, preferred shares and warrants
Common stock
As of December 31, 2016 and 2015, the number of issued and outstanding shares of common stock was 53,557,761 and 15,709,786, respectively, which did not include shares of treasury stock of 160,235 and 0, respectively.
The change in the number of outstanding shares of common stock during the year ended December 31, 2016 was a result of the following issuances:
|
|
• |
On February 22, 2016, the Company’s Series B Non-voting Convertible Preferred Stock, par value $0.0001 per share (the “Series B Preferred”), 450,962 shares in total, automatically converted into 22,548,100 shares of the Company’s common stock, by multiplying each such share of Series B Preferred by 50, pursuant to the Company’s Series B Preferred certificate of designation. |
F-30
|
|
• |
On March 11, 2016, the Company amended the certificate of designations of the Series A Preferred to provide for the conversion of the Series A Preferred into common stock on a one-for-one basis. Previously, the Series A Preferred were convertible in connection with a sale of any such shares to a non-affiliate of the Company. As a result, all the outstanding shares of Series A Preferred converted into 6,672,022 shares of common stock. |
|
|
• |
During the year ended December 31, 2016, the Company issued an aggregate of 1,069,728 shares (“Exchange Shares”) of common stock in exchange for warrants previously issued to four stockholders of the Company, including Frost Gamma, resulting in a loss on the exchange of warrants of $1,273 recognized in other expenses, net. No additional consideration was paid by the warrant holders and the old warrants were cancelled. In addition, new warrants to purchase 320,102 shares of common stock (the “New Exchange Warrants”), at an exercise price of $10.00 per share, were issued to one of the warrant holders as part of the exchange of warrants. |
|
|
• |
During the year ended December 31, 2016, 14,500 restricted shares of common stock were issued to two vendors of the Company as additional consideration for services rendered. |
|
|
• |
An aggregate of 1,434,562 shares of common stock were issued as a result of the vesting of restricted stock units (“RSUs”), of which, 360,235 shares of common stock were withheld to pay withholding taxes upon such vesting, which are reflected in treasury stock. |
|
|
• |
In December 2016, an aggregate of 200,000 shares of common stock were sold to an investor. These shares were issued out of treasury stock. |
|
|
• |
An aggregate of 3,000,000 shares of common stock were issued in registered direct offerings (“Registered Direct Offerings”) to certain investors, pursuant to the securities purchase agreements entered into on May 17, 2016 and November 28, 2016. |
|
|
• |
On June 8, 2016, an aggregate of 2,369,190 shares of common stock were issued to Selling Source in connection with the Q Interactive Acquisition. |
The activities in the number of outstanding shares of common stock during the year ended December 31, 2015 was a result of the following:
|
|
• |
On March 21, 2015, for accounting purpose, 7,291,299 common shares were deemed to be issued to the accounting acquiree as a result of the reverse acquisition. |
|
|
• |
During the year ended December 31, 2015, an aggregate of 382,300 common shares were issued to certain directors, officers and employees, as a result of the vesting of RSUs. |
|
|
• |
On July 28, 2015, 1,280,410 shares were issued to an institutional investor as a result of a registered direct offering. Pursuant to the definitive purchase agreement (“July Securities Purchase Agreement”) with an institutional investor on July 24, 2015, the Company sold 1,280,410 shares of its common stock at a per share price of $7.81. The net proceeds to the Company from the offering, after deducting offering costs of $600, were received on July 28, 2015. |
|
|
• |
During the year ended December 31, 2015, an aggregate of 45,000 shares were issued to four third-party consulting firms, for services to be performed in accordance with contracts. |
|
|
• |
In December 2015, an aggregate of 93,500 shares of Series A Preferred were converted into the Company’s Common Shares, based on the conversion rate of 1:1. |
Warrants
Warrants to purchase an aggregate of 1,589,830 shares of the Company’s common stock were outstanding as of December 31, 2015, which includes:
|
|
• |
Pursuant to a concurrent private placement with the 2015 July Securities Purchase Agreement, the Company issued to the investor warrants to purchase 0.5 share of common stock for each share of common stock purchased in the registered direct offering at an exercise price of $10.00 per share, for a total of 640,205 shares of common stock. |
F-31
|
|
• |
Warrants to purchase 200,000 shares of the Company’s common stock were issued to the Term Loan Agent at an exercise price of $8.00 per shares. |
An aggregate of 1,069,728 Exchange Shares were issued to four stockholders during 2016, in exchange for the partial cancellation of warrants previously issued to such stockholders. Noncash loss on the Exchange Shares of $1,273 was recognized in other expense, net during 2016.
As of December 31, 2016, warrants to purchase an aggregate of 2,220,102 shares of common stock were outstanding, which includes:
|
|
• |
New Exchange Warrants to purchase 320,102 shares of common stock were issued to an institutional investor as part of the exchange of warrants, as discussed above. The New Exchange Warrants will expire twenty-four months from the date of issuance. |
|
|
• |
Warrants to purchase 200,000 shares of the Company’s common stock were issued as part of our Term Loan of $45 million, with the exercise price being amended to $5.08 as a result of the Amendment No. 2 to Credit Agreement entered into on September 30, 2016. As part of the Amendment No. 2, we issued additional New Whitehorse Warrants to purchase 100,000 shares of common stock, with an exercise price of $5.08 per share and an expiration date of September 30, 2026. As a result of the amended and newly issued warrants, an aggregate of $492 was recognized in additional paid-in capital. |
|
|
• |
Concurrent with the Registered Direct Offering in May 2016, as discussed above, warrants to purchase an aggregate of 500,000 shares of common stock were issued to five investors, with an exercise price of $8.00 per share, which are exercisable beginning six months and one day from the date of issuance and expire 24 months from the date they became exercisable. |
|
|
• |
Concurrent with the Registered Direct Offering in November 2016, warrants to purchase an aggregate of 1,000,000 shares and 100,000 shares of common stock were issued to four investors and related agents, with an exercise price of $3.75 and $5.00 per share, respectively. These warrants issued to the four investors are exercisable beginning six months and one day from the date of issuance and expire five years from the date they became exercisable, while the warrants issued to related agents are exercisable beginning six months and one day from the date of issuance and expire 24 months from the date they became exercisable. |
Treasury stock
As of December 31, 2016, the Company held 160,235 shares in treasury, with a cost of $531. This increase in treasury stock during the year ended December 31, 2016 was due to 360,235 shares that were withheld to pay withholding taxes upon the vesting of RSUs, which was decreased by the sale of 200,000 shares of treasury stock.
Series A Preferred shares
As part of the TBO Merger, the Company, as accounting acquiree, issued a total of 4,965,302 shares of Series A Preferred to TBO shareholders. An additional 1,800,220 shares of Company’s Series A Preferred were issued subject to an earn-out on March 11, 2016.
In March 2016, an aggregate of 6,672,022 outstanding shares of Series A Preferred, including the Series A Earn Out Shares, were converted into the Company’s common stock. There was no outstanding Series A Preferred as of December 31, 2016.
Series B Preferred shares
As of December 31, 2015, the Company had issued a total of 450,962 shares of Series B Preferred to the Sellers of Fluent and certain investors.
On February 22, 2016, the 450,962 shares of Series B Preferred automatically converted into 22,548,100 shares of the Company’s common stock, by multiplying each such share of Series B Preferred by 50. There was no outstanding Series B Preferred as of December 31, 2016.
15. Share-based payments
As of December 31, 2016, the Company maintains two share-based incentive plans: the 2008 Share Incentive Plan (the “2008 Plan”), which was carried forward as a result of the TBO Merger effective on March 21, 2015 and the Cogint, Inc. 2015 Stock Incentive Plan
F-32
(the “2015 Plan”), which was approved during the annual meeting of stockholders on June 2, 2015, which authorized the issuance of 2,500,000 shares of common stock. The 2015 Plan was amended on June 3, 2016 at the Company’s annual meeting of stockholders which approved an increase of the number of shares of common stock authorized for issuance under the 2015 Plan to 12,500,000. The primary purpose of the 2015 Plan is to attract, retain, reward and motivate certain individuals by providing them with an opportunity to acquire or increase a proprietary interest in the Company and to incentivize them to expend maximum effort for the growth and success of the Company, so as to strengthen the mutuality of the interests between such individuals and the stockholders of the Company.
As of December 31, 2016, there were 180,568 and 5,555,742 shares of common stock reserved for issuance under the 2008 Plan and the 2015 Plan, respectively.
Outside of the 2008 Plan and 2015 Plan, as amended, Marlin Capital Investments, LLC (“Marlin Capital”), a company which our Executive Chairman Michael Brauser owns 50% and is one of two managers, held RSUs representing the right to receive 2,000,000 shares of common stock of TBO (“TBO Common Stock”), which was assumed by the Company upon closing of the TBO Merger and such RSUs represent the right to receive 2,000,000 shares of the Company’s common stock. These RSUs vest annually beginning from October 13, 2015 only if certain performance goals of the Company are met. The shares underlying such RSUs will not be delivered until October 13, 2018, unless there is a change of control of the Company. For the years ended December 31, 2016 and 2015, share-based compensation expenses of $1,252 and $1,512, associated with shares under the Marlin Capital agreement, were recognized, respectively.
In addition, 960,000 RSUs held by TBO employees, including the Company’s Chief Executive Officer and Interim President, and Chief Financial Officer, were also assumed by the Company and represent the right to receive 960,000 shares of the Company’s common stock, with a vesting period of two years, which were fully vested and delivered in 2016.
Outside of the 2008 Plan and 2015 Plan, effective November 16, 2015, the Company entered into an employment agreement with Michael Brauser (the “Michael Brauser Employment Agreement”) relating to his service as Executive Chairman of the Board of Directors, pursuant to which, Michael Brauser will receive an annual base salary of $25 payable in accordance with the Company’s general payroll practices and 5,000,000 RSUs representing the right to receive 5,000,000 shares of common stock. The issuance of shares of common stock underlying the RSUs was approved by the stockholders annual meeting in 2016. These RSUs vest ratably over a four year period; provided, however, that no portion of the RSUs shall vest unless and until the Company has, for any fiscal year in which the RSUs are outstanding, gross revenue determined in accordance with the Company’s audited financial statements in excess of $100.0 million for such fiscal year and positive earnings before income tax, interests, depreciation and amortization (“EBITDA”) (as determined based on the Company’s audited financial statements) for such fiscal year, after subtracting all charges for equity compensation paid to executives or other service providers to the Company (collectively, the “Vesting Conditions”). Such RSUs vest in full upon a Company change in control, termination of Michael Brauser without cause, termination by Michael Brauser for good reason, or Michael Brauser’s death or disability. As of December 31, 2015, the Company concluded that it would be probable that the Vesting Conditions would be met.
Outside of the 2008 Plan and 2015 Plan, on December 8, 2015, at the time of Phillip Frost’s joining the Board of Directors of the Company as Executive Vice Chairman, Frost Gamma received a grant of 3,000,000 RSUs, and the issuance of shares of common stock underlying such RSUs was approved by the stockholders annual meeting in 2016. These grants were fully vested on December 8, 2015.
The Company determined the Board of Directors approval date to be the grant date and amortize the share-based compensation expenses beginning from the grant date.
Share options
Details of share options activity during the years ended December 31, 2016, 2015 and 2014 were as follows:
F-33
|
|
|
Number of options |
|
|
Weighted average exercise price per share |
|
|
Weighted average remaining contractual term |
|
|
Aggregate intrinsic value |
|
||||
|
Balance as of January 1, 2015 |
|
|
- |
|
|
$ |
- |
|
|
|
- |
|
|
$ |
- |
|
|
Additions as a result of the reverse acquisition |
|
|
407,000 |
|
|
$ |
9.21 |
|
|
|
|
|
|
|
|
|
|
Granted |
|
|
85,000 |
|
|
$ |
10.39 |
|
|
|
|
|
|
|
|
|
|
Forfeited |
|
|
(30,000 |
) |
|
$ |
7.85 |
|
|
|
|
|
|
|
|
|
|
Outstanding as of December 31, 2015 |
|
|
462,000 |
|
|
$ |
9.52 |
|
|
5.3 years |
|
|
$ |
- |
|
|
|
Granted |
|
|
30,000 |
|
|
$ |
5.04 |
|
|
|
|
|
|
|
|
|
|
Forfeited |
|
|
(40,000 |
) |
|
$ |
8.45 |
|
|
|
|
|
|
|
|
|
|
Expired |
|
|
(100,000 |
) |
|
$ |
6.02 |
|
|
|
|
|
|
|
|
|
|
Outstanding as of December 31, 2016 |
|
|
352,000 |
|
|
$ |
10.25 |
|
|
4.4 years |
|
|
$ |
- |
|
|
|
Options vested and expected to vest as of December 31, 2016 |
|
|
352,000 |
|
|
$ |
10.25 |
|
|
4.4 years |
|
|
$ |
- |
|
|
|
Options exercisable as of December 31, 2016 |
|
|
283,250 |
|
|
$ |
10.56 |
|
|
3.3 years |
|
|
$ |
- |
|
|
The aggregate intrinsic value amounts in the table above represent the difference between the closing price of the Company’s common stock on December 31, 2016 of $3.45 and the exercise price, multiplied by the number of in-the-money stock options as of the same date.
The activity of unvested balance of options is shown below for the years ended December 31, 2016, 2015 and 2014:
|
|
|
Number of options |
|
|
Weighted average exercise price per share |
|
|
Weighted average remaining contractual term |
|
|||
|
Unvested as of January 1, 2015 |
|
|
- |
|
|
$ |
- |
|
|
|
- |
|
|
Additions as a result of the reverse acquisition |
|
|
63,334 |
|
|
$ |
6.82 |
|
|
|
|
|
|
Granted |
|
|
85,000 |
|
|
$ |
10.39 |
|
|
|
|
|
|
Vested |
|
|
(11,667 |
) |
|
$ |
8.10 |
|
|
|
|
|
|
Forfeited |
|
|
(10,000 |
) |
|
$ |
7.85 |
|
|
|
|
|
|
Unvested as of December 31, 2015 |
|
|
126,667 |
|
|
$ |
9.02 |
|
|
8.1 years |
|
|
|
Granted |
|
|
30,000 |
|
|
$ |
5.04 |
|
|
|
|
|
|
Vested |
|
|
(47,917 |
) |
|
$ |
7.16 |
|
|
|
|
|
|
Forfeited |
|
|
(40,000 |
) |
|
$ |
8.45 |
|
|
|
|
|
|
Unvested as of December 31, 2016 |
|
|
68,750 |
|
|
$ |
8.91 |
|
|
8.9 years |
|
|
On June 3, 2016, a total of 30,000 share options were granted to two employees with a vesting period of four years.
We estimate the fair value of each stock option on the date of grant using a Black-Scholes option-pricing model applying the following assumptions, and amortize the fair value to expense over the option’s vesting period using the straight-line attribution approach for employees and non-employee directors, for the years ended December 31, 2016 and 2015:
|
|
|
Year Ended December 31, |
|
|||||
|
|
|
2016 |
|
|
2015 |
|
||
|
Expected term (in years) |
|
4 |
|
|
4 |
|
||
|
Risk-free interest rate |
|
|
1.71 |
% |
|
1.57% - 1.66% |
|
|
|
Expected volatility |
|
|
99.27 |
% |
|
20.97% - 128.66% |
|
|
|
Expected dividend yield |
|
|
0.00 |
% |
|
|
0.00% |
|
We estimate the risk-free interest rate based on rates in effect for United States government bonds with terms similar to the expected terms of the stock options, at the time of grant. We estimate the volatility of our shares on the date of grant utilizing the historical volatility of our publicly-traded shares. We estimate the expected terms by taking into account the contractual terms and historical exercise patterns.
The weighted average grant-date fair value of share options granted during the years ended December 31, 2016, 2015 and 2014 was $3.55, $7.35 and $0, respectively. There were no share options exercised for the three years ended December 31, 2016. The total fair value of share options vested during the years ended December 31, 2016, 2015 and 2014 was $272, $61, and $0, respectively.
F-34
Compensation expense recognized from employee stock options for the years ended December 31, 2016, 2015 and 2014 was $110, $28 and $0, respectively, which was recognized in general and administrative expenses and discontinued operations in the consolidated statements of operations. As of December 31, 2016, unrecognized share-based compensation cost in respect of granted share options amounted to $366, which are expected to be recognized over a weighted average period of 3.0 years.
Restricted stock units
Details of unvested RSUs activity during the years ended December 31, 2016, 2015 and 2014 were as follows:
|
|
|
Number of units |
|
|
Weighted average grant-date fair value |
|
||
|
Balance as of September 22, 2014 (inception) |
|
|
- |
|
|
$ |
- |
|
|
Granted |
|
|
2,960,000 |
|
|
$ |
2.00 |
|
|
Unvested as of December 31, 2014 |
|
|
2,960,000 |
|
|
$ |
2.00 |
|
|
Additions as a result of the reverse acquisition |
|
|
416,800 |
|
|
$ |
4.81 |
|
|
Granted (1) |
|
|
13,890,500 |
|
|
$ |
9.16 |
|
|
Vested and delivered |
|
|
(382,300 |
) |
|
$ |
5.55 |
|
|
Vested not delivered |
|
|
(3,085,000 |
) |
|
$ |
8.36 |
|
|
Forfeited |
|
|
(79,000 |
) |
|
$ |
5.78 |
|
|
Unvested as of December 31, 2015(1) |
|
|
13,721,000 |
|
|
$ |
7.78 |
|
|
Granted |
|
|
1,339,758 |
|
|
$ |
4.17 |
|
|
Vested and delivered |
|
|
(1,074,327 |
) |
|
$ |
3.28 |
|
|
Withheld as treasury stock (2) |
|
|
(360,235 |
) |
|
$ |
1.52 |
|
|
Vested not delivered |
|
|
(1,022,667 |
) |
|
$ |
2.59 |
|
|
Forfeited |
|
|
(196,500 |
) |
|
$ |
7.16 |
|
|
Unvested as of December 31, 2016 |
|
|
12,407,029 |
|
|
$ |
8.40 |
|
|
|
|
|
|
|
|
|
|
|
|
(1) |
Among the grants in 2015 and the unvested balance as of December 31, 2015, 12,312,000 shares, with weighted average grant-date fair value of $9.48, were subsequently approved at the Company’s annual meeting of stockholders on June 3, 2016. |
|
(2) |
As discussed in Note 14, the increase in treasury stock was due to shares withheld to pay statutory withholding taxes upon the vesting of RSUs during the year ended December 31, 2016, among which, 200,000 shares of treasury stock were subsequently sold to an investor in 2016. |
The Company recognized compensation expenses (included in sales and marketing expenses, general and administrative expenses, and discontinued operations in the consolidated statements of operations, and intangible assets in the consolidated balance sheets) for these RSUs of $30,126, $34,505 and $23 for the years ended December 31, 2016, 2015 and 2014, respectively. The fair value of the RSUs was determined using the market value of the common shares on the date of grant, which was equivalent to the closing price of the common stock on the grant date.
As of December 31, 2016, unrecognized share-based compensation expenses associated with the granted RSUs amounted to $73,745, which are expected to be recognized over a weighted average period of 2.5 years.
Shares issued to third-party vendors
The Company issues shares to certain third-party vendors from time to time in lieu of cash for services rendered. During the years ended December 31, 2016, 2015 and 2014, 14,500, 45,000 and 0 restricted shares of common stock were issued to certain vendors of the Company as additional consideration for services rendered, respectively. Stock compensation expenses for shares issued to third-party vendors of $166, $446 and $0 for the years ended December 31, 2016, 2015 and 2014, respectively, were recognized in general and administrative expenses.
The share-based compensation expenses for the Company’s share options, RSUs and common stock were allocated to the following accounts in the consolidated financial statements for the years ended December 31, 2016, 2015 and 2014:
F-35
|
|
|
Year Ended December 31, |
|
|||||||||
|
(In thousands) |
|
2016 |
|
|
2015 |
|
|
2014 |
|
|||
|
Sales and marketing expenses |
|
$ |
2,340 |
|
|
$ |
310 |
|
|
$ |
- |
|
|
General and administrative expenses |
|
|
26,909 |
|
|
|
33,850 |
|
|
|
23 |
|
|
Discontinued operations |
|
|
- |
|
|
|
456 |
|
|
|
- |
|
|
|
|
|
29,249 |
|
|
|
34,616 |
|
|
|
23 |
|
|
Capitalized in intangible assets |
|
|
1,154 |
|
|
|
363 |
|
|
|
- |
|
|
Total |
|
$ |
30,403 |
|
|
$ |
34,979 |
|
|
$ |
23 |
|
16. Segment information
We currently manage our operations in two reportable segments, Information Services and Performance Marketing. The segments reflect the way the Company evaluates its business performance and manages its operations. In 2015, the Company has disposed of all assets and liabilities related to its Advertising Business and related results of operations has been recognized as discontinued operations. Therefore, no information relating to the Advertising Business is presented here.
Information regarding our Information Services and Performance Marketing segments are as follows:
|
|
|
Year Ended December 31, |
|
|||||||||
|
(In thousands) |
|
2016 |
|
|
2015 |
|
|
2014 (1) |
|
|||
|
Revenue: |
|
|
|
|
|
|
|
|
|
|
|
|
|
Information Services |
|
$ |
55,454 |
|
|
$ |
6,413 |
|
|
$ |
817 |
|
|
Performance Marketing |
|
|
131,382 |
|
|
|
7,678 |
|
|
|
- |
|
|
|
|
$ |
186,836 |
|
|
$ |
14,091 |
|
|
$ |
817 |
|
|
Income (loss) from operations: |
|
|
|
|
|
|
|
|
|
|
|
|
|
Information Services |
|
$ |
(44,483 |
) |
|
$ |
(44,384 |
) |
|
$ |
(777 |
) |
|
Performance Marketing |
|
|
10,445 |
|
|
|
(16 |
) |
|
|
- |
|
|
|
|
$ |
(34,038 |
) |
|
$ |
(44,400 |
) |
|
$ |
(777 |
) |
|
Depreciation and amortization: |
|
|
|
|
|
|
|
|
|
|
|
|
|
Information Services |
|
$ |
5,894 |
|
|
$ |
481 |
|
|
$ |
17 |
|
|
Performance Marketing |
|
|
6,737 |
|
|
|
360 |
|
|
|
- |
|
|
|
|
$ |
12,631 |
|
|
$ |
841 |
|
|
$ |
17 |
|
|
Share-based payments: |
|
|
|
|
|
|
|
|
|
|
|
|
|
Information Services |
|
$ |
25,916 |
|
|
$ |
33,906 |
|
|
$ |
23 |
|
|
Performance Marketing |
|
|
3,333 |
|
|
|
254 |
|
|
|
- |
|
|
|
|
$ |
29,249 |
|
|
$ |
34,160 |
|
|
$ |
23 |
|
|
Capital expenditure: |
|
|
|
|
|
|
|
|
|
|
|
|
|
Information Services |
|
$ |
9,804 |
|
|
$ |
3,977 |
|
|
$ |
298 |
|
|
Performance Marketing |
|
|
1,122 |
|
|
|
- |
|
|
|
- |
|
|
|
|
$ |
10,926 |
|
|
$ |
3,977 |
|
|
$ |
298 |
|
F-36
|
(1) |
As IDI Holdings, the accounting acquirer of the merger consummated effective as of March 21, 2015, was incorporated on September 22, 2014, the financial data for the corresponding period in 2014 were from September 22, 2014, the date of inception, through December 31, 2014. |
|
(In thousands) |
|
December 31, 2016 |
|
|
December 31, 2015 |
|
||
|
Assets: |
|
|
|
|
|
|
|
|
|
Information Services |
|
$ |
113,974 |
|
|
$ |
102,582 |
|
|
Performance Marketing |
|
|
197,937 |
|
|
|
186,610 |
|
|
|
|
$ |
311,911 |
|
|
$ |
289,192 |
|
|
Intangible assets, net: |
|
|
|
|
|
|
|
|
|
Information Services |
|
$ |
52,424 |
|
|
$ |
42,951 |
|
|
Performance Marketing |
|
|
46,107 |
|
|
|
44,494 |
|
|
|
|
$ |
98,531 |
|
|
$ |
87,445 |
|
|
Goodwill: |
|
|
|
|
|
|
|
|
|
Information Services |
|
$ |
44,178 |
|
|
$ |
42,623 |
|
|
Performance Marketing |
|
|
122,078 |
|
|
|
119,130 |
|
|
|
|
$ |
166,256 |
|
|
$ |
161,753 |
|
A reconciliation of loss from operations from segments to loss from continuing operations before income taxes for the periods presented is as follows:
|
|
|
Year Ended December 31, |
|
|||||||||
|
(In thousands) |
|
2016 |
|
|
2015 |
|
|
2014 |
|
|||
|
Loss from operations from segments |
|
$ |
(34,038 |
) |
|
$ |
(44,400 |
) |
|
$ |
(777 |
) |
|
Total other expense (1) |
|
|
(9,090 |
) |
|
|
(14,768 |
) |
|
|
- |
|
|
Loss from continuing operations before income taxes |
|
$ |
(43,128 |
) |
|
$ |
(59,168 |
) |
|
$ |
(777 |
) |
|
(1) |
Other expense, mainly represents non-operating income and expense, including interest expense, net, contingent earn out costs, and other expenses, net, which the Company does not allocate into segments. |
Revenue by geography is based on the location of the customers. The following table sets forth revenue by geographic areas:
|
|
|
Year Ended December 31, |
|
|||||||||
|
(In thousands) |
|
2016 |
|
|
2015 |
|
|
2014 |
|
|||
|
Revenue: |
|
|
|
|
|
|
|
|
|
|
|
|
|
United States |
|
$ |
167,568 |
|
|
$ |
12,816 |
|
|
$ |
817 |
|
|
Rest of the world(1) |
|
|
19,268 |
|
|
|
1,275 |
|
|
|
- |
|
|
|
|
$ |
186,836 |
|
|
$ |
14,091 |
|
|
$ |
817 |
|
|
(1) |
No individual country, other than disclosed above, exceeded 10% of our total consolidated revenue for any period presented. |
17. Related party transactions
For the years ended December 31, 2016, 2015 and 2014, material related party transactions were as follows:
Interest in the TBO Merger
Before the TBO Merger, but after giving effect to the Reverse Split, Frost Gamma, an affiliate of Phillip Frost, M.D., owned 2,144,275 shares of the Company, representing 29.4% of the Company’s outstanding ordinary shares. In addition, at the Effective Time of the TBO Merger, after giving effect to a TBO recapitalization, Frost Gamma owned 80,000 shares of TBO Common Stock, 640,000 shares of TBO Series C Preferred Stock, and 4,000 shares of TBO Series D Preferred Stock, which resulted in the Company issuing to Frost Gamma 2,660,309 shares of Company Common Stock at closing, and an additional 900,108 shares of Company Common Share subject to an earn out. As a result, following the TBO Merger, Frost Gamma owned 34.6% of Company Common Share at closing and 38.6% of Company Common Share assuming the Common Earn Out Shares are earned. In connection with approving the TBO Merger and the related transactions, the Board of Directors of the Company and its Audit Committee reviewed and considered Frost Gamma’s interest in such transactions.
F-37
On March 11, 2016, the Company issued 900,108 Common Earn-out Shares to Frost Gamma, and 1,800,220 Series A Earn-out Shares to certain investors (which were subsequently converted to 1,800,220 shares of common stock), including 567,069 shares to Grander Holdings, Inc. 401K, an entity owned by Michael Brauser, the Executive Chairman of the Board of Directors, upon a determination by the Board of Directors that certain financial targets had been achieved as set forth in the TBO Merger Agreement.
Phillip Frost, M.D
As mentioned in Note 15 above, on December 8, 2015, Phillip Frost, M.D., was appointed as a director of the Company to fill the Board seat vacated by Daniel Brauser, and was named Executive Vice Chairman of the Board. At the time of his joining the Board of Directors as Executive Vice Chairman, Frost Gamma, received a grant of 3,000,000 RSUs, which was subsequently approved at the Company’s annual meeting of stockholders on June 3, 2016.
Financing
On November 16, 2015, approximately $7.0 million of gross proceeds was raised pursuant to a Securities Purchase Agreement (the “FGIT Securities Purchase Agreement”) between the Company and Frost Gamma. Frost Gamma received (i) 20,990 shares of Series B Preferred and (ii) warrants to purchase up to 524,750 shares of the Company’s common share, with an exercise price of $6.67 per share.
On November 16, 2015, the Company entered into the Stock Purchase Agreement with Frost Gamma providing for the sale of 119,940 shares of Series B Preferred to Frost Gamma, in exchange for $40.0 million (the “FGIT Stock Purchase Agreement”). Each share of Series B Preferred will automatically convert into 50 shares of Common Stock, on the Conversion Date. The sale was completed in connection with the Fluent Acquisition on December 8, 2015.
On December 8, 2015, the Company entered into and consummated Promissory Notes with certain investors, for an aggregate financing of $10.0 million, pursuant to which the Company received $5.0 million from Frost Gamma, $4.0 million from Michael Brauser, and $1.0 million from another investor. As of December 31, 2016 and 2015, the principal, plus accrued PIK interest, of such Promissory Notes, owing to Frost Gamma, Michael Brauser and such other investor, were $5,566 and $5,033, $4,453 and $4,027, and $1,113 and $1,007, respectively. Refer to details discussed in Note 11 – Long-term debt, net.
Business Consulting Agreement
On October 13, 2014, IDI Holdings entered into a business consulting services agreement with Marlin Capital for a term of four years (the “Marlin Consulting Agreement”). Under the Marlin Consulting Agreement, Marlin Capital serves in the capacity of a strategic advisor to TBO and provides services such as recommendations on organizational structure, capital structure, future financing needs, and business strategy. The Marlin Consulting Agreement provided for equity compensation issued to Marlin Capital in the amount of 2,000,000 RSUs of TBO. The Company assumed these RSUs in the TBO Merger and the RSUs represent the right to receive 2,000,000 shares of the Company’s common stock. The RSUs vest on four equal annual installments beginning October 13, 2015 only if certain performance goals of the Company are met. The shares underlying such RSUs will not be delivered until October 13, 2018, unless there is a change of control of the Company.
The Company recognized share-based compensation expenses of $1,252, $1,512 and $0 for the years ended December 31, 2016, 2015 and 2014, respectively.
Conversion of Series B Preferred
On February 22, 2016, the Company’s Series B Preferred, 450,962 shares in total, including 141,430 shares previously issued to Frost Gamma in relation to certain financial arrangements, and 156,544 and 105,704 shares previously issued to Ryan Schulke, Chief Executive Officer of Fluent, and Matthew Conlin, President of Fluent, respectively, in connection with the Fluent Acquisition, automatically converted into the Company’s common stock, by multiplying each such share of Series B Preferred by 50.
Warrant Exchange
As discussed in Note 8, during the year ended December 31, 2016, the Company issued an aggregate of 1,069,728 shares of Exchange Shares and New Exchange Warrants to purchase up to 320,102 shares of common stock, in exchange for warrants previously issued to
F-38
certain stockholders of the Company, including 524,750 shares to Frost Gamma. No additional consideration was paid by the shareholders and the warrants were cancelled upon the exchange.
Others
Effective on August 1, 2015, IDI entered into a consulting agreement with DAB Management Group Inc. (“DAB”) for DAB to provide consulting services related to business development, future acquisitions and strategic transactions for a term of six months, and shall automatically renew for additional six-month periods, unless either party provides written notice to the other of its intent not to renew not fewer than 30 days prior to the expiration of the then current term (the “DAB Agreement”). DAB is owned by Daniel Brauser, a director of the Company at the time the DAB Agreement was entered into and the son of Michael Brauser, Executive Chairman of the Company. Under the DAB Agreement, the consulting service fee is $20 per month. The Company recognized consulting service fee of $240 and $100 for the years ended December 31, 2016 and 2015, respectively.
In October 2015, the Company entered into a Non-Exclusive Aircraft Dry Lease Agreement with Brauser Aviation, LLC, an affiliated entity of our Executive Chairman, to pay a set hourly rate for Company-related usage of the aircraft. The Company recognized aircraft lease fee of $216 and $94 for the years ended December 31, 2016 and 2015, respectively.
18. Commitments and contingencies
(a) Operating lease commitments
The Company recorded rental expenses of $1,378, $365 and $11 for the years ended December 31, 2016, 2015 and 2014, respectively. As of December 31, 2016, future minimum rental payments under non-cancellable operating leases having initial or remaining lease terms of more than one year are as follows:
|
(In thousands) |
|
|
|
|
|
Year |
|
December 31, 2016 |
|
|
|
2017 |
|
$ |
857 |
|
|
2018 |
|
|
431 |
|
|
2019 |
|
|
415 |
|
|
2020 |
|
|
427 |
|
|
2021 |
|
|
440 |
|
|
2022 and thereafter |
|
|
1,163 |
|
|
Total |
|
$ |
3,733 |
|
(b) Capital commitment
The Company incurred data costs of $3,200, $924 and $0 for the years ended December 31, 2016, 2015 and 2014, respectively, under certain non-cancellable data licensing agreements. As of December 31, 2016, material capital commitments under non-cancellable data licensing agreements of our Information Service segment were $16,728, shown as follows:
|
(In thousands) |
|
|
|
|
|
Year |
|
December 31, 2016 |
|
|
|
2017 |
|
$ |
4,155 |
|
|
2018 |
|
|
4,298 |
|
|
2019 |
|
|
4,105 |
|
|
2020 |
|
|
3,270 |
|
|
2021 |
|
|
900 |
|
|
Total |
|
$ |
16,728 |
|
(c) Employment agreements
We have employment agreements with certain executives, mainly including our Executive Chairman, Chief Executive Officer, and Chief Financial Officer, etc., which provide for compensation and certain other benefits and for severance payments under certain circumstances.
F-39
Other than as described below, the Company is not currently a party to any legal proceeding, investigation or claim which, in the opinion of the management, is likely to have a material adverse effect on the business, financial condition, results of operations or cash flows. Legal fees associated with such legal proceedings, are expensed as incurred. For capitalized Purchased IP litigation costs, as discussed in Note 8, the Company has written off the balance into the operating expenses as write-off of intangible assets during the year ended December 31, 2016. We review legal proceedings and claims on an ongoing basis and follow appropriate accounting guidance, including ASC 450, when making accrual and disclosure decisions. We establish accruals for those contingencies where the incurrence of a loss is probable and can be reasonably estimated, and we disclose the amount accrued and the amount of a reasonably possible loss in excess of the amount accrued, if such disclosure is necessary for our financial statements to not be misleading. To estimate whether a loss contingency should be accrued by a charge to income, we evaluate, among other factors, the degree of probability of an unfavorable outcome and the ability to make a reasonable estimate of the amount of the loss. We do not record liabilities when the likelihood that the liability has been incurred is probable, but the amount cannot be reasonably estimated. Based upon present information, we determined that there were no matters that required an accrual as of the balance sheet date, December 31, 2016. The Company estimates that adverse rulings in pending litigation matters could result in a possible loss of between $3,000 and $6,000.
On October 27, 2014, TRADS filed a Complaint for Declaratory Judgment against Interactive Data, among other parties, in the U.S. Bankruptcy Court, Southern District of Florida (the “Court”), regarding a dispute over ownership of certain intellectual property to which both TRADS and Company subsidiary TBO have asserted competing ownership claims. TBO asserted that it purchased this intellectual property from Ole Poulsen (“Poulsen”), the Company’s Chief Science Officer (“Purchased IP”). TRADS has since dropped Interactive Data as a party, and added TBO and Ole Poulsen. On June 10, 2015, over TRADS’ objections, the Court granted TBO’s motion to expand the scope of discovery to include, among other things, whether TRADS is a good faith purchaser of any of the Purchased IP, free of any fraud or misconduct by or on behalf of TRADS, and whether there was a fraud on the Court by TRADS. On February 22, 2016, TBO and Mr. Poulsen filed a motion for summary judgment seeking judgment in their favor on all claims based upon, among other things, TRADS having committed a fraud on the Court. On April 20, 2016, the Court denied the motion for summary judgment. Trial took place on May 16 and 17, 2016 and June 15, 22-24 and 27, 2016. The parties submitted post-trial memoranda to the Court on July 12, 2016.
On August 18, 2016, the Court entered a trial order (“Trial Order”) and final judgment (the “Final Judgment”) in favor of TRADS finding the Purchased IP is owned by TRADS, and ordering the Company, TBO and Poulsen to turn over all copies of the Purchased IP in their possession. The Court also ordered the Company and TBO to pay TRADS’ attorneys’ fees and costs, in an amount to be determined at a later time by the Court.
On October 7, 2016, TRADS filed a motion seeking its attorneys’ fees and costs. A preliminary hearing was initially set on this motion for October 18, 2016, and then continued until November 15, 2016. On November 15, 2016, the bankruptcy court again continued the motion to December 20, 2016 and again continued to February 15, 2017, and again continued to April 4, 2017. TBO intends to file an opposition to the attorneys’ fee motion and/or the bill of costs.
The Company, TBO and Poulsen have appealed the Court’s ruling to the United States District Court, Southern District of Florida (“Federal District Court”), and on October 11, 2016, filed a motion for stay of the Final Judgment pending appeal in the Federal District Court. By stipulation of the parties, TRADS agreed not to enforce the turnover of the Purchased IP until at least October 27, 2016, while the stay motion was briefed. On October 25, 2016, the Company, TBO and Poulsen filed an emergency motion for an interim stay of the Final Judgment until the stay motion filed October 11, 2016 could be resolved. The Federal District Court granted the interim stay and on November 8, 2016 held a hearing on whether to keep the stay in effect while the appeal is pending. On December 14, 2016, the Federal District Court denied TBO and Poulsen’s motion for stay of the final judgment pending appeal, however, the judge stayed the effectiveness of that order for seven days to allow TBO to appeal the stay ruling to the Eleventh Circuit Court of Appeals. The order further provided that the effectiveness of the order would be further delayed until the Eleventh Circuit Court of Appeals ruled on a request for stay. In December 2016, the Company, TBO and Poulsen filed notices of appeal to the Eleventh Circuit Court of Appeals seeking review of the District Court’s orders denying their motions for stay pending appeal. TRADS moved to dismiss the appeal of the stay ruling to the Eleventh Circuit for lack of jurisdiction. On February 28, 2017, the Eleventh Circuit ruled that while it did not have jurisdiction over the appeals, before the district court finally adjudicated the appeals, it had inherent power to consider the stay motions. The Eleventh Circuit denied the stay motions but ruled that the Company “has established that it has strong likelihood of succeeding in its argument that the judgment incorrectly identifies it as The Best One, Inc.’s legal successor entity…” TBO and Poulsen have complied with the orders, with Poulsen turning over the Purchased IP to TRADS. The Eleventh Circuit returned the case to the District Court until completion of the appeal before that court.
As a result of the Trial Order and Final Judgment, as of September 30, 2016, the Company has written off $4,055 of intangible assets for both the Purchased IP and capitalized legal costs incurred and paid in defending the claims. An adverse ruling on the award of
F-40
attorneys’ fees and costs could have an immediate near-term impact on the Company’s financial position, results of operations, and liquidity. As of the date hereof, this case is ongoing.
On October 23, 2014, TRADS filed a Complaint and Motion for Temporary Injunction, in the Fifteenth Judicial Circuit Court in and for Palm Beach County, Florida, against James Reilly, then President and Chief Operating Officer of the Company, seeking relief for alleged violation of a noncompetition agreement. On February 5, 2015, after the presentation of TRADS’ case, the court denied TRADS’ motion for a temporary injunction to prohibit Mr. Reilly from continuing employment with TBO. TRADS appealed that order, and on December 2, 2015, the Fourth District Court of Appeal reversed the order denying the temporary injunction and remanded for Mr. Reilly to present his case opposing the preliminary injunction. The evidentiary hearing on TRADS’ motion took place on May 4 and 5, 2016. On July 1, 2016, a temporary injunction was entered against Mr. Reilly. On July 15, 2016, Mr. Reilly filed a notice of appeal, appealing the trial court’s injunction order to the Fourth District Court of Appeal. On October 3, 2016, Mr. Reilly filed an answer, affirmative defenses, and counterclaim asserting claims against TRADS for fraudulent and negligent misrepresentation. TRADS responded to the counterclaim on November 16, 2016 by filing a motion to dismiss. On October 5, 2016, the Fourth District Court of Appeal affirmed the trial court’s injunction order. On February 17, 2017, the court heard TRADS’ motion to dismiss, granted the motion without prejudice, and gave leave to Mr. Reilly to amend his answer, affirmative defenses, and counterclaim alleging TRADS’ fraudulent and negligent misrepresentation. On February 28, 2017, Mr. Reilly filed a motion to amend the temporary injunction. That motion was heard by the court on March 9, 2017. The court has not yet ruled on that motion. Mr. Reilly filed his amended answer, affirmative defenses and counterclaim on March 6, 2017. TRADS’ response to the counterclaim is due on March 21, 2017. An adverse ruling could have an immediate near-term impact on the Company’s financial position, results of operations, and liquidity. As of the date of this report, this case is ongoing.
On July 28, 2015, TRADS filed a Complaint and Motion for Preliminary Injunction in the United States District Court, Southern District of Florida, against Surya Challa, former Vice President of Technology of TBO, seeking relief for an alleged violation of a noncompetition agreement. The hearing on TRADS’ Motion for Preliminary Injunction was held on February 19, 2016. On March 23, 2016, the court denied TRADS’ motion for preliminary injunction. On April 22, 2016, TRADS filed a notice of appeal seeking review of the trial court’s order denying the motion for preliminary injunction. On September 23, 2016, the district court judge entered an order staying the case pending appeal. On December 16, 2016, Challa filed a motion to dismiss the appeal as moot because he is no longer employed by the Company. On January 12, 2017, the Eleventh Circuit Court of Appeals issued an opinion affirming the district court’s order denying TRADS’ motion for preliminary injunction. The Eleventh Circuit also denied Challa’s motion to dismiss the appeal as moot. Trial is scheduled during the two-week period commencing May 15, 2017. As of the date of this report, this case is ongoing. An adverse ruling could have an immediate near-term impact on the Company’s financial position, results of operations, and liquidity.
On August 10, 2016, the Company filed a lawsuit against TransUnion and related parties alleging tortious interference with its prospective business relationship with Datamyx, LLC (“Datamyx”). The complaint was amended on October 18, 2016. The Company alleges that it was in negotiations to acquire Datamyx, and a definitive transaction was imminent, when TransUnion interfered with the proposed Datamyx acquisition solely as an act of malice in order to damage the Company. As a result of the interference, Datamyx abruptly terminated negotiations with the Company and was ultimately acquired by another suitor. As of the date hereof, this case is ongoing.
The Company has been made aware of a lawsuit filed by TRADS against the Company alleging trademark infringement. The Company has not been served with such lawsuit.
In addition to the foregoing, we may be involved in litigation from time to time in the ordinary course of business. We do not believe that the ultimate resolution of any such matters will have a material adverse effect on our business, financial condition, results of operations or cash flows. However, the results of such matters cannot be predicted with certainty and we cannot assure you that the ultimate resolution of any legal or administrative proceeding or dispute will not have a material adverse effect on our business, financial condition, results of operations and cash flows.
F-41
19. Quarterly financial data (unaudited)
The quarterly financial data (unaudited) for the years ended December 31, 2016 and 2015 consist of the following:
|
|
|
Three Months Ended |
|
|||||||||||||
|
(In thousands, except share data) |
|
December 31, 2016 |
|
|
September 30, 2016 |
|
|
June 30, 2016 |
|
|
March 31, 2016 |
|
||||
|
Statements of Operations: |
|
|
|
|
|
|
|
|
|
|
|
|
|
|
|
|
|
Revenue |
|
$ |
54,193 |
|
|
$ |
52,176 |
|
|
$ |
41,043 |
|
|
$ |
39,424 |
|
|
Gross profit |
|
$ |
18,104 |
|
|
$ |
12,518 |
|
|
$ |
11,486 |
|
|
$ |
10,930 |
|
|
Loss from operations |
|
$ |
(5,653 |
) |
|
$ |
(12,357 |
) |
|
$ |
(7,856 |
) |
|
$ |
(8,172 |
) |
|
Net loss from continuing operations |
|
$ |
(5,386 |
) |
|
$ |
(9,744 |
) |
|
$ |
(7,184 |
) |
|
$ |
(6,772 |
) |
|
Net loss attributable to cogint |
|
$ |
(5,386 |
) |
|
$ |
(9,744 |
) |
|
$ |
(7,184 |
) |
|
$ |
(6,772 |
) |
|
Basic and diluted loss per share (1) |
|
|
|
|
|
|
|
|
|
|
|
|
|
|
|
|
|
Continuing operations |
|
$ |
(0.10 |
) |
|
$ |
(0.19 |
) |
|
$ |
(0.15 |
) |
|
$ |
(0.25 |
) |
|
|
|
|
|
|
|
|
|
|
|
|
|
|
|
|
|
|
|
|
|
Three Months Ended |
|
|||||||||||||
|
(In thousands, except share data) |
|
December 31, 2015 |
|
|
September 30, 2015 |
|
|
June 30, 2015 |
|
|
March 31, 2015 |
|
||||
|
Statements of Operations: |
|
|
|
|
|
|
|
|
|
|
|
|
|
|
|
|
|
Revenue |
|
$ |
10,837 |
|
|
$ |
1,002 |
|
|
$ |
994 |
|
|
$ |
1,258 |
|
|
Gross profit |
|
$ |
2,328 |
|
|
$ |
236 |
|
|
$ |
570 |
|
|
$ |
704 |
|
|
Loss from operations |
|
$ |
(34,598 |
) |
|
$ |
(4,523 |
) |
|
$ |
(3,716 |
) |
|
$ |
(1,563 |
) |
|
Net loss from continuing operations |
|
$ |
(32,639 |
) |
|
$ |
(4,402 |
) |
|
$ |
(3,981 |
) |
|
$ |
(1,563 |
) |
|
Net loss from discontinued operations attributable to cogint |
|
$ |
- |
|
|
$ |
(387 |
) |
|
$ |
(41,489 |
) |
|
$ |
(74 |
) |
|
Net loss attributable to cogint |
|
$ |
(32,639 |
) |
|
$ |
(4,789 |
) |
|
$ |
(45,470 |
) |
|
$ |
(1,637 |
) |
|
Basic and diluted loss per share (1) |
|
|
|
|
|
|
|
|
|
|
|
|
|
|
|
|
|
Continuing operations |
|
$ |
(2.09 |
) |
|
$ |
(0.29 |
) |
|
$ |
(0.29 |
) |
|
$ |
(0.21 |
) |
|
Discontinued operations |
|
|
- |
|
|
|
(0.03 |
) |
|
|
(2.99 |
) |
|
|
(0.01 |
) |
|
|
|
$ |
(2.09 |
) |
|
$ |
(0.32 |
) |
|
$ |
(3.27 |
) |
|
$ |
(0.22 |
) |
|
(1) |
The sum of quarterly loss per share amounts, may not equal amounts reported for year-to-date periods. This is due to the effects of rounding and changes in the number of weighted-average shares outstanding for each period. |
20. Subsequent events
On January 18, 2017, the Company’s management and Board of Directors approved the plan to merge and fully integrate Q Interactive’s business into Fluent (the “Integration”), with Q Interactive becoming a wholly-owned subsidiary of Fluent. We expect little or no customer or revenue attrition associated with the Integration. As a result of the cost synergies we will achieve through the Integration, we expect to realize annualized savings in our operating expenses of approximately $4,500 beginning in the second quarter of 2017. We estimate an aggregate of $850 in restructuring costs associated with the Integration, which we expect to incur in 2017. Also, we estimate an impairment loss of intangible assets of $3,600, including primarily trade names and acquired proprietary technology, acquired in the Q Interactive Acquisition, to be recognized in the first quarter of 2017.
On January 19, 2017, Fluent entered into an Amendment No. 3 to Credit Agreement ("Amendment No. 3"), amending Fluent's Term Loan facility dated as of December 8, 2015. The Amendment No. 3, among other things, provides for a new term loan in the principal amount of $15,000 ("Incremental Term Loan"), subject to the terms and conditions of the Amendment No. 3, and modifies certain other provisions set forth in the Credit Agreement, including certain financial covenants and related definitions. The entire Incremental Term Loan was received on February 1, 2017. The Incremental Term Loan and Fluent's existing $45,000 Term Loan (collectively, the "Term Loans") are guaranteed by the Company and the other direct and indirect subsidiaries of the Company, and are secured by substantially all of the assets of the Company and its direct and indirect subsidiaries, including Fluent, in each case, on an equal and ratable basis. The Term Loans accrue interest at the rate of: (a) either, at Fluent's option, LIBOR (subject to a floor of 0.50%) plus 10.5% per annum, or base rate plus 9.5% per annum, payable in cash, plus (b) 1% per annum, payable, at Fluent's option, in either cash or in-kind. Principal amortization of the Term Loans will be $688 per quarter, payable at the end of each calendar quarter, commencing on March 31, 2017. The Term Loans mature on December 8, 2020.
F-42
|
Exhibit No. |
|
Description |
|
|
|
|
|
10.39 |
|
Amendment No. 3 to Credit Agreement, dated as of January 19, 2017, by and among Cogint, Inc., Fluent, LLC, the other borrowers party thereto, Whitehorse Finance, Inc., as administrative agent, and the other lenders party thereto. |
|
|
|
|
|
21.1 |
|
Subsidiaries of Cogint, Inc. |
|
|
|
|
|
23.1 |
|
Consent of Grant Thornton LLP. |
|
|
|
|
|
23.2 |
|
Consent of RBSM LLP |
|
|
|
|
|
23.3 |
|
Consent of EisnerAmper LLP |
|
|
|
|
|
31.1 |
|
Certification of Executive Chairman filed pursuant to Exchange Act Rules 13a-14(a) and 15d-14(a) of the Securities and Exchange Act of 1934 as adopted pursuant to Section 302 of the Sarbanes-Oxley Act of 2002. |
|
|
|
|
|
31.2 |
|
Certification of Chief Financial Officer filed pursuant to Exchange Act Rules 13a-14(a) and 15d-14(a) of the Securities and Exchange Act of 1934 as adopted pursuant to Section 302 of the Sarbanes-Oxley Act of 2002. |
|
|
|
|
|
32.1 |
|
Certification by Executive Chairman pursuant to 18 U.S.C. Section 1350, as adopted pursuant to Section 906 of the Sarbanes-Oxley Act of 2002. |
|
|
|
|
|
32.2 |
|
Certification by Chief Financial Officer pursuant to 18 U.S.C. Section 1350, as adopted pursuant to Section 906 of the Sarbanes-Oxley Act of 2002. |
|
|
|
|
|
101.INS |
|
XBRL Instance Document |
|
|
|
|
|
101.SCH |
|
XBRL Taxonomy Extension Schema Document |
|
|
|
|
|
101.CAL |
|
XBRL Taxonomy Extension Calculation Linkbase Document |
|
|
|
|
|
101.DEF |
|
XBRL Taxonomy Extension Definition Linkbase Document |
|
|
|
|
|
101.LAB |
|
XBRL Taxonomy Extension Label Linkbase Document |
|
|
|
|
|
101.PRE |
|
XBRL Taxonomy Extension Presentation Linkbase Document |
|
|
|
|
|
|
|
|