Attached files
| file | filename |
|---|---|
| EX-31.2 - EX-31.2 - Mead Johnson Nutrition Co | a17-8062_1ex31d2.htm |
| EX-31.1 - EX-31.1 - Mead Johnson Nutrition Co | a17-8062_1ex31d1.htm |
UNITED STATES
SECURITIES AND EXCHANGE COMMISSION
WASHINGTON, D.C. 20549
FORM 10-K/A
(Amendment No. 1)
ANNUAL REPORT PURSUANT TO SECTION 13 OR 15(d) OF THE
SECURITIES EXCHANGE ACT OF 1934
For the fiscal year ended December 31, 2016
Commission File Number 001-34251
MEAD JOHNSON NUTRITION COMPANY
(Exact Name of Registrant as Specified in Its Charter)
|
Delaware |
|
80-0318351 |
|
(State or Other Jurisdiction of Incorporation or Organization) |
|
(IRS Employer Identification No.) |
225 North Canal Street
25th Floor
Chicago, Illinois 60606
(Address of Principal Executive Offices and Zip Code)
Registrant’s Telephone Number, Including Area Code: (312) 466-5800
Securities registered pursuant to Section 12(b) of the Act:
|
Title of each class |
|
Name of each exchange on which registered |
|
Common Stock, $0.01 Par Value |
|
New York Stock Exchange |
Securities registered pursuant to Section 12(g) of the Act: None
Indicate by check mark if the registrant is a well-known seasoned issuer, as defined in Rule 405 of the Securities Act. Yes x No o
Indicate by check mark if the registrant is not required to file reports pursuant to Section 13 or Section 15(d) of the Act. Yes o No x
Indicate by check mark whether the registrant (1) has filed all reports required to be filed by Section 13 or 15(d) of the Securities Exchange Act of 1934 during the preceding 12 months (or for such shorter period that the registrant was required to file such reports), and (2) has been subject to such filing requirements for the past 90 days. Yes x No o
Indicate by check mark whether the registrant has submitted electronically and posted on its corporate Web site, if any, every Interactive Data File required to be submitted and posted pursuant to Rule 405 of Regulation S-T during the preceding 12 months (or for such shorter period that the registrant was required to submit and post such files). Yes x No o
Indicate by check mark if disclosure of delinquent filers pursuant to Item 405 of Regulation S-K is not contained herein, and will not be contained, to the best of the registrant’s knowledge, in definitive proxy or information statements incorporated by reference in Part III of this Form 10-K or any amendment to this Form 10-K. x
Indicate by check mark whether the registrant is a large accelerated filer, an accelerated filer, a non-accelerated filer or a smaller reporting company. See the definitions of “large accelerated filer,” “accelerated filer” and “smaller reporting company” in Rule 12b-2 of the Exchange Act.
|
Large accelerated filer x |
Accelerated filer o |
Non-accelerated filer o |
Smaller reporting company o |
Indicate by check mark if the registrant is a shell company (as defined in Rule 12b-2 of the Exchange Act). Yes o No x
The aggregate market value of the shares of common stock held by non-affiliates of the registrant, computed by reference to the closing price as reported on the New York Stock Exchange, as of June 30, 2016, the last business day of the registrant’s most recently completed second fiscal quarter, was approximately $16.7 billion.
As of March 6, 2017, there were 183,565,047 shares of common stock outstanding.
Explanatory Note
This Amendment No. 1 on Form 10-K/A (the “Amendment”) amends the Annual Report on Form 10-K of Mead Johnson Nutrition Company, a Delaware corporation (“the Company,” “MJN,” “Mead Johnson,” “we” or “us”), for the fiscal year ended December 31, 2016, originally filed with the Securities and Exchange Commission (“SEC”) on February 27, 2017 (the “Original Filing”). This Amendment is being filed to amend Part III of the Original Filing to include the information required by and not included in Part III of the Original Filing because the Company no longer intends to file a definitive proxy statement for an annual meeting of shareholders within 120 days of the end of its fiscal year ended December 31, 2016. Part IV of the Original Filing is being amended solely to add as exhibits certain new certifications in accordance with Rule 13a-14(a) promulgated by the SEC under the Securities Exchange Act of 1934, as amended (the “Exchange Act”). Because no financial statements have been included in this Amendment and this Amendment does not contain or amend any disclosure with respect to Items 307 and 308 of Regulation S-K, paragraphs 3, 4 and 5 of the certifications have been omitted.
Except as described above, no other changes have been made to the Original Filing. The Original Filing continues to speak as of the date of the Original Filing, and the Company has not updated the disclosures contained therein to reflect any events which occurred at a date subsequent to the filing of the Original Filing other than as expressly indicated in this Amendment. Accordingly, this Amendment should be read in conjunction with the Original Filing and the Company’s other filings made with the SEC on or subsequent to February 27, 2017.
MEAD JOHNSON NUTRITION COMPANY
|
|
|
| |
|
|
|
|
|
|
|
| ||
|
|
|
|
|
|
|
| ||
|
|
|
|
|
|
SECURITY OWNERSHIP OF CERTAIN BENEFICIAL OWNERS AND MANAGEMENT AND RELATED STOCKHOLDER MATTERS |
|
| |
|
|
|
|
|
|
CERTAIN RELATIONSHIPS AND RELATED TRANSACTIONS, AND DIRECTOR INDEPENDENCE |
|
| |
|
|
|
|
|
|
|
| ||
|
|
|
|
|
|
|
|
| |
|
|
|
|
|
|
|
|
Item 10. DIRECTORS, EXECUTIVE OFFICERS AND CORPORATE GOVERNANCE.
Board of Directors
Our business and affairs are managed under the direction of our Board. Among other oversight responsibilities, our Board reviews and evaluates the Company’s strategic plans and monitors performance toward our strategic objectives. Our Board consists of the 13 members listed below.
Our Board is composed of a diverse group of leaders in their respective fields, most of whom have leadership experience at major companies with global operations, as well as experience on other companies’ boards, which provides an understanding of different business processes, challenges and strategies. Others have experience as members of significant academic and research institutions, which brings unique perspectives to the Board. The Company’s directors also have other experience that makes them valuable members, such as nutrition science, pediatric medicine, finance, compliance, marketing, social responsibility and consumer products experience that provides insight into issues faced by the Company.
The Nominating and Corporate Governance Committee and the Board believe that the above-mentioned attributes, along with the leadership skills and other experiences of its Board members described below, provide us with the perspectives and judgment necessary to guide our strategies and monitor their execution.
Set forth below is biographical information concerning our directors as of March 6, 2017.
|
|
|
Dr. Altschuler is the president and chief executive officer of the University of Miami Health System and has served in this position since January 2016. He was the former chief executive officer of The Children’s Hospital of Philadelphia, a position he held from April 2000 through his retirement in June 2015. Dr. Altschuler serves as a director of Weight Watchers International, Inc., where he is a member of the audit and compensation committees, and he serves as chairman of the board and a member of the nominating and corporate governance committee of Spark Therapeutics. In addition to his many years in a leadership position at a leading institution in pediatric medicine, Dr. Altschuler has clinical and research experience in pediatric medicine, as well as experience as an outside director of charitable organizations. |
|
Steven M. Altschuler, M.D. |
| |
|
Director Since 2009 |
| |
|
Committees: |
| |
|
Compensation and Management Development (Chair) |
| |
|
Age 63 |
| |
|
|
|
|
|
|
|
|
|
|
|
Mr. Bernick is currently the president of Bernick Advisory Limited, a private investment advisory company, and has served in such a role since November 2006. From November 1994 to November 2006, Mr. Bernick served as president and chief executive officer and a director of Alberto-Culver Company, a global branded consumer products and beauty supply distribution company. From August 2001 through October 2008, Mr. Bernick served as a director of the Wm. Wrigley Jr. Company, a global confectionery company, until its 2008 acquisition by Mars Inc. Mr. Bernick serves on the board of directors of The Duchossois Group, Inc. and is a member of the board of trustees of The Field Museum in Chicago. In addition to his global business experience as former president and chief executive officer of a global branded consumer products company, Mr. Bernick has outside board experience, has served in an advisory capacity to various companies and has private investment advisory experience. |
|
Howard B. Bernick |
| |
|
Director Since 2009 |
| |
|
Committees: |
| |
|
Compensation and Management Development |
| |
|
Risk Management and Compliance |
| |
|
Age 64 |
|


|
Kimberly A. Casiano Director Since 2010 Committees: Audit Nominating and Corporate Governance Age 59 |
|
Ms. Casiano is an advisor to top business leaders targeting the Hispanic market. From 1994 to 2009, Ms. Casiano was president and chief operating officer of Casiano Communications, Inc. one of the largest Hispanic publishers of magazines and periodicals in the United States. Ms. Casiano has held various management positions at that firm since she joined in 1988, including leading the sales and editorial functions for consumer publications and managing the company’s bilingual direct marketing, customer relationship management and multi-media contact center division. Prior to that, she managed her own company, Caribbean Marketing Overseas Corporation, to foster trade and investment in the Caribbean and Latin America. She has served on the board of directors of Ford Motor Company since 2003, including as a member of the audit committee, nominating and governance committee and sustainability and innovation committee, having previously served on the finance committee. Ms. Casiano also serves on the board of directors of Mutual of America and the Hispanic Scholarship Fund. In addition to her media, marketing and Hispanic market experience as a president and chief operating officer of the largest Hispanic publisher of magazines and periodicals in the United States, Ms. Casiano has global business experience managing her own company, as well as outside board experience. |
|
|
|
|
|
Anna C. Catalano Director Since 2010 Committees: Nominating and Corporate Governance Nutrition Science and Technology Age 57 |
|
Ms. Catalano has over 30 years of corporate experience, of which over 20 years were spent in the energy industry, serving in various marketing, operations and business development roles. Most recently, at BP p.l.c., she served as group vice president of marketing from 2000 to 2003, and group vice president of emerging markets from 1999 to 2000. She has held senior executive positions in Asia, Europe and the United States, including president of Amoco Orient Oil Company in China, and senior vice president of Retail Operations for Amoco in the United States. Ms. Catalano currently serves as a director and member of the nominating and corporate governance committee of Willis Towers Watson and served as a director of Willis Group Holdings until its 2016 merger with Towers Watson. She also serves as a member of the board of directors of Chemtura Corporation, where she also serves on the environmental, health and safety committee and the compensation committee; and Kraton Performance Polymers, where she also serves on the compensation committee. Ms. Catalano also serves on the National Board of Directors of the Alzheimer’s Association the board of directors of the Houston Grand Opera and as a director of the NACD Texas Tri-Cities Chapter. She is a senior fellow and advisory board member of the Kellogg Innovation Network at Northwestern University. In addition to her global business experience in marketing, Ms. Catalano has outside board and advisory experience. |
|
|
|
|
|
Celeste A. Clark, Ph.D. Director Since 2011 Committees: Audit Nutrition Science and Technology Age 63 |
|
Dr. Clark served for almost 35 years at Kellogg Company, most recently as the company’s senior vice president of global public policy and external relations, chief sustainability officer and a member of the global executive leadership team. Dr. Clark also served as president of the Kellogg Citizenship Fund, the company’s philanthropic entity, and was a company liaison worldwide between professional organizations, academic institutions, government agencies, and industry associations on nutrition, health policy and advertising practices. Dr. Clark served as a director of Diamond Foods, Inc. until its 2016 acquisition by Snyder’s-Lance, Inc. She is a director and member of the audit and nominating and corporate governance committees of AdvancePierre Foods, a member of the board of trustees and the audit and board development committees of the W.K. Kellogg Foundation, and she is a member of the board of directors and nominating and governance committee of AAA Michigan. Dr. Clark is an adjunct professor in Food Science and Nutrition at Michigan State University. She is the principal of Abraham Clark Consulting, LLC which specializes in leadership development, health policy and regulatory affairs. In addition to her global business experience, Dr. Clark has industry experience in various nutrition, consumer products, public policy, risk management, governance and philanthropic matters. |


|
James M. Cornelius Director and Chairman of the Board Since 2009 Committees: Nominating and Corporate Governance (Chair) Age 73 |
|
Mr. Cornelius, our chairman of the board, served as the non-executive chairman of the board of directors of Bristol-Myers Squibb Company (‘‘BMS’’) from May 2010 through his retirement in May 2015. Prior to serving as BMS’s non-executive chairman, Mr. Cornelius served as chairman of the board and chief executive officer of BMS since September 2006, including serving as interim chief executive officer of BMS from September 2006 to April 2007. He retired as the chief executive officer of BMS in May 2010. Mr. Cornelius is a member of the board of Arcamed, Inc., an Indianapolis-based manufacturer of custom metal products, HyGIeaCare Inc., a company specializing in gastroenterological services and solutions, PrEP Biopharm Limited, a development-stage biopharmaceutical company focused on the prevention of respiratory infections, and Cambridge Medical Technologies, Ltd. He also serves on the board of YourEncore, an Indianapolis-based company providing a network of retired and veteran scientists and engineers assisting clients with proven experience to help accelerate the pace of their innovation. Among other qualifications, Mr. Cornelius has significant global business leadership experience, both as an executive officer and a director of public companies. |
|
| ||
|
| ||
|
| ||
|
| ||
|
| ||
|
|
|
|
|
|
|
|
|
Stephen W. Golsby Director Since 2009 Committees: Compensation and Management Development Nutrition Science and Technology Age 62 |
|
Mr. Golsby served, from September 2008 until his retirement in April 2013, as our president and chief executive officer. Prior to serving as president and chief executive officer, he was employed continuously by Mead Johnson in various capacities since October 1997. From January 2004 to September 2008, Mr. Golsby served as president of Mead Johnson. He served as president, International of Mead Johnson from 2001 until 2003 and senior vice president, Asia Pacific from 1998 to 2000. Mr. Golsby served as a director of Beam Inc. until its 2014 acquisition by Suntory Holdings Limited. Mr. Golsby is a director of RMA Group (Hong Kong) and Tesco PLC. He serves as an advisor to Thai Union Group and to the Thailand Ministry of Science and Technology. In addition to his global business experience as the former president and chief executive officer of the Company and, previously, in various senior positions at Unilever, Mr. Golsby’s extensive knowledge of and insight into the Company provides unique value to the Board. |
|
| ||
|
| ||
|
| ||
|
| ||
|
| ||
|
| ||
|
|
|
|
|
|
|
|
|
Michael Grobstein Director Since 2014 Committees: Risk Management and Compliance (Chair) Age 74 |
|
Mr. Grobstein is a retired vice chairman of Ernst & Young LLP, an independent registered public accounting firm. Mr. Grobstein worked with Ernst & Young from 1964 to 1998, and was admitted as a partner in 1975. He served as a vice chairman-international operations from 1993 to 1998, as vice chairman-planning, marketing and industry services from 1987 to 1993, and vice chairman-accounting and auditing services from 1984 to 1987. He currently serves on the board of directors of BMS, where he is a member of the audit committee and serves as the chair of the compensation and management development committee. He serves on the board of trustees and executive committee and is the treasurer of the Central Park Conservancy, and he is a director of the Peer Health Exchange, Inc. Mr. Grobstein has extensive knowledge and background relating to accounting and financial reporting rules and regulations as well as the evaluation of financial results, internal controls and business processes. Mr. Grobstein has significant depth and breadth of financial expertise, experience handling complex financial issues and experience serving on major international boards of directors. |
|
| ||
|
| ||
|
| ||
|
| ||
|
| ||
|
|
|
|
|
Peter Kasper Jakobsen President and Chief Executive Officer Director Since 2012 Committees: None Age 54 |
|
Mr. Jakobsen has been our President and Chief Executive Officer since April 2013, prior to which he served as the Company’s executive vice president and chief operating officer since January 2012. Mr. Jakobsen previously had been our president, Americas from January 2009 through December 2011 and has been employed continuously by Mead Johnson since March 1998 in various capacities. From October 2006 to January 2009, he served as senior vice president, Asia Pacific. From February 2004 to October 2006, Mr. Jakobsen served as vice president, South Asia, and from June 2001 to June 2004, he served as general manager, Philippines. He currently serves as a director of SC Johnson. In addition to his extensive knowledge of and experience with the Company, Mr. Jakobsen serves as a critical link between management and the Board. |
|
| ||
|
| ||
|
| ||
|
| ||
|
| ||
|
|


|
Peter G. Ratcliffe Director Since 2009 Committees: Audit (Chair) Age 69 |
|
Mr. Ratcliffe served, from April 2003 until his retirement in June 2007, as chief executive officer of the P&O Princess International division of Carnival Corporation and plc, a global cruise company. From January 2000 to April 2003, he served as chief executive officer of P&O Princess Cruises plc, a global cruise company. Mr. Ratcliffe is a director of BBA Aviation plc and Casa Pacifica Centers for Children & Families. Mr. Ratcliffe is a fellow of the Institute of Chartered Accountants in England and Wales. Among other qualifications, Mr. Ratcliffe has significant global business leadership experience, both as an executive officer and a director of public companies. |
|
| ||
|
| ||
|
| ||
|
| ||
|
| ||
|
|
|
|
|
|
|
|
|
Michael A. Sherman Director Since 2015 Committees: Audit Nominating and Corporate Governance Age 50 |
|
Mr. Sherman currently serves as the Chief Executive Officer and President of Endocyte, Inc., a position he assumed in June 2016. Previously, Mr. Sherman served as Endocyte’s Chief Financial officer from 2006 to February 2017 and also as Endocyte’s Chief Operating Officer from 2014 to 2016. Prior to 2006, Mr. Sherman served in various executive roles at Guidant Corporation, including Vice President of Finance and Strategic Planning, Vice President of Finance for Europe, Middle East, Africa and Canada and Corporate Controller. Mr. Sherman serves as a director of the Children’s Museum of Indianapolis. In addition to his wide-ranging financial expertise, Mr. Sherman has both significant familiarity with health-related industries and extensive experience with global commercial (particularly sales and marketing) activities and leadership of strategic transactions. |
|
| ||
|
| ||
|
| ||
|
| ||
|
| ||
|
| ||
|
|
|
|
|
|
|
|
|
Elliott Sigal, M.D., Ph.D. Director Since 2009 Committees: Nutrition Science and Technology (Chair) Age 65 |
|
Dr. Sigal is a former executive vice president and director of Bristol-Myers Squibb. Dr. Sigal joined BMS in 1997 and had roles of increasing responsibility in both research and development. He served as chief scientific officer and president of research and development for BMS from 2004 until his retirement in 2013. Dr. Sigal served on the board of BMS from 2011 until his retirement. He currently serves as a senior advisor to the healthcare team of the venture group, New Enterprise Associates and is a consultant to various biotechnology companies. In addition, Dr. Sigal serves as a director of Spark Therapeutics where he serves as a member of the compensation, nominating and corporate governance and science and technology committees. He is a director of Adaptimmune Therapeutics plc where he serves as a member of the corporate governance and nominating committee, and serves on the board of the private non-profit foundation, the Melanoma Research Alliance. In addition to his global business experience in research and development and as a chief scientific officer, Dr. Sigal has industry and research experience in global clinical and pharmaceutical development. |
|
| ||
|
| ||
|
| ||
|
| ||
|
|
| |
|
|
|
|
|
Robert S. Singer Director Since 2009 Committees: Compensation and Management Development Risk Management and Compliance Age 65 |
|
Mr. Singer served as chief executive officer of Barilla Holding S.p.A, a major Italian food company, from January 2006 to April 2009. From May 2004 through August 2005, Mr. Singer served as president and chief operating officer of Abercrombie & Fitch Co., an American clothing retailer. Prior to joining Abercrombie, Mr. Singer served as chief financial officer of Gucci Group NV, a leading luxury goods company, from September 1995 to April 2004. Mr. Singer serves as a director of Tiffany & Co., where he also serves as the chairman of the audit committee and a member of the compensation committee. Mr. Singer also serves as a director and chairman of the audit committee of Coty Inc. and as a director and chairman of the audit committee of Jimmy Choo PLC. Mr. Singer currently serves on the board of directors of privately held Bally S.A. and Belstaff. He serves on the advisory council of John Hopkins University School of Advanced International Studies (SAIS) Bologna Center and is an advisor to CCMP Capital. Among other qualifications, Mr. Singer has significant global business leadership experience, both as an executive officer and a director of public companies. |
|
| ||
|
| ||
|
| ||
|
| ||
|
| ||
|
|


Board Meetings
During 2016, the Board held seven meetings and concluded each of its regular meetings in executive session without management present. In addition, our independent directors met separately as a group in 2016.
During 2016, all of our directors attended 75% or more of the aggregate number of meetings of the Board and Board committees on which they served. All directors are expected to attend our annual meetings of stockholders. All 13 of our directors attended the annual meeting of stockholders in May 2016.
Committees of the Board of Directors
The standing committees of the Board are the Audit Committee, the Compensation and Management Development Committee, the Nominating and Corporate Governance Committee, the Nutrition Science and Technology Committee and the Risk Management and Compliance Committee. The members of each committee are appointed by the Board and serve until their successors are elected and qualified, unless they are earlier removed or resign.
The Board has determined that all members of the Audit Committee, the Compensation and Management Development Committee and the Nominating and Corporate Governance Committee are independent within the meaning of applicable SEC rules and the listing standards of the NYSE applicable to members of each such committee. In the case of the Compensation and Management Development Committee, this determination included an assessment by the Board that no member of the committee has a relationship which is material to such director’s ability to be independent from management in connection with the duties of a compensation committee member. Each committee is governed by a written charter that is available on our website at www.meadjohnson.com under the caption “Company - Corporate Governance - Committee Charters.”
The table below indicates the current composition of each committee, the audit committee members determined by the Board to be “audit committee financial experts” and the number of meetings held by each committee in 2016:
|
Committee |
|
Committee Chair |
|
Additional |
|
Audit Committee |
|
Number of |
|
Audit Committee |
|
Peter G. Ratcliffe |
|
Kimberly A. Casiano Celeste A. Clark, Ph.D. Michael A. Sherman |
|
Peter G. Ratcliffe Michael A. Sherman |
|
12 |
|
Compensation and Management Development |
|
Steven M. Altschuler, M.D. |
|
Howard B. Bernick Stephen W. Golsby Robert S. Singer |
|
— |
|
5 |
|
Nominating and Corporate Governance |
|
James M. Cornelius |
|
Kimberly A. Casiano Anna C. Catalano Michael A. Sherman |
|
— |
|
4 |
|
Nutrition Science and Technology |
|
Elliott Sigal, M.D., Ph.D. |
|
Anna C. Catalano Celeste A. Clark, Ph.D. Stephen W. Golsby |
|
— |
|
4 |
|
Risk Management and Compliance |
|
Michael Grobstein |
|
Howard B. Bernick Robert S. Singer |
|
— |
|
5 |
Section 16(a) Beneficial Ownership Reporting Compliance
Section 16(a) of the Securities Exchange Act of 1934, as amended (the “Exchange Act”) requires our executive officers and directors and persons who own more than 10% of our common stock to file initial reports of ownership and changes in ownership with the SEC. Based solely on our review of the reports that have been filed by or on behalf of such persons in this regard and written representations from them that no other reports were required, we believe that all persons filed the reports required by Section 16(a) of the Exchange Act on a timely basis during or with respect to 2016.
Corporate Governance Guidelines
The Board has adopted Corporate Governance Guidelines that delineate its operation and that of its committees. From time to time, our Board may revise the Corporate Governance Guidelines in response to changing regulatory requirements, evolving corporate governance best practices and the concerns of our stockholders and other constituents. The Corporate Governance Guidelines are
available on our website at www.meadjohnson.com under the caption “Company - Corporate Governance - Guidelines - Corporate Governance Guidelines.” The Corporate Governance Guidelines address, among other matters, the Board’s composition and structure, the Board’s responsibilities, the Board’s retirement policy, the Board’s meeting procedures, the Board’s involvement with senior management, the Board’s role in leadership development and general committee matters.
Code of Ethics
We have established Standards of Business Conduct and Ethics (the “SBCE”), a Code of Ethics for Senior Financial Officers, and a Code of Conduct and Ethics for Directors (collectively, the “Codes”). These Codes establish the standards of ethical conduct applicable to all of our directors, officers, employees, consultants and contractors, and communicate our commitment to the highest standards of ethical behavior in all of our business activities as well as compliance with all applicable laws and regulations.
The SBCE addresses, among other things, competing fairly in the global marketplace, compliance with anti-bribery and other laws, conflicts of interest, keeping accurate records, protecting company assets, confidentiality, and corporate opportunity requirements and the process for reporting violations of the SBCE, employee misconduct, conflicts of interest or other violations of company policies and procedures. The Code of Ethics for Senior Financial Officers applies to the Company’s chief executive officer, chief financial officer, the financial and operations controllers, the treasurer, the head of internal audit and heads of major business units and others performing similar functions and supplements the SBCE. The Code of Conduct and Ethics for Directors applies to the Company’s non-employee directors.
The Codes are publicly available on our website at www.meadjohnson.com, under the caption “Company - Corporate Governance - Conduct.” The Company will furnish a copy of the Codes to any person, without charge, upon written request directed to the Corporate Secretary at our principal executive offices at 225 North Canal Street, 25th Floor, Chicago, Illinois 60606. Any amendment or waiver to the Codes with respect to our chief executive officer, chief financial officer, controller or persons performing similar functions will be disclosed as required by applicable law and will be posted promptly on our website.
Item 11. EXECUTIVE COMPENSATION.
COMPENSATION AND MANAGEMENT DEVELOPMENT COMMITTEE REPORT
The Compensation and Management Development Committee has reviewed and discussed with management the disclosures contained in the section entitled “Compensation Discussion and Analysis” set forth in this filing. Based upon this review and discussion, the Compensation and Management Development Committee recommended to the Board that the section entitled “Compensation Discussion and Analysis” be included in the Company’s Annual Report on Form 10-K for the fiscal year ended December 31, 2016.
|
|
|
Members of the Compensation and Management Development Committee, | |
|
|
|
| |
|
|
|
|
Steven M. Altschuler, Chairman Howard B. Bernick Stephen W. Golsby Robert S. Singer |
COMPENSATION DISCUSSION AND ANALYSIS
Introduction
This Compensation Discussion and Analysis (“CD&A”) describes our executive compensation program design and how our program operated in 2016 with respect to our principal executive officer, our principal financial officer and our three other most highly compensated executive officers (collectively our “Named Executive Officers”). The CD&A first describes our executive compensation philosophy and then details the process by which our Compensation and Management Development Committee (the “CMDC”) established compensation for our Named Executive Officers for 2016. We discuss performance during 2016, as well as the principal components of each Named Executive Officer’s 2016 compensation and other benefits. Finally, we describe several of our key corporate governance policies covering executive compensation. For 2016, our Named Executive Officers were:
· Peter Kasper Jakobsen - our President and Chief Executive Officer (“CEO”);
· Michel Cup - our Executive Vice President and Chief Financial Officer;
· Charles M. Urbain - our Executive Vice President and Chief Operating Officer;
· Patrick M. Sheller - our Senior Vice President, General Counsel and Secretary; and
· Ian E. Ormesher - our Senior Vice President, Global Human Resources.
Our Business Environment, Challenges and Achievements
As a global leader in pediatric nutrition, we are committed to being the world’s leading nutrition company for infants and children and to helping nourish the world’s children for the best start in life. Throughout 2016, we continued to face soft economic conditions in many of our key markets as well as continued exposure to adverse foreign currency exchange rates. These circumstances negatively impacted our results. The financial results, however, do not tell the full story of our progress.
In late 2015, the Company initiated a business productivity program referred to as “Fuel for Growth,” which is expected to deliver operating efficiencies and reduce costs. During 2016, the program delivered savings of approximately $90 million and total cost savings to date are $110 million, with approximately $180 million expected by the end of 2018. Fuel for Growth is expected to create additional investments in brand building and growth initiatives, and in the long term is expected to improve profitability.
With a portion of the Fuel for Growth savings we made select strategic investments in 2016 to reshape our product portfolio and channel mix in key markets, most notably in China.
It was in this context that the CMDC made 2016 compensation decisions balancing effective program design with rewards that offer a strong pay for performance linkage with both upside potential and downside risk. The CMDC believes that the compensation decisions are commensurate with the effort expected and the results achieved.
For 2016, compensation awarded to our executive officers strongly reflects our actual company results as follows:
· No Salary increases were delivered to Named Executive Officers.
· Short-term incentive awards were strongly tied to our operating results for the performance period and also reflect individual performance. Actual aggregate annual incentive awards delivered were paid at approximately 82% of target.
· Long-term incentive compensation consisted of restricted stock units, stock options and performance shares. Performance shares provide no actual value unless threshold target levels of performance are achieved. 2014 performance shares earned over a cumulative performance period from 2014 through 2016 represented approximately 63% of the target award value.
For more information on our Pay for Performance philosophy, see “Pay for Performance,” below.
During 2016, the CMDC chose to deliver a special long-term incentive award with the purpose of aligning executives with the long-term performance objectives of our business transformation as detailed above. In order to reinforce the underlying goal of driving stockholder value creation through improved business performance, the CMDC chose to deliver the special grant in the form of stock options.
Executive Summary
· The foundation of our executive compensation program is a philosophy that focuses on pay-for-performance, stockholder value creation and competitive pay. Our executive compensation program is highly performance oriented and is designed to establish competitive pay levels and to recognize Company and individual performance.
· Approximately 80% of total target compensation is structured in the form of variable or “at risk” compensation. As such, our executives have a significant portion of their potential compensation based primarily on the annual and long-term financial success of our Company and the creation of a sustainable return for our stockholders.
· In 2016, the Company’s performance fell short of target levels for certain of its key corporate performance goals. Consequently, the Company’s cash incentive awards were below targeted payout levels. Additionally, the portion of the Company’s performance share awards attributable to 2016 performance paid out below targeted levels.
· The fact that cash incentive awards and performance share awards were adversely impacted underscores the Company’s philosophy that a significant amount of executive compensation should remain “at risk” and directly tied to performance and the realization of stockholder value.
Executive Compensation Philosophy
We base our executive compensation philosophy on three core elements: (1) pay for performance, (2) stockholder value creation and (3) competitive pay. Each of these elements is further described below.
Pay for Performance
We structure our executive compensation program to align the interests of our executive officers with the interests of our stockholders. We believe that an executive’s compensation should be tied directly to helping us achieve our mission, execute our strategy and deliver value to our stockholders. We also believe that a significant amount of compensation should be variable and earned over the long-term. Therefore, a significant part of each executive’s pay depends on both Company performance and individual performance measured against financial and operational objectives. We believe this approach serves to focus the efforts of our executives on the attainment of sustained growth and profitability.
As Company or individual performance fluctuates above or below targeted levels, our executives’ pay will fluctuate above or below target compensation levels. This compensation strategy helps ensure that the Company remains focused on annual operating excellence while simultaneously emphasizing sustainable long-term enterprise value.
Stockholder Value Creation
Our compensation plans are designed to motivate executives to increase the value we deliver to our stockholders. While managing risk, we believe that investing for the growth and profitability of our brands and business is critical to the long-term success of our Company. As such, a substantial portion of executive compensation is delivered in the form of equity awards, the value of which parallels value delivered to our stockholders.
Competitive Pay
We believe that a competitive executive compensation program is an important tool to help attract and retain talented leaders. By providing compensation that is competitive with our peer companies, we retain the talent we need and enhance our ability to recruit new talent as we continue to build and lead our business over the long term. In addition to paying competitively versus our peers, our executive compensation program is designed to pay executives equitably relative to one another based on the work they perform, the capabilities and experience they possess and the performance they demonstrate. Our executive compensation program is also designed to promote a nondiscriminatory work environment that enables us to leverage the diversity of thought that comes with a diverse global workforce, to motivate executives to deliver high performance with integrity, and to continue to focus on good corporate governance by implementing compensation best practices and corporate policies.
Compensation Practices
Below we summarize both executive compensation practices that we have implemented to drive performance and executive compensation practices that we avoid because we do not believe they serve the long-term interests of our stockholders.
|
What We Do |
|
What We Do Not Do | ||||
|
|
|
| ||||
|
|
|
Pay for performance |
|
x |
|
Guarantee salary increases or bonus awards |
|
|
|
Cap payouts on long and short-term incentive awards |
|
x |
|
Allow hedging of Company stock by directors and executives |
|
|
|
Set stock ownership and retention guidelines for directors and executives |
|
x |
|
Enter into employment contracts except as required by local law or prevailing market practice |
|
|
|
Subject all variable pay to a compensation recovery “claw-back” policy |
|
x |
|
Reprice stock options |
|
|
|
Have double-trigger Change in Control agreements |
|
|
|
|
|
|
|
Provide limited perquisites |
|
|
|
|
2016 Stockholder Advisory Vote on Executive Compensation
The CMDC reviewed the results of the 2016 stockholder advisory vote on our executive compensation and believes that having 94.2% of the votes cast for approval of our executive compensation confirms that the actions and policy decisions reflected in last year’s proxy statement were appropriate. After considering this approval, the CMDC concluded that no additional actions should be taken beyond those that were part of the normal recurring activity described in this CD&A.
Executive Compensation Program Design
Role of the CMDC
The CMDC is responsible for reviewing the executive compensation strategy and philosophy for our organization. The CMDC reviews and approves individual compensation packages for our most senior executives. The CMDC reviewed and approved both the Named Executive Officers’ 2016 annual incentive award performance goals and payouts (as described under “Annual Incentive Awards,” below) as well as their 2016 long-term incentive award goals and payouts (as described under “Long-Term Incentive Awards,” below). In the case of compensation for individuals below our most senior executives, the CMDC delegated authority to members of management to make determinations in accordance with guidelines established by the CMDC.
Interaction between the CMDC and Our Executive Officers
Our Chief Executive Officer and Chief Financial Officer recommend to the CMDC the performance targets to be used for our annual and long-term incentive awards, subject to CMDC review and approval. In addition, the senior executive officer responsible for human resources works with the CMDC, its independent compensation consultant and senior management to: (i) provide the CMDC with the appropriate information to make its decisions; (ii) propose recommendations for CMDC consideration and action; and (iii) communicate CMDC decisions to senior management for implementation. When determining compensation for the Named Executive Officers (other than the Chief Executive Officer), the CMDC considered individual performance as assessed by the Chief Executive Officer. The performance of the Chief Executive Officer was assessed directly by the Board in executive session with no members of management present.
Role of the Independent Compensation Consultant
The CMDC retains Aon Hewitt as its independent compensation consultant, reporting directly to the CMDC. See “Compensation Governance and Oversight - Independent Compensation Consultant,” below, for a discussion of Aon Hewitt’s independence. The CMDC instructs Aon Hewitt to give it advice, independent of management, and to provide such advice for the benefit of the Company and its stockholders. In 2016, Aon Hewitt specifically assisted the CMDC by:
· Participating in the design and development of our 2016 executive compensation program;
· Providing competitive compensation benchmarking and market data analysis, identifying the public companies comprising our peer group, and recommending updates and revisions to our executive compensation and benefit plans;
· Assessing the alignment of our executive compensation program with the interests of our stockholders and our pay-for-performance philosophy; and
· Providing compensation recommendations for our Named Executive Officers.
Principal Components of Our 2016 Executive Compensation Program
There are three principal components to our executive compensation program: base salary, annual incentive awards and long-term incentive awards. The following charts show our target mix of these three compensation components for (i) our CEO and (ii) our other Named Executive Officers, on an aggregate basis:
Target Compensation Mix
|
CEO Target Compensation |
|
All Other Named Executive Officers |
|
|
|
|
We believe that our target mix supports our executive compensation philosophy by emphasizing incentive compensation to ensure that a sufficient portion of compensation remains “at risk” and tied to performance goals. Our CEO has a higher percentage of “at risk” compensation than our other named executive officers because the CMDC believes that the CEO, the individual with the greatest overall responsibility for Company performance and most direct impact on overall corporate results, should have both a larger incentive opportunity and a correlating higher percentage of total compensation “at risk.”
Establishing the 2016 Compensation Framework of Named Executive Officers
All elements of executive compensation are reviewed both separately and in the aggregate to ensure that the amount and types of compensation are appropriately competitive and that the program design encourages the creation of long-term stockholder value. For 2016, the CMDC established a target pay structure for our Named Executive Officers, taking into account competitive market data, scope of responsibility and experience. The CMDC applied judgment and discretion in setting individual pay levels within this structure for each of our Named Executive Officers, taking into account not only competitive market data but also factors such as Company, business unit and individual performance, scope of responsibility, critical needs and skill sets, unique qualifications, experience, leadership potential and succession planning. The CMDC determined individual payouts of annual cash incentive awards after considering (1) Company performance measured against annual corporate performance goals and (2) individual performance. Because the Company continued to experience a period of slower growth in 2016, the CMDC also considered the retention value of base pay and incentive awards for individual executives.
Competitive Benchmarking
We believe it is critical to pay for executives at a competitive level relative to our peer group in order to attract and retain the talent we need to deliver high performance. While competitive, size-adjusted positional benchmark data was prepared consistent with past years’ practice, this benchmark data was less meaningful in determining individual pay decisions in 2016 compared to other factors such as company, business unit and individual performance, scope of responsibility, critical needs and skills, leadership potential and succession planning. These factors are reviewed annually to ensure ongoing competitiveness of our executive compensation structure (i.e. our salary structure, our annual target bonus levels and our long-term incentive award guidelines).
Based on Aon Hewitt’s analysis and recommendation, the CMDC used the following peer group of companies for competitive benchmarking of our 2016 executive compensation program:
|
Boston Scientific Corporation |
|
Hanesbrands Inc. |
|
Mattel Inc. |
|
|
|
|
|
|
|
Campbell Soup Company |
|
Hasbro Inc. |
|
McCormick & Company, Incorporated |
|
|
|
|
|
|
|
Church & Dwight Co., Inc. |
|
Herbalife Ltd. |
|
Molson Coors Brewing Company |
|
|
|
|
|
|
|
The Clorox Company |
|
The Hershey Company |
|
Perrigo Company plc |
|
|
|
|
|
|
|
Colgate-Palmolive Company |
|
Ingredion Incorporated |
|
The Sherwin-Williams Company |
|
|
|
|
|
|
|
Edgewell Personal Care Company |
|
International Flavors & Fragrances Inc. |
|
TreeHouse Foods, Inc. |
|
|
|
|
|
|
|
The Estée Lauder Companies Inc. |
|
The J.M. Smucker Company |
|
Tupperware Brands Corporation |
|
|
|
|
|
|
|
Hain Celestial Group Inc. |
|
Kellogg Company |
|
|
We believe this peer group of 23 companies was appropriate given the nature of our industry. The companies were chosen for a variety of reasons, including: comparability in size in terms of revenue and market capitalization; global business footprint; and strategic characteristics specific to the food and beverage and consumer products industries. We also considered whether a peer group company competed directly with us for executive talent. We annually review the composition of our peer group and make changes when appropriate. As a result of the 2016 analysis, we replaced Energizer Holdings, Inc. with Edgewell Personal Care Company (following Energizer’s 2015 spin off from its former parent company, the newly named Edgewell Personal Care Company) and removed Keurig Green Mountain, Inc. (following its 2016 acquisition).
2016 Corporate Performance Goals
In establishing annual corporate performance goals, the CMDC strives to ensure that targets are sufficiently ambitious to create maximum stockholder value, while also offering an opportunity to provide meaningful payouts to our executives. In 2016, the CMDC used the following measures with relative weightings to determine the level of achievement of various awards.
|
2016 Corporate |
|
Definition |
|
Rationale/Linkage to Stockholder |
|
Weighting |
|
2016 |
|
Net Sales |
|
Company performance measured against targeted net sales in constant currency, excluding the impact of specified items** |
|
Sales growth is a key driver of value creation |
|
40% |
|
$3,918 million |
|
EBIT |
|
Company performance measured against targeted earnings before interest and taxes (EBIT), excluding the impact of specified items** |
|
The EBIT goal ensures that operating performance and cost management are given significant attention in incentive compensation (versus EPS alone) |
|
25% |
|
$989 million |
|
EPS |
|
Company performance measured against targeted diluted earnings per share, as adjusted for specified items** |
|
EPS is the broadest measure that captures key factor driving profitability: operating performance, capital structure (debt) and taxes |
|
25% |
|
$3.57 |
|
Working Capital |
|
Company performance measured against targeted working capital (inventories, trade accounts receivable, and accounts payable) expressed as a percentage of net sales in constant currency, excluding the impact of specified items** |
|
The Working Capital goal focuses the organization on all drivers of cash flow |
|
10% |
|
9.2% |
* The 2016 Corporate Performance Goals are consistent with performance measures used in previous years to ensure continued focus on top-line growth and profitability. The CMDC believes that this continuity was critical during 2016 which was anticipated to be a year of transition for the business. Further, the stability of our metrics was important to anchor and focus organizational objectives.
** As defined in our Annual Report on Form 10-K for fiscal year 2016.
Individual Performance
All of our employees, including our Named Executive Officers, participate in the Company’s performance management process. The performance management process measures individual performance over the course of the previous year against pre-set performance / achievement metrics. Individual performance factors and other achievements are taken into account by the CMDC when determining annual incentive payments and long-term incentive award levels for each Named Executive Officer.
2016 Executive Pay Decisions
Set forth below is a description of the specific pay decisions that were made in 2016 with respect to our Named Executive Officers.
Base Salaries
Base salaries for our Named Executive Officers are reviewed annually. Base salary target ranges are established using the 50th percentile of our compensation peer group as an initial point of reference. Specific salary levels are based on factors such as individual performance, unique qualifications and experience. Salary increases, if any, are based on individual performance, individual salary position relative to market data, and our overall salary increase budget in a given year. Management reviews results of surveys that forecast what other companies’ salary increase budgets will be and sets the annual salary increase budgets based upon such forecasts, along with consideration of business performance and economic conditions. In addition, salary adjustments may be granted based on significant job changes, sustained performance in a role and/or the determination that an executive’s base salary is significantly below the benchmark based on the peer group analysis.
Given the Company’s continued focus in 2016 on organizational and cost efficiency, the 2016 base salaries for our Named Executive Officers were not adjusted above prior year levels. The base salaries for the Named Executive Officers for 2016 were as follows:
|
Name |
|
December 31, 2015 |
|
2016 Percentage Increase |
|
December 31, 2016 |
| ||
|
Peter Kasper Jakobsen |
|
$ |
1,000,000 |
|
— |
|
$ |
1,000,000 |
|
|
Michel Cup |
|
$ |
700,000 |
|
— |
|
$ |
700,000 |
|
|
Charles M. Urbain |
|
$ |
600,000 |
|
— |
|
$ |
600,000 |
|
|
Patrick M. Sheller |
|
$ |
500,000 |
|
— |
|
$ |
500,000 |
|
|
Ian E. Ormesher |
|
$ |
450,000 |
|
— |
|
$ |
450,000 |
|
Annual Incentive Awards
Our annual incentive awards are cash awards designed to reward executives for achieving corporate goals, regional market goals (as applicable) and individual performance goals. Annual incentive awards are made to our executives under the Senior Executive Performance Incentive Plan (the “Executive Performance Incentive Plan”) and are targeted at the median of the compensation peer group. Each executive’s target annual incentive award is a percentage of the executive’s base salary as determined by job level and benchmarking data.
For 2016, each Named Executive Officer’s annual incentive award was subject, in part, to the 2016 Corporate Performance Goals described under “—2016 Corporate Performance Goals,” above. For Messrs. Jakobsen, Cup, Urbain, Sheller and Ormesher, attainment of the 2016 incentive awards was weighted 100% on 2016 Corporate Performance Goals.
The 2016 Corporate Performance Goals and comparative Company performance with respect to each such goal were as follows:
|
2016 Corporate Performance Goals |
|
Weighting |
|
Target |
|
Actual |
|
Achievement |
|
% Payout |
| ||
|
Net Sales |
|
40 |
% |
$ |
3,918 million |
|
$ |
3,698 million |
|
94.4 |
% |
49.2 |
% |
|
EBIT |
|
25 |
% |
$ |
989 million |
|
$ |
927 million |
|
93.7 |
% |
80.7 |
% |
|
EPS |
|
25 |
% |
$ |
3.57 |
|
$ |
3.40 |
|
95.2 |
% |
95.3 |
% |
|
Working Capital |
|
10 |
% |
9.2 |
% |
9.0 |
% |
102.2 |
% |
106.9 |
% | ||
|
Total |
|
100 |
% |
|
|
|
|
|
|
74.4 |
% | ||
These measures represent four diverse, independently assessed metrics intended to focus on multiple growth and other financial objectives. Each measure is designed to be challenging to attain. Scales are developed for each performance goal to measure performance between a threshold and maximum level permitting Named Executive Officers to earn between 0% to 200% of their annual incentive targets based on actual results achieved. Target achievement for each performance metric results in a 100% earning factor for such weighted metric, interpolated for achievement between threshold, target and maximum results. Finally, as in previous years, the CMDC applied an umbrella threshold for payout under the corporate performance goal portion of the plan relative to the weighted average performance across the four goals shown above.
Overall payout opportunity for each Named Executive Officer under the corporate performance goal portion of the plan was determined in accordance with the total payout percentage shown above. Separately, the CMDC considered a number of factors in evaluating individual performance, including specific individual achievements, execution of specific objectives under the Company’s Fuel for Growth program and the Company’s actual performance against corporate goals. The specific activities considered by the CMDC were: (1) For Mr. Jakobsen, the demonstration of strong leadership of the Company’s strategic reshape though a challenging transitional period. Mr. Jakobsen was also responsible for developing a new vision for our China and Hong Kong businesses and for driving the Company’s cost reductions program to enable significant investment in initiatives that will underpin future growth. (2) For Mr. Cup, who drove a range of standardization and analytical programs. Optimizing the Company’s Finance and IM organizations and provided strong leadership of the Company’s Fuel for Growth program and other important value creating initiatives, including treasury and share repurchase programs. (3) For Mr. Urbain, his focus and achievements on specific market turnarounds and capability building initiatives, including his commitment and relocation to South Asia. (4) For Mr. Sheller, his continued role in the execution of the Fuel for Growth program and his leadership of legal support for key Company product launch initiatives and the Company’s shareholder engagement program. (5) For Mr. Ormesher, his leadership of employee engagement and retention strategies, focus on productivity and service in his function, under the “One HR” banner and the execution of company-wide leadership development programs.
After considering these factors, the CMDC approved performance incentive awards under the plan for Messrs. Jakobsen, Cup, Urbain, Sheller and Ormesher at disclosed in the “Non-Equity Incentive Plan Compensation” column of the Summary Compensation Table below.
Long-Term Incentive Awards
Long-term incentive awards are made to our executives under our stockholder-approved Long Term Incentive Plan (the “LTIP”). Our 2016 long-term incentive awards are equity-based awards designed to tie executive interests to the interests of stockholders. The ultimate value of long-term incentive awards is determined by stock price, which provides a direct link to the creation of stockholder value. In addition, our long-term incentive award program is designed to reward individual performance, as the amount of long-term incentive awards granted can vary based on the CMDC’s assessments of individual performance and future potential. We use three long-term incentive award vehicles, each of which serves a different purpose.
· Performance share awards to reward the achievement of financial objectives which align with our global growth strategy;
· Stock option awards to reward the creation of stockholder value and growth; and
· Restricted stock unit awards to enhance the retention component of our program.
We typically make grants of long-term incentive awards in late February or early March of each year, following the release of the prior year’s financial results. We believe that consistent timing of equity award grants reflects good corporate governance that reduces the risk in selecting a grant date with a preferential stock price. For additional details regarding our policy for granting long-term incentive awards, see “Compensation Governance and Oversight - Equity Grant Practices.”
The following chart shows the 2016 target mix of the annual long-term incentive awards for each of the Named Executive Officers:
|
Target Mix of Annual Long-Term Incentive Awards* |
|
|
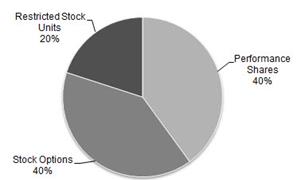
* Represents our standard equity vehicle mix excluding the 2016 supplemental grant of stock options made to our Named Executive Officers and other select individuals. The purpose of this award is described in the section titled “Supplemental Stock Option Awards,” below.
We believe that the mix of annual long-term incentive awards shown above provides an appropriate balance between linking the compensation of our executives directly to Company performance, the creation of growth in stockholder value and enhancing the retention aspect of our executive compensation program.
The target number of performance shares, stock options, and restricted stock units granted to each executive for the annual award is determined based on a review of competitive market data, a subjective assessment of individual performance and future performance expectations. These target values are reviewed and approved annually. Once the target value of the annual long-term incentive award is determined, the number of performance shares, stock options and restricted stock units is calculated based on the mix of long-term incentive awards approved by the CMDC (illustrated above) and the closing stock price on the date of grant.
Annual Performance Share Awards
In 2016, 40% of each Named Executive Officer’s and other senior executives’ annual long-term incentive awards were granted in the form of performance share awards. Each executive’s performance share award is denominated as a target number of performance shares (the “Executive’s Target Shares”) for a three-year performance cycle (a “Performance Cycle”). Each Performance Cycle is comprised of three discrete annual performance periods (each, a “Performance Period”). One-third of an Executive’s Target Shares is targeted to be earned during each Performance Period in the Performance Cycle.
Corporate financial goals applicable to a Performance Period must be achieved if the executive is to earn the portion of the Executive’s Target Shares applicable to that Performance Period. Unlike the annual incentive awards, payment of the performance shares is not subject to an individual performance component. After the completion of each Performance Period, the CMDC assesses and certifies the corporate financial performance results and calculates the number of shares to be allocated to each executive with regard to such Performance Period. At approximately the same time, the CMDC establishes new corporate financial goals for the next Performance Period in the Performance Cycle. Share amounts that are earned for a completed Performance Period are fixed for the remaining duration of the Performance Cycle but are not distributed until the end of the Performance Cycle, at which time all of the shares earned by an executive for the Performance Cycle vest and are paid out to the executive.
The financial goals and payout scale applicable to the 2016 Performance Period were set to be identical to the 2016 Corporate Performance Goals in order to underscore continued focus on top-line growth and profitability. However, any three-year Performance Cycle that includes the 2016 Performance Period (i.e. the 2014 - 2016 Performance Cycle, the 2015 - 2017 Performance Cycle and the 2016 - 2018 Performance Cycle) incorporates three distinct years of performance factors to create a unique, multi-year performance target. Because the ultimate payout applicable to any three-year Performance Cycle is determined by a composite of distinct annual Performance Periods, the CMDC believes that three-year Performance Cycles reflect long term performance results.
Performance Results Under Our Outstanding Performance Share Awards
The following table illustrates our performance share awards for each of the 2014-2016, 2015-2017 and 2016-2018 Performance Cycles. The 2014 and 2015 Performance Periods were previously completed and awards for these periods are fixed.
2014 - 2016 Performance Share Award Results
As noted above, each long-term Performance Cycle is comprised of three discrete annual Performance Periods. We believe that maintaining discrete, annual Performance Periods for our performance share awards allows us to set more ambitious objectives than would be considered for a single three-year performance period. This approach allows us to focus on attainment of specific annual objectives while maintaining alignment with long-term strategic objectives. Furthermore, our use of four different performance measures for each annual Performance Period provides a multi-dimensional view of performance, often with varying levels of achievement and resulting payouts.
As described in the chart below, achievement against the Company’s 2016 Corporate Performance Goals resulted in performance share payout at 74.4% of target for the 2016 Performance Period. The following displays the level of achievement for the 2014 - 2016 Performance Share Awards, representing a blend of each of the 2014, 2015 and 2016 performance periods.
|
2014 Performance Period |
|
2015 Performance Period |
|
2016 Performance Period |
|
|
|
|
|
|
|
See 2014 Achievement Levels Below |
|
See 2015 Achievement Levels Below |
|
See 2016 Achievement Levels Below |
|
% Payout: 113.3% |
|
% Payout: 0% |
|
% Payout: 74.4% |
2014-2016 Performance Cycle
Three-year Average % Payout: 62.6%
|
Year |
|
Corporate Performance Goals |
|
Weighting |
|
Target |
|
Actual |
|
Achievement |
|
% Payout |
| ||
|
|
|
|
|
|
|
|
|
|
|
|
|
|
| ||
|
2014 |
|
Net Sales |
|
40 |
% |
$ |
4,377 million |
|
$ |
4,489 million |
|
102.6 |
% |
126.1 |
% |
|
|
|
EBIT |
|
25 |
% |
$ |
1,033 million |
|
$ |
1,027 million |
|
99.4 |
% |
95.3 |
% |
|
|
|
EPS |
|
25 |
% |
$ |
3.60 |
|
$ |
3.65 |
|
101.4 |
% |
115.0 |
% |
|
|
|
Working Capital |
|
10 |
% |
9.0 |
% |
8.8 |
% |
102.2 |
% |
103.0 |
% | ||
|
|
|
Total |
|
100 |
% |
|
|
Weighted Average: |
|
113.3 |
% | ||||
|
|
|
|
|
|
|
|
|
|
|
|
|
|
| ||
|
2015 |
|
Net Sales |
|
40 |
% |
$ |
4,547 million |
|
$ |
4,071 million |
|
89.5 |
% |
— |
% |
|
|
|
EBIT |
|
25 |
% |
$ |
1,115 million |
|
$ |
981 million |
|
88.0 |
% |
— |
% |
|
|
|
EPS |
|
25 |
% |
$ |
3.96 |
|
$ |
3.44 |
|
86.9 |
% |
— |
% |
|
|
|
Working Capital |
|
10 |
% |
9.5 |
% |
9.2 |
% |
103.3 |
% |
110.0 |
% | ||
|
|
|
Total |
|
100 |
% |
|
|
Weighted Average: |
|
11.0 |
% | ||||
|
|
|
|
|
|
|
|
|
|
|
|
|
|
| ||
|
2016 |
|
Net Sales |
|
40 |
% |
$ |
3,918 million |
|
$ |
3,698 million |
|
94.4 |
% |
49.2 |
% |
|
|
|
EBIT |
|
25 |
% |
$ |
989 million |
|
$ |
927 million |
|
93.7 |
% |
80.7 |
% |
|
|
|
EPS |
|
25 |
% |
$ |
3.57 |
|
$ |
3.40 |
|
95.2 |
% |
95.3 |
% |
|
|
|
Working Capital |
|
10 |
% |
9.2 |
% |
9.0 |
% |
102.2 |
% |
106.9 |
% | ||
|
|
|
Total |
|
100 |
% |
|
|
Weighted Average: |
|
74.4 |
% | ||||
Annual Stock Option Awards
Stock options provide for the right of an executive to purchase shares of Company stock in the future based on a fixed price established on the date of grant. As such, we believe stock options are inherently performance-based as the option has value to the executive only in the case that the stock price increases over time. If the stock price does not increase above the grant price, the executive will realize no value from the award. More details on the practices of granting stock options can be found below under “Compensation Governance and Oversight - Equity Grant Practices.”
In 2016, 40% of each Named Executive Officer’s and other senior executives’ annual long-term incentive awards were granted in the form of stock options. The annual stock option awards granted in 2016 will vest 33.3% each year on the first, second and third anniversaries of the grant date.
Supplemental Stock Option Awards
In 2016, each of the Named Executive Officers and other select individuals received a supplemental stock option award designed to retain key talent through a time of critical transition for the business. The CMDC viewed this award as a means to align key talent with the Company’s Fuel for Growth objectives and to further encourage the creation of long-term stockholder value and growth. The CMDC chose stock options as the vehicle for this supplemental equity award because the CMDC recognized stock options as having a direct link to the creation of stockholder value. If the stock price does not increase above the grant price, no value will be realized. These awards vest 25% each year on the first, second, third and fourth anniversaries of the grant date. The supplemental stock options granted to the CEO reflects 22% of his overall 2016 equity award. The supplemental stock options granted to the other Named Executive Officers reflects approximately 27% of their overall 2016 equity awards.
Annual Restricted Stock Unit Awards
Restricted stock units generally provide for the right of an executive to receive shares of Company stock upon the attainment of continuous employment through the vesting schedule. If the executive does not meet the employment conditions specified in the award agreement, the executive will forfeit the award.
In 2016, 20% of each Named Executive Officer’s and other senior executives’ annual long-term incentive awards were granted in the form of restricted stock units. Restricted stock units are awarded not only to help support the creation of stockholder value but also to enhance the retention of our executives. Generally, annual awards granted to our Named Executive Officers vest in full on the fourth anniversary of the grant date.
The CMDC periodically grants additional “off-cycle” awards to key employees, including Named Executive Officers, in connection with recruitment, promotions, succession planning, significant accomplishments or achievements, or focused retention efforts.
Individual Compensation Arrangements
Generally, we have no employment contracts with our executives, unless required by local law or practice. We had no employment contracts for our Named Executive Officers in 2016.
Other Elements of 2016 Compensation
In addition to the components set forth above, our senior executives, including each of the Named Executive Officers, are entitled to participate in qualified and non-qualified retirement and savings plans, severance and change in control severance plans, other general employee benefits and limited perquisite opportunities.
Post-Employment Benefits
We offer certain plans that provide compensation and benefits to employees, including the Named Executive Officers, upon their retirement or if their employment is otherwise terminated. These plans are periodically reviewed by the CMDC to ensure that they are consistent with current competitive practice. The plans offered are common within our peer group and enhance our ability to attract and retain key talent.
Retirement Benefits
Qualified and Non-Qualified Retirement Plans: During 2016, certain Named Executive Officers participated in our defined benefit plans for U.S. employees, which provide income for employees following retirement. These plans were closed to new participants in 2009 and participants do not accrue additional service credits under the defined benefit formulas. The Retirement Income Plan is a tax-qualified plan, as defined under Internal Revenue Service (“IRS”) regulations, and the Benefit Equalization Plan—Retirement Plan is a non-qualified plan that provides pension benefits above those allowed under the pay limits for tax-qualified plans. The Summary Compensation Table reflects any increase in 2016 in the actuarial value of these benefits under each of these plans. Accrued benefits for participating Named Executive Officers, determined as of December 31, 2016, are provided in the Pension Benefits Table.
Qualified and Non-Qualified Savings Plans: During 2016, certain Named Executive Officers participated in our savings plans for U.S. employees, which allow employees to defer a portion of their base salary and bonus and to receive matching contributions from us to supplement their income in retirement. The Retirement Savings Plan is a tax-qualified 401(k) plan, as defined under IRS regulations, and the Benefit Equalization Plan—Savings Plan is a non-qualified deferred compensation plan that allows employees to defer a portion of their base salary and bonus and to receive matching contributions from us in excess of the contributions allowed under the Retirement Savings Plan. The savings plans are designed to allow employees to accumulate savings for retirement on a tax-advantaged basis. All of our U.S. employees are eligible to participate in the qualified plan, and employees whose pay or benefits exceeds the IRS qualified plan limits are eligible for the non-qualified plan. The Summary Compensation Table reflects our contributions to these plans during 2016. The Non-Qualified Deferred Compensation table provides more detail on the Benefits Equalization Plan—Savings Plan.
Severance Benefits
Severance Plan: The Second Amended and Restated Mead Johnson & Company, LLC Senior Executive Severance Plan (the “Executive Severance Plan”) provides the basis for establishing a competitive level of severance protection for certain senior executives to help us attract and retain key talent necessary to run our Company. Severance payments are based on the executive’s position in the Company and may be adjusted as determined by the CMDC in certain situations. Treatment of outstanding equity awards in the event of a qualifying termination are governed by the terms of the applicable equity award agreement. Both the key terms of the Executive Severance Plan and the value of severance benefits to be paid to our Named Executive Officers under the Executive Severance Plan (assuming an effective termination date of December 31, 2016) are described below under “—Potential Payments Upon Termination or Change in Control.”
Change in Control Severance Plan: The Third Amended and Restated Mead Johnson & Company, LLC Executive Change in Control Severance Plan (the “Executive Change in Control Plan”) enables management to evaluate and support potential transactions that might be beneficial to stockholders even though the result would be a change in control of our Company. The plan contains a “double-trigger,” which means that benefits are only triggered upon a covered executive’s involuntary termination of employment with us other than for cause or by the covered executive’s termination of employment for good reason, in either case during the two-year period following the date of a change in control. Severance payments are based on the executive’s position in the Company. Treatment of outstanding equity awards in the event of a qualifying termination upon a change in control are governed by the terms of the applicable equity award agreement. The Executive Change in Control Plan does not provide excise tax gross-ups. Both the key terms of the Executive Change in Control Plan and the value of severance benefits to be paid to our Named Executive Officers under the Executive Change in Control Plan (assuming an effective termination date of December 31, 2016) are described below under “—Potential Payments Upon Termination or Change in Control.”
General Employee Benefits
We maintain medical and dental insurance, accidental death insurance and disability insurance for all of our employees. The Named Executive Officers are eligible to participate in the same welfare benefit plans as our other employees and are covered by the same vacation, leave of absence and similar policies.
Limited Perquisites
We maintain an expatriate program that provides certain benefits to our employees who accept expatriate assignments. Our executive officers, including the Named Executive Officers, are entitled to the same benefits under the Company’s expatriate program as other Company employees. Under the Company’s expatriate program, such benefits include providing gross-ups on taxable foreign assignment assistance and making tax equalization payments on behalf of (or to) expatriate employees who, as a result of their expatriate assignment, incur tax liabilities in excess of what they would have incurred had they not accepted the expatriate assignment. In 2016, Mr. Urbain incurred no excess tax liabilities related to income earned during his expatriate assignment in Singapore (the “Urbain
Singapore Expatriate Assignment”). In future years, the Company may pay excess tax liabilities for Mr. Urbain under this program based on potential additional foreign tax liability on certain other income earned by Mr. Urbain during the Urbain Singapore Expatriate Assignment, as well as on income earned by Mr. Urbain during his former expatriate assignment in Thailand (the “Urbain Thailand Expatriate Assignment”). Under our expatriate program, the Company paid such excess tax liabilities, as reported for Mr. Urbain, below, in the “All Other Compensation” column of the Summary Compensation Table. The Company will, to the extent possible, claim any foreign tax credit refunds available during future years based on income earned by Mr. Urbain during the Urbain Singapore Expatriate Assignment and the Urbain Thailand Expatriate Assignment. Foreign tax credit refunds have been applied and will be applied (during future years) to offset any excess tax liabilities to the Company.
Except for the benefits provided under the Company’s expatriate program, perquisites, if any, for individual Named Executive Officers in 2016 were less than $10,000.
Tax Implications of Executive Compensation Program
It is our intention that amounts payable under the Executive Performance Incentive Plan, gains from stock option awards and long-term performance share awards will be fully deductible “performance-based” compensation under Section 162(m) of the Code. All such payments and awards are specifically approved by the 162(m) Subcommittee of the CMDC, as applicable.
However, in order to maintain a market competitive executive compensation program, we reserve the right to make awards that are not treated as “performance-based” compensation under Section 162(m) of the Code and, as such, may not be fully deductible under Section 162(m) of the Code. More specifically, compensation attributable to the vesting and settlement of restricted stock unit awards is not “performance-based” under Section 162(m) of the Code.
Compensation Governance and Oversight
Risk Considerations
The CMDC considers, in establishing and reviewing our compensation program, whether the program or any of its features could encourage unnecessary or excessive risk taking. The factors considered by the CMDC include:
· the general design philosophy of our compensation policies and practices, as such policies and practices relate to or affect risk taking by employees on our behalf, and the manner of their implementation;
· our risk assessment and incentive considerations in structuring our compensation policies and practices or in awarding and paying compensation;
· how our compensation policies and practices relate to the realization of risks resulting from the actions of employees in both the short term and the long term;
· our policies regarding adjustments to our compensation plans and practices to address changes in our risk profile; and
· whether any material adjustments need to be made to our compensation policies and practices as a result of any changes in our risk profile.
The CMDC reviews management’s assessment of the risks associated with the Company’s compensation practices and policies for employees, including a consideration of the balance between risk-taking and risk-mitigating factors. The CMDC believes that the Company has mitigated unnecessary risk considering both the design of the compensation plans and the controls placed upon them because (i) payments under all of our management compensation plans are capped, (ii) the multiple performance goals relate directly to the business plan approved by the Board and (iii) there is an appropriate balance between our annual operating achievements and longer-term value creation, with a particular emphasis on longer-term value creation. Following a review of this assessment, the CMDC determined that any risks arising from the Company’s compensation policies and practices are not reasonably likely to have a material adverse effect on the Company. This evaluation is completed annually by the CMDC.
Stock Ownership and Retention Guidelines for Executive Officers
To further promote sustained stockholder return and to ensure the Company’s executives remain focused on both short- and long-term objectives, the Company has established stock ownership and retention guidelines for our executive officers. Our guidelines require that our CEO hold shares of our common stock with a value of five times his base salary and that other senior executives,
including each of our Named Executive Officers, hold shares of our common stock with a value of three times their base salary. Until these stock ownership retention amounts are attained, the executive should not sell any shares acquired following any option exercises or vesting of stock awards (except to satisfy tax withholding requirements).
Executive officers are required to accumulate and hold the minimum number of shares to meet their respective stock ownership level within five years of assuming their position. For purposes of this requirement, “shares” include shares of our common stock that are owned by the executive officer, unvested time-based RSUs, performance shares earned for the annual performance periods of our open performance cycles, and the value of shares held in the company 401(k) savings plan. The CMDC reviews the stock ownership and retention levels of our executive officers on an annual basis, and in February 2017, determined that, all of our executive officers, including the Named Executive Officers, were found to have either satisfied these requirements or were on track to satisfy these requirements ahead of their allowed time frame.
Equity Grant Practices
The following describes our practices regarding equity grants to our employees.
Approval of Awards
Awards granted to our Chief Executive Officer, executive officers and other senior executives and employees are approved by the CMDC. The CMDC has provided a limited delegation of authority to the Chief Executive Officer and the senior executive officer responsible for human resources to make grants of equity to employees who are not executive officers at times other than the annual grant within certain limits. These grants are used primarily in the case of new hires or promotions.
Grant Effective Date—Annual Awards and All Other Awards
For regularly scheduled annual awards, the grant effective date is the date on which the CMDC meets to grant annual awards. For awards granted to current employees at any other time during the year, the grant effective date is generally the first business day of the month following the approval date, except that if the approval date falls on the first business day of a given month, the grant effective date is the approval date. For awards granted to new hires, the grant effective date is the first business day of the month following the employee’s hire date, except that if the employee’s hire date falls on the first business day of a given month, the grant effective date is the employee’s hire date. In no case whatsoever will the grant effective date precede the approval date of a given award.
Grant Price and Fair Market Value
The stock option exercise price of all stock option awards is the fair market value of our common stock as of the date of grant, which for this purpose is the closing price of our common stock on the New York Stock Exchange on the date of grant.
Clawback Provisions
We have a policy providing for the adjustment or recovery of compensation in certain circumstances. If the Board, upon recommendation by the CMDC, determines that, as a result of a restatement of our financial statements or an act of malfeasance of office, an executive has received more compensation than would have been paid absent the action(s) or the incorrect financial statements, the Board, in its discretion, shall take such action as it deems necessary or appropriate to address the events that gave rise to the restatement or improper action and to prevent its recurrence. In certain cases, such action may include, to the extent permitted by applicable law: (i) requiring partial or full reimbursement of any bonus or other incentive compensation paid to the executive, (ii) causing the partial or full cancellation of restricted stock units or deferred stock awards and outstanding stock options, (iii) adjusting the future compensation of such executive and (iv) dismissing or taking legal action against the executive, in each case as the Board, upon recommendation by the CMDC, determines to be in our best interests and that of our stockholders.
Independent Compensation Consultant
The CMDC retains Aon Hewitt as its independent compensation consultant. Aon Hewitt reports directly to the CMDC, and the CMDC directly oversees the fees paid for these services provided by Aon Hewitt.
Aon Hewitt has developed safeguards to promote the independence of its executive compensation consulting advice. These independence policies include: (i) strong confidentiality requirements, a code of conduct and a strict policy against investing in client organizations; (ii) management of multiservice client relationships by separate account executives; (iii) clearly defined engagements with compensation committees that are separate from any other services provided; (iv) formal segregation of executive compensation services into a separate business unit; (v) no incentives for cross-selling of services and no compensation rewards based on other results;
(vi) no offers of more favorable terms for companies that retain Aon Hewitt for additional services; and (vii) consulting work limited to boards, compensation committees and companies, with no representation of individual executives in any capacity.
The CMDC has determined that the work of Aon Hewitt does not raise any conflict of interest and engaged Aon Hewitt without the recommendation of management. In making this assessment, the CMDC considered, among other factors, Aon Hewitt’s provision of other services to the Company, the level of fees received by Aon Hewitt from the Company as a percentage of Aon Hewitt’s total revenues, Aon Hewitt’s policies and procedures designed to prevent conflicts of interest, and whether the individual Aon Hewitt advisers to the CMDC own any Company stock or have any business or personal relationships with members of the CMDC or our executive officers.
As Aon Hewitt is a leading, global human resources consultancy, the Company also retains Aon Hewitt both in certain ongoing roles and on an as-needed basis. In 2016, Aon Hewitt attended four meetings and received $101,287 in fees for its work done on behalf of the CMDC, $15,296 in fees for its work performed on behalf of the Nominating and Governance Committee and an additional $1,044,077 for general compensation consulting, employee benefit program and actuarial services done on behalf of the Company at the request of management. The CMDC was advised in 2016 of the work that Aon Hewitt does for the Company but did not specifically approve these other services.
COMPENSATION COMMITTEE INTERLOCKS AND INSIDER PARTICIPATION
None of our executive officers serves, or in the past year has served, as a member of the board of directors or compensation committee of any entity that has one or more executive officers who serve, or in the past year has served, on our Board or Compensation and Management Development Committee.
Summary Compensation Table - 2016, 2015 and 2014
The following table and notes present information concerning total compensation earned by each of our Named Executive Officers for service in 2016, 2015 and 2014, with the exception of (1) Mr. Cup and Mr. Sheller whose total compensation is shown for 2016 and 2015 only and (2) Mr. Ormesher whose total compensation is shown for 2016 only. Mr. Cup and Mr. Sheller were first determined to be Named Executive Officers in 2015. Mr. Ormesher was first determined to be a Named Executive Officer in 2016.
|
Name and Principal |
|
Year |
|
Salary |
|
Bonus |
|
Stock |
|
Option |
|
Non-Equity |
|
Change in |
|
All Other |
|
Total |
| |
|
Peter Kasper Jakobsen |
|
2016 |
|
1,000,000 |
|
— |
|
4,046,503 |
|
3,385,403 |
|
855,600 |
|
326,782 |
|
|
132,179 |
|
9,746,467 |
|
|
President and Chief Executive Officer |
|
2015 |
|
1,000,000 |
|
— |
|
4,145,856 |
|
1,424,873 |
|
400,000 |
|
27,534 |
|
|
197,967 |
|
7,196,230 |
|
|
|
2014 |
|
1,000,000 |
|
— |
|
3,445,523 |
|
1,291,803 |
|
1,035,000 |
|
1,403,529 |
|
193,303 |
|
8,369,158 |
| ||
|
|
|
|
|
|
|
|
|
|
|
|
|
|
|
|
|
|
|
|
|
|
|
Michel Cup Executive Vice President and Chief Financial Officer |
|
2016 |
|
700,000 |
|
|
|
1,253,075 |
|
1,212,085 |
|
442,680 |
|
— |
|
|
40,277 |
|
3,648,117 |
|
|
|
2015 |
|
239,170 |
(1) |
650,000 |
(2) |
705,955 |
|
329,374 |
|
69,417 |
|
— |
|
|
124,418 |
|
2,118,334 |
| |
|
|
|
|
|
|
|
|
|
|
|
|
|
|
|
|
|
|
|
|
|
|
|
Charles M. Urbain Executive Vice President and Chief Operating Officer |
|
2016 |
|
600,000 |
|
— |
|
1,253,075 |
|
955,490 |
|
379,440 |
|
61,648 |
|
|
140,028 |
|
3,389,681 |
|
|
|
2015 |
|
574,817 |
|
— |
|
760,145 |
|
261,238 |
|
166,299 |
|
— |
|
|
362,721 |
|
2,125,220 |
| |
|
|
2014 |
|
551,000 |
|
— |
|
758,047 |
|
284,201 |
|
480,698 |
|
776,508 |
|
|
327,825 |
|
3,178,279 |
| |
|
|
|
|
|
|
|
|
|
|
|
|
|
|
|
|
|
|
|
|
|
|
|
Patrick M. Sheller |
|
2016 |
|
500,000 |
|
— |
|
569,259 |
|
654,192 |
|
338,520 |
|
— |
|
|
57,185 |
|
2,119,156 |
|
|
Senior Vice President, General Counsel and Secretary |
|
2015 |
|
486,538 |
|
265,000 |
(3) |
877,483 |
|
358,869 |
|
125,125 |
|
— |
|
113,353 |
|
2,226,368 |
| |
|
|
|
|
|
|
|
|
|
|
|
|
|
|
|
|
|
|
|
|
| |
|
Ian E. Ormesher |
|
2016 |
|
450,000 |
|
— |
|
569,259 |
|
654,192 |
|
326,430 |
|
— |
|
49,946 |
|
2,049,827 |
| |
|
Senior Vice President, Global Human Resources |
|
|
|
|
|
|
|
|
|
|
|
|
|
|
|
|
|
|
| |
(1) Mr. Cup commenced employment with the Company as its Executive Vice President and Chief Financial Officer on September 1, 2015. The 2015 amount reported in the “Salary” column, above, represents Mr. Cup’s annual base salary prorated for the number of months he was employed with the Company in 2015.
(2) As part of his recruitment package, Mr. Cup received a transition cash payment of $650,000, which payment is subject to repayment if Mr. Cup voluntarily resigns or is terminated for cause within his first 24 months of employment.
(3) As part of his recruitment package, Mr. Sheller received a transition cash payment of $265,000 in lieu of the annual incentive opportunity forfeited when Mr. Sheller left his prior employer.
(4) The amounts shown in the Stock Awards and Option Awards columns represent the grant date fair value of stock options, restricted stock units and performance shares determined in accordance with FASB ASC Topic 718. The assumptions made in the valuation reflected in these columns are set forth in the following notes to the Company’s Consolidated Financial Statements:
|
For Stock and Option Awards |
|
Consolidated |
|
Included with |
|
Note |
|
|
2016 |
|
December 31, 2016 |
|
February 27, 2017 |
|
7 |
|
|
2015 |
|
December 31, 2015 |
|
February 17, 2016 |
|
7 |
|
|
2014 |
|
December 31, 2014 |
|
February 27, 2015 |
|
6 |
|
For performance share awards granted during 2016, the Company assumed that these awards would pay out at the targeted number of shares, and the grant date fair values set forth in the Stock Awards column for each Named Executive Officer reflects this assumption. Assuming maximum performance is achieved, the grant date value of the performance share awards would be as follows:
|
|
|
Value of Performance |
|
Value of Performance |
| ||
|
Peter Kasper Jakobsen |
|
$ |
2,676,927 |
|
$ |
5,353,854 |
|
|
Michel Cup |
|
$ |
828,955 |
|
$ |
1,657,910 |
|
|
Charles M. Urbain |
|
$ |
828,955 |
|
$ |
1,657,910 |
|
|
Patrick M. Sheller |
|
$ |
376,598 |
|
$ |
753,196 |
|
|
Ian E. Ormesher |
|
$ |
376,598 |
|
$ |
753,196 |
|
(5) These amounts were earned under the Executive Performance Incentive Plan, which is discussed in the Compensation Discussion and Analysis under “—Annual Incentive Awards.”
(6) The amounts shown in the Change in Pension Value and Nonqualified Deferred Compensation Earnings column are attributable to the aggregate change during 2016 in the actuarial present value of each Named Executive Officer’s accumulated pension benefit; the present value of the accumulated pension benefits is reported below in the “Pension Benefits” table. During 2016, the actuarial present value of accumulated pension benefit increased for Mr. Jakobsen and Mr. Urbain. Mr. Cup, Mr. Sheller and Mr. Ormesher each joined the Company after the Retirement Income Plan was closed to new participants in 2009 and therefore do not participate in this pension plan.
(7) Amounts shown in the All Other Compensation column for 2016 are comprised of the following:
|
|
|
Relocation / |
|
Group |
|
Company |
|
TOTAL |
| ||||
|
Peter Kasper Jakobsen |
|
|
|
$ |
1,848 |
|
$ |
130,331 |
|
$ |
132,179 |
| |
|
Michel Cup |
|
|
|
$ |
1,294 |
|
$ |
38,983 |
|
$ |
40,277 |
| |
|
Charles M. Urbain |
|
$ |
62,150 |
(a) |
$ |
1,109 |
|
$ |
76,769 |
|
$ |
140,028 |
|
|
Patrick M. Sheller |
|
|
|
$ |
924 |
|
$ |
56,261 |
|
$ |
57,185 |
| |
|
Ian E. Ormesher |
|
|
|
$ |
832 |
|
$ |
49,114 |
|
$ |
49,946 |
| |
(a) Includes overseas relocation and assignment expenses to Singapore including Housing & Utilities ($28,877), Cost of Living Allowance ($6,570), Destination Assistance ($2,365), Relocation Allowance ($12,000), Car - consistent with local policy ($11,088) and tax preparation services ($1,250). Amounts paid in foreign currency have been converted at a weighted average exchange rate of 1.37 Singapore dollars to 1.0 U.S. dollar.
(b) Includes Company contributions to the qualified and non-qualified savings plans.
Grants of Plan Based Awards - 2016
The following table presents information regarding the incentive awards granted to the Named Executive Officers for 2016.
|
|
|
|
|
|
|
|
|
|
|
|
|
|
|
|
|
|
|
All Other |
|
|
|
|
|
|
|
|
|
|
|
|
|
|
|
|
|
|
|
|
|
|
|
|
|
|
|
|
Stock |
|
All Other |
|
|
|
|
|
|
|
|
|
|
|
|
|
|
|
|
|
|
|
|
|
|
|
|
|
|
Awards: |
|
Option |
|
|
|
Grant |
|
|
|
|
|
|
|
|
|
|
|
|
|
|
|
|
|
|
|
|
|
|
Number |
|
Awards: |
|
|
|
Date Fair |
|
|
|
|
|
|
|
|
|
|
|
|
|
|
|
|
|
|
|
|
|
|
of |
|
Number |
|
Exercise |
|
Value of |
|
Value of |
|
|
|
|
|
|
|
|
Estimated Future Payouts Under |
|
Estimated Future Payouts |
|
Shares of |
|
of |
|
or Base |
|
Stock |
|
Performance |
| ||||||||
|
|
|
|
|
|
|
Non- |
|
Under Equity Incentive Plan |
|
Stock |
|
Securities |
|
Price of |
|
and |
|
Share Awards |
| ||||||||
|
|
|
|
|
|
|
Equity Incentive Plan Awards(1) |
|
Awards(2) |
|
or |
|
Underlying |
|
Option |
|
Option |
|
Assuming |
| ||||||||
|
|
|
Grant |
|
Award |
|
Threshold |
|
Target |
|
Maximum |
|
Threshold |
|
Target |
|
Maximum |
|
Units |
|
Options |
|
Awards |
|
Awards |
|
Maximum |
|
|
Name |
|
Date |
|
Type |
|
($) |
|
($) |
|
($) |
|
(#) |
|
(#) |
|
(#) |
|
(#) |
|
(#) |
|
$(/Sh) |
|
($)(3) |
|
Performance |
|
|
Peter Kasper Jakobsen |
|
|
|
Annual Incentive |
|
391,000 |
|
1,150,000 |
|
2,300,000 |
|
|
|
|
|
|
|
|
|
|
|
|
|
|
|
|
|
|
|
|
2/29/2016 |
|
Perf. Shares |
|
|
|
|
|
|
|
15,166 |
|
37,915 |
|
75,830 |
|
|
|
|
|
|
|
2,676,927 |
|
5,353,854 |
|
|
|
|
2/29/2016 |
|
RSUs |
|
|
|
|
|
|
|
|
|
|
|
|
|
18,568 |
|
|
|
|
|
1,369,576 |
|
|
|
|
|
|
2/29/2016 |
|
Stock Options |
(4) |
|
|
|
|
|
|
|
|
|
|
|
|
|
|
125,581 |
|
73.76 |
|
1,741,808 |
|
|
|
|
|
|
2/29/2016 |
|
Stock Options |
(5) |
|
|
|
|
|
|
|
|
|
|
|
|
|
|
118,500 |
|
73.76 |
|
1,643,595 |
|
|
|
|
|
|
|
|
|
|
|
|
|
|
|
|
|
|
|
|
|
|
|
|
|
|
|
|
|
|
|
|
|
Michel Cup |
|
|
|
Annual Incentive |
|
202,300 |
|
595,000 |
|
1,190,000 |
|
|
|
|
|
|
|
|
|
|
|
|
|
|
|
|
|
|
|
|
2/29/2016 |
|
Perf. Shares |
|
|
|
|
|
|
|
4,697 |
|
11,741 |
|
23,482 |
|
|
|
|
|
|
|
828,955 |
|
1,657,910 |
|
|
|
|
2/29/2016 |
|
RSUs |
|
|
|
|
|
|
|
|
|
|
|
|
|
5,750 |
|
|
|
|
|
424,120 |
|
|
|
|
|
|
2/29/2016 |
|
Stock Options |
(4) |
|
|
|
|
|
|
|
|
|
|
|
|
|
|
38,889 |
|
73.76 |
|
539,390 |
|
|
|
|
|
|
2/29/2016 |
|
Stock Options |
(5) |
|
|
|
|
|
|
|
|
|
|
|
|
|
|
48,500 |
|
73.76 |
|
672,695 |
|
|
|
|
|
|
|
|
|
|
|
|
|
|
|
|
|
|
|
|
|
|
|
|
|
|
|
|
|
|
|
|
|
Charles M. Urbain |
|
|
|
Annual Incentive |
|
173,400 |
|
510,000 |
|
1,020,000 |
|
|
|
|
|
|
|
|
|
|
|
|
|
|
|
|
|
|
|
|
2/29/2016 |
|
Perf. Shares |
|
|
|
|
|
|
|
4,697 |
|
11,741 |
|
23,482 |
|
|
|
|
|
|
|
828,955 |
|
1,657,910 |
|
|
|
|
2/29/2016 |
|
RSUs |
|
|
|
|
|
|
|
|
|
|
|
|
|
5,750 |
|
|
|
|
|
424,120 |
|
|
|
|
|
|
2/29/2016 |
|
Stock Options |
(4) |
|
|
|
|
|
|
|
|
|
|
|
|
|
|
38,889 |
|
73.76 |
|
539,390 |
|
|
|
|
|
|
2/29/2016 |
|
Stock Options |
(5) |
|
|
|
|
|
|
|
|
|
|
|
|
|
|
30,000 |
|
73.76 |
|
416,100 |
|
|
|
|
|
|
|
|
|
|
|
|
|
|
|
|
|
|
|
|
|
|
|
|
|
|
|
|
|
|
|
|
|
Patrick M. Sheller |
|
|
|
Annual Incentive |
|
110,500 |
|
325,000 |
|
650,000 |
|
|
|
|
|
|
|
|
|
|
|
|
|
|
|
|
|
|
|
|
2/29/2016 |
|
Perf. Shares |
|
|
|
|
|
|
|
2,134 |
|
5,334 |
|
10,668 |
|
|
|
|
|
|
|
376,598 |
|
753,196 |
|
|
|
|
2/29/2016 |
|
RSUs |
|
|
|
|
|
|
|
|
|
|
|
|
|
2,612 |
|
|
|
|
|
192,661 |
|
|
|
|
|
|
2/29/2016 |
|
Stock Options |
(4) |
|
|
|
|
|
|
|
|
|
|
|
|
|
|
17,666 |
|
73.76 |
|
245,027 |
|
|
|
|
|
|
2/29/2016 |
|
Stock Options |
(5) |
|
|
|
|
|
|
|
|
|
|
|
|
|
|
29,500 |
|
73.76 |
|
409,165 |
|
|
|
|
|
|
|
|
|
|
|
|
|
|
|
|
|
|
|
|
|
|
|
|
|
|
|
|
|
|
|
|
|
Ian E. Ormesher |
|
|
|
Annual Incentive |
|
99,450 |
|
292,500 |
|
585,000 |
|
|
|
|
|
|
|
|
|
|
|
|
|
|
|
|
|
|
|
|
2/29/2016 |
|
Perf. Shares |
|
|
|
|
|
|
|
2,134 |
|
5,334 |
|
10,668 |
|
|
|
|
|
|
|
376,598 |
|
753,196 |
|
|
|
|
2/29/2016 |
|
RSUs |
|
|
|
|
|
|
|
|
|
|
|
|
|
2,612 |
|
|
|
|
|
192,661 |
|
|
|
|
|
|
2/29/2016 |
|
Stock Options |
(4) |
|
|
|
|
|
|
|
|
|
|
|
|
|
|
17,666 |
|
73.76 |
|
245,027 |
|
|
|
|
|
|
2/29/2016 |
|
Stock Options |
(5) |
|
|
|
|
|
|
|
|
|
|
|
|
|
|
29,500 |
|
73.76 |
|
409,165 |
|
|
|
(1) The threshold payout shown applies to the corporate performance component of the annual incentive plan only. As described in the Compensation Discussion and Analysis under “—Annual Incentive Awards,” individual performance awards are
determined based on both corporate and individual performance and, therefore, may be payable even when threshold levels are not achieved. Maximum payout shown is 200% of the target amount.
(2) The threshold payout shown is based on Company financial performance only. Individual performance ratings do not impact these awards, and no payout is made for performance below the threshold level. Maximum payout shown is 200% of the target amount.
(3) The amounts shown represent the grant date fair value of the relevant award determined in accordance with FASB ASC Topic 718. For awards subject to performance-based conditions, the grant date fair values set forth above are calculated based on target achievement. For a discussion of the assumptions made in the valuations reflected in this column, see Note 7 to the Company’s Consolidated Financial Statements included in its Annual Report on Form 10-K for the year ended December 31, 2016.
(4) This award represents the annual grant of stock options described in the Compensation Discussion and Analysis under “—Long-Term Incentive Awards—Annual Stock Option Awards.”
(5) This award represents the supplemental grant of stock options described in the Compensation Discussion and Analysis under “—Long-Term Incentive Awards—Supplemental Stock Option Awards.”
Description of Plan-Based Awards
Annual Incentive Awards
These non-equity incentive plan awards represent annual incentive award opportunities granted to the Named Executive Officers under the Executive Performance Incentive Plan for the 12-month period from January 1, 2016 through December 31, 2016. The target levels of awards are generally set as a percentage of base salary based on grade level and targeted at the median of our peer group. These awards are cash awards designed to reward executives for achieving corporate goals, regional market goals (as applicable) and individual performance goals. Performance targets and individual performance factors are described in the CD&A under “—Annual Incentive Awards.”
Performance Share Awards
The performance share awards were granted to the Named Executive Officers under the LTIP for the Company’s 2016-2018 performance cycle and represent part of the normal annual long-term incentive grants. Performance shares are earned at between zero to 200% of one-third of the target award amount based on the achievement of the performance goal(s) established for each year of the performance cycle, subject to performance criteria being met and, generally, with continued employment through the end of 2018. Payment of the performance shares is not subject to an individual performance component. Dividends or dividend equivalents are not payable on the performance shares. The performance-based conditions for the first one-third of these awards determinable for 2016 were the performance measures described in the Compensation Discussion and Analysis under “—Long-Term Incentive Awards” as follows: Net Sales (40%), EBIT (25%), EPS (25%), and Working Capital (10%). Upon an executive’s death or retirement more than one year after the grant date, the executive or the executive’s estate will retain any shares that have become fixed for annual performance periods that have been completed and will be entitled to a proportionate number of shares that would otherwise have been accrued for the year in which their employment ended (based on actual performance). If an executive’s employment is terminated for “cause” or an executive voluntarily resigns prior to the date on which the performance share awards are settled, all such performance share awards will be forfeited. If an executive’s employment is terminated ‘‘without cause’’ or ‘‘for good reason’’ prior to a change in control, the executive will retain any shares that have become fixed for annual performance periods that have been completed and will be entitled to a proportionate number of the shares that would otherwise have been accrued for the year in which employment terminates (based on actual performance). If an executive’s employment is terminated ‘‘without cause’’ or ‘‘for good reason’’ during the two years following a change in control, the executive is entitled to receive the actual performance share payout for any full performance year completed prior to the termination date and the target performance share payout for the year of termination and any years not yet commenced.
Restricted Stock Units (“RSUs”)
The RSUs were granted to the Named Executive Officers under the LTIP, and represent part of the normal annual long-term incentive grants. The RSUs earn dividend equivalents in accordance with the terms of the applicable agreement. Generally, the awards granted as part of the annual long-term incentives vest in full on the fourth anniversary of the grant date.
An executive’s right to the RSUs is generally subject to continued employment by the Company and an agreement to not compete, solicit or engage in any activity that is harmful to the interests of the Company. Upon an executive’s death or retirement at least one year after the grant date, the executive or the executive’s estate will be entitled to a proportionate number of the total number of RSUs granted. If an executive’s employment is terminated for “cause” or an executive voluntarily resigns, all unvested RSUs will be forfeited upon termination. If an executive’s employment is terminated “without cause” or “for good reason” prior to a change in control, the executive will be entitled to a proportionate number of the total RSUs that would have otherwise vested for the vesting period in
which the termination occurs. If an executive’s employment is terminated “without cause” or “for good reason” during the two years following a change in control, all remaining restrictions will lapse and the RSUs will become fully vested.
Stock Options
Both grants of stock options made to the Named Executive Officers in 2016 were under the LTIP. Dividends or dividend equivalents are not payable on the stock options. The annual grant of stock options vests ratably on each of the first, second and third anniversaries of the grant date. The supplemental grant of stock options vests ratably on each of the first, second, third and fourth anniversaries of the grant date.
The stock options have an exercise price equal to the closing stock price on the grant date. The stock options can be exercised once vested but before their expiration ten years following the date they were granted. The vesting of the unvested stock options will be fully accelerated upon an executive’s retirement or death more than one year after the grant date and the executive’s estate will have the full term to exercise the options. If an executive’s employment is terminated for “cause” or an executive voluntarily resigns, all vested and unvested options are canceled (and are no longer exercisable) upon termination. Upon an executive’s termination “without cause” or “for good reason” prior to a change in control, the executive will generally be entitled to a proportionate number of the options that would have otherwise vested for the vesting period in which the termination occurs and have three months to exercise these options. If an executive’s employment is terminated “without cause” or “for good reason” during the two years following a change in control, all restrictions will lapse and the options will become fully vested and the executive will have three months to exercise the options.
Outstanding Equity Awards at Fiscal Year-End - 2016
|
|
|
|
|
|
|
Option Awards |
|
Stock Awards |
| ||||||||||||
|
Name |
|
Award Type(1) |
|
Grant Date |
|
Number of |
|
Number of |
|
Option |
|
Option |
|
Number |
|
Market |
|
Equity |
|
Equity |
|
|
|
|
|
|
|
|
|
|
|
|
|
|
|
|
|
|
|
|
|
|
|
|
|
Peter Kasper Jakobsen |
|
Stock Options(2) |
|
3/11/2009 |
|
27,341 |
|
— |
|
26.58 |
|
3/11/2019 |
|
|
|
|
|
|
|
|
|
|
|
|
Stock Options(5) |
|
2/24/2010 |
|
17,409 |
|
— |
|
46.30 |
|
2/24/2020 |
|
|
|
|
|
|
|
|
|
|
|
|
Stock Options(5) |
|
3/2/2011 |
|
23,469 |
|
— |
|
58.86 |
|
3/2/2021 |
|
|
|
|
|
|
|
|
|
|
|
|
Stock Options(5) |
|
3/2/2012 |
|
24,558 |
|
— |
|
78.26 |
|
3/2/2022 |
|
|
|
|
|
|
|
|
|
|
|
|
Stock Options(5) |
|
2/27/2013 |
|
64,364 |
|
— |
|
74.65 |
|
2/27/2023 |
|
|
|
|
|
|
|
|
|
|
|
|
Stock Options(5) |
|
2/28/2014 |
|
49,098 |
|
24,551 |
|
81.55 |
|
2/28/2024 |
|
|
|
|
|
|
|
|
|
|
|
|
Stock Options(5) |
|
2/26/2015 |
|
23,022 |
|
46,046 |
|
104.35 |
|
2/26/2025 |
|
|
|
|
|
|
|
|
|
|
|
|
Stock Options(5) |
|
2/29/2016 |
|
— |
|
125,581 |
|
73.76 |
|
2/28/2026 |
|
|
|
|
|
|
|
|
|
|
|
|
Stock Options(3) |
|
2/29/2016 |
|
— |
|
118,500 |
|
73.76 |
|
2/28/2026 |
|
|
|
|
|
|
|
|
|
|
|
|
RSUs(7) |
|
2/27/2013 |
|
|
|
|
|
|
|
|
|
12,608 |
|
892,142 |
|
|
|
|
|
|
|
|
RSUs(7) |
|
2/28/2014 |
|
|
|
|
|
|
|
|
|
14,427 |
|
1,020,855 |
|
|
|
|
|
|
|
|
RSUs(7) |
|
2/26/2015 |
|
|
|
|
|
|
|
|
|
13,530 |
|
957,383 |
|
|
|
|
|
|
|
|
RSUs(7) |
|
2/29/2016 |
|
|
|
|
|
|
|
|
|
18,568 |
|
1,313,872 |
|
|
|
|
|
|
|
|
Perf. Shares(9) |
|
2/28/2014 |
|
|
|
|
|
|
|
|
|
18,053 |
|
1,277,430 |
|
— |
|
— |
|
|
|
|
Perf. Shares(10) |
|
2/26/2015 |
|
|
|
|
|
|
|
|
|
6,711 |
|
474,870 |
|
9,020 |
|
638,255 |
|
|
|
|
Perf. Shares(11) |
|
2/29/2016 |
|
|
|
|
|
|
|
|
|
9,403 |
|
665,356 |
|
25,277 |
|
1,788,601 |
|
|
|
|
|
|
|
|
|
|
|
|
|
|
|
|
93,300 |
|
6,601,908 |
|
34,297 |
|
2,426,856 |
|
|
|
|
|
|
|
|
|
|
|
|
|
|
|
|
|
|
|
|
|
|
|
|
|
Michel Cup |
|
Stock Options(6) |
|
9/1/2015 |
|
7,898 |
|
15,798 |
|
76.04 |
|
9/1/2025 |
|
|
|
|
|
|
|
|
|
|
|
|
Stock Options(5) |
|
2/29/2016 |
|
— |
|
38,889 |
|
73.76 |
|
2/28/2026 |
|
|
|
|
|
|
|
|
|
|
|
|
Stock Options(3) |
|
2/29/2016 |
|
— |
|
48,500 |
|
73.76 |
|
2/28/2026 |
|
|
|
|
|
|
|
|
|
|
|
|
RSUs(7) |
|
9/1/2015 |
|
|
|
|
|
|
|
|
|
9,284 |
|
656,936 |
|
|
|
|
|
|
|
|
RSUs(7) |
|
2/29/2016 |
|
|
|
|
|
|
|
|
|
5,750 |
|
406,870 |
|
|
|
|
|
|
|
|
Perf. Shares(11) |
|
2/29/2016 |
|
|
|
|
|
|
|
|
|
2,912 |
|
206,053 |
|
7,828 |
|
553,909 |
|
|
|
|
|
|
|
|
|
|
|
|
|
|
|
|
17,946 |
|
1,269,859 |
|
7,828 |
|
553,909 |
|
|
|
|
|
|
|
|
|
|
|
|
|
|
|
|
|
|
|
|
|
|
|
|
|
Charles M. Urbain |
|
Stock Options(5) |
|
3/2/2011 |
|
19,898 |
|
— |
|
58.86 |
|
3/2/2021 |
|
|
|
|
|
|
|
|
|
|
|
|
Stock Options(5) |
|
3/2/2012 |
|
15,349 |
|
— |
|
78.26 |
|
3/2/2022 |
|
|
|
|
|
|
|
|
|
|
|
|
Stock Options(5) |
|
2/27/2013 |
|
17,700 |
|
— |
|
74.65 |
|
2/27/2023 |
|
|
|
|
|
|
|
|
|
|
|
|
Stock Options(5) |
|
2/28/2014 |
|
10,800 |
|
5,403 |
|
81.55 |
|
2/28/2024 |
|
|
|
|
|
|
|
|
|
|
|
|
Stock Options(5) |
|
2/26/2015 |
|
4,220 |
|
8,443 |
|
104.35 |
|
2/26/2025 |
|
|
|
|
|
|
|
|
|
|
|
|
Stock Options(5) |
|
2/29/2016 |
|
— |
|
38,889 |
|
73.76 |
|
2/28/2026 |
|
|
|
|
|
|
|
|
|
|
|
|
Stock Options(3) |
|
2/29/2016 |
|
— |
|
30,000 |
|
73.76 |
|
2/28/2026 |
|
|
|
|
|
|
|
|
|
|
|
|
RSUs(7) |
|
2/27/2013 |
|
|
|
|
|
|
|
|
|
3,467 |
|
245,325 |
|
|
|
|
|
|
|
|
RSUs(7) |
|
2/28/2014 |
|
|
|
|
|
|
|
|
|
3,174 |
|
224,592 |
|
|
|
|
|
|
|
|
RSUs(7) |
|
2/26/2015 |
|
|
|
|
|
|
|
|
|
2,481 |
|
175,556 |
|
|
|
|
|
|
|
|
RSUs(7) |
|
2/29/2016 |
|
|
|
|
|
|
|
|
|
5,750 |
|
406,870 |
|
|
|
|
|
|
|
|
Perf. Shares(9) |
|
2/28/2014 |
|
|
|
|
|
|
|
|
|
3,973 |
|
281,129 |
|
— |
|
— |
|
|
|
|
Perf. Shares(10) |
|
2/26/2015 |
|
|
|
|
|
|
|
|
|
1,231 |
|
87,106 |
|
1,654 |
|
117,037 |
|
|
|
|
Perf. Shares(11) |
|
2/29/2016 |
|
|
|
|
|
|
|
|
|
2,912 |
|
206,053 |
|
7,828 |
|
553,909 |
|
|
|
|
|
|
|
|
|
|
|
|
|
|
|
|
22,988 |
|
1,626,631 |
|
9,482 |
|
670,946 |
|
|
|
|
|
|
|
|
Option Awards |
|
Stock Awards |
| ||||||||||||
|
Name |
|
Award Type(1) |
|
Grant Date |
|
Number of |
|
Number of |
|
Option |
|
Option |
|
Number |
|
Market |
|
Equity |
|
Equity |
|
|
|
|
|
|
|
|
|
|
|
|
|
|
|
|
|
|
|
|
|
|
|
|
|
Patrick M. Sheller |
|
Stock Options(4) |
|
2/2/2015 |
|
1,884 |
|
5,653 |
|
99.61 |
|
2/2/2025 |
|
|
|
|
|
|
|
|
|
|
|
|
Stock Options(5) |
|
2/26/2015 |
|
3,238 |
|
6,478 |
|
104.35 |
|
2/26/2025 |
|
|
|
|
|
|
|
|
|
|
|
|
Stock Options(5) |
|
2/29/2016 |
|
— |
|
17,666 |
|
73.76 |
|
2/28/2026 |
|
|
|
|
|
|
|
|
|
|
|
|
Stock Options(3) |
|
2/29/2016 |
|
— |
|
29,500 |
|
73.76 |
|
2/28/2026 |
|
|
|
|
|
|
|
|
|
|
|
|
RSUs(8) |
|
2/2/2015 |
|
|
|
|
|
|
|
|
|
2,215 |
|
156,733 |
|
|
|
|
|
|
|
|
RSUs(7) |
|
2/26/2015 |
|
|
|
|
|
|
|
|
|
1,904 |
|
134,727 |
|
|
|
|
|
|
|
|
RSUs(7) |
|
2/29/2016 |
|
|
|
|
|
|
|
|
|
2,612 |
|
184,825 |
|
|
|
|
|
|
|
|
Perf. Shares(10) |
|
2/26/2015 |
|
|
|
|
|
|
|
|
|
945 |
|
66,868 |
|
1,269 |
|
89,794 |
|
|
|
|
Perf. Shares(11) |
|
2/29/2016 |
|
|
|
|
|
|
|
|
|
1,323 |
|
93,615 |
|
3,556 |
|
251,623 |
|
|
|
|
|
|
|
|
|
|
|
|
|
|
|
|
8,999 |
|
636,768 |
|
4,825 |
|
341,417 |
|
|
|
|
|
|
|
|
|
|
|
|
|
|
|
|
|
|
|
|
|
|
|
|
|
Ian E. Ormesher |
|
Stock Options(12) |
|
10/1/2014 |
|
3,931 |
|
3,931 |
|
95.50 |
|
10/1/2024 |
|
|
|
|
|
|
|
|
|
|
|
|
Stock Options(5) |
|
2/26/2015 |
|
1,918 |
|
3,838 |
|
104.35 |
|
2/26/2025 |
|
|
|
|
|
|
|
|
|
|
|
|
Stock Options(5) |
|
2/29/2016 |
|
— |
|
17,666 |
|
73.76 |
|
2/28/2026 |
|
|
|
|
|
|
|
|
|
|
|
|
Stock Options(3) |
|
2/29/2016 |
|
— |
|
29,500 |
|
73.76 |
|
2/28/2026 |
|
|
|
|
|
|
|
|
|
|
|
|
RSUs(13) |
|
10/1/2014 |
|
|
|
|
|
|
|
|
|
1,540 |
|
108,970 |
|
|
|
|
|
|
|
|
RSUs(7) |
|
2/26/2015 |
|
|
|
|
|
|
|
|
|
1,128 |
|
79,817 |
|
|
|
|
|
|
|
|
RSUs(7) |
|
2/29/2016 |
|
|
|
|
|
|
|
|
|
2,612 |
|
184,825 |
|
|
|
|
|
|
|
|
Perf. Shares(10) |
|
2/26/2015 |
|
|
|
|
|
|
|
|
|
560 |
|
39,626 |
|
752 |
|
53,212 |
|
|
|
|
Perf. Shares(11) |
|
2/29/2016 |
|
|
|
|
|
|
|
|
|
1,323 |
|
93,615 |
|
3,556 |
|
251,623 |
|
|
|
|
|
|
|
|
|
|
|
|
|
|
|
|
7,163 |
|
506,853 |
|
4,308 |
|
304,835 |
|
(1) A detailed description of the terms of these awards is set forth above under the section titled “Description of Plan Based Awards.” See also “Compensation Discussion and Analysis —Long-Term Incentive Awards” for additional award information.
(2) 25% of this stock option award vested on each of the first, second, third and fourth anniversaries of its grant date. As of December 31, 2016, this award was fully vested.
(3) 25% of this stock option award vests on each of the first, second, third and fourth anniversaries of its grant date. As of December 31, 2016, this award had four remaining vesting dates (March 1, 2017, March 1, 2018, March 1, 2019 and February 29, 2020).
(4) 25% of this stock option award vests on each of the first, second, third and fourth anniversaries of its grant date. As of December 31, 2016, this award had three remaining vesting dates (February 2, 2017, February 2, 2018 and February 2, 2019).
(5) One-third of this stock option award vests on each of the first, second, and third anniversaries of the grant date. As of December 31, 2016, the 2010, 2011, 2012 and 2013 awards were fully vested, the 2014 award had one remaining vesting date (February 28, 2017), the 2015 award had two remaining vesting dates (February 26, 2017 and February 26, 2018) and the 2016 award had three remaining vesting dates (March 1, 2017, March 1, 2018 and March 1, 2019).
(6) One-third of this stock option award vests on each of the first, second, and third anniversaries of its grant date. As of December 31, 2016, this award had two remaining vesting dates (September 1, 2017 and September 1, 2018).
(7) This RSU award vests in full (100%) on the fourth anniversary of its grant date.
(8) 25% of this RSU award vests on each of the first, second, third and fourth anniversaries of its date of grant. As of December 31, 2016, this award had three remaining vesting dates (February 2, 2017, February 2, 2018 and February 2, 2019).
(9) The number and value of performance shares shown represents the number and value of performance shares that became fixed for (i) the 2014 performance period at 113.3% of target based on performance achieved for 2014, (ii) the 2015 performance period at 0% of target (zero performance shares earned) based on 2015 performance and (iii) the 2016 performance period at 74.4% of target based on performance achieved for 2016.
(10) The number and value of performance shares shown represents: (a) the number and value of shares that became fixed for (i) the 2015 performance period at 0% of target (zero performance shares earned) based on 2015 performance and (ii) the 2016 performance period at 74.4% of target based on performance achieved for 2016 and (b) the target number and value of shares that could become fixed based on target performance criteria being met for 2017.
(11) The number and value of performance shares shown represents: (a) the number and value of shares that became fixed for the 2016 performance period at 74.4% of target based on performance achieved for 2016 and (b) the target number and value of shares that could become fixed based on target performance criteria being met for 2017 and 2018.
(12) 25% of this stock option award vests on each of the first, second, third and fourth anniversaries of its grant date. As of December 31, 2016, this award had two remaining vesting dates (October 1, 2017, October 1, 2018).
(13) 25% of this RSU award vests on each of the first, second, third and fourth anniversaries of its date of grant. As of December 31, 2016, this award had two remaining vesting dates (October 1, 2017 and October 1, 2018).
(14) The values shown are based on $70.76 per share, which was the closing price of our common stock on December 30, 2016, the last business day of 2016.
Option Exercises and Stock Vested - 2016
The following table presents information regarding the exercise of stock options by Named Executive Officers during 2016 and the vesting during 2016 of other stock awards previously granted to the Named Executive Officers.
|
|
|
Option Awards |
|
Stock Awards(1) |
| |||||
|
Name |
|
Number of |
|
Value Realized |
|
Number of |
|
Value Realized |
| |
|
Peter Kasper Jakobsen |
|
— |
|
— |
|
24,361 |
|
$ |
1,793,981 |
|
|
Michel Cup |
|
— |
|
— |
|
— |
|
$ |
— |
|
|
Charles M. Urbain |
|
— |
|
— |
|
8,383 |
|
$ |
616,526 |
|
|
Patrick M. Sheller |
|
— |
|
— |
|
738 |
|
$ |
50,900 |
|
|
Ian E. Ormesher |
|
— |
|
— |
|
770 |
|
$ |
60,838 |
|
(1) The pre-tax dollar value realized on the vesting of these awards has been determined by multiplying the aggregate number of stock awards that vested by the closing price of the common stock on the vesting date as follows:
|
Name |
|
Type of |
|
Date of Vest |
|
|
|
Number of Shares |
|
Closing Price of |
|
Total Value Realized |
| ||
|
Peter Kasper Jakobsen |
|
RSUs |
|
3/2/2016 |
|
|
|
4,811 |
|
$ |
73.16 |
|
$ |
351,973 |
|
|
|
|
Perf. Shares |
|
2/29/2016 |
|
|
|
19,550 |
|
$ |
73.76 |
|
$ |
1,442,008 |
|
|
|
|
|
|
|
|
Total |
|
24,361 |
|
|
|
$ |
1,793,981 |
| |
|
|
|
|
|
|
|
|
|
|
|
|
|
|
| ||
|
Charles M. Urbain |
|
RSUs |
|
3/2/2016 |
|
|
|
3,007 |
|
$ |
73.16 |
|
$ |
219,992 |
|
|
|
|
Perf. Shares |
|
2/29/2016 |
|
|
|
5,376 |
|
$ |
73.76 |
|
$ |
396,534 |
|
|
|
|
|
|
|
|
Total |
|
8,383 |
|
|
|
$ |
616,526 |
| |
|
|
|
|
|
|
|
|
|
|
|
|
|
|
| ||
|
Patrick M. Sheller |
|
RSUs |
|
2/2/2016 |
|
|
|
738 |
|
$ |
68.97 |
|
$ |
50,900 |
|
|
|
|
|
|
|
|
Total |
|
738 |
|
|
|
$ |
50,900 |
| |
|
|
|
|
|
|
|
|
|
|
|
|
|
|
| ||
|
Ian E. Ormesher |
|
RSUs |
|
10/1/2016 |
|
|
|
770 |
|
$ |
79.01 |
|
$ |
60,838 |
|
|
|
|
|
|
|
|
Total |
|
770 |
|
|
|
$ |
60,838 |
| |
Pension Benefits - 2016
|
Name |
|
Plan Name |
|
Number of |
|
Present Value of |
|
Payments |
|
|
Peter Kasper Jakobsen |
|
Benefit Equalization Plan |
|
0.360 |
|
108,363 |
|
— |
|
|
|
|
Retirement Income Plan |
|
0.360 |
|
20,259 |
|
— |
|
|
|
|
Key International Plan |
|
11.198 |
|
3,527,252 |
|
— |
|
|
|
|
|
|
|
|
3,655,874 |
|
— |
|
|
|
|
|
|
|
|
|
|
|
|
|
Michel Cup |
|
N/A |
|
— |
|
— |
|
— |
|
|
|
|
|
|
|
|
— |
|
— |
|
|
|
|
|
|
|
|
|
|
|
|
|
Charles M. Urbain |
|
Benefit Equalization Plan |
|
19.770 |
|
4,473,768 |
|
— |
|
|
|
|
Retirement Income Plan |
|
19.770 |
|
1,313,259 |
|
— |
|
|
|
|
|
|
|
|
5,787,027 |
|
— |
|
|
|
|
|
|
|
|
|
|
|
|
|
Patrick M. Sheller |
|
N/A |
|
— |
|
— |
|
— |
|
|
|
|
|
|
|
|
— |
|
— |
|
|
|
|
|
|
|
|
|
|
|
|
|
Ian E. Ormesher |
|
N/A |
|
— |
|
— |
|
— |
|
|
|
|
|
|
|
|
— |
|
— |
|
(1) There are no additional years of service credited after February 9, 2009, and there are no additional years of pay credited after February 8, 2014.
The present values disclosed in the Pension Benefits Table above as of December 31, 2016 were based on the following assumptions:
• Discount rates of 4.04% for the Mead Johnson and Company Retirement Plan, 3.81% for the Benefit Equalization Plan, and 3.91% for the Key International Pension Plan as of December 31, 2016;
• Lump sum mortality was assumed to be the 2016 417(e) table with projected longevity improvements by Scale AA to commencement year; and
• A retirement date at the earliest unreduced retirement age, which can be as early as age 60 with 10 years of service (for Mr. Jakobsen and Mr. Urbain the present value of the benefit payable upon termination at the end of 2016 is higher by $326,782 and $61,648 respectively).
Retirement Income Plan
The Retirement Income Plan is a defined benefit pension plan that provides income for employees after retirement. The Retirement Income Plan is a tax-qualified plan, as defined under Section 401(a) of the Code. The benefit is calculated based on the employee’s final average compensation and years of service. The Retirement Income Plan was closed to new participants in 2009, which means that no person hired after February 9, 2009 is eligible for participation in this plan. Employees who participate in the Executive Performance Incentive Plan or whose pay or benefits exceed the IRS qualified plan limits are eligible to participate in the Benefit Equalization Plan—Retirement Plan. The key plan provisions of the Retirement Income Plan are as follows:
• The retirement benefit equals:
• 2% × Final Average Compensation × Years of Service (prior to February 9, 2009), up to 40, minus
• 1/70th of the Primary Social Security Benefit × Years of Service, up to 40.
• Final Average Compensation equals the average of the five consecutive years out of the last ten in which the employee’s compensation was the highest. Compensation equals the base salary rate, plus bonuses paid during the year. Compensation is subject to the limits defined under Section 401(a)(17) of the Code. For purposes of calculating Final Average Compensation, compensation increases after February 8, 2014 are not recognized.
• Normal retirement age is 65. Employees may elect to take early retirement at age 55 with 10 or more years of service.
• Employees eligible for early retirement may receive their pension without any reduction at age 60. The pension is reduced by 4% for each year that the retirement age precedes age 60.
• Employees are 100% vested after attaining five years of service.
• The pension is payable as a monthly life annuity, with or without survivor benefits, or a lump sum.
Benefit Equalization Plan—Retirement Plan
The Benefit Equalization Plan—Retirement Plan is a non-qualified deferred compensation plan that provides income for employees after retirement in excess of the benefits payable under the qualified Retirement Income Plan. The benefit is calculated using the same formula as the Retirement Income Plan, but without the limits on compensation and benefits imposed under Section 401(a)(17) and Section 415(b) of the Code. The provisions are the same as those above for the Retirement Income Plan, except for the following:
• Compensation is not subject to the limits under Section 401(a)(17) of the Code;
• Compensation includes the higher of bonus earned or paid during the year; and
• The pension is paid as a cash lump sum or, if an election is made at least 12 months prior to retirement, the lump sum may be credited to the Benefit Equalization Plan—Retirement Savings Plan.
Key International Pension Plan
The Key International Pension Plan is a non-qualified plan. This plan was closed to new participants in 2009. The plan provides income for these employees after retirement.
The benefit is calculated based on the employee’s final average compensation and years of service. The key plan provisions are as follows:
• The retirement benefit equals:
• 1.75% × Final Average Compensation × Years of Service prior to February 1, 2009 (non-U.S. employees) or February 9, 2009 (U.S. employees), up to 40, minus
• 1/70th of the Primary Social Security Benefit × Years of Service, up to 40, only when applicable.
• Final Average Compensation equals the average compensation in the five consecutive years out of the last ten in which the employee’s compensation was the highest. Compensation equals the base salary rate, plus the higher of bonuses earned or paid during the year. For purposes of calculating Final Average Compensation, compensation increases after February 8, 2014 are not recognized.
• Normal retirement age is 65. Employees are eligible for early retirement at age 55 with 10 or more years of service.
• Employees eligible for early retirement may receive their pension without any reduction at age 60. The pension is reduced by 4% for each year that the retirement age precedes age 60.
• Employees are 100% vested after attaining five years of service.
• The pension is payable as a monthly life annuity, with or without survivor benefits, or a lump sum.
Non-Qualified Deferred Compensation - 2016
|
Name |
|
Executive |
|
Company |
|
Aggregate |
|
Aggregate |
|
Aggregate |
|
|
Peter Kasper Jakobsen |
|
68,331 |
|
124,331 |
|
78,420 |
|
— |
|
1,209,609 |
|
|
Michel Cup |
|
— |
|
23,083 |
|
— |
|
— |
|
25,909 |
|
|
Charles M. Urbain |
|
50,361 |
|
60,869 |
|
84,397 |
|
— |
|
1,991,416 |
|
|
Patrick M. Sheller |
|
72,025 |
|
40,361 |
|
4,196 |
|
— |
|
131,294 |
|
|
Ian E. Ormesher |
|
16,842 |
|
33,214 |
|
2,120 |
|
— |
|
68,113 |
|
(1) Amounts reported as compensation in the last fiscal year in the “Salary” column of the Summary Compensation Table.
(2) Includes amounts reported as compensation in the last fiscal year in the “All Other Compensation” column of the Summary Compensation Table.
(3) Amounts not shown in the Summary Compensation Table because they are not above-market.
(4) Of the amounts shown in this column, the following were reported in the Summary Compensation Table for the prior fiscal years: Mr. Jakobsen ($582,022); Mr. Cup ($2,827); Mr. Urbain ($363,002); Mr. Sheller ($14,712); and Mr. Ormesher ($0).
All of the amounts shown in the Non-Qualified Deferred Compensation table, above, were deferred under the Benefit Equalization Plan—Retirement Savings Plan described below.
Retirement Savings Plan
The Retirement Savings Plan is a defined contribution plan designed to allow participants to save for retirement and benefit from Company contributions and tax advantages available through the plan. The Retirement Savings Plan is a tax-qualified 401(k) plan, as defined under Section 401(a) of the Code. Employees who participated in the Executive Performance Incentive Plan or whose pay or benefits exceed the IRS qualified plan limits under the Retirement Savings Plan are eligible for the Benefit Equalization Plan—Retirement Savings Plan. The key plan provisions of the Retirement Savings Plan are as follows:
Participants are immediately eligible for Company contributions. Eligible pay is defined as an employee’s current base salary or wages and annual bonus before any pre-tax savings are deducted. Employees are eligible to contribute from 1% to 25% on a pre-tax or after-tax basis or a combination of both to the plan. Employees may make additional pre-tax “catch-up” contributions at or after age 50. The Company will make matching contributions of $1 for each $1 on the first 6% of eligible pay (base pay plus annual bonus) that the employee contributes. The Company matching contribution is on pre-tax and/or after-tax dollars. The plan provides additional Company contributions of 2%, 3% or 4% of eligible pay (base pay plus bonus) to active employees based on employee points (age plus service) as follows:
|
Less than 40 points: |
|
2 |
% |
|
40 - 59 points: |
|
3 |
% |
|
60 or more points: |
|
4 |
% |
Employee contributions are always 100% vested. Company contributions become 100% vested as soon as they are made on the participant’s behalf and regardless of years of service. Participants are able to invest their own contributions and Company contributions into a variety of investment alternatives at their own discretion.
Benefit Equalization Plan—Retirement Savings Plan
The Benefit Equalization Plan—Retirement Savings Plan is a non-qualified deferred compensation plan designed to allow participants to save for retirement and benefit from Company contributions and tax advantages available through the plan in excess of the benefits payable under the qualified Retirement Savings Plan. The key plan provisions are the same as those described above for the Retirement Savings Plan, except for the limits on compensation and benefits imposed on the plan under Section 401(a)(17) and Section 415(b) of the Code.
Potential Payments Upon Termination or Change in Control - 2016
Generally, we have no employment contracts with our executives, unless required by local law or practice. Therefore, post-termination benefits are typically addressed by the plan or award agreement relating to each element of compensation. For example, our equity award agreements set forth their treatment upon an executive’s termination of employment. We do not provide for “single trigger” vesting of awards upon a change in control. However, pursuant to the terms of our equity award agreements, there is an exception to this general treatment if any of these equity awards would be canceled or otherwise cease to be outstanding upon a change in control.
The discussion below describes payments that are due the Named Executive Officers in the event of various termination scenarios or a change in control assuming an effective date of December 31, 2016. To the extent payments and benefits are generally available to salaried employees on a non-discriminatory basis, they are excluded from the tabular disclosures which follow.
None of the tables below reflect payments due to the Named Executive Officers in the event that such Named Executive Officer leaves the Company on a voluntary basis (without good reason or not in connection with a constructive termination). We do not offer any payments to salaried employees, including the Named Executive Officers, upon a voluntary termination other than those that are vested prior to or at the time of termination.
Retirement, Death or Disability
|
|
|
Annual Incentive Award |
|
Stock Options |
|
Restricted Stock Units |
|
Long-Term Performance Awards |
|
Total |
|
|
Name |
|
($)(2) |
|
($)(3) |
|
($)(4) |
|
($)(5) |
|
($) |
|
|
Retirement(1): |
|
|
|
|
|
|
|
|
|
|
|
|
Peter Kasper Jakobsen |
|
— |
|
— |
|
— |
|
— |
|
— |
|
|
Michel Cup |
|
— |
|
— |
|
— |
|
— |
|
— |
|
|
Charles M. Urbain |
|
379,440 |
|
— |
|
476,003 |
|
368,235 |
|
1,223,678 |
|
|
Patrick M. Sheller |
|
— |
|
— |
|
— |
|
— |
|
— |
|
|
Ian E. Ormesher |
|
— |
|
— |
|
— |
|
— |
|
— |
|
|
|
|
|
|
|
|
|
|
|
|
|
|
|
Death: |
|
|
|
|
|
|
|
|
|
|
|
|
Peter Kasper Jakobsen |
|
855,600 |
|
— |
|
2,022,958 |
|
2,417,657 |
|
5,296,215 |
|
|
Michel Cup |
|
442,680 |
|
— |
|
219,002 |
|
206,053 |
|
867,735 |
|
|
Charles M. Urbain |
|
379,440 |
|
— |
|
476,003 |
|
574,288 |
|
1,429,731 |
|
|
Patrick M. Sheller |
|
338,520 |
|
— |
|
109,749 |
|
160,484 |
|
608,753 |
|
|
Ian E. Ormesher |
|
326,430 |
|
— |
|
50,452 |
|
133,241 |
|
510,123 |
|
|
|
|
|
|
|
|
|
|
|
|
|
|
|
Disability: |
|
|
|
|
|
|
|
|
|
|
|
|
Peter Kasper Jakobsen |
|
855,600 |
|
— |
|
4,184,251 |
|
2,417,657 |
|
7,457,508 |
|
|
Michel Cup |
|
442,680 |
|
— |
|
1,063,806 |
|
206,053 |
|
1,712,539 |
|
|
Charles M. Urbain |
|
379,440 |
|
— |
|
1,052,343 |
|
574,288 |
|
2,006,071 |
|
|
Patrick M. Sheller |
|
338,520 |
|
— |
|
476,286 |
|
160,484 |
|
975,290 |
|
|
Ian E. Ormesher |
|
326,430 |
|
— |
|
373,613 |
|
133,241 |
|
833,284 |
|
The following benefits are generally available to all salaried employees, including the Named Executive Officers, upon full retirement at age 65 (or age 55 with 10 or more years of service), death or disability:
(1) Of our Named Executive Officers, only Mr. Urbain was eligible for retirement benefits as of December 31, 2016.
(2) Annual Incentive Award: Reflects actual amount earned for the fiscal year. Employees are eligible for a pro-rata portion of their annual incentive award. The pro-rata award is paid at target, adjusted for performance.
(3) Stock Options: Employees are eligible for accelerated vesting of any stock options granted at least one year prior to the termination event and have the full term to exercise. While on disability status, stock option awards continue to vest until termination of employment, with such termination of employment treated as a retirement, death, or voluntary termination of employment depending upon the circumstances at the time of such termination.
(4) Restricted Stock Units: Upon retirement or death, employees are entitled to a proportionate number of restricted stock unit awards granted at least one year prior to the termination event. While on disability status, restricted stock unit awards granted continue to vest until termination of employment at cessation of all disability benefits with such termination of employment treated as a retirement, death, or voluntary termination of employment depending upon the circumstances at the time of such termination.
(5) Long-Term Performance Awards: For the 2014-2016, 2015-2017 and 2016-2018 performance cycles, upon completion of one year of service, an executive shall be entitled to receive the performance shares that have become fixed for any completed year of the respective performance cycles, plus a proportionate number of shares that would otherwise have been accrued for the year in progress upon retirement or death (based on actual performance). If the employee incurs a disability and if the disability exceeds 26 weeks in the aggregate during one or more performance years, the employee will earn only a proportionate number of performance shares that the employee would otherwise have earned for such affected performance year(s). While on disability status, earned performance share awards continue to vest until termination of employment treated as a retirement, death or voluntary termination of employment depending upon the circumstances at the time of such termination.
Involuntary Termination without Cause or Termination with Good Reason
The Company’s Named Executive Officers were eligible to receive severance payments and benefits under the Executive Severance Plan if their employment was terminated for any of the following reasons:
· Involuntary termination by the Company or participating employer without “Cause”; or
· Termination by executive with “Good Reason.”
|
Name |
|
Cash |
|
Annual |
|
Stock |
|
Restricted |
|
Long-Term |
|
Other |
|
Total |
|
|
Peter Kasper Jakobsen |
|
4,376,923 |
|
855,600 |
|
— |
|
2,298,143 |
|
2,417,657 |
|
121,131 |
|
10,069,454 |
|
|
Michel Cup |
|
1,348,846 |
|
442,680 |
|
— |
|
304,197 |
|
206,053 |
|
90,253 |
|
2,392,029 |
|
|
Charles M. Urbain |
|
1,711,154 |
|
379,440 |
|
— |
|
561,198 |
|
574,288 |
|
82,883 |
|
3,308,963 |
|
|
Patrick M. Sheller |
|
1,224,399 |
|
338,520 |
|
— |
|
148,454 |
|
160,484 |
|
60,863 |
|
1,932,720 |
|
|
Ian E. Ormesher |
|
1,148,365 |
|
326,430 |
|
— |
|
89,158 |
|
133,241 |
|
64,907 |
|
1,762,101 |
|
An executive whose employment is terminated by the Company without Cause or by the executive with Good Reason and who complies with the applicable notice provisions in the case of a Good Reason termination, would have been eligible for the following:
(1) Cash Severance Payment: Other than four weeks of basic severance pay, subject to signing a general release, a cash severance payment in the amount of two times the sum of base salary and target bonus for Mr. Jakobsen and one and a half times the sum of base salary and target bonus for each of the other Named Executive Officers; however, the amounts for Messrs. Cup and Sheller have been adjusted to reflect proration for participants who have been employed by the Company for less than two years.
(2) Annual Incentive Award: Reflects actual amount earned for the 2016 fiscal year. The Named Executive Officers are eligible for a pro-rata award based on performance, subject to signing a general release.
(3) Stock Options: In accordance with the terms of the applicable agreement, employees are generally eligible for accelerated vesting of a proportionate number of the options that would have otherwise vested for the vesting period in which the termination occurs (based on the period of employment during the vesting period). Generally, employees have three months to exercise stock options following termination.
(4) Restricted Stock Units: In accordance with the terms of the applicable agreement, employees are generally eligible for a proportionate number of the total restricted stock units that would have otherwise vested for the vesting period in which the termination occurs (based on the period of employment during the vesting period).
(5) Long-Term Performance Awards: In accordance with the terms of the applicable agreement, the employee will be entitled to receive the performance shares that have become fixed for any completed year of the performance cycle, plus a proportionate number of the shares that would otherwise have been accrued for the year in which employment terminates (based on actual performance).
(6) Continuation of Certain Benefits and other Severance Payments: Continuation of health, dental and life insurance coverage, employee assistance benefits and outplacement services, until the earlier of the end of the severance pay period or the date the executive begins new employment, subject to signing a general release. The maximum outplacement benefit under our policy is 10% of base salary, which is included in the table above.
Additionally, executives who are expatriates are eligible for financial counseling and repatriation relocation benefits based on our standard expatriate relocation policy. However, the policy calls for these to be reasonable and customary in amount (e.g., air tickets home and tax preparation services). The policy does not establish a maximum and the Company cannot estimate what value these benefits would have.
For purposes of the Executive Severance Plan, “Cause” means the following:
• Failure or refusal by the executive to substantially perform their duties with the Company, a participating employer or any of their affiliates (except where the failure results from incapacity due to disability); or
• Severe misconduct or activity deemed detrimental to the interests of the Company, a participating employer or any of its affiliates.
“Cause” will be interpreted by the Compensation and Management Development Committee in its sole discretion and such interpretation will be conclusive and binding.
For purposes of the Executive Severance Plan, “Good Reason” means the occurrence of any of the following events without the executive’s consent:
• A material reduction in the executive’s base salary;
• A reduction in the executive’s grade level resulting in a material diminution of the executive’s authority, duties or responsibilities; or
• A change in the principal location of the executive’s job or office, such that the executive will be based at a location that is 50 miles or more further from the executive’s principal job or office location immediately prior to the proposed change in job or office.
Change in Control and Involuntary Termination Without Cause or Termination with Good Reason
The Company’s Named Executive Officers are eligible to receive enhanced benefits under the Executive Change in Control Plan in the event of a covered termination following a change in control. The occurrence of a change in control alone is generally insufficient to trigger benefits under the Executive Change in Control Plan. However, pursuant to the terms of our equity award agreements, there is an exception to this general treatment if any of these equity awards would be cancelled or otherwise cease to be outstanding upon a change in control.
To trigger benefits under the Executive Change in Control Plan, there must be both a “Change in Control” of the Company and either (1) a subsequent involuntary termination by the Company without Cause or (2) a termination by the executive with Good Reason. Thus, the only benefits that an executive would be entitled to upon a change in control alone are those that are vested at the time of the change in control.
The Company’s Named Executive Officers were eligible to receive severance payments and benefits under the Executive Change in Control Plan if their employment was terminated within two years following a Change in Control for any of the following reasons:
• Involuntary termination by Company without “Cause”;
• Termination by executive with “Good Reason.”
|
Name |
|
Cash |
|
Annual |
|
Stock |
|
Restricted |
|
Long-Term |
|
Supplemental |
|
Other |
|
Reduction in |
|
Total |
|
|
Peter Kasper Jakobsen |
|
6,450,000 |
|
1,150,000 |
|
— |
|
4,184,251 |
|
4,844,513 |
|
760,000 |
|
137,055 |
|
(1,387,215 |
) |
16,138,604 |
|
|
Michel Cup |
|
2,590,000 |
|
595,000 |
|
— |
|
1,063,806 |
|
759,962 |
|
286,650 |
|
105,577 |
|
(387,741 |
) |
5,013,254 |
|
|
Charles M. Urbain |
|
2,220,000 |
|
510,000 |
|
— |
|
1,052,343 |
|
1,245,234 |
|
273,000 |
|
98,160 |
|
— |
|
5,398,737 |
|
|
Patrick M. Sheller |
|
1,650,000 |
|
325,000 |
|
— |
|
476,286 |
|
501,901 |
|
177,750 |
|
76,094 |
|
(264,869 |
) |
2,942,162 |
|
|
Ian E. Ormesher |
|
1,485,000 |
|
292,500 |
|
— |
|
373,613 |
|
438,075 |
|
159,975 |
|
80,115 |
|
— |
|
2,829,278 |
|
An executive whose employment is terminated without Cause or with Good Reason within two years following a Change in Control would be eligible for the following:
(1) Cash Severance Payment: Subject to the executive signing a general release, a cash payment equal to three times base salary plus target bonus for Mr. Jakobsen and two times base salary plus target bonus for each of the other Named Executive Officers.
(2) Annual Incentive Award: Reflects only target bonus for the 2016 fiscal year for purposes of this disclosure. The Named Executive Officers are eligible for a pro-rata award, subject to signing a general release.
(3) Stock Options: In accordance with the terms of the applicable award, unvested stock options will fully vest. Employees have three months to exercise these stock options.
(4) Restricted Stock Units: In accordance with the terms of the applicable award, accelerated vesting of restricted stock units.
(5) Long-Term Performance Awards: In accordance with the terms of the applicable award, long-term performance awards that relate to any completed performance year will be deemed vested, and those related to the year of termination or any future performance year will be deemed earned at target.
(6) Supplemental Retirement Benefits: Subject to the executive signing a general release, additional supplemental retirement benefits based on early termination and the amount of severance payable under the plan and including additional credits to defined contribution plans based on cash severance amounts.
(7) Continuation of Certain Benefits and Other Severance Payments: Continuation of medical, dental and life insurance coverage, employee assistance benefits, outplacement services and financial planning services, until the earlier of the end of the severance pay period or the date the executive begins new employment, subject to signing a general release. Expatriation and repatriation benefits are also provided. The maximum outplacement benefit under our policy is 10% of base salary, which amount is included in the table above.
Additionally, executives who are expatriates are eligible for financial counseling and relocation benefits. However, the policy calls for these to be reasonable and customary in amount (e.g., air tickets home and tax preparation services). The policy does not establish a maximum and the Company cannot estimate what value these benefits would have.
(8) Reduction in Severance—Excise Tax: The Company’s Executive Change in Control Plan does not provide excise tax gross-ups to any executive. The Executive Change in Control Plan contains a “best net” approach to address the potential for any excise tax to be imposed for severance payments and benefits that would constitute an “excess parachute payment” under Section 4999 of the Internal Revenue Code. Under the terms of the Executive Change in Control Plan, the Company would not provide a gross-up payment and would instead reduce payments to the executives such that the aggregate amount equals the maximum amount that can be paid without triggering imposition of the excise tax, if the net amount received by the executives on an after-tax basis would be greater than it would be absent such a reduction.
For purposes of the Executive Change in Control Plan, “Cause” means the following:
• Willful and continued failure by the executive to substantially perform his or her duties with the Company (except if as a result of disability) for a period of 30 consecutive days after written demand for substantial performance is delivered to the executive;
• Willful engagement by executive in conduct that is demonstrably and materially injurious to the Company or its subsidiaries or affiliates, monetarily or otherwise; or
• A felony conviction or the entry of plea of nolo contendere to a felony.
For purposes of the Executive Change in Control Plan, “Good Reason” means the occurrence of any of the following events without the executive’s consent:
• Assignment of any duties materially inconsistent with the executive’s status as an officer of the Company or a substantially adverse alteration in the nature or status of the executive’s authorities, duties or responsibilities from those in effect immediately prior to the Change in Control;
• A material adverse change in the executive’s reporting relationships;
• A material reduction by the Company in the executive’s base salary or bonus from the levels in effect immediately prior to a Change in Control or as the same may be increased from time to time after a Change in Control;
• The relocation of the executive’s principal place of employment to a location more than 50 miles from the location of such place of employment immediately prior to a Change in Control, except for required travel on the Company’s business to an extent substantially consistent with the executive’s business travel obligations prior to the Change in Control or, if the executive has consented to a relocation, the failure by the Company to provide the executive with all of the benefits of the Company’s relocation policy as in operation immediately prior to a Change in Control;
• The failure of the Company to pay the executive any material amount or portion of executive’s compensation or to pay to executive any portion of an installment of deferred compensation under any deferred compensation program of the Company within seven days of the date on which such compensation was due; or
• The failure of the Company to continue in effect any compensation or benefit plan which is material to the executive’s compensation and in which executive participated immediately prior to the Change in Control, unless an equitable arrangement has been made with respect to such plan, or the failure by the Company to continue the executive’s participation therein on a basis not materially less favorable, both in terms of the amounts of benefits provided and the level of executive’s participation relative to other participants, as existed at the time of the Change in Control.
For purposes of the Executive Change in Control Severance Plan, “Change in Control” means the occurrence of any of the following events:
• Any individual, entity or group (within the meaning of Section 13(d)(3) or 14(d)(2) of the Securities Exchange Act of 1934, as amended (the “Exchange Act”)) (a “Person”) shall have become the direct or indirect beneficial owner of thirty percent (30%) or more of (i) the then-outstanding shares of common stock of the Company (the “Outstanding MJN Common Shares”) or (ii) the combined voting power of the then-outstanding voting securities of the Company entitled to vote generally in the election of directors (the “Outstanding MJN Voting Securities”)(other than, in each case, in connection with a merger or consolidation as a result of which (1) the Company becomes a direct or indirect wholly-owned subsidiary of a holding company, (2) the direct or indirect holders of the common stock and the voting securities of such holding company immediately following the transaction are substantially the same as the holders of the Outstanding MJN Common Shares and the Outstanding MJN Voting Securities, as the case may be, immediately prior to the transaction, and (3) immediately following the transaction no Person is the beneficial owner, directly or indirectly, of thirty percent (30%) or more of the common stock or the voting securities of such holding company);
• The consummation of a reorganization, merger, statutory share exchange, consolidation or similar transaction involving the Company or any of its subsidiaries, the sale or other disposition of all or substantially all of the assets of the Company and its subsidiaries (taken as a whole), or the acquisition of assets or stock of another entity by the Company or any of its subsidiaries (each, a “Business Combination”), in each case, unless, following such Business Combination, (i) all or substantially all of the individuals and entities that were the beneficial owners of the Outstanding MJN Common Shares and the Outstanding MJN Voting Securities immediately prior to such Business Combination beneficially own, directly or indirectly, more than fifty percent (50%) of the then-outstanding shares of common stock (or, for a non-corporate entity, equivalent securities) and the combined voting power of the then-outstanding voting securities entitled to vote generally in the election of members of the board of directors (or, for a non-corporate entity, equivalent governing body), as the case may be, of the entity surviving or resulting from such Business Combination (including an entity that, as a result of such transaction, owns all or substantially all of the common stock or the voting securities of the Company or all or substantially all of the Company’s assets either directly or through one or more subsidiaries) in substantially the same proportions as their ownership immediately prior to such Business Combination of the Outstanding MJN Common Shares and the Outstanding MJN Voting Securities, as the case may be, (ii) no Person (excluding the Company or any employee benefit plan (or related trust) of the Company or such entity surviving or resulting from such Business Combination) beneficially owns, directly or indirectly, thirty percent (30%) or more of, respectively, the then-outstanding shares of common stock (or, for a non-corporate entity, equivalent securities) of the entity surviving or resulting from such Business Combination (or any parent thereof) or the combined voting power of the then-outstanding voting securities of such entity (or any parent thereof) entitled to vote generally in the election of members of the board of directors (or, for a non-corporate entity, equivalent governing body) and (iii) at least a majority of the members of the board of directors (or, for a non-corporate entity,
equivalent governing body) of the entity surviving or resulting from such Business Combination (or any parent thereof) were members of the Board at the time of the execution of the initial agreement or action of the Board providing for such Business Combination;
• The stockholders of the Company approve a plan of complete liquidation or dissolution of the Company; or
• There shall have been a change in the composition of the Board within a two-year period such that a majority of the Board does not consist of directors who were serving at the beginning of such period together with directors whose initial nomination for election by the Company’s stockholders or, if earlier, initial appointment to the Board was approved by the vote of two-thirds of the directors then still in office who were in office at the beginning of the two-year period together with the directors who were previously so approved (either by a specific vote of approval or by approval of the Company’s proxy statement in which such person was named as a nominee for election as a director).
Compensation of Directors
We have adopted a director compensation program that establishes annual compensation for our non-employee directors that will enable us to attract and retain highly qualified directors, provide them with compensation at a level that is consistent with our compensation objectives and encourage their ownership of our common stock to further align their interests with those of our stockholders. Our non-employee director compensation program includes cash compensation and equity grants in the form of restricted stock units (“RSUs”) as described below. In overseeing our director compensation program, the Nominating and Corporate Governance Committee uses the same peer group for director compensation comparisons as is used for executive compensation comparisons, has a comparable compensation strategy and reviews our program annually with the assistance of Aon Hewitt.
Cash Compensation
In light of the Board’s one-time cost savings initiative undertaken in conjunction with the Company’s “Fuel for Growth” cost savings program, total 2016 director compensation levels were lower than in prior years. In 2016, our non-employee director compensation program provided the following cash compensation for all non-employee directors:
Restricted Stock Units
In 2016, each non-employee director was entitled to an annual equity grant in the form of RSUs having a grant date fair market value as is listed in the table below. Generally, these RSU grants are made concurrently with annual equity grants to our employees; however, unlike employee equity grants, the directors’ RSU grants vest in full on the first anniversary of the grant date.

Modifications to Director Compensation Program for 2017
In December 2016, the Nominating and Corporate Governance Committee engaged in its periodic review of non-employee director compensation. As part of this review, the committee evaluated benchmark data based on the Company’s peer group. At the committee’s recommendation, the Board decided to re-position and reduce director compensation at the median of the compensation peer group (instead of the 75th percentile). The Board also agreed to maintain committee chair fees, but to eliminate fees for non-chair committee members. As a result, our non-employee director compensation program will provide the following compensation for non-employee directors in 2017:
2016 Director Compensation
The following table provides information on 2016 compensation for non-employee directors who served on the Board during 2016.
|
Name |
|
Fees Earned or Paid in |
|
Stock Awards ($)(2) |
|
All Other |
|
Total ($) |
| ||||
|
Steven M. Altschuler, M.D. |
|
|
73,250 |
|
|
175,032 |
|
|
0 |
|
|
248,282 |
|
|
Howard B. Bernick |
|
|
65,000 |
|
|
175,032 |
|
|
10,000 |
|
|
250,032 |
|
|
Kimberly A. Casiano |
|
|
66,500 |
|
|
175,032 |
|
|
0 |
|
|
241,532 |
|
|
Anna C. Catalano |
|
|
67,750 |
|
|
175,032 |
|
|
10,000 |
|
|
252,782 |
|
|
Celeste A. Clark, Ph.D. |
|
|
65,593 |
|
|
175,032 |
|
|
500 |
|
|
241,125 |
|
|
James M. Cornelius |
|
|
99,556 |
|
|
360,023 |
|
|
10,000 |
|
|
469,579 |
|
|
Stephen W. Golsby |
|
|
61,278 |
|
|
175,032 |
|
|
0 |
|
|
236,310 |
|
|
Michael Grobstein |
|
|
70,000 |
|
|
175,032 |
|
|
10,000 |
|
|
255,032 |
|
|
Peter G. Ratcliffe |
|
|
78,250 |
|
|
175,032 |
|
|
10,000 |
|
|
263,282 |
|
|
Michael A. Sherman |
|
|
66,500 |
|
|
175,032 |
|
|
10,000 |
|
|
251,532 |
|
|
Elliott Sigal, M.D., Ph.D. |
|
|
68,750 |
|
|
175,032 |
|
|
10,000 |
|
|
253,782 |
|
|
Robert S. Singer |
|
|
66,250 |
|
|
175,032 |
|
|
10,000 |
|
|
251,282 |
|
(1) Consists of the amounts described above under “Compensation of Directors - Cash Compensation” for 2016 including annual cash retainers, committee chair retainers and committee member retainers. Committee assignments were modified on May 11, 2016, and payments were prorated accordingly.
(2) Amounts shown represent the grant date fair value of RSUs granted in 2016 as described above under “Compensation of Directors - Restricted Stock Units” and as computed in accordance with Financial Accounting Standards Board (“FASB”) (Accounting Standards Codification (“ASC”)) Topic 718, Compensation—Stock Compensation. The value of dividends to be paid on RSUs is factored into the grant date fair value of the awards. The following table sets forth the aggregate number of outstanding RSUs held by each director as of December 31, 2016:
|
Name |
|
RSUs |
|
|
Steven M. Altschuler, M.D. |
|
2,373 |
|
|
Howard B. Bernick |
|
2,373 |
|
|
Kimberly A. Casiano |
|
2,373 |
|
|
Anna C. Catalano |
|
2,373 |
|
|
Celeste A. Clark, Ph.D. |
|
2,373 |
|
|
James M. Cornelius |
|
4,881 |
|
|
Stephen W. Golsby |
|
2,373 |
|
|
Michael Grobstein |
|
2,373 |
|
|
Peter G. Ratcliffe |
|
2,373 |
|
|
Michael A. Sherman |
|
2,373 |
|
|
Elliott Sigal, M.D., Ph.D. |
|
2,373 |
|
|
Robert S. Singer |
|
2,373 |
|
(3) Amounts shown reflect donations made by the Company to charitable institutions under our charitable matching gift program whereby the Company matches directors’ donations to charitable institutions that qualify as 501(c)(3) charities (up to $10,000 annually per director).
Director Stock Ownership Guidelines
Our non-employee directors are subject to ownership guidelines regarding shares of our common stock. Our guidelines require that, within four years of becoming a director, each of our non-employee directors hold common stock with a value equal to four times his or her annual cash retainer. In measuring stock ownership for our directors, actual common stock owned and unvested time-based RSUs are counted toward the ownership requirements. Directors may acquire common stock through the retention of the annual stock awards as well as any other acquisition of common stock. Our non-employee directors may not sell any of their common stock awards until the director has achieved the ownership threshold (except to satisfy any tax withholding requirements). If a director holds the retention amount, such director may elect to sell any shares above that amount upon vesting. When one of our non-employee directors departs from the Board, the director must retain common stock with a value equal to four times his or her annual cash retainer for a six-month period following the director’s date of departure. All of our current directors have met our stock retention requirements, or are on track to meet our stock retention requirements, within the required time frame.
Item 12. SECURITY OWNERSHIP OF CERTAIN BENEFICIAL OWNERS AND MANAGEMENT AND RELATED STOCKHOLDER MATTERS.
The following table sets forth information as of March 6, 2017, regarding beneficial ownership of our common stock by:
• each person known to us to be a beneficial owner of more than five percent of our common stock;
• each of our Named Executive Officers;
• each of our directors; and
• all of our directors and executive officers as a group.
The number of shares beneficially owned by each stockholder is determined under the SEC’s rules and generally includes voting or investment power over shares. Under SEC rules, shares are beneficially owned when an individual has voting and/or investment power over the shares or could obtain voting and/or investment power over the shares within 60 days. Voting power includes the power to direct the voting of the shares, and investment power includes the power to direct the disposition of the shares. Unless otherwise noted, shares listed below are owned directly or indirectly with sole voting and investment power. None of our directors or executive officers, individually or as a group, beneficially owns greater than 1% of the outstanding shares of our common stock.
|
Name of Beneficial Owner |
|
Number of Shares of |
|
Percent of Common |
|
|
5% or Greater Stockholders |
|
|
|
|
|
|
BlackRock, Inc.(2) |
|
13,512,653 |
|
7.36 |
% |
|
The Vanguard Group(3) |
|
11,939,925 |
|
6.50 |
% |
|
FMR LLC(4) |
|
11,634,993 |
|
6.34 |
% |
|
Capital Research Global Investors(5) |
|
10,758,562 |
|
5.86 |
% |
|
Capital World Investors(6) |
|
10,724,917 |
|
5.84 |
% |
|
Named Executive Officers and Directors: |
|
|
|
|
|
|
Peter Kasper Jakobsen |
|
415,844 |
(7) |
|
|
|
Michel Cup |
|
38,986 |
(8) |
|
|
|
Charles M. Urbain |
|
154,496 |
(9) |
|
|
|
Patrick M. Sheller |
|
24,446 |
(10) |
|
|
|
Ian E. Ormesher |
|
22,065 |
(11) |
|
|
|
Steven M. Altschuler, M.D. |
|
16,792 |
|
|
|
|
Howard B. Bernick |
|
47,373 |
(12) |
|
|
|
Kimberly A. Casiano |
|
9,483 |
|
|
|
|
Anna C. Catalano |
|
11,169 |
|
|
|
|
Celeste A. Clark, Ph.D. |
|
12,661 |
|
|
|
|
James M. Cornelius |
|
83,219 |
(13) |
|
|
|
Stephen W. Golsby |
|
21,784 |
|
|
|
|
Michael Grobstein |
|
8,197 |
|
|
|
|
Peter G. Ratcliffe |
|
17,096 |
|
|
|
|
Michael A. Sherman |
|
4,051 |
|
|
|
|
Elliott Sigal, M.D., Ph.D. |
|
26,671 |
(14) |
|
|
|
Robert S. Singer |
|
9,661 |
|
|
|
|
All directors and executive officers as a group (20 persons) |
|
1,109,081 |
(15) |
|
|
(1) Includes shares credited to accounts of the executive officers under the Mead Johnson & Company Retirement Savings Plan and stock options that are currently exercisable or exercisable within 60 days. No RSUs or performance shares will vest and be payable within 60 days.
(2) As reported on Schedule 13G filed with the SEC on January 25, 2017, BlackRock, Inc. beneficially owned 13,512,653 shares of our common stock as of December 31, 2016. Of such shares, BlackRock, Inc. has sole voting power for 11,815,390 shares. The address of the principal business office of BlackRock, Inc. is 55 East 52nd Street, New York, New York 10055.
(3) As reported on Schedule 13G filed with the SEC on February 10, 2017, The Vanguard Group beneficially owned 11,939,925 shares of our common stock as of December 31, 2016. Of such shares, The Vanguard Group has sole voting power for 289,524 shares, shared voting power for 35,374 shares, sole dispositive power for 11,612,370 shares and shared dispositive power for 327,555 shares. The address of the principal business office of The Vanguard Group is 100 Vanguard Blvd, Malvern, PA 19355.
(4) As reported on Schedule 13G filed with the SEC on February 14, 2017, each of FMR LLC and Abigail P. Johnson (a Director, the Chairman and the CEO of FMR LLC) beneficially owned 11,634,993 shares of our common stock as of December 31, 2016. Of such shares, FMR LLC has sole voting power for 1,549,534 shares. The address of the principal business office of FMR LLC is 245 Summer Street, Boston, Massachusetts 02210.
(5) As reported on Schedule 13G filed with the SEC on February 13, 2017, Capital Research Global Investors beneficially owned 10,758,562 shares of our common stock as of December 31, 2016. The address of the principal business office of Capital Research Global Investors is 333 South Hope Street, Los Angeles, CA 90071.
(6) As reported on Schedule 13G filed with the SEC on February 13, 2017, Capital World Investors beneficially owned 10,724,917 shares of our common stock as of December 31, 2016. The address of the principal business office of Capital World Investors is 333 South Hope Street, Los Angeles, CA 90071.
(7) Includes 348,320 shares underlying stock options that are currently exercisable or exercisable within 60 days. 27,114 of the shares of common stock held by Mr. Jakobsen have been pledged to secure a line of credit extended by a commercial bank.
(8) Includes 32,986 shares underlying stock options that are currently exercisable or exercisable within 60 days.
(9) Includes 98,054 shares underlying stock options that are currently exercisable or exercisable within 60 days.
(10) Includes 23,508 shares underlying stock options that are currently exercisable or exercisable within 60 days.
(11) Includes 21,031 shares underlying stock options that are currently exercisable or exercisable within 60 days.
(12) These shares are held by a personal holding company owned by the director.
(13) Includes 27,975 shares contributed by Mr. Cornelius to grantor retained annuity trusts.
(14) Includes 12,950 shares held indirectly through Sigal Family Investments, LLC, a family investment limited liability company of which Dr. Sigal is the sole manager.
(15) Includes 666,850 shares underlying stock options currently exercisable or exercisable within 60 days and 57.0830 shares held indirectly through the Mead Johnson & Company Retirement Savings Plan.
Securities Authorized for Issuance Under Equity Compensation Plans
The following table provides certain information as of December 31, 2016 regarding common stock that may be issued under the LTIP, our one equity compensation plan.
|
Plan Category |
|
Number of Securities to be |
|
Weighted Average |
|
Number of Securities Remaining |
| |
|
Equity Compensation Plans Approved by Security Holders |
|
3,647,619 |
(1) |
$ |
74.66 |
(2) |
16,950,920 |
(3) |
|
Equity Compensation Plans Not Approved by Security Holders |
|
— |
|
— |
|
— |
| |
|
Total |
|
3,647,619 |
|
$ |
74.66 |
|
16,950,920 |
|
(1) Includes (a) stock options to purchase 2,552,712 shares of common stock with a weighted average exercise price of $74.66, (b) 707,516 shares of common stock issuable following the vesting of restricted stock units for which no exercise price will be paid and (c) 387,391 shares of common stock deliverable in respect of performance share awards for which no exercise price will be paid (assuming maximum payout of performance share awards).
(2) The calculation of weighted average exercise price includes only outstanding stock options and excludes restricted stock units and performance share awards.
(3) Types of awards issuable under the LTIP include: options, stock appreciation rights, restricted stock, restricted stock units, stock granted as a bonus or in lieu of another award, dividend equivalents, other stock-based awards or performance share awards.
Item 13. CERTAIN RELATIONSHIPS AND RELATED TRANSACTIONS, AND DIRECTOR INDEPENDENCE.
Certain Relationships and Related Person Transactions
The Board must approve any transactions involving the Company in which any of our directors, director nominees, executive officers, greater than five percent beneficial owners and their respective immediate family members has a direct or indirect material interest and where the amount involved in the transaction exceeds or is expected to exceed $120,000 in a single calendar year. In doing so, the Board takes into account, among other factors it deems appropriate:
· The related person’s interest in the transaction;
· The approximate dollar value of the amount involved in the transaction;
· The approximate dollar value of the amount of the related person’s interest in the transaction without regard to the amount of any profit or loss;
· Whether the transaction was undertaken in the ordinary course of our business;
· Whether the transaction with the related person is proposed to be, or was, entered into on terms no less favorable to us than terms that could have been reached with an unrelated third party;
· The purpose of, and the potential benefits to us of, the transaction; and
· Any other information regarding the transaction or the related person in the context of the proposed transaction that would be material to investors in light of the circumstances of the particular transaction.
FMR LLC (“Fidelity”) filed an amended Schedule 13G in February 2017, indicating that it holds over 5% of the Company’s common stock. As a result, Fidelity is currently considered a “related person” as outlined above. Certain affiliates of Fidelity provide services to the Company in connection with the administration of our pension plan and 401(k) plans. The Company paid such entities approximately $398,547, to administer our pension plan in fiscal year 2016 and approximately $77,177 to administer our 401(k) plans in
fiscal year 2016. Services with Fidelity were negotiated at arm’s length and generally comparable amounts are expected to be paid to Fidelity in 2017.
Director Independence
To be considered independent, the Board must affirmatively determine that a director does not have any direct or indirect material relationship with the Company (either directly or as a partner, stockholder or officer of an organization that has a relationship with the Company). Our Corporate Governance Guidelines require that the Board be composed of a majority of directors who meet the criteria for “independence” established by rules of the NYSE.
Our Board annually undertakes a review of director independence. During its review, the Board considered transactions and relationships between each director or any member of his or her immediate family and the Company and its subsidiaries and affiliates. The Board also considered whether there were any transactions or relationships between directors or any member of their immediate family (or any entity of which a director or an immediate family member is an executive officer, general partner or significant equity holder) and members of our senior management or their affiliates. The purpose of this review was to determine whether any such relationships or transactions existed that were inconsistent with a determination that the director is independent.
As a result of this review, the Board affirmatively determined that a majority of our directors are independent as follows:
|
Name |
|
Independence Status |
|
Factors Considered |
|
Steven M. Altschuler, M.D. |
|
Independent |
|
(1) |
|
Howard B. Bernick |
|
Independent |
|
|
|
Kimberly A. Casiano |
|
Independent |
|
|
|
Anna C. Catalano |
|
Independent |
|
(2) |
|
Celeste A. Clark, Ph.D. |
|
Independent |
|
|
|
James M. Cornelius |
|
Independent |
|
|
|
Stephen W. Golsby |
|
Independent |
|
(3) |
|
Michael Grobstein |
|
Independent |
|
(4) |
|
Peter Kasper Jakobsen |
|
Not Independent |
|
(5) |
|
Peter G. Ratcliffe |
|
Independent |
|
|
|
Michael A. Sherman |
|
Independent |
|
|
|
Elliott Sigal, M.D., Ph.D. |
|
Not Independent |
|
(6) |
|
Robert S. Singer |
|
Independent |
|
|
(1) Dr. Altschuler serves as the President and CEO of the University of Miami Health Systems (“University of Miami”). In determining whether Dr. Altschuler meets the applicable independence standards, the Board considered that we and our subsidiaries have, during the last three years, conducted ordinary course business with the University of Miami. Amounts paid to the University of Miami in each of the past three years were less than $110,000 and did not approach 2% of the hospital’s total revenue. The Board determined that this relationship did not impair Dr. Altschuler’s independence.
(2) In determining whether Ms. Catalano meets the applicable independence standards, the Board considered that we have, in the ordinary course of business, made payments in 2016 to various subsidiaries of Willis Towers Watson, where Ms. Catalano serves as a non-employee director, for fees related to the administration of our insurance policies. The Board determined that this relationship did not impair Ms. Catalano’s independence.
(3) In determining whether Mr. Golsby meets the applicable independence standards, the Board considered that we have, in the ordinary course of business, made payments in 2016 to Tesco PLC, where Mr. Golsby serves as a non-employee director, in connection with trade promotion activity. The Board determined that this relationship did not impair Mr. Golsby’s independence.
(4) In determining whether Mr. Grobstein meets the applicable independence standards, the Board considered certain payments made to PricewaterhouseCoopers, where Mr. Grobstein’s son is a partner who works on matters unrelated to the Company’s engagement. The Board determined that this relationship did not impair Mr. Grobstein’s independence.
(5) Mr. Jakobsen, our current President and Chief Executive Officer, is not independent because of his current employment relationship with the Company.
(6) Dr. Sigal is not an independent director because he has an immediate family member who is a current partner at Deloitte Tax LLP, an affiliate of Deloitte & Touche, our Independent Registered Public Accounting Firm.
Item 14. PRINCIPAL ACCOUNTANT FEES AND SERVICES.
Fees Paid to Independent Registered Public Accounting Firm
The table set forth below presents the fees for professional audit services rendered by Deloitte & Touche in connection with the integrated audits of our consolidated financial statements for the years ended December 31, 2016 and 2015, and fees for other services rendered by Deloitte & Touche and its affiliates during these periods.
|
|
|
2016 |
|
2015 |
| ||
|
Audit Fees |
|
$ |
3,942,753 |
|
$ |
3,859,110 |
|
|
Audit-Related Fees |
|
52,515 |
|
81,321 |
| ||
|
Tax Fees |
|
102,545 |
|
146,475 |
| ||
|
All Other Fees |
|
— |
|
— |
| ||
|
Total |
|
$ |
4,097,813 |
|
$ |
4,086,906 |
|
Audit Fees for 2016 and 2015 include fees for services rendered for the audits of our consolidated financial statements and of our internal control over financial reporting, reviews of our quarterly financial statements, and statutory audits.
Audit-Related Fees for 2016 include fees for services rendered related to the issuance of certain regulatory attestation reports and the audit of our Canadian pension plan. For 2015, fees were for services rendered related to the issuance of a comfort letter and certain regulatory attestation reports.
Tax Fees for 2016 and 2015 were for services rendered related to tax compliance and advisory services, including transfer pricing analyses, VAT analyses, and tax audit support services.
Pre-Approval of Audit and Permissible Non-Audit Services
The Audit Committee pre-approved all audit and non-audit services provided by Deloitte & Touche and its affiliates during 2016 in accordance with our policy described below.
The Audit Committee has established a policy to pre-approve all audit and permissible non-audit services provided by our independent registered public accounting firm consistent with applicable SEC rules. Our independent registered public accounting firm is generally prohibited from performing any management consulting projects, or from providing tax consulting services relating to transactions or proposals in which the sole purpose may be tax avoidance or for which the tax treatment may not be supported by the Internal Revenue Code. Prior to the engagement of our independent registered public accounting firm for the next year’s audit, management submits an aggregate of services expected to be rendered during that year for each of the four categories of services described above to the Audit Committee for approval. Prior to engagement, the Audit Committee pre-approves these services by category of service. The fees are budgeted by category of service and the Audit Committee receives periodic reports from management and our independent registered public accounting firm on actual fees versus the budget by category of service. During the year, circumstances may arise when it may become necessary to engage our independent registered public accounting firm for additional services not contemplated in the pre-approval. In those instances, the Audit Committee requires specific pre-approval before engaging our independent registered public accounting firm.
The Audit Committee may delegate pre-approval authority to its Chair. The Chair is required to report, for informational purposes, any pre-approval decisions to the Audit Committee at its next regularly scheduled meeting.
Item 15. EXHIBITS AND FINANCIAL STATEMENT SCHEDULES.
The financial statements and schedule required to filed in our Annual Report on Form 10-K are included in the Original Filing. The exhibits filed as a part of this Amendment are listed in the Exhibit Index immediately following the signature page to this report.
SIGNATURES
Pursuant to the requirements of Section 13 or 15(d) of the Securities Exchange Act of 1934, the registrant has duly caused this report to be signed on its behalf by the undersigned, thereunto duly authorized.
|
|
MEAD JOHNSON NUTRITION COMPANY | ||
|
|
|
|
|
|
Date: |
March 13, 2017 |
By: |
/s/ Michel Cup |
|
|
|
|
Michel Cup |
|
|
|
|
Executive Vice President and Chief Financial Officer |
EXHIBIT INDEX
|
Exhibit |
|
Description |
|
|
|
|
|
2 |
|
Plan of Acquisition, Reorganization, Arrangement, Liquidation or Succession |
|
2.1 |
|
Agreement and Plan of Merger, dated as of February 10, 2017, among Mead Johnson Nutrition Company, Reckitt Benckiser Group plc and Marigold Merger Sub, Inc. (incorporated by reference to Exhibit 2.1 to Current Report on Form 8-K filed on February 13, 2017) |
|
|
|
|
|
3 |
|
Articles of Incorporation and Bylaws |
|
3.1 |
|
Second Amended and Restated Certificate of Incorporation of Mead Johnson Nutrition Company (incorporated by reference to Exhibit 3.1 to Current Report on Form 8-K filed on January 8, 2010) |
|
3.2 |
|
Amended and Restated By-laws of Mead Johnson Nutrition Company (incorporated by reference to Exhibit 3.1 to Current Report on Form 8-K filed on December 14, 2016) |
|
3.2 |
|
Amendment No. 1 to the Amended and Restated Bylaws of the Company, adopted on February 9, 2017 (incorporated by reference to Exhibit 3.1 to Current Report on Form 8-K filed on February 13, 2017) |
|
|
|
|
|
4 |
|
Instruments defining the rights of the security holders, including indentures |
|
4.1 |
|
Specimen Common Stock Certificate (incorporated by reference to Exhibit 4.1 to Amendment No. 1 to Registration Statement on Form S-1 (Registration No. 333-156298) filed on January 14, 2009) |
|
4.2 |
|
Indenture, dated as of November 1, 2009, by and between Mead Johnson Nutrition Company and The Bank of New York Mellon Trust Company, N.A., as trustee (incorporated by reference to Exhibit 4.1 to Current Report on Form 8-K filed on November 12, 2009) |
|
4.3 |
|
First Supplemental Indenture, dated as of November 5, 2009, by and among Mead Johnson Nutrition Company, Mead Johnson & Company and The Bank of New York Mellon Trust Company, N.A., as trustee (including forms of the 4.90% Notes due 2019 and 5.90% Notes due 2039 Notes) (incorporated by reference to Exhibit 4.2 to Current Report on Form 8-K filed on November 12, 2009) |
|
4.4 |
|
Second Supplemental Indenture, dated as of May 13, 2014, between Mead Johnson Nutrition Company and The Bank of New York Mellon Trust Company, N.A., as trustee (including form of the 4.60% Senior Notes due June 1, 2044) (incorporated by reference to Exhibit 4.1 to the Company’s Current Report on Form 8-K filed on May 13, 2014) |
|
4.5 |
|
Third Supplemental Indenture, dated as of November 3, 2015, between Mead Johnson Nutrition Company and The Bank of New York Mellon Trust Company, N.A., as trustee (including forms of the 3.000% Senior Notes due 2020 and 4.125% Senior Notes due 2025) (incorporated by reference to Exhibit 4.1 to the Company’s Current Report on Form 8-K filed on November 3, 2015) |
|
|
|
|
|
10 |
|
Material Contracts |
|
10.1 |
|
Separation Agreement by and between Bristol-Myers Squibb Company and Mead Johnson Nutrition Company, dated January 31, 2009 (incorporated by reference to Exhibit 10.1 to Annual Report on Form 10-K for the fiscal year ended December 31, 2008 filed on March 27, 2009) |
|
10.2 |
|
Employee Matters Agreement between Bristol-Myers Squibb Company and Mead Johnson Nutrition Company, dated January 31, 2009 (incorporated by reference to Exhibit 10.2 to Annual Report on Form 10-K for the fiscal year ended December 31, 2008 filed on March 27, 2009) |
|
10.3 |
|
Second Amended and Restated Transitional Services Agreement between Bristol-Myers Squibb Company and Mead Johnson Nutrition, dated December 18, 2009 (incorporated by reference to Exhibit 10.4 to Annual Report on Form 10-K for the fiscal year ended December 31, 2009 filed on February 25, 2010) |
|
10.4 |
|
Amended and Restated Tax Matters Agreement between Bristol-Myers Squibb Company and Mead Johnson Nutrition Company dated December 18, 2009 (incorporated by reference to Exhibit 10.1 to Current Report on Form 8-K filed on December 23, 2009) |
|
10.5 |
|
First Amendment, dated June 27, 2014, to Five Year Revolving Credit Facility Agreement among Mead Johnson Nutrition Company, Mead Johnson & Company, LLC, various subsidiaries of the Company party thereto from time to time, various financial institutions and JPMorgan Chase Bank, N.A., as Administrative Agent (incorporated by reference to Exhibit 10.1 to the Company’s Current Report on Form 8-K filed on June 30, 2014) |
|
10.6 |
|
Amendment No. 2 to Five Year Revolving Credit Facility Agreement, dated as of November 5, 2015, among Mead Johnson Nutrition Company, various financial institutions and JPMorgan Chase Bank, N.A., as Administrative Agent (incorporated by reference to Exhibit 10.6 to Annual Report on Form 10-K for the fiscal year ended December 31, 2015 filed on February 17, 2016) |
|
10.7* |
|
Mead Johnson Nutrition Company Long Term Incentive Plan (incorporated by reference to Appendix A to Definitive Proxy Statement on Schedule 14A filed on March 23, 2015) |
|
10.8* |
|
Mead Johnson Nutrition Company Senior Executive Performance Incentive Plan (as Amended and Restated Effective as of January 1, 2015) (incorporated by reference to Exhibit 10.7 to Annual Report on Form 10-K for the fiscal year ended December 31, 2014 filed on February 27, 2015) |
|
10.9* |
|
Mead Johnson & Company Benefit Equalization Plan-Retirement Plan (incorporated by reference to Exhibit 10.31 to Annual Report on Form 10-K for the fiscal year ended December 31, 2008 filed on March 27, 2009) |
|
10.10* |
|
Mead Johnson & Company Benefit Equalization Plan-Retirement Savings Plan (incorporated by reference to Exhibit 10.32 to Annual Report on Form 10-K for the fiscal year ended December 31, 2008 filed on March 27, 2009) |
|
10.11* |
|
Mead Johnson & Company Key International Pension Plan (incorporated by reference to Exhibit 10.33 to Annual Report on Form 10-K for the fiscal year ended December 31, 2008 filed on March 27, 2009) |
|
10.12* |
|
Second Amended and Restated Mead Johnson & Company, LLC Senior Executive Severance Plan (incorporated by reference to Exhibit 10.1 to Current Report on Form 8-K filed on December 5, 2014) |
|
10.13* |
|
Third Amended and Restated Mead Johnson & Company, LLC Executive Change in Control Severance Plan (incorporated by reference to Exhibit 10.2 to the Company’s Current Report on Form 8-K filed on June 13, 2014) |
|
10.14* |
|
Form of Nonqualified Stock Option Agreement (incorporated by reference to Exhibit 10.34 to Annual Report on Form 10-K for the fiscal year ended December 31, 2008 filed on March 27, 2009) |
|
10.15* |
|
Form of Performance Shares Agreement (incorporated by reference to Exhibit 10.35 to Annual Report on Form 10-K for the fiscal year ended December 31, 2008 filed on March 27, 2009) |
|
10.16* |
|
Form of Director Restricted Stock Units Agreement (incorporated by reference to Exhibit 10.36 to Annual Report on Form 10-K for the fiscal year ended December 31, 2008 filed on March 27, 2009) |
|
10.17* |
|
Form of Employee Restricted Stock Units Agreement (incorporated by reference to Exhibit 10.37 to Annual Report on Form 10-K for the fiscal year ended December 31, 2008 filed on March 27, 2009) |
|
10.18* |
|
Form of Restricted Stock Units Agreement (incorporated by reference to Exhibit 10.5 to Current Report on Form 8-K filed on December 23, 2009) |
|
10.19* |
|
Form of 2013 Nonqualified Stock Option Agreement (incorporated by reference to Exhibit 10.1 to Quarterly Report on Form 10-Q for the fiscal quarter ended March 31, 2013 filed on April 25, 2013) |
|
10.20* |
|
Form of 2013 Employee Restricted Stock Unit Agreement (incorporated by reference to Exhibit 10.2 to Quarterly Report on Form 10-Q for the fiscal quarter ended March 31, 2013 filed on April 25, 2013) |
|
10.21* |
|
Form of 2013 Non-Employee Director Restricted Stock Unit Agreement (incorporated by reference to Exhibit 10.3 to Quarterly Report on Form 10-Q for the fiscal quarter ended March 31, 2013 filed on April 25, 2013) |
|
10.22* |
|
Form of 2013 Performance Share Award Agreement (incorporated by reference to Exhibit 10.4 to Quarterly Report on Form 10-Q for the fiscal quarter ended March 31, 2013 filed on April 25, 2013) |
|
10.23* |
|
Form of Performance Share Award Agreement (incorporated by reference to Exhibit 10.1 to the Company’s Current Report on Form 8-K filed on June 13, 2014) |
|
10.24* |
|
Form of Nonqualified Stock Option Agreement (incorporated by reference to Exhibit 10.3 to the Company’s Quarterly Report on Form 10-Q for the fiscal quarter ended June 30, 2015 filed on July 23, 2015) |
|
10.25* |
|
Form of Employee Restricted Stock Unit Agreement (incorporated by reference to Exhibit 10.4 to the Company’s Quarterly Report on Form 10-Q for the fiscal quarter ended June 30, 2015 filed on July 23, 2015) |
|
10.26* |
|
Form of Non-Employee Director Restricted Stock Unit Agreement (incorporated by reference to Exhibit 10.5 to the Company’s Quarterly Report on Form 10-Q for the fiscal quarter ended June 30, 2015 filed on July 23, 2015) |
|
10.27* |
|
Form of Performance Share Award Agreement (incorporated by reference to Exhibit 10.6 to the Company’s Quarterly Report on Form 10-Q for the fiscal quarter ended June 30, 2015 filed on July 23, 2015) |
|
10.28* |
|
Form of Nonqualified Stock Option Agreement (incorporated by reference to Exhibit 10.1 to the Company’s Quarterly Report on Form 10-Q for the fiscal quarter ended March 31, 2016 filed on April 28, 2016) |
|
10.29* |
|
Letter Agreement between the Company and Mr. Peter G. Leemputte (incorporated by reference to Exhibit 10.1 to the Company’s Current Report on Form 8-K filed on March 5, 2015) |
|
10.30* |
|
Amendment No. 1 to Letter Agreement, dated May 20, 2015, between the Company and Mr. Peter G. Leemputte (incorporated by reference to Exhibit 10.2 to the Company’s Quarterly Report on Form 10-Q for the fiscal quarter ended June 30, 2015 filed on July 23, 2015) |
|
|
|
|
|
21 |
|
Subsidiaries of the Registrant |
|
21.1+ |
|
Subsidiaries of the Registrant |
|
|
|
|
|
23 |
|
Consents of Experts and Counsel |
|
23.1+ |
|
Consent of Deloitte & Touche LLP |
|
|
|
|
|
31 |
|
Rule 13a-14(a)/15d-14(a) Certifications |
|
31.1 |
|
Certification of the Chief Executive Officer |
|
31.2 |
|
Certification of the Chief Financial Officer |
|
|
|
|
|
32 |
|
Section 1350 Certifications |
|
32.1+ |
|
Certification of the Chief Executive Officer |
|
32.2+ |
|
Certification of the Chief Financial Officer |
* Compensatory plan or arrangement.
+ Previously filed by the Company as an exhibit to the Company’s Annual Report on Form 10-K for the fiscal year ended December 31, 2016 filed on February 27, 2017.