Attached files
UNITED STATES
SECURITIES AND EXCHANGE COMMISSION
WASHINGTON, D.C. 20549
FORM 10-K
x ANNUAL REPORT PURSUANT TO SECTION 13 OR 15(d) OF THE SECURITIES EXCHANGE ACT OF 1934
For the fiscal year ended December 31, 2016
OR
o TRANSITION REPORT PURSUANT TO SECTION 13 OR 15(d) OF THE SECURITIES EXCHANGE ACT OF 1934
For the Transition Period from _____ to _____
Commission File Number 001-15204
Kingsway Financial Services Inc.
(Exact name of registrant as specified in its charter)
Ontario, Canada | Not Applicable | |||
(State or other jurisdiction of incorporation or organization) | (I.R.S. Employer Identification No.) | |||
45 St. Clair Avenue West, Suite 400 Toronto, Ontario | M4V 1K9 | |||
(Address of principal executive offices) | (Zip Code) | |||
1-416-848-1171
(Registrant's telephone number, including area code)
Securities registered pursuant to Section 12(b) of the Act:
Title of Each Class | Name of Each Exchange on Which Registered |
Common Stock, no par value | New York Stock Exchange |
Securities registered pursuant to Section 12(g) of the Act: None
Indicate by check mark if the registrant is a well-known seasoned issuer, as defined in Rule 405 of the Securities Act. Yes o No x
Indicate by check mark if the registrant is not required to file reports pursuant to Section 13 or Section 15(d) of the Act. Yes o No x
Indicate by check mark whether the registrant (1) has filed all reports required to be filed by Section 13 or 15(d) of the Securities Exchange Act of 1934 during the preceding 12 months (or for such shorter period that the registrant was required to file such reports), and (2) has been subject to such filing requirements for the past 90 days. Yes x No o
Indicate by check mark whether the registrant has submitted electronically and posted on its corporate Web site, if any, every Interactive Data File required to be submitted and posted pursuant to Rule 405 of Regulation S-T during the preceding 12 months (or for such shorter period that the registrant was required to submit and post such files). Yes x No o
Indicate by check mark if disclosure of delinquent filers pursuant to Item 405 of Regulation S-K (§ 229.405 of this chapter) is not contained herein, and will not be contained, to the best of registrant's knowledge, in definitive proxy or information statements incorporated by reference in Part III of this Form 10-K or any amendment to this Form 10-K. x
Indicate by check mark whether the registrant is a large accelerated filer, an accelerated filer, a non-accelerated filer or a smaller reporting company. See the definitions of “large accelerated filer,” “accelerated filer” and “smaller reporting company” in Rule 12b-2 of the Exchange Act. Large accelerated filer o Accelerated filer x Non-accelerated filer o Smaller reporting company o
Indicate by check mark whether the registrant is a shell company (as defined in Rule 12b-2 of the Exchange Act). Yes o No x
As of June 30, 2016, the aggregate market value of the registrant's voting common stock held by non-affiliates of registrant was $68,251,572 based upon the closing sale price of the common stock as reported by the New York Stock Exchange. Solely for purposes of this calculation, all executive officers and directors of the registrant are considered affiliates.
The number of shares of the Registrant's Common Stock outstanding as of March 13, 2017 was 21,458,190.
DOCUMENTS INCORPORATED BY REFERENCE
Part III of this Form 10-K is incorporated by reference to certain sections of the Proxy Statement for the 2016 Annual Meeting of Shareholders, which will be filed with the Securities and Exchange Commission no later than 120 days after the end of our fiscal year ended December 31, 2016.
KINGSWAY FINANCIAL SERVICES INC. | ||
Table Of Contents | ||
Caution Regarding Forward-Looking Statements | ||
PART I | ||
Item 1. Business | ||
Item 1A. Risk Factors | ||
Item IB. Unresolved Staff Comments | ||
Item 2. Properties | ||
Item 3. Legal Proceedings | ||
Item 4. Mine Safety Disclosures | ||
PART II | ||
Item 5. Market for Registrant's Common Equity, Related Stockholder Matters and Issuer Purchases of Equity Securities | ||
Item 6. Selected Financial Data | ||
Item 7. Management's Discussion and Analysis of Financial Condition and Results of Operations | ||
Item 7A. Quantitative and Qualitative Disclosures About Market Risk | ||
Item 8. Financial Statements and Supplementary Data | ||
Item 9. Changes in and Disagreements with Accountants on Accounting and Financial Disclosure | ||
Item 9A. Controls and Procedures | ||
Item 9B. Other Information | ||
PART III | ||
Item 10. Directors, Executive Officers, and Corporate Governance | ||
Item 11. Executive Compensation | ||
Item 12. Security Ownership of Certain Beneficial Owners and Management and Related Stockholder Matters | ||
Item 13. Certain Relationships and Related Transactions, and Director Independence | ||
Item 14. Principal Accounting Fees and Services | ||
PART IV | ||
Item 15. Exhibits, Financial Statement Schedules | ||
Item 16. Form 10-K Summary | ||
SIGNATURES | ||
EXHIBIT INDEX | ||
2 | ||
KINGSWAY FINANCIAL SERVICES INC. | ||
Caution Regarding Forward-Looking Statements
This 2016 Annual Report on Form 10-K (the "2016 Annual Report"), including the accompanying consolidated financial statements of Kingsway Financial Services Inc. ("Kingsway") and its subsidiaries (individually and collectively referred to herein as the "Company") and the notes thereto appearing in Item 8 herein (the "Consolidated Financial Statements"), Management's Discussion and Analysis of Financial Condition and Results of Operations appearing in Item 7 herein (the "MD&A"), and the other Exhibits and Financial Statement Schedules filed as a part hereof or incorporated by reference herein may contain or incorporate by reference information that includes or is based on forward-looking statements within the meaning of Section 27A of the Securities Act of 1933 and Section 21E of the Securities Exchange Act of 1934.
Forward-looking statements relate to future events or future performance and reflect Kingsway management's current beliefs, based on information currently available. The words "anticipate," "expect," "believe," "may," "should," "estimate," "project," "outlook," "forecast" and variations or similar words and expressions are used to identify such forward looking information, but these words are not the exclusive means of identifying forward-looking statements. Specifically, statements about (i) the Company's ability to preserve and use its net operating losses; (ii) the Company's expected liquidity; and (iii) the potential impact of volatile investment markets and other economic conditions on the Company's investment portfolio and underwriting results, among others, are forward-looking, and the Company may also make forward-looking statements about, among other things:
• | its results of operations and financial condition (including, among other things, premium volume, premium rates, net and operating income, investment income and performance, return on equity, and expected current returns and combined ratios); |
• | changes in facts and circumstances affecting assumptions used in determining the provision for unpaid loss and loss adjustment expenses; |
• | the number and severity of insurance claims (including those associated with catastrophe losses) and their impact on the adequacy of the provision for unpaid loss and loss adjustment expenses; |
• | the impact of emerging claims issues as well as other insurance and non-insurance litigation; |
• | orders, interpretations or other actions by regulators that impact the reporting, adjustment and payment of claims; |
• | changes in industry trends and significant industry developments; |
• | uncertainties related to regulatory approval of insurance rates, policy forms, license applications and similar matters; |
• | the impact of certain guarantees made by the Company; |
• | the ability to complete current or future acquisitions successfully; |
• | the ability to successfully implement our restructuring activities; and |
• | strategic initiatives. |
For a discussion of some of the factors that could cause actual results to differ, see Item 1A,"Risk Factors," and Item 7, "Management's Discussion and Analysis of Financial Condition and Results of Operations-Critical Accounting Estimates and Assumptions," in this 2016 Annual Report.
Except as expressly required by applicable securities laws, the Company disclaims any intention or obligation to update or revise any forward-looking statements, whether as a result of new information, future events or otherwise, that might arise subsequent to the date of this 2016 Annual Report.
3 | ||
KINGSWAY FINANCIAL SERVICES INC. | ||
Part I
Item 1. BUSINESS
Kingsway Financial Services Inc. was incorporated under the Business Corporations Act (Ontario) on September 19, 1989. In this report, the terms "Kingsway," the "Company," "we," "us" or "our" mean Kingsway Financial Services Inc. and all entities included in our Consolidated Financial Statements.
The Company's registered office is located at 45 St. Clair Avenue West, Suite 400, Toronto, Ontario, Canada M4V 1K9. The common shares of Kingsway are listed on the Toronto Stock Exchange and the New York Stock Exchange under the trading symbol "KFS."
Kingsway is a Canadian holding company with operating subsidiaries located in the United States. The Company operates as a merchant bank primarily engaged, through its subsidiaries, in the property and casualty insurance business. Kingsway conducts its business through the following three reportable segments: Insurance Underwriting, Insurance Services and Leased Real Estate. Insurance Underwriting, Insurance Services and Leased Real Estate conduct their business and distribute their products in the United States. Certain of the business descriptions below, particularly "Investments," "Reinsurance" and "Regulatory Environment," are principally or exclusively related to Insurance Underwriting.
Financial information about Kingsway's reportable business segments for the years ended December 31, 2016, 2015 and 2014 is contained in the following sections of this 2016 Annual Report: (i) Note 25, "Segmented Information," to the Consolidated Financial Statements; and (ii) "Results of Continuing Operations" section of MD&A.
RESTATEMENT OF PREVIOUSLY ISSUED FINANCIAL STATEMENTS
The Company has restated its Consolidated Financial Statements as of and for the years ended December 31, 2015 and December 31, 2014. In addition, the Company has restated the balances for the years ended December 31, 2015 and December 31, 2014 included in the first table to Note 24, “Accumulated Other Comprehensive Loss.” The restatements reflect immaterial corrections of errors identified by management during the fourth quarter of 2016 in the Company’s intercompany eliminations related to accumulated other comprehensive loss and accumulated deficit. No change to shareholders’ equity attributable to common shareholders, total shareholders’ equity, the consolidated statements of operations or the consolidated statements of cash flows for the periods presented in the 2016 Annual Report results from the restatements. The restatements are more fully discussed in Note 3, "Restatement of Previously Issued Financial Statements," to the Consolidated Financial Statements.
Previously filed Annual Reports on Form 10-K and quarterly reports on Form 10-Q for the periods affected by the restatements have not been amended. All amounts in this 2016 Annual Report affected by the restatements reflect such amounts as restated.
REPORTING CURRENCY
The Consolidated Financial Statements have been presented in U.S. dollars because the Company's principal investments and cash flows are denominated in U.S. dollars. The Company's functional currency is the U.S. dollar since the substantial majority of its operations is conducted in the United States. Assets and liabilities of subsidiaries with non-U.S. dollar functional currencies are translated to U.S. dollars at period-end exchange rates, while revenue and expenses are translated at average monthly rates and shareholders' equity is translated at the rates in effect at dates of capital transactions. Foreign currency translation adjustments are included in shareholders' equity under the caption accumulated other comprehensive loss. Foreign currency gains and losses resulting from transactions which are denominated in currencies other than the entity's functional currency are reflected in foreign exchange losses, net in the consolidated statements of operations.
All of the dollar amounts in this 2016 Annual Report are expressed in U.S. dollars, except where otherwise indicated. References to "dollars" or "$" are to U.S. dollars, and any references to "C$" are to Canadian dollars.
GENERAL DEVELOPMENT OF BUSINESS
Acquisitions
CMC Industries, Inc.:
On July 14, 2016, the Company completed the acquisition of 81.0% of CMC Industries, Inc. ("CMC") for cash consideration of $1.5 million. CMC is included in the Leased Real Estate segment. CMC owns, through an indirect wholly owned subsidiary, a parcel of real property consisting of approximately 192 acres located in the State of Texas (the "Real Property"). The Real Property is leased to a third party pursuant to a long-term triple net lease. The Real Property is also subject to a mortgage in the principal
4 | ||
KINGSWAY FINANCIAL SERVICES INC. | ||
amount of $180.0 million (the "Mortgage") at the date of acquisition. Further information is contained in Note 5, "Acquisitions," to the Consolidated Financial Statements.
Argo Management Group LLC:
Effective April 21, 2016, the Company issued 160,000 shares of its common stock to acquire Argo Management Group LLC ("Argo"). The Argo purchase price of $0.7 million was determined using the closing price of Kingsway common stock on the date the 160,000 shares were issued. Argo’s primary business is to act as the Managing Member of Argo Holdings Fund I, LLC, an investment fund organized for purposes of making control-oriented equity investments in established lower middle market companies based in North America, with a focus on search fund investments. Further information is contained in Note 5, "Acquisitions," to the Consolidated Financial Statements.
Deconsolidation
During the third quarter of 2016, the Company's ownership percentage in 1347 Investors LLC ("1347 Investors") was reduced to 26.7%. As a result, the Company recorded a non-cash gain of $5.6 million during the third quarter of 2016 related to the deconsolidation of 1347 Investors. This gain results from removing the carrying value of the noncontrolling interest in 1347 Investors and the carrying value of the consolidated net assets of 1347 Investors, and recording the fair value of the Company's 26.7% retained noncontrolling investment in 1347 Investors. Further information is contained in Note 6, "Disposition, Deconsolidations and Discontinued Operations," to the Consolidated Financial Statements.
Private Placement
On November 16, 2016, the Company closed with non-affiliate investors a private placement of 1,615,384 shares of its common stock at a purchase price of $6.50 per share with gross proceeds to the Company of $10.5 million. Net proceeds to the Company were $10.5 million after deducting expenses.
INSURANCE UNDERWRITING SEGMENT
The Company's property and casualty insurance business operations are conducted primarily through the following subsidiaries: Mendota Insurance Company ("Mendota"), Mendakota Insurance Company ("Mendakota"), Mendakota Casualty Company ("MCC"), Kingsway Amigo Insurance Company ("Amigo") and Kingsway Reinsurance Corporation (collectively, "Insurance Underwriting").
The insurance subsidiaries in Insurance Underwriting issue insurance policies and retain the risk of operating profit or loss related to the ultimate loss and loss adjustment expenses incurred on the underlying policies. Insurance Underwriting provides non-standard automobile insurance to individuals who do not meet the criteria for coverage by standard automobile insurers. Insurance Underwriting has policyholders in 12 states; however, new business is accepted in only 8 states. In 2016, the following states accounted for 89.0% of Insurance Underwriting's gross premiums written: Florida (27.4%), Texas (17.7%), Illinois (13.3%), Nevada (11.3%), California (10.9%) and Colorado (8.4%).
The Company previously placed Amigo and MCC into voluntary run-off in 2012 and 2011, respectively. Each of Amigo and MCC entered into a comprehensive run-off plan which was approved by its respective state of domicile. Kingsway continues to manage Amigo and MCC in a manner consistent with the run-off plans. During the first quarter of 2015, MCC sent a letter of intent to the Illinois Department of Insurance to resume writing private passenger automobile policies in the state of Illinois. MCC began writing these policies on April 1, 2015.
Effective March 31, 2014, the Company's wholly owned subsidiary, 1347 Property Insurance Holdings, Inc. ("PIH"), formerly known as Maison Insurance Holdings, Inc., completed an initial public offering of its common stock. Upon completion of the transaction, the Company maintained a minority ownership interest in the common shares of PIH. The earnings of PIH are included in the consolidated statements of operations through the March 31, 2014 transaction date. Prior to the transaction, PIH was included in the Insurance Underwriting segment. As a result of the disposal of the Company's majority interest in PIH on March 31, 2014, all segmented information has been restated to exclude PIH from the Insurance Underwriting segment.
5 | ||
KINGSWAY FINANCIAL SERVICES INC. | ||
Insurance Underwriting Products
Insurance Underwriting primarily markets automobile insurance products which provide coverage in three major areas: liability, accident benefits and physical damage. Liability insurance provides coverage for claims against the Company's insureds legally responsible for automobile accidents which have injured third-parties or caused property damage to third-parties. Accident benefit policies or personal injury protection policies provide coverage for loss of income, medical and rehabilitation expenses for insured persons who are injured in an automobile accident, regardless of fault. Physical damage policies cover damages to an insured automobile arising from a collision with another object or from other risks such as fire or theft.
Table 1 and Table 2 summarize Insurance Underwriting's gross premiums written by line of business and by state, respectively, for the years ended December 31, 2016, 2015 and 2014.
TABLE 1 Gross premiums written by line of business
For the years ended December 31 (in thousands of dollars, except for percentages)
2016 | % of Total | 2015 | % of Total | 2014 | % of Total | |||||||
Private passenger auto liability | 90,114 | 67.9 | % | 78,811 | 67.7 | % | 76,487 | 67.1 | % | |||
Auto physical damage | 42,575 | 32.1 | % | 37,592 | 32.3 | % | 37,515 | 32.9 | % | |||
Total gross premiums written | 132,689 | 100.0 | % | 116,403 | 100.0 | % | 114,002 | 100.0 | % | |||
TABLE 2 Gross premiums written by state
For the years ended December 31 (in thousands of dollars, except for percentages)
2016 | % of Total | 2015 | % of Total | 2014 | % of Total | |||||||
Florida | 36,378 | 27.4 | % | 27,935 | 24.0 | % | 21,440 | 18.8 | % | |||
Texas | 23,525 | 17.7 | % | 18,989 | 16.3 | % | 20,142 | 17.7 | % | |||
Illinois | 17,644 | 13.3 | % | 18,265 | 15.7 | % | 17,786 | 15.6 | % | |||
California | 14,429 | 10.9 | % | 12,046 | 10.3 | % | 11,363 | 10.0 | % | |||
Nevada | 15,015 | 11.3 | % | 11,572 | 9.9 | % | 10,863 | 9.5 | % | |||
Colorado | 11,122 | 8.4 | % | 10,027 | 8.6 | % | 11,033 | 9.7 | % | |||
Other | 14,576 | 11.0 | % | 17,569 | 15.2 | % | 21,375 | 18.7 | % | |||
Total gross premiums written | 132,689 | 100.0 | % | 116,403 | 100.0 | % | 114,002 | 100.0 | % | |||
Non-standard automobile insurance is principally provided to individuals who do not qualify for standard automobile insurance coverage because of their payment history, driving record, place of residence, age, vehicle type or other factors. Such drivers typically represent higher than normal risks and pay higher insurance rates for comparable coverage.
Non-standard automobile insurance loss experience is generally driven by higher frequency and lower severity than the standard automobile market. The higher frequency, however, is mitigated to some extent by higher premium rates; the tendency of high-risk individuals to own low-value automobiles; and generally lower limits of insurance coverage as insureds tend to purchase coverage at the minimum prescribed limits. In the United States, non-standard automobile insurance policies generally have lower limits of insurance commensurate with the minimum coverage requirements under the statute of the states in which we write the business. These limits of liability are typically not greater than $50,000 per occurrence.
The insuring of non-standard automobile drivers is often transitory. When their driving records improve, insureds may qualify to obtain insurance in the standard market at lower premium rates. We often cancel policies for non-payment of premium and, following a period of lapse in coverage, insureds frequently return to purchase a new policy at a later date. As a result, our non-standard automobile insurance policies experience a retention rate that is lower than that experienced for standard market risks. This creates an on-going requirement to replace non-renewing policyholders with new policyholders and to react promptly to issue cancellation notices for non-payment of premiums to mitigate potential bad debt write-offs. Most of our insureds pay their premiums on a monthly installment basis, and we typically limit our risk related to non-payment of premiums by requiring a deposit for future insurance premiums and the prepayment of subsequent installments.
In the United States, automobile insurers are generally required to participate in various involuntary residual market pools and assigned risk plans that provide automobile insurance coverage to individuals or other entities that are unable to purchase such
6 | ||
KINGSWAY FINANCIAL SERVICES INC. | ||
coverage in the voluntary market. Participation in these pools in most jurisdictions is in proportion to voluntary writings of selected lines of business in those jurisdictions.
Non-standard automobile insurance accounted for 100.0% of Insurance Underwriting's gross premiums written in 2016, 2015 and 2014. For the year ended December 31, 2016, gross premiums written for non-standard automobile insurance increased 14.0% to $132.7 million as compared to $116.4 million in 2015. For the year ended December 31, 2015, gross premium written for non-standard automobile insurance increased 2.1% to $116.4 million as compared to $114.0 million in 2014. The increase in gross premiums written during 2016 compared to 2015 reflects a change in the mix of business by state resulting from Insurance Underwriting’s strategic shift to emphasize certain states and de-emphasize others while also reflecting the competitive market dynamics of each state. Of particular note, the Company has recorded increased premiums written in Florida, Texas and Nevada while reducing premiums written in Virginia, a state in which Insurance Underwriting ceased writing new business beginning in the third quarter of 2015. The increase in gross premiums written during 2015 compared to 2014, resulted primarily from increased premium volumes written in Florida during the year ended December 31, 2015 compared to prior year.
Marketing and Distribution
Our strategy focuses on developing and maintaining strong relationships with our independent agents. Insurance Underwriting's products and services are marketed through approximately 3,800 independent agencies. We maintain an "open market" approach which enables these agents to place business with us without the obligation of minimum production commitments, providing us with a broad, flexible and scalable distribution network. We continually strive to provide excellent service in the markets in which we operate, communicating through a variety of channels as we look for opportunities to increase efficiency and reduce operating costs with our agents. Our independent agents have the ability to bind insurance policies on our behalf, subject to our underwriting guidelines. Our proprietary point-of-sale systems, however, prevent any agent from binding an unacceptable risk. We do not, though, delegate authority to settle or adjust claims, establish underwriting guidelines, develop rates or enter into other transactions or commitments through our independent agents.
Texas business is originated through an affiliated managing general agent and written through an unaffiliated Texas county mutual insurance company. This business is then 100% assumed through a quota-share arrangement by one of our insurance subsidiaries. This represents a common way of originating non-standard automobile business in the state of Texas due to the greater rating and underwriting flexibility accorded Texas county mutual insurance companies under Texas statutes.
No customer or group of affiliated customers accounts for 10% or more of Insurance Underwriting's revenues, and no loss of a customer or group of affiliated customers would have a material adverse effect on the Company.
Competition
Insurance Underwriting operates in a highly competitive environment. Our core non-standard automobile offerings are policies at the minimum prescribed limits in each state produced entirely through our independent agents. We compete with large national insurance companies and smaller regional insurance companies which produce through independent agents. We also compete with insurance companies which sell policies directly to their customers.
Large national insurance companies and direct underwriters typically operate in standard lines of personal automobile and property insurance in addition to non-standard lines and generally bring with them increased name recognition obtained through extensive media advertising, loyalty of the customer base to the insurer rather than to an independent agency and, potentially, reduced policy acquisition costs and increased customer retention.
From time to time, the non-standard automobile market attracts competition from new entrants. In many cases, these entrants are looking for growth and, as a result, price their insurance below the rates that we believe provide an acceptable return for the related risk. We firmly believe that it is not in our best interest to compete solely on price; consequently, we are willing to experience a loss of market share during periods of intense price competition or soft market conditions. During the last few years, the Company carried out a detailed review of its premium adequacy in the territories in which it operates and implemented steps to terminate business where premium adequacy was unlikely to be achieved within an acceptable period of time.
In order to stay competitive while striving to generate an economic rate of return, we compete on a number of factors such as distribution strength and breadth, premium adequacy, agency relationships, ease of doing business and market reputation. Ultimately, we believe that our ability to compete successfully in our industry is based, among other things, on our ability to:
• | identify markets that are most likely to produce an underwriting profit; |
• | operate with a disciplined underwriting approach; |
7 | ||
KINGSWAY FINANCIAL SERVICES INC. | ||
• | practice prudent claims management; |
• | establish an appropriate provision for unpaid loss and loss adjustment expenses; |
• | strive for cost containment and the economics of shared support functions where deemed appropriate; and |
• | provide our independent agents and brokers with competitive commissions, an ease of doing business and additional value-added products and services for them and their customers. |
Insurance Underwriting generally does not compete on the basis of ratings assigned by insurance rating agencies. Previously, the Company's insurance subsidiaries were assigned ratings by A.M. Best. In October, 2011 the Company had the A.M. Best ratings for all of its insurance subsidiaries withdrawn. As a result, the Company's insurance subsidiaries are currently unrated.
Underwriting
Our underwriting philosophy stresses receiving an adequate premium and spread of risks for the business we accept. We regularly monitor premium adequacy by territory, line of business and agency and take actions as necessary. Actions include, but are not limited to, tightening underwriting requirements, filing for rate increases, terminating underperforming programs and agents, non-renewing policies (where permitted) and other administrative changes. Typically, we do not reduce our premiums when competitors underwrite at premium rates that we believe are below acceptable levels. Instead, we focus on maintaining our premium per risk rather than writing a large number of risks at premiums that we believe would be inadequate and thus unprofitable. As a result, our premium volumes may be negatively impacted during a soft market.
Claims Management
Claims management is the process by which Insurance Underwriting determines the validity and amount of a claim. We believe that claims management is fundamental to our operating results. With respect to Insurance Underwriting, proper and efficient claims management has a direct effect on the operating profit or loss which has been retained related to the ultimate loss and loss adjustment expenses incurred on the underlying policies.
Insurance Underwriting primarily employs its own claims adjusters who are responsible for investigating and settling claims. Our goal is to settle claims fairly for the benefit of our insureds in a manner that is consistent with the insurance policy language and our regulatory and legal obligations.
In addition to claims adjusters, our operating subsidiaries also employ appraisers, special investigators and salvage, subrogation and other personnel who are responsible for helping us reduce the net cost of claim-handling, particularly with respect to identifying instances of fraud. We also outsource certain of these activities when we believe outsourcing represents a more efficient approach to performing these activities. We aggressively combat fraud and have processes in place to investigate suspicious claim activity. We may also engage independent appraisers, private investigators, various experts and legal counsel to assist us in adjusting claims. When necessary, we defend litigation against our insureds generally by retaining outside legal counsel.
INSURANCE SERVICES SEGMENT
Insurance Services includes the following subsidiaries of the Company: IWS Acquisition Corporation ("IWS") and Trinity Warranty Solutions LLC ("Trinity"), (collectively, "Insurance Services").
IWS is a licensed motor vehicle service agreement company and is a provider of after-market vehicle protection services distributed by credit unions in 23 states to their members.
Trinity is a provider of warranty products and maintenance support to consumers and businesses in the heating, ventilation, air conditioning ("HVAC"), standby generator, commercial LED lighting and refrigeration industries. Trinity distributes its warranty products through original equipment manufacturers, HVAC distributors and commercial and residential contractors. Trinity distributes its maintenance support direct through corporate owners of retail spaces throughout the United States.
Effective April 1, 2015, the Company closed on the sale of its wholly owned subsidiary, Assigned Risk Solutions Ltd. ("ARS"). As a result, ARS has been classified as discontinued operations and the results of their operations are reported separately for all periods presented. Prior to the transaction, ARS was included in the Insurance Services segment. As a result of classifying ARS as a discontinued operation, all segmented information has been restated to exclude ARS from the Insurance Services segment. Further information is contained in Note 6, "Disposition, Deconsolidations and Discontinued Operations," to the Consolidated Financial Statements.
8 | ||
KINGSWAY FINANCIAL SERVICES INC. | ||
Insurance Services Products
IWS markets and administers vehicle service agreements and related products for new and used automobiles throughout the United States. A vehicle service agreement is an agreement between IWS and the vehicle purchaser under which IWS agrees to replace or repair, for a specific term, designated vehicle parts in the event of a mechanical breakdown. IWS serves as the administrator on all contracts it originates. Vehicle service agreements supplement, or are in lieu of, manufacturers' warranties and provide a variety of extended coverage options. Vehicle service agreements typically range from three months to seven years and/or 3,000 miles to 100,000 miles. The cost of the vehicle service agreement is a function of the contract term, coverage limits and type of vehicle.
In addition to marketing vehicle service agreements, IWS also brokers a guaranteed asset protection product ("GAP") through its distribution channel. GAP generally covers a consumer's out-of-pocket amount, related to an automobile loan or lease, if the vehicle is stolen or damaged beyond repair. IWS earns a commission when a consumer purchases a GAP certificate but does not take on any insurance risk.
Trinity is a provider of HVAC, standby generator, commercial LED lighting and refrigeration warranty products and provider of equipment breakdown and maintenance support services to companies across the United States. As a provider of warranty products, Trinity markets and administers product warranty contracts for certain new and used products in the HVAC, standby generator, commercial LED lighting and refrigeration industries throughout the United States. A warranty contract is an agreement between Trinity and the purchaser of such HVAC, standby generator, commercial LED lighting and refrigeration equipment to replace or repair, for a specific term, designated parts in the event of a mechanical breakdown. As a provider of equipment breakdown and maintenance support services, Trinity acts as a single point of contact to its clients for both certain equipment breakdowns and scheduled maintenance of equipment. Trinity will provide such repair and breakdown services by contracting with certain HVAC providers.
Marketing and Distribution
IWS markets its products primarily through credit unions. IWS enters into an exclusive agreement with each credit union whereby the credit union receives a stipulated access fee for each vehicle service agreement issued to its members. The credit unions are served by IWS employee representatives located throughout the United States in close geographical proximity to the credit unions they serve. IWS distributes and markets its products in 23 states.
Trinity directly markets and distributes its warranty products to manufacturers, distributors and installers of HVAC, standby generator, commercial LED lighting and refrigeration equipment. As a provider of equipment breakdown and maintenance support, Trinity directly markets and distributes its product through its clients, which are primarily companies that directly own and operate numerous locations across the United States.
No customer or group of affiliated customers accounts for 10% or more of Insurance Service's revenues, and no loss of a customer or group of affiliated customers would have a material adverse effect on the Company.
Competition
IWS focuses exclusively on the automotive finance market with its core vehicle service agreement and related product offerings, while much of its competition in the credit union channel has a less targeted product approach. IWS' typical competitor takes a generalist approach to market by providing credit unions with a variety of different product offerings. They are thus unable to deliver specialty expertise on par with IWS and do not give vehicle service agreement products the attention they require for healthy profitability and strong risk management.
Trinity operates in an environment with few market competitors. Trinity competes on two important facets: its belief that it provides superior customer service relative to its competitors and its ability, through the support of its insurance company partners, to provide warranty solutions to a wider range of HVAC, standby generator, commercial LED lighting and refrigeration equipment than that of its competitors.
Claims Management
Claims management is the process by which Insurance Services determines the validity and amount of a claim. We believe that claims management is fundamental to our operating results. The individual operating subsidiaries in Insurance Services primarily employ their own claims adjusters who are responsible for investigating and settling claims. Our goal is to settle claims fairly for the benefit of our insureds and the insureds of our insurance company partners in a manner that is consistent with the insurance policy language and our regulatory and legal obligations.
9 | ||
KINGSWAY FINANCIAL SERVICES INC. | ||
IWS effectively and efficiently manages claims by utilizing in-house expertise and information systems. IWS employs an experienced claims staff comprised of Automotive Service Excellence certified mechanics, knowledgeable in all aspects of vehicle repairs and potential claims. Additionally, IWS owns its own proprietary database of historical claims data dating back over twenty years. Management analyzes this database to drive real-time pricing adjustments and strategic decision-making.
Trinity claims on warranty products are managed by the insurance companies with which Trinity partners. Trinity may, at times, act as a third-party administrator of such claims; however, at no time does Trinity bear the loss of claims on warranty products.
LEASED REAL ESTATE SEGMENT
Leased Real Estate includes the Company's subsidiary, CMC, which was acquired on July 14, 2016. CMC owns, through an indirect wholly owned subsidiary, the Real Property, which is subject to a long-term triple net lease agreement. The Real Property is also subject to the Mortgage. All cash rental income generated by the Real Property is applied to make principal and interest payments on the Mortgage.
PRICING AND PRODUCT MANAGEMENT
Responsibility for pricing and product management rests with the Company's individual operating subsidiaries in each of Insurance Underwriting and Insurance Services. Typically, teams comprised of pricing actuaries, product managers and business development managers work together by territory to develop policy forms and language, rating structures, regulatory filings and new product ideas. Data solutions and claims groups track loss performance on a monthly basis so as to alert the operating subsidiaries to the potential need to adjust forms or rates.
UNPAID LOSS AND LOSS ADJUSTMENT EXPENSES
Kingsway records a provision for its unpaid losses that have occurred as of a given evaluation date as well as for its estimated liability for loss adjustment expenses. The provision for unpaid losses includes a provision, commonly referred to as case reserves, for losses related to reported claims as well as a provision for losses related to claims incurred but not reported ("IBNR"). The provision for loss adjustment expenses represents the cost to investigate and settle claims.
The provision for unpaid loss and loss adjustment expenses does not represent an exact calculation of the liability but instead represents management's best estimate at a given accounting date, utilizing actuarial and statistical procedures, of the undiscounted estimates of the ultimate net cost of all unpaid loss and loss adjustment expenses. Management continually reviews its estimates and adjusts its provision as new information becomes available. In establishing the provision for unpaid loss and loss adjustment expenses, the Company also takes into account estimated recoveries, reinsurance, salvage and subrogation.
Any adjustments to the provision for unpaid loss and loss adjustment expenses are reflected in the consolidated statements of operations in the periods in which they become known, and the adjustments are accounted for as changes in estimates. Even after such adjustments, ultimate liability or recovery may exceed or be less than the revised provisions. An adjustment that increases the provision for unpaid loss and loss adjustment expenses is known as an unfavorable development or a deficiency and will reduce net income while an adjustment that decreases the provision is known as a favorable development or a redundancy and will increase net income.
Process for Establishing the Provision for Unpaid Loss and Loss Adjustment Expenses
The process for establishing the provision for unpaid loss and loss adjustment expenses reflects the uncertainties and significant judgmental factors inherent in predicting future results of both reported and IBNR claims. As such, the process is inherently complex and imprecise and estimates are constantly refined. The process of establishing the provision for unpaid loss and loss adjustment expenses relies on the judgment and opinions of a large number of individuals, including the opinions of the Company's actuaries.
Factors affecting the provision for unpaid loss and loss adjustment expenses include the continually evolving and changing regulatory and legal environment, actuarial studies, professional experience and expertise of the Company's claims departments' personnel and independent adjusters retained to handle individual claims, the quality of the data used for projection purposes, existing claims management practices including claims handling and settlement practices, the effect of inflationary trends on future loss settlement costs, court decisions, economic conditions and public attitudes.
The process for establishing the provision for loss and loss adjustment expenses begins with the collection and analysis of claim data. Data on individual reported claims, both current and historical, including paid amounts and individual claim adjuster estimates, are grouped by common characteristics and evaluated by actuaries in their analyses of ultimate claim liabilities by product line. Such data is occasionally supplemented with external data as available and when appropriate. The process of analyzing the provision is undertaken on a regular basis, generally quarterly, in light of continually updated information.
10 | ||
KINGSWAY FINANCIAL SERVICES INC. | ||
Multiple estimation methods are available for the analysis of the provision for loss and loss adjustment expenses. Each estimation method has its own set of assumption variables and its own advantages and disadvantages, with no single estimation method being better than the others in all situations and no one set of assumption variables being meaningful for all product line components. The relative strengths and weaknesses of the particular estimation methods when applied to a particular group of claims can also change over time; therefore, the actual choice of estimation method can change with each evaluation. The estimation methods chosen are those that are believed to produce the most reliable indication at that particular evaluation date.
In most cases, multiple estimation methods will be valid for the evaluation of the provision for loss and loss adjustment expenses. This will result in a range of reasonable estimates for the provision. Reported values found to be closer to the endpoints of a range of reasonable estimates are subject to further detailed reviews. These reviews may substantiate the validity of management's recorded provision or lead to a change in the reported provision.
The exact boundary points of these ranges are more qualitative than quantitative in nature, as no clear line of demarcation exists to determine when the set of underlying assumptions for an estimation method switches from being reasonable to unreasonable. As a result, the Company does not believe that the endpoints of these ranges are or would be comparable across companies. In addition, potential interactions among the different estimation assumptions for different product lines make the aggregation of individual ranges a highly judgmental and inexact process.
A basic premise in most actuarial analyses is that past patterns demonstrated in the data will repeat themselves in the future, absent a material change in the associated risk factors discussed below. To the extent a material change affecting the ultimate provision for loss and loss adjustment expenses is known, such change is quantified to the extent possible through an analysis of internal company data and, if available and when appropriate, external data. Such a measurement is specific to the facts and circumstances of the particular claim portfolio and the known change being evaluated. Significant structural changes to the available data, product mix or organization can materially impact the provision for loss and loss adjustment expenses.
Informed judgment is applied throughout the process. This includes the application of various individual experiences and expertise to multiple sets of data and analyses. In addition to actuaries, experts involved with the reserving process also include underwriting and claims personnel and lawyers, as well as other company management. As a result, management may have to consider varying individual viewpoints when establishing the provision for loss and loss adjustment expenses.
Variables Influencing the Provision for Unpaid Loss and Loss Adjustment Expenses
The variables discussed above have different impacts on estimation uncertainty for a given product line, depending on the length of the claim tail, the reporting lag, the impact of individual claims and the complexity of the claim process for a given product line.
Property and casualty insurance policies are either written on a claims-made or occurrence basis. Claims-made policies generally cover, subject to requirements in individual policies, claims reported during the policy period. Policies that are written on an occurrence basis require that the insured demonstrate that a loss occurred in the policy period, even if the insured reports the loss in a later policy period.
Product lines are generally classifiable as either long-tail or short-tail, based on the average length of time between the event triggering claims under a policy and the final resolution of those claims. Short-tail claims are reported and settled quickly, resulting in less estimation variability. The longer the time before final claim resolution, the greater the exposure to estimation risks and hence the greater the estimation uncertainty.
A major component of the claim tail is the reporting lag. The reporting lag, which is the time between the event triggering a claim and the reporting of the claim to the insurer, makes estimating IBNR inherently more uncertain. In addition, the greater the reporting lag, the greater the proportion of IBNR to the total provision for the product line. Writing new products with material reporting lags can result in adding several years' worth of IBNR claim exposure before the reporting lag exposure becomes clearly observable, thereby increasing the risk associated with pricing and reserving such products.
For some lines, the impact of large individual claims or loss events, such as catastrophes, can be material to the analysis. These lines are generally referred to as being "low frequency/high severity," while lines without this "large claim" sensitivity are referred to as "high frequency/low severity." The provision for low frequency/high severity lines can be sensitive to the impact of a small number of potentially large claims or a small number of significant loss events, such as catastrophes. As a result, the role of judgment is much greater for these provisions. In contrast, for high frequency/low severity lines, the impact of individual claims is relatively minor and the range of reasonable provision estimates is narrower and more stable.
11 | ||
KINGSWAY FINANCIAL SERVICES INC. | ||
Claim complexity can also greatly affect the estimation process by impacting the number of assumptions needed to produce the estimate, the potential stability of the underlying data and claim process, and the ability to gain an understanding of the data. Product lines with greater claim complexity have inherently greater estimation uncertainty.
Actuaries have to exercise a considerable degree of judgment in the evaluation of all these factors in their analysis of the provision for loss and loss adjustment expenses. The human element in the application of actuarial judgment is unavoidable when faced with material uncertainty. Different actuaries may choose different assumptions when faced with such uncertainty, based on their individual backgrounds, professional experiences and areas of focus. Hence, the estimates selected by the various actuaries may differ materially from each other.
Lastly, significant structural changes to the available data, product mix or organization can also materially impact the process for establishing the provision for loss and loss adjustment expenses.
Property and Casualty Insurance
The Company's insurance policies are generally written on an occurrence basis. Non-standard automobile includes both short and long-tail coverages. The payments that are made quickly typically pertain to auto physical damage and property damage claims. The payments that take longer to finalize and are more difficult to estimate relate to bodily injury claims. Reporting lags are relatively short, and the claim settlement process for personal automobile liability generally is the least complex of the liability products. Given that our core non-standard automobile offerings are policies at the minimum prescribed limits in each state, our non-standard automobile business is generally viewed as a high frequency, low severity business.
Examples of common risk factors that could change and, thus, affect the provision for loss and loss adjustment expenses for the non-standard automobile product line include, but are not limited to:
• | trends in jury awards; |
• | changes in the underlying court system and its philosophy; |
• | changes in case law; |
• | litigation trends; |
• | frequency of claims with payment capped by policy limits; |
• | change in average severity of accidents, or proportion of severe accidents; |
• | subrogation opportunities; |
• | degree of patient responsiveness to treatment; |
• | changes in claim handling philosophies; |
• | effectiveness of no-fault laws; |
• | frequency of visits to health providers; |
• | number of medical procedures given during visits to health providers; |
• | types of health providers used; |
• | types of medical treatments received; |
• | changes in cost of medical treatments; |
• | changes in policy provisions (e.g., deductibles, policy limits, endorsements, etc.); |
• | changes in underwriting standards; and |
• | changes in the use of credit data for rating and underwriting. |
Rollforward of Property and Casualty Unpaid Loss and Loss Adjustment Expenses
Table 3 shows a rollforward of the provision for property and casualty unpaid loss and loss adjustment expenses, net of amounts recoverable from reinsurers. The effect on the Company's net loss (income) during the past three years due to changes in estimates
12 | ||
KINGSWAY FINANCIAL SERVICES INC. | ||
of prior year property and casualty unpaid loss and loss adjustment expenses is shown as the "prior years" contribution to incurred losses. The consolidated financial statements are presented on a calendar year basis for all data. Calendar year results reflect payments and re-estimation of the provision that have been recorded in the consolidated financial statements during the applicable reporting period without regard to the periods in which the original losses were incurred. Calendar year results do not change after the end of the applicable reporting period, even as new information develops.
TABLE 3 Rollforward of property and casualty unpaid loss and loss adjustment expenses
As of December 31 (in thousands of dollars)
2016 | 2015 | 2014 | |||||||
Balance at beginning of period, gross | 55,471 | 63,895 | 84,534 | ||||||
Less reinsurance recoverable related to property and casualty unpaid loss and loss adjustment expenses | 1,207 | 3,203 | 7,942 | ||||||
Balance at beginning of period, net | 54,264 | 60,692 | 76,592 | ||||||
Incurred related to: | |||||||||
Current year | 96,289 | 86,439 | 84,577 | ||||||
Prior years | 8,095 | 616 | (5,123 | ) | |||||
Paid related to: | |||||||||
Current year | (62,978 | ) | (54,415 | ) | (52,521 | ) | |||
Prior years | (42,556 | ) | (39,068 | ) | (42,428 | ) | |||
Disposal of unpaid loss and loss adjustment expenses related to PIH | — | — | (405 | ) | |||||
Balance at end of period, net | 53,114 | 54,264 | 60,692 | ||||||
Plus reinsurance recoverable related to property and casualty unpaid loss and loss adjustment expenses | 681 | 1,207 | 3,203 | ||||||
Balance at end of period, gross | 53,795 | 55,471 | 63,895 | ||||||
INVESTMENTS
We manage our investments to support the liabilities of our insurance operations, preserve capital, maintain adequate liquidity and maximize after-tax investment returns within acceptable risks. The fixed maturities portfolios are managed by a third-party firm and are comprised predominantly of high-quality fixed maturities with relatively short durations. Equity, limited liability and other investments are managed by a team of employees and advisors dedicated to the identification of investment opportunities that offer asymmetric risk/reward potential with a margin of safety supported by private market values. The Investment Committee of the Board of Directors is responsible for monitoring the performance of our investments and compliance with the Company's investment policies and guidelines, which it reviews annually. We are also subject to the applicable state regulations that prescribe the type, quality and concentration of investments that individual insurance companies can make.
For further descriptions of the Company's investments, see our disclosures under the headings "Net Investment Income," "Net Realized Gains," "Investments," "Liquidity and Capital Resources" and "Critical Accounting Estimates and Assumptions" in the MD&A and Note 7, "Investments," and Note 26, "Fair Value of Financial Instruments," to the Consolidated Financial Statements.
REINSURANCE
For most of the non-standard automobile business that we write, our exposure is generally limited to the minimum statutory liability limits, which are typically not greater than $50,000 per occurrence, depending on the state. We have from time to time, though, entered into different types of reinsurance arrangements as part of the management of our non-standard automobile business. For 2016 and 2015, we entered into an excess of loss reinsurance arrangement to reduce our exposure to losses related to certain catastrophic events which may occur in any of the states in which we write non-standard automobile business. Upon the expiration in January, 2017 of this excess of loss reinsurance arrangement, we concluded not to renew it.
Reinsurance ceded does not relieve us of our ultimate liability to our insureds in the event that any reinsurer is unable to meet its obligations under its reinsurance contracts. We therefore enter into reinsurance contracts with only those reinsurers which we believe have sufficient financial resources to meet their obligations to us. Reinsurance treaties generally have terms of one year and, as a result, are subject to renegotiation annually.
13 | ||
KINGSWAY FINANCIAL SERVICES INC. | ||
Because our reinsurance recoverable is generally unsecured, we regularly evaluate the financial condition of our reinsurers and monitor the concentrations of credit risk to minimize our exposure to significant losses as a result of the insolvency of a reinsurer. We believe that the amounts we have recorded as reinsurance recoverable are appropriately established. Estimating our reinsurance recoverable, however, is subject to various uncertainties and the amounts ultimately recoverable may vary from amounts currently recorded. Estimating amounts of reinsurance recoverable is also impacted by the uncertainties involved in the establishment of provisions for unpaid loss and loss adjustment expenses. As our underlying provision develops, the amounts ultimately recoverable may vary from amounts currently recorded.
As of December 31, 2016, we had $0.8 million recoverable from third-party reinsurers. As shown in Table 4 below, at December 31, 2016, 100.0% of the amounts recoverable from third-party reinsurers were due from reinsurers that were rated "A-" or higher by the A.M. Best rating service. We regularly evaluate our reinsurers and their respective amounts recoverable, and an allowance for uncollectible reinsurance is provided, if needed.
TABLE 4 Composition of amounts due from reinsurers by A.M. Best rating
As of December 31, 2016
A+ | 53.0 | % |
A- | 47.0 | % |
Total | 100.0 | % |
DEBT
Debt consists of the following instruments:
TABLE 5 Debt
As of December 31 (in thousands of dollars)
2016 | 2015 | |||||||
Principal | Fair Value | Principal | Fair Value | |||||
Note payable | 178,781 | 190,074 | — | — | ||||
Subordinated debt | 90,500 | 43,619 | 90,500 | 39,898 | ||||
Total | 269,281 | 233,693 | 90,500 | 39,898 | ||||
Further information regarding our debt is discussed within the "Debt" section of MD&A as well as in Note 15, "Debt," to the Consolidated Financial Statements.
REGULATORY ENVIRONMENT
Our insurance subsidiaries are subject to extensive regulation in the states in which they do business. Such regulation pertains to a variety of matters, including, but not limited to, policy forms, premium rate plans, licensing of agents, licenses to transact business, trade practices, claims practices, investments, payment of dividends, transactions with affiliates and solvency. The majority of our insurance is written in states requiring prior approval by regulators before proposed rates for property and casualty policies may be implemented.
Our U.S. insurance subsidiaries are subject to the insurance holding company laws in the jurisdictions in which they conduct business. These regulations require that each U.S insurance company in the holding company system register with the insurance department of its state of domicile and furnish information concerning the operations of companies in the holding company system which may materially affect the operations, management or financial condition of the insurers in the holding company domiciled in that state. We have U.S. insurance subsidiaries that are organized and domiciled under the insurance statutes of Illinois, Minnesota and Florida. The insurance laws in each of these states similarly provide that all transactions among members of a holding company system be done at arm’s length and be shown to be fair and reasonable to the regulated insurer. Transactions between insurance company subsidiaries and their parents and affiliates typically must be disclosed to the state regulators, and any material or extraordinary transaction requires prior approval of the applicable state insurance regulator. A change of control of a domestic insurer or of any controlling person requires the prior approval of the state insurance regulator. In general, any person who acquires 10% or more of the outstanding voting securities of the insurer or its parent company is presumed to have acquired control of the domestic insurer. To the best of our knowledge, we are in compliance with the regulations discussed above.
14 | ||
KINGSWAY FINANCIAL SERVICES INC. | ||
The liquidity of the holding company is managed separately from its subsidiaries. Actions available to the holding company to raise liquidity in order to meet its obligations include the sale of passive investments; sale of subsidiaries; issuance of debt or equity securities; and giving notice to its Trust Preferred trustees of its intention to exercise its voluntary right to defer interest payments for up to 20 quarters, which right the Company previously exercised during the period from the first quarter of 2011 through the fourth quarter of 2015.
Receipt of dividends from the Insurance Underwriting subsidiaries is not generally considered a source of liquidity for the holding company. The insurance subsidiaries require regulatory approval for the return of capital and, in certain circumstances, prior to the payment of dividends. At December 31, 2016, the U.S. insurance subsidiaries of the Company were restricted from making any dividend payments to the holding company without regulatory approval pursuant to the domiciliary state insurance regulations.
Receipt of dividends from the Leased Real Estate segment is not generally considered a source of liquidity for the holding company. All cash rental income generated by the Real Property is applied to make principal and interest payments on the Mortgage. As a result, the Company does not expect any positive cash flow to be available from the Leased Real Estate segment to help the Company meet its holding company obligations until the occurrence of one of the three events defined in the management services agreement entered into at the time of the acquisition of CMC. There can be no assurance as to the timing of the occurrence, or the resulting outcome, from one of these events. Refer to the "Liquidity and Capital Resources" section of MD&A for further discussion.
Insurance companies are required to report their financial condition and results of operation in accordance with statutory accounting principles prescribed or permitted by state insurance regulators in conjunction with the National Association of Insurance Commissioners ("NAIC"). State insurance regulators also prescribe the form and content of statutory financial statements, perform periodic financial examinations of insurers, set minimum reserve and loss ratio requirements, establish standards for the types and amounts of investments and require minimum capital and surplus levels. Such statutory capital and surplus requirements reflect risk-based capital ("RBC") standards promulgated by the NAIC. These RBC standards are intended to assess the level of risk inherent in an insurance company's business and consider items such as asset risk, credit risk, underwriting risk and other business risks relevant to its operations. In accordance with RBC formulas, an insurance company's RBC requirements are calculated and compared to its total adjusted capital, as defined by the NAIC, to determine whether regulatory intervention is warranted. In general, insurers reporting surplus as regards policyholders below 200% of the authorized control level, as defined by the NAIC, at December 31 are subject to varying levels of regulatory action, including discontinuation of operations. As of December 31, 2016, surplus as regards policyholders reported by each of our insurance subsidiaries exceeded the 200% threshold.
Our insurance subsidiaries are required under the guaranty fund laws of most states in which they transact business to pay assessments up to prescribed limits to fund policyholder losses or liabilities of insolvent insurance companies. Our insurance subsidiaries also are required to participate in various involuntary pools or assigned risk pools. In most states, the involuntary pool participation of our insurance subsidiaries is in proportion to their voluntary writings of related lines of business in such states.
We operate under licenses issued by various state insurance authorities. These licenses govern, among other things, the types of insurance coverage and agency and claim services that we may offer consumers in these states. Such licenses typically are issued only after we file an appropriate application and satisfy prescribed criteria. We must apply for and obtain the appropriate new licenses before we can implement any plan to expand into a new state or offer a new line of insurance or other new product that requires separate licensing.
The insurance laws of most states in which our insurance subsidiaries operate require insurance companies to file insurance rate schedules and insurance policy forms for review and approval. State insurance regulators have broad discretion in judging whether our rates are adequate, not excessive and not unfairly discriminatory and whether our policy forms comply with law. The speed at which we can change our rates depends, in part, on the method by which the applicable state's rating laws are administered. Generally, state insurance regulators have the authority to disapprove our rates or request changes in our rates. In addition, certain states in which we operate have laws and regulations that limit an automobile insurance company's ability to cancel or not renew policies.
We are subject to state laws and regulations that require diversification of our investment portfolios and that limit the amount of investments in certain categories. Failure to comply with these laws and regulations would cause non-conforming investments to be treated as non-admitted assets for purposes of measuring statutory surplus and, in some instances, would require divestiture.
The state insurance departments that have jurisdiction over our insurance company subsidiaries may conduct on-site visits and examinations of the insurance companies' affairs, especially as to their financial condition, ability to fulfill their obligations to policyholders, market conduct, claims practices and compliance with other laws and applicable regulations. Typically, these examinations are conducted every three to five years. In addition, if circumstances dictate, regulators are authorized to conduct special or target examinations of insurance companies to address particular concerns or issues. The results of these examinations
15 | ||
KINGSWAY FINANCIAL SERVICES INC. | ||
can give rise to regulatory orders requiring remedial, injunctive or other corrective action on the part of the company that is the subject of the examination or the assessment of fines or other penalties against that company.
The Gramm-Leach-Bliley Act protects consumers from the unauthorized dissemination of certain personal information. The majority of states have implemented additional regulations to address privacy issues. These laws and regulations apply to all financial institutions, including insurance companies, and require us to maintain appropriate procedures for managing and protecting certain personal information of our customers and to fully disclose our privacy practices to our customers. We may also be exposed to future privacy laws and regulations, which could impose additional costs and impact our results of operations or financial condition.
In July 2010, the Dodd-Frank Act (the "DFA") was enacted into law. Among other things, the DFA forms within the Treasury Department a Federal Insurance Office ("FIO") that is charged with monitoring all aspects of the insurance industry, gathering data, and conducting a study on methods to modernize and improve the insurance regulatory system in the United States. FIO's report, which was delivered to Congress in 2013, concluded that a hybrid approach to regulation, involving a combination of state and federal government action, could improve the U.S. insurance system by attaining uniformity, efficiency and consistency, particularly with respect to solvency and market conduct regulation. A hybrid approach was also recommended to address the perceived need for uniform supervision of insurance companies with national and global activities. FIO established the Federal Advisory Committee on Insurance ("FACI") whose mission is to provide recommendations to FIO on issues it monitors for Congress. While the NAIC continues to promote the strengths of the U.S. state-based insurance regulatory system, both FIO/FACI and international standard setting authorities such as the International Association of Insurance Supervisors are actively seeking a role in shaping the future of the U.S. insurance regulatory framework.
Title V of the Wall Street Reform Act instructs the FIO Director to submit an update to the report that FIO submitted to Congress in 2013 describing the impact of Part II of the Nonadmitted and Reinsurance Reform Act of 2010 ("NRRA") on the ability of state regulators to access reinsurance information for regulated entities in their jurisdictions. The update, submitted by FIO in May 2015, concludes that Part II of NRRA has not had an adverse impact on the ability of state regulators to access reinsurance information from regulated companies. It is not yet known whether or how these organizations' recommendations might result in changes to the current state-based system of insurance industry regulation or ultimately impact Kingsway’s operations.
Vehicle service agreements are regulated in all states in the United States, and IWS is subject to these regulations. Most states utilize the approach of the Uniform Service Contract Act which was adopted by the NAIC in the early 1990's. Under that scheme, states regulate vehicle service contract companies by requiring them annually to file documentation, together with a copy of the contract of insurance covering their liability under the service contracts, which complies with the particular state's regulatory requirements. IWS is in compliance with the regulations of each state in which it sells vehicle service agreements.
Certain, but not all, states regulate the sale of HVAC and equipment warranty contracts. Trinity is licensed as a service contract provider in those states where it is required.
EMPLOYEES
At December 31, 2016, we employed 299 personnel supporting our continuing operations, of which 292 were full-time employees.
ACCESS TO REPORTS
Our Annual Report on Form 10-K, quarterly reports on Form 10-Q, current reports on Form 8-K and amendments to those reports filed or furnished pursuant to Section 13(a) or 15(d) of the Securities Exchange Act of 1934 are made available free of charge through our website at www.kingsway-financial.com as soon as reasonably practicable after such material is electronically filed with, or furnished to, the U.S. Securities and Exchange Commission ("SEC").
Item 1A. Risk Factors
Most issuers, including Kingsway, are exposed to numerous risk factors that could cause actual results to differ materially from recent results or anticipated future results. The risks and uncertainties described below are those specific to the Company which we currently believe have the potential to be material, but they may not be the only ones we face. If any of the following risks, or any other risks and uncertainties that we have not yet identified or that we currently consider not to be material, actually occur or become material risks, our business, prospects, financial condition, results of operations and cash flows could be materially and adversely affected. Investors are advised to consider these factors along with the other information included in this 2016 Annual Report and to consult any further disclosures Kingsway makes on related subjects in its filings with the SEC.
16 | ||
KINGSWAY FINANCIAL SERVICES INC. | ||
FINANCIAL RISK
Kingsway is a holding company, and its operating insurance subsidiaries are subject to dividend restrictions and are required to maintain minimum capital and surplus levels, which could limit our operations and have a material adverse effect on our financial condition.
Kingsway is a holding company with assets consisting primarily of the capital stock of its subsidiaries. Our operations are and will continue to be limited by the earnings of our subsidiaries and their ability to pay dividends to us. The payment of dividends by our operating insurance subsidiaries is subject to various statutory and regulatory restrictions imposed by the insurance laws of the domiciliary jurisdiction, including Barbados, of each such subsidiary. As a result of operating losses recorded in recent years, at this time none of our U.S. insurance subsidiaries is able to declare and pay a dividend to the holding company without prior regulatory approval. The Company expects these restrictions to continue. In the case of other subsidiaries not currently subject to these restrictions, these subsidiaries may be limited in their ability to make dividend payments or advance funds to Kingsway in the future because of the need to support their own capital levels. The inability of our subsidiaries to pay dividends to us could have a material adverse effect on our financial condition.
See the "Liquidity and Capital Resources" section of MD&A for a detailed description of the liquidity requirements of the holding company and the regulatory capital requirements of the operating insurance subsidiaries. No assurances can be given that the operating insurance subsidiaries will be able to maintain compliance with these regulatory capital requirements.
We have substantial outstanding recourse debt, which could adversely affect our ability to obtain financing in the future, react to changes in our business and satisfy our obligations.
As of December 31, 2016, we had $90.5 million principal value of outstanding recourse subordinated debt, in the form of trust preferred debt instruments, with redemption dates beginning in December, 2032. Because of our substantial outstanding recourse debt:
• | our ability to engage in acquisitions without raising additional equity or obtaining additional debt financing could be limited; |
• | our ability to obtain additional financing for working capital, capital expenditures, acquisitions, debt service requirements or general corporate purposes and our ability to satisfy our obligations with respect to our debt may be impaired in the future; |
• | a large portion of our cash flow must be dedicated to the payment of principal and interest on our debt, thereby reducing the funds available to us for other purposes; |
• | we are exposed to the risk of increased interest rates because our outstanding subordinated debt, representing $90.5 million of principal value, bears interest directly related to the London interbank offered interest rate for three-month U.S. dollar deposits ("LIBOR"); |
• | it may be more difficult for us to satisfy our obligations to our creditors, resulting in possible defaults on, and acceleration of, such debt; |
• | we may be more vulnerable to general adverse economic and industry conditions; |
• | we may be at a competitive disadvantage compared to our competitors with proportionately less debt or with comparable debt on more favorable terms and, as a result, they may be better positioned to withstand economic downturns; |
• | our ability to refinance debt may be limited or the associated costs may increase; |
• | our flexibility to adjust to changing market conditions and ability to withstand competitive pressures could be limited; and |
• | we may be prevented from carrying out capital spending that is, among other things, necessary or important to our growth strategy and efforts to improve the operating results of our businesses. |
Increases in interest rates would increase the cost of servicing our debt and could adversely affect our results of operation.
Our outstanding recourse debt of $90.5 million principal value bears interest directly related to LIBOR. As a result, increases in LIBOR would increase the cost of servicing our debt and could adversely affect our results of operations. As of December 31, 2016, each one hundred basis point increase in LIBOR would result in an approximately $0.9 million increase in our annual interest expense.
Our operations are restricted by the terms of our debt indentures, which could limit our ability to plan for or react to market conditions or meet our capital needs.
Our debt indentures contain numerous covenants that may limit our ability, among other things, to make particular types of restricted payments and pay dividends or redeem capital stock. The covenants under our debt agreements could limit our ability to plan for or react to market conditions or to meet our capital needs. No assurances can be given that we will be able to maintain compliance with these covenants.
17 | ||
KINGSWAY FINANCIAL SERVICES INC. | ||
If we are not able to comply with the covenants and other requirements contained in the debt indentures, an event of default under the relevant debt instrument could occur. If an event of default does occur, it could trigger a default under our other debt instruments, and the holders of the defaulted debt instrument could declare amounts outstanding with respect to such debt to become immediately due and payable. Upon such an event, our assets and cash flow may not be sufficient to fully repay borrowings under our outstanding debt instruments. In addition, such a repayment under an event of default could adversely affect our liquidity and force us to sell assets to repay borrowings.
The Investment Committee of the Board of Directors closely monitors the debt and capital position and, from time to time, recommends capital initiatives based upon the circumstances of the Company.
The Real Property is leased pursuant to a long-term triple net lease and the failure of the tenant to satisfy its obligations under the lease may adversely affect the condition of the Real Property or the results of the Leased Real Estate segment.
Because the Real Property is leased pursuant to a long-term triple net lease, we depend on the tenant to pay all insurance, taxes, utilities, common area maintenance charges, maintenance and repair expenses and to indemnify, defend and hold us harmless from and against various claims, litigation and liabilities arising in connection with its business, including any environmental liabilities. There can be no assurance that the tenant will have sufficient assets, income and access to financing to enable it to satisfy its payment obligations to us under the lease. The inability or unwillingness of the tenant to meet its rent obligations to CMC or to satisfy its other obligations, including indemnification obligations, could materially adversely affect the business, financial position or results of operations of our Leased Real Estate segment. Furthermore, the inability or unwillingness of the tenant to satisfy its other obligations under the lease, such as the payment of insurance, taxes and utilities, could materially and adversely affect the condition of the Real Property.
Our triple net lease agreement requires that the tenant maintain comprehensive liability and hazard insurance. However, there are certain types of losses (including losses arising from environmental conditions or of a catastrophic nature, such as earthquakes, hurricanes and floods) that may be uninsurable or not economically insurable. Insurance coverage may not be sufficient to pay the full current market value or current replacement cost of a loss. Inflation, changes in building codes and ordinances, environmental considerations, and other factors also might make it infeasible to use insurance proceeds to replace the property after such property has been damaged or destroyed. In addition, if we experience a loss that is uninsured or that exceeds policy coverage limits, we could lose the capital invested in the property as well as the anticipated future cash flows from the property.
We may not be able to realize our investment objectives, which could significantly reduce our earnings and liquidity.
We depend on our investments, particularly our fixed maturities, for a substantial portion of our liquidity. As of December 31, 2016, the fair value of our investments included $61.8 million of fixed maturities. Given the low interest rate environment which exists for fixed maturities, a significant increase in investment yields or an impairment of investments that we own could have a material adverse effect on our business, results of operations and financial condition by reducing the fair value of the investments we own, particularly if we were forced to liquidate investments at a loss. The low interest rate environment for fixed maturities which has existed for years also exposes us to reinvestment risk as these investments mature because the funds may be reinvested at rates lower than those of the maturing investments.
Our ability to achieve our investment objectives is affected by general economic conditions that are beyond our control. General economic conditions can adversely affect the markets for interest rate-sensitive instruments, including the extent and timing of investor participation in such markets, the level and volatility of interest rates and, consequently, the fair value of fixed maturities.
In addition, changing economic conditions can result in increased defaults by the issuers of investments that we own. Interest rates are highly sensitive to many factors, including monetary policies, domestic and international economic and political conditions and other factors beyond our control. General economic conditions, stock market conditions and many other factors can also adversely affect the securities markets and, consequently, the fair value of the investments we own. We may not be able to realize our investment objectives, which could reduce our profitability significantly.
A difficult economy generally may materially adversely affect our business, results of operations and financial condition.
An adverse change in market conditions leading to instability in the global credit markets presents additional risks and uncertainties for our business. In particular, deterioration in the public debt markets could lead to investment losses and an erosion of capital in our insurance company subsidiaries as a result of a reduction in the fair value of investments.
Depending on market conditions going forward, we could incur substantial realized and unrealized losses in future periods, which could have an adverse impact on our results of operations and financial condition. We could also experience a reduction in capital in our insurance subsidiaries below levels required by the regulators in the jurisdictions in which they operate. Certain trust accounts and letters of credit for the benefit of related companies and third-parties have been established with collateral on deposit
18 | ||
KINGSWAY FINANCIAL SERVICES INC. | ||
under the terms and conditions of the relevant trust and/or letter of credit agreements. The value of collateral could fall below the levels required under these agreements putting the subsidiary or subsidiaries in breach of the agreements.
Market volatility may also make it more difficult to value certain of our investments if trading becomes less frequent. Disruptions, uncertainty and volatility in the global credit markets may also impact our ability to obtain financing for future acquisitions. If financing is available, it may only be available at an unattractive cost of capital, which would decrease our profitability. There can be no assurance that market conditions will not deteriorate in the near future.
Financial disruption or a prolonged economic downturn may materially and adversely affect our business.
Worldwide financial markets have recently experienced periods of extraordinary disruption and volatility, resulting in heightened credit risk, reduced valuation of investments and decreased economic activity. Moreover, many companies have experienced reduced liquidity and uncertainty as to their ability to raise capital during such periods of market disruption and volatility. In the event that these conditions recur or result in a prolonged economic downturn, our results of operations, financial position and/or liquidity could be materially and adversely affected. These market conditions may affect the Company's ability to access debt and equity capital markets. In addition, as a result of recent financial events, we may face increased regulation. Many of the other risk factors discussed in this Risk Factors section identify risks that result from, or are exacerbated by, financial economic downturn. These include risks related to our investments portfolio, the competitive environment, adequacy of unpaid loss and loss adjustment expenses and regulatory developments.
We have provided a third-party guarantee which could materially adversely affect our business, results of operations and financial condition.
We provided an indemnity and hold harmless agreement to a third-party for customs bonds reinsured by Lincoln General Insurance Company ("Lincoln General") during the time Lincoln General was a subsidiary of ours. This agreement may require us to compensate the third-party if Lincoln General is unable to fulfill its obligations relating to the customs bonds. Our potential exposure under this agreement is not determinable, and no assurances can be given that we will not be required to perform under this agreement in a manner that has a material adverse effect on our business, results of operations and financial condition.
We have generated net operating loss carryforwards for U.S. income tax purposes, but our ability to use these net operating losses may be limited by our inability to generate future taxable income.
Our U.S. businesses have generated consolidated net operating loss carryforwards ("U.S. NOLs") for U.S. federal income tax purposes of approximately $859.5 million as of December 31, 2016. These U.S. NOLs can be available to reduce income taxes that might otherwise be incurred on future U.S. taxable income. The utilization of these U.S. NOLs would have a positive effect on our cash flow. Our operations, however, remain challenged, and there can be no assurance that we will generate the taxable income in the future necessary to utilize these U.S. NOLs and realize the positive cash flow benefit. Also, our U.S. NOLs have expiration dates. There can be no assurance that, if and when we generate taxable income in the future from operations or the sale of assets or businesses, we will generate such taxable income before our U.S. NOLs expire.
We have generated U.S. NOLs, but our ability to preserve and use these U.S. NOLs may be limited or impaired by future ownership changes.
Our ability to utilize the U.S. NOLs after an "ownership change" is subject to the rules of Section 382 of the U.S. Internal Revenue Code of 1986, as amended ("Section 382"). An ownership change occurs if, among other things, the shareholders (or specified groups of shareholders) who own or have owned, directly or indirectly, five (5%) percent or more of the value of our shares or are otherwise treated as five (5%) percent shareholders under Section 382 and the regulations promulgated thereunder increase their aggregate percentage ownership of the value of our shares by more than 50 percentage points over the lowest percentage of the value of the shares owned by these shareholders over a three-year rolling period. An ownership change could also be triggered by other activities, including the sale of our shares that are owned by our five (5%) shareholders. In the event of an ownership change, Section 382 would impose an annual limitation on the amount of taxable income we may offset with U.S. NOLs. This annual limitation is generally equal to the product of the value of our shares on the date of the ownership change multiplied by the long-term tax-exempt rate in effect on the date of the ownership change. The long-term tax-exempt rate is published monthly by the Internal Revenue Service. Any unused Section 382 annual limitation may be carried over to later years until the applicable expiration date for the respective U.S. NOLs. In the event an ownership change as defined under Section 382 were to occur, our ability to utilize our U.S. NOLs would become substantially limited. The consequence of this limitation would be the potential loss of a significant future cash flow benefit because we would no longer be able to substantially offset future taxable income with U.S. NOLs. There can be no assurance that such ownership change will not occur in the future.
19 | ||
KINGSWAY FINANCIAL SERVICES INC. | ||
Expiration of our tax benefit preservation plan may increase the probability that we will experience an ownership change as defined under Section 382.
In order to reduce the likelihood that we would experience an ownership change without the approval of our Board of Directors, our shareholders ratified and approved the tax benefit preservation plan agreement (the "Plan"), dated as of September 28, 2010, between the Company and Computershare Investor Services Inc., as rights agent, for the sole purpose of protecting the U.S. NOLs. The Plan expired on September 28, 2013. There can be no assurance that our Board of Directors will recommend to our shareholders that a similar tax benefit preservation plan be approved to replace the expired Plan; furthermore, there can be no assurance that our shareholders would approve any new tax benefit preservation plan were our Board of Directors to present one for shareholder approval. The expiration of the Plan, without a new tax benefit preservation plan, exposes us to certain changes in share ownership which we would not be able to prevent as we would have been able to prevent under the Plan. Such changes in share ownership could trigger an ownership change as defined under Section 382 resulting in restrictions on the use of NOLs in future periods, as discussed above.
We will only be able to utilize our U.S. NOLs against the future taxable income generated by companies we acquire if we are able to include the acquired companies in our U.S. consolidated tax return group.
We have in the past acquired companies and expect to do so in the future. Our ability to include acquired companies in our U.S. consolidated tax return group is subject to the rules of Section 1504 of the U.S. Internal Revenue Code of 1986, as amended. If it were ever determined that an acquired company did not qualify to be included in our U.S. consolidated tax return group, such acquired company would be required to file a U.S. tax return separate and apart from our U.S. consolidated tax return group. In that instance, the acquired company would be required to pay U.S. income tax on its taxable income despite the existence of our U.S. NOLs, which would be a use of cash at the acquired company; furthermore, were the income tax obligation of the acquired company in such instance to be greater than its available cash, we could be obligated to contribute cash to our subsidiary to meet its income tax obligation. There can be no assurance that an acquired company will generate taxable income and, if an acquired company does generate taxable income, there can be no assurance that the acquired company will be allowed to be included in our U.S. consolidated tax return group.
Our being registered as a Canadian domestic company subjects us to being taxed in Canada on foreign accrual property income that cannot be offset by our U.S. NOLs.
Canadian domestic companies are subject to taxation on certain non-Canadian sourced income called foreign accrual property income ("FAPI"). FAPI is traditionally comprised of passive income (i.e. interest, dividends, rents, capital gains and income generated from triple net leases). As a result, our investment portfolio, triple net lease and merchant banking activities are generally deemed to be sources of FAPI. Active trades or businesses are generally not considered sources of FAPI; however, pursuant to current Canadian tax law, our U.S. property-casualty insurance companies may be considered sources of FAPI. Our FAPI is subject to taxation in Canada regardless of whether we separately utilize our U.S. NOLs to offset that same income for U.S. income tax purposes. As a result, we could be required to pay Canadian income tax on FAPI despite the existence of our U.S. NOLs. We are currently in a position to offset some amount of FAPI using available Canadian NOLs and foreign accrual property losses ("FAPLs") that have been generated based upon our prior year loss activity. In the event that we do not have sufficient Canadian NOLs and FAPLs to offset future FAPI, however, we would be required to pay Canadian income tax, which would have a negative effect on our cash flow. There can be no assurance that our available Canadian NOLs and FAPLs will offset our future FAPI. In order for us to avoid paying Canadian income tax on future FAPI, we would have to redomesticate to a non-Canadian jurisdiction.
COMPLIANCE RISK
If we fail to comply with applicable insurance and securities laws or regulatory requirements, our business, results of operations and financial condition could be adversely affected.
As a publicly traded holding company listed on the Toronto and New York Stock Exchanges and which owns several property and casualty insurance subsidiaries, we are subject to numerous laws and regulations. These laws and regulations delegate regulatory, supervisory and administrative powers to federal, provincial or state regulators.
Insurance regulations are generally designed to protect policyholders rather than shareholders and are related to matters including:
• | rate-setting; |
• | risk-based capital and solvency standards; |
• | restrictions on the amount, type, nature, quality and quantity of investments; |
• | the maintenance of adequate provisions for unearned premiums and unpaid loss and loss adjustment expenses; |
• | restrictions on the types of terms that can be included in insurance policies; |
• | standards for accounting; |
20 | ||
KINGSWAY FINANCIAL SERVICES INC. | ||
• | marketing practices; |
• | claims-settlement practices; |
• | the examination of insurance companies by regulatory authorities, including periodic financial and market conduct examinations; |
• | the licensing of insurers and their agents; |
• | limitations on dividends and transactions with affiliates; |
• | approval of certain reinsurance transactions; and |
• | insolvency proceedings. |
In light of losses incurred in recent years, Kingsway and its regulated subsidiaries have been subject to intense review and supervision by insurance regulators. Regulators have taken significant steps to protect the policyholders of the companies we own. These steps have included:
• | requesting additional capital contributions from Kingsway to its insurance subsidiaries; and |
• | requiring more frequent reporting, including with respect to capital and liquidity positions. |
These and other actions have made it challenging for the Company to continue to maintain focus on the operation and development of its businesses. The Company does not expect these conditions to change in the foreseeable future.
In light of financial performance and a number of material transactions executed during the year, the Company has been asked to respond to questions from and provide information to regulatory bodies overseeing insurance and/or securities laws in Canada and the United States. The Company has cooperated in all respects with these reviews and has responded to information requests on a timely basis.
Any failure to comply with applicable laws or regulations could result in the imposition of fines or significant restrictions on our ability to do business, which could adversely affect our results of operations or financial condition. In addition, any changes in laws or regulations, including the adoption of consumer initiatives regarding rates charged for automobile or other insurance coverage or claims-handling procedures, could materially adversely affect our business, results of operations and financial condition. It is not possible to predict the future impact of changing federal, state and provincial regulation on our operations, and there can be no assurance that laws and regulations enacted in the future will not be more restrictive than existing laws and regulations.
Our business is subject to risks related to litigation and regulatory actions.
We are a defendant in a number of legal actions relating to our insurance and other business operations. We may from time to time be subject to a variety of legal and regulatory actions relating to our current and past business operations, including, but not limited to:
• | disputes over coverage or claims adjudication; |
• | disputes regarding sales practices, disclosure, premium refunds, licensing, regulatory compliance and compensation arrangements; |
• | disputes with our agents, producers or network providers over compensation and termination of contracts and related claims; |
• | disputes with taxing authorities regarding our tax liabilities; and |
• | disputes relating to certain businesses acquired or disposed of by us. |
In addition, plaintiffs continue to bring new types of legal actions against insurance and related companies. Current and future court decisions and legislative activity may increase our exposure to these types of claims. Multiparty or class action claims may present additional exposure to substantial economic, non-economic or punitive damage awards. The loss of even one of these claims, if it resulted in a significant award or a judicial ruling that was otherwise detrimental, could create a precedent in our industry that could have a material adverse effect on our results of operations and financial condition. This risk of potential liability may make reasonable settlements of claims more difficult to obtain. We cannot determine with any certainty what new theories of recovery may evolve or what their impact may be on our business.
We may be subject to governmental or administrative investigations and proceedings in the context of our highly regulated businesses. We cannot predict the outcome of these investigations, proceedings and reviews, and cannot assure that such investigations, proceedings or reviews or related litigation or changes in operating policies and practices would not materially adversely affect our results of operations and financial condition. In addition, if we were to experience difficulties with our relationship with a regulatory body in a given jurisdiction, it could have a material adverse effect on our ability to do business in that jurisdiction.
21 | ||
KINGSWAY FINANCIAL SERVICES INC. | ||
We have identified a material weakness in our internal control over financial reporting, which could, if not sufficiently remediated, result in material misstatements in our consolidated financial statements.
We are required, pursuant to Section 404 of the Sarbanes-Oxley Act, to furnish a report by management on the effectiveness of our internal control over financial reporting. In addition, our independent registered public accounting firm must report on its evaluation of our internal control over financial reporting. As disclosed in Item 9A of this 2016 Annual Report, we have identified a material weakness as of December 31, 2016 in our internal control over financial reporting related to income tax accounting for non-routine transactions.
Our management plans to enhance its internal control over financial reporting related to non-routine transactions by supplementing with outside resources as necessary and enhancing the design and documentation of management review controls. Although we plan to take steps intended to remediate this material weakness, we can provide no assurance that our remediation efforts will be effective or that additional material weaknesses in our internal control over financial reporting will not be identified in the future.
STRATEGIC RISK
The achievement of our strategic objectives is highly dependent on effective change management.
We have restructured our operating insurance subsidiaries, including exiting states and lines of business, placing subsidiaries into voluntary run-off and terminating managing general agent relationships, with the objective of focusing on core lines of business, creating a more effective and efficient operating structure and focusing on profitability. These actions resulted in changes to our structure and business processes. While these changes are expected to bring us benefits in the form of a more agile and focused business, success is dependent on management effectively realizing the intended benefits. Ineffective change management may result in disruptions to the operations of the business or may cause employees to act in a manner which is inconsistent with our objectives. Any of these events could negatively impact our performance. We may not always achieve the expected cost savings and other benefits of our initiatives.
We may experience difficulty continuing to reduce our holding company expenses while at the same time retaining staff given the significant reduction in size and scale of our businesses.
We have divested a number of subsidiaries and significantly reduced our written premium in the insurance subsidiaries we continue to own. At the same time, we have been downsizing our holding company expense base in an attempt to compensate for the reduction in scale. There can be no assurance that our remaining businesses will produce enough cash flow to adequately compensate and retain staff and to service our other holding company obligations, particularly the interest expense burden of our remaining outstanding debt.
The insurance industry and related businesses in which we operate may be subject to periodic negative publicity which may negatively impact our financial results.
Our products and services are ultimately distributed to individual consumers. From time to time, consumer advocacy groups or the media may focus attention on insurance products and services, thereby subjecting our industry to periodic negative publicity. We also may be negatively impacted if participants in one or more of our markets engage in practices resulting in increased public attention to our businesses. Negative publicity may also result in increased regulation and legislative scrutiny of practices in the property and casualty insurance industry as well as increased litigation. These factors may further increase our costs of doing business and adversely affect our profitability by impeding our ability to market our products and services, requiring us to change our products or services, or by increasing the regulatory burdens under which we operate.
The highly competitive environment in which we operate could have an adverse effect on our business, results of operations and financial condition.
The property and casualty markets in which we operate are highly competitive. We compete with major North American and other insurers, many of which have more financial, marketing and management resources than we do. There may also be other companies of which we are not aware that may be planning to enter the property and casualty insurance industry. Insurers in our markets generally compete on the basis of price, consumer recognition, coverages offered, claims handling, financial stability, customer service and geographic coverage. Although our pricing is influenced to some degree by that of our competitors, we generally believe that it is not in our best interest to compete solely on price. As a result, we are willing to experience from time to time a loss of market share during periods of intense price competition. Our business could be adversely impacted by the loss of business to competitors offering competitive insurance products at lower prices. This competition could affect our ability to attract and retain profitable business.
22 | ||
KINGSWAY FINANCIAL SERVICES INC. | ||
In our non-standard automobile business, we compete with both large national underwriters and smaller regional companies. Our competitors include other companies that, like us, serve the independent agency market, as well as companies that sell insurance directly to customers. Direct underwriters may have certain competitive advantages over agency underwriters, including increased name recognition, loyalty of the customer base to the insurer rather than to an independent agency and reduced costs to acquire policies.
Additionally, in certain states, government-operated risk plans may provide non-standard automobile insurance products at lower prices than we provide.
From time to time, our markets may also attract competition from new entrants. In some cases, such entrants may, because of inexperience, the desire for new business or for other reasons, price their insurance below the rates that we believe offer acceptable premiums for the related risk. Further, a number of our competitors, including new entrants to our markets, are developing e-business capabilities which may impact the level of business transacted through our more traditional distribution channels or that may affect pricing in the market as a whole.
The vehicle service agreement market in which we compete is comprised of a few large companies, which market service agreements to credit unions on a national basis and have significantly more financial, marketing and management resources than we do, as well as several other companies that are somewhat similar in size to IWS that market service agreements to credit unions either on a regional basis or a less robust national basis. There may also be other companies of which we are not aware that may be planning to enter the vehicle service agreement industry. Competitors in our market generally compete on coverages offered, claims handling, customer service, financial stability and, to a lesser extent, price. Larger competitors of ours benefit from added advantages such as industry endorsements and preferred vendor status. We do not believe that it is in our best interest to compete solely on price. Instead, we focus our marketing on the total value experience to the credit union and its member, with an emphasis on customer service. While we historically have been able to adjust our product offering to remain competitive when competitors have focused on price, our business could be adversely impacted by the loss of business to competitors offering vehicle service agreements at lower prices.
Engaging in acquisitions involves risks, and, if we are unable to effectively manage these risks, our business may be materially harmed.
From time to time we engage in discussions concerning acquisition opportunities and, as a result of such discussions, may enter into acquisition transactions.
Acquisitions entail numerous risks, including the following:
• | difficulties in the integration of the acquired business; |
• | assumption of unknown material liabilities, including deficient provisions for unpaid loss and loss adjustment expenses; |
• | diversion of management's attention from other business concerns; |
• | failure to achieve financial or operating objectives; and |
• | potential loss of policyholders or key employees of acquired companies. |
We may not be able to integrate or operate successfully any business, operations, personnel, services or products that we may acquire in the future.
Engaging in new business start-ups involves risks, and, if we are unable to effectively manage these risks, our business may be materially harmed.
From time to time we engage in discussions concerning the formation of a new business venture and, as a result of such discussions, may form and capitalize a new business.
New business start-ups entail numerous risks, including the following:
• | identification of appropriate management to run the new business; |
• | understanding the strategic, competitive and marketplace dynamics of the new business and, perhaps, industry; |
• | establishment of proper financial and operational controls; |
• | diversion of management's attention from other business concerns; and |
• | failure to achieve financial or operating objectives. |
We may not be able to operate successfully any business, operations, personnel, services or products that we may organize as a new business start-up in the future.
23 | ||
KINGSWAY FINANCIAL SERVICES INC. | ||
Our company has executive officers who also serve as directors and executive officers for 1347 Property Insurance Holdings, Inc., Atlas Financial Holdings, Inc., Limbach Holdings, Inc., Itasca Capital Ltd. and 1347 Energy Holdings LLC, entities in which we hold investments, which may lead to conflicting interests.
As a result of our having previously spun off 1347 Property Insurance Holdings, Inc. ("PIH") and Atlas Financial Holdings, Inc. ("Atlas"); formed 1347 Capital Corp., which later entered into a business combination with Limbach Holdings, Inc. ("Limbach"); and invested in Itasca Capital Ltd. ("ICL") and 1347 Energy Holdings LLC ("1347 Energy"), entities in which we hold investments, we have executive officers who also serve as directors for PIH, Atlas, Limbach, ICL and 1347 Energy and who serve as executive officers, pursuant to a management services agreement, for ICL. Our executive officers and members of our Company's board of directors have fiduciary duties to our stockholders; likewise, persons who serve in similar capacities at PIH, Atlas, Limbach, ICL and 1347 Energy have fiduciary duties to those companies’ stockholders. We may find, though, the potential for a conflict of interest if our Company and one or more of these other companies pursue acquisitions, investments and other business opportunities that may be suitable for each of us. Our executive officers who find themselves in these multiple roles may, as a result, have conflicts of interest or the appearance of conflicts of interest with respect to matters involving or affecting more than one of the companies to which they owe fiduciary duties. Furthermore, our executive officers who find themselves in these multiple roles own stock options, shares of common stock and other securities in some of these entities. These ownership interests could create, or appear to create, potential conflicts of interest when the applicable individuals are faced with decisions that could have different implications for our Company and these other entities. Our Audit Committee reviews potential conflicts that may arise on a case-by-case basis, keeping in mind the applicable fiduciary duties owed by the executive officers and directors of each entity. From time to time, we may enter into transactions with or participate jointly in investments with PIH, Atlas, Limbach, ICL or 1347 Energy. There can be no assurance that we will not create new situations where our directors or executive officers serve as directors or executive officers in future investment holdings of our Company.
OPERATIONAL RISK
Our provisions for unpaid loss and loss adjustment expenses may be inadequate, which would result in a reduction in our net income and might adversely affect our financial condition.
Our provisions for unpaid loss and loss adjustment expenses do not represent an exact calculation of our actual liability but are estimates involving actuarial and statistical projections at a given point in time of what we expect to be the cost of the ultimate settlement and administration of reported and IBNR claims. The process for establishing the provision for unpaid loss and loss adjustment expenses reflects the uncertainties and significant judgmental factors inherent in estimating future results of both reported and IBNR claims and, as such, the process is inherently complex and imprecise. These estimates are based upon various factors, including:
• | actuarial projections of the cost of settlement and administration of claims reflecting facts and circumstances then known; |
• | estimates of future trends in claims severity and frequency; |
• | legal theories of liability; |
• | variability in claims-handling procedures; |
• | economic factors such as inflation; |
• | judicial and legislative trends, actions such as class action lawsuits, and judicial interpretation of coverages or policy exclusions; and |
• | the level of insurance fraud. |
Most or all of these factors are not directly quantifiable, particularly on a prospective basis, and the effects of these and unforeseen factors could negatively impact our ability to accurately assess the risks of the policies that we write. In addition, there may be significant reporting lags between the occurrence of insured events and the time they are actually reported to us and additional lags between the time of reporting and final settlement of claims.
As time passes and more information about the claims becomes known, the estimates are appropriately adjusted upward or downward to reflect this additional information. Because of the elements of uncertainty encompassed in this estimation process, and the extended time it can take to settle many of the more substantial claims, several years of experience may be required before a meaningful comparison can be made between actual losses and the original provision for unpaid loss and loss adjustment expenses.
We cannot assure that we will not have unfavorable development in the future. In addition, we have in the past, and may in the future, acquire other insurance companies. We cannot assure that the provisions for unpaid loss and loss adjustment expenses of the companies that we acquire are or will be adequate.
In addition, government regulators for our insurance subsidiaries could require that we increase our provisions for unpaid loss and loss adjustment expenses if they determine that our provisions are understated. Such an increase to the provision for unpaid loss
24 | ||
KINGSWAY FINANCIAL SERVICES INC. | ||
and loss adjustment expenses for one of our insurance subsidiaries could cause a reduction in its surplus as regards policyholders, which could adversely affect our ability to sell insurance policies.
Our Insurance Services subsidiaries' deferred service fees may be inadequate, which would result in a reduction in our net income and might adversely affect our financial condition.
Our Insurance Services subsidiaries' deferred service fees do not represent an exact calculation but are estimates involving actuarial and statistical projections at a given point in time of what we expect to be the remaining future revenue to be recognized in relation to our remaining future obligations to provide policy administration and claim-handling services. The process for establishing deferred service fees reflects the uncertainties and significant judgmental factors inherent in estimating the length of time and the amount of work related to our future service obligations. If we amortize the deferred service fees too quickly, we could overstate current revenues which may adversely affect future reported operating results.
As time passes and more information about the remaining service obligations becomes known, the estimates are appropriately adjusted upward or downward to reflect this additional information. We cannot assure that we will not have unfavorable re-estimations in the future of our deferred service fees. In addition, we have in the past, and may in the future, acquire companies which record deferred service fees. We cannot assure that the deferred service fees of the companies that we acquire are or will be adequate.
Our reliance on independent agents can impact our ability to maintain business, and it exposes us to credit risk.
We market and distribute our automobile insurance products through a network of independent agents in the United States. As a result, we rely heavily on these agents to attract new business. They typically represent more than one insurance company, which may expose us to competition within the agencies and, therefore, we cannot rely on their commitment to our insurance products. Loss of all or a substantial portion of the business provided by these intermediaries could have a material adverse effect on our business, results of operations and financial condition.
In accordance with industry practice, our customers sometimes pay the premiums for their policies to agents for remittance to us. These premiums are considered paid when received by the agents and thereafter the customer is no longer liable to us for those amounts, whether or not we have actually received the premiums from the agents. Consequently, we assume a degree of risk associated with our reliance on independent agents in connection with the settlement of insurance balances.
Our reliance on credit unions can impact our ability to maintain business.
We market and distribute our vehicle service agreements through a network of credit unions in the United States. As a result, we rely heavily on these credit unions to attract new business. While these distribution arrangements tend to be exclusive between us and each credit union, we have competitors which offer similar products exclusively through credit unions. Loss of all or a substantial portion of our existing credit union relationships could have a material adverse effect on our business, results of operations and financial condition.
Our reliance on a limited number of warranty and maintenance support clients and customers can impact our ability to maintain business.
We market and distribute our warranty products and equipment breakdown and maintenance support services through a limited number of customers and clients across the United States. Loss of all or a substantial portion of our existing customers and clients could have a material adverse effect on our business, results of operations and financial condition.
Our gross premiums written are derived from the non-standard automobile markets. If the demand for insurance in this market declines, our results of operations could be adversely affected.
For the year ended December 31, 2016, 100.0% of the gross premiums written from our Insurance Underwriting segment were attributable to non-standard automobile insurance. The size of the non-standard automobile insurance market can be affected significantly by many factors outside of our control, such as the underwriting capacity and underwriting criteria of standard automobile insurance carriers, and we may be specifically affected by these factors. Additionally, the non-standard automobile insurance market tends to contract during periods of high unemployment. To the extent that the non-standard automobile insurance markets are affected adversely for any reason, our gross premiums written will be disproportionately affected due to our substantial reliance on these insurance markets.
25 | ||
KINGSWAY FINANCIAL SERVICES INC. | ||
We derive the majority of our non-standard automobile insurance gross premiums written from a few geographic areas, which may cause our business to be affected by catastrophic losses or business conditions in these areas.
Certain jurisdictions, specifically Florida, Texas, Illinois, California, Colorado and Nevada, generated 89.0% of our non-standard automobile insurance gross premiums written during 2016.
Our results of operations may, therefore, be adversely affected by any catastrophic losses in these areas. Catastrophic losses can be caused by a wide variety of events, including earthquakes, hurricanes, tropical storms, tornadoes, wind, ice storms, hail, fires, terrorism, riots and explosions, and their incidence and severity are inherently unpredictable. Catastrophic losses are characterized by low frequency but high severity due to aggregation of losses and could result in adverse effects on our results of operations or financial condition. Our results of operations may also be adversely affected by general economic conditions, competition, regulatory actions or other business conditions that affect losses or business conditions in the specific areas in which we conduct most of our business.
If reinsurance rates rise significantly or reinsurance becomes unavailable or reinsurers are unable to pay amounts due to us, we may be adversely affected.
In the past, we have purchased reinsurance from third-parties in order to reduce our liability on individual risks. Reinsurance does not relieve us of our primary liability to our insureds. A third-party reinsurer's insolvency, inability or unwillingness to make payments under the terms of a reinsurance treaty could have a material adverse effect on our financial condition or results of operations. As of December 31, 2016, we had $1.5 million recoverable from third-party reinsurers, including reinsurance recoverable related to property and casualty unpaid loss and loss adjustment expenses.
The amount and cost of reinsurance available to our insurance companies are subject, in large part, to prevailing market conditions beyond our control. Our ability to provide insurance at competitive premium rates and coverage limits on a continuing basis may depend in part upon the extent to which we can obtain adequate reinsurance in amounts and at rates that will not adversely affect our competitive position. If we determine in the future that access to reinsurance facilities is desirable or necessary in order for us to conduct business, we cannot assure that we will be able to obtain reinsurance in adequate amounts and at favorable rates. If this were to occur, we may need to modify our underwriting practices or reduce our underwriting commitments.
Disruptions or security failures in our information technology systems could create liability for us and/or limit our ability to effectively monitor, operate and control our operations and adversely impact our reputation, business, financial condition, results of operation and cash flows.
Our information technology systems facilitate our ability to monitor, operate and control our operations. Changes or modifications to our information technology systems could cause disruption to our operations or cause challenges with respect to our compliance with laws, regulations or other applicable standards. For example, delays, higher than expected costs or unsuccessful implementation of new information technology systems could adversely impact our operations. In addition, any disruption in or failure of our information technology systems to operate as expected could, depending on the magnitude of the problem, adversely impact our business, financial condition, results of operation and cash flows, including by limiting our capacity to monitor, operate and control our operations effectively. Failures of our information technology systems could also lead to violations of privacy laws, regulations, trade guidelines or practices related to our customers and employees. If our disaster recovery plans do not work as anticipated, or if the third-party vendors to which we have outsourced certain information technology or other services fail to fulfill their obligations to us, our operations may be adversely impacted. Any of these circumstances could adversely impact our reputation, business, financial condition, results of operation and cash flows.
Our success depends on our ability to price accurately the risks we underwrite.
Our results of operation and financial condition depend on our ability to underwrite and set premium rates accurately for a wide variety of risks. Adequate rates are necessary to generate premiums sufficient to pay loss and loss adjustment expenses and other expenses and to earn a profit. To price our products accurately, we must collect and properly analyze a substantial amount of data; develop, test and apply appropriate pricing techniques; closely monitor and timely recognize changes in trends; and project both severity and frequency of losses with reasonable accuracy. Our ability to undertake these efforts successfully, and as a result price our products accurately, is subject to a number of risks and uncertainties, some of which are outside our control, including:
• | the availability of reliable data and our ability to properly analyze available data; |
• | the uncertainties that inherently characterize estimates and assumptions; |
• | our selection and application of appropriate pricing techniques; and |
• | changes in applicable legal liability standards and in the civil litigation system generally. |
26 | ||
KINGSWAY FINANCIAL SERVICES INC. | ||
Consequently, we could underprice risks, which would adversely affect our underwriting results, or we could overprice risks, which would reduce our sales volume and competitiveness. In either case, our results of operation could be materially and adversely affected.
Our results of operation may fluctuate as a result of cyclical changes in the property and casualty insurance industry.
Our results of operation are primarily attributable to the property and casualty insurance industry, which as an industry is cyclical in nature and has historically been characterized by soft markets followed by hard markets. A soft market is a period of relatively high levels of price competition, less restrictive underwriting standards and generally low premium rates. A hard market is a period of capital shortages resulting in lack of insurance availability, relatively low levels of competition, more selective underwriting of risks and relatively high premium rates. If we find it necessary to reduce premiums or limit premium increases due to competitive pressures on pricing in a softening market, we may experience a reduction in our premiums written and, therefore, in our earned premium revenues, which could adversely affect our results of operation.
Our results of operation and financial condition could be adversely affected by the results of our voluntary run-off of two of our insurance subsidiaries.
The Company currently has two of its insurance subsidiaries, MCC and Amigo, operating in voluntary run-off. Our success at managing these run-offs is highly dependent upon proper claim-handling and the availability of the necessary liquidity to pay claims when due. As a result, we are dependent in part on our ability to retain the services of appropriately trained and supervised claim-handling personnel. The loss of the services of any of our key claim-handling personnel working in our run-offs, or the inability to identify, hire and retain other highly qualified claim-handling personnel in the future, could adversely affect our results of operations. We are also dependent on the continuing availability of the necessary liquidity, from the sale of securities, collection of reinsurance recoverables and, potentially, capital contributions, to properly settle claims. Our inability to sell securities when needed or to collect outstanding reinsurance recoverables when due could have an adverse effect on our results of operation or financial condition. See the "Liquidity and Capital Resources" section of MD&A for additional detail regarding the voluntary run-offs of MCC and Amigo.
HUMAN RESOURCES RISK
Our business depends upon key employees, and if we are unable to retain the services of these key employees or to attract and retain additional qualified personnel, our business may be adversely affected.
Our success at improving our performance will be dependent in part on our ability to retain the services of our existing key employees and to attract and retain additional qualified personnel in the future. The loss of the services of any of our key employees, or the inability to identify, hire and retain other highly qualified personnel in the future, could adversely affect our results of operations.
Item 1B. Unresolved Staff Comments
None.
Item 2. Properties
Leased Properties
Insurance Underwriting leases facilities with an aggregate square footage of approximately 68,274 at four locations in four states. The latest expiration date of the existing leases is in November 2019.
Insurance Services leases facilities with an aggregate square footage of approximately 14,361 at two locations in two states. The latest expiration date of the existing leases is in November 2019.
The Company leases facilities for its corporate offices with an aggregate square footage of approximately 8,086 at two locations in one state. The latest expiration date of the existing leases is in November 2020.
The properties described above are in good condition. We consider our office facilities suitable and adequate for our current levels of operations.
27 | ||
KINGSWAY FINANCIAL SERVICES INC. | ||
Owned Properties
Leased Real Estate owns the Real Property, which is subject to a long-term triple net lease agreement. The Real Property includes rail car tracks which provide rail car storage spaces and has 72 miles of double-ended rail track. The Real Property also contains a 5,760 square foot office building with an attached observation tower comprised of 1,150 square feet.
The Company also owns two buildings located in Illinois consisting of approximately 4,636 square feet. The buildings are used for rental purposes and corporate offices.
Item 3. Legal Proceedings
In connection with its operations in the ordinary course of business, the Company and its subsidiaries are named as defendants in various actions for damages and costs allegedly sustained by the plaintiffs. While it is not possible to estimate the loss, or range of loss, if any, that may be incurred in connection with any of the various proceedings at this time, it is possible that some of the actions may result in losses having a material adverse effect on the Company's financial condition or results of operations.
Item 4. Mine Safety Disclosures
Not applicable.
Part II
Item 5. Market for Registrant's Common Equity, Related Stockholder Matters and Issuer Purchases of Equity Securities
Market Information
Our common shares are listed on the Toronto Stock Exchange ("TSX") and the New York Stock Exchange ("NYSE") under the trading symbol "KFS."
The following table sets forth, for the calendar quarters indicated, the high and low sales price for our common shares as reported on the TSX and NYSE.
28 | ||
KINGSWAY FINANCIAL SERVICES INC. | ||
TSX | NYSE | |||||||||||||||
High - C$ | Low - C$ | High - US$ | Low - US$ | |||||||||||||
2016 | ||||||||||||||||
Quarter 4 | C$ | 8.36 | C$ | 7.42 | $ | 6.25 | $ | 5.45 | ||||||||
Quarter 3 | 7.63 | 6.65 | 5.79 | 5.23 | ||||||||||||
Quarter 2 | 6.90 | 5.59 | 5.37 | 4.48 | ||||||||||||
Quarter 1 | 6.34 | 5.33 | 4.79 | 3.72 | ||||||||||||
2015 | ||||||||||||||||
Quarter 4 | 6.51 | 5.43 | 4.90 | 4.09 | ||||||||||||
Quarter 3 | 7.62 | 5.95 | 5.97 | 4.43 | ||||||||||||
Quarter 2 | 7.62 | 6.69 | 6.12 | 5.47 | ||||||||||||
Quarter 1 | 7.49 | 6.44 | 5.94 | 5.41 | ||||||||||||
Shareholders of Record
As of March 10, 2017, the closing sales price of our common shares as reported by the TSX was C$7.80 per share and as reported by the NYSE was $5.75 per share.
As of March 13, 2017, we had 21,458,190 common shares issued and outstanding, held by approximately 3,700 shareholders of record.
Dividends
The Company has not declared a dividend since the first quarter of 2009. The declaration and payment of dividends is subject to the discretion of our Board of Directors after taking into account many factors, including financial condition, results of operations, anticipated cash needs and other factors deemed relevant by our Board of Directors. For a discussion of our cash resources and needs, see the "Liquidity and Capital Resources" section of MD&A.
Securities Authorized for Issuance under Equity Compensation Plans
As of December 31, 2016, we had one equity compensation plan under which our shares of common stock have been authorized for issuance to key officers of the Company and its subsidiaries, namely our 2013 Equity Incentive Plan (the "2013 Plan") adopted by the Board of Directors in 2013. The 2013 Plan has been approved by the shareholders of the Company.
The following summary information is presented with respect to shares of our common stock that may be issued under our equity compensation plan as of December 31, 2016:
Equity Compensation Plan Information | |||
Number of securities to be issued upon exercise of outstanding options, warrants and rights | Weighted-average exercise price of outstanding options, warrants and rights | Number of securities remaining available for future issuance under equity compensation plans (excluding securities reflected in column (a)) | |
Plan category | (a) | (b) | (c) |
Equity compensation plans approved by security holders | 651,875 | $4.51 | — |
Equity compensation plans not approved by security holders | N/A | N/A | N/A |
Total | 651,875 | $4.51 | — |
29 | ||
KINGSWAY FINANCIAL SERVICES INC. | ||
Recent Sales of Unregistered Securities
On November 9, 2016, the Company entered into separate Stock Purchase Agreements with GrizzlyRock Institutional Value Partners, LP, W.H.I. Growth Fund Q.P., L.P. and Yorkmont Capital Partners, LP for the private placement (the "Private Placement") of 1,615,384 shares of its common stock at a purchase price of $6.50 per share with gross proceeds to the Company of $10.5 million. No brokerage, finder’s, placement agent or investment banking fees or commissions were payable by the Company in connection with the Private Placement. The Private Placement closed on November 16, 2016.
Issuer Purchases of Equity Securities
In November 2015, the Company's Board of Directors approved a share repurchase program under which the Company is authorized to repurchase up to 5% of its currently issued and outstanding common stock through November 2016. Refer to Note 23, "Shareholders' Equity," to the Consolidated Financial Statements for further discussion related to the share repurchase program. During the three months ended December 31, 2016, we did not have any repurchases of our equity securities.
30 | ||
KINGSWAY FINANCIAL SERVICES INC. | ||
Performance Graph
The following stock performance graph shows a comparison of cumulative total shareholder return on the Company's common stock for the period beginning on December 31, 2011 and ending on December 31, 2016 with cumulative total return of the Russell MicroCap Index and the SNL MicroCap U.S. Financial Services Index. Kingsway is not a constituent of either of these two indices. The graph shows the change in value of an initial one hundred dollar investment over the period indicated, assuming all dividends have been reinvested.
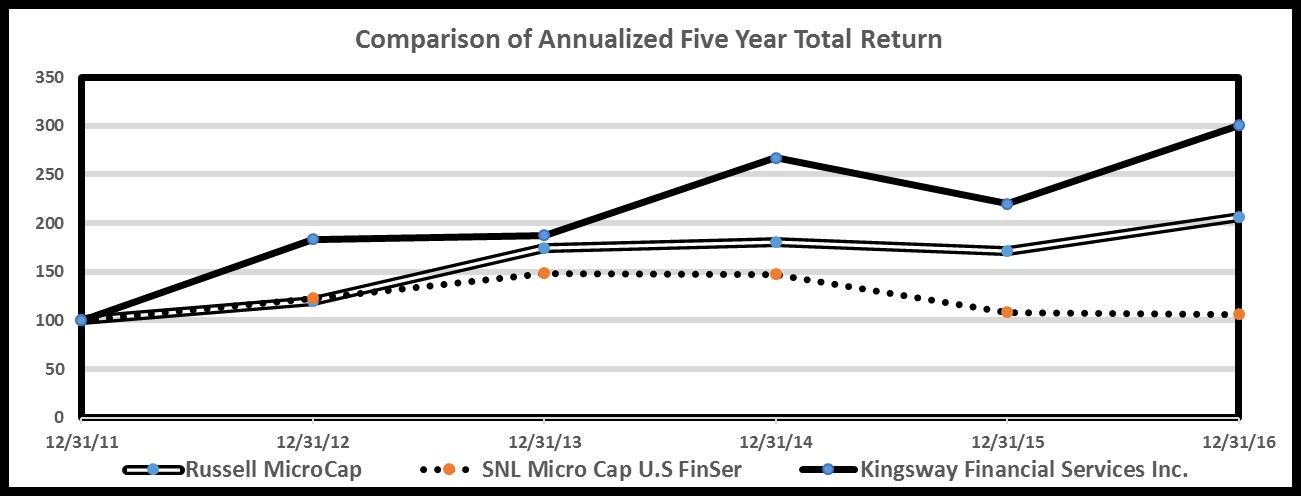
Years ended December 31, | ||||||||||||||||||
Company/Index | 2011 | 2012 | 2013 | 2014 | 2015 | 2016 | ||||||||||||
Kingsway | $ | 100 | $ | 183 | $ | 188 | $ | 267 | $ | 220 | $ | 300 | ||||||
Russell MicroCap | $ | 100 | $ | 120 | $ | 174 | $ | 181 | $ | 171 | $ | 206 | ||||||
SNL Micro Cap U.S. Financial Services | $ | 100 | $ | 123 | $ | 148 | $ | 148 | $ | 108 | $ | 106 | ||||||
31 | ||
KINGSWAY FINANCIAL SERVICES INC. | ||
Item 6. Selected Financial Data
The following table has selected financial data as of and for the years ended December 31, 2016, 2015, 2014, 2013 and 2012 and should be read in conjunction with the Consolidated Financial Statements and MD&A included in this 2016 Annual Report. Historical results are not necessarily indicative of future results.
For the years ended December 31 (in thousands of dollars, except per share data)
2016 | 2015 | 2014 | 2013 | 2012 | |||||||||||
Consolidated Statements of Operations Data (1): | |||||||||||||||
Net premiums earned | 127,608 | 117,433 | 117,593 | 109,608 | 114,937 | ||||||||||
Service fee and commission income | 24,232 | 22,966 | 24,659 | 49,543 | 35,491 | ||||||||||
Rental income | 5,419 | — | — | — | — | ||||||||||
Net investment income | 8,200 | 2,918 | 1,616 | 2,186 | 3,165 | ||||||||||
Net realized gains | 360 | 1,197 | 5,041 | 3,505 | 1,084 | ||||||||||
Loss from continuing operations | (733 | ) | (11,415 | ) | (14,666 | ) | (43,311 | ) | (53,278 | ) | |||||
Basic loss per share - continuing operations | (0.04 | ) | (0.60 | ) | (0.95 | ) | (3.12 | ) | (3.96 | ) | |||||
Diluted loss per share - continuing operations | (0.04 | ) | (0.60 | ) | (0.95 | ) | (3.12 | ) | (3.96 | ) | |||||
Consolidated Balance Sheet Data: | |||||||||||||||
Cash and invested assets | 163,519 | 159,437 | 158,317 | 167,784 | 168,813 | ||||||||||
Total Assets | 501,021 | 241,022 | 301,722 | 324,639 | 372,800 | ||||||||||
Note payable | 190,074 | — | — | — | — | ||||||||||
LROC preferred units, at fair value | — | — | 13,618 | 14,854 | 13,655 | ||||||||||
Senior unsecured debentures, at fair value | — | — | — | 14,356 | 23,730 | ||||||||||
Subordinated debt, at fair value | 43,619 | 39,898 | 40,659 | 28,471 | 23,774 | ||||||||||
Total Liabilities | 437,759 | 190,925 | 253,526 | 287,719 | 307,386 | ||||||||||
Total Shareholders' Equity | 56,835 | 43,703 | 41,866 | 36,920 | 65,414 | ||||||||||
(1) The Company disposed of its subsidiary, ARS, on April 1, 2015. The financial results of ARS are presented as discontinued operations for the years ended December 31, 2015 and 2014. Refer to Note 6, "Disposition, Deconsolidations and Discontinued Operations," to the Consolidated Financial Statements, for further discussion.
The Company disposed of its majority interest in its subsidiary, PIH, effective March 31, 2014. The earnings of PIH are included in the consolidated statements of operations for the three months ended March 31, 2014 and for the years ended December 31, 2013 and 2012. Refer to Note 6, "Disposition, Deconsolidations and Discontinued Operations," to the Consolidated Financial Statements, for further discussion.
The Company acquired its subsidiary, Trinity, effective May 22, 2013. The consolidated statements of operations include the earnings of Trinity from the date of acquisition.
The Company acquired its subsidiary, IWS, effective November 16, 2012. The consolidated statements of operations include the earnings of IWS from the date of acquisition.
32 | ||
KINGSWAY FINANCIAL SERVICES INC. Management's Discussion and Analysis | ||
Item 7. MANAGEMENT'S DISCUSSION AND ANALYSIS OF FINANCIAL CONDITION AND RESULTS OF OPERATIONS
OVERVIEW
Kingsway is a Canadian holding company with operating subsidiaries located in the United States. The Company operates as a merchant bank primarily engaged, through its subsidiaries, in the property and casualty insurance business. Kingsway conducts its business through the following three reportable segments: Insurance Underwriting, Insurance Services and Leased Real Estate.
Insurance Underwriting includes the following subsidiaries of the Company: Mendota Insurance Company ("Mendota"), Mendakota Insurance Company, Mendakota Casualty Company ("MCC"), Kingsway Amigo Insurance Company ("Amigo") and Kingsway Reinsurance Corporation. Throughout Management's Discussion and Analysis, the term "Insurance Underwriting" is used to refer to this segment.
Insurance Underwriting provides non-standard automobile insurance to individuals who do not meet the criteria for coverage by standard automobile insurers. Insurance Underwriting has policyholders in 12 states; however new business is accepted in only 8 states. In 2016, production in the following states represented 89.0% of Insurance Underwriting's gross premiums written: Florida (27.4%), Texas (17.7%), Illinois (13.3%), Nevada (11.3%), California (10.9%) and Colorado (8.4%). For the year ended December 31, 2016, non-standard automobile insurance accounted for 100.0% of Insurance Underwriting's gross premiums written.
The Company previously placed Amigo and MCC into voluntary run-off in 2012 and 2011, respectively. Each of Amigo and MCC entered into a comprehensive run-off plan which was approved by its respective state of domicile. Kingsway continues to manage Amigo and MCC in a manner consistent with the run-off plans. During the first quarter of 2015, MCC sent a letter of intent to the Illinois Department of Insurance to resume writing private passenger automobile policies in the state of Illinois. MCC began writing these policies on April 1, 2015.
Insurance Services includes the following subsidiaries of the Company: IWS Acquisition Corporation ("IWS") and Trinity Warranty Solutions LLC ("Trinity"). Throughout this 2016 Annual Report, the term "Insurance Services" is used to refer to this segment.
IWS is a licensed motor vehicle service agreement company and is a provider of after-market vehicle protection services distributed by credit unions in 23 states to their members.
Trinity is a provider of warranty products and maintenance support to consumers and businesses in the heating, ventilation, air conditioning ("HVAC"), standby generator, commercial LED lighting and refrigeration industries. Trinity distributes its warranty products through original equipment manufacturers, HVAC distributors and commercial and residential contractors. Trinity distributes its maintenance support direct through corporate owners of retail spaces throughout the United States.
Leased Real Estate includes the Company's subsidiary, CMC Industries, Inc. ("CMC"), which was acquired on July 14, 2016. CMC owns, through an indirect wholly owned subsidiary (the "Property Owner"), a parcel of real property consisting of approximately 192 acres located in the State of Texas (the "Real Property"), which is subject to a long-term triple net lease agreement. The Real Property is also subject to a mortgage (the "Mortgage"). Throughout Management's Discussion and Analysis, the term "Leased Real Estate" is used to refer to this segment.
Effective April 1, 2015, the Company closed on the sale of its wholly owned subsidiary, Assigned Risk Solutions Ltd. ("ARS"). As a result, ARS has been classified as discontinued operations and the results of their operations are reported separately for all periods presented. Prior to the transaction, ARS was included in the Insurance Services segment. As a result of classifying ARS as a discontinued operation, all segmented information has been restated to exclude ARS from the Insurance Services segment.
Effective March 31, 2014, the Company's wholly owned subsidiary, 1347 Property Insurance Holdings, Inc. ("PIH"), formerly known as Maison Insurance Holdings, Inc., completed an initial public offering of its common stock. Upon completion of the transaction, the Company maintained a minority ownership interest in the common shares of PIH. The earnings of PIH are included in the consolidated statements of operations through the March 31, 2014 transaction date. Prior to the transaction, PIH was included in the Insurance Underwriting segment. As a result of the disposal of the Company's majority interest in PIH on March 31, 2014, all segmented information has been restated to exclude PIH from the Insurance Underwriting segment.
33 | ||
KINGSWAY FINANCIAL SERVICES INC. Management's Discussion and Analysis | ||
NON U.S.-GAAP FINANCIAL MEASURES
Throughout this 2016 Annual Report, we present our operations in the way we believe will be most meaningful, useful and transparent to anyone using this financial information to evaluate our performance. In addition to the U.S. GAAP presentation of net income (loss), we show certain statutory reporting information and other non-U.S. GAAP financial measures that we believe are relevant in managing our business and drawing comparisons to our peers. These measures are segment operating (loss) income, gross premiums written, net premiums written and underwriting ratios.
Following is a list of non-U.S. GAAP measures found throughout this report with their definitions, relationships to U.S. GAAP measures and explanations of their importance to our operations.
Segment Operating (Loss) Income
Segment operating (loss) income represents one measure of the pretax profitability of our segments and is derived by subtracting direct segment expenses from direct segment revenues. Revenues and expenses are presented in the consolidated statements of operations, but are not subtotaled by segment; however, this information is available in total and by segment in Note 25, "Segmented Information," to the Consolidated Financial Statements, regarding reportable segment information. The nearest comparable U.S. GAAP measure is loss from continuing operations before income tax (benefit) expense which, in addition to segment operating (loss) income, includes net investment income, net realized gains, other-than-temporary impairment loss, amortization of intangible assets, contingent consideration benefit, impairment of asset held for sale, interest expense not allocated to segments, other income not allocated to segments, general and administrative expenses, foreign exchange losses, net, (loss) gain on change in fair value of debt, loss on disposal of subsidiary, loss on disposal of asset held for sale, gain (loss) on deconsolidation of subsidiaries and equity in net loss of investees. A reconciliation of segment operating (loss) income to loss from continuing operations before income tax (benefit) expense for the years ended December 31, 2016, 2015 and 2014 is presented in Tables 1 and 2 of the "Results of Continuing Operations" section of MD&A.
Gross Premiums Written
While net premiums earned is the related U.S. GAAP measure used in the consolidated statements of operations, gross premiums written is the component of net premiums earned that measures insurance business produced before the impact of ceding reinsurance premiums, but without respect to when those premiums will be recognized as actual revenue. We use this measure as an overall gauge of gross business volume in Insurance Underwriting.
Net Premiums Written
While net premiums earned is the related U.S. GAAP measure used in the consolidated statements of operations, net premiums written is the component of net premiums earned that measures the difference between gross premiums written and the impact of ceding reinsurance premiums, but without respect to when those premiums will be recognized as actual revenue. We use this measure as an indication of retained or net business volume in Insurance Underwriting.
Underwriting Ratios
Kingsway, like many insurance companies, analyzes performance based on underwriting ratios such as loss and loss adjustment expense ratio, expense ratio and combined ratio. The loss and loss adjustment expense ratio is derived by dividing the amount of net loss and loss adjustment expenses incurred by net premiums earned. The expense ratio is derived by dividing the sum of commissions and premium taxes; general and administrative expenses and policy fee income by net premiums earned. The combined ratio is the sum of the loss and loss adjustment expense ratio and the expense ratio. A combined ratio below 100% demonstrates underwriting profit whereas a combined ratio over 100% demonstrates an underwriting loss.
CRITICAL ACCOUNTING ESTIMATES AND ASSUMPTIONS
The preparation of consolidated financial statements in conformity with U.S. GAAP requires management to make estimates and assumptions that affect application of policies and the reported amounts of assets and liabilities and disclosure of contingent assets and liabilities at the date of the consolidated financial statements and the reported amounts of revenues and expenses during the year. Actual results could differ from these estimates. Estimates and their underlying assumptions are reviewed on an ongoing basis. Changes in estimates are recorded in the accounting period in which they are determined. The critical accounting estimates and assumptions in the accompanying consolidated financial statements include the provision for unpaid loss and loss adjustment expenses; valuation of fixed maturities and equity investments; impairment assessment of investments; valuation of limited liability investment at fair value; valuation of deferred income taxes; valuation and impairment assessment of intangible assets; goodwill
34 | ||
KINGSWAY FINANCIAL SERVICES INC. Management's Discussion and Analysis | ||
recoverability; deferred acquisition costs; fair value assumptions for derivative financial instruments; fair value assumptions for subordinated debt obligations; and contingent consideration.
Provision for Unpaid Loss and Loss Adjustment Expenses
A significant degree of judgment is required to determine amounts recorded in the consolidated financial statements for the provision for unpaid loss and loss adjustment expenses. The process for establishing the provision for unpaid loss and loss adjustment expenses reflects the uncertainties and significant judgmental factors inherent in predicting future results of both known and unknown loss events. As such, the process is inherently complex and imprecise and estimates are constantly refined. The process of establishing the provision for unpaid loss and loss adjustment expenses relies on the judgment and opinions of a large number of individuals, including the opinions of the Company's actuaries. Further information regarding estimates used in determining our provision for unpaid loss and loss adjustment expenses is discussed in the “Unpaid Loss and Loss Adjustment Expenses” section of Part I, Item 1 of this 2016 Annual Report and Note 14, "Unpaid Loss and Loss Adjustment Expenses," to the Consolidated Financial Statements.
Factors affecting the provision for unpaid loss and loss adjustment expenses include the continually evolving and changing regulatory and legal environment; actuarial studies; the professional experience and expertise of the Company's claims personnel and independent adjusters retained to handle individual claims; the quality of the data used for projection purposes; existing claims management practices including claims handling and settlement practices; the effect of inflationary trends on future loss settlement costs; court decisions; economic conditions; and public attitudes.
The Company utilizes external actuaries to evaluate the adequacy of our provision for unpaid loss and loss adjustment expenses under the terms of our insurance policies and vehicle service agreements. The provision is evaluated by the Company's actuaries with the results then shared with management, which is responsible for establishing the provision recorded in the consolidated balance sheets.
In the year-end actuarial review process, an analysis of the provision for unpaid loss and loss adjustment expenses is completed for each insurance subsidiary and IWS. Unpaid deferred cost containment expenses and unpaid adjusting and other expenses, which are components of the provision for loss adjustment expenses, and unpaid losses are each separately analyzed by line of business and by accident year utilizing a wide range of actuarial methods. These unpaid losses and loss adjustment expenses are further analyzed by looking separately at case reserves, which are specific reserves established for specific claims, and reserves for losses incurred but not reported ("IBNR").
Because the establishment of the provision for unpaid loss and loss adjustment expenses is an inherently uncertain process involving estimates, current provisions may need to be updated. Adjustments to the provision, both favorable and unfavorable, are reflected in the consolidated statements of operations for the periods in which such estimates are updated. The Company's actuaries develop a range of reasonable estimates and a point estimate of unpaid loss and loss adjustment expenses. The actuarial point estimate is intended to represent the actuaries' best estimate and will not necessarily be at the mid-point of the high and low estimates of the range.
Valuation of Fixed Maturities and Equity Investments
Our equity investments, including warrants, are recorded at fair value using quoted market values based on latest bid prices, where active markets exist, or models based on significant market observable inputs, where no active markets exist. For fixed maturities, we use observable inputs such as quoted prices in inactive markets, quoted prices in active markets for similar instruments, benchmark interest rates, broker quotes and other relevant inputs. We do not have any fixed maturities and equity investments in our portfolio which require us to use unobservable inputs.
Gains and losses realized on the disposition of investments are determined on the first-in first-out basis and credited or charged to the consolidated statements of operations. Premium and discount on investments are amortized and accredited using the interest method and charged or credited to net investment income.
Impairment Assessment of Investments
The establishment of an other-than-temporary impairment on an investment requires a number of judgments and estimates. We perform a quarterly analysis of the individual investments to determine if declines in market value are other-than-temporary. The analysis includes some or all of the following procedures, as applicable:
• | identifying all unrealized loss positions that have existed for at least six months; |
• | identifying other circumstances which management believes may impact the recoverability of the unrealized loss positions; |
35 | ||
KINGSWAY FINANCIAL SERVICES INC. Management's Discussion and Analysis | ||
• | obtaining a valuation analysis from third-party investment managers regarding the intrinsic value of these investments based on their knowledge and experience together with market-based valuation techniques; |
• | reviewing the trading range of certain investments over the preceding calendar period; |
• | assessing if declines in market value are other-than-temporary for debt instruments based on the investment grade credit ratings from third-party rating agencies; |
• | assessing if declines in market value are other-than-temporary for any debt instrument with a non-investment grade credit rating based on the continuity of its debt service record; |
• | determining the necessary provision for declines in market value that are considered other-than-temporary based on the analyses performed; and |
• | assessing the Company's ability and intent to hold these investments at least until the investment impairment is recovered. |
The risks and uncertainties inherent in the assessment methodology used to determine declines in market value that are other-than-temporary include, but may not be limited to, the following:
• | the opinions of professional investment managers could be incorrect; |
• | the past trading patterns of individual investments may not reflect future valuation trends; |
• | the credit ratings assigned by independent credit rating agencies may be incorrect due to unforeseen or unknown facts related to a company's financial situation; and |
• | the debt service pattern of non-investment grade instruments may not reflect future debt service capabilities and may not reflect a company's unknown underlying financial problems. |
As a result of the analysis performed by the Company to determine declines in market value that are other-than-temporary, the Company recorded write downs of $0.1 million and $0.1 million for other-than-temporary impairment related to equity investments and limited liability investments, respectively, for the year ended December 31, 2016 and $0.0 million for other-than-temporary impairment related to fixed maturities for the year ended December 31, 2015. The Company did not recognize any impairment related to its investments that was considered other-than-temporary for the year ended December 31, 2014.
Valuation of Limited Liability Investment, at Fair Value
In connection with the deconsolidation of 1347 Investors LLC ("1347 Investors") during the third quarter of 2016, the Company retained a minority investment in 1347 Investors. The Company has made an irrevocable election to account for this investment at fair value with changes in fair value reported in the consolidated statements of operations. The fair value of this investment is calculated based on an internally developed model that distributes the net equity of 1347 Investors to all classes of membership interests. The model uses quoted market prices and significant market observable inputs.
Valuation of Deferred Income Taxes
The provision for income taxes is calculated based on the expected tax treatment of transactions recorded in our consolidated financial statements. In determining our provision for income taxes, we interpret tax legislation in a variety of jurisdictions and make assumptions about the expected timing of the reversal of deferred income tax assets and liabilities and the valuation of deferred income taxes.
The ultimate realization of the deferred income tax asset balance is dependent upon the generation of future taxable income during the periods in which the Company's temporary differences reverse and become deductible. A valuation allowance is established when it is more likely than not that all or a portion of the deferred income tax asset balance will not be realized. In determining whether a valuation allowance is needed, management considers all available positive and negative evidence affecting specific deferred income tax asset balances, including the Company's past and anticipated future performance, the reversal of deferred income tax liabilities, and the availability of tax planning strategies.
Objective positive evidence is necessary to support a conclusion that a valuation allowance is not needed for all or a portion of a company's deferred income tax asset balances when significant negative evidence exists. Cumulative losses are the most compelling form of negative evidence considered by management in this determination. To the extent a valuation allowance is established in a period, an expense must be recorded within the income tax provision in the consolidated statements of operations. As of December 31, 2016, the Company maintains a valuation allowance of $276.6 million, $269.7 million of which relates to its U.S. deferred income taxes. The largest component of the U.S. deferred income tax asset balance relates to tax loss carryforwards that have arisen as a result of losses generated from the Company's U.S. operations. Uncertainty over the Company's ability to utilize these losses over the short-term has led the Company to record a valuation allowance.
Future events may result in the valuation allowance being adjusted, which could materially impact our financial position and results of operations. If sufficient positive evidence were to arise in the future indicating that all or a portion of the deferred income tax
36 | ||
KINGSWAY FINANCIAL SERVICES INC. Management's Discussion and Analysis | ||
assets would meet the more likely than not standard, the valuation allowance would be reversed in the period that such a conclusion was reached.
Valuation and Impairment Assessment of Intangible Assets
Intangible assets are recorded at their estimated fair values at the date of acquisition. Intangible assets with definite useful lives consist of vehicle service agreements in-force ("VSA in-force"), database, customer relationships, contract-based revenues and in-place lease. Intangible assets with definite useful lives are reviewed for impairment whenever events or changes in circumstances indicate that the carrying amount of an asset or asset group may not be recoverable. If circumstances require that a definite-lived intangible asset be tested for possible impairment, we first compare the undiscounted cash flows expected to be generated by that definite-lived intangible asset to its carrying amount. If the carrying amount of the definite-lived intangible asset is not recoverable on an undiscounted cash flow basis, an impairment is recognized to the extent that the carrying amount exceeds its fair value.
Indefinite-lived intangible assets consist of a tenant relationship, insurance licenses and trade name. Intangible assets with an indefinite life are assessed for impairment annually as of December 31, or more frequently if events or circumstances indicate that the carrying value may not be recoverable. The Company has the option to perform a qualitative assessment to determine whether it is more likely than not that an indefinite-lived intangible asset is impaired. If facts and circumstances indicate that it is more likely than not that the intangible asset is impaired, a fair value-based impairment test would be required. Management must make estimates and assumptions in determining the fair value of indefinite-lived intangible assets that may affect any resulting impairment write-down. This includes assumptions regarding future cash flows and future revenues from the related intangible assets or their reporting units. Management then compares the fair value of the indefinite-lived intangible assets to their respective carrying amounts. If the carrying amount of an intangible asset exceeds the fair value of that intangible asset, an impairment is recorded. Additional information regarding our intangible assets is included in Note 12, "Intangible Assets," to the Consolidated Financial Statements.
Goodwill Recoverability
Goodwill is assessed for impairment annually as of December 31, or more frequently if events or circumstances indicate that the carrying value may not be recoverable. The Company has the option to perform a qualitative assessment to determine whether it is more likely than not that the fair value of a reporting unit is less than its carrying amount. If facts and circumstances indicate that it is more likely than not that the goodwill is impaired, a fair value-based impairment test would be required. The goodwill impairment test is a two-step process that requires management to make judgments in determining what assumptions to use in the calculation. The first step of the process consists of estimating the fair value of each reporting unit based on valuation techniques, including a discounted cash flow model using revenue and profit forecasts, and comparing those estimated fair values with the carrying values of the assets and liabilities of the reporting unit, which includes the allocated goodwill. If the estimated fair value is less than the carrying value, a second step is performed to compute the amount of the impairment, if any, by determining an implied fair value of goodwill. The determination of the implied fair value of goodwill of a reporting unit requires management to allocate the estimated fair value of the reporting unit to the assets and liabilities of the reporting unit. Any unallocated fair value represents the implied fair value of goodwill, which is compared to its corresponding carrying value. For reporting units with a negative book value, qualitative factors are evaluated to determine whether it is necessary to perform the second step of the goodwill impairment test. Additional information regarding our goodwill is included in Note 11, "Goodwill," to the Consolidated Financial Statements.
Deferred Acquisition Costs
Deferred acquisition costs represent the deferral of expenses that we incur related to successful efforts to acquire new business or renew existing business. Acquisition costs, primarily commissions, premium taxes and underwriting and agency expenses related to issuing insurance policies and vehicle service agreements, are deferred and charged against income ratably over the terms of the related insurance policies and vehicle service agreements. Management regularly reviews the categories of acquisition costs that are deferred and assesses the recoverability of this asset. For Insurance Underwriting, a premium deficiency and a corresponding charge to income is recognized if the sum of the expected losses and loss adjustment expenses, unamortized acquisition costs and maintenance costs exceeds related unearned premiums and anticipated net investment income.
Derivative Financial Instruments
Derivative financial instruments include investments in warrants and performance shares issued to the Company under various performance share grant agreements. Refer to Note 27, "Related Party Transactions," to the Consolidated Financial Statements, for further details regarding the performance shares. Warrants are classified as equity investments in the consolidated balance sheets.
37 | ||
KINGSWAY FINANCIAL SERVICES INC. Management's Discussion and Analysis | ||
We measure derivative financial instruments at fair value. Warrants are recorded at fair value using quoted market values based on latest bid prices, where active markets exist, or models based on significant market observable inputs, where no active markets exist. The performance shares, for which no active market exists, are required to be valued at fair value as determined in good faith by the Company. Such determination of fair value would require us to develop a model based upon relevant observable market inputs as well as significant unobservable inputs, including developing a sufficiently reliable estimate for an appropriate discount to reflect the illiquidity and unique structure of the security. The Company determined that its model for the performance shares was not sufficiently reliable. As a result, we have assigned a fair value of zero to the performance shares.
Fair Value Assumptions for Subordinated Debt Obligations
Our subordinated debt is measured and reported at fair value. The fair value of the subordinated debt is calculated using a model based on significant market observable inputs and inputs developed by a third-party. These inputs include credit spread assumptions developed by a third-party and market observable swap rates.
Contingent Consideration
The consideration for certain of the Company's acquisitions includes future payments to the former owners that are contingent upon the achievement of certain targets over future reporting periods. Liabilities for contingent consideration are measured and reported at fair value at the date of acquisition with subsequent changes reported in the consolidated statements of operations as contingent consideration benefit or expense. The fair value of contingent consideration liabilities is estimated using valuation models designed to estimate the probability of such contingent payments based on various assumptions. Estimated payments are discounted using present value techniques to arrive at the estimated fair value at the balance sheet date. We revalue these contingent consideration liabilities each reporting period. Changes in the fair value of contingent consideration liabilities can result from changes to one or multiple inputs, including adjustments to the discount rates or changes in the assumed achievement or timing of any targets. These fair value measurements are based on significant inputs not observable in the market. Management must use judgment in determining the appropriateness of these assumptions as of the acquisition date and for each subsequent period. Changes in assumptions could have a material impact on the amount of contingent consideration benefit or expense reported in the consolidated statements of operations and an impact on the payout of contingent consideration liabilities. Additional information regarding our contingent consideration liabilities is included in Note 26, "Fair Value of Financial Instruments," to the Consolidated Financial Statements.
38 | ||
KINGSWAY FINANCIAL SERVICES INC. Management's Discussion and Analysis | ||
RESULTS OF CONTINUING OPERATIONS
Comparison of the Years Ended December 31, 2016 and 2015:
A reconciliation of total segment operating loss to net income (loss) for the years ended December 31, 2016 and 2015 is presented in Table 1 below:
Table 1 Segment Operating (Loss) Income for the Years Ended December 31, 2016 and 2015
For the years ended December 31 (in thousands of dollars)
2016 | 2015 | Change | ||||
Segment operating (loss) income | ||||||
Insurance Underwriting | (8,202 | ) | (1,147 | ) | (7,055 | ) |
Insurance Services | 506 | (628 | ) | 1,134 | ||
Leased Real Estate | 627 | — | 627 | |||
Total segment operating loss | (7,069 | ) | (1,775 | ) | (5,294 | ) |
Net investment income | 8,200 | 2,918 | 5,282 | |||
Net realized gains | 360 | 1,197 | (837 | ) | ||
Other-than-temporary impairment loss | (157 | ) | (10 | ) | (147 | ) |
Amortization of intangible assets | (1,242 | ) | (1,244 | ) | 2 | |
Contingent consideration benefit | 657 | 1,139 | (482 | ) | ||
Interest expense not allocated to segments | (4,496 | ) | (5,278 | ) | 782 | |
Other income and expenses not allocated to segments, net | (7,596 | ) | (3,753 | ) | (3,843 | ) |
Foreign exchange losses, net | (15 | ) | (1,215 | ) | 1,200 | |
(Loss) gain on change in fair value of debt | (3,721 | ) | 1,458 | (5,179 | ) | |
Gain (loss) on deconsolidation of subsidiaries | 5,643 | (4,420 | ) | 10,063 | ||
Equity in net loss of investees | (1,017 | ) | (339 | ) | (678 | ) |
Loss from continuing operations before income tax expense | (10,453 | ) | (11,322 | ) | 869 | |
Income tax (benefit) expense | (9,720 | ) | 93 | (9,813 | ) | |
Loss from continuing operations | (733 | ) | (11,415 | ) | 10,682 | |
Income from discontinued operations, net of taxes | — | 1,417 | (1,417 | ) | ||
Gain on disposal of discontinued operations, net of taxes | 1,255 | 11,267 | (10,012 | ) | ||
Net income (loss) | 522 | 1,269 | (747 | ) | ||
Loss from Continuing Operations, Net Income (Loss) and Diluted Earnings (Loss) per Share
For the year ended December 31, 2016, we incurred a loss from continuing operations of $0.7 million ($0.04 per diluted share) compared to $11.4 million ($0.60 per diluted share) for the year ended December 31, 2015. The loss from continuing operations for the year ended December 31, 2016 is primarily attributable to operating loss in Insurance Underwriting, income and expenses not allocated to segments, interest expense not allocated to segments, and loss on change in fair value of debt, partially offset by net investment income, gain on deconsolidation of subsidiary and income tax benefit. The loss from continuing operations for the year ended December 31, 2015 is primarily attributable to operating losses in Insurance Underwriting and Insurance Services, interest expense not allocated to segments, income and expenses not allocated to segments and loss on deconsolidation of subsidiary, partially offset by net investment income, and gain on change in fair value of debt.
For the year ended December 31, 2016, we reported net income of 0.5 million ($0.02 per diluted share) compared to net income of $1.3 million ($0.04 per diluted share) for the year ended December 31, 2015.
Insurance Underwriting
For the year ended December 31, 2016, Insurance Underwriting gross premiums written were $132.7 million compared to$116.4 million for the year ended December 31, 2015, representing a 14.0% increase. Net premiums written increased 14.0% to $132.5
39 | ||
KINGSWAY FINANCIAL SERVICES INC. Management's Discussion and Analysis | ||
million for the year ended December 31, 2016 compared with $116.2 million for the year ended December 31, 2015. Net premiums earned increased 8.7% to $127.6 million for the year ended December 31, 2016 compared with $117.4 million for the year ended December 31, 2015. The increase in gross premiums written, net premiums written and net premiums earned reflect a change in the mix of business by state resulting from Insurance Underwriting’s strategic shift to emphasize certain states and de-emphasize others while also reflecting the competitive market dynamics of each state. Of particular note, the Company has recorded increased premiums written in Florida, Texas and Nevada while reducing premiums written in Virginia, a state in which Insurance Underwriting ceased writing new business beginning in the third quarter of 2015.
The Insurance Underwriting operating loss increased to $8.2 million for the year ended December 31, 2016 compared to $1.1 million for the year ended December 31, 2015. The increase in operating loss is primarily attributed to an increase in loss and loss adjustment expenses, partially offset by an increase in net premiums earned in 2016 as compared to 2015. During the fourth quarter of 2016, the Company recorded unfavorable development of approximately $9.1 million related to accident years 2015 and prior in the Company’s continuing operations, while approximately $1.5 million of favorable development was recorded during the fourth quarter related to the continuing run-offs at Amigo and MCC. In response to industry trends of increasing frequency and severity, Mendota and MCC have been aggressively increasing premium rates throughout the second half of 2016 and into 2017. During this same period, the Company has hired several new members to the Insurance Underwriting management team, including a new President and two new Vice Presidents to supervise the Claim Department. The new management team has already launched a number of initiatives related to increasing policy fee income, reducing bad debt expense, outsourcing the first notice of loss function, outsourcing much of the salvage and subrogation function and entering into an agreement with an outside vendor to migrate to a new policy administration and claim-handling operating platform sometime in 2017.
The Insurance Underwriting loss and loss adjustment expense ratio for 2016 was 81.8% compared to 74.1% in 2015. The increase in the loss and loss adjustment expense ratio is primarily attributable to the increased loss and loss adjustment expenses recorded in the fourth quarter of 2016 related to accident years 2015 and prior as described above.
The Insurance Underwriting expense ratio was 24.3% in 2016 compared with 27.4% in 2015. The decrease in the expense ratio is primarily due to the increase in net premiums earned and policy fee income for 2016 as compared to 2015. The Insurance Underwriting expense ratio includes policy fee income of $9.8 million and $8.3 million, respectively, for the years ended December 31, 2016 and December 31, 2015.
The Insurance Underwriting combined ratio was 106.1% in 2016 compared with 101.5% in 2015, reflecting the dynamics which affected the loss and loss adjustment expense ratio and expense ratio.
Insurance Services
The Insurance Services service fee and commission income increased 5.2% to $24.2 million for the year ended December 31, 2016 compared with $23.0 million for the year ended December 31, 2015. This increase was due to increased service fee and commission income at both IWS and Trinity. The Insurance Services operating income was $0.5 million for the year ended December 31, 2016 compared with operating loss of $0.6 million for the year ended December 31, 2015. The increase in operating income is primarily related to lower staff-related expenses at Trinity along with increased service fee and commission income at both IWS and Trinity for the year ended December 31, 2016 compared to the same period in 2015.
Leased Real Estate
Leased Real Estate rental income was $5.4 million for the year ended December 31, 2016 compared to zero for the year ended December 31, 2015. The rental income is derived from CMC's long-term triple net lease. The Company acquired 81% of CMC on July 14, 2016. The Leased Real Estate operating income was $0.6 million for the year ended December 31, 2016 compared to zero for the year ended December 31, 2015. Leased Real Estate operating income includes interest expense of $2.9 million and zero for the years ended December 31, 2016 and 2015, respectively. See "Investments" section below for further discussion.
Net Investment Income
Net investment income increased to $8.2 million in 2016 compared to $2.9 million in 2015. The increase in 2016 is primarily due to income from the Company's limited liability investment at fair value. During 2016, the Company recorded net investment income related to this investment of $4.7 million.
40 | ||
KINGSWAY FINANCIAL SERVICES INC. Management's Discussion and Analysis | ||
Net Realized Gains
The Company incurred net realized gains of $0.4 million in 2016 compared to $1.2 million in 2015. The net realized gains in 2016 resulted primarily from the liquidation of equity investments in Insurance Underwriting. The net realized gains in 2015 resulted primarily from the liquidation of limited liability investments in Insurance Underwriting.
Other-Than-Temporary Impairment Loss
As a result of the analysis performed by the Company to determine declines in market value that are other-than-temporary, the Company recorded write downs of $0.1 million and $0.1 million for other-than-temporary impairment related to equity investments and limited liability investments, respectively, for the year ended December 31, 2016 and $0.0 million for other-than-temporary impairment related to fixed maturities for the year ended December 31, 2015.
Amortization of Intangible Assets
The Company's intangible assets with definite useful lives are amortized over their estimated useful lives. Amortization of intangible assets was $1.2 million in 2016 compared to $1.2 million in 2015.
Contingent Consideration Benefit
Contingent consideration benefit was $0.7 million in 2016 compared to $1.1 million in 2015. Contingent consideration liabilities resulting from the acquisitions of IWS and Trinity were estimated at their respective acquisition dates using valuation models designed to estimate the probability of such contingent payments based on various assumptions. The valuation models assume certain achievement of targets, discount rates related to riskiness of the projections used and the time value of money to calculate the net present value of future consideration payments. Each reporting period, the Company reevaluates its contingent consideration liabilities and, if significant, makes adjustments to the recorded liabilities.
The benefit recorded for the year ended December 31, 2016 is attributable to the Company having executed an agreement with the former owners of IWS. The asset purchase agreement executed by the Company in 2012 related to the acquisition of IWS provided that additional payments were due to the former owners of IWS contingent upon the achievement of certain targets over future reporting periods. The parties to the agreement agreed to a fixed payment and other consideration in exchange for extinguishing the rights to future contingent payments. The benefit recorded for the year ended December 31, 2015 is the result of the Company's evaluation of its contingent consideration liabilities. At December 31, 2016 and 2015, the Company has total contingent liabilities of $0.3 million and $2.0 million, respectively, which is included in accrued expenses and other liabilities on the consolidated balance sheets. See Note 26, "Fair Value of Financial Instruments," to the Consolidated Financial Statements, for further details.
Interest Expense not Allocated to Segments
Interest expense not allocated to segments for 2016 was $4.5 million compared to $5.3 million in 2015. The decrease is attributable to the repayment during June 2015 of the outstanding principal balance on the LROC preferred units due June 30, 2015.
Other Income and Expenses not Allocated to Segments, Net
Other income and expenses not allocated to segments was a net expense of $7.6 million in 2016 compared to $3.8 million in 2015. The increase in net expense is primarily the result of a $6.0 million gain recorded during the first quarter of 2015 related to the termination of the Company's management services agreement with PIH, as further discussed in Note 27, "Related Party Transactions," to the Consolidated Financial Statements, partially offset by less general expense for salaries in 2016 as compared to 2015.
Foreign Exchange Losses, Net
During 2016, the Company incurred foreign exchange losses, net of $0.0 million compared to $1.2 million in 2015. Foreign exchange losses, net for the year ended December 31, 2015 were incurred primarily related to conversion of the net Canadian dollar assets of Kingsway Linked Return of Capital Trust ("KLROC Trust"). The Company deconsolidated KLROC Trust in June 2015.
41 | ||
KINGSWAY FINANCIAL SERVICES INC. Management's Discussion and Analysis | ||
(Loss) Gain on Change in Fair Value of Debt
The loss on change in fair value of debt amounted to $3.7 million in 2016 compared to a gain of $1.5 million in 2015. The 2016 loss is due to an increase in the fair value of the subordinated debt, whereas the 2015 gain is due to a decrease in the fair values of the subordinated debt and LROC preferred units. See "Debt" section below for further information.
Gain (Loss) on Deconsolidation of Subsidiaries
Prior to the third quarter of 2016, the Company owned 61.0% of the outstanding units of 1347 Investors. Because the Company owned more than 50% of the outstanding units, the Company had been consolidating the financial statements of 1347 Investors. During the third quarter of 2016, the Company's ownership percentage in 1347 Investors was reduced to 26.7%. As a result of this change in ownership, the Company recorded a non-cash gain on deconsolidation of 1347 Investors of $5.6 million during the third quarter of 2016. This gain results from removing the carrying value of the noncontrolling interest in 1347 Investors and the carrying value of the consolidated net assets of 1347 Investors, which the Company reported prior to the closing of the transaction, and recording the fair value of the Company's 26.7% retained noncontrolling investment in 1347 Investors as of the transaction date. Refer to the "Investments" section below and Note 6, "Disposition, Deconsolidations and Discontinued Operations," to the Consolidated Financial Statements, for further discussion.
Prior to the second quarter of 2015, the Company beneficially owned and controlled 74.8% of KLROC Trust. As a result, the Company had been consolidating the financial statements of KLROC Trust. During the second quarter of 2015, the Company’s controlling interest in KLROC Trust was reduced to zero upon the Company's repayment of its C$15.8 million outstanding on its LROC preferred units due June 30, 2015. As a result, the Company recorded a non-cash loss on deconsolidation of subsidiary of $4.4 million during the year ended December 31, 2015. This reported loss results from removing the net assets and accumulated other comprehensive loss of KLROC Trust from the Company’s consolidated balance sheets. Refer to Note 6, "Disposition, Deconsolidations and Discontinued Operations," to the Consolidated Financial Statements, for further discussion.
Equity in Net Loss of Investees
Equity in net loss of investees of $1.0 million and $0.3 million for the years ended December 31, 2016 and 2015, respectively, represents the loss related to the Company's investments in Itasca Capital Ltd. and 1347 Capital Corp. See Note 8, "Investments in Investees," to the Consolidated Financial Statements, for further discussion.
Income Tax (Benefit) Expense
Income tax benefit for 2016 was $9.7 million compared to income tax expense of $0.1 million in 2015. The 2016 income tax benefit is related to the partial release of the Company’s valuation allowance carried against its deferred income tax assets as a result of its acquisition of CMC. See Note 18, "Income Taxes," to the Consolidated Financial Statements, for additional detail of the income tax (benefit) expense recorded for the years ended December 31, 2016 and 2015, respectively.
42 | ||
KINGSWAY FINANCIAL SERVICES INC. Management's Discussion and Analysis | ||
Comparison of the Years Ended December 31, 2015 and 2014:
A reconciliation of total segment operating (loss) income to net income (loss) for the years ended December 31, 2015 and 2014 is presented in Table 2 below:
Table 2 Segment Operating (Loss) Income for the Years Ended December 31, 2015 and 2014
For the years ended December 31 (in thousands of dollars)
2015 | 2014 | Change | ||||
Segment operating (loss) income | ||||||
Insurance Underwriting | (1,147 | ) | 1,290 | (2,437 | ) | |
Insurance Services | (628 | ) | 206 | (834 | ) | |
Total segment operating (loss) income | (1,775 | ) | 1,496 | (3,271 | ) | |
Net investment income | 2,918 | 1,616 | 1,302 | |||
Net realized gains | 1,197 | 5,041 | (3,844 | ) | ||
Other-than-temporary impairment loss | (10 | ) | — | (10 | ) | |
Amortization of intangible assets | (1,244 | ) | (1,620 | ) | 376 | |
Contingent consideration benefit | 1,139 | 2,223 | (1,084 | ) | ||
Impairment of asset held for sale | — | (1,180 | ) | 1,180 | ||
Interest expense not allocated to segments | (5,278 | ) | (5,645 | ) | 367 | |
Other income and expenses not allocated to segments, net | (3,753 | ) | (4,887 | ) | 1,134 | |
Foreign exchange losses, net | (1,215 | ) | (419 | ) | (796 | ) |
Gain (loss) on change in fair value of debt | 1,458 | (10,953 | ) | 12,411 | ||
Loss on disposal of subsidiary | — | (1,244 | ) | 1,244 | ||
Loss on disposal of asset held for sale | — | (125 | ) | 125 | ||
Loss on deconsolidation of subsidiary | (4,420 | ) | — | (4,420 | ) | |
Equity in net loss of investee | (339 | ) | (190 | ) | (149 | ) |
Loss from continuing operations before income tax expense (benefit) | (11,322 | ) | (15,887 | ) | 4,565 | |
Income tax expense (benefit) | 93 | (1,221 | ) | 1,314 | ||
Loss from continuing operations | (11,415 | ) | (14,666 | ) | 3,251 | |
Income from discontinued operations, net of taxes | 1,417 | 3,442 | (2,025 | ) | ||
Gain on disposal of discontinued operations, net of taxes | 11,267 | — | 11,267 | |||
Net income (loss) | 1,269 | (11,224 | ) | 12,493 | ||
Loss from Continuing Operations, Net Income (Loss) and Diluted Earnings (Loss) per Share
For the year ended December 31, 2015, we incurred a loss from continuing operations of $11.4 million ($0.60 per diluted share) compared to $14.7 million ($0.95 per diluted share) for the year ended December 31, 2014. The loss from continuing operations for the year ended December 31, 2015 is primarily attributable to operating loss in Insurance Underwriting and Insurance Services, interest expense not allocated to segments, income and expenses not allocated to segments and loss on deconsolidation of subsidiary, partially offset by net investment income and gain on change in fair value of debt. The loss from continuing operations for the year ended December 31, 2014 is attributable to impairment of asset held for sale, interest expense not allocated to segments, income and expenses not allocated to segments, loss on change in fair value of debt and loss on disposal of subsidiary, partially offset by net realized gains, contingent consideration benefit and operating income in Insurance Services and Insurance Underwriting.
For the year ended December 31, 2015, we reported net income of $1.3 million ($0.04 per diluted share) compared to net loss of $11.2 million ($0.75 per diluted share) for the year ended December 31, 2014.
43 | ||
KINGSWAY FINANCIAL SERVICES INC. Management's Discussion and Analysis | ||
Insurance Underwriting
For the year ended December 31, 2015, Insurance Underwriting gross premiums written were $116.4 million compared to $114.0 million for the year ended December 31, 2014, representing a 2.1% increase. Net premiums written decreased 1.5% to $116.2 million for the year ended December 31, 2015 compared with $118.0 million for the year ended December 31, 2014. Net premiums earned increased 3.4% to $117.4 million for the year ended December 31, 2015 compared with $113.5 million for the year ended December 31, 2014. The increase in gross premiums written and net premiums earned results primarily from increased premium volumes written in Florida during the year ended December 31, 2015 compared to prior year.
The Insurance Underwriting operating loss increased to $1.1 million for the year ended December 31, 2015 compared to operating income of $1.3 million for the year ended December 31, 2014. The increase in operating loss is primarily attributed to an increase in loss and loss adjustment expenses, partially offset by an increase in net premiums earned and a decrease in general expenses in 2015 as compared to 2014.
The Insurance Underwriting loss and loss adjustment expense ratio for 2015 was 74.1% compared to 69.7% in 2014. The increase in the loss and loss adjustment expense ratio is primarily attributable to lower favorable development related to property and casualty unpaid loss and loss adjustment expenses at Amigo and MCC in 2015 compared to 2014 due to the continuing voluntary run-offs of Amigo and MCC.
The Insurance Underwriting expense ratio was 27.4% in 2015 compared with 29.5% in 2014. The decrease in the expense ratio is primarily due to an overall reduction in general expenses. The Insurance Underwriting expense ratio includes policy fee income of $8.3 million and $8.1 million, respectively, for the years ended December 31, 2015 and December 31, 2014.
The Insurance Underwriting combined ratio was 101.5% in 2015 compared with 99.2% in 2014, reflecting the dynamics which affected the loss and loss adjustment expense ratio and expense ratio.
Insurance Services
The Insurance Services service fee and commission income decreased 6.9% to $23.0 million for the year ended December 31, 2015 compared with $24.7 million for the year ended December 31, 2014. This decrease was due to decreased service fee and commission income at IWS. The Insurance Services operating loss was $0.6 million for the year ended December 31, 2015 compared with operating income of $0.2 million for the year ended December 31, 2014. The increase in operating loss is primarily related to decreased service fee and commission income at IWS and increased general and administrative expenses at Trinity for the year ended December 31, 2015 compared to the same period in 2014.
Net Investment Income
Net investment income increased to $2.9 million in 2015 compared to $1.6 million in 2014. The increase in 2015 is due to an increase in income from limited liability investments. Income from limited liability investments is recognized based on the Company's share of the earnings of the limited liability entities.
Net Realized Gains
The Company incurred net realized gains of $1.2 million in 2015 compared to $5.0 million in 2014. The net realized gains in 2015 resulted primarily from the liquidation of limited liability investments in Insurance Underwriting. The net realized gains in 2014 resulted primarily from the liquidation of equity investments in Insurance Underwriting.
Amortization of Intangible Assets
The Company's intangible assets with definite useful lives are amortized over their estimated useful lives. Amortization of intangible assets was $1.2 million in 2015 compared to $1.6 million in 2014. The decrease is primarily attributed to less amortization expense related to the IWS VSA in-force intangible asset in 2015 compared to 2014. The VSA in-force asset is amortized over a seven-year term as the corresponding deferred service fees acquired are earned as revenue.
Contingent Consideration Benefit
Contingent consideration benefit was $1.1 million in 2015 compared to $2.2 million in 2014. Contingent consideration liabilities resulting from the acquisitions of IWS and Trinity were estimated at their respective acquisition dates using valuation models designed to estimate the probability of such contingent payments based on various assumptions. Each reporting period, the Company reevaluates its contingent consideration liabilities and, if significant, makes adjustments to the recorded liabilities. As a result of the analyses performed in 2015 and 2014, the Company decreased contingent consideration liabilities by $1.5 million
44 | ||
KINGSWAY FINANCIAL SERVICES INC. Management's Discussion and Analysis | ||
and $3.0 million, respectively, during the fourth quarters of 2015 and 2014, resulting in a total liability of $2.0 million and $3.1 million, respectively, at December 31, 2015 and 2014, which is included in accrued expenses and other liabilities on the consolidated balance sheets. See Note 26, "Fair Value of Financial Instruments," to the Consolidated Financial Statements, for further details.
Impairment of Asset Held for Sale
Prior to the fourth quarter of 2014, property consisting of building and land located in Miami, Florida with a carrying value of $5.2 million was classified as held for sale. As a result of declines in the fair value of the property, the Company recorded an impairment write-down of $1.2 million related to the asset held for sale during the year ended December 31, 2014.
Interest Expense not Allocated to Segments
Interest expense not allocated to segments for 2015 was $5.3 million compared to $5.6 million in 2014. The decrease is attributable to the repayment during June 2015 of the outstanding principal balance on the LROC preferred units due June 30, 2015.
Other Income and Expenses not Allocated to Segments, Net
Other income and expenses not allocated to segments was a net expense of $3.8 million in 2015 compared to $4.9 million in 2014. The decrease in net expense is primarily the result of a $6.0 million gain recorded during the first quarter of 2015 related to the termination of the Company's management services agreement with PIH, as further discussed in Note 27, "Related Party Transactions," to the Consolidated Financial Statements, partially offset by less general expense for salaries, employee benefits and professional fees in 2014 as compared to 2015, and $2.3 million of income reported during the first quarter of 2014 related to PIH. As further discussed in Note 6, "Disposition, Deconsolidations and Discontinued Operations," to the Consolidated Financial Statements, effective March 31, 2014, PIH completed an initial public offering of its common stock. The earnings of PIH are included in the consolidated statements of operations through the March 31, 2014 transaction date. Prior to the transaction, PIH was included in the Insurance Underwriting segment. As a result of the disposal of the Company's majority interest in PIH on March 31, 2014, all segmented information has been restated to exclude PIH from the Insurance Underwriting segment and to include its earnings in other income and expenses not allocated to segments, net.
Foreign Exchange Losses, Net
During 2015, the Company incurred foreign exchange losses, net of $1.2 million compared to $0.4 million in 2014. Foreign exchange losses, net for the years ended December 31, 2015 and 2014 were incurred primarily related to conversion of the net Canadian dollar assets of KLROC Trust.
Gain (Loss) on Change in Fair Value of Debt
The gain on change in fair value of debt amounted to $1.5 million in 2015 compared to a loss of $11.0 million in 2014. The 2015 gain is primarily due to a decrease in the fair values of the subordinated debt and LROC preferred units, whereas the 2014 loss is due to an increase in the fair value of the Company's subordinated debt, partially offset by a decrease in the fair value of the LROC preferred units. For information regarding the Company's approach to determining fair value of debt, see Note 26, "Fair Value of Financial Instruments," to the Consolidated Financial Statements.
Loss on Disposal of Subsidiary
Effective March 31, 2014, the Company's wholly owned subsidiary, PIH, completed an initial public offering of its common stock. Upon completion of the transaction, the Company maintained a minority ownership interest in the common shares of PIH. As a result of the disposal, the Company recognized a loss of $1.2 million in 2014. See Note 6, "Disposition, Deconsolidations and Discontinued Operations," to the Consolidated Financial Statements, for further details.
Loss on Disposal of Asset Held for Sale
During the fourth quarter of 2014, the Company completed a sale and leaseback transaction involving building and land located in Miami, Florida, which was previously recorded as asset held for sale. Net proceeds were $4.3 million after deducting direct costs of the transaction. The Company recognized a loss of $0.1 million equal to the difference between the fair market value and the carrying value of the property at the date of the transaction. See Note 13, "Property and Equipment," to the Consolidated Financial Statements, for further details.
45 | ||
KINGSWAY FINANCIAL SERVICES INC. Management's Discussion and Analysis | ||
Loss on Deconsolidation of Subsidiary
Prior to the second quarter of 2015, the Company beneficially owned and controlled 74.8% of KLROC Trust. As a result, the Company had been consolidating the financial statements of KLROC Trust. During the second quarter of 2015, the Company’s controlling interest in KLROC Trust was reduced to zero upon the Company's repayment of its C$15.8 million outstanding on its LROC preferred units due June 30, 2015. As a result, the Company recorded a non-cash loss on deconsolidation of subsidiary of $4.4 million during the year ended December 31, 2015. This reported loss results from removing the net assets and accumulated other comprehensive loss of KLROC Trust from the Company’s consolidated balance sheets. Refer to Note 6, "Disposition, Deconsolidations and Discontinued Operations," to the Consolidated Financial Statements, for further discussion.
Equity in Net Loss of Investee
Equity in net loss of investee of $0.3 million and $0.2 million for the years ended December 31, 2015 and 2014, respectively, represents the loss related to the Company's investment in 1347 Capital Corp. See Note 8, "Investments in Investees," to the Consolidated Financial Statements, for further discussion.
Income Tax Expense (Benefit)
Income tax expense for 2015 was $0.1 million compared to a tax benefit of $1.2 million in 2014. See Note 18, "Income Taxes," to the Consolidated Financial Statements, for additional detail of the income tax expense (benefit) recorded for the years ended December 31, 2015 and 2014, respectively.
46 | ||
KINGSWAY FINANCIAL SERVICES INC. Management's Discussion and Analysis | ||
INVESTMENTS
Portfolio Composition
All of our investments in fixed maturities and equity investments are classified as available-for-sale and are reported at fair value. At December 31, 2016, we held cash and cash equivalents and investments with a carrying value of $163.5 million. Investments held by our insurance subsidiaries must comply with applicable domiciliary state regulations that prescribe the type, quality and concentration of investments. Our U.S. operations typically invest in U.S. dollar-denominated instruments to mitigate their exposure to currency rate fluctuations.
Table 3 below summarizes the carrying value of investments, including cash and cash equivalents, at the dates indicated.
TABLE 3 Carrying value of investments, including cash and cash equivalents
As of December 31 (in thousands of dollars, except for percentages)
Type of investment | 2016 | % of Total | 2015 | % of Total | ||||||||
Fixed maturities: | ||||||||||||
U.S. government, government agencies and authorities | 28,148 | 17.2 | % | 20,453 | 12.8 | % | ||||||
States, municipalities and political subdivisions | 3,088 | 1.9 | % | 2,256 | 1.4 | % | ||||||
Mortgage-backed | 8,506 | 5.2 | % | 7,963 | 5.0 | % | ||||||
Asset-backed securities and collateralized mortgage obligations | 3,467 | 2.1 | % | 6,023 | 3.8 | % | ||||||
Corporate | 18,555 | 11.3 | % | 18,864 | 11.8 | % | ||||||
Total fixed maturities | 61,764 | 37.7 | % | 55,559 | 34.8 | % | ||||||
Equity investments: | ||||||||||||
Common stock | 21,426 | 13.1 | % | 26,586 | 16.7 | % | ||||||
Warrants | 1,804 | 1.1 | % | 973 | 0.6 | % | ||||||
Total equity investments | 23,230 | 14.2 | % | 27,559 | 17.3 | % | ||||||
Limited liability investments | 22,974 | 14.0 | % | 20,141 | 12.6 | % | ||||||
Limited liability investment, at fair value | 10,700 | 6.5 | % | — | — | % | ||||||
Other investments | 7,975 | 4.9 | % | 4,077 | 2.6 | % | ||||||
Short-term investments | 401 | 0.2 | % | 400 | 0.3 | % | ||||||
Total investments | 127,044 | 77.5 | % | 107,736 | 67.6 | % | ||||||
Cash and cash equivalents | 36,475 | 22.5 | % | 51,701 | 32.4 | % | ||||||
Total | 163,519 | 100.0 | % | 159,437 | 100.0 | % | ||||||
Other-Than-Temporary Impairment
The Company performs a quarterly analysis of its investment portfolio to determine if declines in market value are other-than-temporary. Further information regarding our detailed analysis and factors considered in establishing an other-than-temporary impairment on an investment is discussed within the "Critical Accounting Estimates and Assumptions" section of MD&A.
As a result of the analysis performed by the Company to determine declines in market value that are other-than-temporary, the Company recorded write downs of $0.1 million and $0.1 million for other-than-temporary impairment related to equity investments and limited liability investments, respectively, for the year ended December 31, 2016 and $0.0 million for other-than-temporary impairment related to fixed maturities for the year ended December 31, 2015. The Company did not recognize any impairment related to its investments that was considered other-than-temporary for the year ended December 31, 2014.
The length of time a fixed maturity investment may be held in an unrealized loss position may vary based on the opinion of the investment manager and their respective analyses related to valuation and to the various credit risks that may prevent us from recapturing the principal investment. In the case of a fixed maturity investment where the investment manager determines that
47 | ||
KINGSWAY FINANCIAL SERVICES INC. Management's Discussion and Analysis | ||
there is little or no risk of default prior to the maturity of a holding, we would elect to hold the investment in an unrealized loss position until the price recovers or the investment matures. In situations where facts emerge that might increase the risk associated with recapture of principal, the Company may elect to sell a fixed maturity investment at a loss.
Due to the inherent volatility of equity markets, we believe an equity investment may trade from time to time below its intrinsic value based on historical valuation measures. In these situations, an equity investment may be maintained in an unrealized loss position for different periods of time based on the underlying economic assumptions driving the investment manager’s valuation of the holding.
At December 31, 2016 and 2015, the gross unrealized losses for fixed maturities and equity investments amounted to $1.0 million and $2.6 million, respectively, and there were no unrealized losses attributable to non-investment grade fixed maturities. At each of December 31, 2016 and December 31, 2015, all unrealized losses on individual investments were considered temporary.
Limited Liability Investments
The Company owns investments in various limited liability companies ("LLCs"), limited partnerships ("LPs") and a general partnership ("GP") that primarily invest in income-producing real estate or real estate related investments. The Company's investments in these LLCs, LPs and GP are accounted for under the equity method of accounting and reported as limited liability investments in the consolidated balance sheets. The most recently available financial statements of the LLCs, LPs and GP are used in applying the equity method. The difference between the end of the reporting period of the LLCs, LPs and GP and that of the Company is no more than three months. Most of the real estate investments are held on a triple net lease basis whereby the lessee agrees to pay all real estate taxes, building insurance and maintenance. Table 4 below presents additional information pertaining to the limited liability investments at December 31, 2016 and 2015.
TABLE 4 Limited liability investments
As of December 31 (in thousands of dollars)
Carrying Value | ||||||
2016 | 2015 | |||||
Triple net lease limited liability investments | 12,190 | 10,809 | ||||
Other real estate related limited liability investments | 3,904 | 4,108 | ||||
Non-real estate limited liability investments | 6,880 | 5,224 | ||||
Total | 22,974 | 20,141 | ||||
Triple Net Lease Investments
Table 5 below presents total income from triple net lease investments included in the Company’s loss from continuing operations for the years ended December 31, 2016, 2015 and 2014.
TABLE 5 Income from triple net lease investments included in loss from continuing operations
As of December 31 (in thousands of dollars)
2016 | 2015 | 2014 | |||||||
Income from triple net lease limited liability investments | 1,381 | 1,701 | 140 | ||||||
Income from CMC operations | 519 | — | — | ||||||
Consolidated income tax benefit as a result of CMC acquisition | 9,915 | — | — | ||||||
Total income included in loss from continuing operations as a result of triple net lease investments and CMC acquisition | 11,815 | 1,701 | 140 | ||||||
48 | ||
KINGSWAY FINANCIAL SERVICES INC. Management's Discussion and Analysis | ||
The Company has been increasing its exposure to triple net lease investments. These can take the form of limited liability investments as well as the Company’s investment in CMC. See Note 5, "Acquisitions," to the Consolidated Financial Statements for further discussion regarding CMC.
Income from limited liability investments is recognized based on the Company's share of the earnings of the limited liability entities and is included in net investment income.
Income from CMC operations is consolidated, and for the year ended December 31, 2016, is comprised of segment income of $0.6 million, amortization of intangible assets of $0.0 million and income tax expense of $0.1 million.
Consolidated income tax benefit as a result of CMC acquisition is related to the partial release of the Company's valuation allowance carried against its deferred income tax assets as a result of the acquisition of CMC.
Given that the Company has now completed its fair value analysis of its acquisition of CMC, the Company expects to record income each year based upon the rental income recognized under its existing triple net lease agreement on the Real Property less operating expenses, which are comprised principally of interest on the Mortgage and depreciation and amortization of certain of the assets acquired. Over the next four years, the Company generally expects to recognize in its consolidated statements of operations income of approximately $1.3 to $1.6 million per year related to its ownership of CMC. The Company does not expect any positive cash flow to be available from its ownership of CMC given that all cash rental income generated by the Real Property is applied to make principal and interest payments on the Mortgage. Any material cash flow to the Company is likely to occur only upon the occurrence of one of the three events that would trigger payment of service fees. There can be no assurance as to the timing of the occurrence, or the resulting outcome, from one of these events. Refer to the "Liquidity and Capital Resources" section below for further discussion.
Limited Liability Investment, at Fair Value
The Company's investment in 1347 Investors is accounted for at fair value and reported as limited liability investment, at fair value in the consolidated balance sheets. As of December 31, 2016 and December 31, 2015, the carrying value of the Company's limited liability investment, at fair value was $10.7 million and zero, respectively. Refer to Note 6, "Disposition, Deconsolidations and Discontinued Operations," to the Consolidated Financial Statements, for further discussion.
Originally, the Company owned 61.0% of the outstanding units of 1347 Investors. Because the Company owned more than 50% of the outstanding units, 1347 Investors had been included in the consolidated financial statements of the Company. 1347 Investors had an investment in the common stock and private units of 1347 Capital Corp. which was reflected in investments in investees in the consolidated balance sheets. 1347 Capital Corp. was formed for the purpose of entering into a merger, share exchange, asset acquisition or other similar business combination with one or more businesses or entities.
On July 21, 2016, Limbach Holdings LLC announced the closing of its previously announced merger with 1347 Capital Corp. and was renamed Limbach Holdings, Inc. ("Limbach"). As a result of this transaction, the Company's ownership percentage in 1347 Investors was reduced from 61.0% to 26.7%, leading the Company to record a $5.6 million gain during the third quarter of 2016 related to the deconsolidation of 1347 Investors. This gain resulted from removing the carrying value of the noncontrolling interest in 1347 Investors and the carrying value of the consolidated net assets of 1347 Investors, and recording the fair value at the time of the transaction of the Company's 26.7% retained investment in 1347 Investors. At the time of the transaction, the noncontrolling interest representing 39.0% of 1347 Investors had been carried by the Company at $1.5 million.
As a result of recording a gain of $5.6 million in the consolidated statements of operations and a reduction to shareholders’ equity of $1.5 million from the removal of the noncontrolling interest in 1347 Investors, the Company reported a net increase in its shareholders' equity of $4.1 million during the third quarter of 2016 related to the closing of the Limbach merger and the related deconsolidation of 1347 Investors. Following the transaction, the principal asset of 1347 Investors is its holdings of Limbach common shares.
During the fourth quarter of 2016, the Company made an irrevocable election to account for its remaining 26.7% investment in 1347 Investors at fair value, with any changes in fair value to be reported in net investment income in the consolidated statements of operations. The fair value of this investment is calculated based on an internally developed model that distributes the net equity of 1347 Investors to all classes of membership interests. The model uses quoted market prices and significant market observable inputs. As a result of this election, the Company recorded net investment income of $4.7 million during the fourth quarter of 2016. Since the close of the Limbach merger with 1347 Capital Corp. on July 21, 2016, the Company has recorded $10.3 million in its consolidated statements of operations, and its shareholders’ equity has increased by $8.8 million.
49 | ||
KINGSWAY FINANCIAL SERVICES INC. Management's Discussion and Analysis | ||
PROPERTY AND CASUALTY UNPAID LOSS AND LOSS ADJUSTMENT EXPENSES
Property and casualty unpaid loss and loss adjustment expenses represent the estimated liabilities for reported loss events, IBNR loss events and the related estimated loss adjustment expenses.
Tables 6 and 7 present distributions, by line of business, of the provision for property and casualty unpaid loss and loss adjustment expenses gross and net of external reinsurance, respectively.
TABLE 6 Provision for property and casualty unpaid loss and loss adjustment expenses - gross
As of December 31 (in thousands of dollars)
Line of Business | 2016 | 2015 | ||
Non-standard automobile | 52,115 | 53,066 | ||
Commercial automobile | 918 | 1,358 | ||
Other | 762 | 1,047 | ||
Total | 53,795 | 55,471 | ||
TABLE 7 Provision for property and casualty unpaid loss and loss adjustment expenses - net of reinsurance recoverable
As of December 31 (in thousands of dollars)
Line of Business | 2016 | 2015 | ||
Non-standard automobile | 51,497 | 51,937 | ||
Commercial automobile | 855 | 1,280 | ||
Other | 762 | 1,047 | ||
Total | 53,114 | 54,264 | ||
Non-Standard Automobile
At December 31, 2016 and 2015, the gross provisions for property and casualty unpaid loss and loss adjustment expenses for our non-standard automobile business were $52.1 million and $53.1 million, respectively. The decrease is primarily due to the continuing voluntary run-off of Amigo, partially offset by an increase in unpaid loss and loss adjustment expenses at MCC.
Commercial Automobile
At December 31, 2016 and 2015, the gross provisions for property and casualty unpaid loss and loss adjustment expenses for our commercial automobile business were $0.9 million and $1.4 million, respectively. This decrease is primarily due to the continuing voluntary run-off of Amigo.
Information with respect to development of our provision for prior years' property and casualty unpaid loss and loss adjustment expenses is presented in Table 8.
TABLE 8 Increase (decrease) in prior years' provision for property and casualty unpaid loss and loss adjustment expenses by line of business and accident year
For the year ended December 31, 2016 (in thousands of dollars)
50 | ||
KINGSWAY FINANCIAL SERVICES INC. Management's Discussion and Analysis | ||
Accident Year | Non-standard Automobile | Commercial Automobile | Other | Total | ||||
2011 & prior | (193 | ) | 201 | 17 | 25 | |||
2012 | 338 | 325 | — | 663 | ||||
2013 | 205 | (224 | ) | — | (19 | ) | ||
2014 | 1,524 | — | — | 1,524 | ||||
2015 | 5,902 | — | — | 5,902 | ||||
Total | 7,776 | 302 | 17 | 8,095 | ||||
For the year ended December 31, 2015 (in thousands of dollars)
Accident Year | Non-standard Automobile | Commercial Automobile | Other | Total | ||||
2010 & prior | (457 | ) | (406 | ) | 120 | (743 | ) | |
2011 | (451 | ) | (7 | ) | — | (458 | ) | |
2012 | 1,018 | (432 | ) | — | 586 | |||
2013 | (935 | ) | (134 | ) | — | (1,069 | ) | |
2014 | 2,300 | — | — | 2,300 | ||||
Total | 1,475 | (979 | ) | 120 | 616 | |||
For the year ended December 31, 2014 (in thousands of dollars)
Accident Year | Non-standard Automobile | Commercial Automobile | Other | Total | ||||
2009 & prior | (2,560 | ) | (109 | ) | (845 | ) | (3,514 | ) |
2010 | (724 | ) | (381 | ) | (8 | ) | (1,113 | ) |
2011 | (1,981 | ) | (56 | ) | — | (2,037 | ) | |
2012 | 557 | (161 | ) | — | 396 | |||
2013 | 1,401 | (180 | ) | (76 | ) | 1,145 | ||
Total | (3,307 | ) | (887 | ) | (929 | ) | (5,123 | ) |
The net movements in prior years' provisions for property and casualty unpaid loss and loss adjustment expenses, net of reinsurance, was an increase of $8.1 million and $0.6 million, respectively, for the years ended December 31, 2016 and 2015 and a decrease of $5.1 million for the year ended December 31, 2014. Table 8 identifies the relative contribution of the increases (decreases) in the provisions for property and casualty unpaid loss and loss adjustment expenses attributable to the respective lines of business and accident years.
The unfavorable development in 2016 was primarily related to the increase in property and casualty unpaid loss and loss adjustment expenses at Mendota and MCC, offset by a decrease in property and casualty unpaid loss and loss adjustment expenses due to the continuing voluntary run-off of Amigo. Refer to the "Results of Continuing Operations, Insurance Underwriting" section above for further discussion. The unfavorable development in 2015 was primarily related to the increase in property and casualty unpaid loss and loss adjustment expenses at Mendota, offset by a decrease in property and casualty unpaid loss and loss adjustment expenses due to the continuing voluntary run-offs of Amigo and MCC. The favorable development in 2014 was primarily related to the decrease in property and casualty unpaid loss and loss adjustment expenses at Amigo and MCC. Original estimates are increased or decreased as additional information becomes known regarding individual claims.
DEBT
Note Payable
As part of the acquisition of CMC, the Company assumed a note payable with a principal amount of $180.0 million on the date of acquisition that matures on May 15, 2034 and has a fixed interest rate of 4.07%. The note payable was recorded at the date of acquisition at its estimated fair market value, which includes a premium of 11.7 million. This premium is being amortized through
51 | ||
KINGSWAY FINANCIAL SERVICES INC. Management's Discussion and Analysis | ||
the maturity date of the note payable using the effective interest rate method. The carrying value of the note payable at December 31, 2016 of $190.1 million represents its amortized cost.
Subordinated Debt
Between December 4, 2002 and December 16, 2003, six subsidiary trusts of the Company issued $90.5 million of 30-year capital securities to third-parties in separate private transactions. In each instance, a corresponding floating rate junior subordinated deferrable interest debenture was then issued by KAI to the trust in exchange for the proceeds from the private sale. The floating rate debentures bear interest at the rate of the London interbank offered interest rate for three-month U.S. dollar deposits ("LIBOR"), plus spreads ranging from 3.85% to 4.20%. The Company has the right to call each of these securities at par value any time after five years from their issuance until their maturity. During the first quarter of 2011, the Company gave notice to its Trust Preferred trustees of its intention to exercise its voluntary right to defer interest payments for up to 20 quarters, pursuant to the contractual terms of its outstanding indentures, which permit interest deferral. This action does not constitute a default under the Company's Trust Preferred indentures or any of its other debt indentures. On November 6, 2015, the Company paid $22.1 million to its Trust Preferred trustees to be used by the trustees to pay the interest which the Company had been deferring since the first quarter of 2011.
The Company's subordinated debt is measured and reported at fair value. At December 31, 2016, the carrying value of the subordinated debt is $43.6 million. The fair value of the subordinated debt is calculated using a model based on significant market observable inputs and inputs developed by a third-party. For a description of the market observable inputs and inputs developed by a third-party used in determining fair value of debt, see Note 26, "Fair Value of Financial Instruments," to the Consolidated Financial Statements.
During the year ended December 31, 2016, the Company experienced a decrease in the credit spread assumption developed by the third-party and an increase in the market observable swap rates. A decrease in the credit spread assumption has the effect of increasing the fair value of the Company’s subordinated debt while an increase in the credit spread assumption has the effect of decreasing the fair value. Changes in the market observable swap rates affect the fair value model in different ways. An increase in the LIBOR swap rates has the effect of increasing fair value while an increase in the risk-free swap rates has the effect of decreasing fair value. The other primary variable affecting the fair value of debt calculation is the passage of time, which will always have the effect of increasing the fair value of debt. The changes to the credit spread and swap rate variables throughout 2016, along with the passage of time, contributed to the $3.7 million increase in fair value of the Company’s subordinated debt between December 31, 2015 and December 31, 2016. This increase in fair value is reported as loss on change in fair value of debt in the Company’s consolidated statements of operations.
Though the changes in the model assumptions will continue to introduce volatility each quarter to the Company’s reported gain or loss on change in fair value of debt, the fair value of the Company’s subordinated debt will eventually equal the principal value of the subordinated debt by the time of the stated redemption date of each trust, beginning with the trust maturing on December 4, 2032 and continuing through January 8, 2034, the redemption date of the last of the Company’s outstanding trusts. As a result, it should be expected that, on average, the Company will continue to report quarterly and annual losses on change in fair value of debt and that from time to time these quarterly and annual losses may be material to the Company’s results of operations.
For a description of each of the Company's six subsidiary trusts, see Note 15, "Debt," to the Consolidated Financial Statements.
LIQUIDITY AND CAPITAL RESOURCES
The purpose of liquidity management is to ensure that there is sufficient cash to meet all financial commitments and obligations as they fall due. The liquidity requirements of the Company and its subsidiaries have been met primarily by funds generated from operations, capital raising, disposal of discontinued operations, investment maturities and income and other returns received on investments or from the sale of investments. Cash provided from these sources is used primarily for making investments and for loss and loss adjustment expense payments, debt servicing and other operating expenses. The timing and amount of payments for loss and loss adjustment expenses may differ materially from our provisions for unpaid loss and loss adjustment expenses, which may create increased liquidity requirements.
Cash Flows
During 2016, the net cash used in operating activities as reported on the consolidated statements of cash flows was $15.6 million. The reconciliation between the Company's reported net income of $0.5 million and the net cash used in operating activities of $15.6 million can be explained primarily by the gain on change in fair value of investments of $5.1 million, deferred income tax
52 | ||
KINGSWAY FINANCIAL SERVICES INC. Management's Discussion and Analysis | ||
expense of $9.8 million, the increase in premiums and service fee receivable of $4.9 million and the gain on deconsolidation of subsidiary of $5.6 million, partially offset by the loss on change in fair value of debt of $3.7 million and the increase in unearned premiums of $4.9 million.
During 2016, the net cash used in investing activities as reported on the consolidated statements of cash flows was $8.8 million. This use of cash was driven primarily by purchases of fixed maturities, equity investments, limited liability investments, other investments and short-term investments in excess of proceeds from sales and maturities of fixed maturities and equity investments.
During 2016, the net cash provided by financing activities as reported on the consolidated statements of cash flows was $9.1 million. This source of cash is attributed to the private placement of 1,615,384 shares of common stock at a purchase price of $6.50 per share with net proceeds to the Company of $10.5 million, offset by the Company's repurchase of its common stock for cancellation in the amount of $0.1 million during the second quarter of 2016 and principal repayments of $1.2 million on the Company's note payable.
In summary, as reported on the consolidated statements of cash flows, the Company's net decrease in cash and cash equivalents during 2016 was $15.2 million.
The Company's Insurance Underwriting subsidiaries fund their obligations primarily through premium and investment income and maturities in the investments portfolios. The Company's Insurance Services subsidiaries fund their obligations primarily through service fee and commission income. The Company's Leased Real Estate subsidiary funds its obligations through rental income.
The liquidity of the holding company is managed separately from its subsidiaries. Actions available to the holding company to raise liquidity in order to meet its obligations include the sale of passive investments; sale of subsidiaries; issuance of debt or equity securities; and giving notice to its Trust Preferred trustees of its intention to exercise its voluntary right to defer interest payments for up to 20 quarters, which right the Company previously exercised during the period from the first quarter of 2011 through the fourth quarter of 2015.
Receipt of dividends from the Insurance Underwriting subsidiaries is not generally considered a source of liquidity for the holding company. The insurance subsidiaries require regulatory approval for the return of capital and, in certain circumstances, prior to the payment of dividends. At December 31, 2016, the U.S. insurance subsidiaries of the Company were restricted from making any dividend payments to the holding company without regulatory approval pursuant to the domiciliary state insurance regulations.
Receipt of dividends from the Leased Real Estate segment is not generally considered a source of liquidity for the holding company. All cash rental income generated by the Real Property is applied to make principal and interest payments on the Mortgage. As a result, the Company does not expect any positive cash flow to be available from the Leased Real Estate segment to help the Company meet its holding company obligations until the occurrence of one of the three events described in the next paragraph that would trigger payment of service fees. There can be no assurance as to the timing of the occurrence, or the resulting outcome, from one of these events.
Pursuant to the terms of the management services agreement entered into at the closing of the acquisition of CMC, an affiliate of the seller (the "Service Provider") will provide certain services to CMC and its subsidiaries in exchange for service fees. Such services (collectively, the "Services") will include (i) causing an affiliate of the Service Provider to guaranty certain obligations of the Property Owner (pursuant to an Indemnity and Guaranty Agreement between such affiliate and the holder of the Mortgage (the "Mortgagor")), (ii) providing certain individuals to serve as members of the board of directors and/or certain executive officers of CMC and/or its subsidiaries and (iii) providing asset management services with respect to the Real Property. In exchange for the Services, the Property Owner will pay certain fees to the Service Provider. The payment of such service fees will be triggered by (i) a sale of the Real Property, (ii) a restructuring of the lease to which the Real Property is subject or (iii) a refinancing or restructuring of the Mortgage. The amount of the service fees will range from 40%-80% of the net proceeds generated by the event triggering the payment of the service fees (depending on the nature and timing of the triggering event).
The holding company’s liquidity, defined as the amount of cash in the bank accounts of Kingsway Financial Services Inc. and Kingsway America Inc., was $14.9 million and $13.2 million at December 31, 2016 and December 31, 2015, respectively. These amounts are reflected in the cash and cash equivalents of $36.5 million and $51.7 million reported at December 31, 2016 and December 31, 2015, respectively, on the Company’s consolidated balance sheets. The cash and cash equivalents other than the holding company’s liquidity represent restricted and unrestricted cash held by the Company’s Insurance Underwriting, Insurance Services and Leased Real Estate subsidiaries and are not considered to be available to meet holding company obligations, which
53 | ||
KINGSWAY FINANCIAL SERVICES INC. Management's Discussion and Analysis | ||
primarily consist of interest payments on subordinated debt; holding company operating expenses; transaction-driven expenses of the Company’s merchant banking activities; investments; and any other extraordinary demands on the holding company.
The holding company’s liquidity of $14.9 million at December 31, 2016 represents approximately 18 months of interest payments on subordinated debt and regularly recurring operating expenses before any transaction-driven expenses of the Company’s merchant banking activities, any new holding company investments or any other extraordinary demands on the holding company.
While the Company believes it has sources of liquidity available to allow it to continue to meet its holding company obligations, there can be no assurance that such sources of liquidity will be available when needed.
Regulatory Capital
In the United States, a risk-based capital ("RBC") formula is used by the National Association of Insurance Commissioners ("NAIC") to identify property and casualty insurance companies that may not be adequately capitalized. In general, insurers reporting surplus as regards policyholders below 200% of the authorized control level, as defined by the NAIC, at December 31 are subject to varying levels of regulatory action, including discontinuation of operations. As of December 31, 2016, surplus as regards policyholders reported by each of our insurance subsidiaries exceeded the 200% threshold.
During the fourth quarter of 2012, the Company began taking steps to place all of Amigo into voluntary run-off. As of December 31, 2012, Amigo’s RBC was 157%. In April 2013, Kingsway filed a comprehensive run-off plan with the Florida Office of Insurance Regulation, which outlines plans for Amigo's run-off. Amigo remains in compliance with that plan. As of December 31, 2016, Amigo's RBC was 1,541%.
Kingsway previously placed MCC into voluntary run-off in early 2011. At the time it was placed into voluntary run-off, MCC's RBC was 160%. MCC entered into a comprehensive run-off plan approved by the Illinois Department of Insurance in June 2011. MCC remains in compliance with that plan. As of December 31, 2016, MCC's RBC was 833%.
Our reinsurance subsidiary, which is domiciled in Barbados, is required by the regulator in Barbados to maintain minimum capital levels. As of December 31, 2016, the capital maintained by Kingsway Reinsurance Corporation was in excess of the regulatory capital requirements in Barbados.
CONTRACTUAL OBLIGATIONS
Table 9 summarizes cash disbursements related to the Company's contractual obligations projected by period, including debt maturities, interest payments on outstanding debt, the provision for unpaid loss and loss adjustment expenses and future minimum payments under operating leases. Interest payments in Table 9 related to the subordinated debt assume LIBOR remains constant throughout the projection period.
Our provision for unpaid loss and loss adjustment expenses does not have contractual payment dates. In Table 9 below, we have included a projection of when we expect our unpaid loss and loss adjustment expenses to be paid, based on historical payment patterns. The exact timing of the payment of unpaid loss and loss adjustment expenses cannot be predicted with certainty. We maintain an investments portfolio with varying maturities and a substantial amount in short-term investments to provide adequate cash flows for the projected payments in Table 9. The unpaid loss and loss adjustment expenses in Table 9 have not been reduced by amounts recoverable from reinsurers.
TABLE 9 Cash payments related to contractual obligations projected by period
As of December 31, 2016 (in thousands of dollars)
2017 | 2018 | 2019 | 2020 | 2021 | Thereafter | Total | ||||||||
Note payable | 2,645 | 2,981 | 3,337 | 3,712 | 4,108 | 161,998 | 178,781 | |||||||
Subordinated debt | — | — | — | — | — | 90,500 | 90,500 | |||||||
Interest payments on outstanding debt | 11,905 | 11,791 | 11,663 | 11,520 | 11,362 | 114,511 | 172,752 | |||||||
Unpaid loss and loss adjustment expenses | 38,046 | 10,900 | 4,646 | 1,797 | 759 | 562 | 56,710 | |||||||
Future minimum lease payments | 1,605 | 906 | 713 | 72 | 3 | — | 3,299 | |||||||
Total | 54,201 | 26,578 | 20,359 | 17,101 | 16,232 | 367,571 | 502,042 | |||||||
54 | ||
KINGSWAY FINANCIAL SERVICES INC. Management's Discussion and Analysis | ||
OFF-BALANCE SHEET ARRANGEMENTS
The Company has an off-balance sheet arrangement related to a guarantee, which is further described in Note 28, "Commitments and Contingent Liabilities," to the Consolidated Financial Statements.
55 | ||
KINGSWAY FINANCIAL SERVICES INC. | ||
Item 7A. Quantitative and Qualitative Disclosures About Market Risk
Market Risk
Market risk is the risk that we will incur losses due to adverse changes in interest or currency exchange rates and equity prices. We have exposure to market risk through our investment activities and our financing activities.
Given our U.S. operations typically invest in U.S. dollar denominated fixed maturity instruments, our primary market risk exposures in the investments portfolio are to changes in interest rates. Periodic changes in interest rate levels generally impact our financial results to the extent that the investments are recorded at market value and reinvestment yields are different than the original yields on maturing instruments. During periods of rising interest rates, the market values of the existing fixed maturities will generally decrease. The reverse is true during periods of declining interest rates.
We manage our exposure to risks associated with interest rate fluctuations through active review of our investment portfolio by our management and Board, consultation with third-party financial advisors and by managing the maturity profile of our fixed maturity portfolio. As a general matter, we do not attempt to match the durations of our assets with the durations of our liabilities. Our goal is to maximize the total after-tax return on all of our investments. An important strategy that we employ to achieve this goal is to try to hold enough in cash and short-term investments in order to avoid liquidating longer-term investments to pay loss and loss adjustment expenses.
Table 10 below summarizes the fair value by contractual maturities of the fixed maturities portfolio, excluding cash and cash equivalents, at December 31, 2016 and 2015.
TABLE 10 Fair value of fixed maturities by contractual maturity date
As of December 31 (in thousands of dollars, except for percentages)
2016 | % of Total | 2015 | % of Total | |||||||||
Due in less than one year | 6,561 | 10.6 | % | 10,078 | 18.1 | % | ||||||
Due in one through five years | 40,750 | 66.0 | % | 35,999 | 64.8 | % | ||||||
Due after five through ten years | 4,552 | 7.4 | % | 1,425 | 2.6 | % | ||||||
Due after ten years | 9,901 | 16.0 | % | 8,057 | 14.5 | % | ||||||
Total | 61,764 | 100.0 | % | 55,559 | 100.0 | % | ||||||
At December 31, 2016, 76.6% of fixed maturities, including treasury bills, government bonds and corporate bonds, had contractual maturities of five years or less. Actual maturities may differ from contractual maturities because certain issuers have the right to call or prepay obligations with or without call or prepayment penalties. The Company holds cash and high-grade short-term assets which, along with fixed maturities, management believes are sufficient in amount for the payment of unpaid loss and loss adjustment expenses and other obligations on a timely basis. In the event that additional cash is required to meet obligations to our policyholders and customers, we believe that the high-quality investments in the portfolios provide us with sufficient liquidity.
Based upon the results of interest rate sensitivity analysis, Table 11 below shows the interest rate risk of our investments in fixed maturities, measured in terms of fair value (which is equal to the carrying value for all our fixed maturity securities).
TABLE 11 Sensitivity analysis on fixed maturities
As of December 31 (in thousands of dollars)
100 Basis Point Decrease in Interest Rates | No Change | 100 Basis Point Increase in Interest Rates | ||||||||||
As of December 31, 2016 | ||||||||||||
Estimated fair value | $ | 63,303 | $ | 61,764 | $ | 60,225 | ||||||
Estimated increase (decrease) in fair value | $ | 1,539 | $ | — | $ | (1,539 | ) | |||||
As of December 31, 2015 | ||||||||||||
Estimated fair value | $ | 56,758 | $ | 55,559 | $ | 54,359 | ||||||
Estimated increase (decrease) in fair value | $ | 1,199 | $ | — | $ | (1,200 | ) | |||||
56 | ||
KINGSWAY FINANCIAL SERVICES INC. | ||
We use both fixed and variable rate debt as sources of financing. Because our subordinated debt is LIBOR-based, our primary market risk related to financing activities is to changes in LIBOR. As of December 31, 2016, each one hundred basis point increase in LIBOR would result in an approximately $0.9 million increase in our annual interest expense.
Equity Risk
Equity risk is the risk that we will incur economic losses due to adverse changes in equity prices. Our exposure to changes in equity prices results from our holdings of common stock. We principally manage equity price risk through industry and issuer diversification and asset allocation techniques and by continuously evaluating market conditions.
Credit Risk
Credit risk is defined as the risk of financial loss due to failure of the other party to a financial instrument to discharge an obligation. Credit risk arises from our positions in short-term investments, corporate debt instruments and government bonds.
The Investment Committee of the Board of Directors is responsible for the oversight of key investment policies and limits. These policies and limits are subject to annual review and approval by the Investment Committee. The Investment Committee is also responsible for ensuring that these policies are implemented and that procedures are in place to manage and control credit risk.
Table 12 below summarizes the composition of the fair values of fixed maturities, excluding cash and cash equivalents, at December 31, 2016 and 2015, by rating as assigned by Standard and Poor's ("S&P") or Moody's Investors Service ("Moody's"). Fixed maturities consist of predominantly high-quality instruments in corporate and government bonds with approximately 90.2% of those investments rated 'A' or better at December 31, 2016. During the first quarter of 2015, the Company received $3.0 million of 8% preferred stock of PIH, redeemable on February 24, 2020, related to the termination of the Company's management services agreement with PIH, as further discussed in Note 27, "Related Party Transactions," to the Consolidated Financial Statements. The preferred stock, which is included in fixed maturities, is not rated.
TABLE 12 Credit ratings of fixed maturities
As of December 31
Rating (S&P/Moody's) | 2016 | 2015 | ||
AAA/Aaa | 69.5 | % | 61.9 | % |
AA/Aa | 6.4 | 10.5 | ||
A/A | 14.3 | 18.4 | ||
Percentage rated A/A2 or better | 90.2 | % | 90.8 | % |
BBB/Baa | 3.8 | 3.7 | ||
BB/Ba | 1.0 | — | ||
Not rated | 5.0 | 5.5 | ||
Total | 100.0 | % | 100.0 | % |
57 | ||
KINGSWAY FINANCIAL SERVICES INC. | ||
Item 8. Financial Statements and Supplementary Data.
Index to the Consolidated Financial Statements of
Kingsway Financial Services Inc.
Report of Independent Registered Public Accounting Firm | ||
Consolidated Balance Sheets at December 31, 2016 and 2015 | ||
Consolidated Statements of Operations for the Years Ended December 31, 2016, 2015 and 2014 | ||
Consolidated Statements of Comprehensive Income (Loss) for the Years Ended December 31, 2016, 2015 and 2014 | ||
Consolidated Statements of Shareholders' Equity for the Years Ended December 31, 2016, 2015 and 2014 | ||
Consolidated Statements of Cash Flows for the Years Ended December 31, 2016, 2015 and 2014 | ||
Notes to the Consolidated Financial Statements | ||
Note 1-Business | ||
Note 2-Summary of Significant Accounting Policies | ||
Note 3-Restatement of Previously Issued Financial Statements | ||
Note 4-Recently Issued Accounting Standards | ||
Note 5-Acquisitions | ||
Note 6-Disposition, Deconsolidations and Discontinued Operations | ||
Note 7-Investments | ||
Note 8-Investments in Investees | ||
Note 9-Reinsurance | ||
Note 10-Deferred Acquisition Costs | ||
Note 11-Goodwill | ||
Note 12-Intangible Assets | ||
Note 13-Property and Equipment | ||
Note 14-Unpaid Loss and Loss Adjustment Expenses | ||
Note 15-Debt | ||
Note 16-Finance Lease Obligation Liability | ||
Note 17-Leases | ||
Note 18-Income Taxes | ||
Note 19-Loss from Continuing Operations per Share | ||
Note 20-Stock-Based Compensation | ||
Note 21-Employee Benefit Plan | ||
Note 22-Class A Preferred Stock | ||
Note 23-Shareholders' Equity | ||
Note 24-Accumulated Other Comprehensive Loss | ||
Note 25-Segmented Information | ||
Note 26-Fair Value of Financial Instruments | ||
Note 27-Related Party Transactions | ||
Note 28-Commitments and Contingent Liabilities | ||
Note 29-Regulatory Capital Requirements and Ratios | ||
Note 30-Statutory Information and Policies | ||
Note 31-Selected Quarterly Financial Data (Unaudited) | ||
58 | ||
KINGSWAY FINANCIAL SERVICES INC. | ||
Report of Independent Registered Public Accounting Firm
Board of Directors and Shareholders
Kingsway Financial Services Inc.
Itasca, Illinois
We have audited the accompanying consolidated balance sheets of Kingsway Financial Services Inc. as of December 31, 2016 and 2015 and the related consolidated statements of operations, comprehensive income (loss), shareholders’ equity, and cash flows for each of the three years in the period ended December 31, 2016. In connection with our audits of the consolidated financial statements, we have also audited the financial statement schedules listed in the accompanying index. These consolidated financial statements and schedules are the responsibility of the Company’s management. Our responsibility is to express an opinion on these financial statements and schedules based on our audits.
We conducted our audits in accordance with the standards of the Public Company Accounting Oversight Board (United States). Those standards require that we plan and perform the audit to obtain reasonable assurance about whether the financial statements are free of material misstatement. An audit includes examining, on a test basis, evidence supporting the amounts and disclosures in the financial statements, assessing the accounting principles used and significant estimates made by management, as well as evaluating the overall presentation of the financial statements and schedules. We believe that our audits provide a reasonable basis for our opinion.
In our opinion, the consolidated financial statements referred to above present fairly, in all material respects, the financial position of Kingsway Financial Services Inc. at December 31, 2016 and 2015, and the results of its operations and its cash flows for each of the three years in the period ended December 31, 2016, in conformity with accounting principles generally accepted in the United States of America.
Also, in our opinion, the financial statement schedules, when considered in relation to the basic consolidated financial statements taken as a whole, present fairly, in all material respects, the information set forth therein.
We also have audited, in accordance with the standards of the Public Company Accounting Oversight Board (United States), Kingsway Financial Services Inc.’s internal control over financial reporting as of December 31, 2016, based on criteria established in Internal Control - Integrated Framework (2013) issued by the Committee of Sponsoring Organizations of the Treadway Commission (COSO) and our report dated March 13, 2017 expressed an adverse opinion thereon.
/s/ BDO USA LLP
Grand Rapids, Michigan
March 13, 2017
BDO USA, LLP, a Delaware limited liability partnership, is the U.S. member of BDO International Limited, a UK company limited by guarantee, and forms part of the international BDO network of independent member firms.
BDO is the brand name for the BDO network and for each of the BDO Member Firms.
59 | ||
KINGSWAY FINANCIAL SERVICES INC. | ||
Consolidated Balance Sheets
(in thousands, except share data)
December 31, 2016 | December 31, 2015 | |||||||
(as restated) | ||||||||
Assets | ||||||||
Investments: | ||||||||
Fixed maturities, at fair value (amortized cost of $62,136 and $55,606, respectively) | $ | 61,764 | $ | 55,559 | ||||
Equity investments, at fair value (cost of $19,099 and $26,428, respectively) | 23,230 | 27,559 | ||||||
Limited liability investments | 22,974 | 20,141 | ||||||
Limited liability investment, at fair value | 10,700 | — | ||||||
Other investments, at cost which approximates fair value | 7,975 | 4,077 | ||||||
Short-term investments, at cost which approximates fair value | 401 | 400 | ||||||
Total investments | 127,044 | 107,736 | ||||||
Cash and cash equivalents | 36,475 | 51,701 | ||||||
Investments in investees | 3,116 | 1,772 | ||||||
Accrued investment income | 790 | 594 | ||||||
Premiums receivable, net of allowance for doubtful accounts of $115 and $165, respectively | 31,564 | 27,090 | ||||||
Service fee receivable, net of allowance for doubtful accounts of $274 and $276, respectively | 1,320 | 911 | ||||||
Other receivables, net of allowance for doubtful accounts of $806 and $806, respectively | 4,692 | 3,789 | ||||||
Reinsurance recoverable | 784 | 1,422 | ||||||
Deferred acquisition costs, net | 13,609 | 12,143 | ||||||
Income taxes recoverable | — | 61 | ||||||
Property and equipment, net of accumulated depreciation of $10,603 and $12,537, respectively | 116,961 | 5,577 | ||||||
Goodwill | 71,061 | 10,078 | ||||||
Intangible assets, net of accumulated amortization of $7,181 and $6,009, respectively | 89,017 | 14,736 | ||||||
Other assets | 4,588 | 3,412 | ||||||
Total Assets | $ | 501,021 | $ | 241,022 | ||||
Liabilities and Shareholders' Equity | ||||||||
Liabilities: | ||||||||
Unpaid loss and loss adjustment expenses: | ||||||||
Property and casualty | $ | 53,795 | $ | 55,471 | ||||
Vehicle service agreements | 2,915 | 2,975 | ||||||
Total unpaid loss and loss adjustment expenses | 56,710 | 58,446 | ||||||
Unearned premiums | 40,176 | 35,234 | ||||||
Reinsurance payable | 100 | 145 | ||||||
Note payable | 190,074 | — | ||||||
Subordinated debt, at fair value | 43,619 | 39,898 | ||||||
Deferred income tax liability | 48,720 | 2,924 | ||||||
Deferred service fees | 35,822 | 34,319 | ||||||
Income taxes payable | 2,051 | — | ||||||
Accrued expenses and other liabilities | 20,487 | 19,959 | ||||||
Total Liabilities | 437,759 | 190,925 | ||||||
Class A preferred stock, no par value; unlimited number authorized; 262,876 and 262,876 issued and outstanding at December 31, 2016 and December 31, 2015, respectively; redemption amount of $6,572 | 6,427 | 6,394 | ||||||
Shareholders' Equity: | ||||||||
Common stock, no par value; unlimited number authorized; 21,458,190 and 19,709,706 issued and outstanding at December 31, 2016 and December 31, 2015, respectively | — | — | ||||||
Additional paid-in capital | 353,882 | 341,646 | ||||||
Accumulated deficit | (297,668 | ) | (297,209 | ) | ||||
Accumulated other comprehensive loss | (208 | ) | (2,486 | ) | ||||
Shareholders' equity attributable to common shareholders | 56,006 | 41,951 | ||||||
Noncontrolling interests in consolidated subsidiaries | 829 | 1,752 | ||||||
Total Shareholders' Equity | 56,835 | 43,703 | ||||||
Total Liabilities and Shareholders' Equity | $ | 501,021 | $ | 241,022 | ||||
See accompanying notes to Consolidated Financial Statements.
60 | ||
KINGSWAY FINANCIAL SERVICES INC. | ||
Consolidated Statements of Operations
(in thousands, except per share data)
Years ended December 31, | ||||||||||||
2016 | 2015 | 2014 | ||||||||||
Revenues: | ||||||||||||
Net premiums earned | $ | 127,608 | $ | 117,433 | $ | 117,593 | ||||||
Service fee and commission income | 24,232 | 22,966 | 24,659 | |||||||||
Rental income | 5,419 | — | — | |||||||||
Net investment income | 8,200 | 2,918 | 1,616 | |||||||||
Net realized gains | 360 | 1,197 | 5,041 | |||||||||
Other-than-temporary impairment loss | (157 | ) | (10 | ) | — | |||||||
Other income | 10,968 | 15,462 | 9,315 | |||||||||
Total revenues | 176,630 | 159,966 | 158,224 | |||||||||
Operating expenses: | ||||||||||||
Loss and loss adjustment expenses | 109,609 | 92,812 | 86,227 | |||||||||
Commissions and premium taxes | 24,562 | 22,773 | 23,238 | |||||||||
Cost of services sold | 4,193 | 4,044 | 3,880 | |||||||||
General and administrative expenses | 41,629 | 41,760 | 41,613 | |||||||||
Leased real estate segment interest expense | 2,899 | — | — | |||||||||
Amortization of intangible assets | 1,242 | 1,244 | 1,620 | |||||||||
Contingent consideration benefit | (657 | ) | (1,139 | ) | (2,223 | ) | ||||||
Impairment of asset held for sale | — | — | 1,180 | |||||||||
Total operating expenses | 183,477 | 161,494 | 155,535 | |||||||||
Operating (loss) income | (6,847 | ) | (1,528 | ) | 2,689 | |||||||
Other (revenues) expenses, net: | ||||||||||||
Interest expense not allocated to segments | 4,496 | 5,278 | 5,645 | |||||||||
Foreign exchange losses, net | 15 | 1,215 | 419 | |||||||||
Loss (gain) on change in fair value of debt | 3,721 | (1,458 | ) | 10,953 | ||||||||
Loss on disposal of subsidiary | — | — | 1,244 | |||||||||
Loss on disposal of asset held for sale | — | — | 125 | |||||||||
(Gain) loss on deconsolidation of subsidiaries | (5,643 | ) | 4,420 | — | ||||||||
Equity in net loss of investees | 1,017 | 339 | 190 | |||||||||
Total other expenses, net | 3,606 | 9,794 | 18,576 | |||||||||
Loss from continuing operations before income tax (benefit) expense | (10,453 | ) | (11,322 | ) | (15,887 | ) | ||||||
Income tax (benefit) expense | (9,720 | ) | 93 | (1,221 | ) | |||||||
Loss from continuing operations | (733 | ) | (11,415 | ) | (14,666 | ) | ||||||
Income from discontinued operations, net of taxes | — | 1,417 | 3,442 | |||||||||
Gain on disposal of discontinued operations, net of taxes | 1,255 | 11,267 | — | |||||||||
Net income (loss) | 522 | 1,269 | (11,224 | ) | ||||||||
Less: net (loss) income attributable to noncontrolling interests in consolidated subsidiaries | (281 | ) | 162 | 1,596 | ||||||||
Less: dividends on preferred stock | 398 | 329 | 300 | |||||||||
Net income (loss) attributable to common shareholders | $ | 405 | $ | 778 | $ | (13,120 | ) | |||||
Loss per share - continuing operations: | ||||||||||||
Basic: | $ | (0.04 | ) | $ | (0.60 | ) | $ | (0.95 | ) | |||
Diluted: | $ | (0.04 | ) | $ | (0.60 | ) | $ | (0.95 | ) | |||
Earnings per share - discontinued operations: | ||||||||||||
Basic: | $ | 0.06 | $ | 0.64 | $ | 0.20 | ||||||
Diluted: | $ | 0.06 | $ | 0.64 | $ | 0.20 | ||||||
Earnings (loss) per share – net income (loss) attributable to common shareholders: | ||||||||||||
Basic: | $ | 0.02 | $ | 0.04 | $ | (0.75 | ) | |||||
Diluted: | $ | 0.02 | $ | 0.04 | $ | (0.75 | ) | |||||
Weighted average shares outstanding (in ‘000s): | ||||||||||||
Basic: | 20,003 | 19,710 | 17,398 | |||||||||
Diluted: | 20,003 | 19,710 | 17,398 | |||||||||
See accompanying notes to Consolidated Financial Statements.
61 | ||
KINGSWAY FINANCIAL SERVICES INC. | ||
Consolidated Statements of Comprehensive Income (Loss)
(in thousands)
Years ended December 31, | ||||||||||||
2016 | 2015 | 2014 | ||||||||||
Net income (loss) | $ | 522 | $ | 1,269 | $ | (11,224 | ) | |||||
Other comprehensive income (loss), net of taxes(1): | ||||||||||||
Unrealized gains (losses) on fixed maturities and equity investments: | ||||||||||||
Unrealized gains (losses) arising during the period | 2,764 | (3,505 | ) | (2,597 | ) | |||||||
Reclassification adjustment for amounts included in net income (loss) | (494 | ) | 1,564 | 1,552 | ||||||||
Foreign currency translation adjustments | — | 858 | (31 | ) | ||||||||
Recognition of currency translation loss on deconsolidation of subsidiary | — | 1,243 | — | |||||||||
Other comprehensive income (loss) | 2,270 | 160 | (1,076 | ) | ||||||||
Comprehensive income (loss) | $ | 2,792 | $ | 1,429 | $ | (12,300 | ) | |||||
Less: comprehensive (loss) income attributable to noncontrolling interests in consolidated subsidiaries | (289 | ) | (308 | ) | 1,451 | |||||||
Comprehensive income (loss) attributable to common shareholders | $ | 3,081 | $ | 1,737 | $ | (13,751 | ) | |||||
(1) Net of income tax (benefit) expense of $0, $0 and $0 in 2016, 2015 and 2014, respectively | ||||||||||||
See accompanying notes to Consolidated Financial Statements.
62 | ||
KINGSWAY FINANCIAL SERVICES INC. | ||
Consolidated Statements of Shareholders' Equity
(in thousands, except share data)
Common Stock | Additional Paid-in Capital | Accumulated Deficit | Accumulated Other Comprehensive Income (Loss) | Shareholders' Equity Attributable to Common Shareholders | Noncontrolling Interests in Consolidated Subsidiaries | Total Shareholders' Equity | |||||||||||||||||||||||||
Shares | Amount | ||||||||||||||||||||||||||||||
Balance, January 1, 2014, as reported | 16,429,761 | $ | — | $ | 324,803 | $ | (298,930 | ) | $ | 9,601 | $ | 35,474 | $ | 1,446 | $ | 36,920 | |||||||||||||||
Correction of prior period errors | — | — | — | 11,042 | (11,042 | ) | — | — | — | ||||||||||||||||||||||
Balance, January 1, 2014, as restated | 16,429,761 | — | 324,803 | (287,888 | ) | (1,441 | ) | 35,474 | 1,446 | 36,920 | |||||||||||||||||||||
Net (loss) income | — | — | — | (12,820 | ) | — | (12,820 | ) | 1,596 | (11,224 | ) | ||||||||||||||||||||
Other comprehensive loss | — | — | — | — | (931 | ) | (931 | ) | (145 | ) | (1,076 | ) | |||||||||||||||||||
Exercise of warrants | 3,279,945 | — | 14,803 | — | — | 14,803 | — | 14,803 | |||||||||||||||||||||||
Preferred stock dividends | (300 | ) | — | (300 | ) | — | (300 | ) | |||||||||||||||||||||||
Consolidation of 1347 Investors LLC | — | — | — | — | — | — | 1,505 | 1,505 | |||||||||||||||||||||||
Forfeited options | — | — | (1 | ) | — | — | (1 | ) | — | (1 | ) | ||||||||||||||||||||
Stock-based compensation | — | — | 1,239 | — | — | 1,239 | — | 1,239 | |||||||||||||||||||||||
Balance, December 31, 2014, as restated | 19,709,706 | $ | — | $ | 340,844 | $ | (301,008 | ) | $ | (2,372 | ) | $ | 37,464 | $ | 4,402 | $ | 41,866 | ||||||||||||||
Correction of prior period error | — | — | — | 744 | (744 | ) | — | — | — | ||||||||||||||||||||||
Deconsolidation of noncontrolling interest | — | — | — | 2,342 | — | 2,342 | (2,342 | ) | — | ||||||||||||||||||||||
Net income | — | — | — | 1,107 | — | 1,107 | 162 | 1,269 | |||||||||||||||||||||||
Other comprehensive income (loss) | — | — | — | — | 630 | 630 | (470 | ) | 160 | ||||||||||||||||||||||
Preferred stock dividends, net of tax | (394 | ) | — | (394 | ) | — | (394 | ) | |||||||||||||||||||||||
Stock-based compensation | — | — | 802 | — | — | 802 | — | 802 | |||||||||||||||||||||||
Balance, December 31, 2015, as restated | 19,709,706 | $ | — | $ | 341,646 | $ | (297,209 | ) | $ | (2,486 | ) | $ | 41,951 | $ | 1,752 | $ | 43,703 | ||||||||||||||
Deconsolidation of 1347 Investors LLC | — | — | — | (572 | ) | — | (572 | ) | (933 | ) | (1,505 | ) | |||||||||||||||||||
Net income (loss) | — | — | — | 803 | — | 803 | (281 | ) | 522 | ||||||||||||||||||||||
Other comprehensive income (loss) | — | — | — | — | 2,278 | 2,278 | (8 | ) | 2,270 | ||||||||||||||||||||||
Common stock issued, net | 1,775,384 | — | 11,221 | — | — | 11,221 | — | 11,221 | |||||||||||||||||||||||
63 | ||
KINGSWAY FINANCIAL SERVICES INC. | ||
Repurchases of common stock for cancellation | (26,900 | ) | — | — | (125 | ) | — | (125 | ) | — | (125 | ) | |||||||||||||||||||
Consolidation of CMC Industries, Inc. | — | — | — | — | — | — | 299 | 299 | |||||||||||||||||||||||
Preferred stock dividends, net of tax | — | — | — | (565 | ) | — | (565 | ) | — | (565 | ) | ||||||||||||||||||||
Stock-based compensation | — | — | 1,015 | — | — | 1,015 | — | 1,015 | |||||||||||||||||||||||
Balance, December 31, 2016 | 21,458,190 | $ | — | $ | 353,882 | $ | (297,668 | ) | $ | (208 | ) | $ | 56,006 | $ | 829 | $ | 56,835 | ||||||||||||||
See accompanying notes to Consolidated Financial Statements.
64 | ||
KINGSWAY FINANCIAL SERVICES INC. | ||
Consolidated Statements of Cash Flows
(in thousands)
Years ended December 31, | ||||||||||||
2016 | 2015 | 2014 | ||||||||||
Cash provided by (used in): | ||||||||||||
Operating activities: | ||||||||||||
Net income (loss) | $ | 522 | $ | 1,269 | $ | (11,224 | ) | |||||
Adjustments to reconcile net income (loss) to net cash used in operating activities: | ||||||||||||
Gain on disposal of discontinued operations, net of taxes | (1,255 | ) | (11,267 | ) | — | |||||||
Equity in net loss of investees | 1,017 | 339 | 190 | |||||||||
Equity in net income of limited liability investments | (1,157 | ) | (1,596 | ) | (184 | ) | ||||||
(Gain) loss on change in fair value of investments | (5,100 | ) | 216 | — | ||||||||
Depreciation and amortization expense | 2,780 | 1,845 | 1,635 | |||||||||
Contingent consideration benefit | (657 | ) | (1,139 | ) | (2,223 | ) | ||||||
Stock-based compensation expense, net of forfeitures | 1,015 | 802 | 1,239 | |||||||||
Net realized gains | (360 | ) | (1,197 | ) | (5,041 | ) | ||||||
Loss (gain) on change in fair value of debt | 3,721 | (1,458 | ) | 10,953 | ||||||||
Deferred income taxes | (9,807 | ) | 87 | 263 | ||||||||
Other-than-temporary impairment loss | 157 | 10 | — | |||||||||
Amortization of fixed maturities premiums and discounts | 218 | 323 | 618 | |||||||||
Amortization of note payable premium | (447 | ) | — | — | ||||||||
Loss on disposal of subsidiary | — | — | 1,244 | |||||||||
Loss on disposal of asset held for sale | — | — | 125 | |||||||||
(Gain) loss on deconsolidation of subsidiaries | (5,643 | ) | 4,420 | — | ||||||||
Impairment of asset held for sale | — | — | 1,180 | |||||||||
Changes in operating assets and liabilities: | ||||||||||||
Premiums and service fee receivable, net | (4,883 | ) | 1,848 | 3,001 | ||||||||
Other receivables, net, adjusted for CMC assets acquired | 1,068 | 1,356 | (1,372 | ) | ||||||||
Reinsurance recoverable | 638 | 2,230 | 6,683 | |||||||||
Deferred acquisition costs, net | (1,466 | ) | 54 | 195 | ||||||||
Income taxes recoverable | 61 | 13 | (74 | ) | ||||||||
Unpaid loss and loss adjustment expenses | (1,736 | ) | (8,424 | ) | (20,792 | ) | ||||||
Unearned premiums | 4,942 | (1,198 | ) | (12,145 | ) | |||||||
Reinsurance payable | (45 | ) | (380 | ) | (508 | ) | ||||||
Deferred service fees | 1,503 | (777 | ) | 493 | ||||||||
Other, net, adjusted for CMC assets acquired and liabilities assumed | (675 | ) | (20,181 | ) | 9,405 | |||||||
Net cash used in operating activities | (15,589 | ) | (32,805 | ) | (16,339 | ) | ||||||
Investing activities: | ||||||||||||
Proceeds from sales and maturities of fixed maturities | 26,063 | 27,480 | 27,655 | |||||||||
Proceeds from sales of equity investments | 7,807 | 819 | 8,047 | |||||||||
Purchases of fixed maturities | (32,297 | ) | (26,351 | ) | (36,902 | ) | ||||||
Purchases of equity investments | (3,178 | ) | (9,564 | ) | (14,462 | ) | ||||||
Net acquisitions of limited liability investments | (3,118 | ) | (10,312 | ) | (2,703 | ) | ||||||
Net purchases of other investments | (3,898 | ) | (600 | ) | (600 | ) | ||||||
Net (purchases of) proceeds from short-term investments | (264 | ) | 4 | (102 | ) | |||||||
Net proceeds from sale of discontinued operations | 1,255 | 44,919 | — | |||||||||
Acquisition of business, net of cash acquired | (494 | ) | — | — | ||||||||
Acquisition of investee | — | — | (2,305 | ) | ||||||||
Net (purchases) disposals of property and equipment and intangible assets, adjusted for CMC assets acquired | (645 | ) | (203 | ) | 4,663 | |||||||
Net cash (used in) provided by investing activities | (8,769 | ) | 26,192 | (16,709 | ) | |||||||
Financing activities: | ||||||||||||
Proceeds from issuance of preferred stock, net | — | — | 6,330 | |||||||||
Proceeds from issuance of common stock, net | 10,477 | — | — | |||||||||
Repurchase of common stock for cancellation | (125 | ) | — | — | ||||||||
Proceeds from exercise of warrants | — | — | 14,803 | |||||||||
Principal payments on note payable assumed in CMC acquisition | (1,220 | ) | — | — | ||||||||
Redemption of LROC preferred units | — | (12,920 | ) | — | ||||||||
Redemption of senior unsecured debentures | — | — | (14,356 | ) | ||||||||
Net cash provided by (used in) financing activities | 9,132 | (12,920 | ) | 6,777 | ||||||||
Net decrease in cash and cash equivalents | (15,226 | ) | (19,533 | ) | (26,271 | ) | ||||||
Cash and cash equivalents at beginning of period | 51,701 | 71,234 | 97,505 | |||||||||
Cash and cash equivalents at end of period | $ | 36,475 | $ | 51,701 | $ | 71,234 | ||||||
65 | ||
KINGSWAY FINANCIAL SERVICES INC. | ||
Supplemental disclosures of cash flows information: | ||||||||||||
Cash paid (received) during the year for: | ||||||||||||
Interest | $ | 7,298 | $ | 24,249 | $ | 5,288 | ||||||
Income taxes | $ | 10 | $ | — | $ | (736 | ) | |||||
Non-cash investing and financing activities: | ||||||||||||
Issuance of common stock in connection with acquisition of Argo | $ | 744 | $ | — | $ | — | ||||||
Fixed maturities received in connection with termination of PIH management services agreement | $ | — | $ | 3,000 | $ | — | ||||||
Equity investments received in connection with termination of PIH management services agreement | $ | — | $ | 960 | $ | — | ||||||
Accrued dividends on Class A preferred stock issued | $ | 398 | $ | 329 | $ | 300 | ||||||
See accompanying notes to Consolidated Financial Statements.
66 | ||
KINGSWAY FINANCIAL SERVICES INC. Notes to Consolidated Financial Statements | ||
NOTE 1 BUSINESS
Kingsway Financial Services Inc. (the "Company" or "Kingsway") was incorporated under the Business Corporations Act (Ontario) on September 19, 1989. Kingsway is a Canadian holding company with operating subsidiaries located in the United States. The Company operates as a merchant bank primarily engaged, through its subsidiaries, in the property and casualty insurance business.
NOTE 2 SUMMARY OF SIGNIFICANT ACCOUNTING POLICIES
(a) | Principles of consolidation: |
The accompanying information in the 2016 Annual Report has been prepared in accordance with accounting principles generally accepted in the United States of America ("U.S. GAAP").
Certain prior year amounts have been reclassified to conform to current year presentation. Such reclassifications had no impact on previously reported net income (loss) or total shareholders' equity.
Subsidiaries
The Company's consolidated financial statements include the assets, liabilities, shareholders' equity, revenues, expenses and cash flows of the holding company and its subsidiaries and have been prepared on the basis of U.S. GAAP. A subsidiary is an entity which is controlled, directly or indirectly, through ownership of more than 50% of the outstanding voting rights, or where the Company has the power to govern the financial and operating policies so as to obtain benefits from its activities. Assessment of control is based on the substance of the relationship between the Company and the entity and includes consideration of both existing voting rights and, if applicable, potential voting rights that are currently exercisable and convertible. The operating results of subsidiaries that have been disposed of are included up to the date control ceased and any difference between the fair value of the consideration received and the carrying value of the subsidiary are recognized in the consolidated statements of operations. All intercompany balances and transactions are eliminated in full.
The consolidated financial statements are prepared as of December 31, 2016 based on individual company financial statements at the same date. Accounting policies of subsidiaries have been aligned where necessary to ensure consistency with those of Kingsway. The consolidated financial statements include the following subsidiaries, all of which are owned, directly or indirectly: 1347 Advisors LLC ("1347 Advisors"); 1347 Capital LLC; Appco Finance Corporation; American Country Underwriting Agency Inc.; Argo Management Group, LLC ("Argo"); ARM Holdings, Inc.; CMC Industries, Inc. ("CMC"); Congress General Agency, Inc.; Insurance Management Services Inc.; Itasca Capital Corp.; Itasca Investors LLC; IWS Acquisition Corporation ("IWS"); KAI Advantage Auto, Inc.; KFS Capital LLC ("KFS Capital"); Kingsway America II Inc.; Kingsway America Inc.; Kingsway America Agency Inc.; Kingsway Amigo Insurance Company ("Amigo"); Kingsway General Insurance Company; Kingsway LGIC Holdings, LLC; Kingsway Reinsurance Corporation; Kingsway ROC GP; Kingsway ROC LLC; Lens MSP LLC; Mattoni Insurance Brokerage, Inc.; Mendakota Casualty Company ("MCC"); Mendakota Insurance Company ("Mendakota"); Mendota Insurance Agency, Inc.; Mendota Insurance Company ("Mendota"); MIC Insurance Agency Inc.; and Trinity Warranty Solutions LLC ("Trinity").
Noncontrolling interests
The Company has noncontrolling interests attributable to its subsidiaries, CMC and IWS. The Company previously had noncontrolling interests attributable to 1347 Investors LLC ("1347 Investors") and Kingsway Linked Return of Capital Trust ("KLROC Trust") prior to the deconsolidation of these subsidiaries in July 2016 and June 2015, respectively. Refer to Note 6, "Disposition, Deconsolidations and Discontinued Operations," for information regarding the deconsolidations of 1347 Investors and KLROC Trust. A noncontrolling interest arises where the Company owns less than 100% of the voting rights and economic interests in a subsidiary and is initially recognized at the proportionate share of the identifiable net assets of the subsidiary at the acquisition date and is subsequently adjusted for the noncontrolling interest's share of the acquiree's net income (losses) and changes in capital. The effects of transactions with noncontrolling interests are recorded in shareholders' equity where there is no change of control.
(b) | Use of estimates: |
The preparation of consolidated financial statements in conformity with U.S. GAAP requires management to make estimates and assumptions that affect application of policies and the reported amounts of assets and liabilities and disclosure of contingent assets and liabilities at the date of the consolidated financial statements and the reported amounts of revenues and expenses during the year. Actual results could differ from these estimates. Estimates and their underlying assumptions are reviewed on an ongoing
67 | ||
KINGSWAY FINANCIAL SERVICES INC. Notes to Consolidated Financial Statements | ||
basis. Changes in estimates are recorded in the accounting period in which they are determined. The critical accounting estimates and assumptions in the accompanying consolidated financial statements include the provision for unpaid loss and loss adjustment expenses; valuation of fixed maturities and equity investments; impairment assessment of investments; valuation of limited liability investment at fair value; valuation of deferred income taxes; valuation and impairment assessment of intangible assets; goodwill recoverability; deferred acquisition costs; fair value assumptions for performance shares; fair value assumptions for subordinated debt obligations; and contingent consideration.
(c)Foreign currency translation:
The consolidated financial statements have been presented in U.S. dollars because the Company's principal investments and cash flows are denominated in U.S. dollars. The Company's functional currency is the U.S. dollar since the substantial majority of its operations is conducted in the United States. Assets and liabilities of subsidiaries with non-U.S. dollar functional currencies are translated to U.S. dollars at period-end exchange rates, while revenue and expenses are translated at average monthly rates and shareholders' equity is translated at the rates in effect at dates of capital transactions. The net unrealized gains or losses which result from the translation of non-U.S. subsidiaries financial statements are recognized in accumulated other comprehensive loss. Such currency translation gains or losses are recognized in the consolidated statements of operations upon the sale of a foreign subsidiary. Transactions settled in foreign currencies are translated to functional currencies at the exchange rate prevailing at the transaction dates. The unrealized foreign currency translation gains and losses arising from available-for-sale financial assets are recognized in other comprehensive income (loss) until realized, at which date they are reclassified to the consolidated statements of operations. Unrealized foreign currency translation gains and losses on certain interest bearing debt obligations carried at fair value are included in the consolidated statements of operations.
Foreign currency translation adjustments are included in shareholders' equity under the caption accumulated other comprehensive loss. Foreign currency gains and losses resulting from transactions which are denominated in currencies other than the entity's functional currency are reflected in foreign exchange losses, net in the consolidated statements of operations.
(d) | Business combinations: |
The acquisition method of accounting is used to account for acquisitions of subsidiaries or other businesses. The results of acquired subsidiaries or other businesses are included in the consolidated statements of operations from the date of acquisition. The cost of an acquisition is measured as the fair value of the assets received, equity instruments issued and liabilities incurred or assumed at the date of exchange. Identifiable assets acquired and liabilities and contingent liabilities assumed in a business combination are measured initially at their fair values at the acquisition date, irrespective of the extent of any noncontrolling interest. The excess of the cost of an acquisition over the fair value of the Company's share of the identifiable net assets acquired is recorded as goodwill. If the cost of acquisition is less than the fair value of the net assets of the subsidiary acquired, the difference is recognized in the consolidated statements of operations. Noncontrolling interests in the net assets of consolidated entities are reported separately in shareholders' equity.
(e) | Investments: |
Investments in fixed maturities and equity investments in common stocks are classified as available-for-sale and reported at fair value. Unrealized gains and losses are included in accumulated other comprehensive loss, net of tax, until sold or until an other-than-temporary impairment is recognized, at which point cumulative unrealized gains or losses are transferred to the consolidated statements of operations.
Limited liability investments include investments in limited liability companies and limited partnerships in which the Company's interests are not deemed minor and, therefore, are accounted for under the equity method of accounting.
Limited liability investment, at fair value represents the Company's investment in 1347 Investors. The Company has made an irrevocable election to account for this investment at fair value with changes in fair value reported in the consolidated statements of operations.
Other investments include mortgage and collateral loans and are reported at their unpaid principal balance.
Short-term investments, which consist of investments with original maturities between three months and one year, are reported at cost which approximates fair value.
Realized gains and losses on sales, determined on a first-in first-out basis, are included in net realized gains.
68 | ||
KINGSWAY FINANCIAL SERVICES INC. Notes to Consolidated Financial Statements | ||
Dividends and interest income are included in net investment income. Investment income is recorded as it accrues. Income from limited liability investments is recognized based on the Company's share of the earnings of the limited liability entities and is included in net investment income. Income from limited liability investment, at fair value is included in net investment income.
The Company accounts for all financial instruments using trade date accounting.
The Company conducts a quarterly review to identify and evaluate investments that show objective indications of possible impairment. Impairment is charged to the consolidated statements of operations if the fair value of an instrument falls below its cost/amortized cost and the decline is considered other-than-temporary. Factors considered in determining whether a loss is other-than-temporary include the length of time and extent to which fair value has been below cost; the financial condition and near-term prospects of the issuer; and the Company's ability and intent to hold investments for a period of time sufficient to allow for any anticipated recovery.
(f) | Derivative financial instruments: |
Derivative financial instruments include investments in warrants and performance shares issued to the Company under various performance share grant agreements. Refer to Note 27, "Related Party Transactions," for further details regarding the performance shares. Warrants are classified as equity investments in the consolidated balance sheets.
The Company measures derivative financial instruments at fair value. The fair value of derivative financial instruments is required to be revalued each reporting period, with corresponding changes in fair value recorded in the consolidated statements of operations, or, in the case of derivative financial instruments that are publicly traded, in other accumulated other comprehensive loss. Realized gains or losses are recognized upon settlement of the contracts.
(g) | Cash and cash equivalents: |
Cash and cash equivalents include cash and investments with original maturities of three months or less that are readily convertible into cash.
(h) | Investments in investees: |
At December 31, 2016, investment in investee includes the Company's investment in the common stock of Itasca Capital Ltd. ("ICL"). At December 31, 2015, investment in investee includes the investment in the common stock and private units of 1347 Capital Corp. These investments are accounted for under the equity method of accounting and reported as investments in investees in the consolidated balance sheets. Investment in investee is comprised of an investment in an entity where the Company has the ability to exercise significant influence but not control. Significant influence is presumed to exist when the Company owns, directly or indirectly, between 20% and 50% of the outstanding voting rights of the investee. Assessment of significant influence is based on the substance of the relationship between the Company and the investee and includes consideration of both existing voting rights and, if applicable, potential voting rights that are currently exercisable and convertible. This investment is reported as investment in investee in the consolidated balance sheets, with the Company's share of income (loss) and other comprehensive income (loss) of the investee reported in the corresponding line in the consolidated statements of operations and consolidated statements of comprehensive income (loss), respectively. Under the equity method of accounting, an investment in investee is initially recognized at cost and adjusted thereafter for the post-acquisition change in the Company's share of net assets of the investee.
At each reporting date, and more frequently when conditions warrant, management assesses its investment in investee for potential impairment. If management's assessment indicates that there is objective evidence of impairment, the investee is written down to its recoverable amount, which is determined as the higher of its fair value less costs to sell and its value in use. Write-downs to reflect other-than-temporary impairments in value are included in other-than-temporary impairment loss in the consolidated statements of operations.
The most recently available financial statements of the investee are used in applying the equity method. The difference between the end of the reporting period of the investee and that of the Company is no more than three months. Adjustments are made for the effects of significant transactions or events that occur between the date of the investee's financial statements and the date of the Company's consolidated financial statements.
(i) | Premiums and service fee receivables: |
Premiums and service fee receivables include balances due and uncollected and installment premiums not yet due from agents and insureds. Premiums and service fee receivables are reported net of an estimated allowance for doubtful accounts.
69 | ||
KINGSWAY FINANCIAL SERVICES INC. Notes to Consolidated Financial Statements | ||
(j) | Reinsurance: |
Reinsurance premiums, losses, and loss adjustment expenses are accounted for on a basis consistent with those used in accounting for the original policies issued and the terms of the reinsurance contracts. Premiums and losses ceded to other companies have been reported as a reduction of premium revenue and incurred loss and loss adjustment expenses. Commissions paid to the Company by reinsurers on business ceded have been accounted for as a reduction of the related policy acquisition costs. Reinsurance recoverable is recorded for that portion of paid and unpaid losses and loss adjustment expenses that are ceded to other companies. Prepaid reinsurance premiums are recorded for unearned premiums that have been ceded to other companies.
(k) | Deferred acquisition costs, net: |
The Company defers commissions, premium taxes and other underwriting and agency expenses that are directly related to successful efforts to acquire new or existing insurance policies and vehicle service agreements to the extent they are considered recoverable. Costs deferred on property and casualty insurance products are amortized over the period in which premiums are earned. Costs deferred on vehicle service agreements are amortized as the related revenues are earned. The method followed in determining the deferred acquisition costs limits the deferral to its realizable value by giving consideration to estimated future loss and loss adjustment expenses to be incurred as revenues are earned. Changes in estimates, if any, are recorded in the accounting period in which they are determined. Anticipated investment income is included in determining the realizable value of the deferred acquisition costs. The Company's deferred acquisition costs are reported net of ceding commissions.
(l) | Property and equipment: |
Property and equipment are reported in the consolidated financial statements at cost. Depreciation of property and equipment has been provided using the straight-line method over the estimated useful lives of such assets. Repairs and maintenance are recognized in operations during the period incurred. Land is not depreciated. The Company estimates useful life to be thirty to forty years for buildings; five to fifty years for site improvements; four to ten years for leasehold improvements; three to ten years for furniture and equipment; and three to five years for computer hardware.
(m) | Goodwill and intangible assets: |
When the Company acquires a subsidiary or other business where it exerts significant influence, the fair value of the net tangible and intangible assets acquired is determined and compared to the amount paid for the subsidiary or business acquired. Any excess of the amount paid over the fair value of those net assets is considered to be goodwill.
Goodwill is tested for impairment annually as of December 31, or more frequently if events or circumstances indicate that the carrying value may not be recoverable, to ensure that its fair value is greater than or equal to the carrying value. Any excess of carrying value over fair value is charged to the consolidated statements of operations in the period in which the impairment is determined.
The Company has the option to assess goodwill for impairment by first performing a qualitative assessment to determine whether it is more likely than not that the fair value of a reporting unit is less than its carrying amount. If facts and circumstances indicate that it is more likely than not that the goodwill is impaired, a fair value-based impairment test would be required. The goodwill impairment test is a two-step process that requires management to make judgments in determining what assumptions to use in the calculation. In the first step, the fair value of the reporting unit is compared to its book value including goodwill. If the fair value of the reporting unit is in excess of its book value, the related goodwill is not impaired and no further analysis is necessary. If the fair value of the reporting unit is less than its book value, there is an indication of potential impairment and a second step is performed. When required, the second step of testing involves calculating the implied fair value of goodwill for the reporting unit. The implied fair value of goodwill is determined in the same manner as goodwill recognized in a business combination, which is the excess of the fair value of the reporting unit determined in step one over the fair value of its net assets and identifiable intangible assets as if the reporting unit had been acquired. If the carrying value of the reporting unit's goodwill exceeds the implied fair value of that goodwill, an impairment loss is recognized in an amount equal to that excess. For reporting units with a negative book value, qualitative factors are evaluated to determine whether it is necessary to perform the second step of the goodwill impairment test.
When the Company acquires a subsidiary or other business where it exerts significant influence or acquires certain assets, intangible assets may be acquired, which are recorded at their fair value at the time of the acquisition. An intangible asset with a definite useful life is amortized in the consolidated statements of operations over its estimated useful life. The Company writes down the value of an intangible asset with a definite useful life when the undiscounted cash flows are not expected to allow for full recovery of the carrying value.
70 | ||
KINGSWAY FINANCIAL SERVICES INC. Notes to Consolidated Financial Statements | ||
Intangible assets with indefinite useful lives are not subject to amortization and are tested for impairment annually as of December 31, or more frequently if events or circumstances indicate that the carrying value may not be recoverable, to ensure that fair values are greater than or equal to carrying values. Any excess of carrying value over fair value is charged to the consolidated statements of operations in the period in which the impairment is determined.
(n) | Unpaid loss and loss adjustment expenses: |
Unpaid loss and loss adjustment expenses represent the estimated liabilities for reported loss events, incurred but not yet reported loss events and the related estimated loss adjustment expenses, including investigation. Unpaid loss and loss adjustment expenses are determined using case-basis evaluations and statistical analyses, including industry loss data, and represent estimates of the ultimate cost of all claims incurred through the balance sheet date. Although considerable variability is inherent in such estimates, management believes that the liability for unpaid loss and loss adjustment expenses is adequate. The estimates are continually reviewed and adjusted as necessary, and such adjustments are included in current operations and accounted for as changes in estimates.
(o) | Debt: |
The Company's note payable is reported at amortized cost. The note payable includes a premium which is being amortized through the maturity date of the note payable using the effective interest rate method.
The Company's subordinated debt is measured and reported at fair value. The fair value of the subordinated debt is calculated using a model based on significant market observable inputs and inputs developed by a third-party. These inputs include credit spread assumptions developed by a third-party and market observable swap rates. Changes in fair value are reported in the consolidated statements of operations as loss (gain) on change in fair value of debt.
(p) | Contingent consideration: |
The consideration for certain of the Company's acquisitions includes future payments to the former owners that are contingent upon the achievement of certain targets over future reporting periods. Liabilities for contingent consideration are measured and reported at fair value at the date of acquisition and are included in accrued expenses and other liabilities in the consolidated balance sheets. Changes in the fair value of contingent consideration liabilities can result from changes to one or multiple inputs, including adjustments to the discount rates or changes in the assumed achievement or timing of any targets. These fair value measurements are based on significant inputs not observable in the market. Changes in assumptions could have an impact on the payout of contingent consideration liabilities. Changes in fair value are reported in the consolidated statements of operations as contingent consideration benefit.
(q) | Income taxes: |
The Company and its non-U.S. subsidiaries file separate foreign income tax returns. Kingsway America II Inc. and its eligible U.S. subsidiaries file a U.S. consolidated federal income tax return ("KAI Tax Group"). The method of allocating federal income taxes among the companies in the KAI Tax Group is subject to written agreement, approved by each company's Board of Directors. The allocation is made primarily on a separate return basis, with current credit for any net operating losses or other items utilized in the consolidated federal income tax return. The Company's U.S. subsidiaries which are not included in the KAI Tax Group file separate federal income tax returns.
The Company follows the asset and liability method of accounting for income taxes, whereby deferred income tax assets and liabilities are recognized for (i) the differences between the financial statement carrying amount of existing assets and liabilities and their respective tax bases and (ii) loss and tax credit carryforwards. Deferred income tax assets and liabilities are measured using enacted tax rates expected to apply to taxable income in the years in which those temporary differences are expected to be recovered or settled. The effect on deferred tax assets and liabilities of a change in tax rates is recognized in income in the period that includes the date of enactment. Future tax benefits are recognized to the extent that realization of such benefits is more likely than not and a valuation allowance is established for any portion of a deferred tax asset that management believes will not be realized. Current federal income taxes are charged or credited to operations based upon amounts estimated to be payable or recoverable as a result of taxable operations for the current year. The Company accounts for uncertain tax positions in accordance with the income tax accounting guidance. The Company recognizes interest and penalties, if any, related to unrecognized tax benefits in income tax (benefit) expense.
71 | ||
KINGSWAY FINANCIAL SERVICES INC. Notes to Consolidated Financial Statements | ||
(r) | Leases |
Rental income from operating leases is recognized on a straight-line basis, based on contractual lease terms with fixed and determinable increases over the non-cancellable term of the related lease when collectability is reasonably assured. Rental income recognized in excess of amounts contractually due and collected pursuant to the underlying lease is recorded in other receivables in the consolidated balance sheets. Rental expense for operating leases is recognized on a straight-line basis over the lease term, net of any applicable lease incentive amortization. Below market lease liabilities recorded in connection with the acquisition method of accounting are amortized on a straight-line basis over the remaining term of the lease, as determined at the acquisition date, and are included in accrued expenses and other liabilities in the consolidated balance sheets. Amortization of below market lease liabilities is included in rental income in the consolidated statements of operations.
(s) | Revenue recognition: |
Premium revenue and unearned premiums
Premium revenue is recognized on a pro rata basis over the terms of the respective policy contracts. Unearned premiums represent the portion of premiums written that are applicable to the unexpired terms of policies in force.
Service charges on installment premiums are recognized as income upon receipt of related installment payments and are reflected in other income. Revenue from policy fees is deferred and recognized over the terms of the respective policy contracts, with revenue reflected in other income.
The reinsurers' share of unearned premiums is recognized as amounts recoverable using principles consistent with the Company's method for determining the unearned premium liability.
Service fee and commission income and deferred service fees
Service fee and commission income represents vehicle service agreement fees and warranty product and maintenance support fees based on terms of various agreements with credit unions, consumers and businesses.
Vehicle service agreement fees include the administrative fees from the sale of vehicle service agreements as well as the fees to administer future claims. The administrative fee component is recognized in proportion to the costs incurred in acquiring and administering the vehicle service agreements. The claims fee component is earned over the life of the vehicle service agreements based on the greater of expected claims or actual claims experience.
Warranty product and maintenance support fees include the fees from the sale of warranty contracts for certain new and used heating, ventilation, air conditioning ("HVAC"), standby generator, commercial LED lighting and refrigeration equipment as well as the fees collected to administer equipment breakdown and maintenance support services. Warranty product and maintenance support fees are earned at the time the warranty product sales and equipment breakdown and maintenance support transactions are completed or services are rendered.
Contingent revenue
The terms of the sale of one of the Company's subsidiaries includes potential receipt by the Company of future earnout payments. The gain related to the earnout payments is recorded when the consideration is determined to be realizable and is reported in the consolidated statements of operations as gain on disposal of discontinued operations, net of taxes.
The assumptions and methodologies used are continually reviewed and any adjustments are reflected in the consolidated statements of operations in the period in which the adjustments are made.
(t) | Cost of services sold: |
Cost of services sold is comprised of direct costs incurred to generate maintenance support fee revenue. Cost of services sold includes payments to third-party contractors who service equipment breakdowns and perform maintenance support.
(u) | Stock-based compensation: |
The Company has a stock-based compensation plan for key officers of the Company. The Company uses the fair-value method of accounting for stock-based compensation awards granted to employees. Expense is recognized on a straight-line basis over the service period during which awards are expected to vest, with a corresponding increase to additional paid-in capital. The Company determines the fair value of stock options on their grant date using the Black-Scholes option pricing model. When these stock
72 | ||
KINGSWAY FINANCIAL SERVICES INC. Notes to Consolidated Financial Statements | ||
options are exercised, the amount of proceeds together with the amount recorded in additional paid-in capital is recorded in shareholders' equity.
(v) | Fair value of financial instruments: |
The fair values of the Company's investments in fixed maturities and equity investments, limited liability investment, at fair value, performance shares, subordinated debt and contingent consideration are estimated using a fair value hierarchy to categorize the inputs it uses in valuation techniques. The fair value of the Company's investments in investees is based on quoted market prices. Fair values for other investments approximate their unpaid principal balance. The carrying amounts reported in the consolidated balance sheets approximate fair values for cash, short-term investments and certain other assets and other liabilities because of their short-term nature.
NOTE 3 RESTATEMENT OF PREVIOUSLY ISSUED FINANCIAL STATEMENTS
The Company has restated its consolidated financial statements as of and for the years ended December 31, 2015 and December 31, 2014. In addition, the Company has restated the balances for the years ended December 31, 2015 and December 31, 2014 included in the first table to Note 24, “Accumulated Other Comprehensive Loss.” The restatements reflect immaterial corrections of errors identified by management during the fourth quarter of 2016 in the Company’s intercompany eliminations related to accumulated other comprehensive income and accumulated deficit. No change to shareholders’ equity attributable to common shareholders, total shareholders’ equity, the consolidated statements of operations or the consolidated statements of cash flows for the periods presented in the 2016 Annual Report results from the restatements. The nature and impact of these restatements are described below and detailed in the table below.
Intercompany Eliminations
During the fourth quarter of 2016, the Company identified items in its accumulated other comprehensive income balance primarily related to subsidiaries that were disposed of in 2009 and 2010, a subsidiary that was liquidated in 2013 and a subsidiary that was deconsolidated in 2015. These errors resulted in overstatements of accumulated other comprehensive income and understatements of accumulated deficit.
The errors from the 2009 and 2010 disposals of subsidiaries resulted from entries that were recorded against accumulated deficit instead of accumulated other comprehensive income at the time the accounting for the disposals occurred. The recording of these errors resulted in no change to loss from continuing operations, net loss or total shareholders’ equity for the years ended December 31, 2010 and December 31, 2009.
The error from the 2013 liquidation of subsidiary resulted from tax on foreign exchange related to the liquidated entity. The tax on foreign exchange was not reversed from accumulated other comprehensive income at the time the accounting for the liquidation occurred. The recording of this error related to the liquidation of subsidiary resulted in no change to loss from continuing operations, a decrease to net loss of approximately $1.9 million and no change to shareholders’ equity attributable to common shareholders or total shareholders’ equity for the year ended December 31, 2013.
The restatements described above relate to periods prior to 2014. The cumulative effect of those restatements prior to 2014 resulted in a reduction to accumulated other comprehensive income and an increase to accumulated deficit of approximately $11.0 million, which has been reflected as a correction of prior period errors as of January 1, 2014 in the consolidated statements of shareholders’ equity.
The error from the 2015 deconsolidation of subsidiary resulted from an entry that was recorded against accumulated other comprehensive income instead of accumulated deficit at the time the accounting for the deconsolidation occurred. The recording of this error resulted in no change to loss from continuing operations, net income, shareholders’ equity attributable to common shareholders or total shareholders’ equity for the year ended December 31, 2015.
The restatement related to the year ended December 31, 2015 resulted in a reduction to accumulated other comprehensive income and an increase to accumulated deficit of approximately $0.8 million, which has been reflected as a correction of prior period error for the year ended December 31, 2015 in the consolidated statements of shareholders’ equity.
The cumulative effect of the restatements identified over the restated periods resulted in a reduction to accumulated other comprehensive income and an increase to accumulated deficit of approximately $11.8 million and no change to shareholders’ equity attributable to common shareholders or total shareholders’ equity as reported in the consolidated balance sheets at December 31, 2015.
73 | ||
KINGSWAY FINANCIAL SERVICES INC. Notes to Consolidated Financial Statements | ||
The restated consolidated balance sheet as of December 31, 2015 is presented below:
(in thousands) | December 31, 2015 | |||||||||||
As Previously Reported on Form 10-K | Intercompany Elimination Restatements | As Restated | ||||||||||
Assets: | ||||||||||||
Investments: | ||||||||||||
Fixed maturities, at fair value | $ | 55,559 | $ | — | $ | 55,559 | ||||||
Equity investments, at fair value | 27,559 | — | 27,559 | |||||||||
Limited liability investments | 20,141 | — | 20,141 | |||||||||
Other investments, at cost which approximates fair value | 4,077 | — | 4,077 | |||||||||
Short-term investments, at cost which approximates fair value | 400 | — | 400 | |||||||||
Total investments | 107,736 | — | 107,736 | |||||||||
Cash and cash equivalents | 51,701 | — | 51,701 | |||||||||
Investment in investee | 1,772 | — | 1,772 | |||||||||
Accrued investment income | 594 | — | 594 | |||||||||
Premiums receivable, net | 27,090 | — | 27,090 | |||||||||
Service fee receivable, net | 911 | — | 911 | |||||||||
Other receivables, net | 3,789 | — | 3,789 | |||||||||
Reinsurance recoverable | 1,422 | — | 1,422 | |||||||||
Deferred acquisition costs, net | 12,143 | — | 12,143 | |||||||||
Income taxes recoverable | 61 | — | 61 | |||||||||
Property and equipment, net | 5,577 | — | 5,577 | |||||||||
Goodwill | 10,078 | — | 10,078 | |||||||||
Intangible assets, net | 14,736 | — | 14,736 | |||||||||
Other assets | 3,412 | — | 3,412 | |||||||||
Total Assets | $ | 241,022 | $ | — | $ | 241,022 | ||||||
Liabilities and Shareholders' Equity | ||||||||||||
Liabilities: | ||||||||||||
Unpaid loss and loss adjustment expenses: | ||||||||||||
Property and casualty | $ | 55,471 | $ | — | $ | 55,471 | ||||||
Vehicle service agreements | 2,975 | — | 2,975 | |||||||||
Total unpaid loss and loss adjustment expenses | 58,446 | — | 58,446 | |||||||||
Unearned premiums | 35,234 | — | 35,234 | |||||||||
Reinsurance payable | 145 | — | 145 | |||||||||
Subordinated debt, at fair value | 39,898 | — | 39,898 | |||||||||
Deferred income tax liability | 2,924 | — | 2,924 | |||||||||
Deferred service fees | 34,319 | — | 34,319 | |||||||||
Accrued expenses and other liabilities | 19,959 | — | 19,959 | |||||||||
Total Liabilities | 190,925 | — | 190,925 | |||||||||
Class A preferred stock, no par value | 6,394 | — | 6,394 | |||||||||
Shareholders' Equity: | ||||||||||||
Common stock, no par value | — | — | — | |||||||||
Additional paid-in capital | 341,646 | — | 341,646 | |||||||||
Accumulated deficit | (308,995 | ) | 11,786 | (297,209 | ) | |||||||
Accumulated other comprehensive income (loss) | 9,300 | (11,786 | ) | (2,486 | ) | |||||||
Shareholders' equity attributable to common shareholders | 41,951 | — | 41,951 | |||||||||
Noncontrolling interests in consolidated subsidiaries | 1,752 | — | 1,752 | |||||||||
Total Shareholders' Equity | 43,703 | — | 43,703 | |||||||||
Total Liabilities and Shareholders' Equity | $ | 241,022 | $ | — | $ | 241,022 | ||||||
74 | ||
KINGSWAY FINANCIAL SERVICES INC. Notes to Consolidated Financial Statements | ||
NOTE 4 RECENTLY ISSUED ACCOUNTING STANDARDS
(a) Adoption of New Accounting Standards:
In February 2015, the FASB issued ASU 2015-02, Consolidation (Topic 810): Amendments to the Consolidation Analysis ("ASU 2015-02"). The amendments in ASU 2015-02 affect reporting entities that are required to evaluate whether they should consolidate certain legal entities. All legal entities are subject to reevaluation under the revised consolidation model. Specifically, the amendments modify the evaluation of whether limited partnerships and similar legal entities are variable interest entities ("VIEs") or voting interest entities while also eliminating the presumption that a general partner should consolidate a limited partnership. Effective January 1, 2016, the Company adopted ASU 2015-02. The adoption of the standard did not have an impact on the consolidated financial statements.
In May 2015, the FASB issued ASU 2015-09, Financial Services-Insurance (Topic 944): Disclosures about Short-Duration Contracts ("ASU 2015-09"). ASU 2015-09 was issued to enhance disclosures about an entity’s insurance liabilities, including the nature, amount, timing and uncertainty of cash flows related to those liabilities. ASU 2015-09 is effective for annual reporting periods beginning after December 15, 2015 and for interim periods beginning after December 15, 2016. Early adoption is permitted. Except for the increased disclosure requirements, the adoption of ASU 2015-09 did not impact the Company's consolidated financial statements.
In September 2015, the FASB issued ASU 2015-16, Business Combinations (Topic 805): Simplifying the Accounting for Measurement-Period Adjustments ("ASU 2015-16"). ASU 2015-16 simplifies the accounting for measurement-period adjustments in a business combination by requiring the acquirer to recognize adjustments to provisional amounts that are identified during the measurement period in the reporting period in which the adjustment amounts are determined. The effect on earnings as a result of the change to the provisional amounts, calculated as if the accounting had been completed as of the acquisition date, must be recorded in the reporting period in which the adjustment amounts are determined rather than retrospectively. The effects, by line item, if any, must be disclosed. Effective January 1, 2016, the Company adopted ASU 2015-16. The adoption of the standard did not have an impact on the consolidated financial statements.
In March 2016, the FASB issued ASU 2016-07, Investments-Equity Method and Joint Ventures (Topic 323): Simplifying the Transition to the Equity Method of Accounting ("ASU 2016-07"). ASU 2016-07 simplifies the transition to equity method accounting by requiring an equity method investor to add the cost of acquiring the additional interest in the investee to the current basis of the investor's previously held interest and adopt the equity method of accounting as of the date the investment becomes qualified for equity method accounting. ASU 2016-07 is effective for annual reporting periods beginning after December 15, 2016 and should be applied prospectively upon the effective date. Early adoption is permitted. Effective January 1, 2016, the Company adopted ASU 2016-07. The adoption of the standard did not have a material impact on the consolidated financial statements.
(b) Accounting Standards Not Yet Adopted:
In May 2014, the FASB issued ASU 2014-09, Revenue from Contracts with Customers ("ASU 2014-09"), which outlines a single comprehensive model for entities to use in accounting for revenue arising from contracts with customers. The core principle of ASU 2014-09 is that an entity recognizes revenue to depict the transfer of promised goods or services to customers in an amount that reflects the consideration to which the entity expects to be entitled in exchange for those goods or services. In August 2015, the FASB issued ASU 2015-14, Revenue from Contracts with Customers (Topic 606): Deferral of the Effective Date ("ASU 2015-14"). This amendment defers the effective date of the previously issued ASU 2014-09 until the interim and annual reporting periods beginning after December 15, 2017. Earlier application is permitted for interim and annual reporting periods beginning after December 15, 2016. In addition, the FASB has issued four related ASU's on principal versus agent guidance (ASU 2016-08), identifying performance obligations and the licensing implementation guidance (ASU 2016-10), a revision of certain SEC Staff Observer comments (ASU 2016-11) and implementation guidance (ASU 2016-12). Insurance contracts are not within the scope of ASU 2014-09; therefore, this standard would not apply to the Company's Insurance Underwriting segment. The Company is currently evaluating the impact of the adoption of ASU 2014-09 on its consolidated financial statements.
In January 2016, the FASB issued ASU 2016-01, Financial Instruments-Overall (Subtopic 825-10): Recognition and Measurement of Financial Assets and Financial Liabilities ("ASU 2016-01"). The amendments in ASU 2016-01 address certain aspects of recognition, measurement, presentation, and disclosure of financial instruments. Most significantly, ASU 2016-01 requires equity investments (except those accounted for under the equity method of accounting or those that result in consolidation of an investee) to be measured at fair value with changes in fair value recognized in net income (loss). For public business entities, the amendments in ASU 2016-01 are effective for fiscal years beginning after December 15, 2017, including interim periods within those fiscal years, and will be applied using a cumulative-effect adjustment to accumulated deficit as of the beginning of the fiscal year of adoption. The Company currently records its equity investments at fair value with net unrealized gains or losses reported in
75 | ||
KINGSWAY FINANCIAL SERVICES INC. Notes to Consolidated Financial Statements | ||
accumulated other comprehensive income. Adoption of ASU 2016-01 will require the changes in fair value on equity investments with readily determinable fair values to be recorded in net income (loss). Subsequent to adoption, ASU 2016-01 could have a significant impact on the Company's results of operations and earnings (loss) per share as changes in fair value will be presented in net income (loss) rather than other comprehensive income (loss).
In February 2016, the FASB issued ASU 2016-02, Leases ("ASU 2016-02"). ASU 2016-02 was issued to improve the financial reporting of leasing transactions. Under current guidance for lessees, leases are only included on the balance sheet if certain criteria, classifying the agreement as a capital lease, are met. This update will require the recognition of a right-of-use asset and a corresponding lease liability, discounted to the present value, for all leases that extend beyond 12 months. For operating leases, the asset and liability will be expensed over the lease term on a straight-line basis, with all cash flows included in the operating section of the statement of cash flows. For finance leases, interest on the lease liability will be recognized separately from the amortization of the right-of-use asset in the statement of comprehensive income and the repayment of the principal portion of the lease liability will be classified as a financing activity while the interest component will be included in the operating section of the statement of cash flows. ASU 2016-02 is effective for annual and interim reporting periods beginning after December 15, 2018. Early adoption is permitted. Upon adoption, leases will be recognized and measured at the beginning of the earliest period presented using a modified retrospective approach. The Company is currently evaluating the impact of the adoption of ASU 2016-02 on its consolidated financial statements.
In March 2016, the FASB issued ASU 2016-09, Compensation - Stock Compensation (Topic 718): Improvements to Employee Share-Based Payment Accounting ("ASU 2016-09"). ASU 2016-09 was issued to simplify the accounting for share-based payment awards. The guidance requires that, prospectively, all tax effects related to share-based payments be made through the statement of operations at the time of settlement as opposed to excess tax benefits being recognized in additional paid-in-capital under the current guidance. ASU 2016-09 also removes the requirement to delay recognition of a tax benefit until it reduces current taxes payable. This change is required to be applied on a modified retrospective basis, with a cumulative-effect adjustment to opening accumulated deficit. Additionally, all tax related cash flows resulting from share-based payments are to be reported as operating activities on the statement of cash flows, a change from the current requirement to present tax benefits as an inflow from financing activities and an outflow from operating activities. ASU 2016-09 is effective for annual and interim reporting periods beginning after December 15, 2016. Early adoption is permitted with any adjustments reflected as of the beginning of the fiscal year of adoption. The Company does not believe the adoption of ASU 2016-09 will have a material impact on its consolidated financial statements.
In August 2016, the FASB issued ASU 2016-15, Classification of Certain Cash Receipts and Cash Payments ("ASU 2016-15"). The objective of ASU 2016-15 is to reduce diversity in the classification of cash receipts and payments for specific cash flow issues, including debt prepayment or debt extinguishment costs, contingent consideration payments made after a business combination and proceeds from the settlement of insurance claims. ASU 2016-15 is effective for fiscal years beginning after December 31, 2017, and interim periods within those fiscal years. Early adoption of ASU 2016-15 is permitted. The Company does not believe the adoption of ASU 2016-15 will have a material impact on its consolidated financial statements.
In January 2017, the FASB issued ASU 2017-04, Intangibles - Goodwill and Other (Topic 350): Simplifying the Test for Goodwill Impairment ("ASU 2017-04"). ASU 2017-04 was issued to simplify the subsequent measurement of goodwill. This update changes the impairment test by requiring an entity to compare the fair value of a reporting unit with its carrying amount as opposed to comparing the carrying amount of goodwill with its implied fair value. ASU 2017-04 is effective for annual and interim reporting periods beginning after December 15, 2019. Early adoption is permitted. The Company does not believe the adoption of ASU 2017-04 will have a material impact on its consolidated financial statements.
NOTE 5 ACQUISITIONS
(a) Acquisitions
CMC Industries, Inc.:
On July 14, 2016, the Company completed the acquisition of 81.0% of CMC for cash consideration of $1.5 million. The consolidated statements of operations include the earnings of CMC from the date of acquisition. As further discussed in Note 25, "Segmented Information," CMC is included in the Leased Real Estate segment. CMC owns, through an indirect wholly owned subsidiary (the "Property Owner"), a parcel of real property consisting of approximately 192 acres located in the State of Texas (the "Real Property"). The Real Property is leased to a third party pursuant to a long-term triple net lease. The Real Property is also subject to a mortgage in the principal amount of $180.0 million (the "Mortgage") at the date of acquisition. The Mortgage is nonrecourse indebtedness with respect to CMC and its subsidiaries (including the Property Owner), and the Mortgage is not, nor will it be, guaranteed by
76 | ||
KINGSWAY FINANCIAL SERVICES INC. Notes to Consolidated Financial Statements | ||
Kingsway or its affiliates. All cash rental income generated by the Real Property is applied to make principal and interest payments on the Mortgage. The Mortgage is recorded as note payable on the consolidated balance sheets.
This acquisition was accounted for as a business combination using the acquisition method of accounting. The purchase price was allocated to the assets acquired and liabilities assumed based upon their estimated fair values at the date of acquisition. During the fourth quarter of 2016, the Company completed its fair value analysis on the assets acquired and liabilities assumed. Goodwill of $61.0 million was recognized in addition to $74.8 million of separately identifiable intangible assets resulting from the valuations of in-place lease and a tenant relationship. The goodwill is not deductible for tax purposes. Refer to Note 12, "Intangible Assets," for further disclosure of the intangible assets related to this acquisition. The Company also recognized a below market lease liability of $0.9 million, which is included in accrued expenses and other liabilities. The below market lease liability resulted from the terms of the acquired operating lease contract being unfavorable relative to market terms of comparable leases on the date of acquisition. The below market lease liability is amortized on a straight-line basis over the remaining term of the lease, as determined at the acquisition date. Amortization of below market lease liabilities is included in rental income in the consolidated statements of operations.
The following table summarizes the estimated fair value of the assets acquired and liabilities assumed at the date of acquisition:
(in thousands) | ||||
July 14, 2016 | ||||
Cash and cash equivalents | $ | 1,006 | ||
Other receivables | 1,971 | |||
Property and equipment | 113,008 | |||
Intangible asset - subject to amortization | 1,125 | |||
Intangible asset - not subject to amortization | 73,667 | |||
Other assets | 1,385 | |||
Goodwill | 60,983 | |||
Total assets | $ | 253,145 | ||
Note payable | $ | 191,741 | ||
Deferred income tax liability | 55,603 | |||
Income taxes payable | 2,018 | |||
Accrued expenses and other liabilities | 1,984 | |||
Noncontrolling interest in CMC | 299 | |||
Total liabilities and noncontrolling interest | $ | 251,645 | ||
Purchase price | $ | 1,500 | ||
The consolidated statements of operations include the earnings of CMC from the date of acquisition. From the date of acquisition through December 31, 2016, CMC earned revenue of $5.4 million and net income of $0.5 million. The following unaudited pro forma summary presents the Company's consolidated financial statements for the years ended December 31, 2016 and December 31, 2015 as if CMC had been acquired on January 1, 2015. The pro forma summary is presented for illustrative purposes only and does not purport to represent the results of our operations that would have actually occurred had the acquisition occurred on January 1, 2015 or project our results of operations as of any future date or for any future period, as applicable.
77 | ||
KINGSWAY FINANCIAL SERVICES INC. Notes to Consolidated Financial Statements | ||
(in thousands, except per share data) | Years ended December 31, | |||||||
2016 | 2015 | |||||||
Revenues | $ | 183,294 | $ | 172,320 | ||||
Income (loss) from continuing operations attributable to common shareholders | $ | 538 | $ | (10,884 | ) | |||
Basic earnings (loss) per share - continuing operations | $ | 0.03 | $ | (0.55 | ) | |||
Diluted earnings (loss) per share - continuing operations | $ | 0.03 | $ | (0.55 | ) | |||
Argo Management Group LLC:
Effective April 21, 2016, the Company issued 160,000 shares of its common stock to acquire Argo. The Argo purchase price of $0.7 million was determined using the closing price of Kingsway common stock on the date the 160,000 shares were issued. The consolidated statements of operations include the earnings of Argo from the date of acquisition. No supplemental pro forma revenue and earnings information related to the acquisition has been presented for the years ended December 31, 2016 and December 31, 2015, as the impact is immaterial. Argo’s primary business is to act as the Managing Member of Argo Holdings Fund I, LLC, an investment fund organized for purposes of making control-oriented equity investments in established lower middle market companies based in North America, with a focus on search fund investments.
This acquisition was accounted for as a business combination using the acquisition method of accounting. The purchase price was allocated to the assets acquired and liabilities assumed based upon their estimated fair values at the date of acquisition. During the second quarter of 2016, the Company completed its fair value analysis on the assets acquired and liabilities assumed. Separately identifiable intangible assets of $0.7 million were recognized resulting from the valuations of contract-based management fee and promote fee revenues. Refer to Note 12, "Intangible Assets," for further disclosure of the intangible assets related to this acquisition.
The following table summarizes the estimated fair value of the assets acquired and liabilities assumed at the date of acquisition:
(in thousands) | ||||
April 21, 2016 | ||||
Cash and cash equivalents | $ | 5 | ||
Other receivables | 17 | |||
Intangible assets - subject to amortization | 731 | |||
Other assets | 5 | |||
Total assets | $ | 758 | ||
Accrued expenses and other liabilities | $ | 14 | ||
Total liabilities | $ | 14 | ||
Purchase price | $ | 744 | ||
NOTE 6 DISPOSITION, DECONSOLIDATIONS AND DISCONTINUED OPERATIONS
(a) Disposition
Effective March 31, 2014, the Company's wholly owned subsidiary, 1347 Property Insurance Holdings, Inc. ("PIH"), formerly known as Maison Insurance Holdings, Inc., completed an initial public offering of its common stock. Total consideration to the Company as a result of this transaction was $7.7 million, consisting of a 28.7% interest in the common shares of PIH. As a result of the disposal, the Company recognized a loss of $1.2 million during the first quarter of 2014. The earnings of PIH are included in the consolidated statements of operations through the March 31, 2014 transaction date. The Company's approximate voting percentage in PIH is 16.4% at December 31, 2016. The Company's investment in PIH common stock is included in equity investments and reported at its fair value of $7.6 million in the consolidated balance sheets at December 31, 2016.
78 | ||
KINGSWAY FINANCIAL SERVICES INC. Notes to Consolidated Financial Statements | ||
(b) Deconsolidations
1347 Investors LLC:
At June 30, 2016, the Company owned 61.0% of the outstanding units of 1347 Investors. Because the Company owned more than 50% of the outstanding units, 1347 Investors was included in the consolidated financial statements of the Company. 1347 Investors had an investment in the common stock and private units of 1347 Capital Corp. which was reflected in investments in investees in the consolidated balance sheets. 1347 Capital Corp., which completed an initial public offering on July 21, 2014 and which had 24 months from the date of the initial public offering to complete a successful business combination, was formed for the purpose of entering into a merger, share exchange, asset acquisition or other similar business combination with one or more businesses or entities.
On March 23, 2016, 1347 Capital Corp. announced the signing of a definitive agreement with Limbach Holdings LLC ("Limbach"), in which 1347 Capital Corp. would merge with Limbach. On July 21, 2016, Limbach announced the closing of the previously announced merger, and 1347 Capital Corp. was renamed Limbach Holdings, Inc. As a result of this transaction, the Company's ownership percentage in 1347 Investors was reduced to 26.7% at the transaction date, leading the Company to record a non-cash gain of $5.6 million during 2016 related to the deconsolidation of 1347 Investors. This gain results from removing the carrying value of the noncontrolling interest in 1347 Investors and the carrying value of the consolidated net assets of 1347 Investors, which the Company reported prior to the closing of the transaction, and recording the fair value of the Company's 26.7% retained noncontrolling investment in 1347 Investors as of the transaction date. Subsequent to the transaction date, the Company is accounting for its remaining noncontrolling investment in 1347 Investors at fair value.
Kingsway Linked Return of Capital Trust:
On July 14, 2005, KLROC Trust completed its public offering of C$78.0 million through the issuance of 3,120,000 LROC 5% preferred units due June 30, 2015 (“LROC preferred units”), of which the Company was a promoter. KLROC Trust’s net proceeds of the public offering was C$74.1 million.
During 2009 and 2010, KFS Capital began purchasing LROC preferred units. As a result of these acquisitions, the Company beneficially owned and controlled 2,333,715 units, representing 74.8% of the issued and outstanding LROC preferred units and began consolidating the financial statements of KLROC Trust effective July 23, 2010.
During the second quarter of 2015, the Company's controlling interest in KLROC Trust was reduced to zero upon the Company's repayment of its C$15.8 million outstanding on its LROC preferred units due June 30, 2015. As a result, the Company recorded a non-cash loss on deconsolidation of KLROC Trust of $4.4 million for the year ended December 31, 2015. This reported loss results from removing the net assets and accumulated other comprehensive loss of KLROC Trust from the Company’s consolidated balance sheets.
(c) Discontinued Operations
On April 1, 2015, the Company closed on the sale of its subsidiary, Assigned Risk Solutions Ltd. ("ARS") for $47.0 million in cash. During the second quarter of 2015, the Company received additional post-closing cash consideration of $2.0 million. The terms of the sale also provide for potential receipt by the Company of future earnout payments equal to 1.25% of ARS' written premium and fee income during the earnout periods. The earnout payments are payable in three annual installments beginning in April 2016 through April 2018. During 2016, the Company received cash consideration of $1.5 million, before expenses, consisting of the first annual installment earnout payment of $1.4 million and $0.1 million related to state tax overpayments. Net of expenses, the Company recorded an additional gain on disposal of ARS of $1.3 million for the year ended December 31, 2016. The Company recorded a net gain on disposal of ARS, not including future earnout payments, of $11.3 million for the year ended December 31, 2015. As a result of the sale, ARS, previously disclosed as part of the Insurance Services segment, has been classified as a discontinued operation. The earnings of ARS are disclosed as discontinued operations in the consolidated statements of operations for all periods presented. Summary financial information included in income from discontinued operations, net of taxes for the years ended December 31, 2016, 2015 and 2014 is presented below:
79 | ||
KINGSWAY FINANCIAL SERVICES INC. Notes to Consolidated Financial Statements | ||
(in thousands) | Year ended December 31, | Year ended December 31, | Year ended December 31, | |||||||||
2016 | 2015 | 2014 | ||||||||||
Revenues: | ||||||||||||
Service fee and commission income | $ | — | $ | 8,342 | $ | 30,189 | ||||||
Other (expense) income | — | (20 | ) | 27 | ||||||||
Total revenues | — | 8,322 | 30,216 | |||||||||
Expenses: | ||||||||||||
General and administrative expenses | — | 6,462 | 25,611 | |||||||||
Income from discontinued operations before income tax expense | — | 1,860 | 4,605 | |||||||||
Income tax expense | — | 443 | 1,163 | |||||||||
Income from discontinued operations, net of taxes | — | 1,417 | 3,442 | |||||||||
Gain on disposal of discontinued operations before income tax benefit | 1,255 | 11,177 | — | |||||||||
Income tax benefit | — | (90 | ) | — | ||||||||
Gain on disposal of discontinued operations, net of taxes | 1,255 | 11,267 | — | |||||||||
Total gain/income from discontinued operations, net of taxes | $ | 1,255 | $ | 12,684 | $ | 3,442 | ||||||
For the years ended December 31, 2016 and 2015, ARS' net cash used in operating activities was zero and $0.2 million, respectively. For the year ended December 31, 2014, ARS' net cash provided by operating activities was $1.7 million. ARS had no cash flows from investing activities for the years ended December 31, 2016, 2015 and 2014.
80 | ||
KINGSWAY FINANCIAL SERVICES INC. Notes to Consolidated Financial Statements | ||
NOTE 7 INVESTMENTS
The amortized cost, gross unrealized gains and losses, and estimated fair value of the Company's investments in fixed maturities and equity investments at December 31, 2016 and December 31, 2015 are summarized in the tables shown below:
(in thousands) | December 31, 2016 | |||||||||||||||
Amortized Cost | Gross Unrealized Gains | Gross Unrealized Losses | Estimated Fair Value | |||||||||||||
Fixed maturities: | ||||||||||||||||
U.S. government, government agencies and authorities | $ | 28,312 | $ | 22 | $ | 186 | $ | 28,148 | ||||||||
States, municipalities and political subdivisions | 3,131 | 1 | 44 | 3,088 | ||||||||||||
Mortgage-backed | 8,610 | 12 | 116 | 8,506 | ||||||||||||
Asset-backed securities and collateralized mortgage obligations | 3,468 | 4 | 5 | 3,467 | ||||||||||||
Corporate | 18,615 | 94 | 154 | 18,555 | ||||||||||||
Total fixed maturities | 62,136 | 133 | 505 | 61,764 | ||||||||||||
Equity investments: | ||||||||||||||||
Common stock | 17,701 | 4,156 | 431 | 21,426 | ||||||||||||
Warrants - publicly traded | 438 | 279 | 53 | 664 | ||||||||||||
Warrants - not publicly traded | 960 | 180 | — | 1,140 | ||||||||||||
Total equity investments | 19,099 | 4,615 | 484 | 23,230 | ||||||||||||
Total fixed maturities and equity investments | $ | 81,235 | $ | 4,748 | $ | 989 | $ | 84,994 | ||||||||
(in thousands) | December 31, 2015 | |||||||||||||||
Amortized Cost | Gross Unrealized Gains | Gross Unrealized Losses | Estimated Fair Value | |||||||||||||
Fixed maturities: | ||||||||||||||||
U.S. government, government agencies and authorities | $ | 20,443 | $ | 73 | $ | 63 | $ | 20,453 | ||||||||
States, municipalities and political subdivisions | 2,241 | 20 | 5 | 2,256 | ||||||||||||
Mortgage-backed | 7,997 | 25 | 59 | 7,963 | ||||||||||||
Asset-backed securities and collateralized mortgage obligations | 6,040 | 4 | 21 | 6,023 | ||||||||||||
Corporate | 18,885 | 60 | 81 | 18,864 | ||||||||||||
Total fixed maturities | 55,606 | 182 | 229 | 55,559 | ||||||||||||
Equity investments: | ||||||||||||||||
Common stock | 25,177 | 3,464 | 2,055 | 26,586 | ||||||||||||
Warrants - publicly traded | 291 | 28 | 90 | 229 | ||||||||||||
Warrants - not publicly traded | 960 | 24 | 240 | 744 | ||||||||||||
Total equity investments | 26,428 | 3,516 | 2,385 | 27,559 | ||||||||||||
Total fixed maturities and equity investments | $ | 82,034 | $ | 3,698 | $ | 2,614 | $ | 83,118 | ||||||||
81 | ||
KINGSWAY FINANCIAL SERVICES INC. Notes to Consolidated Financial Statements | ||
Net unrealized gains and losses in the tables above are reported as other comprehensive income with the exception of net unrealized gains of $0.2 million, at December 31, 2016, and net unrealized losses of $0.2 million, at December 31, 2015, related to warrants - not publicly traded, which are reported in the consolidated statements of operations.
The table below summarizes the Company's fixed maturities at December 31, 2016 by contractual maturity periods. Actual results may differ as issuers may have the right to call or prepay obligations, with or without penalties, prior to the contractual maturity of these obligations.
(in thousands) | December 31, 2016 | |||||||
Amortized Cost | Estimated Fair Value | |||||||
Due in one year or less | $ | 6,565 | $ | 6,561 | ||||
Due after one year through five years | 40,995 | 40,750 | ||||||
Due after five years through ten years | 4,665 | 4,552 | ||||||
Due after ten years | 9,911 | 9,901 | ||||||
Total | $ | 62,136 | $ | 61,764 | ||||
The following tables highlight the aggregate unrealized loss position, by security type, of fixed maturities and equity investments in unrealized loss positions as of December 31, 2016 and December 31, 2015. The tables segregate the holdings based on the period of time the investments have been continuously held in unrealized loss positions.
(in thousands) | December 31, 2016 | ||||||||||||||||||||||
Less than 12 Months | Greater than 12 Months | Total | |||||||||||||||||||||
Estimated Fair Value | Unrealized Loss | Estimated Fair Value | Unrealized Loss | Estimated Fair Value | Unrealized Loss | ||||||||||||||||||
Fixed maturities: | |||||||||||||||||||||||
U.S. government, government agencies and authorities | $ | 18,509 | $ | 186 | $ | — | $ | — | $ | 18,509 | $ | 186 | |||||||||||
States, municipalities and political subdivisions | 2,594 | 44 | — | — | 2,594 | 44 | |||||||||||||||||
Mortgage-backed | 7,709 | 116 | 58 | — | 7,767 | 116 | |||||||||||||||||
Asset-backed securities and collateralized mortgage obligations | 1,830 | 5 | 44 | — | 1,874 | 5 | |||||||||||||||||
Corporate | 10,956 | 154 | — | — | 10,956 | 154 | |||||||||||||||||
Total fixed maturities | 41,598 | 505 | 102 | — | 41,700 | 505 | |||||||||||||||||
Equity investments: | |||||||||||||||||||||||
Common stock | 900 | 293 | 868 | 138 | 1,768 | 431 | |||||||||||||||||
Warrants | 31 | 20 | — | 33 | 31 | 53 | |||||||||||||||||
Total equity investments | 931 | 313 | 868 | 171 | 1,799 | 484 | |||||||||||||||||
Total | $ | 42,529 | $ | 818 | $ | 970 | $ | 171 | $ | 43,499 | $ | 989 | |||||||||||
82 | ||
KINGSWAY FINANCIAL SERVICES INC. Notes to Consolidated Financial Statements | ||
(in thousands) | December 31, 2015 | ||||||||||||||||||||||
Less than 12 Months | Greater than 12 Months | Total | |||||||||||||||||||||
Estimated Fair Value | Unrealized Loss | Estimated Fair Value | Unrealized Loss | Estimated Fair Value | Unrealized Loss | ||||||||||||||||||
Fixed maturities: | |||||||||||||||||||||||
U.S. government, government agencies and authorities | $ | 12,635 | $ | 63 | $ | — | $ | — | $ | 12,635 | $ | 63 | |||||||||||
States, municipalities and political subdivisions | 745 | 5 | — | — | 745 | 5 | |||||||||||||||||
Mortgage-backed | 5,685 | 59 | — | — | 5,685 | 59 | |||||||||||||||||
Asset-backed securities and collateralized mortgage obligations | 5,035 | 21 | — | — | 5,035 | 21 | |||||||||||||||||
Corporate | 9,171 | 81 | — | — | 9,171 | 81 | |||||||||||||||||
Total fixed maturities | 33,271 | 229 | — | — | 33,271 | 229 | |||||||||||||||||
Equity investments: | |||||||||||||||||||||||
Common stock | 15,711 | 2,055 | — | — | 15,711 | 2,055 | |||||||||||||||||
Warrants | 897 | 330 | — | — | 897 | 330 | |||||||||||||||||
Total equity investments | 16,608 | 2,385 | — | — | 16,608 | 2,385 | |||||||||||||||||
Total | $ | 49,879 | $ | 2,614 | $ | — | $ | — | $ | 49,879 | $ | 2,614 | |||||||||||
Fixed maturities and equity investments contain approximately 173 and 127 individual investments that were in unrealized loss positions as of December 31, 2016 and 2015, respectively.
The establishment of an other-than-temporary impairment on an investment requires a number of judgments and estimates. The Company performs a quarterly analysis of the individual investments to determine if declines in market value are other-than-temporary. The analysis includes some or all of the following procedures as deemed appropriate by the Company:
• | identifying all unrealized loss positions that have existed for at least six months; |
• | identifying other circumstances which management believes may impact the recoverability of the unrealized loss positions; |
• | obtaining a valuation analysis from third-party investment managers regarding the intrinsic value of these investments based on their knowledge and experience together with market-based valuation techniques; |
• | reviewing the trading range of certain investments over the preceding calendar period; |
• | assessing if declines in market value are other-than-temporary for debt instruments based on the investment grade credit ratings from third-party rating agencies; |
• | assessing if declines in market value are other-than-temporary for any debt instrument with a non-investment grade credit rating based on the continuity of its debt service record; |
• | determining the necessary provision for declines in market value that are considered other-than-temporary based on the analyses performed; and |
• | assessing the Company's ability and intent to hold these investments at least until the investment impairment is recovered. |
The risks and uncertainties inherent in the assessment methodology used to determine declines in market value that are other-than-temporary include, but may not be limited to, the following:
• | the opinions of professional investment managers could be incorrect; |
• | the past trading patterns of individual investments may not reflect future valuation trends; |
• | the credit ratings assigned by independent credit rating agencies may be incorrect due to unforeseen or unknown facts related to a company's financial situation; and |
• | the debt service pattern of non-investment grade instruments may not reflect future debt service capabilities and may not reflect a company's unknown underlying financial problems. |
As a result of the analysis performed by the Company to determine declines in market value that are other-than-temporary, the Company recorded write downs of $0.1 million and $0.1 million for other-than-temporary impairment related to equity investments and limited liability investments, respectively, for the year ended December 31, 2016 and $0.0 million for other-than-temporary
83 | ||
KINGSWAY FINANCIAL SERVICES INC. Notes to Consolidated Financial Statements | ||
impairment related to fixed maturities for the year ended December 31, 2015. The Company did not recognize any impairment related to its investments that was considered other-than-temporary for the year ended December 31, 2014.
There were $0.1 million and $0.0 million of other-than-temporary losses recognized in other comprehensive income for the years ended December 31, 2016 and 2015. There were no other-than-temporary losses recognized in other comprehensive loss for the year ended December 31, 2014.
The Company has reviewed currently available information regarding investments with estimated fair values that are less than their carrying amounts and believes that these unrealized losses are not other-than-temporary and are primarily due to temporary market and sector-related factors rather than to issuer-specific factors. The Company does not intend to sell those investments, and it is not likely that it will be required to sell those investments before recovery of its amortized cost.
The Company does not have any exposure to subprime mortgage-backed investments.
Limited liability investments include investments in limited liability companies, limited partnerships and a general partnership that primarily invest in income-producing real estate or real estate related investments. The Company's interests in these investments are not deemed minor and, therefore, are accounted for under the equity method of accounting. The most recently available financial statements are used in applying the equity method. The difference between the end of the reporting period of the limited liability entities and that of the Company is no more than three months. As of December 31, 2016 and December 31, 2015, the carrying value of limited liability investments totaled $23.0 million and $20.1 million, respectively. At December 31, 2016, the Company has unfunded commitments totaling $1.6 million to fund limited liability investments.
Limited liability investment, at fair value represents the Company's investment in 1347 Investors. In connection with the deconsolidation of 1347 Investors during the third quarter of 2016, the Company retained a minority investment in 1347 Investors. The Company has made an irrevocable election to account for this investment at fair value. As of December 31, 2016 and December 31, 2015, the carrying value of the Company's limited liability investment, at fair value was $10.7 million and zero, respectively. At December 31, 2016, there was no unfunded commitment related to the limited liability investment, at fair value.
Other investments include mortgage and collateral loans and are reported at their unpaid principal balance. As of December 31, 2016 and December 31, 2015, the carrying value of other investments totaled $8.0 million and $4.1 million, respectively.
Gross realized gains and losses on fixed maturities, equity investments and limited liability investments for the years ended December 31, 2016, 2015 and 2014 were as follows:
(in thousands) | Years ended December 31, | |||||||||||
2016 | 2015 | 2014 | ||||||||||
Gross realized gains | $ | 764 | $ | 1,198 | $ | 5,474 | ||||||
Gross realized losses | (404 | ) | (1 | ) | (433 | ) | ||||||
Total | $ | 360 | $ | 1,197 | $ | 5,041 | ||||||
Net investment income for the years ended December 31, 2016, 2015 and 2014, respectively, is comprised as follows:
(in thousands) | Years ended December 31, | |||||||||||
2016 | 2015 | 2014 | ||||||||||
Investment income | ||||||||||||
Interest from fixed maturities | $ | 794 | $ | 907 | $ | 1,084 | ||||||
Dividends | 682 | 702 | 203 | |||||||||
Income from limited liability investments | 1,157 | 1,596 | 184 | |||||||||
Gain on change in fair value of limited liability investment, at fair value | 4,720 | — | — | |||||||||
Gain (loss) on change in fair value of warrants - not publicly traded | 380 | (216 | ) | — | ||||||||
Other | 609 | 186 | 372 | |||||||||
Gross investment income | 8,342 | 3,175 | 1,843 | |||||||||
Investment expenses | (142 | ) | (257 | ) | (227 | ) | ||||||
Net investment income | $ | 8,200 | $ | 2,918 | $ | 1,616 | ||||||
84 | ||
KINGSWAY FINANCIAL SERVICES INC. Notes to Consolidated Financial Statements | ||
NOTE 8 INVESTMENTS IN INVESTEES
At December 31, 2016, investment in investee includes the Company's investment in the common stock of ICL. Prior to the second quarter of 2016, the Company's investment in ICL was included in equity investments in the consolidated balance sheets. During the second quarter of 2016, the Company's ownership percentage in ICL was increased to 31.2%. As a result of this change in ownership, the Company determined that its investment in the common stock of ICL qualifies for the equity method of accounting and, thus, is included in investments in investees in the consolidated balance sheet at December 31, 2016. The Company's investment in ICL is recorded on a three-month lag basis.
At December 31, 2015, investment in investee includes 1347 Investors' investment in the common stock and private units of 1347 Capital Corp. As discussed in Note 6, "Disposition, Deconsolidations and Discontinued Operations," during the third quarter of 2016, the Company's ownership percentage in 1347 Investors was reduced to 26.7% and the Company deconsolidated 1347 Investors. As a result of removing the net assets of 1347 Investors from the Company’s consolidated balance sheets, the Company no longer has a direct investment in the common stock and private units of 1347 Capital Corp. at December 31, 2016.
Investments in investees are accounted for under the equity method. The carrying value, estimated fair value and approximate equity percentage for each of the Company's investments in investees at December 31, 2016 and December 31, 2015 were as follows:
(in thousands, except for percentages) | ||||||||||||||||||||||
December 31, 2016 | December 31, 2015 | |||||||||||||||||||||
Equity Percentage | Estimated Fair Value | Carrying Value | Equity Percentage | Estimated Fair Value | Carrying value | |||||||||||||||||
1347 Capital Corp. | — | % | $ | — | $ | — | 21.0 | % | $ | 12,369 | $ | 1,772 | ||||||||||
ICL | 31.2 | % | $ | 4,251 | $ | 3,116 | — | % | $ | — | $ | — | ||||||||||
Total | $ | 4,251 | $ | 3,116 | $ | 12,369 | $ | 1,772 | ||||||||||||||
The estimated fair value of the Company's investment in ICL at December 31, 2016 in the table above is calculated based on the published closing price of ICL at September 30, 2016 to be consistent with the three-month lag in reporting its carrying value under the equity method. The estimated fair value of the Company's investment in ICL based on the published closing price of ICL at December 31, 2016 is $3.6 million.
Equity in net loss of investees was $1.0 million, $0.3 million and $0.2 million for the years ended December 31, 2016, 2015 and 2014, respectively.
NOTE 9 REINSURANCE
As is customary in the insurance industry, the Company reinsures portions of certain insurance policies it writes, thereby providing a greater diversification of risk and minimizing exposure on larger risks. The Company remains contingently at risk with respect to any reinsurance ceded and would incur an additional loss if an assuming company were unable to meet its obligation under the reinsurance treaty.
The Company monitors the financial condition of its reinsurers to minimize its exposure to significant losses from reinsurer insolvencies. Letters of credit are maintained for any unauthorized reinsurer to cover ceded unearned premium and ceded unpaid loss and loss adjustment expenses balances.
For most of the non-standard automobile business, the liability is limited to the minimum statutory liability limits, which are typically not greater than $50,000 per occurrence, depending on the state. The Company's reinsurance includes excess of loss reinsurance to reduce its exposure to individual losses as well as losses related to catastrophic events which may simultaneously affect many of our policyholders. During 2016 and 2015, the Company entered into an excess of loss reinsurance arrangement to reduce its exposure to losses related to certain catastrophic events which may occur in any of the states in which the Company writes non-standard automobile business.
85 | ||
KINGSWAY FINANCIAL SERVICES INC. Notes to Consolidated Financial Statements | ||
Ceded premiums, loss and loss adjustments expenses, and commissions as of and for the years ended December 31, 2016, 2015 and 2014 are summarized as follows:
(in thousands) | Years ended December 31, | |||||||||||
2016 | 2015 | 2014 | ||||||||||
Ceded premiums written | $ | 141 | $ | 165 | $ | (3,695 | ) | |||||
Ceded premiums earned | 141 | 166 | 1,104 | |||||||||
Ceded loss and loss adjustment expenses | 111 | (571 | ) | 655 | ||||||||
Ceded unpaid loss and loss adjustment expenses | 681 | 1,207 | 3,203 | |||||||||
Ceded unearned premiums | 7 | 7 | 533 | |||||||||
Ceding commissions | — | (138 | ) | 5 | ||||||||
The maximum amount of return commission and return of unearned premium which would have been due if all of the Company's reinsurance had been canceled is as follows at December 31, 2016:
(in thousands) | December 31, 2016 | |||||||
Unearned Premium Reserve | Commission Equity | |||||||
Assumed | $ | 5,747 | $ | 912 | ||||
Ceded | 7 | — | ||||||
Net | $ | 5,740 | $ | 912 | ||||
The amounts of assumed premiums written were $23.5 million, $19.0 million and $20.1 million for the years ended December 31, 2016, 2015 and 2014, respectively. The amounts of assumed premiums earned were $22.8 million, $19.8 million and $19.9 million for the years ended December 31, 2016, 2015 and 2014, respectively.
NOTE 10 DEFERRED ACQUISITION COSTS
Policy acquisition costs consist primarily of commissions, premium taxes, and underwriting and agency expenses, net of ceding commission income, incurred related to successful efforts to acquire new or renewal insurance contracts and vehicle service agreements. Acquisition costs deferred on both property and casualty insurance products and vehicle service agreements are amortized over the period in which the related revenues are earned.
The components of deferred acquisition costs and the related amortization expense as of and for the years ended December 31, 2016, 2015 and 2014, respectively, are comprised as follows:
(in thousands) | Years ended December 31, | |||||||||||
2016 | 2015 | 2014 | ||||||||||
Balance at January 1, net | $ | 12,143 | $ | 12,197 | $ | 12,392 | ||||||
Additions | 29,288 | 26,307 | 26,627 | |||||||||
Amortization | (27,822 | ) | (26,361 | ) | (25,779 | ) | ||||||
Acquisition costs disposed of during the year related to PIH | — | — | (1,043 | ) | ||||||||
Balance at December 31, net | $ | 13,609 | $ | 12,143 | $ | 12,197 | ||||||
NOTE 11 GOODWILL
Goodwill was $71.1 million and $10.1 million at December 31, 2016 and 2015, respectively. As further discussed in Note 5, "Acquisitions," the Company recorded goodwill of $61.0 million related to the acquisition of CMC on July 14, 2016. The Company's goodwill at December 31, 2016 is attributable to the Insurance Services and Leased Real Estate reportable segments. The Company's goodwill at December 31, 2015 is attributable to the Insurance Services reportable segment.
Goodwill is assessed for impairment annually as of December 31, or more frequently if events or circumstances indicate that the carrying value may not be recoverable. The Company tested goodwill for recoverability at December 31, 2016, 2015 and 2014. Based on the assessment performed, no goodwill impairments were recognized in 2016, 2015 or 2014.
86 | ||
KINGSWAY FINANCIAL SERVICES INC. Notes to Consolidated Financial Statements | ||
NOTE 12 INTANGIBLE ASSETS
Intangible assets are comprised as follows:
(in thousands) | December 31, 2016 | |||||||||||
Gross Carrying Value | Accumulated Amortization | Net Carrying Value | ||||||||||
Intangible assets subject to amortization | ||||||||||||
Database | $ | 4,918 | $ | 2,029 | $ | 2,889 | ||||||
Vehicle service agreements in-force | 3,680 | 3,554 | 126 | |||||||||
Customer relationships | 3,611 | 1,521 | 2,090 | |||||||||
In-place lease | 1,125 | 29 | 1,096 | |||||||||
Contract-based revenues | 731 | 48 | 683 | |||||||||
Intangible assets not subject to amortization | ||||||||||||
Tenant relationship | 73,667 | — | 73,667 | |||||||||
Insurance licenses | 7,803 | — | 7,803 | |||||||||
Trade name | 663 | — | 663 | |||||||||
Total | $ | 96,198 | $ | 7,181 | $ | 89,017 | ||||||
(in thousands) | December 31, 2015 | |||||||||||
Gross Carrying Value | Accumulated Amortization | Net Carrying Value | ||||||||||
Intangible assets subject to amortization | ||||||||||||
Database | $ | 4,918 | $ | 1,537 | $ | 3,381 | ||||||
Vehicle service agreements in-force | 3,680 | 3,362 | 318 | |||||||||
Customer relationships | 3,611 | 1,040 | 2,571 | |||||||||
Non-compete agreement | 70 | 70 | — | |||||||||
Intangible assets not subject to amortization | ||||||||||||
Insurance licenses | 7,803 | — | 7,803 | |||||||||
Trade name | 663 | — | 663 | |||||||||
Total | $ | 20,745 | $ | 6,009 | $ | 14,736 | ||||||
As further discussed in Note 5, "Acquisitions," during 2016, the Company recorded $74.8 million of separately identifiable intangible assets related to in-place lease and tenant relationship, as part of the acquisition of CMC. The in-place lease intangible asset of $1.1 million is being amortized on a straight-line basis over its estimated useful life of approximately 18 years, which is based on the term of the existing operating lease. The tenant relationship intangible asset of $73.7 million relates to a single long-term tenant relationship. The Company has determined that there are no legal, regulatory, contractual, competitive, economic or other factors limiting the useful life of the tenant relationship; therefore the tenant relationship intangible asset is deemed to have an indefinite useful life and is not amortized.
As further discussed in Note 5, "Acquisitions," during the second quarter of 2016, the Company recorded $0.7 million of separately identifiable intangible assets for contract-based management fee and promote fee revenues as part of the acquisition of Argo. The contract-based management fee revenue intangible asset is being amortized over nine years. The contract-based promote fee revenue intangible asset is being amortized over a three-year period beginning in 2022. The amortization periods for the contract-based revenues intangible assets are based on the patterns in which the economic benefits of the intangible assets are expected to be consumed.
The Company's other intangible assets with definite useful lives are amortized either based on the pattern in which the economic benefits of the intangible asset are expected to be consumed or using the straight-line method over their estimated useful lives, which range from seven to fifteen years. Amortization of intangible assets was $1.2 million, $1.2 million and $1.6 million for the years ended December 31, 2016, 2015 and 2014, respectively. The estimated aggregate future amortization expense of all intangible assets is $1.2 million for 2017, $1.1 million for 2018, $0.9 million for 2019, $0.8 million for 2020 and $0.8 million for 2021.
87 | ||
KINGSWAY FINANCIAL SERVICES INC. Notes to Consolidated Financial Statements | ||
The tenant relationship, insurance licenses and trade name intangible assets have indefinite useful lives and are not amortized. All intangible assets with indefinite useful lives are reviewed annually by the Company for impairment. No impairment charges were taken on intangible assets in 2016, 2015 or 2014.
NOTE 13 PROPERTY AND EQUIPMENT
Property and equipment are comprised as follows:
(in thousands) | December 31, 2016 | |||||||||||
Cost | Accumulated Depreciation | Carrying Value | ||||||||||
Land | $ | 23,355 | $ | — | $ | 23,355 | ||||||
Site improvements | 91,308 | 1,894 | 89,414 | |||||||||
Buildings | 5,533 | 1,828 | 3,705 | |||||||||
Leasehold improvements | 540 | 392 | 148 | |||||||||
Furniture and equipment | 2,149 | 1,952 | 197 | |||||||||
Computer hardware | 4,679 | 4,537 | 142 | |||||||||
Total | $ | 127,564 | $ | 10,603 | $ | 116,961 | ||||||
(in thousands) | December 31, 2015 | |||||||||||
Cost | Accumulated Depreciation | Carrying Value | ||||||||||
Land | $ | 1,984 | $ | — | $ | 1,984 | ||||||
Building | 4,565 | 1,669 | 2,896 | |||||||||
Leasehold improvements | 463 | 330 | 133 | |||||||||
Furniture and equipment | 2,588 | 2,318 | 270 | |||||||||
Computer hardware | 8,514 | 8,220 | 294 | |||||||||
Total | $ | 18,114 | $ | 12,537 | $ | 5,577 | ||||||
For the year ended December 31, 2016, depreciation expense on property and equipment of $2.3 million and $0.2 million is included in general and administrative expenses and loss and loss adjustment expenses, respectively, in the consolidated statements of operations. For the year ended December 31, 2015, depreciation expense on property and equipment of $0.4 million and $0.2 million is included in general and administrative expenses and loss and loss adjustment expenses, respectively, in the consolidated statements of operations. For the year ended December 31, 2014, depreciation expense on property and equipment of $0.8 million and $0.0 million is included in general and administrative expenses and loss and loss adjustment expenses, respectively, in the consolidated statements of operations.
Prior to the fourth quarter of 2014, property consisting of building and land located in Miami, Florida with a carrying value of $5.2 million was classified as held for sale. As a result of declines in the fair value of the property, the Company recorded an impairment write-down of $1.2 million related to the asset held for sale during the year ended December 31, 2014. On October 2, 2014, the Company completed a sale and leaseback transaction involving the building and land located in Miami, Florida. Net proceeds were $4.3 million after deducting direct costs of the transaction. The Company recognized a loss of $0.1 million equal to the difference between the fair market value and the carrying value of the property at the date of the transaction. This transaction is accounted for as a financing because it does not qualify for sales recognition under the sale-leaseback accounting guidance due to the Company's continuing involvement with the property. As a result, at the date of the transaction, land and building with a carrying value of $5.2 million was reclassified from asset held for sale to property and equipment in the consolidated balance sheets, and the building is being depreciated over its estimated useful life. At December 31, 2016 and 2015, the carrying value of the land and building was $4.8 million and $4.9 million, respectively. See Note 16, "Finance Lease Obligation Liability," for further discussion.
NOTE 14 UNPAID LOSS AND LOSS ADJUSTMENT EXPENSES
The establishment of the provision for unpaid loss and loss adjustment expenses is based on known facts and interpretation of circumstances and is, therefore, a complex and dynamic process influenced by a large variety of factors. These factors include
88 | ||
KINGSWAY FINANCIAL SERVICES INC. Notes to Consolidated Financial Statements | ||
the Company's experience with similar cases and historical trends involving loss payment patterns, pending levels of unpaid loss and loss adjustment expenses, product mix or concentration, loss severity and loss frequency patterns.
Other factors include the continually evolving and changing regulatory and legal environment; actuarial studies; professional experience and expertise of the Company's claims departments' personnel and independent adjusters retained to handle individual claims; the quality of the data used for projection purposes; existing claims management practices including claims-handling and settlement practices; the effect of inflationary trends on future loss settlement costs; court decisions; economic conditions; and public attitudes.
Consequently, the process of determining the provision for unpaid loss and loss adjustment expenses necessarily involves risks that the actual loss and loss adjustment expenses incurred by the Company will deviate, perhaps materially, from the estimates recorded.
The Company's evaluation of the adequacy of unpaid loss and loss adjustment expenses includes a re-estimation of the liability for unpaid loss and loss adjustment expenses relating to each preceding financial year compared to the liability that was previously established.
(a) Property and Casualty
The results of this comparison and the changes in the provision for property and casualty unpaid loss and loss adjustment expenses, net of amounts recoverable from reinsurers, as of December 31, 2016 , December 31, 2015 and December 31, 2014 were as follows:
(in thousands) | December 31, | |||||||||||
2016 | 2015 | 2014 | ||||||||||
Balance at beginning of period, gross | $ | 55,471 | $ | 63,895 | $ | 84,534 | ||||||
Less reinsurance recoverable related to property and casualty unpaid loss and loss adjustment expenses | 1,207 | 3,203 | 7,942 | |||||||||
Balance at beginning of period, net | 54,264 | 60,692 | 76,592 | |||||||||
Incurred related to: | ||||||||||||
Current year | 96,289 | 86,439 | 84,577 | |||||||||
Prior years | 8,095 | 616 | (5,123 | ) | ||||||||
Paid related to: | ||||||||||||
Current year | (62,978 | ) | (54,415 | ) | (52,521 | ) | ||||||
Prior years | (42,556 | ) | (39,068 | ) | (42,428 | ) | ||||||
Disposal of unpaid loss and loss adjustment expenses related to PIH | — | — | (405 | ) | ||||||||
Balance at end of period, net | 53,114 | 54,264 | 60,692 | |||||||||
Plus reinsurance recoverable related to property and casualty unpaid loss and loss adjustment expenses | 681 | 1,207 | 3,203 | |||||||||
Balance at end of period, gross | $ | 53,795 | $ | 55,471 | $ | 63,895 | ||||||
The Company reported unfavorable development on property and casualty unpaid loss and loss adjustment expenses of $8.1 million and $0.6 million in 2016 and 2015, respectively, and favorable development of $5.1 million in 2014. The unfavorable development in 2016 was primarily related to the increase in property and casualty unpaid loss and loss adjustment expenses at Mendota and MCC, offset by a decrease in property and casualty unpaid loss and loss adjustment expenses due to the continuing voluntary run-off of Amigo. The unfavorable development in 2015 was primarily related to the increase in property and casualty unpaid loss and loss adjustment expenses at Mendota, offset by a decrease in property and casualty unpaid loss and loss adjustment expenses due to the continuing voluntary run-offs of Amigo and MCC. The favorable development in 2014 was primarily related to the decrease in property and casualty unpaid loss and loss adjustment expenses at Amigo and MCC. Original estimates are increased or decreased as additional information becomes known regarding individual claims.
89 | ||
KINGSWAY FINANCIAL SERVICES INC. Notes to Consolidated Financial Statements | ||
The following tables contain information about property and casualty incurred and paid loss and loss adjustment expenses development as of and for the year December 31, 2016, net of reinsurance, as well as cumulative claim frequency and the total of IBNR liabilities, including expected development on reported property and casualty unpaid loss and loss adjustment expenses included within the net incurred losses and allocated loss adjustment expenses amounts. The information about property and casualty incurred and paid loss and loss adjustment expenses development for the years ended December 31, 2007 through 2015, and the average annual percentage payout of incurred claims by age as of December 31, 2016, is presented as supplementary information.
Non-standard automobile insurance | |||||||||||||||||||||||||||
(in thousands) | |||||||||||||||||||||||||||
Incurred Loss and Allocated Loss Adjustment Expenses, Net of Reinsurance | |||||||||||||||||||||||||||
For the Years Ended December 31, | As of December 31, 2016 | ||||||||||||||||||||||||||
Accident Year | 2007 Unaudited | 2008 Unaudited | 2009 Unaudited | 2010 Unaudited | 2011 Unaudited | 2012 Unaudited | 2013 Unaudited | 2014 Unaudited | 2015 Unaudited | 2016 | Total of IBNR Plus Expected Development on Reported Losses | Cumulative Number of Reported Claims | |||||||||||||||
2007 | 186,902 | 199,988 | 203,203 | 208,109 | 207,872 | 207,398 | 223,317 | 222,939 | 223,213 | 224,127 | 938 | 52 | |||||||||||||||
2008 | 169,011 | 178,901 | 186,086 | 188,375 | 190,835 | 201,902 | 201,448 | 201,472 | 201,476 | 154 | 39 | ||||||||||||||||
2009 | 182,829 | 184,499 | 184,989 | 186,769 | 196,085 | 195,366 | 195,123 | 194,876 | 60 | 34 | |||||||||||||||||
2010 | 167,682 | 173,657 | 176,234 | 185,768 | 184,930 | 184,613 | 184,214 | 58 | 35 | ||||||||||||||||||
2011 | 106,834 | 106,744 | 114,291 | 112,087 | 111,672 | 111,380 | 10 | 25 | |||||||||||||||||||
2012 | 63,333 | 72,792 | 73,400 | 74,327 | 74,607 | 523 | 17 | ||||||||||||||||||||
2013 | 69,974 | 71,274 | 70,133 | 70,681 | 280 | 26 | |||||||||||||||||||||
2014 | 74,320 | 76,676 | 78,463 | 549 | 26 | ||||||||||||||||||||||
2015 | 74,431 | 79,818 | 1,015 | 29 | |||||||||||||||||||||||
2016 | 83,835 | 3,249 | 33 | ||||||||||||||||||||||||
Total | 1,303,477 | ||||||||||||||||||||||||||
90 | ||
KINGSWAY FINANCIAL SERVICES INC. Notes to Consolidated Financial Statements | ||
Non-standard automobile insurance | |||||||||||||||||||||
(in thousands) | |||||||||||||||||||||
Cumulative Paid Loss and Allocated Loss Adjustment Expenses, Net of Reinsurance | |||||||||||||||||||||
For the Years Ended December 31, | |||||||||||||||||||||
Accident Year | 2007 Unaudited | 2008 Unaudited | 2009 Unaudited | 2010 Unaudited | 2011 Unaudited | 2012 Unaudited | 2013 Unaudited | 2014 Unaudited | 2015 Unaudited | 2016 | |||||||||||
2007 | 123,645 | 173,197 | 189,648 | 200,655 | 204,502 | 205,302 | 222,354 | 222,676 | 223,021 | 223,177 | |||||||||||
2008 | 105,842 | 156,504 | 175,729 | 183,505 | 185,724 | 200,301 | 200,832 | 201,094 | 201,249 | ||||||||||||
2009 | 103,882 | 157,090 | 172,990 | 176,305 | 192,464 | 194,206 | 194,575 | 194,675 | |||||||||||||
2010 | 95,490 | 148,631 | 161,756 | 179,144 | 182,306 | 183,464 | 183,727 | ||||||||||||||
2011 | 63,908 | 90,303 | 106,760 | 109,238 | 110,481 | 110,985 | |||||||||||||||
2012 | 34,045 | 63,701 | 70,298 | 72,652 | 73,722 | ||||||||||||||||
2013 | 40,456 | 61,555 | 66,388 | 69,543 | |||||||||||||||||
2014 | 44,897 | 67,964 | 74,954 | ||||||||||||||||||
2015 | 44,828 | 71,048 | |||||||||||||||||||
2016 | 52,687 | ||||||||||||||||||||
Total | 1,255,767 | ||||||||||||||||||||
Liabilities for non-standard automobile unpaid loss and loss adjustment expenses prior to 2007, net of reinsurance | 115 | ||||||||||||||||||||
Total liabilities for non-standard automobile unpaid loss and loss adjustment expenses, net of reinsurance | 47,825 | ||||||||||||||||||||
The following table reconciles the non-standard automobile unpaid loss and loss adjustment expenses, net of reinsurance presented in the tables above to the property and casualty unpaid loss and loss adjustment expenses reported in the consolidated balance sheet at December 31, 2016:
(in thousands) | December 31, 2016 | ||
Liabilities for property and casualty loss and loss adjustment expenses, net of reinsurance | |||
Non-standard automobile | 47,825 | ||
Commercial automobile and other | 1,333 | ||
Total | 49,158 | ||
Reinsurance recoverable on unpaid loss and loss adjustment expenses | |||
Non-standard automobile | 619 | ||
Commercial automobile and other | 62 | ||
Total | 681 | ||
Unallocated loss adjustment expenses | 3,956 | ||
Total gross liability for property and casualty unpaid loss and loss adjustment expenses | 53,795 | ||
The following is supplementary information about average historical incurred loss duration as of December 31, 2016.
Average Annual Percentage Payout of Incurred Losses by Age, Net of Reinsurance (Unaudited) | |||||||||||||||||||||
Year 1 | Year 2 | Year 3 | Year 4 | Year 5 | Year 6 | Year 7 | Year 8 | Year 9 | Year 10 | ||||||||||||
Non-standard automobile | 67.8 | % | 19.4 | % | 8.0 | % | 2.9 | % | 1.1 | % | 0.5 | % | 0.2 | % | 0.1 | % | — | % | — | % | |
91 | ||
KINGSWAY FINANCIAL SERVICES INC. Notes to Consolidated Financial Statements | ||
(b) Vehicle Service Agreements
The results of the comparison and the changes in the provision for vehicle service agreement unpaid loss and loss adjustment expenses as of December 31, 2016, December 31, 2015 and December 31, 2014 were as follows:
(in thousands) | December 31, | |||||||||||
2016 | 2015 | 2014 | ||||||||||
Balance at beginning of period | $ | 2,975 | $ | 2,975 | $ | 3,128 | ||||||
Incurred related to: | ||||||||||||
Current year | 5,225 | 5,757 | 6,773 | |||||||||
Prior years | — | — | — | |||||||||
Paid related to: | ||||||||||||
Current year | (5,321 | ) | (5,757 | ) | (6,866 | ) | ||||||
Prior years | 36 | — | (60 | ) | ||||||||
Balance at end of period | $ | 2,915 | $ | 2,975 | $ | 2,975 | ||||||
NOTE 15 DEBT
Debt consists of the following instruments:
(in thousands) | December 31, | |||||||||||||||
2016 | 2015 | |||||||||||||||
Principal | Fair Value | Principal | Fair Value | |||||||||||||
Note payable | $ | 178,781 | $ | 190,074 | $ | — | $ | — | ||||||||
Subordinated debt | 90,500 | 43,619 | 90,500 | 39,898 | ||||||||||||
Total | $ | 269,281 | $ | 233,693 | $ | 90,500 | $ | 39,898 | ||||||||
Subordinated debt mentioned above consists of the following trust preferred debt instruments:
Issuer | Principal (in thousands) | Issue date | Interest | Redemption date | ||
Kingsway CT Statutory Trust I | $ | 15,000 | 12/4/2002 | annual interest rate equal to LIBOR, plus 4.00% payable quarterly | 12/4/2032 | |
Kingsway CT Statutory Trust II | $ | 17,500 | 5/15/2003 | annual interest rate equal to LIBOR, plus 4.10% payable quarterly | 5/15/2033 | |
Kingsway CT Statutory Trust III | $ | 20,000 | 10/29/2003 | annual interest rate equal to LIBOR, plus 3.95% payable quarterly | 10/29/2033 | |
Kingsway DE Statutory Trust III | $ | 15,000 | 5/22/2003 | annual interest rate equal to LIBOR, plus 4.20% payable quarterly | 5/22/2033 | |
Kingsway DE Statutory Trust IV | $ | 10,000 | 9/30/2003 | annual interest rate equal to LIBOR, plus 3.85% payable quarterly | 9/30/2033 | |
Kingsway DE Statutory Trust VI | $ | 13,000 | 1/8/2004 | annual interest rate equal to LIBOR, plus 4.00% payable quarterly | 1/8/2034 | |
(a) Note payable:
As further discussed in Note 5, "Acquisitions," as part of the acquisition of CMC, the Company assumed a note payable with a principal amount of $180.0 million on the date of acquisition that matures on May 15, 2034 and has a fixed interest rate of 4.07%. The note payable was recorded at the date of acquisition at its estimated fair market value, which includes a premium of 11.7 million. This premium is being amortized through the maturity date of the note payable using the effective interest rate method.
92 | ||
KINGSWAY FINANCIAL SERVICES INC. Notes to Consolidated Financial Statements | ||
(b) Subordinated debt:
Between December 4, 2002 and December 16, 2003, six subsidiary trusts of the Company issued $90.5 million of 30-year capital securities to third-parties in separate private transactions. In each instance, a corresponding floating rate junior subordinated deferrable interest debenture was then issued by KAI to the trust in exchange for the proceeds from the private sale. The floating rate debentures bear interest at the rate of the London interbank offered interest rate for three-month U.S. dollar deposits ("LIBOR"), plus spreads ranging from 3.85% to 4.20%. At December 31, 2016, the interest rates ranged from 4.84% to 5.13%. The Company has the right to call each of these securities at par value any time after five years from their issuance until their maturity.
During the first quarter of 2011, the Company gave notice to its Trust Preferred trustees of its intention to exercise its voluntary right to defer interest payments for up to 20 quarters, pursuant to the contractual terms of its outstanding Trust Preferred indentures, which permit interest deferral. This action does not constitute a default under the Company's Trust Preferred indentures or any of its other debt indentures. On November 6, 2015, the Company paid $22.1 million to its Trust Preferred trustees to be used by the trustees to pay the interest which the Company had been deferring since the first quarter of 2011.
NOTE 16 FINANCE LEASE OBLIGATION LIABILITY
As described in Note 13, "Property and Equipment," on October 2, 2014, the Company completed a sale and leaseback transaction involving building and land located in Miami, Florida. The transaction does not qualify for sales recognition and is accounted for as a financing due to the Company's continuing involvement with the property as a result of nonrecourse financing provided to the buyer in the form of prepaid rent. A finance lease obligation liability equal to the selling price of the property was established at the date of the transaction. During the five-year lease term, the Company will record interest expense on the finance lease obligation at its incremental borrowing rate and will increase the finance lease obligation liability by the same amount. At the end of the lease term, the Company will no longer have continuing involvement with the property and will then recognize the sale of the property as well as the gain of approximately $1.1 million that will result from removing the net book value of the land and building and finance lease obligation liability from the consolidated balance sheets. At December 31, 2016 and 2015, finance lease obligation liability of $5.1 million and $4.9 million, respectively, is included in accrued expenses and other liabilities in the consolidated balance sheets.
NOTE 17 LEASES
As further discussed in Note 5, "Acquisitions," the Company owns Real Property which is subject to a long-term triple net lease agreement with a third party. The lease provides for future rent escalations and renewal options. The initial lease term ends in May 2034. The lessee bears the cost of maintenance and property taxes. In addition, the Company leases a property to a third party under an operating lease, where we are the lessor. Rental income from operating leases is recognized on a straight-line basis, based on contractual lease terms with fixed and determinable increases over the non-cancellable term of the related lease when collectability is reasonably assured. Rental income includes amortization of below market lease liabilities of $0.0 million, zero and zero for the years ended December 31, 2016, 2015 and 2014. The estimated aggregate future amortization of below market lease liabilities is $0.1 million for 2017, $0.1 million for 2018, $0.1 million for 2019, $0.1 million for 2020 and $0.1 million for 2021.
Assets leased to third parties under operating leases, where the Company is the lessor, that are included in property and equipment, net on the consolidated balance sheet, are as follows:
(in thousands) | As of December 31, | |||
2016 | ||||
Land | $ | 21,183 | ||
Site improvements | 91,308 | |||
Buildings | 811 | |||
Gross property and equipment leased | 113,302 | |||
Accumulation depreciation | (1,915 | ) | ||
Net property and equipment leased | $ | 111,387 | ||
The Company also leases certain office space under non-cancelable leases, with initial terms typically ranging from two to ten years, along with options that permit renewals for additional periods. The Company also leases certain equipment under non-
93 | ||
KINGSWAY FINANCIAL SERVICES INC. Notes to Consolidated Financial Statements | ||
cancelable operating leases, with initial terms typically ranging from four to five years. Minimum rent is expensed on a straight-line basis over the term of the lease.
Future minimum annual lease payments and lease receipts under operating leases for the next five years and thereafter are:
(in thousands) | Lease Commitments | Lease Receipts | ||||||
2017 | $ | 1,605 | $ | 19,480 | ||||
2018 | 906 | 10,102 | ||||||
2019 | 713 | 10,329 | ||||||
2020 | 72 | 10,562 | ||||||
2021 | 3 | 10,779 | ||||||
Thereafter | — | 156,133 | ||||||
NOTE 18 INCOME TAXES
Income tax (benefit) expense consists of the following:
(in thousands) | Years ended December 31, | |||||||||||
2016 | 2015 | 2014 | ||||||||||
Current income tax expense (benefit) | $ | 87 | $ | 6 | $ | (1,484 | ) | |||||
Deferred income tax (benefit) expense | (9,807 | ) | 87 | 263 | ||||||||
Income tax (benefit) expense | $ | (9,720 | ) | $ | 93 | $ | (1,221 | ) | ||||
Income tax (benefit) expense varies from the amount that would result by applying the applicable United States corporate income tax rate of 34% to loss from continuing operations before income tax (benefit) expense. The following table summarizes the differences:
(in thousands) | Years ended December 31, | |||||||||||
2016 | 2015 | 2014 | ||||||||||
Income tax benefit at United States statutory income tax rate | $ | (3,554 | ) | $ | (3,849 | ) | $ | (5,402 | ) | |||
Valuation allowance | (6,743 | ) | 1,033 | 5,686 | ||||||||
Non-deductible compensation | 345 | 273 | 421 | |||||||||
Foreign operations subject to different tax rates | 145 | 223 | 514 | |||||||||
Indefinite life intangibles | 108 | 88 | 88 | |||||||||
Change in unrecognized tax benefits | 51 | — | (1,256 | ) | ||||||||
Deconsolidation of subsidiary | — | 2,384 | 423 | |||||||||
Non-taxable dividend income | — | (415 | ) | (1,669 | ) | |||||||
Prior year tax | — | — | (341 | ) | ||||||||
Other | (72 | ) | 356 | 315 | ||||||||
Income tax (benefit) expense for continuing operations | $ | (9,720 | ) | $ | 93 | $ | (1,221 | ) | ||||
94 | ||
KINGSWAY FINANCIAL SERVICES INC. Notes to Consolidated Financial Statements | ||
The tax effects of temporary differences that give rise to significant portions of the deferred income tax assets and liabilities are presented as follows:
(in thousands) | December 31, | |||||||
2016 | 2015 | |||||||
Deferred income tax assets: | ||||||||
Losses carried forward | $ | 301,339 | $ | 295,320 | ||||
Unpaid loss and loss adjustment expenses and unearned premiums | 5,609 | 5,314 | ||||||
Investments | 1,828 | 449 | ||||||
Debt issuance costs | 1,621 | 983 | ||||||
Deferred rent | 1,395 | 172 | ||||||
Intangible assets | 1,135 | 1,941 | ||||||
Deferred revenue | 385 | 297 | ||||||
Depreciation and amortization | — | 117 | ||||||
Other | 1,134 | 738 | ||||||
Valuation allowance | (276,590 | ) | (283,636 | ) | ||||
Deferred income tax assets | $ | 37,856 | $ | 21,695 | ||||
Deferred income tax liabilities: | ||||||||
Depreciation and amortization | $ | (28,620 | ) | $ | — | |||
Indefinite life intangibles | (28,079 | ) | (2,925 | ) | ||||
Fair value of debt | (12,100 | ) | (17,205 | ) | ||||
Land | (7,181 | ) | — | |||||
Investments | (5,969 | ) | (360 | ) | ||||
Deferred acquisition costs | (4,627 | ) | (4,129 | ) | ||||
Deferred income tax liabilities | (86,576 | ) | (24,619 | ) | ||||
Net deferred income tax liabilities | $ | (48,720 | ) | $ | (2,924 | ) | ||
The Company maintains a valuation allowance for its gross deferred income tax assets of $276.6 million (U.S. operations - $269.7 million; Other - $6.9 million) and $283.6 million (U.S. operations - $277.1 million; Other - $6.5 million) at December 31, 2016 and December 31, 2015, respectively. The Company's businesses have generated substantial operating losses in prior years. These losses can be available to reduce income taxes that might otherwise be incurred on future taxable income; however, it is uncertain whether the Company will generate the taxable income necessary to utilize these losses or other reversing temporary differences. This uncertainty has caused management to place a full valuation allowance on its December 31, 2016 and December 31, 2015 net deferred income tax assets, excluding the deferred income tax liability amounts set forth in the paragraph below. In 2016, the Company released into income $9.9 million of its valuation allowance, as a result of its acquisition of CMC, due to net deferred income tax liabilities that are expected to reverse during the period in which the Company will have deferred income tax assets available.
The Company carries a deferred income tax liability of $48.7 million at December 31, 2016, $13.4 million of which relates to deferred income tax liabilities that are scheduled to reverse in periods after the expiration of the Company's consolidated U.S. net operating loss carryforwards and $35.3 million of which relates to land and indefinite life intangible assets. The Company carries a deferred income tax liability of $2.9 million at December 31, 2015, all of which relates to indefinite life intangible assets. The Company considered a tax planning strategy in arriving at its December 31, 2016 deferred income tax liability.
95 | ||
KINGSWAY FINANCIAL SERVICES INC. Notes to Consolidated Financial Statements | ||
Amounts, originating dates and expiration dates of the KAI Tax Group's consolidated U.S. net operating loss carryforwards, totaling $859.5 million, are as follows:
Year of net operating loss | Expiration date | Net operating loss (in thousands) | ||||
2006 | 2026 | 8,321 | ||||
2007 | 2027 | 62,308 | ||||
2008 | 2028 | 53,895 | ||||
2009 | 2029 | 512,499 | ||||
2010 | 2030 | 92,058 | ||||
2011 | 2031 | 45,238 | ||||
2012 | 2032 | 33,756 | ||||
2013 | 2033 | 30,780 | ||||
2014 | 2034 | 7,245 | ||||
2016 | 2036 | 13,391 | ||||
In addition, not reflected in the table above, are net operating loss carryforwards of (i) $6.5 million relating to separate U.S. tax returns, which losses will expire over various years through 2036; (ii) $85.4 million, relating to operations in Barbados, of which $59.8 million will expire in 2017, $24.2 million will expire in 2018 and $1.4 million will expire over various years through 2025; and (iii) $20.4 million relating to operations in Canada, which losses will expire over various years through 2036.
A reconciliation of the beginning and ending unrecognized tax benefits, exclusive of interest and penalties, is as follows:
(in thousands) | December 31, | |||||||||||
2016 | 2015 | 2014 | ||||||||||
Unrecognized tax benefits - beginning of year | $ | — | $ | — | $ | 1,772 | ||||||
Gross additions - current year tax positions | — | — | — | |||||||||
Gross additions - prior year tax positions | 1,274 | — | — | |||||||||
Gross reductions - prior year tax positions | — | — | — | |||||||||
Gross reductions - settlements with taxing authorities | — | — | (1,772 | ) | ||||||||
Impact due to expiration of statute of limitations | — | — | — | |||||||||
Unrecognized tax benefits - end of year | $ | 1,274 | $ | — | $ | — | ||||||
The amount of unrecognized tax benefits that, if recognized as of December 31, 2016 and December 31, 2015 would affect the Company's effective tax rate, was an expense of $0.1 million and zero, respectively. The amount of unrecognized tax benefits that, if recognized as of December 31, 2014 would affect the Company's effective tax rate, was a benefit of $1.3 million.
As of December 31, 2016 and December 31, 2015, the Company carried a liability for unrecognized tax benefits of $1.3 million and zero, respectfully, that is included in income taxes payable in the consolidated balance sheets. The Company classifies interest and penalty accruals, if any, related to unrecognized tax benefits as income tax expense. During the years ended December 31, 2016 and December 31, 2015, the Company recognized an expense for interest and penalties of $0.1 million and zero, respectively. During the year ended December 31, 2014, the Company recognized a benefit for interest and penalties of $1.3 million. At December 31, 2016 and December 31, 2015, the Company carried an accrual for the payment of interest and penalties of $0.4 million and zero, respectively.
The federal income tax returns of the Company's U.S. operations for the years through 2012 are closed for Internal Revenue Service ("IRS") examination. The Company's federal income tax returns are not currently under examination by the IRS for any open tax years. The federal income tax returns of the Company's Canadian operations for the years through 2011 are closed for Canada Revenue Agency ("CRA") examination. The Company's Canadian operations federal income tax returns are not currently under examination by the CRA for any open tax years.
96 | ||
KINGSWAY FINANCIAL SERVICES INC. Notes to Consolidated Financial Statements | ||
NOTE 19 LOSS FROM CONTINUING OPERATIONS PER SHARE
The following table sets forth the reconciliation of numerators and denominators for the basic and diluted loss from continuing operations per share computation for the years ended December 31, 2016, 2015 and 2014:
(in thousands, except per share data) | Years ended December 31, | |||||||||||
2016 | 2015 | 2014 | ||||||||||
Numerator: | ||||||||||||
Loss from continuing operations | $ | (733 | ) | $ | (11,415 | ) | $ | (14,666 | ) | |||
Plus (less): net loss (income) attributable to noncontrolling interests | 281 | (162 | ) | (1,596 | ) | |||||||
Less: dividends on preferred stock | (398 | ) | (329 | ) | (300 | ) | ||||||
Loss from continuing operations attributable to common shareholders | $ | (850 | ) | $ | (11,906 | ) | $ | (16,562 | ) | |||
Denominator: | ||||||||||||
Weighted average basic shares | ||||||||||||
Weighted average common shares outstanding | 20,003 | 19,710 | 17,398 | |||||||||
Weighted average diluted shares | ||||||||||||
Weighted average common shares outstanding | 20,003 | 19,710 | 17,398 | |||||||||
Effect of potentially dilutive securities | — | — | — | |||||||||
Total weighted average diluted shares | 20,003 | 19,710 | 17,398 | |||||||||
Basic loss from continuing operations per common share | $ | (0.04 | ) | $ | (0.60 | ) | $ | (0.95 | ) | |||
Diluted loss from continuing operations per common share | $ | (0.04 | ) | $ | (0.60 | ) | $ | (0.95 | ) | |||
Loss from continuing operations per share is based on the weighted-average number of shares outstanding. Diluted weighted-average shares is calculated by adjusting basic weighted-average shares outstanding by all potentially dilutive securities. Potentially dilutive securities consist of stock options, unvested restricted stock awards, unvested restricted stock units, warrants and convertible preferred stock. Since the Company is reporting a loss from continuing operations for the years ended December 31, 2016, 2015 and 2014, all potentially dilutive securities outstanding were excluded from the calculation of both basic and diluted loss from continuing operations per share since their inclusion would have been anti-dilutive.
NOTE 20 STOCK-BASED COMPENSATION
(a) Stock Options
On May 13, 2013, the Company's shareholders approved the 2013 Equity Incentive Plan ("2013 Plan"). The 2013 Plan replaced the Company's previous Amended and Restated Stock Option Plan ("Prior Plan"), with respect to the granting of future equity awards. Under the 2013 Plan, the Company reserved for issuance to key employees selected by the Company new stock options ("New Stock Options") to purchase up to an additional 300,000 common shares. During the year ended December 31, 2016, the Company granted 40,000 New Stock Options to an employee of the Company. There are no New Stock Options remaining for future grants.
On May 13, 2013, the Company's shareholders also approved the Option Exchange Program whereby the outstanding stock options under the Prior Plan held by current employees will be canceled and replaced with stock options granted under the 2013 Plan ("Replacement Options"). The maximum number of common shares available to be granted as Replacement Options is 355,625. No Replacement Options were granted during the year ended December 31, 2016. There are no Replacement Options remaining for future grants.
The Replacement Options and New Stock Options (collectively, the "Stock Options") are fully vested and exercisable at the date of grant and are exercisable for a period of four years.
97 | ||
KINGSWAY FINANCIAL SERVICES INC. Notes to Consolidated Financial Statements | ||
The following table summarizes the stock option activity during the year ended December 31, 2016:
Number of Options Outstanding | Weighted-Average Exercise Price | Weighted-Average Remaining Contractual Term (in years) | Aggregate Intrinsic Value (in thousands) | |||||||||||
Outstanding at December 31, 2015 | 611,875 | $ | 4.50 | 2.2 | $ | 43 | ||||||||
Granted | 40,000 | 4.67 | ||||||||||||
Exercised | — | — | ||||||||||||
Expired or Forfeited | — | — | ||||||||||||
Outstanding at December 31, 2016 | 651,875 | $ | 4.51 | 1.4 | $ | 1,134 | ||||||||
Exercisable at December 31, 2016 | 651,875 | $ | 4.51 | 1.4 | $ | 1,134 | ||||||||
The aggregate intrinsic value of stock options outstanding and exercisable is the difference between the December 31, 2016 market price for the Company's common shares and the exercise price of the options, multiplied by the number of options where the fair value exceeds the exercise price.
At December 31, 2016, 2015 and 2014, the number of options exercisable was 651,875, 611,875 and 611,875, respectively, with weighted average prices of $4.51, $4.50 and $4.50, respectively. No options were exercised during the years ended December 31, 2016, 2015 and 2014.
The Company uses the Black-Scholes option pricing model to estimate the fair value of each option on the date of grant. No options were granted during the year ended December 31, 2015. The assumptions used in the Black-Scholes pricing model for options granted or exchanged during the years ended December 31, 2016 and December 31, 2014 were as follows:
Year ended December 31, 2016 | Year ended December 31, 2014 | |||||
Risk-free interest rate | 1.1 | % | 0.06% - 1.4% | |||
Dividend yield | — | — | ||||
Expected volatility | 0.5 | % | 0.4 | % | ||
Expected term (in years) | 4.0 | 0.78 - 4 | ||||
(b) Restricted Stock Awards
Under the 2013 Plan, the Company made grants of restricted common stock awards ("Restricted Stock Awards") to certain officers of the Company. The Restricted Stock Awards vest after a ten-year period and are subject to the officers' continued employment through the vesting date. The Restricted Stock Awards are amortized on a straight-line basis over the ten-year requisite service period. Total unamortized compensation expense related to unvested Restricted Stock Awards at December 31, 2016 was $5.9 million. The grant-date fair value of Restricted Stock Awards was determined using the closing price of Kingsway common stock on the date of grant. The following table summarizes the activity related to unvested Restricted Stock Awards during the year ended December 31, 2016:
Number of Restricted Stock Awards | Weighted-Average Grant Date Fair Value (per Share) | ||||||
Unvested at December 31, 2015 | 1,952,665 | $ | 4.14 | ||||
Granted | — | — | |||||
Forfeited | — | — | |||||
Unvested at December 31, 2016 | 1,952,665 | $ | 4.14 | ||||
98 | ||
KINGSWAY FINANCIAL SERVICES INC. Notes to Consolidated Financial Statements | ||
(c) Restricted Stock Units
The Company granted restricted common stock units ("Restricted Stock Units") to an officer of the Company pursuant to a Restricted Stock Unit Agreement dated August 24, 2016. Each Restricted Stock Unit represents a right to receive one common share on the vesting date. The Restricted Stock Units shall become fully vested and the restriction period shall lapse as of March 28, 2024 subject to the officer's continued employment through the vesting date. The Restricted Stock Units are amortized on a straight-line basis over the requisite service period. Total unamortized compensation expense related to unvested Restricted Stock Units at December 31, 2016 was $2.7 million. The grant-date fair value of the Restricted Stock Units was determined using the closing price of Kingsway common stock on the date of grant. The following table summarizes the activity related to unvested Restricted Stock Units for the year ended December 31, 2016:
Number of Restricted Stock Units | Weighted-Average Grant Date Fair Value (per Share) | ||||||
Unvested at December 31, 2015 | — | $ | — | ||||
Granted | 500,000 | 5.73 | |||||
Vested | — | — | |||||
Forfeited | — | — | |||||
Unvested at December 31, 2016 | 500,000 | $ | 5.73 | ||||
Total stock-based compensation expense, net of forfeitures, was $1.0 million, $0.8 million and $1.2 million for the years ended December 31, 2016, 2015 and 2014, respectively.
(d) Employee Share Purchase Plan
The Company has an employee share purchase plan ("ESPP Plan") whereby qualifying employees could choose each year to have up to 5% of their annual base earnings withheld to purchase the Company's common shares. In 2014, the ESPP Plan was amended and restated to allow qualifying employees to be eligible for matching Company contributions. After one year of employment, the Company matches 100% of the employee contribution amount, and the contributions vest immediately. All contributions are used by the plan administrator to purchase common shares in the open market. The Company's contribution is expensed as paid and for the years ended December 31, 2016, 2015 and 2014 totaled $0.2 million, $0.2 million and $0.1 million, respectively.
NOTE 21 EMPLOYEE BENEFIT PLAN
The Company maintains a defined contribution plan in the United States for all of its qualified employees. Qualifying employees can choose to voluntarily contribute up to 60% of their annual earnings subject to an overall limitation of $18,000 in each of 2016 and 2015. The Company matches an amount equal to 50% of each participant's contribution, limited to contributions up to 5% of a participant's earnings.
The contributions for the plan vest based on years of service with 100% vesting after five years of service. The Company's contribution is expensed as paid and for the years ended December 31, 2016, 2015 and 2014 totaled $0.3 million, $0.3 million and $0.3 million respectively. All Company obligations to the plans were fully funded as of December 31, 2016.
NOTE 22 CLASS A PREFERRED STOCK
On May 13, 2013, the Company's shareholders approved an amendment to the Company's Articles of Incorporation to create an unlimited number of zero par value class A preferred shares. The Company's Board of Directors will have the ability to fix the designation, rights, privileges, restrictions and conditions attaching to the shares of each series of preferred shares. The preferred shares will have priority over the common shares. There were 262,876 shares of Class A preferred stock outstanding at December 31, 2016 and 2015, respectively.
On February 3, 2014, the Company closed on its previously announced private placement totaling $6.6 million. At closing, the Company received gross proceeds of $6.6 million, resulting from the sale and issuance of 262,876 units for a purchase price of $25.00 per unit. Net proceeds to the Company were $6.3 million after deducting expenses.
Each unit consists of one class A convertible preferred share, series 1 (the "Preferred Shares"), and 6.25 common share class C purchase warrants. Each Preferred Share is convertible into 6.25 common shares at a conversion price of $4.00 per common share
99 | ||
KINGSWAY FINANCIAL SERVICES INC. Notes to Consolidated Financial Statements | ||
any time at the option of the holder prior to April 1, 2021. The maximum number of common shares issuable upon conversion of the Preferred Shares is 1,642,975 common shares. Each warrant will entitle the subscriber to purchase one common share of Kingsway at a price of $5.00 per common share at any time after September 16, 2016 and prior to expiry on September 15, 2023.
The Preferred Shares are not entitled to vote. The holders of the Preferred Shares are entitled to receive fixed, cumulative, preferential cash dividends at a rate of $1.25 per Preferred Share per year. The cash dividend rate shall be revised to $1.875 per Preferred Share per year if the dividend accumulates for a period greater than 30 consecutive months from the date of the most recent dividend payment. On and after February 3, 2016, the Company may redeem all or any part of the then outstanding Preferred Shares for the price of $28.75 per Preferred Share, plus accrued but unpaid dividends thereon, whether or not declared, up to and including the date specified for redemption. The Company will redeem any Preferred Shares not previously converted into common shares, and which remain outstanding on April 1, 2021, for the price of $25.00 per Preferred Share, plus accrued but unpaid dividends, whether or not declared, up to and including the date specified for redemption. At December 31, 2016 and 2015, accrued dividends of $1.0 million and $0.6 million were included in accrued expenses and other liabilities in the consolidated balance sheets.
In accordance with FASB ASC Topic 480-10-S99-3A, SEC Staff Announcement: Classification and Measurement of Redeemable Securities, redemption features which are not solely within the control of the issuer are required to be presented outside of permanent equity on the consolidated balance sheets. As described above, the holder has the option to convert the Preferred Shares at any time; however, if not converted, they are required to be redeemed on April 1, 2021. As such, the Preferred Shares are presented in temporary or mezzanine equity on the consolidated balance sheets and will be accreted up to the stated redemption value of $6.6 million through the April 1, 2021 redemption date.
On July 8, 2014, the holders of the Company's series B warrants approved certain amendments to the terms of the Series B Warrant Agreement dated September 16, 2013. The Series B Warrant Agreement Amendments permitted the Company to issue up to 1,642,975 additional Series B Warrants and complete the Series C Warrant Exchange. Under the Series C Warrant Exchange, each class C purchase warrant was automatically exchanged for one Series B Warrant.
NOTE 23 SHAREHOLDERS' EQUITY
The Company is authorized to issue an unlimited number of zero par value common stock. There were 21,458,190 and 19,709,706 shares of common stock outstanding at December 31, 2016 and 2015, respectively.
There were no dividends declared during the years ended December 31, 2016, 2015 and 2014.
On August 18, 2014, the Company announced its intention to redeem its outstanding series A warrants, which were issued pursuant to the Company's September 2013 rights offering. Holders of series A warrants could exercise their outstanding series A warrants at $4.50 per common share. Any series A warrants that remained unexercised after September 19, 2014 were automatically redeemed by the Company at the redemption price of $0.25 per series A warrant. During the year ended December 31, 2014, series A warrants to purchase 3,279,945 shares of common stock were exercised, resulting in cash proceeds of $14.8 million. The 845 series A warrants that remained unexercised were redeemed by the Company at the redemption price of $0.25.
In November 2015, the Company's Board of Directors approved a share repurchase program under which the Company is authorized to repurchase up to 5% of its currently issued and outstanding common stock through November 2016. During the year ended December 31, 2016, the Company repurchased 26,900 shares for an aggregate purchase price of $0.1 million, including fees and commissions, under its share repurchase program. All repurchased common stock was cancelled. The timing and amount of any share repurchases are determined based on market conditions, share price and other factors, and the program may be discontinued or suspended at any time.
On April 21, 2016, the Company issued 160,000 shares of common stock as consideration for the acquisition of Argo. Refer to Note 5, "Acquisitions," for further details regarding the Argo acquisition.
On November 16, 2016, the Company closed with non-affiliate investors a private placement of 1,615,384 shares of common stock at a purchase price of $6.50 per share with net proceeds to the Company of $10.5 million.
100 | ||
KINGSWAY FINANCIAL SERVICES INC. Notes to Consolidated Financial Statements | ||
The following table summarizes information about warrants outstanding at December 31, 2016:
December 31, 2016 | |||||||||||||
Exercise Price | Date of Issue | Expiry Date | Remaining Contractual Life (in years) | Number Outstanding | |||||||||
$ | 5.00 | 16-Sep-13 | 15-Sep-23 | 6.7 | 3,280,790 | ||||||||
$ | 5.00 | 3-Feb-14 | 15-Sep-23 | 6.7 | 1,642,975 | ||||||||
Total: | 6.7 | 4,923,765 | |||||||||||
NOTE 24 ACCUMULATED OTHER COMPREHENSIVE LOSS
The table below details the change in the balance of each component of accumulated other comprehensive income (loss), net of tax, for the years ended December 31, 2016, 2015 and 2014 as relates to shareholders' equity attributable to common shareholders on the consolidated balance sheets. On the other hand, the consolidated statements of comprehensive income (loss) present the components of other comprehensive income (loss), net of tax, only for the years ended December 31, 2016, 2015 and 2014 and inclusive of the components attributable to noncontrolling interests in consolidated subsidiaries.
(in thousands) | ||||||||||||
Unrealized Gains (Losses) on Fixed Maturities and Equity Investments | Foreign Currency Translation Adjustments | Total Accumulated Other Comprehensive Income (Loss) | ||||||||||
Balance, January 1, 2014, as reported | $ | 15,583 | $ | (5,982 | ) | $ | 9,601 | |||||
Correction of prior period errors | (11,042 | ) | — | (11,042 | ) | |||||||
Balance, January 1, 2014, as restated | 4,541 | (5,982 | ) | (1,441 | ) | |||||||
Other comprehensive (loss) income before reclassifications | (2,513 | ) | 30 | (2,483 | ) | |||||||
Amounts reclassified from accumulated other comprehensive income (loss) | 1,552 | — | 1,552 | |||||||||
Net current-period other comprehensive (loss) income | (961 | ) | 30 | (931 | ) | |||||||
Balance, December 31, 2014, as restated | $ | 3,580 | $ | (5,952 | ) | $ | (2,372 | ) | ||||
Correction of prior period error | (744 | ) | — | (744 | ) | |||||||
Other comprehensive (loss) income before reclassifications | (2,884 | ) | 929 | (1,955 | ) | |||||||
Amounts reclassified from accumulated other comprehensive loss | 1,342 | 1,243 | 2,585 | |||||||||
Net current-period other comprehensive (loss) income | (2,286 | ) | 2,172 | (114 | ) | |||||||
Balance, December 31, 2015, as restated | $ | 1,294 | $ | (3,780 | ) | $ | (2,486 | ) | ||||
Other comprehensive income before reclassifications | 2,772 | — | 2,772 | |||||||||
Amounts reclassified from accumulated other comprehensive loss | (494 | ) | — | (494 | ) | |||||||
Net current-period other comprehensive income | 2,278 | — | 2,278 | |||||||||
Balance, December 31, 2016 | $ | 3,572 | $ | (3,780 | ) | $ | (208 | ) | ||||
101 | ||
KINGSWAY FINANCIAL SERVICES INC. Notes to Consolidated Financial Statements | ||
Components of accumulated other comprehensive loss were reclassified to the following lines of the consolidated statements of operations for the years ended December 31, 2016, 2015 and 2014:
(in thousands) | Years ended December 31, | |||||||||||
2016 | 2015 | 2014 | ||||||||||
Reclassification of accumulated other comprehensive income from unrealized gains (losses) on fixed maturities and equity investments to: | ||||||||||||
Net realized gains | $ | 527 | $ | (1,332 | ) | $ | (1,552 | ) | ||||
Other-than-temporary impairment loss | (33 | ) | (10 | ) | — | |||||||
Loss from continuing operations before income tax (benefit) expense | 494 | (1,342 | ) | (1,552 | ) | |||||||
Income tax (benefit) expense | — | — | — | |||||||||
Net income (loss) | 494 | (1,342 | ) | (1,552 | ) | |||||||
Reclassification of accumulated other comprehensive loss from foreign currency translation adjustments to: | ||||||||||||
Loss on deconsolidation of subsidiary | — | (1,243 | ) | — | ||||||||
Loss from continuing operations before income tax (benefit) expense | — | (1,243 | ) | — | ||||||||
Income tax (benefit) expense | — | — | — | |||||||||
Net income (loss) | — | (1,243 | ) | — | ||||||||
Total reclassification from accumulated other comprehensive loss to net income (loss) | $ | 494 | $ | (2,585 | ) | $ | (1,552 | ) | ||||
NOTE 25 SEGMENTED INFORMATION
The Company operates as a merchant bank primarily engaged, through its subsidiaries, in the property and casualty insurance business. The Company conducts its business through the following three reportable segments: Insurance Underwriting, Insurance Services and Leased Real Estate.
Insurance Underwriting Segment
Insurance Underwriting includes the following subsidiaries of the Company: Mendota, Mendakota, MCC, Amigo and Kingsway Reinsurance Corporation (collectively, "Insurance Underwriting"). Insurance Underwriting principally offers personal automobile insurance to drivers who do not meet the criteria for coverage by standard automobile insurers. Insurance Underwriting has policyholders in 12 states; however, new business is accepted in only 8 states.
The Company previously placed Amigo and MCC into voluntary run-off in 2012 and 2011, respectively. Each of Amigo and MCC entered into a comprehensive run-off plan which was approved by its respective state of domicile. Kingsway continues to manage Amigo and MCC in a manner consistent with the run-off plans. During the first quarter of 2015, MCC sent a letter of intent to the Illinois Department of Insurance to resume writing private passenger automobile policies in the state of Illinois. MCC began writing these policies on April 1, 2015.
Effective March 31, 2014, the Company's wholly owned subsidiary, PIH, completed an initial public offering of its common stock. Upon completion of the transaction, the Company maintained a minority ownership interest in the common shares of PIH. The earnings of PIH are included in the consolidated statements of operations through the March 31, 2014 transaction date. Prior to the transaction, PIH was included in the Insurance Underwriting segment. As a result of the disposal of the Company's majority interest in PIH on March 31, 2014, all segmented information has been adjusted to exclude PIH from the Insurance Underwriting segment.
Insurance Services Segment
Insurance Services includes the following subsidiaries of the Company: IWS and Trinity (collectively, "Insurance Services").
IWS is a licensed motor vehicle service agreement company and is a provider of after-market vehicle protection services distributed by credit unions in 23 states to their members.
102 | ||
KINGSWAY FINANCIAL SERVICES INC. Notes to Consolidated Financial Statements | ||
Trinity is a provider of warranty products and maintenance support to consumers and businesses in the HVAC, standby generator, commercial LED lighting and refrigeration industries. Trinity distributes its warranty products through original equipment manufacturers, HVAC distributors and commercial and residential contractors. Trinity distributes its maintenance support directly through corporate owners of retail spaces throughout the United States.
Effective April 1, 2015, the Company closed on the sale of its wholly owned subsidiary, ARS. As a result, ARS has been classified as discontinued operations and the results of their operations are reported separately for all periods presented. Prior to the transaction, ARS was included in the Insurance Services segment. As a result of classifying ARS as a discontinued operation, all segmented information has been restated to exclude ARS from the Insurance Services segment.
Leased Real Estate Segment
Leased Real Estate includes the Company's subsidiary, CMC, which was acquired on July 14, 2016. CMC owns the Real Property which is leased to a third party pursuant to a long-term triple net lease. The Real Property is also subject to a mortgage, which is recorded as note payable in the Company's consolidated balance sheet. When assessing and measuring the operational and financial performance of the segment, interest expense related to the Company's note payable is included in the Leased Real Estate's segment operating income.
Results for the Company's reportable segments are based on the Company's internal financial reporting systems and are consistent with those followed in the preparation of the consolidated financial statements. The following tables provide financial data used by management. Segment assets are not allocated for management use and, therefore, are not included in the segment disclosures below.
Revenues by reportable segment reconciled to consolidated revenues for the years ended December 31, 2016, 2015 and 2014 were:
(in thousands) | Years ended December 31, | |||||||||||
2016 | 2015 | 2014 | ||||||||||
Revenues: | ||||||||||||
Insurance Underwriting: | ||||||||||||
Net premiums earned | $ | 127,608 | $ | 117,433 | $ | 113,479 | ||||||
Other income | 10,272 | 8,937 | 8,478 | |||||||||
Total Insurance Underwriting | 137,880 | 126,370 | 121,957 | |||||||||
Insurance Services: | ||||||||||||
Service fee and commission income | 24,232 | 22,966 | 24,659 | |||||||||
Other income | 283 | 368 | 407 | |||||||||
Total Insurance Services | 24,515 | 23,334 | 25,066 | |||||||||
Leased Real Estate: | ||||||||||||
Rental income | 5,419 | — | — | |||||||||
Other income | 50 | — | — | |||||||||
Total Leased Real Estate | 5,469 | — | — | |||||||||
Total segment revenues | 167,864 | 149,704 | 147,023 | |||||||||
Net premiums earned not allocated to segments | — | — | 4,114 | |||||||||
Net investment income | 8,200 | 2,918 | 1,616 | |||||||||
Net realized gains | 360 | 1,197 | 5,041 | |||||||||
Other-than-temporary impairment loss | (157 | ) | (10 | ) | — | |||||||
Other income not allocated to segments | 363 | 6,157 | 430 | |||||||||
Total revenues | $ | 176,630 | $ | 159,966 | $ | 158,224 | ||||||
103 | ||
KINGSWAY FINANCIAL SERVICES INC. Notes to Consolidated Financial Statements | ||
The segment operating (loss) income of each segment in the following table is before income taxes and includes revenues and direct segment costs. Total segment operating (loss) income reconciled to the consolidated loss from continuing operations for the years ended December 31, 2016, 2015 and 2014 were:
(in thousands) | Years ended December 31, | |||||||||||
2016 | 2015 | 2014 | ||||||||||
Segment operating (loss) income | ||||||||||||
Insurance Underwriting | $ | (8,202 | ) | $ | (1,147 | ) | $ | 1,290 | ||||
Insurance Services | 506 | (628 | ) | 206 | ||||||||
Leased Real Estate | 627 | — | — | |||||||||
Total segment operating (loss) income | (7,069 | ) | (1,775 | ) | 1,496 | |||||||
Net investment income | 8,200 | 2,918 | 1,616 | |||||||||
Net realized gains | 360 | 1,197 | 5,041 | |||||||||
Other-than-temporary impairment loss | (157 | ) | (10 | ) | — | |||||||
Amortization of intangible assets | (1,242 | ) | (1,244 | ) | (1,620 | ) | ||||||
Contingent consideration benefit | 657 | 1,139 | 2,223 | |||||||||
Impairment of asset held for sale | — | — | (1,180 | ) | ||||||||
Interest expense not allocated to segments | (4,496 | ) | (5,278 | ) | (5,645 | ) | ||||||
Other income and expenses not allocated to segments, net | (7,596 | ) | (3,753 | ) | (4,887 | ) | ||||||
Foreign exchange losses, net | (15 | ) | (1,215 | ) | (419 | ) | ||||||
(Loss) gain on change in fair value of debt | (3,721 | ) | 1,458 | (10,953 | ) | |||||||
Loss on disposal of subsidiary | — | — | (1,244 | ) | ||||||||
Loss on disposal of asset held for sale | — | — | (125 | ) | ||||||||
Gain (loss) on deconsolidation of subsidiaries | 5,643 | (4,420 | ) | — | ||||||||
Equity in net loss of investees | (1,017 | ) | (339 | ) | (190 | ) | ||||||
Loss from continuing operations before income tax (benefit) expense | (10,453 | ) | (11,322 | ) | (15,887 | ) | ||||||
Income tax (benefit) expense | (9,720 | ) | 93 | (1,221 | ) | |||||||
Loss from continuing operations | $ | (733 | ) | $ | (11,415 | ) | $ | (14,666 | ) | |||
Net premiums earned by line of business for the years ended December 31, 2016, 2015 and 2014 were:
(in thousands) | Years ended December 31, | |||||||||||
2016 | 2015 | 2014 | ||||||||||
Insurance Underwriting: | ||||||||||||
Private passenger auto liability | $ | 69,086 | $ | 79,258 | $ | 76,031 | ||||||
Auto physical damage | 58,522 | 38,175 | 37,448 | |||||||||
Total Insurance Underwriting | 127,608 | 117,433 | 113,479 | |||||||||
Net premiums earned not allocated to segments: | ||||||||||||
Allied lines | — | — | 1,944 | |||||||||
Homeowners | — | — | 2,159 | |||||||||
Other | — | — | 11 | |||||||||
Total net premiums earned not allocated to segments | — | — | 4,114 | |||||||||
Total net premiums earned | $ | 127,608 | $ | 117,433 | $ | 117,593 | ||||||
104 | ||
KINGSWAY FINANCIAL SERVICES INC. Notes to Consolidated Financial Statements | ||
NOTE 26 FAIR VALUE OF FINANCIAL INSTRUMENTS
Fair value amounts represent estimates of the consideration that would currently be agreed upon between knowledgeable, willing parties who are under no compulsion to act. Fair value is best evidenced by quoted bid or ask price, as appropriate, in an active market. Where bid or ask prices are not available, such as in an illiquid or inactive market, the closing price of the most recent transaction of that instrument subject to appropriate adjustments as required is used. Where quoted market prices are not available, the quoted prices of similar financial instruments or valuation models with observable market-based inputs are used to estimate the fair value. These valuation models may use multiple observable market inputs, including observable interest rates, foreign exchange rates, index levels, credit spreads, equity prices, counterparty credit quality, corresponding market volatility levels and option volatilities. Minimal management judgment is required for fair values calculated using quoted market prices or observable market inputs for models. Greater subjectivity is required when making valuation adjustments for financial instruments in inactive markets or when using models where observable parameters do not exist. Also, the calculation of estimated fair value is based on market conditions at a specific point in time and may not be reflective of future fair values. For the Company's financial instruments carried at cost or amortized cost, the book value is not adjusted to reflect increases or decreases in fair value due to market fluctuations, including those due to interest rate changes, as it is the Company's intention to hold them until there is a recovery of fair value, which may be to maturity.
The Company classifies its investments in fixed maturities and equity investments as available-for-sale and reports these investments at fair value. The Company's limited liability investment, at fair value, performance shares, subordinated debt and contingent consideration liabilities are measured and reported at fair value.
Fixed maturities and equity investments - Fair values of fixed maturities for which no active market exists are derived from quoted market prices of similar instruments or other third-party evidence. Fair values of equity investments, including warrants, reflect quoted market values based on latest bid prices, where active markets exist, or models based on significant market observable inputs, where no active markets exist.
Limited liability investment, at fair value - The fair value of the limited liability investment, at fair value is calculated based on an internally developed model that distributes that net equity of 1347 Investors to all classes of membership interests. The model uses quoted market prices and significant market observable inputs.
Performance shares - The performance shares, for which no active market exists, are required to be valued at fair value as determined in good faith by the Company. Such determination of fair value would require the Company to develop a model based upon relevant observable market inputs as well as significant unobservable inputs, including developing a sufficiently reliable estimate for an appropriate discount to reflect the illiquidity and unique structure of the security. The Company determined that its model for the performance shares was not sufficiently reliable. As a result, the Company has assigned a fair value of zero to the performance shares. Refer to Note 27, "Related Party Transactions," for further details regarding the performance shares.
Subordinated debt - The fair value of the subordinated debt is calculated using a model based on significant market observable inputs and inputs developed by a third-party. These inputs include credit spread assumptions developed by a third-party and market observable swap rates.
Contingent consideration - The consideration for certain of the Company's acquisitions includes future payments to the former owners that are contingent upon the achievement of certain targets over future reporting periods. Liabilities for contingent consideration are measured and reported at fair value and are included in accrued expenses and other liabilities in the consolidated balance sheets. The fair value of contingent consideration liabilities is estimated using internal models without relevant observable market inputs. Estimated payments are discounted using present value techniques to arrive at estimated fair value. Contingent consideration liabilities are revalued each reporting period. Changes in the fair value of contingent consideration liabilities can result from changes to one or multiple inputs, including adjustments to the discount rates or changes in the assumed achievement or timing of any targets. Changes in fair value are reported in the consolidated statements of operations as contingent consideration benefit. The maximum the Company can pay in future contingent payments is $2.4 million, on an undiscounted basis.
105 | ||
KINGSWAY FINANCIAL SERVICES INC. Notes to Consolidated Financial Statements | ||
The Company employs a fair value hierarchy to categorize the inputs it uses in valuation techniques to measure the fair value. The extent of use of quoted market prices (Level 1), valuation models using observable market information (Level 2) and internal models without observable market information (Level 3) in the valuation of the Company's financial assets and liabilities measured at fair value on a recurring basis as of December 31, 2016 and December 31, 2015 was as follows:
(in thousands) | December 31, 2016 | |||||||||||||||
Fair Value Measurements at the End of the Reporting Period Using | ||||||||||||||||
Total | Quoted Prices in Active Markets for Identical Assets(Level 1) | Significant Other Observable Inputs (Level 2) | Significant Unobservable Inputs (Level 3) | |||||||||||||
Recurring fair value measurements | ||||||||||||||||
Assets: | ||||||||||||||||
Fixed maturities: | ||||||||||||||||
U.S. government, government agencies and authorities | $ | 28,148 | $ | — | $ | 28,148 | $ | — | ||||||||
States, municipalities and political subdivisions | 3,088 | — | 3,088 | — | ||||||||||||
Mortgage-backed | 8,506 | — | 8,506 | — | ||||||||||||
Asset-backed securities and collateralized mortgage obligations | 3,467 | — | 3,467 | — | ||||||||||||
Corporate | 18,555 | — | 18,555 | — | ||||||||||||
Total fixed maturities | 61,764 | — | 61,764 | — | ||||||||||||
Equity investments: | ||||||||||||||||
Common stock | 21,426 | 21,426 | — | — | ||||||||||||
Warrants | 1,804 | 664 | 1,140 | — | ||||||||||||
Total equity investments | 23,230 | 22,090 | 1,140 | — | ||||||||||||
Limited liability investment, at fair value | 10,700 | 10,700 | ||||||||||||||
Other investments | 7,975 | — | 7,975 | — | ||||||||||||
Short-term investments | 401 | — | 401 | — | ||||||||||||
Total assets | $ | 104,070 | $ | 22,090 | $ | 81,980 | $ | — | ||||||||
Liabilities: | ||||||||||||||||
Subordinated debt | $ | 43,619 | $ | — | $ | 43,619 | $ | — | ||||||||
Contingent consideration | 325 | — | — | 325 | ||||||||||||
Total liabilities | $ | 43,944 | $ | — | $ | 43,619 | $ | 325 | ||||||||
106 | ||
KINGSWAY FINANCIAL SERVICES INC. Notes to Consolidated Financial Statements | ||
(in thousands) | December 31, 2015 | |||||||||||||||
Fair Value Measurements at the End of the Reporting Period Using | ||||||||||||||||
Total | Quoted Prices in Active Markets for Identical Assets (Level 1) | Significant Other Observable Inputs (Level 2) | Significant Unobservable Inputs (Level 3) | |||||||||||||
Recurring fair value measurements | ||||||||||||||||
Assets: | ||||||||||||||||
Fixed maturities: | ||||||||||||||||
U.S. government, government agencies and authorities | $ | 20,453 | $ | — | $ | 20,453 | $ | — | ||||||||
States, municipalities and political subdivisions | 2,256 | — | 2,256 | — | ||||||||||||
Mortgage-backed | 7,963 | — | 7,963 | — | ||||||||||||
Asset-backed securities and collateralized mortgage obligations | 6,023 | — | 6,023 | — | ||||||||||||
Corporate | 18,864 | — | 18,864 | — | ||||||||||||
Total fixed maturities | 55,559 | — | 55,559 | — | ||||||||||||
Equity investments: | ||||||||||||||||
Common stock | 26,586 | 26,586 | — | — | ||||||||||||
Warrants | 973 | 229 | 744 | — | ||||||||||||
Total equity investments | 27,559 | 26,815 | 744 | — | ||||||||||||
Other investments | 4,077 | — | 4,077 | — | ||||||||||||
Short-term investments | 400 | — | 400 | — | ||||||||||||
Total assets | $ | 87,595 | $ | 26,815 | $ | 60,780 | $ | — | ||||||||
Liabilities: | ||||||||||||||||
Subordinated debt | 39,898 | — | 39,898 | — | ||||||||||||
Contingent consideration | 1,982 | — | — | 1,982 | ||||||||||||
Total liabilities | $ | 41,880 | $ | — | $ | 39,898 | $ | 1,982 | ||||||||
The following table provides a reconciliation of the fair value of recurring Level 3 fair value measurements for the years ended December 31, 2016, 2015 and 2014:
(in thousands) | Years ended December 31, | |||||||||||
2016 | 2015 | 2014 | ||||||||||
Liabilities: | ||||||||||||
Contingent consideration: | ||||||||||||
Beginning balance | $ | 1,982 | $ | 3,121 | $ | 5,344 | ||||||
Settlements of contingent consideration liabilities | (1,000 | ) | — | — | ||||||||
Change in fair value of contingent consideration included in net income (loss) | (657 | ) | (1,139 | ) | (2,223 | ) | ||||||
Ending balance | $ | 325 | $ | 1,982 | $ | 3,121 | ||||||
107 | ||
KINGSWAY FINANCIAL SERVICES INC. Notes to Consolidated Financial Statements | ||
NOTE 27 RELATED PARTY TRANSACTIONS
Related party transactions, including services provided to or received by the Company's subsidiaries, are carried out in the normal course of operations and are measured in part by the amount of consideration paid or received as established and agreed by the parties. Management believes that consideration paid for such services in each case approximates fair value. Except where disclosed elsewhere in these consolidated financial statements, the following is a summary of related party transactions.
On February 11, 2014, the Company's subsidiary, 1347 Advisors entered into a management services agreement with PIH which provides for certain services, including forecasting, analysis of capital structure and reinsurance programs, consultation in future restructuring or capital raising transactions, and consultation in corporate development initiatives, that 1347 Advisors will provide to PIH unless and until 1347 Advisors and PIH agree to terminate the services. On February 24, 2015, the Company announced that it had entered into a definitive agreement with PIH to terminate the management services agreement. Pursuant to the transaction, 1347 Advisors received the following consideration: $2.0 million in cash; $3.0 million of 8% preferred stock of PIH, mandatorily redeemable on February 24, 2020; a Performance Shares Grant Agreement with PIH, whereby 1347 Advisors will be entitled to receive 100,000 shares of PIH common stock if at any time the last sales price of PIH's common stock equals or exceeds $10.00 per share for any 20 trading days within any 30-trading day period; and warrants to purchase 1,500,000 shares of common stock of PIH with a strike price of $15.00, expiring on February 24, 2022. The Company recorded a gain of $6.0 million during 2015 related to the termination of the management services agreement, which is included in other income in the consolidated statements of operations. To the extent shares of PIH common stock are granted to the Company under the Performance Shares Grant Agreement, they will be recorded at the time the shares are granted and will have a valuation equal to the last sales price of PIH common stock on the day prior to such grant. No shares were received by the Company under the Performance Shares Grant Agreement as of December 31, 2016. Refer to Note 26, "Fair Value of Financial Instruments," for further details regarding the performance shares.
On March 26, 2014, the Company entered into a Performance Share Grant Agreement with PIH, whereby the Company will be entitled to receive up to an aggregate of 375,000 shares of PIH common stock upon achievement of certain milestones for PIH’s stock price. Pursuant to the terms of the Performance Share Grant Agreement, if at any time the last sales price of PIH’s common stock equals or exceeds: (i) $12.00 per share (as adjusted for stock splits, stock dividends, reorganizations, recapitalizations and the like) for any 20 trading days within any 30-trading day period, the Company will receive 125,000 shares of PIH common stock; (ii) $15.00 per share (as adjusted for stock splits, stock dividends, reorganizations, recapitalizations and the like) for any 20 trading days within any 30-trading day period, the Company will receive 125,000 shares of PIH common stock (in addition to the 125,000 shares of common stock earned pursuant to clause (i) herein); and (iii) $18.00 per share (as adjusted for stock splits, stock dividends, reorganizations, recapitalizations and the like) for any 20 trading days within any 30-trading day period, the Company will receive 125,000 shares of PIH common stock (in addition to the 250,000 shares of common stock earned pursuant to clauses (i) and (ii) herein). To the extent shares of PIH common stock are granted to the Company under the Performance Share Grant Agreement, they will be recorded at the time the shares are granted and will have a valuation equal to the last sales price of PIH common stock on the day prior to such grant. No shares were received by the Company under the Performance Share Grant Agreement as of December 31, 2016. Refer to Note 26, "Fair Value of Financial Instruments," for further details regarding the performance shares.
On April 20, 2016, John T. Fitzgerald, the Managing Member of Argo, joined the Company as an Executive Vice President. As part of the agreement to purchase Argo, Mr. Fitzgerald received 160,000 common shares of the Company. On April 21, 2016, the Board of Directors appointed Mr. Fitzgerald as a new director.
Effective June 10, 2016, the Company entered into a management services agreement with ICL, formerly Kobex Capital Corp. At December 31, 2016, the Company owns 31.2% of ICL, as further discussed in Note 8, "Investments in Investees." The management services agreement provides that the Company shall provide management and administrative services to ICL, as well as the non-exclusive use and services of appropriately qualified individuals to serve as the Chief Executive Officer, Chief Financial Officer and Corporate Secretary of ICL. Pursuant to the management services agreement, Larry G. Swets, Jr. was appointed Chief Executive Officer of ICL and Hassan Baqar was appointed Chief Financial Officer and Corporate Secretary of ICL. Mr. Swets is the Chief Executive Officer and a director of the Company. Mr. Baqar is a Vice President of the Company.
On December 14, 2016, the Company sold 100,000 shares of PIH common stock to Ballantyne Strong, Inc. ("Ballantyne") at a price of $7.57 per share. Kyle Cerminara is the Chief Executive Officer of Ballantyne and Fundamental Global Investors (FGI). FGI is a greater than 5% shareholder of the Company.
108 | ||
KINGSWAY FINANCIAL SERVICES INC. Notes to Consolidated Financial Statements | ||
NOTE 28 COMMITMENTS AND CONTINGENT LIABILITIES
(a) Legal proceedings:
In connection with its operations in the ordinary course of business, the Company and its subsidiaries are named as defendants in various actions for damages and costs allegedly sustained by the plaintiffs. While it is not possible to estimate the loss, or range of loss, if any, that may be incurred in connection with any of the various proceedings at this time, it is possible that individual actions may result in losses having material adverse effects on the Company's financial condition or results of operations.
(b) Guarantee:
The Company provided an indemnity and hold harmless agreement to a third-party for customs bonds reinsured by Lincoln General Insurance Company ("Lincoln General") during the time Lincoln General was a subsidiary of the Company. This agreement may require the Company to compensate the third-party if Lincoln General is unable to fulfill its obligations relating to the customs bonds. The Company's potential exposure under this agreement is not determinable, and no liability has been recorded in the consolidated financial statements at December 31, 2016. No assurances can be given that the Company will not be required to perform under this agreement in a manner that has a material adverse effect on the Company's business, results of operations and financial condition.
(c) Commitment:
The Company has entered into subscription agreements to commit up to $2.5 million of capital to allow for participation in limited liability investments which invest principally in income-producing real estate. At December 31, 2016, the unfunded commitment was $1.6 million.
(d) Collateral pledged:
Fixed maturities and short-term investments with an estimated fair value of $13.1 million and $12.9 million were on deposit with state and provincial regulatory authorities at December 31, 2016 and December 31, 2015, respectively. Also, from time to time, the Company pledges investments to third-parties as deposits or to collateralize liabilities incurred under its policies of insurance. The amount of such pledged investments was $16.4 million and $15.8 million at December 31, 2016 and December 31, 2015, respectively. Collateral pledging transactions are conducted under terms that are common and customary to standard collateral pledging and are subject to the Company's standard risk management controls.
NOTE 29 REGULATORY CAPITAL REQUIREMENTS AND RATIOS
In the United States, a risk-based capital ("RBC") formula is used by the National Association of Insurance Commissioners ("NAIC") to identify property and casualty insurance companies that may not be adequately capitalized. In general, insurers reporting surplus as regards policyholders below 200% of the authorized control level, as defined by the NAIC, at December 31 are subject to varying levels of regulatory action, including discontinuation of operations. As of December 31, 2016, surplus as regards policyholders reported by each of our insurance subsidiaries exceeded the 200% threshold.
During the fourth quarter of 2012, the Company began taking steps to place all of Amigo into voluntary run-off. As of December 31, 2012, Amigo’s RBC was 157%. In April 2013, Kingsway filed a comprehensive run-off plan with the OIR, which outlines plans for Amigo's run-off. Amigo remains in compliance with that plan. As of December 31, 2016, Amigo's RBC was 1,541%.
The Company previously placed MCC into voluntary run-off in early 2011. At the time it was placed into voluntary run-off, MCC's RBC was 160%. MCC entered into a comprehensive run-off plan approved by the Illinois Department of Insurance in June 2011. MCC remains in compliance with that plan. As of December 31, 2016, MCC's RBC was 833%.
The Company's reinsurance subsidiary, which is domiciled in Barbados, is required by the regulator in Barbados to maintain minimum capital levels. As of December 31, 2016, the capital maintained by Kingsway Reinsurance Corporation was in excess of the regulatory capital requirements in Barbados.
NOTE 30 STATUTORY INFORMATION AND POLICIES
The Company's insurance subsidiaries prepare statutory basis financial statements in accordance with accounting practices prescribed or permitted by the Departments of Insurance in states in which they are domiciled. "Prescribed" statutory accounting practices include state laws, regulations and general administrative rules, as well as a variety of publications of the NAIC.
109 | ||
KINGSWAY FINANCIAL SERVICES INC. Notes to Consolidated Financial Statements | ||
"Permitted" statutory accounting practices encompass all accounting practices that are not prescribed. Such practices may differ from state to state; may differ from company to company within a state; and may change in the future.
The Company's insurance subsidiaries are required to report results of operations and financial position to insurance regulatory authorities based upon statutory accounting practices. In converting from statutory to U.S. GAAP, typical adjustments include deferral of acquisition costs, the inclusion of statutory non-admitted assets in the balance sheets, the inclusion of net unrealized holding gains or losses related to fixed maturities in shareholders’ equity, and the inclusion of changes in deferred tax assets and liabilities in net income (loss).
Statutory capital and surplus and statutory net (loss) income for the Company's insurance subsidiaries are:
(in thousands) | December 31, | |||||||||||
2016 | 2015 | 2014 | ||||||||||
Combined net (loss) income, statutory basis | $ | (7,528 | ) | $ | 6,298 | $ | 2,725 | |||||
Combined capital and surplus, statutory basis | $ | 41,330 | $ | 42,387 | $ | 39,042 | ||||||
The Company’s insurance subsidiaries are required to hold minimum levels of statutory capital and surplus to satisfy regulatory requirements. The minimum statutory capital and surplus, or company action level RBC, necessary to satisfy regulatory requirements for the Company's insurance subsidiaries collectively was $27.8 million at December 31, 2016. Company action level RBC is the level at which an insurance company is required to file a corrective action plan with its regulators and is equal to 200% of the authorized control level RBC.
Dividends paid by insurance subsidiaries are restricted by regulatory requirements of the insurance departments in the subsidiaries' state of domicile. The maximum amount of dividends that can be paid to shareholders by insurance companies without prior approval of the domiciliary state insurance commissioner is generally limited to the greater of (i) 10% of a company's statutory capital and surplus at the end of the previous year or (ii) 100% of the company's net income for the previous year and is generally required to be paid out of an insurance company's unassigned funds.
At December 31, 2016, the U.S. insurance subsidiaries of the Company were restricted from making any dividend payments to the holding company without regulatory approval pursuant to the domiciliary state insurance regulations.
110 | ||
KINGSWAY FINANCIAL SERVICES INC. Notes to Consolidated Financial Statements | ||
NOTE 31 SELECTED QUARTERLY FINANCIAL DATA (UNAUDITED)
Select unaudited quarterly information is as follows:
(in thousands, except per share data) | 2016 | |||||||||||||||
Q4 | Q3 | Q2 | Q1 | |||||||||||||
Net premiums earned | $ | 33,419 | $ | 32,949 | $ | 31,813 | $ | 29,427 | ||||||||
Service fee and commission income | 7,186 | 6,330 | 5,394 | 5,322 | ||||||||||||
Rental income | 2,993 | 2,426 | — | — | ||||||||||||
Total revenues | 52,788 | 45,825 | 41,137 | 36,880 | ||||||||||||
Total operating expenses | 55,415 | 46,161 | 42,187 | 39,714 | ||||||||||||
Operating loss | (2,627 | ) | (336 | ) | (1,050 | ) | (2,834 | ) | ||||||||
Income (loss) from continuing operations | 1,174 | 1,587 | (1,999 | ) | (1,495 | ) | ||||||||||
Net income (loss) | 1,305 | 1,587 | (875 | ) | (1,495 | ) | ||||||||||
Net income (loss) attributable to common shareholders | 1,110 | 1,429 | (596 | ) | (1,538 | ) | ||||||||||
Earnings (loss) per share - continuing operations: | ||||||||||||||||
Basic: | 0.05 | 0.07 | (0.09 | ) | (0.08 | ) | ||||||||||
Diluted: | 0.04 | 0.06 | (0.09 | ) | (0.08 | ) | ||||||||||
Earnings (loss) per share – net income (loss) attributable to common shareholders: | ||||||||||||||||
Basic: | 0.05 | 0.07 | (0.03 | ) | (0.08 | ) | ||||||||||
Diluted: | 0.05 | 0.06 | (0.03 | ) | (0.08 | ) | ||||||||||
(in thousands, except per share data) | 2015 | |||||||||||||||
Q4 | Q3 | Q2 | Q1 | |||||||||||||
Net premiums earned | $ | 29,006 | $ | 29,197 | $ | 30,200 | $ | 29,030 | ||||||||
Service fee and commission income | 5,536 | 6,184 | 5,848 | 5,398 | ||||||||||||
Rental income | — | — | — | — | ||||||||||||
Total revenues | 38,177 | 38,558 | 39,143 | 44,088 | ||||||||||||
Total operating expenses | 39,063 | 40,389 | 41,642 | 40,400 | ||||||||||||
Operating (loss) income | (886 | ) | (1,831 | ) | (2,499 | ) | 3,688 | |||||||||
(Loss) income from continuing operations | (2,103 | ) | (894 | ) | (10,426 | ) | 2,008 | |||||||||
Net (loss) income | (2,104 | ) | (894 | ) | 833 | 3,434 | ||||||||||
Net (loss) income attributable to common shareholders | (2,275 | ) | (891 | ) | 1,815 | 2,129 | ||||||||||
(Loss) earnings per share - continuing operations: | ||||||||||||||||
Basic: | (0.12 | ) | (0.05 | ) | (0.48 | ) | 0.04 | |||||||||
Diluted: | (0.12 | ) | (0.05 | ) | (0.48 | ) | 0.03 | |||||||||
(Loss) earnings per share – net (loss) income attributable to common shareholders: | ||||||||||||||||
Basic: | (0.12 | ) | (0.05 | ) | 0.09 | 0.11 | ||||||||||
Diluted: | (0.12 | ) | (0.05 | ) | 0.09 | 0.10 | ||||||||||
111 | ||
KINGSWAY FINANCIAL SERVICES INC. | ||
Item 9. Changes in and Disagreements with Accountants on Accounting and Financial Disclosure
None
Item 9A. Controls and Procedures
Evaluation of Disclosure Controls and Procedures
The Company’s management, with the participation of our Chief Executive Officer and Chief Financial Officer, has conducted an evaluation of the effectiveness of the Company’s disclosure controls and procedures (as defined in Rule 13a-15(e) and 15d-15(e) under the Securities Exchange Act of 1934, as amended (the “Exchange Act”) as of December 31, 2016. The Company’s disclosure controls and procedures are designed to ensure that information required to be disclosed in the reports the Company files under the Exchange Act is recorded, processed, summarized and reported within the time periods specified in the Securities and Exchange Commission’s rules and forms and that such information is accumulated and communicated to the Company’s management, including the Company’s Chief Executive Officer and Chief Financial Officer, to allow for timely decisions regarding required disclosures. In designing and evaluating our disclosure controls and procedures, the Company’s management recognizes that disclosure controls and procedures, no matter how well conceived and operated, can provide only reasonable, not absolute, assurance that the objectives of the disclosure controls and procedures are met. Our disclosure controls and procedures have been designed to meet reasonable assurance standards. In addition, the design of disclosure controls and procedures must reflect the fact that there are resource constraints that require the Company’s management to apply its judgment in evaluating the benefits of possible controls and procedures relative to their costs. The design of any disclosure controls and procedures also is based in part upon certain assumptions about the likelihood of future events, and there can be no assurance that any design will succeed in achieving its stated goals under all potential future conditions. Based on this evaluation, the Company's Chief Executive Officer and Chief Financial Officer have concluded that, as of December 31, 2016, the Company's disclosure controls and procedures were not effective as a result of a material weakness in the Company’s internal control over financial reporting related to income tax accounting for non-routine transactions, as further described below.
Management's Report on Internal Control over Financial Reporting
The Company's management is responsible for establishing and maintaining adequate internal control over financial reporting as defined in Rules 13a-15(f) and 15d-15(f) under the Exchange Act. The Company's management evaluated the effectiveness of its internal control over financial reporting based on the framework in Internal Control-Integrated Framework issued by the Committee of Sponsoring Organizations of the Treadway Commission (2013 framework). Based on that evaluation, the Company’s management has concluded that, as of December 31, 2016, our internal controls over financial reporting were not effective because of the existence of the material weakness in internal control over financial reporting related to income tax accounting for non-routine transactions described below.
Material Weakness in Internal Control Over Financial Reporting
The material weakness in internal control over financial reporting resulted from the inadequate design and operation of internal controls related to income tax accounting for non-routine transactions. Specifically, the execution of the controls over the application of the accounting literature to changes in the Company’s valuation allowance against its deferred income tax assets at the time of a business combination did not operate effectively with respect to (1) the recognition as income tax benefit of the partial release of its valuation allowance due to net deferred income tax liabilities, created as a result of the Company’s acquisition of CMC, that are expected to reverse during the period in which the Company will have deferred income tax assets available; and (2) the netting of deferred income tax liabilities created as a result of the Company’s acquisition of CMC against goodwill created in that same acquisition. The matters were discovered during the course of the 2016 external audit of the accounts and related controls and were reviewed with the Company's Audit Committee. The misstatements in the consolidated financial statements were corrected prior to the issuance of the Company’s consolidated financial statements as of and for the year ended December 31, 2016. Notwithstanding the material weakness described above, the Company’s management, including the Company’s Chief Executive Officer and Chief Financial Officer, believes that the audited consolidated financial statements contained in this 2016 Annual Report on Form 10-K fairly present, in all material respects, our financial condition, results of operations and cash flows for the fiscal years presented in conformity with U.S. GAAP. In addition, the material weakness described above did not result in any restatements of the Company’s audited and unaudited consolidated financial statements or disclosures for any previously reported periods.
112 | ||
KINGSWAY FINANCIAL SERVICES INC. | ||
Remediation Process
The Company’s management plans to enhance its internal control over financial reporting related to non-routine transactions by supplementing with outside resources as necessary and enhancing the design and documentation of management review controls.
Attestation Report of Independent Registered Public Accounting Firm
The effectiveness of the Company's internal control over financial reporting as of December 31, 2016 has been audited by BDO USA, LLP, an independent registered public accounting firm. Their attestation report is included below under the heading "Report of Independent Registered Public Accounting Firm," and is incorporated into this Item 9A by reference.
Changes in Internal Control over Financial Reporting
Effective July 14, 2016, the Company acquired 81% of CMC. Since the date of acquisition, the Company has been analyzing and evaluating procedures and controls to determine their effectiveness and to make them consistent with our disclosure controls and procedures. As permitted by the SEC, CMC has been excluded from the scope of our quarterly discussion of material changes in internal control over financial reporting below.
There have been no changes in the Company's internal control over financial reporting during the period beginning October 1, 2016, and ending December 31, 2016, that have materially affected, or are reasonably likely to materially affect, its internal control over financial reporting, except with respect to CMC and the material weakness described above.
113 | ||
KINGSWAY FINANCIAL SERVICES INC. | ||
Report of Independent Registered Public Accounting Firm
Board of Directors and Shareholders
Kingsway Financial Services Inc.
Itasca, Illinois
We have audited Kingsway Financial Services Inc.’s internal control over financial reporting as of December 31, 2016, based on criteria established in Internal Control - Integrated Framework (2013) issued by the Committee of Sponsoring Organizations of the Treadway Commission (the COSO criteria). Kingsway Financial Services Inc.’s management is responsible for maintaining effective internal control over financial reporting and for its assessment of the effectiveness of internal control over financial reporting, included in the accompanying “Item 9A, Management’s Report on Internal Control Over Financial Reporting”. Our responsibility is to express an opinion on the company’s internal control over financial reporting based on our audit.
We conducted our audit in accordance with the standards of the Public Company Accounting Oversight Board (United States). Those standards require that we plan and perform the audit to obtain reasonable assurance about whether effective internal control over financial reporting was maintained in all material respects. Our audit included obtaining an understanding of internal control over financial reporting, assessing the risk that a material weakness exists, and testing and evaluating the design and operating effectiveness of internal control based on the assessed risk. Our audit also included performing such other procedures as we considered necessary in the circumstances. We believe that our audit provides a reasonable basis for our opinion.
A company’s internal control over financial reporting is a process designed to provide reasonable assurance regarding the reliability of financial reporting and the preparation of financial statements for external purposes in accordance with generally accepted accounting principles. A company’s internal control over financial reporting includes those policies and procedures that (1) pertain to the maintenance of records that, in reasonable detail, accurately and fairly reflect the transactions and dispositions of the assets of the company; (2) provide reasonable assurance that transactions are recorded as necessary to permit preparation of financial statements in accordance with generally accepted accounting principles, and that receipts and expenditures of the company are being made only in accordance with authorizations of management and directors of the company; and (3) provide reasonable assurance regarding prevention or timely detection of unauthorized acquisition, use, or disposition of the company’s assets that could have a material effect on the financial statements.
Because of its inherent limitations, internal control over financial reporting may not prevent or detect misstatements. Also, projections of any evaluation of effectiveness to future periods are subject to the risk that controls may become inadequate because of changes in conditions, or that the degree of compliance with the policies or procedures may deteriorate.
A material weakness is a deficiency, or a combination of deficiencies, in internal control over financial reporting, such that there is a reasonable possibility that a material misstatement of the company’s annual or interim financial statements will not be prevented or detected on a timely basis. A material weakness regarding management’s failure to design and operate internal controls related to income tax accounting for non-routine transactions has been described in management’s assessment. This material weakness was considered in determining the nature, timing, and extent of audit tests applied in our audit of the 2016 financial statements, and this report does not affect our report dated March 13, 2017 on those financial statements.
In our opinion, Kingsway Financial Services Inc. did not maintain, in all material respects, effective internal control over financial reporting as of December 31, 2016, based on the COSO criteria.
We do not express an opinion or any other form of assurance on management’s statements referring to any corrective actions taken by the company after the date of management’s assessment.
We also have audited, in accordance with the standards of the Public Company Accounting Oversight Board (United States), the consolidated balance sheets of Kingsway Financial Services Inc. as of December 31, 2016 and 2015, and the related consolidated statements of operations, comprehensive income (loss), shareholders’ equity, and cash flows for each of the three years in the period ended December 31, 2016 and our report dated March 13, 2017 expressed an unqualified opinion therein.
/s/ BDO USA LLP
Grand Rapids, Michigan
March 13, 2017
BDO USA, LLP, a Delaware limited liability partnership, is the U.S. member of BDO International Limited, a UK company limited by guarantee, and forms part of the international BDO network of independent member firms.
BDO is the brand name for the BDO network and for each of the BDO Member Firms.
114 | ||
KINGSWAY FINANCIAL SERVICES INC. | ||
Item 9B. Other Information
None
PART III.
Item 10. Directors, Executive Officers, and Corporate Governance
The information required by this Item is incorporated herein by reference to the Proxy Statement for our 2016 Annual Meeting of Shareholders, which will be filed with the SEC no later than 120 days after the end of our fiscal year ended December 31, 2016.
We have adopted a code of ethics applicable to our directors, chief executive officer, chief financial officer, and other senior financial personnel ("Code of Ethics for Senior Financial Personnel") which is posted in the "Corporate Governance" section of our website at www.kingsway-financial.com. Any future amendments to the Code of Ethics for Senior Financial Personnel and any grant of waiver from a provision of the code requiring disclosure under applicable SEC rules will be disclosed in the "Corporate Governance" section of our website.
Item 11. Executive Compensation
The information required by this Item is incorporated herein by reference to the Proxy Statement for our 2016 Annual Meeting of Shareholders, which will be filed with the SEC no later than 120 days after the end of our fiscal year ended December 31, 2016.
Item 12. Security Ownership of Certain Beneficial Owners and Management and Related Stockholder Matters
Information regarding our equity compensation plans is incorporated herein by reference to Item 5 of Part II of this Form 10-K. All other information required by this Item is incorporated herein by reference to the Proxy Statement for our 2016 Annual Meeting of Shareholders, which will be filed with the SEC no later than 120 days after the end of our fiscal year ended December 31, 2016.
Item 13. Certain Relationships and Related Transactions, and Director Independence
The information required by this Item is incorporated herein by reference to the Proxy Statement for our 2016 Annual Meeting of Shareholders, which will be filed with the SEC no later than 120 days after the end of our fiscal year ended December 31, 2016.
Item 14. Principal Accounting Fees and Services
The information required by this Item is incorporated herein by reference to the Proxy Statement for our 2016 Annual Meeting of Shareholders, which will be filed with the SEC no later than 120 days after the end of our fiscal year ended December 31, 2016.
115 | ||
KINGSWAY FINANCIAL SERVICES INC. | ||
Part IV
Item 15. Exhibits, Financial Statement Schedules
(a) Documents filed as part of this Report
(1) Financial Statements. We have filed the following documents, which are included in Part II, Item 8 of this 2016 Annual Report on Form 10-K.
Report of Independent Registered Public Accounting Firm
Consolidated Balance Sheets
Consolidated Statements of Operations
Consolidated Statements of Comprehensive Income (Loss)
Consolidated Statements of Shareholders' Equity
Consolidated Statements of Cash Flow
Notes to Consolidated Financial Statements
(2) Financial Statement Schedules. The following financial statement schedules are filed as a part hereof along with the related reports of the Independent Registered Public Accounting Firm included in Part II, Item 8. Schedules not listed here have been omitted because they are not applicable or the required information is included in the Consolidated Financial Statements.
Schedule I Investments Other Than Investments in Related Parties
Schedule II Financial Information of Registrant (Parent Company)
Schedule III Supplementary Insurance Information
Schedule IV Reinsurance Schedule
Schedule V Valuation and Qualifying Accounts
Schedule VI Supplemental Information Concerning Property-Casualty Insurance Operations
(3) Exhibits. The exhibits listed in the accompanying "Index to Exhibits" that follow the signature pages of this report are filed or incorporated by reference as part of this Form 10-K.
(b) Exhibits. Included in Item 15(a)(3) above
(c) Financial Statement Schedules. Included in Item 15(a)(2) above
116 | ||
KINGSWAY FINANCIAL SERVICES INC. | ||
SCHEDULE I. Investments Other Than Investments in Related Parties
(in thousands) | December 31, 2016 | |||||||||||
Cost or Amortized Cost | Fair Value | Amount Shown on Consolidated Balance Sheet | ||||||||||
Fixed maturities: | ||||||||||||
U.S. government, government agencies and authorities | $ | 28,312 | $ | 28,148 | $ | 28,148 | ||||||
States, municipalities and political subdivisions | 3,131 | 3,088 | 3,088 | |||||||||
Mortgage-backed | 8,610 | 8,506 | 8,506 | |||||||||
Asset-backed securities and collateralized mortgage obligations | 3,468 | 3,467 | 3,467 | |||||||||
Corporate | 18,615 | 18,555 | 18,555 | |||||||||
Total fixed maturities | 62,136 | 61,764 | 61,764 | |||||||||
Equity investments: | ||||||||||||
Common stock | 17,701 | 21,426 | 21,426 | |||||||||
Warrants | 1,398 | 1,804 | 1,804 | |||||||||
Total equity investments | 19,099 | 23,230 | 23,230 | |||||||||
Limited liability investments | 22,974 | — | 22,974 | |||||||||
Limited liability investments, at fair value | 10,700 | 10,700 | 10,700 | |||||||||
Other investments | 7,975 | — | 7,975 | |||||||||
Short-term investments | 401 | — | 401 | |||||||||
Total investments | $ | 123,285 | $ | 84,994 | $ | 127,044 | ||||||
NOTE 1: Cost approximates fair value for limited liability investments, other investments and short-term investments.
See accompanying report of independent registered accounting firm.
117 | ||
KINGSWAY FINANCIAL SERVICES INC. | ||
SCHEDULE II. Financial Information of Registrant (Parent Company)
Parent Company Balance Sheets
(in thousands) | December 31, 2016 | December 31, 2015 | ||||||
Assets | ||||||||
Investments in subsidiaries | $ | 47,729 | $ | 43,878 | ||||
Equity investments | — | 2,555 | ||||||
Cash and cash equivalents | 11,469 | 2,332 | ||||||
Investment in investee | 3,116 | — | ||||||
Other assets | 2,254 | 2,503 | ||||||
Total Assets | $ | 64,568 | $ | 51,268 | ||||
Liabilities and Shareholders' Equity | ||||||||
Liabilities: | ||||||||
Accrued expenses and other liabilities | $ | 1,306 | $ | 1,171 | ||||
Total Liabilities | 1,306 | 1,171 | ||||||
Class A preferred stock | 6,427 | 6,394 | ||||||
Shareholders' Equity: | ||||||||
Common stock | — | — | ||||||
Additional paid-in capital | 353,882 | 341,646 | ||||||
Accumulated deficit | (297,668 | ) | (297,209 | ) | ||||
Accumulated other comprehensive loss | (208 | ) | (2,486 | ) | ||||
Shareholders' equity attributable to common shareholders | 56,006 | 41,951 | ||||||
Noncontrolling interests in consolidated subsidiaries | 829 | 1,752 | ||||||
Total Shareholders' Equity | 56,835 | 43,703 | ||||||
Total Liabilities and Shareholders' Equity | $ | 64,568 | $ | 51,268 | ||||
See accompanying report of independent registered accounting firm.
118 | ||
KINGSWAY FINANCIAL SERVICES INC. | ||
SCHEDULE II. Financial Information of Registrant (Parent Company)
Parent Company Statements of Operations
(in thousands) | Years ended December 31, | |||||||||||
2016 | 2015 | 2014 | ||||||||||
Revenues: | ||||||||||||
Net investment income | $ | 6 | $ | 5 | $ | 7 | ||||||
Net realized gains | 47 | — | — | |||||||||
Total revenues | 53 | 5 | 7 | |||||||||
Expenses: | ||||||||||||
General and administrative expenses | 2,147 | 2,715 | 2,796 | |||||||||
Foreign exchange (gains) losses, net | (58 | ) | 553 | 298 | ||||||||
Equity in net loss of investee | 74 | — | — | |||||||||
Total expenses | 2,163 | 3,268 | 3,094 | |||||||||
Loss from continuing operations before income tax benefit and equity in income (loss) of subsidiaries | (2,110 | ) | (3,263 | ) | (3,087 | ) | ||||||
Income tax benefit | — | — | (341 | ) | ||||||||
Equity in income (loss) of subsidiaries | 2,632 | 4,532 | (8,478 | ) | ||||||||
Net income (loss) | $ | 522 | $ | 1,269 | $ | (11,224 | ) | |||||
See accompanying report of independent registered accounting firm.
119 | ||
KINGSWAY FINANCIAL SERVICES INC. | ||
SCHEDULE II. Financial Information of Registrant (Parent Company)
Parent Company Statements of Comprehensive Income (Loss)
(in thousands) | Years ended December 31, | |||||||||||
2016 | 2015 | 2014 | ||||||||||
Net income (loss) | $ | 522 | $ | 1,269 | $ | (11,224 | ) | |||||
Other comprehensive income (loss), net of taxes(1): | ||||||||||||
Unrealized gains (losses) on fixed maturities and equity investments: | ||||||||||||
Unrealized gains (losses) arising during the period | 588 | (588 | ) | — | ||||||||
Reclassification adjustment for amounts included in net (loss) income | — | — | ||||||||||
Foreign currency translation adjustments | — | — | (31 | ) | ||||||||
Other comprehensive income (loss) - parent only | 588 | (588 | ) | (31 | ) | |||||||
Equity in other comprehensive income (loss) of subsidiaries | 1,682 | 748 | (1,045 | ) | ||||||||
Other comprehensive income (loss) | 2,270 | 160 | (1,076 | ) | ||||||||
Comprehensive income (loss) | $ | 2,792 | $ | 1,429 | $ | (12,300 | ) | |||||
(1) Net of income tax (benefit) expense of $0, $0 and $0 in 2016, 2015 and 2014 | ||||||||||||
See accompanying report of independent registered accounting firm.
120 | ||
KINGSWAY FINANCIAL SERVICES INC. | ||
SCHEDULE II. Financial Information of Registrant (Parent Company)
Parent Company Statements of Cash Flows
(in thousands) | Years ended December 31, | |||||||||||
2016 | 2015 | 2014 | ||||||||||
Cash provided by (used in): | ||||||||||||
Operating activities: | ||||||||||||
Net income (loss) | $ | 522 | $ | 1,269 | $ | (11,224 | ) | |||||
Adjustments to reconcile net income (loss) to net cash used in operating activities: | ||||||||||||
Equity in net (income) loss of subsidiaries | (2,632 | ) | (4,532 | ) | 8,478 | |||||||
Equity in net loss of investee | 74 | — | — | |||||||||
Stock-based compensation expense, net of forfeitures | 1,015 | 802 | 1,239 | |||||||||
Net realized gains | (47 | ) | — | — | ||||||||
Other, net | (147 | ) | 1,242 | (146 | ) | |||||||
Net cash used in operating activities | (1,215 | ) | (1,219 | ) | (1,653 | ) | ||||||
Investing activities: | ||||||||||||
Purchases of equity investments | — | (3,143 | ) | — | ||||||||
Net cash used in investing activities | — | (3,143 | ) | — | ||||||||
Financing activities: | ||||||||||||
Proceeds from issuance of preferred stock, net | — | — | 6,330 | |||||||||
Proceeds from issuance of common stock, net | 10,477 | — | — | |||||||||
Repurchase of common stock for cancellation | (125 | ) | — | — | ||||||||
Proceeds from exercise of warrants | — | — | 14,803 | |||||||||
Capital contributions to subsidiaries | — | (500 | ) | (19,500 | ) | |||||||
Cash dividends received from subsidiaries | — | 500 | 2,152 | |||||||||
Net cash provided by financing activities | 10,352 | — | 3,785 | |||||||||
Net increase (decrease) in cash and cash equivalents | 9,137 | (4,362 | ) | 2,132 | ||||||||
Cash and cash equivalents at beginning of period | 2,332 | 6,694 | 4,562 | |||||||||
Cash and cash equivalents at end of period | $ | 11,469 | $ | 2,332 | $ | 6,694 | ||||||
See accompanying report of independent registered accounting firm.
121 | ||
KINGSWAY FINANCIAL SERVICES INC. | ||
SCHEDULE III. Supplementary Insurance Information
(in thousands) | December 31, | Years ended December 31, | ||||||||||||||||||||||||||||||
Deferred Acquisition Costs | Unpaid Loss and Loss Adjustment Expenses | Unearned Premiums | Net Premiums Earned | Loss and Loss Adjustment Expenses | Amortization of Deferred Acquisition Costs | Other Operating Expenses | Net Premiums Written | |||||||||||||||||||||||||
2016 | ||||||||||||||||||||||||||||||||
Insurance Underwriting | $ | 7,782 | $ | 53,795 | $ | 40,176 | $ | 127,608 | $ | 104,384 | $ | 24,154 | $ | 17,543 | $ | 132,550 | ||||||||||||||||
Amounts not allocated to segments | — | — | — | — | — | — | — | — | ||||||||||||||||||||||||
Total | $ | 7,782 | $ | 53,795 | $ | 40,176 | $ | 127,608 | $ | 104,384 | $ | 24,154 | $ | 17,543 | $ | 132,550 | ||||||||||||||||
2015 | ||||||||||||||||||||||||||||||||
Insurance Underwriting | $ | 6,696 | $ | 55,471 | $ | 35,234 | $ | 117,433 | $ | 87,055 | $ | 23,333 | $ | 17,130 | $ | 116,239 | ||||||||||||||||
Amounts not allocated to segments | — | — | — | — | — | — | — | — | ||||||||||||||||||||||||
Total | $ | 6,696 | $ | 55,471 | $ | 35,234 | $ | 117,433 | $ | 87,055 | $ | 23,333 | $ | 17,130 | $ | 116,239 | ||||||||||||||||
2014 | ||||||||||||||||||||||||||||||||
Insurance Underwriting | $ | 6,786 | $ | 63,895 | $ | 36,432 | $ | 113,479 | $ | 79,070 | $ | 21,713 | $ | 19,888 | $ | 118,021 | ||||||||||||||||
Amounts not allocated to segments | — | — | — | 4,114 | 384 | 881 | 563 | 5,357 | ||||||||||||||||||||||||
Total | $ | 6,786 | $ | 63,895 | $ | 36,432 | $ | 117,593 | $ | 79,454 | $ | 22,594 | $ | 20,451 | $ | 123,378 | ||||||||||||||||
NOTE 1: Net investment income is not allocated to segments, therefore net investment income is not provided in this schedule.
NOTE 2: Amounts not allocated to segments represent balances related to the Company's disposed subsidiary, PIH.
See accompanying report of independent registered accounting firm.
122 | ||
KINGSWAY FINANCIAL SERVICES INC. | ||
SCHEDULE IV. Reinsurance
(in thousands, except for percentages) | Years ended December 31, | ||||||||||||||||||
Direct Premiums Written | Premiums Ceded to Other Companies | Premiums Assumed from Other Companies | Net Premiums Written | Percentage of Premiums Assumed to Net | |||||||||||||||
2016 | $ | 109,165 | $ | 141 | $ | 23,526 | $ | 132,550 | 17.7 | % | |||||||||
2015 | $ | 97,414 | $ | 165 | $ | 18,990 | $ | 116,239 | 16.3 | % | |||||||||
2014 | $ | 99,540 | $ | (3,695 | ) | $ | 20,143 | $ | 123,378 | 16.3 | % | ||||||||
See accompanying report of independent registered accounting firm.
123 | ||
KINGSWAY FINANCIAL SERVICES INC. | ||
SCHEDULE V. Valuation and Qualifying Accounts
(in thousands) | ||||||||||||||||
Balance at Beginning of Year | Charged to Income Tax (Benefit) Expense | Disposals and Other | Balance at End of Year | |||||||||||||
Valuation Allowance for Deferred Tax Assets: | ||||||||||||||||
Year Ended December 31, 2016 | $ | 283,636 | $ | (6,743 | ) | $ | (303 | ) | $ | 276,590 | ||||||
Year Ended December 31, 2015 | $ | 287,151 | $ | 1,033 | $ | (4,548 | ) | $ | 283,636 | |||||||
Year Ended December 31, 2014 | $ | 281,613 | $ | 5,686 | $ | (148 | ) | $ | 287,151 | |||||||
See accompanying report of independent registered accounting firm.
124 | ||
KINGSWAY FINANCIAL SERVICES INC. | ||
SCHEDULE VI. Supplemental Information Concerning Property-Casualty Insurance Operations
(in thousands) | ||||||||||||||||||||||||||||||
Loss and Loss Adjustment Expenses Related to | ||||||||||||||||||||||||||||||
Affiliation with Registrant (1) | Deferred Acquisition Costs | Unpaid Loss and Loss Adjustment Expenses | Unearned Premiums | Net Earned Premiums | Net Investment Income | Current Year | Prior Years | Amortization of Deferred Acquisition Costs | Paid Loss and Loss Adjustment Expenses | Net Premiums Written | ||||||||||||||||||||
Year ended December 31, 2016 | ||||||||||||||||||||||||||||||
$ | 7,782 | $ | 53,795 | $ | 40,176 | $ | 127,608 | $ | 5,530 | $ | 96,289 | $ | 8,095 | $ | 24,154 | $ | 105,534 | $ | 132,550 | |||||||||||
Year ended December 31, 2015 | ||||||||||||||||||||||||||||||
$ | 6,696 | $ | 55,471 | $ | 35,234 | $ | 117,433 | $ | 2,811 | $ | 86,439 | $ | 616 | $ | 23,333 | $ | 93,483 | $ | 116,239 | |||||||||||
Year ended December 31, 2014 | ||||||||||||||||||||||||||||||
$ | 6,786 | $ | 63,895 | $ | 36,432 | $ | 117,593 | $ | 1,281 | $ | 84,577 | $ | (5,123 | ) | $ | 22,594 | $ | 94,949 | $ | 123,378 | ||||||||||
See accompanying report of independent registered accounting firm.
Item 16. Form 10-K Summary
None.
125 | ||
KINGSWAY FINANCIAL SERVICES INC. | ||
SIGNATURES
Pursuant to the requirements of Section 13 or 15(d) of the Securities Exchange Act of 1934, the registrant has duly caused this report to be signed on its behalf by the undersigned, thereunto duly authorized.
KINGSWAY FINANCIAL SERVICES INC. | |||
Date: | March 13, 2017 | By: | /s/ Larry G. Swets, Jr. |
Name: | Larry G. Swets, Jr. | ||
Title: | Chief Executive Officer and Director | ||
(Principal Executive Officer) | |||
Pursuant to the requirements of the Securities Exchange Act of 1934, this report has been signed below by the following persons on behalf of the registrant and in the capacities and on the dates indicated.
/s/ Larry G. Swets, Jr. Larry G. Swets, Jr. | Chief Executive Officer and Director (principal executive officer) | March 13, 2017 |
/s/ John T. Fitzgerald John T. Fitzgerald | President, Chief Operating Officer and Director | March 13, 2017 |
/s/ William A. Hickey, Jr. William A. Hickey, Jr. | Executive Vice President and Chief Financial Officer (principal financial and accounting officer) | March 13, 2017 |
/s/ Terence Kavanagh Terence Kavanagh | Chairman of the Board and Director | March 13, 2017 |
/s/ Gregory Hannon Gregory Hannon | Director | March 13, 2017 |
/s/ Gary Schaevitz Gary Schaevitz | Director | March 13, 2017 |
/s/ Joseph Stilwell Joseph Stilwell | Director | March 13, 2017 |
126 | ||
KINGSWAY FINANCIAL SERVICES INC. | ||
EXHIBIT INDEX
Exhibit | Description |
2.1 | Stock Purchase Agreement, dated April 1, 2015, by and between National General Holdings Corp., as Buyer, and Kingsway America Inc. and Mendota Insurance Company, as Sellers (included as Exhibit 2.1 to the Form 8-K, filed April 7, 2015, and incorporated herein by reference). |
2.2 | Stock Purchase Agreement, dated as of May 17, 2016 by and among CMC Acquisition, LLC, CRIC TRT Acquisition LLC and BNSF-Delpres Investments Ltd. (included as Exhibit 2.1 to the Form 8-K, filed July 20, 2016, and incorporated herein by reference). |
2.3 | Amendment to Stock Purchase Agreement, dated as of June 17, 2016, by and among CMC Acquisition, LLC, CRIC TRT Acquisition LLC, and BNSF-Delpres Investments Ltd. (included as Exhibit 2.1 to the Form 8-K, filed June 17, 2016, and incorporated herein by reference). |
3.1 | Certificate of Amendment to the Articles of Incorporation of Kingsway Financial Services Inc. (included as Exhibit 3.1 to the Form 10-Q, filed November 7, 2013, and incorporated herein by reference). |
3.2 | By-law No. 5 of Kingsway Financial Services Inc. (included as Exhibit 3.2 to the Form 10-K, filed March 30, 2012, and incorporated herein by reference). |
4.1 | Indenture dated January 28, 2004 among Kingsway America Inc., Kingsway Financial Services Inc. and BNY Midwest Trust Company (included as Exhibit 4.1 to the Form F-4, filed May 27, 2004, and incorporated herein by reference). |
4.2 | Trust Indenture dated July 10, 2007 among Kingsway 2007 General Partnership, Kingsway Financial Services Inc., Kingsway America Inc., and Computershare Trust Company of Canada (included as Exhibit 4.2 to the Form 10-K, filed March 30, 2012, and incorporated herein by reference). |
4.3 | Indenture dated December 4, 2002 between Kingsway America Inc. and State Street Bank and Trust Company of Connecticut, National Association (included as Exhibit 4.3 to the Form 10-K, filed March 30, 2012, and incorporated herein by reference). |
4.4 | Indenture dated May 15, 2003 between Kingsway America Inc. and U.S. Bank National Association (included as Exhibit 4.4 to the Form 10-K, filed March 30, 2012, and incorporated herein by reference). |
4.5 | Indenture dated October 29, 2003 between Kingsway America Inc. and U.S. Bank National Association (included as Exhibit 4.5 to the Form 10-K, filed March 30, 2012, and incorporated herein by reference). |
4.6 | Indenture dated May 22, 2003 between Kingsway America Inc., Kingsway Financial Services Inc., and Wilmington Trust Company (included as Exhibit 4.6 to the Form 10-K, filed March 30, 2012, and incorporated herein by reference). |
4.7 | Junior Subordinated Indenture dated September 30, 2003 between Kingsway America Inc. and J.P Morgan Chase Bank (included as Exhibit 4.7 to the Form 10-K, filed March 30, 2012, and incorporated herein by reference). |
4.8 | Indenture dated December 16, 2003 between Kingsway America Inc., Kingsway Financial Services Inc., and Wilmington Trust Company (included as Exhibit 4.8 to the Form 10-K, filed March 30, 2012, and incorporated herein by reference). |
4.9 | Excerpt of the Articles of Amendment to the Articles of Incorporation of the Company (included as Exhibit 4.1 to the Form 8-K, filed December 27, 2013, and incorporated herein by reference). |
4.10 | Form of Common Stock Series C Warrant Agreement (included as Exhibit 4.2 to the Form 8-K, filed December 27, 2013, and incorporated herein by reference). |
4.11 | Amended and Restated Common Stock Series B Warrant Agreement, dated July 8, 2014 (included as Exhibit 4.1 to the Form 8-K, filed July 10, 2014, and incorporated herein by reference). |
10.1 | Amended and Restated Stock Option Plan of Kingsway Financial Services Inc., dated as of May 2001 and amended most recently as of May 2007 (included as Exhibit 10.1 to the Form 10-K, filed March 30, 2012, and incorporated herein by reference). * |
127 | ||
KINGSWAY FINANCIAL SERVICES INC. | ||
10.2 | Purchase Agreement, dated January 25, 2010, between The Westaim Corporation and Kingsway Financial Services Inc. (included as Exhibit 10.2 to the Form 10-K, filed March 30, 2012, and incorporated herein by reference). |
10.3 | Second Amendment to and Assignment and Assumption of Purchase Agreement, dated June 21, 2010, by and among FH Enterprises Inc., JBA Associates Inc., the four individual holders of all of JBA's voting securities, and Kingsway America Inc. (included as Exhibit 10.3 to the Form 10-K, filed March 30, 2012, and incorporated herein by reference). |
10.4 | Tax Benefit Preservation Plan Agreement, dated as of September 28, 2010, between Kingsway Financial Services Inc. and Computershare Investor Services Inc. (included as Exhibit 10.4 to the Form 10-K, filed March 30, 2012, and incorporated herein by reference). |
10.5 | Agreement and Plan of Merger, dated December 14, 2010, among JJR VI Acquisition Corp., Atlas Acquisition Corp., Kingsway Financial Services Inc., and American Insurance Acquisition Inc. (included as Exhibit 10.5 to the Form 10-K, filed March 30, 2012, and incorporated herein by reference). |
10.6 | Operating Agreement of Acadia GP, LLC dated March 16, 2011 (included as Exhibit 10.8 to the March 31, 2011 Form 10-Q, filed March 27, 2012, and incorporated herein by reference). |
10.7 | Stock Purchase Agreement dated March 30, 2011 between HRM Acquisition Corp. and Kingsway America Inc. (included as Exhibit 10.1 to the March 31, 2011 Form 10-Q, filed March 27, 2012, and incorporated herein by reference). |
10.8 | Senior Promissory Note dated March 30, 2011 issued by HRM Acquisition Corp. to Kingsway America Inc. (included as Exhibit 10.2 to the March 31, 2011 Form 10-Q, filed March 27, 2012, and incorporated herein by reference). |
10.9 | Junior Promissory Note dated March 30, 2011 issued by HRM Acquisition Corp to Kingsway America Inc. (included as Exhibit 10.3 to the March 31, 2011 Form 10-Q, filed March 27, 2012, and incorporated herein by reference). |
10.10 | Note Purchase Agreement dated March 30, 2011 between HRM Acquisition Corp. and United Property and Casualty Insurance Company (included as Exhibit 10.4 to the March 31, 2011 Form 10-Q, filed March 27, 2012, and incorporated herein by reference). |
10.11 | Promissory Note dated March 30, 2011 issued by HRM Acquisition Corp. to United Property and Casualty Insurance Company (included as Exhibit 10.5 to the March 31, 2011 Form 10-Q, filed March 27, 2012, and incorporated herein by reference). |
10.12 | Agreement of Limited Partnership dated March 30, 2011 between Acadia GP, LLC (in its capacity as a general partner of Acadia Acquisition Partners, L.P.) and limited partners (including United Property and Casualty Insurance Company) (included as Exhibit 10.6 to the March 31, 2011 Form 10-Q, filed March 27, 2012, and incorporated herein by reference). |
10.13 | Intercreditor Agreement dated March 30, 2011 between HRM Acquisition Corp. and Kingsway America Inc. (included as Exhibit 10.7 to the March 31, 2011 Form 10-Q, filed March 27, 2012, and incorporated herein by reference). |
10.14 | Subscription and Investment Representation Agreement dated March 30, 2011 (included as Exhibit 10.9 to the March 31, 2011 Form 10-Q, filed March 27, 2012, and incorporated herein by reference). |
10.15 | Management Services Agreement between United Insurance Management, L.C. and 1347 Advisors LLC, effective August 29, 2011 (included as Exhibit 10.1 to the September 30, 2011 Form 10-Q, filed March 27, 2012, and incorporated herein by reference). |
10.16 | Kingsway Financial Services Inc. 2013 Equity Incentive Plan (included as Schedule B to the Definitive Proxy Statement on Schedule 14A filed with the SEC on April 11, 2013, and incorporated herein by reference). * |
10.17 | Form of Subscription Agreement (included as Exhibit 10.1 to the Form 8-K, filed December 27, 2013, and incorporated herein by reference). |
10.18 | Registration Rights Agreement, dated February 3, 2014, by and among the Company and the other parties signatory thereto (included as Exhibit 10.2 to the Form 8-K, filed February 4, 2014, and incorporated herein by reference). |
128 | ||
KINGSWAY FINANCIAL SERVICES INC. | ||
10.19 | Kingsway America Inc. Employee Share Purchase Plan (included as Schedule B to the Definitive Proxy Statement on Schedule 14A filed with the SEC on April 30, 2014 and incorporated herein by reference). * |
10.20 | Agreement to Buyout and Release dated February 24, 2015 between 1347 Advisors LLC and 1347 Property Insurance Holdings, Inc. (included as Exhibit 10.1 to the Form 8-K, filed February 27, 2015, and incorporated herein by reference). |
10.21 | Stockholders’ Agreement, dated as of July 14, 2016, by and between CMC Industries, Inc., CMC Acquisition LLC and CRIC TRT Acquisition LLC (included as Exhibit 10.1 to Form 8-K, filed July 20, 2016, and incorporated herein by reference). |
10.22 | Management Services Agreement, dated as of July 14, 2016, by and between TRT LeaseCo, LLC and DGI-BNSF Corp. (included as Exhibit 10.2 to Form 8-K, filed July 20, 2016, and incorporated herein by reference). |
10.23 | TRT LeaseCo, LLC 4.07% Senior Secured Note, Due May 15, 2034 (included as Exhibit 10.3 to Form 10-Q, filed August 4, 2016, and incorporated herein by reference). |
10.24 | Deed of Trust, Security Agreement, Assignment of Leases and Rents and Fixture Filing Statement, dated as of March 12, 2015, from TRT LeaseCo, LLC to Malcolm Morris, as Deed of Trust Trustee for the benefit of Wells Fargo Bank Northwest, N.A., as trustee (included as Exhibit 10.4 to Form 10-Q, filed August 4, 2016, and incorporated herein by reference). |
10.25 | Lease between TRT LeaseCo, LLC, as Landlord, and BNSF Railway Company (f/k/a The Burlington Northern and Santa Fe Railway Company), as Tenant, dated as of June 1, 2014 (included as Exhibit 10.5 to Form 10-Q, filed August 4, 2016, and incorporated herein by reference). |
10.26 | Stock Purchase Agreement, dated as of November 9, 2016 by and between the Company and GrizzlyRock Institutional Value Partners, LP. (included as Exhibit 10.1 to Form 8-K, filed November 16, 2016, and incorporated herein by reference). |
10.27 | Stock Purchase Agreement, dated as of November 9, 2016 by and between the Company and W.H.I. Growth Fund Q.P., L.P. (included as Exhibit 10.2 to Form 8-K, filed November 16, 2016, and incorporated herein by reference). |
10.28 | Stock Purchase Agreement, dated as of November 9, 2016 by and between the Company and Yorkmont Capital Partners, LP. (included as Exhibit 10.3 to Form 8-K, filed November 16, 2016, and incorporated herein by reference). |
10.29 | Registration Rights Agreement, dated as of November 16, 2016 by and among the Company, GrizzlyRock Institutional Value Partners, LP and W.H.I. Growth Fund Q.P., L.P. (included as Exhibit 10.4 to Form 8-K, filed November 16, 2016, and incorporated herein by reference). |
10.30 | Registration Rights Agreement, dated as of November 16, 2016 by and between the Company and Yorkmont Capital Partners, LP. (included as Exhibit 10.5 to Form 8-K, filed November 16, 2016, and incorporated herein by reference). |
10.31 | Right of First Offer Agreement, dated as of November 16, 2016 by and between the Company and GrizzlyRock Institutional Value Partners, LP. (included as Exhibit 10.6 to Form 8-K, filed November 16, 2016, and incorporated herein by reference). |
10.32 | Right of First Offer Agreement, dated as of November 16, 2016 by and between the Company and W.H.I. Growth Fund Q.P., L.P. (included as Exhibit 10.7 to Form 8-K, filed November 16, 2016, and incorporated herein by reference). |
14 | Kingsway Financial Services Inc. Code of Business Conduct & Ethics (included as Exhibit 14 to the Form 10-K, filed March 30, 2012, and incorporated herein by reference). |
21 | Subsidiaries of Kingsway Financial Services Inc. |
23 | Consent of BDO USA, LLP |
31.1 | Certification of Chief Executive Officer pursuant to Rule 13a-14(a) of the Exchange Act |
31.2 | Certification of Chief Financial Officer pursuant to Rule 13a-14(a) of the Exchange Act |
32.1 | Certification of Chief Executive Officer pursuant to 18 U.S.C. Section 1350, as adopted pursuant to Section 906 of the Sarbanes-Oxley Act of 2002 |
129 | ||
KINGSWAY FINANCIAL SERVICES INC. | ||
32.2 | Certification of Chief Financial Officer pursuant to 18 U.S.C. Section 1350, as adopted pursuant to Section 906 of the Sarbanes-Oxley Act of 2002 |
101.INS | XBRL Instance Document |
101.SCH | XBRL Taxonomy Extension Schema |
101.CAL | XBRL Taxonomy Extension Calculation Linkbase |
101.DEF | XBRL Taxonomy Extension Definition Linkbase |
101.LAB | XBRL Taxonomy Extension Label Linkbase |
101.PRE | XBRL Taxonomy Extension Presentation Linkbase |
* Management contract or compensatory plan or arrangement.
130 | ||