Attached files
| file | filename |
|---|---|
| EX-32.1 - EX-32.1 - SMITH MICRO SOFTWARE, INC. | smsi-ex321_9.htm |
| EX-31.2 - EX-31.2 - SMITH MICRO SOFTWARE, INC. | smsi-ex312_7.htm |
| EX-31.1 - EX-31.1 - SMITH MICRO SOFTWARE, INC. | smsi-ex311_6.htm |
| EX-23.1 - EX-23.1 - SMITH MICRO SOFTWARE, INC. | smsi-ex231_8.htm |
| EX-21.1 - EX-21.1 - SMITH MICRO SOFTWARE, INC. | smsi-ex211_10.htm |
UNITED STATES
SECURITIES AND EXCHANGE COMMISSION
Washington, D.C. 20549
FORM 10-K
|
☒ |
ANNUAL REPORT PURSUANT TO SECTION 13 OR 15(d) OF THE SECURITIES EXCHANGE ACT OF 1934 |
For the fiscal year ended December 31, 2016
|
☐ |
TRANSITION REPORT PURSUANT TO SECTION 13 OR 15(d) OF THE SECURITIES EXCHANGE ACT OF 1934 |
For the transition period from __________ to __________
Commission File Number 01‑35525
SMITH MICRO SOFTWARE, INC.
(Exact name of registrant as specified in its charter)
|
Delaware |
|
33-0029027 |
|
(State or other jurisdiction of |
|
(I.R.S. Employer |
|
|
|
|
|
51 Columbia, Aliso Viejo, CA |
|
92656 |
|
(Address of principal executive offices) |
|
(Zip Code) |
Registrant's telephone number, including area code: (949) 362-5800
|
Common Stock, $.001 par value |
The NASDAQ Stock Market LLC |
|
(Title of each class) |
(Name of each exchange on which registered) |
Securities registered pursuant to Section 12(b) of the Act: Common Stock, $.001 par value
Securities registered pursuant to Section 12(g) of the Act: None
Indicate by check mark if the registrant is a well-known seasoned issuer, as defined in Rule 405 of the Securities Act. YES ☐ NO ☒
Indicate by check mark if the registrant is not required to file reports pursuant to Section 13 or 15(d) of the Securities Exchange Act of 1934 YES ☐ NO ☒
Indicate by check mark whether the registrant (1) has filed all reports required to be filed by Section 13 or 15(d) of the Securities Exchange Act of 1934 during the preceding 12 months (or for such shorter period that the registrant was required to file such reports), and (2) has been subject to such filing requirements for the past 90 days. YES ☒ NO ☐
Indicate by check mark whether the registrant has submitted electronically and posted on its corporate Web site, if any, every Interactive Data File required to be submitted and posted pursuant to Rule 405 of Regulation S-T during the preceding 12 months (or for such shorter period that the registrant was required to submit and post such files). YES ☒ NO ☐
Indicate by check mark if disclosure of delinquent filers pursuant to Item 405 of Regulation S-K is not contained herein, and will not be contained, to the best of registrant's knowledge, in definitive proxy or information statements incorporated by reference in Part III of this Form 10-K or any amendment to this Form 10‑K ☐
Indicate by check mark if whether the registrant is a large accelerated filer, an accelerated filer, or a non-accelerated filer. See definition of “accelerated filer and large accelerated filer” in Rule 12b-2 of the Exchange Act. (Check one):
|
Large accelerated filer |
☐ |
Accelerated filer |
☐ |
|
|
|
|
|
|
Non-accelerated filer |
☐ (Do not check if a smaller reporting company) |
Smaller reporting company |
☒ |
Indicate by check mark whether the registrant is a shell company (as defined in Rule 12b-2 of the Act). YES ☐ NO ☒
As of June 30, 2016, the last business day of the registrant’s most recently completed second quarter, the aggregate market value of the common stock of the registrant held by non-affiliates was $23,624,604 based upon the closing sale price of such stock as reported on the Nasdaq Capital Market on that date. For purposes of such calculation, only executive officers, board members, and beneficial owners of more than 10% of the registrant’s outstanding common stock are deemed to be affiliates.
As of March 3, 2017, there were 12,289,174 shares of common stock outstanding.
DOCUMENTS INCORPORATED BY REFERENCE
Portions of the registrant’s Proxy Statement for the 2017 Annual Meeting of Stockholders to be filed under the Securities Exchange Act of 1934 are incorporated by reference in Part III of this report.
2016 ANNUAL REPORT ON FORM 10-K
TABLE OF CONTENTS
|
|
|
|
|
|
|
|
|
|
|
|
|
Item 1. |
|
|
4 |
|
|
|
|
|
|
|
|
Item 1A. |
|
|
10 |
|
|
|
|
|
|
|
|
Item 1B. |
|
|
19 |
|
|
|
|
|
|
|
|
Item 2. |
|
|
19 |
|
|
|
|
|
|
|
|
Item 3. |
|
|
19 |
|
|
|
|
|
|
|
|
Item 4. |
|
|
19 |
|
|
|
|
|
|
|
|
|
|
|
|
|
|
|
|
|
|
|
|
Item 5. |
|
|
20 |
|
|
|
|
|
|
|
|
Item 6. |
|
|
24 |
|
|
|
|
|
|
|
|
Item 7. |
|
MANAGEMENT'S DISCUSSION AND ANALYSIS OF FINANCIAL CONDITION AND RESULTS OF OPERATIONS |
|
26 |
|
|
|
|
|
|
|
Item 7A. |
|
|
39 |
|
|
|
|
|
|
|
|
Item 8. |
|
|
39 |
|
|
|
|
|
|
|
|
Item 9. |
|
CHANGES IN AND DISAGREEMENTS WITH ACCOUNTANTS ON ACCOUNTING AND FINANCIAL DISCLOSURE |
|
39 |
|
|
|
|
|
|
|
Item 9A. |
|
|
39 |
|
|
|
|
|
|
|
|
Item 9B. |
|
|
40 |
|
|
|
|
|
|
|
|
|
|
|
|
|
|
|
|
|
|
|
|
Item 10. |
|
|
41 |
|
|
|
|
|
|
|
|
Item 11. |
|
|
42 |
|
|
|
|
|
|
|
|
Item 12. |
|
SECURITY OWNERSHIP OF CERTAIN BENEFICIAL OWNERS AND MANAGEMENT AND RELATED STOCKHOLDER MATTERS |
|
43 |
|
|
|
|
|
|
|
Item 13. |
|
CERTAIN RELATIONSHIPS AND RELATED TRANSACTIONS, AND DIRECTOR INDEPENDENCE |
|
43 |
|
|
|
|
|
|
|
Item 14. |
|
|
43 |
|
|
|
|
|
|
|
|
|
|
|
|
|
|
|
|
|
|
|
|
Item 15. |
|
|
44 |
|
|
|
|
|
|
|
|
|
|
|
48 |
2
SPECIAL NOTE REGARDING FORWARD LOOKING STATEMENTS
In this document, the terms “Smith Micro,” “Company,” “we,” “us,” and “our” refer to Smith Micro Software, Inc. and, where appropriate, its subsidiaries.
This report contains forward-looking statements regarding Smith Micro which include, but are not limited to, statements concerning our ability to remain a going concern, our ability to raise more funds, customer concentration, projected revenues, expenses, gross profit and income, the competitive factors affecting our business, market acceptance of products, the success and timing of new product introductions, and the protection of our intellectual property. These forward-looking statements are based on our current expectations, estimates and projections about our industry, management's beliefs, and certain assumptions made by us. Words such as “anticipates,” “expects,” “intends,” “plans,” “predicts,” “potential,” “believes,” “seeks,” “estimates,” “should,” “may,” “will,” and variations of these words or similar expressions are intended to identify forward-looking statements. Forward-looking statements also include the assumptions underlying or relating to any of the foregoing statements. These statements are not guarantees of future performance and are subject to risks, uncertainties, and assumptions that are difficult to predict. Therefore, our actual results could differ materially and adversely from those expressed or implied in any forward-looking statements as a result of various factors. Such factors include, but are not limited to, the following:
|
|
• |
our ability to remain a going concern; |
|
|
• |
our ability to raise additional capital to fund our operations and such capital may not be available to us at commercially reasonable terms or at all; |
|
|
• |
our customer concentration given that the majority of our sales depend on a few large client relationships, including Sprint; |
|
|
• |
our ability to become and remain profitable; |
|
|
• |
our quarterly revenues and operating results are difficult to predict and could fall below analyst or investor expectations, which could cause the price of our common stock to fall; |
|
|
• |
changes in demand for our products from our key customers and their end users; |
|
|
• |
the intensity of the competition and our ability to successfully compete; |
|
|
• |
the pace at which the market for new products develop; |
|
|
• |
our ability to hire and retain key personnel; |
|
|
• |
the availability of third party intellectual property and licenses which may not be on commercially reasonable terms, or not at all; |
|
|
• |
our ability to establish and maintain strategic relationships with our customers; |
|
|
• |
our ability to assimilate acquisitions without diverting management attention and impacting current operations; |
|
|
• |
our ability to protect our intellectual property and our ability to not infringe on the rights of others; |
|
|
• |
security and privacy breaches in our systems may damage client relations and inhibit our ability to grow; |
|
|
• |
interruptions or delays in the services we provide from our data center hosting facilities could harm our business; and |
|
|
• |
the risk of being delisted from NASDAQ if we fail to meet any of the listing requirements; |
|
|
• |
those additional factors which are listed under the section “1A. Risk Factors,” beginning on page 10 of this report. |
The forward-looking statements contained in this report are made on the basis of the views and assumptions of management regarding future events and business performance as of the date this report is filed with the Securities and Exchange Commission (the “SEC”). We do not undertake any obligation to update these statements to reflect events or circumstances occurring after the date this report is filed.
3
General
Smith Micro develops software to simplify and enhance the mobile experience, providing solutions to leading wireless service providers, device manufacturers, and enterprise businesses around the world. From optimizing wireless networks to uncovering customer experience insights, and from streamlining Wi-Fi access to ensuring family safety, our solutions enrich connected lifestyles while creating new opportunities to engage consumers via smartphones. Our portfolio also includes a wide range of products for creating, sharing, and monetizing rich content, such as visual messaging, video streaming, and 2D/3D graphics applications. With this as a focus, it is Smith Micro’s mission to help our customers thrive in a connected world.
Over the past three decades, Smith Micro has developed deep expertise in embedded software for mobile devices, policy-based management platforms, and highly-scalable client and server applications. Tier 1 mobile network operators, cable providers, OEMs/device manufacturers, and enterprise businesses across a wide range of industries use our software to capitalize on the growth of connected consumers and the Internet of Things (“IoT”).
In general, we help our customers:
|
|
• |
Optimize networks, reduce operational costs, and deliver “best-connected” user experiences; |
|
|
• |
Manage mobile devices over-the-air for maximum performance, efficiency, reliability and cost-effectiveness; |
|
|
• |
Provide greater insight into the mobile user experience to improve service quality and customer loyalty; |
|
|
• |
Engage and grow high-value relationships with their customers using smartphones. |
We continue to innovate and evolve our business to take advantage of industry trends and opportunities in emerging markets, such as “Big Data” analytics, the explosion of Wi-Fi hotspots, and business-to-consumer (“B2C”) mobile marketing and advertising. The key to our longevity, however, is not simply technology innovation, but a never-ending focus on customer value.
During fiscal year 2016, we experienced a significant decrease in our revenues primarily due to our largest customer, Sprint, terminating a contract for one of our products. Even with our two acquisitions and the pipeline of new potential deals, our revenues have been slow to materialize. As such, we had to implement a significant restructuring plan during the fourth quarter of fiscal year 2016. We also impaired one of our acquired intangible assets.
We have continued to restructure during the first fiscal quarter of 2017 in order to align our expenses with our current short-term revenue projections. Overall, we have reduced our quarterly expenses by approximately $3.5 million.
The Company was incorporated in California in November 1983, and reincorporated in Delaware in June 1995. Our principal executive offices are located at 51 Columbia, Aliso Viejo, California 92656. Our telephone number is (949) 362-5800. Our website address is www.smithmicro.com. Our NASDAQ symbol is SMSI, and we make our SEC filings available on the Investor Relations page of our website. Information contained on our website is not part of this Annual Report on Form 10-K.
Business Segments
Our business is focused on two industry segments: Wireless and Graphics. We do not separately allocate operating expenses, nor do we allocate specific assets to these segments. Therefore, segment information reported includes only revenues and cost of revenues. See Note 8 of Notes to Consolidated Financial Statements for financial information related to our business segments and geographical information.
4
The wireless industry continues to undergo rapid change on all fronts, from the ubiquity of Wi-Fi and cellular networks, to the vast array of connected devices, mobile applications, and digital content consumed by users who want information and entertainment anytime, anywhere. While most of us think about being “connected” in terms of computers, tablets and smartphones, the IoT is creating a world where almost anything can be connected to the wireless internet. In addition, pervasive connectivity has changed the way business operates on small and grand scales. For example, Wi-Fi hotspots are being deployed by neighborhood bookstores and coffee houses to keep customers on premise longer, as well as by large sports arenas to deliver real-time video feeds via social networks and online broadcasts. Retailers are now spending more than 50% of their advertising budgets on mobile media, and targeting for those advertisements is driven by “Big Data” initiatives that collect consumer information from virtually every online or mobile interaction.
Although there are numerous business opportunities associated with pervasive connectivity, there are also many challenges:
|
- |
Complexity, congestion, and spectrum scarcity plague wireless networks, making it difficult and expensive to satisfy the demand for mobile services by consumers and businesses. |
|
- |
Mobile Network Operators (“MNO”) are being marginalized by over-the-top messaging applications and face growing competitive pressure from Cable/Multiple Service Operators (“MSO”) and others deploying Wi-Fi networks to attract mobile users. |
|
- |
Enterprises face increasing pressure to mobilize workforces, operations, and customer engagement, but lack the expertise and technologies needed to leverage mobile securely and cost-effectively. |
|
- |
Consumers – frustrated by slow, congested mobile networks and inconsistent device/app behavior – seek simpler network access and more personalized mobile experiences, while simultaneously demanding faster, cheaper, and more secure wireless services. |
To address these challenges, Smith Micro offers multi-platform, modular solutions organized into three product families:
NetWise® – NetWise® is a policy-on-device platform that optimizes wireless Quality of Experience (“QoE”) and enhances mobile customer engagement. Addressing challenges central to today's mobile lifestyle such as connection and network traffic management, context-driven mobile engagement, Wi-Fi discovery, credential provisioning, user authentication and radio management, NetWise is a proven carrier-grade solution for wireless and cable network operators, device manufacturers, OEMs, and enterprises.
CommSuite® – CommSuite Visual Voicemail by Smith Micro Software is voicemail, redefined. Gone are the days where consumers can be bothered to manually listen to voicemail on their smartphones. Today’s mobile users want every service on-demand, including voicemail. CommSuite Visual Voicemail quickly and easily allows users to manage voice messages just like email or SMS – with reply, forwarding and social sharing options. Smith Micro’s services feature multi-language Voice-to-Text transcription messaging, which enables discreet message consumption for users by reading versus listening. For operators, CommSuite Visual Voicemail turns traditional voicemail into a profitable, modern service.
SafePath™ - SafePath Family is a next-generation location tracking and parental controls platform that enables mobile operators to provide comprehensive family safety functionalities to their subscribers as a white-labeled value-added service. The SafePath Family feature set includes real-time location tracking and location-based notifications, geo-fencing, family-wide panic alerts, parental device controls and content blocking, phone security and support for wearable devices. With the SafePath Family solution, mobile operators can boost subscriber loyalty and engagement, while increasing average revenue per user.
5
4D App Studio™ - With millions of mobile apps available in the market today, differentiation is an acute challenge. Smith Micro addresses this need with our 4D App Studio, which offers complete mobile app design and development services that accelerate app time-to-market and mobilizes products and services. Smith Micro’s team of experts know first-hand that for a mobile app to be successful in the long term it must align with your business goals, deliver a complete and unique mobile experience, obtain maximum exposure and be ubiquitous across all devices. From initial ideation and business case mapping to long-term app maintenance and support, the 4D App Studio team has launched more than 30 unique mobile experiences for clients around the world across Android, iOS and Windows operating environments.
QuickLink® – Our QuickLink connection managers have shipped on more than 100 million devices worldwide, forming the foundation of our heritage as the leader in mobile connectivity. Many of the world’s largest mobile network operators, including AT&T, Bell Canada, Orange, Sprint, T-Mobile, Verizon Wireless, and Vodafone, have deployed QuickLink as a white-label connection management application to their subscribers. Leading chipset manufacturers and module makers embed QuickLink components to ensure that connectivity is consistent across all device types. In addition, enterprises and public sector organizations with mobile work forces leverage QuickLink to provide enhanced security and configurability over public and private wireless networks.
Through our broad software portfolio, Smith Micro offers exceptional expertise in mobile platforms, integration to operator networks, and wireless industry standards. Our powerful efficient on-device expert system and analytics are the perfect complements to the “Big Data” and mobile marketing initiatives driving most customer acquisition and loyalty programs today. Further, our ability to customize solutions and accelerate time to market for mobile services, while meeting stringent reliability and security requirements, makes us a leading choice for any company that wants to deliver more with mobile.
Graphics
The Graphics group develops a variety of software, including graphic design and animation, and compression and PC/Mac utilities, for consumers, professional artists, and educators. These products are available through direct sales on Smith Micro websites (smithmicro.com, mysmithmicro.com and contentparadise.com), as well as through affiliate websites, resellers, and retail outlets.
The three main products in this area of Smith Micro’s business include Poser®, Moho™ (formerly Anime Studio®), and Clip Studio Paint ® (formerly Manga Studio®). These products are aimed at digital artists and designers of all skill levels, helping them to produce professional quality animations, comics, illustrations, and other 2D and 3D designs. Poser is widely used for 3D human figure design and animation, as well as for creating photorealistic images for a variety of industries. Moho is used by both hobbyists and professional artists working for high-end animation studios in the motion picture industry, and Clip Studio Paint is the leading software for comic illustration and manga creation, used by famous graphic novelists such as Dave Gibbons, the author of New York Times Bestseller “Watchmen.”
6
Our primary products consist of the following:
|
Business Segment |
|
Products |
|
Description |
|
|
|
|
|
|
|
Wireless |
|
NetWise® Director |
|
Intelligent traffic management for data offload and seamless, secure access to 3G/4G/Wi-Fi networks |
|
|
|
|
|
|
|
|
|
NetWise® SmartSpot |
|
Wi-Fi discoverability, promotion, and automated authentication |
|
|
|
|
|
|
|
|
|
NetWise® Captivate |
|
Mobile marketing platform that uses real-time conditions, events, location, and analytics to better engage customers |
|
|
|
|
|
|
|
|
|
NetWise® OMC |
|
Open Management Client for OMA-DM standards-based device management |
|
|
|
|
|
|
|
|
|
NetWise® FOTA |
|
Lightweight device agent and deployment server for updating Firmware Over The Air (“FOTA”) |
|
|
|
|
|
|
|
|
|
NetWise® I/O |
|
A toolkit for testing client/server interoperability using the ANDSF networking standard |
|
|
|
|
|
|
|
|
|
NetWise Device Management™ |
|
An end-to-end device management platform for fault & diagnostics management, device provisioning, device configuration, and firmware/software updates |
|
|
|
|
|
|
|
|
|
NetWise Optics™ |
|
A mobile analytics solution that uncovers performance blind spots and optimize network quality |
|
|
|
|
|
|
|
|
|
NetWise Passport™ |
|
An automated onboarding and Wi-Fi service provisioning solution |
|
|
|
|
|
|
|
|
|
|
|
|
|
|
|
|
|
|
|
|
|
CommSuite® VVM |
|
Visual Voicemail (“VVM”) delivered directly to a mobile phone app and managed like email |
|
|
|
|
|
|
|
|
|
CommSuite® VTT |
|
Voice-to-Text (“VTT”) transcription of voicemail and voice SMS messages |
|
|
|
|
|
|
|
|
|
CommSuite® AniMates® |
|
Talking avatars that let users lip-synch a message with voice effects, backgrounds, stickers, and photos to personalize mobile communications |
|
|
|
|
|
|
|
|
|
CommSuite® VIDIO Prime® |
|
Adaptive streaming of live or pre-recorded video content to support mobile viewing across laptops, tablets, phones, TVs, and more |
|
|
|
|
|
|
|
|
|
SafePath Family™ |
|
Real-time family location tracking app with easy to use parental controls and supports wearables such as GPS wristwatches and backpack locators |
|
|
|
|
|
|
|
|
|
4D App Studio™ |
|
Design and development service to customize mobile apps |
|
|
|
|
|
|
|
|
|
QuickLink® Mobile |
|
Connection management application to control, customize, and automate wireless connections from PCs and Macs to WWAN and WLAN/Wi-Fi networks |
|
|
|
|
|
|
|
|
|
QuickLink® Mobility |
|
Mobile VPN and connection manager targeted to enterprises with mobile workforces, as well as the public sector |
|
|
|
|
|
|
|
|
|
QuickLink® Zero |
|
Streamlined connectivity for mobile hotspot features on smartphones and mobile broadband devices, with billing integration, automated diagnostics, usage metering, and data management |
7
|
Business Segment |
|
Products |
|
Description |
|
|
|
|
|
|
|
|
|
|
|
|
|
|
|
QuickLink® MBIM Middleware |
|
Customizable drivers that support the Mobile Broadband Interface Model (“MBIM”) standard for connecting USB devices to a variety of operating systems |
|
|
|
|
|
|
|
Graphics |
|
Poser® |
|
3D rendering and animation software for photorealistic characters, art, illustration, and digital design |
|
|
|
|
|
|
|
|
|
Moho™ |
|
Complete 2D animation program for creating movies, cartoons, anime, and cut out animations |
|
|
|
|
|
|
|
|
|
Clip Studio Paint® |
|
Comic illustration software for creating manga, comic art, and graphic novels |
|
|
|
|
|
|
|
|
|
MotionArtist™ |
|
A fast, easy solution for creating animatics and interactive presentations |
|
|
|
|
|
|
|
|
|
StuffIt Deluxe® |
|
A patented, lossless compression solution for documents and media |
|
|
|
|
|
|
|
|
|
Sock Puppets™ |
|
iOS app to create lip-synched cartoons and share them on Facebook and YouTube |
|
|
|
|
|
|
|
|
|
AniMates™ Stickers |
|
A series of characters (sold as sticker packs) for mobile messaging for iOS iMessage Store |
Marketing and Sales Strategy
Because of our broad product portfolio, deep integration experience, and flexible business models, we can quickly bring to market innovative solutions that support our customers’ needs to create new revenue opportunities and differentiate their products and services among their competitors.
Our marketing and sales strategy is as follows:
Leverage Operator and OEM Relationships. We continue to capitalize on our strong relationships with the world’s leading mobile network operators, multiple service operators, and device manufacturers. These customers serve as our primary distribution channel, providing access to hundreds of millions of end users around the world.
Focus on High-Growth Markets. We continue to focus on mobile marketing, analytics/Big Data, premium messaging services, and wireless connectivity taking advantage of expanding 4G and Wi-Fi networks, as well as the explosive growth of smartphones, tablets, and IoT devices.
Expand our Customer Base. In addition to growing business with current customers, we are increasing penetration of the enterprise market, with particular focus on large B2C companies, such as retail, brands, banking, and hospitality, as well as industrial IoT companies deploying connected devices.
Key Revenue Contributors
Revenues from Sprint and their respective affiliates in the Wireless business segment accounted for 62.6% of the Company’s total revenues for the fiscal year 2016. Revenues from FastSpring in the Graphics business segment accounted for 13.5% of the Company’s total revenues for the fiscal year 2016. Revenues to Sprint and their respective affiliates in the Wireless business segment accounted for 65.4% of the Company’s total revenues for the fiscal year 2015. Revenues to FastSpring in the Graphics business segment accounted for 11.3% of the Company’s total revenues for the fiscal year 2015. Revenues to Sprint and their respective affiliates in the Wireless business segment accounted for 68.0% of the Company’s total revenues for the fiscal year 2014. Revenues to FastSpring in the Graphics business segment accounted for 11.2% of the Company’s total revenues for the fiscal year 2014. Our major customers could reduce their orders of our products in favor of a competitor's product or for any other reason.
8
The loss of any of our major customers or decisions by a significant customer to substantially reduce purchases could have a material adverse effect on our business.
Customer Service and Technical Support
We provide technical support and customer service through our online knowledge base, via email, and live chat. OEM customers generally provide their own primary customer support functions and rely on us for support to their own technical support personnel.
Product Development
The software industry, particularly the wireless market, is characterized by rapid and frequent changes in technology and user needs. We work closely with industry groups and customers, both current and potential, to help us anticipate changes in technology and determine future customer needs. Software functionality depends upon the capabilities of the hardware. Accordingly, we maintain engineering relationships with various hardware manufacturers and we develop our software in tandem with their product development. Our engineering relationships with manufacturers, as well as with our major customers, are central to our product development efforts. We remain focused on the development and expansion of our technology, particularly in the wireless space. Research and development expenditures amounted to $15.9 million, $13.9 million, and $14.2 million for the years ended December 31, 2016, 2015, and 2014, respectively.
Manufacturing
Manufacturing is for our Graphics physical products. Our product development group produces a product master for each product that is then duplicated and packaged into products by the manufacturing organization. All product components are purchased by our personnel in our Aliso Viejo, California facility. Our manufacturing is subcontracted to outside vendors and includes the replication of CD-ROMs and the printing of documentation materials. Assembly of the final package is completed by our Aliso Viejo, California facility.
Competition
The markets in which we operate are highly competitive and subject to rapid changes in technology. These conditions create new opportunities for Smith Micro, as well as for our competitors, and we expect new competitors to enter the market. We will not only compete with other software vendors for new customer contracts, we will also compete to acquire technology and qualified personnel.
We believe that the principal competitive factors affecting the mobile software market include domain expertise, product features, usability, quality, price, customer service, and effective sales and marketing efforts. Although we believe that our products currently compete favorably with respect to these factors, there can be no assurance that we can maintain our competitive position against current and potential competitors. We also believe that the market for our software products has been and will continue to be characterized by significant price competition. A material reduction in the price of our products could negatively affect our profitability.
Many existing and potential customers have the resources to develop products that compete directly with our products. As such, these customers may opt to discontinue the purchase of our products in the future. With this as background, our future performance is substantially dependent upon the extent to which existing customers elect to purchase software from us rather than design and develop their own software.
Proprietary Rights and Licenses
Our success and ability to compete is dependent upon our software code base, our programming methodologies and our other intellectual properties. To protect our proprietary technology and intellectual property, we rely on a combination of trade secrets, nondisclosure agreements, patents, copyright and trademark law that may afford only limited protection. As of December 31, 2016, we owned 93 issued U.S. patents. These patents are intended to
9
provide generalized protection of our intellectual property technology base and we will continue to apply for various patents and trademarks in the future as we deem necessary to protect our intellectual property technology base.
We seek to avoid unauthorized use and disclosure of our proprietary intellectual property by requiring employees and consultants with access to our proprietary information to execute confidentiality agreements with us and by restricting access to our source code. The deterrent steps that we have taken to protect our proprietary technology may not be adequate to deter misappropriation of our proprietary information or prevent the successful assertion of any adverse claim against us relating to software or intellectual property utilized by us. In addition, we may not be able to detect unauthorized use of our intellectual property rights or take effective steps to enforce those rights.
In selling our products, we primarily rely on “shrink wrap” licenses that are not signed by licensees and may be unenforceable under the laws of certain jurisdictions. In addition, the laws of some foreign countries do not protect our proprietary rights to as great an extent as do the laws of the United States. Accordingly, the means we currently use to protect and enforce all of our proprietary rights and intellectual property rights may not be adequate. Moreover, our competitors may independently develop competitive technology similar to ours. We also license technology on a non‑exclusive basis from several companies for inclusion in our products and anticipate that we will continue to do so in the future. If we are unable to continue to license these technologies or to license other necessary technologies for inclusion in our products, or such third party technologies become subject to claims directed to or against the third party technologies used by us, or if we experience substantial increases in royalty payments under these third party licenses, our business could be materially and adversely affected.
Employees
As of December 31, 2016, we had a total of 173 employees within the following departments: 109 in engineering, 28 in sales and marketing, 13 in operations and customer support, and 23 in management and administration. We are not subject to any collective bargaining agreement and we believe that our relationships with our employees are good.
Our future operating results are highly uncertain. Before deciding to invest in our common stock or to maintain or increase your investment, you should carefully consider the risks described below, in addition to the other information contained in this report and in our other filings with the SEC, including our reports on Forms 10-K, 10-Q and 8-K. The risks and uncertainties described below are not the only ones we face. Additional risks and uncertainties not presently known to us or that we currently deem immaterial may also affect our business operations. If any of these risks actually occur, our business, financial condition or results of operations could be seriously harmed. In that event, the market price for our common stock could decline and you may lose all or part of your investment.
If we are unable to meet our obligations as they become due over the next twelve months, the Company may not be able to continue as a going concern.
We currently believe that we will be able to meet our financial obligations as they become due over the next twelve months from the issuance date, primarily as a result of our current working capital levels, recent restructurings (which reduced our breakeven level of cash revenues to approximately $7.0 million), our current financial projections, and our ability to secure short-term loans when necessary.
Our ability to continue as a going concern is substantially dependent upon these factors. If our current financial and cash flow projections become unfavorable compared to our internal plans, we may need to consider additional actions to mitigate conditions or events that would raise substantial doubt about its ability to continue as a going concern, including the following:
|
|
• |
Raise additional capital through short-term loans. |
|
|
• |
Implement additional restructuring and cost reductions. |
|
|
• |
Raise additional capital through a private placement. |
10
|
|
• |
Dispose of one or more product lines. |
|
|
• |
Sell or license intellectual property. |
Should our going concern assumption not be appropriate and we are not able to continue in the normal course of operations, adjustments would be required to our consolidated financial statements to the amounts and classifications of assets and liabilities, and these adjustments could be significant. Our consolidated financial statements do not reflect the adjustments or reclassifications of assets and liabilities that would be necessary if we are unable to continue as a going concern.
We may raise additional capital through the issuance of additional equity or convertible debt securities or by borrowing money, in order to meet our capital needs. Additional funds may not be available on terms acceptable to us to allow us to meet our capital needs.
We believe that the cash and cash equivalents and the cash we expect to generate from operations and short-term borrowings will be sufficient to meet our capital needs for at the next twelve months from the issuance date. However, it is possible that we may need or choose to obtain additional financing to fund our activities in the future. We could raise these funds by selling more stock to the public or to selected investors, or by borrowing money. We may not be able to obtain additional funds on favorable terms, or at all. If adequate funds are not available, we may be required to curtail our operations or other business activities significantly or to obtain funds through arrangements with strategic partners or others that may require us to relinquish rights to certain technologies or potential markets.
In February 2017, we filed a shelf registration statement with the SEC to sell from time to time additional shares of our common stock in one or more offerings in amounts, at prices and on the terms that we will determine at the time of offering. If we raise additional funds by issuing additional equity or convertible debt securities (whether in a public offering or private placement), the ownership percentages of existing stockholders would be reduced. In addition, the equity or debt securities that we issue may have rights, preferences, or privileges senior to those of the holders of our common stock. We currently have no established line of credit or other business borrowing facility in place.
It is possible that our future capital requirements may vary materially from those now planned. The amount of capital that we will need in the future will depend on many factors, including:
|
|
• |
the market acceptance of our products; |
|
|
• |
the levels of promotion and advertising that will be required to launch our products and achieve and maintain a competitive position in the marketplace; |
|
|
• |
our business, product, capital expenditure, and research and development plans and product and technology roadmaps; |
|
|
• |
the levels of working capital that we maintain; |
|
|
• |
capital improvements to new and existing facilities; |
|
|
• |
technological advances; |
|
|
• |
our competitors’ response to our products; and |
|
|
• |
our relationships with suppliers and customers. |
In addition, we may raise additional capital to accommodate planned growth, hiring, and infrastructure needs or to consummate acquisitions of other businesses, products or technologies.
11
We derive a significant portion of our revenues from sales of a small number of products to Sprint, so our revenues and operating results are highly vulnerable to shifts in demand and may decline.
In our Wireless business segment, we sell primarily to large carriers, cable operators, and original equipment manufacturers (“OEMs”), so there are a limited number of actual and potential customers for our products, resulting in customer concentration for sales of our products and services. For the year ended December 31, 2016, sales to Sprint and their affiliates comprised 62.6% of our total revenues. Sprint has been going through several cost reduction and restructurings over the past several years, the latest being their announcement to reduce expenses by two billion dollars in 2016. As such, our revenues with Sprint were down 32% in 2016 versus 2015.
Because of our customer concentration, this carrier and other large customers may have significant pricing power over us, and any material decrease in sales to any of them would materially affect our revenues and profitability. Additionally, carriers, cable operators, and OEMs are not the end users of our products. If any of their efforts to market products and services incorporating our software are unsuccessful in the marketplace, our revenues and profitability could be adversely affected.
We also derive a significant portion of our revenues from a few vertical markets, such as wireless carriers, cable operators, and handset manufacturers. In order to sustain and grow our business, we must continue to sell our software products in these vertical markets. Shifts in the dynamics of these vertical markets, such as new product introductions by our competitors, could materially harm our results of operations, financial condition and prospects. To increase our sales outside our core vertical markets, for example to large enterprises, requires us to devote time and resources to hire and train sales employees familiar with those industries. Even if we are successful in hiring and training sales teams, customers in other vertical markets may not need or sufficiently value our current products or new product introductions.
The Company has a history of net losses, may incur substantial net losses in the future, and may not achieve profitability.
We have undertaken recent restructurings to reduce our expenses to be more in line with our current revenues and revenue projections. However, if our revenues do not increase in the future, we will likely need to undertake further restructurings and operating losses will likely continue, and we may not be able to achieve profitability in the foreseeable future.
If there are delays in the distribution of our products or if customer negotiations for our new products cannot occur on a timely basis, we may not be able to generate revenues sufficient to meet the needs of the business in the foreseeable future or at all.
Our quarterly revenues and operating results are difficult to predict and could fall below analyst or investor expectations, which could cause the price of our common stock to fall.
Our quarterly revenues and operating results have fluctuated significantly in the past and may continue to vary from quarter to quarter due to a number of factors, many of which are not within our control. If our operating results do not meet the expectations of securities analysts or investors, our stock price may decline. Fluctuations in our operating results may be due to a number of factors, including the following:
|
|
• |
the gain or loss of a key customer; |
|
|
• |
the size and timing of orders from and shipments to our major customers; |
|
|
• |
the size and timing of any product return requests; |
|
|
• |
our ability to maintain or increase gross margins; |
|
|
• |
variations in our sales channels or the mix of our product sales; |
|
|
• |
our ability to anticipate market needs and to identify, develop, complete, introduce, market and produce new products and technologies in a timely manner to address those needs; |
12
|
|
• |
the availability and pricing of competing products and technologies and the resulting effect on sales and pricing of our products; |
|
|
• |
acquisitions; |
|
|
• |
the effect of new and emerging technologies; |
|
|
• |
the timing of acceptance of new mobile services by users of our customers’ services; |
|
|
• |
deferrals of orders by our customers in anticipation of new products, applications, product enhancements or operating systems; and |
|
|
• |
general economic and market conditions. |
We have difficulty predicting the volume and timing of orders. In any given quarter, our sales have involved, and we expect will continue to involve, large financial commitments from a relatively small number of customers. As a result, the cancellation or deferral of even a small number of orders would reduce our revenues, which would adversely affect our quarterly financial performance. Also, we have often recorded a large amount of our sales in the last month of the quarter and often in the last week of that month. Accordingly, delays in the closing of sales near the end of a quarter could cause quarterly revenues to fall substantially short of anticipated levels. Significant sales may also occur earlier than expected, which could cause operating results for later quarters to compare unfavorably with operating results from earlier quarters.
Future orders may come from new customers or from existing customers for new products. The sales cycles may be greater than what we have experienced in the past, increasing the difficulty to predict quarterly revenues.
Because we sell primarily to large carriers, cable/MSOs and OEM customers, we have no direct relationship with most end users of our products. This indirect relationship delays feedback and blurs signals of change in the quick-to-evolve wireless ecosystem, and is one of the reasons we have difficulty predicting demand.
A large portion of our operating expenses, including rent, depreciation and amortization, is fixed and difficult to reduce or change. Accordingly, if our total revenue does not meet our expectations, we may not be able to adjust our expenses quickly enough to compensate for the shortfall in revenue. In that event, our business, financial condition, and results of operations would be materially and adversely affected.
Due to all of the foregoing factors, and the other risks discussed in this report, you should not rely on quarter-to-quarter comparisons of our operating results as an indication of future performance.
Technology and customer needs change rapidly in our market, which could render our products obsolete and negatively affect our business, financial condition and results of operations.
Our success depends on our ability to anticipate and adapt to changes in technology and industry standards. We will also need to continue to develop and introduce new and enhanced products to meet our target markets’ changing demands, keep up with evolving industry standards, including changes in the Microsoft, Google, and Apple operating systems with which our products are designed to be compatible, and to promote those products successfully. The communications and graphics software markets in which we operate are characterized by rapid technological change, changing customer needs, frequent new product introductions, evolving industry standards, and short product life cycles. In addition, the technology we market, which has been sold as software in the past, can be integrated at the chipset level by the leading mobile chipset manufacturers. Any of these factors could render our existing products obsolete and unmarketable. In addition, new products and product enhancements can require long development and testing periods as a result of the complexities inherent in today’s computing environments and the performance demanded by customers and called for by evolving wireless networking technologies. If our target markets do not develop as we anticipate, our products do not gain widespread acceptance in these markets, or we are unable to develop new versions of our software products that can operate on future wireless networks and PC and mobile device operating systems and interoperate with other popular applications, our business, financial condition and results of operations could be materially and adversely affected.
13
Competition within our target markets is intense and includes numerous established competitors and new entrants, which could negatively affect our revenues and results of operations.
We operate in markets that are extremely competitive and subject to rapid changes in technology. Because there are low barriers to entry into the software markets in which we participate and may participate in the future, we expect significant competition to continue from both established and emerging software companies in the future, both domestic and international. In fact, our growth opportunities in new product markets could be limited to the extent established and emerging software companies enter or have entered those markets. Furthermore, our existing and potential OEM customers may acquire or develop products that compete directly with our products.
Many of our other current and prospective competitors have significantly greater financial, marketing, service, support, technical and other resources than we do. As a result, they may be able to adapt more quickly than we can to new or emerging technologies and changes in customer requirements or to devote greater resources to the promotion and sale of their products. Announcements of competing products by competitors could result in the cancellation of orders by customers in anticipation of the introduction of such new products. In addition, some of our competitors are currently making complementary products that are sold separately. Such competitors could decide to enhance their competitive position by bundling their products to attract customers seeking integrated, cost-effective software applications. Some competitors have a retail emphasis and offer OEM products with a reduced set of features. The opportunity for retail upgrade sales may induce these and other competitors to make OEM products available at their own cost or even at a loss. We also expect competition to increase as a result of software industry consolidations, which may lead to the creation of additional large and well-financed competitors. Increased competition is likely to result in price reductions, fewer customer orders, reduced margins, and loss of market share.
We are entering new, emerging markets in which we have limited experience; if these markets do not develop or we are unable to otherwise succeed in them, our revenues will suffer and the price of our common stock will likely decline.
Our recent and planned product introductions to support new higher speed networking and 4G technologies have allowed us to enter new markets, such as mobile marketing and analytics. A viable market for these products may not develop or be sustainable, and we may face intense competition in these markets. In addition, our success in these markets depends on our carrier, MSO, and enterprise customers’ ability to successfully introduce new mobile services enabled by our products and our ability to broaden our carrier customer base, which we believe will be difficult and time-consuming. If the expected benefits from entering new markets do not materialize, our revenues will suffer and the price of our common stock would likely decline. In addition, to the extent we enter new markets through acquisitions of companies or technologies, our financial condition could be harmed or our stockholders could suffer dilution without a corresponding benefit to our company if we do not realize expected benefits of entering such new markets.
If the adoption of and investments in new technologies and services grows more slowly than anticipated in our product planning and development, our operating results, financial condition, and prospects may be negatively affected.
If the adoption of and investments in new networking and 4G technologies and services does not grow or grows more slowly than anticipated, we will not obtain the anticipated returns from our planning and development investments. We have introduced new high-speed networking and 4G products, but the pace of the market introduction of such technologies is uncertain. Future sales and any future profits from these and related products are substantially dependent upon the acceptance and use of these new technologies, and on the continued adoption and use of mobile data services by end users.
Many of our customers and other communications service providers have made and continue to make major investments in next generation networks that are intended to support more complex applications. If communications service providers delay their deployment of networks or fail to deploy such networks successfully, demand for our products could decline, which would adversely affect our revenues. Also, to the extent we devote substantial resources and incur significant expenses to enable our products to be interoperable with new networks that have failed or have been delayed or not deployed, our operating results, financial condition, and prospects may be negatively affected.
14
If we are unable to retain key personnel, the loss of their services could materially and adversely affect our business, financial condition and results of operations.
Our future performance depends in significant part upon the continued service of our senior management and other key technical personnel. We do not have employment agreements with our key employees that govern the length of their service. The loss of the services of our key employees would materially and adversely affect our business, financial condition and results of operations. Our future success also depends on our ability to continue to attract, retain, and motivate qualified personnel, particularly highly skilled engineers involved in the ongoing research and development required to develop and enhance our products. Competition for these employees remains high and employee retention is a common problem in our industry. Our inability to attract and retain the highly trained technical personnel that are essential to our product development, marketing, service and support teams may limit the rate at which we can generate revenue, develop new products or product enhancements and generally would have an adverse effect on our business, financial condition and results of operations.
We rely directly and indirectly on third-party intellectual property and licenses, which may not be available on commercially reasonable terms or at all.
Many of the Company’s products and services include third-party intellectual property, which requires licenses from those third parties directly to us or to unrelated companies which provide us with sublicenses and/or execution of services for the operation of our business. These products and services include our wireless suite of products, as well as our graphics products. The Company has historically been able to obtain such licenses on reasonable terms. There is however no assurance that in the future the necessary licenses could be obtained on acceptable terms or at all. If the Company or our third party service providers are unable to obtain or renew critical licenses on reasonable terms, we may be forced to terminate or curtail our products and services which rely on such intellectual property, and our financial condition and operating results may be materially adversely affected.
If we fail to continue to establish and maintain strategic relationships with mobile device manufacturers, wireless carriers, cable MSOs and network infrastructure manufacturers, market acceptance of our products, and our profitability may suffer.
Most of our strategic relationships with mobile device manufacturers are not subject to written contract, but rather are in the form of informal working relationships. We believe these relationships are valuable to our success. In particular, these relationships provide us with insights into product development and emerging technologies, which allows us to keep abreast of, or anticipate, market trends, and helps us serve our current and prospective customers. Because these relationships are not typically governed by written agreements, there is no obligation for many of our partners to continue working with us. If we are unable to maintain our existing strategic relationships with mobile device manufacturers or if we fail to enter into additional strategic relationships or the parties with whom we have strategic relationships favor one of our competitors, our ability to provide products that meet our current and prospective customers’ needs could be compromised and our reputation and future revenue prospects could suffer. For example, if our software does not function well with a popular mobile device because we have not maintained a relationship with its manufacturer, carriers seeking to provide that device to their respective customers could choose a competitor’s software over ours or develop their own. Even if we succeed in establishing these relationships, they may not result in additional customers or revenues.
Our growth depends in part on our customers’ ability and willingness to promote services and attract and retain new customers or achieve other goals outside of our control.
We sell our products for use on handheld devices primarily through our carrier, cable/MSO, and enterprise customers. Losing the support of these customers may limit our ability to compete in existing and potential markets and could negatively affect our revenues. In addition, the success of these customers, and their ability and willingness to market services supported by our products, is critical to our future success. Our ability to generate revenues from sales of our software is also constrained by our carrier customers’ ability to attract and retain customers. We have no input into or influence upon their marketing efforts and sales and customer retention activities. If our large carrier customers fail to maintain or grow demand for their services, revenues or revenue growth from our products designed for use on mobile devices will decline and our results of operations will suffer.
15
Acquisitions of companies or technologies may disrupt our business and divert management attention and cause our current operations to suffer.
We have historically made targeted acquisitions of smaller companies with important technology and expect to continue to do so in the future. As part of any acquisition, we will be required to assimilate the operations, products and personnel of the acquired businesses and train, retain, and motivate key personnel from the acquired businesses. We may not be able to maintain uniform standards, controls, procedures and policies if we fail in these efforts. Similarly, acquisitions may cause disruptions in our operations and divert management’s attention from our company’s day-to-day operations, which could impair our relationships with our current employees, customers, and strategic partners. Acquisitions may also subject us to liabilities and risks that are not known or identifiable at the time of the acquisition.
We may also have to incur debt or issue equity securities in order to finance future acquisitions. Our financial condition could be harmed to the extent we incur substantial debt or use significant amounts of our cash resources in acquisitions. The issuance of equity securities for any acquisition could be substantially dilutive to our existing stockholders. In addition, we expect our profitability could be adversely affected because of acquisition-related accounting costs, write offs, amortization expenses, and charges related to acquired intangible assets. In consummating acquisitions, we are also subject to risks of entering geographic and business markets in which we have had limited or no prior experience. If we are unable to fully integrate acquired businesses, products, or technologies within existing operations, we may not receive the intended benefits of acquisitions.
Our operating income or loss may continue to change due to shifts in our sales mix and variability in our operating expenses.
Our operating income or loss can change quarter to quarter and year to year due to a change in our sales mix and the timing of our continued investments in research and development and infrastructure. We continue to invest in research and development, which is the lifeline of our technology portfolio. The timing of these additional expenses can vary significantly quarter to quarter and even from year to year.
Our products may contain undetected software defects, which could negatively affect our revenues.
Our software products are complex and may contain undetected defects. In the past, we have discovered software defects in certain of our products and have experienced delayed or lost revenues during the period it took to correct these problems. Although we and our OEM customers test our products, it is possible that errors may be found or occur in our new or existing products after we have commenced commercial shipment of those products. Defects, whether actual or perceived, could result in adverse publicity, loss of revenues, product returns, a delay in market acceptance of our products, loss of competitive position, or claims against us by customers. Any such problems could be costly to remedy and could cause interruptions, delays, or cessation of our product sales, which could cause us to lose existing or prospective customers and could negatively affect our results of operations. In addition, some of our software contains open source components that are licensed under the GNU General Public License and similar open source licenses. These components may contain undetected defects or incompatibilities, may cause us to lose control over the development of portions of our software code, and may expose us to claims of infringement if these components are, or incorporate, infringing materials, the licenses are not enforceable or are modified to become incompatible with other open source licenses, or exposure to misappropriation claims if these components include unauthorized materials from a third party.
Regulations affecting our customers and us and future regulations, to which they or we may become subject to, may harm our business.
Certain of our customers in the communications industry are subject to regulation by the Federal Communications Commission, which could have an indirect effect on our business. In addition, the United States telecommunications industry has been subject to continuing deregulation since 1984. We cannot predict when, or upon what terms and conditions, further regulation or deregulation might occur or the effect regulation or deregulation may have on demand for our products from customers in the communications industry. Demand for our products may be indirectly affected by regulations imposed upon potential users of those products, which may increase our costs and expenses.
16
We may be unable to adequately protect our intellectual property and other proprietary rights, which could negatively impact our revenues.
Our success is dependent upon our software code base, our programming methodologies and other intellectual properties and proprietary rights. In order to protect our proprietary technology, we rely on a combination of trade secrets, nondisclosure agreements, patents, and copyright and trademark law. We currently own U.S. trademark registrations for certain of our trademarks and U.S. patents for certain of our technologies. However, these measures afford us only limited protection. Furthermore, we rely primarily on “shrink wrap” licenses that are not signed by the end user and, therefore, may be unenforceable under the laws of certain jurisdictions. Accordingly, it is possible that third parties may copy or otherwise obtain our rights without our authorization. It is also possible that third parties may independently develop technologies similar to ours. It may be difficult for us to detect unauthorized use of our intellectual property and proprietary rights.
We may be subject to claims of intellectual property infringement as the number of trademarks, patents, copyrights and other intellectual property rights asserted by companies in our industry grows and the coverage of these patents and other rights and the functionality of software products increasingly overlap. From time to time, we have received communications from third parties asserting that our trade name or features, content, or trademarks of certain of our products infringe upon intellectual property rights held by such third parties. We have also received correspondence from third parties separately asserting that our products may infringe on certain patents held by each of the parties. Although we are not aware that any of our products infringe on the proprietary rights of others, third parties may claim infringement by us with respect to our current or future products. Additionally, our customer agreements require that we indemnify our customers for infringement claims made by third parties involving our intellectual property embedded in their products. Infringement claims, whether with or without merit, could result in time-consuming and costly litigation, divert the attention of our management, cause product shipment delays, or require us to enter into royalty or licensing agreements with third parties. If we are required to enter into royalty or licensing agreements, they may not be on terms that are acceptable to us. Unfavorable royalty or licensing agreements could seriously impair our ability to market our products.
Our business, financial condition and operating results could be adversely affected as a result of legal, business and economic risks specific to international operations.
In recent years, our revenues derived from sales to customers outside the U.S. have not been material. Our revenues derived from such sales can vary from quarter to quarter and from year to year. We also frequently ship products to our domestic customers’ international manufacturing divisions and subcontractors. In the future, we may expand these international business activities. International operations are subject to many inherent risks, including:
|
|
• |
general political, social and economic instability; |
|
|
• |
trade restrictions; |
|
|
• |
the imposition of governmental controls; |
|
|
• |
exposure to different legal standards, particularly with respect to intellectual property; |
|
|
• |
burdens of complying with a variety of foreign laws; |
|
|
• |
import and export license requirements and restrictions of the United States and any other country in which we operate; |
|
|
• |
unexpected changes in regulatory requirements; |
|
|
• |
foreign technical standards; |
|
|
• |
changes in tariffs; |
|
|
• |
difficulties in staffing and managing international operations; |
|
|
• |
difficulties in securing and servicing international customers; |
|
|
• |
difficulties in collecting receivables from foreign entities; |
17
|
|
• |
potentially adverse tax consequences. |
These conditions may increase our cost of doing business. Moreover, as our customers are adversely affected by these conditions, our business with them may be disrupted and our results of operations could be adversely affected.
Security and privacy breaches may harm our business.
The uninterrupted operation of our hosted solutions and the confidentiality and security of third-party information is critical to our business. Any failures in our security and privacy measures, such as “hacking” of our systems by outsiders, could have a material adverse effect on our financial position and results of operations. If we are unable to protect, or our customers perceive that we are unable to protect, the security and privacy of our electronic information, our growth could be materially adversely affected. A security or privacy breach may:
|
|
• |
cause our customers to lose confidence in our solutions; |
|
|
• |
harm our reputation; |
|
|
• |
expose us to liability; and |
|
|
• |
increase our expense from potential remediation costs. |
While we believe we use proven applications designed for data security and integrity to process electronic transactions, there can be no assurance that our use of these applications will be sufficient to address changing market conditions or the security and privacy concerns of existing and potential customers. In addition, our customers and end users may use our products and services in a manner which violates security or data privacy laws in one or more jurisdictions. Any significant or high profile data privacy breaches or violations of data privacy laws, whether directly through our hosted solutions or by third parties using our products and services, could result in the loss of business and reputation, litigation against us and regulatory investigations and penalties that could adversely affect our operating results and financial condition.
Interruptions or delays in service from data center hosting facilities could impair the delivery of our service and harm our business.
We currently serve our customers from data center hosting facilities. Any damage to, or failure of, our systems generally could result in interruptions in our service. Interruptions in our service may reduce our revenue, cause us to issue credits or pay penalties, cause customers to terminate their on-demand services, and adversely affect our renewal rates and our ability to attract new customers.
If we fail to meet the requirements for continued listing on the NASDAQ Stock Market, our common stock would likely be delisted from trading on NASDAQ, which would likely reduce the liquidity of our common stock and could cause our trading price to decline.
Our common stock is currently listed for quotation on the NASDAQ Stock Market. We are required to meet specified financial requirements in order to maintain our listing on NASDAQ. If we fail to satisfy NASDAQ’s continued listing requirements, our common stock would likely be delisted from NASDAQ and our common stock may trade on the OTC Market. Any potential delisting of our common stock from NASDAQ would likely result in decreased liquidity and increased volatility of our common stock, and would likely cause our trading price to decline.
We may have exposure to additional tax liabilities.
As a multinational corporation, we are subject to income taxes as well as sales, use, and other non-income based taxes, in both the United States and various foreign jurisdictions. Significant judgment is required in determining our worldwide provision for income taxes, sales and use taxes, and other tax liabilities. Changes in tax laws or tax rulings may have a significantly adverse impact on our effective tax rate.
18
We are also subject to non-income based taxes, such as payroll, sales, use, value-added, net worth, property, and goods and services taxes, in both the United States and various foreign jurisdictions. We are regularly under audit by tax authorities with respect to these non-income based taxes and may have exposure to additional non-income based tax liabilities. An increasing number of states have considered or have adopted laws that attempt to impose obligations on out-of-state retailers to collect sales and use taxes on their behalf. A successful assertion by one or more states or foreign countries requiring us to collect sales and use taxes where we do not do so could result in substantial tax liabilities, including for past sales, as well as penalties and interest.
Although we believe that our income and non-income based tax estimates are reasonable, there is no assurance that our provisions for taxes are correct, or that the final determination of tax audits or tax disputes will not be different from what is reflected in our historical income tax provisions and accruals. If we are required to pay substantially more taxes in the future or for prior periods, our operating results and financial condition could be adversely affected.
Item 1B. UNRESOLVED STAFF COMMENTS
None.
Our corporate headquarters, including our principal administrative, sales and marketing, customer support, and research and development facility, is located in Aliso Viejo, California, where we currently lease and occupy approximately 24,688 square feet of space pursuant to lease that expires on May 31, 2019. We lease approximately 55,600 square feet in Pittsburgh, Pennsylvania under a lease that expires December 31, 2021. Commencing February 1, 2015, we entered into an agreement to sublease 19,965 square feet of that space through the expiry date. Internationally, we lease approximately 6,300 square feet in Belgrade, Serbia under a lease that expires December 31, 2021. We lease approximately 6,900 square feet in Stockholm, Sweden under a lease that expires May 31, 2019. We lease approximately 3,200 square feet in Braga, Portugal under a lease that expires July 31, 2018.
We lease an additional 19,100 square feet in Aliso Viejo, California under a lease that expires January 31, 2022. In August 2014, we signed an addendum to sublease all of this space commencing on September 15, 2014 for a three-year period, with two, two-year renewal options. The remaining lease expense, net of sublease income, has been accrued for in our 2013 restructuring liability account.
We lease approximately 15,300 square feet in Watsonville, California under a lease that expires September 30, 2018. In March 2014, we signed an addendum to sublease all of this space commencing on May 1, 2014. We continued to pay our current monthly rent through June 30, 2014. Beginning on July 1, 2014, we are paying the landlord a minimum amount of rent, with annual escalations, through the end of the lease. This lease expense has been accrued for in our 2013 restructuring liability account. We now occupy a very small facility in Santa Cruz, California and are paying month-to-month rent.
The Company may become involved in various legal proceedings arising from its business activities. While management does not believe the ultimate disposition of these matters will have a material adverse impact on the Company’s consolidated results of operations, cash flows, or financial position, litigation is inherently unpredictable, and depending on the nature and timing of these proceedings, an unfavorable resolution could materially affect the Company’s future consolidated results of operations, cash flows or financial position in a particular period.
Item 4. MINE SAFETY DISCLOSURES
Not Applicable.
19
Item 5. MARKET FOR REGISTRANT’S COMMON EQUITY, RELATED STOCKHOLDER MATTERS AND ISSUER PURCHASES OF EQUITY SECURITIES
Market Information
Our common stock is traded on the NASDAQ Stock Market under the symbol “SMSI.” The high and low sale prices for our common stock as reported by NASDAQ are set forth below for the periods indicated. The prices have been adjusted for our 1:4 reverse stock split on August 17, 2016.
|
|
|
High |
|
|
Low |
|
||
|
YEAR ENDED DECEMBER 31, 2016: |
|
|
|
|
|
|
|
|
|
First Quarter |
|
$ |
3.12 |
|
|
$ |
1.80 |
|
|
Second Quarter |
|
|
3.20 |
|
|
|
2.24 |
|
|
Third Quarter |
|
|
3.20 |
|
|
|
2.00 |
|
|
Fourth Quarter |
|
|
2.34 |
|
|
|
1.28 |
|
|
YEAR ENDED DECEMBER 31, 2015: |
|
|
|
|
|
|
|
|
|
First Quarter |
|
$ |
7.40 |
|
|
$ |
3.64 |
|
|
Second Quarter |
|
|
6.52 |
|
|
|
4.32 |
|
|
Third Quarter |
|
|
5.36 |
|
|
|
3.00 |
|
|
Fourth Quarter |
|
|
3.68 |
|
|
|
2.56 |
|
On March 3, 2017, the closing sale price for our common stock as reported by NASDAQ was $1.25.
For information regarding Securities Authorized for Issuance under Equity Compensation Plans, please refer to Item 12.
20
The following graph and information compares the cumulative total stockholder return on our common stock against the cumulative total return of the S&P Midcap 400 Index and the S&P Midcap Applications Software Index (Peer Group) for the same period.
The graph covers the period from December 31, 2011 through December 31, 2016. The graph assumes that $100 was invested in our common stock on December 31, 2011, and in each index, and that all dividends were reinvested. No cash dividends have been declared on our common stock. Stockholder returns over the indicated period should not be considered indicative of future stockholder returns.
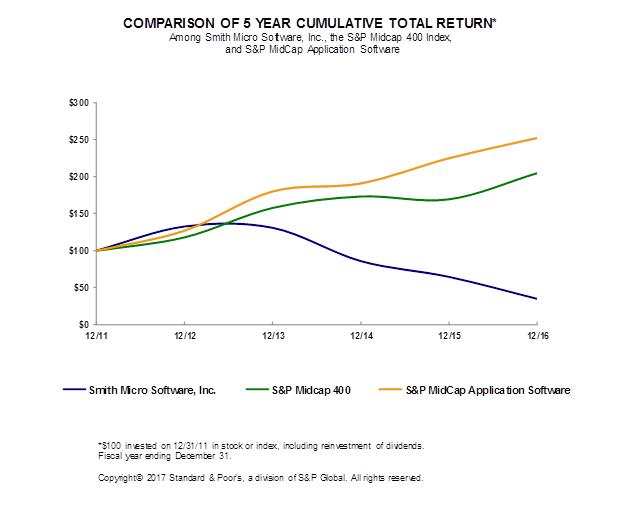
|
|
|
12/11 |
|
|
12/12 |
|
|
12/13 |
|
|
12/14 |
|
|
12/15 |
|
|
12/16 |
|
||||||
|
Smith Micro Software, Inc. |
|
|
100.00 |
|
|
|
132.74 |
|
|
|
130.97 |
|
|
|
85.84 |
|
|
|
64.51 |
|
|
|
34.73 |
|
|
S&P Midcap 400 |
|
|
100.00 |
|
|
|
117.88 |
|
|
|
157.37 |
|
|
|
172.74 |
|
|
|
168.98 |
|
|
|
204.03 |
|
|
S&P MidCap Application Software |
|
|
100.00 |
|
|
|
127.02 |
|
|
|
179.88 |
|
|
|
190.73 |
|
|
|
224.64 |
|
|
|
251.93 |
|
The stock price performance included in this graph is not necessarily indicative of future stock price performance.
21
As of March 3, 2017, there were approximately 173 holders of record of our common stock based on information provided by our transfer agent.
Dividends
We have never paid any cash dividends on our common stock and we have no current plans to do so.
Recent Sales of Unregistered Securities
On September 2, 2016, the Company entered into a Note and Warrant Purchase Agreement with Unterberg Koller Capital Fund L.P. and William W. and Dieva L. Smith (collectively, the “Investors”), pursuant to which the Company issued and sold to the Investors in a private placement senior subordinated promissory notes in the aggregate principal amount of $4,000,000 (the “Notes”) and five-year warrants (the “Warrants”) to purchase an aggregate of 1,700,000 shares of the Company’s common stock (the “Warrant Shares”) at an exercise price of $2.74 per share. The Notes bear interest at the rate of 10% of the outstanding principal balance of the Notes, payable quarterly in cash or shares of the Company’s common stock at a conversion price equal to the five-day volume weighted average closing price of the common stock on the Nasdaq Stock Market, measured on the third trading day prior to the date that interest is due, or $2.3825 in the case of Mr. Smith. The Notes and Warrants were issued to “accredited investors” in transactions exempt from registration pursuant to Rule 506 of Regulation D of the Securities Act of 1933, as amended (the “Securities Act”), and similar exemptions under applicable state securities laws. The sale of the Notes and Warrants did not involve a public offering and was made without general solicitation or general advertising. The Investors have represented that they are accredited investors, as that term is defined in Regulation D, and that they have acquired the securities for investment purposes only and not with a view to or for sale in connection with any distribution thereof.
On July 19, 2016, the Company entered into a Share Purchase Agreement to acquire all of the outstanding shares of iMobileMagic – Mobile Experiences, LDA, a Portuguese limited liability company. The acquisition was consummated concurrently with the execution of the Purchase Agreement. Under the terms of the Purchase Agreement, the Company paid an aggregate purchase price consisting of cash plus €500,000 in value of the Company’s common stock, totaling 814,339 shares of common stock and €1,000,000 in value of the Company’s common stock, totaling 1,628,676 shares, to be held in escrow pursuant to an Escrow Agreement. The shares were issued pursuant to exemptions from registration provided by Section 4(a)(2) and/or the private offering safe harbor provisions of Regulation D of the Securities Act, and Regulation S of the Securities Act, based on the following factors: (i) the number of offerees or purchasers, as applicable, (ii) the absence of general solicitation, (iii) investment representations obtained from the sellers, including with respect to their status as an accredited investor, (iv) the provision of appropriate disclosure, (v) the status of the sellers as non-U.S. persons, and (vi) the placement of restrictive legends on the certificates or book-entry notations reflecting the securities.
22
Purchases of Equity Securities by the Company
The table set forth below shows all purchases of securities by us during the fiscal year 2016:
|
ISSUER PURCHASES OF EQUITY SECURITIES |
|
||||||||||||||||
|
Period |
|
Total Number of Shares (or Units) Purchased |
|
|
|
Average Price Paid per Share (or Unit) |
|
|
Total Number of Shares (or Units) Purchased as Part of Publicly Announced Plans or Programs |
|
|
Maximum Number (or Approximate Dollar Value) of Shares (or Units) that May Yet Be Purchased Under the Plans or Programs |
|
||||
|
Mar 1-31, 2016 |
|
|
41,416 |
|
|
|
$ |
2.52 |
|
|
|
— |
|
|
|
— |
|
|
Jun 1-30, 2016 |
|
|
28,780 |
|
|
|
$ |
2.76 |
|
|
|
— |
|
|
|
— |
|
|
Sep 1-30, 2016 |
|
|
29,162 |
|
|
|
$ |
2.52 |
|
|
|
— |
|
|
|
— |
|
|
Oct 1 - 31, 2016 |
|
|
— |
|
|
|
$ |
— |
|
|
|
— |
|
|
|
— |
|
|
Nov 1 - 30, 2016 |
|
|
— |
|
|
|
$ |
— |
|
|
|
— |
|
|
|
— |
|
|
Dec 1-31, 2016 |
|
|
26,462 |
|
|
|
$ |
1.74 |
|
|
|
— |
|
|
|
— |
|
|
Total |
|
|
125,820 |
|
(a) |
|
|
|
|
|
|
— |
|
|
|
— |
|
The above table includes:
|
(a) |
Acquisition of stock by the Company as payment of withholding taxes in connection with the vesting of restricted stock awards, in an aggregate amount of 125,820 shares during the periods set forth in the table. All of the shares were cancelled when they were acquired. |
23
Item 6. SELECTED CONSOLIDATED FINANCIAL DATA
The following selected consolidated financial data should be read in conjunction with “Management’s Discussion and Analysis of Financial Condition and Results of Operations” and our consolidated financial statements and the related notes thereto appearing elsewhere in this Annual Report. The following selected consolidated statement of operations and comprehensive loss data for the years ended December 31, 2016, 2015 and 2014, and the consolidated balance sheet data at December 31, 2016 and 2015, have been derived from audited consolidated financial statements included elsewhere in this Annual Report. The consolidated statement of operations and comprehensive loss data presented below for the years ended December 31, 2013 and 2012, and the consolidated balance sheet data at December 31, 2014, 2013 and 2012 are derived from audited consolidated financial statements that are not included in this Annual Report.
|
|
|
Year Ended December 31, |
|
|||||||||||||||||
|
|
|
2016 |
|
|
2015 |
|
|
2014 |
|
|
2013 |
|
|
2012 |
|
|||||
|
Consolidated Statement of Operations and Comprehensive Loss Data (in thousands, except per share data): |
|
|
|
|
|
|
|
|
|
|
|
|
|
|
|
|
|
|
|
|
|
Revenues |
|
$ |
28,235 |
|
|
$ |
39,507 |
|
|
$ |
36,979 |
|
|
$ |
42,675 |
|
|
$ |
43,329 |
|
|
Cost of revenues |
|
|
7,564 |
|
|
|
8,152 |
|
|
|
9,317 |
|
|
|
9,707 |
|
|
|
8,448 |
|
|
Gross profit |
|
|
20,671 |
|
|
|
31,355 |
|
|
|
27,662 |
|
|
|
32,968 |
|
|
|
34,881 |
|
|
Operating expenses: |
|
|
|
|
|
|
|
|
|
|
|
|
|
|
|
|
|
|
|
|
|
Selling and marketing |
|
|
9,615 |
|
|
|
8,902 |
|
|
|
9,559 |
|
|
|
15,675 |
|
|
|
16,666 |
|
|
Research and development |
|
|
15,906 |
|
|
|
13,863 |
|
|
|
14,192 |
|
|
|
21,305 |
|
|
|
24,767 |
|
|
General and administrative |
|
|
10,341 |
|
|
|
11,128 |
|
|
|
13,218 |
|
|
|
18,216 |
|
|
|
20,211 |
|
|
Restructuring expenses |
|
|
303 |
|
|
|
— |
|
|
|
2,435 |
|
|
|
5,602 |
|
|
|
238 |
|
|
Long-lived asset impairment |
|
|
411 |
|
|
|
— |
|
|
|
— |
|
|
|
— |
|
|
|
— |
|
|
Total operating expenses |
|
|
36,576 |
|
|
|
33,893 |
|
|
|
39,404 |
|
|
|
60,798 |
|
|
|
61,882 |
|
|
Operating loss |
|
|
(15,905 |
) |
|
|
(2,538 |
) |
|
|
(11,742 |
) |
|
|
(27,830 |
) |
|
|
(27,001 |
) |
|
Non-operating income (expense): |
|
|
|
|
|
|
|
|
|
|
|
|
|
|
|
|
|
|
|
|
|
Change in fair value of warrant liability |
|
|
910 |
|
|
|
— |
|
|
|
— |
|
|
|
— |
|
|
|
— |
|
|
Change in carrying value of contingent liability |
|
|
668 |
|
|
|
— |
|
|
|
— |
|
|
|
— |
|
|
|
1,210 |
|
|
Interest income (expense), net |
|
|
(389 |
) |
|
|
1 |
|
|
|
(5 |
) |
|
|
28 |
|
|
|
91 |
|
|
Other income (expense), net |
|
|
(25 |
) |
|
|
3 |
|
|
|
(3 |
) |
|
|
2 |
|
|
|
3 |
|
|
Loss before provision for income taxes |
|
|
(14,741 |
) |
|
|
(2,534 |
) |
|
|
(11,750 |
) |
|
|
(27,800 |
) |
|
|
(25,697 |
) |
|
Provision for income tax expense (benefit) |
|
|
(229 |
) |
|
|
68 |
|
|
|
49 |
|
|
|
153 |
|
|
|
(234 |
) |
|
Net loss |
|
|
(14,512 |
) |
|
|
(2,602 |
) |
|
|
(11,799 |
) |
|
|
(27,953 |
) |
|
|
(25,463 |
) |
|
Other comprehensive income (loss), before tax: |
|
|
|
|
|
|
|
|
|
|
|
|
|
|
|
|
|
|
|
|
|
Unrealized holding gains (losses) on available- for-sale securities |
|
|
2 |
|
|
|
(1 |
) |
|
|
— |
|
|
|
7 |
|
|
|
33 |
|
|
Income tax expense related to items of other comprehensive income |
|
|
— |
|
|
|
— |
|
|
|
— |
|
|
|
— |
|
|
|
6 |
|
|
Other comprehensive income (expense), net of tax |
|
|
2 |
|
|
|
(1 |
) |
|
|
— |
|
|
|
7 |
|
|
|
27 |
|
|
Comprehensive loss |
|
$ |
(14,510 |
) |
|
$ |
(2,603 |
) |
|
$ |
(11,799 |
) |
|
$ |
(27,946 |
) |
|
$ |
(25,436 |
) |
|
Net loss per share: |
|
|
|
|
|
|
|
|
|
|
|
|
|
|
|
|
|
|
|
|
|
Basic |
|
$ |
(1.21 |
) |
|
$ |
(0.23 |
) |
|
$ |
(1.16 |
) |
|
$ |
(3.02 |
) |
|
$ |
(2.84 |
) |
|
Diluted |
|
$ |
(1.21 |
) |
|
$ |
(0.23 |
) |
|
$ |
(1.16 |
) |
|
$ |
(3.02 |
) |
|
$ |
(2.84 |
) |
|
Weighted average shares: |
|
|
|
|
|
|
|
|
|
|
|
|
|
|
|
|
|
|
|
|
|
Basic |
|
|
11,951 |
|
|
|
11,486 |
|
|
|
10,162 |
|
|
|
9,245 |
|
|
|
8,962 |
|
|
Diluted |
|
|
11,951 |
|
|
|
11,486 |
|
|
|
10,162 |
|
|
|
9,245 |
|
|
|
8,962 |
|
24
|
|
|
As of December 31, |
|
|||||||||||||||||
|
|
|
2016 |
|
|
2015 |
|
|
2014 |
|
|
2013 |
|
|
2012 |
|
|||||
|
Consolidated Balance Sheet Data (in thousands): |
|
|
|
|
|
|
|
|
|
|
|
|
|
|
|
|
|
|
|
|
|
Total assets |
|
$ |
14,308 |
|
|
$ |
24,473 |
|
|
$ |
27,390 |
|
|
$ |
31,538 |
|
|
$ |
54,395 |
|
|
Total liabilities |
|
|
11,804 |
|
|
|
10,447 |
|
|
|
12,488 |
|
|
|
13,367 |
|
|
|
11,733 |
|
|
Accumulated comprehensive deficit |
|
|
(225,397 |
) |
|
|
(210,887 |
) |
|
|
(208,284 |
) |
|
|
(196,485 |
) |
|
|
(168,539 |
) |
|
Total stockholders' equity |
|
$ |
2,504 |
|
|
$ |
14,026 |
|
|
$ |
14,902 |
|
|
$ |
18,171 |
|
|
$ |
42,662 |
|
25
Item 7. MANAGEMENT'S DISCUSSION AND ANALYSIS OF FINANCIAL CONDITION AND RESULTS OF OPERATIONS
The following discussion of our financial condition and results of operations should be read in conjunction with our consolidated financial statements and the related notes and other financial information appearing elsewhere in this Annual Report. Readers are also urged to carefully review and consider the various disclosures made by us which attempt to advise interested parties of the factors which affect our business, including without limitation the disclosures made in Item 1A of Part I of this Annual Report under the caption “Risk Factors.”
Risk factors that could cause actual results to differ from those contained in the forward-looking statements include, but are not limited to: our ability to remain a going concern; our ability to raise more funds to meet our capital needs; our dependence upon the large carrier customers for a significant portion of our revenues; deriving revenues from a small number of customers and products; changes in demand for our products; our failure to successfully compete; changes in technology; our entry into new markets; failure of our customers to adopt new technologies; loss of key personnel; the availability of third party intellectual property and licenses; failure to maintain strategic relationships with our customers; potential fluctuations in quarterly results; our failure to protect intellectual property; exposure to intellectual property claims; undetected software defects; security and privacy breaches in our systems or interruptions or delays in the services we provide which could damage client relations; doing business internationally; and being delisted from the NASDAQ.
Introduction and Overview
Smith Micro provides software solutions to simplify and enhance the mobile experience. As a leader in wireless connectivity, our applications ensure the best Quality of Experience for mobile users while optimizing networks for wireless service providers and enterprises. Using our intelligent policy-on-device platform, along with premium voice, video and content monetization services, we create new opportunities to engage consumers and capitalize on the growth of connected devices. In addition to wireless and mobility software, Smith Micro develops and distributes personal, professional, and educational productivity and graphics products and tools for consumers, artists, animators and designers worldwide.
Over the past three decades, the Company has developed deep expertise in embedded software for networked devices, policy-based management platforms, and highly-scalable mobile applications and hosted services. For organizations struggling to reduce costs and complexity in the fragmented, rapidly evolving mobile market, Smith Micro offers proven solutions that increase reliability and efficiency while accelerating delivery and value of mobile services to consumers.
During fiscal year 2016, we experienced a significant decrease in our revenues primarily due to our largest customer, Sprint, terminating a contract for one of our products. Even with our two acquisitions and the pipeline of new potential deals, our revenues have been slow to materialize. As such, we had to implement a significant restructuring plan during the fourth quarter of fiscal year 2016. We also impaired one of our acquired intangible assets.
We have continued to restructure during the first fiscal quarter of 2017 in order to align our expenses with our current short-term revenue projections. Overall, we have reduced our quarterly expenses by approximately $3.5 million. We believe that these actions, along with closing some significant new deals, will soon return us to profitability.
Results of Operations
Revenues to Sprint and their respective affiliates in the Wireless business segment accounted for 62.6% of the Company’s total revenues for the fiscal year 2016. Revenues to FastSpring in the Graphics business segment accounted for 13.5% of the Company’s total revenues for the fiscal year 2016. Revenues to Sprint and their respective affiliates in the Wireless business segment accounted for 65.4% of the Company’s total revenues for the fiscal year 2015. Revenues to FastSpring in the Graphics business segment accounted for 11.3% of the Company’s total revenues for the fiscal year 2015. Revenues to Sprint and their respective affiliates in the Wireless business segment accounted for 68.0% of the Company’s total revenues for the fiscal year 2014. Revenues to FastSpring in
26
the Graphics business segment accounted for 11.2% of the Company’s total revenues for the fiscal year 2014. These two customers accounted for 80%, 83%, and 87% of accounts receivable for the years ended December 31, 2016, 2015, and 2014, respectively.
The following table sets forth certain consolidated statement of comprehensive loss data as a percentage of total revenues for the periods indicated:
|
|
|
Year Ended December 31, |
|
|
|||||||||
|
|
|
2016 |
|
|
2015 |
|
|
2014 |
|
|
|||
|
Revenues |
|
|
100.0 |
|
% |
|
100.0 |
|
% |
|
100.0 |
|
% |
|
Cost of revenues |
|
|
26.8 |
|
|
|
20.6 |
|
|
|
25.2 |
|
|
|
Gross profit |
|
|
73.2 |
|
|
|
79.4 |
|
|
|
74.8 |
|
|
|
Operating expenses: |
|
|
|
|
|
|
|
|
|
|
|
|
|
|
Selling and marketing |
|
|
34.0 |
|
|
|
22.5 |
|
|
|
25.9 |
|
|
|
Research and development |
|
|
56.3 |
|
|
|
35.1 |
|
|
|
38.4 |
|
|
|
General and administrative |
|
|
36.6 |
|
|
|
28.2 |
|
|
|
35.7 |
|
|
|
Restructuring expenses |
|
|
1.1 |
|
|
|
— |
|
|
|
6.6 |
|
|
|
Long-lived asset impairment |
|
|
1.5 |
|
|
|
— |
|
|
|
— |
|
|
|
Total operating expenses |
|
|
129.5 |
|
|
|
85.8 |
|
|
|
106.6 |
|
|
|
Operating loss |
|
|
(56.3 |
) |
|
|
(6.4 |
) |
|
|
(31.8 |
) |
|
|
Change in fair value of warrant liability |
|
|
3.2 |
|
|
|
— |
|
|
|
— |
|
|
|
Change in carrying value of contingent liability |
|
|
2.4 |
|
|
|
— |
|
|
|
— |
|
|
|
Interest expense |
|
|
(1.4 |
) |
|
|
— |
|
|
|
— |
|
|
|
Other expense |
|
|
(0.1 |
) |
|
|
— |
|
|
|
— |
|
|
|
Loss before provision for income taxes |
|
|
(52.2 |
) |
|
|
(6.4 |
) |
|
|
(31.8 |
) |
|
|
Provision for income tax expense (benefit) |
|
|
(0.8 |
) |
|
|
0.2 |
|
|
|
0.1 |
|
|
|
Net loss |
|
|
(51.4 |
) |
% |
|
(6.6 |
) |
% |
|
(31.9 |
) |
% |
Revenues and Expense Components
The following is a description of the primary components of our revenues and expenses:
Revenues. Revenues are net of sales returns and allowances. Our operations are organized into two business segments:
|
|
• |
Wireless, which includes our NetWise®, CommSuite®, SafePath™, and QuickLink®, family of products; and |
|
|
• |
Graphics, which includes our consumer-based products: Poser®, Moho™ (formerly Anime Studio®), Clip Studio Paint® (formerly Manga Studio®), MotionArtist®, and StuffIt®. |
The following table shows the revenues generated by each business segment (in thousands):
|
|
|
Year Ended December 31, |
|
|||||||||
|
|
|
2016 |
|
|
2015 |
|
|
2014 |
|
|||
|
Wireless |
|
$ |
23,086 |
|
|
$ |
33,553 |
|
|
$ |
31,276 |
|
|
Graphics |
|
|
5,149 |
|
|
|
5,954 |
|
|
|
5,703 |
|
|
Total revenues |
|
|
28,235 |
|
|
|
39,507 |
|
|
|
36,979 |
|
|
Cost of revenues |
|
|
7,564 |
|
|
|
8,152 |
|
|
|
9,317 |
|
|
Gross profit |
|
$ |
20,671 |
|
|
$ |
31,355 |
|
|
$ |
27,662 |
|
Cost of revenues. Cost of revenues consists of direct product and assembly, maintenance, data center, royalties, and technical support expenses.
27
Selling and marketing. Selling and marketing expenses consist primarily of personnel costs, advertising costs, sales commissions, trade show expenses, and the amortization of certain intangible assets. These expenses vary significantly from quarter to quarter based on the timing of trade shows and product introductions.
Research and development. Research and development expenses consist primarily of personnel and equipment costs required to conduct our software development efforts. It also includes the amortization of certain intangible assets.
General and administrative. General and administrative expenses consist primarily of personnel costs, professional services and fees paid for external service providers, space and occupancy costs, and legal and other public company costs.
Change in fair value of warrant liability. The change in the fair value of our warrant liability.
Change in carrying value of contingent liability. The change in the carrying value of the Pennsylvania grant liability.
Interest income (expense), net. Interest expense is primarily related to interest on our debt, and the credit-adjusted risk-free interest rate used to measure our operating lease termination liabilities in restructuring.
Other income (expense), net. Other income (expense) is primarily related to fixed assets disposals.
Provision for income tax expense (benefit). The Company accounts for income taxes as required by Financial Accounting Standards Board (“FASB”) Accounting Standards Codification (“ASC”) Topic No. 740, Income Taxes. This statement requires the recognition of deferred tax assets and liabilities for the future consequences of events that have been recognized in the Company’s financial statements or tax returns. Measurement of the deferred items is based on enacted tax laws. In the event the future consequences of differences between financial reporting bases and tax bases of the Company’s assets and liabilities result in a deferred tax asset, we are required to evaluate the probability of being able to realize the future benefits indicated by such asset. The deferred tax assets are reduced by a valuation allowance if, based upon all available evidence, it is more likely than not that some or all of the deferred tax assets will not be realized. Establishing, reducing or increasing a valuation allowance in an accounting period generally results in an increase or decrease in tax expense in the statement of operations. We must make significant judgments to determine the provision for income taxes, deferred tax assets and liabilities, unrecognized tax benefits, and any valuation allowance to be recorded against deferred tax assets. Because of our loss position, the current provision for income tax expense consists of state income tax minimums, foreign tax withholdings, and foreign income taxes. After consideration of the Company’s continuing cumulative loss position as of December 31, 2016, the Company retained a valuation allowance related to its U.S.-based deferred tax assets of $76.3 million at December 31, 2016. During fiscal year 2016, the valuation allowance on deferred tax assets increased by $1.4 million, decreased by $0.8 million in fiscal year 2015, and increased by $3.2 million during fiscal year 2014.
Year Ended December 31, 2016 Compared to the Year Ended December 31, 2015
Revenues. Revenues of $28.2 million for fiscal year 2016 decreased $11.3 million, or 28.5%, from $39.5 million for fiscal year 2015. Wireless revenues of $23.1 million decreased $10.5 million, or 31.2%. The decrease was primarily due to Sprint which decreased $8.2 million due to the termination of the NetWise and connection manager business, the Cable/MSO business which decreased $1.1 million due to slower customer rollouts, and the continued decline of our legacy connection manager business which decreased $1.2 million. We continue to pursue some large opportunities, and we expect to start seeing revenues from our acquisitions made in fiscal year 2016. But since these are new customers, markets, and products, the rate of adoption and deployment is unknown at this time, causing material uncertainty regarding the timing of our future wireless revenues. Graphics sales decreased $0.8 million, or 13.5%, primarily due to lower customer demand for most of our products except Moho, which increased 12% year-over-year.
Cost of revenues. Cost of revenues of $7.5 million for fiscal year 2016 decreased $0.6 million, or 7.2%, from $8.1 million for fiscal year 2015. This decrease was primarily due to the lower revenues, lower maintenance costs, and lower spending.
28
Gross profit. Gross profit of $20.7 million or 73.2% of revenues for fiscal year 2016 decreased $10.7 million, or 34.1%, from $31.4 million, or 79.4% of revenues for fiscal year 2015. The 6.2 percentage point decrease was primarily due to the decreased revenues.
Selling and marketing. Selling and marketing expenses of $9.6 million for fiscal year 2016 increased $0.7 million, or 8.0%, from $8.9 million for fiscal year 2015. This increase was primarily due to the Birdstep acquisition of $0.5 million and increased advertising of $0.1 million. The amortization of intangible assets resulting from the Birdstep and iMobileMagic acquisitions was $0.2 million. Stock-based compensation of $0.3 million in 2016 decreased by $0.1 million from 2015.
Research and development. Research and development expenses of $15.9 million for fiscal year 2016 increased $2.0 million, or 14.7%, from $13.9 million for fiscal year 2015. This increase was primarily due to the Birdstep and iMobileMagic acquisitions of $1.2 million and other headcount additions during the year of $1.2 million. They were partially offset by reduced spending in other areas of $0.2 million. Stock-based compensation was $0.5 million in fiscal year 2016, a decrease of $0.2 million from fiscal year 2015.
General and administrative. General and administrative expenses of $10.3 million for fiscal year 2016 decreased $0.8 million, or 6.9%, from $11.1 million for fiscal year 2015. This decrease was primarily due to lower depreciation of $0.7 million and cost reductions of $0.2 million, partially offset by increased travel of $0.3 million, acquisition costs of $0.2 million, and legal fees of $0.1 million. Stock-based compensation expense decreased from $1.2 million to $0.7 million, or $0.5 million.
Restructuring expenses. Restructuring expense was $0.3 million for fiscal year 2016 due to one-time employee terminations of $0.2 million and other expenses of $0.1 million. There were no restructuring expenses in 2015.
Long-lived asset impairment. An intangible asset was impaired that resulted in a charge to the statement of operations of $0.4 million in fiscal year 2016. There were no impairment charges in 2015.
Change in fair value of warrant liability. The change in the fair value of the warrant liability was income of $0.9 million for fiscal year 2016.
Change in carrying value of contingent liability. The change in the carrying value of the Pennsylvania grant liability was income of $0.7 million for fiscal year 2016.
Interest income (expense), net. Interest expense was $0.4 million for fiscal year 2016 due to the issuance of notes payable on September 6, 2016 and the credit-adjusted risk-free interest rate used to measure our operating lease termination liabilities in restructuring.
Provision for income tax expense. The Company accounts for income taxes as required by Financial Accounting Standards Board (“FASB”) Accounting Standards Codification (“ASC”) Topic No. 740, Income Taxes. This statement requires the recognition of deferred tax assets and liabilities for the future consequences of events that have been recognized in the Company’s financial statements or tax returns. Measurement of the deferred items is based on enacted tax laws. In the event the future consequences of differences between financial reporting bases and tax bases of the Company’s assets and liabilities result in a deferred tax asset, we are required to evaluate the probability of being able to realize the future benefits indicated by such asset. The deferred tax assets are reduced by a valuation allowance if, based upon all available evidence, it is more likely than not that some or all of the deferred tax assets will not be realized. Establishing, reducing or increasing a valuation allowance in an accounting period generally results in an increase or decrease in tax expense in the statement of operations. We must make significant judgments to determine the provision for income taxes, deferred tax assets and liabilities, unrecognized tax benefits, and any valuation allowance to be recorded against deferred tax assets. Because of our loss position, the current provision for income tax expense consists of state income tax minimums, foreign tax withholdings, and foreign income taxes. After consideration of the Company’s continuing cumulative loss position as of December 31, 2016, the Company retained a valuation allowance related to its U.S.-based deferred tax assets of $76.4 million at December 31, 2016. During fiscal year 2016, the valuation allowance on deferred tax assets increased by $1.5 million and decreased by $0.8 million during fiscal year 2015.
29
Year Ended December 31, 2015 Compared to the Year Ended December 31, 2014
Revenues. Revenues of $39.5 million for fiscal year 2015 increased $2.5 million, or 6.8%, from $37.0 million for fiscal year 2014. Wireless revenues of $33.6 million increased $2.3 million, or 7.3%, primarily due to higher sales of NetWise of $3.9 million due to our new business at Comcast and higher revenue from Sprint. CommSuite revenues increased $0.7 million primarily due to Sprint. These increases were partially offset by decreases in our legacy connection manager business of $2.0 million. Graphics sales increased $0.2 million, or 4.4%, primarily due to high customer demand for our Manga and Clip Studio products.
Cost of revenues. Cost of revenues of $8.1 million for fiscal year 2015 decreased $1.2 million, or 12.5%, from $9.3 million for fiscal year 2014. This decrease was primarily due to cost reduction savings as a result of our 2014 restructuring and lower spending.
Gross profit. Gross profit of $31.4 million or 79.4% of revenues for fiscal year 2015 increased $3.7 million, or 13.4%, from $27.7 million, or 74.8% of revenues for fiscal year 2014. The 4.6 percentage point increase was primarily due to the increased revenues and cost reduction savings.
Selling and marketing. Selling and marketing expenses of $8.9 million for fiscal year 2015 decreased $0.7 million, or 6.9%, from $9.6 million for fiscal year 2014. This decrease was primarily due to headcount reductions of $0.6 million and other cost reductions of $0.1 million. Stock-based compensation remained flat at $0.3 million for both 2015 and 2014.
Research and development. Research and development expenses of $13.9 million for fiscal year 2015 decreased $0.3 million, or 2.3%, from $14.2 million for fiscal year 2014. This decrease was primarily due to headcount reductions of $0.6 million partially offset by patent-related legal expenses. Stock-based compensation remained flat at $0.7 million for both 2015 and 2014.
General and administrative. General and administrative expenses of $11.1 million for fiscal year 2015 decreased $2.1 million, or 15.8%, from $13.2 million for fiscal year 2014. This decrease was primarily due to lower depreciation of $0.6 million, lower space and occupancy costs of $0.5 million, headcount reductions of $0.5 million, and lower legal fees of $0.2 million. Stock-based compensation expense decreased from $1.5 million to $1.2 million, or $0.3 million.
Restructuring expenses. No restructuring expenses were recorded in 2015. Restructuring expense was $2.4 million for fiscal year 2014 due to one-time employee terminations of $1.3 million of non-cash stock-based compensation and $0.4 million of severance costs, $0.6 million for lease terminations, and $0.1 million of other related expenses.
Provision for income tax expense. We recorded income tax expense of $68,000 and $49,000 for fiscal years 2015 and 2014, respectively, primarily related to foreign income taxes.
Liquidity and Capital Resources
Going Concern Evaluation
In connection with preparing consolidated financial statements for the year ended December 31, 2016, management evaluated whether there were conditions and events, considered in the aggregate, that raised substantial doubt about the Company’s ability to continue as a going concern within one year from the date that the financial statements are issued.
The Company considered the following:
|
|
• |
Operating losses for seven consecutive quarters. |
|
|
• |
Negative cash flow from operating activities for three consecutive quarters. |
30
|
|
• |
Depressed stock price resulting in being non-compliant with NASDAQ listing rules to maintain a stock price of $1.00/share resulting in the necessity to execute a 1:4 reverse stock split. |
|
|
• |
Loss of 32% of business from our number one customer, Sprint, in fiscal year 2016 versus fiscal year 2015. |
Ordinarily, conditions or events that raise substantial doubt about an entity’s ability to continue as a going concern relate to the entity’s ability to meet its obligations as they become due.
The Company evaluated its ability to meet its obligations as they become due within one year from the date that the financial statements are issued by considering the following:
|
|
• |
The Company raised $4.0 million of debt financing during the year ended December 31, 2016. |
|
|
• |
The Company has been able to raise capital from short-term loans from its Board members. |
|
|
• |
As a result of the Company’s restructuring that was implemented during the three months ended December 31, 2016, and again during the first quarter of fiscal 2017, the Company’s cost structure is now in line with its current baseline revenue projections. |
Management believes that the Company will generate enough cash from operations to satisfy its obligations for the next twelve months from the issuance date.
The Company will take the following actions if it starts to trend unfavorable to its internal profitability and cash flow projections, in order to mitigate conditions or events that would raise substantial doubt about its ability to continue as a going concern:
|
|
• |
Raise additional capital through short-term loans. |
|
|
• |
Implement additional restructuring and cost reductions. |
|
|
• |
Raise additional capital through a private placement. |
|
|
• |
Secure a commercial bank line of credit. |
|
|
• |
Dispose of one or more product lines. |
|
|
• |
Sell or license intellectual property. |
At December 31, 2016, we had $2.2 million in cash and cash equivalents and $2.4 million of working capital.
Operating Activities
In 2016, net cash used in operating activities was $11.5 million primarily due to our net loss adjusted for non-cash items of $12.6 million, decreases of accounts payable and accrued liabilities of $2.0 million and a decrease of deferred revenue of $0.8 million. This usage was partially offset by a decrease of accounts receivable of $3.4 million, prepaid assets of $0.3 million, and a decrease of other assets of $0.2 million.
In 2015, net cash used in operating activities was $0.1 million primarily due to decreases in accounts payable and accrued expenses of $1.4 million and decreases in deferred revenue of $1.0 million. This usage was partially offset by our net loss adjusted for depreciation, amortization, non-cash stock-based compensation, inventory and accounts receivable reserves of $1.5 million, income tax refunds of $0.7 million, and decreases in other prepaid assets of $0.1 million.
In 2014, net cash used in operations was $6.8 million primarily due to our net loss adjusted for depreciation, amortization, non-cash stock-based compensation, inventory, and accounts receivable reserves of $4.7 million, decreases in accounts payable and accrued expenses of $2.2 million, and an increase in accounts receivable of $1.0 million. This usage was partially offset by an increase in deferred revenue of $1.0 million and a decrease in prepaid expenses of $0.1 million.
31
In 2016, cash provided by investing activities was $1.1 million due to the proceeds from the sale of short-term investments of $4.1 million, partially offset by the acquisition of Birdstep of $1.9 million, the acquisition of iMobileMagic of $0.6 million, and capital expenditures of $0.5 million.
In 2015, cash used by investing activities were for the purchase of short-term investments of $1.2 million and capital expenditures of $0.1 million.
In 2014, cash used by investing activities was de minimis as the sale of short-term investments of $0.2 million was offset by capital expenditures of $0.2 million.
Financing Activities
In 2016, cash provided by financing activities was $3.8 million due to the net proceeds from the issuance of debt instruments.
In 2015, cash provided by financing activities was de minimis as a result of cash received from the sale of stock for our employee stock purchase plan and the exercise of stock options.
In 2014, cash provided by financing activities was $5.3 million. We received $5.2 million from the sale of our common stock in a private placement. We also received $21,000 from the stock sale for the employee stock purchase plan and $6,000 from the exercise of stock options.
Contractual Obligations and Commercial Commitments
The following table summarizes our contractual obligations as of December 31, 2016 (in thousands):
|
|
|
Payments due by period |
|
|||||||||||||||||
|
|
|
|
|
|
|
Less than |
|
|
|
|
|
|
|
|
|
|
More than |
|
||
|
Contractual obligations: |
|
Total |
|
|
1 year |
|
|
1-3 years |
|
|
3-5 years |
|
|
5 years |
|
|||||
|
Operating lease obligations |
|
$ |
10,189 |
|
|
$ |
2,363 |
|
|
$ |
4,385 |
|
|
$ |
3,408 |
|
|
$ |
33 |
|
|
Notes payable |
|
|
4,000 |
|
|
|
— |
|
|
|
4,000 |
|
|
|
— |
|
|
|
— |
|
|
Purchase obligations |
|
|
776 |
|
|
|
776 |
|
|
|
— |
|
|
|
— |
|
|
|
— |
|
|
Pennsylvania state grant note |
|
|
343 |
|
|
|
69 |
|
|
|
206 |
|
|
|
68 |
|
|
|
— |
|
|
Total |
|
$ |
15,308 |
|
|
$ |
3,208 |
|
|
$ |
8,591 |
|
|
$ |
3,476 |
|
|
$ |
33 |
|
During our normal course of business, we have made certain indemnities, commitments, and guarantees under which we may be required to make payments in relation to certain transactions. These include: intellectual property indemnities to our customers and licensees in connection with the use, sale and/or license of our products; indemnities to various lessors in connection with facility leases for certain claims arising from such facility or lease; indemnities to vendors and service providers pertaining to claims based on the negligence or willful misconduct; indemnities involving the accuracy of representations and warranties in certain contracts; and indemnities to directors and officers of the Company to the maximum extent permitted under the laws of the State of Delaware. We may also issue a guarantee in the form of a standby letter of credit as security for contingent liabilities under certain customer contracts. The duration of these indemnities, commitments and guarantees varies, and in certain cases, may be indefinite. The majority of these indemnities, commitments and guarantees may not provide for any limitation of the maximum potential for future payments we could be obligated to make. We have not recorded any liability for these indemnities, commitments and guarantees in the accompanying consolidated balance sheets.
Real Property Leases
Our corporate headquarters, including our principal administrative, sales and marketing, customer support, and research and development facility, is located in Aliso Viejo, California, where we currently lease and occupy approximately 24,688 square feet of space pursuant to lease that expires on May 31, 2019. We lease approximately 55,600 square feet in Pittsburgh, Pennsylvania under a lease that expires December 31, 2021. Commencing
32
February 1, 2015, we entered into an agreement to sublease 19,965 square feet of that space through the expiry date. Internationally, we lease approximately 6,300 square feet in Belgrade, Serbia under a lease that expires December 31, 2021. We lease approximately 6,900 square feet in Stockholm, Sweden under a lease that expires May 31, 2019. We lease approximately 3,200 square feet in Braga, Portugal under a lease that expires July 31, 2018.
We lease an additional 19,100 square feet in Aliso Viejo, California under a lease that expires January 31, 2022. In August 2014, we signed an addendum to sublease all of this space commencing on September 15, 2014 for a three-year period, with two, two-year renewal options. The remaining lease expense, net of sublease income, has been accrued for in our 2013 restructuring liability account.
We lease approximately 15,300 square feet in Watsonville, California under a lease that expires September 30, 2018. In March 2014, we signed an addendum to sublease all of this space commencing on May 1, 2014. We continued to pay our current monthly rent through June 30, 2014. Beginning on July 1, 2014, we are paying the landlord a minimum amount of rent, with annual escalations, through the end of the lease. This lease expense has been accrued for in our 2013 restructuring liability account. We now occupy a very small facility in Santa Cruz, California and are paying month-to-month rent.
Off-Balance Sheet Arrangements
As of December 31, 2016, we did not have any off-balance sheet arrangements.
Critical Accounting Policies and Estimates
Our discussion and analysis of results of operations, financial condition, and liquidity are based upon our consolidated financial statements, which have been prepared in accordance with accounting principles generally accepted in the United States of America (“U.S. GAAP”). The preparation of these consolidated financial statements requires us to make estimates and judgments that affect the reported amounts of assets and liabilities and disclosure of contingent assets and liabilities at the date of the financial statements and the reported amounts of revenues and expenses during the reporting period. We base our estimates on historical experience and on various other assumptions that are believed to be reasonable under the circumstances. Actual results may materially differ from these estimates under different assumptions or conditions. On an on-going basis, we review our estimates to ensure that they appropriately reflect changes in our business or new information as it becomes available.
We believe the following critical accounting policies affect our more significant estimates and assumptions used in the preparation of our consolidated financial statements:
Revenue Recognition
We currently report our net revenues under two operating groups: Wireless and Graphics. Within each of these groups software revenue is recognized based on the customer and contract type. We recognize revenue when persuasive evidence of an arrangement exists, delivery has occurred, the price is fixed and determinable, and collectability is probable as required by FASB ASC Topic No. 605-985, Revenue Recognition-Software. We recognize revenues from sales of our software to our customers or end users as completed products are shipped and title passes; or from royalties generated as authorized customers duplicate our software, if the other requirements are met. If the requirements are not met at the date of shipment, revenue is not recognized until these elements are known or resolved. For Wireless sales, returns from customers are limited to defective goods or goods shipped in error. Historically, customer returns have not exceeded the very nominal estimates and reserves. We also provide some technical support to our customers. Such costs have historically been insignificant.
We have a few multiple element agreements for which we have contracted to provide a perpetual license for use of proprietary software, to provide non-recurring engineering, and in some cases, to provide software maintenance (post contract support). For these software and software-related multiple element arrangements, we must: (1) determine whether and when each element has been delivered; (2) determine whether undelivered products or services are essential to the functionality of the delivered products and services; (3) determine the fair value of each undelivered element using vendor-specific objective evidence (“VSOE”), and (4) allocate the total price among the
33
various elements. VSOE of fair value is used to allocate a portion of the price to the undelivered elements and the residual method is used to allocate the remaining portion to the delivered elements. Absent VSOE, revenue is deferred until the earlier of the point at which VSOE of fair value exists for any undelivered element or until all elements of the arrangement have been delivered. However, if the only undelivered element is post contract support, the entire arrangement fee is recognized ratably over the performance period. We determine VSOE for each element based on historical stand-alone sales to third parties or from the stated renewal rate for the elements contained in the initial arrangement. In determining VSOE, we require that a substantial majority of the selling prices for a product or service fall within a reasonably narrow pricing range. We have established VSOE for our post contract support services and non-recurring engineering.
On occasion, we enter into fixed fee arrangements, i.e. for trials, in which customer payments are tied to the achievement of specific milestones. Revenue for these contracts is recognized based on customer acceptance of certain milestones as they are achieved. We also enter hosting arrangements that sometimes include up-front, non-refundable set-up fees. Revenue is recognized for these fees over the term of the agreement.
For Graphics sales, management reviews available retail channel information and makes a determination of a return provision for sales made to distributors and retailers based on current channel inventory levels and historical return patterns. Certain sales to distributors or retailers are made on a consignment basis. Revenue for consignment sales are not recognized until sell through to the final customer is established. Certain revenues are booked net of revenue sharing payments. Sales directly to end users are recognized upon shipment. End users have a thirty-day right of return, but such returns are reasonably estimable and have historically been immaterial. We also provide technical support to our customers. Such costs have historically been insignificant.
Sales Incentives
For our Graphics sales, the cost of sales incentives the Company offers without charge to customers that can be used in, or that are exercisable by a customer as a result of, a single exchange transaction is accounted for as a reduction of revenue as required by FASB ASC Topic No. 605-50, Revenue Recognition-Customer Payments and Incentives. We use historical redemption rates to estimate the cost of customer incentives. Total sales incentives were $0.3 million, $0.2 million, and $0.5 million for the years ended December 31, 2016, 2015, and 2014, respectively.
Accounts Receivable and Allowance for Doubtful Accounts
We sell our products worldwide. We perform ongoing credit evaluations of our customers and adjust credit limits based upon payment history, the customer’s current credit worthiness and various other factors, as determined by our review of their current credit information. We continuously monitor collections and payments from our customers. We estimate credit losses and maintain an allowance for doubtful accounts reserve based upon these estimates. While such credit losses have historically been within our estimated reserves, we cannot guarantee that we will continue to experience the same credit loss rates that we have in the past. If not, this could have an adverse effect on our consolidated financial statements.
Intangible Assets and Amortization
Amortization expense related to other intangibles acquired in acquisitions is calculated on a straight line basis over the useful lives.
Impairment or Disposal of Long Lived Assets
Long-lived assets to be held are reviewed for events or changes in circumstances which indicate that their carrying value may not be recoverable. They are tested for recoverability using undiscounted cash flows to determine whether or not impairment to such value has occurred as required by FASB ASC Topic No. 360, Property, Plant, and Equipment. The Company determined there was no impairment as of December 31, 2016 and 2015.
34
Valuation of Goodwill and Intangible Assets
The Company accounts for goodwill and intangible assets as required by FASB ASC Topic No. 350, Intangibles-Goodwill and Other. This statement requires us to periodically assess the impairment of our goodwill and intangible assets, which requires us to make assumptions and judgments regarding the carrying value of these assets. These assets are considered to be impaired if we determine that their carrying value may not be recoverable based upon our assessment of the following events or changes in circumstances:
|
|
• |
a determination that the carrying value of such assets cannot be recovered through undiscounted cash flows; |
|
|
• |
loss of legal ownership or title to the assets; |
|
|
• |
significant changes in our strategic business objectives and utilization of the assets; or |
|
|
• |
the impact of significant negative industry or economic trends. |
If the intangible assets are considered to be impaired, the impairment we recognize is the amount by which the carrying value of the intangible assets exceeds the fair value of the intangible assets. In addition, we base the useful lives and the related amortization expense on our estimate of the useful life of the intangible assets. Due to the numerous variables associated with our judgments and assumptions relating to the carrying value of our intangible assets and the effects of changes in circumstances affecting these valuations, both the precision and reliability of the resulting estimates are subject to uncertainty, and as additional information becomes known, we may change our estimate, in which case, the likelihood of a material change in our reported results would increase. The Company recognized an impairment loss of $0.4 million in the three and twelve months ended December 31, 2016 related to an intangible asset acquired from our Birdstep acquisition.
We review the recoverability of the carrying value of goodwill at least annually or whenever events or circumstances indicate a potential impairment. Our annual impairment testing date is December 31. Recoverability of goodwill is determined by comparing the estimated fair value of our reporting units to the carrying value of the underlying net assets in the reporting units. If the estimated fair value of a reporting unit is determined to be less than the fair value of its net assets, goodwill is deemed impaired and an impairment loss is recognized to the extent that the carrying value of goodwill exceeds the difference between the estimated fair value of the reporting unit and the fair value of its other assets and liabilities. We determined that we did not have any impairment of goodwill at December 31, 2016.
Derivative Liabilities
The Company analyzes all financial instruments with features of both liabilities and equity under FASB ASC Topic No. 480, Distinguishing Liabilities From Equity and FASB ASC Topic No. 815, Derivatives and Hedging. Derivative liabilities are adjusted to reflect fair value at each period end, with any increase or decrease in the fair value being recorded in results of operations as adjustments to fair value of derivatives. The effects of interactions between embedded derivatives are calculated and accounted for in arriving at the overall fair value of the financial instruments. In addition, the fair values of freestanding derivative instruments such as warrant derivatives are valued using the Black-Scholes model.
Internal Software Development Costs
Development costs incurred in the research and development of new software products and enhancements to existing software products are expensed as incurred until technological feasibility has been established. The Company considers technological feasibility to be established when all planning, designing, coding, and testing has been completed according to design specifications. After technological feasibility is established, any additional costs are capitalized. Through December 31, 2016, software has been substantially completed concurrently with the establishment of technological feasibility; accordingly, no costs have been capitalized to date.
35
We account for income taxes as required by FASB ASC Topic No. 740, Income Taxes. This Topic clarifies the accounting for uncertainty in income taxes recognized in an enterprise’s financial statements and prescribes a recognition threshold and measurement process for financial statement recognition and measurement of a tax position taken or expected to be taken in a tax return. The Topic also provides guidance on derecognition, classification, interest and penalties, accounting in interim periods, disclosure, and transition. The Topic requires an entity to recognize the financial statement impact of a tax position when it is more likely than not that the position will be sustained upon examination. The amount recognized is measured as the largest amount of benefit that is greater than fifty percent likely of being realized upon ultimate settlement. In addition, the Topic permits an entity to recognize interest and penalties related to tax uncertainties either as income tax expense or operating expenses. The Company has chosen to recognize interest and penalties related to tax uncertainties as income tax expense.
The Company assesses whether a valuation allowance should be recorded against its deferred tax assets based on the consideration of all available evidence, using a “more likely than not” realization standard. The four sources of taxable income that must be considered in determining whether deferred tax assets will be realized are: (1) future reversals of existing taxable temporary differences (i.e., offset of gross deferred tax liabilities against gross deferred tax assets); (2) taxable income in prior carryback years, if carryback is permitted under the applicable tax law; (3) tax planning strategies, and (4) future taxable income exclusive of reversing temporary differences and carryforwards.
In assessing whether a valuation allowance is required, significant weight is to be given to evidence that can be objectively verified. A significant factor in the Company’s assessment is that the Company has been in a five-year historical cumulative loss as of the end of fiscal year 2016. These facts, combined with uncertain near-term market and economic conditions, reduced the Company’s ability to rely on projections of future taxable income in assessing the realizability of its deferred tax assets.
After a review of the four sources of taxable income as of December 31, 2016 (as described above), and after consideration of the Company’s continuing cumulative loss position as of December 31, 2016, the Company will continue to reserve its U.S.-based deferred tax amounts, which totaled $76.3 million, as of December 31, 2016.
The Company is subject to U.S. federal income tax, as well as income tax of multiple state jurisdictions. Federal income tax returns of the Company are subject to IRS examination for the 2012 - 2015 tax years. State income tax returns are subject to examination for a period of three to four years after filing. The outcome of tax audits cannot be predicted with certainty. If any issues addressed in the Company’s tax audits are resolved in a manner not consistent with management’s expectations, the Company could be required to adjust its provision for income tax in the period such resolution occurs. We may from time to time be assessed interest or penalties by major tax jurisdictions, although any such assessments historically have been minimal and immaterial to our financial results. It is the Company’s policy to classify any interest and/or penalties in the financial statements as a component of income tax expense.
Business Combinations
The Company applies the provisions of FASB ASC Topic No. 805, Business Combinations, in the accounting for its acquisitions, which requires recognition of the assets acquired and the liabilities assumed at their acquisition date fair values, separately from goodwill. Goodwill as of the acquisition date is measured as the excess of consideration transferred over the net of the acquisition date fair values of the tangible and identifiable intangible assets acquired and liabilities assumed. While the Company uses its best estimates and assumptions to accurately value assets acquired and liabilities assumed at the acquisition date as well as contingent consideration, where applicable, its estimates are inherently uncertain and subject to refinement. As a result, during the measurement period that exists up to twelve months from the acquisition date, the Company may record adjustments to the tangible and specifically identifiable intangible assets acquired and liabilities assumed with a corresponding adjustment to goodwill in the reporting period in which the adjusted amounts are determined. Upon the conclusion of the measurement period or final determination of the values of assets acquired and liabilities assumed, whichever comes first, the impact of any subsequent adjustments is included in the consolidated statements of operations.
36
Costs to exit or restructure certain activities of an acquired company or the Company’s internal operations are accounted for as a one-time termination and exit cost pursuant to FASB ASC Topic No. 420, Exit or Disposal Cost Obligations, and are accounted for separately from the business combination. A liability for costs associated with an exit or disposal activity is recognized and measured at its fair value in the Company’s consolidated statement of operations in the period in which the liability is incurred.
Uncertain income tax positions and tax-related valuation allowances that are acquired in connection with a business combination are initially estimated as of the acquisition date. The Company reevaluates these items quarterly based upon facts and circumstances that existed as of the acquisition date, with any adjustments to the preliminary estimates being recorded to goodwill if such adjustments occur within the 12-month measurement period. Subsequent to the end of the measurement period or the Company’s final determination of the value of the tax allowance or contingency, whichever comes first, changes to these uncertain tax positions and tax-related valuation allowances will affect the provision for income taxes in the consolidated statement of operations, and could have a material impact on results of operations and financial position.
Stock-Based Compensation
The Company accounts for all stock-based payment awards made to employees and directors based on their fair values and recognized as compensation expense over the vesting period using the straight-line method over the requisite service period for each award as required by FASB ASC Topic No. 718, Compensation-Stock Compensation.
Recently Adopted Accounting Pronouncements
In September 2015, FASB issued Accounting Standard Update (“ASU”) No. 2015-16, Business Combinations (Topic 805): Simplifying the Accounting for Measurement-Period Adjustments as part of the Board’s Simplification Initiative. This Update requires:
|
|
• |
An acquirer to recognize adjustments to provisional amounts identified during the measurement period in the reporting period in which the adjustment amounts are determined. |
|
|
• |
An acquirer to record, in the same period’s financial statements, the effect on earnings of changes in depreciation, amortization, or other income effects resulting from the change to the provisional amounts. This effect is required to be calculated as if the accounting had been completed at the acquisition date. |
|
|
• |
An entity to present separately on the face of the income statement or disclose in the notes the portion of the amount recorded in current-period earnings by line item that would have been recorded in previous reporting periods if the adjustment to the provisional amounts had been recognized as of the acquisition date. |
The guidance was effective for financial statements issued for annual periods beginning after December 15, 2015, including interim periods within those fiscal years. The Company has adopted this standard and it did not have a material impact on the Company’s consolidated financial statements.
In April 2015, FASB issued ASU No. 2015-03, Interest-Imputation of Interest (Topic 835-30): This Update requires that debt issuance costs be presented in the balance sheet as a direct deduction from the carrying amount of debt liability, consistent with debt discounts or premiums. The Company has adopted this standard during fiscal year 2016 and it did not have a material impact on the Company’s consolidated financial statements.
In August 2014, the FASB issued ASU No. 2014-15, Presentation of Financial Statements-Going Concern (Subtopic 205-40). The Update provides U.S. GAAP guidance on management’s responsibility in evaluating whether there is substantial doubt about a company’s ability to continue as a going concern and about related footnote disclosures. For each reporting period, management will be required to evaluate whether there are conditions or events that raise substantial doubt about a company’s ability to continue as a going concern within one year from the date the financial statements are issued. The amendments in this Update are effective for the annual period ending after December 15, 2016, and for annual periods and interim periods thereafter. The Company has
37
adopted this standard and it had no impact on the Company’s consolidated financial statements other than additional required disclosure.
Recently Issued Accounting Standards not yet Adopted
In August 2016, the FASB issued ASU No. 2016-15, Statement of Cash Flows (Topic 230): Classification of Certain Cash Receipts and Cash Payments, to reduce the existing diversity in how certain cash receipts and cash payments are presented and classified in the statement of cash flows. Amendments in this Update are effective for annual periods beginning after December 15, 2017, and interim periods within those annual periods. Early adoption is permitted for any entity in any interim or annual period. If an entity early adopts the amendments in an interim period, any adjustments should be reflected as of the beginning of the fiscal year that includes that interim period. An entity that elects early adoption must adopt all of the amendments in the same period. The Company will be evaluating the impact of this guidance on our consolidated financial statements.
In March 2016, the FASB issued final guidance in ASU No. 2016-09, Improvements to Employee Share-Based Payment Accounting, which will change certain aspects of accounting for share-based payments to employees. The new guidance will require all income tax effects of awards to be recognized in the income statement when the awards vest or are settled. It will also allow an employer to repurchase more of an employee’s shares than it currently can for tax withholding purposes without triggering liability accounting and to make a policy election to account for forfeitures as they occur. The guidance is effective for financial statements issued for annual periods beginning after December 15, 2016. Early adoption is permitted for all companies in any interim or annual period, and must be adopted on a modified prospective approach. Due to the Company applying a full valuation allowance against its deferred tax assets, the nature of the change on the balance sheet will not be material.
In February 2016, the FASB issued ASU No. 2016-02, Leases (Topic 842), to increase transparency and comparability among organizations by recognizing all lease transactions (with terms in excess of 12 months) on the balance sheet as a lease liability and a right-of-use asset (as defined). The ASU is effective for fiscal years beginning after December 15, 2018, including interim periods within those fiscal years, with earlier application permitted. Upon adoption, the lessee will apply the new standard retrospectively to all periods presented or retrospectively using a cumulative effect adjustment in the year of adoption. The Company will be evaluating the impact of this guidance on our consolidated financial statements.
In January 2016, the FASB issued ASU No. 2016-01, Financial Instruments-Overall (Topic 825-10). The Amendments to this Update require all equity investments to be measured at fair value with changes in the fair value recognized through net income (other than those accounted for under equity method of accounting or those that result in consolidation of the investee). The amendments in this Update also require an entity to present separately in other comprehensive income the portion of the total change in the fair value of a liability resulting from a change in the instrument-specific credit risk when the entity has elected to measure the liability at fair value in accordance with the fair value option for financial instruments. In addition, the amendments in this Update requires disclosure of the method(s) and significant assumptions used to estimate the fair value that is required to be disclosed for financial instruments measured at amortized cost on the balance sheet. For public business entities, the amendments in this Update are effective for fiscal years beginning after December 15, 2017, including interim periods within those fiscal years. Early application by public business entities to financial statements of fiscal years or interim periods that have not yet been issued or, by all other entities, that have not yet been made available for issuance of the following amendments in this Update are permitted as of the beginning of the fiscal year of adoption - an entity should present separately in other comprehensive income the portion of the total change in the fair value of a liability resulting from a change in the instrument-specific credit risk if the entity has elected to measure the liability at fair value in accordance with the fair value option for financial instruments. The Company will be evaluating the impact of this guidance on our consolidated financial statements.
In May 2014, the FASB issued ASU No. 2014-09, Revenue from Contracts with Customers (Topic 606). The amendments to this Update supersede nearly all existing revenue recognition guidance under U.S. GAAP. The core principle of this Topic is to recognize revenues when promised goods or services are transferred to customers in an amount that reflects the consideration that is expected to be received for those goods or services. This Topic defines a five-step process to achieve this core principle and, in doing so, it is possible more judgment and estimates may be required within the revenue recognition process than required under existing U.S. GAAP including identifying
38
performance obligations in the contract, estimating the amount of variable consideration to include in the transaction price and allocating the transaction price to each separate performance obligation. In July 2015, the FASB deferred the effective date for annual reporting periods beginning after December 15, 2017 (including interim reporting periods within those periods). Early adoption is permitted to the original effective date of December 15, 2016 (including interim reporting periods within those periods). The amendments may be applied retrospectively to each prior period presented or retrospectively with the cumulative effect recognized as of the date of initial application. The Company will be evaluating the impact of this guidance on our consolidated financial statements.
Item 7A. QUANTITATIVE AND QUALITATIVE DISCLOSURES ABOUT MARKET RISK
Interest Rate Risk
Our financial instruments include cash and cash equivalents and short-term investments. At December 31, 2016, the carrying values of our financial instruments approximated fair values based on current market prices and rates.
Foreign Currency Risk
While a majority of our business is denominated in U.S. dollars, we do occasionally invoice in foreign currencies. For the three years ended December 31, 2016, 2015, and 2014, our revenues denominated in foreign currencies were $204,000, $30,000, and $43,000, respectively. Fluctuations in the rate of exchange between the U.S. dollar and certain other currencies may affect our results of operations and period-to-period comparisons of our operating results. We do not currently engage in hedging or similar transactions to reduce these risks. The operational expenses of our foreign entities reduce the currency exposure we have because our foreign currency revenues are offset in part by expenses payable in foreign currencies. As such, we do not believe we have a material exposure to foreign currency rate fluctuations at this time.
Item 8. FINANCIAL STATEMENTS AND SUPPLEMENTARY DATA
Our consolidated financial statements and schedule appear in a separate section of this Annual Report on Form 10-K beginning on page F-1 and S-1, respectively.
Item 9. CHANGES IN AND DISAGREEMENTS WITH ACCOUNTANTS ON ACCOUNTING AND FINANCIAL DISCLOSURE
None.
Item 9A. CONTROLS AND PROCEDURES
Evaluation of Disclosure Controls and Procedures
We conducted an evaluation under the supervision and with the participation of our management, including our Chief Executive Officer and Chief Financial Officer, of the effectiveness of the design and operation of our disclosure controls and procedures (as defined in Rules 13a-15(e) under the Securities Exchange Act of 1934 (“Exchange Act”)) as of December 31, 2016. Based upon that evaluation, our Chief Executive Officer and Chief Financial Officer have determined that as of December 31, 2016, our disclosure controls and procedures were effective to ensure that the information required to be disclosed in our Exchange Act reports is recorded, processed, summarized, and reported within the time periods specified in the Securities and Exchange Commission’s rules and forms, and that such information is accumulated and communicated to our management, including our Chief Executive Officer and Chief Financial Officer, as appropriate, to allow timely decisions regarding required disclosure. In designing and evaluating the disclosure controls and procedures, our management recognizes that any controls and procedures, no matter how well designed and operated, can provide only reasonable assurance of achieving the desired control objectives, and our management necessarily is required to apply its judgment in evaluating the cost-benefit relationship of possible controls and procedures.
39
Management’s Responsibility for Financial Statements
Our management is responsible for the integrity and objectivity of all information presented in this report. The consolidated financial statements were prepared in conformity with accounting principles generally accepted in the United States of America and include amounts based on management’s best estimates and judgments. Management believes the consolidated financial statements fairly reflect the form and substance of transactions and that the consolidated financial statements fairly represent the Company’s financial position and results of operations for the periods and as of the dates stated therein.
The Audit Committee of the Board of Directors, which is composed solely of independent directors, meets regularly with our independent registered public accounting firm, SingerLewak LLP, and representatives of management to review accounting, financial reporting, internal control, and audit matters, as well as the nature and extent of the audit effort. The Audit Committee is responsible for the engagement of the independent auditors. The independent auditors have free access to the Audit Committee.
Changes in Internal Control over Financial Reporting
There have been no changes in our internal controls over financial reporting during the quarter ended December 31, 2016 that have materially affected, or are reasonably likely to materially affect, our internal controls over financial reporting.
Report of Management on Internal Control Over Financial Reporting
Our management, including the Chief Executive Officer and Chief Financial Officer, is responsible for establishing and maintaining adequate internal control over financial reporting (as defined in Rules 13a-15(f) and 15d-15(f) under the Securities Exchange Act of 1934).
Our management, including the Chief Executive Officer and Chief Financial Officer, assessed the effectiveness of our internal control over financial reporting as of December 31, 2016. Management based this assessment on criteria for effective internal control over financial reporting described in “Internal Control—Integrated Framework 2013” issued by the Committee of Sponsoring Organizations of the Treadway Commission.
Based on this assessment, management determined that, as of December 31, 2016, we maintained effective internal control over financial reporting.
None.
40
Item 10. DIRECTORS, EXECUTIVE OFFICERS AND CORPORATE GOVERNANCE
The following table sets forth certain information regarding our executive officers and certain key officers as of March 10, 2017:
|
Name |
|
Age |
|
Position |
|
William W. Smith, Jr. |
|
69 |
|
Chairman of the Board, President and Chief Executive Officer |
|
David Blakeney |
|
56 |
|
Vice President, Engineering |
|
Marco Leal |
|
39 |
|
Vice President, Worldwide Products |
|
Charles Messman |
|
46 |
|
Vice President, Investor Relations and Corporate Development |
|
Ken Shebek |
|
54 |
|
Vice President, Chief Information Officer |
|
David P. Sperling |
|
48 |
|
Vice President, Chief Technology Officer |
|
Steven M. Yasbek |
|
63 |
|
Vice President, Chief Financial Officer |
Mr. Smith co‑founded Smith Micro and has served as the Chairman of the Board, President and Chief Executive Officer since inception in 1982. Mr. Smith was employed by Rockwell International Corporation in a variety of technical and management positions from 1975 to 1984. Mr. Smith served with Xerox Data Systems from 1972 to 1975 and RCA Computer Systems Division from 1969 to 1972 in mainframe sales and pre‑sale technical roles. Mr. Smith received a B.A. in Business Administration from Grove City College.
Mr. Blakeney joined the Company in 2011 and is responsible for Development Engineering. Prior to this role, he led the development team for several Smith Micro products as well as the Wireless Products Quality Engineering team. Prior to joining Smith Micro, he served as Vice President of Product Development for Marconi’s Broadband Switching Division and Vice President of ATM Engineering at Fore Systems. Previous positions also include engineering management roles at 3Com Corporation and Texas Instruments. Mr. Blakeney holds a B.S. degree in Electrical Engineering from the University of Illinois and studied for a Masters in Electrical Engineering at Rice University.
Mr. Leal joined the Company in July 2016 as a result of the iMobileMagic acquisition and soon thereafter became the Vice President, Worldwide Products. He is an experienced professional in the mobile products and services area with a career that spans over 16 years across technical, management and executive roles. Mr. Leal started his career at MobiComp, playing a key role in its product development and innovation strategy, helping the company grow and expand internationally. After MobiComp’s acquisition by Microsoft in 2008, he took the role of Principal Group Program Manager where he helped deliver high profile mobile products and data services. Mr. Leal left Microsoft in 2011 to start iMobileMagic as its co-founder and CEO. He is a graduate of the Computer Science and Systems Engineering degree at the Universidade do Minho in Braga, Portugal.
Mr. Messman joined the Company in April 2016 as Vice President, Investor Relations and Corporate Development. Mr. Messman brings over 20 years of experience in working with a large range of technology companies providing investor relations counsel, strategy, financing alternatives, and M&A. Prior to joining Smith Micro, Mr. Messman was the Vice President of Finance & Corporate Development at eGain Corporation as well as having co-founded The MKR Group, serving as its President. He has worked with over 50 companies with market caps ranging from $10 million to $2.5 billion and is well known on Wall Street for having a strong marketing presence throughout many diverse industries. Mr. Messman holds a B.A. degree in Economics from Iowa State University.
Mr. Shebek joined the Company in December 2010 as the Vice President of Operations where he led the Enterprise Mobility Product platform. Mr. Shebek currently is responsible for Information Technology throughout the Company as well as overseeing the Pittsburgh facility. Prior to joining Smith Micro, he was Vice President of Operations for Tollgrade Communications. He also served as Vice President of Supply & Logistics for Ericsson, Inc. and worked for Marconi as Vice President of Supply Chain where he also served as its Vice President of North American Operations. He joined Fore Systems in 1994, and previously held management positions with IBM. He holds a B.S. in Mechanical Engineering degree from Pennsylvania State University.
41
Mr. Sperling joined the Company in April 1989 and has been the Director of Software Engineering since April 1992. He assumed the Chief Technology Officer position in September 1999. Mr. Sperling began his professional career as a software engineer with us and he currently has five patents for various Internet and connectivity technologies. He holds a B.S. degree in Computer Science and an M.B.A. from the University of California, Irvine.
Mr. Yasbek joined the Company in May 2008 as the Chief Accounting Officer and assumed the Vice President and Chief Financial Officer position in May 2014. Mr. Yasbek has held executive finance and information technology positions with REMEC, Paradigm Wireless Systems, Intellisys Group, Pacific Scientific Company, Symbol Technologies, and TRW. Prior to joining the Company, Mr. Yasbek was the Chief Financial Officer of Alphatec Spine. He holds a B.S. in Accounting and M.B.A from Loyola Marymount University, and he is a Certified Public Accountant.
Officers are elected by, and serve at the discretion of, the Board of Directors.
For information about our Directors, please see the section titled “Directors and Executive Officers” appearing in our Proxy Statement for our 2017 Annual Meeting of Stockholders, which is hereby incorporated by reference.
The section titled “Corporate Governance” appearing in our Proxy Statement for our 2017 Annual Meeting of Stockholders is hereby incorporated by reference.
Audit Committee; Audit Committee Financial Expert
Our Board of Directors has a standing Audit Committee. The members of the Audit Committee are Messrs. Campbell, Gulko and Szabo. Our Board has determined that Mr. Gulko, Chairman of the Audit Committee, is an audit committee financial expert as defined by Item 401(h) of Regulation S-K and that each member of the Audit Committee is independent within the meaning of NASDAQ Marketplace Rule 4200(a)(15).
Section 16(a) Beneficial Ownership Reporting Compliance
Section 16(a) of the Exchange Act requires certain of the company’s executive officers, as well as its directors and persons who own more than ten percent (10%) of a registered class of the Company’s equity securities to file reports of ownership and changes in ownership with the Securities and Exchange Commission.
Based solely on its review of the copies of such forms received by the Company, or written representations from certain reporting persons, the Company believes that all filing requirements applicable to our executive officers, directors, and more than 10% stockholders were met in a timely manner in 2016.
Code of Ethics
We have adopted a Code of Ethics that applies to all of our employees, including our principal executive officer, our principal financial officer, and all members of our finance department performing similar functions. Our Code of Ethics was filed as Exhibit 14 to the Annual Report on Form 10-K for the year ended December 31, 2003 which was filed on March 25, 2004. In the event of an amendment to, or a waiver from, certain provisions of our Code of Ethics, we intend, to the extent possible, to satisfy Form 8-K disclosure requirements by disclosing this information on our website at www.smithmicro.com.
Item 11. EXECUTIVE COMPENSATION
The section titled “Executive Compensation and Related Information” appearing in our Proxy Statement for our 2017 Annual Meeting of Stockholders is hereby incorporated by reference.
42
Item 12. SECURITY OWNERSHIP OF CERTAIN BENEFICIAL OWNERS AND MANAGEMENT AND RELATED STOCKHOLDER MATTERS
The section titled “Ownership of Securities and Related Stockholder Matters” appearing in our Proxy Statement for our 2017 Annual Meeting of Stockholders is hereby incorporated by reference.
Securities Authorized for Issuance Under An Equity Compensation Plan
The following table provides information as of December 31, 2016 with respect to the shares of common stock that may be issued under our existing equity compensation plans (in thousands, except per share data):
|
|
|
Number of shares to be issued upon exercise of outstanding options |
|
|
Weighted average exercise price of outstanding options |
|
|
Number of shares remaining available for future issuance |
|
|||
|
2015 Omnibus Equity Incentive Plan (1) |
|
|
27 |
|
|
$ |
2.47 |
|
|
|
1,744 |
|
|
2005 Stock Option / Stock Issuance Plan (2) |
|
|
346 |
|
|
|
24.00 |
|
|
|
— |
|
|
Total |
|
|
373 |
|
|
$ |
22.44 |
|
|
|
1,744 |
|
|
(1) |
The 2015 Omnibus Equity Incentive Plan was approved by shareholders effective June 18, 2015. |
|
(2) |
Upon shareholder approval of the 2015 OEIP, any unissued shares under the 2005 Plan were cancelled and no longer available for future issuance. |
Item 13. CERTAIN RELATIONSHIPS AND RELATED TRANSACTIONS, AND DIRECTOR INDEPENDENCE
The section titled “Related Party Transactions” and “Director Independence” appearing in our Proxy Statement for our 2017 Annual Meeting of Stockholders is incorporated herein by reference.
Item 14. PRINCIPAL ACCOUNTING FEES AND SERVICES
The section titled “Ratification of Appointment of Independent Registered Public Accounting Firm – Principal Accountant Fees and Services” appearing in our Proxy Statement for our 2017 Annual Meeting of Stockholders is incorporated herein by reference.
43
Item 15. EXHIBITS AND FINANCIAL STATEMENT SCHEDULES
(a) (1) Financial Statements
Smith Micro’s financial statements appear in a separate section of this Annual Report on Form 10-K beginning on the pages referenced below:
|
|
|
Page |
|
|
|
|
|
|
F-1 |
|
|
|
|
|
|
|
F-2 |
|
|
|
|
|
|
CONSOLIDATED STATEMENTS OF OPERATIONS AND COMPREHENSIVE LOSS |
|
F-3 |
|
|
|
|
|
|
F-4 |
|
|
|
|
|
|
|
F-5 |
|
|
|
|
|
|
|
F-6 |
(2) Financial Statement Schedule
Smith Micro’s financial statement schedule appears in a separate section of this Annual Report on Form 10-K on the pages referenced below. All other schedules have been omitted as they are not applicable, not required, or the information is included in the consolidated financial statements or the notes thereto.
(3) Exhibits
|
Exhibit No. |
|
Title |
|
Method of Filing |
|
|
|
|
|
|
|
3.1 |
|
Amended and Restated Certificate of Incorporation. |
|
Incorporated by reference to Exhibit 3.1 to the Registrant's Registration Statement No. 33-95096. |
|
|
|
|
|
|
|
3.1.1 |
|
Amendment to Certificate of Incorporation dated July 11, 2000. |
|
Incorporated by reference to Exhibit 3.1.1 to the Registrant’s Quarterly Report on Form 10-Q for the period ended June 30, 2000. |
|
|
|
|
|
|
|
3.1.2 |
|
Amendment to Certificate of Incorporation dated August 18, 2005. |
|
Incorporated by reference to Exhibit 3.1.2 to the Registrant’s Annual Report on Form 10-K for the period ended December 31, 2005. |
|
|
|
|
|
|
|
3.1.3 |
|
Amendment to Certificate of Incorporation dated June 25, 2012. |
|
Incorporated by reference to Appendix B to the Registrant’s Definitive Proxy Statement on Schedule 14A filed on April 27, 2012. |
|
|
|
|
|
|
|
3.1.4 |
|
Certificate of Elimination of Series A Junior Participating Preferred Stock dated October 16, 2015. |
|
Incorporated by reference to Exhibit 3.1 to the Registrant’s Current Report on Form 8-K filed on October 16, 2015. |
|
|
|
|
|
|
|
3.1.5 |
|
Certificate of Designation of Series A Participating Preferred Stock dated October 16, 2015. |
|
Incorporated by reference to Exhibit 3.2 to the Registrant’s Current Report on Form 8-K filed on October 16, 2015. |
|
|
|
|
|
|
44
|
Exhibit No. |
|
Title |
|
Method of Filing |
|
|
|
|
|
|
|
|
Certificate of Amendment to Amended and Restated Certificate of Incorporation filed on August 15, 2016. |
|
Incorporated by reference to Exhibit 3.1 to the Registrant’s Current Report on Form 8-K filed on August 17, 2016. |
|
|
|
|
|
|
|
|
3.2 |
|
Amended and Restated Bylaws. |
|
Incorporated by reference to Exhibit 3.2 to the Registrant's Registration Statement No. 33-95096. |
|
|
|
|
|
|
|
3.3 |
|
Amendment to Amended and Restated Bylaws. |
|
Incorporated by reference to Exhibit 3.3 to the Registrant’s Current Report on Form 8-K filed on October 31, 2007. |
|
|
|
|
|
|
|
4.1 |
|
Specimen certificate representing shares of Common Stock. |
|
Incorporated by reference to Exhibit 4.1 to the Registrant's Registration Statement No. 33-95096. |
|
|
|
|
|
|
|
4.2 |
|
Preferred Shares Rights Agreement, dated as of October 16, 2015, between the Registrant and Computershare Trust Company, N.A., as Rights Agent. |
|
Incorporated by reference to Exhibit 4.1 to the Registrant’s Current Report on Form 8-K filed on October 16, 2015. |
|
|
|
|
|
|
|
10.1 |
|
Form of Indemnification Agreement. |
|
Incorporated by reference to Exhibit 10.1 to the Registrant's Registration Statement No. 33-95096. |
|
|
|
|
|
|
|
10.2 |
|
Amended and Restated 2005 Stock Option / Stock Issuance Plan. |
|
Incorporated by reference to Exhibit 10.7 to the Registrant’s Registration Statement on Form S-8 (Reg. No. 333-149222). |
|
|
|
|
|
|
|
10.3 |
|
Summary of oral agreement dated June 2005 by and between William W. Smith, Jr. and the Registrant. |
|
Incorporated by reference to Exhibit 10.10 to the Registrant’s Quarterly Report on Form 10-Q for the quarter ended June 30, 2009. |
|
|
|
|
|
|
|
10.4 |
|
Amended & Restated Employee Stock Purchase Plan. |
|
Incorporated by reference to Exhibit 10.11 to the Registrant’s Registration Statement on Form S-8 (No. 333-169671) filed on September 30, 2010. |
|
|
|
|
|
|
|
10.5 |
|
Form of Common Stock Purchase Agreement dated August 15, 2014 |
|
Incorporated by reference to Exhibit 10.1 to the Registrant’s Current Report on Form 8-K filed on August 20, 2014. |
|
|
|
|
|
|
|
10.6 |
|
Form of Registration Rights Agreement dated August 15, 2014. |
|
Incorporated by reference to Exhibit 10.2 to the Registrant’s Current Report on Form 8-K filed on August 20, 2014. |
|
|
|
|
|
|
|
10.7 |
|
2015 Omnibus Equity Incentive Plan. |
|
Incorporated by reference to Appendix A to the Registrant’s Definitive Proxy Statement on Schedule 14A filed on April 30, 2015. |
|
|
|
|
|
|
|
10.8 |
|
Share Purchase Agreement, dated March 8, 2016, by and between Smith Micro Software, Inc. and Birdstep Technology ASA. |
|
Incorporated by reference to Exhibit 2.1 to the Registrant’s Current Report on Form 8-K filed on March 10, 2016. |
|
|
|
|
|
|
|
10.9 |
|
Share Purchase Agreement, dated July 19, 2016, by and between Smith Micro Software, Inc. and the selling shareholders of iMobileMagic–Mobile Experiences, LDA. |
|
Incorporated by reference to Exhibit 2.6 to the Registrant’s Current Report on Form 8-K filed on July 25, 2016. |
|
|
|
|
|
|
45
|
Exhibit No. |
|
Title |
|
Method of Filing |
|
|
|
|
|
|
|
|
Escrow Agreement, dated July 19, 2016, by and among Smith Micro Software, Inc., Computershare Trust Company, N.A., and the selling shareholders of iMobileMagic– Mobile Experiences, LDA named in Exhibit A thereto. |
|
Incorporated by reference to Exhibit 2.7 to the Registrant’s Current Report on Form 8-K filed on July 25, 2016. |
|
|
|
|
|
|
|
|
10.11 |
|
Note and Warrant Purchase Agreement, dated September 2, 2016, by and among the Company and each of the Investors. |
|
Incorporated by reference to Exhibit 10.1 to the Registrant’s Current Report on Form 8-K filed on September 7, 2016. |
|
|
|
|
|
|
|
10.12 |
|
Form of Senior Subordinated Promissory Note, dated September 6, 2016. |
|
Incorporated by reference to Exhibit 10.2 to the Registrant’s Current Report on Form 8-K filed on September 7, 2016. |
|
|
|
|
|
|
|
10.13 |
|
Form of Warrant to Purchase Common Stock, dated September 6, 2016. |
|
Incorporated by reference to Exhibit 10.3 to the Registrant’s Current Report on Form 8-K filed on September 7, 2016. |
|
|
|
|
|
|
|
10.14 |
|
Form of Registration Rights Agreement, dated September 6, 2016. |
|
Incorporated by reference to Exhibit 10.4 to the Registrant’s Current Report on Form 8-K filed on September 7, 2016. |
|
|
|
|
|
|
|
10.15 |
|
Secured Promissory Note December 6, 2016. |
|
Incorporated by reference to Exhibit 10.1 to the Registrant’s Current Report on Form 8-K filed on December 12, 2016. |
|
|
|
|
|
|
|
10.16 |
|
Amendment to Note issued to Unterberg Koller Capital Fund L.P. |
|
Incorporated by reference to Exhibit 10.1 to the Registrant’s Current Report on Form 8-K filed on December 28, 2016. |
|
|
|
|
|
|
|
10.17 |
|
Amendment to Note and Warrant issued to William W. and Dieva L. Smith. |
|
Incorporated by reference to Exhibit 10.2 to the Registrant’s Current Report on Form 8-K filed on December 28, 2016. |
|
|
|
|
|
|
|
14.1 |
|
Code of Ethics. |
|
Incorporated by reference to Exhibit 14.1 to the Registrant’s Annual Report on Form 10-K for the year ended December 31, 2003. |
|
|
|
|
|
|
|
14.1.1 |
|
Attachment 1 to Code of Ethics. |
|
Incorporated by reference to Exhibit 14.1.1 to the Registrant’s Annual Report on Form 10-K for the year ended December 31, 2003. |
|
|
|
|
|
|
|
21.1 |
|
Subsidiaries. |
|
Filed herewith. |
|
|
|
|
|
|
|
23.1 |
|
Consent of Independent Registered Public Accounting Firm. |
|
Filed herewith. |
|
|
|
|
|
|
|
31.1 |
|
Certification of the Chief Executive Officer pursuant to Section 302 of the Sarbanes-Oxley Act of 2002. |
|
Filed herewith. |
|
|
|
|
|
|
|
31.2 |
|
Certification of the Chief Financial Officer pursuant to Section 302 of the Sarbanes-Oxley Act of 2002. |
|
Filed herewith. |
|
|
|
|
|
|
|
32.1 |
|
Certifications of the Chief Executive Officer and the Chief Financial Officer pursuant to Section 906 of the Sarbanes-Oxley Act of 2002. |
|
Furnished herewith. |
|
|
|
|
|
|
|
101.INS |
|
XBRL Instance Document. |
|
Filed herewith. |
|
|
|
|
|
|
46
|
Exhibit No. |
|
Title |
|
Method of Filing |
|
|
|
|
|
|
|
|
XBRL Taxonomy Extension Schema Document. |
|
Filed herewith. |
|
|
|
|
|
|
|
|
101.CAL |
|
XBRL Taxonomy Extension Calculation Linkbase Document. |
|
Filed herewith. |
|
|
|
|
|
|
|
101.DEF |
|
XBRL Taxonomy Extension Definition Linkbase Document. |
|
Filed herewith. |
|
|
|
|
|
|
|
101.LAB |
|
XBRL Taxonomy Extension Label Linkbase Document. |
|
Filed herewith. |
|
|
|
|
|
|
|
101.PRE |
|
XBRL Taxonomy Extension Presentation Linkbase Document. |
|
Filed herewith. |
|
(b) |
Exhibits |
The exhibits filed as part of this report are listed above in Item 15(a) (3) of this Form 10-K.
|
(c) |
Financial Statement Schedule |
The Financial Statement Schedule required by Regulation S-X and Item 8 of this Form are listed above in Item 15(a)(2) of this Form 10-K.
47
Pursuant to the requirements of Section 13 or 15(d) of the Securities Exchange Act of 1934, the registrant has duly caused this report to be signed on its behalf by the undersigned thereunto duly authorized.
|
|
|
SMITH MICRO SOFTWARE, INC. |
|
|
|
|
|
Date: March 10, 2017 |
|
By:/s/ William W. Smith, Jr. |
|
|
|
William W. Smith, Jr. |
|
|
|
Chairman of the Board, |
|
|
|
President and Chief Executive Officer |
|
|
|
(Principal Executive Officer) |
|
|
|
|
|
Date: March 10, 2017 |
|
By:/s/ Steven M. Yasbek |
|
|
|
Steven M. Yasbek |
|
|
|
Vice President and Chief Financial Officer |
|
|
|
(Principal Financial and Accounting Officer) |
Pursuant to the requirements of the Securities Exchange Act of 1934, this report has been signed below by the following persons on behalf of the registrant and in the capacities and on the dates indicated.
|
Signature |
|
Title |
|
Date |
|
|
|
|
|
|
|
/s/ William W. Smith, Jr. |
|
Chairman of the Board, President and Chief Executive Officer (Principal Executive Officer) |
|
March 10, 2017 |
|
William W. Smith, Jr. |
|
|||
|
|
|
|
|
|
|
/s/ Steven M. Yasbek |
|
Vice President and Chief Financial Officer (Principal Financial and Accounting Officer) |
|
March 10, 2017 |
|
Steven M. Yasbek |
||||
|
|
|
|
|
|
|
/s/ Andrew Arno |
|
Director |
|
March 10, 2017 |
|
Andrew Arno |
|
|
||
|
|
|
|
|
|
|
/s/ Thomas G. Campbell |
|
Director |
|
March 10, 2017 |
|
Thomas G. Campbell |
|
|
|
|
|
|
|
|
|
|
|
/s/ Steven L. Elfman |
|
Director |
|
March 10, 2017 |
|
Steven L. Elfman |
|
|
|
|
|
|
|
|
|
|
|
/s/ Samuel Gulko |
|
Director |
|
March 10, 2017 |
|
Samuel Gulko |
|
|
|
|
|
|
|
|
|
|
|
/s/ Gregory J. Szabo |
|
Director |
|
March 10, 2017 |
|
Gregory J. Szabo |
|
|
|
|
48
REPORT OF INDEPENDENT REGISTERED PUBLIC ACCOUNTING FIRM
To the Board of Directors and Stockholders
Smith Micro Software, Inc.
We have audited the accompanying consolidated balance sheets of Smith Micro Software, Inc. and subsidiaries (collectively, the “Company”) as of December 31, 2016 and 2015, and the related consolidated statements of operations and comprehensive loss, stockholders’ equity and cash flows for each of the three years in the period ended December 31, 2016. Our audits also included the financial statement schedule of the Company listed in Item 15(a). These financial statements are the responsibility of the Company’s management. Our responsibility is to express an opinion on these financial statements based on our audits.
We conducted our audits in accordance with the standards of the Public Company Accounting Oversight Board (United States). Those standards require that we plan and perform the audit to obtain reasonable assurance about whether the financial statements are free of material misstatement. The Company is not required to have, nor were we engaged to perform, an audit of its internal control over financial reporting. Our audits included consideration of internal control over financial reporting as a basis for designing audit procedures that are appropriate in the circumstances, but not for the purpose of expressing an opinion on the effectiveness of the Company’s internal control over financial reporting. Accordingly, we express no such opinion. An audit also includes examining, on a test basis, evidence supporting the amounts and disclosures in the financial statements. An audit also includes assessing the accounting principles used and significant estimates made by management, as well as evaluating the overall financial statement presentation. We believe that our audits provide a reasonable basis for our opinion.
In our opinion, the consolidated financial statements referred to above present fairly, in all material respects, the financial position of the Company as of December 31, 2016 and 2015, and the results of its operations and its cash flows for each of the three years in the period ended December 31, 2016, in conformity with U.S. generally accepted accounting principles. Also, in our opinion, the related financial statement schedule, when considered in relation to the basic consolidated financial statements taken as a whole, presents fairly, in all material respects, the information set forth therein.
/s/ SingerLewak LLP
Los Angeles, California
March 10, 2017
F-1
(in thousands, except share and par value data)
|
|
|
December 31, |
|
|||||
|
|
|
2016 |
|
|
2015 |
|
||
|
Assets |
|
|
|
|
|
|
|
|
|
Current assets: |
|
|
|
|
|
|
|
|
|
Cash and cash equivalents |
|
$ |
2,229 |
|
|
$ |
8,819 |
|
|
Short-term investments |
|
|
— |
|
|
|
4,078 |
|
|
Accounts receivable, net of allowances for doubtful accounts and other adjustments of $197 (2016) and $201 (2015) |
|
|
4,962 |
|
|
|
8,145 |
|
|
Income tax receivable |
|
|
1 |
|
|
|
13 |
|
|
Inventories, net of reserves for excess and obsolete inventory of $148 (2016) and $158 (2015) |
|
|
12 |
|
|
|
39 |
|
|
Prepaid expenses and other current assets |
|
|
713 |
|
|
|
692 |
|
|
Total current assets |
|
|
7,917 |
|
|
|
21,786 |
|
|
Equipment and improvements, net |
|
|
1,811 |
|
|
|
2,492 |
|
|
Other assets |
|
|
149 |
|
|
|
195 |
|
|
Intangible assets, net |
|
|
745 |
|
|
|
— |
|
|
Goodwill |
|
|
3,686 |
|
|
|
— |
|
|
Total assets |
|
$ |
14,308 |
|
|
$ |
24,473 |
|
|
Liabilities and Stockholders' Equity |
|
|
|
|
|
|
|
|
|
Current liabilities: |
|
|
|
|
|
|
|
|
|
Accounts payable |
|
$ |
1,907 |
|
|
$ |
1,708 |
|
|
Accrued liabilities |
|
|
3,503 |
|
|
|
5,064 |
|
|
Deferred revenue |
|
|
98 |
|
|
|
440 |
|
|
Total current liabilities |
|
|
5,508 |
|
|
|
7,212 |
|
|
Non-current liabilities: |
|
|
|
|
|
|
|
|
|
Related-party notes payable, net of discount & issuance costs of $1,033 and $0, respectively |
|
|
967 |
|
|
|
— |
|
|
Notes payable, net of discount & issuance costs of $1,033 and $0, respectively |
|
|
967 |
|
|
|
— |
|
|
Warrant liability |
|
|
1,210 |
|
|
|
— |
|
|
Deferred rent and other long term liabilities |
|
|
2,971 |
|
|
|
3,235 |
|
|
Deferred tax liability, net |
|
|
181 |
|
|
|
— |
|
|
Total non-current liabilities |
|
|
6,296 |
|
|
|
3,235 |
|
|
Commitments and contingencies (Note 5) |
|
|
|
|
|
|
|
|
|
Stockholders' equity: |
|
|
|
|
|
|
|
|
|
Preferred stock, par value $0.001 per share; 5,000,000 shares authorized; none issued or outstanding |
|
|
— |
|
|
|
— |
|
|
Common stock, par value $0.001 per share; 100,000,000 shares authorized; 12,297,954 and 11,432,318 shares issued and outstanding at December 31, 2016 and December 31, 2015, respectively |
|
|
12 |
|
|
|
46 |
|
|
Additional paid-in capital |
|
|
227,889 |
|
|
|
224,867 |
|
|
Accumulated comprehensive deficit |
|
|
(225,397 |
) |
|
|
(210,887 |
) |
|
Total stockholders’ equity |
|
|
2,504 |
|
|
|
14,026 |
|
|
Total liabilities and stockholders' equity |
|
$ |
14,308 |
|
|
$ |
24,473 |
|
See accompanying notes to the consolidated financial statements.
F-2
CONSOLIDATED STATEMENTS OF OPERATIONS AND COMPREHENSIVE LOSS
(in thousands, except per share amount)
|
|
|
Year ended December 31, |
|
|||||||||
|
|
|
2016 |
|
|
2015 |
|
|
2014 |
|
|||
|
Revenues |
|
$ |
28,235 |
|
|
$ |
39,507 |
|
|
$ |
36,979 |
|
|
Cost of revenues |
|
|
7,564 |
|
|
|
8,152 |
|
|
|
9,317 |
|
|
Gross profit |
|
|
20,671 |
|
|
|
31,355 |
|
|
|
27,662 |
|
|
Operating expenses: |
|
|
|
|
|
|
|
|
|
|
|
|
|
Selling and marketing |
|
|
9,615 |
|
|
|
8,902 |
|
|
|
9,559 |
|
|
Research and development |
|
|
15,906 |
|
|
|
13,863 |
|
|
|
14,192 |
|
|
General and administrative |
|
|
10,341 |
|
|
|
11,128 |
|
|
|
13,218 |
|
|
Restructuring expenses |
|
|
303 |
|
|
|
— |
|
|
|
2,435 |
|
|
Long-lived asset impairment |
|
|
411 |
|
|
|
— |
|
|
|
— |
|
|
Total operating expenses |
|
|
36,576 |
|
|
|
33,893 |
|
|
|
39,404 |
|
|
Operating loss |
|
|
(15,905 |
) |
|
|
(2,538 |
) |
|
|
(11,742 |
) |
|
Non-operating income (expense): |
|
|
|
|
|
|
|
|
|
|
|
|
|
Change in fair value of warrant liability |
|
|
910 |
|
|
|
— |
|
|
|
— |
|
|
Change in carrying value of contingent liability |
|
|
668 |
|
|
|
— |
|
|
|
— |
|
|
Interest income (expense), net |
|
|
(389 |
) |
|
|
1 |
|
|
|
(5 |
) |
|
Other income (expense), net |
|
|
(25 |
) |
|
|
3 |
|
|
|
(3 |
) |
|
Loss before provision for income taxes |
|
|
(14,741 |
) |
|
|
(2,534 |
) |
|
|
(11,750 |
) |
|
Provision for income tax expense (benefit) |
|
|
(229 |
) |
|
|
68 |
|
|
|
49 |
|
|
Net loss |
|
|
(14,512 |
) |
|
|
(2,602 |
) |
|
|
(11,799 |
) |
|
Other comprehensive income (loss), before tax: |
|
|
|
|
|
|
|
|
|
|
|
|
|
Unrealized holding gains (losses) on available-for-sale securities |
|
|
2 |
|
|
|
(1 |
) |
|
|
— |
|
|
Income tax expense related to items of other comprehensive income |
|
|
— |
|
|
|
— |
|
|
|
— |
|
|
Other comprehensive income (expense), net of tax |
|
|
2 |
|
|
|
(1 |
) |
|
|
— |
|
|
Comprehensive loss |
|
$ |
(14,510 |
) |
|
$ |
(2,603 |
) |
|
$ |
(11,799 |
) |
|
Net loss per share: |
|
|
|
|
|
|
|
|
|
|
|
|
|
Basic and diluted |
|
$ |
(1.21 |
) |
|
$ |
(0.23 |
) |
|
$ |
(1.16 |
) |
|
Weighted average shares outstanding: |
|
|
|
|
|
|
|
|
|
|
|
|
|
Basic and diluted |
|
|
11,951 |
|
|
|
11,486 |
|
|
|
10,162 |
|
See accompanying notes to the consolidated financial statements.
F-3
CONSOLIDATED STATEMENTS OF STOCKHOLDERS’ EQUITY
(in thousands)
|
|
|
|
|
|
|
|
|
|
|
Additional |
|
|
Accumulated |
|
|
|
|
|
||
|
|
|
Common stock |
|
|
paid-in |
|
|
comprehensive |
|
|
|
|
|
|||||||
|
|
|
Shares |
|
|
Amount |
|
|
capital |
|
|
deficit |
|
|
Total |
|
|||||
|
BALANCE, December 31, 2013 |
|
|
36,994 |
|
|
$ |
37 |
|
|
$ |
214,619 |
|
|
$ |
(196,485 |
) |
|
$ |
18,171 |
|
|
Exercise of common stock options |
|
|
4 |
|
|
|
— |
|
|
|
6 |
|
|
|
— |
|
|
|
6 |
|
|
Non-cash compensation recognized on stock options and ESPP |
|
|
— |
|
|
|
— |
|
|
|
157 |
|
|
|
— |
|
|
|
157 |
|
|
Restricted stock grants, net of cancellations |
|
|
1,421 |
|
|
|
1 |
|
|
|
3,494 |
|
|
|
— |
|
|
|
3,495 |
|
|
Cancellation of shares for payment of withholding tax |
|
|
(292 |
) |
|
|
— |
|
|
|
(391 |
) |
|
|
— |
|
|
|
(391 |
) |
|
Employee stock purchase plan |
|
|
27 |
|
|
|
— |
|
|
|
21 |
|
|
|
— |
|
|
|
21 |
|
|
Issuance of common stock in a private placement |
|
|
6,846 |
|
|
|
7 |
|
|
|
5,235 |
|
|
|
|
|
|
|
5,242 |
|
|
Comprehensive loss |
|
|
— |
|
|
|
— |
|
|
|
— |
|
|
|
(11,799 |
) |
|
|
(11,799 |
) |
|
BALANCE, December 31, 2014 |
|
|
45,000 |
|
|
$ |
45 |
|
|
$ |
223,141 |
|
|
$ |
(208,284 |
) |
|
$ |
14,902 |
|
|
Exercise of common stock options |
|
|
8 |
|
|
|
— |
|
|
|
10 |
|
|
|
— |
|
|
|
10 |
|
|
Non-cash compensation recognized on stock options and ESPP |
|
|
— |
|
|
|
— |
|
|
|
186 |
|
|
|
— |
|
|
|
186 |
|
|
Restricted stock grants, net of cancellations |
|
|
1,091 |
|
|
|
1 |
|
|
|
1,966 |
|
|
|
— |
|
|
|
1,967 |
|
|
Cancellation of shares for payment of withholding tax |
|
|
(394 |
) |
|
|
— |
|
|
|
(458 |
) |
|
|
— |
|
|
|
(458 |
) |
|
Tax benefit deficiencies related to restricted stock expense |
|
|
— |
|
|
|
— |
|
|
|
5 |
|
|
|
— |
|
|
|
5 |
|
|
Employee stock purchase plan |
|
|
24 |
|
|
|
— |
|
|
|
17 |
|
|
|
— |
|
|
|
17 |
|
|
Comprehensive loss |
|
|
— |
|
|
|
— |
|
|
|
— |
|
|
|
(2,603 |
) |
|
|
(2,603 |
) |
|
BALANCE, December 31, 2015 |
|
|
45,729 |
|
|
$ |
46 |
|
|
$ |
224,867 |
|
|
$ |
(210,887 |
) |
|
$ |
14,026 |
|
|
Non-cash compensation recognized on stock options and ESPP |
|
|
— |
|
|
|
— |
|
|
|
137 |
|
|
|
— |
|
|
|
137 |
|
|
Restricted stock grants, net of cancellations |
|
|
366 |
|
|
|
— |
|
|
|
1,391 |
|
|
|
— |
|
|
|
1,391 |
|
|
Cancellation of shares for payment of withholding tax |
|
|
(126 |
) |
|
|
— |
|
|
|
(304 |
) |
|
|
— |
|
|
|
(304 |
) |
|
Employee stock purchase plan |
|
|
7 |
|
|
|
— |
|
|
|
13 |
|
|
|
— |
|
|
|
13 |
|
|
Shares issued for iMobileMagic acquisition |
|
|
611 |
|
|
|
— |
|
|
|
1,737 |
|
|
|
— |
|
|
|
1,737 |
|
|
Shares issued for interest on notes payable |
|
|
8 |
|
|
|
|
|
|
|
17 |
|
|
|
|
|
|
|
17 |
|
|
Effects of reverse stock split |
|
|
(34,297 |
) |
|
|
(34 |
) |
|
|
31 |
|
|
|
— |
|
|
|
(3 |
) |
|
Comprehensive loss |
|
|
— |
|
|
|
— |
|
|
|
— |
|
|
|
(14,510 |
) |
|
|
(14,510 |
) |
|
BALANCE, December 31, 2016 |
|
|
12,298 |
|
|
$ |
12 |
|
|
$ |
227,889 |
|
|
$ |
(225,397 |
) |
|
$ |
2,504 |
|
See accompanying notes to the consolidated financial statements.
F-4
CONSOLIDATED STATEMENTS OF CASH FLOWS
(in thousands)
|
|
|
Year ended December 31, |
|
|||||||||
|
|
|
2016 |
|
|
2015 |
|
|
2014 |
|
|||
|
Operating activities: |
|
|
|
|
|
|
|
|
|
|
|
|
|
Net loss |
|
$ |
(14,512 |
) |
|
$ |
(2,602 |
) |
|
$ |
(11,799 |
) |
|
Adjustments to reconcile net loss to net cash used in operating activities: |
|
|
|
|
|
|
|
|
|
|
|
|
|
Depreciation and amortization |
|
|
1,381 |
|
|
|
1,904 |
|
|
|
2,931 |
|
|
Amortization of debt discounts and financing issuance costs |
|
|
247 |
|
|
|
— |
|
|
|
— |
|
|
Long-lived asset impairment |
|
|
411 |
|
|
|
|
|
|
|
|
|
|
Change in fair value of warrant liability |
|
|
(910 |
) |
|
|
— |
|
|
|
— |
|
|
Change in carrying value of contingent liability |
|
|
(668 |
) |
|
|
— |
|
|
|
— |
|
|
Provision for adjustments to accounts receivable and doubtful accounts |
|
|
70 |
|
|
|
31 |
|
|
|
347 |
|
|
Provision for excess and obsolete inventory |
|
|
11 |
|
|
|
48 |
|
|
|
124 |
|
|
Loss on disposal of fixed assets |
|
|
27 |
|
|
|
1 |
|
|
|
— |
|
|
Tax benefits from stock-based compensation |
|
|
— |
|
|
|
(5 |
) |
|
|
— |
|
|
Non-cash compensation related to stock options and restricted stock |
|
|
1,528 |
|
|
|
2,158 |
|
|
|
3,652 |
|
|
Deferred income taxes |
|
|
(137 |
) |
|
|
— |
|
|
|
(2 |
) |
|
Change in operating accounts: |
|
|
|
|
|
|
|
|
|
|
|
|
|
Accounts receivable |
|
|
3,368 |
|
|
|
40 |
|
|
|
(1,000 |
) |
|
Income tax receivable |
|
|
115 |
|
|
|
688 |
|
|
|
(7 |
) |
|
Inventories |
|
|
16 |
|
|
|
10 |
|
|
|
(54 |
) |
|
Prepaid expenses and other assets |
|
|
344 |
|
|
|
92 |
|
|
|
114 |
|
|
Accounts payable and accrued liabilities |
|
|
(1,966 |
) |
|
|
(1,362 |
) |
|
|
(2,189 |
) |
|
Deferred revenue |
|
|
(828 |
) |
|
|
(1,058 |
) |
|
|
1,034 |
|
|
Net cash used in operating activities |
|
|
(11,503 |
) |
|
|
(55 |
) |
|
|
(6,849 |
) |
|
Investing activities: |
|
|
|
|
|
|
|
|
|
|
|
|
|
Acquisition of Birdstep Technology, net of cash received |
|
|
(1,927 |
) |
|
|
— |
|
|
|
— |
|
|
Acquisition of iMobileMagic, net of cash received |
|
|
(558 |
) |
|
|
— |
|
|
|
— |
|
|
Capital expenditures |
|
|
(500 |
) |
|
|
(124 |
) |
|
|
(216 |
) |
|
Proceeds from the sale of short-term investments |
|
|
4,079 |
|
|
|
— |
|
|
|
198 |
|
|
Purchases of short-term investments |
|
|
— |
|
|
|
(1,199 |
) |
|
|
— |
|
|
Net cash provided by (used in) investing activities |
|
|
1,094 |
|
|
|
(1,323 |
) |
|
|
(18 |
) |
|
Financing activities: |
|
|
|
|
|
|
|
|
|
|
|
|
|
Cash received from issuance of common stock, net of offering costs |
|
|
— |
|
|
|
— |
|
|
|
5,242 |
|
|
Cash received from related-party notes payable, net of issuance costs ($97) |
|
|
1,903 |
|
|
|
— |
|
|
|
— |
|
|
Cash received from notes payable, net of issuance costs ($97) |
|
|
1,903 |
|
|
|
— |
|
|
|
— |
|
|
Cash received from stock sale for employee stock purchase plan |
|
|
13 |
|
|
|
17 |
|
|
|
21 |
|
|
Cash received from exercise of stock options |
|
|
— |
|
|
|
10 |
|
|
|
6 |
|
|
Tax benefits received from stock-based compensation |
|
|
— |
|
|
|
5 |
|
|
|
— |
|
|
Net cash provided by financing activities |
|
|
3,819 |
|
|
|
32 |
|
|
|
5,269 |
|
|
Net decrease in cash and cash equivalents |
|
|
(6,590 |
) |
|
|
(1,346 |
) |
|
|
(1,598 |
) |
|
Cash and cash equivalents, beginning of period |
|
|
8,819 |
|
|
|
10,165 |
|
|
|
11,763 |
|
|
Cash and cash equivalents, end of period |
|
$ |
2,229 |
|
|
$ |
8,819 |
|
|
$ |
10,165 |
|
|
Supplemental disclosures of cash flow information: |
|
|
|
|
|
|
|
|
|
|
|
|
|
Cash paid for income taxes |
|
$ |
27 |
|
|
$ |
17 |
|
|
$ |
75 |
|
|
Cash paid for interest expense |
|
$ |
21 |
|
|
$ |
— |
|
|
$ |
— |
|
|
Change in unrealized gain (loss) on short-term investments |
|
$ |
2 |
|
|
$ |
(1 |
) |
|
$ |
— |
|
See accompanying notes to the consolidated financial statements.
F-5
NOTES TO CONSOLIDATED FINANCIAL STATEMENTS
1. Organization, Basis of Presentation and Summary of Significant Accounting Policies
The Company
Smith Micro Software, Inc. (“Smith Micro,” “Company,” “we,” “us,” and “or”) develops software to simplify and enhance the mobile experience, providing solutions to leading wireless service providers, device manufacturers, and enterprise businesses around the world. From optimizing wireless networks to uncovering customer experience insights, and from streamlining Wi-Fi access to ensuring family safety, our solutions enrich connected lifestyles while creating new opportunities to engage consumers via smartphones. Our portfolio also includes a wide range of products for creating, sharing, and monetizing rich content, such as visual messaging, video streaming, and 2D/3D graphics applications. With this as a focus, it is Smith Micro’s mission to help our customers thrive in a connected world.
Over the past three decades, Smith Micro has developed deep expertise in embedded software for mobile devices, policy-based management platforms, and highly-scalable client and server applications. Tier 1 mobile network operators, cable providers, OEMs/device manufacturers, and enterprise businesses across a wide range of industries use our software to capitalize on the growth of connected consumers and the Internet of Things (“IoT”).
In general, we help our customers:
|
|
• |
Optimize networks, reduce operational costs, and deliver “best-connected” user experiences; |
|
|
• |
Manage mobile devices over-the-air for maximum performance, efficiency, reliability and cost-effectiveness; |
|
|
• |
Provide greater insight into the mobile user experience to improve service quality and customer loyalty; |
|
|
• |
Engage and grow high-value relationships with their customers using smartphones. |
We continue to innovate and evolve our business to take advantage of industry trends and opportunities in emerging markets, such as “Big Data” analytics, the explosion of Wi-Fi hotspots, and business-to-consumer (“B2C”) mobile marketing and advertising. The key to our longevity, however, is not simply technology innovation, but a never-ending focus on customer value.
Basis of Presentation
The accompanying consolidated financial statements reflect the operating results and financial position of Smith Micro and its wholly owned subsidiaries in accordance with accounting principles generally accepted in the United States of America. All intercompany amounts have been eliminated in consolidation.
Foreign Currency Transactions
The Company has international operations resulting from current and prior year acquisitions. The countries in which the Company has a subsidiary or branch office in are Serbia, Sweden, Portugal, the United Kingdom and Canada. The functional currency for all of these foreign entities is the U.S. dollar in accordance with the Financial Accounting Standards Board (“FASB”) Accounting Standards Codification (“ASC”) Topic No. 830-30, Foreign Currency Matters-Translation of Financial Statements. Foreign currency transactions that increase or decrease expected functional currency cash flows is a foreign currency transaction gain or loss that are included in determining net income for the period in which the exchange rate changes. Likewise, a transaction gain or loss (measured from the transaction date or the most recent intervening balance sheet date, whichever is later) realized upon settlement of a foreign currency transaction is included in determining net income for the period in which the transaction is settled.
F-6
The Company applies the provisions of FASB ASC Topic No. 805, Business Combinations, in the accounting for its acquisitions, which requires recognition of the assets acquired and the liabilities assumed at their acquisition date fair values, separately from goodwill. Goodwill as of the acquisition date is measured as the excess of consideration transferred over the net of the acquisition date fair values of the tangible and identifiable intangible assets acquired and liabilities assumed. While the Company uses its best estimates and assumptions to accurately value assets acquired and liabilities assumed at the acquisition date as well as contingent consideration, where applicable, its estimates are inherently uncertain and subject to refinement. As a result, during the measurement period that exists up to twelve months from the acquisition date, the Company may record adjustments to the tangible and specifically identifiable intangible assets acquired and liabilities assumed with a corresponding adjustment to goodwill in the reporting period in which the adjusted amounts are determined. Upon the conclusion of the measurement period or final determination of the values of assets acquired and liabilities assumed, whichever comes first, the impact of any subsequent adjustments is included in the consolidated statements of operations.
Costs to exit or restructure certain activities of an acquired company or the Company’s internal operations are accounted for as a one-time termination and exit cost pursuant to FASB ASC Topic No. 420, Exit or Disposal Cost Obligations, and are accounted for separately from the business combination. A liability for costs associated with an exit or disposal activity is recognized and measured at its fair value in the Company’s consolidated statement of operations in the period in which the liability is incurred.
Uncertain income tax positions and tax-related valuation allowances that are acquired in connection with a business combination are initially estimated as of the acquisition date. The Company reevaluates these items quarterly based upon facts and circumstances that existed as of the acquisition date, with any adjustments to the preliminary estimates being recorded to goodwill if such adjustments occur within the 12-month measurement period. Subsequent to the end of the measurement period or the Company’s final determination of the value of the tax allowance or contingency, whichever comes first, changes to these uncertain tax positions and tax-related valuation allowances will affect the provision for income taxes in the consolidated statement of operations, and could have a material impact on results of operations and financial position.
Use of Estimates
The preparation of consolidated financial statements in conformity with accounting principles generally accepted in the U.S. requires management to make estimates and assumptions that affect the reported amounts in the consolidated financial statements and accompanying notes. Actual results could differ from those estimates.
Fair Value of Financial Instruments
The Company measures and discloses fair value measurements as required by FASB ASC Topic No. 820, Fair Value Measurements and Disclosures.
Fair value is an exit price, representing the amount that would be received to sell an asset or paid to transfer a liability in an orderly transaction between market participants. As such, fair value is a market-based measurement that is determined based on assumptions that market participants would use in pricing an asset or a liability. As a basis for considering such assumptions, the FASB establishes a three-tier value hierarchy, which prioritizes the inputs used in the valuation methodologies in measuring fair value:
|
|
• |
Level 1 - Observable inputs that reflect quoted prices (unadjusted) for identical assets or liabilities in active markets. |
|
|
• |
Level 2 - Include other inputs that are directly or indirectly observable in the marketplace. |
|
|
• |
Level 3 - Unobservable inputs which are supported by little or no market activity. |
F-7
The fair value hierarchy also requires an entity to maximize the use of observable inputs and minimize the use of unobservable inputs when measuring fair value.
As required by FASB ASC Topic No. 820, we measure our cash equivalents and short-term investments at fair value. Our cash equivalents and short-term investments are classified within Level 1 by using quoted market prices utilizing market observable inputs.
As required by FASB ASC Topic No. 825, Financial Instruments, an entity can choose to measure at fair value many financial instruments and certain other items that are not currently required to be measured at fair value. Subsequent changes in fair value for designated items are required to be reported in earnings in the current period. This Topic also establishes presentation and disclosure requirements for similar types of assets and liabilities measured at fair value. As permitted, the Company has elected not to use the fair value option to measure our available-for-sale securities under this Topic and will continue to report as required by FASB ASC Topic No. 320, Investments-Debt and Equity Securities. We have made this election because the nature of our financial assets and liabilities are not of such complexity that they would benefit from a change in valuation to fair value.
As required by FASB ASC Topic No. 350, for goodwill and other intangibles impairment analysis, we utilize fair value measurements which are categorized within Level 3 of the fair value hierarchy.
Our warrant liability is classified within Level 3 as some of the inputs to our valuation model are either not observable quoted prices or are not derived principally from or corroborated by observable market data by correlation or other means. The carrying values of all other assets and liabilities approximate fair value
As required by FASB ASC Topic No. 820, we measure our warrant liability at fair value. Our warrant liability is classified within Level 3 as some of the inputs to our valuation model are either not observable quoted prices or are not derived principally from or corroborated by observable market data by correlation or other means. The carrying values of all other assets and liabilities approximate fair value.
Significant Concentrations
For the year ended December 31, 2016, two customers, each accounting for over 10% of revenues, made up 76.1% of revenues and 80% of accounts receivable, and one service provider with more than 10% of purchases totaled 24% of accounts payable. For the year ended December 31, 2015, two customers, each accounting for over 10% of revenues, made up 76.7% of revenues and 83% of accounts receivable, and one service provider with more than 10% of purchases totaled 13% of accounts payable. For the year ended December 31, 2014, two customers, each accounting for over 10% of revenues, made up 79.2% of revenues and 87% of accounts receivable, and one service provider with more than 10% of purchases totaled 27% of accounts payable.
Cash and Cash Equivalents
Cash and cash equivalents generally consist of cash, government securities, mutual funds, and money market funds. These securities are primarily held in two financial institutions and are uninsured except for the minimum Federal Deposit Insurance Corporation coverage, and have original maturity dates of three months or less. As of December 31, 2016 and 2015, bank balances totaling approximately $2.1 million and $8.5 million, respectively, were uninsured.
Short-Term Investments
Short-term investments have consisted of corporate notes, bonds, and commercial paper and U.S. government agency and government sponsored enterprise obligations. The Company accounts for these short-term investments as required by FASB ASC Topic No. 320, Investments-Debt and Equity Securities. These debt and equity securities are not classified as either held-to-maturity securities or trading securities. As such, they are classified as available-for-sale securities. Available-for-sale securities are recorded at fair value, with
F-8
unrealized gains or losses recorded as a separate component of accumulated other comprehensive income in stockholders’ equity until realized.
Accounts Receivable and Allowance for Doubtful Accounts
We sell our products worldwide. We perform ongoing credit evaluations of our customers and adjust credit limits based upon payment history, the customer’s current credit worthiness and various other factors, as determined by our review of their current credit information. We continuously monitor collections and payments from our customers. We estimate credit losses and maintain an allowance for doubtful accounts reserve based upon these estimates. While such credit losses have historically been within our estimated reserves, we cannot guarantee that we will continue to experience the same credit loss rates that we have in the past. If not, this could have an adverse effect on our consolidated financial statements. Allowances for product returns are included in other adjustments to accounts receivable on the accompanying consolidated balance sheets. Product returns are estimated based on historical experience and have also been within management’s estimates.
Inventories
Inventories consist principally of compact disks (“CDs”), boxes and manuals and are stated at the lower of cost (determined by the first-in, first-out method) or market. The Company regularly reviews its inventory quantities on hand and records a provision for excess and obsolete inventory based primarily on management’s forecast of product demand and production requirements. At December 31, 2016 and 2015, our net inventory of $12,000 and $39,000 respectively, consisted mostly of components.
Equipment and Improvements
Equipment and improvements are stated at cost. Depreciation is computed using the straight-line method based on the estimated useful lives of the assets, generally ranging from three to seven years. Leasehold improvements are amortized using the straight-line method over the shorter of the estimated useful life of the asset or the lease term.
Internal Software Development Costs
Development costs incurred in the research and development of new software products and enhancements to existing software products are expensed as incurred until technological feasibility has been established. The Company considers technological feasibility to be established when all planning, designing, coding, and testing has been completed according to design specifications. After technological feasibility is established, any additional costs are capitalized. Through December 31, 2016, software has been substantially completed concurrently with the establishment of technological feasibility; accordingly, no costs have been capitalized to date.
Impairment or Disposal of Long Lived Assets
Long-lived assets to be held are reviewed for events or changes in circumstances which indicate that their carrying value may not be recoverable. They are tested for recoverability using undiscounted cash flows to determine whether or not impairment to such value has occurred as required by FASB ASC Topic No. 360, Property, Plant, and Equipment. The Company determined there was an impairment of its Customer Relationships intangible asset in the amount of $0.4 million as of December 31, 2016.
Goodwill
In accordance with FASB ASC Topic No. 350, Intangibles-Goodwill and Other, we review the recoverability of the carrying value of goodwill at least annually or whenever events or circumstances indicate a potential impairment. The Company’s annual impairment testing date is December 31. Recoverability of goodwill is determined by comparing the fair value of the Company’s reporting units to the carrying value of the
F-9
underlying net assets in the reporting units. If the fair value of a reporting unit is determined to be less than the carrying value of its net assets, goodwill is deemed impaired and an impairment loss is recognized to the extent that the carrying value of goodwill exceeds the difference between the fair value of the reporting unit and the fair value of its other assets and liabilities.
Intangible Assets and Amortization
Amortization expense related to other intangibles acquired in acquisitions is calculated on a straight line basis over the useful lives.
Derivative Liabilities
The Company analyzes all financial instruments with features of both liabilities and equity under FASB ASC Topic No. 480, Distinguishing Liabilities From Equity and FASB ASC Topic No. 815, Derivatives and Hedging. Derivative liabilities are adjusted to reflect fair value at each period end, with any increase or decrease in the fair value being recorded in results of operations as adjustments to fair value of derivatives. The effects of interactions between embedded derivatives are calculated and accounted for in arriving at the overall fair value of the financial instruments. In addition, the fair values of freestanding derivative instruments such as warrant derivatives are valued using the Black-Scholes model.
Deferred Rent and Other Long-Term Liabilities
The long-term liabilities are for deferred rent to account for the difference between straight-line and bargain rents, lease incentives included in deferred rent, restructuring expenses, and sublease deposits.
Going Concern Evaluation
In connection with preparing consolidated financial statements for the year ended December 31, 2016, management evaluated whether there were conditions and events, considered in the aggregate, that raised substantial doubt about the Company’s ability to continue as a going concern within one year from the date that the financial statements are issued.
The Company considered the following:
|
|
• |
Operating losses for seven consecutive quarters. |
|
|
• |
Negative cash flow from operating activities for three consecutive quarters. |
|
|
• |
Depressed stock price resulting in being non-compliant with NASDAQ listing rules to maintain a stock price of $1.00/share resulting in the necessity to execute a 1:4 reverse stock split. |
|
|
• |
Loss of 32% of revenue from our number one customer, Sprint, in fiscal year 2016 versus fiscal year 2015. |
Ordinarily, conditions or events that raise substantial doubt about an entity’s ability to continue as a going concern relate to the entity’s ability to meet its obligations as they become due.
The Company evaluated its ability to meet its obligations as they become due within one year from the date that the financial statements are issued by considering the following:
|
|
• |
The Company raised $4.0 million of debt financing during the year ended December 31, 2016. |
|
|
• |
The Company has been able to raise capital from short-term loans from its Board members. |
|
|
• |
As a result of the Company’s restructuring that was implemented during the three months ended December 31, 2016, and again during the first quarter of fiscal 2017, the Company’s cost structure is now in line with its current baseline revenue projections. See Footnote 3 for additional details regarding restructuring. |
F-10
Management believes that the Company will generate enough cash from operations to satisfy its obligations for the next twelve months.
The Company will take the following actions if it starts to trend unfavorable to its internal profitability and cash flow projections, in order to mitigate conditions or events that would raise substantial doubt about its ability to continue as a going concern:
|
|
• |
Raise additional capital through short-term loans. |
|
|
• |
Implement additional restructuring and cost reductions. |
|
|
• |
Raise additional capital through a private placement. |
|
|
• |
Secure a commercial bank line of credit. |
|
|
• |
Dispose of one or more product lines. |
|
|
• |
Sell or license intellectual property. |
Revenue Recognition
We currently report our net revenues under two operating groups: Wireless and Graphics. Within each of these groups, software revenue is recognized based on the customer and contract type. We recognize revenue when persuasive evidence of an arrangement exists, delivery has occurred, the price is fixed and determinable, and collectability is probable as required by FASB ASC Topic No. 605-985, Revenue Recognition-Software. We recognize revenues from sales of our software to our customers or end users as completed products are shipped and title passes or from royalties generated as authorized customers duplicate our software, if the other requirements are met. If the requirements are not met at the date of shipment, revenue is not recognized until these elements are known or resolved. For Wireless sales, returns from customers are limited to defective goods or goods shipped in error. Historically, customer returns have not exceeded the very nominal estimates and reserves. We also provide some technical support to our customers. Such costs have historically been insignificant.
We have a few multiple element agreements for which we have contracted to provide a perpetual license for use of proprietary software, to provide non-recurring engineering, and in some cases, to provide software maintenance (post contract support). For these software and software-related multiple element arrangements, we must: (1) determine whether and when each element has been delivered; (2) determine whether undelivered products or services are essential to the functionality of the delivered products and services; (3) determine the fair value of each undelivered element using vendor-specific objective evidence (“VSOE”); and (4) allocate the total price among the various elements. VSOE of fair value is used to allocate a portion of the price to the undelivered elements and the residual method is used to allocate the remaining portion to the delivered elements. Absent VSOE, revenue is deferred until the earlier of the point at which VSOE of fair value exists for any undelivered element or until all elements of the arrangement have been delivered. However, if the only undelivered element is post contract support, the entire arrangement fee is recognized ratably over the performance period. We determine VSOE for each element based on historical stand-alone sales to third parties or from the stated renewal rate for the elements contained in the initial arrangement. In determining VSOE, we require that a substantial majority of the selling prices for a product or service fall within a reasonably narrow pricing range. We have established VSOE for our post contract support services and non-recurring engineering.
On occasion, we enter into fixed fee arrangements, i.e. for trials, in which customer payments are tied to the achievement of specific milestones. Revenue for these contracts is recognized based on customer acceptance of certain milestones as they are achieved. We also enter hosting arrangements that sometimes include up-front, non-refundable set-up fees. Revenue is recognized for these fees over the term of the agreement.
For Graphics sales, management reviews available retail channel information and makes a determination of a return provision for sales made to distributors and retailers based on current channel inventory levels and historical return patterns. Certain sales to distributors or retailers are made on a consignment basis. Revenue
F-11
for consignment sales are not recognized until sell through to the final customer is established. Certain revenues are booked net of revenue sharing payments. Sales directly to end users are recognized upon shipment. End users have a thirty-day right of return, but such returns are reasonably estimable and have historically been immaterial. We also provide technical support to our customers. Such costs have historically been insignificant.
Sales Incentives
For our Graphics sales, the cost of sales incentives the Company offers without charge to customers that can be used in, or that are exercisable by a customer as a result of, a single exchange transaction is accounted for as a reduction of revenue as required by FASB ASC Topic No. 605-50, Revenue Recognition-Customer Payments and Incentives. We use historical redemption rates to estimate the cost of customer incentives. Total sales incentives were $0.3 million, $0.2 million and $0.5 million for the years ended December 31, 2016, 2015, and 2014, respectively.
Advertising Expense
Advertising costs are expensed as incurred. Advertising expenses were $0.5 million, $0.3 million, and $0.3 million for the years ended December 31, 2016, 2015, and 2014, respectively.
Stock-Based Compensation
The Company accounts for all stock-based payment awards made to employees and directors based on their fair values and recognized as compensation expense over the vesting period using the straight-line method over the requisite service period for each award as required by FASB ASC Topic No. 718, Compensation-Stock Compensation.
F-12
The Company calculates earnings per share (“EPS”) as required by FASB ASC Topic No. 260, Earning Per Share. Basic EPS is calculated by dividing the net income available to common stockholders by the weighted average number of common shares outstanding for the period, excluding common stock equivalents. Diluted EPS is computed by dividing the net income available to common stockholders by the weighted average number of common shares outstanding for the period, plus the weighted average number of dilutive common stock equivalents outstanding for the period determined using the treasury-stock method. For purposes of this calculation, common stock subject to repurchase by the Company and options are considered to be common stock equivalents, and are only included in the calculation of diluted earnings per share when their effect is dilutive.
|
|
|
Year Ended December 31, |
|
|||||||||
|
|
|
2016 |
|
|
2015 |
|
|
2014 |
|
|||
|
|
|
(in thousands, except per share amounts) |
|
|||||||||
|
Numerator: |
|
|
|
|
|
|
|
|
|
|
|
|
|
Net loss available to common stockholders |
|
$ |
(14,512 |
) |
|
$ |
(2,602 |
) |
|
$ |
(11,799 |
) |
|
Denominator: |
|
|
|
|
|
|
|
|
|
|
|
|
|
Weighted average shares outstanding - basic |
|
|
11,951 |
|
|
|
11,486 |
|
|
|
10,162 |
|
|
Potential common shares - options (treasury stock method) |
|
|
— |
|
|
|
— |
|
|
|
— |
|
|
Weighted average shares outstanding - diluted |
|
|
11,951 |
|
|
|
11,486 |
|
|
|
10,162 |
|
|
Shares excluded (anti-dilutive) |
|
|
— |
|
|
|
17 |
|
|
|
37 |
|
|
Shares excluded due to an exercise price greater than weighted average stock price for the period |
|
|
2,094 |
|
|
|
383 |
|
|
|
377 |
|
|
Net loss per common share: |
|
|
|
|
|
|
|
|
|
|
|
|
|
Basic |
|
$ |
(1.21 |
) |
|
$ |
(0.23 |
) |
|
$ |
(1.16 |
) |
|
Diluted |
|
$ |
(1.21 |
) |
|
$ |
(0.23 |
) |
|
$ |
(1.16 |
) |
Recently Adopted Accounting Pronouncements
In September 2015, FASB issued ASU No. 2015-16, Business Combinations (Topic 805): Simplifying the Accounting for Measurement-Period Adjustments as part of the Board’s Simplification Initiative. This Update requires:
|
|
• |
An acquirer to recognize adjustments to provisional amounts identified during the measurement period in the reporting period in which the adjustment amounts are determined. |
|
|
• |
An acquirer to record, in the same period’s financial statements, the effect on earnings of changes in depreciation, amortization, or other income effects resulting from the change to the provisional amounts. This effect is required to be calculated as if the accounting had been completed at the acquisition date. |
|
|
• |
An entity to present separately on the face of the income statement or disclose in the notes the portion of the amount recorded in current-period earnings by line item that would have been recorded in previous reporting periods if the adjustment to the provisional amounts had been recognized as of the acquisition date. |
The guidance was effective for financial statements issued for annual periods beginning after December 15, 2015, including interim periods within those fiscal years. The Company has adopted this standard and it did not have a material impact on the Company’s consolidated financial statements.
In April 2015, FASB issued ASU No. 2015-03, Interest-Imputation of Interest (Topic 835-30): This Update requires that debt issuance costs be presented in the balance sheet as a direct deduction from the carrying amount of debt liability, consistent with debt discounts or premiums. The Company has adopted this standard
F-13
during fiscal year 2016 and it did not have a material impact on the Company’s consolidated financial statements.
In August 2014, the FASB issued ASU No. 2014-15, Presentation of Financial Statements-Going Concern (Subtopic 205-40). The Update provides U.S. GAAP guidance on management’s responsibility in evaluating whether there is substantial doubt about a company’s ability to continue as a going concern and about related footnote disclosures. For each reporting period, management will be required to evaluate whether there are conditions or events that raise substantial doubt about a company’s ability to continue as a going concern within one year from the date the financial statements are issued. The amendments in this Update are effective for the annual period ending after December 15, 2016, and for annual periods and interim periods thereafter. The Company has adopted this standard and it had no impact on the Company’s consolidated financial statements other than additional required disclosure.
Recently Issued Accounting Standards not yet Adopted
In August 2016, the FASB issued ASU No. 2016-15, Statement of Cash Flows (Topic 230): Classification of Certain Cash Receipts and Cash Payments, to reduce the existing diversity in how certain cash receipts and cash payments are presented and classified in the statement of cash flows. Amendments in this update are effective for annual periods beginning after December 15, 2017, and interim periods within those annual periods. Early adoption is permitted for any entity in any interim or annual period. If an entity early adopts the amendments in an interim period, any adjustments should be reflected as of the beginning of the fiscal year that includes that interim period. An entity that elects early adoption must adopt all of the amendments in the same period. The Company will be evaluating the impact of this guidance on our consolidated financial statements.
In March 2016, the FASB issued final guidance in ASU No. 2016-09, Improvements to Employee Share-Based Payment Accounting, which will change certain aspects of accounting for share-based payments to employees. The new guidance will require all income tax effects of awards to be recognized in the income statement when the awards vest or are settled. It will also allow an employer to repurchase more of an employee’s shares than it currently can for tax withholding purposes without triggering liability accounting and to make a policy election to account for forfeitures as they occur. The guidance is effective for financial statements issued for annual periods beginning after December 15, 2016. Early adoption is permitted for all companies in any interim or annual period, and must be adopted on a modified prospective approach. Due to the Company applying a full valuation allowance against its deferred tax assets, the nature of the change on the balance sheet will not be material.
In February 2016, the FASB issued ASU No. 2016-02, Leases (Topic 842), to increase transparency and comparability among organizations by recognizing all lease transactions (with terms in excess of 12 months) on the balance sheet as a lease liability and a right-of-use asset (as defined). The ASU is effective for fiscal years beginning after December 15, 2018, including interim periods within those fiscal years, with earlier application permitted. Upon adoption, the lessee will apply the new standard retrospectively to all periods presented or retrospectively using a cumulative effect adjustment in the year of adoption. The Company will be evaluating the impact of this guidance on our consolidated financial statements.
In January 2016, the FASB issued ASU No. 2016-01, Financial Instruments-Overall (Topic 825-10). The Amendments to this Update require all equity investments to be measured at fair value with changes in the fair value recognized through net income (other than those accounted for under equity method of accounting or those that result in consolidation of the investee). The amendments in this Update also require an entity to present separately in other comprehensive income the portion of the total change in the fair value of a liability resulting from a change in the instrument-specific credit risk when the entity has elected to measure the liability at fair value in accordance with the fair value option for financial instruments. In addition, the amendments in this Update requires disclosure of the method(s) and significant assumptions used to estimate the fair value that is required to be disclosed for financial instruments measured at amortized cost on the balance sheet. For public business entities, the amendments in this Update are effective for fiscal years beginning after December 15, 2017, including interim periods within those fiscal years. Early application by public business entities to financial statements of fiscal years or interim periods that have not yet been issued
F-14
or, by all other entities, that have not yet been made available for issuance of the following amendments in this Update are permitted as of the beginning of the fiscal year of adoption - an entity should present separately in other comprehensive income the portion of the total change in the fair value of a liability resulting from a change in the instrument-specific credit risk if the entity has elected to measure the liability at fair value in accordance with the fair value option for financial instruments. The Company will be evaluating the impact of this guidance on our consolidated financial statements.
In May 2014, the FASB issued ASU No. 2014-09, Revenue from Contracts with Customers (Topic 606). The amendments to this Update supersede nearly all existing revenue recognition guidance under U.S. GAAP. The core principle of this Topic is to recognize revenues when promised goods or services are transferred to customers in an amount that reflects the consideration that is expected to be received for those goods or services. This Topic defines a five-step process to achieve this core principle and, in doing so, it is possible more judgment and estimates may be required within the revenue recognition process than required under existing U.S. GAAP including identifying performance obligations in the contract, estimating the amount of variable consideration to include in the transaction price and allocating the transaction price to each separate performance obligation. In July 2015, the FASB deferred the effective date for annual reporting periods beginning after December 15, 2017 (including interim reporting periods within those periods). Early adoption is permitted to the original effective date of December 15, 2016 (including interim reporting periods within those periods). The amendments may be applied retrospectively to each prior period presented or retrospectively with the cumulative effect recognized as of the date of initial application. The Company will be evaluating the impact of this guidance on our consolidated financial statements.
2. Acquisitions
The Company applies the provisions of FASB ASC Topic No. 805, Business Combinations, in the accounting for its acquisitions, which requires recognition of the assets acquired and the liabilities assumed at their acquisition date fair values, separately from goodwill. Goodwill as of the acquisition date is measured as the excess of consideration transferred over the net of the acquisition date fair values of the tangible and identifiable intangible assets acquired and liabilities assumed. While the Company uses its best estimates and assumptions to accurately value assets acquired and liabilities assumed at the acquisition date as well as contingent consideration, where applicable, its estimates are inherently uncertain and subject to refinement. As a result, during the measurement period that exists up to 12 months from the acquisition date, the Company may record adjustments to the tangible and specifically identifiable intangible assets acquired and liabilities assumed with a corresponding adjustment to goodwill. Upon the conclusion of the measurement period or final determination of the values of assets acquired and liabilities assumed, whichever comes first, the impact of any subsequent adjustments is included in the consolidated statements of operations.
Costs to exit or restructure certain activities of an acquired company or the Company’s internal operations are accounted for as a one-time termination and exit cost pursuant to FASB ASC Topic No. 420, Exit or Disposal Cost Obligations, and are accounted for separately from the business combination. A liability for costs associated with an exit or disposal activity is recognized and measured at its fair value in the Company’s consolidated statement of operations in the period in which the liability is incurred.
Uncertain income tax positions and tax-related valuation allowances that are acquired in connection with a business combination are initially estimated as of the acquisition date. The Company reevaluates these items quarterly based upon facts and circumstances that existed as of the acquisition date, with any adjustments to the preliminary estimates being recorded to goodwill if such adjustments occur within the 12-month measurement period. Subsequent to the end of the measurement period or the Company’s final determination of the value of the tax allowance or contingency, whichever comes first, changes to these uncertain tax positions and tax-related valuation allowances will affect the provision for income taxes in the consolidated statement of operations, and could have a material impact on results of operations and financial position.
iMobileMagic – Mobile Experiences, LDA
On July 19, 2016, the Company and iMobileMagic – Mobile Experiences, LDA (“iMM”), a Portuguese limited liability company, entered into a Share Purchase Agreement (the “Share Purchase Agreement”)
F-15
pursuant to which the Company agreed to acquire 100% of the outstanding share capital (the “Shares”) of iMM. Under the terms of the Share Purchase Agreement, the aggregate purchase price for the Shares, Shareholders Credits and the share held by Seller Marco Leal in the share capital of the Portuguese company “Fammly, Lda.”, consisted of the following consideration (collectively, the “Purchase Price”): (i) €500,000 in cash, plus €20,238 in cash corresponding to the difference between cash and debt (excluding the Shareholders Credits) of the Company as of June 30, 2016, in a total of €520,238 or equivalent value of $580,577 in cash (the “Cash Consideration”); (ii) €500,000 or equivalent value of $578,994 in value of Buyer’s common stock (the “Initial Shares”); and (iii) €1,000,000 or equivalent value of $1,157,989 in value of Buyer’s common stock to be held in escrow pursuant to the Escrow Agreement (the “Escrowed Shares”). As a result of the Acquisition, iMM has become a wholly-owned subsidiary of the Company. Approximately 16 employees continued as employees of iMM following the Closing. Acquisition-related costs of $0.2 million were recorded as expense in fiscal year 2016 in the general and administrative section of the consolidated statement of operations.
The total purchase price is summarized as follows (in thousands):
|
Cash paid at closing |
|
$ |
581 |
|
|
Common stock |
|
|
1,737 |
|
|
Total purchase price |
|
$ |
2,318 |
|
The Company’s allocation of the purchase price is summarized as follows (in thousands):
|
Assets: |
|
|
|
|
|
Cash and cash equivalents |
|
$ |
23 |
|
|
Short term investments |
|
|
1 |
|
|
Accounts receivable |
|
|
156 |
|
|
Prepaids and other current assets |
|
|
8 |
|
|
Intangible assets |
|
|
683 |
|
|
Goodwill |
|
|
1,695 |
|
|
Total assets |
|
$ |
2,566 |
|
|
Liabilities: |
|
|
|
|
|
Accounts payable |
|
$ |
13 |
|
|
Accrued liabilities |
|
|
64 |
|
|
Deferred tax liability |
|
|
171 |
|
|
Total liabilities |
|
$ |
248 |
|
|
Total purchase price |
|
$ |
2,318 |
|
The results of operations of iMobileMagic have been included in the Company’s consolidated financial statements from the date of acquisition. The pro-forma effect of the acquisition on historical periods is not material and therefore is not included.
The purpose of the iMobileMagic acquisition was to enter into the fast growing international family services, location-tracking market.
Birdstep Technology AB
On April 7, 2016, pursuant to the Share Purchase Agreement, dated as of March 8, 2016, by and between the Company and Birdstep Technology ASA (“Birdstep”), the Company completed its acquisition of 100% of the outstanding capital stock of Birdstep’s wholly owned Swedish subsidiary, Birdstep Technology AB (the “Acquisition”). Pursuant to the terms of the Share Purchase Agreement, the Company paid a net purchase price of $2,000,000 in cash to Birdstep at the closing. As a result of the Acquisition, Birdstep Technology AB became a wholly-owned subsidiary of the Company. Approximately 18 employees continued as employees of Birdstep Technology AB following the Closing. Acquisition-related costs of $0.2 million were recorded as
F-16
expense in the fiscal year 2016 in the general and administrative section of the consolidated statement of operations.
The total purchase price is summarized as follows (in thousands):
|
Cash paid at closing |
|
$ |
2,883 |
|
|
Less: Reimbursement of cash on hand at closing |
|
|
(883 |
) |
|
Total purchase price |
|
$ |
2,000 |
|
The Company’s allocation of the purchase price is summarized as follows (in thousands):
|
Assets: |
|
|
|
|
|
Cash and cash equivalents |
|
$ |
73 |
|
|
Accounts receivable |
|
|
99 |
|
|
Income tax receivable |
|
|
103 |
|
|
Prepaids and other current assets |
|
|
311 |
|
|
Equipment and improvements |
|
|
30 |
|
|
Intangible assets |
|
|
670 |
|
|
Goodwill |
|
|
1,991 |
|
|
Total assets |
|
$ |
3,277 |
|
|
Liabilities: |
|
|
|
|
|
Accounts payable |
|
$ |
223 |
|
|
Accrued liabilities |
|
|
421 |
|
|
Deferred revenue |
|
|
486 |
|
|
Deferred tax liability |
|
|
147 |
|
|
Total liabilities |
|
$ |
1,277 |
|
|
Total purchase price |
|
$ |
2,000 |
|
The results of operations of Birdstep Technology AB have been included in the Company’s consolidated financial statements from the date of acquisition. The pro-forma effect of the acquisition on historical periods is not material and therefore is not included.
The purpose of the Birdstep acquisition was to re-enter the Asia-Pacific and European wireless markets, and to acquire engineering talent that was already in place and developing essentially the same NetWise-type products that we were.
3. Restructuring
2016 Restructuring
In the fourth quarter of fiscal 2016, the Board of Directors approved a plan of restructuring intended to streamline and flatten the Company’s organization, reduce overall headcount by approximately 30%, and reduce its overall cost structure by approximately $2.5 million per quarter. The restructuring plan resulted in special charges totaling $0.3 million recorded during the three-month period ended December 31, 2016. These charges were for primarily related to severance costs and were all paid out by December 31, 2016.
In the first quarter of fiscal 2017, the Board of Directors approved an additional restructuring plan intended to further streamline and flatten the Company’s organization, reduce overall headcount by approximately 16%, and reduce its overall cost structure by another $0.9 - $1.0 million per quarter. The restructuring plan will result in special charges totaling approximately $0.3 million to be recorded during the three-month period ending March 31, 2017. These charges are primarily related to severance costs and include $0.1 million of non-cash stock-based compensation severance.
F-17
On May 6, 2014, the Board of Directors approved a plan of restructuring intended to streamline and flatten the Company’s organization, reduce overall headcount by approximately 20%, and reduce its overall cost structure by approximately $2.0 million per quarter. The restructuring plan resulted in special charges totaling $1.8 million recorded during the three-month period ended June 30, 2014. These charges were for non-cash stock-based compensation expense of $1.3 million, severance costs for affected employees of $0.4 million, and other related costs of $0.1 million.
2013 Restructuring
On July 25, 2013, the Board of Directors approved a plan of restructuring intended to bring the Company’s operating expenses better in line with revenues. The restructuring plan involved a realignment of organizational structures, facility consolidations/closures, and headcount reductions of approximately 26% of the Company’s worldwide workforce. The restructuring plan was implemented primarily during the three-month period ended September 30, 2013 and resulted in annualized savings of approximately $16.0 million.
The restructuring plan resulted in special charges totaling $5.6 million recorded in the year ended December 31, 2013. These charges were for lease/rental terminations of $3.3 million, severance costs for affected employees of $1.1 million, equipment, and improvements write-offs as a result of our lease/rental terminations of $1.0 million and other related costs of $0.2 million.
In the year ended December 31, 2014, we increased the reserve by $0.6 million due to changes in our assumptions on future sublease income on our lease terminations of $0.8 million, partially offset by adjustments to our one-time employee termination benefits.
Following is the activity in our restructuring liability for the year ended December 31, 2016 (in thousands):
|
|
|
December 31, 2015 |
|
|
|
|
|
|
|
|
|
|
December 31, 2016 |
|
||
|
|
|
Balance |
|
|
Provision-net |
|
|
Usage |
|
|
Balance |
|
||||
|
Lease/rental terminations |
|
$ |
2,123 |
|
|
$ |
17 |
|
|
$ |
(354 |
) |
|
$ |
1,786 |
|
|
One-time employee termination benefits |
|
|
— |
|
|
|
239 |
|
|
|
(174 |
) |
|
|
65 |
|
|
Datacenter consolidation, other |
|
|
86 |
|
|
|
47 |
|
|
|
(24 |
) |
|
|
109 |
|
|
Total |
|
$ |
2,209 |
|
|
$ |
303 |
|
|
$ |
(552 |
) |
|
$ |
1,960 |
|
4. Fair Value of Financial Instruments
The Company analyzes all financial instruments with features of both liabilities and equity under FASB ASC Topic No. 480, Distinguishing Liabilities From Equity and FASB ASC Topic No. 815, Derivatives and Hedging. Derivative liabilities are adjusted to reflect fair value at each period end, with any increase or decrease in the fair value being recorded in results of operations as adjustments to fair value of derivatives. The effects of interactions between embedded derivatives are calculated and accounted for in arriving at the overall fair value of the financial instruments. In addition, the fair values of freestanding derivative instruments such as warrant derivatives are valued using the Black-Scholes model.
At December 31, 2016 and December 31, 2015, the carrying value and the aggregate fair value of the Company’s warrant liability and long-term debt were as follows (in thousands):
|
|
|
As of December 31, 2016 |
|
|
As of December 31, 2015 |
|
||||||||||
|
|
|
Carrying Amount |
|
|
Fair Value |
|
|
Carrying Amount |
|
|
Fair Value |
|
||||
|
Liabilities: |
|
|
|
|
|
|
|
|
|
|
|
|
|
|
|
|
|
Warrant liability |
|
$ |
1,210 |
|
|
$ |
1,210 |
|
|
$ |
— |
|
|
$ |
— |
|
|
Long-term debt |
|
$ |
1,934 |
|
|
$ |
1,934 |
|
|
$ |
— |
|
|
$ |
— |
|
F-18
The warrants were accounted for as liabilities, with changes in the fair value included in net loss for the respective periods. Because some of the inputs to our valuation model were either not observable nor derived principally from or corroborated by observable market data by correlation or other means, the warrant liability is classified as a Level 3 in the fair value hierarchy.
Our stock price can be volatile and there could be material fluctuations in the value of the warrants in future periods.
A roll forward of our warrant liability classified as Level 3 and measured at fair value on a recurring basis is as follows (in thousands):
|
Balance, December 31, 2015 |
|
$ |
— |
|
|
Issuances |
|
|
2,120 |
|
|
Change in fair value of warrant liability |
|
|
(910 |
) |
|
Balance, December 31, 2016 |
|
$ |
1,210 |
|
Warrant Liability
On September 2, 2016, we entered into a Note and Warrant Purchase Agreement with Unterberg Koller Capital Fund L.P. and William W. and Dieva L. Smith, pursuant to which the Company issued and sold to the Investors in a private placement senior subordinated promissory notes in the aggregate principal amount of $4,000,000 and five-year warrants to purchase an aggregate of 1,700,000 shares of the Company’s common stock at an exercise price of $2.74 per share, and expires five years from the date of issuance. The Company completed the transactions contemplated by the Purchase Agreement and issued the Notes and Warrants on September 6, 2016. We assessed the warrants and concluded that they should be recorded as a liability.
The initial fair value of the warrant liability associated with the Note and Warrant Purchase Agreement was $2.1 million, and the fair value decreased to $1.2 million as of December 31, 2016.
All changes in the fair value of warrants will be recognized in our consolidated statements of operations until they are either exercised or expire. The warrants are not traded in an active securities market, and as such the estimated fair value as of December 31, 2016 was determined by using an option pricing model (Black-Scholes) with the following assumptions:
|
|
|
As of |
|
|
|
|
|
December 31, 2016 |
|
|
|
Expected remaining term |
|
4.75 years |
|
|
|
Common stock market price |
|
$ |
1.57 |
|
|
Risk-free interest rate |
|
|
1.96 |
% |
|
Expected volatility |
|
|
70.5 |
% |
|
Resulting fair value (per warrant) |
|
$ |
0.71 |
|
Expected volatility is based on historical volatility. Historical volatility was computed using monthly pricing observations for recent periods that correspond to the remaining expected term of the warrants. We believe this method produces an estimate that is representative of our expectations of future volatility over the expected term of these warrants. We currently have no reason to believe future volatility over the expected remaining life of these warrants is likely to differ materially from historical volatility. The expected life is based on the remaining contractual term of the warrants. The risk-free interest rate is the U.S. Treasury bond rate as of the valuation date.
F-19
At December 31, 2016, the aggregate fair value and the carrying value of the Company’s long-term debt was as follows (in thousands):
|
|
|
As of December 31, 2016 |
|
|
As of December 31, 2015 |
|
||||||||||
|
|
|
Carrying Amount |
|
|
Fair Value |
|
|
Carrying Amount |
|
|
Fair Value |
|
||||
|
Long-term debt - related party |
|
$ |
967 |
|
|
$ |
967 |
|
|
$ |
— |
|
|
$ |
— |
|
|
Long-term debt |
|
|
967 |
|
|
|
967 |
|
|
|
— |
|
|
|
— |
|
|
Total long-term debt |
|
$ |
1,934 |
|
|
$ |
1,934 |
|
|
$ |
— |
|
|
$ |
— |
|
The carrying value $1.9 million is net of debt discount of $1.9 million and debt issuance costs of $0.2 million as of December 31, 2016.
5. Balance Sheet Details
Short-Term Investments
Short-term investments consist of U.S. government agency and government sponsored enterprise obligations. The Company accounts for these short-term investments as required by FASB ASC Topic No. 320, Investments-Debt and Equity Securities. These debt and equity securities are not classified as either held-to-maturity securities or trading securities. As such, they are classified as available-for-sale securities. Available-for-sale securities are recorded at fair value, with unrealized gains or losses recorded as a separate component of accumulated other comprehensive income in stockholders’ equity until realized. Available-for-sale securities with contractual maturities of less than 12 months were as follows (in thousands):
|
|
|
December 31, 2016 |
|
|
December 31, 2015 |
|
||||||||||||||||||
|
|
|
Amortized |
|
|
Gross |
|
|
Fair |
|
|
Amortized |
|
|
Gross |
|
|
Fair |
|
||||||
|
|
|
cost basis |
|
|
unrealized loss |
|
|
value |
|
|
cost basis |
|
|
unrealized loss |
|
|
value |
|
||||||
|
Corporate bonds and notes |
|
$ |
— |
|
|
$ |
— |
|
|
$ |
— |
|
|
$ |
— |
|
|
$ |
— |
|
|
$ |
— |
|
|
Government securities/money market |
|
|
— |
|
|
|
— |
|
|
|
— |
|
|
|
4,080 |
|
|
|
(2 |
) |
|
|
4,078 |
|
|
Total |
|
$ |
— |
|
|
$ |
— |
|
|
$ |
— |
|
|
$ |
4,080 |
|
|
$ |
(2 |
) |
|
$ |
4,078 |
|
There were no realized gains (losses) recognized in interest and other income for the years ended December 31, 2016, 2015, and 2014.
Equipment and Improvements
Equipment and improvements consist of the following (in thousands):
|
|
|
December 31, |
|
|||||
|
|
|
2016 |
|
|
2015 |
|
||
|
Computer hardware, software, and equipment |
|
$ |
14,617 |
|
|
$ |
16,288 |
|
|
Leasehold improvements |
|
|
5,315 |
|
|
|
5,170 |
|
|
Office furniture and fixtures |
|
|
1,073 |
|
|
|
1,214 |
|
|
|
|
|
21,005 |
|
|
|
22,672 |
|
|
Less accumulated depreciation and amortization |
|
|
(19,194 |
) |
|
|
(20,180 |
) |
|
Equipment and improvements, net |
|
$ |
1,811 |
|
|
$ |
2,492 |
|
Depreciation and amortization expense on equipment and improvements was $1.3 million, $1.9 million and $2.9 million for the years ended December 31, 2016, 2015, and 2014 respectively.
F-20
These are office rent and other deposits.
Intangible Assets
The following table sets forth our acquired intangible assets by major asset class as of December 31, 2016 and December 31, 2015 (in thousands except for useful life data):
|
|
|
|
|
December 31, 2016 |
|
|
December 31, 2015 |
|
||||||||||||||||||||||||||
|
|
|
Useful life |
|
|
|
|
|
Accumulated |
|
|
Net book value |
|
|
Impairment |
|
|
Net |
|
|
|
|
|
|
Accumulated |
|
|
Net |
|
||||||
|
|
|
(years) |
|
Gross |
|
|
amortization |
|
|
before impairment |
|
|
charge |
|
|
book value |
|
|
Gross |
|
|
amortization |
|
|
book value |
|
||||||||
|
Purchased technology |
|
5 -6 |
|
$ |
265 |
|
|
$ |
(32 |
) |
|
$ |
233 |
|
|
$ |
— |
|
|
$ |
233 |
|
|
$ |
— |
|
|
$ |
— |
|
|
$ |
— |
|
|
Customer relationships |
|
3-6 |
|
|
999 |
|
|
|
(147 |
) |
|
|
852 |
|
|
|
(411 |
) |
|
|
441 |
|
|
|
— |
|
|
|
— |
|
|
|
— |
|
|
Trademarks/trade names |
|
2 |
|
|
38 |
|
|
|
(9 |
) |
|
|
29 |
|
|
|
— |
|
|
|
29 |
|
|
|
— |
|
|
|
— |
|
|
|
— |
|
|
Non-compete |
|
3 |
|
|
51 |
|
|
|
(9 |
) |
|
|
42 |
|
|
|
— |
|
|
|
42 |
|
|
|
— |
|
|
|
— |
|
|
|
— |
|
|
Total |
|
|
|
$ |
1,353 |
|
|
$ |
(197 |
) |
|
$ |
1,156 |
|
|
$ |
(411 |
) |
|
$ |
745 |
|
|
$ |
— |
|
|
$ |
— |
|
|
$ |
— |
|
Intangible assets amortization expense was $0.1 million for the three and twelve months ended December 31, 2016.
Future amortization expense related to intangible assets as of December 31, 2016 are as follows (in thousands):
|
Year Ending December 31, |
|
|
|
|
|
2017 |
|
|
259 |
|
|
2018 |
|
|
249 |
|
|
2019 |
|
|
143 |
|
|
2020 |
|
|
46 |
|
|
2021 |
|
|
40 |
|
|
Beyond |
|
|
8 |
|
|
Total |
|
$ |
745 |
|
Valuation of Goodwill and Intangible Assets
The Company accounts for goodwill and intangible assets as required by FASB ASC Topic No. 350, Intangibles-Goodwill and Other. This statement requires us to periodically assess the impairment of our goodwill and intangible assets, which requires us to make assumptions and judgments regarding the carrying value of these assets. These assets are considered to be impaired if we determine that their carrying value may not be recoverable based upon our assessment of the following events or changes in circumstances:
|
|
• |
a determination that the carrying value of such assets cannot be recovered through undiscounted cash flows; |
|
|
• |
loss of legal ownership or title to the assets; |
|
|
• |
significant changes in our strategic business objectives and utilization of the assets; or |
|
|
• |
the impact of significant negative industry or economic trends. |
If the intangible assets are considered to be impaired, the impairment we recognize is the amount by which the carrying value of the intangible assets exceeds the fair value of the intangible assets. In addition, we base the useful lives and the related amortization expense on our estimate of the useful life of the intangible assets. Due
F-21
to the numerous variables associated with our judgments and assumptions relating to the carrying value of our intangible assets and the effects of changes in circumstances affecting these valuations, both the precision and reliability of the resulting estimates are subject to uncertainty, and as additional information becomes known, we may change our estimate, in which case, the likelihood of a material change in our reported results would increase. The Company recognized an impairment loss of $0.4 million in the three and twelve months ended December 31, 2016 related to an intangible asset acquired from our Birdstep acquisition.
We review the recoverability of the carrying value of goodwill at least annually or whenever events or circumstances indicate a potential impairment. Our annual impairment testing date is December 31. Recoverability of goodwill is determined by comparing the estimated fair value of our reporting units to the carrying value of the underlying net assets in the reporting units. If the estimated fair value of a reporting unit is determined to be less than the fair value of its net assets, goodwill is deemed impaired and an impairment loss is recognized to the extent that the carrying value of goodwill exceeds the difference between the estimated fair value of the reporting unit and the fair value of its other assets and liabilities. We determined that we did not have any impairment of goodwill at December 31, 2016.
Accrued Liabilities
Accrued short-term liabilities consist of the following (in thousands):
|
|
|
December 31, |
|
|||||
|
|
|
2016 |
|
|
2015 |
|
||
|
Salaries and benefits |
|
$ |
2,545 |
|
|
$ |
2,723 |
|
|
Restructuring liabilities |
|
|
485 |
|
|
|
442 |
|
|
Pennsylvania grant liability |
|
|
65 |
|
|
|
1,000 |
|
|
Royalties and revenue sharing |
|
|
146 |
|
|
|
643 |
|
|
Income & other taxes payable |
|
|
56 |
|
|
|
205 |
|
|
Interest payable |
|
|
97 |
|
|
|
— |
|
|
Marketing expenses, rebates, and other |
|
|
109 |
|
|
|
51 |
|
|
Total accrued short-term liabilities |
|
$ |
3,503 |
|
|
$ |
5,064 |
|
Deferred Rent and Other Long-Term Liabilities
Deferred rent and other long-term liabilities consist of the following (in thousands):
|
|
|
December 31, |
|
|||||
|
|
|
2016 |
|
|
2015 |
|
||
|
Deferred rent |
|
$ |
1,162 |
|
|
$ |
1,402 |
|
|
Restructuring liabilities |
|
|
1,475 |
|
|
|
1,767 |
|
|
Pennsylvania grant liability |
|
|
268 |
|
|
|
— |
|
|
Sublease deposits |
|
|
66 |
|
|
|
66 |
|
|
Total deferred rent and other long-term liabilities |
|
$ |
2,971 |
|
|
$ |
3,235 |
|
6. Income Taxes
Income (loss) before provision for income taxes was generated from the following sources (in thousands):
|
|
|
Year Ended December 31, |
|
|||||||||
|
|
|
2016 |
|
|
2015 |
|
|
2014 |
|
|||
|
Domestic |
|
$ |
(14,314 |
) |
|
$ |
(2,651 |
) |
|
$ |
(11,867 |
) |
|
Foreign |
|
|
(427 |
) |
|
|
117 |
|
|
|
117 |
|
|
Total loss before provision for income taxes |
|
$ |
(14,741 |
) |
|
$ |
(2,534 |
) |
|
$ |
(11,750 |
) |
F-22
A summary of the income tax expense is as follows (in thousands):
|
|
|
Year Ended December 31, |
|
|||||||||
|
|
|
2016 |
|
|
2015 |
|
|
2014 |
|
|||
|
Current: |
|
|
|
|
|
|
|
|
|
|
|
|
|
Federal |
|
$ |
— |
|
|
$ |
— |
|
|
$ |
— |
|
|
State |
|
|
(153 |
) |
|
|
5 |
|
|
|
5 |
|
|
Foreign |
|
|
61 |
|
|
|
63 |
|
|
|
44 |
|
|
Total current |
|
|
(92 |
) |
|
|
68 |
|
|
|
49 |
|
|
Deferred: |
|
|
|
|
|
|
|
|
|
|
|
|
|
Federal |
|
|
— |
|
|
|
— |
|
|
|
— |
|
|
State |
|
|
— |
|
|
|
— |
|
|
|
— |
|
|
Foreign |
|
|
(137 |
) |
|
|
— |
|
|
|
— |
|
|
Total deferred |
|
|
(137 |
) |
|
|
— |
|
|
|
— |
|
|
Total provision |
|
$ |
(229 |
) |
|
$ |
68 |
|
|
$ |
49 |
|
A reconciliation of the provision for income taxes to the amount of income tax expense that would result from applying the federal statutory rate to the profit before income taxes is as follows:
|
|
|
Year Ended December 31, |
|
|||||||||
|
|
|
2016 |
|
|
2015 |
|
|
2014 |
|
|||
|
Federal statutory rate |
|
|
35.0 |
|
% |
|
35.0 |
|
% |
|
35.0 |
|
|
State tax, net of federal benefit |
|
|
4.6 |
|
|
|
(20.4 |
) |
|
|
1.2 |
|
|
Equity compensation |
|
|
(0.3 |
) |
|
|
(13.7 |
) |
|
|
(6.6 |
) |
|
International tax items |
|
|
(1.0 |
) |
|
|
(4.6 |
) |
|
|
0.1 |
|
|
Foreign taxes |
|
|
0.5 |
|
|
|
(2.5 |
) |
|
|
(0.4 |
) |
|
Uncertain tax positions |
|
|
1.1 |
|
|
|
0.0 |
|
|
|
0.0 |
|
|
Other |
|
|
(0.2 |
) |
|
|
(10.6 |
) |
|
|
(2.5 |
) |
|
Miscellaneous |
|
|
(0.5 |
) |
|
|
(1.1 |
) |
|
|
0.0 |
|
|
Change in valuation allowance |
|
|
(37.6 |
) |
|
|
15.2 |
|
|
|
(27.5 |
) |
|
|
|
|
1.6 |
|
% |
|
(2.7 |
) |
% |
|
(0.7 |
) |
The major components of the Company’s deferred tax assets and liabilities are as follows (in thousands):
|
|
|
Year Ended December 31, |
|
|||||
|
|
|
2016 |
|
|
2015 |
|
||
|
Deferred income tax assets |
|
|
|
|
|
|
|
|
|
Net operating loss carry forwards |
|
$ |
54,023 |
|
|
$ |
48,003 |
|
|
Credit carry forwards |
|
|
3,464 |
|
|
|
3,708 |
|
|
Fixed assets |
|
|
985 |
|
|
|
1,181 |
|
|
Intangibles |
|
|
15,894 |
|
|
|
19,588 |
|
|
Equity based compensation |
|
|
688 |
|
|
|
311 |
|
|
Nondeductible accruals |
|
|
1,346 |
|
|
|
1,977 |
|
|
Various reserves |
|
|
132 |
|
|
|
142 |
|
|
Other |
|
|
28 |
|
|
|
56 |
|
|
Valuation allowance |
|
|
(76,337 |
) |
|
|
(74,907 |
) |
|
Total deferred income taxes - net |
|
|
223 |
|
|
|
59 |
|
|
Deferred income tax liabilities |
|
|
|
|
|
|
|
|
|
Warrants |
|
|
(347 |
) |
|
|
— |
|
|
Prepaid expenses |
|
|
(57 |
) |
|
|
(59 |
) |
|
Total deferred income liabilities |
|
|
(404 |
) |
|
|
(59 |
) |
|
|
|
|
|
|
|
|
|
|
|
Net deferred income tax assets (liabilities) |
|
$ |
(181 |
) |
|
$ |
— |
|
F-23
The Company has federal and state net operating loss (“NOL”) carryforwards of approximately $134.6 million and $147.5 million, respectively, at December 31, 2016, to reduce future cash payments for income taxes. Of the $134.6 million of NOL carryforwards at December 31, 2016, $0.8 million relates to the excess tax benefits from employee restricted stock. Equity will be increased by $0.8 million, if and when such excess tax benefits are ultimately realized. These federal NOL carryforwards will expire from 2024 through 2036 and state NOL carryforwards will expire 2016 through 2036. The Company also had $0.5 million of Alternative minimum tax credit carryforwards with an indefinite life, available to offset regular federal income tax requirements.
The Company has federal and state tax credit carryforwards of approximately $2.5 million and $0.7 million, respectively, at December 31, 2016. These tax credits will begin to expire in 2027.
To the extent that an ownership change has occurred under Internal Revenue Code Sections 382 and 383, the Company’s use of its loss carryforwards and credit carryforwards to offset future taxable income may be limited.
At December 31, 2016 and 2015, the Company had unrecognized tax benefits, including interest and penalties of approximately $0.4 million and $0.6 million for as of December 31, 2016 and 2015, respectively.
The Company’s gross unrecognized tax benefits as of December 31, 2016 and 2015 and the changes in those balances are as follows (in thousands):
|
|
|
Year Ended December 31, |
|
|||||
|
|
|
2016 |
|
|
2015 |
|
||
|
Beginning balance |
|
$ |
592 |
|
|
$ |
592 |
|
|
Increases/(decreases) in tax positions for the current year |
|
|
(164 |
) |
|
|
— |
|
|
Increases/(decreases) in tax positions for the prior year |
|
|
— |
|
|
|
— |
|
|
Gross unrecognized tax benefits, ending balance |
|
$ |
428 |
|
|
$ |
592 |
|
We account for income taxes as required by FASB ASC Topic No. 740, Income Taxes. This Topic clarifies the accounting for uncertainty in income taxes recognized in an enterprise’s financial statements and prescribes a recognition threshold and measurement process for financial statement recognition and measurement of a tax position taken or expected to be taken in a tax return. The Topic also provides guidance on derecognition, classification, interest and penalties, accounting in interim periods, disclosure, and transition. The Topic requires an entity to recognize the financial statement impact of a tax position when it is more likely than not that the position will be sustained upon examination. The amount recognized is measured as the largest amount of benefit that is greater than fifty percent likely of being realized upon ultimate settlement. In addition, the Topic permits an entity to recognize interest and penalties related to tax uncertainties either as income tax expense or operating expenses. The Company has chosen to recognize interest and penalties related to tax uncertainties as income tax expense.
The Company assesses whether a valuation allowance should be recorded against its deferred tax assets based on the consideration of all available evidence, using a “more likely than not” realization standard. The four sources of taxable income that must be considered in determining whether deferred tax assets will be realized are: (1) future reversals of existing taxable temporary differences (i.e., offset of gross deferred tax liabilities against gross deferred tax assets); (2) taxable income in prior carryback years, if carryback is permitted under the applicable tax law; (3) tax planning strategies; and (4) future taxable income exclusive of reversing temporary differences and carryforwards.
After a review of the four sources of taxable income as of December 31, 2016 (as described above), and after consideration of the Company’s continuing cumulative loss position as of December 31, 2016, the Company recorded a valuation allowance related to its U.S.-based deferred tax assets of $76.3 million at December 31,
F-24
2016. During fiscal year 2016, the valuation allowance on deferred tax assets increased by $1.4 million and decreased $0.8 million during fiscal years 2015 and 2014 million and $12.1 million, respectively.
We recognized interest and penalties accrued related to unrecognized tax benefits in income tax expense. During the fiscal years 2016 and 2015, we recognized approximately $0 and $3,000 of interest and penalties in each year. The cumulative interest and penalties at December 31, 2016 and 2015 were $0 and $47,000, respectively.
Unrecognized tax benefits of $164 million were released in October of 2016, which impacted the effective tax rate due to the expiration of the statute of limitations. We do not anticipate any material changes to unrecognized tax benefits within the next twelve months that will affect the effective tax rate.
The Company is subject to U.S. federal income tax, as well as to income tax of multiple state jurisdictions. Federal income tax returns of the Company are subject to IRS examination for the 2012 – 2015 tax years. State income tax returns are subject to examination for a period of three to four years after filing. As of December 31, 2016, the Company had no outstanding tax audits. The outcome of tax audits cannot be predicted with certainty. If any issues addressed in the Company’s tax audits are resolved in a manner not consistent with management’s expectations, the Company could be required to adjust its provision for income tax in the period such resolution occurs.
7. Commitments and Contingencies
Leases
The Company leases its buildings under operating leases that expire on various dates through 2022. Future minimum annual lease payments under such leases as of December 31, 2016 are as follows (in thousands):
|
Year Ending December 31, |
|
Operating |
|
|
|
2017 |
|
$ |
2,364 |
|
|
2018 |
|
|
2,387 |
|
|
2019 |
|
|
1,998 |
|
|
2020 |
|
|
1,702 |
|
|
2021 |
|
|
1,705 |
|
|
Beyond |
|
|
33 |
|
|
Total |
|
$ |
10,189 |
|
As of December 31, 2016, $4.0 million of the remaining lease commitments expense has been accrued as part of the 2013 Restructuring Plan, partially offset by future estimated sublease income of $2.1 million.
Total rent expense was $1.6 million, $1.3 million and $1.2 million for the years ended December 31, 2016, 2015, and 2014, respectively.
As a condition of our lease in Pittsburgh, the landlord agreed to incentives of $40.00 per square foot, or a total of $2.2 million, for improvements to the space. These costs have been included in deferred rent in our long-term liabilities and are being amortized over the remaining lease term.
Pennsylvania Opportunity Grant Program
On September 26, 2011, we received $1.0 million from the State of Pennsylvania to help fund our agreement to start-up a new facility. The grant carried with it an obligation, or commitment, to employ at least 232 people within a three-year time period that ended on December 31, 2013. We received an extension of time to meet this employment commitment by April 30, 2016. The grant contained conditions that would require us to return a pro-rata amount of the monies received if we failed to meet these conditions. As such, the monies had been recorded as a liability in the accrued liabilities line item on the balance sheet until we are irrevocably entitled to retain the monies, or until it is determined that we need to return a portion or all of the monies
F-25
received. On June 27, 2016, we received a letter from the State of Pennsylvania requesting reimbursement of $0.3 million and said we earned the remaining $0.7 million of the original $1.0 million grant. On September 19, 2016, we entered into a Settlement and Release Agreement with the Commonwealth of Pennsylvania, acting by and through the Department of Community and Economic Development (“DCED”) to repay $0.3 million of the original $1.0 million grant. Per the agreement, the total amount due of $0.3 million is at 0% interest and is payable in twenty equal quarterly installments commencing on January 31, 2017 and ending on October 31, 2021.
Litigation
The Company may become involved in various legal proceedings arising from its business activities. While management does not believe the ultimate disposition of these matters will have a material adverse impact on the Company’s consolidated results of operations, cash flows, or financial position, litigation is inherently unpredictable, and depending on the nature and timing of these proceedings, an unfavorable resolution could materially affect the Company’s future consolidated results of operations, cash flows, or financial position in a particular period.
Other Contingent Contractual Obligations
During its normal course of business, the Company has made certain indemnities, commitments, and guarantees under which it may be required to make payments in relation to certain transactions. These include: intellectual property indemnities to the Company’s customers and licensees in connection with the use, sale and/or license of Company products; indemnities to various lessors in connection with facility leases for certain claims arising from such facility or lease; indemnities to vendors and service providers pertaining to claims based on the negligence or willful misconduct of the Company; indemnities involving the accuracy of representations and warranties in certain contracts; and indemnities to directors and officers of the Company to the maximum extent permitted under the laws of the State of Delaware. In addition, the Company has made contractual commitments to employees providing for severance payments upon the occurrence of certain prescribed events. The Company may also issue a guarantee in the form of a standby letter of credit as security for contingent liabilities under certain customer contracts. The duration of these indemnities, commitments, and guarantees varies, and in certain cases, may be indefinite. The majority of these indemnities, commitments and guarantees may not provide for any limitation of the maximum potential for future payments the Company could be obligated to make. The Company has not recorded any liability for these indemnities, commitments, and guarantees in the accompanying consolidated balance sheets.
8. Segment, Customer Concentration and Geographical Information
Segment Information
Public companies are required to report financial and descriptive information about their reportable operating segments as required by FASB ASC Topic No. 280, Segment Reporting. The Company has two primary business units based on how management internally evaluates separate financial information, business activities and management responsibility. Wireless includes our NetWise®, CommSuite®, SafePath™, and QuickLink® family of products. Graphics includes our consumer-based products: Poser®, Moho™ (formerly Anime Studio®), Clip Studio® (formerly Manga Studio®), MotionArtist® and StuffIt®.
The Company does not separately allocate operating expenses to these business units, nor does it allocate specific assets. Therefore, business unit information reported includes only revenues.
F-26
The following table shows the revenues generated by each business unit (in thousands):
|
|
|
Year Ended December 31, |
|
|||||||||
|
|
|
2016 |
|
|
2015 |
|
|
2014 |
|
|||
|
Wireless |
|
$ |
23,086 |
|
|
$ |
33,553 |
|
|
$ |
31,276 |
|
|
Graphics |
|
|
5,149 |
|
|
|
5,954 |
|
|
|
5,703 |
|
|
Total revenues |
|
|
28,235 |
|
|
|
39,507 |
|
|
|
36,979 |
|
|
Cost of revenues |
|
|
7,564 |
|
|
|
8,152 |
|
|
|
9,317 |
|
|
Gross profit |
|
$ |
20,671 |
|
|
$ |
31,355 |
|
|
$ |
27,662 |
|
Customer Concentration Information
A summary of the Company’s customers that represent 10% or more of the Company’s revenues is as follows:
|
|
|
Year Ended December 31, |
|
|||||||||
|
|
|
2016 |
|
|
2015 |
|
|
2014 |
|
|||
|
Wireless: |
|
|
|
|
|
|
|
|
|
|
|
|
|
Sprint (& affiliates) |
|
|
62.6 |
% |
|
|
65.4 |
% |
|
|
68.0 |
% |
|
Graphics: |
|
|
|
|
|
|
|
|
|
|
|
|
|
FastSpring |
|
|
13.5 |
% |
|
|
11.3 |
% |
|
|
11.2 |
% |
The customers listed above comprised 80%, 83% and 87% of our accounts receivable as of December 31, 2016, 2015, and 2014, respectively. Our major customers could reduce their orders of our products in favor of a competitor's product or for any other reason. The loss of any of our major customers or decisions by a significant customer to substantially reduce purchases could have a material adverse effect on our business.
Geographical Information
During the years ended December 31, 2016, 2015, and 2014, the Company operated in three geographic locations: the Americas, EMEA (Europe, the Middle East, and Africa), and Asia Pacific. Revenues attributed to the geographic location of the customer’s bill-to address, were as follows (in thousands):
|
|
|
Year ended December 31, |
|
|||||||||
|
|
|
2016 |
|
|
2015 |
|
|
2014 |
|
|||
|
Americas |
|
$ |
27,618 |
|
|
$ |
39,008 |
|
|
$ |
35,689 |
|
|
EMEA |
|
|
424 |
|
|
|
239 |
|
|
|
964 |
|
|
Asia Pacific |
|
|
193 |
|
|
|
260 |
|
|
|
326 |
|
|
Total revenues |
|
$ |
28,235 |
|
|
$ |
39,507 |
|
|
$ |
36,979 |
|
9. Profit Sharing
The Company offers its employees a 401(k) plan, in which the Company matches the employee contributions at a rate of 20%, subject to a vesting schedule. Total employer contributions amounted to $0.2 million in each of the years ended December 31, 2016, 2015, and 2014.
10. Stock-Based Compensation
Stock Plans
On June 18, 2015, our Shareholders approved the 2015 Omnibus Equity Incentive Plan (“2015 OEIP”). The 2015 OEIP, which became effective the same date, replaced the 2005 Stock Option / Stock Issuance Plan (“2005 Plan”) which was due to expire on July 28, 2015. All outstanding options under the 2005 Plan remain outstanding, but no new grants will be made under that Plan. The maximum number of shares of the Company’s common stock available for issuance over the term of the 2015 OEIP may not exceed 2,125,000 shares.
F-27
The 2015 Plan provides for the issuance of full value awards (restricted stock, performance stock, dividend equivalent right or restricted stock units) and not full value awards (stock options or stock appreciation rights) to employees, non-employee members of the board and consultants. Any full value award settled in shares will be debited as 1.2 shares and not full value awards settled in shares will be debited as 1.0 shares against the share reserve. The exercise price per share for option grants is not to be less than the fair market value per share of the Company’s common stock on the date of grant. The Board of Directors has the discretion to determine the vesting schedule. Options may be exercisable immediately or in installments, but generally vest over a four-year period from the date of grant. In the event the holder ceases to be employed by the Company, all unvested options terminate and all vested options may be exercised within a period following termination. In general, options expire ten years from the date of grant. Restricted stock is valued using the closing stock price on the date of the grant. The total value is expensed over the vesting period of 12 to 48 months.
Employee Stock Purchase Plan
The Company has a shareholder approved employee stock purchase plan (“ESPP”), under which substantially all employees may purchase the Company’s common stock through payroll deductions at a price equal to 85% of the lower of the fair market values of the stock as of the beginning and end of six-month offering periods. An employee’s payroll deductions under the ESPP are limited to 10% of the employee’s compensation and employees may not purchase more than the lesser of $25,000 of stock, or 250 shares, for any purchase period. Additionally, no more than 250,000 shares may be purchased under the plan.
Stock Compensation Expense
The Company accounts for all stock-based payment awards made to employees and directors based on their fair values and recognized as compensation expense over the vesting period using the straight-line method over the requisite service period for each award as required by FASB ASC Topic No. 718, Compensation-Stock Compensation.
Valuation of Stock Option and Restricted Stock Awards
The assumptions used to compute the share-based compensation costs for the stock options granted during the years ended December 31, 2016, 2015, and 2014, respectively, using the Black-Scholes option pricing model, were as follows:
|
|
|
Year Ended December 31, |
|
|||||||||
|
|
|
2016 |
|
|
2015 |
|
|
2014 |
|
|||
|
Weighted average grant-date fair value of stock options |
|
$ |
1.40 |
|
|
$ |
3.08 |
|
|
$ |
2.28 |
|
|
Assumptions |
|
|
|
|
|
|
|
|
|
|
|
|
|
Risk-free interest rate (weighted average) |
|
|
1.1 |
% |
|
|
1.1 |
% |
|
|
1.2 |
% |
|
Expected dividend yield |
|
|
— |
|
|
|
— |
|
|
|
— |
|
|
Weighted average expected life (years) |
|
|
4.8 |
|
|
|
4.0 |
|
|
|
3.5 |
|
|
Volatility (weighted average) |
|
|
74.3 |
% |
|
|
83.5 |
% |
|
|
82.9 |
% |
|
Forfeiture rate |
|
|
23.0 |
% |
|
|
23.3 |
% |
|
|
25.5 |
% |
The risk-free interest rate assumption was based on the United States Treasury’s rates for U.S. Treasury zero-coupon bonds with maturities similar to those of the expected term of the award being valued. The Company assumed no dividend yield because it does not expect to pay dividends for the foreseeable future. The weighted average expected life is the vesting period for those options granted during that period. The average volatility is based on the actual historical volatility of our common stock. The forfeiture rate was based on modified employee turnover.
Grants of restricted stock are valued using the closing stock price on the date of grant. In the year ended December 31, 2016, a total of 75,000 shares of restricted stock, with a total value of $51,000, were granted to non-employee members of the Board of Directors. This cost will be amortized over a period of 12 months. In
F-28
addition, 300,000 shares of restricted stock, with a total value of $0.9 million, were granted to key officers and employees of the Company. This cost will be amortized over a period of 48 months.
Valuation of ESPP
The fair values are estimated at the beginning of each offering period using a Black-Scholes valuation model that uses the assumptions noted in the following table. The risk-free rate is based on the U.S. treasury yield curve in effect at the time of grant. Expected volatility was based on the historical volatility on the day of grant. Following is a schedule of the shares purchased, the fair value per share, and the Black-Scholes model assumptions for each offering period:
|
|
|
(Ending) |
|
|
|
|
|
|
|
|
|
|
|
|
|
|
|
|
|
|
|
|
|
September 30, |
|
|
March 31, |
|
|
September 30, |
|
|
March 31, |
|
|
September 30, |
|
|||||
|
Offering Period Ended |
|
2016 |
|
|
2016 |
|
|
2015 |
|
|
2015 |
|
|
2014 |
|
|||||
|
Shares purchased for offering period |
|
|
3,536 |
|
|
|
3,498 |
|
|
|
3,113 |
|
|
|
2,804 |
|
|
|
3,405 |
|
|
Fair value per share |
|
$ |
0.77 |
|
|
$ |
1.24 |
|
|
$ |
2.39 |
|
|
$ |
1.72 |
|
|
$ |
3.32 |
|
|
Assumptions |
|
|
|
|
|
|
|
|
|
|
|
|
|
|
|
|
|
|
|
|
|
Risk-free interest rate (average) |
|
|
0.47 |
% |
|
|
0.18 |
% |
|
|
0.11 |
% |
|
|
0.40 |
% |
|
|
0.80 |
% |
|
Expected dividend yield |
|
|
— |
|
|
|
— |
|
|
|
— |
|
|
|
— |
|
|
|
— |
|
|
Weighted average expected life (years) |
|
|
0.5 |
|
|
|
0.5 |
|
|
|
0.5 |
|
|
|
0.5 |
|
|
|
0.5 |
|
|
Volatility (average) |
|
|
40.4 |
% |
|
|
66.1 |
% |
|
|
103.8 |
% |
|
|
109.1 |
% |
|
|
74.0 |
% |
Compensation Costs
Non-cash stock-based compensation expenses related to stock options, restricted stock grants and the ESPP were recorded in the financial statements as follows (in thousands):
|
|
|
Year Ended December 31, |
|
|||||||||
|
|
|
2016 |
|
|
2015 |
|
|
2014 |
|
|||
|
Cost of revenues |
|
$ |
3 |
|
|
$ |
12 |
|
|
$ |
13 |
|
|
Selling and marketing |
|
|
277 |
|
|
|
335 |
|
|
|
270 |
|
|
Research and development |
|
|
495 |
|
|
|
644 |
|
|
|
659 |
|
|
General and administrative |
|
|
753 |
|
|
|
1,167 |
|
|
|
1,437 |
|
|
Restructuring expense |
|
|
— |
|
|
|
— |
|
|
|
1,273 |
|
|
Total non-cash stock compensation expense |
|
$ |
1,528 |
|
|
$ |
2,158 |
|
|
$ |
3,652 |
|
Total share-based compensation for each year includes cash payment of income taxes related to grants of restricted stock in the amounts of $0, $0.1 million and $0.2 million for the years ended December 31, 2016, 2015, and 2014, respectively.
F-29
A summary of the Company’s stock options outstanding under the 2015 and 2005 Plans as of December 31, 2016 and the activity during the years ended herein are as follows (in thousands except per share amounts):
|
|
|
|
|
|
|
Weighted Ave. |
|
|
Aggregate |
|
||
|
|
|
Shares |
|
|
Exercise Price |
|
|
Intrinsic Value |
|
|||
|
Outstanding as of December 31, 2013 |
|
|
543 |
|
|
$ |
27.04 |
|
|
$ |
— |
|
|
(393 options exercisable at a weighted average exercise price of $35.24) |
|
|
|
|
|
|
|
|
|
|
|
|
|
Granted (weighted average fair value of $2.28) |
|
|
158 |
|
|
$ |
3.80 |
|
|
|
|
|
|
Exercised |
|
|
(1 |
) |
|
$ |
5.52 |
|
|
|
|
|
|
Cancelled |
|
|
(166 |
) |
|
$ |
23.92 |
|
|
|
|
|
|
Outstanding as of December 31, 2014 |
|
|
534 |
|
|
$ |
21.16 |
|
|
$ |
— |
|
|
(322 options exercisable at a weighted average exercise price of $32.16) |
|
|
|
|
|
|
|
|
|
|
|
|
|
Granted (weighted average fair value of $3.08) |
|
|
18 |
|
|
$ |
5.08 |
|
|
|
|
|
|
Exercised |
|
|
(2 |
) |
|
$ |
4.76 |
|
|
|
|
|
|
Cancelled |
|
|
(139 |
) |
|
$ |
16.20 |
|
|
|
|
|
|
Outstanding as of December 31, 2015 |
|
|
411 |
|
|
$ |
21.56 |
|
|
$ |
— |
|
|
(1,291 options exercisable at a weighted average exercise price of $8.04) |
|
|
|
|
|
|
|
|
|
|
|
|
|
Granted (weighted average fair value of $1.40) |
|
|
33 |
|
|
$ |
2.36 |
|
|
|
|
|
|
Exercised |
|
|
— |
|
|
$ |
— |
|
|
|
|
|
|
Cancelled |
|
|
(71 |
) |
|
$ |
8.04 |
|
|
|
|
|
|
Outstanding as of December 31, 2016 |
|
|
373 |
|
|
$ |
22.44 |
|
|
$ |
— |
|
|
Exercisable as of December 31, 2016 |
|
|
307 |
|
|
$ |
26.48 |
|
|
$ |
— |
|
|
Vested and expected to vest at December 31, 2016 |
|
|
366 |
|
|
$ |
22.79 |
|
|
$ |
— |
|
During the year ended December 31, 2016, no options were exercised. The weighted-average grant-date fair value of options granted during the year ended December 31, 2016 was $2.36. As of December 31, 2016, there is $2.1 million of unrecognized compensation costs related to non-vested stock options and restricted stock granted under the Plans. At December 31, 2016, there were 1.7 million and 0 shares available for future grants under the 2015 Omnibus Equity Incentive Plan and 2005 Stock Issuance / Stock Option Plan, respectively.
Restricted Stock Awards
There were 375,000 restricted stock awards were granted under the 2015 Omnibus Equity Incentive Plan and 2005 Stock Issuance / Stock Option Plan as of December 31, 2016.
F-30
A summary of the Company’s restricted stock awards outstanding under the 2015 and 2005 Plans as of December 31, 2016, and the activity during years ended therein, are as follows (in thousands):
|
|
|
|
|
|
|
Weighted average |
|
|
|
|
|
Number |
|
|
grant date |
|
||
|
|
|
of shares |
|
|
fair value |
|
||
|
Unvested at December 31, 2013 |
|
|
436 |
|
|
$ |
9.92 |
|
|
Granted |
|
|
406 |
|
|
$ |
7.16 |
|
|
Vested |
|
|
(360 |
) |
|
$ |
9.92 |
|
|
Cancelled and forfeited |
|
|
(51 |
) |
|
$ |
7.16 |
|
|
Unvested at December 31, 2014 |
|
|
431 |
|
|
$ |
7.64 |
|
|
Granted |
|
|
343 |
|
|
$ |
6.00 |
|
|
Vested |
|
|
(252 |
) |
|
$ |
7.80 |
|
|
Cancelled and forfeited |
|
|
(71 |
) |
|
$ |
6.68 |
|
|
Unvested at December 31, 2015 |
|
|
451 |
|
|
$ |
6.44 |
|
|
Granted |
|
|
375 |
|
|
$ |
2.70 |
|
|
Vested |
|
|
(253 |
) |
|
$ |
5.83 |
|
|
Cancelled and forfeited |
|
|
(139 |
) |
|
$ |
4.16 |
|
|
Unvested at December 31, 2016 |
|
|
434 |
|
|
$ |
4.30 |
|
11. Equity Transactions
On August 15, 2014, the Company entered into a common stock purchase agreement with a number of accredited investors (“Investors”) in a private placement pursuant to which the Company issued and sold to the Investors 6,845,830 shares of its common stock at a price per share of $0.816. The transaction closed on August 20, 2014 and the Company realized gross proceeds of $5.6 million before deducting commissions and other expenses. Offering costs related to the transaction totaled $0.4 million, comprised of $0.2 million of commissions and $0.2 million of legal and other expenses, resulting in net proceeds of $5.2 million. The Company filed a registration statement with the SEC providing for the resale of the shares of Common Stock issued pursuant to the Purchase Agreement. The registration statement became effective on September 25, 2014.
12. Preferred Stock
On October 16, 2015, the Company entered into a Preferred Shares Rights Agreement (“Rights Agreement”) with Computershare Trust Company, N.A., as rights agent, in connection with a dividend distribution declared by the Company’s Board of Directors of one right (“Right”) for each outstanding share of common stock, par value $0.001 (“Common Shares”), per common share of the Company to stockholders of record as of the close of business on October 26, 2015 (“Record Date”). Each Right entitles the registered holder to purchase from the Company one one-thousandth of a share of Series A Participating Preferred Stock, par value $0.001 per share (“Preferred Shares”), of the Company at an exercise price of $6.69 per one one-thousandth of a Preferred Share, subject to adjustment.
The Board adopted the Rights Agreement to protect stockholders from coercive or otherwise unfair takeover tactics. In general terms, it works by imposing a significant penalty upon any person or group that acquires 20% or more of the Common Shares without the approval of the Board. As a result, the overall effect of the Rights Agreement and the issuance of the Rights may be to render more difficult or discourage a merger, tender or exchange offer or other business combination involving the Company that is not approved by the Board. However, neither the Rights Agreement nor the Rights should interfere with any merger, tender or exchange offer or other business combination approved by the Board.
13. Related Party Transactions
On December 6, 2016, the Company entered into a short-term secured borrowing arrangement with William W. and Dieva L. Smith (“Smith”), pursuant to which Smith loaned to the Company $1,000,000 and the
F-31
Company issued to Smith a Secured Promissory Note (the “Secured Note”) bearing interest at the rate of 18% per annum. The Secured Note was due and repaid on December 14, 2016.
On September 2, 2016, the Company entered into a Note and Warrant Purchase Agreement (the “Purchase Agreement”) with William W. and Dieva L. Smith (collectively, the “Investors”), pursuant to which the Company issued and sold to the Investors in a private placement senior subordinated promissory notes in the aggregate principal amount of $2,000,000 (the “Notes”) and five-year warrants (the “Warrants”) to purchase an aggregate of 850,000 shares of the Company’s common stock at an exercise price of $2.74 per share. The Company completed the transactions contemplated by the Purchase Agreement and issued the Notes and Warrants on September 6, 2016. William W. Smith, Jr. is the Company’s Chairman of the Board, President and Chief Executive Officer. Refer to Note 14 for additional details.
14. Long Term Debt
On September 2, 2016, the Company entered into a Purchase Agreement with Unterberg Koller Capital Fund L.P. and William W. and Dieva L. Smith (collectively, the “Investors”), pursuant to which the Company issued and sold Notes in the aggregate principal amount of $4,000,000 and five-year Warrants to purchase an aggregate of 1,700,000 shares of the Company’s common stock at an exercise price of $2.74 per share. The Company completed the transactions contemplated by the Purchase Agreement and issued the Notes and Warrants on September 6, 2016.
The Notes mature three years following the issuance date, or September 6, 2019, and bear interest at the rate of 10% of the outstanding principal balance of the Notes, payable quarterly in cash or shares of the Company’s common stock at a conversion price equal to the greater of (i) the five-day volume weighted average closing price of the common stock on the Nasdaq Stock Market, measured on the third trading day prior to the date that interest is due, or (ii) the minimum price so that payment of interest for such installment in the form of common stock shall not constitute “equity compensation” to an officer, director, employee or consultant of the Company for purposes of Rule 5635(c) of the Nasdaq Stock Market or a private placement that, combined with the other securities issued or issuable under the Purchase Agreement, would require shareholder approval by the Company under Rule 5635(d) of the Nasdaq Stock Market. The Notes are subordinate and junior in right of payment to the prior payment in full of all claims, whether now existing or arising in the future, of holders of senior debt of the Company, as described in the Notes.
Under the Notes, if an Acceleration Event occurs and shall be continuing, any Holder of the Notes, may by written notice delivered to the Secretary of the Company within ninety days after any occurrence of such Acceleration Event (an “Acceleration Notice”), declare the entire unpaid principal balance of the Note, together with all interest accrued, due and payable shall be accelerated and due and payable, without presentment, demand, protest, or notice (except for the delivery of an Acceleration Notice). For purposes of the Notes, an Acceleration Event shall occur if, while the Notes are outstanding, William W. Smith, Jr. (i) is not nominated for re-election as a director of the Company at the normal expiration of his term as director, (ii) is terminated or removed as Chairman of the Board of Directors of the Company, (iii) is terminated or removed as Chief Executive Officer of the Company or (iv) dies or becomes permanently disabled. An Acceleration Event shall not occur if Mr. Smith consents to any of the events referenced above or voluntarily resigns or retires from any of the positions listed.
We allocated the aggregate proceeds of the senior subordinated promissory notes payable between the warrants and the debt obligations based on their fair values. In accordance with ASC 480 and ASC 815, the warrants were recorded as a liability and will be marked to market. The fair value of the warrants issued to the Lender was calculated utilizing the Black-Scholes option pricing model. The Black-Scholes option-pricing model incorporates various and highly sensitive assumptions including expected volatility, expected term and risk-free interest rates. The expected volatility is based on the historical volatility of the Company’s common stock over the most recent period. The risk-free interest rate for period within the contractual life of the warrant is based on the U.S. Treasury yield in effect at the time of grant. We will amortize the fair value of the warrants as a discount of $2.1 million over the term of the loan using the effective interest method, with an effective interest rate of 28.6%.
F-32
The Company evaluates and discloses subsequent events as required by ASC Topic No. 855, Subsequent Events. The Topic establishes general standards of accounting for and disclosure of events that occur after the balance sheet date but before the financial statements are issued or are available to be issued.
On February 7, 2017, the Company entered into a short-term secured borrowing arrangement with William W. and Divea L. Smith (“Smith”) and on February 8, 2017 entered into a short-term secured borrowing arrangement with Steven L. and Monique P. Elfman (“Elfman”) pursuant to which Smith and Elfman each loaned to the Company $1,000,000 and the Company issued to each of them a Secured Promissory Note (the “Notes”) bearing interest at the rate of 18% per annum. The Notes are due on March 24, 2017 and are secured by the Company’s accounts receivable and certain other assets. Messrs. Smith and Elfman are each directors of the Company, and Mr. Smith is the Chairman and Chief Executive Officer of the Company.
Subsequent events have been evaluated as of the date of this filing and there are no further disclosures required.
16. Quarterly Financial Data (Unaudited)
The following financial information reflects all normal recurring adjustments, which are, in the opinion of management, necessary for a fair statement of the results of the interim periods. Summarized quarterly data for fiscal 2016 and 2015 are as follows (in thousands, except per share data):
|
|
|
Year ended December 31, 2016 |
|
|||||||||||||
|
|
|
1st Quarter |
|
|
2nd Quarter |
|
|
3rd Quarter |
|
|
4th Quarter |
|
||||
|
Selected quarterly financial data: |
|
|
|
|
|
|
|
|
|
|
|
|
|
|
|
|
|
Revenues |
|
$ |
7,214 |
|
|
$ |
7,459 |
|
|
$ |
6,478 |
|
|
$ |
7,084 |
|
|
Gross profit |
|
$ |
5,101 |
|
|
$ |
5,547 |
|
|
$ |
4,680 |
|
|
$ |
5,343 |
|
|
Operating loss |
|
$ |
(3,679 |
) |
|
$ |
(3,907 |
) |
|
$ |
(4,557 |
) |
|
$ |
(3,762 |
) |
|
Net loss |
|
$ |
(3,706 |
) |
|
$ |
(3,279 |
) |
|
$ |
(4,314 |
) |
|
$ |
(3,213 |
) |
|
Net (loss) per share, basic (1) |
|
$ |
(0.32 |
) |
|
$ |
(0.28 |
) |
|
$ |
(0.35 |
) |
|
$ |
(0.26 |
) |
|
Weighted average shares outstanding, basic |
|
|
11,524 |
|
|
|
11,741 |
|
|
|
12,209 |
|
|
|
12,323 |
|
|
Net (loss) per share, diluted (1) |
|
$ |
(0.32 |
) |
|
$ |
(0.28 |
) |
|
$ |
(0.35 |
) |
|
$ |
(0.27 |
) |
|
Weighted average shares outstanding, diluted |
|
|
11,524 |
|
|
|
11,741 |
|
|
|
12,209 |
|
|
|
12,323 |
|
|
|
|
Year ended December 31, 2015 |
|
|||||||||||||
|
|
|
1st Quarter |
|
|
2nd Quarter |
|
|
3rd Quarter |
|
|
4th Quarter |
|
||||
|
Selected quarterly financial data: |
|
|
|
|
|
|
|
|
|
|
|
|
|
|
|
|
|
Revenues |
|
$ |
10,529 |
|
|
$ |
9,386 |
|
|
$ |
9,586 |
|
|
$ |
10,006 |
|
|
Gross profit |
|
$ |
8,411 |
|
|
$ |
7,315 |
|
|
$ |
7,627 |
|
|
$ |
8,002 |
|
|
Operating income (loss) |
|
$ |
2 |
|
|
$ |
(1,225 |
) |
|
$ |
(768 |
) |
|
$ |
(547 |
) |
|
Net income (loss) |
|
$ |
(10 |
) |
|
$ |
(1,231 |
) |
|
$ |
(770 |
) |
|
$ |
(591 |
) |
|
Net (loss) per share, basic (1) |
|
$ |
(0.00 |
) |
|
$ |
(0.11 |
) |
|
$ |
(0.07 |
) |
|
$ |
(0.05 |
) |
|
Weighted average shares outstanding, basic |
|
|
11,375 |
|
|
|
11,564 |
|
|
|
11,540 |
|
|
|
11,465 |
|
|
Net (loss) per share, diluted (1) |
|
$ |
(0.00 |
) |
|
$ |
(0.11 |
) |
|
$ |
(0.07 |
) |
|
$ |
(0.05 |
) |
|
Weighted average shares outstanding, diluted |
|
|
11,375 |
|
|
|
11,564 |
|
|
|
11,540 |
|
|
|
11,465 |
|
|
(1) |
Basic and diluted net (loss) per share is computed independently for each of the quarters presented. Therefore, the sum of the quarterly per share amounts will not necessarily equal the total for the year. |
F-33
SCHEDULE II - VALUATION AND QUALIFYING ACCOUNTS
FOR EACH OF THE THREE YEARS
IN THE PERIOD ENDED DECEMBER 31, 2016
(In thousands)
|
|
|
|
|
|
|
Additions |
|
|
|
|
|
|
|
|
|
|
|
|
|
Balance at |
|
|
charged to |
|
|
|
|
|
|
Balance at |
|
|||
|
|
|
beginning of |
|
|
costs and |
|
|
|
|
|
|
end of |
|
|||
|
|
|
period |
|
|
expenses |
|
|
Deductions |
|
|
period |
|
||||
|
Allowance for accounts receivable (1): |
|
|
|
|
|
|
|
|
|
|
|
|
|
|
|
|
|
2016 |
|
$ |
201 |
|
|
$ |
70 |
|
|
$ |
(74 |
) |
|
$ |
197 |
|
|
2015 |
|
|
602 |
|
|
|
31 |
|
|
|
(432 |
) |
|
|
201 |
|
|
2014 |
|
|
617 |
|
|
|
347 |
|
|
|
(362 |
) |
|
|
602 |
|
|
Allowance for excess and obsolete inventory: |
|
|
|
|
|
|
|
|
|
|
|
|
|
|
|
|
|
2016 |
|
$ |
158 |
|
|
$ |
11 |
|
|
$ |
(21 |
) |
|
$ |
148 |
|
|
2015 |
|
|
151 |
|
|
|
48 |
|
|
|
(41 |
) |
|
|
158 |
|
|
2014 |
|
|
301 |
|
|
|
124 |
|
|
|
(274 |
) |
|
|
151 |
|
|
(1) |
Allowances are for retail return reserves, marketing development funds, and doubtful accounts. |
S-1