Attached files
| file | filename |
|---|---|
| EX-99.1 - EX-99.1 - Jones Energy, Inc. | jone-20161231ex991b80fc8.htm |
| EX-32.2 - EX-32.2 - Jones Energy, Inc. | jone-20161231ex3227fb34d.htm |
| EX-32.1 - EX-32.1 - Jones Energy, Inc. | jone-20161231ex321ba2d33.htm |
| EX-31.2 - EX-31.2 - Jones Energy, Inc. | jone-20161231ex31270db29.htm |
| EX-31.1 - EX-31.1 - Jones Energy, Inc. | jone-20161231ex31118f98b.htm |
| EX-23.2 - EX-23.2 - Jones Energy, Inc. | jone-20161231ex232c4f4e1.htm |
| EX-23.1 - EX-23.1 - Jones Energy, Inc. | jone-20161231ex231554242.htm |
| EX-21.1 - EX-21.1 - Jones Energy, Inc. | jone-20161231ex2118b0ba3.htm |
| EX-10.29 - EX-10.29 - Jones Energy, Inc. | jone-20161231ex10299d04e.htm |
UNITED STATES
SECURITIES AND EXCHANGE COMMISSION
Washington, D.C. 20549
FORM 10‑K
|
☒ |
ANNUAL REPORT PURSUANT TO SECTION 13 OR 15(d) OF THE SECURITIES EXCHANGE ACT OF 1934 |
|
|
|
|
For the fiscal year ended: December 31, 2016 |
|
|
|
|
|
☐ |
TRANSITION REPORT PURSUANT TO SECTION 13 OR 15(d) OF THE SECURITIES EXCHANGE ACT OF 1934 |
|
|
|
|
For the transition period from to |
|
Commission file number: 001‑36006
Jones Energy, Inc.
(Exact name of registrant as specified in its charter)
|
Delaware |
80‑0907968 |
807 Las Cimas Parkway, Suite 350
Austin, Texas 78746
(Address of principal executive offices) (Zip Code)
Tel: (512) 328‑2953
Registrant’s telephone number, including area code
Securities registered pursuant to Section 12(b) of the Exchange Act:
|
Title of class |
|
Name of each exchange on which registered |
|
Class A Common Stock, $0.001 par value |
|
New York Stock Exchange |
Securities registered pursuant to Section 12(g) of the Exchange Act: None
Indicate by check mark if the registrant is a well‑known seasoned issuer, as defined in Rule 405 of the Securities Act. Yes ☐ No ☒
Indicate by check mark if the registrant is not required to file reports pursuant to Section 13 or 15(d) of the Act. Yes ☐ No ☒
Indicate by check mark whether the registrant (1) has filed all reports required to be filed by Section 13 or 15(d) of the Securities Exchange Act of 1934 during the preceding 12 months (or for such shorter period that the registrant was required to file such reports), and (2) has been subject to such filing requirements for the past 90 days. Yes ☒ No ☐
Indicate by check mark whether the registrant has submitted electronically and posted on its corporate website, if any, every Interactive Data File required to be submitted and posted pursuant to Rule 405 of Regulation S‑T during the preceding 12 months (or for such shorter period that the registrant was required to submit and post such files). Yes ☒ No ☐
Indicate by check mark if disclosure of delinquent filers pursuant to Item 405 of Regulation S‑K (§ 229.405 of this chapter) is not contained herein, and will not be contained, to the best of registrant’s knowledge, in definitive proxy or information statements incorporated by reference in Part III of this Form 10‑K or any amendment to this Form 10‑K. ☐
Indicate by check mark whether the registrant is a large accelerated filer, an accelerated filer, a non‑accelerated filer, or a smaller reporting company. See the definitions of “large accelerated filer,” “accelerated filer” and “smaller reporting company” in Rule 12b‑2 of the Exchange Act.
|
Large accelerated filer ☐ |
Accelerated filer ☒ |
Non‑accelerated filer ☐ |
Smaller reporting company ☐ |
Indicate by check mark whether the registrant is a shell company (as defined in Rule 12b‑2 of the Exchange Act). Yes ☐ No ☒
The aggregate market value of the voting and non-voting common stock held by non-affiliates of the registrant computed as of June 30, 2016 (the last business day of the Registrant’s most recently completed second fiscal quarter) based on the closing price of the Class A common stock on the New York Stock Exchange was $126.4 million.
There were 57,193,106 and 29,832,098 shares of the registrant’s Class A and Class B common stock, respectively, outstanding on March 1, 2017.
DOCUMENTS INCORPORATED BY REFERENCE
Portions of the registrant’s definitive proxy statement for the 2017 Annual Meeting of Stockholders, to be filed no later than 120 days after the end of the fiscal year, which we refer to as the Proxy Statement, are incorporated by reference into Part III of this Annual Report on Form 10‑K.
JONES ENERGY, INC.
i
Cautionary Statement Regarding Forward‑Looking Statements
The information in this Annual Report on Form 10‑K (the “Annual Report”), includes “forward‑looking statements.” All statements, other than statements of historical fact included in this report, regarding our strategy, future operations, financial position, estimated revenues and losses, projected costs, prospects, plans and objectives of management are forward‑looking statements. When used in this Annual Report, the words “could,” “should,” “will,” “may,” “believe,” “anticipate,” “intend,” “estimate,” “expect,” “project” and similar expressions are intended to identify forward‑looking statements, although not all forward‑looking statements contain such identifying words. These forward‑looking statements are based on our current expectations and assumptions about future events and are based on currently available information as to the outcome and timing of future events. When considering forward‑looking statements, you should keep in mind the risk factors and other cautionary statements described under the heading “Risk Factors” included in this report. These forward‑looking statements are based on management’s current belief, based on currently available information, as to the outcome and timing of future events, actions and developments including:
|
· |
business strategy; |
|
· |
estimated current and future net reserves and the present value thereof; |
|
· |
drilling and completion of wells including our identified drilling locations; |
|
· |
cash flows and liquidity; |
|
· |
financial strategy, budget, projections and operating results; |
|
· |
future prices and change in prices for oil, natural gas and NGLs; |
|
· |
customers’ elections to reject ethane and include it as part of the natural gas stream; |
|
· |
timing and amount of future production of oil and natural gas; |
|
· |
availability and cost of drilling, completion and production equipment; |
|
· |
availability and cost of oilfield labor; |
|
· |
the amount, nature and timing of capital expenditures, including future development costs; |
|
· |
ability to fund our 2017 capital expenditure budget; |
|
· |
availability and terms of capital; |
|
· |
development results from our identified drilling locations; |
|
· |
ability to generate returns and pursue opportunities; |
|
· |
marketing of oil, natural gas and NGLs; |
|
· |
property acquisitions and dispositions, including potential non-strategic asset sales; |
|
· |
the availability, cost and terms of, and competition for mineral leases and other permits and rights‑of‑way and our ability to maintain mineral leases; |
|
· |
costs of developing our properties and conducting other operations, including costs associated with our operations in the Merge area as compared to our operations in the Cleveland play; |
|
· |
general economic conditions, including the levels of supply and demand for oil, natural gas and NGLs, and the commodity price environment; |
|
· |
competitive conditions in our industry; |
1
|
· |
effectiveness and extent of our risk management activities; |
|
· |
estimates of future potential impairments; |
|
· |
environmental and endangered species regulations and liabilities; |
|
· |
counterparty credit risk; |
|
· |
the extent and effect of any hedging activities engaged in by us; |
|
· |
the impact of, and changes in, governmental regulation of the oil and natural gas industry, including tax laws and regulations, environmental, health and safety laws and regulations, and laws and regulations with respect to derivatives and hedging activities; |
|
· |
developments in oil‑producing and natural gas‑producing countries; |
|
· |
uncertainty regarding our future operating results; |
|
· |
weather, including its impact on oil and natural gas demand and weather‑related delays on operations; |
|
· |
technology; and |
|
· |
plans, objectives, expectations and intentions contained in this report that are not historical. |
We caution you that these forward‑looking statements are subject to all of the risks and uncertainties, most of which are difficult to predict and many of which are beyond our control, incident to the exploration for and development and production of oil and natural gas. These risks include, but are not limited to, commodity price levels and volatility, inflation, the cost of oil field equipment and services, lack of availability of drilling, completion and production equipment and services, environmental risks, drilling and other operating risks, regulatory changes, the uncertainty inherent in estimating oil and natural gas reserves and in projecting future rates of production, cash flow and access to capital, the timing of development expenditures, and the other risks described under “Risk Factors” in this report.
Reserve engineering is a process of estimating underground accumulations of oil and natural gas that cannot be measured in an exact way. The accuracy of any reserve estimate depends on the quality of available data, the interpretation of such data and price and cost assumptions made by reservoir engineers. In addition, the results of drilling, testing and production activities may justify revisions of estimates that were made previously. If significant, such revisions would change the schedule of any further production and development drilling. Accordingly, reserve estimates may differ significantly from the quantities of oil and natural gas that are ultimately recovered.
Should one or more of the risks or uncertainties described in this report occur, or should underlying assumptions prove incorrect, our actual results and plans could differ materially from those expressed in any forward‑looking statements.
All forward‑looking statements, expressed or implied, included in this report are expressly qualified in their entirety by this cautionary statement. This cautionary statement should also be considered in connection with any subsequent written or oral forward‑looking statements that we or persons acting on our behalf may issue.
Except as otherwise required by applicable law, we disclaim any duty to update any forward‑looking statements, all of which are expressly qualified by the statements in this section, to reflect events or circumstances after the date of this report.
References
Unless indicated otherwise in this Annual Report or the context requires otherwise, all references to “Jones Energy,” the “Company,” “our company,” “we,” “our” and “us” refer to Jones Energy, Inc. and its subsidiaries, including Jones Energy Holdings, LLC (“JEH”). Jones Energy, Inc. is a holding company whose sole material asset is an equity interest in Jones Energy Holdings, LLC.
2
Organization
Jones Energy, Inc. was formed in March 2013 as a Delaware corporation to become a publicly-traded entity and the holding company of Jones Energy Holdings, LLC. As the sole managing member of JEH, the Company is responsible for all operational, management and administrative decisions relating to JEH’s business and consolidates the financial results of JEH and its subsidiaries.
The Company’s certificate of incorporation authorizes two classes of common stock, Class A common stock and Class B common stock. The Class B common stock is held by the owners of JEH prior to the Company’s initial public offering (“IPO”) and can be exchanged (together with a corresponding number of common units representing membership interests in JEH (“JEH Units”)) for shares of Class A common stock on a one-for-one basis, subject to customary conversion rate adjustments for stock splits, stock dividends and reclassifications and other similar transactions. In addition, the Company’s certificate of incorporation also authorizes the board of directors of the Company to establish one or more series of preferred stock. On August 25, 2016, the Company issued 1.84 million shares of its 8.0% Series A Perpetual Convertible preferred stock, par value $0.001 per share (the “Series A preferred stock”), in a registered public offering.
Jones Energy, Inc.’s Class A common stock has been listed on the New York Stock Exchange (“NYSE”) under the symbol “JONE” since July 2013.
Overview
We are an independent oil and gas company engaged in the exploration, development, production and acquisition of oil and natural gas properties in the mid‑continent United States, spanning areas of Texas and Oklahoma. Our Chairman and CEO, Jonny Jones, founded our predecessor company in 1988 in continuation of his family’s long history in the oil and gas business, which dates back to the 1920’s. We have grown rapidly by leveraging our focus on low-cost drilling and completion methods and our horizontal drilling expertise to develop our inventory and execute several strategic acquisitions. We have accumulated extensive knowledge and experience in developing the Anadarko and Arkoma basins, having concentrated our operations in the Anadarko basin for over 25 years and applied our knowledge to the Arkoma basin since 2011. We have drilled over 840 total wells as operator, including nearly 670 horizontal wells, since our formation and delivered compelling rates of return over various commodity price cycles. Our operations are focused on horizontal drilling and completions within three distinct areas in the Texas Panhandle and Oklahoma:
|
· |
the Western Anadarko Basin—targeting the liquids rich Cleveland, Granite Wash, Tonkawa and Marmaton formations; |
|
· |
the Eastern Anadarko Basin—targeting the liquids rich Merge Woodford shale and Sycamore formations in the Merge area of the STACK/SCOOP (the “Merge”); and |
|
· |
the Arkoma Basin—targeting the Arkoma Woodford shale formation. |
We seek to optimize returns through a disciplined emphasis on controlling costs and promoting operational efficiencies, and we are recognized as one of the lowest-cost drilling and completion operators in the Cleveland and Arkoma Woodford shale formations. We believe that our low-cost drilling expertise will apply directly to our new drilling in the Merge area, which is located approximately 150 miles to the east of our Cleveland play.
The Anadarko and Arkoma basins are among the most prolific and largest onshore producing oil and natural gas basins in the United States, characterized by multiple producing horizons and extensive well control collected over 100 years of development. We leverage our extensive geologic experience in the basin and seek to identify the most profitable exploration and development opportunities to apply our operational expertise. The formations we target are generally characterized by oil and/or liquids‑rich natural gas content, extensive production histories, long‑lived reserves, high drilling success rates and attractive initial production rates. We focus on formations in our operating areas that we believe offer significant development and acquisition opportunities and to which we can apply our technical experience and operational excellence to increase proved reserves and production to deliver attractive economic rates of return. Our goal is to build value through a disciplined balance between developing our current inventory of 6,923 gross (1,659 net)
3
identified drilling locations, identifying new opportunities within our existing asset base, and actively pursuing organic leasing and acquisitions.
On August 18, 2016, we entered into a definitive purchase and sale agreement with SCOOP Energy Company, LLC to acquire oil and gas properties located in the Merge area of the STACK/SCOOP play in Central Oklahoma (the “Merge Acquisition”). The oil and gas properties acquired in the Merge Acquisition principally consist of approximately 18,000 undeveloped net acres in Canadian, Grady and McClain Counties, Oklahoma. We closed the Merge Acquisition on September 22, 2016. This acquisition represents a natural eastward expansion of our Anadarko platform. The position contatins multiple target zones providing significant stacked pay potential. We spud our first well in this new play on December 8, 2016.
As of December 31, 2016, our total estimated proved reserves were 105.2 MMBoe, of which 59% were classified as proved developed reserves. Approximately 22% of our total estimated proved reserves as of December 31, 2016 consisted of oil, 33% consisted of NGLs, and 45% consisted of natural gas. As of December 31, 2016, our properties included 1,170 gross producing wells. For the three years ended December 31, 2016, we drilled 234 wells as operator. The following table presents summary reserve, acreage and production data for each of our core operating areas:
|
|
|
|
|
|
|
|
|
|
|
|
Year Ended |
|
||
|
|
|
As of December 31, 2016 |
|
December 31, 2016 |
|
|||||||||
|
|
|
Estimated Net |
|
|
|
|
|
|
Average Daily Net |
|
||||
|
|
|
Proved Reserves |
|
|
Acreage |
|
Production |
|
||||||
|
|
|
|
|
% Oil and |
|
|
Gross |
|
Net |
|
|
|
% Oil and |
|
|
|
|
MMBoe |
|
NGLs |
|
|
Acreage |
|
Acreage |
|
MBoe/d |
|
NGLs |
|
|
Western Anadarko (1) |
|
86.4 |
|
60 |
% |
|
222,132 |
|
157,852 |
|
13.9 |
|
62 |
% |
|
Eastern Anadarko (2) |
|
2.5 |
|
63 |
% |
|
158,219 |
|
18,131 |
|
— |
|
— |
% |
|
Arkoma (3) |
|
14.2 |
|
33 |
% |
|
10,444 |
|
4,298 |
|
3.0 |
|
34 |
% |
|
Other |
|
2.1 |
|
13 |
% |
|
35,083 |
|
18,937 |
|
2.3 |
|
41 |
% |
|
All properties |
|
105.2 |
|
55 |
% |
|
425,878 |
|
199,218 |
|
19.2 |
|
55 |
% |
|
(1) |
Western Anadarko includes the Cleveland, Granite Wash, Tonkawa and Marmaton formations. |
|
(2) |
Eastern Anadarko includes the Merge and STACK plays. |
|
(3) |
Arkoma includes the Arkoma Woodford formation. |
The following table presents summary well and drilling location data for each of our key formations for the date indicated:
|
|
|
As of December 31, 2016 |
|
||||||
|
|
|
|
|
|
|
Identified |
|
||
|
|
|
Producing |
|
Drilling |
|
||||
|
|
|
Wells |
|
Locations (1) |
|
||||
|
|
|
Gross |
|
Net |
|
Gross |
|
Net |
|
|
Western Anadarko |
|
748 |
|
501 |
|
1,903 |
|
1,013 |
|
|
Eastern Anadarko |
|
34 |
|
1 |
|
4,746 |
|
605 |
|
|
Arkoma |
|
152 |
|
60 |
|
274 |
|
41 |
|
|
Other |
|
236 |
|
78 |
|
— |
|
— |
|
|
All properties |
|
1,170 |
|
640 |
|
6,923 |
|
1,659 |
|
|
(1) |
Our total identified drilling locations include 2,716 gross total proved undeveloped, probable and possible drilling locations, of which 485 gross locations are associated with proved undeveloped reserves as of December 31, 2016. We have estimated our drilling locations based on well spacing assumptions for the areas in which we operate and other criteria. See “Business—Development of Proved Undeveloped Reserves” and “Business—Drilling Locations” for more information regarding our proved undeveloped reserves and the processes and criteria through which these drilling locations were identified. |
Our 2016 capital expenditures totaled $268.8 million (excluding the impact of asset retirement costs), of which $72.2 million was utilized to drill and complete operated wells and $163.0 million was related to acquisition activity. The Company has established an initial capital budget of $275.0 million for 2017, including $232 million for drilling and completion, $25 million for leasing and $18 million for workovers and efficiency projects. Please see “Item 7. Management’s Discussion and Analysis of Financial Condition and Results of Operations—Liquidity and Capital
4
Resources.” We expect to fund our 2017 budgeted capital expenditures with cash flow from operations and borrowings under our credit facility, as well as potential non-strategic asset sales or potentially accessing the public debt and/or equity markets. Furthermore, we expect to develop all drilling locations classified as proved undeveloped reserves in the year‑end reserve report within five years of initial proved reserve booking. We consider projections of future commodity prices when determining our development plan, but many other factors are also considered. Should the commodity price environment or other material factors change significantly from current levels, we will re‑evaluate our development plan at that time. If the evaluation results in a shifting of capital expenditures into future periods beyond five years from the initial proved reserve booking, it could potentially lead to a reduction in proved undeveloped reserves.
We have allocated our 2017 capital expenditure budget as follows:
|
(in millions of dollars) |
|
2017 Capital Expenditure Budget |
|
|||
|
Drilling and completion |
|
|
|
|
|
|
|
|
Western Anadarko |
|
$ |
122 |
|
|
|
|
Eastern Anadarko, operated |
|
|
88 |
|
|
|
|
Eastern Anadarko, non-operated |
|
|
22 |
|
|
|
|
Total drilling and completion |
|
$ |
232 |
|
|
|
Leasing |
|
|
25 |
|
|
|
|
Other activities |
|
|
18 |
|
|
|
|
|
All properties and activities |
|
$ |
275 |
|
|
Business Strategies
Our goal is to increase shareholder value by managing our capital expenditures and level of activity to maximize returns through commodity price cycles while also evaluating and executing opportunities for growth of reserves, production, and cash flow through potential partnerships, acquisitions, leasing and pooling opportunities. We seek to achieve this goal by executing a combination of the following strategies:
Maintain the Lowest Cost Structure in the Plays Where We Operate.
Decades of experience in the mid-continent United States and emphasis on operational execution and cost control have allowed us to drill and complete wells at significantly lower cost than most other operators and, as a result, to realize compelling economic returns. In the Cleveland, for example, from 2005 to 2015 we reduced our average well spud‑to‑rig release time, which directly affects drilling costs, from 30 days to 17 days, and in 2016 we further reduced that metric to an average of 15 days. During that same timeframe, we have more than doubled the lateral lengths of wells we drilled, which directly affects production, from approximately 2,000 feet to approximately 4,500 feet per well. We will continue to apply this expertise while also leveraging our leading position in our focus areas to obtain the best possible pricing from service providers which we expect will further reduce capital costs and ultimately enhance returns. Our cost structure is particularly important in periods of low commodity prices and may give us an advantage over other operators as we compete for acquisitions, leases, and strategic partnerships.
Develop Our Multi‑Year Inventory.
We intend to add production and reserves through the development of our existing drilling inventory, which we believe to be repeatable and low‑risk. The Company has a long history in the mid-continent United States, having drilled over 840 wells in the area since 1988. We believe our historical drilling experience, together with the results of substantial industry activity within our operating areas, reduces the risk and uncertainty associated with drilling horizontal wells in these areas. As of December 31, 2016, we had identified 6,923 gross (1,659 net) drilling locations, which gives us many years of development drilling based on our current development plan.
Opportunistically Grow Through Exploration, Acquisitions and Strategic Partnerships.
As a complement to our development program, we look to execute acquisitions, leases and partnerships where our operating experience can be leveraged. Given the Company’s ability to decrease costs and ramp up drilling activity, we seek opportunities that have less proved developed producing reserves and a large number of high‑quality drilling
5
locations. Since 2009, we have successfully executed five significant property acquisitions and several bolt‑on acquisitions in our operating areas, for an aggregate purchase price of approximately $1.0 billion. The Merge Acquisition, which closed in September 2016, is an example of this strategy with the acreage being an Eastern extension of our Anadarko footprint.
We also continue to seek new leasing opportunities to expand our acreage position and complement our existing drilling inventory, as we believe that targeted organic leasing around our existing acreage provides the ability for greater returns due to cost and operating synergies in overlapping areas of operation.
In calendar year 2016, we leased and/or acquired over 53,000 net acres.
Joint development opportunities complement our acquisition strategy by providing a capital efficient and risk‑lowering approach to acquiring drilling opportunities. These agreements give us control over the drilling and completion phase of the well, where we can add value by applying our low-cost structure. In this regard, we have a history of developed relationships with several large exploration and production companies such as BP, ConocoPhillips, and ExxonMobil, in which they have farmed out portions of their basin operations to us. We have drilled nearly 330 wells in connection with these types of agreements, of which approximately 200 have been drilled in connection with an active 16‑year farm‑out and development agreement with ExxonMobil.
Exploit Upside Within Our Existing Assets.
The stacked reservoirs within our asset base provide exposure to additional upside potential in several emerging resource plays. We expect to engage in additional development activity throughout the Anadarko basin as commodity prices continue to improve. Based upon our recent assessment, we believe that we have approximately 752 gross potential drilling locations in the Tonkawa and Marmaton formations that provide us with additional resource potential. Further, our current leasehold position provides longer term potential exposure to other prospective formations found in the Anadarko basin, including the Douglas, Cottage Grove, Cherokee Shale, Atoka Shale, and the Upper, Middle and Lower Morrow formations. In our newly acquired Merge acreage, we have additional upside potential beyond the Merge Woodford and Sycamore, including the Hunton, Osage, Chester, Caney, and Spinger formations, along with numerous prospective Pennsylvanian-age sandstone and carbonate reservoirs identified from logs and offset production. In addition, we continue to apply our proven geoscience expertise in the search for new exploration opportunities in the greater mid-continent United States region.
Maintain Operational Control.
We operated substantially all of the wells that we drilled and completed during 2016, allowing us to effectively manage the timing and levels of our development spending, overall well costs and operating expenses. With over 76% of our total acreage held by existing production, and, over 83% of our acreage held by existing production exluding our newly acquired Merge acreage, we also will not be required to expend significant capital to hold acreage in our portfolio. We believe that continuing to exercise a high degree of control over our acreage position will provide us with flexibility to manage our drilling program and optimize our returns and profitability.
Focus on Well‑Level Returns.
Our management and technical teams are focused on maximizing well‑level returns, which we believe drives shareholder value. In addition to our focus on costs and optimizing drilling and completion techniques, our team maximizes returns by allocating capital to areas with the highest rates of return based on commodity mix. Our drilling inventory comprises oil, natural gas and NGLs, which enables us to adjust our development approach based on prevailing commodity prices. In light of current commodity prices, we will continue to focus our drilling activity on locations which present the best commodity mix coupled with the most operational efficiency from a development program standpoint. In addition, we expect that continuing to operate the substantial majority of our drilling locations will allow us to reallocate our capital and resources opportunistically in response to market conditions. Our disciplined focus on well‑level returns in allocating our capital and resources has been a key component of our ability to deliver successful results through various commodity price cycles.
Competitive Strengths
We possess a number of competitive strengths that we believe will allow us to successfully execute our business strategy:
6
Geographic Focus in the Prolific Mid-Continent United States.
Our operations are focused in the mid-continent United States region, targeting liquids‑ rich opportunities in the Anadarko and Arkoma basins of Texas and Oklahoma. We generally focus on formations characterized by oil and liquids‑rich natural gas content, extensive production histories, long‑lived reserves, high drilling success rates, and attractive initial production rates. Furthermore, our areas of operation are proximate to well‑developed natural gas and liquids midstream infrastructure and oilfield services providers, which we believe reduces the risk of production delays and facilitates adequate takeaway capacity.
Multi‑Year Drilling Inventory in Existing and Emerging Resource Plays.
Our drilling inventory consists of approximately 6,923 gross identified drilling locations in the Anadarko and Arkoma basins, and our development plans target locations that we believe are low‑cost, provide attractive economics, present low risk, and support a relatively predictable production profile. As of December 31, 2016, we had identified 1,903 gross drilling locations in the Western Anadarko basin, 4,746 gross drilling locations in the Eastern Anadarko basin, and 274 gross drilling locations in the Arkoma basin. Our concentrated leasehold position has been delineated largely through drilling on our Cleveland leasehold, which we expanded substantially through our Chalker and Sabine acquisitions and more recently through our leasing efforts. We have also expanded, in prior years, through joint development agreements with large independent producers and major oil and gas companies in the Cleveland and Arkoma Woodford formations.
Extensive Operational Expertise and Low‑Cost Operating Structure.
Drilling horizontal wells has been our primary approach to field development since 1998. Having drilled nearly 670 horizontal wells in nine formations in our areas of operation since 1996, we have established systematic protocols that we believe provide repeatable results. We also have established relationships with oilfield services providers, allowing for continued cost efficiencies. As an example, we have consistently drilled horizontal Cleveland wells at a meaningfully lower cost than most of our competition in the same area. Through our focus on drilling, completion and operational efficiencies, we are able to effectively control costs and deliver attractive rates of return and profitability.
Strong Financial Position and Conservative Policies.
We are committed to maintaining a conservative financial profile in order to preserve operational flexibility and financial stability. We believe that our operating cash flow, together with projected availability under our senior secured revolving credit facility, provide us with the financial flexibility to pursue acquisitions, joint development agreements and organic leasing opportunities. In addition, we have historically hedged a significant amount of our production from oil, gas and NGLs. For the three years ended December 31, 2016, approximately 81% of our total production was protected by commodity hedges. Our hedge position is reviewed frequently to evaluate the impact of new wells coming online and changes to our development program. We intend to continue to actively hedge our future production in order to reduce the impact of commodity price volatility on our cash flows and secure our rates of return for up to five years. As of December 31, 2016, the market value of our existing hedges was approximately $43.0 million.
High Caliber Management Team with Deep Operating Experience and a Proven Track Record.
Our top five executives average more than 29 years of industry experience and have worked together developing assets for many years, resulting in a high degree of continuity. We have assembled a strong technical staff of geoscientists, field operations managers and engineers with significant experience drilling horizontal wells and with fracture stimulation of unconventional formations, which has resulted in a successful track record of reserve and production growth. In addition, our management team has extensive expertise and operational experience in the oil and natural gas industry with a proven track record of successfully negotiating, executing and integrating acquisitions. Members of our management team and staff have previously held positions with both major and large independent oil and natural gas companies, including ExxonMobil, BP, Shell, Southwestern Energy, Marathon Oil, Chesapeake Energy, Apache, EOG Resources, Chevron, Devon Energy, and Conoco Phillips.
Alignment of Management Team.
Our predecessor company was founded in 1988 by our CEO, Jonny Jones, in continuation of his family’s history in the oil and gas business, which dates back to the 1920’s. Jones family members and our management team controlled approximately 15.5% of our combined voting power and economic interest as of December 31, 2016. We believe the
7
equity interests of our officers and directors align their interests and provide substantial incentive to grow the value of our business.
Recent Developments
See Note 16, “Subsequent Events,” in the Notes to Consolidated Financial Statements for discussion of recent developments.
Our Operations
Our Areas of Operations
We own leasehold interests in oil and natural gas producing properties, as well as in undeveloped acreage, substantially all of which are located in the Anadarko and Arkoma basins in Texas and Oklahoma. The majority of our interests are in producing properties located in fields characterized by what we believe to be long‑lived, predictable production profiles and repeatable development opportunities. Specifically, our properties and wells are located in fields that generally have been developed over a long period of time, typically decades. Given the long productive history of these fields, there is substantial midstream and service infrastructure in place, including natural gas and NGL pipelines and natural gas processing plants. Observing the performance of these fields over many years allows for greater understanding of production and reservoir characteristics, making future performance more predictable. For a discussion of the risks inherent in oil and natural gas production, please read “Risk Factors—Drilling for and producing oil, natural gas and NGLs are high‑risk activities with many uncertainties that could adversely affect our business, financial condition or results of operations.”
Anadarko Basin
Approximately 86% of our estimated proved reserves as of December 31, 2016 and approximately 83% of our average daily net production for the year ended December 31, 2016 were located in the Anadarko basin. The Anadarko basin is one of the most prolific oil and natural gas producing basins in the United States, covering approximately 50,000 square miles primarily in Oklahoma, but also including the upper Texas Panhandle, southwestern Kansas, and southeastern Colorado.
The basin has an especially well developed interval of productive Pennsylvanian age sedimentary rocks, up to 15,000 feet thick. Our wells in this area produce oil, natural gas and NGLs from various formations at depths from approximately 7,000 feet to 12,000 feet. We drilled 46 gross (41 net) wells as operator in the Anadarko basin during 2016. Our operations in the Anadarko basin have been primarily focused on the Cleveland formation where we have 669 producing wells. We also have acreage in the Tonkawa, Marmaton, Granite Wash, and various Pennsylvanian‑age shale formations located in the eastern portion of the Texas Panhandle and western Oklahoma.
Our production in the Anadarko basin is currently derived primarily from the following formations, where we have 782 gross (502 net) producing wells and where we have identified 6,649 gross (1,618 net) drilling locations as of December 31, 2016, of which 429 have proved undeveloped reserves attributed to them as of December 31, 2016. See “Drilling Locations” for more information regarding the processes and criteria through which these drilling locations were identified.
Western Anadarko Basin.
|
· |
Cleveland Formation. Our Cleveland acreage is primarily located in Ochiltree, Lipscomb, Hutchinson, and Hemphill Counties in Texas and Ellis County in Oklahoma. The Cleveland formation ranges from depths of approximately 7,000 feet to 8,800 feet and is characterized by a tight, shaly sand with low permeability that lends itself to improved recovery through enhanced drilling and completion techniques. |
As of December 31, 2016, we had 669 gross (474 net) producing wells in the formation with an average working interest of 71%, of which we operated 484 gross (403 net) producing wells. Our Cleveland properties contained 82.1 MMBoe of estimated net proved reserves as of December 31, 2016, 60% of which are oil and NGLs, and generated an average daily net production of 13.9 MBoe/d for the year ended December 31, 2016. We have identified 788 gross (540 net) drilling locations in the Cleveland formation as of December 31, 2016. Of these 788 locations, 310 locations (39%) have proved undeveloped reserves attributed to them as of December 31, 2016.
8
|
· |
Tonkawa Formation. As of December 31, 2016, we identified 279 gross (168 net) drilling locations in the Tonkawa formation primarily in Lipscomb and Hemphill Counties in Texas. In addition, the Tonkawa formation is present in the area of other properties we own located primarily in Ellis and Roger Mills Counties in Oklahoma. The Tonkawa is a newly‑targeted horizontal oil formation at depths of approximately 6,000 feet to 8,000 feet and is characterized by fine to very fine‑grained shallow marine sandstone, ranging in thickness from 20 feet to 40 feet. |
We drilled our first horizontal Tonkawa well in May 2010 and drilled two additional horizontal wells in the formation under a farm‑out with Samson Resources that is not part of our current leasehold. During 2014, we drilled six additional test wells in different areas of the Company’s leasehold acreage in the Tonkawa formation. As of December 31, 2016, our Tonkawa properties contained 0.2 MMBoe of estimated net proved reserves.
|
· |
Marmaton Formation. As of December 31, 2016, we identified 473 gross (283 net) drilling locations in the Marmaton formation. Our properties in the Marmaton formation are all undeveloped and span three sub‑ formations: properties located primarily in Ellis County, Oklahoma characterized by fluvio‑deltaic sands, properties located primarily in Northeast Ochiltree and Northwest Lipscomb Counties, Texas, characterized by shallow marine sands, and properties located primarily in Ochiltree County, Texas characterized by algal reef complex. The Marmaton sand is a tight, shaly sand with similar reservoir characteristics to the Cleveland. The Marmaton sand ranges in thickness from 40 feet to 80 feet while the reef ranges from 80 feet to 150 feet. |
|
· |
Granite Wash Formation. Our Granite Wash acreage is primarily located in Roberts, Hemphill and Wheeler Counties in Texas and Roger Mills, Beckham, Custer and Washita Counties in Oklahoma. The Granite Wash spans multiple zones from depths of approximately 9,000 feet to 12,000 feet and is composed of stacked, low permeability, variable lithology alluvial fan deltaic deposits. |
As of December 31, 2016, we had 30 gross (18 net) producing wells in the formation with an average working interest of 59%, of which we operated 23 gross (17 net) producing wells. Our Granite Wash properties contained 2.4 MMBoe of estimated net proved reserves as of December 31, 2016, approximately 45% of which are oil and NGLs. We have 363 gross (22 net) remaining drilling locations in the Granite Wash formation as of December 31, 2016.
Eastern Anadarko Basin.
|
· |
Merge Woodford Formation. Our Merge Woodford acreage is located in Canadian, Grady and McClain Counties in Oklahoma. The Merge Woodford ranges in depths of approximately 8,500 feet to 13,000 feet and includes various fluids from black oil to gas/condensate. The Merge Woodford formation consist of siliceous, organic-rich shale, and thin bedded carbonates. The low permeability reservoir is naturally fractured with silica-rich brittle layers that are highly conducive to improved recovery from enhanced drilling and completion techniques. |
Our Merge Woodford properties contained 1.1 MMBoe of estimated net proved reserves as of December 31, 2016, approximately 63% of which are oil and NGLs. We have identified 3,363 gross (407 net) drilling locations in the Merge Woodford formation as of December 31, 2016. Of these 3,363 locations, 51 locations (2%) have proved undeveloped reserves attributed to them as of December 31, 2016.
|
· |
Sycamore Formation. Our Sycamore acreage is located in Canadian, Grady and McClain Counties in Oklahoma. The Sycamore is a newly-targeted horizontal liquid-rich reservoir that ranges in depths of approximately 8,000 feet to 12,500 feet. The reservoir includes various fluids from black oil to gas/condensate. The Sycamore formation consist of siltstones, organic-rich shale, and limestones with gradations between rock types. Early results from laterals drilled in various landing points within the Sycamore indicate the rock is highly conducive to improved recovery from enhanced drilling and completion techniques. |
Our Sycamore properties contained 1.3 MMBoe of estimated net proved reserves as of December 31, 2016, approximately 63% of which are oil and NGLs. We have identified 1,383 gross (198 net) drilling locations
9
in the Sycamore formation as of December 31, 2016. Of these 1,383 locations, 18 locations (1%) have proved undeveloped reserves attributed to them as of December 31, 2016.
Future Potential Opportunities. Our current leasehold position provides longer term potential exposure to other prospective formations in the Anadarko basin, including the Atoka, Cherokee, Douglas, Cottage Grove, and Upper and Lower Morrow formations in the Western Anadarko, and the Hunton, Osage, Chester, Caney, and Springer formations in the Eastern Anadarko. The Atoka and Cherokee formations, in particular, have attractive geologic properties, and we may elect to pursue their development in the future.
Arkoma Basin
Approximately 14% of our estimated proved reserves as of December 31, 2016, and approximately 17% of our average daily net production for the year ended December 2016, were located in the Arkoma basin. The Arkoma basin is a historically prolific, largely gas‑prone basin extending from eastern Oklahoma into western Arkansas. The basin produces natural gas, oil and NGLs from multiple horizons, which range in depth from 500 to 21,000 feet.
As of December 31, 2016, we operated approximately 42% of our properties in the Arkoma basin and produce primarily from the Arkoma Woodford formation.
|
· |
Arkoma Woodford Shale Formation. Our properties in the Arkoma Woodford shale formation are located primarily in Atoka, Coal, Pittsburg and Hughes Counties in eastern Oklahoma. The Arkoma Woodford shale formation ranges from depths of approximately 5,000 feet to 12,700 feet and is composed of 75 to 220‑foot thick black siliceous shale in our operating area. The Arkoma Woodford shale in this area is prospective for natural gas with a high concentration of associated NGLs. |
As of December 31, 2016, we have 152 gross (60 net) producing wells in the formation with an average working interest of 39%, of which we operated 78 gross (45 net) producing wells. Our Arkoma Woodford shale formation properties contained 14.2 MMBoe of estimated net proved reserves as of December 31, 2016, 33% of which are oil and NGLs, and generated an average daily net production of 3.0 MBoe/d for the year ended December 31, 2016. We identified 274 gross (41 net) drilling locations in the Arkoma Woodford shale formation as of December 31, 2016, of which 20% had proved undeveloped reserves attributed to them.
Drilling Locations
We have identified a total of 6,923 gross (1,659 net) drilling locations, all of which are horizontal drilling locations. Of these total identified locations, 2,047 gross locations are attributable to acreage that is currently held by production and approximately 485 (7%) are attributable to proved undeveloped reserves as of December 31, 2016. In order to identify drilling locations, we apply geologic screening criteria based on the presence of a minimum threshold of reservoir thickness in a section and then consider the number of sections and the appropriate well density to develop the applicable field. In making these assessments, we include properties in which we hold operated and non‑operated interests, as well as redevelopment opportunities. Once we have identified acreage that is prospective for the targeted formations, well placement is determined primarily by the regulatory spacing rules prescribed by the governing body in each of our operating areas. Wells drilled in the Cleveland formation are developed on 128‑acre spacing (5 wells per section). Wells drilled in the Merge Woodford formation adhere to 160‑acre spacing (4 wells per section). Wells drilled in the Sycamore formation are developed on 213‑acre spacing (3 wells per section). Wells drilled in the Arkoma Woodford shale formation adhere to 80‑acre and 120‑acre spacing, depending on the area. Wells drilled in the Granite Wash formation are developed on 128‑acre or 213‑acre spacing. Wells drilled in the Tonkawa and Marmaton formations adhere to 160‑acre spacing. We view the risk profiles for the Tonkawa and Marmaton formations as being higher than for our other drilling locations due to relatively less available production data and drilling history.
Our identified drilling locations are scheduled to be drilled over many years. The ultimate timing of the drilling of these locations will be influenced by multiple factors, including oil, natural gas and NGL prices, the availability and cost of capital, drilling, completion and production costs, the availability of drilling services and equipment, drilling results, lease expirations, gathering systems, processing, marketing and pipeline transportation constraints, regulatory approvals and other factors. In addition, a number of our identified drilling locations are associated with joint development agreements, and if we do not meet our obligation to drill the minimum number of wells specified in an agreement, we will lose the right to continue to develop certain acreage covered by that agreement. For a discussion of the risks
10
associated with our drilling program, see “Risk Factors—Our identified drilling locations are scheduled to be drilled over many years, making them susceptible to uncertainties that could materially alter the occurrence or timing of their drilling, which in certain instances could prevent or delay associated expected production. In addition, we may not be able to raise the amount of capital that would be necessary to drill a substantial portion of our identified drilling locations.”
Estimated Proved Reserves
The following table sets forth summary data with respect to our estimated net proved oil, natural gas and NGLs reserves as of December 31, 2016, 2015 and 2014, which are based upon reserve reports of Cawley, Gillespie & Associates, Inc., (“Cawley Gillespie”), our independent reserve engineers. Cawley Gillespie’s reports were prepared in accordance with the rules and regulations of the SEC regarding oil and natural gas reserve reporting in effect during such periods.
|
|
|
As of December 31, |
|
|||||||
|
|
|
2016 |
|
2015 |
|
2014 |
|
|||
|
Reserve Data: |
|
|
|
|
|
|
|
|
|
|
|
Estimated proved reserves: |
|
|
|
|
|
|
|
|
|
|
|
Oil (MBbls) |
|
|
23,594 |
|
|
25,408 |
|
|
27,683 |
|
|
Natural gas (MMcf) |
|
|
283,140 |
|
|
261,596 |
|
|
292,277 |
|
|
NGLs (MBbls) |
|
|
34,425 |
|
|
32,649 |
|
|
38,870 |
|
|
Total estimated proved reserves (MBoe) (1) |
|
|
105,209 |
|
|
101,657 |
|
|
115,266 |
|
|
Estimated proved developed reserves: |
|
|
|
|
|
|
|
|
|
|
|
Oil (MBbls) |
|
|
11,471 |
|
|
11,032 |
|
|
10,773 |
|
|
Natural gas (MMcf) |
|
|
180,293 |
|
|
169,651 |
|
|
160,877 |
|
|
NGLs (MBbls) |
|
|
20,941 |
|
|
19,670 |
|
|
22,555 |
|
|
Total estimated proved developed reserves (MBoe) (1) |
|
|
62,461 |
|
|
58,977 |
|
|
60,141 |
|
|
Estimated proved undeveloped reserves: |
|
|
|
|
|
|
|
|
|
|
|
Oil (MBbls) |
|
|
12,123 |
|
|
14,376 |
|
|
16,910 |
|
|
Natural gas (MMcf) |
|
|
102,847 |
|
|
91,945 |
|
|
131,400 |
|
|
NGLs (MBbls) |
|
|
13,484 |
|
|
12,980 |
|
|
16,315 |
|
|
Total estimated proved undeveloped reserves (MBoe) (1) |
|
|
42,748 |
|
|
42,680 |
|
|
55,125 |
|
|
PV-10 (in millions) (2) |
|
$ |
401 |
|
$ |
470 |
|
$ |
1,502 |
|
|
Standardized measure (in millions) (3) |
|
|
383 |
|
|
465 |
|
|
1,388 |
|
|
(1) |
One Boe is equal to six Mcf of natural gas or one Bbl of oil or NGLs based on an approximate energy equivalency. This is a physical correlation and does not reflect a value or price relationship between the commodities. |
|
(2) |
PV‑10 is a non‑GAAP financial measure and generally differs from Standardized Measure, the most directly comparable GAAP financial measure, because it does not include the effect of income taxes on discounted future net cash flows. Neither PV‑10 nor Standardized Measure represents an estimate of the fair market value of our oil and natural gas properties. The oil and gas industry uses PV‑10 as a measure to compare the relative size and value of proved reserves held by companies without regard to the specific tax characteristics of such entities. See “Reconciliation of PV‑10 to Standardized Measure” below. |
|
(3) |
Standardized measure is calculated in accordance with ASC Topic 932, Extractive Activities—Oil and Gas. |
11
The following table sets forth the benchmark prices used to determine our estimated proved reserves for the periods indicated.
|
|
|
As of December 31, |
|
|||||||
|
|
|
2016 |
|
2015 |
|
2014 |
|
|||
|
Oil, Natural Gas and NGLs Benchmark Prices: |
|
|
|
|
|
|
|
|
|
|
|
Oil (per Bbl) (1) |
|
$ |
42.75 |
|
$ |
50.25 |
|
$ |
94.99 |
|
|
Natural gas (per MMBtu) (2) |
|
|
2.46 |
|
|
2.59 |
|
|
4.35 |
|
|
NGLs (per Bbl) (3) |
|
|
17.73 |
|
|
17.63 |
|
|
33.17 |
|
|
(1) |
Benchmark prices for oil reflect the unweighted arithmetic average first‑day‑of‑the‑month prices for the prior 12 months using WTI Cushing posted prices. These prices were utilized in the reserve reports prepared by Cawley Gillespie and in management’s internal estimates and are adjusted by well for content, quality, transportation fees, geographical differentials, marketing bonuses or deductions and other factors affecting the price received at the wellhead. As of December 31, 2016, 2015 and 2014, the average realized prices for oil were $38.80, $45.97 and $91.06 per Bbl, respectively. |
|
(2) |
Benchmark prices for natural gas in the table above reflect the unweighted arithmetic average first‑day‑of‑the‑month prices for the prior 12 months, respectively, using Henry Hub prices. These prices were utilized in the reserve reports prepared by Cawley Gillespie and in management’s internal estimates and are adjusted by well for content, quality, transportation fees, geographical differentials, marketing bonuses or deductions and other factors affecting the price received at the wellhead. As of December 31, 2016, 2015 and 2014, the average realized prices for natural gas were $2.19, $2.37 and $4.16 per MMBtu, respectively. |
|
(3) |
Prices for NGLs in the table above reflect the average realized prices for the prior 12 months assuming ethane is recovered from the natural gas stream. Benchmark prices for NGLs vary depending on the composition of the NGL basket and current prices for the various components thereof, such as butane, ethane, and propane, among others. Due to declines in ethane prices relative to natural gas prices, beginning in 2012, purchasers of our Arkoma Woodford production have been electing not to recover ethane from the natural gas stream and instead are paying us based on the natural gas price for the ethane left in the gas stream. As a result of the increased energy content associated with the returned ethane and the absence of plant shrinkage, this ethane rejection has increased the incremental revenue and volumes that we receive for our natural gas product relative to what we would have received if the ethane was separately recovered, but has reduced physical barrels of liquid ethane that we are selling. |
Reserves Sensitivities
Assuming NYMEX strip pricing as of March 1, 2017 through 2021 and keeping pricing flat thereafter, instead of 2016 SEC pricing, and leaving all other parameters unchanged, the Company’s proved reserves would have been 113.2 MMBoe and the PV‑10 value of proved reserves would have been $682.0 million. This alternative pricing scenario is provided only to demonstrate the impact that the current pricing environment may have on reserves volumes and PV‑10. There is no assurance that these prices will actually be realized. The value of our proved reserves as of December 31, 2016 calculated using SEC pricing is lower than the value of our proved reserves calculated using current market prices. Using SEC pricing of December 31, 2016, our total estimated proved reserves were 105.2 MMBoe and the PV‑10 value of proved reserves was $401.4 million.
Reconciliation of PV‑10 to Standardized Measure
PV‑10 is derived from the Standardized Measure of discounted future net cash flows, which is the most directly comparable GAAP financial measure. PV‑10 is a computation of the Standardized Measure of discounted future net cash flows on a pre‑tax basis. PV‑10 is equal to the Standardized Measure of discounted future net cash flows at the applicable date, before deducting future income taxes, discounted at 10 percent. We believe that the presentation of PV‑10 is relevant and useful to investors because it presents the discounted future net cash flows attributable to our estimated net proved reserves prior to taking into account future corporate income taxes, and it is a useful measure for evaluating the relative monetary significance of our oil and natural gas properties. Further, investors may utilize the measure as a basis for comparison of the relative size and value of our reserves to other companies. We use this measure when assessing the potential return on investment related to our oil and natural gas properties. PV‑10, however, is not a
12
substitute for the Standardized Measure of discounted future net cash flows. Our PV‑10 measure and the Standardized Measure of discounted future net cash flows do not purport to represent the fair value of our oil and natural gas reserves.
The following table provides a reconciliation of the components of the Standardized Measure of discounted future net cash flows to PV‑10 at December 31, 2016, 2015 and 2014.
|
|
|
As of December 31, |
|
|||||||
|
(in millions of dollars) |
|
2016 |
|
2015 |
|
2014 |
|
|||
|
Standardized measure |
|
$ |
383 |
|
$ |
465 |
|
$ |
1,388 |
|
|
Present value of future income taxes discounted at 10% |
|
|
18 |
|
|
5 |
|
|
114 |
|
|
PV-10 |
|
$ |
401 |
|
$ |
470 |
|
$ |
1,502 |
|
Internal Controls
Our proved reserves are estimated at the well or unit level and compiled for reporting purposes by our corporate reservoir engineering staff. We maintain internal evaluations of our reserves in a secure reserve engineering database. The corporate reservoir engineering staff interacts with our internal petroleum engineers and geoscience professionals in each of our operating areas and with operating, accounting and marketing employees to obtain the necessary data for the reserves estimation process. Reserves are reviewed and approved internally by our senior management team on a semi‑annual basis. We expect to have our reserve estimates evaluated by Cawley Gillespie, our independent third‑party reserve engineers, or another independent reserve engineering firm, at least annually.
Our internal professional staff works closely with Cawley Gillespie to ensure the integrity, accuracy and timeliness of data that is furnished to them for their reserve estimation process. We provide all of the reserve information maintained in our secure reserve engineering database to the external engineers, as well as other pertinent data, such as geologic maps, well logs, production tests, material balance calculations, well performance data, operating procedures and relevant economic criteria. We make all requested information, as well as our pertinent personnel, available to the external engineers as part of their evaluation of our reserves. Various procedures are used to ensure the accuracy of the data provided to our independent petroleum engineers, including review processes. Changes in reserves from the previous report are closely monitored. Reconciliation of reserves from the previous report, which includes an explanation of all significant changes, is reviewed by both the engineering department and upper management, including our chief operating officer. Our independent petroleum engineers prepare our annual reserves estimates, whereas interim estimates are internally prepared.
Technology Used to Establish Proved Reserves
Under SEC rules, proved reserves are those quantities of oil and natural gas that by analysis of geoscience and engineering data can be estimated with reasonable certainty to be economically producible from a given date forward from known reservoirs, and under existing economic conditions, operating methods and government regulations. The term “reasonable certainty” implies a high degree of confidence that the quantities of oil and natural gas actually recovered will equal or exceed the estimate. Reasonable certainty can be established using techniques that have been proven effective by actual production from projects in the same reservoir or an analogous reservoir or by other evidence using reliable technology that establishes reasonable certainty. Reliable technology is a grouping of one or more technologies (including computational methods) that has been field tested and has been demonstrated to provide reasonably certain results with consistency and repeatability in the formation being evaluated or in an analogous formation.
To establish reasonable certainty with respect to our estimated proved reserves, our internal reserve engineers and Cawley Gillespie employed technologies that have been demonstrated to yield results with consistency and repeatability. The technologies and economic data used in the estimation of our proved reserves include, but are not limited to, electrical logs, radioactivity logs, core analyses, geologic maps and available downhole and production data, seismic data and well test data. Reserves attributable to producing wells with sufficient production history were estimated using appropriate decline curves or other performance relationships. Reserves attributable to producing wells with limited production history and for undeveloped locations were estimated using performance from analogous wells in the surrounding area and geologic data to assess the reservoir continuity. These wells were considered to be analogous based on production performance from the same formation and well completion using similar techniques.
13
Qualifications of Responsible Technical Persons
Internal engineer. Eric Niccum, our Executive Vice President and Chief Operating Officer, is the technical specialist primarily responsible for overseeing the preparation of our reserves estimates. Mr. Niccum is also responsible for liaising with and oversight of our third‑party reserve engineer. Mr. Niccum is a graduate of Purdue University with a Bachelor of Science degree in Mechanical Engineering. He has 23 years of energy experience.
Cawley Gillespie. Cawley, Gillespie & Associates, Inc. is a Texas Registered Engineering Firm (F‑693), made up of independent registered professional engineers and geologists. The firm has provided petroleum consulting services to the oil and gas industry for over 50 years. No director, officer, or key employee of Cawley Gillespie has any financial ownership in us or any of our affiliates. Cawley Gillespie’s compensation for the required investigations and preparation of its report is not contingent upon the results obtained and reported, and Cawley Gillespie has not performed other work for us that would affect its objectivity. The engineering audit presented in the Cawley Gillespie report was supervised by W. Todd Brooker, Senior Vice President at Cawley Gillespie. Mr. Brooker is an experienced reservoir engineer having been a practicing petroleum engineer since 1989. He has more than 25 years of experience in reserves evaluation and joined Cawley Gillespie as a reserve engineer in 1992. He has a Bachelor’s of Science Degree in Petroleum Engineering from the University of Texas at Austin and is a Registered Professional Engineer in the State of Texas (License No. 83462).
Development of Proved Undeveloped Reserves
As of December 31, 2016, none of our proved undeveloped reserves at December 31, 2016 were scheduled to be developed on a date more than five years from the date the reserves were initially booked as proved undeveloped. However, certain of our proved undeveloped reserves are associated with joint development agreements with third parties that include obligations to drill a specified minimum number of wells in a time frame that is shorter than five years. If we do not meet our obligation to drill the minimum number of wells specified in a joint development agreement, we will lose the right to continue to develop the undeveloped acreage covered by the agreement, which in some cases would result in a reduction in our proved undeveloped reserves. Historically, our drilling and development programs were substantially funded from our cash flow from operations and the capital markets. Our expectation is to continue to fund our drilling and development programs primarily from our cash flow from operations and projected availability under our senior secured revolving credit facility, as well as potential non-strategic asset sales or potentially accessing the public debt and/or equity markets. Based on our current expectations of our cash flows and drilling and development programs, which include drilling of proved undeveloped locations, we believe that we will be able to fund the drilling of our current inventory of proved undeveloped locations and our expansion activities in the next five years. For a more detailed discussion of our liquidity position, please read “Management’s Discussion and Analysis of Financial Condition and Results of Operations—Liquidity and Capital Resources.”
|
|
|
Total |
|
|
|
|
(MMBoe) |
|
|
Estimated Proved Undeveloped Reserves |
|
|
|
|
December 31, 2014 |
|
55.1 |
|
|
Extensions and discoveries |
|
3.7 |
|
|
Conversion to proved developed |
|
(8.2) |
|
|
Purchases of minerals in place |
|
— |
|
|
Sales of minerals in place |
|
— |
|
|
Revisions of previous estimates |
|
(7.9) |
|
|
December 31, 2015 |
|
42.7 |
|
|
Extensions and discoveries |
|
2.0 |
|
|
Conversion to proved developed |
|
(5.9) |
|
|
Purchases of minerals in place |
|
9.2 |
|
|
Sales of minerals in place |
|
— |
|
|
Revisions of previous estimates |
|
(5.3) |
|
|
December 31, 2016 |
|
42.7 |
|
We have maintained the volume of our proved undeveloped reserves year-over-year at 42.7 MMBoe as of December 31, 2015 and 2016. Reductions were due to (i) the conversion of 5.9 MMBoe of proved undeveloped reserves to proved developed reserves and (ii) net negative revisions of 5.3 MMBoe, primarily due to forecast revisions. These were offset
14
by increases due to (i) additions of 2.0 MMBoe from extensions and discoveries and (ii) additions of 9.2 MMBoe from the purchase of minerals in place. Proved undeveloped reserves decreased as a percentage of total reserves from 42% for the year ended December 31, 2015 to 41% for the year ended December 31, 2016. Proved undeveloped reserves decreased as a percentage of total reserves from 48% for the year ended December 31, 2014 to 42% for the year ended December 31, 2015.
For the year ended December 31, 2016, we converted 5.9 MMBoe of proved undeveloped reserves to proved developed reserves or 14% of total proved undeveloped reserves booked at December 31, 2015. We incurred approximately $73.7 million in capital to convert undeveloped reserves to proved developed reserves during the year ended December 31, 2016. Our 2016 capital expenditures totaled $268.8 million excluding the impact of asset retirement costs, of which $72.2 million was utilized to drill and complete operated wells including wells that had no proved undeveloped reserves associated with them prior to drilling. The Company has established an initial capital budget of $275.0 million for 2017, with the majority dedicated to drilling and completion activities. Costs of proved undeveloped reserve development in 2016 do not represent the total costs of these conversions, as additional costs may have been incurred in previous years. Estimated future development costs relating to the development of 2016 year‑end proved undeveloped reserves is $401.4 million, all of which is scheduled to be incurred within five years of initial proved reserve booking. All drilling locations classified as proved undeveloped reserves in the year‑end reserve report are scheduled to be drilled within five years of initial proved reserve booking.
Operating Data
The following table sets forth summary data regarding production volumes, average prices and average production costs associated with our sale of oil and natural gas for the periods indicated.
|
|
|
Year Ended December 31, |
|
|||||||
|
|
|
2016 |
|
2015 |
|
2014 |
|
|||
|
Production and Operating Data: |
|
|
|
|
|
|
|
|
|
|
|
Net Production Volumes: |
|
|
|
|
|
|
|
|
|
|
|
Oil (MBbls) |
|
|
1,685 |
|
|
2,583 |
|
|
2,475 |
|
|
Natural gas (MMcf) |
|
|
18,842 |
|
|
23,839 |
|
|
21,922 |
|
|
NGLs (MBbls) |
|
|
2,204 |
|
|
2,618 |
|
|
2,345 |
|
|
Total (MBoe) |
|
|
7,029 |
|
|
9,174 |
|
|
8,474 |
|
|
Average net production (Boe/d) |
|
|
19,205 |
|
|
25,134 |
|
|
23,216 |
|
|
Average Sales Price (1): |
|
|
|
|
|
|
|
|
|
|
|
Oil (per Bbl) |
|
$ |
37.83 |
|
$ |
44.15 |
|
$ |
88.93 |
|
|
Natural gas (per Mcf) |
|
|
1.67 |
|
|
1.91 |
|
|
3.78 |
|
|
NGLs (per Bbl) |
|
|
13.48 |
|
|
13.36 |
|
|
32.14 |
|
|
Combined (per Boe) realized |
|
|
17.77 |
|
|
21.21 |
|
|
44.65 |
|
|
Average Costs per Boe: |
|
|
|
|
|
|
|
|
|
|
|
Lease operating |
|
$ |
4.64 |
|
$ |
4.47 |
|
$ |
4.46 |
|
|
Production and ad valorem taxes |
|
|
1.11 |
|
|
1.32 |
|
|
2.66 |
|
|
Depreciation, depletion and amortization |
|
|
21.90 |
|
|
22.40 |
|
|
21.44 |
|
|
General and administrative (2) |
|
|
4.22 |
|
|
3.64 |
|
|
3.04 |
|
|
(1) |
Prices do not include the effects of derivative cash settlements. |
|
(2) |
General and administrative includes non‑cash compensation of $8.2 million, $8.0 million and $4.8 million for the years ended December 31, 2016, 2015 and 2014, respectively. Excluding non-cash compensation from the above metric results in average cash general and administrative cost per Boe of $3.05, $2.77 and $2.47 for the years ended December 31, 2016, 2015 and 2014, respectively. |
15
Drilling Activity
The following table sets forth information with respect to wells drilled and completed during the periods indicated. The information should not be considered indicative of future performance, nor should a correlation be assumed between the number of productive wells drilled, quantities of reserves found or economic value.
|
|
|
Year Ended December 31, |
|
||||||||||
|
|
|
2016 |
|
2015 |
|
2014 |
|
||||||
|
|
|
Gross |
|
Net |
|
Gross |
|
Net |
|
Gross |
|
Net |
|
|
Development Wells: |
|
|
|
|
|
|
|
|
|
|
|
|
|
|
Productive |
|
42 |
|
37 |
|
51 |
|
47 |
|
134 |
|
107 |
|
|
Mechanical failure (1) |
|
3 |
|
3 |
|
1 |
|
1 |
|
1 |
|
1 |
|
|
Dry |
|
— |
|
— |
|
— |
|
— |
|
— |
|
— |
|
|
Exploratory Wells: |
|
|
|
|
|
|
|
|
|
|
|
|
|
|
Productive |
|
1 |
|
1 |
|
— |
|
— |
|
— |
|
— |
|
|
Dry |
|
— |
|
— |
|
— |
|
— |
|
1 |
|
1 |
|
|
Total Wells: |
|
|
|
|
|
|
|
|
|
|
|
|
|
|
Productive |
|
43 |
|
38 |
|
51 |
|
47 |
|
134 |
|
107 |
|
|
Mechanical failure (1) |
|
3 |
|
3 |
|
1 |
|
1 |
|
1 |
|
1 |
|
|
Dry |
|
— |
|
— |
|
— |
|
— |
|
1 |
|
1 |
|
|
Total |
|
46 |
|
41 |
|
52 |
|
48 |
|
136 |
|
109 |
|
|
(1) |
Mechanical failures represent wells drilled during the year indicated which were classified as “Proved Developed Non-Producing” in the Reserve Report for that year. |
For the three years ended December 31, 2016, we had one gross (one net) developmental or exploratory well that was deemed to be a dry well. As of December 31, 2016, there were four development wells in the process of drilling and two wells in the process of completions. For the three years ended December 31, 2016, we drilled 234 gross (198 net) wells as operator with over a 97% success rate.
During the twelve months ended December 31, 2016, we successfully drilled 43 gross proved undeveloped wells and completed 32 gross proved undeveloped wells.
Productive Wells
The following table sets forth our total gross and net productive wells by oil or natural gas classification as of December 31, 2016.
|
|
|
Oil |
|
Natural Gas |
|
Total |
|
||||||
|
|
|
Gross |
|
Net |
|
Gross |
|
Net |
|
Gross |
|
Net |
|
|
Operated (1) |
|
303 |
|
249 |
|
356 |
|
285 |
|
659 |
|
534 |
|
|
Non-operated |
|
98 |
|
14 |
|
413 |
|
92 |
|
511 |
|
106 |
|
|
Total |
|
401 |
|
263 |
|
769 |
|
377 |
|
1,170 |
|
640 |
|
|
(1) |
Includes wells on which we act as contract operator. |
Gross wells are the total number of producing wells in which we own an interest, and net wells are the sum of our fractional working interests owned in gross wells.
Acreage Data
The following table sets forth certain information regarding the developed and undeveloped acreage in which we have an interest as of December 31, 2016 for each of our producing areas. Acreage related to royalty, overriding royalty and
16
other similar interests is excluded from this summary. As of December 31, 2016, over 76% of our leasehold acreage was held by existing production.
|
|
|
Developed Acres |
|
Undeveloped Acres |
|
Total |
|
||||||
|
|
|
Gross |
|
Net |
|
Gross |
|
Net |
|
Gross |
|
Net |
|
|
Western Anadarko |
|
180,256 |
|
127,781 |
|
41,876 |
|
30,071 |
|
222,132 |
|
157,852 |
|
|
Eastern Anadarko |
|
7,109 |
|
1,073 |
|
151,110 |
|
17,058 |
|
158,219 |
|
18,131 |
|
|
Arkoma |
|
10,444 |
|
4,298 |
|
— |
|
— |
|
10,444 |
|
4,298 |
|
|
Other |
|
33,191 |
|
18,887 |
|
1,892 |
|
50 |
|
35,083 |
|
18,937 |
|
|
All properties |
|
231,000 |
|
152,039 |
|
194,878 |
|
47,179 |
|
425,878 |
|
199,218 |
|
Undeveloped Acreage Expirations
The following table sets forth the number of gross and net undeveloped acres as of December 31, 2016 that will expire over the next three years by operating area unless production is established within the spacing units covering the acreage prior to the expiration dates or unless the existing leases are renewed prior to expiration.
|
|
|
Expiring 2017 |
|
Expiring 2018 |
|
Expiring 2019 |
|
Thereafter |
|
||||||||
|
|
|
Gross |
|
Net |
|
Gross |
|
Net |
|
Gross |
|
Net |
|
Gross |
|
Net |
|
|
Western Anadarko |
|
17,831 |
|
14,676 |
|
14,708 |
|
7,777 |
|
9,337 |
|
7,618 |
|
— |
|
— |
|
|
Eastern Anadarko |
|
17,424 |
|
3,099 |
|
67,459 |
|
8,898 |
|
66,227 |
|
5,061 |
|
— |
|
— |
|
|
Arkoma |
|
— |
|
— |
|
— |
|
— |
|
— |
|
— |
|
— |
|
— |
|
|
Other |
|
1,575 |
|
43 |
|
— |
|
— |
|
317 |
|
7 |
|
— |
|
— |
|
|
All properties |
|
36,830 |
|
17,818 |
|
82,167 |
|
16,675 |
|
75,881 |
|
12,686 |
|
— |
|
— |
|
A majority of the leases comprising the acreage set forth in the table above will expire at the end of their respective primary terms unless operations have commenced or production from the acreage has been established prior to such date, in which event the lease will remain in effect until the cessation of operations or production in commercial quantities. We also have options to extend some of our leases through payment of additional lease bonus payments prior to the expiration of the primary term of the leases. In addition, we may attempt to secure a new lease upon the expiration of certain of our acreage; however, there may be third‑party leases that become effective immediately if our leases expire at the end of their respective terms and production has not been established prior to such date. We do not have any of our proved undeveloped reserves as of December 31, 2016 attributed to acreage whose lease expiration date precedes the scheduled initial drilling date. Our leases are mainly fee leases with primary terms of three to five years. We believe that our lease terms are similar to our competitors’ fee lease terms as they relate to both primary term and royalty interests.
Competition
The oil and natural gas industry is highly competitive. We compete with numerous entities, including major domestic and foreign oil companies, other independent oil and natural gas concerns and individual producers and operators. Many of these competitors are large, well‑established companies and have financial and other resources substantially greater than ours. As a result, our competitors may be able to pay more for productive oil and natural gas properties and exploratory prospects, as well as evaluate, bid for and purchase a greater number of properties and prospects than our financial or personnel resources permit. Our ability to acquire additional properties and to find and develop reserves will depend on our ability to evaluate and select suitable properties and to consummate transactions in a highly competitive environment. Please read “Risk Factors—We may be unable to compete effectively with larger companies, which may adversely affect our ability to generate sufficient revenues.”
We are also affected by competition for drilling rigs, equipment, services, supplies and qualified personnel. Starting with the downturn in commodity prices in late 2014, the United States onshore oil and natural gas industry experienced a surplus of drilling and completion rigs, equipment, pipe and personnel, due to significantly lower commodity prices. Although this provided a temporary respite from the previous high demand environment, demand for such services and equipment have recently begun to increase as commodity prices have recovered and stabilized. If commodity prices continue to increase and exploration and production activity increases, market forces may revert to the previous situation that resulted in delayed development drilling and other exploration activities and caused significant increases in the prices for this equipment and personnel. We are unable to predict when, or if, such changes may occur or how they would affect our development and exploitation programs.
17
Segment Information and Geographic Areas
The Company operates in one industry segment, which is the exploration, development and production of oil and natural gas, and all of its operations are conducted in one geographic area of the United States, as described under “—Our Operations—Our Areas of Operations.”
Oil and Natural Gas Leases
The typical oil and natural gas lease agreement covering our properties provides for the payment of royalties to the mineral owner for all oil and natural gas produced from any wells drilled on the leased premises. The lessor royalties and other leasehold burdens on our properties generally range from 19% to 25%. Our net revenue interests average 61% for our operated leases and 40% including all operated and non‑operated leases.
Over 76% of our leases (based on net acreage) are held by production and do not require lease rental payments.
Marketing and Major Customers
Our oil is generally sold under short‑term, extendable and cancellable agreements with unaffiliated purchasers based on published price bulletins reflecting an established field posting price. As a consequence, the prices we receive for oil and liquids move up and down in direct correlation with the oil market as it reacts to supply and demand factors. We do not own any oil or liquids pipelines or other assets for the transportation of those commodities, and transportation costs related to moving oil are deducted from the price received for oil. In September of 2014, we signed a 10‑year oil gathering and transportation agreement with Monarch Oil Pipeline LLC, pursuant to which Monarch Oil Pipeline LLC built, at its expense, a new oil gathering system and connected the gathering system to our dedicated leases in Texas. The system began service during the fourth quarter of 2015 and provides connectivity to both a regional refinery market as well as the Cushing market hub. We have reserved capacity of up to 12,000 barrels per day on the system with the potential to increase throughput at a future date.
Our natural gas is sold under both long‑term and short‑term natural gas purchase agreements. Natural gas produced by us is sold at various delivery points at or near producing wells to natural gas gathering and marketing companies. We receive proceeds from prices that are based on various pipeline indices less any associated fees. On virtually all of our natural gas production, we are paid for the extracted NGLs based on a negotiated percentage of the proceeds that are generated from the customer’s sale of the liquids, or based on other negotiated pricing arrangements. We do not own any natural gas pipelines or other assets for the transportation of natural gas.
During the year ended December 31, 2016, the largest purchasers of our production were Plains Marketing LP (“Plains Marketing”) and ETC Field Services LLC, which accounted for approximately 37% and 24% of consolidated oil and gas sales, respectively. If we were to lose any one of our customers, the loss could temporarily delay production and sale of our oil and natural gas in the related producing region. If we were to lose any single customer, we believe we could identify a substitute customer to purchase the impacted production volumes. However, if one or more of our larger customers ceased purchasing oil or natural gas altogether, the loss of such customer could have a detrimental effect on our production volumes in general and on our ability to find substitute customers to purchase our production volumes. For a discussion of the risks associated with the loss of key customers, please read “Risk factors—Our customer base is concentrated, and the loss of any one of our key customers could, therefore, adversely affect our financial condition and results of operations.”
Seasonality
Generally, but not always, the demand for natural gas decreases during the summer months and increases during the winter months, resulting in seasonal fluctuations in the price we receive for our natural gas production. Seasonal anomalies such as mild winters sometimes lessen this fluctuation.
Title to Properties
Prior to completing an acquisition of producing oil and natural gas properties, we perform title reviews on significant leases, and depending on the materiality of properties, we may obtain a title opinion or review previously obtained title opinions. As a result, title examinations have been obtained on a significant portion of our properties.
18
As is customary in the oil and natural gas industry, we initially conduct only a cursory review of the titles to our properties on which we do not have proved reserves. Prior to the commencement of drilling operations on those properties, we conduct a thorough title examination and perform curative work with respect to material defects. To the extent title opinions or other investigations reflect title defects on those properties, we are typically responsible for curing any title defects at our expense. We generally will not commence drilling operations on a property until we have cured any material title defects on such property.
We conduct a portion of our operations through joint development agreements with third parties. Certain of our joint development agreements include complete‑to‑earn arrangements, whereby we are assigned title to properties from the third‑party after we complete wells. Occasionally, delivery of such assignments may be delayed. Furthermore, certain of our joint development agreements specify that assignments are only to occur when the wells are capable of producing hydrocarbons in paying quantities. These additional conditions to assignment of title may from time to time apply to wells of substantial value.
We believe that we have satisfactory title to all of our material assets. Although title to these properties is subject to encumbrances in some cases, such as customary interests generally retained in connection with the acquisition of real property, customary royalty interests and contract terms and restrictions, liens under operating agreements, liens related to environmental liabilities associated with historical operations, liens for current taxes and other burdens, easements, restrictions and minor encumbrances customary in the oil and natural gas industry, we believe that none of these liens, restrictions, easements, burdens and encumbrances will materially detract from the value of these properties or from our interest in these properties or materially interfere with our use of these properties in the operation of our business. In addition, we believe that we have obtained sufficient rights‑of‑way grants and permits from public authorities and private parties for us to operate our business in all material respects as described in this Annual Report on Form 10‑K.
Regulations
Our operations are substantially affected by federal, state and local laws and regulations. In particular, natural gas production and related operations are, or have been, subject to price controls, taxes and numerous other laws and regulations. All of the jurisdictions in which we own or operate producing oil and natural gas properties have statutory provisions regulating the exploration for and production of oil and natural gas, including provisions related to permits for the drilling of wells, bonding requirements to drill or operate wells, the location of wells, the method of drilling and casing wells, the surface use and restoration of properties upon which wells are drilled, sourcing and disposal of water used in the drilling and completion process, and the abandonment of wells. Our operations are also subject to various conservation laws and regulations. These include the regulation of the size of drilling and spacing units or proration units, the number of wells which may be drilled in an area, and the unitization or pooling of wells, as well as regulations that generally prohibit the venting or flaring of natural gas, and impose certain requirements regarding the ratability or fair apportionment of production from fields and individual wells. The effect of these regulations is to limit the amount of oil and natural gas that we can produce from our wells and limit the number of wells or locations at which we can drill, although we can apply for exceptions to such regulations or to have reductions in well spacing. Moreover, each state generally imposes a production or severance tax with respect to the production and sale of oil, natural gas and NGLs within its jurisdiction.
Failure to comply with applicable laws and regulations can result in substantial penalties. The regulatory burden on the industry increases the cost of doing business and affects profitability. Although we believe we are in substantial compliance with all applicable laws and regulations, such laws and regulations are frequently amended or reinterpreted. Therefore, we are unable to predict the future costs or impact of compliance. Additional proposals and proceedings that affect the oil and natural gas industry are regularly considered by Congress and federal agencies, the states, and the courts. We cannot predict when or whether any such proposals may become effective. Our competitors in the oil and natural gas industry are generally subject to the same regulatory requirements and restrictions that affect our operations.
Environmental Matters and Regulation
Our operations are subject to stringent and complex federal, state and local laws and regulations that govern the protection of the environment, as well as the discharge of materials into the environment. These laws and regulations may, among other things:
|
· |
require the acquisition of various permits before drilling commences; |
19
|
· |
require the installation of pollution control equipment in connection with operations; |
|
· |
restrict or prohibit our drilling and production activities during periods when such activities might affect protected wildlife; |
|
· |
place restrictions or regulations upon the types, quantities or concentrations of materials or substances used in our operations; |
|
· |
restrict the types, quantities or concentrations of various substances that can be released into the environment or used in connection with drilling, production and transportation activities; |
|
· |
limit or prohibit drilling activities on lands lying within wilderness, wetlands and other protected areas; and |
|
· |
require remedial measures to mitigate pollution from former and ongoing operations, such as site restoration, pit closure and plugging of abandoned wells. |
These laws and regulations may also restrict the rate of oil and natural gas production below the rate that would otherwise be possible. The regulatory burden on the oil and natural gas industry increases the cost of doing business in the industry and consequently affects profitability. Additionally, federal, state and local lawmakers and agencies frequently revise environmental laws and regulations. Such changes could affect costs for environmental compliance, such as waste handling, permitting, or cleanup for the oil and natural gas industry and could have a significant impact on our operating costs.
The following is a summary of some of the existing laws and regulations to which our business operations are subject.
Solid and Hazardous Waste Handling and Releases
The federal Resource Conservation and Recovery Act, or RCRA, and comparable state statutes regulate the generation, transportation, treatment, storage, disposal and cleanup of hazardous and non‑hazardous waste. Drilling fluids, produced waters, and most of the other wastes associated with the exploration, development, production and transportation of oil and gas are currently excluded from regulation as hazardous wastes under RCRA. In the course of our operations, however, we generate some industrial wastes, such as paint wastes, waste solvents, and waste oils, which may be regulated as hazardous wastes. Although a substantial amount of the waste generated in our operations are regulated as non‑hazardous solid waste rather than hazardous waste, there is no guarantee that the U.S. Environmental Protection Agency, or the EPA, or individual states will not adopt more stringent requirements for the handling of non‑hazardous waste. Moreover, it is possible that certain oil and gas exploration and production wastes now classified as non‑hazardous could be classified as hazardous wastes in the future. On May 4, 2016, environmental groups filed a declaratory judgment action in federal district court for the District of Columbia seeking to compel the EPA to review the exemption of oil and gas exploration and production wastes under RCRA in formal rulemaking; the case to compel a rulemaking schedule remains pending. Any repeal or modification of this or similar exemptions in comparable state statutes, would increase the volume of hazardous waste we are required to manage and dispose of, and would cause us, as well as our competitors, to incur increased operating expenses. Any such change could result in an increase in our costs to manage and dispose of waste, which could have a material adverse effect on our results of operations and financial position.
The Comprehensive Environmental Response, Compensation, and Liability Act, or CERCLA, also known as “Superfund,” and comparable state laws and regulations impose liability without regard to fault or legality of the original conduct, on certain classes of persons with respect to the release into the environment of substances designated under CERCLA as hazardous substances. These classes of persons, or so‑called potentially responsible parties, or PRPs, include current and past owners or operators of a site where the release occurred and anyone who disposed or arranged for the disposal of a hazardous substance released at a site. Under CERCLA, such persons may be subject to joint and several, strict liability for the costs of cleaning up the hazardous substances released into the environment, for damages to natural resources and for the costs of certain health studies. CERCLA also authorizes the EPA and, in some instances, third parties to take actions in response to threats to public health or the environment and to seek to recover from the PRPs the costs of such action. Many states have adopted comparable or more stringent state statutes. In addition, it is not uncommon for neighboring landowners and other third parties to file claims for personal injury and property damage allegedly caused by the hazardous substances released into the environment.
20
Although CERCLA generally exempts “petroleum” from the definition of hazardous substance, in the course of our operations, we have generated and will generate wastes that may fall within CERCLA’s definition of hazardous substances and may have disposed of these wastes at disposal sites owned and operated by others. We may also be the owner or operator of sites on which hazardous substances have been released. To our knowledge, neither we nor our predecessors have been designated as a PRP by the EPA under CERCLA; we also do not know of any prior owners or operators of our properties that are named as PRPs related to their ownership or operation of such properties. In the event contamination is discovered at a site on which we are or have been an owner or operator or to which we sent hazardous substances, we could be liable for the costs of investigation and remediation and natural resources damages.
We currently own, lease, or operate numerous properties that have been used for oil and natural gas exploration and production for many years. Although we believe we have utilized operating and waste disposal practices that were standard in the industry at the time, hazardous substances, wastes or hydrocarbons may have been released on or under the properties owned, leased or operated by us, or on or under other locations, including offsite locations, where such substances have been taken for disposal. In addition, some of these properties have been operated by third parties or by previous owners or operators whose treatment and disposal of hazardous substances, wastes, or hydrocarbons were not under our control. These properties and the substances disposed or released on them may be subject to RCRA, CERCLA, and analogous state laws. Spills or other contamination required to be remediated have not required material capital expenditures to date. In the future, we could be required to remediate property, including groundwater, containing or impacted by previously disposed wastes (including wastes disposed or released by prior owners or operators, or property contamination, including groundwater contamination by prior owners or operators) or to perform remedial plugging operations to prevent future or mitigate existing contamination.
Clean Water Act
The federal Water Pollution Control Act, or the Clean Water Act, and analogous state laws impose restrictions and strict controls with respect to the discharge of pollutants, including spills and leaks of produced water and other oil and natural gas wastes, into waters of the United States or waters of the state, both broadly defined terms. The discharge of pollutants into regulated waters is prohibited, except in accordance with the terms of a permit issued by the EPA or an analogous state agency. The Clean Water Act also prohibits the discharge of dredge and fill material in regulated waters, including wetlands, unless authorized by a permit issued by the U.S. Army Corps of Engineers. Federal and state regulatory agencies can impose administrative, civil and criminal penalties, as well as require remedial or mitigation measures, for non‑compliance with discharge permits or other requirements of the Clean Water Act and analogous state laws and regulations. In the event of an unauthorized discharge of wastes, we may be liable for penalties and costs. The EPA and the U.S. Army Corps of Engineers adopted in June 2015 a rule redefining the term “waters of the United States,” which establishes the scope of regulated waters under the Clean Water Act. The rule has been challenged and was stayed by federal courts. The agencies released a notice on February 28, 2017 that they intend to revisit and potentially repeal and replace this rule, and will give consideration to a narrowing of federal jurisdiction as directed in an Executive Order released that same day. The EPA also finalized regulations in 2016 under the Clean Water Act to set a zero-discharge standard for wastewater discharges from hydraulic fracturing and other natural gas production activities to publicly‑owned treatment works.
Safe Drinking Water Act
The Safe Drinking Water Act, or SDWA, regulates, among other things, underground injection operations. Congress in the past has considered legislation that would impose additional regulation under the SDWA upon the use of hydraulic fracturing fluids. If similar legislation is enacted in the future, it could impose on our hydraulic fracturing operations permit and financial assurance requirements, requirements that we adhere to construction specifications, fulfill monitoring, reporting and recordkeeping obligations, and meet plugging and abandonment requirements. In addition to subjecting the injection of hydraulic fracturing to the SDWA regulatory and permitting requirements, the previously proposed legislation would have required the disclosure of the chemicals within the hydraulic fluids, which could make it easier for third parties opposing hydraulic fracturing to initiate legal proceedings based on allegations that specific chemicals used in the process could adversely affect ground water. In addition, the EPA has taken the position that hydraulic fracturing with fluids containing diesel fuel is subject to the Underground Injection Control program in states in which the EPA is the permitting authority and released permitting guidance on the use of diesel fuel as an additive in hydraulic fracturing fluids. On December 13, 2016, the EPA released a study of the potential adverse effects that hydraulic fracturing may have on water quality and public health, concluding that there is scientific evidence that hydraulic fracturing activities can potentially impact drinking water resources in the United States under some circumstances. A committee of the U.S. House of Representatives has commenced its own investigation into hydraulic
21
fracturing practices. The U.S. Department of Energy also studied hydraulic fracturing and provided broad recommendations regarding best practices and other steps to enhance companies’ safety and environmental performance of hydraulic fracturing. If the pending or similar legislation is enacted or other new requirements or restrictions regarding hydraulic fracturing are adopted as a result of these studies, we could incur substantial compliance costs and the requirements could negatively impact our ability to conduct fracturing activities on our assets.
Other Regulation of Hydraulic Fracturing
On May 19, 2014, the EPA published an advance notice of rulemaking under the Toxic Substances Control Act, to gather information regarding the potential regulation of chemical substances and mixtures used in oil and gas exploration and production. Also, effective June 24, 2015, the Bureau of Land Management, or BLM, adopted rules regarding well stimulation, chemical disclosures, water management, and other requirements for hydraulic fracturing on federal and Indian lands; however, a federal district court invalidated these BLM rules in June 2016 and an appeal is pending. BLM also adopted new rules on November 15, 2016, to be effective on January 17, 2017, to reduce venting, flaring, and leaks during oil and natural gas production activities on onshore federal and Indian leases. On November 4, 2016 and effective December 5, 2016, the U.S. National Park Service, or NPS, finalized updates to its regulations governing non‑federal oil and gas rights, notably, eliminating exemptions affecting approval requirements for approximately 60% of the oil and gas operations located within the national park system and purporting to adopt under its own authority, the BLM rules on well stimulation invalidated by a district court. The Interagency Working Group on Unconventional Natural Gas and Oil created by Executive Order on April 13, 2012 is charged with coordinating and aligning federal agency research and scientific studies on unconventional natural gas and oil resources.
Hydraulic fracturing is also subject to regulation at the state and local levels. Several states have proposed or adopted legislative or administrative rules regulating hydraulic fracturing operations. For example, the Railroad Commission of Texas, implementing a state law passed in June 2011, adopted the Hydraulic Fracturing Chemical Disclosure Rule on December 13, 2011. The rule requires public disclosure of chemicals in fluids used in the hydraulic fracturing process for drilling permits issued after February 1, 2012. Additionally, Texas has authorized the Texas Commission on Environmental Quality to suspend water use rights for oil and gas users in the event of serious drought conditions and has imposed more stringent emissions, monitoring, inspection, maintenance, and repair requirements on Barnett Shale operators to minimize Volatile Organic Compound, or VOC, releases. Other states that we operate in, including Oklahoma, have adopted similar chemical disclosure measures. Some states, including Texas and Oklahoma, also assert the authority to shut down injection wells that are deemed to contribute to induced seismicity, or seismic activity that is caused by human activity. For example, on August 3, 2015, the Oklahoma Corporation Commission adopted a plan calling for mandatory reductions in oil and gas wastewater disposal well volumes to address potential induced seismicity in Oklahoma, which was implemented in 2015 and 2016 by ongoing reductions or shut ins of disposal wells. Please see “Risk Factors—Federal and state legislative and regulatory initiatives relating to hydraulic fracturing and other oil and gas production activities as well as governmental reviews of such activities could result in increased costs, additional operating restrictions or delays, which could adversely affect our production” for a further discussion of state hydraulic fracturing regulation. In addition to state laws, local land use restrictions, such as city ordinances, may restrict or prohibit the performance of well drilling in general and/or hydraulic fracturing in particular.
Oil Pollution Act
The primary federal law related to oil spill liability is the Oil Pollution Act, or the OPA, which amends and augments oil spill provisions of the Clean Water Act and imposes certain duties and liabilities on certain “responsible parties” related to the prevention of oil spills and damages resulting from such spills in or threatening United States waters or adjoining shorelines. For example, operators of certain oil and gas facilities must develop, implement and maintain facility response plans, conduct annual spill training for certain employees and provide varying degrees of financial assurance. A liable “responsible party” includes the owner or operator of a facility, vessel or pipeline that is a source of an oil discharge or that poses the substantial threat of discharge, or in the case of offshore facilities, the lessee or permittee of the area in which a discharging facility is located. OPA assigns strict joint and several liability, without regard to fault, to each liable party for oil removal costs and a variety of public and private damages. Although defenses exist to the liability imposed by OPA, they are limited. In the event of an oil discharge or substantial threat of discharge, we may be liable for costs and damages.
22
Air Emissions
Our operations may be subject to the Clean Air Act, or CAA, and comparable state and local requirements for the control of emissions from sources of air pollution. Federal and state laws require new and modified sources of air pollutants to obtain permits prior to commencing construction. Major sources of air pollutants are subject to more stringent, federally imposed requirements including additional permits. Federal and state laws designed to control hazardous (toxic) air pollutants, might require installation of additional controls. Administrative enforcement actions for failure to comply strictly with air pollution regulations or permits are generally resolved by payment of monetary fines and correction of any identified deficiencies. Alternatively, regulatory agencies could bring lawsuits for civil penalties or injunctions or require us to forego construction, modification or operation of certain air emission sources.
We may incur expenditures in the future for air pollution control equipment in connection with obtaining or maintaining operating permits and approvals for air emissions. For instance, effective October 15, 2012, final federal rules established new air emission controls for oil and natural gas production and natural gas processing operations, specifically addressing emissions of sulfur dioxide and volatile organic compounds, and hazardous air pollutants frequently associated with oil and natural gas production and processing activities. The rules establish specific requirements regarding emissions from compressors, dehydrators, storage tanks and other production equipment in addition to leak detection requirements for natural gas processing plants. In October 2012, several challenges to the EPA’s rules were filed by various parties, including environmental groups and industry associations. In a January 16, 2013 unopposed motion to hold this litigation in abeyance, the EPA indicated that it may reconsider some aspects of the rules. The case remains in abeyance. The EPA has since made several changes to the rules and has indicated that it may reconsider other aspects of the rules. Depending on the outcome of such judicial proceedings and regulatory actions, the rules may be further modified or rescinded or the EPA may issue new rules. These rules that took effect on October 15, 2012, as well as any modifications to these rules or additional rules, could require a number of modifications to our operations including the installation of new equipment. We have already reported some of our facilities as being subject to these rules and have incurred, and will continue to incur, costs to control emissions, and to satisfy reporting and other administrative requirements associated with these rules. Additionally, new federal rules to regulate emissions of methane and volatile organic compounds from new and modified sources in the oil and gas sector and to establish the alternative criteria for aggregating multiple small surface sites into a single source for air‑quality permitting purposes became effective on August 2, 2016. The aggregation rule could cause small facilities, on an aggregate basis, to be deemed a major source, thereby triggering more stringent air permitting processes and requirements across the oil and gas industry. Further, in 2015, the EPA adopted a lower national ambient air quality standard for ozone. This lower standard may cause additional areas to be designated as ozone nonattainment areas, causing states to revise their implementation plans to require additional emissions control equipment and to impose more stringent permit requirements on facilities in those areas.
Endangered Species and Migratory Birds
The Endangered Species Act, or ESA, restricts activities that may affect endangered or threatened species or their habitats. Pursuant to the ESA, if a species is listed as threatened or endangered, activities adversely affecting that species or its habitat may be considered “take” and may incur liability. Similar protections are offered to migratory birds under the Migratory Bird Treaty Act. Criminal liability can attach for even an incidental taking of migratory birds, and the federal government recently issued indictments under the Migratory Bird Treaty Act to several oil and gas companies after dead migratory birds were found near reserve pits associated with drilling activities.
We conduct operations in areas where certain species that are listed as threatened or endangered under the ESA may be present. For example, our operations in the Arkoma basin of Oklahoma overlap with the range of the American Burying Beetle, which is listed as endangered. The presence of endangered or threatened species may force us to modify or terminate our operations in certain areas. Additionally, the designation of previously unidentified endangered or threatened species could cause us to incur additional costs or limit future development activity in the affected areas. On August 23, 2016 an environmental group filed a Notice of Intent to sue the Fish and Wildlife Service for failure to act on 417 petitions to list species as threatened or endangered under the ESA.
On March 27, 2014, the U.S. Fish and Wildlife Service listed the Lesser Prairie Chicken as a threatened species under the Endangered Species Act. The designated habitat for the Lesser Prairie Chicken encompasses significant portions of our properties in the Anadarko basin. On September 1, 2015 a federal district court in Texas vacated the listing of the Lesser Prairie Chicken as a threatened species, holding the Fish and Wildlife Service did not sufficiently account for voluntary range wide conservation efforts being implemented to protect the species. In July 2016, the Lesser Prairie
23
Chicken was removed from the ESA List of Endangered and Threatened Wildlife following the court order. However, as of November 29, 2016, the Fish and Wildlife Service has completed initial reviews of a petition filed by environmental groups to list the Lesser Prairie Chicken as endangered and found substantial information that the petitioned action may be warranted. An assessment of the biological status of the Lesser Prairie Chicken, which began in 2015, remains ongoing and is not expected to be completed until at least the summer of 2017.
In a special rule under ESA Section 4(d) released simultaneously with the decision to list the Lesser Prairie Chicken as threatened, the Fish and Wildlife Service exempted from “take” certain oil and gas and other activities conducted by a participant that could have resulted in an “incidental take” of the Lesser Prairie Chicken as long as the participant was enrolled in, and operating in compliance with, a range‑wide conservation plan endorsed by the Fish and Wildlife Service. The range‑wide conservation plan also included a Candidate Conservation Agreement with Assurances (CCAA) component that provides “take” coverage for properties enrolled into the CCAA before the listing was effective. To mitigate the risk of liability from “incidental takes” of the Lesser Prairie Chicken, prior to delisting, we enrolled affected leasehold interests in the CCAA.
EPA issues remain dynamic. For example, on November 21, 2016, the Fish and Wildlife Service issued its revised Mitigation Policy, providing a framework and goal to achieve a net gain in conservation outcomes, or at a minimum, no net loss of resources and their values, services, and functions resulting from proposed actions authorized under the ESA; however, this policy will be evaluated by the new administration and the outcome of that review remains unclear. We continue to evaluate the impact of these rules, agency actions, and legal challenges on our operations. The listing under the Endangered Species Act of species in areas that we operate could force us to incur additional costs and delay or otherwise limit or terminate our operations.
National Environmental Policy Act
Oil and natural gas exploration and production activities on federal lands may be subject to the National Environmental Policy Act, or NEPA, which requires federal agencies, including the Department of Interior, to evaluate major agency actions having the potential to significantly impact the environment. In the course of such evaluations, an agency will prepare an Environmental Assessment that assesses the potential direct, indirect and cumulative impacts of a proposed project and, if necessary, will prepare a more detailed Environmental Impact Statement that may be made available for public review and comment. All of our current production activities, as well as any exploration and development plans that may be proposed in the future, on federal lands require governmental permits that are subject to the requirements of NEPA. This process has the potential to delay or impose additional conditions upon the development of oil and natural gas projects.
Climate Change
More stringent laws and regulations relating to climate change and greenhouse gases, or GHGs, may be adopted in the future and could cause us to incur material expenses in complying with them. Both houses of Congress have actively considered legislation to reduce emissions of GHGs, but no legislation has yet passed. In the absence of comprehensive federal legislation on GHG emission control, the EPA is regulating GHGs as pollutants under the CAA. The EPA has adopted regulations affecting emissions of GHGs from motor vehicles and is also requiring permit review for GHGs from certain stationary sources that emit GHGs at levels above statutory and regulatory thresholds and are otherwise subject to CAA permitting requirements based on emissions of non‑GHG regulated air pollutants. We do not believe our operations are currently subject to these permitting requirements, but if our operations become subject to these or other similar requirements, we could incur significant costs to control our emissions and comply with regulatory requirements.
In addition, the EPA has adopted a mandatory GHG emissions reporting program that imposes reporting and monitoring requirements on various types of facilities and industries. On November 9, 2010, the EPA issued final rules to expand its existing GHG reporting rule to include onshore oil and natural gas production, processing, transmission, storage, and distribution facilities. The rule requires reporting of GHG emissions by regulated entities to the EPA on an annual basis. Reporting was first required in 2012 for emissions occurring in 2011. In 2015, the EPA added reporting of GHG emissions from gathering and boosting systems, completions and workovers of oil wells using hydraulic fracturing, and blowdowns of natural gas transmission pipelines to the GHG reporting rule. We are currently required to monitor and report GHG emissions under this rule, and operational and/or regulatory changes could increase the burden of compliance with GHG emissions monitoring and reporting requirements.
24
Because of the lack of any comprehensive legislative program addressing GHGs, there is continuing uncertainty regarding the further development of federal regulation of GHG‑emitting sources. Additionally, a number of states, either individually or as part of regional initiatives, have begun taking actions to control and/or reduce GHG emissions primarily through the planned development of GHG emission inventories and/or regional GHG cap and trade programs. Most of these cap and trade programs work by requiring major sources of emissions to acquire and surrender emission allowances. The international, federal, regional and local regulatory initiatives that target GHGs also could adversely affect the marketability of the oil and natural gas we produce. For example, on October 23, 2015, the EPA published the final Clean Power Plan rule. While the rule directly applies to power plants, the Clean Power Plan is targeted at creating a shift from fossil fuels toward renewable power generation; however, the rule has been stayed, is not effective during the judicial review, and is likely to be revisited by the new administration. Also, in 2015, the United States participated in the United Nations Conference on Climate Change, which led to the creation of the Paris Agreement. The Paris Agreement entered into force November 4, 2016, and requires countries to review and “represent a progression” in their intended nationally determined contributions, which set GHG emission reduction goals, every five years beginning in 2020. With the change in administration, the United States’ continued participation in the Paris Agreement is uncertain. Due to the uncertainties surrounding the regulation of and other risks associated with GHG emissions, we cannot predict the financial impact of related developments on our operations, however, we do not expect our operations to be affected any differently than other similarly situated domestic competitors.
In addition to legislative and regulatory developments, plaintiffs have brought judicial actions under common law theories against greenhouse gas emitting companies in recent years. For example, municipal plaintiffs in Kivalina v. ExxonMobil Corporation, et al, alleged that the defendant corporations’ contributions to global warming caused property damage associated with rising sea levels. Although the plaintiffs in Kivalina were ultimately unsuccessful, there is a continuing litigation risk associated with greenhouse gas‑emitting activities.
The federal administration also issued a Climate Action Plan in June 2013. Among other things, the Climate Action Plan directs federal agencies to develop a strategy for the reduction of methane emissions, including emissions from the oil and natural gas industry. As previously mentioned, the EPA finalized a rule effective August 2016, setting standards for methane and volatile organic compound emissions from new and modified sources in the oil and gas sector. On November 10, 2016, the EPA issued a final Information Collection Request (ICR) that would have required numerous oil and gas companies to provide information regarding methane emissions from existing oil and gas facilities, but on March 2, 2017, EPA withdrew that ICR. It is likely that the regulatory focus is shifting in the new administration, however, additional GHG regulation of the oil and gas industry remains a possibility. Although it is not possible at this time to predict how legislation or new regulations that may be adopted to address GHG emissions would impact our business, any such future laws and regulations imposing reporting obligations on, or limiting emissions of GHGs from, our equipment and operations could require us to incur costs to reduce emissions of GHGs associated with our operations.
OSHA and Other Laws and Regulation
We are subject to the requirements of the federal Occupational Safety and Health Act, or OSHA, and comparable state statutes. These laws and regulations strictly govern the protection of the health and safety of employees. The OSHA hazard communication standard, the EPA community right‑to‑know regulations under Title III of CERCLA and similar state statutes require that we organize and/or disclose information about hazardous materials used or produced in our operations and that this information be provided to employees, state and local government authorities and citizens. We believe that we are in substantial compliance with these applicable requirements and with other OSHA and comparable requirements.
We believe that we are in substantial compliance with all existing environmental laws and regulations applicable to our current operations and that our continued compliance with existing requirements will not have a material adverse impact on our financial condition and results of operations. We did not incur any material capital expenditures for remediation or pollution control activities for the years ended December 31, 2016, 2015 or 2014. Additionally, we are not aware of any environmental issues or claims that will require material capital expenditures during 2017 or that will otherwise have a material impact on our financial position or results of operations in the future. However, we cannot assure you that the passage of more stringent laws and regulations in the future will not have a negative impact on our business activities, financial condition or results of operations.
25
Offices
We currently lease approximately 43,000 square feet of office space in Austin, Texas at 807 Las Cimas Parkway, Austin, Texas 78746, where our principal offices are located. The primary lease expires in April 2020. We also lease approximately 5,500 square feet of office space in Oklahoma City, Oklahoma. Additionally, we lease field offices in Canadian, Texas and McAlester, Oklahoma.
Employees
As of December 31, 2016, we had 90 employees, including 26 technical (geosciences, engineering, land), 34 field operations, 25 corporate (finance, accounting, business development, IT, human resources, office management) and 5 management. None of these employees are represented by labor unions or covered by any collective bargaining agreement. We consider our relations with our employees to be satisfactory. From time to time, we utilize the services of independent contractors to perform various field and other services as needed.
Available information
We are required to file annual, quarterly and current reports, proxy statements and other information with the SEC. Our reports filed with the SEC are made available to read and copy at the SEC’s Public Reference Room at 100 F Street, N.E., Washington, D.C., 20549. You may obtain information about the Public Reference Room by contacting the SEC at 1‑800‑SEC‑0330. Reports filed with the SEC are also made available on its website at www.sec.gov.
Our common stock is listed and traded on the New York Stock Exchange under the symbol “JONE.” Our reports, proxy statements and other information filed with the SEC can also be inspected and copied at the New York Stock Exchange, 20 Broad Street, New York, New York 10005.
Through our website, www.jonesenergy.com, you can access, free of charge, electronic copies of all of the documents that we file with the SEC, including our annual reports on Form 10‑K, quarterly reports on Form 10‑Q and current reports on Form 8‑K, as well as any amendments to these reports.
Our business involves a high degree of risk. If any of the following risks, or any risks described elsewhere in this Annual Report on Form 10‑K, were actually to occur, our business, financial condition or results of operations could be materially adversely affected and the trading price of our shares could decline resulting in the loss of part or all of your investment. The risks described below are not the only ones facing us. Additional risks not presently known to us or which we currently consider immaterial may also adversely affect us.
Risks Relating to the Oil and Natural Gas Industry and Our Business:
A substantial or extended decline in oil, natural gas or NGL prices may adversely affect our business, financial condition or results of operations and our ability to meet our capital expenditure obligations and financial commitments.
The price we receive for our oil, natural gas and NGLs heavily influences our revenue, profitability, access to capital and future rate of growth. Oil and natural gas are commodities and, therefore, their prices are subject to wide fluctuations in response to relatively minor changes in supply and demand. During the past six years, the NYMEX WTI oil price has ranged from a low of $26.19 per Bbl in February 2016 to a high of $113.39 per Bbl in April 2011. The NYMEX Henry Hub spot market price of gas has ranged from $7.51 per MMBtu in January 2010 to a high of $8.15 per MMBtu in February 2014 and a low of $1.49 in March 2016. These markets will likely continue to be volatile in the future, especially given the current geopolitical conditions. The prices we receive for our production and the levels of our production depend on numerous factors beyond our control. These factors include the following:
|
· |
regional and worldwide economic conditions impacting the supply and demand for oil, natural gas and NGLs; |
|
· |
the actions of the Organization of Petroleum Exporting Countries; |
|
· |
the price and quantity of imports of foreign oil, natural gas and NGLs; |
26
|
· |
political conditions regionally, domestically or in other oil and gas‑producing regions; |
|
· |
the level of domestic and global oil and natural gas exploration and production; |
|
· |
the level of domestic and global oil and natural gas inventories; |
|
· |
localized supply and demand fundamentals and transportation availability; |
|
· |
weather conditions and natural disasters; |
|
· |
domestic, local and foreign governmental regulations and taxes; |
|
· |
speculation as to the future price of oil, natural gas and NGLs and the speculative trading of oil, natural gas and NGLs; |
|
· |
trading prices of futures contracts; |
|
· |
price and availability of competitors’ supplies of oil, natural gas and NGLs; |
|
· |
technological advances affecting energy consumption; |
|
· |
the price and availability of alternative fuels; and |
|
· |
the impact of energy conservation efforts. |
NGLs are made up of ethane, propane, isobutane, butane and natural gasoline, all of which have different uses and different pricing characteristics. NGLs comprised 32% of our 2016 production, and we realized an average price of $13.48 per barrel, a 0.9% increase from the average realized price of our 2015 production. An extended decline in NGL prices could materially and adversely affect our future business, financial condition and results of operations.
Substantially all of our production is sold to purchasers under contracts with market‑based prices. Lower oil, natural gas and NGL prices will reduce our cash flows and the present value of our reserves. If oil, natural gas and NGL prices continue to deteriorate or remain at depressed levels, we anticipate that the borrowing base under our senior secured revolving credit facility, which is revised periodically, will be reduced at some point, which would negatively impact our borrowing ability. Additionally, prices could reduce our cash flows to a level that would require us to borrow to fund our capital budget. Lower oil, natural gas and NGL prices may also reduce the amount of oil, natural gas and NGLs that we can produce economically. Substantial decreases in oil, natural gas and NGL prices could render uneconomic a significant portion of our identified drilling locations. This may result in significant downward adjustments to our estimated proved reserves. As a result, a substantial or extended decline in oil, natural gas or NGL prices may materially and adversely affect our future business, financial condition, results of operations, liquidity or ability to finance planned capital expenditures.
Drilling for and producing oil, natural gas and NGLs are high risk activities with many uncertainties that could adversely affect our business, financial condition or results of operations.
Our future financial condition and results of operations will depend on the success of our exploration, exploitation, development and production activities. Our oil, natural gas and NGLs exploitation, development and production activities are subject to numerous risks beyond our control, including the risk that drilling will not result in commercially viable oil and natural gas production. Our decisions to purchase, explore, develop or otherwise exploit locations or properties will depend in part on the evaluation of information obtained through geophysical and geological analyses, production data and engineering studies, the results of which are often inconclusive or subject to varying interpretations. In addition, our cost of drilling, completing and operating wells is often uncertain before drilling commences, which ultimately results in uncertainty as to when the capital investment required to deploy rigs will create an acceptable return for our shareholders. Further, many factors may curtail, delay or cancel our scheduled drilling projects, including the following:
|
· |
delays imposed by or resulting from compliance with regulatory and contractual requirements and related lawsuits, which may include limitations on hydraulic fracturing or the discharge of greenhouse gases; |
27
|
· |
pressure or irregularities in geological formations; |
|
· |
shortages of or delays in obtaining equipment and qualified personnel; |
|
· |
equipment failures or accidents; |
|
· |
lack of available gathering facilities or delays in construction of gathering facilities; |
|
· |
lack of available capacity on interconnecting transmission pipelines; |
|
· |
fires and blowouts; |
|
· |
adverse weather conditions, such as hurricanes, blizzards and ice storms; |
|
· |
environmental hazards, such as natural gas leaks, oil spills, pipeline and tank ruptures, encountering naturally occurring radioactive materials, and unauthorized discharges of brine, well stimulation and completion fluids, toxic gases or other pollutants into the surface or subsurface environment; |
|
· |
declines in oil, natural gas and NGL prices; |
|
· |
limited availability of financing at acceptable rates; |
|
· |
title problems; and |
|
· |
limitations in the market for oil, natural gas and NGLs. |
Part of our strategy involves using some of the latest available horizontal drilling and completion techniques, which involve risks and uncertainties in their application.
Our operations involve utilizing some of the latest drilling and completion techniques as developed by us and our service providers. Risks that we face while drilling include, but are not limited to, the following:
|
· |
effectively controlling the level of pressure flowing from particular wells; |
|
· |
landing our wellbore in the desired drilling zone; |
|
· |
staying in the desired drilling zone while drilling horizontally through the formation; |
|
· |
running our casing the entire length of the wellbore; and |
|
· |
running tools and other equipment consistently through the horizontal wellbore. |
Risks that we face while completing our wells include, but are not limited to, the following:
|
· |
the ability to fracture stimulate the planned number of stages; |
|
· |
the ability to run tools the entire length of the wellbore during completion operations; and |
|
· |
the ability to successfully clean out the wellbore after completion of the final fracture stimulation stage. |
The results of our drilling in new or emerging formations are more uncertain initially than drilling results in areas that are more developed and have a longer history of established production. Newer or emerging formations and areas have limited or no production history and, consequently, we are more limited in assessing future drilling results in these areas.
The value of our undeveloped acreage could decline if drilling results are unsuccessful.
The success of our horizontal drilling and completion techniques can only be evaluated over time as more wells are drilled and production profiles are established over a sufficiently long time period. If our drilling results are less than anticipated or we are unable to execute our drilling program because of capital constraints, lease expirations, access to
28
gathering systems, declines in oil, natural gas and NGL prices and/or other factors, the return on our investment in these areas may not be as attractive as we anticipate. Further, as a result of any of these developments we could incur material write‑downs of our oil and gas properties and the value of our undeveloped acreage could decline in the future.
Our business requires substantial capital expenditures, and we may be unable to obtain needed capital or financing on satisfactory terms or at all.
Our exploration, exploitation, development and acquisition activities require substantial capital expenditures. Our total capital expenditures for 2016 were $268.8 million excluding the impact of asset retirement costs. The Company has established an initial capital budget of $275.0 million for 2017. Historically, we have funded development and operating activities primarily through a combination of equity capital raised from a private equity partner and public equity offerings, through borrowings under our senior secured revolving credit facility, through the issuance of debt securities and through internal operating cash flows. We intend to finance the majority of our capital expenditures predominantly with cash flows from operations. If necessary, we may also access capital through proceeds from potential asset dispositions, borrowings under our senior secured revolving credit facility and the issuance of additional debt and equity securities. Our cash flow from operations and access to capital are subject to a number of variables, including:
|
· |
the estimated quantities of our oil, natural gas and NGL reserves; |
|
· |
the amount of oil, natural gas and NGLs we produce from existing wells; |
|
· |
the prices at which we sell our production; |
|
· |
any gains or losses from our hedging activities; |
|
· |
the costs of developing and producing our oil, natural gas and NGL reserves; |
|
· |
take‑away capacity; |
|
· |
our ability to acquire, locate and produce new reserves; |
|
· |
the ability and willingness of banks to lend to us; and |
|
· |
our ability to access the equity and debt capital markets. |
If our cash flow from operations is not sufficient to fund our capital expenditure budget, we may have limited ability to obtain the additional capital necessary to conduct our operations at expected levels. Our senior secured revolving credit facility and the indentures governing our senior notes due 2022 (the “2022 Notes”) and senior notes due 2023 (the “2023 Notes”) may restrict our ability to obtain new debt financing. We may not be able to obtain debt or equity financing on terms favorable to us, or at all. The failure to obtain additional financing could result in a curtailment of our operations relating to exploration and development of our prospects, which in turn could lead to a decline in our oil, natural gas and NGLs production or reserves, and in some areas a loss of properties.
External financing may be required in the future to fund our growth. We may not be able to obtain additional financing, and financing under our senior secured revolving credit facility and through the capital markets may not be available in the future. Without additional capital resources, we may be unable to pursue and consummate acquisition opportunities as they become available, and we may be forced to limit or defer our planned oil, natural gas and NGLs development program, which will adversely affect the recoverability and ultimate value of our oil, natural gas and NGLs properties, in turn negatively affecting our business, financial condition and results of operations.
The development of our proved undeveloped reserves in our areas of operation may take longer and may require higher levels of capital expenditures than we currently anticipate. Therefore, our undeveloped reserves may not be ultimately developed or produced.
Approximately 41% of our total estimated proved reserves were classified as proved undeveloped as of December 31, 2016. Development of these reserves may take longer and require higher levels of capital expenditures than we currently anticipate. In addition, continued declines in commodity prices could cause us to reevaluate our development plans and delay or cancel development. Delays in the development of our reserves, increases in costs to drill and develop such reserves or sustained periods of low commodity prices will reduce the future net revenues estimated for such reserves
29
and may result in some projects becoming uneconomic. In addition, delays in the development of reserves or lower commodity prices could cause us to have to reclassify our proved reserves as unproved reserves.
Our hedging strategy may be ineffective in reducing the impact of commodity price volatility from our cash flows, which could result in financial losses or could reduce our income.
To achieve more predictable cash flow and to reduce our exposure to adverse fluctuations in the prices of oil, natural gas and NGLs, we enter into commodity derivative contracts for a significant portion of our oil, natural gas and NGL production that could result in both realized and unrealized hedging losses. The extent of our commodity price exposure is related largely to the effectiveness and scope of our commodity derivative contracts. For example, some of the commodity derivative contracts we utilize are based on quoted market prices, which may differ significantly from the actual prices we realize in our operations for oil, natural gas and NGLs. In addition, our senior secured revolving credit facility limits the aggregate notional volume of commodities that can be covered under commodity derivative contracts we can enter into and, as a result, we will continue to have direct commodity price exposure on the unhedged portion of our production volumes. For the years ending December 31, 2017, 2018, and 2019, approximately 36%, 66%, and 80%, respectively, of our estimated total oil, natural gas and NGL production from proved reserves, based on our reserve report as of December 31, 2016, will not be covered by commodity derivative contracts.
Our policy has been to hedge a significant portion of our estimated oil, natural gas and NGLs production. However, our price hedging strategy and future hedging transactions will be determined at our discretion. We are not under an obligation to hedge a specific portion of our production. The prices at which we hedge our production in the future will be dependent upon commodity prices at the time we enter into these transactions, which may be substantially higher or lower than current oil, natural gas and NGLs prices. Accordingly, our price hedging strategy may not protect us from significant declines in oil, natural gas and NGL prices received for our future production. Conversely, our hedging strategy may limit our ability to realize cash flows from commodity price increases.
In addition, our actual future production may be significantly higher or lower than we estimate at the time we enter into commodity derivative contracts for such period. If the actual amount is higher than we estimate, we will have greater commodity price exposure than we projected. If the actual amount is lower than the notional amount of our commodity derivative contracts, we might be forced to satisfy all or a portion of our commodity derivative contracts without the benefit of the cash flow from our sale or purchase of the underlying physical commodity, substantially diminishing our liquidity. There may be a change in the expected differential between the underlying commodity price in the commodity derivative contract and the actual price received, which may result in payments to our derivative counterparty that are not offset by our receipt of payments for our production in the field.
As a result of these factors, our commodity derivative activities may not be as effective as we intend in reducing the volatility of our cash flows, and in certain circumstances may actually increase the volatility of our cash flows.
Our hedging transactions expose us to counterparty credit risk.
Our hedging transactions expose us to risk of financial loss if a counterparty fails to perform under a derivative contract. Disruptions in the financial markets could lead to sudden changes in a counterparty’s liquidity, which could impair their ability to perform under the terms of the derivative contract. We are unable to predict sudden changes in a counterparty’s creditworthiness or ability to perform. Even if we do accurately predict sudden changes, our ability to negate the risk may be limited depending upon market conditions. Currently our entire hedge portfolio is hedged directly with banks in our credit agreements, thus allowing hedging without any margin requirements.
During periods of falling commodity prices, our hedge receivable positions generally increase, which increases our counterparty credit exposure. If the creditworthiness of our counterparties deteriorates and results in their nonperformance, we could incur a significant loss.
Derivatives legislation and implementing rules could have an adverse effect on our ability to use derivatives to reduce the effect of commodity price risk, interest rate risk and other risks associated with our business.
We use commodity derivatives to manage our commodity price risk. The U.S. Congress adopted comprehensive financial reform legislation that, among other things, expands comprehensive federal oversight and regulation of derivatives and many of the entities that participate in that market. Although the Dodd‑Frank Wall Street Reform and Consumer Protection Act, or the Dodd‑Frank Act, was enacted on July 21, 2010, the Commodity Futures Trading Commission, or the CFTC, and the SEC, along with certain other regulators, must promulgate final rules and regulations
30
to implement many of its provisions relating to derivatives. While some of these rules have been finalized, some have not. When fully implemented, the law and any new regulations could increase the operational and transactional cost of derivatives contracts and affect the number and/or creditworthiness of available counterparties.
In addition, we may transact with counterparties based in the European Union, Canada or other jurisdictions which, like the U.S., are in the process of implementing regulations to regulate derivatives transactions, some of which are currently in effect and impose operational and transactional costs on our derivatives activities.
Unless we replace our reserves, our reserves and production will naturally decline, which would adversely affect our business, financial condition and results of operations.
Unless we conduct successful exploration, development and acquisition activities or acquire properties containing proved reserves, our proved reserves will decline as those reserves are produced. Producing oil and natural gas reservoirs generally are characterized by declining production rates that vary depending upon reservoir characteristics and other factors. Our future oil, natural gas and NGL reserves and production, and therefore our cash flows and income, are highly dependent on our success in efficiently developing our current reserves and economically finding or acquiring additional recoverable reserves. We may not be able to develop, find or acquire additional reserves to replace our current and future production at acceptable costs. If we are unable to replace our current and future production, the value of our reserves will decrease, and our business, financial condition and results of operations will be adversely affected.
Our identified drilling locations are scheduled to be drilled over many years, making them susceptible to uncertainties that could materially alter the occurrence or timing of their drilling, which in certain instances could prevent or delay associated expected production. In addition, we may not be able to raise the amount of capital that would be necessary to drill a substantial portion of our identified drilling locations.
Our management team has identified and scheduled certain drilling locations as an estimation of our future multi‑year drilling activities on our existing acreage. These drilling locations represent a significant part of our growth strategy. Our drilling locations are in various stages of evaluation, ranging from a location that is ready to drill to a location that will require substantial additional interpretation. There is no way to predict in advance of drilling and testing whether any particular location will yield oil, natural gas or NGLs in sufficient quantities to recover drilling or completion costs or to be economically viable. Similarly, the use of technologies and the study of producing fields in the same area of producing wells will not enable us to know conclusively prior to drilling whether oil or natural gas will be present or, if present, whether oil or natural gas will be present in sufficient quantities to be economically viable. Even if sufficient quantities of oil or natural gas exist, we may damage the potentially productive hydrocarbon bearing formation or experience mechanical difficulties while drilling or completing the well, resulting in a reduction in production or abandonment of the well. If we drill additional wells that we identify as dry holes in our current and future drilling locations, our drilling success rate may decline and materially harm our business. In addition, our ability to drill and develop these drilling locations depends on a number of uncertainties, including oil, natural gas and NGL prices, the availability and cost of capital, drilling and production costs, the availability of drilling services and equipment, drilling results, lease expirations, gathering systems, marketing and pipeline transportation constraints, regulatory approvals and other factors. In addition, a number of our identified drilling locations are associated with joint development agreements and if we do not meet our obligation to drill the minimum number of wells specified in an agreement, we will lose the right to continue to develop certain acreage covered by that agreement. Because of the uncertainty inherent in these factors, we do not know if the numerous drilling locations we have identified will ever be drilled or if we will be able to produce oil, natural gas or NGLs from these or any other drilling locations. Our initial capital budget for 2017 is $275.0 million.
Continued low commodity prices or future price declines or downward reserve revisions may result in write‑downs of the carrying values of our properties.
Accounting rules require that we periodically review the carrying value of our properties for possible impairment. Based on prevailing commodity prices and specific market factors and circumstances at the time of prospective impairment reviews, and the continuing evaluation of development plans, production data, economics and other factors, we may be required to write down the carrying value of our properties. A write‑down constitutes a non‑cash charge to earnings. Such impairment may be accompanied by a reduction in proved reserves, thereby increasing future depletion charges per unit of production. We may incur impairment charges and related reductions in proved reserves in the future, which could have a material adverse effect on our results of operations for the periods in which such charges are taken. If commodity prices remain low relative to their historical levels, we may incur future impairments to long‑lived assets.
31
Our estimated oil, natural gas and NGLs reserve quantities and future production rates are based on many assumptions that may prove to be inaccurate. Any significant inaccuracies in these reserve estimates or the underlying assumptions will materially affect the quantities and present value of our reserves.
Numerous uncertainties are inherent in estimating quantities of oil, natural gas and NGL reserves. Our estimates of our proved reserve quantities are based upon our reserve report as of December 31, 2016. Reserve estimation is a subjective process of evaluating underground accumulations of oil, natural gas and NGLs that cannot be measured in an exact manner. Reserves that are “proved reserves” are those estimated quantities of oil, natural gas and NGLs that geological and engineering data demonstrate with reasonable certainty are recoverable in future years from known reservoirs under existing economic and operating conditions and that relate to projects for which the extraction of hydrocarbons must have commenced or the operator must be reasonably certain will commence within a reasonable time.
The process of estimating oil, natural gas and NGL reserves is complex, requiring significant decisions and assumptions in the evaluation of available geological, engineering and economic data for each reservoir, and these reports rely upon various assumptions, including assumptions regarding future oil, natural gas and NGL prices, production levels, and operating and development costs. As a result, estimated quantities of proved reserves and projections of future production rates and the timing of development expenditures may prove to be inaccurate. Quantities of proved reserves are estimated based on pricing conditions in existence during the period of assessment and costs at the end of the period of assessment. Changes to oil, natural gas and NGL prices in the markets for such commodities may have the impact of shortening the economic lives of certain fields, because it becomes uneconomic to produce all recoverable reserves on such fields, which reduces proved property reserve estimates.
Over time, we may make material changes to reserve estimates taking into account the results of actual drilling and production. Any significant variance in our assumptions and actual results could greatly affect our estimates of reserves, the economically recoverable quantities of oil, natural gas and NGLs attributable to any particular group of properties, the classifications of reserves based on risk of recovery, and estimates of the future net cash flows. In addition, changes in future production cost assumptions could have a significant effect on our proved reserve quantities.
If we do not fulfill our obligation to drill minimum numbers of wells specified in our joint development agreements, we will lose the right to develop the undeveloped acreage associated with the agreement and any proved undeveloped reserves attributable to such undeveloped acreage.
If we do not meet our obligation to drill the minimum number of wells specified in a joint development agreement, we will lose the right to continue to develop the undeveloped acreage covered by the agreement, which would result in the loss of any proved undeveloped reserves attributable to such undeveloped acreage.
The standardized measure of discounted future net cash flows from our proved reserves will not necessarily be the same as the current market value of our estimated oil, natural gas and NGL reserves.
You should not assume that the standardized measure of discounted future net cash flows from our proved reserves is the current market value of our estimated oil, natural gas and NGL reserves. In accordance with SEC requirements, we based the discounted future net cash flows from our proved reserves on the 12‑ month unweighted arithmetic average of the first‑day‑of‑the‑ month commodities prices for the preceding 12 months without giving effect to derivative transactions. Actual future net cash flows from our oil and natural gas properties will be affected by factors such as:
|
· |
commodity price hedging and actual prices we receive for oil, natural gas and NGLs; |
|
· |
actual cost of development and production expenditures; |
|
· |
the amount and timing of actual development and production; and |
|
· |
changes in governmental regulations or taxation. |
The timing of both our production and our incurrence of expenses in connection with the development and production of oil and natural gas properties will affect the timing and amount of actual future net revenues from proved reserves, and thus their actual present value. In addition, the 10% discount factor we use when calculating standardized measure may not be the most appropriate discount factor based on interest rates in effect from time to time and risks associated with our company or the oil and natural gas industry in general.
32
If oil prices decline by $10.00 per Bbl, then our standardized measure as of December 31, 2016 excluding hedging impacts would decrease approximately $140.6 million holding all costs constant. If natural gas prices decline by $1.00 per Mcf, then our standardized measure as of December 31, 2016 excluding hedging impacts would decrease by approximately $91.6 million holding all costs constant.
Over 99% of our estimated proved reserves are located in the Anadarko and Arkoma basins in the Texas Panhandle and Oklahoma, making us vulnerable to risks associated with operating in one geographic area.
Over 99% of our estimated proved reserves as of December 31, 2016 were located in the Anadarko and Arkoma basins in the Texas Panhandle and Oklahoma. Approximately 72% of our 2016 production was from the Cleveland formation where properties are located in four contiguous counties of Texas and Oklahoma. As a result of this concentration, we may be disproportionately exposed to the impact of regional supply and demand factors, delays or interruptions of production from wells in this area caused by governmental regulation, processing or transportation capacity constraints, availability of equipment, facilities, personnel or services market limitations or interruption of the processing or transportation of oil, natural gas or NGLs. In addition, the effect of fluctuations on supply and demand may become more pronounced within specific geographic oil and natural gas producing areas such as our properties producing from the Cleveland formation, which may cause these conditions to occur with greater frequency or magnify the effects of these conditions. Due to the concentrated nature of our portfolio of properties, a number of our properties could experience any of the same conditions at the same time, resulting in a relatively greater impact on our results of operations than they might have on other companies that have a more diversified portfolio of properties. Such delays or interruptions could have a material adverse effect on our financial condition and results of operations.
Our customer base is concentrated, and the loss of any one of our key customers could, therefore, adversely affect our financial condition and results of operations.
Historically, we have been dependent on a few customers for a significant portion of our revenue. For the year ended December 31, 2016 purchases by our top five customers accounted for approximately 37%, 24%, 7%, 7% and 7%, respectively, of our total oil, natural gas and NGL sales. This concentration of customers may increase our overall exposure to credit risk, and customers will likely be similarly affected by changes in economic and industry conditions. To the extent that any of our major purchasers reduces their purchases of oil, natural gas or NGLs or defaults on their obligations to us, our financial condition and results of operations could be adversely affected.
We may be unable to make attractive acquisitions or successfully integrate acquired businesses, and any inability to do so may disrupt our business and hinder our ability to grow.
In the future we may make acquisitions of businesses that complement or expand our current business. We may not be able to identify attractive acquisition opportunities. Even if we do identify attractive acquisition opportunities, we may not be able to complete the acquisition or do so on commercially acceptable terms. In addition, increased competition in the areas in which we operate, including the Merge play, may make it more difficult for us to identify or complete acquisitions.
In addition, our senior secured revolving credit facility impose certain limitations on our ability to enter into mergers or combination transactions. Our senior secured revolving credit facility also limits our ability to incur certain indebtedness, which could indirectly limit our ability to engage in acquisitions of businesses.
Any acquisition involves potential risks, including, among other things:
|
· |
the validity of our assumptions about estimated proved reserves, future production, commodity prices, revenues, capital expenditures, operating expenses and costs; |
|
· |
an inability to successfully integrate the assets we acquire; |
|
· |
an inability to obtain satisfactory title to the assets we acquire; |
|
· |
a decrease in our liquidity by using a significant portion of our available cash or borrowing capacity to finance acquisitions; |
|
· |
a significant increase in our interest expense or financial leverage if we incur additional debt to finance acquisitions; |
33
|
· |
the assumption of unknown liabilities, losses or costs for which we obtain no or limited indemnity or other recourse; |
|
· |
the diversion of management’s attention from other business concerns; |
|
· |
an inability to hire, train or retain qualified personnel to manage and operate our growing assets; and |
|
· |
the occurrence of other significant changes, such as impairment of oil and natural gas properties, goodwill or other intangible assets, asset devaluation or restructuring charges. |
Our decision to acquire a property will depend in part on the evaluation of data obtained from production reports and engineering studies, geophysical and geological analyses and seismic data and other information, the results of which are often inconclusive and subject to various interpretations.
The success of any completed acquisition will depend on our ability to integrate effectively the acquired assets into our existing operations. The process of integrating acquired assets may involve unforeseen difficulties and may require a disproportionate amount of our managerial and financial resources. In addition, even if we successfully integrate an acquisition, it may not be possible to realize the full benefits we may expect in estimated proved reserves, production volume, cost savings from operating synergies or other benefits anticipated from an acquisition or realize these benefits within the expected time frame. Anticipated benefits of an acquisition may be offset by operating losses relating to changes in commodity prices in oil and natural gas industry conditions, risks and uncertainties relating to the exploratory prospects of the combined assets or operations, or an increase in operating or other costs or other difficulties. If we fail to realize the benefits we anticipate from an acquisition, our results of operations may be adversely affected.
Deficiencies of title to our leased interests could significantly affect our financial condition.
It is our practice, in acquiring oil and natural gas leases or undivided interests in oil and natural gas leases or other developed rights, not to incur the expense of retaining lawyers to examine the title to the mineral interest to be acquired. Rather, we rely upon the judgment of oil and natural gas lease brokers or landmen who perform the fieldwork in examining records in the appropriate governmental or county clerk’s office to determine mineral ownership before we acquire an oil and gas lease or other developed rights in a specific mineral interest.
Prior to the drilling of an oil or gas well, it is the normal practice in our industry for the operator of the well to obtain a drilling title opinion from a qualified title attorney to ensure there are no obvious title defects on the property on which the well is to be located. The title attorney would typically research documents that are of record, including liens, taxes and all applicable contracts that burden the property. Frequently, as a result of such examinations, certain curative work must be undertaken to correct defects in the marketability of the title, and such curative work entails expense. Our failure to completely cure any title defects may invalidate our title to the subject property and adversely impact our ability in the future to increase production and reserves. Additionally, because a less strenuous title review is conducted on lands where a well has not yet been scheduled, undeveloped acreage has greater risk of title defects than developed acreage. Any title defects or defects in assignment of leasehold rights in properties in which we hold an interest may adversely impact our ability in the future to increase production and reserves, which could have a material adverse effect on our business, financial condition and results of operations.
We conduct a substantial portion of our operations through joint development agreements with third parties. Certain of our joint development agreements include complete‑to‑earn arrangements, whereby we are assigned title to properties from the third‑party after we complete wells and, in the case of certain counterparties, after completion reports relating to the wells have been approved by regulatory authorities whose approval may be delayed. Furthermore, certain of our joint development agreements specify that assignments are only to occur when the wells are capable of producing hydrocarbons in paying quantities. These additional conditions to assignment of title may from time to time apply to wells of substantial value. If one of our counterparties assigned title to a well in which we had earned an interest (according to our joint development agreement) to a third‑party, our title to such a well could be adversely impacted. In addition, if one of our counterparties becomes a debtor in a bankruptcy proceeding, or is placed into receivership, or enters into an assignment for the benefit of creditors, after we had earned ownership of, but before we had received title to, a well, certain creditors of the counterparty may have rights in that well that would rank prior to ours.
34
Certain federal income tax deductions currently available with respect to oil and natural gas exploration and development may be eliminated and new taxes may be imposed as a result of future legislation.
From time to time, legislation is introduced that would, if enacted, make significant changes to U.S. tax laws. These proposed changes have included repealing many tax incentives and deductions that are currently used by U.S. oil and gas companies and imposing new fees. Among others, proposed changes have included: elimination of the ability to fully deduct intangible drilling costs in the year incurred; repeal of the percentage depletion deduction for oil and gas properties; repeal of the domestic manufacturing tax deduction for oil and gas companies; increase in the geological and geophysical cost amortization period for independent producers; imposing a per barrel fee on domestically produced oil; and implementation of a fee on non‑producing federal oil and gas leases. The passage of legislation containing some or all of these provisions or any other similar change in U.S. federal income tax law could eliminate or postpone certain tax deductions that are currently available to us with respect to oil and natural gas exploration and development, and any such change could have a material adverse effect on our business, financial condition and results of operations.
We may be unable to compete effectively with larger companies, which may adversely affect our ability to generate sufficient revenues.
The oil and natural gas industry is intensely competitive, and we compete with other companies that have greater resources than us. Many of our larger competitors not only drill for and produce oil and natural gas, but also engage in refining operations and market petroleum and other products on a regional, national or worldwide basis. These companies may have a greater ability to continue drilling activities during periods of low oil, natural gas and NGL prices, to contract for drilling equipment, to secure trained personnel, and to absorb the burden of present and future federal, state, local and other laws and regulations. The oil and natural gas industry has periodically experienced shortages of drilling rigs, equipment, pipe and personnel, which has delayed development drilling and other exploitation activities and has caused significant price increases. Competition has been strong in hiring experienced personnel, particularly in the engineering and technical, accounting and financial reporting, tax and land departments. In addition, competition is strong for attractive oil and natural gas producing properties, oil and natural gas companies, and undeveloped leases and drilling rights. Any inability to compete effectively with larger companies could have a material adverse impact on our financial condition and results of operations.
The oil and natural gas industry is characterized by rapid and significant technological advancements and introductions of new products and services using new technologies. As others use or develop new technologies, we may be placed at a competitive disadvantage or competitive pressures may force us to implement those new technologies at substantial costs. In addition, other oil and natural gas companies may have greater financial, technical, and personnel resources that allow them to enjoy technological advantages and may in the future allow them to implement new technologies before we can. We may not be able to respond to these competitive pressures and implement new technologies on a timely basis or at an acceptable cost. If one or more of the technologies we use now or in the future were to become obsolete or if we are unable to use the most advanced commercially available technology, our business, financial condition and results of operations could be materially adversely affected.
We participate in oil and gas leases with third parties who may not be able to fulfill their commitments to our projects.
We frequently own less than 100% of the working interest in the oil and gas leases on which we conduct operations, and other parties will own the remaining portion of the working interest. Financial risks are inherent in any operation where the cost of drilling, equipping, completing and operating wells is shared by more than one person. We could be held liable for joint activity obligations of other working interest owners, such as nonpayment of costs and liabilities arising from the actions of other working interest owners. In addition, declines in oil, natural gas and NGL prices may increase the likelihood that some of these working interest owners, particularly those that are smaller and less established, are not able to fulfill their joint activity obligations. A partner may be unable or unwilling to pay its share of project costs, and, in some cases, a partner may declare bankruptcy. In the event any of our project partners do not pay their share of such costs, we would likely have to pay those costs, and we may be unsuccessful in any efforts to recover these costs from our partners, which could materially adversely affect our financial position.
35
The unavailability or high cost of drilling rigs, equipment, supplies, personnel and oil field services as well as fees for the cancellation of such services could adversely affect our ability to execute development and exploitation plans on a timely basis and within budget, and consequently could adversely affect our anticipated cash flow.
We utilize third‑party services to maximize the efficiency of our operation. The cost of oil field services typically fluctuates based on demand for those services. We may not be able to contract for such services on a timely basis, or the cost of such services may not remain at a satisfactory or affordable level. Shortages or the high cost of drilling rigs, equipment, supplies or personnel, including hydraulic fracturing equipment, supplies and personnel necessary for horizontal drilling, could delay or adversely affect our development and exploitation operations, which could have a material adverse effect on our financial condition and results of operations.
Our business depends in part on pipelines, transportation and gathering systems and processing facilities owned by others. Any limitation in the availability of those facilities could interfere with our ability to market our oil, natural gas and NGLs production and could harm our business.
The marketability of our oil, natural gas and NGLs production depends in part on the availability, proximity and capacity of pipelines and other transportation methods, such as trucks, gathering systems and processing facilities owned by third parties. The amount of oil, natural gas and NGLs that can be produced and sold is subject to curtailment in certain circumstances, such as pipeline interruptions due to scheduled and unscheduled maintenance, excessive pressure, physical damage or lack of contracted capacity on such systems. Also, the transfer of our oil, natural gas and NGLs on third‑party pipelines may be curtailed or delayed if it does not meet the quality specifications of the pipeline owners. Our access to transportation options, including trucks owned by third parties, can also be affected by U.S. federal and state regulation of oil and gas production and transportation, general economic conditions and changes in supply and demand. The curtailments arising from these and similar circumstances may last from a few days to several months. In many cases, we are provided only with limited, if any, notice as to when these circumstances will arise and their duration. Any significant curtailment in gathering system or transportation or processing facility capacity could reduce our ability to market our oil, natural gas and NGLs production and harm our business.
We may incur substantial losses and be subject to substantial liability claims as a result of our oil and natural gas operations. Additionally, we may not be insured for, or our insurance may be inadequate to protect us against, these risks.
We are not insured against all risks. Losses and liabilities arising from uninsured and underinsured events could materially and adversely affect our business, financial condition or results of operations. We may elect not to obtain insurance if we believe that the cost of available insurance is excessive relative to the risks presented. In addition, pollution and environmental risks generally are not fully insurable. Our oil and natural gas exploration and production activities are subject to all of the operating risks associated with drilling for and producing oil and natural gas, including the possibility of:
|
· |
environmental hazards, such as uncontrollable flows of oil, natural gas, brine, well fluids, toxic gas or other pollution into the environment, including groundwater contamination; |
|
· |
adverse weather conditions and natural disasters; |
|
· |
encountering abnormally pressured formations; |
|
· |
facility or equipment malfunctions; |
|
· |
mechanical difficulties, such as stuck oilfield drilling and service tools and casing collapse; |
|
· |
fires, explosions and ruptures of pipelines; |
|
· |
personal injuries and death; and |
|
· |
terrorist attacks targeting oil and natural gas related facilities and infrastructure. |
36
Any of these risks could adversely affect our ability to conduct operations or result in substantial losses to us as a result of:
|
· |
injury or loss of life; |
|
· |
damage to and destruction of property, natural resources and equipment; |
|
· |
pollution and other environmental damage and associated clean‑up responsibilities; |
|
· |
regulatory investigations, penalties or other sanctions; |
|
· |
suspension of our operations; and |
|
· |
repair and remediation costs. |
We are subject to complex federal, state, local and other laws and regulations that could adversely affect the cost, manner or feasibility of conducting our operations.
Our oil and natural gas exploration and production operations are subject to complex and stringent laws and regulations. In order to conduct our operations in compliance with these laws and regulations, we must obtain and maintain numerous permits, approvals and certificates from various federal, state and local governmental authorities. Failure or delay in obtaining regulatory approvals or drilling permits could have a material adverse effect on our ability to develop our properties, and receipt of drilling permits with onerous conditions could increase our compliance costs. In addition, regulations regarding conservation practices and the protection of correlative rights affect our operations by limiting the quantity of oil, natural gas and NGLs we may produce and sell.
We are subject to federal, state and local laws and regulations as interpreted and enforced by governmental authorities possessing jurisdiction over various aspects of the exploration, production and transportation of oil, natural gas and NGLs, as well as safety matters. Legal requirements are frequently changed and subject to interpretation, and we are unable to predict the ultimate cost of compliance with these requirements or their ultimate effect on our operations. We may be required to make significant expenditures to comply with governmental laws and regulations. The discharge of oil, natural gas, NGLs or other pollutants into the air, soil or water may give rise to significant liabilities on our part to the government, and third parties and may require us to incur substantial costs for remediation.
See “Item 1. Business—Regulations” for a further description of the laws and regulations that affect us.
Our ability to pursue our business strategies may be adversely affected if we incur costs and liabilities due to a failure to comply with environmental regulations or a release of hazardous substances into the environment.
We may incur significant costs and liabilities as a result of environmental requirements applicable to the operation of our wells, gathering systems and other facilities. These costs and liabilities could arise under a wide range of federal, state and local environmental laws and regulations, including, for example:
|
· |
the Clean Air Act, or CAA, and comparable state laws and regulations that impose obligations related to air emissions; |
|
· |
the Clean Water Act and Oil Pollution Act, or OPA, and comparable state laws and regulations that impose obligations related to discharges of pollutants into regulated bodies of water; |
|
· |
the Resource Conservation and Recovery Act, or RCRA, and comparable state laws that impose requirements for the handling and disposal of waste from our facilities; |
|
· |
the Comprehensive Environmental Response, Compensation, and Liability Act, or CERCLA, and comparable state laws that regulate the cleanup of hazardous substances that may have been released at properties currently or previously owned or operated by us or at locations to which we have sent waste for disposal; |
37
|
· |
the Environmental Protection Agency’s, or the EPA’s, community right to know regulations under the Title III of CERCLA and comparable state laws that require that we organize and/or disclose information about hazardous materials used or produced in our operations; |
|
· |
the Occupational Safety and Health Act, or OSHA, which establishes workplace standards for the protection of the health and safety of employees, including the implementation of hazard communications programs designed to inform employees about hazardous substances in the workplace, potential harmful effects of these substances, and appropriate control measures; |
|
· |
the National Environmental Policy Act, or NEPA, which requires federal agencies to evaluate major agency actions having the potential to significantly impact the environment and which may require the preparation of Environmental Assessments and more detailed Environmental Impact Statements that may be made available for public review and comment; |
|
· |
the Migratory Bird Treaty Act, which implements various treaties and conventions between the United States and certain other nations for the protection of migratory birds and, pursuant to which the taking, killing, or possessing of migratory birds is unlawful without a permit, thereby potentially requiring the implementation of operating restrictions or a temporary, seasonal, or permanent ban on operations in affected areas; and |
|
· |
the Endangered Species Act, or ESA, and analogous state laws, which seek to ensure that activities do not jeopardize endangered or threatened animals, fish and plant species, nor destroy or modify the critical habitat of such species. |
We may incur significant delays, costs and liabilities as a result of federal, state and local environmental, health and safety requirements applicable to exploration, development and production activities. These laws and regulations may require us to obtain a variety of permits or other authorizations governing our air emissions, water discharges, waste disposal, development in regulated wetlands or waters, or other environmental impacts associated with drilling, production and product transportation pipelines or other operations; regulate the sourcing and disposal of water used in the drilling, fracturing and completion processes; limit or prohibit drilling activities in certain areas and on certain lands lying within wilderness, frontier and other protected areas or that contain regulated wetlands or other waters; require remedial action to prevent or mitigate pollution from former operations such as plugging abandoned wells or closing earthen pits; and/or impose substantial liabilities for spills, pollution or failure to comply with regulatory filing requirements. In addition, these laws and regulations are complex, change frequently and have tended to become increasingly stringent over time; however, the impact of the new administration on future changes to environmental laws and regulations remains uncertain. Failure to comply with these laws and regulations may trigger a variety of administrative, civil and criminal enforcement measures, including the assessment of monetary penalties, the imposition of remedial requirements, and the issuance of orders enjoining future operations. Certain environmental statutes, including the RCRA, CERCLA, the federal OPA and analogous state laws and regulations, impose strict joint and several liability for costs required to clean up and restore sites where petroleum or hazardous substances or other waste products have been disposed of or otherwise released. More stringent laws and regulations, including laws related to climate change and greenhouse gases, may be adopted in the future. If there are more expensive and stringent environmental legislation and regulations applied to the oil and natural gas industry, it could result in increased costs of doing business and consequently affect profitability. Moreover, it is not uncommon for neighboring landowners and other third parties to file claims for personal injury and property damage allegedly caused by the release of hazardous substances or other waste products into the environment. We are also subject to many other environmental requirements delineated in “Business—Environmental Matters and Regulation.”
Federal and state legislative and regulatory initiatives relating to hydraulic fracturing and other oil and gas production activities as well as governmental reviews of such activities could result in increased costs, additional operating restrictions or delays, which could adversely affect our production.
Hydraulic fracturing is an important and common practice that is used to stimulate production of natural gas and/or oil from dense subsurface rock formations. The process involves the injection of water, sand and chemicals under pressure into the formation to fracture the surrounding rock and stimulate production. We routinely utilize hydraulic fracturing techniques in our oil and natural gas drilling and completion programs. The process is typically regulated by state oil and natural gas commissions. However, the EPA has asserted federal regulatory authority over certain hydraulic fracturing activities involving diesel under the federal Safe Drinking Water Act, or SDWA, in states where the EPA is the
38
permitting authority and released guidance in February 2014 on regulatory requirements for companies that plan to conduct hydraulic fracturing using diesel in those states. In addition, the EPA issued a notice of rulemaking under the Toxic Substances Control Act relating to chemical substances and mixtures used in oil and gas exploration and production. Congress has also considered legislation to provide for federal regulation of hydraulic fracturing and to require disclosure of the chemicals used in the fracturing process.
Some states, including those in which we operate, have adopted, and other states are considering adopting, regulations that could impose more stringent permitting, disclosure and well construction requirements on hydraulic fracturing operations under certain circumstances. For example, Texas adopted a law in June 2011 requiring disclosure to the Railroad Commission of Texas, or TRRC, and the public of certain information regarding the components of the fluids used in the hydraulic fracturing process. On December 13, 2011, the TRRC finalized regulations requiring public disclosure of chemicals in fluids used in the hydraulic fracturing process for drilling permits issued after February 1, 2012. In addition, on October 20, 2011, Louisiana adopted new regulations for hydraulic fracturing operations in the state. These new regulations require hydraulic fracturing operators to publicly disclose the volume of hydraulic fracturing fluid, the type, trade name, supplier and volume of additives, and a list of chemical compounds contained in the additive, along with its maximum concentration, subject to certain trade secret protections. However, trade secret chemicals must be identified by their chemical family. The mandatory disclosure of information regarding the constituents of hydraulic fracturing fluids could make it easier for third parties opposing the hydraulic fracturing process to initiate legal proceedings based upon allegations that specific chemicals used in the fracturing process could adversely affect the environment. In addition, the Oklahoma Corporation Commission has adopted rules prohibiting water pollution resulting from hydraulic fracturing operations and requiring disclosure of chemicals used in hydraulic fracturing.
Texas has also authorized the Texas Commission on Environmental Quality to suspend water use rights for oil and gas users in the event of serious drought conditions and has imposed more stringent emissions, monitoring, inspection, maintenance, and repair requirements on Barnett Shale operators to minimize Volatile Organic Compound, or VOC, releases. Also, Louisiana requires operators to minimize releases of gases into the open air after hydraulic fracturing in certain urban areas.
In addition to state laws, local land use restrictions, such as city ordinances, may restrict or prohibit the performance of well drilling in general and/or hydraulic fracturing in particular. If state, local, or municipal legal restrictions are adopted in areas where we are currently conducting operations, or in the future plan to conduct operations, we may incur additional costs to comply with such requirements that may be significant in nature, experience delays or curtailment in the pursuit of exploration, development, or production activities, and perhaps even be precluded from drilling wells.
There are also certain governmental reviews recently conducted that focus on environmental aspects of hydraulic fracturing practices. The White House Council on Environmental Quality coordinated an administration‑wide review of hydraulic fracturing practices, and a committee of the United States House of Representatives has conducted an investigation of hydraulic fracturing practices. Furthermore, a number of federal agencies are analyzing, or have been requested to review, a variety of environmental issues associated with hydraulic fracturing. On December 13, 2016, the EPA released a study of the potential adverse effects that hydraulic fracturing activities (including water acquisition, chemical mixing, well injection, and disposal and reuse) may have on water quality and public health, concluding that there is scientific evidence that hydraulic fracturing activities could impact drinking water resources in the United States under some circumstances.
The EPA finalized a rule prohibiting discharges of wastewater resulting from hydraulic fracturing to publicly‑owned treatment works. The EPA is also conducting a study of private wastewater treatment facilities, referred to as centralized waste treatment, or CWT, facilities, accepting oil and gas extraction wastewater and will evaluate whether to revise discharge limits from CWT facilities. In addition, the U.S. Department of Energy’s Natural Gas Subcommittee of the Secretary of Energy Advisory Board conducted a review of hydraulic fracturing issues and practices and made recommendations to better protect the environment from drilling using hydraulic fracturing completion methods. These ongoing or proposed studies, depending on their degree of pursuit and any meaningful results obtained, could spur initiatives to further regulate hydraulic fracturing under the Safe Drinking Water Act, the Toxic Substances Control Act, or other statutory and/or regulatory mechanisms. Executive Order on April 13, 2012 created the Interagency Working Group on Unconventional Natural Gas and Oil, which is charged with coordinating and aligning federal agency research and scientific studies on unconventional oil and natural gas resources.
39
Also, in 2015, the U.S. Department of the Interior’s Bureau of Land Management, or BLM, adopted rules regarding well stimulation, chemical disclosures and other requirements for hydraulic fracturing on federal and Indian lands; however, a federal district court invalidated BLM rules in June 2016. An appeal of that ruling is pending. On November 14, 2016, the NPS, finalized updates to its regulations governing non-federal oil and gas rights, affecting various approval exemptions and addressing well stimulation, chemical disclosures and other requirements for hydraulic fracturing.
In addition, as discussed further below, state and federal regulatory agencies recently have focused on seismic events potentially associated with oil and gas operations, including injection well disposal.
Further, on April 17, 2012, the EPA released final rules to subject oil and gas operations (production, processing, transmission, storage and distribution) to regulation under the New Source Performance Standards, or NSPS, and National Emission Standards for Hazardous Air Pollutants, or NESHAPS, programs. These rules became effective on October 15, 2012. The EPA rules also include NSPS standards for completions of hydraulically‑fractured gas wells. These standards include the reduced emission completion techniques developed in the EPA’s Natural Gas STAR program along with pit flaring of gas not sent to the gathering line. The standards are applicable to newly drilled and fractured wells as well as existing wells that are refractured. Further, the regulations under NESHAPS include maximum achievable control technology, or MACT, standards for those glycol dehydrators and storage vessels at major sources of hazardous air pollutants not currently subject to MACT standards. In October 2012, several challenges to the EPA’s rules were filed by various parties, including environmental groups and industry associations. In a January 16, 2013 unopposed motion to hold this litigation in abeyance, the EPA indicated that it may reconsider some aspects of the rules. The EPA has since reconsidered several aspects of the rules and may continue to make changes. For example in 2015, the EPA finalized a final rule defining “low pressure gas well” and removing “connected in parallel” from the definition of storage vessels in the New Source Performance Standard. Depending on the outcome of such judicial proceedings and regulatory actions, the rules may be further modified or rescinded or the EPA may issue new rules. We have reported some of our facilities as being subject to these rules and have incurred, and will continue to incur, costs to control emissions, and to satisfy reporting and other administrative requirements associated with these rules. We continue to evaluate the effect these rules will have on our business. In addition, the EPA finalized new rules to regulate emissions of methane and volatile organic compounds from new and modified sources in the oil and gas sector effective August 2, 2016. The EPA also finalized a rule regarding the alternative criteria for aggregating multiple small surface sites into a single source for air‑quality permitting purposes. This rule could cause small facilities, on an aggregate basis, to be deemed a major source, thereby triggering more stringent air permitting processes and requirements across the oil and gas industry. The Administration has also stated that other federal agencies, including the Bureau of Land Management, the Pipeline and Hazardous Materials Safety Administration, and the Department of Energy will impose new or more stringent regulations on the oil and gas sector that will have the effect of further reducing methane emissions. For example, BLM also adopted new rules on November 15, 2016, to be effective on January 17, 2017, to reduce venting, flaring, and leaks during oil and natural gas production activities on onshore federal and Indian leases. Increased regulation and attention given to the hydraulic‑fracturing process could lead to greater opposition, including litigation, to oil and gas production activities using hydraulic‑fracturing techniques. Additional legislation or regulation could also lead to operational delays or increased operating costs in the production of oil and natural gas, including from the developing shale formations, or could make it more difficult to perform hydraulic fracturing. The adoption of any federal, state or local laws or the implementation of regulations regarding hydraulic fracturing could potentially cause a decrease in the completion of new oil and gas wells, increased compliance costs and time, which could adversely affect our financial position, results of operations and cash flows.
40
Federal and state legislative and regulatory initiatives relating to induced seismicity in connection with oil and gas activities could result in increased costs, additional operating restrictions or delays, and litigation risks which could adversely affect our operations
State and federal regulatory agencies recently have focused on a possible connection between the operation of injection wells used for oil and gas waste waters and an observed increase in minor seismic activity and tremors. When caused by human activity, such events are called induced seismicity. In some instances, operators of injection wells in the vicinity of minor seismic events have reduced injection volumes or suspended operations, often voluntarily. A 2012 report published by the National Academy of Sciences concluded that only a very small fraction of the tens of thousands of injection wells have been suspected to be, or have been, the likely cause of induced seismicity. However, some state regulatory agencies have modified their regulations to account for induced seismicity. For example, the Texas Railroad Commission rules allow the Commission to modify, suspend, or terminate a permit based on a determination that the permitted injection well activity is likely to be contributing to seismic activity. The Oklahoma Corporation Commission also asserts authority to shut down injection wells that it considers linked to induced seismicity, and has recently taken other steps to regulate injection wells that may contribute to induced seismicity. For example, on August 3, 2015, the Oklahoma Corporation Commission adopted a plan calling for mandatory reductions in oil and gas wastewater disposal well volumes to address potential induced seismicity in Oklahoma; implementation has involved reductions of injection or shut-ins of disposal wells in 2015 and 2016. Regulatory agencies are continuing to study possible linkage between injection activity and induced seismicity and also possible linkages to the hydraulic fracturing process. Third-party lawsuits for property damage and other remedies based on allegations of induced seismicity have been brought against other energy companies.
Climate change legislation or regulations restricting emissions of greenhouse gases could result in increased operating costs and reduced demand for the oil, natural gas and NGLs we produce; and actual impacts of climate change like extreme weather conditions could adversely affect our operations.
In December 2009, the EPA officially published its findings that emissions of carbon dioxide, methane and other greenhouse gases, or GHGs, present an endangerment to public health and the environment because emissions of such gases are, according to the EPA, contributing to warming of the earth’s atmosphere and other climatic changes. Based on its findings, the EPA promulgated regulations to restrict emissions of GHGs under existing provisions of the federal Clean Air Act, including one rule that requires a reduction in emissions of GHGs from motor vehicles and another that regulates emissions of GHGs from certain large stationary sources. In addition, on October 30, 2009, the EPA published a final rule requiring the reporting of GHG emissions from specified large GHG emission sources in the United States. On November 9, 2010, the EPA issued final rules to expand its existing GHG reporting rule to include onshore oil and natural gas production, processing, transmission, storage and distribution facilities with reporting of GHG emissions from such facilities required on an annual basis. The first reports were due in 2012 for emissions occurring in 2011. In 2015, the EPA added reporting of GHG emissions from gathering and boosting systems, completions and workovers of oil wells using hydraulic fracturing, and blowdowns of natural gas transmission pipelines to the GHG reporting rule. We are currently required to monitor and report GHG emissions under this rule, and operational and/or regulatory changes could increase the burden of compliance with GHG emissions monitoring and reporting requirements.
The Climate Action Plan also calls for reductions of methane emissions. As previously mentioned, the federal administration finalized a rule to require methane reductions from new or modified oil and gas sources. On November 10, 2016, the EPA issued a final ICR that would have required numerous oil and gas companies to provide information regarding methane emissions from existing oil and gas facilities, but EPA withdrew the ICR on March 2, 2017. In addition, the U.S. Congress has from time to time considered adopting legislation to reduce emissions of GHGs and almost one‑half of the states have already taken legal measures to reduce emissions of GHGs primarily through the planned development of GHG emission inventories and/or regional GHG cap and trade programs. The adoption of legislation or regulatory programs to reduce emissions of GHGs could require us to incur increased operating costs, such as costs to purchase and operate emissions control systems, to acquire emissions allowances or comply with new regulatory or reporting requirements. Any such legislation or regulatory programs could also increase the cost of consuming, and thereby reduce demand for, the oil, natural gas and NGLs we produce. In addition, international, federal, regional and local regulatory initiatives that target GHGs could adversely affect the marketability of the oil and natural gas we produce. On October 23, 2015, the EPA published the final Clean Power Plan. While the rule directly applies to power plants, the Clean Power Plan is targeted at creating a shift from fossil fuels toward renewable power generation; however the rule has been stayed, is not effect during the judicial review, and is likely to be revisited by the new administration. Also, in 2015, the United States participated in the United Nations Conference on Climate Change, which led to the creation of the Paris Agreement. The Paris Agreement came into force on November 4, 2016, requiring,
41
countries to review and “represent a progression” in their intended nationally determined contributions, which set GHG emission reduction goals, every five years beginning in 2020. With the change in administration, the United States’ continued participation in the Paris Agreement is uncertain. Due to the uncertainties surrounding the regulation of and other risks associated with GHG emissions, we cannot predict the financial impact of related developments on our operations. To the extent adopted, legislation and regulatory programs to reduce emissions of GHGs could have an adverse effect on our business, financial condition and results of operations.
In addition, there has been public discussion that climate change may be associated with extreme weather conditions such as more intense hurricanes, thunderstorms, tornados and snow or ice storms, as well as rising sea levels. Another possible consequence of climate change is increased volatility in seasonal temperatures. Some studies indicate that climate change could cause some areas to experience temperatures substantially colder than their historical averages. Extreme weather conditions can interfere with our production and increase our costs and damage resulting from extreme weather may not be fully insured. However, at this time we are unable to determine the extent to which climate change may lead to increased storm or weather hazards affecting our operations.
We may face unanticipated water and other waste disposal costs.
We may be subject to regulation that restricts our ability to discharge water produced as part of our oil or gas production operations. Productive zones frequently contain water that must be removed in order for the oil or gas to produce, and our ability to remove and dispose of sufficient quantities of water from the various zones will determine whether we can produce oil or gas in commercial quantities. The produced water currently is transported from the lease and injected into disposal wells. Some states, including Texas and Oklahoma, also assert the authority to shut down disposal wells that are deemed to contribute to induced seismicity, or seismic activity that is caused by human activity. On August 3, 2015, the Oklahoma Corporation Commission adopted a plan calling for mandatory reductions in oil and gas wastewater disposal well volumes to address potential induced seismicity in Oklahoma. The availability of disposal wells with sufficient capacity to receive all of the water produced from our wells may affect our ability to produce our wells. Also, the EPA has prohibited the disposal of wastewater from hydraulic fracturing into publicly owned treatment facilities through a “zero discharge” pretreatment standard. The EPA is also conducting a study of private wastewater treatment facilities, referred to as centralized waste treatment, or CWT, facilities, accepting oil and gas extraction wastewater and will evaluate whether to revise discharge limits from CWT facilities. Therefore, across the oil and gas industry, the cost to transport and dispose of that water, including the cost of complying with regulations concerning water disposal, may increase. This increase may reduce our profitability.
In the event water produced from our projects fails to meet the quality requirements of applicable regulatory agencies, our wells produce water in excess of the applicable volumetric permit limits, the disposal wells fail to meet the requirements of all applicable regulatory agencies, or we are unable to secure access to disposal wells with sufficient capacity to accept all of the produced water, we may have to shut in wells, reduce drilling activities, or upgrade facilities for water handling or treatment. The costs to dispose of this produced water may increase if any of the following occur:
|
· |
we cannot obtain future permits from applicable regulatory agencies; |
|
· |
water of lesser quality or requiring additional treatment is produced; |
|
· |
our wells produce excess water; |
|
· |
new laws and regulations require water to be disposed in a different manner; or |
|
· |
costs to transport the produced water to the disposal wells increase. |
We conduct a substantial portion of our operations through farm‑outs, areas of mutual interest and other joint development agreements. These agreements subject us to additional risks that could have a material adverse effect on the success of these operations, our financial position and our results of operations.
We conduct a substantial portion of our operations through joint development agreements with third parties, including ExxonMobil. We may also enter into other joint development agreements in the future. These third parties may have obligations that are important to the success of the joint development agreement, such as the obligation to contribute capital or pay carried or other costs associated with the joint development agreement. The performance of these third‑party obligations, including the ability of the third parties to satisfy their obligations under these arrangements, is
42
outside our control. If these parties do not satisfy their obligations under these arrangements, our business may be adversely affected.
Our joint development agreements may involve risks not otherwise present when exploring and developing properties directly, including, for example:
|
· |
our joint development partners may share certain approval rights over major decisions; |
|
· |
our joint development partners may not pay their share of the joint development agreement obligations, leaving us liable for their share of joint development liabilities; |
|
· |
we may incur liabilities as a result of an action taken by our joint development partners; |
|
· |
our joint development partners may be in a position to take actions contrary to our instructions or requests or contrary to our policies or objectives; and |
|
· |
disputes between us and our joint development partners may result in delays, litigation or operational impasses. |
The risks described above, the failure to continue our joint ventures or to resolve disagreements with our joint development partners could adversely affect our ability to transact the business of such joint development, which would in turn negatively affect our financial condition and results of operations.
Risks Relating to Financings and Ownership:
Future sales of our common stock in the public market or the issuance of securities senior to our common stock, or the perception that these sales may occur, could adversely affect the trading price of our common stock and our ability to raise funds in stock offerings.
A large percentage of our shares of common stock are held by a relatively small number of investors. Further, we entered into registration rights agreements with certain of those investors pursuant to which we have filed a registration statement with the SEC to facilitate potential future sales of such shares by them. Sales by us or our stockholders of a substantial number of shares of our common stock in the public markets, or even the perception that these sales might occur, could cause the market price of our Class A common stock to decline or could impair our ability to raise capital through a future sale of, or pay for acquisitions using, our equity securities.
We may issue common stock or other equity securities senior to our common stock in the future for a number of reasons, including to finance acquisitions, to adjust our leverage ratio, and to satisfy our obligations upon the exercise of warrants and options, or for other reasons. We cannot predict the effect, if any, that future sales or issuances of shares of our common stock or other equity securities, or the availability of shares of common stock or such other equity securities for future sale or issuance, will have on the trading price of our common stock.
Increases in interest rates could adversely affect our business.
Our business and operating results can be harmed by factors such as the availability, terms and cost of capital, increases in interest rates or a reduction in credit rating. These changes could cause our cost of doing business to increase, limit our ability to pursue acquisition opportunities, reduce our cash flow available for drilling and place us at a competitive disadvantage. For example, as of December 31, 2016, we had an unused borrowing capacity of approximately $247.0 million under our revolving credit facility, subject to compliance with financial covenants. The impact of a 1.0% increase in interest rates on an assumed borrowing of the full $425.0 million available under our revolving credit facility would result in increased annual interest expense of approximately $4.3 million and a corresponding decrease in our net income. Recent and continuing disruptions and volatility in the global financial markets may lead to a contraction in credit availability impacting our ability to finance our operations. A significant reduction in our cash flows from operations or the availability of credit could materially and adversely affect our ability to achieve our planned growth and operating results.
43
Our indebtedness could adversely affect our financial condition. For example, any reduction in the borrowing base under our revolving credit facility may reduce our liquidity or result in our having to repay indebtedness under our revolving credit facility earlier than anticipated.
As of December 31, 2016, we had $737.1 million of total long-term debt obligations, including $178.0 million drawn on our revolving credit facility. Our indebtedness may significantly affect our financial flexibility in the future, including by making it more difficult for us to borrow in the future, making us more vulnerable to adverse economic or industry conditions and deterring third parties from material transactions with us. In addition, a reduction in the borrowing base for our revolving credit facility will reduce our liquidity. If such a reduction results in the outstanding amount under our revolving credit facility exceeding the borrowing base, we will be required to repay the deficiency within a short period of time. Our business may not continue to generate sufficient cash flow from operations to repay our indebtedness. If we are unable to generate sufficient cash flow from operations, we may be required to sell assets, to refinance all or a portion of our indebtedness or to obtain additional financing.
The borrowing base under our revolving credit facility will be redetermined at least semi-annually on or about April 1 and October 1 of each year, with such redetermination based primarily on reserve reports using lender commodity price expectations at such time. JEH and the administrative agent (acting at the direction of lenders holding at least 662/3% of the outstanding loans) may each request one unscheduled borrowing base redetermination between each scheduled redetermination. In addition, the lenders may elect to redetermine the borrowing base upon the occurrence of certain defaults under our material operating agreements or upon the cancellation or termination of certain of our joint development agreements. The borrowing base may also be reduced as a result of our issuance of unsecured notes, our termination of material hedging positions or our consummation of significant asset sales. If current low commodity prices continue through such redetermination events, the borrowing base under our revolving credit facility may be reduced.
Certain federal regulatory agencies, including the Office of the Comptroller of the Currency (OCC), the Federal Reserve, and the Federal Deposit Insurance Corp., have recently focused on oil and gas lenders’ examinations and ratings of reserve based loans, with a view towards encouraging such lenders to reduce their exposure to potentially substandard loans to oil and gas companies. In April 2014, the OCC issued the “Oil and Gas Production Lending” bank examination booklet, which details potential regulatory requirements related to reserve based lending. Whether or not these regulatory agencies are successful in implementing stricter requirements related to reserve based lending, oil and gas lenders may respond to these discussions by taking a more conservative approach in their lending practices, which could adversely impact future borrowing base redeterminations under our revolving credit facility.
For more information on our indebtedness, see “Item 7. Management’s Discussion and Analysis of Financial Condition and Results of Operations—Liquidity and Capital Resources.”
The Jones family and Metalmark Capital, our primary private equity investor, control a significant percentage of Jones Energy, Inc.’s voting power and have the ability to take actions that may conflict with your interests.
As of December 31, 2016, the Jones family and Metalmark Capital held approximately 36.5% of the combined voting power of Jones Energy, Inc. The Jones family and Metalmark Capital are entitled to act separately in their own respective interests with respect to their ownership interests in Jones Energy, Inc., and together have the ability to substantially influence the election of the members of our board of directors, thereby potentially controlling our management and affairs. In addition, the Jones family and Metalmark Capital have significant influence over all matters that require approval by our stockholders, including mergers and other material transactions.
If we fail to develop or maintain an effective system of internal controls, we may not be able to report our financial results accurately or prevent fraud, which would likely have a negative impact on the market price of our common stock.
Effective internal controls are necessary for us to provide reliable financial reports, prevent fraud and to operate successfully as a publicly traded company. To comply with the requirements of being a publicly traded company, we may need to implement additional financial and management controls, reporting systems and procedures and hire additional accounting, finance, tax and legal staff. Our efforts to develop and maintain our internal controls may not be successful, and we may be unable to maintain effective controls over our financial processes and reporting in the future or to comply with our obligations under Section 404 of the Sarbanes‑Oxley Act of 2002, which we refer to as Section 404. For example, Section 404 requires us, among other things, to annually review and report on the
44
effectiveness of our internal controls over financial reporting. Any failure to develop, implement or maintain effective internal controls or to improve our internal controls could harm our operating results or cause us to fail to meet our reporting obligations. Given the difficulties inherent in the design and operation of internal controls over financial reporting, we can provide no assurance as to our conclusions about the effectiveness of our internal controls, and we may incur significant costs in our efforts to comply with Section 404. If one or more material weaknesses persist or if we fail to establish and maintain effective internal control over financial reporting, our ability to accurately report our financial results could be adversely affected. Ineffective internal controls could also subject us to regulatory scrutiny and a loss of confidence in our reported financial information, which could have an adverse effect on our business.
The loss of senior management or technical personnel could adversely affect our operations.
Our success will depend to a large extent upon the efforts and abilities of our executive officers and key operations personnel. The loss of the services of one or more of these key employees could have a material adverse effect on us. We do not maintain insurance against the loss of any of these individuals. Our business will also be dependent upon our ability to attract and retain qualified personnel. Since the fourth quarter of 2014, the prices of oil, natural gas and NGLs were extremely volatile and declined significantly. Key employees may depart because of uncertainty during times of commodity price volatility. Acquiring and keeping these personnel could prove more difficult or cost substantially more than estimated. This could cause us to incur greater costs, or prevent us from pursuing our development and exploitation strategy as quickly as we would otherwise wish to do.
We will incur corporate income tax liabilities on taxable income allocated to us by JEH with respect to JEH Units we own, which may be substantial. JEH is required to make cash tax distributions under its operating agreement. JEH’s ability to make tax distributions, and our ability to pay taxes and the TRA liability may be limited by our structure and available liquidity. To the extent that we incur cash income tax liabilities or JEH is required to make cash tax distributions and cash payments of the TRA liability it would impact our liquidity and reduce cash available for other uses.
Under the terms of its operating agreement, JEH is generally required to make quarterly pro rata cash tax distributions to its unitholders (including us) based on income allocated to such unitholders through the end of each relevant quarter, as adjusted to take into account good faith projections by the Company of taxable income or loss for the remainder of the calendar year, to the extent JEH has cash available for such distributions and subject to certain other restrictions described below. During 2016, JEH generated taxable income, resulting in the payment during 2016 of $17.3 million in cash tax distributions to JEH unitholders (other than us). As a result of JEH’s 2016 taxable income (all of which is passed-through and taxed to us and JEH’s other unitholders), we anticipate that, in 2017, we will be required to make further income tax payments to federal and state taxing authorities of $4.0 million and JEH will make further tax distributions to JEH unitholders (other than us) of $0.6 million. Based on our initial 2017 operating budget and information available as of this filing, we do not anticipate that we will be required to make any additional tax payments or that JEH will make any additional tax distributions during 2017. Estimating the tax distributions required under the operating agreement is imprecise by nature, highly uncertain, and dependent upon a variety of factors.
We are classified as a corporation for U.S. federal income tax purposes and, in most states in which JEH does business, for state income tax purposes. Under current law, we are subject to U.S. federal income tax at rates of up to 35% (and a 20% alternative minimum tax in certain cases), and to state income tax at rates that vary from state to state, on the net income allocated to us by JEH with respect to the JEH Units we own. We are a holding company with our sole asset consisting of our ownership in JEH and have no independent means of generating revenue. JEH is classified as a partnership for federal income tax purposes and as such is not subject to federal income tax (other than as a withholding agent). Instead, taxable income is allocated to holders of JEH Units, including the JEH Units we own. Under the terms of its operating agreement, JEH is obligated to make tax distributions to holders of its units, including us, subject to the conditions described below. Our ability to cause JEH to make tax distributions, which generally will be pro rata with respect to all outstanding JEH Units, in an amount sufficient to allow us to pay our taxes and make any payments due under the TRA, is subject to various factors, including the cash requirements and financial condition of JEH, compliance by JEH or its subsidiaries with restrictions, covenants and financial ratios related to existing or future indebtedness, including under our notes and our revolving credit agreement, and other agreements entered into with third parties. As a result, it is possible that Jones Energy, Inc. will not have sufficient cash to pay taxes and make payments under the TRA liability.
See “Risk Factors—We will be required to make payments under the Tax Receivable Agreement for certain tax benefits we may receive (or be deemed to receive), and the amounts of such payments could be significant.”
45
We will be required to make payments under the Tax Receivable Agreement for certain tax benefits we may receive (or be deemed to receive), and the amounts of such payments could be significant.
We entered into the Tax Receivable Agreement with JEH and the Class B shareholders. This agreement generally provides for the payment by us of 85% of the amount of cash savings, if any, in U.S. federal, state and local income tax or franchise tax that we actually realize (or are deemed to realize in certain circumstances) as a result of (i) the tax basis increases resulting from the Class B shareholders’ exchange of JEH Units for shares of Class A common stock (or resulting from a sale of JEH Units to us for cash) and (ii) imputed interest deemed to be paid by us as a result of, and additional tax basis arising from, any payments we make under the Tax Receivable Agreement. In addition, payments we make under the Tax Receivable Agreement will be increased by any interest accrued from the due date (without extensions) of the corresponding tax return.
The payment obligations under the Tax Receivable Agreement are our obligations and not obligations of JEH. For purposes of the Tax Receivable Agreement, cash savings in tax generally are calculated by comparing our actual tax liability to the amount we would have been required to pay had we not been able to utilize any of the tax benefits subject to the Tax Receivable Agreement. Any payments are made within a designated period of time following the filing of the tax return where we utilize such tax benefits to reduce taxes in a given year. The term of the Tax Receivable Agreement will continue until all such tax benefits have been utilized or expired, unless we exercise our right to terminate the Tax Receivable Agreement by making the termination payment specified in the agreement.
The actual increase in tax basis, as well as the amount and timing of any payments under the Tax Receivable Agreement, will vary depending upon a number of factors, including the timing of the exchanges of JEH Units, the price of Class A common stock at the time of each exchange, the extent to which such exchanges are taxable, the amount and timing of the taxable income we generate in the future and the tax rate then applicable, and the portion of our payments under the Tax Receivable Agreement constituting imputed interest or depletable, depreciable or amortizable basis. We expect that the payments that we will be required to make under the Tax Receivable Agreement could be substantial.
The payments under the Tax Receivable Agreement will not be conditioned upon a holder of rights under the Tax Receivable Agreement having a continued ownership interest in either JEH or us.
In certain circumstances including transactions involving a change in control, significant payments under the Tax Receivable Agreement may be accelerated and/or significantly exceed the actual benefits, if any, we realize in respect of the tax attributes subject to the Tax Receivable Agreement.
Under certain circumstances, we could become obligated to make significant payments under our Tax Receivable Agreement that could exceed or represent a substantial portion of our liquidity and market capitalization. These payment obligations could be to persons without significant equity ownership in the Company at the time such obligation arises. If we elect to terminate the Tax Receivable Agreement early or it is terminated early due to certain mergers or other changes of control, we would be required to make an immediate payment equal to the present value of the anticipated future tax benefits subject to the Tax Receivable Agreement, which calculation of anticipated future tax benefits will be based upon certain assumptions and deemed events set forth in the Tax Receivable Agreement, including the assumption that we have sufficient taxable income to fully utilize such benefits and that any JEH Units that the Class B shareholders or their permitted transferees own on the termination date are deemed to be exchanged on the termination date. Any early termination payment may be made significantly in advance of the actual realization, if any, of such future benefits. In these situations, our obligations under the Tax Receivable Agreement could have a substantial negative impact on our liquidity and could have the effect of delaying, deferring or preventing certain mergers, asset sales, other forms of business combinations or other changes of control due to the additional transaction cost a potential acquirer may attribute to satisfying such obligations.
Payments under the Tax Receivable Agreement will be based on the tax reporting positions that we will determine. The holders of rights under the Tax Receivable Agreement will not reimburse us for any payments previously made under the Tax Receivable Agreement if such basis increases or other benefits are subsequently disallowed, except that excess payments made to any Class B shareholder will be netted against payments otherwise to be made, if any, to such Class B shareholder after our determination of such excess. As a result, in such circumstances, we could make payments that are greater than our actual cash tax savings, if any, and may not be able to recoup those payments, which could adversely affect our liquidity.
46
For as long as we are an emerging growth company, we will not be required to comply with certain requirements that apply to other public companies.
We continue to qualify as an “emerging growth company” under the Jumpstart Our Business Startups Act (the “JOBS Act”). By virtue of such, we may take advantage of certain exemptions from various reporting requirements that are applicable to other public companies that are not emerging growth companies, including not being required to provide an auditor’s attestation report on management’s assessment of the effectiveness of our system of internal control over financial reporting pursuant to Section 404 and reduced disclosure obligations regarding executive compensation in our periodic reports. We will remain an emerging growth company for up to five years, although we will lose that status sooner if we have more than $1.0 billion of revenues in a fiscal year, have more than $700 million in market value of our Class A common stock held by non-affiliates, or issue more than $1.0 billion of non-convertible debt over a three year period.
To the extent that we rely on any of the exemptions available to emerging growth companies, you will receive less information about our executive compensation and internal control over financial reporting than issuers that are not emerging growth companies.
We are subject to cyber security risks. A cyber incident could occur and result in information theft, data corruption, operational disruption or financial loss.
The oil and gas industry has become increasingly dependent on digital technologies to conduct certain exploration, development, production, processing and distribution activities. For example, we depend on digital technologies to interpret seismic data, manage drilling rigs, production equipment and gathering and transportation systems, conduct reservoir modeling and reserves estimation and process and record financial and operating data. As an oil and natural gas producer, we face various security threats, including cyber security threats. Cyber security attacks in particular are increasing and include, but are not limited to, malicious software, attempts to gain unauthorized access to data, and other electronic security breaches that could lead to disruptions in critical systems, unauthorized release of confidential or otherwise protected information and corruption of data. Although to date we have not experienced any material losses related to cyber security attacks, we may suffer such losses in the future. Moreover, the various procedures and controls we use to monitor and protect against these threats and to mitigate our exposure to such threats may not be sufficient in preventing security threats from materializing. If any of these events were to materialize, they could lead to losses of sensitive information, critical infrastructure, personnel or capabilities essential to our operations and could have a material adverse effect on our reputation, financial position, results of operations or cash flows.
Loss of our information and computer systems could adversely affect our business.
We are heavily dependent on our information systems and computer based programs, including our well operations information, seismic data, electronic data processing and accounting data. If any of such programs or systems were to fail or create erroneous information in our hardware or software network infrastructure, possible consequences include our loss of communication links, inability to find, produce, process and sell oil, natural gas and NGLs and inability to automatically process commercial transactions or engage in similar automated or computerized business activities. Any such consequence could have a material adverse effect on our business.
Item 1B. Unresolved Staff Comments
None.
The information required by Item 2. is contained in Item 1. Business.
We are from time to time subject to, and are presently involved in, litigation or other legal proceedings arising out of the ordinary course of business. None of these legal proceedings are expected to have a material adverse effect on our financial condition, results of operations or cash flow. With respect to these proceedings, our management believes that we will either prevail, have adequate insurance coverage or have established appropriate reserves to cover potential liabilities. Any costs that management estimates may be paid related to these proceedings or claims are accrued when the
47
liability is considered probable and the amount can be reasonably estimated. There can be no assurance, however, as to the ultimate outcome of any of these matters, and if all or substantially all of these legal proceedings were to be determined adversely to us, there could be a material adverse effect on our financial condition, results of operations and cash flow.
See Note 15, “Commitments and Contingencies - Litigation,” in the Notes to Consolidated Financial Statements for further discussion.
Items 4. Mine Safety Disclosures
Not applicable.
48
Item 5. Market for Registrant’s Common Equity, Related Stockholder Matters and Issuer Purchases of Equity Securities
Our common stock is listed on the New York Stock Exchange (“NYSE”) under the symbol “JONE.”
The following table sets forth the range of high and low sales prices of our common stock as reported by the NYSE for the periods indicated.
|
|
|
2016 |
|
2015 |
|
||||||||
|
|
|
High |
|
Low |
|
High |
|
Low |
|
||||
|
1st Quarter |
|
$ |
4.01 |
|
$ |
1.16 |
|
$ |
12.60 |
|
$ |
7.74 |
|
|
2nd Quarter |
|
$ |
5.30 |
|
$ |
2.84 |
|
$ |
11.63 |
|
$ |
8.39 |
|
|
3rd Quarter |
|
$ |
4.49 |
|
$ |
2.55 |
|
$ |
9.15 |
|
$ |
4.41 |
|
|
4th Quarter |
|
$ |
5.34 |
|
$ |
3.35 |
|
$ |
6.05 |
|
$ |
3.20 |
|
On March 1, 2017, the last sale price of our common stock, as reported on the NYSE, was $3.35 per share. As of March 1, 2017, there were 57,193,106 shares of Class A common stock outstanding held by approximately twenty-two stockholders of record and 29,832,098 shares of Class B common stock outstanding held by approximately ten stockholders of record.
Dividend Policy
We have not paid any cash dividends and do not anticipate declaring or paying any cash dividends to holders of our Class A common stock in the foreseeable future. We currently intend to retain future earnings, if any, to finance the growth of our business. Our future dividend policy is within the discretion of our board of directors and will depend upon then existing conditions, including our results of operations, financial condition, capital requirements, investment opportunities, statutory restrictions on our ability to pay dividends and other factors our board of directors may deem relevant. In addition, our senior secured revolving credit facility, the 2022 Notes and the 2023 Notes prohibit us from paying cash dividends.
Issuer Purchases of Equity Securities
None.
Sales of Unregistered Equity Securities
None.
Stock Performance Graph
The following stock performance graph and related information shall not be deemed “soliciting material” or to be “filed” with the SEC, nor shall such information be incorporated by reference into any future filing under the Securities Act of 1933, as amended (the “Securities Act”), or the Securities Exchange Act of 1934, as amended (the “Exchange Act”), except to the extent that we specifically incorporate such information by reference into such a filing. The graph and information is included for historical comparative purposes only and should not be considered indicative of future stock performance.
The graph compares the cumulative total shareholder return to Jones Energy, Inc.’s common stockholders as compared to the cumulative total returns on the Standard & Poor’s 500 index (“the S&P 500 Index”) and the Standard and Poor’s 500 Oil & Gas Exploration & Production Index (“S&P 500 O&G E&P Index”) since the time of our IPO. The graph was prepared assuming $100 was invested in our common stock at its initial public offering price of $15.00 per share and
49
invested in the S&P 500 Index and the S&P 500 O&G E&P Index on July 24, 2013 at the closing price on such date and tracked through December 31, 2016.
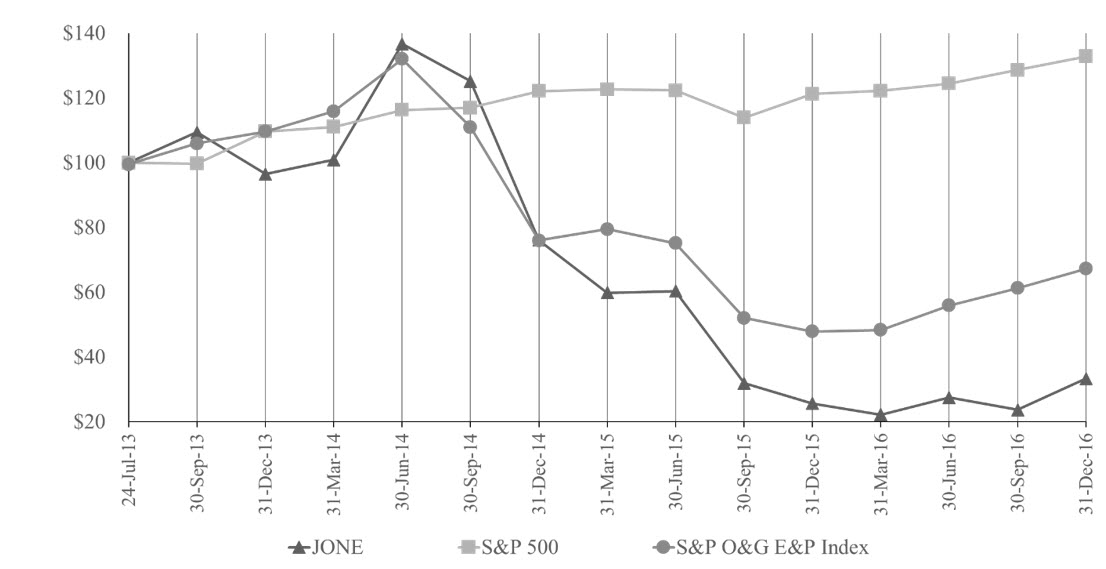
Securities Authorized for issuance Under Equity Compensation Plans
The following table presents the securities authorized for issuance under the Amended and Restated Jones Energy, Inc. 2013 Omnibus Incentive Plan (the “LTIP”) as of December 31, 2016.
|
|
|
|
|
|
|
Number of Shares |
|
|
|
|
Number of Shares to be |
|
Weighted-Average |
|
Remaining Available for |
|
|
|
|
Issued Upon Exercise of |
|
Exercise Price of |
|
Future Issuance under |
|
|
|
|
Outstanding Options, |
|
Outstanding Options, |
|
Equity Compensation |
|
|
Plan Category |
|
Warrants and Rights |
|
Warrants and Rights ($) |
|
Plans |
|
|
Equity compensation plan approved by security holders (1) |
|
— |
|
— |
|
4,447,283 |
(2) |
|
Equity compensation plans not approved by security holders |
|
— |
|
— |
|
— |
|
|
Total |
|
— |
|
— |
|
4,447,283 |
|
|
(1) |
Our Amended and Restated 2013 Omnibus Incentive Plan (the “LTIP”) was approved by our board of directors in May 2016 and took effect on May 4, 2016. The LTIP was also approved by our shareholders at the Annual Meeting of Shareholders on May 4, 2016. |
|
(2) |
The LTIP may consist of the following components: restricted stock, stock options, performance awards, restricted stock units, stock appreciation rights, cash awards, dividend equivalents, and other share‑ based awards. The LTIP limits the number of shares that may be delivered pursuant to awards to an aggregate total of 7,350,000 shares of our Class A common stock. Our board of directors had approved total cumulative awards of 2,902,717 shares of restricted Class A common stock under the LTIP as of December 31, 2016, net of forfeitures and other adjustments that return previously awarded shares to the pool of remaining available shares. |
50
Item 6. Selected Financial Data
The following table sets forth selected financial data of Jones Energy, Inc. and its predecessor for the years ended December 31, 2016, 2015, 2014, 2013 and 2012. This information should be read in connection with “Item 7. Management’s Discussion and Analysis of Financial Condition and Results of Operations” and “Item 8. Financial Statements and Supplementary Data” presented elsewhere in this report.
|
|
|
Year Ended December 31, |
|
|||||||||||||
|
(in thousands except per share data) |
|
2016 |
|
2015 |
|
2014 |
|
2013 |
|
2012 |
|
|||||
|
Operating revenues |
|
|
|
|
|
|
|
|
|
|
|
|
|
|
|
|
|
Oil and gas sales |
|
$ |
124,877 |
|
$ |
194,555 |
|
$ |
378,401 |
|
$ |
258,063 |
|
$ |
148,967 |
|
|
Other revenues |
|
|
2,970 |
|
|
2,844 |
|
|
2,196 |
|
|
1,106 |
|
|
847 |
|
|
Total operating revenues |
|
|
127,847 |
|
|
197,399 |
|
|
380,597 |
|
|
259,169 |
|
|
149,814 |
|
|
Operating costs and expenses |
|
|
|
|
|
|
|
|
|
|
|
|
|
|
|
|
|
Lease operating |
|
|
32,640 |
|
|
41,027 |
|
|
37,760 |
|
|
25,129 |
|
|
22,151 |
|
|
Production and ad valorem taxes |
|
|
7,768 |
|
|
12,130 |
|
|
22,556 |
|
|
15,517 |
|
|
6,529 |
|
|
Exploration |
|
|
6,673 |
|
|
6,551 |
|
|
3,453 |
|
|
16,125 |
|
|
356 |
|
|
Depletion, depreciation and amortization |
|
|
153,930 |
|
|
205,498 |
|
|
181,669 |
|
|
114,136 |
|
|
80,709 |
|
|
Impairment of oil and gas properties |
|
|
— |
|
|
— |
|
|
— |
|
|
— |
|
|
18,821 |
|
|
Accretion of ARO liability |
|
|
1,263 |
|
|
1,087 |
|
|
770 |
|
|
608 |
|
|
533 |
|
|
General and administrative |
|
|
29,640 |
|
|
33,388 |
|
|
25,763 |
|
|
31,902 |
|
|
15,875 |
|
|
Other operating |
|
|
199 |
|
|
4,188 |
|
|
— |
|
|
— |
|
|
— |
|
|
Total operating expenses |
|
|
232,113 |
|
|
303,869 |
|
|
271,971 |
|
|
203,417 |
|
|
144,974 |
|
|
Operating income (loss) |
|
|
(104,266) |
|
|
(106,470) |
|
|
108,626 |
|
|
55,752 |
|
|
4,840 |
|
|
Other income (expense) |
|
|
|
|
|
|
|
|
|
|
|
|
|
|
|
|
|
Interest expense |
|
|
(53,127) |
|
|
(64,458) |
|
|
(41,875) |
|
|
(30,053) |
|
|
(24,687) |
|
|
Gain on debt extinguishment |
|
|
99,530 |
|
|
— |
|
|
— |
|
|
— |
|
|
— |
|
|
Net gain (loss) on commodity derivatives |
|
|
(51,264) |
|
|
158,753 |
|
|
189,641 |
|
|
(2,566) |
|
|
16,684 |
|
|
Other income (expense) |
|
|
536 |
|
|
317 |
|
|
(4,554) |
|
|
(799) |
|
|
557 |
|
|
Other income (expense), net |
|
|
(4,325) |
|
|
94,612 |
|
|
143,212 |
|
|
(33,418) |
|
|
(7,446) |
|
|
Income (loss) before income tax |
|
|
(108,591) |
|
|
(11,858) |
|
|
251,838 |
|
|
22,334 |
|
|
(2,606) |
|
|
Income tax provision |
|
|
|
|
|
|
|
|
|
|
|
|
|
|
|
|
|
Current |
|
|
3,981 |
|
|
113 |
|
|
53 |
|
|
85 |
|
|
— |
|
|
Deferred |
|
|
(27,767) |
|
|
(2,894) |
|
|
26,165 |
|
|
(156) |
|
|
473 |
|
|
Total income tax provision (benefit) |
|
|
(23,786) |
|
|
(2,781) |
|
|
26,218 |
|
|
(71) |
|
|
473 |
|
|
Net income (loss) |
|
|
(84,805) |
|
|
(9,077) |
|
|
225,620 |
|
|
22,405 |
|
|
(3,079) |
|
|
Net income (loss) attributable to non-controlling interests |
|
|
(42,253) |
|
|
(6,696) |
|
|
184,484 |
|
|
24,591 |
|
|
— |
|
|
Net income (loss) attributable to controlling interests |
|
$ |
(42,552) |
|
$ |
(2,381) |
|
$ |
41,136 |
|
$ |
(2,186) |
|
$ |
(3,079) |
|
|
Dividends and accretion on preferred stock |
|
|
(2,669) |
|
|
— |
|
|
— |
|
|
— |
|
|
— |
|
|
Net income (loss) attributable to common shareholders |
|
|
(45,221) |
|
|
(2,381) |
|
|
41,136 |
|
|
(2,186) |
|
|
(3,079) |
|
|
|
|
|
|
|
|
|
|
|
|
|
|
|
|
|
|
|
|
Earnings (loss) per share: |
|
|
|
|
|
|
|
|
|
|
|
|
|
|
|
|
|
Basic - Net income (loss) attributable to common shareholders |
|
$ |
(1.13) |
|
$ |
(0.09) |
|
$ |
3.28 |
|
|
(0.17) |
|
|
|
|
|
Diluted - Net income (loss) attributable to common shareholders |
|
$ |
(1.13) |
|
$ |
(0.09) |
|
$ |
3.28 |
|
|
(0.17) |
|
|
|
|
|
Weighted average Class A shares outstanding: |
|
|
|
|
|
|
|
|
|
|
|
|
|
|
|
|
|
Basic |
|
|
40,009 |
|
|
26,816 |
|
|
12,526 |
|
|
12,500 |
|
|
|
|
|
Diluted |
|
|
40,009 |
|
|
26,816 |
|
|
12,535 |
|
|
12,500 |
|
|
|
|
|
Other Supplementary Data: |
|
|
|
|
|
|
|
|
|
|
|
|
|
|
|
|
|
EBITDAX (1) |
|
$ |
187,955 |
|
$ |
268,417 |
|
$ |
303,014 |
|
$ |
204,997 |
|
$ |
135,741 |
|
|
Adjusted net income (2) |
|
$ |
(15,528) |
|
$ |
2,220 |
|
$ |
68,824 |
|
$ |
56,425 |
|
$ |
29,767 |
|
|
(1) |
EBITDAX is a non‑GAAP financial measure. For a definition of EBITDAX and a reconciliation of EBITDAX to our net income, see “—Non‑GAAP Financial Measures” below. |
|
(2) |
Adjusted net income is a non‑GAAP financial measure. For a definition of adjusted net income and a reconciliation of adjusted net income to our net income, see “—Non‑GAAP Financial Measures” below. |
51
|
|
|
Year Ended December 31, |
|
|||||||||||||
|
(in thousands of dollars) |
|
2016 |
|
2015 |
|
2014 |
|
2013 |
|
2012 |
|
|||||
|
Statement of Cash Flow Data |
|
|
|
|
|
|
|
|
|
|
|
|
|
|
|
|
|
Net cash provided by operating activities |
|
$ |
25,700 |
|
$ |
68,849 |
|
$ |
265,319 |
|
$ |
148,528 |
|
$ |
84,550 |
|
|
Net cash (used in) investing activities |
|
|
(130,862) |
|
|
(168,220) |
|
|
(463,799) |
|
|
(368,232) |
|
|
(337,636) |
|
|
Net cash provided by financing activities |
|
|
117,911 |
|
|
107,698 |
|
|
188,226 |
|
|
219,798 |
|
|
270,676 |
|
|
Net increase (decrease) in cash |
|
$ |
12,749 |
|
$ |
8,327 |
|
$ |
(10,254) |
|
$ |
94 |
|
$ |
17,590 |
|
|
|
|
As of December 31, |
|
|||||||||||||
|
(in thousands of dollars) |
|
2016 |
|
2015 |
|
2014 |
|
2013 |
|
2012 |
|
|||||
|
Balance Sheet Data |
|
|
|
|
|
|
|
|
|
|
|
|
|
|
|
|
|
Cash and cash equivalents |
|
$ |
34,642 |
|
$ |
21,893 |
|
$ |
13,566 |
|
$ |
23,820 |
|
$ |
23,726 |
|
|
Other current assets |
|
|
64,680 |
|
|
172,281 |
|
|
230,648 |
|
|
121,725 |
|
|
74,886 |
|
|
Total current assets |
|
|
99,322 |
|
|
194,174 |
|
|
244,214 |
|
|
145,545 |
|
|
98,612 |
|
|
Property and equipment, net |
|
|
1,746,584 |
|
|
1,639,639 |
|
|
1,642,908 |
|
|
1,300,672 |
|
|
1,010,742 |
|
|
Other long-term assets |
|
|
40,794 |
|
|
101,341 |
|
|
96,363 |
|
|
37,775 |
|
|
36,443 |
|
|
Total assets |
|
$ |
1,886,700 |
|
$ |
1,935,154 |
|
$ |
1,983,485 |
|
$ |
1,483,992 |
|
$ |
1,145,797 |
|
|
Current liabilities |
|
$ |
107,807 |
|
$ |
67,576 |
|
$ |
229,132 |
|
$ |
179,623 |
|
$ |
93,360 |
|
|
Long-term debt |
|
|
724,009 |
|
|
837,654 |
|
|
848,636 |
|
|
654,013 |
|
|
605,111 |
|
|
Other long-term liabilities |
|
|
74,458 |
|
|
93,072 |
|
|
52,367 |
|
|
26,232 |
|
|
18,926 |
|
|
Mezzanine equity |
|
|
88,975 |
|
|
— |
|
|
— |
|
|
— |
|
|
— |
|
|
Total stockholders’ / members’ equity |
|
|
891,451 |
|
|
936,852 |
|
|
853,350 |
|
|
624,124 |
|
|
428,400 |
|
|
Total liabilities and stockholders’ / members’ equity |
|
$ |
1,886,700 |
|
$ |
1,935,154 |
|
$ |
1,983,485 |
|
$ |
1,483,992 |
|
$ |
1,145,797 |
|
Non‑GAAP financial measures
EBITDAX is a supplemental non-GAAP financial measure that is used by management and external users of our consolidated financial statements, such as industry analysts, investors, lenders and rating agencies.
We define EBITDAX as earnings before interest expense, income taxes, depreciation, depletion and amortization, exploration expense, gains and losses from derivatives less the current period settlements of matured derivative contracts and the other items described below. EBITDAX is not a measure of net income as determined by United States generally accepted accounting principles, or GAAP. Management believes EBITDAX is useful because it allows us to more effectively evaluate our operating performance and compare the results of our operations from period to period and against our peers without regard to our financing methods or capital structure. We exclude the items listed above from net income in arriving at EBITDAX because these amounts can vary substantially from company to company within our industry depending upon accounting methods and book values of assets, capital structures and the method by which the assets were acquired. EBITDAX has limitations as an analytical tool and should not be considered as an alternative to, or more meaningful than, net income as determined in accordance with GAAP or as an indicator of our liquidity. Certain items excluded from EBITDAX are significant components in understanding and assessing a company’s financial performance, such as a company’s cost of capital and tax structure, as well as the historical costs of depreciable assets. Our presentation of EBITDAX should not be construed as an inference that our results will be unaffected by unusual or
52
nonrecurring items. Our computations of EBITDAX may not be comparable to other similarly titled measures of other companies.
The following table sets forth a reconciliation of net income (loss) as determined in accordance with GAAP to EBITDAX for the periods indicated:
|
|
|
Year Ended December 31, |
|
|||||||||||||
|
(in thousands of dollars) |
|
2016 |
|
2015 |
|
2014 |
|
2013 |
|
2012 |
|
|||||
|
Reconciliation of EBITDAX to net income |
|
|
|
|
|
|
|
|
|
|
|
|
|
|
|
|
|
Net income (loss) |
|
$ |
(84,805) |
|
$ |
(9,077) |
|
$ |
225,620 |
|
$ |
22,405 |
|
$ |
(3,079) |
|
|
Interest expense |
|
|
53,127 |
|
|
64,458 |
|
|
41,875 |
|
|
30,053 |
|
|
24,688 |
|
|
Exploration expense |
|
|
6,673 |
|
|
6,551 |
|
|
3,453 |
|
|
16,125 |
|
|
356 |
|
|
Income taxes |
|
|
(23,786) |
|
|
(2,781) |
|
|
26,218 |
|
|
(71) |
|
|
473 |
|
|
Depreciation and depletion |
|
|
153,930 |
|
|
205,498 |
|
|
181,669 |
|
|
114,136 |
|
|
80,709 |
|
|
Impairment of oil and natural gas properties |
|
|
— |
|
|
— |
|
|
— |
|
|
— |
|
|
18,821 |
|
|
Accretion of ARO liability |
|
|
1,263 |
|
|
1,087 |
|
|
770 |
|
|
608 |
|
|
533 |
|
|
Reduction of TRA liability |
|
|
(784) |
|
|
(1,984) |
|
|
— |
|
|
— |
|
|
— |
|
|
Other non-cash charges |
|
|
1,202 |
|
|
1,023 |
|
|
376 |
|
|
79 |
|
|
129 |
|
|
Stock compensation expense |
|
|
7,425 |
|
|
7,562 |
|
|
4,040 |
|
|
10,838 |
|
|
570 |
|
|
Deferred and other non-cash compensation expense |
|
|
804 |
|
|
455 |
|
|
758 |
|
|
2,719 |
|
|
— |
|
|
Net (gain) loss on derivative contracts |
|
|
51,264 |
|
|
(158,753) |
|
|
(189,641) |
|
|
2,566 |
|
|
(16,684) |
|
|
Current period settlements of matured derivative contracts |
|
|
123,249 |
|
|
149,801 |
|
|
4,476 |
|
|
5,209 |
|
|
29,783 |
|
|
Amortization of deferred revenue |
|
|
(2,384) |
|
|
(1,960) |
|
|
(1,154) |
|
|
(469) |
|
|
— |
|
|
(Gain) loss on sale of assets |
|
|
(14) |
|
|
3 |
|
|
(297) |
|
|
78 |
|
|
(1,162) |
|
|
(Gain) on debt extinguishment |
|
|
(99,530) |
|
|
— |
|
|
— |
|
|
— |
|
|
— |
|
|
Stand-by rig costs |
|
|
— |
|
|
4,188 |
|
|
— |
|
|
— |
|
|
— |
|
|
Financing expenses and other loan fees |
|
|
321 |
|
|
2,346 |
|
|
4,851 |
|
|
721 |
|
|
604 |
|
|
EBITDAX |
|
$ |
187,955 |
|
$ |
268,417 |
|
$ |
303,014 |
|
$ |
204,997 |
|
$ |
135,741 |
|
Adjusted Net Income and Adjusted Earnings per Share are supplemental non-GAAP financial measures that are used by management and external users of the Company’s consolidated financial statements. We define Adjusted Net Income as net income excluding the impact of certain non-cash items including gains or losses on commodity derivative instruments not yet settled, impairment of oil and gas properties, non-cash compensation expense, and the other items described below. We define Adjusted Earnings per Share as earnings per share plus that portion of the components of adjusted net income allocated to the controlling interests divided by weighted average shares outstanding. We believe adjusted net income and adjusted earnings per share are useful to investors because they provide readers with a more meaningful measure of our profitability before recording certain items for which the timing or amount cannot be reasonably determined. However, these measures are provided in addition to, not as an alternative for, and should be read in conjunction with, the information contained in our financial statements prepared in accordance with GAAP. Our computations of adjusted net income and adjusted earnings per share may not be comparable to other similarly titled measures of other companies.
53
The following table provides a reconciliation of net income (loss) as determined in accordance with GAAP to adjusted net income for the periods indicated.
|
|
|
Year Ended December 31, |
|
|||||||||||||
|
(in thousands except per share data) |
|
2016 |
|
2015 |
|
2014 |
|
2013 |
|
2012 |
|
|||||
|
Net income (loss) |
|
$ |
(84,805) |
|
$ |
(9,077) |
|
$ |
225,620 |
|
$ |
22,405 |
|
$ |
(3,079) |
|
|
Net (gain) loss on derivative contracts |
|
|
51,264 |
|
|
(158,753) |
|
|
(189,641) |
|
|
2,566 |
|
|
(16,684) |
|
|
Current period settlements of matured derivative contracts |
|
|
123,249 |
|
|
149,801 |
|
|
4,476 |
|
|
5,209 |
|
|
29,783 |
|
|
Impairment of oil and gas properties |
|
|
— |
|
|
— |
|
|
— |
|
|
— |
|
|
18,821 |
|
|
Exploration |
|
|
6,673 |
|
|
6,551 |
|
|
3,453 |
|
|
16,125 |
|
|
356 |
|
|
Non-cash stock compensation expense |
|
|
7,425 |
|
|
7,562 |
|
|
4,040 |
|
|
10,838 |
|
|
570 |
|
|
Deferred and other non-cash compensation expense |
|
|
804 |
|
|
455 |
|
|
758 |
|
|
2,719 |
|
|
— |
|
|
(Gain) on debt extinguishment |
|
|
(99,530) |
|
|
— |
|
|
— |
|
|
— |
|
|
— |
|
|
Stand-by rig costs |
|
|
— |
|
|
4,188 |
|
|
— |
|
|
— |
|
|
— |
|
|
Financing expenses |
|
|
— |
|
|
2,250 |
|
|
3,761 |
|
|
— |
|
|
— |
|
|
Change in TRA liability |
|
|
(784) |
|
|
(1,984) |
|
|
— |
|
|
— |
|
|
— |
|
|
Tax impact of adjusting items (1) |
|
|
(20,774) |
|
|
(1,106) |
|
|
16,357 |
|
|
(3,437) |
|
|
— |
|
|
Change in valuation allowance |
|
|
950 |
|
|
2,333 |
|
|
— |
|
|
— |
|
|
— |
|
|
Adjusted net income (loss) |
|
$ |
(15,528) |
|
$ |
2,220 |
|
$ |
68,824 |
|
$ |
56,425 |
|
$ |
29,767 |
|
|
Adjusted net income (loss) attributable to non-controlling interests |
|
|
(9,861) |
|
|
1,275 |
|
|
56,208 |
|
|
52,679 |
|
|
|
|
|
Adjusted net income (loss) attributable to controlling interests |
|
|
(5,667) |
|
|
945 |
|
|
12,616 |
|
|
3,746 |
|
|
|
|
|
Dividends and accretion on preferred stock |
|
|
(2,669) |
|
|
— |
|
|
— |
|
|
— |
|
|
|
|
|
Adjusted net income (loss) attributable to common shareholders |
|
$ |
(8,336) |
|
$ |
945 |
|
$ |
12,616 |
|
$ |
3,746 |
|
|
|
|
|
|
|
|
|
|
|
|
|
|
|
|
|
|
|
|
|
|
|
Earnings per share (basic and diluted) |
|
$ |
(1.13) |
|
$ |
(0.09) |
|
$ |
3.28 |
|
$ |
(0.17) |
|
|
|
|
|
Net (gain) loss on derivative contracts |
|
|
0.76 |
|
|
(2.68) |
|
|
(3.85) |
|
|
0.43 |
|
|
|
|
|
Current period settlements of matured derivative contracts |
|
|
1.67 |
|
|
2.48 |
|
|
0.09 |
|
|
(0.01) |
|
|
|
|
|
Impairment of oil and gas properties |
|
|
— |
|
|
— |
|
|
— |
|
|
— |
|
|
|
|
|
Exploration |
|
|
0.11 |
|
|
0.12 |
|
|
0.07 |
|
|
0.31 |
|
|
|
|
|
Non-cash stock compensation expense |
|
|
0.10 |
|
|
0.13 |
|
|
0.08 |
|
|
0.02 |
|
|
|
|
|
Deferred and other non-cash compensation expense |
|
|
0.01 |
|
|
0.01 |
|
|
0.02 |
|
|
— |
|
|
|
|
|
(Gain) on debt extinguishment |
|
|
(1.23) |
|
|
— |
|
|
— |
|
|
— |
|
|
|
|
|
Stand-by rig costs |
|
|
— |
|
|
0.06 |
|
|
— |
|
|
— |
|
|
|
|
|
Financing expenses |
|
|
— |
|
|
0.03 |
|
|
0.08 |
|
|
— |
|
|
|
|
|
Change in TRA liability |
|
|
(0.02) |
|
|
(0.07) |
|
|
— |
|
|
— |
|
|
|
|
|
Tax impact of adjusting items (1) |
|
|
(0.50) |
|
|
(0.04) |
|
|
1.24 |
|
|
(0.28) |
|
|
|
|
|
Change in valuation allowance |
|
|
0.02 |
|
|
0.09 |
|
|
— |
|
|
— |
|
|
|
|
|
Adjusted earnings per share (basic and diluted) |
|
$ |
(0.21) |
|
$ |
0.04 |
|
$ |
1.01 |
|
$ |
0.30 |
|
|
|
|
|
|
|
|
|
|
|
|
|
|
|
|
|
|
|
|
|
|
|
Weighted average Class A shares outstanding: |
|
|
|
|
|
|
|
|
|
|
|
|
|
|
|
|
|
Basic |
|
|
40,009 |
|
|
26,816 |
|
|
12,526 |
|
|
12,500 |
|
|
|
|
|
Diluted |
|
|
40,009 |
|
|
26,816 |
|
|
12,535 |
|
|
12,500 |
|
|
|
|
|
Effective tax rate on net income (loss) attributable to controlling interests |
|
|
35.2 |
% |
|
38.9 |
% |
|
35.7 |
% |
|
36.9 |
% |
|
|
|
|
(1) |
In arriving at adjusted net income, the tax impact of the adjustments to net income is determined by applying the appropriate tax rate to each adjustment and then allocating the tax impact between the controlling and non‑controlling interests. |
54
Item 7. Management’s Discussion and Analysis of Financial Condition and Results of Operations
The following discussion and analysis of our financial condition and results of operations should be read in conjunction with our Consolidated Financial Statements and the Notes to Consolidated Financial Statements appearing elsewhere in this Annual Report on Form 10‑K. The following discussion contains “forward‑looking statements” that are based on management’s current expectations, estimates and projections about our business and operations, and that involve risks and uncertainties. Our actual results may differ materially from those currently anticipated and expressed in such forward‑looking statements as a result of a number of factors, including those we discuss under “Risk Factors,” “Cautionary Statement Regarding Forward‑ Looking Statements” and elsewhere in this report.
Overview
We are an independent oil and gas company engaged in the exploration, development, production and acquisition of oil and natural gas properties in the mid-continent United States, spanning areas of Texas and Oklahoma. Our Chairman and CEO, Jonny Jones, founded our predecessor company in 1988 in continuation of his family’s long history in the oil and gas business, which dates back to the 1920’s. We have grown rapidly by leveraging our focus on low-cost drilling and completion methods and our horizontal drilling expertise to develop our inventory and execute several strategic acquisitions. We have accumulated extensive knowledge and experience in developing the Anadarko and Arkoma basins, having concentrated our operations in the Anadarko basin for over 25 years and applied our knowledge to the Arkoma basin since 2011. We have drilled over 840 total wells as operator, including nearly 670 horizontal wells, since our formation and delivered compelling rates of return over various commodity price cycles. Our operations are focused on horizontal drilling and completions within three distinct areas in the Texas Panhandle and Oklahoma:
|
· |
the Western Anadarko Basin—targeting the liquids rich Cleveland, Granite Wash, Tonkawa and Marmaton formations; |
|
· |
the Eastern Anadarko Basin—targeting the liquids rich Merge Woodford shale and Sycamore formations in the Merge area of the STACK/SCOOP (the “Merge”); and |
|
· |
the Arkoma Basin—targeting the Arkoma Woodford shale formation. |
We seek to optimize returns through a disciplined emphasis on controlling costs and promoting operational efficiencies, and we are recognized as one of the lowest-cost drilling and completion operators in the Cleveland and Arkoma Woodford shale formations. We believe that our low-cost drilling expertise will apply directly to our new drilling in the Merge area, which is located approximately 150 miles to the east of our Cleveland play.
As of December 31, 2016, our total estimated proved reserves were 105.2 MMBoe, of which 59% were classified as proved developed reserves. Approximately 22% of our total estimated proved reserves as of December 31, 2016 consisted of oil, 33% consisted of NGLs, and 45% consisted of natural gas.
Outlook
The markets for oil, natural gas and NGLs, historically, have been volatile. Beginning in late 2014 and continuing into 2016, the oil and natural gas industry experienced a significant decline in commodity prices. As an example, during the past six years, the NYMEX WTI oil price has ranged from a low of $26.19 per Bbl in February 2016 to a high of $113.39 per Bbl in April 2011. The NYMEX Henry Hub spot market price of gas has ranged from $7.51 per MMBtu in January 2010 to a high of $8.15 per MMBtu in February 2014 and a low of $1.49 in March 2016. Oil prices have begun to recover and stabilize and reached a closing price of $53.83 on March 1, 2017, while the Henry Hub spot market price of gas was $2.80 on the same date. However, both of these prices are significantly below the most recent highs. The price we receive for our oil, natural gas and NGLs heavily influences our revenue, profitability, liquidity, access to capital and prospects for future growth. Oil and natural gas are commodities and, therefore, their prices are subject to wide fluctuations in response to relatively minor changes in supply and demand. These markets will likely continue to be volatile in the future.
We believe that the commodity pricing environment will remain challenging for our business in 2017. However, we believe that our strong hedge position, our ability to maintain low drilling and completion costs, and our existing drilling inventory of 6,923 gross (1,659 net) drilling locations will enable us to compete for strategic acquisitions and joint development opportunities, and generate attractive economic rates of return from the development of our inventory of drilling locations.
55
The estimated mark-to-market value of our commodity price hedges in 2017 and beyond was approximately $65.1 million, incorporating strip pricing as of March 1, 2017 but excluding adjustments for credit risk. We engage in derivative risk management activities in order to reduce the risk associated with commodity price fluctuations. Commodity hedges in place for 2017 will help mitigate some of the commodity price volatility and recent declines. The following table summarizes our commodity derivative contracts outstanding as of March 1, 2017:
|
|
|
Fiscal Year Ending December 31, |
|
|||||||
|
|
|
2017 |
|
2018 |
|
2019 |
|
|||
|
Oil Hedges |
|
|
|
|
|
|
|
|
|
|
|
Swaps Sold (MBbl) |
|
|
1,898 |
|
|
2,057 |
|
|
219 |
|
|
Price ($/Bbl) |
|
$ |
65.00 |
|
$ |
61.83 |
|
$ |
64.96 |
|
|
|
|
|
|
|
|
|
|
|
|
|
|
Offset Swaps Purchased (MBbl) (1) |
|
|
— |
|
|
803 |
|
|
219 |
|
|
Price ($/Bbl) |
|
$ |
— |
|
$ |
46.83 |
|
$ |
48.57 |
|
|
|
|
|
|
|
|
|
|
|
|
|
|
Collars (MBbl) |
|
|
— |
|
|
— |
|
|
810 |
|
|
Floor ($/Bbl) |
|
$ |
— |
|
$ |
— |
|
$ |
48.52 |
|
|
Ceiling ($/Bbl) |
|
$ |
— |
|
$ |
— |
|
$ |
59.64 |
|
|
|
|
|
|
|
|
|
|
|
|
|
|
Gas Hedges |
|
|
|
|
|
|
|
|
|
|
|
Swaps Sold (MMcf) |
|
|
18,850 |
|
|
29,840 |
|
|
3,750 |
|
|
Price ($/Mcf) |
|
$ |
3.66 |
|
$ |
3.38 |
|
$ |
3.50 |
|
|
|
|
|
|
|
|
|
|
|
|
|
|
Offset Swaps Purchased (MMcf) (1) |
|
|
— |
|
|
9,900 |
|
|
3,750 |
|
|
Price ($/Mcf) |
|
$ |
— |
|
$ |
2.81 |
|
$ |
2.86 |
|
|
|
|
|
|
|
|
|
|
|
|
|
|
Collars (MMcf) |
|
|
— |
|
|
— |
|
|
11,890 |
|
|
Floor ($/Mcf) |
|
$ |
— |
|
$ |
— |
|
$ |
2.55 |
|
|
Ceiling ($/Mcf) |
|
$ |
— |
|
$ |
— |
|
$ |
3.19 |
|
|
|
|
|
|
|
|
|
|
|
|
|
|
NGL Swaps (MBbl) |
|
|
|
|
|
|
|
|
|
|
|
Ethane |
|
|
— |
|
|
— |
|
|
— |
|
|
Propane |
|
|
879 |
|
|
— |
|
|
— |
|
|
Iso Butane |
|
|
103 |
|
|
— |
|
|
— |
|
|
Butane |
|
|
264 |
|
|
— |
|
|
— |
|
|
Natural Gasoline |
|
|
332 |
|
|
— |
|
|
— |
|
|
Total NGLs (MBbl) |
|
|
1,578 |
|
|
— |
|
|
— |
|
|
|
|
|
|
|
|
|
|
|
|
|
|
NGL Swap Prices ($/Gal) |
|
|
|
|
|
|
|
|
|
|
|
Ethane |
|
$ |
— |
|
$ |
— |
|
$ |
— |
|
|
Propane |
|
$ |
0.46 |
|
$ |
— |
|
$ |
— |
|
|
Iso Butane |
|
$ |
0.63 |
|
$ |
— |
|
$ |
— |
|
|
Butane |
|
$ |
0.60 |
|
$ |
— |
|
$ |
— |
|
|
Natural Gasoline |
|
$ |
1.04 |
|
$ |
— |
|
$ |
— |
|
|
(1) |
Swaps purchased to effectively realize a $44.5 million gain. |
Sustained downward pressure on commodity prices has adverse effects on our business and financial position. Our ability to access capital markets may be restricted, which could have an impact on our flexibility to react to changing economic and business conditions. Further, the global oversupply situation could have an adverse impact on our business partners, customers and lenders, potentially causing them to fail to meet their obligations to us.
The amount of our proved reserves, as estimated based on SEC pricing and definitions, was 105.2 MMBoe as of December 31, 2016, of which 59% were classified as proved developed reserves. This increase of 3.4%, from 101.7 MMBoe as of December 31, 2015, was primarily due to our acquisition activity during 2016.
The Company reviews its proved oil and gas properties for impairment purposes by comparing the expected undiscounted future cash flows at a producing field level to the unamortized capitalized cost of the asset.
56
Periodic revisions to the estimated reserves and related future cash flows may be necessary as a result of a number of factors, including changes in oil and natural gas prices, reservoir performance, new drilling and completion, purchases, sales and terminations of leases, drilling and operating cost changes, technological advances, new geological or geophysical data or other economic factors. All of these factors are inherently estimates and are inter‑dependent. While each variable carries its own degree of uncertainty, some factors, such as oil and natural gas prices, have historically been highly volatile and may be highly volatile in the future. This high degree of volatility causes a high degree of uncertainty associated with the estimation of reserve quantities and estimated future cash flows. Therefore, future results are highly uncertain and subject to potentially significant revisions. Accordingly, reserve estimates are generally different from the quantities of oil and natural gas that are ultimately recovered. We cannot predict the amounts or timing of future reserve revisions, as such revisions could be negatively impacted by:
|
· |
Declines in commodity prices or actual realized prices below those assumed for future years; |
|
· |
Increases in service costs; |
|
· |
Increases in future global or regional production or decreases in demand; |
|
· |
Increases in operating costs; |
|
· |
Reductions in availability of drilling, completion, or other equipment. |
If such revisions are significant, they could significantly affect future amortization of capitalized costs and result in an impairment of assets that may be material. Any future impairments are difficult to predict, and although it is not reasonably practicable to quantify the impact of any future impairments at this time, such impairments may be significant.
During 2016, JEH generated taxable income, resulting in the payment during 2016 of $17.3 million in cash tax distributions to JEH unitholders (other than us). As a result of JEH’s 2016 taxable income (all of which is passed-through and taxed to us and JEH’s other unitholders), we anticipate that, in 2017 JEH will make further tax distributions to JEH unitholders (other than us) of $0.6 million. Based on our initial 2017 operating budget and information available as of this filing, we do not anticipate that we will be required to make any additional tax payments or that JEH will make any additional tax distributions during 2017.
During 2016, JEH paid cash tax distributions to us of $23.7 million and will make an anticipated $1.1 million additional tax distribution payment to us in 2017. As a result of JEH’s 2016 taxable income (all of which is passed-through and taxed to us and JEH’s other unitholders), we anticipate that, in 2017, we will be required to make further income tax payments to federal and state taxing authorities of $4.0 million. To the extent that cash tax distributions from JEH to us during 2016 and 2017 exceed the amount required to pay taxes and make payments under the tax receivable agreement, such excess cash will be used to acquire additional JEH Units. On March 3, 2017, the Company announced that $17.5 million of prior tax distributions will be used to purchase additional JEH Units at a per unit price determined by reference to the volume weighted average price per share of the Class A common stock during the five trading days ended February 28, 2017. In conjunction with the purchase of additional JEH Units, on March 31, 2017 the Company will pay a stock dividend of 0.087423 shares of its Class A common stock for each then outstanding share of Class A common stock as of the applicable record date. See Note 16, “Subsequent Events,” in the Notes to Consolidated Financial Statements for further discussion.
As a result of taxable income allocated to us from JEH in 2016, we estimate that we will make a payment of a portion of the TRA liability during 2018 of $0.6 million.
Our 2016 capital expenditures totaled $268.8 million excluding the impact of asset retirement costs, of which $72.2 million was utilized to drill and complete operated wells and $163.0 million was related to acquisition activity. We currently plan to invest approximately $275.0 million in total capital expenditures in 2017, with the majority dedicated to drilling and completion activities. We will continue to monitor market conditions and may decide, at a later date, to spend more or less capital for a variety of reasons. Please see “Liquidity and Capital Resources.” All drilling locations classified as proved undeveloped reserves in the year‑end reserve report are scheduled to be drilled within five years of initial proved reserve booking.
57
Basis of Presentation
We consider and report all of our operations as one segment.
Sources of our revenues
We derive our revenue from the production and sale of oil, natural gas and NGLs. Our revenues are a function of oil, natural gas, and NGL production volumes sold and average sales prices received for those volumes. We recognize revenues when the product is delivered at a fixed or determinable price, title has transferred, and collectability is reasonably assured. Our revenues do not include the effects of our hedging activities and may vary substantially from period to period as a result of changes in production volumes or commodity prices.
Hedging
Due to the inherent volatility in oil and gas prices, we use commodity derivative instruments such as swaps to hedge price risk associated with a significant portion of our anticipated oil, natural gas and NGL production. These instruments allow us to reduce, but not eliminate, the potential effects of variability in cash flow from operations due to fluctuations in commodity prices. The instruments provide only partial protection against declines in oil and gas prices, and may limit our potential gains from future increases in prices. None of these instruments are used for trading purposes. We do not speculate on commodity prices but rather attempt to hedge physical production by individual hydrocarbon product in order to protect returns. The only counterparties to our derivatives are lenders under the Revolver, and our hedge positions are generally reviewed on a monthly basis. We have not designated any of our derivative contracts as fair value or cash flow hedges. The changes in fair value of the contracts are included in net income. We record such derivative instruments as assets or liabilities in the balance sheet. During the year ended December 31, 2016, 84% of our total production for oil, natural gas and NGLs was hedged. As of December 31, 2016, approximately 48% of our total forecasted production from proved reserves through 2018 was hedged, and the market value of our hedge position was $43.0 million. We do not anticipate any substantial changes in our hedging policy.
58
Our open positions as of December 31, 2016 were as follows:
|
|
|
Year Ending December 31, |
|
|
||||||||||||
|
|
|
2017 |
|
2018 |
|
2019 |
|
2020 |
|
2021 |
|
|||||
|
Oil positions (1): |
|
|
|
|
|
|
|
|
|
|
|
|
|
|
|
|
|
Sold swaps: |
|
|
|
|
|
|
|
|
|
|
|
|
|
|
|
|
|
Hedged volume (MBbl) |
|
|
1,639 |
|
|
1,817 |
|
|
219 |
|
|
— |
|
|
— |
|
|
Weighted average price ($/Bbl) |
|
$ |
66.30 |
|
$ |
62.84 |
|
$ |
64.96 |
|
$ |
— |
|
$ |
— |
|
|
Bought swaps: |
|
|
|
|
|
|
|
|
|
|
|
|
|
|
|
|
|
Hedged volume (MBbl) |
|
|
36 |
|
|
803 |
|
|
219 |
|
|
— |
|
|
— |
|
|
Weighted average price ($/Bbl) |
|
$ |
42.00 |
|
$ |
46.83 |
|
$ |
48.57 |
|
$ |
— |
|
$ |
— |
|
|
Natural gas positions (2): |
|
|
|
|
|
|
|
|
|
|
|
|
|
|
|
|
|
Sold swaps: |
|
|
|
|
|
|
|
|
|
|
|
|
|
|
|
|
|
Hedged volume (MMcf) |
|
|
16,780 |
|
|
23,840 |
|
|
3,750 |
|
|
— |
|
|
— |
|
|
Weighted average price ($/Mcf) |
|
$ |
3.92 |
|
$ |
3.49 |
|
$ |
3.50 |
|
$ |
— |
|
$ |
— |
|
|
Bought swaps: |
|
|
|
|
|
|
|
|
|
|
|
|
|
|
|
|
|
Hedged volume (MMcf) |
|
|
— |
|
|
9,900 |
|
|
3,750 |
|
|
— |
|
|
— |
|
|
Weighted average price ($/Mcf) |
|
$ |
— |
|
$ |
2.81 |
|
$ |
2.86 |
|
$ |
— |
|
$ |
— |
|
|
NGL positions (3): |
|
|
|
|
|
|
|
|
|
|
|
|
|
|
|
|
|
Swaps: |
|
|
|
|
|
|
|
|
|
|
|
|
|
|
|
|
|
Hedged volume (MBbl) |
|
|
1,378 |
|
|
— |
|
|
— |
|
|
— |
|
|
— |
|
|
Weighted average price ($/gal) |
|
$ |
0.59 |
|
$ |
— |
|
$ |
— |
|
$ |
— |
|
$ |
— |
|
|
Natural Gas Basis positions (4): |
|
|
|
|
|
|
|
|
|
|
|
|
|
|
|
|
|
Swaps: |
|
|
|
|
|
|
|
|
|
|
|
|
|
|
|
|
|
Hedged volume (MMcf) |
|
|
— |
|
|
— |
|
|
— |
|
|
— |
|
|
— |
|
|
Weighted average price ($/Mcf) |
|
$ |
— |
|
$ |
— |
|
$ |
— |
|
$ |
— |
|
$ |
— |
|
|
(1) |
The oil derivatives are settled based on the month’s average daily NYMEX price of West Texas Intermediate Light Sweet Crude. |
|
(2) |
The natural gas derivatives are settled based on the NYMEX natural gas futures price for the calculation period. |
|
(3) |
The NGL derivatives are settled based on the month’s average daily price of Mont Belvieu and Conway ethane, propane, isobutane, butane and natural gasoline. |
|
(4) |
The basis swap derivatives are settled based on the differential between the NYMEX natural gas futures price and the ANR Pipeline Co. Oklahoma price, the CenterPoint Energy Gas Transmission Co. East price, the Natural Gas Pipeline Co. of America Texok zone price, the Northern Natural Gas Co. demarcation price or the Panhandle Eastern Pipe Line Co. Texas/Oklahoma price. |
Principal components of our cost structure
Lease operating expenses. These are daily costs incurred to bring oil and natural gas out of the ground and to the market, together with the daily costs incurred to maintain our producing properties. Such costs also include maintenance, repairs and workover expenses related to our oil and gas properties. Lease operating expenses include both a portion of costs that are fixed in nature, such as infrastructure costs, as well as variable costs resulting from additional well maintenance and production enhancements. As production increases, our average lease operating expense per barrel of oil equivalent is typically reduced because fixed costs do not increase proportionately with production.
Exploration. Exploration expense consists of geological and geophysical costs, seismic costs, amortization of unproved leasehold costs, and the costs to drill exploratory wells that do not find proved reserves.
Depreciation, depletion and amortization. Under the successful efforts accounting method that we employ, we capitalize all costs associated with our acquisition, successful exploration, and all development efforts within cost centers classified by producing field. We then systematically expense the costs in each field on a units‑of‑production basis based on proved oil and natural gas reserve quantities. We calculate depletion on (i) all capitalized costs, other than the cost of investments in unproved properties and major development projects for which proved reserves cannot yet be assigned, less accumulated amortization; and (ii) the estimated plugging and abandonment costs, net of estimated
59
salvage values. We calculate depreciation on the cost of fixed assets related to our well equipment and other fixed assets over the estimated useful lives.
Impairment of oil and gas properties. This is the cost to reduce the carrying value of each field of proved and unproved oil and gas properties to no more than the fair value of the particular field for which impairment recognition is required. We assess our unproved properties periodically for impairment on a property‑by‑property basis based on remaining lease terms, drilling results or future plans to develop acreage.
Accretion of ARO liability. Accretion of ARO liabilities are related to our obligation for retirement of oil and gas wells and facilities. We record these liabilities when we place the assets in service, using discounted present values of the estimated future obligation. We then record accretion of the liabilities as they approach maturity.
General and administrative. These are costs incurred for overhead, including payroll and benefits for our corporate staff, costs of maintaining our headquarters, costs of managing our production and development operations, audit and other fees for professional services and legal compliance.
Interest. The primary component of this line item is the interest paid to lenders. We finance a portion of our working capital requirements and capital expenditures with borrowings under our senior secured revolving credit facility and senior notes. We incur interest expense that is affected by both fluctuations in interest rates and our financing decisions.
60
Results of Operations
The following table summarizes our revenues, expenses and production data for the periods indicated.
|
(in thousands of dollars except for |
|
Year Ended December 31, |
|
||||||||||||||||
|
production, sales price and average cost data) |
|
2016 |
|
2015 |
|
Change |
|
2015 |
|
2014 |
|
Change |
|
||||||
|
Revenues: |
|
|
|
|
|
|
|
|
|
|
|
|
|
|
|
|
|
|
|
|
Oil |
|
$ |
63,736 |
|
$ |
114,029 |
|
$ |
(50,293) |
|
$ |
114,029 |
|
$ |
220,090 |
|
$ |
(106,061) |
|
|
Natural gas |
|
|
31,434 |
|
|
45,558 |
|
|
(14,124) |
|
|
45,558 |
|
|
82,947 |
|
|
(37,389) |
|
|
NGLs |
|
|
29,707 |
|
|
34,968 |
|
|
(5,261) |
|
|
34,968 |
|
|
75,364 |
|
|
(40,396) |
|
|
Total oil and gas |
|
|
124,877 |
|
|
194,555 |
|
|
(69,678) |
|
|
194,555 |
|
|
378,401 |
|
|
(183,846) |
|
|
Other |
|
|
2,970 |
|
|
2,844 |
|
|
126 |
|
|
2,844 |
|
|
2,196 |
|
|
648 |
|
|
Total operating revenues |
|
|
127,847 |
|
|
197,399 |
|
|
(69,552) |
|
|
197,399 |
|
|
380,597 |
|
|
(183,198) |
|
|
Costs and expenses: |
|
|
|
|
|
|
|
|
|
|
|
|
|
|
|
|
|
|
|
|
Lease operating |
|
|
32,640 |
|
|
41,027 |
|
|
(8,387) |
|
|
41,027 |
|
|
37,760 |
|
|
3,267 |
|
|
Production and ad valorem taxes |
|
|
7,768 |
|
|
12,130 |
|
|
(4,362) |
|
|
12,130 |
|
|
22,556 |
|
|
(10,426) |
|
|
Exploration |
|
|
6,673 |
|
|
6,551 |
|
|
122 |
|
|
6,551 |
|
|
3,453 |
|
|
3,098 |
|
|
Depletion, depreciation and amortization |
|
|
153,930 |
|
|
205,498 |
|
|
(51,568) |
|
|
205,498 |
|
|
181,669 |
|
|
23,829 |
|
|
Accretion of ARO liability |
|
|
1,263 |
|
|
1,087 |
|
|
176 |
|
|
1,087 |
|
|
770 |
|
|
317 |
|
|
General and administrative |
|
|
29,640 |
|
|
33,388 |
|
|
(3,748) |
|
|
33,388 |
|
|
25,763 |
|
|
7,625 |
|
|
Other operating |
|
|
199 |
|
|
4,188 |
|
|
(3,989) |
|
|
4,188 |
|
|
— |
|
|
4,188 |
|
|
Total costs and expenses |
|
|
232,113 |
|
|
303,869 |
|
|
(71,756) |
|
|
303,869 |
|
|
271,971 |
|
|
31,898 |
|
|
Operating income (loss) |
|
|
(104,266) |
|
|
(106,470) |
|
|
2,204 |
|
|
(106,470) |
|
|
108,626 |
|
|
(215,096) |
|
|
Other income (expenses): |
|
|
|
|
|
|
|
|
|
|
|
|
|
|
|
|
|
|
|
|
Interest expense |
|
|
(53,127) |
|
|
(64,458) |
|
|
11,331 |
|
|
(64,458) |
|
|
(41,875) |
|
|
(22,583) |
|
|
Gain on debt extinguishment |
|
|
99,530 |
|
|
— |
|
|
99,530 |
|
|
— |
|
|
— |
|
|
— |
|
|
Net gain (loss) on commodity derivatives |
|
|
(51,264) |
|
|
158,753 |
|
|
(210,017) |
|
|
158,753 |
|
|
189,641 |
|
|
(30,888) |
|
|
Other income/(expense) |
|
|
536 |
|
|
317 |
|
|
219 |
|
|
317 |
|
|
(4,554) |
|
|
4,871 |
|
|
Total other income (expense) |
|
|
(4,325) |
|
|
94,612 |
|
|
(98,937) |
|
|
94,612 |
|
|
143,212 |
|
|
(48,600) |
|
|
Income (loss) before income tax |
|
|
(108,591) |
|
|
(11,858) |
|
|
(96,733) |
|
|
(11,858) |
|
|
251,838 |
|
|
(263,696) |
|
|
Income tax provision (benefit) |
|
|
(23,786) |
|
|
(2,781) |
|
|
(21,005) |
|
|
(2,781) |
|
|
26,218 |
|
|
(28,999) |
|
|
Net income (loss) |
|
|
(84,805) |
|
|
(9,077) |
|
|
(75,728) |
|
|
(9,077) |
|
|
225,620 |
|
|
(234,697) |
|
|
Net income (loss) attributable to non-controlling interests |
|
|
(42,253) |
|
|
(6,696) |
|
|
(35,557) |
|
|
(6,696) |
|
|
184,484 |
|
|
(191,180) |
|
|
Net income (loss) attributable to controlling interests |
|
$ |
(42,552) |
|
$ |
(2,381) |
|
$ |
(40,171) |
|
$ |
(2,381) |
|
$ |
41,136 |
|
$ |
(43,517) |
|
|
Dividends and accretion on preferred stock |
|
|
(2,669) |
|
|
— |
|
|
(2,669) |
|
|
— |
|
|
— |
|
|
— |
|
|
Net income (loss) attributable to common shareholders |
|
$ |
(45,221) |
|
$ |
(2,381) |
|
$ |
(42,840) |
|
$ |
(2,381) |
|
$ |
41,136 |
|
$ |
(43,517) |
|
|
|
|
|
|
|
|
|
|
|
|
|
|
|
|
|
|
|
|
|
|
|
Net production volumes: |
|
|
|
|
|
|
|
|
|
|
|
|
|
|
|
|
|
|
|
|
Oil (MBbls) |
|
|
1,685 |
|
|
2,583 |
|
|
(898) |
|
|
2,583 |
|
|
2,475 |
|
|
108 |
|
|
Natural gas (MMcf) |
|
|
18,842 |
|
|
23,839 |
|
|
(4,997) |
|
|
23,839 |
|
|
21,922 |
|
|
1,917 |
|
|
NGLs (MBbls) |
|
|
2,204 |
|
|
2,618 |
|
|
(414) |
|
|
2,618 |
|
|
2,345 |
|
|
273 |
|
|
Total (MBoe) |
|
|
7,029 |
|
|
9,174 |
|
|
(2,145) |
|
|
9,174 |
|
|
8,474 |
|
|
700 |
|
|
Average net (Boe/d) |
|
|
19,205 |
|
|
25,134 |
|
|
(5,929) |
|
|
25,134 |
|
|
23,216 |
|
|
1,918 |
|
|
Average sales price, unhedged: |
|
|
|
|
|
|
|
|
|
|
|
|
|
|
|
|
|
|
|
|
Oil (per Bbl), unhedged |
|
$ |
37.83 |
|
$ |
44.15 |
|
$ |
(6.32) |
|
$ |
44.15 |
|
|
88.93 |
|
|
(44.78) |
|
|
Natural gas (per Mcf), unhedged |
|
|
1.67 |
|
|
1.91 |
|
|
(0.24) |
|
|
1.91 |
|
|
3.78 |
|
|
(1.87) |
|
|
NGLs (per Bbl), unhedged |
|
|
13.48 |
|
|
13.36 |
|
|
0.12 |
|
|
13.36 |
|
|
32.14 |
|
|
(18.78) |
|
|
Combined (per Boe), unhedged |
|
|
17.77 |
|
|
21.21 |
|
|
(3.44) |
|
|
21.21 |
|
|
44.65 |
|
|
(23.44) |
|
|
Average sales price, hedged: |
|
|
|
|
|
|
|
|
|
|
|
|
|
|
|
|
|
|
|
|
Oil (per Bbl), hedged |
|
$ |
84.71 |
|
$ |
76.35 |
|
$ |
8.36 |
|
$ |
76.35 |
|
|
88.16 |
|
|
(11.81) |
|
|
Natural gas (per Mcf), hedged |
|
|
3.45 |
|
|
3.35 |
|
|
0.10 |
|
|
3.35 |
|
|
4.02 |
|
|
(0.67) |
|
|
NGLs (per Bbl), hedged |
|
|
17.25 |
|
|
25.73 |
|
|
(8.48) |
|
|
25.73 |
|
|
32.60 |
|
|
(6.87) |
|
|
Combined (per Boe), hedged |
|
|
34.96 |
|
|
37.54 |
|
|
(2.58) |
|
|
37.54 |
|
|
45.18 |
|
|
(7.64) |
|
|
Average costs (per BOE): |
|
|
|
|
|
|
|
|
|
|
|
|
|
|
|
|
|
|
|
|
Lease operating |
|
$ |
4.64 |
|
$ |
4.47 |
|
$ |
0.17 |
|
$ |
4.47 |
|
|
4.46 |
|
|
0.01 |
|
|
Production and ad valorem taxes |
|
|
1.11 |
|
|
1.32 |
|
|
(0.21) |
|
|
1.32 |
|
|
2.66 |
|
|
(1.34) |
|
|
Depletion, depreciation and amortization |
|
|
21.90 |
|
|
22.40 |
|
|
(0.50) |
|
|
22.40 |
|
|
21.44 |
|
|
0.96 |
|
|
General and administrative |
|
|
4.22 |
|
|
3.64 |
|
|
0.58 |
|
|
3.64 |
|
|
3.04 |
|
|
0.60 |
|
61
Results of Operations—Year ended December 31, 2016 as compared to year ended December 31, 2015
Operating revenues
Oil and gas sales. Oil and gas sales decreased by $69.7 million, or 35.8%, to $124.9 million for the year ended December 31, 2016, as compared to $194.6 million for the year ended December 31, 2015. The decrease was attributable to decreased production volumes ($47.9 million), as well as the decline in commodity prices ($21.8 million). The decrease in production volumes was driven by the temporary suspension of our drilling program, beginning in the fourth quarter of 2015 and continuing into early 2016. The average realized oil price, excluding the effects of commodity derivative instruments, decreased from $44.15 per Bbl to $37.83 per Bbl, or 14.3%, year over year. The average realized natural gas price, excluding the effects of commodity derivative instruments, decreased from $1.91 per Mcf to $1.67 per Mcf, or 12.6%, year over year. The average realized natural gas liquids price, excluding the effects of commodity derivative instruments, increased from $13.36 per Bbl to $13.48 per Bbl, or 0.9%, year over year. Average daily production decreased 23.6% to 19,205 Boe per day for the year ended December 31, 2016 as compared to 25,134 Boe per day for the year ended December 31, 2015.
Costs and expenses
Lease operating. Lease operating expense decreased by $8.4 million, or 20.5%, to $32.6 million for the year ended December 31, 2016, as compared to $41.0 million for the year ended December 31, 2015. The decrease was principally attributable to reduction in post-completion costs driven by a temporary suspension of the drilling program, operational focus on reducing recurring operating expenses, such as optimizing the usage of compressors and rental equipment, and vendor price reductions. Due to the year-over-year decline in production volumes, lease operating expense increased on a per unit basis by $0.17 per Boe or 3.8%, from $4.47 for the year ended December 31, 2015 to $4.64 per Boe, as compared to the year ended December 31, 2016.
Production and ad valorem taxes. Production and ad valorem taxes decreased by $4.3 million, or 35.5%, to $7.8 million for the year ended December 31, 2016, as compared to $12.1 million for the year ended December 31, 2015. The decrease was driven by a $2.6 million (30.6%) reduction in production taxes, which decreased in conjunction with the 35.8% decrease in oil and gas revenue. Production tax rates vary between states, products, and production levels; therefore, the overall blended rate is impacted by numerous factors and the mix of producing wells at any given time. Additionally, estimated ad valorem taxes decreased $1.7 million from $3.6 million for the year ended December 31, 2015 to $1.9 million for the year ended December 31, 2016, reflecting lower property assessments due to lower commodity prices. The average effective rate excluding the impact of ad valorem taxes increased from 4.4% for the year ended December 31, 2015 to 4.7% for the year ended December 31, 2016.
Exploration. Exploration expense increased from $6.6 million for the year ended December 31, 2015 to $6.7 million for the year ended December 31, 2016. The Company recognized charges for lease abandonment of $6.3 million during 2016, as compared to $5.3 million during 2015, relating to certain leases that the Company decided during the respective year not to develop. The remaining spending during 2016 primarily related to geological data and seismic processing associated with unproved acreage. No exploratory wells resulted in exploration expense during either year.
Depreciation, depletion and amortization. Depreciation, depletion and amortization decreased by $51.6 million, or 25.1%, to $153.9 million for the year ended December 31, 2016, as compared to $205.5 million for the year ended December 31, 2015. The decrease was primarily the result of lower production caused by a reduction in capital spending driven by a temporary suspension of the drilling program. On a per unit basis, depletion expense decreased $0.50 per Boe, or 2.2%, to $21.90 per Boe for the year ended December 31, 2016 as compared to $22.40 per Boe for the year ended December 31, 2015.
General and administrative. General and administrative expenses decreased by $3.8 million, or 11.4%, to $29.6 million for the year ended December 31, 2016, as compared to $33.4 million for the year ended December 31, 2015. The decrease in general and administrative expense was primarily attributable to staff and other cost reductions. Non-cash compensation expense increased $0.2 million from $8.0 million for the year ended December 31, 2015 to $8.2 million for the year ended December 31, 2016. On a per unit basis, general and administrative expenses, excluding non-cash items, increased from $2.77 per Boe for the year ended December 31, 2015 to $3.05 per Boe for the year ended December 31, 2016.
62
Other operating expense. Other operating expense decreased from $4.2 million for the year ended December 31, 2015 to $0.2 million for the year ended December 31, 2016. Expense for the year ended December 31, 2015 represents stand-by rig costs associated with the early termination of drilling rig contracts. There were no similar charges during 2016.
Interest expense. Interest expense decreased by $11.4 million, or 17.7%, to $53.1 million for the year ended December 31, 2016, as compared to $64.5 million for the year ended December 31, 2015. The decrease was driven by a reduction in the outstanding balance of the 2022 Notes and the 2023 Notes as a result of our debt extinguishments. During the year ended December 31, 2016, borrowings under the Revolver, the 2022 Notes and the 2023 Notes bore interest at a weighted average rate of 2.40%, 6.75% and 9.25%, respectively. Average outstanding balances for the year ended December 31, 2016 were $172.3 million, $420.3 million and $166.4 million under the Revolver, the 2022 Notes and the 2023 Notes, respectively.
Gain on debt extinguishment. The gain on debt extinguishment of $99.5 million for the year ended December 31, 2016 was related to the purchase of an aggregate principal amount of $190.9 million of our senior unsecured notes for cash of $84.6 million. The company recognized accelerated amortization of debt issuance costs of $6.7 million associated with the cancellation. See Note 5, “Long-Term Debt,” for further details regarding the debt extinguishment. There were no similar gains during 2015.
Net gain (loss) on commodity derivatives. The net gain (loss) on commodity derivatives was a net loss of $51.3 million for the year ended December 31, 2016, as compared to a net gain of $158.8 million for the year ended December 31, 2015. The loss was driven by higher average crude oil and natural gas prices ($43.29 per barrel and $2.52 per Mcf, respectively) for the year ended December 31, 2016, as compared to the crude oil and natural gas prices as of December 31, 2015 ($37.13 per barrel and $2.28 per Mcf, respectively), as well as additional hedging activity during 2016.
Income taxes. The provision for federal and state income taxes for the year ended December 31, 2016 was a benefit of $23.8 million resulting in a 21.9% effective tax rate as a percentage of our pre-tax book income, as compared to a benefit of $2.8 million with a 23.5% effective tax rate as a percentage of our pre-tax book income for the year ended December 31, 2015. Our effective tax rate is based on the statutory rate applicable to the U.S. and the blended rate of the states in which we conduct business and is adjusted from the enacted rates for the share of net income allocated to the non-controlling interest. The change in effective tax rate was primarily due to the percentage of income allocated to the non-controlling interest and the impact of a change in enacted state tax rate during the year ended December 31, 2015. See Note 11, “Income Taxes,” for further details.
Results of Operations—Year ended December 31, 2015 as compared to year ended December 31, 2014
Operating revenues
Oil and gas sales. Oil and gas sales decreased by $183.8 million, or 48.6%, to $194.6 million for the year ended December 31, 2015, as compared to $378.4 million for the year ended December 31, 2014. The decrease was attributable to the decline in commodity prices ($195.9 million), partially offset by increased production volumes ($12.1 million). The average realized oil price, excluding the effects of commodity derivative instruments, decreased from $88.93 per Bbl to $44.15 per Bbl, or 50.4%, year over year. The average realized natural gas price, excluding the effects of commodity derivative instruments, decreased from $3.78 per Mcf to $1.91 per Mcf, or 49.5%, year over year. The average realized natural gas liquids price, excluding the effects of commodity derivative instruments, decreased from $32.14 per Bbl to $13.36 per Bbl, or 58.4%, year over year. Average daily production increased 8.3% to 25,134 Boe per day for the year ended December 31, 2015 as compared to 23,216 Boe per day for the year ended December 31, 2014. Crude oil production increased 4.4% from 2,475 MBbls for the year ended December 31, 2014 to 2,583 MBbls for the year ended December 31, 2015. Natural gas production increased 8.7% from 21,922 MMcf for the year ended December 31, 2014 to 23,839 MMcf for the year ended December 31, 2015. The increase in production was driven by the year‑over‑year increase in producing wells due to continued drilling activity through the third quarter, as well as changes in completion techniques.
Costs and expenses
Lease operating. Lease operating expense increased by $3.2 million, or 8.5%, to $41.0 million for the year ended December 31, 2015, as compared to $37.8 million for the year ended December 31, 2014. The increase occurred primarily in correlation with the 8.3% increase in production volumes and number of producing wells. On a per unit
63
basis, lease operating expense increased by $0.01 per Boe or 0.2%, from $4.46 for the year ended December 31, 2014 to $4.47 per Boe, as compared to the year ended December 31, 2015.
Production and ad valorem taxes. Production and ad valorem taxes decreased by $10.5 million, or 46.5%, to $12.1 million for the year ended December 31, 2015, as compared to $22.6 million for the year ended December 31, 2014. Overall production and ad valorem taxes decreased in conjunction with the 48.6% decrease in oil and gas revenue. Estimated ad valorem taxes accounted for $2.5 million of the decrease from $6.1 million for the year ended December 31, 2014 to $3.6 million for the year ended December 31, 2015, reflecting lower property assessments due to lower commodity prices. The average effective rate excluding the impact of ad valorem taxes remained consistent at 4.4% for the years ended December 31, 2014 and 2015. Production tax rates vary between states, products, and production levels; therefore, the overall blended rate is impacted by numerous factors and the mix of producing wells at any given time.
Exploration. Exploration expense increased from $3.5 million for the year ended December 31, 2014 to $6.6 million for the year ended December 31, 2015. In 2015, the Company recognized charges for lease abandonment of $5.3 million relating to certain leases that the Company does not plan to develop. In 2014, the Company recognized the drilling cost of $3.0 million associated with an unsuccessful exploratory well. The remaining spend during 2015 primarily related to geological data and seismic processing associated with unproved acreage.
Depreciation, depletion and amortization. Depreciation, depletion and amortization increased by $23.8 million, or 13.1%, to $205.5 million for the year ended December 31, 2015, as compared to $181.7 million for the year ended December 31, 2014. The increase was primarily the result of continued drilling activity. On a per unit basis, depletion expense increased $0.96 per Boe or 4.5% to $22.40 per Boe for the year ended December 31, 2015 as compared to $21.44 per Boe for the year ended December 31, 2014.
General and administrative. General and administrative expenses increased by $7.6 million, or 29.5%, to $33.4 million for the year ended December 31, 2015, as compared to $25.8 million for the year ended December 31, 2014. Contributing to the change was an increase of $3.2 million related to non‑cash compensation expense. Excluding these non‑cash compensation items, general and administrative expenses increased $4.4 million (21.0%) to $25.4 million for the year ended December 31, 2015, as compared to $21.0 million for the year ended December 31, 2014. The increase in cash general and administrative expense was primarily attributable to a 12% increase in headcount year‑over‑year. The remainder of the increase was primarily attributable to increases in professional fees including higher accounting, legal and other fees associated with the Company’s financing activities and status as a new public entity. On a per unit basis, cash general and administrative expenses increased from $2.47 per Boe for the year ended December 31, 2014 to $2.77 per Boe for the year ended December 31, 2015.
Other operating expense. Other operating expense of $4.2 million for the year ended December 31, 2015 represents stand‑by rig costs associated with the charges assessed on early termination of drilling rig contracts. This is a non‑recurring charge for which all costs have been recognized as of December 31, 2015.
Interest expense. Interest expense increased by $22.6 million, or 53.9%, to $64.5 million for the year ended December 31, 2015, as compared to $41.9 million for the year ended December 31, 2014. The increase was driven by the issuance of the 2022 Notes and 2023 Notes on April 1, 2014 and February 23, 2015, respectively. During the year ended December 31, 2015, borrowings under the Revolver, the 2022 Notes and the 2023 Notes bore interest at a weighted average rate of 2.39%, 6.75% and 9.25%, respectively. Average outstanding balances for the year ended December 31, 2015 were $144.9 million, $500.0 million and $213.7 million under the Revolver, the 2022 Notes and the 2023 Notes, respectively.
Net gain (loss) on commodity derivatives. The net gain (loss) on commodity derivatives was a net gain of $158.8 million for the year ended December 31, 2015, as compared to a net gain of $189.6 million for the year ended December 31, 2014. The gain was driven by lower average crude oil and natural gas prices ($48.66 per barrel and $2.62 per Mcf, respectively) for the year ended December 31, 2015, as compared to the crude oil and natural gas prices as of December 31, 2014 ($53.45 per barrel and $3.14 per Mcf, respectively) as well as additional hedging activity during 2015.
Other income (expense). Other income (expense) for the year ended December 31, 2015 was a net income of $0.3 million. Other income (expense) for the year ended December 31, 2015 primarily related to financing costs resulting in expenses of $5.5 million, partially offset by the recognition of income associated with the establishment of a
64
$2.0 million valuation allowance associated with the TRA and by the receipt of a $0.7 million distribution of dividend income from our investment in Monarch Natural Gas Holdings, LLC.
Income taxes. The provision for federal and state income taxes for the year ended December 31, 2015 was a benefit of $2.8 million as compared to an expense of $26.2 million for the year ended December 31, 2014. Our effective tax rate is based on the statutory rate applicable to the U.S. and the blended rate of the states in which we conduct business and is adjusted from the enacted rates for the share of net income allocated to the non‑controlling interest.
Liquidity and Capital Resources
Historically, our primary sources of liquidity have been private and public sales of our debt and equity, borrowings under bank credit facilities and cash flows from operations. Our primary use of capital has been for the exploration, development and acquisition of oil and gas properties. As we pursue reserves and production growth, we continually consider which capital resources, including equity and debt financings, are available to meet our future financial obligations, planned capital expenditure activities and liquidity requirements. Our ability to grow proved reserves and production will be highly dependent on the capital resources available to us. We strive to maintain financial flexibility in order to maintain substantial borrowing capacity under our Revolver (as defined below), facilitate drilling on our undeveloped acreage positions and permit us to selectively expand our acreage positions. Depending on the profitability, timing and concentration of the development of our non-proved locations, we may be required to generate or raise significant amounts of capital to develop all of our potential drilling locations should we endeavor to do so. In the event our profitability or cash flows are materially less than anticipated and other sources of capital we historically have utilized are not available on acceptable terms, we may curtail our capital spending. Our balance sheet at December 31, 2016 reflects a negative working capital balance. We have historically and in the future expect to maintain a negative working capital balance, and we use our Revolver to help manage our working capital.
Availability under the Revolver is subject to a borrowing base, as well as financial covenants. Our borrowing base at December 31, 2016 was $425.0 million of which $178.0 million was utilized leaving an unused capacity of $247.0 million. The borrowing base will be re-determined at least semi-annually on or about April 1 and October 1 of each year, with such re-determination based primarily on reserve reports using lender commodity price expectations at such time. Any reduction in the borrowing base will reduce our liquidity, and, if the reduction results in the outstanding amount under our Revolver exceeding the borrowing base, we will be required to repay the deficiency within a short period of time. The financial covenants can further constrain our ability to borrow under our Revolver.
The Company routinely enters into oil and natural gas swap contracts as seller, thus resulting in a fixed price. In early 2016, the Company realized certain mark-to-market gains associated with oil and natural gas hedges the Company had in place for years 2018 and 2019. The gains were effectively realized by purchasing, as opposed to selling, oil and natural gas swap contracts for the equal volume that was associated with the initial hedge transaction. Based on current contract terms, the gains will be recognized as the hedge contracts mature in 2018 and 2019. The estimated mark-to-market value of the Company’s realized gains as a result of these offsetting hedges were approximately $38.5 million and $6.0 million relating to the years ended December 31, 2018 and December 31, 2019, respectively, incorporating strip pricing as of March 1, 2017, but excluding adjustments for credit risk.
On May 24, 2016, the Company and Jones Energy Holdings, LLC entered into an Equity Distribution Agreement with Citigroup Global Markets Inc. and Wells Fargo Securities, LLC (each, a “Manager” and collectively, the “Managers”). Pursuant to the terms of the Equity Distribution Agreement, the Company may sell from time to time through the Managers, as the Company’s sales agents, the Company’s Class A common stock having an aggregate offering price of up to $73.0 million (the “Class A Shares”). Under the terms of the Equity Distribution Agreement, the Company may also sell Class A Shares from time to time to any Manager as principal for its own account at a price to be agreed upon at the time of sale. Any sale of Class A Shares to a Manager as principal would be pursuant to the terms of a separate terms agreement between the Company and such Manager. Sales of the Class A Shares, if any, will be made by means of ordinary brokers’ transactions, to or through a market maker or directly on or through an electronic communication network, a “dark pool” or any similar market venue, or as otherwise agreed by the Company and one or more of the Managers.
During the year ended December 31, 2016, the Company sold approximately 0.5 million Class A Shares under the Equity Distribution Agreement for net proceeds of approximately $1.8 million ($2.1 million gross proceeds, net of approximately $0.3 million in commissions and professional services expenses). The Company used the net proceeds for
65
general corporate purposes. At December 31, 2016, approximately $70.9 million in aggregate offering price remained available to be issued and sold under the Equity Distribution Agreement.
The amount, timing and allocation of capital expenditures are largely discretionary and within management’s control. If oil and gas prices decline to levels below our acceptable levels or costs increase to levels above our acceptable levels, we may choose to defer a portion of our budgeted capital expenditures until later periods in order to achieve the desired balance between sources and uses of liquidity and to prioritize capital projects that we believe have the highest expected returns and potential to generate near-term cash flow. We may also increase our capital expenditures significantly to take advantage of opportunities we consider to be attractive. We continuously monitor and adjust our projected capital expenditures in response to success or lack of success in drilling activities, changes in prices, availability of financing, drilling and acquisition costs, industry conditions, the availability of rigs, contractual obligations, internally generated cash flow and other factors both within and outside our control.
The following table summarizes our cash flows for the years ended December 31, 2016, 2015 and 2014:
|
|
|
Year Ended December 31, |
|
|||||||
|
(in thousands of dollars) |
|
2016 |
|
2015 |
|
2014 |
|
|||
|
Net cash provided by operating activities |
|
$ |
25,700 |
|
$ |
68,849 |
|
$ |
265,319 |
|
|
Net cash (used in) investing activities |
|
|
(130,862) |
|
|
(168,220) |
|
|
(463,799) |
|
|
Net cash provided by financing activities |
|
|
117,911 |
|
|
107,698 |
|
|
188,226 |
|
|
Net increase (decrease) in cash |
|
$ |
12,749 |
|
$ |
8,327 |
|
$ |
(10,254) |
|
Cash Flow Provided by Operating Activities
Net cash provided by operating activities was $25.7 million for the year ended December 31, 2016 as compared to cash provided by operating activities of $68.8 million for the year ended December 31, 2015. The decrease in operating cash flows was primarily due to a $69.7 million decrease in oil and gas revenues for the year ended December 31, 2016 as compared to the year ended December 31, 2015. The decrease in revenue was attributable to decreased production volumes, as well as the decline in commodity prices.
Net cash provided by operating activities was $68.8 million for the year ended December 31, 2015 as compared to cash provided by operating activities of $265.3 million for the year ended December 31, 2014. The decrease in operating cash flows was primarily due to a $183.8 million decrease in oil and gas revenues for the year ended December 31, 2015 as compared to the year ended December 31, 2014. The decrease in revenue was attributable to the decline in commodity prices.
Our operating cash flows are sensitive to a number of variables, the most significant of which is oil, NGL, and natural gas prices. For additional information on the impact of changing prices on our financial position, see “Item 7A. Quantitative and Qualitative Disclosures about Market Risk.”
Cash Flow Used in Investing Activities
Net cash used in investing activities was $130.9 million for the year ended December 31, 2016 as compared to cash used in investing activities of $168.2 million for the year ended December 31, 2015. The decrease was primarily driven by the reduction in capital expenditures which decreased $46.8 million during the year ended December 31, 2016 as compared to the year ended December 31, 2015 due to a decrease in drilling activity. Partially offsetting the impact of our capital expenditures, cash flows from current period settlements of our commodity derivative instruments resulted in net cash receipts of $132.3 million for the year ended December 31, 2016 as compared to net cash receipts of $144.1 million for the year ended December 31, 2015 driven by the decline in commodity prices.
Net cash used in investing activities was $168.2 million for the year ended December 31, 2015 as compared to cash used in investing activities of $463.8 million for the year ended December 31, 2014. The decrease was primarily driven by the reduction in capital expenditures which decreased $163.3 million during the year ended December 31, 2015 as compared to the year ended December 31, 2014 due to a decrease in drilling activity. Additionally, cash flows from current period settlements of our commodity derivative instruments resulted in net cash receipts of $144.1 million for the year ended December 31, 2015 as compared to net payments of $3.7 million for the year ended December 31, 2014 as a result of lower commodity prices.
66
We expect our 2017 capital expenditures to be approximately $275.0 million, including $232 million for drilling and completion, $25 million for leasing and $18 million for workovers and efficiency projects. Expenditures for development and exploration of oil and gas properties are the primary use of our capital resources. Our capital budget may be adjusted as business conditions warrant. The amount, timing and allocation of capital expenditures is largely discretionary and within our control. If oil and natural gas prices decline or costs increase significantly, we could defer a significant portion of our budgeted capital expenditures until later periods to prioritize capital projects that we believe have the highest expected returns and potential to generate near‑term cash flows. We routinely monitor and adjust our capital expenditures in response to changes in prices, availability of financing, drilling and acquisition costs, industry conditions, the timing of regulatory approvals, the availability of rigs, the degree of success in drilling activities, contractual obligations, internally generated cash flows and other factors both within and outside our control.
Cash Flow Provided by Financing Activities
Net cash provided by financing activities was $117.9 million for the year ended December 31, 2016 as compared to net cash provided by financing activities of $107.7 million for the year ended December 31, 2015. The increase in financing cash flows was primarily due to borrowings under the Revolver, net of repayments, which totaled $68.0 million during 2016 compared to net repayments of $250.0 million during 2015. Offsetting this increase, the Company purchased an aggregate principal amount of $190.9 million of our senior unsecured notes for cash of $84.6 million. The Company used cash on hand and borrowings from its Revolver to fund the note purchases. Additionally, we paid cash tax distributions of approximately $17.3 million to Class B shareholders. Cash flows provided by financing activities were also impacted by net equity offerings of $153.4 million.
Net cash provided by financing activities was $107.7 million for the year ended December 31, 2015 as compared to net cash provided by financing activities of $188.2 million for the year ended December 31, 2014. The decrease in cash flows provided by financing activities was primarily due to a $263.5 million reduction in proceeds from the issuance of senior notes. During 2015, we made net payments on our credit facility of $251.6 million as compared to net payments of $311.4 million during 2014.
Senior Unsecured Notes
On April 1, 2014, JEH and Jones Energy Finance Corp., JEH’s wholly‑owned subsidiary formed for the sole purpose of co‑issuing certain of JEH’s debt (collectively, the “Issuers”), sold $500.0 million in aggregate principal amount of the Issuers’ 6.75% senior notes due 2022 (the “2022 Notes”). The Company used the net proceeds from the issuance of the 2022 Notes to repay all outstanding borrowings under the Term Loan ($160.0 million), a portion of the outstanding borrowings under the Revolver ($308.0 million) and for working capital and general corporate purposes. The Company subsequently terminated the Term Loan in accordance with its terms. The 2022 Notes bear interest at a rate of 6.75% per year, payable semi‑annually on April 1 and October 1 of each year beginning October 1, 2014. The 2022 Notes were registered in March 2015.
On February 23, 2015, the Issuers sold $250.0 million in aggregate principal amount of 9.25% senior notes due 2023 (the “2023 Notes”) in a private placement to affiliates of GSO Capital Partners LP and Magnetar Capital LLC. The 2023 Notes were issued at a discounted price equal to 94.59% of the principal amount. The Company used the $236.5 million net proceeds from the issuance of the 2023 Notes to repay outstanding borrowings under the Revolver and for working capital and general corporate purposes. The 2023 Notes bear interest at a rate of 9.25% per year, payable semi‑annually on March 15 and September 15 of each year beginning September 15, 2015. The 2023 Notes were registered in February 2016.
During the year ended December 31, 2016, through several open market and privately negotiated purchases, the Company purchased an aggregate principal amount of $190.9 million of its senior unsecured notes. As of December 31, 2016, the Company had purchased $90.9 million principal amount of its 2022 Notes for $38.1 million, and $100.0 million principal amount of its 2023 Notes for $46.5 million, in each case excluding accrued interest and including any associated fees. The Company used cash on hand and borrowings from its Revolver to fund the note purchases. In conjunction with the extinguishment of this debt, JEH recognized cancellation of debt income of $99.5 million for the nine months ended September 30, 2016, on a pre-tax basis. This income is recorded in Gain on debt extinguishment on the Company’s Consolidated Statement of Operations. Of the Company’s total repurchases, $20.3 million principal amount of its 2022 Notes were not cancelled and are available for future reissuance, subject to applicable securities laws.
67
The 2022 Notes and 2023 Notes are guaranteed on a senior unsecured basis by the Company and by all of its significant subsidiaries. However, as of December 31, 2016, two of our subsidiaries that are now guarantors, Nosley SCOOP, LLC and Nosley Acquisition, LLC, were not guarantors and are not displayed as subsidiary guarantors in our financial statements for the year ending December 31, 2016. The 2022 Notes and 2023 Notes will be senior in right of payment to any future subordinated indebtedness of the Issuers.
The Company may redeem the 2022 Notes at any time on or after April 1, 2017 and the 2023 Notes at any time on or after March 15, 2018 at a declining redemption price set forth in the respective indentures, plus accrued and unpaid interest.
The indentures governing the 2022 Notes and 2023 Notes are substantially identical and contain covenants that, among other things, limit the ability of the Company to incur additional indebtedness or issue certain preferred stock, pay dividends on capital stock, transfer or sell assets, make investments, create certain liens, enter into agreements that restrict dividends or other payments from the Company’s restricted subsidiaries to the Company, consolidate, merge or transfer all of the Company’s assets, engage in transactions with affiliates or create unrestricted subsidiaries. If at any time when the 2022 Notes or 2023 Notes are rated investment grade and no default or event of default (as defined in the indenture) has occurred and is continuing, many of the foregoing covenants pertaining to the 2022 Notes or 2023 Notes, as applicable, will be suspended. If the ratings on the 2022 Notes or 2023 Notes, as applicable, were to decline subsequently to below investment grade, the suspended covenants would be reinstated.
As of December 31, 2016, the Company was in compliance with the indentures governing the 2022 Notes and 2023 Notes.
Other Long-Term Debt
The Company entered into two credit agreements dated December 31, 2009, with Wells Fargo Bank N.A, the Senior Secured Revolving Credit Facility (the “Revolver”) and the Second Lien Term Loan (the “Term Loan”). On April 1, 2014, the Term Loan was repaid in full and terminated in connection with the issuance of the 2022 Notes. On November 6, 2014, the Company amended the Revolver to, among other things, extend the maturity date of the Revolver to November 6, 2019. The Company’s oil and gas properties are pledged as collateral to secure its obligations under the Revolver. The borrowing base on the Revolver was subsequently adjusted to $562.5 million in accordance with its terms as a result of the issuance of the 2023 Notes in February 2015 and was reaffirmed at this level effective April 1, 2015. Effective October 8, 2015, the borrowing base was reduced to $510.0 million during the semi-annual borrowing base re-determination.
On August 1, 2016, the Company entered into an amendment to the Revolver to, among other things (i) require that the Company's deposit accounts and securities accounts (subject to certain exclusions) become subject to control agreements, (ii) restrict the Company from borrowing or receiving Letters of Credit under the Revolver if the Company has, or, after giving effect to such borrowing or issuance of Letter of Credit, will have, a Consolidated Cash Balance (as defined in the Revolver) in excess of $30.0 million (in each case giving effect to the anticipated use of proceeds thereof) and (iii) set the borrowing base under the Revolver at $425.0 million. The borrowing base was reaffirmed at this level during the semi-annual borrowing base re-determination effective October 24, 2016. As of December 31, 2016, the Company had $178.0 million of outstanding borrowings under the Revolver, leaving an unused capacity of $247.0 million.
The terms of the Revolver require the Company to make periodic payments of interest on the loans outstanding thereunder, with all outstanding principal and interest under the Revolver due on the maturity date. The Revolver is subject to a borrowing base, which limits the amount of borrowings which may be drawn thereunder. The borrowing base will be re-determined by the lenders at least semi-annually on or about April 1 and October 1 of each year, with such re-determination based primarily on reserve reports using lender commodity price expectations at such time. Any reduction in the borrowing base will reduce our liquidity, and, if the reduction results in the outstanding amount under our revolving credit facility exceeding the borrowing base, we will be required to repay the deficiency within a short period of time.
Interest on the Revolver is calculated, at the Company’s option, at either (a) the London Interbank Offered (“LIBO”) rate for the applicable interest period plus a margin of 1.50% to 2.50% based on the level of borrowing base utilization at such time or (b) the greatest of the federal funds rate plus 0.50%, the one month adjusted LIBO rate plus 1.00%, or the
68
prime rate announced by Wells Fargo Bank, N.A. in effect on such day, in each case plus a margin of 0.50% to 1.50% based on the level of borrowing base utilization at such time.
The Revolver contains various covenants that, among other things, limit our ability to:
|
· |
incur indebtedness; |
|
· |
grant liens on our assets; |
|
· |
pay dividends or distributions or redeem any of our equity interests; |
|
· |
make certain investments, loans and advances; |
|
· |
merge into or with or consolidate with any other person, or dispose of all or substantially all of our property to any other person; |
|
· |
engage in certain asset dispositions; |
|
· |
enter into transactions with affiliates; |
|
· |
grant negative pledges or agree to restrict dividends or distributions from subsidiaries; |
|
· |
allow gas imbalances, take‑or‑pay or certain other prepayments with respect to oil and gas properties; and |
|
· |
enter into certain derivative arrangements. |
The Revolver also contains a covenant which restricts the ability of Jones Energy, Inc. to (i) hold any assets, (ii) incur, create, assume, or suffer to exist any debt or any other liability or obligation, (iii) create, make or enter into any investment or (iv) engage in any other activity or operation other than, among other exceptions described therein, its ownership of equity interests in JEH and the activities of a passive holding company and assets and operations incidental thereto (including the maintenance of cash and reserves for the payment of operational costs and expenses).
Jones Energy, Inc. and its consolidated subsidiaries are also required under the Revolver to maintain the following financial ratios:
|
· |
a total leverage ratio, consisting of consolidated debt to EBITDAX, of not greater than 4.0x to 1.0x as of the last day of any fiscal quarter; and |
|
· |
a current ratio, consisting of consolidated current assets, including the unused amounts of the total commitments, to consolidated current liabilities, of not less than 1.0x to 1.0x as of the last day of any fiscal quarter. |
As of December 31, 2016, our total leverage ratio is approximately 3.9x and our current ratio is approximately 3.5x, as calculated based on the requirements in our covenants. We are in compliance with all terms of our Revolver at December 31, 2016, and we expect to maintain compliance throughout 2017. However, factors including those outside of our control, such as commodity price declines, may prevent us from maintaining compliance with these covenants, at future measurement dates in 2017 and beyond. In the event it were to become necessary, we believe we have the ability to take actions that would prevent us from failing to comply with our covenants, such as hedge restructuring. If an event of default exists under the Revolver, the lenders will be able to accelerate the obligations outstanding under the Revolver and exercise other rights and remedies. Our Revolver contains customary events of default, including the occurrence of a change of control, as defined in the Revolver.
Off‑Balance Sheet Arrangements
At December 31, 2016, we did not have any off‑balance sheet arrangements.
69
Contractual Obligations
The following table summarizes our contractual obligations as of December 31, 2016:
|
|
|
Payments Due by Period |
|
|||||||||||||
|
|
|
|
|
|
Less than |
|
|
|
|
|
|
|
|
|
|
|
|
(dollars in thousands of dollars) |
|
Total |
|
1 Year |
|
1 - 3 Years |
|
4 - 5 Years |
|
Thereafter |
|
|||||
|
Long-term debt obligations |
|
$ |
737,148 |
|
$ |
— |
|
$ |
178,000 |
|
$ |
409,148 |
|
$ |
150,000 |
|
|
Interest expense (1) |
|
|
242,418 |
|
|
45,764 |
|
|
132,378 |
|
|
62,272 |
|
|
2,004 |
|
|
Commodity derivative obligations |
|
|
15,859 |
|
|
14,650 |
|
|
1,209 |
|
|
— |
|
|
— |
|
|
Operating lease obligations |
|
|
3,672 |
|
|
1,054 |
|
|
2,618 |
|
|
— |
|
|
— |
|
|
Total |
|
$ |
999,097 |
|
$ |
61,468 |
|
$ |
314,205 |
|
$ |
471,420 |
|
$ |
152,004 |
|
|
(1) |
Interest expense is estimated based on the outstanding balance at December 31, 2016 multiplied by the weighted average interest rate during 2016. |
Excluded from the table above are the following:
We recognize as a liability an asset retirement obligation, or ARO, associated with the retirement of a tangible long‑lived asset in the period in which it is incurred or becomes determinable (as defined by the standard), with an associated increase in the carrying amount of the related long‑lived asset. Estimating the future ARO requires management to make estimates and judgments regarding timing and existence of a liability, as well as what constitutes adequate restoration.
The holders of JEH Units, including Jones Energy, Inc., incur U.S. federal, state and local income taxes on their share of any taxable income of JEH. Under the terms of its operating agreement, JEH is generally required to make quarterly pro rata cash tax distributions to its unitholders (including us) based on income allocated to such unitholders through the end of each relevant quarter, as adjusted to take into account good faith projections by the Company of taxable income or loss for the remainder of the calendar year, to the extent JEH has cash available for such distributions and subject to certain other restrictions. This tax distribution is computed based on the estimate of net taxable income of JEH allocated to each holder of JEH Units multiplied by the highest marginal effective rate of federal, state and local income tax applicable to an individual resident in New York, New York, without regard for the federal benefit of the deduction for any state taxes. During 2016, JEH generated taxable income, resulting in the payment of $17.3 million in cash tax distributions to JEH unitholders (other than us). As a result of JEH’s 2016 taxable income (all of which is passed-through and taxed to us and JEH’s other unitholders), we anticipate that, in 2017, we will be required to make further income tax payments to federal and state taxing authorities of $4.0 million and JEH will make further tax distributions to JEH unitholders (other than us) of $0.6 million. Based on our initial 2017 operating budget and information available as of this filing, we do not anticipate that we will be required to make any additional tax payments or that JEH will make any additional tax distributions during 2017. Estimating the tax distributions required under the operating agreement is imprecise by nature, highly uncertain, and dependent upon a variety of factors.
The Company entered into the Tax Receivable Agreement with JEH and the Class B shareholders that provides for payment by Jones Energy, Inc. to exchanging Class B shareholders of 85% of the benefits, if any, that Jones Energy, Inc. is deemed to realize as a result of any exchange. As a result of exchanges made prior to December 31, 2016, the Company recorded a TRA liability of $43.0 million. Estimating the timing of payments made under the Tax Receivable Agreement is imprecise by nature, highly uncertain, and dependent upon a variety of factors.
As a result of taxable income allocated from JEH in 2016 we estimate that we will make a payment of a portion of the TRA liability during 2018 of $0.6 million. See “Management’s Discussion and Analysis of Financial Condition and Results of Operations—Outlook,” and see “Risk Factors—We will be required to make payments under the Tax Receivable Agreement for certain tax benefits we may receive (or be deemed to receive), and the amounts of such payments could be significant.” for further discussion of these items.
Critical Accounting Policies and Estimates
The discussion and analysis of our financial condition and results of operations are based on our consolidated financial statements, which have been prepared in accordance with accounting principles generally accepted in the United States, or GAAP. As used herein, the following acronyms have the following meanings: “FASB” means the Financial Accounting Standards Board; the “Codification” refers to the Accounting Standards Codification, the collected
70
accounting and reporting guidance maintained by the FASB; “ASC” means Accounting Standards Codification and is generally followed by a number indicating a particular section of the Codification; and “ASU” means Accounting Standards Update, followed by an identification number, which are the periodic updates made to the Codification by the FASB.
The preparation of our consolidated financial statements requires us to make estimates and assumptions that affect our reported results of operations and the amount of reported assets, liabilities and proved oil and natural gas reserves. Some accounting policies involve judgments and uncertainties to such an extent that there is reasonable likelihood that materially different amounts could have been reported under different conditions or if different assumptions had been used. Actual results may differ from the estimates and assumptions used in the preparation of our consolidated financial statements. Described below are the most significant policies we apply in preparing our consolidated financial statements, some of which are subject to alternative treatments under GAAP. We also describe the most significant estimates and assumptions we make in applying these policies.
Reserves. Reserve estimates significantly impact depreciation and depletion expense and the calculation of potential impairments of oil and gas properties. Under the SEC rules, proved reserves are those quantities of oil and gas, which, by analysis of geoscience and engineering data, can be estimated with reasonable certainty to be economically producible from a given date forward, from known reservoirs, and under existing economic conditions, operating methods, and government regulations. The term “reasonable certainty” implies a high degree of confidence that the quantities of oil and natural gas actually recovered will equal or exceed the estimate. Reasonable certainty can be established using techniques that have been proven effective by actual production from projects in the same reservoir or an analogous reservoir or by other evidence using reliable technology that establishes reasonable certainty. Reliable technology is a grouping of one or more technologies (including computational methods) that has been field tested and has been demonstrated to provide reasonably certain results with consistency and repeatability in the formation being evaluated or in an analogous formation.
Probable reserves are those additional reserves that are less certain to be recovered than proved reserves but which, together with proved reserves, are as likely as not to be recovered. When deterministic methods are used, it is as likely as not that actual remaining quantities recovered will exceed the sum of estimated proved plus probable reserves. When probabilistic methods are used, there should be at least a 50% probability that the actual quantities recovered will equal or exceed the proved plus probable reserves estimates.
Possible reserves are those additional reserves that are less certain to be recovered than probable reserves. When deterministic methods are used, the total quantities ultimately recovered from a project have a low probability of exceeding proved plus probable plus possible reserves. When probabilistic methods are used, there should be at least a 10% probability that the total quantities ultimately recovered will equal or exceed the proved plus probable plus possible reserves estimates.
Reserves were calculated using an unweighted arithmetic average of commodity prices in effect on the first day of each month within the twelve‑month period ending on the date as of which the applicable estimate is presented. These prices were adjusted for quality, transportation fees, geographical differentials, marketing bonuses or deductions and other factors affecting the price received at the wellhead.
71
Periodic revisions to the estimated reserves and related future cash flows may be necessary as a result of a number of factors, including changes in oil and natural gas prices, reservoir performance, new drilling and completion, purchases, sales and terminations of leases, drilling and operating cost changes, technological advances, new geological or geophysical data or other economic factors. All of these factors are inherently estimates and are inter‑dependent. While each variable carries its own degree of uncertainty, some factors, such as oil and natural gas prices, have historically been highly volatile and may be highly volatile in the future. This high degree of volatility causes a high degree of uncertainty associated with the estimation of reserve quantities and estimated future cash flows. Therefore, future results are highly uncertain and subject to potentially significant revisions. Accordingly, reserve estimates are generally different from the quantities of oil and natural gas that are ultimately recovered. We cannot predict the amounts or timing of future reserve revisions, as such revisions could be negatively impacted by:
|
· |
Declines in commodity prices or actual realized prices below those assumed for future years; |
|
· |
Increases in service costs; |
|
· |
Increases in future global or regional production or decreases in demand; |
|
· |
Increases in operating costs; |
|
· |
Reductions in availability of drilling, completion, or other equipment. |
If such revisions are significant, they could significantly affect future amortization of capitalized costs and result in an impairment of assets that may be material.
Property and Equipment. Oil and gas producing activities are accounted for using the successful efforts method of accounting. Under the successful efforts method, lease acquisition costs and all development costs, including unsuccessful development wells, are capitalized.
Impairment—The capitalized costs of proved oil and gas properties are reviewed at least annually for impairment, whenever events or changes in circumstances indicate that the carrying amount of a long‑lived asset or asset group exceeds its fair market value and is not recoverable. The determination of recoverability is based on comparing the estimated undiscounted future net cash flows from a producing field to the carrying value of the assets. If the future undiscounted cash flows, based on estimates of anticipated production and future oil and natural gas prices and operating costs, are lower than the carrying cost, the carrying cost of the field assets is reduced to fair value. For our proved oil and gas properties, we estimate fair value by discounting the projected future cash flows at an appropriate risk‑adjusted discount rate.
Unproved leasehold costs are assessed at least annually to determine whether they have been impaired based upon lease terminations, expected drilling plans, and the impact of any unsuccessful exploratory drilling. Individually significant properties are assessed for impairment on a property‑by‑property basis, while individually insignificant unproved leasehold costs may be assessed in the aggregate. If unproved leasehold costs are found to be impaired, an impairment allowance is provided and a loss is recognized in the statement of operations.
Sales—Sales of significant portions of a proved field are charged to income as incurred. Gain or loss on the sale is recognized to the extent of the difference between the net proceeds received and the remaining carrying value of the properties sold. Proceeds from the sale of insignificant portions of a larger proved field are accounted for as a recovery of costs, thereby reducing the carrying value of the field until such value reaches zero. For sales of entire working interests in unproved properties, gain or loss is recognized to the extent of the difference between the proceeds received and the net carrying value of the property. Proceeds from sales of partial interests in unproved properties are accounted for as a recovery of costs unless the proceeds exceed the entire cost of the property.
Derivative Financial Instruments. We use derivative contracts to hedge the effects of fluctuations in the prices of oil, natural gas and NGLs. We record such derivative instruments as assets or liabilities in the balance sheet (see Note 7, “Fair Value Measurement,” in the Notes to Consolidated Financial Statements for further information on fair value). Estimating the fair value of derivative financial instruments requires management to make estimates and judgments regarding volatility and counterparty credit risk. We use net presentation of derivative assets and liabilities when such assets and liabilities are with the same counterparty and allowed under the ISDA trading agreement with such counterparty.
72
We have not designated any of our derivative contracts as fair value or cash flow hedges. The changes in fair value of the contracts are included in net income in the period of the change as “Net gain (loss) on commodity derivatives.”
Share‑Based Compensation. We measure and record compensation expense for all share‑based payment awards to employees and directors based on estimated grant‑date fair values. Compensation costs for share‑based awards are recognized over the requisite service period based on the grant‑date fair value. Prior to our IPO, we were not publicly traded, and did not have a listed price with which to calculate fair value. We have historically and consistently calculated fair value using combined valuation models including an enterprise valuation approach; an income approach, utilizing future discounted and undiscounted cash flows; and a market approach, taking into consideration peer group analysis of publicly traded companies, and when available, actual cash transactions in our common stock.
Acquisitions. Acquisitions are accounted for as purchases and, accordingly, the results of operations are included in our statement of operations from the closing date of the acquisition. Purchase prices are allocated to acquired assets and assumed liabilities, if any, based on their estimated fair value at the time of the acquisition. We have historically and consistently calculated fair value using combined valuation models including an enterprise valuation approach; an income approach, utilizing future discounted and undiscounted cash flows; and a market approach, taking into consideration peer group analysis of publicly traded companies.
Asset Retirement Obligations. We recognize as a liability an asset retirement obligation, or ARO, associated with the retirement of a tangible long‑lived asset in the period in which it is incurred or becomes determinable (as defined by the standard), with an associated increase in the carrying amount of the related long‑lived asset. The cost of the tangible asset, including the initially recognized asset retirement cost, is depreciated over the useful life of the asset and accretion expense is recognized over time as the discounted liability is accreted to its expected settlement value. We measure the fair value of the ARO using expected future cash outflows for abandonment discounted generally at our cost of capital at the time of recognition.
Estimating the future ARO requires management to make estimates and judgments regarding timing and existence of a liability, as well as what constitutes adequate restoration. Inherent in the fair value calculation are numerous assumptions and judgments including the ultimate costs, inflation factors, credit adjusted discount rates, timing of settlement and changes in the legal, regulatory, environmental and political environments. To the extent future revisions to these assumptions impact the fair value of the existing ARO liability, a corresponding adjustment is made to the related asset.
Liability under Tax Receivable Agreement. In connection with the IPO, the Company entered into a Tax Receivable Agreement (the “TRA”) which obligates the Company to make payments to certain current and former owners equal to 85% of the applicable cash savings that the Company realizes as a result of tax attributes arising from exchanges of JEH Units and shares of the Company’s Class B common stock held by those owners for shares of the Company’s Class A common stock. The Company will retain the benefit of the remaining 15% of these tax savings.
As a result of exchanges made, the Company accrues the estimated future tax benefits and accounts for this estimated amount as a reduction of deferred tax liabilities on its consolidated balance sheet. The actual amount and timing of payments to be made under the TRA will depend upon a number of factors, including the amount and timing of taxable income generated in the future, changes in future tax rates, the use of loss carryovers, and the portion of the Company’s payments under the TRA constituting imputed interest. To the extent the Company does not realize all of the tax benefits in future years or in the event of a change in future tax rates, this liability may change.
Recent Accounting Pronouncements
See Note 2, “Significant Accounting Policies—Recent Accounting Pronouncements” in our Notes to the Consolidated Financial Statements.
Item 7A. Quantitative and Qualitative Disclosures about Market Risk
We are exposed to certain market risks that are inherent in our financial statements that arise in the normal course of business. We may enter into derivative instruments to manage or reduce market risk, but do not enter into derivative agreements for speculative purposes.
We do not designate these or future derivative instruments as hedges for accounting purposes. Accordingly, the changes in the fair value of these instruments are recognized currently in earnings.
73
Commodity price risk and hedges
Our principal market risk exposure is to oil, natural gas and NGL prices, which are inherently volatile. As such, future earnings are subject to change due to fluctuations in such prices. Realized prices are primarily driven by the prevailing prices for oil and regional spot prices for natural gas and NGLs. We have used, and expect to continue to use, oil, natural gas and NGL derivative contracts to reduce our risk of price fluctuations of these commodities. Pursuant to our risk management policy, we engage in these activities as a hedging mechanism against price volatility associated with projected production levels. The fair value of our oil, natural gas and NGL derivative contracts at December 31, 2016 was a net asset of $43.0 million.
As of December 31, 2016, we had hedged approximately 48% of our total forecasted production from proved reserves through December 31, 2018. For information regarding the terms of these hedges, please see “—Basis of presentation—Hedging” above. The production hedged thereby is consistent with the assumed drilling schedule and monthly production levels in the December 31, 2016 reserve report prepared by Cawley Gillespie, which is based on prices, costs and other assumptions required by SEC rules. Our actual production will vary from the amounts estimated in this reserve report, perhaps materially. Please read “Risk factors—Our estimated oil and natural gas reserve quantities and future production rates are based on many assumptions that may prove to be inaccurate. Any material inaccuracies in these reserve estimates or the underlying assumptions will materially affect the quantities and present value of our reserves.”
Counterparty and customer credit risk
Joint interest receivables arise from billings to entities that own partial interests in the wells we operate. These entities participate in our wells primarily based on their ownership in leases on which we drill. We are also subject to credit risk due to concentration of our oil and natural gas receivables with several significant customers. The inability or failure of these significant customers to meet their obligations or their insolvency or liquidation may adversely affect our financial results. In addition, our oil and natural gas derivative arrangements expose us to credit risk in the event of nonperformance by counterparties.
While we do not typically require our partners, customers and counterparties to post collateral, we have begun to make cash calls to our partners for their share of future project expenditures. We periodically review, evaluate and assess the credit standing of our partners or customers for oil and gas receivables and the counterparties on our derivative instruments. This evaluation may include reviewing a party’s credit rating, latest financial information and, in the case of a customer with which we have receivables, their historical payment record, and undertaking the due diligence necessary to determine creditworthiness. The counterparties on our derivative instruments currently in place are lenders under the revolving credit facility with investment grade ratings. We are not permitted under the terms of the revolving credit facility to enter into derivative instruments with counterparties outside of the banks who are lenders under the revolving credit facility. As a result, any future derivative instruments will be with these or other lenders under the revolving credit facility who will also likely carry investment grade ratings.
Interest rate risk
We are subject to market risk exposure related to changes in interest rates on our variable rate indebtedness. The terms of the senior secured revolving credit facility provide for interest on borrowings at a floating rate equal to prime, LIBOR or federal funds rate plus margins ranging from 0.50% to 2.50% depending on the base rate used and the amount of the loan outstanding in relation to the borrowing base. The base rate margins under the terminated term loan were 6.0‑7.0% depending on the base rate used and the amount of the loan outstanding. The terms of our senior notes provide for a fixed interest rate through their respective maturity dates. During the year ended December 31, 2016, borrowings under the Revolver, the 2022 Notes and the 2023 Notes bore interest at a weighted average rate of 2.40%, 6.75% and 9.25%, respectively.
Item 8. Financial Statements and Supplementary Data
Our consolidated financial statements and supplementary financial data are included in this Annual Report beginning on page F‑1.
Item 9. Changes in and Disagreements with Accountants on Accounting and Financial Disclosure
None.
74
Item 9A. Controls and Procedures
Evaluation of Disclosure Controls and Procedures
As required by Rule 13a‑15(b) of the Exchange Act, we have evaluated, under the supervision and with the participation of our management, including our principal executive officer and principal financial officer, the effectiveness of the design and operation of our disclosure controls and procedures (as defined in Rules 13a‑15(e) and 15d‑15(e) under the Exchange Act) as of the end of the period covered by this report. Our disclosure controls and procedures are designed to provide reasonable assurance that the information required to be disclosed by us in reports that we file under the Exchange Act is accumulated and communicated to our management, including our principal executive officer and principal financial officer, as appropriate, to allow timely decisions regarding required disclosure and is recorded, processed, summarized and reported within the time periods specified in the rules and forms of the SEC.
Our management, with the participation of our principal executive officer and principal financial officer, evaluated the effectiveness of the design and operation of our disclosure controls and procedures. Based on that evaluation, our principal executive officer and principal financial officer concluded that as of December 31, 2016, the end of the period covered by this report, our disclosure controls and procedures are effective at a reasonable assurance level.
Remediation of Previously Reported Material Weakness
As first disclosed in our registration statement on Form S-1 (filed on May 28, 2013), our management previously identified a material weakness in our internal control over financial reporting. A material weakness is a deficiency, or combination of deficiencies, in internal control over financial reporting, such that there is a reasonable possibility that a material misstatement of our annual or interim financial statements will not be prevented or detected on a timely basis.
The material weakness in our internal control over financial reporting resulted from our lack of sufficient resources and processes to effectively review our financial statements on a timely basis. This lack of adequate staffing resulted in errors due to insufficient time spent on review and approval of certain information used to prepare our financial statements.
As of December 31, 2016, we had remediated the previously reported material weakness in our internal control over financial reporting. We have implemented the following changes in our internal control structure that contributed to the remediation of the material weakness described above:
|
· |
Added more experienced accounting staff with the requisite skills and experience to support our structure and financial reporting requirements; |
|
· |
Utilized qualified outside consulting personnel, where necessary, in support of our complex technical accounting matters; |
|
· |
Retained an outside consulting firm to assist us in modifying the design of our internal control over financial reporting to ensure that the processes and intended changes to the processes are addressing the relevant financial statement assertions and presentation and disclosure matters, including the monitoring and oversight of controls in the financial reporting process. |
After completing our testing of the design and operational effectiveness of these controls, our management concluded that we have remediated the material weakness as of December 31, 2016.
Management’s Report on Internal Control over Financial Reporting
Our management is responsible for establishing and maintaining adequate internal control over financial reporting (as defined in Rule 13a‑15(f) and Rule 15d‑15(f) under the Exchange Act). Our internal control over financial reporting is a process designed under the supervision of our principal executive officer and principal financial officer to provide reasonable assurance regarding the reliability of financial reporting and the preparation of our financial statements for external purposes in accordance with generally accepted accounting principles.
Because of its inherent limitations, internal control over financial reporting may not prevent or detect misstatements. Also, projections of any evaluation of effectiveness to future periods are subject to the risk that controls may become inadequate because of changes in conditions, or that the degree of compliance with the policies or procedures may deteriorate.
75
As of December 31, 2016, our management assessed the effectiveness of our internal control over financial reporting based on the criteria for effective internal control over financial reporting established by the Committee of Sponsoring Organizations of the Treadway Commission (“COSO”) in Internal Control—Integrated Framework (2013). Management’s assessment included an evaluation of the design of our internal control over financial reporting and testing of the operational effectiveness of our internal control over financial reporting. Based on this assessment, management has concluded that, as of December 31, 2016, the Company’s internal control over financial reporting is effective based on those criteria.
Attestation Report of the Registered Public Accounting Firm
This annual report does not include an attestation report of the company’s registered public accounting firm regarding internal control over financial reporting. Pursuant to the JOBS Act, management’s report was not subject to attestation by the company’s registered public accounting firm pursuant to rules of the Securities and Exchange Commission that permit the company to provide only management’s report in this annual report.
Changes in Internal Control over Financial Reporting
There have been no changes in internal control over financial reporting during the quarter ended December 31, 2016 that have materially affected, or are reasonably likely to materially affect, the Company’s internal control over financial reporting.
None.
76
Item 10. Directors, Executive Officers and Corporate Governance
The information called for by this Item 10 is incorporated herein by reference to the definitive Proxy Statement to be filed by the registrant pursuant to Regulation 14A of the General Rules and Regulations under the Exchange Act not later than 120 days after the end of the fiscal year covered by this Annual Report on Form 10‑K.
Item 11. Executive Compensation
The information called for by this Item 11 is incorporated herein by reference to the definitive Proxy Statement to be filed by the registrant pursuant to Regulation 14A of the General Rules and Regulations under the Exchange Act not later than 120 days after the end of the fiscal year covered by this Annual Report on Form 10‑K.
Item 12. Security Ownership of Certain Beneficial Owners and Management and Related Stockholder Matters
The information called for by this Item 12 is incorporated herein by reference to the definitive Proxy Statement to be filed by the registrant pursuant to Regulation 14A of the General Rules and Regulations under the Exchange Act not later than 120 days after the end of the fiscal year covered by this Annual Report on Form 10‑K.
Item 13. Certain Relationships and Related Transactions, and Director Independence
The information called for by this Item 13 is incorporated herein by reference to the definitive Proxy Statement to be filed by the registrant pursuant to Regulation 14A of the General Rules and Regulations under the Exchange Act not later than 120 days after the end of the fiscal year covered by this Annual Report on Form 10‑K.
Item 14. Principal Accounting Fees and Services
The information called for by this Item 14 is incorporated herein by reference to the definitive Proxy Statement to be filed by the registrant pursuant to Regulation 14A of the General Rules and Regulations under the Exchange Act not later than 120 days after the end of the fiscal year covered by this Annual Report on Form 10‑K.
77
Item 15. Exhibits, Financial Statement Schedules
(a)The following documents are filed as part of this report or incorporated by reference:
(1) Financial Statements. Our consolidated financial statements are included under Part II, Item 8 of this Annual Report. For a listing of these statements and accompanying footnotes, see “Index to Consolidated Financial Statements” on page F‑1 of this Annual Report.
(2) Financial Statement Schedules. All schedules have been omitted because they are either not applicable, not required or the information called for therein appears in the consolidated financial statements or notes thereto.
(3) Exhibits. The exhibits required to be filed by this Item 15 are set forth in the Exhibit Index accompanying this Annual Report on Form 10‑K.
|
Exhibit |
|
Description |
|
2.1 |
|
Purchase and Sale Agreement, dated August 18, 2016, by and between Jones Energy Holdings, LLC and SCOOP Energy Company, LLC (incorporated by reference to Exhibit 2.1 to the Company’s Quarterly Report on Form 10-Q for the quarterly period ended September 30, 2016 filed with the Securities and Exchange Commission on November 4, 2016). |
|
3.1 |
|
Amended and Restated Certificate of Incorporation of Jones Energy, Inc. (incorporated by reference to Exhibit 3.1 to the Company’s Current Report on Form 8‑K filed with the Securities and Exchange Commission on July 30, 2013). |
|
3.2 |
|
Amended and Restated Bylaws of Jones Energy, Inc. (incorporated by reference to Exhibit 3.2 to the Company’s Current Report on Form 8‑K filed with the Securities and Exchange Commission on July 30, 2013). |
|
3.3 |
|
Certificate of Designations of the 8.0% Series A Perpetual Convertible Preferred Stock, filed with the Secretary of State of the State of Delaware and effective August 25, 2016 (including form of stock certificate) (incorporated by reference herein to the Company’s Current Report on Form 8-K filed with the Securities and Exchange Commission on August 26, 2016) |
|
4.1 |
|
Form of Class A common stock Certificate (incorporated by reference to Exhibit 4.2 to the Company’s Registration Statement on Form S‑1, File No. 333‑188896, filed with the Securities and Exchange Commission on June 7, 2013). |
|
4.2 |
|
Registration Rights and Stockholders Agreement, dated as of July 29, 2013 (incorporated by reference to Exhibit 10.5 to the Company’s Current Report on Form 8‑K filed with the Securities and Exchange Commission on July 30, 2013). |
|
4.3 |
|
Indenture, dated April 1, 2014, among Jones Energy Holdings, LLC, Jones Energy Finance Corp., the Guarantors named therein and Wells Fargo Bank, National Association, as trustee (incorporated by reference to Exhibit 4.1 to the Company’s Current Report on Form 8‑K filed with the Securities and Exchange Commission on April 1, 2014). |
|
4.4 |
|
Registration Rights Agreement, dated April 1, 2014, among Jones Energy Holdings, LLC, Jones Energy Finance Corp., the Guarantors named therein and Citigroup Global Markets Inc., as the sole representative of the Initial Purchasers named therein (incorporated by reference to Exhibit 4.2 to the Company’s Current Report on Form 8‑K filed with the Securities and Exchange Commission on April 1, 2014). |
|
4.5 |
|
Indenture, dated February 23, 2015, among Jones Energy Holdings, LLC, Jones Energy Finance Corp., the Guarantors named therein and Wells Fargo Bank, National Association, as trustee (incorporated by reference to Exhibit 4.1 to Jones Energy, Inc.’s Current Report on Form 8‑K filed with the Securities and Exchange Commission on February 27, 2015). |
78
|
Exhibit |
|
Description |
|
4.6 |
|
Registration Rights Agreement dated February 23, 2015, among Jones Energy Holdings, LLC, Jones Energy Finance Corp., the Guarantors named therein and the purchasers named therein (incorporated by reference to Exhibit 4.2 to Jones Energy, Inc.’s Current Report on Form 8‑K filed with the Securities and Exchange Commission on February 27, 2015). |
|
4.7 |
|
Form of certificate for the 8.0% Series A Perpetual Convertible Preferred Stock (included as Exhibit A to Exhibit 3.3) |
|
10.1 |
|
Fourth Amended and Restated Limited Liability Company Agreement of Jones Energy Holdings, LLC, dated as of August 25, 2016 (incorporated by reference herein to the Company’s Current Report on Form 8-K filed with the Securities and Exchange Commission on August 26, 2016) |
|
10.2 |
|
Amendment No. 1 to Fourth Amended and Restated Limited Liability Company Agreement of Jones Energy Holdings, LLC, dated as of September 30, 2016 (incorporated by reference herein to the Company’s Current Report on Form 8-K filed with the Securities and Exchange Commission on October 6, 2016) |
|
10.3 |
|
Exchange Agreement, dated as of July 29, 2013, by and among Jones Energy, Inc., Jones Energy Holdings, LLC and the members of Jones Energy Holdings, LLC party thereto (incorporated by reference to Exhibit 10.3 to the Company's Current Report on Form 8-K filed with the Securities and Exchange Commission on July 30, 2013). |
|
10.4 |
|
Tax Receivable Agreement, dated as of July 29, 2013, by and among Jones Energy, Inc., Jones Energy Holdings, LLC and the members of Jones Energy Holdings, LLC party thereto (incorporated by reference to Exhibit 10.4 to the Company's Current Report on Form 8-K filed with the Securities and Exchange Commission on July 30, 2013). |
|
10.5 † |
|
Amended and Restated Jones Energy, Inc. 2013 Omnibus Incentive Plan, effective as of May 4, 2016 (incorporated by reference to Appendix A to the Company's Definitive Proxy Statement on Schedule 14A filed with the Securities and Exchange Commission on March 30, 2016). |
|
10.6 † |
|
Amended and Restated Jones Energy, Inc. Short Term Incentive Plan, effective as of May 4, 2016 (incorporated by reference to Appendix B to the Company's Definitive Proxy Statement on Schedule 14A filed with the Securities and Exchange Commission on March 30, 2016). |
|
10.7 † |
|
Form of Director Restricted Stock Award Agreement (incorporated by reference to Exhibit 10.1 to the Company's Current Report on Form 8-K filed with the Securities and Exchange Commission on September 4, 2013). |
|
10.8 † |
|
Form of Employee Restricted Stock Award Agreement (incorporated by reference to Exhibit 10.2 to the Company's Current Report on Form 8-K filed with the Securities and Exchange Commission on May 27, 2014). |
|
10.9 † |
|
Form of Performance Share Unit Award Agreement (formerly referred to as a Performance Unit Award) (incorporated by reference to Exhibit 10.1 to the Company's Current Report on Form 8-K filed with the Securities and Exchange Commission on May 27, 2014). |
|
10.10 † |
|
Jones Energy, LLC Executive Deferral Plan (incorporated by reference to Exhibit 10.1 to the Company's Current Report on Form 8-K filed with the Securities and Exchange Commission on October 23, 2013). |
|
10.11† |
|
Jones Energy Holdings, LLC Monarch Equity Plan (incorporated by reference to Exhibit 10.8 to the Company's Registration Statement on Form S-1, File No. 333-188896, filed on May 28, 2013). |
|
10.12 |
|
Form of Indemnification Agreement (incorporated by reference to Exhibit 10.5 to the Company's Registration Statement on Form S-1, File No. 333-188896, filed with the Securities and Exchange Commission on June 7, 2013). |
|
10.13 |
|
Credit Agreement, dated as of December 31, 2009, among Jones Energy Holdings, LLC, as borrower, Wells Fargo Bank N.A., as administrative agent, and the lenders party thereto (incorporated by reference to Exhibit 10.9 to the Company's Registration Statement on Form S-1, File No. 333-188896, filed with the Securities and Exchange Commission on May 28, 2013). |
|
10.14 |
|
Agreement and Amendment No. 1 to Credit Agreement (First Lien) (incorporated by reference to Exhibit 10.10 to the Company's Registration Statement on Form S-1, File No. 333-188896, filed with the Securities and Exchange Commission on May 28, 2013). |
79
|
Exhibit |
|
Description |
|
10.15 |
|
Master Assignment, Agreement and Amendment No. 2 to Credit Agreement (incorporated by reference to Exhibit 10.11 to the Company's Registration Statement on Form S-1, File No. 333-188896, filed with the Securities and Exchange Commission on May 28, 2013). |
|
10.16 |
|
Master Assignment, Agreement and Amendment No. 3 to Credit Agreement (incorporated by reference to Exhibit 10.12 to the Company's Registration Statement on Form S-1, File No. 333-188896, filed with the Securities and Exchange Commission on May 28, 2013). |
|
10.17 |
|
Agreement and Amendment No. 4 to Credit Agreement (First Lien) (incorporated by reference to Exhibit 10.13 to the Company's Registration Statement on Form S-1, File No. 333-188896, filed with the Securities and Exchange Commission on May 28, 2013). |
|
10.18 |
|
Master Assignment, Agreement and Amendment No. 5 to Credit Agreement (incorporated by reference to Exhibit 10.14 to the Company's Registration Statement on Form S-1, File No. 333-188896, filed with the Securities and Exchange Commission on May 28, 2013). |
|
10.19 |
|
Waiver and Amendment No. 6 to Credit Agreement (incorporated by reference to Exhibit 10.15 to the Company's Registration Statement on Form S-1, File No. 333-188896, filed with the Securities and Exchange Commission on May 28, 2013). |
|
10.20 |
|
Waiver, Agreement and Amendment No. 7 to Credit Agreement and Amendment to Guarantee and Collateral Agreement (incorporated by reference to Exhibit 10.24 to the Company's Registration Statement on Form S-1, File No. 333-188896, filed with the Securities and Exchange Commission on June 17, 2013). |
|
10.21 |
|
Borrowing Base Increase Agreement, dated as of December 18, 2013, among Jones Energy Holdings, LLC, as borrower, certain subsidiaries of Jones Energy Holdings, LLC, as guarantors, Wells Fargo Bank, N.A., as administrative agent, and the lenders party thereto (incorporated by reference to Exhibit 10.19 to the Company's Annual Report on Form 10-K filed with the Securities and Exchange Commission on March 14, 2014). |
|
10.22 |
|
Agreement and Amendment No. 8 to Credit Agreement dated as of January 29, 2014, among Jones Energy Holdings, LLC, as borrower, Jones Energy, Inc., Jones Energy, LLC and Nosley Assets, LLC, as guarantors, Wells Fargo Bank, N.A., as administrative agent, and the lenders party thereto (incorporated by reference to Exhibit 10.20 to the Company's Annual Report on Form 10-K filed with the Securities and Exchange Commission on March 14, 2014). |
|
10.23 |
|
Master Assignment, Agreement and Amendment No. 9 to Credit Agreement dated as of November 6, 2014, among Jones Energy Holdings, LLC, as borrower, Jones Energy, Inc., Jones Energy, LLC and Nosley Assets, LLC, as guarantors, Wells Fargo Bank, N.A., as administrative agent, and the lenders party thereto (incorporated by reference to Exhibit 10.22 to the Company’s Annual Report on Form 10-K for the year ended December 31, 2015 filed with the Securities and Exchange Commission on March 9, 2016). |
|
10.24 |
|
Amendment No. 10 to Credit Agreement dated as of August 1, 2016, among Jones Energy Holdings, LLC, as borrower, Jones Energy, Inc., Jones Energy, LLC and Nosley Assets, LLC, as guarantors, Wells Fargo Bank, N.A., as administrative agent, and the lenders party thereto (incorporated by reference to Exhibit 10.1 to the Company’s Quarterly Report on Form 10-Q for the quarterly period ended September 30, 2016 filed with the Securities and Exchange Commission on November 4, 2016). |
|
10.25 |
|
Guarantee and Collateral Agreement, dated as of January 29, 2014, between Jones Energy, Inc., as guarantor, and Wells Fargo Bank, N.A., as administrative agent (incorporated by reference to Exhibit 10.21 to the Company's Annual Report on Form 10-K filed on March 14, 2014). |
|
10.26 |
|
Equity Distribution Agreement, dated as of May 24, 2016, by and among the Company, Jones Energy Holdings, LLC and the Managers named therein (incorporated by reference to Exhibit 1.1 to the Company's Current Report on Form 8-K filed on May 25, 2016). |
|
10.27 |
|
Amended and Restated Firm Crude Oil Gathering and Transportation Agreement, dated October 23, 2015, by and between Monarch Oil Pipeline, LLC and Jones Energy, LLC (incorporated by reference to Exhibit 10.34 to the Company's Annual Report on Form 10-K filed on March 9, 2016). |
80
|
Exhibit |
|
Description |
|
10.28 |
|
Amended and Restated Gathering and Transportation Services Agreement, dated as of October 23, 2015, by and between Monarch Oil Pipeline, LLC and Jones Energy, LLC (incorporated by reference to Exhibit 10.35 to the Company's Annual Report on Form 10-K filed on March 9, 2016). |
|
10.29*† |
|
Form of Performance Unit Award Agreement |
|
21.1* |
|
List of Subsidiaries of Jones Energy, Inc. |
|
23.1* |
|
Consent of PricewaterhouseCoopers LLP. |
|
23.2* |
|
Consent of Cawley Gillespie & Associates, Inc. |
|
31.1* |
|
Rule 13a‑14(a)/15d‑14(a) Certification of Jonny Jones (Principal Executive Officer). |
|
31.2* |
|
Rule 13a‑14(a)/15d‑14(a) Certification of Robert J. Brooks (Principal Financial Officer). |
|
32.1** |
|
Section 1350 Certification of Jonny Jones (Principal Executive Officer). |
|
32.2** |
|
Section 1350 Certification of Robert J. Brooks (Principal Financial Officer). |
|
99.1* |
|
Summary Report of Cawley, Gillespie & Associates, Inc. for reserves as of December 31, 2016 |
|
101.INS* |
|
XBRL Instance Document. |
|
101.SCH* |
|
XBRL Taxonomy Extension Schema Document. |
|
101.CAL* |
|
XBRL Taxonomy Extension Calculation Linkbase Document. |
|
101.DEF* |
|
XBRL Taxonomy Extension Definition Linkbase Document. |
|
101.LAB* |
|
XBRL Taxonomy Extension Label Linkbase Document. |
|
101.PRE* |
|
XBRL Taxonomy Extension Presentation Linkbase Document. |
* —filed herewith
** — furnished herewith
†—Management contract or compensatory plan or arrangement required to be filed as an exhibit to this 10‑K pursuant to Item 15(b).
Item 16. Form 10-K Summary
None.
81
Pursuant to the requirements of Section 13 or 15(d) of the Securities Exchange Act of 1934, the registrant has duly caused this report to be signed on its behalf by the undersigned, thereunto duly authorized.
|
|
|
JONES ENERGY, INC. |
||
|
|
|
(registrant) |
||
|
|
|
|
||
|
Date: March 10, 2017 |
|
By: |
/s/ Jonny Jones |
|
|
|
|
|
Name: |
Jonny Jones |
|
|
|
|
Title: |
Chief Executive Officer |
Pursuant to the requirements of the Securities Exchange Act of 1934, this report has been signed below by the following persons on behalf of the registrant and in the capacities and on the dates indicated.
|
Name |
|
Title |
|
Date |
|
|
|
|
|
|
|
/s/ Jonny Jones |
|
Chairman of the Board of Directors and Chief |
|
|
|
Jonny Jones |
|
Executive Officer (Principal Executive Officer) |
|
March 10, 2017 |
|
|
|
|
|
|
|
/s/ Mike S. McConnell |
|
|
|
|
|
Mike S. McConnell |
|
Director and President |
|
March 10, 2017 |
|
|
|
|
|
|
|
/s/ Robert J. Brooks |
|
Executive Vice President and Chief Financial |
|
|
|
Robert J. Brooks |
|
Officer (Principal Accounting and Financial |
|
|
|
|
|
Officer) |
|
March 10, 2017 |
|
|
|
|
|
|
|
/s/ Halbert S. Washburn |
|
|
|
|
|
Halbert S. Washburn |
|
Director |
|
March 10, 2017 |
|
|
|
|
|
|
|
/s/ Alan D. Bell |
|
|
|
|
|
Alan D. Bell |
|
Director |
|
March 10, 2017 |
|
|
|
|
|
|
|
/s/ Robb L. Voyles |
|
|
|
|
|
Robb L. Voyles |
|
Director |
|
March 10, 2017 |
|
|
|
|
|
|
|
/s/ Gregory D. Myers |
|
|
|
|
|
Gregory D. Myers |
|
Director |
|
March 10, 2017 |
|
|
|
|
|
|
|
/s/ Howard I. Hoffen |
|
|
|
|
|
Howard I. Hoffen |
|
Director |
|
March 10, 2017 |
82
GLOSSARY OF OIL AND NATURAL GAS TERMS
The terms and abbreviations defined in this section are used throughout this Annual Report on Form 10K:
“AMI”—Area of mutual interest, typically referring to a contractually defined area under a joint development agreement whereby parties are subject to mutual participatory rights and restrictions.
“Basin”—A large natural depression on the earth’s surface in which sediments generally brought by water accumulate.
“Bbl”—One stock tank barrel, of 42 U.S. gallons liquid volume, used herein in reference to crude oil, condensate or NGLs.
“Boe”—Barrels of oil equivalent, with 6,000 cubic feet of natural gas being equivalent to one barrel of oil.
“Boe/d”—Barrels of oil equivalent per day.
“British thermal unit (BTU)”—The heat required to raise the temperature of one pound of water by one degree Fahrenheit.
“Completion”—The process of treating a drilled well followed by the installation of permanent equipment for the production of oil or natural gas, or in the case of a dry hole, the reporting of abandonment to the appropriate agency.
“Condensate”—A mixture of hydrocarbons that exists in the gaseous phase at original reservoir temperature and pressure, but that, when produced, is in the liquid phase at surface pressure and temperature.
“Developed acreage”—The number of acres that are allocated or assignable to productive wells or wells capable of production.
“Developed reserves”—Reserves of any category that can be expected to be recovered (i) through existing wells with existing equipment and operating methods or in which the cost of the required equipment is relatively minor compared to the cost of a new well; and (ii) through installed extraction equipment and infrastructure operational at the time of the reserves estimate if the extraction is by means not involving a well.
“Development well”—A well drilled within the proved area of an oil or natural gas reservoir to the depth of a stratigraphic horizon known to be productive.
“Dry hole”—A well found to be incapable of producing hydrocarbons in sufficient quantities to justify completion of the well, such that proceeds from the sale of such production do not exceed production expenses and taxes.
“Economically producible”—A resource which generates revenue that exceeds, or is reasonably expected to exceed, the costs of the operation.
“Exploratory well”—A well drilled to find a new field or to find a new reservoir in a field previously found to be productive of oil.
“Farm‑in or farm‑out”—An agreement under which the owner of a working interest in an oil or natural gas lease assigns the working interest or a portion of the working interest to another party who desires to drill on the leased acreage. Generally, the assignee is required to drill one or more wells in order to earn its interest in the acreage. The assignor usually retains a royalty or reversionary interest in the lease. The interests received by an assignee is a “farm‑in” while the interest transferred by the assignor is a “farm‑out.”
“Field”—An area consisting of a single reservoir or multiple reservoirs all grouped on, or related to, the same individual geological structural feature or stratigraphic condition.
“Formation”—A layer of rock which has distinct characteristics that differ from nearby rock.
“Fracture stimulation”—A process whereby fluids mixed with proppants are injected into a wellbore under pressure in order to fracture, or crack open, reservoir rock, thereby allowing oil and/or natural gas trapped in the reservoir rock to travel through the fractures and into the well for production.
83
“Gross acres or gross wells”—The total acres or well, as the case may be, in which a working interest is owned.
“Horizontal drilling”—A drilling technique used in certain formations where a well is drilled vertically to a certain depth and then drilled at a right angle within a specified interval.
“Joint development agreement”—Includes joint venture agreements, farm‑in and farm‑out agreements, joint operating agreements and similar partnering arrangements.
“MBbl”—One thousand barrels of oil, condensate or NGLs.
“MBoe”—One thousand barrels of oil equivalent, determined using the equivalent of six Mcf of natural gas to one Bbl of crude oil.
“Mcf”—One thousand cubic feet of natural gas.
“MMBoe”—One million barrels of oil equivalent.
“MMBtu”—One million British thermal units.
“MMcf”—One million cubic feet of natural gas.
“Net acres or net wells”—The sum of the fractional working interest owned in gross acres or gross wells. An owner who has 50% interest in 100 acres owns 50 net acres.
“Net revenue interest”—An owner’s interest in the revenues of a well after deducting proceeds allocated to royalty and overriding interests.
“Possible reserves”—Additional reserves that are less certain to be recognized than probable reserves.
“Probable reserves”—Additional reserves that are less certain to be recovered than proved reserves but which, in sum with proved reserves, are as likely as not to be recovered.
“Productive well”—A well that is found to be capable of producing hydrocarbons in sufficient quantities such that proceeds from the sale of the production exceed production expenses and taxes.
“Prospect”—A specific geographic area which, based on supporting geological, geophysical or other data and also preliminary economic analysis using reasonably anticipated prices and costs, is considered to have potential for the discovery of commercial hydrocarbons.
“Proved developed non‑producing”—Hydrocarbons in a potentially producing horizon penetrated by a wellbore, the production of which has been postponed pending installation of surface equipment or gathering facilities, or pending the production of hydrocarbons from another formation penetrated by the wellbore. The hydrocarbons are classified as proved but non‑producing reserves.
“Proved developed reserves”—Proved reserves that can be expected to be recovered through existing wells and facilities and by existing operating methods.
“Proved reserves”—Reserves of oil and natural gas that have been proved to a high degree of certainty by analysis of the producing history of a reservoir and/or by volumetric analysis of adequate geological and engineering data to be economically producible.
“Proved undeveloped reserves (PUD)”—Proved reserves that are expected to be recovered from new wells on undrilled acreage or from existing wells where a relatively major expenditure is required for recompletion.
“Recompletion”—The process of re‑entering an existing wellbore that is either producing or not producing and completing new reservoirs in an attempt to establish or increase existing production.
“Reserves”—Estimated remaining quantities of oil and natural gas and related substances anticipated to be economically producible as of a given date by application of development projects to known accumulations.
84
“Reservoir”—A porous and permeable underground formation containing a natural accumulation of producible oil and/or natural gas that is confined by impermeable rock or water barriers and is individual and separate from other reservoirs.
“Royalty interest”—An interest in an oil and natural gas property entitling the owner to a share of oil or gas production free of production costs.
“Spacing”—The distance between wells producing from the same reservoir. Spacing is often expressed in terms of acres, e.g., 40‑acre spacing, and is often established by regulatory agencies.
“Spud”—The commencement of drilling operations of a new well.
“Standardized measure of discounted future net cash flows”—The present value of estimated future net revenues to be generated from the production of proved reserves, determined in accordance with the regulations of the Securities and Exchange Commission, without giving effect to non‑property related expenses such as general and administrative expenses, debt service, future income tax expenses or depreciation, depletion and amortization; discounted using an annual discount rate of 10%.
“Trend”—A region of oil and/or natural gas production, the geographic limits of which have not been fully defined, having geological characteristics that have been ascertained through supporting geological, geophysical or other data to contain the potential for oil and/or natural gas reserves in a particular formation or series of formations.
“Unconventional formation”—A term used in the oil and natural gas industry to refer to a formation in which the targeted reservoirs generally fall into one of three categories: (1) tight sands, (2) coal beds, or (3) oil and gas shales. The reservoirs tend to cover large areas and lack the readily apparent traps, seals and discrete hydrocarbon‑water boundaries that typically define conventional reservoirs. These reservoirs generally require fracture stimulation treatments or other special recovery processes in order to produce economic flow rates
“Undeveloped acreage”—Lease acreage on which wells have not been drilled or completed to a point that would permit the production of commercial quantities of oil and natural gas, regardless of whether such acreage contains proved reserves.
“Wellbore”—The hole drilled by the bit that is equipped for oil or gas production on a completed well. Also called well or borehole.
“Working interest”—The right granted to the lessee of a property to explore for and to produce and own oil, gas, or other minerals and receive a share of the production. The working interest owners bear the exploration, development, and operating costs of the property.
85
|
|
F‑2 |
|
|
|
|
|
|
Consolidated Financial Statements |
|
|
|
|
F‑3 |
|
|
|
F‑4 |
|
|
|
F‑5 |
|
|
|
F‑6 |
|
|
|
F‑7 |
|
|
Supplemental Information on Oil and Gas Producing Activities (Unaudited) |
|
F‑43 |
|
|
F‑46 |
F-1
Report of Independent Registered Public Accounting Firm
To the Board of Directors and Stockholders of Jones Energy, Inc.:
In our opinion, the accompanying consolidated balance sheets and the related consolidated statements of operations, changes in stockholders’ equity, and of cash flows present fairly, in all material respects, the financial position of Jones Energy, Inc. and its subsidiaries as of December 31, 2016 and 2015 and the results of their operations and their cash flows for each of the three years in the period ended December 31, 2016 in conformity with accounting principles generally accepted in the United States of America. These financial statements are the responsibility of the Company’s management. Our responsibility is to express an opinion on these financial statements based on our audits. We conducted our audits of these financial statements in accordance with the standards of the Public Company Accounting Oversight Board (United States). Those standards require that we plan and perform the audit to obtain reasonable assurance about whether the financial statements are free of material misstatement. An audit includes examining, on a test basis, evidence supporting the amounts and disclosures in the financial statements, assessing the accounting principles used and significant estimates made by management, and evaluating the overall financial statement presentation. We believe that our audits provide a reasonable basis for our opinion.
/s/ PricewaterhouseCoopers LLP
Houston, Texas
March 10, 2017
F-2
Jones Energy, Inc.
December 31, 2016 and 2015
|
|
|
December 31, |
|
December 31, |
|
||
|
(in thousands of dollars) |
|
2016 |
|
2015 |
|
||
|
Assets |
|
|
|
|
|
|
|
|
Current assets |
|
|
|
|
|
|
|
|
Cash |
|
$ |
34,642 |
|
$ |
21,893 |
|
|
Accounts receivable, net |
|
|
|
|
|
|
|
|
Oil and gas sales |
|
|
26,568 |
|
|
19,292 |
|
|
Joint interest owners |
|
|
5,267 |
|
|
11,314 |
|
|
Other |
|
|
6,061 |
|
|
15,170 |
|
|
Commodity derivative assets |
|
|
24,100 |
|
|
124,207 |
|
|
Other current assets |
|
|
2,684 |
|
|
2,298 |
|
|
Total current assets |
|
|
99,322 |
|
|
194,174 |
|
|
Oil and gas properties, net, at cost under the successful efforts method |
|
|
1,743,588 |
|
|
1,635,766 |
|
|
Other property, plant and equipment, net |
|
|
2,996 |
|
|
3,873 |
|
|
Commodity derivative assets |
|
|
34,744 |
|
|
93,302 |
|
|
Other assets |
|
|
6,050 |
|
|
8,039 |
|
|
Total assets |
|
$ |
1,886,700 |
|
$ |
1,935,154 |
|
|
Liabilities and Stockholders' Equity |
|
|
|
|
|
|
|
|
Current liabilities |
|
|
|
|
|
|
|
|
Trade accounts payable |
|
$ |
36,527 |
|
$ |
7,467 |
|
|
Oil and gas sales payable |
|
|
28,339 |
|
|
32,408 |
|
|
Accrued liabilities |
|
|
25,707 |
|
|
27,011 |
|
|
Commodity derivative liabilities |
|
|
14,650 |
|
|
11 |
|
|
Other current liabilities |
|
|
2,584 |
|
|
679 |
|
|
Total current liabilities |
|
|
107,807 |
|
|
67,576 |
|
|
Long-term debt |
|
|
724,009 |
|
|
837,654 |
|
|
Deferred revenue |
|
|
7,049 |
|
|
11,417 |
|
|
Commodity derivative liabilities |
|
|
1,209 |
|
|
— |
|
|
Asset retirement obligations |
|
|
19,458 |
|
|
20,301 |
|
|
Liability under tax receivable agreement |
|
|
43,045 |
|
|
38,052 |
|
|
Other liabilities |
|
|
792 |
|
|
330 |
|
|
Deferred tax liabilities |
|
|
2,905 |
|
|
22,972 |
|
|
Total liabilities |
|
|
906,274 |
|
|
998,302 |
|
|
Commitments and contingencies (Note 15) |
|
|
|
|
|
|
|
|
Mezzanine equity |
|
|
|
|
|
|
|
|
Series A preferred stock, $0.001 par value; 1,840,000 shares issued and outstanding at December 31, 2016 and no shares issued and outstanding at December 31, 2015 |
|
|
88,975 |
|
|
— |
|
|
Stockholders' equity |
|
|
|
|
|
|
|
|
Class A common stock, $0.001 par value; 57,048,076 shares issued and 57,025,474 shares outstanding at December 31, 2016 and 30,573,509 shares issued and 30,550,907 shares outstanding at December 31, 2015 |
|
|
57 |
|
|
31 |
|
|
Class B common stock, $0.001 par value; 29,832,098 shares issued and outstanding at December 31, 2016 and 31,273,130 shares issued and outstanding at December 31, 2015 |
|
|
30 |
|
|
31 |
|
|
Treasury stock, at cost: 22,602 shares at December 31, 2016 and December 31, 2015 |
|
|
(358) |
|
|
(358) |
|
|
Additional paid-in-capital |
|
|
447,137 |
|
|
363,723 |
|
|
Retained (deficit) / earnings |
|
|
(8,652) |
|
|
36,569 |
|
|
Stockholders' equity |
|
|
438,214 |
|
|
399,996 |
|
|
Non-controlling interest |
|
|
453,237 |
|
|
536,856 |
|
|
Total stockholders’ equity |
|
|
891,451 |
|
|
936,852 |
|
|
Total liabilities and stockholders' equity |
|
$ |
1,886,700 |
|
$ |
1,935,154 |
|
The accompanying notes are an integral part of these consolidated financial statements.
F-3
Jones Energy, Inc.
Consolidated Statements of Operations
Years Ended December 31, 2016, 2015 and 2014
|
|
|
Year Ended December 31, |
|
|||||||
|
(in thousands of dollars except per share data) |
|
2016 |
|
2015 |
|
2014 |
|
|||
|
Operating revenues |
|
|
|
|
|
|
|
|
|
|
|
Oil and gas sales |
|
$ |
124,877 |
|
$ |
194,555 |
|
$ |
378,401 |
|
|
Other revenues |
|
|
2,970 |
|
|
2,844 |
|
|
2,196 |
|
|
Total operating revenues |
|
|
127,847 |
|
|
197,399 |
|
|
380,597 |
|
|
Operating costs and expenses |
|
|
|
|
|
|
|
|
|
|
|
Lease operating |
|
|
32,640 |
|
|
41,027 |
|
|
37,760 |
|
|
Production and ad valorem taxes |
|
|
7,768 |
|
|
12,130 |
|
|
22,556 |
|
|
Exploration |
|
|
6,673 |
|
|
6,551 |
|
|
3,453 |
|
|
Depletion, depreciation and amortization |
|
|
153,930 |
|
|
205,498 |
|
|
181,669 |
|
|
Accretion of ARO liability |
|
|
1,263 |
|
|
1,087 |
|
|
770 |
|
|
General and administrative |
|
|
29,640 |
|
|
33,388 |
|
|
25,763 |
|
|
Other operating |
|
|
199 |
|
|
4,188 |
|
|
— |
|
|
Total operating expenses |
|
|
232,113 |
|
|
303,869 |
|
|
271,971 |
|
|
Operating income (loss) |
|
|
(104,266) |
|
|
(106,470) |
|
|
108,626 |
|
|
Other income (expense) |
|
|
|
|
|
|
|
|
|
|
|
Interest expense |
|
|
(53,127) |
|
|
(64,458) |
|
|
(41,875) |
|
|
Gain on debt extinguishment |
|
|
99,530 |
|
|
— |
|
|
— |
|
|
Net gain (loss) on commodity derivatives |
|
|
(51,264) |
|
|
158,753 |
|
|
189,641 |
|
|
Other income (expense) |
|
|
536 |
|
|
317 |
|
|
(4,554) |
|
|
Other income (expense), net |
|
|
(4,325) |
|
|
94,612 |
|
|
143,212 |
|
|
Income (loss) before income tax |
|
|
(108,591) |
|
|
(11,858) |
|
|
251,838 |
|
|
Income tax provision (benefit) |
|
|
|
|
|
|
|
|
|
|
|
Current |
|
|
3,981 |
|
|
113 |
|
|
53 |
|
|
Deferred |
|
|
(27,767) |
|
|
(2,894) |
|
|
26,165 |
|
|
Total income tax provision (benefit) |
|
|
(23,786) |
|
|
(2,781) |
|
|
26,218 |
|
|
Net income (loss) |
|
|
(84,805) |
|
|
(9,077) |
|
|
225,620 |
|
|
Net income (loss) attributable to non-controlling interests |
|
|
(42,253) |
|
|
(6,696) |
|
|
184,484 |
|
|
Net income (loss) attributable to controlling interests |
|
$ |
(42,552) |
|
$ |
(2,381) |
|
$ |
41,136 |
|
|
Dividends and accretion on preferred stock |
|
|
(2,669) |
|
|
— |
|
|
— |
|
|
Net income (loss) attributable to common shareholders |
|
|
(45,221) |
|
|
(2,381) |
|
|
41,136 |
|
|
|
|
|
|
|
|
|
|
|
|
|
|
Earnings (loss) per share: |
|
|
|
|
|
|
|
|
|
|
|
Basic - Net income (loss) attributable to common shareholders |
|
$ |
(1.13) |
|
$ |
(0.09) |
|
$ |
3.28 |
|
|
Diluted - Net income (loss) attributable to common shareholders |
|
$ |
(1.13) |
|
$ |
(0.09) |
|
$ |
3.28 |
|
|
|
|
|
|
|
|
|
|
|
|
|
|
Weighted average Class A shares outstanding: |
|
|
|
|
|
|
|
|
|
|
|
Basic |
|
|
40,009 |
|
|
26,816 |
|
|
12,526 |
|
|
Diluted |
|
|
40,009 |
|
|
26,816 |
|
|
12,535 |
|
The accompanying notes are an integral part of these consolidated financial statements.
F-4
Jones Energy, Inc.
Statement of Changes in Stockholders’ Equity
Years Ended December 31, 2016, 2015 and 2014
|
|
|
Common Stock |
|
Treasury Stock |
|
Additional |
|
Retained |
|
|
|
|
Total |
|
||||||||||||||
|
|
|
Class A |
|
Class B |
|
Class A |
|
Paid-in- |
|
(Deficit)/ |
|
Non-controlling |
|
Stockholders' |
|
|||||||||||||
|
(amounts in thousands) |
|
Shares |
|
Value |
|
Shares |
|
Value |
|
Shares |
|
Value |
|
Capital |
|
Earnings |
|
Interest |
|
Equity |
|
|||||||
|
Balance at December 31, 2013 |
|
12,500 |
|
|
13 |
|
36,836 |
|
|
37 |
|
- |
|
|
- |
|
|
173,169 |
|
|
(2,186) |
|
|
453,091 |
|
|
624,124 |
|
|
Treasury stock |
|
(23) |
|
|
— |
|
— |
|
|
— |
|
23 |
|
|
(358) |
|
|
— |
|
|
— |
|
|
— |
|
|
(358) |
|
|
Exchange of Class B shares for Class A shares |
|
117 |
|
|
— |
|
(117) |
|
|
— |
|
— |
|
|
— |
|
|
1,554 |
|
|
— |
|
|
(1,630) |
|
|
(76) |
|
|
Stock-compensation expense |
|
— |
|
|
— |
|
— |
|
|
— |
|
— |
|
|
— |
|
|
4,040 |
|
|
— |
|
|
— |
|
|
4,040 |
|
|
Vested restricted shares |
|
28 |
|
|
— |
|
— |
|
|
— |
|
— |
|
|
— |
|
|
— |
|
|
— |
|
|
— |
|
|
— |
|
|
Net income (loss) |
|
— |
|
|
— |
|
— |
|
|
— |
|
— |
|
|
— |
|
|
— |
|
|
41,136 |
|
|
184,484 |
|
|
225,620 |
|
|
Balance at December 31, 2014 |
|
12,622 |
|
|
13 |
|
36,719 |
|
|
37 |
|
23 |
|
|
(358) |
|
|
178,763 |
|
|
38,950 |
|
|
635,945 |
|
|
853,350 |
|
|
Sale of common stock |
|
12,263 |
|
|
12 |
|
— |
|
|
— |
|
— |
|
|
— |
|
|
123,189 |
|
|
— |
|
|
— |
|
|
123,201 |
|
|
Exchange of Class B shares for Class A shares |
|
5,446 |
|
|
6 |
|
(5,446) |
|
|
(6) |
|
— |
|
|
— |
|
|
54,209 |
|
|
— |
|
|
(92,393) |
|
|
(38,184) |
|
|
Stock-compensation expense |
|
67 |
|
|
— |
|
— |
|
|
— |
|
— |
|
|
— |
|
|
7,562 |
|
|
— |
|
|
— |
|
|
7,562 |
|
|
Vested restricted shares |
|
153 |
|
|
— |
|
— |
|
|
— |
|
— |
|
|
— |
|
|
— |
|
|
— |
|
|
— |
|
|
— |
|
|
Net income (loss) |
|
— |
|
|
— |
|
— |
|
|
— |
|
— |
|
|
— |
|
|
— |
|
|
(2,381) |
|
|
(6,696) |
|
|
(9,077) |
|
|
Balance at December 31, 2015 |
|
30,551 |
|
$ |
31 |
|
31,273 |
|
$ |
31 |
|
23 |
|
$ |
(358) |
|
$ |
363,723 |
|
$ |
36,569 |
|
$ |
536,856 |
|
$ |
936,852 |
|
|
Stock-compensation expense |
|
— |
|
|
— |
|
— |
|
|
— |
|
— |
|
|
— |
|
|
7,425 |
|
|
— |
|
|
— |
|
|
7,425 |
|
|
Vested restricted shares |
|
385 |
|
|
— |
|
— |
|
|
— |
|
— |
|
|
— |
|
|
— |
|
|
— |
|
|
— |
|
|
— |
|
|
Cash tax distribution |
|
— |
|
|
— |
|
— |
|
|
— |
|
— |
|
|
— |
|
|
— |
|
|
— |
|
|
(17,319) |
|
|
(17,319) |
|
|
Sale of common stock |
|
24,648 |
|
|
25 |
|
— |
|
|
— |
|
— |
|
|
— |
|
|
65,421 |
|
|
— |
|
|
— |
|
|
65,446 |
|
|
Exchange of Class B shares for Class A shares |
|
1,441 |
|
|
1 |
|
(1,441) |
|
|
(1) |
|
— |
|
|
— |
|
|
10,568 |
|
|
— |
|
|
(24,047) |
|
|
(13,479) |
|
|
Dividends and accretion on preferred stock |
|
— |
|
|
— |
|
— |
|
|
— |
|
— |
|
|
— |
|
|
— |
|
|
(2,669) |
|
|
— |
|
|
(2,669) |
|
|
Net income (loss) |
|
— |
|
|
— |
|
— |
|
|
— |
|
— |
|
|
— |
|
|
— |
|
|
(42,552) |
|
|
(42,253) |
|
|
(84,805) |
|
|
Balance at December 31, 2016 |
|
57,025 |
|
$ |
57 |
|
29,832 |
|
$ |
30 |
|
23 |
|
$ |
(358) |
|
$ |
447,137 |
|
$ |
(8,652) |
|
$ |
453,237 |
|
$ |
891,451 |
|
The accompanying notes are an integral part of these consolidated financial statements.
F-5
Jones Energy, Inc.
Consolidated Statements of Cash Flows
Years Ended December 31, 2016, 2015 and 2014
|
|
|
Year ended December 31, |
|
|||||||
|
(in thousands of dollars) |
|
2016 |
|
2015 |
|
2014 |
|
|||
|
Cash flows from operating activities |
|
|
|
|
|
|
|
|
|
|
|
Net income (loss) |
|
$ |
(84,805) |
|
$ |
(9,077) |
|
$ |
225,620 |
|
|
Adjustments to reconcile net income (loss) to net cash provided by |
|
|
|
|
|
|
|
|
|
|
|
Depletion, depreciation, and amortization |
|
|
153,930 |
|
|
205,498 |
|
|
181,669 |
|
|
Exploration (dry hole and lease abandonment) |
|
|
6,261 |
|
|
5,250 |
|
|
2,952 |
|
|
Accretion of ARO liability |
|
|
1,263 |
|
|
1,087 |
|
|
770 |
|
|
Amortization of debt issuance costs |
|
|
4,060 |
|
|
6,043 |
|
|
6,878 |
|
|
Stock compensation expense |
|
|
7,425 |
|
|
7,562 |
|
|
4,040 |
|
|
Deferred and other non-cash compensation expense |
|
|
804 |
|
|
455 |
|
|
758 |
|
|
Amortization of deferred revenue |
|
|
(2,384) |
|
|
(1,960) |
|
|
(1,154) |
|
|
(Gain) loss on commodity derivatives |
|
|
51,264 |
|
|
(158,753) |
|
|
(189,641) |
|
|
(Gain) loss on sales of assets |
|
|
(14) |
|
|
3 |
|
|
(297) |
|
|
(Gain) on debt extinguishment |
|
|
(99,530) |
|
|
— |
|
|
— |
|
|
Deferred income tax provision |
|
|
(27,767) |
|
|
(2,892) |
|
|
26,165 |
|
|
Other - net |
|
|
418 |
|
|
(961) |
|
|
376 |
|
|
Changes in operating assets and liabilities |
|
|
|
|
|
|
|
|
|
|
|
Accounts receivable |
|
|
2,276 |
|
|
64,510 |
|
|
(2,453) |
|
|
Other assets |
|
|
(675) |
|
|
(432) |
|
|
(669) |
|
|
Accrued interest expense |
|
|
(4,727) |
|
|
7,050 |
|
|
7,823 |
|
|
Accounts payable and accrued liabilities |
|
|
17,901 |
|
|
(54,534) |
|
|
2,482 |
|
|
Net cash provided by operations |
|
|
25,700 |
|
|
68,849 |
|
|
265,319 |
|
|
Cash flows from investing activities |
|
|
|
|
|
|
|
|
|
|
|
Additions to oil and gas properties |
|
|
(264,462) |
|
|
(311,305) |
|
|
(474,619) |
|
|
Net adjustments to purchase price of properties acquired |
|
|
— |
|
|
— |
|
|
15,709 |
|
|
Proceeds from sales of assets |
|
|
1,645 |
|
|
41 |
|
|
448 |
|
|
Acquisition of other property, plant and equipment |
|
|
(310) |
|
|
(1,101) |
|
|
(1,683) |
|
|
Current period settlements of matured derivative contracts |
|
|
132,265 |
|
|
144,145 |
|
|
(3,654) |
|
|
Net cash (used in) investing |
|
|
(130,862) |
|
|
(168,220) |
|
|
(463,799) |
|
|
Cash flows from financing activities |
|
|
|
|
|
|
|
|
|
|
|
Proceeds from issuance of long-term debt |
|
|
130,000 |
|
|
85,000 |
|
|
170,000 |
|
|
Repayment under long-term debt |
|
|
(62,000) |
|
|
(335,000) |
|
|
(468,000) |
|
|
Proceeds from senior notes |
|
|
— |
|
|
236,475 |
|
|
500,000 |
|
|
Purchase of senior notes |
|
|
(84,589) |
|
|
— |
|
|
— |
|
|
Payment of debt issuance costs |
|
|
— |
|
|
(1,556) |
|
|
(13,416) |
|
|
Payment of dividends on preferred stock |
|
|
(1,615) |
|
|
— |
|
|
— |
|
|
Net distributions paid to JEH unitholders |
|
|
(17,319) |
|
|
— |
|
|
— |
|
|
Proceeds from sale of common stock |
|
|
65,446 |
|
|
122,779 |
|
|
— |
|
|
Proceeds from sale of preferred stock |
|
|
87,988 |
|
|
— |
|
|
— |
|
|
Purchases of treasury stock |
|
|
— |
|
|
— |
|
|
(358) |
|
|
Net cash provided by financing |
|
|
117,911 |
|
|
107,698 |
|
|
188,226 |
|
|
Net increase (decrease) in cash |
|
|
12,749 |
|
|
8,327 |
|
|
(10,254) |
|
|
Cash |
|
|
|
|
|
|
|
|
|
|
|
Beginning of period |
|
|
21,893 |
|
|
13,566 |
|
|
23,820 |
|
|
End of period |
|
$ |
34,642 |
|
$ |
21,893 |
|
$ |
13,566 |
|
|
Supplemental disclosure of cash flow information |
|
|
|
|
|
|
|
|
|
|
|
Cash paid for interest |
|
$ |
53,816 |
|
$ |
52,796 |
|
$ |
29,560 |
|
|
Cash paid for income taxes |
|
|
— |
|
|
(155) |
|
|
155 |
|
|
Change in accrued additions to oil and gas properties |
|
|
9,325 |
|
|
(111,210) |
|
|
49,025 |
|
|
Asset retirement obligations incurred, including changes in estimate |
|
|
(1,276) |
|
|
6,371 |
|
|
2,041 |
|
The accompanying notes are an integral part of these consolidated financial statements.
F-6
Jones Energy, Inc.
Notes to the Consolidated Financial Statements
1. Organization and Description of Business
Organization
Jones Energy, Inc. (the “Company”) was formed in March 2013 as a Delaware corporation to become a publicly-traded entity and the holding company of Jones Energy Holdings, LLC (“JEH”). As the sole managing member of JEH, the Company is responsible for all operational, management and administrative decisions relating to JEH’s business and consolidates the financial results of JEH and its subsidiaries.
JEH was formed as a Delaware limited liability company on December 16, 2009 through investments made by the Jones family and through private equity funds managed by Metalmark Capital and Wells Fargo Energy Capital (collectively, the “Class B shareholders”). JEH acts as a holding company of operating subsidiaries that own and operate assets that are used in the exploration, development, production and acquisition of oil and natural gas properties.
The Company’s certificate of incorporation authorizes two classes of common stock, Class A common stock and Class B common stock. The Class B common stock is held by the owners of JEH prior to the Company’s initial public offering (“IPO”) and can be exchanged (together with a corresponding number of common units representing membership interests in JEH (“JEH Units”)) for shares of Class A common stock on a one-for-one basis, subject to customary conversion rate adjustments for stock splits, stock dividends and reclassifications and other similar transactions. The Class B common stock has no economic rights but entitles its holders to one vote on all matters to be voted on by the Company’s stockholders generally. As of December 31, 2016, the Company held 57,025,474 JEH Units and all of the preferred units representing membership interests in JEH, and the remaining 29,832,098 JEH Units are held by the Class B shareholders. The Class B shareholders have no voting rights with respect to their economic interest in JEH, resulting in the Company reporting this ownership interest as a non-controlling interest.
The Company’s certificate of incorporation also authorizes the Board of Directors of the Company to establish one or more series of preferred stock. Unless required by law or by any stock exchange on which our common stock is listed, the authorized shares of preferred stock will be available for issuance without further action. Rights and privileges associated with shares of preferred stock are subject to authorization by the Board of Directors of the Company and may differ from those of any and all other series at any time outstanding.
On August 25, 2016, the Company issued 1.84 million shares of its 8.0% Series A Perpetual Convertible preferred stock, par value $0.001 per share (the “Series A preferred stock”), pursuant to a registered public offering at $50 per share, for gross proceeds of approximately $92 million, before underwriting discounts and commissions of $3.68 million. See Note 12, “Stockholders’ and Mezzanine equity”.
Description of Business
The Company is engaged in the exploration, development, production and acquisition of oil and natural gas properties in the mid-continent United States, spanning areas of Texas and Oklahoma. The Company’s assets are located within the Anadarko and Arkoma basins, and are owned by JEH and its operating subsidiaries. The Company is headquartered in Austin, Texas.
2. Significant Accounting Policies
Basis of Presentation
The accompanying consolidated financial statements have been prepared in accordance with accounting principles generally accepted in the United States of America (“GAAP”) and in accordance with the rules and regulations of the Securities and Exchange Commission. All significant intercompany transactions and balances have been eliminated in consolidation. The Company’s financial position as of December 31, 2016 and 2015 and the financial statements reported for each of the three years in the period ended December 31, 2016 include the Company and all of its subsidiaries
Certain prior period amounts have been reclassified to conform to the current presentation.
F-7
Segment Information
The Company operates in one industry segment, which is the exploration, development and production of oil and natural gas, and all of its operations are conducted in one geographic area of the United States.
Use of Estimates
In preparing the accompanying financial statements, management has made certain estimates and assumptions that affect the reported amounts of assets and liabilities, disclosure of contingent liabilities, and the reported amounts of revenue and expenses during the reporting period. Actual results could differ from these estimates. Changes in estimates are recorded prospectively.
Significant assumptions are required in the valuation of proved and unproved oil and natural gas reserves, which affect the Company’s estimates of depletion expense, impairment, and the allocation of value in our business combinations. Significant assumptions are also required in the Company’s estimates of the net gain or loss on commodity derivative assets and liabilities, fair value associated with business combinations, and asset retirement obligations (“ARO”).
Cash
Cash and cash equivalents include highly liquid investments with a maturity of three months or less. At times, the amount of cash on deposit in financial institutions exceeds federally insured limits. Management monitors the soundness of the financial institutions it does business with, and believes the Company’s risk is not significant.
Accounts Receivable
Accounts receivable—Oil and gas sales consist of uncollateralized accrued revenues due under normal trade terms, generally requiring payment within 30 to 60 days of production. Accounts receivable—Joint interest owners consist of uncollateralized joint interest owner obligations due within 30 days of the invoice date. Accounts receivable—Other consists at December 31, 2016 and at December 31, 2015 of derivative positions not settled as of the balance sheet date. No interest is charged on past‑due balances. The Company routinely assesses the recoverability of all material trade, joint interest and other receivables to determine their collectability, and reduces the carrying amounts by a valuation allowance that reflects management’s best estimate of the amounts that may not be collected. As of December 31, 2016 and 2015, the Company did not have significant allowances for doubtful accounts.
Concentration of Risk
Substantially all of the Company’s accounts receivable are related to the oil and gas industry. This concentration of entities may affect the Company’s overall credit risk in that these entities may be affected similarly by changes in economic and other conditions, including declines in commodity prices. As of December 31, 2016, 77% of Accounts receivable—Oil and gas sales were due from four purchasers and 48% of Accounts receivable‑Joint interest owners were due from five working interest owners. As of December 31, 2015, 68% of Accounts receivable—Oil and gas sales are due from four purchasers and 80% of Accounts receivable—Joint interest owners are due from five working interest owners. As of December 31, 2014, 70% of Accounts receivable—Oil and gas sales were due from five purchasers and 67% of Accounts receivable—Joint interest owners were due from five working interest owners. If any or all of these significant counterparties were to fail to pay amounts due to the Company, the Company’s financial position and results of operations could be materially and adversely affected.
Dependence on Major Customers
The Company maintains a portfolio of crude oil and natural gas marketing contracts with large, established refiners and oil and gas purchasers. During the year ended December 31, 2016, the largest purchasers of our production were Plains Marketing LP (“Plains Marketing”) and ETC Field Services LLC, which accounted for approximately 37% and 24% of consolidated oil and gas sales, respectively. During the year ended December 31, 2015, the largest purchasers of our production were Valero Energy Corp. (“Valero”), ETC Field Services LLC, Plains Marketing LP, and NGL Energy Partners LP, which accounted for approximately 18%, 17%, 16%, and 15% of consolidated oil and gas sales, respectively. During the year ended December 31, 2014, the largest purchasers of our production were Valero Energy Corp. (“Valero”), NGL Energy Partners LP, PVR Midstream LLC (“PVR Midstream”), Plains Marketing LP (“Plains Marketing”), and Monarch Natural Gas LLC which accounted for approximately 22%, 12%, 12%, 10% and 10% of consolidated oil and gas sales, respectively.
F-8
Management believes that there are alternative purchasers and that it may be necessary to establish relationships with such new purchasers. However, there can be no assurance that the Company can establish such relationships and that those relationships will result in an increased number of purchasers. Although the Company is exposed to a concentration of credit risk, management believes that all of the Company’s purchasers are credit worthy.
Dependence on Suppliers
The Company’s industry is cyclical, and from time to time, there can be an imbalance between the supply of and demand for drilling rigs, equipment, services, supplies and qualified personnel. During periods of oversupply, there can be financial pressure on suppliers. If the financial pressure leads to work interruptions or stoppages, the Company could be materially and adversely affected. Management believes that there are adequate alternative providers of drilling and completion services although it may become necessary to establish relationships with new contractors. However, there can be no assurance that the Company can establish such relationships and that those relationships will result in increased availability of drilling rigs or other services, or that they could be obtained on the same terms.
Oil and Gas Properties
The Company accounts for its oil and natural gas exploration and production activities under the successful efforts method of accounting.
Costs to acquire mineral interests in oil and natural gas properties are capitalized. Costs to drill and equip development wells and the related asset retirement costs are capitalized. The costs to drill and equip exploratory wells are capitalized pending determination of whether the Company has discovered proved commercial reserves. If proved commercial reserves are not discovered, such drilling costs are charged to expense. In some circumstances, it may be uncertain whether proved commercial reserves have been found when drilling has been completed. Such exploratory well drilling costs may continue to be capitalized if the anticipated reserve quantity is sufficient to justify its completion as a producing well and sufficient progress in assessing the reserves and the economic and operating viability of the project is being made.
The Company capitalizes interest on expenditures for significant exploration and development projects that last more than six months while activities are in progress to bring the assets to their intended use.
On the sale or retirement of a proved field, the cost and related accumulated depletion, depreciation and amortization are eliminated from the field accounts, and the resultant gain or loss is recognized.
Capitalized amounts attributable to proved oil and gas properties are depleted by the unit‑of‑production method over the life of proved reserves, using the unit conversion ratio of six thousand cubic feet of gas to one barrel of oil equivalent. Depletion of the costs of wells and related equipment and facilities, including capitalized asset retirement costs, net of salvage values, is computed using proved developed reserves. The reserve base used to calculate depreciation, depletion, and amortization for leasehold acquisition costs and the cost to acquire proved properties is the sum of proved developed reserves and proved undeveloped reserves.
The Company reviews its proved oil and natural gas properties, including related wells and equipment, for impairment by comparing expected undiscounted future cash flows at a producing field level to the net capitalized cost of the asset. If the future undiscounted cash flows, based on the Company’s estimate of future commodity prices, operating costs, and production, are lower than the net capitalized cost, the capitalized cost is reduced to fair value. Fair value is calculated by discounting the future cash flows at an appropriate risk‑adjusted discount rate.
The Company evaluates its unproved properties for impairment on a property‑by‑property basis. The Company’s unproved property consists of acquisition costs related to its undeveloped acreage. The Company reviews the unproved property for indicators of impairment based on the Company’s current exploration plans with consideration given to results of any drilling and seismic activity during the period and known information regarding exploration and development activity by other companies on adjacent blocks.
On the sale of an entire interest in an unproved property, gain or loss on the sale is recognized, taking into consideration the amount of any recorded impairment if the property had been assessed individually. If a partial interest in an unproved property is sold, the amount received is treated as a reduction of the cost of the interest retained.
F-9
Other Property, Plant and Equipment
Other property, plant and equipment is depreciated on a straight‑line basis over the estimated useful lives of the property, plant and equipment, which range from three years to ten years.
Oil and Gas Sales Payable
Oil and gas sales payable represents amounts collected from purchasers for oil and gas sales, which are due to other revenue interest owners. Generally, the Company is required to remit amounts due under these liabilities within 60 days of receipt.
Commodity Derivatives
The Company records its commodity derivative instruments on the Consolidated Balance Sheet as either an asset or liability measured at its fair value. Changes in the derivative’s fair value are recognized currently in earnings, unless specific hedge accounting criteria are met. During the years ended December 31, 2016, 2015 and 2014, the Company elected not to designate any of its commodity price risk management activities as cash flow or fair value hedges. The changes in the fair values of outstanding financial instruments are recognized as gains or losses in the period of change.
Although the Company does not designate its commodity derivative instruments as cash‑flow hedges, management uses those instruments to reduce the Company’s exposure to fluctuations in commodity prices related to its natural gas and oil production. Net gains and losses, at fair value, are included on the Consolidated Balance Sheet as current or noncurrent assets or liabilities based on the anticipated timing of cash settlements under the related contracts. Changes in the fair value of commodity derivative contracts are recorded in earnings as they occur and are included in other income (expense) on the Consolidated Statement of Operations. See Note 7, “Fair Value Measurement,” for disclosure about the fair values of commodity derivative instruments.
Asset Retirement Obligations
The Company's asset retirement obligations ("ARO") consist of future plugging and abandonment expenses on oil and natural gas properties. The Company estimates an ARO for each well in the period in which it is incurred based on estimated present value of plugging and abandonment costs, increased by an inflation factor to the estimated date that the well would be plugged. The resulting liability is recorded by increasing the carrying amount of the related long- lived asset. The liability is then accreted to its then-present value each period and the capitalized cost is depleted over the useful life of the related asset. If the liability is settled for an amount other than the recorded amount, a gain or loss is recognized. The ARO is classified as current or noncurrent based on the expect timing of payments.
Revenue Recognition
Revenues from the sale of crude oil, natural gas, and natural gas liquids are valued at the estimated sales price and recognized when the product is delivered at a fixed or determinable price, title has transferred, collectability is reasonably assured and evidenced by a contract. The Company follows the “sales method” of accounting for its oil and natural gas revenue, so it recognizes revenue on all crude oil, natural gas, and natural gas liquids sold to purchasers. A receivable or liability is recognized only to the extent that the Company has an imbalance on a specific property greater than the expected remaining proved reserves. Any such imbalances were not significant as of December 31, 2016, 2015, and 2014.
Income Taxes
The Company records a federal and state income tax liability associated with its status as a corporation. The Company recognizes a tax liability on its share of pre-tax book income, exclusive of the non-controlling interest.
Income taxes are accounted for under the asset and liability method, which requires recognition of deferred tax assets and liabilities for the expected future tax consequences of events that have been included in the financial statements. Under this method, deferred tax assets and liabilities are determined based on the differences between the financial statements and tax basis of assets and liabilities using enacted tax rates in effect for the year in which differences are expected to be recovered or settled pursuant to the provisions of ASC 740—Income Taxes. The effect of a change in tax rates on deferred tax assets and liabilities is recognized in income in the period that includes the enactment date.
F-10
The Company records a valuation allowance if it is deemed more likely than not that all or a portion of its deferred income tax assets will not be realized. In addition, income tax rules and regulations are subject to interpretation and the application of those rules and regulations require judgment by the Company and may be challenged by the taxation authorities. The Company follows a two‑step approach for recognizing and measuring tax benefits taken or expected to be taken in a tax return and disclosures regarding uncertainties in income tax positions. Only tax positions that meet the more likely than not recognition threshold are recognized. The Company’s policy is to include any interest and penalties recorded on uncertain tax positions as a component of income tax expense. The Company’s unrecognized tax benefits or related interest and penalties are immaterial.
Comprehensive Income
The Company has no elements of comprehensive income other than net income.
Recent Accounting Pronouncements
Adopted in the current year:
In August 2014, the Financial Accounting Standards Board (the “FASB”) issued Accounting Standards Update (“ASU”) 2014-15, “Presentation of Financial Statements—Going Concern (Subtopic 205-40): Disclosure of Uncertainties about an Entity’s Ability to Continue as a Going Concern.” This ASU requires management to evaluate whether there are conditions or events that raise substantial doubt about an entity’s ability to continue as a “going concern” and to provide disclosures when certain criteria are met. Substantial doubt exists when relevant conditions and events, considered in the aggregate, indicate that it is probable that the entity will be unable to meet its obligations as they become due within one year after the date that the financial statements are issued (or available to be issued). The amendments are effective for interim and annual reporting periods beginning after December 15, 2016. Early adoption is permitted and the Company chose to early adopt ASU 2014-15 beginning October 1, 2016. Adoption did not have a material impact on the financial position, cash flows or results of operations.
In January 2015, the FASB issued ASU 2015-01, “Income Statement—Extraordinary and Unusual Items.” This ASU removes the concept of extraordinary items from GAAP. Under existing guidance, an entity is required to separately disclose extraordinary items, net of tax, in the income statement after income from continuing operations if an event or transaction is of an unusual nature and occurs infrequently. This separate, net of tax presentation will no longer be allowed. The amendments are effective for interim and annual reporting periods beginning after December 15, 2015. Therefore, the Company adopted ASU 2015-01 beginning January 1, 2016. Adoption did not have a material impact on the financial position, cash flows or results of operations.
In April 2015, the FASB issued ASU 2015-03, “Interest—Imputation of Interest” (Subtopic 835-30): “Simplifying the Presentation of Debt Issuance Costs.” Entities that have historically presented debt issuance costs as an asset, related to a recognized debt liability, will be required to present those costs as a direct deduction from the carrying amount of that debt liability. The ASU does not change the recognition, measurement, or subsequent measurement guidance for debt issuance costs. Adoption of this ASU will be applied retrospectively. In August 2015, the FASB issued ASU 2015-15, “Interest—Imputation of Interest” (Subtopic 835-30), which addresses the presentation or subsequent measurement of debt issuance costs related to line-of-credit arrangements, given the absence of authoritative guidance within ASU 2015-03 for debt issuance costs related to line-of-credit arrangements. The amendments are effective for interim and annual reporting periods beginning after December 15, 2015. Therefore, the Company adopted ASU 2015-03 beginning January 1, 2016. Changes to the balance sheet have been applied on a retrospective basis. This resulted in the reclassification of debt issuance costs of $10.3 million associated with our Senior Unsecured Notes from Other assets to Long-term debt in the Consolidated Balance Sheet for the period ended December 31, 2015. Adoption did not have a material impact on the financial position, cash flows or results of operations.
In September 2015, the FASB issued ASU 2015-16, “Business Combinations” (Topic 805): “Simplifying the Measurement-Period Adjustments.” The new standard eliminates the requirement that an acquirer in a business combination account for measurement-period adjustments retrospectively. Instead, an acquirer will recognize a measurement-period adjustment during the period in which it determines the amount of the adjustment. The standard is effective for interim and annual reporting periods beginning after December 15, 2015. Therefore, the Company adopted ASU 2015-16 beginning January 1, 2016. Adoption did not have a material impact on the financial position, cash flows or results of operations.
F-11
In August 2016, the FASB issued ASU 2016‑15, “Statement of Cash Flows” (Topic 230). This amendment is intended to reduce diversity in practice in how certain transactions are classified in the statement of cash flows, specifically in regard to (1) debt prepayment or debt extinguishment costs, (2) settlement of zerocoupon debt instruments, (3) contingent consideration payments made after a business combination, (4) proceeds from the settlement of insurance claims, (5) proceeds from the settlement of corporateowned life insurance policies, including bankowned life insurance policies, (6) distributions received from equity method investments, (7) beneficial interests in securitization transactions, and (8) separately identifiable cash flows and application of the predominance principle. The amendments are effective for interim and annual reporting periods beginning after December 15, 2017. Early adoption is permitted and the Company chose to early adopt ASU 2016-15 beginning October 1, 2016. Adoption did not have a material impact on the financial position, cash flows or results of operations.
In November 2016, the FASB issued ASU 2016‑18, “Statement of Cash Flows: Restricted Cash” (Topic 230). The new standard requires that the statement of cash flows explain the change during the period in the total of cash, cash equivalents, and amounts generally described as restricted cash or restricted cash equivalents. This standard also requires entities to reconcile such total to amounts on the balance sheet and disclose the nature of the restrictions. The standard is effective for interim and annual reporting periods beginning after December 15, 2017. Early adoption is permitted and the Company chose to early adopt ASU 2016-18 beginning October 1, 2016. Adoption did not have a material impact on the financial position, cash flows or results of operations.
In January 2017, the FASB issued ASU 2017‑01, “Business Combinations” (Topic 805). This amendment is intended to clarify the definition of a business. The standard is effective for interim and annual reporting periods beginning after December 15, 2017. Early adoption is permitted and the Company chose to early adopt ASU 2017-01 beginning October 1, 2016. Adoption did not have a material impact on the financial position, cash flows or results of operations.
To be adopted in a future period:
In May 2014, the FASB issued ASU 2014‑09, “Revenue from Contracts with Customers,” which creates a new topic in the Accounting Standards Codification (“ASC”), topic 606, “Revenue from Contracts with Customers.” This ASU sets forth a five‑step model for determining when and how revenue is recognized. Under the model, an entity will be required to recognize revenue to depict the transfer of goods or services to a customer at an amount reflecting the consideration it expects to receive in exchange for those goods or services. Additional disclosures will be required to describe the nature, amount, timing and uncertainty of revenue and cash flows arising from customer contracts. In August 2015, the FASB issued ASU 2015‑14, which deferred the effective date of ASU 2014‑09 by one year. The amendments are now effective for interim and annual reporting periods beginning after December 15, 2017 and may be applied on either a full or modified retrospective basis. Early adoption is permitted. The Company is in the early stages of evaluating the effect that the adoption of Update 2014‑09 and Update 2015‑14 will have on our financial statements. At this time, we are performing a review on a sample of revenue contracts to determine the impact of adoption. The Company will continue to further evaluate the effect that the adoption of Update 2014-09 and Update 2015-14 will have on our financial statements. We anticipate adoption of Update 2014‑09 and Update 2015‑14 effective as of January 1, 2018.
In February 2016, the FASB issued ASU 2016‑02, “Leases” (Topic 842). This amendment requires, among other things, that lessees recognize the following for all leases (with the exception of short‑term leases) at the commencement date: (1) a lease liability, which is a lessee’s obligation to make lease payments arising from a lease, measured on a discounted basis; and (2) a right‑of‑use asset, which is an asset that represents the lessee’s right to use, or control the use of, a specified asset for the lease term. Lessees and lessors must apply a modified retrospective transition approach for leases existing at, or entered into after, the beginning of the earliest comparative period presented in the financial statements. The amendments are effective for interim and annual reporting periods beginning after December 15, 2018. The Company is currently evaluating the impacts of the amendments to our financial statements and accounting practices for leases. We anticipate adoption of ASU 2016-02 effective as of January 1, 2018.
In March 2016, the FASB issued ASU 2016‑09, “Compensation—Stock Compensation” (Topic 718). This amendment is intended to simplify the accounting for share-based payment awards to employees, specifically in regard to (1) the income tax consequences, (2) classification of awards as either equity or liabilities, and (3) classification on the statement of cash flows. The amendments are effective for interim and annual reporting periods beginning after December 15, 2016. Therefore, the Company has adopted ASU 2016-09 effective as of January 1, 2017. Adoption did not have a material impact on the financial position, cash flows or results of operations.
F-12
3. Acquisitions
During the year ended December 31, 2016, the Company entered into several purchase and sale agreements (as described below). No business combinations occurred during the twelve months ended December 31, 2015 and 2014.
Merge Acquisition
On August 18, 2016, JEH entered into a definitive purchase and sale agreement with SCOOP Energy Company, LLC, an Oklahoma limited liability company, to acquire oil and gas properties located in the Merge area of the STACK/SCOOP (the “Merge”) play in Central Oklahoma (the “Merge Acquisition”). The oil and gas properties acquired in the Merge Acquisition principally consist of approximately 18,000 undeveloped net acres in Canadian, Grady and McClain Counties, Oklahoma. The Company closed the Merge Acquisition on September 22, 2016, for cash consideration of $136.8 million. This transaction has been accounted for as an asset acquisition. The Company used proceeds from our equity offerings to fund a portion of the purchase. See Note 12, “Stockholders’ and Mezzanine equity”.
Anadarko Acquisition
On August 3, 2016, JEH entered into a definitive agreement to acquire producing and undeveloped oil and gas assets in the Western Anadarko basin (the “Anadarko Acquisition”) for $27.1 million, subject to customary closing adjustments. Upon final closing, which occurred October 24, 2016, the transaction closed for $25.9 million. This transaction was accounted for as a business combination. The Company allocated $32.3 million to “Oil and gas properties,” with $3.0 million allocated to “Unproved” properties, $17.0 million allocated to “Proved” properties, and $12.3 million allocated to “Wells and equipment and related facilities”, based on the respective fair values of the assets acquired. Additionally, the Company allocated $6.4 million to our ARO liability associated with those proved properties. As of December 31, 2016, the measurement-period remains open. The Anadarko Acquisition did not result in a significant impact to revenues or net income and as such, pro forma financial information was not included. The Company funded the Anadarko Acquisition with cash on hand.
The assets acquired in the Anadarko Acquisition included interests in 174 wells, 59% of which were operated by the company, and approximately 25,000 net acres in Lipscomb and Ochiltree Counties in the Texas Panhandle. The Company closed the Anadarko Acquisition on August 25, 2016, at which time, the acquired acreage was producing approximately 900 barrels of oil equivalent per day.
4. Properties, Plant and Equipment
Oil and Gas Properties
The Company accounts for its oil and natural gas exploration and production activities under the successful efforts method of accounting. Oil and gas properties consisted of the following at December 31, 2016 and 2015:
|
|
|
December 31, |
|
December 31, |
|
||
|
(in thousands of dollars) |
|
2016 |
|
2015 |
|
||
|
Mineral interests in properties |
|
|
|
|
|
|
|
|
Unproved |
|
$ |
213,153 |
|
$ |
75,308 |
|
|
Proved |
|
|
1,054,683 |
|
|
1,031,669 |
|
|
Wells and equipment and related facilities |
|
|
1,395,291 |
|
|
1,289,323 |
|
|
|
|
|
2,663,127 |
|
|
2,396,300 |
|
|
Less: Accumulated depletion and impairment |
|
|
(919,539) |
|
|
(760,534) |
|
|
Net oil and gas properties |
|
$ |
1,743,588 |
|
$ |
1,635,766 |
|
One exploratory well was drilled during the year ended December 31, 2016, for which associated costs of $1.3 million were capitalized. There were no exploratory wells drilled during the year ended December 31, 2015 and, as such, no associated costs were capitalized. No exploratory wells resulted in exploration expense during either year.
The Company did not capitalize any interest during the years ended December 31, 2016 and 2015 as no projects lasted more than six months. Costs incurred to maintain wells and related equipment are charged to expense as incurred.
F-13
Depletion of oil and gas properties amounted to $152.7 million, $204.2 million, and $180.6 million for the years ended December 31, 2016, 2015, and 2014, respectively.
Due to recent fluctuations in forward commodity prices, the Company continued to monitor its proved and unproved properties for impairment. No impairments of proved or unproved properties were recorded in 2016, 2015, or 2014.
Other Property, Plant and Equipment
Other property, plant and equipment consisted of the following at December 31, 2016 and 2015:
|
|
|
December 31, |
|
December 31, |
|
||
|
(in thousands of dollars) |
|
2016 |
|
2015 |
|
||
|
Leasehold improvements |
|
$ |
1,213 |
|
$ |
1,260 |
|
|
Furniture, fixtures, computers and software |
|
|
4,170 |
|
|
4,090 |
|
|
Vehicles |
|
|
1,677 |
|
|
1,537 |
|
|
Aircraft |
|
|
910 |
|
|
910 |
|
|
Other |
|
|
284 |
|
|
247 |
|
|
|
|
|
8,254 |
|
|
8,044 |
|
|
Less: Accumulated depreciation and amortization |
|
|
(5,258) |
|
|
(4,171) |
|
|
Net other property, plant and equipment |
|
$ |
2,996 |
|
$ |
3,873 |
|
Depreciation and amortization of other property, plant and equipment amounted to $1.2 million, $1.3 million, and $1.1 million during the years ended December 31, 2016, 2015 and 2014, respectively.
5. Long‑Term Debt
Long-term debt consisted of the following at December 31, 2016 and 2015:
|
(in thousands of dollars) |
|
December 31, 2016 |
|
December 31, 2015 |
|
||
|
Revolver |
|
$ |
178,000 |
|
$ |
110,000 |
|
|
2022 Notes |
|
|
409,148 |
|
|
500,000 |
|
|
2023 Notes |
|
|
150,000 |
|
|
250,000 |
|
|
Total principal amount |
|
|
737,148 |
|
|
860,000 |
|
|
Less: unamortized discount |
|
|
(6,240) |
|
|
(12,088) |
|
|
Less: debt issuance costs, net |
|
|
(6,899) |
|
|
(10,258) |
|
|
Total carrying amount |
|
$ |
724,009 |
|
$ |
837,654 |
|
Senior Unsecured Notes
On April 1, 2014, JEH and Jones Energy Finance Corp., JEH’s wholly owned subsidiary formed for the sole purpose of co-issuing certain of JEH’s debt (collectively, the “Issuers”), sold $500.0 million in aggregate principal amount of the Issuers’ 6.75% senior notes due 2022 (the “2022 Notes”). The Company used the net proceeds from the issuance of the 2022 Notes to repay all outstanding borrowings under the Term Loan (as defined below) ($160.0 million), a portion of the outstanding borrowings under the Revolver (as defined below) ($308.0 million) and for working capital and general corporate purposes. The Company subsequently terminated the Term Loan in accordance with its terms. The 2022 Notes bear interest at a rate of 6.75% per year, payable semi-annually on April 1 and October 1 of each year beginning October 1, 2014. The 2022 Notes were registered in March 2015.
On February 23, 2015, the Issuers sold $250.0 million in aggregate principal amount of 9.25% senior notes due 2023 (the “2023 Notes”) in a private placement to affiliates of GSO Capital Partners LP and Magnetar Capital LLC. The 2023 Notes were issued at a discounted price equal to 94.59% of the principal amount. The Company used the $236.5 million net proceeds from the issuance of the 2023 Notes to repay outstanding borrowings under the Revolver and for working capital and general corporate purposes. The 2023 Notes bear interest at a rate of 9.25% per year, payable semi-annually on March 15 and September 15 of each year beginning September 15, 2015. The 2023 Notes were registered in February 2016.
During the year ended December 31, 2016, through several open market and privately negotiated purchases, the Company purchased an aggregate principal amount of $190.9 million of its senior unsecured notes. As of December 31,
F-14
2016, the Company had purchased $90.9 million principal amount of its 2022 Notes for $38.1 million, and $100.0 million principal amount of its 2023 Notes for $46.5 million, in each case excluding accrued interest and including any associated fees. The Company used cash on hand and borrowings from its Revolver to fund the note purchases. In conjunction with the extinguishment of this debt, JEH recognized cancellation of debt income of $99.5 million during the year ended December 31, 2016, on a pre-tax basis. This income is recorded in Gain on debt extinguishment on the Company’s Consolidated Statement of Operations. Of the Company’s total repurchases, $20.3 million principal amount of its 2022 Notes were not cancelled and are available for future reissuance, subject to applicable securities laws.
The 2022 Notes and 2023 Notes are guaranteed on a senior unsecured basis by the Company and by all of its significant subsidiaries other than the new subsidiary formed to acquire the properties in the Merge Acquisition, which was required to become a guarantor no later than January 31, 2017. The 2022 Notes and 2023 Notes will be senior in right of payment to any future subordinated indebtedness of the Issuers.
The Company may redeem the 2022 Notes at any time on or after April 1, 2017 and the 2023 Notes at any time on or after March 15, 2018 at a declining redemption price set forth in the respective indentures, plus accrued and unpaid interest.
The indentures governing the 2022 Notes and 2023 Notes are substantially identical and contain covenants that, among other things, limit the ability of the Company to incur additional indebtedness or issue certain preferred stock, pay dividends on capital stock, transfer or sell assets, make investments, create certain liens, enter into agreements that restrict dividends or other payments from the Company’s restricted subsidiaries to the Company, consolidate, merge or transfer all of the Company’s assets, engage in transactions with affiliates or create unrestricted subsidiaries. If at any time when the 2022 Notes or 2023 Notes are rated investment grade and no default or event of default (as defined in the indenture) has occurred and is continuing, many of the foregoing covenants pertaining to the 2022 Notes or 2023 Notes, as applicable, will be suspended. If the ratings on the 2022 Notes or 2023 Notes, as applicable, were to decline subsequently to below investment grade, the suspended covenants would be reinstated.
As of December 31, 2016, the Company was in compliance with the indentures governing the 2022 Notes and 2023 Notes.
Other Long-Term Debt
The Company entered into two credit agreements dated December 31, 2009, with Wells Fargo Bank N.A, the Senior Secured Revolving Credit Facility (the “Revolver”) and the Second Lien Term Loan (the “Term Loan”). On April 1, 2014, the Term Loan was repaid in full and terminated in connection with the issuance of the 2022 Notes. On November 6, 2014, the Company amended the Revolver to, among other things, extend the maturity date of the Revolver to November 6, 2019. The Company’s oil and gas properties are pledged as collateral to secure its obligations under the Revolver. The borrowing base on the Revolver was subsequently adjusted to $562.5 million in accordance with its terms as a result of the issuance of the 2023 Notes in February 2015 and was reaffirmed at this level effective April 1, 2015. Effective October 8, 2015, the borrowing base was reduced to $510.0 million during the semi-annual borrowing base re-determination.
On August 1, 2016, the Company entered into an amendment to the Revolver to, among other things (i) require that the Company's deposit accounts and securities accounts (subject to certain exclusions) become subject to control agreements, (ii) restrict the Company from borrowing or receiving Letters of Credit under the Revolver if the Company has, or, after giving effect to such borrowing or issuance of Letter of Credit, will have, a Consolidated Cash Balance (as defined in the Revolver) in excess of $30.0 million (in each case giving effect to the anticipated use of proceeds thereof) and (iii) set the borrowing base under the Revolver at $425.0 million. The borrowing base was reaffirmed at this level during the semi-annual borrowing base re-determination effective October 24, 2016.
The terms of the Revolver require the Company to make periodic payments of interest on the loans outstanding thereunder, with all outstanding principal and interest under the Revolver due on the maturity date. The Revolver is subject to a borrowing base, which limits the amount of borrowings which may be drawn thereunder. The borrowing base will be re-determined by the lenders at least semi-annually on or about April 1 and October 1 of each year, with such re-determination based primarily on reserve reports using lender commodity price expectations at such time. Any reduction in the borrowing base will reduce our liquidity, and, if the reduction results in the outstanding amount under our revolving credit facility exceeding the borrowing base, we will be required to repay the deficiency within a short period of time.
F-15
Interest on the Revolver is calculated, at the Company’s option, at either (a) the London Interbank Offered (“LIBO”) rate for the applicable interest period plus a margin of 1.50% to 2.50% based on the level of borrowing base utilization at such time or (b) the greatest of the federal funds rate plus 0.50%, the one month adjusted LIBO rate plus 1.00%, or the prime rate announced by Wells Fargo Bank, N.A. in effect on such day, in each case plus a margin of 0.50% to 1.50% based on the level of borrowing base utilization at such time. For the year ended December 31, 2016, the average interest rate under the Revolver was 2.40% on an average outstanding balance of $172.3 million. For the year ended December 31, 2015, the average interest rate under the Revolver was 2.39% on an average outstanding balance of $144.9 million.
Total interest and commitment fees under the Revolver were $5.3 million, $5.1 million, and $9.5 million for the years ended December 31, 2016, 2015 and 2014, respectively. Total interest and commitment fees under the Term Loan were $3.6 million for the year ended December 31, 2014.
Jones Energy, Inc. and its consolidated subsidiaries are subject to certain covenants under the Revolver, including the requirement to maintain the following financial ratios:
|
· |
a total leverage ratio, consisting of consolidated debt to EBITDAX, of not greater than 4.0x to 1.0x as of the last day of any fiscal quarter; and |
|
· |
a current ratio, consisting of consolidated current assets, including the unused amounts of the total commitments, to consolidated current liabilities, of not less than 1.0x to 1.0x as of the last day of any fiscal quarter. |
As of December 31, 2016, our total leverage ratio is approximately 3.9x and our current ratio is approximately 3.5x, as calculated based on the requirements in our covenants. We are in compliance with all terms of our Revolver at December 31, 2016, and we expect to maintain compliance throughout 2017. However, factors including those outside of our control, such as commodity price declines, may prevent us from maintaining compliance with these covenants, at future measurement dates in 2017 and beyond. In the event it were to become necessary, we believe we have the ability to take actions that would prevent us from failing to comply with our covenants, such as hedge restructuring or seeking a waiver of such covenants. If an event of default exists under the Revolver, the lenders will be able to accelerate the obligations outstanding under the Revolver and exercise other rights and remedies. Our Revolver contains customary events of default, including the occurrence of a change of control, as defined in the Revolver.
6. Derivative Instruments and Hedging Activities
The Company uses derivative instruments to mitigate volatility in commodity prices. While the use of these instruments limits the downside risk of adverse price changes, their use may also limit future revenues from favorable price changes. Depending on changes in oil and gas futures markets and management’s view of underlying supply and demand trends, we may increase or decrease our hedging positions.
The following tables summarize our hedging positions as of December 31, 2016 and 2015:
Hedging Positions
|
|
|
December 31, 2016 |
|
|||||||||||
|
|
|
|
|
|
|
|
|
|
|
Weighted |
|
Final |
|
|
|
|
|
|
|
Low |
|
High |
|
Average |
|
Expiration |
|
|||
|
Oil swaps |
|
Exercise price |
|
$ |
43.65 |
|
$ |
86.85 |
|
$ |
64.49 |
|
June 2019 |
|
|
|
|
Offset exercise price |
|
$ |
42.00 |
|
$ |
49.00 |
|
$ |
47.14 |
|
|
|
|
|
|
Net barrels per month |
|
|
— |
|
|
148,000 |
|
|
87,233 |
|
|
|
|
Natural gas swaps |
|
Exercise price |
|
$ |
2.78 |
|
$ |
4.67 |
|
$ |
3.65 |
|
June 2019 |
|
|
|
|
Offset exercise price |
|
$ |
2.75 |
|
$ |
3.02 |
|
$ |
2.83 |
|
|
|
|
|
|
Net mmbtu per month |
|
|
— |
|
|
1,470,000 |
|
|
1,024,000 |
|
|
|
|
Natural gas liquids swaps |
|
Exercise price |
|
$ |
18.06 |
|
$ |
72.52 |
|
$ |
24.60 |
|
December 2017 |
|
|
|
|
Barrels per month |
|
|
110,000 |
|
|
121,000 |
|
|
114,833 |
|
|
|
|
Oil collars |
|
Puts (floors) |
|
$ |
45.00 |
|
$ |
50.00 |
|
$ |
48.52 |
|
December 2019 |
|
|
|
|
Calls (ceilings) |
|
$ |
56.60 |
|
$ |
61.00 |
|
$ |
59.64 |
|
|
|
|
|
|
Net barrels per month |
|
|
65,000 |
|
|
73,000 |
|
|
67,500 |
|
|
|
|
Natural gas collars |
|
Puts (floors) |
|
$ |
2.55 |
|
$ |
2.55 |
|
$ |
2.55 |
|
December 2019 |
|
|
|
|
Calls (ceilings) |
|
$ |
3.08 |
|
$ |
3.41 |
|
$ |
3.19 |
|
|
|
|
|
|
Net barrels per month |
|
|
950,000 |
|
|
1,050,000 |
|
|
990,833 |
|
|
|
F-16
|
|
|
December 31, 2015 |
|
|||||||||||
|
|
|
|
|
|
|
|
|
|
|
Weighted |
|
Final |
|
|
|
|
|
|
|
Low |
|
High |
|
Average |
|
Expiration |
|
|||
|
Oil swaps |
|
Exercise price |
|
$ |
54.53 |
|
$ |
100.87 |
|
$ |
79.16 |
|
June 2019 |
|
|
|
|
Barrels per month |
|
|
54,000 |
|
|
194,000 |
|
|
97,119 |
|
|
|
|
Natural gas swaps |
|
Exercise price |
|
$ |
3.22 |
|
$ |
6.45 |
|
$ |
4.25 |
|
June 2019 |
|
|
|
|
mmbtu per month |
|
|
700,000 |
|
|
1,640,000 |
|
|
1,042,857 |
|
|
|
|
Natural gas basis swaps |
|
Contract differential |
|
$ |
(0.39) |
|
$ |
(0.11) |
|
$ |
(0.18) |
|
December 2016 |
|
|
|
|
mmbtu per month |
|
|
1,190,000 |
|
|
1,730,000 |
|
|
1,360,833 |
|
|
|
|
Natural gas liquids swaps |
|
Exercise price |
|
$ |
8.90 |
|
$ |
95.24 |
|
$ |
32.62 |
|
December 2017 |
|
|
|
|
Barrels per month |
|
|
2,000 |
|
|
112,000 |
|
|
51,792 |
|
|
|
The Company recognized net losses on derivative instruments of $51.3 million for the year ended December 31, 2016. The Company recognized net gains on derivative instruments of $158.8 million and $189.6 million for the years ended December 31, 2015 and 2014, respectively.
The Company routinely enters into oil and natural gas swap contracts as seller, thus resulting in a fixed price. In early 2016, the Company realized certain mark-to-market gains associated with oil and natural gas hedges the Company had in place for years 2018 and 2019. The gains were effectively realized by purchasing, as opposed to selling, oil and natural gas swap contracts for the equal volume that was associated with the initial hedge transaction. Therefore, as prices fluctuate, the loss (or gain) on any single contract in 2018 and 2019 will be offset by an equal gain (or loss). This essentially leaves the underlying production open to fluctuations in market prices. Based on current contract terms, the gains will be recognized as the hedge contracts mature in 2018 and 2019. Information related to these purchased oil and natural gas swap contracts is presented in the table above as the “offset exercise price”, and the volumes in the table above are presented “net” of such purchased oil and natural gas swap contracts.
Offsetting Assets and Liabilities
As of December 31, 2016, the counterparties to our commodity derivative contracts consisted of six financial institutions. All of our counterparties or their affiliates are also lenders under the Revolver. We are not generally required to post additional collateral under our derivative agreements.
Our derivative agreements contain set-off provisions that state that in the event of default or early termination, any obligation owed by the defaulting party may be offset against any obligation owed to the defaulting party.
The following table presents information about our commodity derivative contracts that are netted on our Consolidated Balance Sheet as of December 31, 2016 and 2015:
|
|
|
|
|
|
|
|
|
Net Amounts |
|
|
|
|
|
|
|
|
|
|
|
|
|
|
Gross |
|
of Assets / |
|
Gross Amounts |
|
|
|
|
|||
|
|
|
Gross Amounts |
|
Amounts |
|
Liabilities |
|
Not |
|
|
|
|
||||
|
|
|
of Recognized |
|
Offset in the |
|
Presented in |
|
Offset in the |
|
|
|
|
||||
|
|
|
Assets / |
|
Balance |
|
the Balance |
|
Balance |
|
|
|
|
||||
|
(in thousands of dollars) |
|
Liabilities |
|
Sheet |
|
Sheet |
|
Sheet |
|
Net Amount |
|
|||||
|
December 31, 2016 |
|
|
|
|
|
|
|
|
|
|
|
|
|
|
|
|
|
Commodity derivative contracts |
|
|
|
|
|
|
|
|
|
|
|
|
|
|
|
|
|
Assets |
|
$ |
79,649 |
|
$ |
(20,805) |
|
$ |
58,844 |
|
$ |
— |
|
$ |
58,844 |
|
|
Liabilities |
|
|
(36,664) |
|
|
20,805 |
|
|
(15,859) |
|
|
— |
|
|
(15,859) |
|
|
December 31, 2015 |
|
|
|
|
|
|
|
|
|
|
|
|
|
|
|
|
|
Commodity derivative contracts |
|
|
|
|
|
|
|
|
|
|
|
|
|
|
|
|
|
Assets |
|
$ |
218,036 |
|
$ |
(527) |
|
$ |
217,509 |
|
$ |
— |
|
$ |
217,509 |
|
|
Liabilities |
|
|
(538) |
|
|
527 |
|
|
(11) |
|
|
— |
|
|
(11) |
|
7. Fair Value Measurement
Fair Value of Financial Instruments
The Company determines fair value amounts using available market information and appropriate valuation methodologies. Fair value is the price that would be received to sell an asset or would be paid to transfer a liability in an
F-17
orderly transaction between market participants at the measurement date. Considerable judgment is required in interpreting market data to develop the estimates of fair value. The use of different market assumptions and/or estimation methods may have a material effect on the estimated fair value amounts.
The Company enters into a variety of derivative financial instruments, which may include over-the-counter instruments, such as natural gas, crude oil, and natural gas liquid contracts. The Company utilizes valuation techniques that maximize the use of observable inputs, where available. If listed market prices or quotes are not published, fair value is determined based upon a market quote, adjusted by other market-based or independently sourced market data, such as trading volume, historical commodity volatility, and counterparty-specific considerations. These adjustments may include amounts to reflect counterparty credit quality, the time value of money, and the liquidity of the market.
Counterparty credit valuation adjustments are necessary when the market price of an instrument is not indicative of the fair value as a result of the credit quality of the counterparty. Generally, market quotes assume that all counterparties have low default rates and equal credit quality. Therefore, an adjustment may be necessary to reflect the quality of a specific counterparty to determine the fair value of the instrument. The Company currently has all derivative positions placed and held by members of its lending group, which have high credit quality.
Liquidity valuation adjustments are necessary when the Company is not able to observe a recent market price for financial instruments that trade in less active markets. Exchange traded contracts are valued at market value without making any additional valuation adjustments; therefore, no liquidity reserve is applied.
Valuation Hierarchy
Fair value measurements are grouped into a three-level valuation hierarchy. The valuation hierarchy is based upon the transparency of inputs to the valuation of an asset or liability as of the measurement date. A financial instrument’s categorization within the hierarchy is based upon the input that requires the highest degree of judgment in the determination of the instrument’s fair value. The three levels are defined as follows:
|
Level 1 |
|
Pricing inputs are based on published prices in active markets for identical assets or liabilities as of the reporting date. |
|
Level 2 |
|
Pricing inputs include quoted prices for similar assets and liabilities in active markets, and inputs that are observable for the asset or liability, either directly or indirectly, as of the reporting date. Contracts that are not traded on a recognized exchange or are tied to pricing transactions for which forward curve pricing is readily available are classified as Level 2 instruments. These include natural gas, crude oil and some natural gas liquids price swaps and natural gas basis swaps. |
|
Level 3 |
|
Pricing inputs include significant inputs that are generally unobservable from objective sources. The Company classifies natural gas liquid swaps and basis swaps for which future pricing is not readily available as Level 3. The Company obtains estimates from independent third parties for its open positions and subjects those to the credit adjustment criteria described above. |
The financial instruments carried at fair value as of December 31, 2016 and 2015, by consolidated balance sheet caption and by valuation hierarchy, as described above are as follows:
|
(in thousands of dollars) |
|
December 31, 2016 |
|
||||||||||
|
|
|
Fair Value Measurements Using |
|
||||||||||
|
Commodity Price Hedges |
|
(Level 1) |
|
(Level 2) |
|
(Level 3) |
|
Total |
|
||||
|
Current assets |
|
$ |
— |
|
$ |
24,100 |
|
$ |
— |
|
$ |
24,100 |
|
|
Long-term assets (1) |
|
|
— |
|
|
36,384 |
|
|
(1,640) |
|
|
34,744 |
|
|
Current liabilities |
|
|
— |
|
|
13,636 |
|
|
1,014 |
|
|
14,650 |
|
|
Long-term liabilities |
|
|
— |
|
|
892 |
|
|
317 |
|
|
1,209 |
|
F-18
|
(in thousands of dollars) |
|
December 31, 2015 |
|
||||||||||
|
|
|
Fair Value Measurements Using |
|
||||||||||
|
Commodity Price Hedges |
|
(Level 1) |
|
(Level 2) |
|
(Level 3) |
|
Total |
|
||||
|
Current assets |
|
$ |
— |
|
$ |
122,779 |
|
$ |
1,428 |
|
$ |
124,207 |
|
|
Long-term assets |
|
|
— |
|
|
93,302 |
|
|
— |
|
|
93,302 |
|
|
Current liabilities |
|
|
— |
|
|
11 |
|
|
— |
|
|
11 |
|
|
Long-term liabilities |
|
|
— |
|
|
— |
|
|
— |
|
|
— |
|
|
(1) |
Level 3 long-term assets are negative as a result of the netting of our commodity derivative reflected on our Consolidated Balance Sheet as of December 31, 2016. Our agreements include set-off provisions, as noted in Note 6, “Derivative Instruments and Hedging Activities - Offsetting Assets and Liabilities”. |
The following table represents quantitative information about Level 3 inputs used in the fair value measurement of the Company’s commodity derivative contracts as of December 31, 2016.
|
|
|
Quantitative Information About Level 3 Fair Value Measurements |
|
|||||||
|
|
|
Fair Value |
|
|
|
Unobservable |
|
|
|
|
|
Commodity Price Hedges |
|
(000’s) |
|
Valuation Technique |
|
Input |
|
Range |
|
|
|
Natural gas liquid swaps |
|
$ |
(1,014) |
|
Use a discounted cash flow approach using inputs including forward price statements from counterparties |
|
Natural gas liquid futures |
|
$23.94 per barrel |
|
|
Crude oil collars |
|
$ |
(1,166) |
|
Use a discounted option model approach using inputs including interpolated volatilities for certain settlement months where market volatility quotes were unavailable for the option strike price |
|
Market volatility quotes at the option strike for certain settlement months in 2019 |
|
$45.00 - $61.00 per barrel |
|
|
Natural gas collars |
|
$ |
(791) |
|
Use a discounted option model approach using inputs including interpolated volatilities for certain settlement months where market volatility quotes were unavailable for the option strike price |
|
Market volatility quotes at the option strike for certain settlement months in 2019 |
|
$2.55 - $3.41 per barrel |
|
Significant increases/decreases in natural gas liquid prices in isolation would result in a significantly lower/higher fair value measurement. The following table presents the changes in the Level 3 financial instruments for the years ended December 31, 2016 and 2015. Changes in fair value of Level 3 instruments represent changes in gains and losses for the periods that are reported in other income (expense). New contracts entered into during the year are generally entered into at no cost with changes in fair value from the date of agreement representing the entire fair value of the instrument. Transfers between levels are evaluated at the end of the reporting period. Transfers from Level 3 to Level 2 represent the Company’s natural gas basis swaps for which observable forward curve pricing information has become readily available.
F-19
A summary of the Company’s commodity derivative contract activity, by year, is as follows:
|
(in thousands of dollars) |
|
|
|
|
|
Balance at December 31, 2014, net |
|
$ |
2,780 |
|
|
Purchases |
|
|
648 |
|
|
Settlements |
|
|
(960) |
|
|
Transfers into Level 3 |
|
|
— |
|
|
Transfers to Level 2 |
|
|
(1,367) |
|
|
Changes in fair value |
|
|
327 |
|
|
Balance at December 31, 2015, net |
|
$ |
1,428 |
|
|
Purchases |
|
|
(5,208) |
|
|
Settlements |
|
|
(171) |
|
|
Transfers to Level 2 |
|
|
2,363 |
|
|
Transfers to Level 3 |
|
|
— |
|
|
Changes in fair value |
|
|
(1,383) |
|
|
Balance at December 31, 2016, net |
|
$ |
(2,971) |
|
Assets and Liabilities Measured at Fair Value on a Nonrecurring Basis
The following table provides the fair value of financial instruments that are not recorded at fair value in the consolidated financial statements:
|
|
|
December 31, 2016 |
|
December 31, 2015 |
|
||||||||
|
|
|
Principal |
|
|
|
|
Principal |
|
|
|
|
||
|
(in thousands of dollars) |
|
Amount |
|
Fair Value |
|
Amount |
|
Fair Value |
|
||||
|
Debt: |
|
|
|
|
|
|
|
|
|
|
|
|
|
|
Revolver |
|
$ |
178,000 |
|
$ |
178,000 |
|
$ |
110,000 |
|
$ |
110,000 |
|
|
2022 Notes |
|
|
409,148 |
|
|
393,150 |
|
|
500,000 |
|
|
260,000 |
|
|
2023 Notes |
|
|
150,000 |
|
|
153,375 |
|
|
250,000 |
|
|
153,283 |
|
The Revolver (as defined in Note 5) is categorized as Level 3 in the valuation hierarchy as the debt is not publicly traded and no observable market exists to determine the fair value; however, the carrying value of the Revolver approximates fair value, as it is subject to short-term floating interest rates that approximate the rates available to the Company for those periods.
The fair value of the 2022 Notes (as defined in Note 5) is based on pricing that is readily available in the public market. Accordingly, the 2022 Notes are classified as Level 1 in the valuation hierarchy as the pricing is based on quoted market prices for the debt securities and is actively traded.
The fair value of the 2023 Notes (as defined in Note 5) is based on indicative pricing that is available in the public market. Accordingly, the 2023 Notes are classified as Level 2 in the valuation hierarchy as the pricing is based on quoted market prices for the debt securities but is not actively traded.
Assets and liabilities acquired in business combinations are recorded at their fair value on the date of acquisition. Significant Level 3 assumptions associated with the calculation of future cash flows used in the analysis of fair value of the oil and gas property acquired include the Company’s estimate of future commodity prices, production costs, development expenditures, production, risk-adjusted discount rates, and other relevant data. Additionally, fair value is used to determine the inception value of the Company’s AROs. The inputs used to determine such fair value are primarily based upon costs incurred historically for similar work, as well as estimates from independent third parties for costs that would be incurred to restore leased property to the contractually stipulated condition. Additions to the Company’s ARO represent a nonrecurring Level 3 measurement.
F-20
8. Asset Retirement Obligations
A summary of the Company’s ARO for the years ended December 31, 2016 and 2015 is as follows:
|
(in thousands of dollars) |
|
2016 |
|
2015 |
|
||
|
ARO liability at beginning of year |
|
$ |
20,980 |
|
$ |
13,610 |
|
|
Liabilities incurred (1) |
|
|
6,947 |
|
|
6,349 |
|
|
Accretion of ARO liability |
|
|
1,263 |
|
|
1,087 |
|
|
Liabilities settled due to sale of related properties |
|
|
(446) |
|
|
(19) |
|
|
Liabilities settled due to plugging and abandonment |
|
|
(463) |
|
|
(69) |
|
|
Change in estimate (2) |
|
|
(8,223) |
|
|
22 |
|
|
ARO liability at end of year |
|
|
20,058 |
|
|
20,980 |
|
|
Less: Current portion of ARO at end of year |
|
|
(600) |
|
|
(679) |
|
|
Total long-term ARO at end of year |
|
$ |
19,458 |
|
$ |
20,301 |
|
|
(2) |
The 2016 amount reflects a reduction in the estimated cost per well, consistent with the decline in actual costs experienced by the Company. |
9. Stock‑based Compensation
Management Unit Awards
Effective January 1, 2010, JEH implemented a management incentive plan that provided indirect awards of membership interests in JEH to members of senior management (“Management Units”). These awards had various vesting schedules, and a portion of the Management Units vested in a lump sum at the IPO date. In connection with the IPO, both the vested and unvested Management Units were converted into the right to receive JEH Units and shares of Class B common stock. The JEH Units (together with a corresponding number of shares of Class B common stock) will become exchangeable under this plan into a like number of shares of Class A common stock upon vesting or forfeiture. No new Management Units have been awarded since the IPO and no new JEH Units or shares of Class B common stock are created upon a vesting event. Grants listed below reflect the transfer of JEH Units that occurred upon forfeiture.
The following table summarizes information related to the vesting of Management Units as of December 31, 2016:
|
|
|
|
|
Weighted Average |
|
|
|
|
|
|
|
Grant Date Fair Value |
|
|
|
|
|
JEH Units |
|
per Share |
|
|
|
Unvested at December 31, 2015 |
|
189,355 |
|
$ |
15.00 |
|
|
Granted |
|
40,630 |
|
|
15.00 |
|
|
Forfeited |
|
(40,630) |
|
|
15.00 |
|
|
Vested |
|
(98,593) |
|
|
15.00 |
|
|
Unvested at December 31, 2016 |
|
90,762 |
|
$ |
15.00 |
|
Stock compensation expense associated with the Management Units for the years ended December 31, 2016, 2015 and 2014 was $1.2 million, $1.3 million, and $1.6 million, respectively, and is included in general and administrative expenses on the Company’s Consolidated Statement of Operations. The weighted average grant date fair value of management units was $15.00 per share for the years ended December 31, 2016 and 2015. Unrecognized expense as of December 31, 2016 for all outstanding management units was $0.9 million and will be recognized over a weighted-average remaining period of 1.3 years.
2013 Omnibus Incentive Plan
Under the Amended and Restated Jones Energy, Inc. 2013 Omnibus Incentive Plan (the “LTIP”), established in conjunction with the Company’s IPO and amended on May 4, 2016 following approval by the Company’s stockholders, the Company has reserved a total of 7,350,000 shares of Class A common stock for non-employee director, consultant, and employee stock-based compensation awards.
F-21
The Company granted (i) performance share unit and restricted stock unit awards to certain officers and employees and (ii) restricted shares of Class A common stock to the Company’s non-employee directors under the LTIP during 2014, 2015 and 2016. During 2016, the Company also granted performance unit awards to certain members of the senior management team under the LTIP.
Restricted Stock Unit Awards
The Company has outstanding restricted stock unit awards granted to certain officers and employees of the Company under the LTIP. The fair value of the restricted stock unit awards is based on the value of the Company’s Class A common stock on the date of grant and is expensed on a straight-line basis over the applicable vesting period, which is typically three years.
The following table summarizes information related to the total number of units awarded to officers and employees as of December 31, 2016:
|
|
|
Restricted |
|
Weighted Average |
|
|
|
|
|
Stock Unit |
|
Grant Date Fair Value |
|
|
|
|
|
Awards |
|
per Share |
|
|
|
Unvested at December 31, 2015 |
|
757,245 |
|
$ |
11.65 |
|
|
Granted |
|
942,377 |
|
|
3.99 |
|
|
Forfeited |
|
(204,487) |
|
|
9.69 |
|
|
Vested |
|
(245,312) |
|
|
12.18 |
|
|
Unvested at December 31, 2016 |
|
1,249,823 |
|
$ |
6.09 |
|
Stock compensation expense associated with the employee restricted stock unit awards for the years ended December 31, 2016, 2015, and 2014 was $3.0 million, $3.1 million, and $1.1 million, respectively, and is included in general and administrative expenses on the Company’s Consolidated Statement of Operations. The weighted average grant date fair value of restricted stock units was $3.99 per share, $9.58 per share, and $17.31 per share for the years ended December 31, 2016, 2015, and 2014, respectively. Unrecognized expense as of December 31, 2016 for all outstanding restricted stock unit awards was $4.4 million and will be recognized over a weighted-average remaining period of 1.8 years.
Performance Share Unit Awards
The Company has outstanding performance share unit awards granted to certain members of the senior management team of the Company under the LTIP. Prior to the second quarter of 2016, the performance share unit awards were described in the Company’s filings as performance unit awards. During the second quarter of 2016, the Company created a new class of equity award, described below as a performance unit award, that is settled in cash rather than shares of the Company’s Class A common stock. As a result, references to performance unit awards in the Company’s filings prior to the second quarter of 2016 refer to this description of performance share unit awards.
Upon the completion of the applicable three-year performance period, each recipient may vest in a number of performance share units. The percent of awarded performance share units in which each recipient vests at such time, if any, will range from 0% to 200% based on the Company’s total shareholder return relative to an industry peer group over the applicable three-year performance period. Each vested performance share unit is exchangeable for one share of the Company’s Class A common stock. The grant date fair value of the performance share units was determined using a Monte Carlo simulation model, which results in an estimated percentage of performance share units earned. The fair value of the performance share units is expensed on a straight-line basis over the applicable three-year performance period.
F-22
The following table summarizes information related to the total number of performance share units awarded to the senior management team as of December 31, 2016:
|
|
|
Performance |
|
Weighted Average |
|
|
|
|
|
Share Unit |
|
Grant Date Fair Value |
|
|
|
|
|
Awards |
|
per Share |
|
|
|
Unvested at December 31, 2015 |
|
539,188 |
|
$ |
14.22 |
|
|
Granted |
|
551,252 |
|
|
4.75 |
|
|
Forfeited |
|
(55,235) |
|
|
13.27 |
|
|
Vested |
|
(168,877) |
|
|
21.65 |
|
|
Unvested at December 31, 2016 |
|
866,328 |
|
$ |
6.81 |
|
At the time the performance share units vest, the results of the the Company’s total share return relative to the industry peer group must be certified by the compensation committee of the board of directors before the corresponding shares of Class A common stock are issued. As of December 31, 2016 the 168,877 performance share units that vested during 2016 were awaiting certification by the compensation committee. The Class A shares corresponding to these uncertified awards are not included in the Company’s total outstanding Class A shares reported within stockholder’s equity on the Company’s Consolidated Balance Sheets.
Stock compensation expense associated with the performance share unit awards for the years ended December 31, 2016, 2015, and 2014 was $2.7 million, $2.6 million, and $0.9 million, respectively, and is included in general and administrative expenses on the Company’s Consolidated Statement of Operations. The weighted average grant date fair value of performance share unit awards was $4.75 per share, $10.27 per share, and $21.65 per share for the years ended December 31, 2016, 2015, and 2014, respectively. Unrecognized expense as of December 31, 2016 for all outstanding performance share unit awards was $2.7 million and will be recognized over a weighted-average remaining period of 1.6 years.
The Monte Carlo simulation process is a generally accepted statistical technique used, in this instance, to simulate future stock prices for the Company and the components of the peer group. The simulation uses a risk- neutral framework along with the risk-free rate of return, the volatility of each entity, and the stock price trading correlations of each entity with the other entities in the peer group. A stock price path has been simulated for the Company and each peer company and is used to determine the payout percentages and the stock price of the Company’s common stock as of the vesting date. The ending stock price is multiplied by the payout percentage to determine the projected payout, which is then discounted using the risk-free rate of return to the grant date to determine the grant date fair value for that simulation. When enough simulations are generated, the resulting distribution gives a reasonable estimate of the range of future expected stock prices.
The following assumptions were used for the Monte Carlo simulation model to determine the grant date fair value and associated stock-based compensation expense during the periods presented:
|
|
|
Performance Share Unit Awards |
|
|||||||
|
|
|
2016 |
|
2015 |
|
2014 |
|
|||
|
Forecast period (years) |
|
|
2.60 |
|
|
2.67 |
|
|
2.62 |
|
|
Risk-free interest rate |
|
|
1.00 |
% |
|
0.79 |
% |
|
0.61 |
% |
|
Jones stock price volatility |
|
|
71.47 |
% |
|
52.87 |
% |
|
40.40 |
% |
The average historical combined volatilities for the Company and each peer company was 70.45%, 55.13%, and 46.95% for the awards made in 2016, 2015, and 2014, respectively. Based on these assumptions, the Monte Carlo simulation model resulted in an expected percentage of performance share units earned of 123.84%, 101.61%, and 126.80% for the 2016, 2015, and 2014 awards, respectively.
Performance Unit Awards
The Company has outstanding performance unit awards, granted initially in 2016, to certain members of the senior management team of the Company under the LTIP. References to performance unit awards in prior filings do not correspond to these newly created performance unit awards. Upon the completion of the applicable three-year performance period, each recipient may vest in a number of performance units. The value of awarded performance units in which each recipient vests at such time, if any, will range from $0.00 to $200.00 per performance unit based on the
F-23
Company’s total shareholder return relative to an industry peer group over the applicable three-year performance period. For accounting purposes, the performance units are treated as a liability award with the liability being re-measured at the end of each reporting period. Therefore, the expense associated with these awards is subject to volatility until the payout is finally determined at the end of the performance period. The value of the performance units was determined at award using a Monte Carlo simulation model, as of the grant date, which resulted in an estimated final value upon vesting of $1.3 million. The fair value measured as of December 31, 2016 was $1.2 million.
The following assumptions were used for the Monte Carlo model to determine the grant date fair value and associated stock-based compensation expense of the performance unit awards granted during the year ended December 31, 2016:
|
|
|
2016 |
|
|
|
|
Performance |
|
|
|
|
Unit Awards |
|
|
Forecast period (years) |
|
2.60 |
|
|
Risk-free interest rate |
|
1.00 |
% |
|
Jones stock price volatility |
|
71.47 |
% |
For the performance units granted during the year ended December 31, 2016, the Monte Carlo simulation model resulted in an expected payout of $67.38 per performance unit as of the grant date.
Stock compensation expense associated with the performance unit awards was $0.3 million for the year ended December 31, 2016, and is included in general and administrative expenses on the Company’s Consolidated Statement of Operations. As of December 31, 2016, $0.9 million of unrecognized compensation expense related to the performance unit awards, subject to re-measurement and adjustment for the change in estimated final value as of the end of each reporting period, is expected to be recognized over the remaining weighted-average remaining period of 2.0 years.
Restricted Stock Awards
The Company has outstanding restricted stock awards granted to the non-employee members of the Board of Directors of the Company under the LTIP. The restricted stock will vest upon the director serving as a director of the Company for a one-year service period in accordance with the terms of the award. The fair value of the awards was based on the price of the Company’s Class A common stock on the date of grant.
The following table summarizes information related to the total value of the awards to the Board of Directors as of December 31, 2016:
|
|
|
|
|
Weighted Average |
|
|
|
|
|
Restricted |
|
Grant Date Fair Value |
|
|
|
|
|
Stock Awards |
|
per Share |
|
|
|
Unvested at December 31, 2015 |
|
67,380 |
|
$ |
7.30 |
|
|
Granted |
|
139,825 |
|
|
4.00 |
|
|
Forfeited |
|
— |
|
|
|
|
|
Vested |
|
(67,380) |
|
|
7.30 |
|
|
Unvested at December 31, 2016 |
|
139,825 |
|
$ |
4.00 |
|
Stock compensation expense associated with awards to the members of the Board of Directors for the years ended December 31, 2016, 2015 and 2014 was $0.6 million, $0.6 million, and $0.4 million, respectively, and is included in general and administrative expenses on the Company’s Consolidated Statement of Operations. The weighted average grant date fair value of restricted stock awards was $4.00 per share, $7.30 per share, and $18.77 per share for the years ended December 31, 2016, 2015, and 2014. Unrecognized expense as of December 31, 2016 for all outstanding restricted stock awards was $0.2 million and will be recognized over the remaining vesting period of 0.4 years.
For the years ended December 31, 2016, 2015, and 2014, the Company had an associated tax benefit of $1.4 million, $1.1 million, and $0.4 million, respectively, related to all stock-based compensation, calculated at the federal statutory rate after adjusting for the non-controlling interest.
F-24
10. Benefit Plans
The Company maintains a tax-qualified 401(k) savings plan (the “Plan”) for the benefit of employees. The Plan is a defined contribution plan and the Company may match a portion of employee contributions to the Plan.
In addition, since 2013, the Company has maintained a non-qualified deferred compensation plan for the benefit of key employees. The non-qualified deferred compensation plan is an unfunded, account-based plan under which key employees of the Company may elect to defer a portion of their base salary and/or bonus. For the years ended December 31, 2016, 2015, and 2014, our total expense relating to these plans was $0.4 million, $0.5 million, and $0.3 million, respectively.
11. Income Taxes
The Company records federal and state income tax liabilities associated with its status as a corporation. The Company recognizes a tax liability on its share of pre-tax book income, exclusive of the non-controlling interest. JEH is not subject to income tax at the federal level and only recognizes Texas franchise tax expense.
The following table summarizes the tax provision for the years ended December 31, 2016, 2015, and 2014:
|
|
|
Year Ended December 31, |
|
|||||||
|
(in thousands of dollars) |
|
2016 |
|
2015 |
|
2014 |
|
|||
|
Current tax expense: |
|
|
|
|
|
|
|
|
|
|
|
Federal |
|
$ |
3,758 |
|
$ |
— |
|
$ |
53 |
|
|
State |
|
|
223 |
|
|
113 |
|
|
— |
|
|
Total current expense |
|
|
3,981 |
|
|
113 |
|
|
53 |
|
|
Deferred tax expense (benefit): |
|
|
|
|
|
|
|
|
|
|
|
Federal |
|
|
(27,245) |
|
|
(1,137) |
|
|
22,140 |
|
|
State |
|
|
(522) |
|
|
(1,757) |
|
|
4,025 |
|
|
Total deferred expense (benefit) |
|
|
(27,767) |
|
|
(2,894) |
|
|
26,165 |
|
|
Total tax expense (benefit) |
|
$ |
(23,786) |
|
$ |
(2,781) |
|
$ |
26,218 |
|
|
Tax expense (benefit) attributable to controlling interests |
|
|
(23,263) |
|
|
(1,160) |
|
|
22,819 |
|
|
Tax expense attributable to non-controlling interests |
|
|
(523) |
|
|
(1,621) |
|
|
3,399 |
|
|
Total income tax expense (benefit) |
|
$ |
(23,786) |
|
$ |
(2,781) |
|
$ |
26,218 |
|
F-25
A reconciliation of the Company’s provision for income taxes as reported and the amount computed by multiplying income before taxes, less non‑controlling interest, by the U.S. federal statutory rate of 35%:
|
(in thousands of dollars) |
|
2016 |
|
2015 |
|
2014 |
|
|||
|
Provision calculated at federal statutory income tax rate: |
|
|
|
|
|
|
|
|
|
|
|
Net income before taxes |
|
$ |
(108,591) |
|
$ |
(11,858) |
|
$ |
251,838 |
|
|
Statutory rate |
|
|
35 |
% |
|
35 |
% |
|
35 |
% |
|
Income tax expense (benefit) computed at statutory rate |
|
$ |
(38,007) |
|
$ |
(4,150) |
|
$ |
88,144 |
|
|
Less: Non-controlling interests |
|
|
14,972 |
|
|
2,911 |
|
|
(65,759) |
|
|
Income tax expense (benefit) attributable to controlling interests |
|
|
(23,035) |
|
|
(1,239) |
|
|
22,385 |
|
|
State and local income taxes, net of federal benefit |
|
|
(622) |
|
|
(1,011) |
|
|
626 |
|
|
Reduction of TRA liability |
|
|
(282) |
|
|
(694) |
|
|
— |
|
|
Equity compensation, shortfall |
|
|
— |
|
|
338 |
|
|
— |
|
|
Change in enacted rate |
|
|
— |
|
|
(650) |
|
|
— |
|
|
Change in valuation allowance |
|
|
950 |
|
|
2,333 |
|
|
— |
|
|
Other |
|
|
(274) |
|
|
(237) |
|
|
(192) |
|
|
Tax expense (benefit) attributable to controlling interests |
|
|
(23,263) |
|
|
(1,160) |
|
|
22,819 |
|
|
Tax expense attributable to non-controlling interests |
|
|
(523) |
|
|
(1,621) |
|
|
3,399 |
|
|
Total income tax expense (benefit) |
|
$ |
(23,786) |
|
$ |
(2,781) |
|
$ |
26,218 |
|
The Company is subject to federal, state, and local income and franchise taxes. As such, deferred income taxes result from temporary differences between the carrying amounts of assets and liabilities of the Company for financial reporting purposes and the amounts used for income tax purposes. Deferred tax assets and liabilities are measured using enacted tax rates in effect in the years in which those temporary differences are expected to reverse.
In 2015, Texas enacted legislation that reduced the Texas franchise tax rate from 1.0% to 0.75%. We recorded a tax benefit of $1.7 million as a result of revaluing our deferred tax assets and liabilities at the newly enacted rate, of which $1.0 million was attributable to the non-controlling interest.
Significant components of the Company’s deferred tax assets and deferred tax liabilities consisted of the following:
|
|
|
As of December 31, |
|
||||
|
(in thousands of dollars) |
|
2016 |
|
2015 |
|
||
|
Deferred tax assets |
|
|
|
|
|
|
|
|
Net operating loss |
|
$ |
8,687 |
|
$ |
9,414 |
|
|
Section 754 election tax basis adjustment |
|
|
51,154 |
|
|
47,100 |
|
|
Other deferred tax asset |
|
|
— |
|
|
505 |
|
|
Total deferred tax assets |
|
|
59,841 |
|
|
57,019 |
|
|
Deferred tax liabilities |
|
|
|
|
|
|
|
|
Investment in consolidated subsidiary JEH |
|
|
56,888 |
|
|
73,559 |
|
|
Noncurrent state deferred tax liability |
|
|
2,703 |
|
|
4,099 |
|
|
Total deferred tax liabilities |
|
|
59,591 |
|
|
77,658 |
|
|
Net deferred tax assets (liabilities) |
|
|
250 |
|
|
(20,639) |
|
|
Valuation allowance |
|
|
(3,155) |
|
|
(2,333) |
|
|
Net deferred tax assets (liabilities) |
|
$ |
(2,905) |
|
$ |
(22,972) |
|
The Company has a federal net operating loss carry-forward totaling $19.5 million and state net operating loss carry-forward of $48.2 million, of which the federal net operating loss carry-forward expires between 2033 and 2035 and with state net operating loss carryforwards expiring between 2033 and 2036. The tax benefits of carryforwards are recorded as an asset to the extent that management assesses the utilization of such carryforwards to be more likely than not. When the future utilization of some portion of the carryforwards is determined not to be more likely than not, a valuation allowance is provided to reduce the recorded tax benefits from such assets. As of December 31, 2016, we had a valuation
F-26
allowance of $3.2 million as a result of management’s assessment of the realizability of federal and state deferred tax assets. Management believes that there will be sufficient future taxable income based on the reversal of temporary differences to enable utilization of substantially all other tax carryforwards.
Internal Revenue Code ("IRC") Section 382 addresses company ownership changes and specifically limits the utilization of certain deductions and other tax attributes on an annual basis following an ownership change. The Company experienced an ownership change within the meaning of IRC Section 382 during 2015 that subjects a portion of the federal net operating loss carryforwards to an IRC Section 382 limitation. Although such limitation is not expected to limit the Company’s ability to utilize its net operating loss carryforwards before expiration, the limitation contributes to a current federal tax liability for the year ended December 31, 2016.
Separate federal and state income tax returns are filed for Jones Energy, Inc. and Jones Energy Holdings, LLC. JEH’s Texas franchise tax returns are subject to audit for 2012 through 2016. The tax years 2013 through 2016 remain open to examination by the major taxing jurisdictions to which the Company is subject, however net operating losses originating in prior years are subject to examination when utilized. The Internal Revenue Service is currently examining the 2013 federal partnership income tax return for JEH, but has indicated that the audit will be concluded with no change. The Company’s other income tax returns have not been audited by the Internal Revenue Service or any state jurisdiction.
Accounting for uncertainty in income taxes prescribes a recognition threshold and measurement methodology for the financial statement recognition and measurement of a tax position taken or expected to be taken in a tax return. As of December 31, 2016, 2015, and 2014 there was no material liability or expense for the periods then ended recorded for payments of interest and penalties associated with uncertain tax positions or material unrecognized tax positions and the Company’s unrecognized tax benefits were not material.
Tax Receivable Agreement
In connection with the IPO, the Company entered into a Tax Receivable Agreement (the “TRA”) which obligates the Company to make payments to certain current and former owners equal to 85% of the applicable cash savings that the Company realizes as a result of tax attributes arising from exchanges of JEH Units and shares of the Company’s Class B common stock held by those owners for shares of the Company’s Class A common stock. The Company will retain the benefit of the remaining 15% of these tax savings. At the time of an exchange, the company records a liability to reflect the future payments under the TRA.
The actual amount and timing of payments to be made under the TRA will depend upon a number of factors, including the amount and timing of taxable income generated in the future, changes in future tax rates, the use of loss carryovers, and the portion of the Company’s payments under the TRA constituting imputed interest. In the event that the Company records a valuation allowance against its deferred tax assets associated with an exchange, the TRA liability will also be reduced as the payment of the TRA liability is dependent on the realizability of the deferred tax assets. As of December 31, 2016 and 2015, the amount of the TRA liability was reduced by $2.7 million, and $2.0 million, respectively, as a result of the valuation allowance recorded against the Company’s deferred tax assets. To the extent the Company does not realize all of the tax benefits in future years or in the event of a change in future tax rates, this liability may change.
As of December 31, 2016, and 2015 the Company had recorded a TRA liability of $43.0 million, and $38.1 million, respectively, for the estimated payments that will be made to the Class B shareholders who have exchanged shares, after adjusting for the TRA liability reduction, along with corresponding deferred tax assets, net of valuation allowance, of $50.6 million, and $44.8 million, respectively, as a result of the increase in tax basis generated arising from such exchanges.
As of December 31, 2016, the Company had not made any payments under the TRA to Class B shareholders who have exchanged JEH units and Class B common stock for Class A common stock. The Company anticipates making a payment of approximately $0.6 million under the TRA with respect to cash savings that the Company will realize on its 2016 tax returns as a result of tax attributes arising from prior exchanges, to be paid in the first quarter of 2018.
Cash Tax Distributions
The holders of JEH Units, including Jones Energy, Inc., incur U.S. federal, state and local income taxes on their share of any taxable income of JEH. Under the terms of its operating agreement, JEH is generally required to make quarterly pro-rata cash tax distributions to its unitholders (including us) based on income allocated to its unitholders through the end of
F-27
each relevant quarter, as adjusted to take into account good faith projections by the Company of taxable income or loss for the remainder of the calendar year, to the extent JEH has cash available for such distributions and subject to certain other restrictions.
A Special Committee of the Board of Directors comprised solely of directors who do not have a direct or indirect interest in such distribution approved, and JEH made, aggregate cash tax distributions during 2016 of $41.0 million (including distributions to us) to its unitholders towards its total 2016 projected tax distribution obligation. The distributions were made pro-rata to all members of JEH, and included a $23.7 million payment to the Company and a $17.3 million payment to Class B shareholders. The 2016 tax distributions are the result of taxable income generated by JEH’s operations and debt extinguishment.
12. Stockholders’ and Mezzanine equity
Stockholders’ equity is comprised of two classes of common stock, Class A common stock and Class B common stock. The Class B common stock is held by the owners of JEH prior to the Company’s IPO and can be exchanged (together with a corresponding number of units representing membership interests in JEH Units) for shares of Class A common stock on a one-for-one basis, subject to customary conversion rate adjustments for stock splits, stock dividends and reclassifications and other similar transactions. The Class B common stock has no economic rights but entitles its holders to one vote on all matters to be voted on by the Company’s stockholders generally.
The Company has classified the Series A preferred stock as mezzanine equity based upon the terms and conditions that contain various redemption and conversion features. For a description of these features, please see below under “—Offering of 8.0% Series A Perpetual Convertible Preferred Stock.”
Equity Distribution Agreement
On May 24, 2016, the Company and JEH entered into an Equity Distribution Agreement (“Equity Distribution Agreement”) with Citigroup Global Markets Inc. and Wells Fargo Securities, LLC (each, a “Manager” and collectively, the “Managers”). Pursuant to the terms of the Equity Distribution Agreement, the Company may sell from time to time through the Managers, as the Company’s sales agents, the Company’s Class A common stock having an aggregate offering price of up to $73.0 million (the “Class A Shares”). Under the terms of the Equity Distribution Agreement, the Company may also sell Class A Shares from time to time to any Manager as principal for its own account at a price to be agreed upon at the time of sale. Any sale of Class A Shares to a Manager as principal would be pursuant to the terms of a separate terms agreement between the Company and such Manager. Sales of the Class A Shares, if any, will be made by means of ordinary brokers’ transactions, to or through a market maker or directly on or through an electronic communication network, a “dark pool” or any similar market venue, or as otherwise agreed by the Company and one or more of the Managers.
During the year ended December 31, 2016, the Company sold approximately 0.5 million Class A Shares under the Equity Distribution Agreement for net proceeds of approximately $1.8 million ($2.1 million gross proceeds, net of approximately $0.3 million in commissions and professional services expenses). The Company used the net proceeds for general corporate purposes. At December 31, 2016, approximately $70.9 million in aggregate offering proceeds remained available to be issued and sold under the Equity Distribution Agreement.
Offering of Class A Common Stock
On August 19, 2016, the Company and JEH entered into an underwriting agreement (the “Common Stock Underwriting Agreement”) with Credit Suisse Securities (USA) LLC and J.P. Morgan Securities LLC, as representatives of the underwriters named therein (the “Common Stock Underwriters”), with respect to the offer and sale of 21,000,000 shares of the Company’s Class A common stock, par value $0.001 per share (the “Class A Common Stock”). The Common Stock Underwriting Agreement also provided the Common Stock Underwriters an option (the “Common Stock Option”) to purchase up to an additional 3,150,000 shares of Class A Common Stock (the “Additional Offering”) within 30 days of the date of the Common Stock Underwriting Agreement. On September 7, 2016, the Underwriters exercised the Common Stock Option in full. The total net proceeds from the offering of Class A Common Stock (after underwriters’ compensation, but before estimated expenses) pursuant to the Common Stock Underwriting Agreement, including the exercise of the Common Stock Option, was $64.0 million. The Class A Common Stock was issued pursuant to the Company’s shelf registration statement on Form S-3 (Registration No. 333-211568), which became effective July 26, 2016, and a prospectus, which consists of a base prospectus, dated as of July 26, 2016, and a prospectus supplement,
F-28
dated August 19, 2016. The closing of the sale of Class A Common Stock occurred on August 26, 2016 and the Additional Offering closed on September 12, 2016.
Offering of 8.0% Series A Perpetual Convertible Preferred Stock
On August 19, 2016, the Company and JEH entered into an underwriting agreement (the “Preferred Stock Underwriting Agreement”) with Credit Suisse Securities (USA) LLC and J.P. Morgan Securities LLC (the “Preferred Stock Underwriters”) with respect to the offer and sale of 1,600,000 shares of the Series A preferred stock. The Preferred Stock Underwriting Agreement also provided the Preferred Stock Underwriters an option (the “Preferred Stock Option”) to purchase an additional 240,000 shares of Series A preferred stock, which was exercised in full. The total net proceeds from the offering of Series A preferred stock (after underwriters’ compensation, but before estimated expenses) pursuant to the Preferred Stock Underwriting Agreement, including the exercise of the Preferred Stock Option, was $88.3 million. The Series A preferred stock was issued pursuant to the Company’s shelf registration statement on Form S-3 (Registration No. 333-211568), which became effective July 26, 2016, and an additional registration statement with respect thereto on Form S-3 (Registration No. 333-213201) filed under Rule 462(b) of the Act, which became effective upon filing on August 19, 2016. The closing of the sale of Series A preferred stock occurred on August 26, 2016.
Holders of Series A preferred stock are entitled to receive, when as and if declared by the Company’s Board of Directors, cumulative dividends at the rate of 8.0% per annum (the “dividend rate”) per share on the $50.00 liquidation preference per share of the Series A Preferred Stock, payable quarterly in arrears on February 15, May 15, August 15 and November 15 of each year, beginning on November 15, 2016. Dividends may be paid in cash or, subject to certain conditions, in Class A common stock, or a combination thereof.
Under the terms of the Series A preferred stock, the Company’s ability to declare or pay dividends or make distributions on, or purchase, redeem or otherwise acquire for consideration, shares of the Company’s Class A common stock, or any junior stock or parity stock currently outstanding or issued in the future, will be subject to certain restrictions in the event that the Company does not pay in full or declare and set aside for payment in full all accrued and unpaid dividends on the Series A preferred stock (including certain unpaid excess cash payment amounts excused from payment as a dividend due to restrictions in credit facilities or other indebtedness or legal requirements (“Unpaid Excess Cash Payment Amounts”)).
Each share of Series A preferred stock has a liquidation preference of $50.00 per share and is convertible, at the holder’s option at any time, initially into approximately 15.6961 shares of Class A common stock (which is equivalent to an initial conversion price of approximately $3.19 per share), subject to specified adjustments and limitations as set forth in the certificate of designations for the Series A preferred stock. Based on the initial conversion rate and the full exercise of the Preferred Stock Underwriters’ over-allotment option, approximately 28.9 million shares of Class A common stock would be issuable upon conversion of all the Series A preferred stock.
On or after August 15, 2021, the Company may, at its option, give notice of its election to cause all outstanding shares of Series A preferred stock to be automatically converted into shares of Class A common stock at the conversion rate, if the closing sale price of the Class A common stock equals or exceeds 175% of the conversion price for at least 20 trading days in a period of 30 consecutive trading days.
On August 15, 2024 (the “designated redemption date”), each holder of Series A preferred stock may require us to redeem any or all Series A preferred stock held by such holder outstanding on the designated redemption date at a redemption price equal to a liquidation preference of $50.00 per share plus all accrued dividends on the shares up to but excluding the designated redemption date that have not been paid plus any Unpaid Excess Cash Payment Amounts (the “redemption price”). At our option, the redemption price may be paid in cash or, subject to certain limitations, in Class A common stock, or a combination thereof.
Except as required by law or the Company’s certificate of incorporation, which includes the certificate of designations for the Series A preferred stock, the holders of Series A preferred stock have no voting rights (other than with respect to certain matters regarding the Series A preferred stock or when dividends payable on the Series A preferred stock have not been paid for an aggregate of six quarterly dividend periods, or more, whether or not consecutive, as provided in the certificate of designations for the Series A preferred stock).
The Series A preferred stock is classified as mezzanine equity on the Company’s Consolidated Balance Sheet.
F-29
Mezzanine equity consisted of the following at December 31, 2016:
|
(in thousands of dollars) |
|
December 31, 2016 |
|
|
|
Series A preferred stock, at issuance (net) |
|
$ |
87,922 |
|
|
Dividends on preferred stock |
|
|
940 |
|
|
Accretion on preferred stock |
|
|
113 |
|
|
Mezzanine equity at December 31, 2016 |
|
$ |
88,975 |
|
13. Earnings per Share
Basic earnings per share (“EPS”) is computed by dividing net income (loss) attributable to controlling interests by the weighted average number of shares of Class A common stock outstanding during the period. Shares of Class B common stock are not included in the calculation of earnings per share because they are not participating securities and have no economic interest in the Company. Diluted earnings per share takes into account the potential dilutive effect of shares that could be issued by the Company in conjunction with the Series A preferred stock and from stock awards that have been granted to directors and employees. Awards of non-vested shares are considered outstanding as of the respective grant dates for purposes of computing diluted EPS even though the award is contingent upon vesting. For the year ended December 31, 2016, 1,249,825 restricted stock units, and 1,035,205 performance share units, and 28,880,824 shares from the convertible Class A preferred stock were excluded from the calculation as they would have had an anti-dilutive effect. For the year ended December 31, 2015, 757,245 restricted stock units, and 539,188 performance share units were excluded from the calculation as they would have had an anti-dilutive effect. For the year ended December 31, 2014, 27,430 restricted stock shares, 54,656 restricted stock units and 192,998 performance share units were excluded from the calculation as they would have had an anti-dilutive effect.
The following is a calculation of the basic and diluted weighted-average number of shares of Class A common stock outstanding and EPS:
Earnings per Share
|
|
|
Year Ended December 31, |
|
|||||||
|
(in thousands, except per share data) |
|
2016 |
|
2015 |
|
2014 |
|
|||
|
Income (numerator): |
|
|
|
|
|
|
|
|
|
|
|
Net income (loss) attributable to controlling interests |
|
$ |
(42,552) |
|
$ |
(2,381) |
|
$ |
41,136 |
|
|
Less: Dividends and accretion on preferred stock |
|
|
(2,669) |
|
|
— |
|
|
— |
|
|
Net income (loss) attributable to common shareholder |
|
$ |
(45,221) |
|
$ |
(2,381) |
|
$ |
41,136 |
|
|
Weighted-average shares (denominator): |
|
|
|
|
|
|
|
|
|
|
|
Weighted-average number of shares of Class A common stock - basic |
|
|
40,009 |
|
|
26,816 |
|
|
12,526 |
|
|
Weighted-average number of shares of Class A common stock - diluted |
|
|
40,009 |
|
|
26,816 |
|
|
12,535 |
|
|
Earnings (loss) per share: |
|
|
|
|
|
|
|
|
|
|
|
Basic - Net income (loss) attributable to common shareholders |
|
$ |
(1.13) |
|
$ |
(0.09) |
|
$ |
3.28 |
|
|
Diluted - Net income (loss) attributable to common shareholders |
|
$ |
(1.13) |
|
$ |
(0.09) |
|
$ |
3.28 |
|
14. Related Parties
Related Party Transactions
Transactions with Our Executive Officers, Directors and 5% Stockholders
On May 7, 2013, the Company entered into a natural gas sale and purchase agreement with Monarch Natural Gas, LLC, (“Monarch”), under which Monarch has the first right to gather the natural gas the Company produces from dedicated properties, process the NGLs from this natural gas production and market the processed natural gas and extracted NGLs. Under the Monarch agreement, the Company is paid a specified percentage of the value of the NGLs extracted and sold by Monarch, based on a set liquids recovery percentage, and the amount received from the sale of the residue gas, after
F-30
deducting a fixed volume for fuel, lost and unaccounted for gas. The Company produced approximately 1.4 MMBoe of natural gas and NGLs for the year ended December 31, 2014, from the properties that became subject to the Monarch agreement. During the year ended December 31, 2014, the Company recognized $37.0 million of revenue associated with the aforementioned natural gas and NGL production. Effective May 1, 2015, the rights to gather natural gas under the sale and purchase agreement transferred from Monarch to Enable Midstream Partners LP, (“Enable”), an unaffiliated third-party. Prior to closing of the transfer of these rights, the Company produced approximately 1.0 MMBoe of natural gas and NGLs for the year ended December 31, 2015 from the properties that became subject to the Monarch agreement for which the Company recognized $10.6 million of revenue. The revenue, for all years mentioned, is recorded in Oil and gas sales on the Company’s Consolidated Statement of Operations. The initial term of the agreement, which remains unchanged by the transfer to Enable, runs for 10 years from the effective date of September 1, 2013.
At the time the Company entered into the 2013 Monarch agreement, Metalmark Capital owned approximately 81% of the outstanding equity interests of Monarch. In addition, Metalmark Capital beneficially owns in excess of five percent of the Company’s outstanding equity interests and two of our directors, Howard I. Hoffen and Gregory D. Myers, are managing directors of Metalmark Capital.
In connection with the Company’s entering into the 2013 Monarch agreement, Monarch issued to JEH equity interests in Monarch, having an estimated fair value of $15.0 million, in return for marketing services to be provided throughout the term of the agreement. The Company recorded this amount as deferred revenue which is being amortized on an estimated units-of-production basis commencing in September 2013, the first month of product sales to Monarch. During the years ended December 31, 2016, 2015, and 2014, the Company amortized $2.4 million, $2.0 million, and $1.2 million, respectively, of the deferred revenue balance. This revenue is recorded in Other revenues on the Company’s Consolidated Statement of Operations.
Following the issuance of the $15.0 million Monarch equity interests, JEH assigned $2.4 million of the equity interests to Jonny Jones, the Company’s chief executive officer and chairman of the board, and reserved $2.6 million of the equity interests for future distribution through an incentive plan to certain of the Company’s officers, including Mike McConnell, Robert Brooks and Eric Niccum. The remaining $10.0 million of Monarch equity interests was distributed to certain of the Class B shareholders, which included Metalmark Capital, Wells Fargo, the Jones family entities, and certain of the Company’s officers and directors, including Jonny Jones, Mike McConnell and Eric Niccum. As of December 31, 2016, equity interests in Monarch of $0.7 million are included in Other assets on the Company’s Consolidated Balance Sheet. During the years ended December 31, 2016, 2015, and 2014, equity interests of $0.6 million, $0.8 million, and $0.5 million, respectively, were distributed to management under the incentive plan. The Company recognized expense of $0.5 million, $0.5 million, and $0.8 million during the years ended December 31, 2016, 2015, and 2014, respectively, in connection with the incentive plan.
In September 2014, the Company signed a 10-year oil gathering and transportation agreement with Monarch Oil Pipeline LLC, pursuant to which Monarch Oil Pipeline LLC built, at its expense, a new oil gathering system and connected the gathering system to dedicated Company leases in Texas. At the time the Company entered into the agreement, Metalmark Capital owned the majority of the outstanding equity interests of Monarch Oil Pipeline LLC and/or its parent. The system began service during the fourth quarter of 2015 and provides connectivity to both a regional refinery market as well as the Cushing market hub. The Company incurred gathering fees, which were paid to Monarch Oil Pipeline LLC, of $2.7 million and $0.4 million associated with the approximately 1.3 MMBoe and 0.2 MMBoe of oil production transported under the agreement for the years ended December 31, 2016 and 2015. These costs are recorded as an offset to Oil and gas sales in the Company’s Consolidated Statement of Operations. The aforementioned production was recognized as Oil and gas sales on the Company’s Consolidated Statement of Operations at the time it was sold to the purchasers, who are unaffiliated third-parties, after passing through the gathering and transportation system. The audit committee of the Board reviewed and approved the terms of the agreement with Monarch Oil Pipeline LLC.
In May 2015, the Company received a $0.7 million cash distribution associated with its equity interests in Monarch, which was accounted for following the cost method. The initial cash distribution from Monarch was treated as dividend income and is recorded in Other income (expense).
Purchase of Senior Unsecured Notes
On February 29, 2016, JEH and Jones Energy Finance Corp. purchased $50.0 million principal amount of their outstanding 2023 Notes from investment funds managed by Magnetar Capital and its affiliates, which investment funds collectively own more than 5% of a class of voting securities of the Company, for approximately $23.3 million
F-31
excluding accrued interest and including any associated fees. On the same day, JEH and Jones Energy Finance Corp. purchased an additional $50.0 million principal amount of their outstanding 2023 Notes from investment funds managed by Blackstone Group Management L.L.C. and its affiliates, which investment funds collectively own more than 5% of a class of voting securities of the Company, for approximately $23.3 million excluding accrued interest and including any associated fees. In conjunction with the extinguishment of this $100.0 million principal amount of debt, JEH recognized cancellation of debt income of $48.3 million on a pre-tax basis. This income is recorded in Gain on debt extinguishment on the Company’s Consolidated Statement of Operations.
15. Commitments and Contingencies
Lease obligations
The Company leases approximately 43,000 square feet of office space in Austin, TX under an operating lease arrangement. We also lease approximately 5,500 square feet of office space in Oklahoma City, Oklahoma. Future minimum payments for all noncancellable operating leases extending beyond one year at December 31, 2016 are as follows:
|
(in thousands of dollars) |
|
|
|
|
|
Years Ending December 31, |
|
|
|
|
|
2017 |
|
$ |
1,054 |
|
|
2018 |
|
|
1,118 |
|
|
2019 |
|
|
1,125 |
|
|
2020 |
|
|
375 |
|
|
2021 |
|
|
— |
|
|
Thereafter |
|
|
— |
|
|
|
|
$ |
3,672 |
|
Rent expense under operating leases was $1.6 million, $1.6 million, and $0.9 million for the years ended December 31, 2016, 2015, and 2014, respectively.
Litigation
The Company is subject to legal proceedings and claims that arise in the ordinary course of its business. When applicable, we record accruals for contingencies when it is probable that a liability will be incurred and the amount of loss can be reasonably estimated. While the outcome of lawsuits and other proceedings against us cannot be predicted with certainty, in the opinion of management, individually or in the aggregate, no such lawsuits are expected to have a material effect on our financial position, results of operations, or liquidity.
In an action filed on June 12, 2015 in the 31st District Court of Hemphill County, Texas, Donna Kim Flowers and Mitchell Kirk Flowers v. Jones Energy, LLC f/k/a Jones Energy Limited, LLC f/k/a Jones Energy, Ltd. (Case No. 7225), the Company was sued by Donna Kim Flowers and Mitchell Kirk Flowers (the “plaintiffs”). The plaintiffs own surface rights to property located in Hemphill County, Texas. The mineral rights are leased to third parties, and the Company is the operator of the Oil and Gas Mineral Lease. On May 28, 2010, the plaintiffs and the Company entered into a Surface Use Agreement concerning the Company’s fracking operations on the property, which require the Company to minimize disruption and damage to the plaintiffs’ surface rights. The plaintiffs allege that the Company is in breach of such contract, and seek monetary damages. In June 2016, the Company presented a settlement offer to the plaintiffs. As a result of this settlement offer, the Company has accrued $1.5 million related to its estimated obligation under this settlement offer. This accrual was included in accrued liabilities on the Company’s Consolidated Balance Sheet as of December 31, 2016, and the charge was recorded as general and administrative expense on the Company’s Consolidated Statement of Operations for the year ended December 31, 2016. However, no certainty exists that a settlement will be reached or if so, the amount of any such settlement. Therefore, the ultimate loss could be greater or less than the amount accrued. In the event the plaintiffs and the Company are not able to reach a settlement, a court date is anticipated to occur during the third quarter of 2017.
F-32
16. Subsequent Events
Preferred Stock Dividend Declared
On January 19, 2017, the Company’s Board of Directors declared a quarterly cash dividend per share equal to 8.0% based on the liquidation preference of $50.00 per share on an annualized basis, or $1.00 per share, on the Company’s 8.0% Series A Perpetual Convertible Preferred Stock. This dividend is for the period beginning on the last payment date of November 15, 2016 through February 14, 2017 and was paid in cash on February 15, 2017 to shareholders of record as of February 1, 2017.
Special Stock Dividend Declared
On March 3, 2017, the Company’s Board of Directors declared a special stock dividend of 0.087423 shares of the Company’s Class A common stock, $0.001 par value (“Class A Common Stock”), for each outstanding share of Class A Common Stock (based on the number of shares outstanding on the date hereof). The special stock dividend is payable on March 31, 2017 to stockholders of record as of the close of business on March 15, 2017. In lieu of issuing fractional shares of Class A Common Stock, cash will be distributed.
From time-to-time, the Company’s subsidiary Jones Energy Holdings, LLC (“JEH”) makes cash distributions to the holders of common units representing membership interests in JEH (“JEH Common Units”) to cover tax obligations that may occur as a result of any net taxable income of JEH allocable to holders of JEH Common Units. As a JEH Common Unit holder, the Company has received such cash distributions from JEH in excess of the amount required to satisfy the Company’s associated tax obligations. As a result, the Company is using the excess cash of approximately $17.5 million in the aggregate to acquire newly-issued JEH Common Units from JEH, who will use the $17.5 million in proceeds to pay down debt outstanding under its credit facility.
The stock dividend has been declared in order to equalize the number of shares of Class A Common Stock outstanding to the number of JEH Common Units held by the Company, and the aggregate number of Class A Common Stock issued in the stock dividend will equal the number of additional JEH Common Units the Company is purchasing from JEH. The JEH Common Units will be purchased at a price of $3.50 per share, which is the volume weighted average price per share of the Class A Common stock for the five trading days ended February 28, 2017. Cash payments in lieu of fractional shares will also be made on the basis of a value per share of Class A Common Stock of $3.50 per share.
The declaration, amount and payment of any future dividends on shares of Class A Common Stock will be at the sole discretion of Jones Energy’s board of directors and the amount and timing of any future dividends cannot be predicted at this time.
17. Subsidiary Guarantors
On April 1, 2014, the Issuers sold $500.0 million in aggregate principal amount of the 2022 Notes. On February 23, 2015, the Issuers sold $250.0 million in aggregate principal amount of the 2023 Notes.
As of December 31, 2016, the 2022 Notes and the 2023 Notes are guaranteed on a senior unsecured basis by the Company and by all of its significant subsidiaries, other than Nosley SCOOP, LLC and Nosley Acquisition, LLC. Therefore, these two subsidiaries are not displayed as subsidiary guarantors in our financial statements for the year ending December 31, 2016. Nosley SCOOP, LLC and Nosley Acquisition, LLC have since become guarantors during the first quarter of 2017 and will be presented as such going forward. Each subsidiary guarantor is 100% owned by JEH, and all guarantees are full and unconditional, subject to customary exceptions pursuant to the indentures governing our 2022 Notes and 2023 Notes, as discussed below, and joint and several with all other subsidiary guarantees and the parent guarantee. Any subsidiaries of JEH other than the subsidiary guarantors and Jones Energy Finance Corp. are immaterial.
Guarantees of the 2022 Notes and 2023 Notes will be released under certain circumstances, including (i) in connection with any sale or other disposition of (a) all or substantially all of the properties or assets of a guarantor (including by way of merger or consolidation) or (b) all of the capital stock of such guarantor, in each case, to a person that is not the Company or a restricted subsidiary of the Company, (ii) if the Company designates any restricted subsidiary that is a guarantor as an unrestricted subsidiary, (iii) upon legal defeasance, covenant defeasance or satisfaction and discharge of the applicable indenture, or (iv) at such time as such guarantor ceases to guarantee any other indebtedness of the Company or any other guarantor.
F-33
The Company is a holding company whose sole material asset is an equity interest in JEH. The Company is the sole managing member of JEH and is responsible for all operational, management and administrative decisions related to JEH’s business. In accordance with JEH’s limited liability company agreement, the Company may not be removed as the sole managing member of JEH.
As of December 31, 2016, the Company held 57,025,474 JEH Units and all of the preferred units representing membership interests in JEH, and the remaining 29,832,098 JEH Units are held by a group of investors that owned interests in JEH prior to the Company’s IPO (the “Class B shareholders”). The Class B shareholders have no voting rights with respect to their economic interest in JEH.
The Company has two classes of common stock, Class A common stock, which was sold to investors in the IPO, and Class B common stock, and one series of preferred stock, Series A preferred stock. Pursuant to the Company’s certificate of incorporation, each share of Class A common stock is entitled to one vote per share, and the shares of Class A common stock are entitled to 100% of the economic interests in the Company. Each share of Class B common stock has no economic rights in the Company, but entitles its holder to one vote on all matters to be voted on by the Company’s stockholders generally. Except as required by law or the Company’s certificate of incorporation, which includes the certificate of designations for the Series A preferred stock, the holders of Series A preferred stock have no voting rights (other than with respect to certain matters regarding the Series A preferred stock or when dividends payable on the Series A preferred stock have not been paid for an aggregate of six quarterly dividend periods, or more, whether or not consecutive, as provided in the certificate of designations for the Series A preferred stock).
In connection with a reorganization that occurred immediately prior to the IPO, each Existing Owner was issued a number of shares of Class B common stock that was equal to the number of JEH Units that such Class B shareholder held. Holders of the Company’s Class A common stock and Class B common stock generally vote together as a single class on all matters presented to the Company’s stockholders for their vote or approval. Accordingly, the Existing Owners collectively have a number of votes in the Company equal to the aggregate number of JEH Units that they hold.
The Class B shareholders have the right, pursuant to the terms of an exchange agreement by and among the Company, JEH and each of the Class B shareholders (the “Exchange Agreement”), to exchange their JEH Units (together with a corresponding number of shares of Class B common stock) for shares of Class A common stock on a one-for-one basis, subject to customary conversion rate adjustments for stock splits, stock dividends and reclassifications and other similar transactions. As a result, the Company expects that over time the Company will have an increasing economic interest in JEH as Class B common stock and JEH Units are exchanged for Class A common stock. Moreover, any transfers of JEH Units outside of the Exchange Agreement (other than permitted transfers to affiliates) must be approved by the Company. The Company intends to retain full voting and management control over JEH.
F-34
Jones Energy, Inc.
Condensed Consolidating Balance Sheet
December 31, 2016
|
|
|
|
|
|
|
|
|
Guarantor |
|
Non-Guarantor |
|
|
|
|
|
|
|
||
|
(in thousands of dollars) |
|
JEI (Parent) |
|
Issuers |
|
Subsidiaries |
|
Subsidiaries |
|
Eliminations |
|
Consolidated |
|
||||||
|
Assets |
|
|
|
|
|
|
|
|
|
|
|
|
|
|
|
|
|
|
|
|
Current assets |
|
|
|
|
|
|
|
|
|
|
|
|
|
|
|
|
|
|
|
|
Cash |
|
$ |
27,164 |
|
$ |
1,975 |
|
$ |
5,483 |
|
$ |
20 |
|
$ |
— |
|
$ |
34,642 |
|
|
Accounts receivable, net |
|
|
|
|
|
|
|
|
|
|
|
|
|
|
|
|
|
|
|
|
Oil and gas sales |
|
|
— |
|
|
— |
|
|
26,568 |
|
|
— |
|
|
— |
|
|
26,568 |
|
|
Joint interest owners |
|
|
— |
|
|
— |
|
|
5,267 |
|
|
— |
|
|
— |
|
|
5,267 |
|
|
Other |
|
|
— |
|
|
5,434 |
|
|
627 |
|
|
— |
|
|
— |
|
|
6,061 |
|
|
Commodity derivative assets |
|
|
— |
|
|
24,100 |
|
|
— |
|
|
— |
|
|
— |
|
|
24,100 |
|
|
Other current assets |
|
|
— |
|
|
422 |
|
|
2,262 |
|
|
— |
|
|
— |
|
|
2,684 |
|
|
Intercompany receivable |
|
|
15,666 |
|
|
1,180,859 |
|
|
— |
|
|
— |
|
|
(1,196,525) |
|
|
— |
|
|
Total current assets |
|
|
42,830 |
|
|
1,212,790 |
|
|
40,207 |
|
|
20 |
|
|
(1,196,525) |
|
|
99,322 |
|
|
Oil and gas properties, net, at cost under the successful efforts method |
|
|
— |
|
|
— |
|
|
1,586,707 |
|
|
156,881 |
|
|
— |
|
|
1,743,588 |
|
|
Other property, plant and equipment, net |
|
|
— |
|
|
— |
|
|
2,378 |
|
|
618 |
|
|
— |
|
|
2,996 |
|
|
Commodity derivative assets |
|
|
— |
|
|
34,744 |
|
|
— |
|
|
— |
|
|
— |
|
|
34,744 |
|
|
Other assets |
|
|
— |
|
|
5,265 |
|
|
785 |
|
|
— |
|
|
— |
|
|
6,050 |
|
|
Investment in subsidiaries |
|
|
531,363 |
|
|
— |
|
|
— |
|
|
— |
|
|
(531,363) |
|
|
— |
|
|
Total assets |
|
$ |
574,193 |
|
$ |
1,252,799 |
|
$ |
1,630,077 |
|
$ |
157,519 |
|
$ |
(1,727,888) |
|
$ |
1,886,700 |
|
|
Liabilities and Stockholders’ Equity |
|
|
|
|
|
|
|
|
|
|
|
|
|
|
|
|
|
|
|
|
Current liabilities |
|
|
|
|
|
|
|
|
|
|
|
|
|
|
|
|
|
|
|
|
Trade accounts payable |
|
$ |
— |
|
$ |
13 |
|
$ |
36,514 |
|
$ |
— |
|
$ |
— |
|
$ |
36,527 |
|
|
Oil and gas sales payable |
|
|
— |
|
|
— |
|
|
28,339 |
|
|
— |
|
|
— |
|
|
28,339 |
|
|
Accrued liabilities |
|
|
3,874 |
|
|
11,227 |
|
|
10,597 |
|
|
9 |
|
|
— |
|
|
25,707 |
|
|
Commodity derivative liabilities |
|
|
— |
|
|
14,650 |
|
|
— |
|
|
— |
|
|
— |
|
|
14,650 |
|
|
Other current liabilities |
|
|
— |
|
|
1,984 |
|
|
600 |
|
|
— |
|
|
— |
|
|
2,584 |
|
|
Intercompany payable |
|
|
— |
|
|
— |
|
|
1,410,077 |
|
|
159,660 |
|
|
(1,569,737) |
|
|
— |
|
|
Total current liabilities |
|
|
3,874 |
|
|
27,874 |
|
|
1,486,127 |
|
|
159,669 |
|
|
(1,569,737) |
|
|
107,807 |
|
|
Long-term debt |
|
|
— |
|
|
724,009 |
|
|
— |
|
|
— |
|
|
— |
|
|
724,009 |
|
|
Deferred revenue |
|
|
— |
|
|
7,049 |
|
|
— |
|
|
— |
|
|
— |
|
|
7,049 |
|
|
Commodity derivative liabilities |
|
|
— |
|
|
1,209 |
|
|
— |
|
|
— |
|
|
— |
|
|
1,209 |
|
|
Asset retirement obligations |
|
|
— |
|
|
— |
|
|
19,441 |
|
|
17 |
|
|
— |
|
|
19,458 |
|
|
Liability under tax receivable agreement |
|
|
43,045 |
|
|
— |
|
|
— |
|
|
— |
|
|
— |
|
|
43,045 |
|
|
Other liabilities |
|
|
— |
|
|
269 |
|
|
523 |
|
|
— |
|
|
— |
|
|
792 |
|
|
Deferred tax liabilities |
|
|
85 |
|
|
2,820 |
|
|
— |
|
|
— |
|
|
— |
|
|
2,905 |
|
|
Total liabilities |
|
|
47,004 |
|
|
763,230 |
|
|
1,506,091 |
|
|
159,686 |
|
|
(1,569,737) |
|
|
906,274 |
|
|
Mezzanine equity |
|
|
|
|
|
|
|
|
|
|
|
|
|
|
|
|
|
|
|
|
Series A preferred stock, $0.001 par value; 1,840,000 shares issued and outstanding at December 31, 2016 |
|
|
88,975 |
|
|
— |
|
|
— |
|
|
— |
|
|
— |
|
|
88,975 |
|
|
Stockholders’/ members' equity |
|
|
|
|
|
|
|
|
|
|
|
|
|
|
|
|
|
|
|
|
Members' equity |
|
|
— |
|
|
489,569 |
|
|
123,986 |
|
|
(2,167) |
|
|
(611,388) |
|
|
— |
|
|
Class A common stock, $0.001 par value; 57,048,076 shares issued and 57,025,474 shares outstanding at December 31, 2016 |
|
|
57 |
|
|
— |
|
|
— |
|
|
— |
|
|
— |
|
|
57 |
|
|
Class B common stock, $0.001 par value; 29,832,098 shares issued and outstanding at December 31, 2016 |
|
|
30 |
|
|
— |
|
|
— |
|
|
— |
|
|
— |
|
|
30 |
|
|
Treasury stock, at cost: 22,602 shares at December 31, 2016 |
|
|
(358) |
|
|
— |
|
|
— |
|
|
— |
|
|
— |
|
|
(358) |
|
|
Additional paid-in-capital |
|
|
447,137 |
|
|
— |
|
|
— |
|
|
— |
|
|
— |
|
|
447,137 |
|
|
Retained earnings (deficit) |
|
|
(8,652) |
|
|
— |
|
|
— |
|
|
— |
|
|
— |
|
|
(8,652) |
|
|
Stockholders' equity |
|
|
438,214 |
|
|
489,569 |
|
|
123,986 |
|
|
(2,167) |
|
|
(611,388) |
|
|
438,214 |
|
|
Non-controlling interest |
|
|
— |
|
|
— |
|
|
— |
|
|
— |
|
|
453,237 |
|
|
453,237 |
|
|
Total stockholders’ equity |
|
|
438,214 |
|
|
489,569 |
|
|
123,986 |
|
|
(2,167) |
|
|
(158,151) |
|
|
891,451 |
|
|
Total liabilities and stockholders’ equity |
|
$ |
574,193 |
|
$ |
1,252,799 |
|
$ |
1,630,077 |
|
$ |
157,519 |
|
$ |
(1,727,888) |
|
$ |
1,886,700 |
|
F-35
Jones Energy, Inc.
Condensed Consolidating Balance Sheet
December 31, 2015
|
|
|
|
|
|
|
|
|
Guarantor |
|
Non-Guarantor |
|
|
|
|
|
|
|
||
|
(in thousands of dollars) |
|
JEI (Parent) |
|
Issuers |
|
Subsidiaries |
|
Subsidiaries |
|
Eliminations |
|
Consolidated |
|
||||||
|
Assets |
|
|
|
|
|
|
|
|
|
|
|
|
|
|
|
|
|
|
|
|
Current assets |
|
|
|
|
|
|
|
|
|
|
|
|
|
|
|
|
|
|
|
|
Cash |
|
$ |
100 |
|
$ |
12,448 |
|
$ |
9,325 |
|
$ |
20 |
|
$ |
— |
|
$ |
21,893 |
|
|
Accounts receivable, net |
|
|
|
|
|
|
|
|
|
|
|
|
|
|
|
|
|
|
|
|
Oil and gas sales |
|
|
— |
|
|
— |
|
|
19,292 |
|
|
— |
|
|
— |
|
|
19,292 |
|
|
Joint interest owners |
|
|
— |
|
|
— |
|
|
11,314 |
|
|
— |
|
|
— |
|
|
11,314 |
|
|
Other |
|
|
— |
|
|
14,444 |
|
|
726 |
|
|
— |
|
|
— |
|
|
15,170 |
|
|
Commodity derivative assets |
|
|
— |
|
|
124,207 |
|
|
— |
|
|
— |
|
|
— |
|
|
124,207 |
|
|
Other current assets |
|
|
— |
|
|
444 |
|
|
1,854 |
|
|
— |
|
|
— |
|
|
2,298 |
|
|
Intercompany receivable |
|
|
12,866 |
|
|
1,161,997 |
|
|
— |
|
|
— |
|
|
(1,174,863) |
|
|
— |
|
|
Total current assets |
|
|
12,966 |
|
|
1,313,540 |
|
|
42,511 |
|
|
20 |
|
|
(1,174,863) |
|
|
194,174 |
|
|
Oil and gas properties, net, at cost under the successful efforts method |
|
|
— |
|
|
— |
|
|
1,635,766 |
|
|
— |
|
|
— |
|
|
1,635,766 |
|
|
Other property, plant and equipment, net |
|
|
— |
|
|
— |
|
|
3,168 |
|
|
705 |
|
|
— |
|
|
3,873 |
|
|
Commodity derivative assets |
|
|
— |
|
|
93,302 |
|
|
— |
|
|
— |
|
|
— |
|
|
93,302 |
|
|
Other assets |
|
|
— |
|
|
7,456 |
|
|
583 |
|
|
— |
|
|
— |
|
|
8,039 |
|
|
Investment in subsidiaries |
|
|
444,362 |
|
|
— |
|
|
— |
|
|
— |
|
|
(444,362) |
|
|
— |
|
|
Total assets |
|
$ |
457,328 |
|
$ |
1,414,298 |
|
$ |
1,682,028 |
|
$ |
725 |
|
$ |
(1,619,225) |
|
$ |
1,935,154 |
|
|
Liabilities and Stockholders’ Equity |
|
|
|
|
|
|
|
|
|
|
|
|
|
|
|
|
|
|
|
|
Current liabilities |
|
|
|
|
|
|
|
|
|
|
|
|
|
|
|
|
|
|
|
|
Trade accounts payable |
|
$ |
— |
|
$ |
388 |
|
$ |
7,079 |
|
$ |
— |
|
$ |
— |
|
$ |
7,467 |
|
|
Oil and gas sales payable |
|
|
— |
|
|
— |
|
|
32,408 |
|
|
— |
|
|
— |
|
|
32,408 |
|
|
Accrued liabilities |
|
|
— |
|
|
15,741 |
|
|
11,270 |
|
|
— |
|
|
— |
|
|
27,011 |
|
|
Commodity derivative liabilities |
|
|
— |
|
|
11 |
|
|
— |
|
|
— |
|
|
— |
|
|
11 |
|
|
Other current liabilities |
|
|
— |
|
|
— |
|
|
679 |
|
|
— |
|
|
— |
|
|
679 |
|
|
Intercompany payable |
|
|
— |
|
|
— |
|
|
1,391,838 |
|
|
2,434 |
|
|
(1,394,272) |
|
|
— |
|
|
Total current liabilities |
|
|
— |
|
|
16,140 |
|
|
1,443,274 |
|
|
2,434 |
|
|
(1,394,272) |
|
|
67,576 |
|
|
Long-term debt |
|
|
— |
|
|
837,654 |
|
|
— |
|
|
— |
|
|
— |
|
|
837,654 |
|
|
Deferred revenue |
|
|
— |
|
|
11,417 |
|
|
— |
|
|
— |
|
|
— |
|
|
11,417 |
|
|
Asset retirement obligations |
|
|
— |
|
|
— |
|
|
20,301 |
|
|
— |
|
|
— |
|
|
20,301 |
|
|
Liability under tax receivable agreement |
|
|
38,052 |
|
|
— |
|
|
— |
|
|
— |
|
|
— |
|
|
38,052 |
|
|
Other liabilities |
|
|
— |
|
|
— |
|
|
330 |
|
|
— |
|
|
— |
|
|
330 |
|
|
Deferred tax liabilities |
|
|
19,280 |
|
|
3,692 |
|
|
— |
|
|
— |
|
|
— |
|
|
22,972 |
|
|
Total liabilities |
|
|
57,332 |
|
|
868,903 |
|
|
1,463,905 |
|
|
2,434 |
|
|
(1,394,272) |
|
|
998,302 |
|
|
Stockholders’/ members' equity |
|
|
|
|
|
|
|
|
|
|
|
|
|
|
|
|
|
|
|
|
Members' equity |
|
|
— |
|
|
545,395 |
|
|
218,123 |
|
|
(1,709) |
|
|
(761,809) |
|
|
— |
|
|
Class A common stock, $0.001 par value; 30,573,509 shares issued and 30,550,907 shares outstanding at December 31, 2015 |
|
|
31 |
|
|
— |
|
|
— |
|
|
— |
|
|
— |
|
|
31 |
|
|
Class B common stock, $0.001 par value; 31,273,130 shares issued and outstanding at December 31, 2015 |
|
|
31 |
|
|
— |
|
|
— |
|
|
— |
|
|
— |
|
|
31 |
|
|
Treasury stock, at cost: 22,602 shares at December 31, 2015 |
|
|
(358) |
|
|
— |
|
|
— |
|
|
— |
|
|
— |
|
|
(358) |
|
|
Additional paid-in-capital |
|
|
363,723 |
|
|
— |
|
|
— |
|
|
— |
|
|
— |
|
|
363,723 |
|
|
Retained earnings (deficit) |
|
|
36,569 |
|
|
— |
|
|
— |
|
|
— |
|
|
— |
|
|
36,569 |
|
|
Stockholders' equity |
|
|
399,996 |
|
|
545,395 |
|
|
218,123 |
|
|
(1,709) |
|
|
(761,809) |
|
|
399,996 |
|
|
Non-controlling interest |
|
|
— |
|
|
— |
|
|
— |
|
|
— |
|
|
536,856 |
|
|
536,856 |
|
|
Total stockholders’ equity |
|
|
399,996 |
|
|
545,395 |
|
|
218,123 |
|
|
(1,709) |
|
|
(224,953) |
|
|
936,852 |
|
|
Total liabilities and stockholders’ equity |
|
$ |
457,328 |
|
$ |
1,414,298 |
|
$ |
1,682,028 |
|
$ |
725 |
|
$ |
(1,619,225) |
|
$ |
1,935,154 |
|
F-36
Jones Energy, Inc.
Condensed Consolidating Statement of Operations
Year Ended December 31, 2016
|
|
|
|
|
|
|
|
|
Guarantor |
|
Non-Guarantor |
|
|
|
|
|
|
|
||
|
(in thousands of dollars) |
|
JEI (Parent) |
|
Issuers |
|
Subsidiaries |
|
Subsidiaries |
|
Eliminations |
|
Consolidated |
|
||||||
|
Operating revenues |
|
|
|
|
|
|
|
|
|
|
|
|
|
|
|
|
|
|
|
|
Oil and gas sales |
|
$ |
— |
|
$ |
— |
|
$ |
124,861 |
|
$ |
16 |
|
$ |
— |
|
$ |
124,877 |
|
|
Other revenues |
|
|
— |
|
|
2,384 |
|
|
586 |
|
|
— |
|
|
— |
|
|
2,970 |
|
|
Total operating revenues |
|
|
— |
|
|
2,384 |
|
|
125,447 |
|
|
16 |
|
|
— |
|
|
127,847 |
|
|
Operating costs and expenses |
|
|
|
|
|
|
|
|
|
|
|
|
|
|
|
|
|
|
|
|
Lease operating |
|
|
— |
|
|
— |
|
|
32,633 |
|
|
7 |
|
|
— |
|
|
32,640 |
|
|
Production and ad valorem taxes |
|
|
— |
|
|
— |
|
|
7,768 |
|
|
— |
|
|
— |
|
|
7,768 |
|
|
Exploration |
|
|
— |
|
|
— |
|
|
6,673 |
|
|
— |
|
|
— |
|
|
6,673 |
|
|
Depletion, depreciation and amortization |
|
|
— |
|
|
— |
|
|
153,831 |
|
|
99 |
|
|
— |
|
|
153,930 |
|
|
Accretion of ARO liability |
|
|
— |
|
|
— |
|
|
1,263 |
|
|
— |
|
|
— |
|
|
1,263 |
|
|
General and administrative |
|
|
— |
|
|
12,028 |
|
|
17,244 |
|
|
368 |
|
|
— |
|
|
29,640 |
|
|
Other operating |
|
|
— |
|
|
— |
|
|
199 |
|
|
— |
|
|
— |
|
|
199 |
|
|
Total operating expenses |
|
|
— |
|
|
12,028 |
|
|
219,611 |
|
|
474 |
|
|
— |
|
|
232,113 |
|
|
Operating income (loss) |
|
|
— |
|
|
(9,644) |
|
|
(94,164) |
|
|
(458) |
|
|
— |
|
|
(104,266) |
|
|
Other income (expense) |
|
|
|
|
|
|
|
|
|
|
|
|
|
|
|
|
|
|
|
|
Interest expense |
|
|
— |
|
|
(53,080) |
|
|
(47) |
|
|
— |
|
|
— |
|
|
(53,127) |
|
|
Gain on debt extinguishment |
|
|
— |
|
|
99,530 |
|
|
— |
|
|
— |
|
|
— |
|
|
99,530 |
|
|
Net gain (loss) on commodity derivatives |
|
|
— |
|
|
(51,264) |
|
|
— |
|
|
— |
|
|
— |
|
|
(51,264) |
|
|
Other income (expense) |
|
|
784 |
|
|
(321) |
|
|
73 |
|
|
— |
|
|
— |
|
|
536 |
|
|
Other income (expense), net |
|
|
784 |
|
|
(5,135) |
|
|
26 |
|
|
— |
|
|
— |
|
|
(4,325) |
|
|
Income (loss) before income tax |
|
|
784 |
|
|
(14,779) |
|
|
(94,138) |
|
|
(458) |
|
|
— |
|
|
(108,591) |
|
|
Equity interest in income |
|
|
(66,804) |
|
|
— |
|
|
— |
|
|
— |
|
|
66,804 |
|
|
— |
|
|
Income tax provision (benefit) |
|
|
(23,468) |
|
|
(318) |
|
|
— |
|
|
— |
|
|
— |
|
|
(23,786) |
|
|
Net income (loss) |
|
|
(42,552) |
|
|
(14,461) |
|
|
(94,138) |
|
|
(458) |
|
|
66,804 |
|
|
(84,805) |
|
|
Net income (loss) attributable to non-controlling interests |
|
|
— |
|
|
— |
|
|
— |
|
|
— |
|
|
(42,253) |
|
|
(42,253) |
|
|
Net income (loss) attributable to controlling interests |
|
$ |
(42,552) |
|
$ |
— |
|
$ |
— |
|
$ |
— |
|
$ |
— |
|
$ |
(42,552) |
|
|
Dividends and accretion on preferred stock |
|
|
(2,669) |
|
|
— |
|
|
— |
|
|
— |
|
|
— |
|
|
(2,669) |
|
|
Net income (loss) attributable to common shareholders |
|
$ |
(45,221) |
|
$ |
— |
|
$ |
— |
|
$ |
— |
|
$ |
— |
|
$ |
(45,221) |
|
F-37
Jones Energy, Inc.
Condensed Consolidating Statement of Operations
Year Ended December 31, 2015
|
|
|
|
|
|
|
|
|
Guarantor |
|
Non-Guarantor |
|
|
|
|
|
|
|
||
|
(in thousands of dollars) |
|
JEI (Parent) |
|
Issuers |
|
Subsidiaries |
|
Subsidiaries |
|
Eliminations |
|
Consolidated |
|
||||||
|
Operating revenues |
|
|
|
|
|
|
|
|
|
|
|
|
|
|
|
|
|
|
|
|
Oil and gas sales |
|
$ |
— |
|
$ |
— |
|
$ |
194,555 |
|
$ |
— |
|
$ |
— |
|
$ |
194,555 |
|
|
Other revenues |
|
|
— |
|
|
1,960 |
|
|
884 |
|
|
— |
|
|
— |
|
|
2,844 |
|
|
Total operating revenues |
|
|
— |
|
|
1,960 |
|
|
195,439 |
|
|
— |
|
|
— |
|
|
197,399 |
|
|
Operating costs and expenses |
|
|
|
|
|
|
|
|
|
|
|
|
|
|
|
|
|
|
|
|
Lease operating |
|
|
— |
|
|
— |
|
|
41,027 |
|
|
— |
|
|
— |
|
|
41,027 |
|
|
Production and ad valorem taxes |
|
|
— |
|
|
— |
|
|
12,130 |
|
|
— |
|
|
— |
|
|
12,130 |
|
|
Exploration |
|
|
— |
|
|
— |
|
|
6,551 |
|
|
— |
|
|
— |
|
|
6,551 |
|
|
Depletion, depreciation and amortization |
|
|
— |
|
|
— |
|
|
205,407 |
|
|
91 |
|
|
— |
|
|
205,498 |
|
|
Accretion of ARO liability |
|
|
— |
|
|
— |
|
|
1,087 |
|
|
— |
|
|
— |
|
|
1,087 |
|
|
General and administrative |
|
|
— |
|
|
13,565 |
|
|
19,707 |
|
|
116 |
|
|
— |
|
|
33,388 |
|
|
Other operating |
|
|
|
|
|
— |
|
|
4,188 |
|
|
— |
|
|
|
|
|
4,188 |
|
|
Total operating expenses |
|
|
— |
|
|
13,565 |
|
|
290,097 |
|
|
207 |
|
|
— |
|
|
303,869 |
|
|
Operating income (loss) |
|
|
— |
|
|
(11,605) |
|
|
(94,658) |
|
|
(207) |
|
|
— |
|
|
(106,470) |
|
|
Other income (expense) |
|
|
|
|
|
|
|
|
|
|
|
|
|
|
|
|
|
|
|
|
Interest expense |
|
|
— |
|
|
(63,160) |
|
|
(1,298) |
|
|
— |
|
|
— |
|
|
(64,458) |
|
|
Net gain (loss) on commodity derivatives |
|
|
— |
|
|
158,753 |
|
|
— |
|
|
— |
|
|
— |
|
|
158,753 |
|
|
Other income (expense) |
|
|
1,984 |
|
|
(1,663) |
|
|
(4) |
|
|
— |
|
|
— |
|
|
317 |
|
|
Other income (expense), net |
|
|
1,984 |
|
|
93,930 |
|
|
(1,302) |
|
|
— |
|
|
— |
|
|
94,612 |
|
|
Income (loss) before income tax |
|
|
1,984 |
|
|
82,325 |
|
|
(95,960) |
|
|
(207) |
|
|
— |
|
|
(11,858) |
|
|
Equity interest in income |
|
|
(4,728) |
|
|
— |
|
|
— |
|
|
— |
|
|
4,728 |
|
|
— |
|
|
Income tax provision (benefit) |
|
|
(363) |
|
|
(2,418) |
|
|
— |
|
|
— |
|
|
— |
|
|
(2,781) |
|
|
Net income (loss) |
|
|
(2,381) |
|
|
84,743 |
|
|
(95,960) |
|
|
(207) |
|
|
4,728 |
|
|
(9,077) |
|
|
Net income (loss) attributable to non-controlling interests |
|
|
— |
|
|
— |
|
|
— |
|
|
— |
|
|
(6,696) |
|
|
(6,696) |
|
|
Net income (loss) attributable to controlling interests |
|
$ |
(2,381) |
|
$ |
— |
|
$ |
— |
|
$ |
— |
|
$ |
— |
|
$ |
(2,381) |
|
F-38
Jones Energy, Inc.
Condensed Consolidating Statement of Operations
Year Ended December 31, 2014
|
|
|
|
|
|
|
|
|
Guarantor |
|
Non-Guarantor |
|
|
|
|
|
|
|
||
|
(in thousands of dollars) |
|
JEI (Parent) |
|
Issuers |
|
Subsidiaries |
|
Subsidiaries |
|
Eliminations |
|
Consolidated |
|
||||||
|
Operating revenues |
|
|
|
|
|
|
|
|
|
|
|
|
|
|
|
|
|
|
|
|
Oil and gas sales |
|
$ |
— |
|
$ |
— |
|
$ |
378,401 |
|
$ |
— |
|
$ |
— |
|
$ |
378,401 |
|
|
Other revenues |
|
|
— |
|
|
1,154 |
|
|
1,042 |
|
|
— |
|
|
— |
|
|
2,196 |
|
|
Total operating revenues |
|
|
— |
|
|
1,154 |
|
|
379,443 |
|
|
— |
|
|
— |
|
|
380,597 |
|
|
Operating costs and expenses |
|
|
|
|
|
|
|
|
|
|
|
|
|
|
|
|
|
|
|
|
Lease operating |
|
|
— |
|
|
— |
|
|
37,760 |
|
|
— |
|
|
— |
|
|
37,760 |
|
|
Production and ad valorem taxes |
|
|
— |
|
|
— |
|
|
22,556 |
|
|
— |
|
|
— |
|
|
22,556 |
|
|
Exploration |
|
|
— |
|
|
— |
|
|
3,453 |
|
|
— |
|
|
— |
|
|
3,453 |
|
|
Depletion, depreciation and amortization |
|
|
— |
|
|
— |
|
|
181,578 |
|
|
91 |
|
|
— |
|
|
181,669 |
|
|
Accretion of ARO liability |
|
|
— |
|
|
— |
|
|
770 |
|
|
— |
|
|
— |
|
|
770 |
|
|
General and administrative |
|
|
— |
|
|
4,493 |
|
|
21,181 |
|
|
89 |
|
|
— |
|
|
25,763 |
|
|
Total operating expenses |
|
|
— |
|
|
4,493 |
|
|
267,298 |
|
|
180 |
|
|
— |
|
|
271,971 |
|
|
Operating income (loss) |
|
|
— |
|
|
(3,339) |
|
|
112,145 |
|
|
(180) |
|
|
— |
|
|
108,626 |
|
|
Other income (expense) |
|
|
|
|
|
|
|
|
|
|
|
|
|
|
|
|
|
|
|
|
Interest expense |
|
|
— |
|
|
(40,365) |
|
|
(1,510) |
|
|
— |
|
|
— |
|
|
(41,875) |
|
|
Net gain (loss) on commodity derivatives |
|
|
— |
|
|
189,641 |
|
|
— |
|
|
— |
|
|
— |
|
|
189,641 |
|
|
Other income (expense) |
|
|
— |
|
|
(4,851) |
|
|
297 |
|
|
— |
|
|
— |
|
|
(4,554) |
|
|
Other income (expense), net |
|
|
— |
|
|
144,425 |
|
|
(1,213) |
|
|
— |
|
|
— |
|
|
143,212 |
|
|
Income (loss) before income tax |
|
|
— |
|
|
141,086 |
|
|
110,932 |
|
|
(180) |
|
|
— |
|
|
251,838 |
|
|
Equity interest in income |
|
|
63,197 |
|
|
— |
|
|
— |
|
|
— |
|
|
(63,197) |
|
|
— |
|
|
Income tax provision (benefit) |
|
|
22,061 |
|
|
4,157 |
|
|
— |
|
|
— |
|
|
— |
|
|
26,218 |
|
|
Net income (loss) |
|
|
41,136 |
|
|
136,929 |
|
|
110,932 |
|
|
(180) |
|
|
(63,197) |
|
|
225,620 |
|
|
Net income (loss) attributable to non-controlling interests |
|
|
— |
|
|
— |
|
|
— |
|
|
— |
|
|
184,484 |
|
|
184,484 |
|
|
Net income (loss) attributable to controlling interests |
|
$ |
41,136 |
|
$ |
— |
|
$ |
— |
|
$ |
— |
|
$ |
— |
|
$ |
41,136 |
|
F-39
Jones Energy, Inc.
Condensed Consolidating Statement of Cash Flows
Year Ended December 31, 2016
|
|
|
|
|
|
|
|
|
Guarantor |
|
Non-Guarantor |
|
|
|
|
|
|
|
||
|
(in thousands of dollars) |
|
JEI (Parent) |
|
Issuers |
|
Subsidiaries |
|
Subsidiaries |
|
Eliminations |
|
Consolidated |
|
||||||
|
Cash flows from operating activities |
|
|
|
|
|
|
|
|
|
|
|
|
|
|
|
|
|
|
|
|
Net income (loss) |
|
$ |
(42,552) |
|
$ |
(14,461) |
|
$ |
(94,138) |
|
$ |
(458) |
|
$ |
66,804 |
|
$ |
(84,805) |
|
|
Adjustments to reconcile net income (loss) to net cash provided by operating activities |
|
|
(105,877) |
|
|
(70,695) |
|
|
196,547 |
|
|
157,334 |
|
|
(66,804) |
|
|
110,505 |
|
|
Net cash (used in) / provided by operations |
|
|
(148,429) |
|
|
(85,156) |
|
|
102,409 |
|
|
156,876 |
|
|
— |
|
|
25,700 |
|
|
Cash flows from investing activities |
|
|
|
|
|
|
|
|
|
|
|
|
|
|
|
|
|
|
|
|
Additions to oil and gas properties |
|
|
— |
|
|
— |
|
|
(107,586) |
|
|
(156,876) |
|
|
— |
|
|
(264,462) |
|
|
Proceeds from sales of assets |
|
|
— |
|
|
— |
|
|
1,645 |
|
|
— |
|
|
— |
|
|
1,645 |
|
|
Acquisition of other property, plant and equipment |
|
|
— |
|
|
— |
|
|
(310) |
|
|
— |
|
|
— |
|
|
(310) |
|
|
Current period settlements of matured derivative contracts |
|
|
— |
|
|
132,265 |
|
|
— |
|
|
— |
|
|
— |
|
|
132,265 |
|
|
Net cash (used in) / provided by investing |
|
|
— |
|
|
132,265 |
|
|
(106,251) |
|
|
(156,876) |
|
|
— |
|
|
(130,862) |
|
|
Cash flows from financing activities |
|
|
|
|
|
|
|
|
|
|
|
|
|
|
|
|
|
|
|
|
Proceeds from issuance of long-term debt |
|
|
— |
|
|
130,000 |
|
|
— |
|
|
— |
|
|
— |
|
|
130,000 |
|
|
Repayment under long-term debt |
|
|
— |
|
|
(62,000) |
|
|
— |
|
|
— |
|
|
— |
|
|
(62,000) |
|
|
Purchase of senior notes |
|
|
— |
|
|
(84,589) |
|
|
— |
|
|
— |
|
|
— |
|
|
(84,589) |
|
|
Payment of dividends on preferred stock |
|
|
(1,615) |
|
|
— |
|
|
— |
|
|
— |
|
|
— |
|
|
(1,615) |
|
|
Net distributions paid to JEH unitholders |
|
|
23,674 |
|
|
(40,993) |
|
|
— |
|
|
— |
|
|
— |
|
|
(17,319) |
|
|
Proceeds from sale of common stock |
|
|
65,446 |
|
|
— |
|
|
— |
|
|
— |
|
|
— |
|
|
65,446 |
|
|
Proceeds from sale of preferred stock |
|
|
87,988 |
|
|
— |
|
|
— |
|
|
— |
|
|
— |
|
|
87,988 |
|
|
Net cash (used in) / provided by financing |
|
|
175,493 |
|
|
(57,582) |
|
|
— |
|
|
— |
|
|
— |
|
|
117,911 |
|
|
Net increase (decrease) in cash |
|
|
27,064 |
|
|
(10,473) |
|
|
(3,842) |
|
|
— |
|
|
— |
|
|
12,749 |
|
|
Cash |
|
|
|
|
|
|
|
|
|
|
|
|
|
|
|
|
|
|
|
|
Beginning of period |
|
|
100 |
|
|
12,448 |
|
|
9,325 |
|
|
20 |
|
|
— |
|
|
21,893 |
|
|
End of period |
|
$ |
27,164 |
|
$ |
1,975 |
|
$ |
5,483 |
|
$ |
20 |
|
$ |
— |
|
$ |
34,642 |
|
F-40
Jones Energy, Inc.
Condensed Consolidating Statement of Cash Flows
Year Ended December 31, 2015
|
|
|
|
|
|
|
|
|
Guarantor |
|
Non-Guarantor |
|
|
|
|
|
|
|
||
|
(in thousands of dollars) |
|
JEI (Parent) |
|
Issuers |
|
Subsidiaries |
|
Subsidiaries |
|
Eliminations |
|
Consolidated |
|
||||||
|
Cash flows from operating activities |
|
|
|
|
|
|
|
|
|
|
|
|
|
|
|
|
|
|
|
|
Net income (loss) |
|
$ |
(2,381) |
|
$ |
84,743 |
|
$ |
(95,960) |
|
$ |
(207) |
|
$ |
4,728 |
|
$ |
(9,077) |
|
|
Adjustments to reconcile net income (loss) to net cash provided by operating activities |
|
|
(120,398) |
|
|
(202,359) |
|
|
405,214 |
|
|
197 |
|
|
(4,728) |
|
|
77,926 |
|
|
Net cash (used in) / provided by operations |
|
|
(122,779) |
|
|
(117,616) |
|
|
309,254 |
|
|
(10) |
|
|
— |
|
|
68,849 |
|
|
Cash flows from investing activities |
|
|
|
|
|
|
|
|
|
|
|
|
|
|
|
|
|
|
|
|
Additions to oil and gas properties |
|
|
— |
|
|
— |
|
|
(311,305) |
|
|
— |
|
|
— |
|
|
(311,305) |
|
|
Proceeds from sales of assets |
|
|
— |
|
|
— |
|
|
41 |
|
|
— |
|
|
— |
|
|
41 |
|
|
Acquisition of other property, plant and equipment |
|
|
— |
|
|
— |
|
|
(1,101) |
|
|
— |
|
|
— |
|
|
(1,101) |
|
|
Current period settlements of matured derivative contracts |
|
|
— |
|
|
144,145 |
|
|
|
|
|
— |
|
|
— |
|
|
144,145 |
|
|
Net cash (used in) / provided by investing |
|
|
— |
|
|
144,145 |
|
|
(312,365) |
|
|
— |
|
|
— |
|
|
(168,220) |
|
|
Cash flows from financing activities |
|
|
|
|
|
|
|
|
|
|
|
|
|
|
|
|
|
|
|
|
Proceeds from issuance of long-term debt |
|
|
— |
|
|
85,000 |
|
|
— |
|
|
— |
|
|
— |
|
|
85,000 |
|
|
Repayment under long-term debt |
|
|
— |
|
|
(335,000) |
|
|
— |
|
|
— |
|
|
— |
|
|
(335,000) |
|
|
Proceeds from senior notes |
|
|
— |
|
|
236,475 |
|
|
— |
|
|
— |
|
|
— |
|
|
236,475 |
|
|
Payment of debt issuance costs |
|
|
— |
|
|
(1,556) |
|
|
— |
|
|
— |
|
|
— |
|
|
(1,556) |
|
|
Proceeds from sale of common stock, net of expense |
|
|
122,779 |
|
|
— |
|
|
— |
|
|
— |
|
|
— |
|
|
122,779 |
|
|
Net cash (used in) / provided by financing |
|
|
122,779 |
|
|
(15,081) |
|
|
— |
|
|
— |
|
|
— |
|
|
107,698 |
|
|
Net increase (decrease) in cash |
|
|
— |
|
|
11,448 |
|
|
(3,111) |
|
|
(10) |
|
|
— |
|
|
8,327 |
|
|
Cash |
|
|
|
|
|
|
|
|
|
|
|
|
|
|
|
|
|
— |
|
|
Beginning of period |
|
|
100 |
|
|
1,000 |
|
|
12,436 |
|
|
30 |
|
|
— |
|
|
13,566 |
|
|
End of period |
|
$ |
100 |
|
$ |
12,448 |
|
$ |
9,325 |
|
$ |
20 |
|
$ |
— |
|
$ |
21,893 |
|
F-41
Jones Energy, Inc.
Condensed Consolidating Statement of Cash Flows
Year Ended December 31, 2014
|
|
|
|
|
|
|
|
|
|
|
|
Non- |
|
|
|
|
|
|
|
|
|
|
|
|
|
|
|
|
|
Guarantor |
|
Guarantor |
|
|
|
|
|
|
|
||
|
(in thousands of dollars) |
|
JEI (Parent) |
|
Issuers |
|
Subsidiaries |
|
Subsidiaries |
|
Eliminations |
|
Consolidated |
|
||||||
|
Cash flows from operating activities |
|
|
|
|
|
|
|
|
|
|
|
|
|
|
|
|
|
|
|
|
Net income (loss) |
|
$ |
41,136 |
|
$ |
136,929 |
|
$ |
110,932 |
|
$ |
(180) |
|
$ |
(63,197) |
|
$ |
225,620 |
|
|
Adjustments to reconcile net income (loss) to net cash provided by operating activities |
|
|
(40,778) |
|
|
(326,859) |
|
|
343,999 |
|
|
140 |
|
|
63,197 |
|
|
39,699 |
|
|
Net cash (used in) / provided by operations |
|
|
358 |
|
|
(189,930) |
|
|
454,931 |
|
|
(40) |
|
|
— |
|
|
265,319 |
|
|
Cash flows from investing activities |
|
|
|
|
|
|
|
|
|
|
|
|
|
|
|
|
|
|
|
|
Additions to oil and gas properties |
|
|
— |
|
|
— |
|
|
(474,619) |
|
|
— |
|
|
— |
|
|
(474,619) |
|
|
Net adjustments to purchase price of properties acquired |
|
|
— |
|
|
— |
|
|
15,709 |
|
|
— |
|
|
— |
|
|
15,709 |
|
|
Proceeds from sales of assets |
|
|
— |
|
|
— |
|
|
448 |
|
|
— |
|
|
— |
|
|
448 |
|
|
Acquisition of other property, plant and equipment |
|
|
— |
|
|
— |
|
|
(1,683) |
|
|
— |
|
|
— |
|
|
(1,683) |
|
|
Current period settlements of matured derivative contracts |
|
|
— |
|
|
(3,654) |
|
|
— |
|
|
— |
|
|
— |
|
|
(3,654) |
|
|
Net cash (used in) / provided by investing |
|
|
— |
|
|
(3,654) |
|
|
(460,145) |
|
|
— |
|
|
— |
|
|
(463,799) |
|
|
Cash flows from financing activities |
|
|
|
|
|
|
|
|
|
|
|
|
|
|
|
|
|
|
|
|
Proceeds from issuance of long-term debt |
|
|
— |
|
|
170,000 |
|
|
— |
|
|
— |
|
|
— |
|
|
170,000 |
|
|
Repayment under long-term debt |
|
|
— |
|
|
(468,000) |
|
|
— |
|
|
— |
|
|
— |
|
|
(468,000) |
|
|
Proceeds from senior notes |
|
|
— |
|
|
500,000 |
|
|
— |
|
|
— |
|
|
— |
|
|
500,000 |
|
|
Payment of debt issuance costs |
|
|
— |
|
|
(13,416) |
|
|
— |
|
|
— |
|
|
— |
|
|
(13,416) |
|
|
Purchases of treasury stock |
|
|
(358) |
|
|
— |
|
|
— |
|
|
— |
|
|
— |
|
|
(358) |
|
|
Net cash (used in) / provided by financing |
|
|
(358) |
|
|
188,584 |
|
|
— |
|
|
— |
|
|
— |
|
|
188,226 |
|
|
Net increase (decrease) in cash |
|
|
— |
|
|
(5,000) |
|
|
(5,214) |
|
|
(40) |
|
|
— |
|
|
(10,254) |
|
|
Cash |
|
|
|
|
|
|
|
|
|
|
|
|
|
|
|
|
|
|
|
|
Beginning of period |
|
|
100 |
|
|
6,000 |
|
|
17,650 |
|
|
70 |
|
|
— |
|
|
23,820 |
|
|
End of period |
|
$ |
100 |
|
$ |
1,000 |
|
$ |
12,436 |
|
$ |
30 |
|
$ |
— |
|
$ |
13,566 |
|
F-42
Jones Energy, Inc.
Supplemental Information on Oil and Gas Producing Activities (Unaudited)
Geographic Area of Operation
All of our proved reserves are located in the mid‑continent United States, spanning areas of Texas and Oklahoma. Therefore, the following disclosures about our costs incurred, results of operations and proved reserves are on a total-company basis.
Costs Incurred
Costs incurred for oil and gas property acquisitions, exploration and development for the last three years are as follows:
|
(in thousands of dollars) |
|
2016 |
|
2015 |
|
2014 |
|
|||
|
Property acquisitions: |
|
|
|
|
|
|
|
|
|
|
|
Unproved |
|
$ |
137,844 |
|
$ |
4,036 |
|
$ |
20,030 |
|
|
Proved |
|
|
51,388 |
|
|
— |
|
|
10,101 |
|
|
Exploration |
|
|
412 |
|
|
6,551 |
|
|
3,453 |
|
|
Development |
|
|
79,617 |
|
|
202,342 |
|
|
488,076 |
|
|
Total costs incurred (1) |
|
$ |
269,261 |
|
$ |
212,929 |
|
$ |
521,660 |
|
|
(1) |
Excludes the impact of asset retirement costs. |
Capitalized Costs
Capitalized costs for our oil and gas properties consisted of the following at the end of each of the following years:
|
(in thousands of dollars) |
|
2016 |
|
2015 |
|
||
|
Unproved properties |
|
$ |
213,153 |
|
$ |
75,308 |
|
|
Proved properties |
|
|
2,449,974 |
|
|
2,320,992 |
|
|
|
|
|
2,663,127 |
|
|
2,396,300 |
|
|
Accumulated depletion and impairment |
|
|
(919,539) |
|
|
(760,534) |
|
|
Net capitalized costs |
|
$ |
1,743,588 |
|
$ |
1,635,766 |
|
Reserves
Users of this information should be aware that the process of estimating quantities of proved and proved developed oil and gas reserves (including natural gas liquids) is very complex, requiring significant subjective decisions in the evaluation of all available geological, engineering and economic data for each reservoir. The data for a given reservoir also may change substantially over time as a result of numerous factors, including additional development activity, evolving production history and continual reassessment of the viability of production under varying economic conditions. Consequently, material revisions to existing reserve estimates may occur from time to time.
The following tables set forth the Company’s total proved reserves and the changes in the Company’s total proved reserves. These reserve estimates are based in part on reports prepared by Cawley, Gillespie & Associates, Inc. (“Cawley Gillespie”), independent petroleum engineers, utilizing data compiled by us. In preparing its reports, Cawley Gillespie evaluated properties representing all of the Company’s proved reserves at December 31, 2016, 2015, and 2014. The Company’s proved reserves are located onshore in the United States. There are many uncertainties inherent in estimating proved reserve quantities, and projecting future production rates and the timing of future development expenditures. In addition, reserve estimates of new discoveries are more imprecise than those of properties with production history. Accordingly, these estimates are subject to change as additional information becomes available. Proved reserves are the estimated quantities of natural gas, natural gas liquids and oil that geoscience and engineering data demonstrate with reasonable certainty to be economically producible in future years from known oil and natural gas reservoirs under existing economic conditions, operating methods and government regulations at the end of the respective years. Proved
F-43
developed reserves are those reserves expected to be recovered through existing wells with existing equipment and operating methods.
|
|
|
Crude Oil |
|
NGL |
|
Natural Gas |
|
Total |
|
|
|
|
(MBbls) |
|
(MBbls) |
|
(MMcf) |
|
(MBoe)(1) |
|
|
Estimated Proved Reserves |
|
|
|
|
|
|
|
|
|
|
December 31, 2013 |
|
16,688 |
|
32,915 |
|
236,648 |
|
89,045 |
|
|
Extensions and discoveries |
|
9,295 |
|
8,675 |
|
59,248 |
|
27,844 |
|
|
Production |
|
(2,475) |
|
(2,345) |
|
(21,922) |
|
(8,474) |
|
|
Purchases of minerals in place |
|
3,180 |
|
3,073 |
|
22,943 |
|
10,077 |
|
|
Sales of minerals in place |
|
— |
|
— |
|
— |
|
— |
|
|
Revisions of previous estimates |
|
995 |
|
(3,448) |
|
(4,640) |
|
(3,226) |
|
|
December 31, 2014 |
|
27,683 |
|
38,870 |
|
292,277 |
|
115,266 |
|
|
Extensions and discoveries |
|
1,793 |
|
1,691 |
|
11,793 |
|
5,450 |
|
|
Production |
|
(2,582) |
|
(2,618) |
|
(23,839) |
|
(9,174) |
|
|
Purchases of minerals in place |
|
— |
|
— |
|
— |
|
— |
|
|
Sales of minerals in place |
|
— |
|
— |
|
— |
|
— |
|
|
Revisions of previous estimates |
|
(1,486) |
|
(5,294) |
|
(18,635) |
|
(9,885) |
|
|
December 31, 2015 |
|
25,408 |
|
32,649 |
|
261,596 |
|
101,657 |
|
|
Extensions and discoveries |
|
774 |
|
750 |
|
4,767 |
|
2,319 |
|
|
Production |
|
(1,690) |
|
(2,210) |
|
(18,878) |
|
(7,046) |
|
|
Purchases of minerals in place |
|
2,326 |
|
3,829 |
|
42,713 |
|
13,275 |
|
|
Sales of minerals in place |
|
(37) |
|
— |
|
(1) |
|
(37) |
|
|
Revisions of previous estimates |
|
(3,187) |
|
(593) |
|
(7,057) |
|
(4,959) |
|
|
December 31, 2016 |
|
23,594 |
|
34,425 |
|
283,140 |
|
105,209 |
|
|
(1) |
Barrels of oil equivalent determined using the ratio of six Mcf of natural gas to one Bbl of crude oil or natural gas liquids. |
For the year ended December 31, 2016, the Company added 2,319 MBoe through extensions, which represent the conversion of unproved reserves to proved reserves as a result of our drilling activity during the year. There were no discoveries of proved reserves. The Company’s estimated proved reserves were reduced by current year production of 7,046 MBoe. The Company added 13,275 MBoe through the purchases of minerals in place. Purchases were primarily related to leasing and the asset purchases in the Western Anadarko basin. The Company also had sales of minerals in place of 37 MBoe during the year ended December 31, 2016.
For the year ended December 31, 2016, the Company had net negative revisions of 4,959 MBoe, of which 1,685 MBoe was related to commodity pricing and 4,155 MBoe was related to proved undeveloped reserves revisions. The remaining net positive revisions of 881 MBoe were primarily related to changes in working interest, cost reductions, and production performance enhancements.
For the year ended December 31, 2015, the Company added 5,450 MBoe through extensions, which represent the conversion of unproved reserves to proved reserves as a result of our drilling activity during the year. There were no discoveries of proved reserves. The Company’s estimated proved reserves were reduced by current year production of 9,174 MBoe. No purchases or sales of minerals in place occurred during the year ended December 31, 2015.
For the year ended December 31, 2015, the Company had net negative revisions of 9,885 MBoe, of which 56,330 MBoe was related to commodity pricing. The remaining net positive revisions of 46,445 MBoe were primarily related to reduced future development costs and production performance improvements.
For the year ended December 31, 2014, the Company added 27,844 MBoe through extensions, which represent the conversion of unproved reserves to proved reserves as a result of our continued drilling activity throughout the year. There were no discoveries of proved reserves. The Company’s estimated proved reserves were reduced by current year production of 8,474 MBoe. The Company added 10,077 MBoe through the purchases of minerals in place. Purchases were primarily related to leasing in the Western Anadarko basin with associated Cleveland proved reserves. No sales of minerals in place occurred during the year ended December 31, 2014.
F-44
For the year ended December 31, 2014, the Company had net negative revisions of 3,226 MBoe, of which 3,534 MBoe was related to production performance in the Arkoma Woodford basin. The remaining net positive revisions of 308 MBoe were primarily related to production performance in the Cleveland basin and other changes.
|
|
|
Crude Oil |
|
NGL |
|
Natural Gas |
|
Total |
|
|
|
|
(MBbls) |
|
(MBbls) |
|
(MMcf) |
|
(MBoe)(1) |
|
|
Estimated Proved Reserves |
|
|
|
|
|
|
|
|
|
|
December 31, 2014 |
|
|
|
|
|
|
|
|
|
|
Proved developed |
|
10,773 |
|
22,555 |
|
160,877 |
|
60,141 |
|
|
Proved undeveloped |
|
16,910 |
|
16,315 |
|
131,400 |
|
55,125 |
|
|
Total proved reserves |
|
27,683 |
|
38,870 |
|
292,277 |
|
115,266 |
|
|
December 31, 2015 |
|
|
|
|
|
|
|
|
|
|
Proved developed |
|
11,032 |
|
19,670 |
|
169,651 |
|
58,977 |
|
|
Proved undeveloped |
|
14,376 |
|
12,980 |
|
91,945 |
|
42,680 |
|
|
Total proved reserves |
|
25,408 |
|
32,650 |
|
261,596 |
|
101,657 |
|
|
December 31, 2016 |
|
|
|
|
|
|
|
|
|
|
Proved developed |
|
11,471 |
|
20,941 |
|
180,293 |
|
62,461 |
|
|
Proved undeveloped |
|
12,123 |
|
13,484 |
|
102,847 |
|
42,748 |
|
|
Total proved reserves |
|
23,594 |
|
34,425 |
|
283,140 |
|
105,209 |
|
|
(1) |
Barrels of oil equivalent determined using the ratio of six Mcf of natural gas to one Bbl of crude oil or natural gas liquids. |
Standardized Measure of Discounted Future Net Cash Flows Relating to Proved Oil and Gas Reserves
The following information was developed utilizing procedures prescribed by FASB Accounting Standards Codification Topic 932, Extractive Industries—Oil and Gas (Topic 932). The “standardized measure of discounted future net cash flows” should not be viewed as representative of the current value of our proved oil and gas reserves. It and the other information contained in the following tables may be useful for certain comparative purposes, but should not be solely relied upon in evaluating the Company or its performance.
In reviewing the information that follows, the following factors should be taken into account:
|
· |
future costs and sales prices will probably differ from those required to be used in these calculations; |
|
· |
actual production rates for future periods may vary significantly from the rates assumed in the calculations; |
|
· |
future tax rates, deductions and credits are calculated under current laws, which may change in future years; |
|
· |
a 10% discount rate may not be reasonable relative to risk inherent in realizing future net oil and natural gas revenues. |
Under the standardized measure, future cash inflows were estimated by using the average of the historical unweighted first‑day‑of‑the‑month prices of oil and natural gas for the prior twelve month periods ended December 31, 2016, 2015, and 2014. Future cash inflows do not reflect the impact of open hedge positions. Future cash inflows were reduced by estimated future development and production costs based on year‑end costs in order to arrive at net cash flows. Use of a 10% discount rate, first‑day‑of‑the‑month prices and year‑end costs are required by ASC 932.
In general, management does not rely on the following information in making investment and operating decisions. Such decisions are based upon a wide range of factors, including estimates of probable as well as proved reserves and varying price and cost assumptions considered more representative of a range of possible outcomes.
F-45
The standardized measure of discounted future net cash flows from the Company’s estimated proved oil and natural gas reserves follows:
|
(in thousands of dollars) |
|
2016 |
|
2015 |
|
2014 |
|
|||
|
Future cash inflows |
|
$ |
2,158,067 |
|
$ |
2,373,971 |
|
$ |
5,038,212 |
|
|
Less related future: |
|
|
|
|
|
|
|
|
|
|
|
Production costs |
|
|
(798,161) |
|
|
(821,773) |
|
|
(1,216,184) |
|
|
Development costs |
|
|
(451,790) |
|
|
(483,060) |
|
|
(939,652) |
|
|
Income tax expenses |
|
|
(46,139) |
|
|
(31,537) |
|
|
(199,727) |
|
|
Future net cash flows |
|
|
861,977 |
|
|
1,037,601 |
|
|
2,682,649 |
|
|
10% annual discount for estimated timing of cash flows |
|
|
(478,498) |
|
|
(572,821) |
|
|
(1,294,553) |
|
|
Standardized measure of discounted future net cash flows |
|
$ |
383,479 |
|
$ |
464,780 |
|
$ |
1,388,096 |
|
A summary of the changes in the standardized measure of discounted future net cash flows applicable to proved natural gas and crude oil reserves follows:
|
(in thousands of dollars) |
|
2016 |
|
2015 |
|
2014 |
|
|||
|
Balance, beginning of period |
|
$ |
464,780 |
|
$ |
1,388,096 |
|
$ |
940,509 |
|
|
Net change in sales and transfer prices, net of production expenses |
|
|
(90,932) |
|
|
(1,063,248) |
|
|
98,647 |
|
|
Changes in estimated future development costs |
|
|
32,678 |
|
|
96,408 |
|
|
(96,245) |
|
|
Sales and transfers of oil and gas produced during the period |
|
|
(94,262) |
|
|
(176,301) |
|
|
(382,202) |
|
|
Net change due to extensions and discoveries |
|
|
24 |
|
|
6,236 |
|
|
442,340 |
|
|
Net change due to purchases of minerals in place |
|
|
18,473 |
|
|
— |
|
|
118,562 |
|
|
Net change due to sales of minerals in place |
|
|
(1,202) |
|
|
— |
|
|
— |
|
|
Net change due to revisions in quantity estimates |
|
|
(51,237) |
|
|
(153,689) |
|
|
43,032 |
|
|
Previously estimated development costs incurred during the period |
|
|
73,735 |
|
|
143,560 |
|
|
163,739 |
|
|
Net change in income taxes |
|
|
(12,824) |
|
|
108,409 |
|
|
(36,514) |
|
|
Accretion of discount |
|
|
37,475 |
|
|
120,047 |
|
|
94,051 |
|
|
Other |
|
|
6,771 |
|
|
(4,738) |
|
|
2,177 |
|
|
Balance, end of period |
|
$ |
383,479 |
|
$ |
464,780 |
|
$ |
1,388,096 |
|
Supplemental Quarterly Financial Information (Unaudited)
Following is a summary of the Company’s results of operations by quarter for the years ended December 31, 2016, 2015, and 2014.
|
|
|
2016 |
|
|||||||||||||
|
|
|
First |
|
Second |
|
Third |
|
Fourth |
|
Full |
|
|||||
|
(in thousands except per share data) |
|
Quarter |
|
Quarter |
|
Quarter |
|
Quarter |
|
Year |
|
|||||
|
Revenues |
|
$ |
25,858 |
|
$ |
29,144 |
|
$ |
33,353 |
|
$ |
39,492 |
|
$ |
127,847 |
|
|
Operating income (loss) |
|
|
(34,081) |
|
|
(26,765) |
|
|
(20,564) |
|
|
(22,856) |
|
|
(104,266) |
|
|
Net income (loss) |
|
|
48,514 |
|
|
(58,646) |
|
|
(22,429) |
|
|
(52,244) |
|
|
(84,805) |
|
|
Net income (loss) attributable to non-controlling interests |
|
|
29,603 |
|
|
(35,401) |
|
|
(12,576) |
|
|
(23,879) |
|
|
(42,253) |
|
|
Net income (loss) attributable to controlling interests |
|
|
18,911 |
|
|
(23,245) |
|
|
(9,853) |
|
|
(28,365) |
|
|
(42,552) |
|
|
Basic earnings per share |
|
$ |
0.62 |
|
$ |
(0.75) |
|
$ |
(0.26) |
|
$ |
(0.53) |
|
$ |
(1.13) |
|
|
Diluted earnings per share |
|
$ |
0.62 |
|
$ |
(0.75) |
|
$ |
(0.26) |
|
$ |
(0.53) |
|
$ |
(1.13) |
|
F-46
|
|
|
2015 |
|
|||||||||||||
|
|
|
First |
|
Second |
|
Third |
|
Fourth |
|
Full |
|
|||||
|
(in thousands except per share data) |
|
Quarter |
|
Quarter |
|
Quarter |
|
Quarter |
|
Year |
|
|||||
|
Revenues |
|
$ |
58,096 |
|
$ |
53,917 |
|
$ |
47,152 |
|
$ |
38,234 |
|
$ |
197,399 |
|
|
Operating income |
|
|
(21,838) |
|
|
(23,531) |
|
|
(32,393) |
|
|
(28,708) |
|
|
(106,470) |
|
|
Net income (loss) |
|
|
5,696 |
|
|
(51,180) |
|
|
34,842 |
|
|
1,565 |
|
|
(9,077) |
|
|
Net income (loss) attributable to non-controlling interests |
|
|
3,508 |
|
|
(32,737) |
|
|
21,604 |
|
|
929 |
|
|
(6,696) |
|
|
Net income (loss) attributable to controlling interests |
|
|
2,188 |
|
|
(18,443) |
|
|
13,238 |
|
|
636 |
|
|
(2,381) |
|
|
Basic earnings per share |
|
$ |
0.12 |
|
$ |
(0.66) |
|
$ |
0.44 |
|
$ |
0.02 |
|
$ |
(0.09) |
|
|
Diluted earnings per share |
|
$ |
0.12 |
|
$ |
(0.66) |
|
$ |
0.44 |
|
$ |
0.02 |
|
$ |
(0.09) |
|
|
|
|
2014 |
|
|||||||||||||
|
|
|
First |
|
Second |
|
Third |
|
Fourth |
|
Full |
|
|||||
|
(in thousands except per share data) |
|
Quarter |
|
Quarter |
|
Quarter |
|
Quarter |
|
Year |
|
|||||
|
Revenues |
|
$ |
98,244 |
|
$ |
106,390 |
|
$ |
100,346 |
|
$ |
75,617 |
|
$ |
380,597 |
|
|
Operating income |
|
|
34,017 |
|
|
36,114 |
|
|
26,231 |
|
|
12,264 |
|
|
108,626 |
|
|
Net income (loss) |
|
|
7,708 |
|
|
(11,454) |
|
|
50,025 |
|
|
179,341 |
|
|
225,620 |
|
|
Net income (loss) attributable to non-controlling interests |
|
|
6,339 |
|
|
(9,397) |
|
|
40,893 |
|
|
146,649 |
|
|
184,484 |
|
|
Net loss attributable to controlling interests |
|
|
1,369 |
|
|
(2,057) |
|
|
9,132 |
|
|
32,692 |
|
|
41,136 |
|
|
Basic earnings (loss) per share |
|
|
0.11 |
|
$ |
(0.16) |
|
$ |
0.73 |
|
$ |
2.60 |
|
$ |
3.28 |
|
|
Diluted earnings (loss) per share |
|
|
0.11 |
|
$ |
(0.16) |
|
$ |
0.73 |
|
$ |
2.60 |
|
$ |
3.28 |
|
F-47