Attached files
| file | filename |
|---|---|
| EX-31.2 - EXHIBIT 31.2 - Exterran Corp | extn-2016123110xkxex312.htm |
| EX-21.1 - EXHIBIT 21.1 - Exterran Corp | extn-2016123110xkxex211.htm |
| EX-23.1 - EXHIBIT 23.1 - Exterran Corp | extn-2016123110xkxex231.htm |
| EX-32.1 - EXHIBIT 32.1 - Exterran Corp | extn-2016123110xkxex321.htm |
| EX-32.2 - EXHIBIT 32.2 - Exterran Corp | extn-2016123110xkxex322.htm |
| EX-31.1 - EXHIBIT 31.1 - Exterran Corp | extn-2016123110kxex311.htm |
| EX-10.33 - EXHIBIT 10.33 - Exterran Corp | exhibit1033-2017commonstoc.htm |
| EX-10.32 - EXHIBIT 10.32 - Exterran Corp | exhibit1032-2017timexveste.htm |
| EX-10.31 - EXHIBIT 10.31 - Exterran Corp | exhibit1031-2017timexveste.htm |
| EX-10.30 - EXHIBIT 10.30 - Exterran Corp | exhibit1030-2017timexveste.htm |
| EX-10.29 - EXHIBIT 10.29 - Exterran Corp | exhibit1029-performanceawa.htm |
UNITED STATES
SECURITIES AND EXCHANGE COMMISSION
Washington, D.C. 20549
Form 10-K
(Mark One)
x ANNUAL REPORT PURSUANT TO SECTION 13 OR 15(d) OF THE SECURITIES EXCHANGE ACT OF 1934
For the fiscal year ended December 31, 2016
or
¨ TRANSITION REPORT PURSUANT TO SECTION 13 OR 15(d) OF THE SECURITIES EXCHANGE ACT OF 1934
For the transition period from to
Commission file no. 001-36875
Exterran Corporation
(Exact name of registrant as specified in its charter)
Delaware | 47-3282259 |
(State or other jurisdiction of incorporation or organization) | (I.R.S. Employer Identification No.) |
4444 Brittmoore Road, Houston, Texas 77041
(Address of principal executive offices, zip code)
(281) 836-7000
(Registrant’s telephone number, including area code)
Securities registered pursuant to Section 12(b) of the Act:
Title of Each Class | Name of Each Exchange on Which Registered | |
Common Stock, $0.01 par value | New York Stock Exchange | |
Securities registered pursuant to 12(g) of the Act: None
Indicate by check mark if the registrant is a well-known seasoned issuer, as defined in Rule 405 of the Securities Act. Yes ¨ No x
Indicate by check mark if the registrant is not required to file reports pursuant to Section 13 or Section 15(d) of the Act. Yes ¨ No x
Indicate by check mark whether the registrant (1) has filed all reports required to be filed by Section 13 or 15(d) of the Securities Exchange Act of 1934 during the preceding 12 months (or for such shorter period that the registrant was required to file such reports), and (2) has been subject to such filing requirements for the past 90 days. Yes x No ¨
Indicate by check mark whether the registrant has submitted electronically and posted on its corporate Web site, if any, every Interactive Data File required to be submitted and posted pursuant to Rule 405 of Regulation S-T (§ 232.405 of this chapter) during the preceding 12 months (or for such shorter period that the registrant was required to submit and post such files). Yes x No ¨
Indicate by check mark if disclosure of delinquent filers pursuant to Item 405 of Regulation S-K (§ 229.405 of this chapter) is not contained herein, and will not be contained, to the best of registrant’s knowledge, in definitive proxy or information statements incorporated by reference in Part III of this Form 10-K or any amendment to this Form 10-K. x
Indicate by check mark whether the registrant is a large accelerated filer, an accelerated filer, a non-accelerated filer, or a smaller reporting company. See the definitions of “large accelerated filer,” “accelerated filer” and “smaller reporting company” in Rule 12b-2 of the Exchange Act.
Large accelerated filer o | Accelerated filer x |
Non-accelerated filer o | Smaller reporting company o |
(Do not check if a smaller reporting company) | m |
Indicate by check mark whether the registrant is a shell company (as defined in Rule 12b-2 of the Exchange Act). Yes o No x
The aggregate market value of the common stock of the registrant held by non-affiliates as of June 30, 2016 was $266,744,579. For purposes of this disclosure, common stock held by persons who hold more than 5% of the outstanding voting shares and common stock held by executive officers and directors of the registrant have been excluded in that such persons may be deemed to be “affiliates” as that term is defined under the rules and regulations promulgated under the Securities Act of 1933, as amended. This determination of affiliate status is not necessarily a conclusive determination for other purposes.
Number of shares of the common stock of the registrant outstanding as of March 2, 2017: 35,582,110 shares.
DOCUMENTS INCORPORATED BY REFERENCE
Portions of the registrant’s definitive proxy statement for the 2017 Meeting of Stockholders, which is expected to be filed with the Securities and Exchange Commission within 120 days after December 31, 2016, are incorporated by reference into Part III of this Form 10-K.
TABLE OF CONTENTS
Page | ||
PART I
DISCLOSURE REGARDING FORWARD-LOOKING STATEMENTS
This report contains “forward-looking statements” intended to qualify for the safe harbors from liability established by the Private Securities Litigation Reform Act of 1995. All statements other than statements of historical fact contained in this report are forward-looking statements within the meaning of Section 21E of the Securities Exchange Act of 1934, as amended (the “Exchange Act”), including, without limitation, statements regarding our business growth strategy and projected costs; future financial position; the sufficiency of available cash flows to fund continuing operations; the expected amount of our capital expenditures; expenditures related to the restatement of our financial statements and current governmental investigation; anticipated cost savings, future revenue, gross margin and other financial or operational measures related to our business and our primary business segments; the future value of our equipment and non-consolidated affiliates; and plans and objectives of our management for our future operations. You can identify many of these statements by looking for words such as “believe,” “expect,” “intend,” “project,” “anticipate,” “estimate,” “will continue” or similar words or the negative thereof.
Such forward-looking statements are subject to various risks and uncertainties that could cause actual results to differ materially from those anticipated as of the date of this report. Although we believe that the expectations reflected in these forward-looking statements are based on reasonable assumptions, no assurance can be given that these expectations will prove to be correct. Known material factors that could cause our actual results to differ from those in these forward-looking statements include those described below, in Part I, Item 1A (“Risk Factors”) and Part II, Item 7 (“Management’s Discussion and Analysis of Financial Condition and Results of Operations”) of this report. Important factors that could cause our actual results to differ materially from the expectations reflected in these forward-looking statements include, among other things:
• | conditions in the oil and natural gas industry, including a sustained imbalance in the level of supply or demand for oil or natural gas or a sustained low price of oil or natural gas, which could depress or reduce the demand or pricing for our natural gas compression and oil and natural gas production and processing equipment and services; |
• | reduced profit margins or the loss of market share resulting from competition or the introduction of competing technologies by other companies; |
• | our reliance on Archrock, Inc. (named Exterran Holdings, Inc. prior to November 3, 2015) (“Archrock”) and its affiliates for recurring oil and gas product sales revenues and our ability to secure new oil and gas product sales customers; |
• | economic or political conditions in the countries in which we do business, including civil developments such as uprisings, riots, terrorism, kidnappings, violence associated with drug cartels, legislative changes and the expropriation, confiscation or nationalization of property without fair compensation; |
• | changes in currency exchange rates, including the risk of currency devaluations by foreign governments, and restrictions on currency repatriation; |
• | risks associated with our operations, such as equipment defects, malfunctions and natural disasters; |
• | the risk that counterparties will not perform their obligations under our financial instruments; |
• | the financial condition of our customers; |
• | the impact of exiting our Belleli EPC product sales business; |
• | our ability to timely and cost-effectively obtain components necessary to conduct our business; |
• | employment and workforce factors, including our ability to hire, train and retain key employees; |
• | our ability to implement our business and financial objectives, including: |
• | winning profitable new business; |
• | timely and cost-effective execution of projects; |
• | enhancing our asset utilization, particularly with respect to our fleet of compressors; |
• | integrating acquired businesses; |
• | generating sufficient cash; and |
• | accessing the financial markets at an acceptable cost; |
• | liability related to the use of our products and services; |
• | changes in governmental safety, health, environmental or other regulations, which could require us to make significant expenditures; |
• | our ability to successfully remediate each of the material weaknesses in our internal control environment as disclosed in this report within the time periods and in the manner currently anticipated; |
1
• | the effectiveness of our internal control environment, including the identification of additional control deficiencies; |
• | the results of governmental actions relating to current investigations; |
• | the results of shareholder actions, if any, relating to the restatement of our financial statements; |
• | the agreements related to the Spin-off (see “Spin-off” below under Part I, Item 1 “Business”) and the anticipated effects of restructuring our business; and |
• | our level of indebtedness and ability to fund our business. |
All forward-looking statements included in this report are based on information available to us on the date of this report. Except as required by law, we undertake no obligation to publicly update or revise any forward-looking statement, whether as a result of new information, future events or otherwise. All subsequent written and oral forward-looking statements attributable to us or persons acting on our behalf are expressly qualified in their entirety by the cautionary statements contained throughout this report.
Item 1. Business
Exterran Corporation (together with its subsidiaries, “Exterran Corporation,” “our,” “we” or “us”), a Delaware corporation formed in March 2015, is a market leader in the provision of compression, production and processing products and services that support the production and transportation of oil and natural gas throughout the world.
Spin-off
On November 3, 2015, Archrock, Inc. (named Exterran Holdings, Inc. prior to November 3, 2015) completed the spin-off (the “Spin-off”) of its international contract operations, international aftermarket services (the international contract operations and international aftermarket services businesses combined are referred to as the “international services businesses” and include such activities conducted outside of the United States of America (“U.S.”)) and global fabrication businesses into an independent, publicly traded company named Exterran Corporation. We refer to the global fabrication business previously operated by Archrock as our product sales businesses (including our oil and gas product sales and Belleli EPC product sales segments). To effect the Spin-off, on November 3, 2015, Archrock distributed, on a pro rata basis, all of our shares of common stock to its stockholders of record as of October 27, 2015 (the “Record Date”). Archrock shareholders received one share of Exterran Corporation common stock for every two shares of Archrock common stock held at the close of business on the Record Date. Pursuant to the separation and distribution agreement with Archrock and certain of our and Archrock’s respective affiliates, on November 3, 2015, we transferred cash of $532.6 million to Archrock. Our Registration Statement on Form 10, as amended, was declared effective on October 21, 2015. On November 4, 2015, Exterran Corporation common stock began “regular-way” trading on the New York Stock Exchange under the stock symbol “EXTN.” Following the completion of the Spin-off, we and Archrock became and continue to be independent, publicly traded companies with separate boards of directors and management.
General
We provide our products and services to a global customer base consisting of companies engaged in all aspects of the oil and natural gas industry, including large integrated oil and natural gas companies, national oil and natural gas companies, independent oil and natural gas producers and oil and natural gas processors, gatherers and pipeline operators. We operate in four primary business lines: contract operations, aftermarket services, oil and gas product sales and Belleli EPC product sales.
In our contract operations business, which accounted for approximately 38% of our revenue and 81% of our gross margin in 2016, we own and operate natural gas compression equipment and crude oil and natural gas production and processing equipment on behalf of our customers outside of the U.S. Our services can include engineering, design, procurement, on-site construction and operation of natural gas compression and crude oil or natural gas production and processing facilities for our customers. Our contract operations business is underpinned by long-term commercial contracts with large customers, including several national oil and natural gas companies, which we believe provide us with relatively stable cash flows due to our limited exposure to the production phase of oil and gas development, particularly when compared to drilling and completion related energy services and product providers. We believe our contract operations services generally allow our customers to achieve higher production rates than they would achieve with their own operations, resulting in increased revenue for our customers. In addition, outsourcing allows our customers flexibility for their compression and production and processing needs while limiting their capital requirements. These contracts generally involve initial terms ranging from three to five years, and in some cases, in excess of 10 years. In many instances, we are able to renew those contracts prior to the expiration of the initial term; in some cases, we may sell the underlying assets to our customers pursuant to purchase options or otherwise.
2
In our aftermarket services business, which accounted for approximately 12% of our revenue and 11% of our gross margin in 2016, we provide operations, maintenance, overhaul and reconfiguration services outside of the U.S. to support our customers who own their own compression, production, processing, treating and related equipment. Our services range from routine maintenance services and parts sales to the full operation and maintenance of customer-owned assets. We seek to couple our aftermarket services with our oil and gas product sales business to provide ongoing services to customers who buy equipment from us and to sell those services to customers who have bought equipment from other companies.
In our oil and gas product sales business, which accounted for approximately 38% of our revenue and 9% of our gross margin in 2016, we design, engineer, manufacture, install and sell natural gas compression packages as well as equipment used in the production, treating and processing of crude oil and natural gas to customers both in the U.S. and internationally. Furthermore, we combine our products into an integrated solution that we design, engineer, procure and, in certain cases, construct on-site for sale to our customers. We believe the broad range of products we sell through our global platform enables us to take advantage of the ongoing, worldwide energy infrastructure build-out.
In our Belleli EPC product sales business, which accounted for approximately 12% of our revenue in 2016, we have historically provided engineering, procurement and construction for the manufacture of tanks for tank farms and the manufacture of evaporators and brine heaters for desalination plants in the Middle East (referred to as “Belleli EPC” or the “Belleli EPC business” herein). As part of our commitment to focus on our oil and gas businesses and optimize our portfolio, in the first quarter of 2016, we began executing a plan to exit our Belleli EPC business. As of December 31, 2016, we had five significant contracts in this business remaining and currently expect to have substantially exited this business by the first half of 2018.
Competitive Strengths
We believe we have the following key competitive strengths:
• | Global platform and expansive service and product offerings poised to capitalize on the global energy infrastructure build-out. Despite the decline in oil and natural gas prices in recent years and its impact on demand for our products and services, we expect that global oil and natural gas infrastructure will continue to be built out and provide us with opportunities for growth, as we believe our global customer base will continue to invest in infrastructure projects based on longer-term fundamentals that are less tied to near-term commodity prices. We believe our size, geographic scope and broad customer base provide us with a unique advantage in meeting our customers’ needs, particularly with regard to large-scale project construction and development, and will allow us to capture future opportunities. We provide our customers with a broad variety of products and services in approximately 30 countries worldwide, including outsourced compression, production and processing services, as well as natural gas compression and oil and natural gas production and processing equipment and installation services. By offering a broad range of products and services that leverage our core strengths, we believe we provide unique integrated solutions that meet our customers’ needs. We believe the breadth and quality of our products and services, the depth of our customer relationships and our presence in many major oil and natural gas-producing regions place us in a position to capture additional business on a global basis. |
• | High-quality products and services. We have built a network of high-quality energy infrastructure assets that are strategically deployed across our global platform. Through our history of operating a wide variety of products in many energy-producing markets around the world, we have developed the technical expertise and experience that we believe is required to understand the needs of our customers and to meet those needs through a range of products and services. These products and services include highly customized compression, production and processing solutions as well as standard products based on our expertise, in support of a range of projects, from those requiring quick completion to those that may take several years to fully develop. Additionally, our experience has enabled us to develop efficient systems and processes and a skilled workforce that allow us to provide high-quality services throughout international markets. We seek to continually improve our products and services to enable us to provide our customers with high-quality, comprehensive oil and natural gas infrastructure support worldwide. |
3
• | Complementary businesses enable us to offer customers integrated infrastructure solutions. We aim to provide our customers with a single source to meet their energy infrastructure needs, and we believe we have the ability to serve our customers’ changing needs in a variety of ways. For customers that seek to limit capital spending on energy infrastructure projects, we offer our full operations services through our contract operations business. For customers that prefer to develop and acquire their own infrastructure assets, we are able to sell equipment and facilities for their operations and, following the sale of our equipment to them, we can also provide through our aftermarket services business operations, maintenance, overhaul and reconfiguration services. Furthermore, we combine our products into an integrated solution that we design, engineer, procure and, in some cases, construct on-site for sale to our customers. Because of the breadth of our products and our ability to deliver those products through our different delivery models, we believe we are able to provide the solution that is most suitable to our customers in the markets in which they operate. We believe this ability to provide our customers with a variety of products and services provides us with more business opportunities, as we are able to adjust the products and services we provide to reflect our customers’ changing needs. |
• | Cash flows from contract operations business supported by long-term contracts with diverse customer base. We provide contract operations services to customers located in approximately 15 countries. Within our contract operations business, we seek to enter into long-term contracts with a diverse collection of customers, including large integrated oil and natural gas companies and national energy companies. These contracts generally involve initial terms ranging from three to five years, and in some cases, in excess of 10 years, and typically require our customers to pay our monthly service fee even during periods of limited or disrupted oil or natural gas flows. In addition, our large, international customer base provides a diversified revenue stream, which we believe reduces customer and geographic concentration risk. Furthermore, our customer base includes several companies that are among the largest and most well-known companies within their respective regions throughout our global platform. |
• | Experienced management team. We have an experienced and skilled management team with a long track record of driving growth through organic expansion and selective acquisitions. The members of our management team have strong relationships in the oil and gas industry and have operated through numerous commodity price cycles throughout our areas of operations. Members of our management team have spent a significant portion of their respective careers at highly regarded energy and manufacturing companies. |
• | Well-balanced capital structure with sufficient liquidity. We intend to maintain a capital structure with an appropriate amount of leverage and the financial flexibility to invest in our operations and pursue attractive growth opportunities that we believe will increase the overall earnings and cash flow generated by our business. At December 31, 2016, taking into account guarantees through letters of credit, we had undrawn capacity of $504.9 million under our revolving credit facility, of which $226.9 million was available for additional borrowings as a result of the covenant restriction on our Total Debt (as defined in the credit agreement) to EBITDA (as defined in the credit agreement) ratio. In addition, as of December 31, 2016, we had $35.7 million of cash and cash equivalents on hand. |
Business Strategies
We intend to continue to capitalize on our competitive strengths to meet our customers’ needs through the following key strategies:
• | Strategically grow our business. Our primary strategic focus involves the growth of our business through expanding our product and services offerings, growing our customer base and expanding relationships with existing customers by leveraging our portfolio of products and services. Additionally, our strategic focus includes targeting redevelopment opportunities in the U.S. energy market and expansions into new international markets benefiting from the global energy infrastructure build-out. We believe our diverse product and service portfolio allows us to readily respond to changes in industry and economic conditions. We believe our global footprint allows us to provide the prompt product availability our customers require, and we can construct projects in new locations as needed to meet customer demand. We have the ability to readily deploy our capital to construct new or supplemental projects that we build, own and operate on behalf of our customers through our contract operations business. In addition, we seek to provide our customers with integrated infrastructure solutions by combining product and service offerings across our businesses. We plan to supplement our organic growth with select acquisitions, partnerships and other commercial arrangements in key markets to further enhance our geographic reach, product offerings and other capabilities. We believe these arrangements will allow us to generate incremental revenues from existing and new customers and obtain greater market share. |
4
• | Expand customer base and deepen relationships with existing customers. We believe the uniquely broad range of services we offer, the quality of our products and services and our diverse geographic footprint position us to attract new customers and cross-sell our products and services to existing customers. In addition, we have a long history and significant experience providing our products and services to our customers which, coupled with the technical expertise of our experienced engineering personnel, enables us to understand and meet our customers’ needs, particularly as those needs develop and change over time. We intend to continue to devote significant business development resources to market our products and services, leverage existing relationships and expedite our growth potential. We also seek to provide supplemental projects and services to our customers as their needs evolve over time. |
• | Enhance our safety performance. We believe our safety performance and reputation help us to attract and retain customers and employees. We have adopted rigorous processes and procedures to facilitate our compliance with safety regulations and policies. We work diligently to meet or exceed applicable safety regulations, and intend to continue to focus on our safety monitoring function as our business grows and operating conditions change. |
• | Continue to optimize our global platform, products and services and enhance our profitability. We regularly review and evaluate the quality of our operations, products and services. This process includes customer review programs to assess the quality of our performance. In addition, we intend to use our global platform to reach a wide variety of customers, which we believe can enable us to achieve cost savings in our operations. We believe our ongoing focus on improving the quality of our operations, products and services results in greater satisfaction among our customers, which we believe results in greater profitability and value for our shareholders. |
Our Businesses
We conduct our operations through four businesses: contract operations, aftermarket services, oil and gas product sales and Belleli EPC product sales. For financial data relating to our business segments or geographic regions that accounted for 10% or more of our revenue in any of the last three fiscal years or 10% or more of our property, plant and equipment, net, as of December 31, 2016 or December 31, 2015, see Part II, Item 7 (“Management’s Discussion and Analysis of Financial Condition and Results of Operations”) and Note 22 to our Consolidated and Combined Financial Statements included in Part IV, Item 15 (collectively referred to as “Financial Statements,” and individually referred to as “balance sheets,” “statements of operations,” “statements of comprehensive income,” “statements of stockholders’ equity” and “statements of cash flows” herein).
Contract Operations
We provide comprehensive contract operations services to customers outside of the U.S. based on each customer’s needs and operating specifications. These services include the provision of personnel, equipment, tools, materials and supplies to meet our customers’ natural gas compression or oil or natural gas production or processing service needs, as well as designing, sourcing, owning, installing, operating, servicing, repairing and maintaining equipment owned by us necessary to provide these services.
We generally enter into contracts with our contract operations customers with initial terms between three to five years, and in some cases, in excess of 10 years. These contracts may require us to provide complete engineering, design and installation services and to make a significant investment in equipment, facilities and related installation costs. These projects may include several compressor units on one site or entire facilities designed to process and treat oil or natural gas to make it suitable for end use. Our customers generally are required to pay a monthly service fee even during periods of limited or disrupted oil or natural gas flows, which enhances the stability and predictability of our cash flows. Additionally, because we typically do not take title to the oil or natural gas we compress, process or treat and because the natural gas we use as fuel for our equipment is supplied by our customers, we have limited direct exposure to commodity price fluctuations.
Our equipment is maintained in accordance with established maintenance schedules. These maintenance procedures are updated as technology changes and as our operations team develops new techniques and procedures. In addition, because our field technicians provide maintenance on our contract operations equipment, they are familiar with the condition of our equipment and can readily identify potential problems. In our experience, these maintenance procedures maximize equipment life and unit availability, minimize avoidable downtime and lower the overall maintenance expenditures over the equipment life.
During the year ended December 31, 2016, approximately 38% of our revenue and 81% of our gross margin was generated from contract operations. As of December 31, 2016, our contract operations business provided contract operations services using a fleet of 853 natural gas compression units with an aggregate capacity of approximately 1,138,000 horsepower and a fleet of production and processing equipment.
5
We believe that our aftermarket services and oil and gas product sales businesses, described below, provide opportunities to cross-sell our contract operations services.
Aftermarket Services
Our aftermarket services business sells parts and components and provides operation, maintenance, overhaul and reconfiguration services to customers outside of the U.S. who own compression, production, processing and treating equipment. We believe that we are particularly well qualified to provide these services because of our highly experienced operating personnel and technical and engineering expertise. In addition, our aftermarket services business is a component of our ability to provide integrated infrastructure solutions to our customers because it enables us to continue to serve our customers after the sale of any assets or facilities manufactured through our oil and gas product sales business. As a result, we seek to couple aftermarket services with our other businesses to maintain and develop our relationships with our customers.
During the year ended December 31, 2016, approximately 12% of our revenue and 11% of our gross margin was generated from aftermarket services.
Oil and Gas Product Sales
We design, engineer, manufacture, sell and, in certain cases, install a broad range of oil and natural gas production and processing equipment designed to heat, separate, dehydrate and condition crude oil and natural gas to make them suitable for end use. Our products include line heaters, oil and natural gas separators, glycol dehydration units, condensate stabilizers, dew point control plants, water treatment, mechanical refrigeration and cryogenic plants and skid-mounted production packages designed for both onshore and offshore production facilities. We sell standard production and processing equipment, which is used for processing wellhead production from onshore or shallow-water offshore platform production. In addition, we sell custom-engineered, built-to-specification production and processing equipment, including designing facilities comprised of a combination of our products integrated into a solution that meets our customers’ needs. Some of these projects are in remote areas and in developing countries with limited oil and natural gas industry infrastructure. To meet most customers’ rapid response requirements and minimize customer downtime, we maintain an inventory of standard products and long delivery components used to manufacture our products to our customers’ specifications. Typically, we expect our oil and gas production and processing equipment backlog to be produced within a three to 24 month period.
We also design, engineer, manufacture, sell and, in certain cases, install, skid-mounted natural gas compression equipment to meet standard or unique customer specifications. Generally, we assemble compressors sold to third parties according to each customer’s specifications. We purchase components for these compressors from third party suppliers including several major engine and compressor manufacturers in the industry. We also sell pre-packaged compressor units designed to our standard specifications. Typically, we expect our compressor equipment backlog to be produced within a three to 12 month period.
We sell our compression and production and processing equipment primarily to major and independent oil and natural gas producers as well as national oil and natural gas companies in the countries where we operate, both within the U.S. and internationally.
During the year ended December 31, 2016, approximately 38% of our revenue and 9% of our gross margin was generated from oil and gas product sales. As of December 31, 2016, our backlog in oil and gas product sales was $306.2 million, of which approximately $14.0 million of future revenue is expected to be recognized after December 31, 2017. Our product sales backlog consists of unfilled orders based on signed contracts and does not include potential product sales pursuant to letters of intent received from customers.
Belleli EPC Product Sales
As part of our commitment to focus on our oil and gas businesses and optimize our portfolio, in the first quarter of 2016, we began executing a plan to exit our Belleli EPC business that has historically been comprised of engineering, procurement and construction for the manufacture of tanks for tank farms and the manufacture of evaporators and brine heaters for desalination plants in the Middle East. We ceased the booking of new orders for our Belleli EPC business during the first quarter of 2016.
During the year ended December 31, 2016, approximately 12% of our revenue was generated from Belleli EPC product sales. As of December 31, 2016, our backlog in Belleli EPC product sales was $63.6 million, of which approximately $4.3 million of future revenue is expected to be recognized after December 31, 2017. We currently expect to have substantially exited this business by the first half of 2018.
6
Industry Overview
Natural Gas Compression
The international compression business is comprised primarily of large horsepower compressors that are typically deployed in facilities comprised of several compressors on one site. A significant portion of this business involves comprehensive projects that require the design, engineering, manufacture, delivery and installation of several compressors on one site along with related natural gas treating and processing equipment. We are able to serve our customers’ needs for such projects through our oil and gas product sales business and after that through our aftermarket services business, or through the provision of our contract operations services.
Natural gas compression is a mechanical process whereby the pressure of a given volume of natural gas is increased to a desired higher pressure for transportation from one point to another and is essential to the production and transportation of natural gas. Compression is typically required several times during the natural gas production and transportation cycle, including (i) at the wellhead, (ii) throughout gathering and distribution systems, (iii) into and out of processing and storage facilities and (iv) along pipelines.
Production and Processing
Crude oil and natural gas are generally not marketable as produced at the wellhead and must be processed or treated before they can be transported to market. Production and processing equipment is used to separate and treat oil and natural gas as they are produced to achieve a marketable quality of product. Production processing typically involves the separation of oil and natural gas and the removal of contaminants. The end result is “pipeline” or “sales” quality oil and natural gas. Further processing or refining is almost always required before oil or natural gas is suitable for use as fuel or feedstock for petrochemical production. Production processing normally takes place in the “upstream” and “midstream” segments, while refining and petrochemical processing is referred to as the “downstream” segment. Wellhead or upstream production and processing equipment include a wide and diverse range of products.
We manufacture and stock standard production equipment based on historical product mix and expected customer purchases following general trends of oil and natural gas production. In addition, we sell custom-engineered, built-to-specification production and processing equipment. We also provide integrated solutions comprised of a combination of our products into a single offering, which typically consists of much larger equipment packages than standard equipment and is generally used in much larger scale production operations. The custom equipment segment is primarily driven by global economic trends, and the specifications for purchased equipment can vary significantly. Technology, engineering capabilities, project management, available manufacturing space and quality control standards are the key drivers in the custom equipment segment.
Outsourcing
Natural gas producers, transporters and processors choose to outsource their operations due to the benefits and flexibility of contract operations. In particular, we believe outsourcing compression, production and processing operations to us offers customers:
• | access to our specialized personnel and technical skills, including engineers and field service and maintenance employees, which we believe generally leads to improved production rates and increased throughput and higher revenues; |
• | the ability to increase their profitability by transporting or producing a higher volume of natural gas through decreased equipment downtime and reduced operating, maintenance and equipment costs by allowing us, as the service provider, to efficiently manage their operations; and |
• | the flexibility to deploy their capital on projects more directly related to their primary business by reducing their investment in compression, production and processing equipment and related maintenance capital requirements. |
Oil and Natural Gas Industry Cyclicality and Volatility
Changes in oil and natural gas exploration and production spending normally result in changes in demand for our products and services. However, we believe our contract operations business is less impacted by commodity prices than certain other energy service products and services because compression, production and processing services are necessary for oil and natural gas to be delivered from the wellhead to end users. Furthermore, our contract operations business is tied primarily to oil and natural gas production and consumption, which are generally less cyclical in nature than exploration activities.
7
Demand for oil and natural gas is cyclical and subject to fluctuations. This is primarily because the industry is driven by commodity demand and corresponding price movements. When oil and natural gas price increases occur, producers typically increase their capital expenditures, which generally results in greater activity levels and revenues for equipment providers to the oil and gas industry. During periods of lower oil or natural gas prices, producers typically decrease their capital expenditures, which generally results in lower activity levels and revenues for equipment providers to the oil and gas industry.
Seasonal Fluctuations
Our results of operations have not historically reflected any material seasonal tendencies and we do not believe that seasonal fluctuations will have a material impact on us in the foreseeable future.
Markets, Customers and Competition
Our global customer base consists primarily of companies engaged in all aspects of the oil and natural gas industry, including large integrated oil and natural gas companies, national energy companies, independent producers and natural gas processors, gatherers and pipeline operators.
During the year ended December 31, 2016, Petroleo Brasileiro S.A. (“Petrobras”) accounted for approximately 10% of our revenues. During the years ended December 31, 2015 and 2014, Archrock and Archrock Partners, L.P. (named Exterran Partners, L.P. prior to November 3, 2015) (“Archrock Partners”) accounted for approximately 11% of our total revenues. No other customer accounted for more than 10% of our revenues in 2016, 2015 and 2014. In connection with the completion of the Spin-off, we entered into a supply agreement pursuant to which we provide Archrock and its affiliates with manufactured equipment. We expect to continue providing Archrock with certain manufactured products that will result in recurring oil and gas product sales revenue for us. The loss of our business with Petrobras or Archrock, unless offset by additional sales to other customers, or the inability or failure of Petrobras or Archrock to meet its payment obligations could have an adverse effect on our business, results of operations and financial condition. See Note 16 to the Financial Statements for further discussion on transactions with affiliates.
We currently operate in approximately 30 countries. We have product sales facilities in the U.S., Singapore and the United Arab Emirates.
The businesses in which we operate are highly competitive. Overall, we experience considerable competition from companies that may be able to more quickly adapt to changes within our industry and changes in economic conditions as a whole and to more readily take advantage of available opportunities. We believe we are competitive with respect to price, equipment availability, customer service, flexibility in meeting customer needs, technical expertise, quality and reliability of our compression, production and processing equipment and related services. We face vigorous competition throughout our businesses, with some firms competing with us in multiple businesses. In our oil and gas product sales business, we have different competitors in the standard and custom-engineered equipment segments. Competitors in the standard equipment segment include several large companies and a large number of small, regional fabricators. Our competition in the custom-engineered segment consists mainly of larger companies with the ability to provide integrated projects and product support after the sale.
We expect to face increased competition as we seek to diversify our customer base and increase utilization of our service offerings.
The separation and distribution agreement contains certain noncompetition provisions addressing restrictions for a limited period of time after the Spin-off on our ability to provide contract operations services in the U.S. and on Archrock’s ability to provide contract operations services outside of the U.S. and product sales to customers worldwide, subject to certain exceptions.
Sources and Availability of Raw Materials
We manufacture natural gas compression and oil and natural gas production and processing equipment to provide contract operations services and to sell to third parties from components which we acquire from a wide range of vendors. These components represent a significant portion of the cost of our compressor and production and processing equipment products. Increases in raw material costs cannot always be offset by increases in our products’ sales prices. While many of our materials and components are available from multiple suppliers at competitive prices, we obtain some of the components, including compressors and engines, used in our products from a limited group of suppliers. We occasionally experience long lead times for components, including compressors and engines, from our suppliers and, therefore, we may at times make purchases in anticipation of future orders.
8
Environmental and Other Regulations
Government Regulation
Our operations are subject to stringent and complex U.S. federal, state, local and international laws and regulations that could have a material impact on our operations or financial condition. Our operations are regulated under a number of laws governing, among other things, discharges of substances into the air, ground and regulated waters, the generation, transportation, treatment, storage and disposal of hazardous and non-hazardous substances, disclosure of information about hazardous materials used or produced in our operations, and occupational health and safety.
Compliance with these environmental laws and regulations may expose us to significant costs and liabilities and cause us to incur significant capital expenditures in our operations. Failure to comply with these laws and regulations may result in the assessment of administrative, civil and criminal penalties, imposition of investigatory and remedial obligations, and the issuance of injunctions delaying or prohibiting operations. In certain circumstances, laws may impose strict, joint and several liability without regard to fault or the legality of the original conduct on classes of persons who are considered to be responsible for the release of hazardous substances into the environment. In addition, it is not uncommon for third parties to file claims for personal injury, property damage and recovery of response costs allegedly caused by hazardous substances or other pollutants released into the environment. We currently own or lease, and in the past have owned or leased, a number of properties that have been used in support of our operations for a number of years. Although we have utilized operating and disposal practices that were standard in the industry at the time, hydrocarbons, hazardous substances, or other regulated wastes may have been disposed of or released on or under the properties owned or leased by us or on or under other locations where such materials have been taken for disposal by companies sub-contracted by us. In addition, many of these properties have been previously owned or operated by third parties whose treatment and disposal or release of hydrocarbons, hazardous substances or other regulated wastes was not under our control. These properties and the materials released or disposed thereon may be subject to various laws that could require us to remove or remediate historical property contamination, or to perform certain operations to prevent future contamination. We are not currently under any order requiring that we undertake or pay for any cleanup activities. However, we cannot provide any assurance that we will not receive any such order in the future.
The clear trend in environmental regulation is to place more restrictions on activities that may affect the environment, and thus, any changes in these laws and regulations that result in more stringent and costly waste handling, storage, transport, disposal, emission or remediation requirements could have a material adverse effect on our results of operations and financial position.
Employees
As of December 31, 2016, we had approximately 5,100 employees. Many of our employees outside of the U.S. are covered by collective bargaining agreements. We generally consider our relationships with our employees to be satisfactory.
Available Information
Our website address is www.exterran.com. Our annual reports on Form 10-K, quarterly reports on Form 10-Q, current reports on Form 8-K and amendments to those reports are available on our website, without charge, as soon as reasonably practicable after they are filed electronically with the Securities and Exchange Commission (“SEC”). Information on our website is not incorporated by reference in this report or any of our other securities filings. Paper copies of our filings are also available, without charge, from Exterran Corporation, 4444 Brittmoore Road, Houston, Texas 77041, Attention: Investor Relations. Alternatively, the public may read and copy any materials we file with the SEC at its Public Reference Room at 100 F Street, NE, Washington, DC 20549.
Information on the operation of the Public Reference Room may be obtained by calling the SEC at 1-800-SEC-0330. The SEC also maintains a website that contains reports, proxy and information statements and other information regarding issuers who file electronically with the SEC. The SEC’s website address is www.sec.gov.
Additionally, we make available free of charge on our website:
• | our Code of Business Conduct; |
• | our Corporate Governance Principles; and |
• | the charters of our audit, compensation and nominating and corporate governance committees. |
9
Item 1A. Risk Factors
As described in Part I (“Disclosure Regarding Forward-Looking Statements”), this report contains forward-looking statements regarding us, our business and our industry. The risk factors described below, among others, could cause our actual results to differ materially from the expectations reflected in the forward-looking statements. If any of the following risks actually occurs, our business, financial condition, results of operations and cash flows could be negatively impacted.
Low oil and natural gas prices could depress or reduce demand or pricing for our natural gas compression and oil and natural gas production and processing equipment and services and, as a result, adversely affect our business.
Our results of operations depend upon the level of activity in the global energy market, including oil and natural gas development, production, processing and transportation. Oil and natural gas exploration and development activity and the number of well completions typically decline when there is a sustained reduction in oil or natural gas prices or significant instability in energy markets. Even the perception of longer-term lower oil or natural gas prices by oil and natural gas exploration, development and production companies can result in their decision to cancel, reduce or postpone major expenditures or to reduce or shut in well production.
Oil and natural gas prices and the level of drilling and exploration activity can be volatile. For example, the Henry Hub spot price for natural gas was $2.28 per MMBtu at December 31, 2015, which was approximately 27% and 47% lower than prices at December 31, 2014 and 2013, respectively, and the U.S. natural gas liquid composite price was approximately $4.72 per MMBtu for the month of November 2015, which was approximately 16% and 56% lower than prices for the months of December 2014 and 2013, respectively. During periods of lower oil or natural gas prices, our customers typically decrease their capital expenditures, which generally results in lower activity levels. A reduction in demand for our products and services could also force us to reduce our pricing substantially, which could have a material adverse effect on our business, financial condition, results of operations and cash flows. As a result of the low oil and natural gas price environment during 2015 and the majority of 2016, our customers sought to reduce their capital and operating expenditure requirements, and as a result, the demand and pricing for the equipment we manufacture was adversely impacted. Moreover, a reduction in demand for our products and services could result in our customers seeking to preserve capital by canceling contracts, canceling or delaying scheduled maintenance of their existing natural gas compression and oil and natural gas production and processing equipment, determining not to enter into new contract operations service contracts or purchase new compression and oil and natural gas production and processing equipment, or canceling or delaying orders for our products and services, any of which could have a material adverse effect on our business, financial condition, results of operations and cash flows. In periods of volatile commodity prices, the timing of any change in activity levels by our customers is difficult to predict. As a result, our ability to project the anticipated activity level for our business, and particularly our oil and gas product sales segment, in 2017 and beyond is limited. If reduced booking levels persist for a sustained period, we could experience a material adverse effect on our business, financial condition, results of operations and cash flows.
The erosion of the financial condition of our customers could adversely affect our business.
Many of our customers finance their exploration and development activities through cash flow from operations, the incurrence of debt or the issuance of equity. During times when the oil or natural gas markets weaken, our customers are more likely to experience a downturn in their financial condition. A reduction in borrowing bases under reserve-based credit facilities, the lack of availability of debt or equity financing or other factors that negatively impact our customers’ financial condition could result in our customers seeking to preserve capital by reducing prices under or cancelling contracts with us, determining not to renew contracts with us, cancelling or delaying scheduled maintenance of their existing natural gas compression and oil and natural gas production and processing equipment, determining not to enter into contract operations agreements or not to purchase new compression and oil and natural gas production and processing equipment, or determining to cancel or delay orders for our products and services. Any such action by our customers would reduce demand for our products and services. Reduced demand for our products and services could adversely affect our business, financial condition, results of operations and cash flows. In addition, in the event of the financial failure of a customer, we could experience a loss on all or a portion of our outstanding accounts receivable associated with that customer.
Failure to timely and cost-effectively execute on larger projects could adversely affect our business.
Some of our projects have a relatively larger size and scope than the majority of our projects, which can translate into more technically challenging conditions or performance specifications for our products and services. Contracts with our customers for these projects typically specify delivery dates, performance criteria and penalties for our failure to perform. Any failure to estimate the cost of and execute such larger projects in a timely and cost effective manner could have a material adverse effect on our business, financial condition, results of operations and cash flows.
10
We have incurred and may in the future incur losses on fixed-price contracts, which constitute a significant portion of our product sales businesses.
In connection with projects and services performed under fixed-price contracts, we generally bear the risk of cost over-runs, operating cost inflation, labor availability and productivity, and supplier and subcontractor pricing and performance, unless additional costs result from customer-requested change orders. Under both our fixed-price contracts and our cost-reimbursable contracts, we may rely on third parties for many support services, and we could be subject to liability for their failures. For example, we have experienced losses on certain large manufacturing projects that have negatively impacted our product sales results. Any failure to accurately estimate our costs and the time required for a fixed-price manufacturing project at the time we enter into a contract could have a material adverse effect on our business, financial condition, results of operations and cash flows.
There are many risks associated with conducting operations in international markets.
Our contract operations, aftermarket services and Belleli EPC product sales businesses, and a portion of our oil and gas product sales business, are conducted in countries outside the U.S. We currently operate in approximately 30 countries. The countries with our largest contract operations businesses include Mexico, Brazil and Argentina. We are exposed to risks inherent in doing business in each of the countries where we operate. Our operations are subject to various risks unique to each country that could have a material adverse effect on our business, financial condition, results of operations and cash flows. For example, in 2009 Petroleos de Venezuela S.A. (“PDVSA”), the Venezuelan state-owned oil company, assumed control over substantially all of our assets and operations in Venezuela.
The countries with our largest contract operations businesses include Mexico, Brazil and Argentina. We generate a significant portion of our revenue in these countries from national oil companies, including Yacimientos Petroliferos Fiscales (“YPF”) in Argentina, Petroleos Mexicanos (“Pemex”) in Mexico and Petrobras in Brazil.
In April 2012, Argentina assumed control over its largest oil and gas producer, YPF. We are unable to predict what effect, if any, the nationalization of YPF will have on our business in Argentina going forward, or whether Argentina will nationalize additional businesses in the oil and gas industry; however, the nationalization of YPF, the nationalization of additional businesses or the taking of other actions listed below by Argentina could have a material adverse effect on our business, financial condition, results of operations and cash flows. More generally in Argentina, the ongoing social, political, economic and legal climate has given rise to significant uncertainties about the country’s economic and political future. The Argentine government may adopt additional regulations or policies in the future that may impact, among other things, (i) the timing of and our ability to repatriate cash from Argentina to the U.S. and other jurisdictions, (ii) the value of our assets and business in Argentina and (iii) our ability to import into Argentina the materials necessary for our operations. Any such changes could have a material adverse effect on our operations in Argentina and may negatively impact our business, results of operations, financial condition and cash flows.
Pemex is a decentralized public entity of the Mexican government, and, therefore, the Mexican government controls Pemex, as well as its annual budget, which is approved by the Mexican Congress. The Mexican government may cut spending in the future. These cuts could adversely affect Pemex’s annual budget and its ability to engage us in the future or compensate us for our services. In 2014, the Mexican government implemented an energy industry reform that will allow the government to grant non-Mexican companies the opportunity to enter into contracts and licenses to explore and drill for oil and natural gas in Mexico. Any impact from this reform on our business in Mexico is uncertain. Also, during the past several years, incidents of security disruptions in many regions of Mexico have increased, including drug cartel related activity. Certain incidents of violence have occurred in regions we serve and have resulted in the temporary disruption of our operations. These disruptions could continue or increase in the future. To the extent that such security disruptions continue or increase, our operations will continue to be affected, and the levels of revenue and operating cash flow from our Mexican operations could be reduced.
A significant number of senior executives at Petrobras, a government-controlled energy company, have resigned their positions in connection with a widely publicized corruption investigation. In addition, Petrobras recently announced further reductions to its long-term capital expenditures budget. We expect these developments to disrupt Petrobras’ operations in the near term, which could in turn adversely affect our business and results of operations in Brazil.
11
We also have operations in Nigeria, a business environment which has and may experience, among other things, work stoppages, negative corporate payment behavior, currency controls or restrictions, uncertainty in its institutional framework, political unrest, corruption and civil uprisings.
With respect to any particular country in which we operate, the risks inherent in our activities may include the following, the occurrence of any of which could have a material adverse effect on our business, financial condition, results of operations and cash flows:
• | difficulties in managing international operations, including our ability to timely and cost effectively execute projects; |
• | unexpected changes in regulatory requirements, laws or policies by foreign agencies or governments; |
• | work stoppages; |
• | training and retaining qualified personnel in international markets; |
• | the burden of complying with multiple and potentially conflicting laws and regulations; |
• | tariffs and other trade barriers; |
• | actions by governments or national oil companies that result in the nullification or renegotiation on less than favorable terms of existing contracts, or otherwise result in the deprivation of contractual rights, and other difficulties in enforcing contractual obligations; |
• | governmental actions that: result in restricting the movement of property or that impede our ability to import or export parts or equipment; require a certain percentage of equipment to contain local or domestic content; or require certain local or domestic ownership, control or employee ratios in order to do business in or obtain special incentives or treatment in certain jurisdictions; |
• | potentially longer receipt of payment cycles; |
• | changes in political and economic conditions in the countries in which we operate, including general political unrest, the nationalization of energy related assets, civil uprisings, riots, kidnappings, violence associated with drug cartels and terrorist acts; |
• | potentially adverse tax consequences or tax law changes; |
• | currency controls or restrictions on repatriation of earnings; |
• | expropriation, confiscation or nationalization of property without fair compensation; |
• | the risk that our international customers may have reduced access to credit because of higher interest rates, reduced bank lending or a deterioration in our customers’ or their lenders’ financial condition; |
• | complications associated with installing, operating and repairing equipment in remote locations; |
• | limitations on insurance coverage; |
• | inflation; |
• | the geographic, time zone, language and cultural differences among personnel in different areas of the world; and |
• | difficulties in establishing new international offices and the risks inherent in establishing new relationships in foreign countries. |
In addition, we may expand our business in international markets where we have not previously conducted business. The risks inherent in establishing new business ventures, especially in international markets where local customs, laws and business procedures present special challenges, may affect our ability to be successful in these ventures or avoid losses that could have a material adverse effect on our business, financial condition, results of operations and cash flows.
12
We are exposed to exchange rate fluctuations in the international markets in which we operate. A decrease in the value of any of these currencies relative to the U.S. dollar could reduce profits from international operations and the value of our international net assets.
We operate in many international countries. We anticipate that there will be instances in which costs and revenues will not be exactly matched with respect to currency denomination. We have not historically entered into significant hedges to limit our exposure to the risk of exchange rate losses. Gains and losses from the remeasurement of assets and liabilities that are receivable or payable in currency other than our subsidiaries’ functional currency are included in our statements of operations. In addition, currency fluctuations cause the U.S. dollar value of our international results of operations and net assets to vary with exchange rate fluctuations. This could have a negative impact on our business, financial condition or results of operations. Our material exchange rate exposure relates to intercompany loans to subsidiaries whose functional currency is the Brazilian Real, which loans carried balances of $41.0 million U.S. dollars as of December 31, 2016. As we expand geographically, we may experience economic loss and a negative impact on earnings or net assets solely as a result of foreign currency exchange rate fluctuations. Further, the markets in which we operate could restrict the removal or conversion of the local or foreign currency, resulting in our inability to hedge against these risks.
The restatement of our prior financial statements may lead to additional risks and uncertainties, including loss of investor and counterparty confidence.
We have restated our financial statements for the years ended December 31, 2015, 2014 and 2013 (including the unaudited quarterly periods within 2015 and 2014) to correct accounting errors primarily related to our Belleli EPC product sales segment and non-income-based tax receivables in Brazil. As a result of the circumstances giving rise to the restatement, we have become subject to a number of additional costs and risks, including unanticipated costs for accounting and legal fees in connection with or related to the restatement and the remediation of our ineffective disclosure controls and procedures and material weaknesses in internal control over financial reporting. In addition, the attention of our management team was diverted by these efforts. The SEC is conducting an investigation into the circumstances giving rise to the restatement. We could be subject to further regulatory, or stockholder or other actions in connection with the restatement in the future. The current SEC investigation and any future proceedings will, regardless of the outcome, continue to consume management’s time and attention and may result in additional legal, accounting, insurance and other costs. In addition, the restatement and related matters could impair our reputation and could cause our current and potential lenders, investors and counterparties to lose confidence in us. Each of these occurrences could have an adverse effect on our business, results of operations and financial condition.
We are involved in governmental and internal investigations, which are costly to conduct and may result in substantial financial and other penalties, as well as adverse effects on our business and financial condition.
In March 2016, the Audit Committee of the Board of Directors retained legal counsel to conduct an internal investigation related to the application of percentage-of-completion accounting principles to specific Belleli EPC product sales projects in the Middle East. On April 26, 2016, we filed a Form 8-K reporting the errors and possible irregularities at Belleli EPC. Contemporaneously with filing the Form 8-K, we self-reported these issues to the SEC. We are cooperating with the SEC in its investigation of this matter, including responding to a subpoena for documents related to the circumstances giving rise to the restatement as well as documents related to our compliance with the U.S. Foreign Corrupt Practices Act (“FCPA”), which are also being provided to the Department of Justice (“DOJ”) at its request. The FCPA related requests in the SEC subpoena pertain to our policies and procedures, information about our third-party sales agents, and documents related to historical internal investigations completed prior to November 2015. We also have made the SEC and DOJ aware of our internal investigation regarding prior year non-income-based tax receivables due to us from the Brazilian government.
The government investigations are continuing, and we are presently unable to predict the duration, scope or results of them or whether the SEC or DOJ will commence any legal actions. If we are found to have violated securities laws or other federal statutes, including the FCPA, we may be subject to criminal and civil penalties and other remedial measures, including, but not limited to injunctive relief, disgorgement, civil and criminal fines and penalties, modifications to business practices including the termination or modification of existing business relationships, modifications of compliance programs and the retention of a monitor to oversee compliance. The imposition of any of these sanctions or remedial measures could have a material adverse impact on our reputation, business, results of operations, financial condition, liquidity and stock price.
13
We have identified material weaknesses in our internal control over financial reporting that, if not remediated, could result in additional material misstatements in our financial statements.
As described in “Part II, Item 9A — Controls and Procedures,” management has identified and evaluated control deficiencies that gave rise to the accounting errors related to Belleli EPC product sales projects and non-income-based tax receivables in Brazil, and has concluded that those deficiencies represent material weaknesses in our internal control over financial reporting. A material weakness is a deficiency, or a combination of deficiencies, in internal control over financial reporting, such that there is a reasonable possibility that a material misstatement of our annual or interim financial statements will not be prevented or detected on a timely basis. As a result of these material weaknesses, management has concluded that we did not maintain effective internal control over financial reporting or effective disclosure controls and procedures as of December 31, 2016.
We are in the process of implementing a remediation plan to address these material weaknesses. If our remediation efforts are insufficient or not completed in a timely manner, or if additional material weaknesses in our internal control over financial reporting are identified or occur in the future, our financial statements may contain material misstatements and we could be required to restate our financial results, which could materially and adversely affect our business, results of operations and financial condition, restrict our ability to access the capital markets, require us to expend significant resources to correct the material weaknesses, subject us to fines, penalties or judgments, harm our reputation or otherwise cause a decline in lender, investor and counterparty confidence.
Our outstanding debt obligations could limit our ability to fund future growth and operations and increase our exposure to risk during adverse economic conditions.
At December 31, 2016, we had approximately $351.3 million in outstanding debt obligations. Many factors, including factors beyond our control, may affect our ability to make payments on our outstanding indebtedness. These factors include those discussed elsewhere in these Risk Factors and those listed in the Disclosure Regarding Forward-Looking Statements section included in Part I of this report.
Our debt and associated commitments could have important adverse consequences. For example, these commitments could:
• | make it more difficult for us to satisfy our contractual obligations; |
• | increase our vulnerability to general adverse economic and industry conditions; |
• | limit our ability to fund future working capital, capital expenditures, acquisitions or other corporate requirements; |
• | increase our vulnerability to interest rate fluctuations because the interest payments on our debt are based upon variable interest rates and can adjust based upon our credit statistics; |
• | limit our flexibility in planning for, or reacting to, changes in our business and our industry; |
• | place us at a disadvantage compared to our competitors that have less debt or less restrictive covenants in such debt; and |
• | limit our ability to refinance our debt in the future or borrow additional funds. |
If we are unable to refinance our term loan when due on acceptable terms, we may experience a material adverse effect on our liquidity and financial condition.
Of the $351.3 million in outstanding debt obligations that we had at December 31, 2016, $232.8 million represents the principal amount outstanding under our term loan facility that is due in November 2017. At or prior to the time the term loan matures, we will be required to refinance it and may enter into one or more new facilities, which could result in higher borrowing costs, issue equity, which would dilute our existing shareholders, repay with borrowings under our revolving credit facility, issue bonds with restrictive covenants that could impact our business flexibility or otherwise raise the funds necessary to repay the outstanding principal amount under the term loan. We have the intent and ability to refinance the principal amount due under the term loan with borrowings under our existing revolving credit facility. In connection with the Spin-off, our wholly owned subsidiary, Exterran Energy Solutions, L.P. (“EESLP”), contributed to a subsidiary of Archrock the right to receive, promptly following the occurrence of a qualified capital raise, a $25.0 million cash payment. No assurance can be given that we will be able to enter into new facilities or issue equity or bonds in the future on attractive terms or at all. If we are unable to obtain financing on acceptable terms, or at all, to refinance the remaining principal amount outstanding under our term loan, we would need to take other actions, including selling assets or seeking strategic investments from third parties, potentially on unfavorable terms, and deferring capital expenditures or other discretionary uses of cash. To the extent that we are unable to refinance our term loan or are required to take any such other action, we would experience a material adverse effect on our liquidity and financial condition.
14
Covenants in our credit agreement may impair our ability to operate our business.
Our credit agreement, consisting of a $680.0 million revolving credit facility expiring in November 2020 and a $232.8 million term loan facility expiring in November 2017, contains various covenants with which we, EESLP and our respective restricted subsidiaries must comply, including, but not limited to, limitations on the incurrence of indebtedness, investments, liens on assets, repurchasing equity, making distributions, transactions with affiliates, mergers, consolidations, dispositions of assets and other provisions customary in similar types of agreements. Additionally, we are required to maintain certain financial covenant ratios. If we fail to remain in compliance with these restrictions and financial covenants, we would be in default under our credit agreement. In addition, if we experience a material adverse effect on our assets, liabilities, financial condition, business or operations that, taken as a whole, impact our ability to perform our obligations under our credit agreement, this could lead to a default. If the repayment obligations on any of our indebtedness were to be accelerated, we may not be able to repay the debt or refinance the debt on acceptable terms, and our financial position would be materially adversely affected. As of December 31, 2016, we were in compliance with all financial covenants under our credit agreement.
Additionally, our credit agreement limits our Total Debt (as defined in the credit agreement) to EBITDA (as defined in the credit agreement) ratio on the last day of the fiscal quarter to not greater than 3.75 to 1.0 (which will increase to 4.50 to 1.0 following the completion of a qualified capital raise (as defined in the credit agreement)). As a result of this limitation, $226.9 million of the $504.9 million of undrawn capacity under our revolving credit facility was available for additional borrowings as of December 31, 2016. Because this limitation considers all of our outstanding debt obligations, the additional borrowings available to us are in excess of borrowings needed under our revolving credit facility to refinance the current principal amount due under the term loan facility.
We may be vulnerable to interest rate increases due to our floating rate debt obligations.
As of December 31, 2016, we had $350.8 million of outstanding borrowings that are subject to floating interest rates. Changes in economic conditions outside of our control could result in higher interest rates, thereby increasing our interest expense and reducing the funds available for capital investment, operations or other purposes. A 1% increase in the effective interest rate on our outstanding debt subject to floating interest rates at December 31, 2016 would result in an annual increase in our interest expense of approximately $3.5 million.
The termination of or any price reductions under certain of our contract operations services contracts could have a material impact on our business.
The termination of or a demand by our customers to reduce prices under certain of our contract operations services contracts may lead to a reduction in our revenues and net income, which could have a material adverse effect upon our business, financial condition, results of operations and cash flows. In addition, we may be unable to renew, or enter into new, contracts with customers on favorable commercial terms, if at all. To the extent we are unable to renew our existing contracts or enter into new contracts on terms that are favorable to us or to successfully manage our overall contract mix over time, our business, results of operations and cash flows may be adversely impacted.
Our product sales backlog may be subject to unexpected adjustments and cancellations.
The revenues projected in our product sales backlog may not be realized or, if realized, may not result in profits. Because of project cancellations or changes in project scope and schedule, we cannot predict with certainty when or if backlog will be performed. In addition, even where a project proceeds as scheduled, it is possible that contracted parties may default and fail to pay amounts owed to us or poor project performance could increase the cost associated with a project. Delays, suspensions, cancellations, payment defaults, scope changes and poor project execution could materially reduce the revenues and reduce or eliminate profits that we actually realize from projects in backlog. We may be at greater risk of delays, suspensions and cancellations in the current low oil price environment.
Reductions in our product sales backlog due to cancellation or modification by a customer or for other reasons may adversely affect, potentially to a material extent, the revenues and earnings we actually receive from contracts included in our backlog. Many of the contracts in our product sales backlog provide for cancellation fees in the event customers cancel projects. These cancellation fees usually provide for reimbursement of our out-of-pocket costs, revenues for work performed prior to cancellation and a varying percentage of the profits we would have realized had the contract been completed. However, we typically have no contractual right upon cancellation to the total revenues reflected in our backlog. Projects may remain in our backlog for extended periods of time. If we experience significant project terminations, suspensions or scope adjustments to contracts reflected in our backlog, our financial condition, results of operations and cash flows may be adversely impacted.
15
From time to time, we are subject to various claims, litigation and other proceedings that could ultimately be resolved against us, requiring material future cash payments or charges, which could impair our financial condition or results of operations.
The size, nature and complexity of our business make us susceptible to various claims, both in litigation and binding arbitration proceedings. We are currently, and may in the future become, subject to various claims, which, if not resolved within amounts we have accrued, could have a material adverse effect on our financial position, results of operations or cash flows. Similarly, any claims, even if fully indemnified or insured, could negatively impact our reputation among our customers and the public, and make it more difficult for us to compete effectively or obtain adequate insurance in the future.
We depend on particular suppliers and may be vulnerable to product shortages and price increases.
Some of the components used in our products are obtained from a single source or a limited group of suppliers. Our reliance on these suppliers involves several risks, including price increases, quality and a potential inability to obtain an adequate supply of required components in a timely manner. We do not have long-term contracts with some of these sources, and the partial or complete loss of certain of these sources could have a negative impact on our results of operations and could damage our customer relationships. Further, a significant increase in the price of one or more of these components could have a negative impact on our results of operations.
We face significant competitive pressures that may cause us to lose market share and harm our financial performance.
Our businesses face intense competition and have low barriers to entry. Our competitors may be able to adapt more quickly to technological changes within our industry and changes in economic and market conditions and more readily take advantage of acquisitions and other opportunities. Our ability to renew or replace existing contract operations service contracts with our customers at rates sufficient to maintain current revenue and cash flows could be adversely affected by the activities of our competitors. If our competitors substantially increase the resources they devote to the development and marketing of competitive products, equipment or services or substantially decrease the price at which they offer their products, equipment or services, we may not be able to compete effectively.
In addition, we could face significant competition from new entrants into the compression services and product sales businesses. Some of our existing competitors or new entrants may expand or develop new compression units that would create additional competition for the products, equipment or services we provide to our customers.
We also may not be able to take advantage of certain opportunities or make certain investments because of our debt levels and our other obligations. As a U.S.-domiciled company, we may also face a higher corporate tax rate than our competitors that are domiciled in other jurisdictions. Any of these competitive pressures could have a material adverse effect on our business, financial condition and results of operations.
Our ability to manage and grow our business effectively may be adversely affected if we lose management or operational personnel.
We believe that our ability to hire, train and retain qualified personnel will continue to be challenging and important. The supply of experienced operational and field personnel, in particular, decreases as other energy and manufacturing companies’ needs for the same personnel increase. Our ability to grow and to continue our current level of service to our customers will be adversely impacted if we are unable to successfully hire, train and retain these important personnel.
16
Our operations entail inherent risks that may result in substantial liability. We do not insure against all potential losses and could be seriously harmed by unexpected liabilities.
Our operations entail inherent risks, including equipment defects, malfunctions and failures and natural disasters, which could result in uncontrollable flows of natural gas or well fluids, fires and explosions. These risks may expose us, as an equipment operator and developer, to liability for personal injury, wrongful death, property damage, pollution and other environmental damage. The insurance we carry against many of these risks may not be adequate to cover our claims or losses. In addition, we are substantially self-insured for workers’ compensation, employer’s liability, property, auto liability, general liability and employee group health claims in view of the relatively high per-incident deductibles we absorb under our insurance arrangements for these risks. Further, insurance covering the risks we expect to face or in the amounts we desire may not be available in the future or, if available, the premiums may not be commercially justifiable. If we were to incur substantial liability and such damages were not covered by insurance or were in excess of policy limits, or if we were to incur liability at a time when we are not able to obtain liability insurance, our business, financial condition and results of operations could be negatively impacted.
Our exit from our Belleli EPC business involves numerous risks that may adversely affect our results of operations, financial condition or liquidity.
We are in the process of executing a plan to exit the Belleli EPC business to focus on our core oil and gas businesses. While we have ceased booking new orders for our Belleli EPC business, our ultimate exit from this business involves numerous risks and uncertainties that could adversely affect our results of operations, financial condition or liquidity. In particular, our exit from the Belleli EPC business may take longer or cost more than we currently anticipate. In addition, the reinvestment of any capital received in excess of the costs to complete our exit, and the reallocation of any resources following this process, may not ultimately yield investment returns in line with our internal or external expectations. Other parts of our ongoing business could be negatively impacted as we complete the exit of this business, including through the diversion of resources and management attention from our ongoing business and other strategic matters, or through the disruption of relationships with our employees, customers or vendors. Further, we may incur indemnity or other obligations in connection with the business that we are exiting that may cause us to recognize additional expenses in the future.
Cyber-attacks or terrorism could affect our business.
We may be adversely affected by problems such as cyber-attacks, computer viruses or terrorism that may disrupt our operations and harm our operating results. Our industry requires the continued operation of sophisticated information technology systems and network infrastructure. Despite our implementation of security measures, our technology systems are vulnerable to disability or failures due to hacking, viruses, acts of war or terrorism and other causes. If our information technology systems were to fail and we were unable to recover in a timely way, we might be unable to fulfill critical business functions, which could have a material adverse effect on our business, financial condition and results of operations.
In addition, our assets may be targets of terrorist activities that could disrupt our ability to service our customers. We may be required by our regulators or by the future terrorist threat environment to make investments in security that we cannot currently predict. The implementation of security guidelines and measures and maintenance of insurance, to the extent available, addressing such activities could increase costs. These types of events could materially adversely affect our business and results of operations. In addition, these types of events could require significant management attention and resources, and could adversely affect our reputation among customers and the public.
We could be adversely affected by violations of the FCPA, similar worldwide anti-bribery laws and trade control laws. If we are found to have violated the FCPA or other legal requirements, we may be subject to criminal and civil penalties and other remedial measures, which could materially harm our reputation, business, results of operations, financial condition and liquidity.
Our international operations require us to comply with U.S. and international laws and regulations, including those involving anti-bribery and anti-corruption. For example, the FCPA and similar laws and regulations prohibit improper payments to foreign officials for the purpose of obtaining or retaining business or gaining any business advantage.
17
We operate in many parts of the world that experience high levels of corruption, and our business brings us in frequent contact with foreign officials. Our compliance policies and programs mandate compliance with all applicable anti-corruption laws but may not be completely effective in ensuring our compliance. Our training and compliance program and our internal control policies and procedures may not always protect us from violations committed by our employees or agents. Actual or alleged violations of these laws could disrupt our business and cause us to incur significant legal expenses, and could result in a material adverse effect on our reputation, business, results of operations, financial condition and liquidity. As noted above, in connection with our self-reporting of accounting errors related to our Belleli EPC product sales business to the SEC, we are responding to a subpoena for documents related to that as well as documents related to our compliance with the FCPA, which are also being provided to the DOJ at its request. The FCPA related requests in the SEC subpoena pertain to our policies and procedures, information about our third-party sales agents and documents related to historical internal investigations completed prior to November 2015. If we are found to be liable for FCPA or other anti-bribery law violations due to our own acts or omissions or due to the acts or omissions of others (including our joint venture partners, agents or other third party representatives), we could suffer from severe civil and criminal penalties or other sanctions, which could materially harm our reputation, business, results of operations, financial condition and liquidity. Separately, we may face competitive disadvantages if our competitors are able to secure business, licenses or other advantages by making payments or using other methods that are prohibited by U.S. and international laws and regulations.
We also are subject to other laws and regulations governing our operations, including regulations administered by the U.S. Department of Treasury’s Office of Foreign Asset Control and various non-U.S. government entities, including applicable export control regulations, economic sanctions on countries and persons and customs requirements. Trade control laws are complex and constantly changing. Our compliance policies and programs increase our cost of doing business and may not work effectively to ensure our compliance with trade control laws. If we undergo an investigation of potential violations of trade control laws by U.S. or foreign authorities or if we fail to comply with these laws, we may incur significant legal expenses or be subject to criminal and civil penalties and other sanctions and remedial measures, which could have a material adverse impact on our reputation, business, results of operations, financial condition, liquidity and stock price.
Tax legislation and administrative initiatives or challenges to our tax positions could adversely affect our results of operations and financial condition.
We operate in locations throughout the U.S. and internationally and, as a result, we are subject to the tax laws and regulations of U.S. federal, state, local and foreign governments. From time to time, various legislative or administrative initiatives may be proposed that could adversely affect our tax positions. For example, there have been proposals from Congress to change U.S. tax laws that would significantly impact how U.S. multinational corporations are taxed on foreign earnings. There can be no assurance that our tax provision or tax payments will not be adversely affected by these initiatives. In addition, U.S. federal, state and local and foreign tax laws and regulations are extremely complex and subject to varying interpretations. Moreover, economic and political pressures to increase tax revenue in various jurisdictions may make resolving tax disputes favorably more difficult. There can be no assurance that our tax positions will not be challenged by relevant tax authorities or that we would be successful in any such challenge. Changes to our tax positions resulting from tax legislation and administrative initiatives or challenges from taxing authorities could adversely affect our results of operations and financial condition.
U.S. federal, state and local legislative and regulatory initiatives relating to hydraulic fracturing as well as governmental reviews of such activities could result in increased costs and additional operating restrictions or delays in the completion of oil and natural gas wells, and adversely affect demand for our products.
Hydraulic fracturing is an important and common practice that is used to stimulate production of natural gas and/or oil, from dense subsurface rock formations. Hydraulic fracturing involves the injection of water, sand or alternative proppant and chemicals under pressure into target geological formations to fracture the surrounding rock and stimulate production. Hydraulic fracturing is typically regulated by state agencies, but recently, there has been increased public concern regarding an alleged potential for hydraulic fracturing to adversely affect drinking water supplies, and proposals have been made to enact separate U.S. federal, state and local legislation that would increase the regulatory burden imposed on hydraulic fracturing.
18
For example, at the U.S. federal level, the U. S. Environmental Protection Agency (“EPA”) issued an Advance Notice of Proposed Rulemaking to collect data on chemicals used in hydraulic fracturing operations under Section 8 of the Toxic Substances Control Act, and proposed regulations under the CWA governing wastewater discharges from hydraulic fracturing and certain other natural gas operations. Also, the U.S. Department of the Interior released a final rule that updates existing regulation of hydraulic fracturing activities on U.S. federal lands, including requirements for chemical disclosure, wellbore integrity and handling of flowback water. The final rule was expected to be effective on June 24, 2015, but, on September 30, 2015, a federal district court issued a preliminary injunction preventing implementation of the rule. In addition, several governmental reviews are underway that focus on environmental aspects of hydraulic fracturing activities. In June 2015, the EPA released its draft report on the potential impacts of hydraulic fracturing on drinking water resources, which concluded that hydraulic fracturing activities have not led to widespread, systemic impacts on drinking water sources in the U.S., although there are above and below ground mechanisms by which hydraulic fracturing activities have the potential to impact drinking water sources. The draft report is expected to be finalized after a public comment period and a formal review by EPA’s Science Advisory Board. In addition, the White House Council on Environmental Quality is coordinating an administration-wide review of hydraulic fracturing practices. The results of this study or similar governmental reviews could spur initiatives to further regulate hydraulic fracturing under the Safe Drinking Water Act of 1974 or otherwise.
At the state level, several states have adopted or are considering legal requirements that could impose more stringent permitting, disclosure, and well construction requirements on hydraulic fracturing activities. For example in May 2013, the Texas Railroad Commission adopted new rules governing well casing, cementing and other standards for ensuring that hydraulic fracturing operations do not contaminate nearby water resources. Local governments may also seek to adopt ordinances within their jurisdictions regulating the time, place and manner of, or prohibiting the performance of, drilling activities in general or hydraulic fracturing activities in particular. If new or more stringent federal, state or local legal restrictions relating to the hydraulic fracturing process are adopted in areas where our natural gas exploration and production customers operate, those customers could incur potentially significant added costs to comply with such requirements, experience delays or curtailment in the pursuit of exploration, development or production activities and perhaps even be precluded from drilling wells. Any such restrictions could reduce demand for our products, and as a result could have a material adverse effect on our business, financial condition, results of operations and cash flows.
We are subject to a variety of governmental regulations; failure to comply with these regulations may result in administrative, civil and criminal enforcement measures and changes in these regulations could increase our costs or liabilities.
We are subject to a variety of U.S. federal, state, local and international laws and regulations relating to, for example, export controls, currency exchange, labor and employment and taxation. Many of these laws and regulations are complex, change frequently, are becoming increasingly stringent, and the cost of compliance with these requirements can be expected to increase over time. From time to time, as part of our operations we may be subject to compliance audits by regulatory authorities in the various countries in which we operate. Our failure to comply with these laws and regulations may result in a variety of administrative, civil and criminal enforcement measures, including assessment of monetary penalties, imposition of remedial requirements and issuance of injunctions as to future compliance, any of which may have a negative impact on our financial condition, profitability and results of operations.
We are subject to a variety of environmental, health and safety regulations. Failure to comply with these regulations may result in administrative, civil and criminal enforcement measures and changes in these regulations could increase our costs or liabilities.
We are subject to a variety of U.S. federal, state, local and international laws and regulations relating to the environment, and worker health and safety. These laws and regulations are complex, change frequently, are becoming increasingly stringent, and the cost of compliance with these requirements can be expected to increase over time. Failure to comply with these laws and regulations may result in administrative, civil and criminal enforcement measures, including assessment of monetary penalties, imposition of remedial requirements and issuance of injunctions as to future compliance. Certain of these laws also may impose joint and several and strict liability for environmental contamination, which may render us liable for remediation costs, natural resource damages and other damages as a result of our conduct that may have been lawful at the time it occurred or the conduct of, or conditions caused by, prior owners or operators or other third parties. In addition, where contamination may be present, it is not uncommon for neighboring land owners and other third parties to file claims for personal injury, property damage and recovery of response costs. Remediation costs and other damages arising as a result of environmental laws and regulations, and costs associated with new information, changes in existing environmental laws and regulations or the adoption of new environmental laws and regulations could be substantial and could negatively impact our financial condition, profitability and results of operations.
19
We may need to apply for or amend facility permits or licenses from time to time with respect to storm water or wastewater discharges, waste handling, or air emissions relating to manufacturing activities or equipment operations, which subjects us to new or revised permitting conditions. These permits and authorizations may contain numerous compliance requirements, including monitoring and reporting obligations and operational restrictions, such as emission limits, which may be onerous or costly to comply with. In addition, certain of our customer service arrangements may require us to operate, on behalf of a specific customer, petroleum storage units such as underground tanks or pipelines and other regulated units, all of which may impose additional compliance and permitting obligations. Given the large number of facilities in which we operate, and the numerous environmental permits and other authorizations that are applicable to our operations, we may occasionally identify or be notified of technical violations of certain requirements existing in various permits or other authorizations. Occasionally, we have been assessed penalties for our non-compliance, and we could be subject to such penalties in the future.
The modification or interpretation of existing environmental, health and safety laws or regulations, the more vigorous enforcement of existing laws or regulations, or the adoption of new laws or regulations may also negatively impact oil and natural gas exploration and production, gathering and pipeline companies, including our customers, which in turn could have a negative impact on us.
Climate change policies, laws and regulations focused on reduction of greenhouse gas emissions could increase operating costs or reduced the demand for our products and services.
There has been an increased focus in the last several years on climate change and the possible role that emissions of greenhouse gases such as carbon dioxide and methane play in climate change. In the U.S., the EPA has begun to regulate greenhouse gas emissions under the federal Clean Air Act and regulatory agencies and legislative bodies in other countries where we operate have adopted greenhouse gas emission reduction programs. The adoption of new or more stringent legislation or regulatory programs restricting greenhouse gas emissions could require us to incur higher operating costs or increase the cost of, and thus reduce the demand for, the hydrocarbon products of our customers. These increased costs or reduced demand could have an adverse effect on our business, profitability or results of operations. Further, some scientists have concluded that increasing greenhouse gas concentrations in the atmosphere may produce physical effects, such as increased severity and frequency of storms, droughts, floods and other climate events. Such climate events have the potential to adversely affect our operations or those of our clients, which in turn could have a negative effect on us.
We may not realize some or all of the benefits we expected to achieve from our separation from Archrock.
The expected benefits from our separation from Archrock include the following:
• | focusing on profitable growth in strategic markets and positioning us and our shareholders to benefit from the continued build-out of the global energy infrastructure and the redevelopment currently underway in North America; |
• | in our international services businesses, relatively stable cash flows due to our limited exposure to the production phase of oil and gas development, particularly when compared to drilling and completion related energy service and product providers; |
• | limited capital expenditures in our product sales business; |
• | financial flexibility to enable investment in value-creating contract operations projects; and |
• | expanding our potential product sales customer base to include companies in the U.S. contract compression business that have historically been Archrock’s competitors. |
We may not achieve the anticipated benefits from our separation for a variety of reasons. For example, we may be unsuccessful in executing our strategy of expanding our product sales customer base to include competitors of Archrock because these prospective customers may have long-standing relationships with existing providers of similar products or services. The availability of shares of our common stock for use as consideration for acquisitions also will not ensure that we will be able to successfully pursue acquisitions or that any acquisitions will be successful. We also may not fully realize the anticipated benefits from our separation if any of the matters identified as risks in this “Risk Factors” section were to occur. If we do not realize the anticipated benefits from our separation for any reason, our business may be materially adversely affected.
20
As a result of the Spin-off, we and Archrock are subject to certain noncompetition restrictions, which may limit our ability to grow our business.
In connection with the completion of the Spin-off, we entered into a separation and distribution agreement with Archrock that contains certain noncompetition provisions addressing restrictions for a limited period of time after the Spin-off on our ability to provide contract operations and aftermarket services in the U.S. and on Archrock’s ability to provide contract operations and aftermarket services outside of the U.S. and product sales to customers worldwide, subject to certain exceptions. These restrictions limit our ability to attract new contract operations and aftermarket services customers in the U.S., which will limit our ability to grow our business.
In addition, if we are unable to enforce the limitations on Archrock’s ability to provide certain contract operations, aftermarket services and product sales, we may lose prospective customers to Archrock, which could cause our results of operations and cash flows to suffer.
We provide Archrock and its affiliates with certain manufactured products that we expect will generate recurring oil and gas product sales revenues for us.
As a result of the Spin-off, Archrock and its affiliates are among our largest customers and are expected to generate recurring oil and gas product sales revenues for us. Therefore, we are indirectly subject to the operational and business risks of Archrock and its affiliates. If Archrock and its affiliates are unable to satisfy its obligations or reduces its demand under our commercial agreements for any reason, our revenues would decline and our financial condition, results of operations and cash flows could be adversely affected. Further, we have no control over Archrock and its affiliates, and Archrock and its affiliates may elect to pursue a business strategy that does not favor us or our business.
We may increase our debt or raise additional capital in the future, which could affect our financial condition, may decrease our profitability or could dilute our shareholders.
We may increase our debt or raise additional capital in the future, subject to restrictions in our credit agreement. If our cash flow from operations is less than we anticipate, or if our cash requirements are more than we expect, we may require more financing. However, debt or equity financing may not be available to us on terms acceptable to us, if at all. If we incur additional debt or raise equity through the issuance of preferred stock, the terms of the debt or preferred stock issued may give the holders rights, preferences and privileges senior to those of holders of our common stock, particularly in the event of liquidation. The terms of the debt may also impose additional and more stringent restrictions on our operations than we currently have. If we raise funds through the issuance of additional equity, our shareholders’ ownership in us would be diluted. If we are unable to raise additional capital when needed, it could affect our financial health, which could negatively affect our shareholders.
We are subject to continuing contingent tax liabilities of Archrock.
Certain tax liabilities of Archrock may become our obligations. Under the Code and the related rules and regulations, each corporation that was a member of the Archrock consolidated U.S. federal income tax reporting group during any taxable period or portion of any taxable period ending on or before the effective time of the Spin-off is jointly and severally liable for the U.S. federal income tax liability of the entire Archrock consolidated tax reporting group for that taxable period. In connection with the Spin-off, we entered into a tax matters agreement with Archrock that allocates the responsibility for prior period taxes of the Archrock consolidated tax reporting group between us and Archrock. If Archrock is unable to pay any prior period taxes for which it is responsible, we could be required to pay the entire amount of such taxes.
The tax treatment of the Spin-off is subject to uncertainty. If the Spin-off does not qualify as a transaction that is tax-free for U.S. federal income tax purposes, we, Archrock and our shareholders could be subject to significant tax liability and, in certain circumstances, we could be required to indemnify Archrock for material taxes pursuant to indemnification obligations under the tax matters agreement.
If the Spin-off is determined to be taxable for U.S. federal income tax purposes, then we, Archrock and/or our shareholders could be subject to significant tax liability. Archrock obtained an opinion of external legal counsel substantially to the effect that, for U.S. federal income tax purposes, the Spin-off should qualify as a reorganization under Sections 355 and 368(a)(1)(D) of the Code, subject to certain qualifications and limitations. Accordingly, for U.S. federal income tax purposes, Archrock should not recognize any material gain or loss and our shareholders generally should recognize no gain or loss or include any amount in taxable income (other than with respect to cash received in lieu of fractional shares) as a result of the Spin-off.
21
Notwithstanding the opinion, the Internal Revenue Service (the “IRS”) could determine on audit that the Spin-off should be treated as a taxable transaction if it determines that any of the facts, assumptions, representations or undertakings we or Archrock has made is not correct or has been violated, or that the Spin-off should be taxable for other reasons, including as a result of a significant change in stock or asset ownership after the Spin-off. If the Spin-off ultimately is determined to be taxable, the Spin-off could be treated as a taxable dividend or capital gain to shareholders for U.S. federal income tax purposes, and shareholders could incur significant U.S. federal income tax liabilities. In addition, Archrock would recognize gain in an amount equal to the excess of the fair market value of shares of our common stock distributed to Archrock shareholders on the Spin-off date over Archrock’s tax basis in such shares of our common stock, and Archrock could incur other significant U.S. federal income tax liabilities.
Under the terms of the tax matters agreement that we entered into with Archrock in connection with the Spin-off, if the Spin-off were determined to be taxable, we may be responsible for all taxes imposed on Archrock as a result thereof if such determination was the result of actions taken after the Spin-off by or in respect of us, any of our affiliates or our shareholders and we may be responsible for 50% of such taxes imposed on Archrock as a result thereof if such determination was not the result of actions taken by us or Archrock. Our obligations under the tax matters agreement are not limited in amount or subject to any cap. Further, even if we are not responsible for tax liabilities of Archrock and its subsidiaries under the tax matters agreement, we nonetheless could be liable under applicable tax law for such liabilities if Archrock were to fail to pay them. If we are required to pay any liabilities under the circumstances set forth in the tax matters agreement or pursuant to applicable tax law, the amounts may be significant.
We might not be able to engage in desirable strategic transactions and equity issuances because of certain restrictions relating to requirements for a tax-free Spin-off.
Our ability to engage in significant equity transactions could be limited or restricted in order to preserve, for U.S. federal income tax purposes, the tax-free nature of the Spin-off. Even if the Spin-off otherwise qualifies for tax-free treatment under Section 355 of the Code, it may result in corporate-level taxable gain to Archrock under Section 355(e) of the Code if there is a 50% or greater change in ownership, by vote or value, of shares of our stock, Archrock’s stock or the stock of a successor of either occurring as part of a plan or series of related transactions that includes the Spin-off. Any acquisitions or issuances of our stock or Archrock’s stock within two years after the Spin-off are generally presumed to be part of such a plan.
Under the tax matters agreement that we entered into with Archrock, we are prohibited from taking or failing to take any action that prevents the Spin-off from being tax-free. Further, during the two-year period following the Spin-off, without obtaining the consent of Archrock, a private letter ruling from the IRS or an unqualified opinion of a nationally recognized law firm, we may be prohibited from taking certain specified actions that could impact the treatment of the Spin-off.
These restrictions may limit our ability to pursue strategic transactions or engage in new business or other transactions that may maximize the value of our business. Moreover, the tax matters agreement also provides that we are responsible for any taxes imposed on Archrock or any of its affiliates as a result of the failure of the Spin-off to qualify for favorable treatment under the Code if such failure is attributable to certain actions taken after the Spin-off by or in respect of us, any of our affiliates or our shareholders.
Our prior and continuing relationship with Archrock exposes us to risks attributable to businesses of Archrock.
Archrock is obligated to indemnify us for losses that third parties may seek to impose upon us or our affiliates for liabilities relating to the business of Archrock that are incurred through a breach of the separation and distribution agreement or any ancillary agreement by Archrock or its affiliates other than us, or losses that are attributable to Archrock in connection with the Spin-off or are not expressly assumed by us under our agreements with Archrock. Any claims made against us that are properly attributable to Archrock in accordance with these arrangements would require us to exercise our rights under our agreements with Archrock to obtain payment from Archrock. We are exposed to the risk that, in these circumstances, Archrock cannot, or will not, make the required payment.
22
In connection with our separation from Archrock, Archrock will indemnify us for certain liabilities, and we will indemnify Archrock for certain liabilities. If we are required to act on these indemnities to Archrock, we may need to divert cash to meet those obligations, and our financial results could be negatively impacted. In the case of Archrock’s indemnity, there can be no assurance that the indemnity will be sufficient to insure us against the full amount of such liabilities, or as to Archrock’s ability to satisfy its indemnification obligations.
Pursuant to the separation and distribution agreement and other agreements with Archrock, Archrock has agreed to indemnify us for certain liabilities, and we have agreed to indemnify Archrock for certain liabilities, in each case for uncapped amounts, as discussed further in our Registration Statement. Under the separation and distribution agreement, we and Archrock will generally release the other party from all claims arising prior to the Spin-off that relate to the other party's business, subject to certain exceptions. Also pursuant to the separation and distribution agreement, we have agreed to use our commercially reasonable efforts to remove Archrock as a party to certain of our contracts with third parties, which may result in a renegotiation of such contracts on terms that are less favorable to us. In the event that Archrock remains as a party, we expect to indemnify Archrock for any liabilities relating to such contracts. Indemnities that we may be required to provide Archrock will not be subject to any cap, may be significant and could negatively impact our business, particularly indemnities relating to our actions that could impact the tax-free nature of the Spin-off.
With respect to Archrock’s, agreement to indemnify us, there can be no assurance that the indemnity from Archrock will be sufficient to protect us against the full amount of such liabilities, or that Archrock will be able to fully satisfy its indemnification obligations. Moreover, even if we ultimately succeed in recovering from Archrock any amounts for which we are held liable, we may be temporarily required to bear these losses ourselves. Each of these risks could negatively affect our business, cash flows, results of operations and financial condition.
The Spin-off may expose us to potential liabilities arising out of state and federal fraudulent conveyance laws and legal dividend requirements.
The Spin-off is subject to review under various state and federal fraudulent conveyance laws. Under these laws, if a court in a lawsuit by an unpaid creditor or an entity vested with the power of such creditor (including without limitation a trustee or debtor-in-possession in a bankruptcy by us or Archrock or any of our respective subsidiaries) were to determine that Archrock or any of its subsidiaries did not receive fair consideration or reasonably equivalent value for distributing our common stock or taking other action as part of the Spin-off, or that we or any of our subsidiaries did not receive fair consideration or reasonably equivalent value for incurring indebtedness, including the borrowings incurred by us under the new credit facility in connection with the Spin-off, transferring assets or taking other action as part of the Spin-off and, at the time of such action, we, Archrock or any of our respective subsidiaries (i) was insolvent or would be rendered insolvent, (ii) lacked reasonably sufficient capital to carry on its business and all business in which it intended to engage or (iii) intended to incur, or believed it would incur, debts beyond its ability to repay such debts as they would mature, then such court could void the Spin-off as a constructive fraudulent transfer. If such court made this determination, the court could impose a number of different remedies, including without limitation, voiding our liens and claims, if any, against Archrock, or providing Archrock with a claim for money damages against us in an amount equal to the difference between the consideration received by Archrock and the fair market value of our company at the time of the Spin-off.
The measure of insolvency for purposes of the fraudulent conveyance laws will vary depending on which jurisdiction’s law is applied. Generally, however, an entity would be considered insolvent if the present fair saleable value of its assets is less than (i) the amount of its liabilities (including contingent liabilities) or (ii) the amount that will be required to pay its probable liabilities on its existing debts as they become absolute and mature. No assurance can be given as to what standard a court would apply to determine insolvency or that a court would determine that we, Archrock or any of our respective subsidiaries were solvent at the time of or after giving effect to the Spin-off, including the distribution of our common stock.
Under the separation and distribution agreement, each of Archrock and we are responsible for the debts, liabilities and other obligations related to the business or businesses which it owns and operates following the consummation of the Spin-off. Although we do not expect to be liable for any such obligations not expressly assumed by us pursuant to the separation and distribution agreement, it is possible that a court would disregard the allocation agreed to between the parties, and require that we assume responsibility for obligations allocated to Archrock, particularly if Archrock were to refuse or were unable to pay or perform the subject allocated obligations.
23
The market price and trading volume of our common stock may be volatile.
The market price of our stock may be influenced by many factors, some of which are beyond our control, including the following:
• | the inability to meet the financial estimates of analysts who follow our common stock; |
• | strategic actions by us or our competitors; |
• | announcements by us or our competitors of significant contracts, acquisitions, joint marketing relationships, joint ventures or capital commitments; |
• | variations in our quarterly operating results and those of our competitors; |
• | general economic and stock market conditions; |
• | risks relating to our business and our industry, including those discussed above; |
• | changes in conditions or trends in our industry, markets or customers; |
• | cyber-attacks or terrorist acts; |
• | future sales of our common stock or other securities; |
• | material weaknesses in our internal control over financial reporting; and |
• | investor perceptions of the investment opportunity associated with our common stock relative to other investment alternatives. |
These broad market and industry factors may materially reduce the market price of our common stock, regardless of our operating performance. In addition, price volatility may be greater if the public float and trading volume of our common stock is low.
We were not in compliance with the New York Stock Exchange’s requirements for continued listing and as a result our common stock may be delisted from trading, which would have a material effect on us and our stockholders.
We were delinquent in the filing of our periodic reports with the SEC, as a result of which we were not in compliance with the rules of the New York Stock Exchange (“NYSE”). By filing our quarterly reports on Form 10-Q for the quarters ended March 31, 2016, June 30, 2016 and September 30, 2016, we have been advised by the NYSE that we have adequately remediated our non-compliance with the NYSE’s rules. However, we delayed our annual meeting of stockholders as a result of the restatement, and to the extent we cannot hold our annual meeting before the end of 2017, our stock may again be subject to delisting from trading on the NYSE. If our common stock is delisted, there can be no assurance as to whether or when our common stock would again be listed for trading on NYSE or any other exchange. The market price of our shares may also decline and become more volatile if our common stock is delisted, and our stockholders may find that their ability to trade in our stock will be adversely affected. Furthermore, institutions whose charters do not allow them to hold securities in unlisted companies might sell our shares, which could have a further adverse effect on the price of our stock.
Our amended and restated certificate of incorporation designates the Court of Chancery of the State of Delaware as the sole and exclusive forum for certain types of actions and proceedings that may be initiated by our stockholders, which could limit our stockholders’ ability to choose the judicial forum for disputes with us or our directors, officers or other employees.
Our amended and restated certificate of incorporation provides that, unless we consent in writing to the selection of an alternate forum, the sole and exclusive forum for (i) any derivative action or proceeding brought on our behalf, (ii) any action asserting a claim of breach of a fiduciary duty owed by any director, officer or other employee to us or our stockholders, (iii) any action asserting a claim arising pursuant to any provision of the Delaware General Corporation Law, our amended and restated certificate of incorporation or our bylaws, in each case, as amended from time to time, or (iv) any action asserting a claim governed by the internal affairs doctrine, shall be the Court of Chancery of the State of Delaware, in all cases subject to the court’s having personal jurisdiction over the indispensable parties named as defendants. Any person or entity purchasing or otherwise acquiring any interest in shares of our capital stock is deemed to have received notice of and consented to the foregoing provision. This forum selection provision may limit a stockholder’s ability to bring a claim in a judicial forum that it finds favorable or cost-effective for disputes with us or our directors, officers or other employees, which may discourage such lawsuits against us and our directors, officers and employees.
Item 1B. Unresolved Staff Comments
None.
24
Item 2. Properties
The following table describes the material facilities we owned or leased as of December 31, 2016:
Location | Status | Square Feet | Uses | |||
Houston, Texas | Owned | 261,600 | Corporate office, oil and gas product sales | |||
Camacari, Brazil | Owned | 86,112 | Contract operations and aftermarket services | |||
Neuquen, Argentina | Owned | 43,233 | Contract operations and aftermarket services | |||
Reynosa, Mexico | Owned | 28,912 | Contract operations and aftermarket services | |||
Santa Cruz, Bolivia | Leased | 22,017 | Contract operations and aftermarket services | |||
Bangkok, Thailand | Leased | 36,611 | Aftermarket services | |||
Port Harcourt, Nigeria | Leased | 19,031 | Aftermarket services | |||
Houston, Texas | Owned | 343,750 | Oil and gas product sales | |||
Columbus, Texas | Owned | 219,552 | Oil and gas product sales | |||
Broken Arrow, Oklahoma | Owned | 141,549 | Oil and gas product sales | |||
Singapore, Singapore | Leased | 111,693 | Oil and gas product sales | |||
Hamriyah Free Zone, UAE | Leased | 212,742 | Oil and gas product sales and Belleli EPC product sales | |||
Item 3. Legal Proceedings
In the ordinary course of business, we are involved in various pending or threatened legal actions. While management is unable to predict the ultimate outcome of these actions, it believes that any ultimate liability arising from any of these actions will not have a material adverse effect on our financial position, results of operations or cash flows. However, because of the inherent uncertainty of litigation and arbitration proceedings, we cannot provide assurance that the resolution of any particular claim or proceeding to which we are a party will not have a material adverse effect on our financial position, results of operations or cash flows.
Contemporaneously with filing the Form 8-K on April 26, 2016, we self-reported the errors and possible irregularities at Belleli EPC to the SEC. Since then, we have been cooperating with the SEC in its investigation of this matter, including responding to a subpoena for documents related to the restatement and of our compliance with the FCPA, which are also being provided to the Department of Justice at its request. The FCPA related requests in the SEC subpoena pertain to our policies and procedures, information about our third-party sales agents, and documents related to historical internal investigations completed prior to November 2015.
Item 4. Mine Safety Disclosures
Not applicable.
25
PART II
Item 5. Market for Registrant’s Common Equity, Related Stockholder Matters and Issuer Purchases of Equity Securities
Our common stock is listed and traded on the New York Stock Exchange under the stock symbol “EXTN.” Our common stock was traded on a “when-issued” basis starting on October 26, 2015, and started “regular-way” trading on the NYSE on November 4, 2015. Prior to November 4, 2015, there was no public market for our common stock. The following table sets forth the range of high and low sale prices for our common stock for the period indicated.
Price Range | |||||||
High | Low | ||||||
Year Ended December 31, 2015 | |||||||
Fourth Quarter (beginning on November 4, 2015) | $ | 18.90 | $ | 13.29 | |||
Year Ended December 31, 2016 | |||||||
First Quarter | $ | 16.99 | $ | 12.07 | |||
Second Quarter | $ | 17.13 | $ | 10.83 | |||
Third Quarter | $ | 15.90 | $ | 11.87 | |||
Fourth Quarter | $ | 24.84 | $ | 14.51 | |||
On March 2, 2017, the closing price of our common stock was $30.04 per share. As of March 2, 2017, there were approximately 1,055 holders of record of our common stock.
We have not paid, and we do not currently anticipate paying cash dividends on our common stock. Instead, we intend to retain our future earnings to support the growth and development of our business. The declaration of any future cash dividends and, if declared, the amount of any such dividends, will be subject to our financial condition, earnings, capital requirements, financial covenants, applicable law and other factors our board of directors deems relevant. Therefore, there can be no assurance as to what level of dividends, if any, will be paid in the future.
For disclosures regarding securities authorized for issuance under our equity compensation plans, see Part III, Item 12 (“Security Ownership of Certain Beneficial Owners and Management and Related Stockholder Matters”) of this report.
26
Comparison of Cumulative Total Return
The performance graph below shows the cumulative total stockholder return on our common stock, compared with the S&P 500 Composite Stock Price Index (the “S&P 500 Index”) and the Oilfield Service Index (the “OSX Index”) over the period from November 4, 2015, the first day of trading volume, to December 31, 2016. The results are based on an investment of $100 in each of our common stock, the S&P 500 Index and the OSX Index. The graph assumes the reinvestment of dividends and adjusts all closing prices and dividends for stock splits.
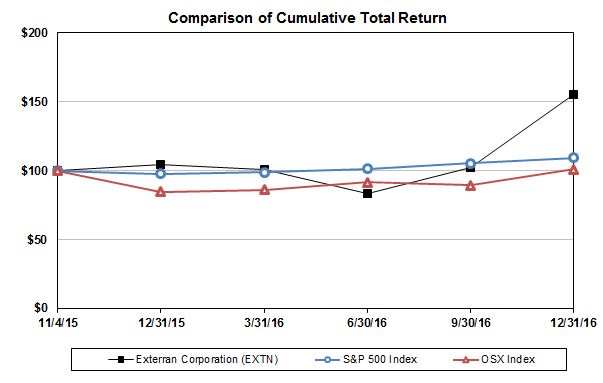
The performance graph shall not be deemed incorporated by reference by any general statement incorporating by reference this Annual Report on Form 10-K into any filing under the Securities Act of 1933 or the Securities Exchange Act of 1934, except to the extent that we specifically incorporate this information by reference, and shall not otherwise be deemed filed under those Acts.
Unregistered Sales of Equity Securities and Use of Proceeds
None.
Repurchase of Equity Securities
The following table summarizes our repurchases of equity securities during the three months ended December 31, 2016:
Period | Total Number of Shares Repurchased (1) | Average Price Paid Per Unit | Total Number of Shares Purchased as Part of Publicly Announced Plans or Programs | Maximum Number of Shares yet to be Purchased Under the Publicly Announced Plans or Programs | |||||||
October 1, 2016 - October 31, 2016 | — | $ | — | N/A | N/A | ||||||
November 1, 2016 - November 30, 2016 | 43,511 | 14.78 | N/A | N/A | |||||||
December 1, 2016 - December 31, 2016 | 160 | 23.90 | N/A | N/A | |||||||
Total | 43,671 | $ | 14.81 | N/A | N/A | ||||||
(1) | Represents shares withheld to satisfy employees’ tax withholding obligations in connection with vesting of restricted stock awards during the period. |
27
Item 6. Selected Financial Data
The table below presents certain selected historical consolidated and combined financial information as of and for each of the years in the five-year period ended December 31, 2016. The selected historical consolidated financial data as of December 31, 2016 and 2015 and the selected historical consolidated and combined financial data for the years ended December 31, 2016, 2015 and 2014 has been derived from our audited Financial Statements included elsewhere in this report. The selected historical combined financial data as of December 31, 2014, 2013 and 2012 and for the years ended December 31, 2013 and 2012 has been derived from our financial statements not included in this report.
Our Spin-off from Archrock was completed on November 3, 2015. Selected financial data for periods prior to the Spin-off represent the combined results of Archrock’s international services and product sales businesses. The combined financial data may not be indicative of our future performance and does not necessarily reflect the financial condition and results of operations we would have realized had we operated as a separate, stand-alone entity during the periods presented, including changes in our operations as a result of our Spin-off from Archrock. As discussed in Note 3 to our Financial Statements, in the first quarter of 2016, we began executing a plan to exit the Belleli CPE business comprising of engineering, procurement and manufacturing services related to the manufacture of critical process equipment for refinery and petrochemical facilities (referred to as “Belleli CPE” or the “Belleli CPE business” herein). The results from continuing operations for all periods presented exclude the results of our Venezuelan contract operations business, Canadian contract operations and aftermarket services businesses (“Canadian Operations”) and Belleli CPE business. Those results are reflected in discontinued operations for all periods presented. The selected financial data presented below should be read together with Management’s Discussion and Analysis of Financial Condition and Results of Operations and the Financial Statements contained in this report.
Years Ended December 31, | |||||||||||||||||||
(in thousands, except per share data) | 2016 | 2015 | 2014 | 2013 | 2012 | ||||||||||||||
Statement of Operations Data: | |||||||||||||||||||
Revenues | $ | 1,029,253 | $ | 1,790,485 | $ | 2,101,663 | $ | 2,324,537 | $ | 1,987,392 | |||||||||
Cost of sales (excluding depreciation and amortization expense) | 722,728 | 1,324,207 | 1,543,877 | 1,772,633 | 1,502,310 | ||||||||||||||
Selling, general and administrative | 165,985 | 220,396 | 263,170 | 259,801 | 264,970 | ||||||||||||||
Depreciation and amortization | 137,974 | 154,801 | 170,088 | 136,607 | 163,829 | ||||||||||||||
Long-lived asset impairment | 15,146 | 20,788 | 3,851 | 11,941 | 5,197 | ||||||||||||||
Restatement charges | 18,879 | — | — | — | — | ||||||||||||||
Restructuring and other charges | 27,457 | 31,315 | — | — | 3,892 | ||||||||||||||
Interest expense | 34,181 | 7,272 | 1,878 | 3,523 | 5,310 | ||||||||||||||
Equity in income of non-consolidated affiliates | (10,403 | ) | (15,152 | ) | (14,553 | ) | (19,000 | ) | (51,483 | ) | |||||||||
Other (income) expense, net | (13,088 | ) | 35,438 | 6,201 | (3,385 | ) | 7,541 | ||||||||||||
Provision for income taxes | 124,760 | 39,546 | 79,042 | 97,195 | 26,917 | ||||||||||||||
Income (loss) from continuing operations | (194,366 | ) | (28,126 | ) | 48,109 | 65,222 | 58,909 | ||||||||||||
Income (loss) from discontinued operations, net of tax | (33,571 | ) | 54,774 | 67,183 | 58,495 | 59,914 | |||||||||||||
Net income (loss) | (227,937 | ) | 26,648 | 115,292 | 123,717 | 118,823 | |||||||||||||
Income (loss) from continuing operations per common share (1): | |||||||||||||||||||
Basic | $ | (5.62 | ) | $ | (0.82 | ) | $ | 1.40 | $ | 1.90 | $ | 1.72 | |||||||
Diluted | (5.62 | ) | (0.82 | ) | 1.40 | 1.90 | 1.72 | ||||||||||||
Weighted average common shares outstanding used in income (loss) from continuing operations per common share (1): | |||||||||||||||||||
Basic | 34,568 | 34,288 | 34,286 | 34,286 | 34,286 | ||||||||||||||
Diluted | 34,568 | 34,288 | 34,286 | 34,286 | 34,286 | ||||||||||||||
Other Financial Data: | |||||||||||||||||||
Total gross margin (2) | $ | 306,525 | $ | 466,278 | $ | 557,786 | $ | 551,904 | $ | 485,082 | |||||||||
EBITDA, as adjusted (2) | 145,069 | 240,571 | 292,990 | 299,801 | 219,977 | ||||||||||||||
Capital expenditures: | |||||||||||||||||||
Contract Operations Equipment: | |||||||||||||||||||
Growth (3) | $ | 53,005 | $ | 105,169 | $ | 97,931 | $ | 36,468 | $ | 107,658 | |||||||||
Maintenance (4) | 14,440 | 27,282 | 24,377 | 21,591 | 22,530 | ||||||||||||||
Other | 6,880 | 24,294 | 34,294 | 34,109 | 29,716 | ||||||||||||||
Balance Sheet Data: | |||||||||||||||||||
Cash and cash equivalents | $ | 35,678 | $ | 29,032 | $ | 39,361 | $ | 35,194 | $ | 34,167 | |||||||||
Working capital (5) | 177,824 | 408,488 | 366,135 | 305,848 | 303,267 | ||||||||||||||
Property, plant and equipment, net | 797,809 | 858,188 | 908,590 | 911,257 | 984,069 | ||||||||||||||
Total assets | 1,374,778 | 1,788,396 | 1,999,303 | 1,973,622 | 2,105,744 | ||||||||||||||
Long-term debt (6) | 348,970 | 525,593 | 1,107 | 1,539 | — | ||||||||||||||
Total stockholders’ equity (6) | 556,771 | 805,936 | 1,364,335 | 1,321,160 | 1,380,975 | ||||||||||||||
(1) | For the periods prior to November 3, 2015, the average number of common shares outstanding used to calculate basic and diluted net income (loss) from continuing operations per common share was based on 34,286,267 shares of our common stock that were distributed by Archrock in the Spin-off on November 3, 2015. |
(2) | Total gross margin and EBITDA, as adjusted, are non-GAAP financial measures. Total gross margin and EBITDA, as adjusted, are defined, reconciled to income (loss) before income taxes and net income (loss), respectively, and discussed further below under “Non-GAAP Financial Measures.” |
(3) | Growth capital expenditures are made to expand or to replace partially or fully depreciated assets or to expand the operating capacity or revenue generating capabilities of existing or new assets, whether through construction, acquisition or modification. The majority of our growth capital expenditures are related to the acquisition cost of new compressor units and processing and treating equipment that we add to our contract operations fleet and installation costs on integrated projects. In addition, growth capital expenditures can include the upgrading of major components on an existing compressor unit where the current configuration of the compressor unit is no longer in demand and the compressor unit is not likely to return to an operating status without the capital expenditures. These latter expenditures substantially modify the operating parameters of the compressor unit such that it can be used in applications for which it previously was not suited. |
(4) | Maintenance capital expenditures are made to maintain the existing operating capacity of our assets and related cash flows further extending the useful lives of the assets. Maintenance capital expenditures are related to major overhauls of significant components of a compressor unit, such as the engine, compressor and cooler, that return the components to a “like new” condition, but do not modify the applications for which the compressor unit was designed. |
(5) | Working capital is defined as current assets minus current liabilities. |
(6) | Pursuant to the separation and distribution agreement with Archrock and certain of our and Archrock’s respective affiliates, on November 3, 2015, we transferred $532.6 million of net proceeds from borrowings under our credit facility to Archrock to allow it to repay a portion of its indebtedness in connection with the Spin-off. |
28
Non-GAAP Financial Measures
We define gross margin as total revenue less cost of sales (excluding depreciation and amortization expense). We evaluate the performance of each of our segments based on gross margin. Total gross margin is included as a supplemental disclosure because it is a primary measure used by our management to evaluate the results of revenue and cost of sales (excluding depreciation and amortization expense), which are key components of our operations. We believe gross margin is important because it focuses on the current operating performance of our operations and excludes the impact of the prior historical costs of the assets acquired or constructed that are utilized in those operations, the indirect costs associated with our selling, general and administrative (“SG&A”) activities, the impact of our financing methods and income taxes. Depreciation and amortization expense may not accurately reflect the costs required to maintain and replenish the operational usage of our assets and therefore may not portray the costs from current operating activity. As an indicator of our operating performance, total gross margin should not be considered an alternative to, or more meaningful than, income (loss) before income taxes as determined in accordance with accounting principles generally accepted in the U.S. (“GAAP”). Our gross margin may not be comparable to a similarly titled measure of another company because other entities may not calculate gross margin in the same manner.
Total gross margin has certain material limitations associated with its use as compared to income (loss) before income taxes. These limitations are primarily due to the exclusion of interest expense, depreciation and amortization expense, SG&A expense, impairments and restructuring and other charges. Each of these excluded expenses is material to our statements of operations. Because we intend to finance a portion of our operations through borrowings, interest expense is a necessary element of our costs and our ability to generate revenue. Additionally, because we use capital assets, depreciation expense is a necessary element of our costs and our ability to generate revenue, and SG&A expenses are necessary to support our operations and required corporate activities. To compensate for these limitations, management uses total gross margin, a non-GAAP measure, as a supplemental measure to other GAAP results to provide a more complete understanding of our performance.
The following table reconciles our net income (loss) before income taxes to total gross margin (in thousands):
Years Ended December 31, | |||||||||||||||||||
2016 | 2015 | 2014 | 2013 | 2012 | |||||||||||||||
Income (loss) before income taxes | $ | (69,606 | ) | $ | 11,420 | $ | 127,151 | $ | 162,417 | $ | 85,826 | ||||||||
Selling, general and administrative | 165,985 | 220,396 | 263,170 | 259,801 | 264,970 | ||||||||||||||
Depreciation and amortization | 137,974 | 154,801 | 170,088 | 136,607 | 163,829 | ||||||||||||||
Long-lived asset impairment | 15,146 | 20,788 | 3,851 | 11,941 | 5,197 | ||||||||||||||
Restatement charges | 18,879 | — | — | — | — | ||||||||||||||
Restructuring and other charges | 27,457 | 31,315 | — | — | 3,892 | ||||||||||||||
Interest expense | 34,181 | 7,272 | 1,878 | 3,523 | 5,310 | ||||||||||||||
Equity in income of non-consolidated affiliates | (10,403 | ) | (15,152 | ) | (14,553 | ) | (19,000 | ) | (51,483 | ) | |||||||||
Other (income) expense, net | (13,088 | ) | 35,438 | 6,201 | (3,385 | ) | 7,541 | ||||||||||||
Total gross margin | $ | 306,525 | $ | 466,278 | $ | 557,786 | $ | 551,904 | $ | 485,082 | |||||||||
We define EBITDA, as adjusted, as net income (loss) excluding income (loss) from discontinued operations (net of tax), cumulative effect of accounting changes (net of tax), income taxes, interest expense (including debt extinguishment costs), depreciation and amortization expense, impairment charges, restructuring and other charges, non-cash gains or losses from foreign currency exchange rate changes recorded on intercompany obligations, expensed acquisition costs and other items. We believe EBITDA, as adjusted, is an important measure of operating performance because it allows management, investors and others to evaluate and compare our core operating results from period to period by removing the impact of our capital structure (interest expense from our outstanding debt), asset base (depreciation and amortization), our subsidiaries’ capital structure (non-cash gains or losses from foreign currency exchange rate changes on intercompany obligations), tax consequences, impairment charges, restructuring and other charges, expensed acquisition costs and other items. Management uses EBITDA, as adjusted, as a supplemental measure to review current period operating performance, comparability measures and performance measures for period to period comparisons. In addition, the compensation committee has used EBITDA, as adjusted, in evaluating the performance of the Company and management and in evaluating certain components of executive compensation, including performance-based annual incentive programs. Our EBITDA, as adjusted, may not be comparable to a similarly titled measure of another company because other entities may not calculate EBITDA in the same manner.
29
EBITDA, as adjusted, is not a measure of financial performance under GAAP, and should not be considered in isolation or as an alternative to net income (loss), cash flows from operating activities and other measures determined in accordance with GAAP. Items excluded from EBITDA, as adjusted, are significant and necessary components to the operation of our business, and, therefore, EBITDA, as adjusted, should only be used as a supplemental measure of our operating performance.
The following table reconciles our net income (loss) to EBITDA, as adjusted (in thousands):
Years Ended December 31, | |||||||||||||||||||
2016 | 2015 | 2014 | 2013 | 2012 | |||||||||||||||
Net income (loss) | $ | (227,937 | ) | $ | 26,648 | $ | 115,292 | $ | 123,717 | $ | 118,823 | ||||||||
(Income) loss from discontinued operations, net of tax | 33,571 | (54,774 | ) | (67,183 | ) | (58,495 | ) | (59,914 | ) | ||||||||||
Depreciation and amortization | 137,974 | 154,801 | 170,088 | 136,607 | 163,829 | ||||||||||||||
Long-lived asset impairment | 15,146 | 20,788 | 3,851 | 11,941 | 5,197 | ||||||||||||||
Restatement charges | 18,879 | — | — | — | — | ||||||||||||||
Restructuring and other charges | 27,457 | 31,315 | — | — | 3,892 | ||||||||||||||
Investment in non-consolidated affiliates impairment | — | 33 | 197 | — | 224 | ||||||||||||||
Proceeds from sale of joint venture assets | (10,403 | ) | (15,185 | ) | (14,750 | ) | (19,000 | ) | (51,707 | ) | |||||||||
Interest expense | 34,181 | 7,272 | 1,878 | 3,523 | 5,310 | ||||||||||||||
(Gain) loss on currency exchange rate remeasurement of intercompany balances | (8,559 | ) | 30,127 | 3,614 | 4,313 | 7,406 | |||||||||||||
Loss on sale of businesses | — | — | 961 | — | — | ||||||||||||||
Provision for income taxes | 124,760 | 39,546 | 79,042 | 97,195 | 26,917 | ||||||||||||||
EBITDA, as adjusted | $ | 145,069 | $ | 240,571 | $ | 292,990 | $ | 299,801 | $ | 219,977 | |||||||||
30
Item 7. Management’s Discussion and Analysis of Financial Condition and Results of Operations
The following discussion and analysis of our financial condition and results of operations should be read in conjunction with our Financial Statements, the notes thereto, and the other financial information appearing elsewhere in this report. The following discussion includes forward-looking statements that involve certain risks and uncertainties. See Part I (“Disclosure Regarding Forward-Looking Statements”) and Part I, Item 1A (“Risk Factors”) in this report.
Overview
We are a market leader in the provision of compression, production and processing products and services that support the production and transportation of oil and natural gas throughout the world. We provide these products and services to a global customer base consisting of companies engaged in all aspects of the oil and natural gas industry, including large integrated oil and natural gas companies, national oil and natural gas companies, independent oil and natural gas producers and oil and natural gas processors, gatherers and pipeline operators. We operate in four primary business lines: contract operations, aftermarket services, oil and gas product sales and Belleli EPC product sales. In our contract operations business line, we have operations outside of the United States of America (“U.S.”) where we own and operate natural gas compression equipment and crude oil and natural gas production and processing equipment on behalf of our customers. In our aftermarket services business line, we primarily have operations outside of the U.S. where we provide operations, maintenance, overhaul and reconfiguration services to customers who own their own compression, production, processing, treating and related equipment. In our oil and gas product sales business line, we manufacture natural gas compression packages and oil and natural gas production and processing equipment for sale to our customers throughout the world and for use in our contract operations business line. In our Belleli EPC product sales business line that we are exiting, we have historically provided engineering, procurement and construction for the manufacture of tanks for tank farms and the manufacture of evaporators and brine heaters for desalination plants. As of December 31, 2016, we had five significant contracts in this business remaining and currently expect to have substantially exited this business by the first half of 2018. We also offer our customers, on either a contract operations basis or a sale basis, the engineering, design, project management, procurement and construction services necessary to incorporate our products into production, processing and compression facilities, which we refer to as integrated projects.
As discussed in Note 22 to the Financial Statements, we changed our reporting segments in the third quarter of 2016 to split our previously disclosed product sales segment into the following two new reportable segments: “oil and gas product sales” and “Belleli EPC product sales.” The contract operations and aftermarket services segments were not impacted by this change. The change in our reportable segments is reflected in this Management’s Discussion and Analysis of Financial Condition and Results of Operations.
Spin-off
On November 3, 2015, Archrock, Inc. (named Exterran Holdings, Inc. prior to November 3, 2015) (“Archrock”) completed the spin-off (the “Spin-off”) of its international contract operations, international aftermarket services (the international contract operations and international aftermarket services businesses combined are referred to as the “international services businesses” and include such activities conducted outside of the U.S.) and global fabrication businesses into an independent, publicly traded company (“Exterran Corporation,” “our,” “we” or “us”). To effect the Spin-off, on November 3, 2015, Archrock distributed, on a pro rata basis, all of our shares of common stock to its stockholders of record as of October 27, 2015 (the “Record Date”). Archrock shareholders received one share of Exterran Corporation common stock for every two shares of Archrock common stock held at the close of business on the Record Date. Pursuant to the separation and distribution agreement with Archrock and certain of our and Archrock’s respective affiliates, on November 3, 2015, we transferred cash of $532.6 million to Archrock. Following the completion of the Spin-off, we and Archrock became and continue to be independent, publicly traded companies with separate boards of directors and management.
31
Basis of Presentation
The accompanying Financial Statements in Part IV, Item 15, have been prepared in accordance with GAAP. All financial information presented for periods after the Spin-off represents our consolidated results of operations, financial position and cash flows (referred to as the “consolidated financial statements”) and all financial information for periods prior to the Spin-off represents our combined results of operations, financial position and cash flows (referred to as the “combined financial statements”). Accordingly:
• | Our consolidated and combined statements of operations, comprehensive income, cash flows and stockholders’ equity for the year ended December 31, 2015 consist of (i) the combined results of Archrock’s international services and product sales businesses for the period between January 1, 2015 and November 3, 2015 and (ii) the consolidated results of Exterran Corporation for periods subsequent to November 3, 2015. Our combined statements of operations, comprehensive income, cash flows and stockholders’ equity for the year ended December 31, 2014 consist entirely of the combined results of Archrock’s international services and product sales businesses. |
• | Our consolidated balance sheets at December 31, 2016 and 2015 consist entirely of our consolidated balances. |
The combined financial statements were derived from the accounting records of Archrock and reflect the combined historical results of operations, financial position and cash flows of Archrock’s international services and product sales businesses. The combined financial statements were presented as if such businesses had been combined for periods prior to November 4, 2015. All intercompany transactions and accounts within these statements have been eliminated. Affiliate transactions between the international services and product sales businesses of Archrock and the other businesses of Archrock have been included in the combined financial statements, with the exception of oil and gas product sales within our wholly owned subsidiary, Exterran Energy Solutions, L.P. (“EESLP”). Prior to the closing of the Spin-off, EESLP also had a fleet of compression units used to provide compression services in the U.S. services business of Archrock. Revenue has not been recognized in the combined statements of operations for the sale of compressor units by us that were used by EESLP to provide compression services to customers of the U.S. services business of Archrock. See Note 16 to the Financial Statements for further discussion on transactions with affiliates.
The combined statements of operations for periods prior to the Spin-off include expense allocations for certain functions historically performed by Archrock and not allocated to its operating segments, including allocations of expenses related to executive oversight, accounting, treasury, tax, legal, human resources, procurement and information technology. See Note 16 to the Financial Statements for further discussion regarding the allocation of corporate expenses. Additionally, third party debt of Archrock, other than debt attributable to capital leases, was not allocated to us for any of the periods prior to the Spin-off as we were not the legal obligor of the debt and Archrock’s borrowings were not directly attributable to our business.
We refer to the consolidated and combined financial statements collectively as “financial statements,” and individually as “balance sheets,” “statements of operations,” “statements of comprehensive income (loss),” “statements of stockholders’ equity” and “statements of cash flows” herein.
Exit of our Belleli Businesses
In the first quarter of 2016, we began executing a plan to exit certain Belleli businesses to focus on our core oil and gas businesses. Specifically, we began marketing for sale the Belleli CPE business comprising of engineering, procurement and manufacturing services related to the manufacture of critical process equipment for refinery and petrochemical facilities (referred to as “Belleli CPE” or the “Belleli CPE business” herein). In addition, we began executing our exit of the Belleli EPC business that has historically been comprised of engineering, procurement and construction for the manufacture of tanks for tank farms and the manufacture of evaporators and brine heaters for desalination plants in the Middle East (referred to as “Belleli EPC” or the “Belleli EPC business” herein). Belleli CPE met the held for sale criteria and is reflected as discontinued operations in our financial statements for all periods presented. In August 2016, we completed the sale of our Belleli CPE business to Tosto S.r.l. for cash proceeds of $5.5 million. Belleli CPE was previously included in our former product sales segment. In conjunction with the planned disposition of Belleli CPE, we recorded impairments of long-lived assets and current assets that totaled $68.8 million during the year ended December 31, 2016. The impairment charges are reflected in income (loss) from discontinued operations, net of tax. In accordance with GAAP, Belleli EPC will be reflected as discontinued operations upon the substantial cessation of the remaining non-oil and gas business. During the first quarter of 2016, we ceased the booking of new orders for our Belleli EPC business. Our plan to exit our Belleli EPC business resulted in a reduction in the remaining useful lives of the assets that are currently used in the Belleli EPC business and a long-lived asset impairment charge of $0.7 million impacting results from continuing operations during the year ended December 31, 2016. Belleli EPC is represented by our Belleli EPC product sales segment.
32
The following table summarizes the operating results of our core oil and gas businesses and our Belleli businesses (in thousands):
Exterran Corporation Excluding Belleli | Belleli | Exterran Corporation Consolidated and Combined | |||||||||||||
CPE | EPC | ||||||||||||||
Year Ended December 31, 2016 | |||||||||||||||
Revenue | $ | 905,397 | $ | — | $ | 123,856 | $ | 1,029,253 | |||||||
Cost of sales (excluding depreciation and amortization expense) | 596,406 | — | 126,322 | 722,728 | |||||||||||
Depreciation and amortization | 130,731 | — | 7,243 | 137,974 | |||||||||||
Loss from continuing operations | (173,354 | ) | — | (21,012 | ) | (194,366 | ) | ||||||||
Income (loss) from discontinued operations, net of tax (1) | 39,036 | (72,607 | ) | — | (33,571 | ) | |||||||||
Net loss | (134,318 | ) | (72,607 | ) | (21,012 | ) | (227,937 | ) | |||||||
Product sales backlog (at period end) | 306,222 | — | 63,578 | (2) | 369,800 | ||||||||||
Third party bookings | 431,188 | — | 25,010 | (2) | 456,198 | ||||||||||
Year Ended December 31, 2015 | |||||||||||||||
Revenue | $ | 1,687,264 | $ | — | $ | 103,221 | $ | 1,790,485 | |||||||
Cost of sales (excluding depreciation and amortization expense) | 1,189,361 | — | 134,846 | 1,324,207 | |||||||||||
Depreciation and amortization | 144,123 | — | 10,678 | 154,801 | |||||||||||
Income (loss) from continuing operations | 26,049 | — | (54,175 | ) | (28,126 | ) | |||||||||
Income (loss) from discontinued operations, net of tax (1) | 56,132 | (1,358 | ) | — | 54,774 | ||||||||||
Net income (loss) | 82,181 | (1,358 | ) | (54,175 | ) | 26,648 | |||||||||
Product sales backlog (at period end) | 267,418 | — | 162,424 | 429,842 | |||||||||||
Third party bookings | 437,250 | — | 80,907 | 518,157 | |||||||||||
Year Ended December 31, 2014 | |||||||||||||||
Revenue | $ | 1,986,184 | $ | — | $ | 115,479 | $ | 2,101,663 | |||||||
Cost of sales (excluding depreciation and amortization expense) | 1,395,007 | — | 148,870 | 1,543,877 | |||||||||||
Depreciation and amortization | 161,071 | — | 9,017 | 170,088 | |||||||||||
Income (loss) from continuing operations | 103,104 | — | (54,995 | ) | 48,109 | ||||||||||
Income (loss) from discontinued operations, net of tax (1) | 73,198 | (6,015 | ) | — | 67,183 | ||||||||||
Net income (loss) | 176,302 | (6,015 | ) | (54,995 | ) | 115,292 | |||||||||
Product sales backlog (at period end) | 765,463 | — | 184,738 | 950,201 | |||||||||||
Third party bookings | 1,420,799 | — | 99,473 | 1,520,272 | |||||||||||
___________________
(1) | See Note 3 to the Financial Statements for further discussion regarding discontinued operations. As Belleli CPE is no longer a part of our continuing operations, Belleli CPE’s product sales backlog and third party bookings have been excluded from all periods presented. We completed the sale of Belleli CPE in August 2016. |
(2) | During the first quarter of 2016, we ceased the booking of new orders for our Belleli EPC business. Changes in our Belleli EPC backlog since March 31, 2016 reflect revenue recognized and change orders booked on existing contracts. |
33
Industry Conditions and Trends
Our business environment and corresponding operating results are affected by the level of energy industry spending for the exploration, development and production of oil and natural gas reserves. Spending by oil and natural gas exploration and production companies is dependent upon these companies’ forecasts regarding the expected future supply, demand and pricing of oil and natural gas products as well as their estimates of risk-adjusted costs to find, develop and produce reserves. Although we believe our contract operations business, and to a lesser extent our oil and gas product sales business, is typically less impacted by commodity prices than certain other energy products and service providers, changes in oil and natural gas exploration and production spending normally result in changes in demand for our products and services.
Natural gas consumption in the U.S. for the twelve months ended November 30, 2016 decreased by approximately 0.6% compared to the twelve months ended November 30, 2015. The U.S. Energy Information Administration (“EIA”) forecasts that total U.S. natural gas consumption will increase by 0.4% in 2017 compared to 2016. As reported by the BP Energy Outlook 2017 edition (“BP Energy Outlook 2017”), North American natural gas consumption and worldwide natural gas consumption is expected to grow annually by an average of approximately 1.4% and 1.9%, respectively, per year between 2015 and 2035.
Natural gas marketed production in the U.S. for the twelve months ended November 30, 2016 decreased by approximately 1.2% compared to the twelve months ended November 30, 2015. The EIA forecasts that total U.S. natural gas marketed production will increase by 2% in 2017 compared to 2016. In addition, according to the BP Energy Outlook 2017, North American natural gas production and worldwide natural gas production is expected to grow annually by an average of approximately 2.4% and 1.8%, respectively, per year between 2015 and 2035.
Global oil and U.S. natural gas prices declined significantly from the third quarter of 2014 through the middle of 2016, which led to declines in U.S. and worldwide capital spending for drilling activity in 2015. Given recent improvements in late 2016 to the market environment, we anticipate industry spending to increase in the U.S. with flat to slight declines in international spending in 2017.
Our Performance Trends and Outlook
Our revenue, earnings and financial position are affected by, among other things, market conditions that impact demand and pricing for natural gas compression and oil and natural gas production and processing and our customers’ decisions among using our products and services, using our competitors’ products and services or owning and operating the equipment themselves.
Due to a significant decrease in oil and natural gas prices since the third quarter of 2014, overall market activity in North America remained at depressed levels for the majority of 2016. Low commodity prices in 2015 and the majority of 2016 have led to reduced drilling of oil and gas wells in North America. Oil and natural gas prices in North America improved late in 2016 over the lows experienced in the earlier part of the year, however, we believe higher commodity prices for a sustained period are necessary to encourage meaningful increases in customer spending. The Henry Hub spot price for natural gas was $3.71 per MMBtu at December 31, 2016, which was approximately 63% and 18% higher than prices at December 2015 and 2014, respectively, and the U.S. natural gas liquid composite price was approximately $5.45 per MMBtu for the month of November 2016, which was approximately 29% higher and 3% lower than prices for the months of December 2015 and 2014, respectively. In addition, the West Texas Intermediate crude oil spot price as of December 31, 2016 was approximately 45% and 1% higher than prices at December 31, 2015 and 2014, respectively. During periods of lower oil or natural gas prices, our customers typically decrease their capital expenditures, which generally results in lower activity levels. As a result of the low oil and natural gas price environment in North America during 2015 and the majority of 2016, our customers sought to reduce their capital and operating expenditure requirements, and as a result, the demand and pricing for the equipment we manufacture in North America was adversely impacted. Third party booking activity levels for our manufactured oil and gas products in North America during the year ended December 31, 2016 were $343.7 million, which represents a decline of approximately 12% and 68% compared to the years ended December 31, 2015 and 2014, respectively, and our North America oil and gas product sales backlog as of December 31, 2016 was $237.7 million, which represents an increase of approximately 6% and a decline of approximately 56% compared to December 31, 2015 and 2014, respectively. We believe these booking levels reflect both our customers’ reduced activity levels in response to the decline in commodity prices and caution on the part of our customers as they sought to reduce costs.
Similarly, in international markets, lower oil and natural gas prices have had a negative impact on the amount of capital investment by our customers in new projects. Our customers sought to reduce their capital and operating expenditure requirements due to lower oil and natural gas prices. As a result, the demand and pricing for our products and services in international markets was adversely impacted.
34
Industry forecasts indicate a sharp rise in U.S. shale fields spending is expected for 2017 with continued underinvestment in international markets. We believe international spending will recover more slowly than spending in North America, as the largest-in-class energy producers with more international exposure focus on debt reduction and returning cash to shareholders, while smaller, U.S.-centric resource holders invest to increase production in lower-cost shale plays. Demand for our oil and gas product sales in the U.S. could benefit from increased customer spending.
Despite the anticipated slower recovery internationally, longer-term fundamentals in our international markets depends in part on international oil and gas infrastructure projects, many of which are based on longer-term plans of our customers that can be driven by their local market demand and local pricing for natural gas. As a result, we believe our international customers make decisions based on longer-term fundamentals that can be less tied to near term commodity prices than our North American customers. Therefore, we believe the demand for our products and services in international markets will continue, and we expect to have opportunities to grow our international businesses over the long term. Third party booking activity levels for our manufactured oil and gas products in international markets during the year ended December 31, 2016 were $87.5 million, which represents an increase of approximately 87% and a decline of approximately 76% compared to the years ended December 31, 2015 and 2014, respectively, and our international market oil and gas product sales backlog as of December 31, 2016 was $68.5 million, which represents an increase of approximately 57% and a decline of approximately 70% compared to December 31, 2015 and 2014, respectively. The fluctuations in the size of our bid proposals for new contracts tend to create variability in booking activity levels in international markets from period to period.
Aggregate third party booking activity levels for our manufactured oil and gas products in North America and international markets during the year ended December 31, 2016 were $431.2 million, which represents a decline of approximately 1% and 70% compared to the years ended December 31, 2015 and 2014, respectively. The aggregate oil and gas product sales backlog for our manufactured products in North America and international markets as of December 31, 2016 was $306.2 million, which represents an increase of approximately 15% and a decline of approximately 60% compared to December 31, 2015 and 2014, respectively.
Since the first quarter of 2016, we have been executing activities necessary to exit the Belleli EPC product sales business. At December 31, 2016, we had five significant contracts in the remaining business and expect to have substantially exited the business by the first half of 2018. Based on contractual requirements, the progress on the projects and the status of negotiations with the related customers, as of December 31, 2016, a liability for estimated penalties for liquidated damages of $18.3 million has been included in our financial statements primarily due to our actual or projected failure to meet certain specified contractual milestone dates. We have asserted claims, or intend to assert claims, and are negotiating change orders, that if settled favorably, could result in recoveries for us, including a release of such claims in exchange for release of liquidated damages.
The timing of any change in activity levels by our customers is difficult to predict. As a result, our ability to project the anticipated activity level for our business, and particularly our oil and gas product sales segment, is limited. In the latter part of 2016, we experienced an increase in oil and gas product sales bookings. However, volatility in commodity prices could delay investments by our customers in significant projects, which could result in a material adverse effect on our business, financial condition, results of operations and cash flows.
Our level of capital spending depends on our forecast for the demand for our products and services and the equipment required to provide services to our customers. Based on demand we see for contract operations, we anticipate investing more capital in our contract operations business in 2017 than we did in 2016.
Certain Key Challenges and Uncertainties
Market conditions and competition in the oil and natural gas industry and the risks inherent in international markets continue to represent key challenges and uncertainties. In addition to these challenges, we believe the following represent some of the key challenges and uncertainties we will face in the future:
35
Global Energy Markets and Oil and Natural Gas Pricing. Our results of operations depend upon the level of activity in the global energy markets, including oil and natural gas development, production, processing and transportation. Oil and natural gas prices and the level of drilling and exploration activity can be volatile and have fallen significantly in recent years. As a result, many producers in the U.S. and other parts of the world, including our customers, significantly reduced their capital and operating spending in 2015 and 2016. If oil and natural gas exploration and development activity and the number of well completions continue to decline due to the reduction in oil and natural gas prices or significant instability in energy markets, we would anticipate a continued decrease in demand and pricing for our natural gas compression and oil and natural gas production and processing equipment and services. For example, unfavorable market conditions or financial difficulties experienced by our customers may result in cancellation of contracts or the delay or abandonment of projects, which could cause our cash flows generated by our product sales and international services to decline and have a material adverse effect on our results of operations and financial condition.
Execution on Larger Contract Operations and Product Sales Projects. Some of our projects are significant in size and scope, which can translate into more technically challenging conditions or performance specifications for our products and services. Contracts with our customers generally specify delivery dates, performance criteria and penalties for our failure to perform. Any failure to execute such larger projects in a timely and cost effective manner could have a material adverse effect on our business, financial condition, results of operations and cash flows.
Maintaining Expense Levels in Line with Activity Decreases. Given the volatility of the global energy markets and industry capital spending activity levels, we have and will continue to monitor and control our expense levels, including personnel head count and costs, to protect our profitability. Some of these expenses are difficult to reduce, and if we are not able to reduce them commensurate with activity decreases, our profitability will be negatively impacted. Any failure to reduce costs in a timely manner could have a material adverse effect on our business, financial condition, results of operations and cash flows.
Summary of Results
As discussed in Note 3 to the Financial Statements, the results from continuing operations for all periods presented exclude the results of our Venezuelan contract operations and Belleli CPE businesses. Those results are reflected in discontinued operations for all periods presented.
Revenue. Revenue during the years ended December 31, 2016, 2015 and 2014 was $1,029.3 million, $1,790.5 million and $2,101.7 million, respectively. The decrease in revenue during the year ended December 31, 2016 compared to the year ended December 31, 2015 was primarily caused by revenue decreases in our oil and gas product and contract operations segments. The decrease in revenue during the year ended December 31, 2015 compared to the year ended December 31, 2014 was caused by revenue decreases in all four of our segments.
Net income. We generated net loss of $227.9 million during the year ended December 31, 2016, and net income of $26.6 million and $115.3 million during the years ended December 31, 2015 and 2014, respectively. The decrease in net income during the year ended December 31, 2016 compared to the year ended December 31, 2015 was primarily due to a decrease in gross margin in our oil and gas product sales and contract operations segments, non-cash valuation allowances of $119.8 million recorded against U.S. deferred tax assets during 2016, impairment charges reflected in loss from discontinued operations, net of tax, of $68.8 million related to Belleli CPE during 2016 and increases in interest expense and restatement charges. These activities were partially offset by a decrease in SG&A expense, foreign currency gains of $6.4 million during 2016 compared to foreign currency losses of $35.8 million during 2015, estimated loss contract provisions of $30.1 million recorded on significant Belleli EPC product sales projects during 2015 and a decrease in depreciation and amortization expense. Net loss during the year ended December 31, 2016 included loss from discontinued operations, net of tax, of $33.6 million and net income during the year ended December 31, 2015 included income from discontinued operations, net of tax, of $54.8 million. The decrease in net income during the year ended December 31, 2015 compared to the year ended December 31, 2014 was primarily due to a decrease in gross margin in our oil and gas product sales and contract operations segments, an increase in restructuring and other charges, a $26.5 million increase in translation losses related to the functional currency remeasurement of our foreign subsidiaries’ non-functional currency denominated intercompany obligations, an increase in long-lived asset impairment and a $16.0 million decrease in proceeds received from the sale of our Venezuelan subsidiary’s assets to PDVSA Gas S.A. (“PDVSA Gas”). These activities were partially offset by decreases in SG&A expense, income tax expense and depreciation and amortization expense. Net income during the years ended December 31, 2015 and 2014 included income from discontinued operations, net of tax, of $54.8 million and $67.2 million, respectively.
36
EBITDA, as adjusted. Our EBITDA, as adjusted, was $145.1 million, $240.6 million and $293.0 million during the years ended December 31, 2016, 2015 and 2014, respectively. EBITDA, as adjusted, during the year ended December 31, 2016 compared to the year ended December 31, 2015 decreased primarily due to a decrease in gross margin in our oil and gas product sales and contract operations segments, partially offset by a decrease in SG&A expense and estimated loss contract provisions of $30.1 million recorded on significant Belleli EPC product sales projects during 2015. EBITDA, as adjusted, during the year ended December 31, 2015 compared to the year ended December 31, 2014 decreased primarily due to a decrease in gross margin in our oil and gas product sales and contract operations segments, partially offset by a decrease in SG&A expense. For a reconciliation of EBITDA, as adjusted, to net income (loss), its most directly comparable financial measure calculated and presented in accordance with GAAP, please read Part II, Item 6 (“Selected Financial Data — Non-GAAP Financial Measures”) of this report.
Results by Business Segment. The following table summarizes revenue, gross margin and gross margin percentages for each of our business segments (dollars in thousands):
Years Ended December 31, | |||||||||||
2016 | 2015 | 2014 | |||||||||
Revenue: | |||||||||||
Contract Operations | $ | 392,463 | $ | 469,900 | $ | 493,853 | |||||
Aftermarket Services | 120,550 | 127,802 | 162,724 | ||||||||
Oil and Gas Product Sales | 392,384 | 1,089,562 | 1,329,607 | ||||||||
Belleli EPC Product Sales | 123,856 | 103,221 | 115,479 | ||||||||
$ | 1,029,253 | $ | 1,790,485 | $ | 2,101,663 | ||||||
Gross Margin (1): | |||||||||||
Contract Operations | $ | 248,793 | $ | 297,509 | $ | 308,445 | |||||
Aftermarket Services | 33,208 | 36,569 | 42,543 | ||||||||
Oil and Gas Product Sales | 26,990 | 163,825 | 240,189 | ||||||||
Belleli EPC Product Sales | (2,466 | ) | (31,625 | ) | (33,391 | ) | |||||
$ | 306,525 | $ | 466,278 | $ | 557,786 | ||||||
Gross Margin percentage (2): | |||||||||||
Contract Operations | 63 | % | 63 | % | 62 | % | |||||
Aftermarket Services | 28 | % | 29 | % | 26 | % | |||||
Oil and Gas Product Sales | 7 | % | 15 | % | 18 | % | |||||
Belleli EPC Product Sales | (2 | )% | (31 | )% | (29 | )% | |||||
(1) | Gross margin is defined as revenue less cost of sales, excluding depreciation and amortization expense. We evaluate the performance of each of our segments based on gross margin. Total gross margin, a non-GAAP financial measure, is reconciled, in total, to income (loss) before income taxes, its most directly comparable financial measure calculated and presented in accordance with GAAP in Part II, Item 6 (“Selected Financial Data — Non-GAAP Financial Measures”) of this report. |
(2) | Gross margin percentage is defined as gross margin divided by revenue. |
37
Operating Highlights
The following tables summarize our total available horsepower, total operating horsepower, average operating horsepower, horsepower utilization percentages and product sales backlog (in thousands, except percentages):
Years Ended December 31, | ||||||||
Contract Operations Horsepower | 2016 | 2015 | 2014 | |||||
Total Available Horsepower (at period end) | 1,138 | 1,181 | 1,236 | |||||
Total Operating Horsepower (at period end) | 936 | 964 | 976 | |||||
Average Operating Horsepower | 953 | 959 | 969 | |||||
Horsepower Utilization (at period end) | 82 | % | 82 | % | 79 | % | ||
December 31, | |||||||||||
Product Sales Backlog (1) | 2016 | 2015 | 2014 | ||||||||
Oil and Gas Product Sales Backlog (2): | |||||||||||
Compressor and Accessory Backlog | $ | 160,006 | $ | 141,059 | $ | 270,297 | |||||
Production and Processing Equipment Backlog | 144,252 | 118,914 | 373,415 | ||||||||
Installation Backlog | 1,964 | 7,445 | 121,751 | ||||||||
Belleli EPC Backlog (3) | 63,578 | 162,424 | 184,738 | ||||||||
Total Product Sales Backlog | $ | 369,800 | $ | 429,842 | $ | 950,201 | |||||
(1) | Our product sales backlog consists of unfilled orders based on signed contracts and does not include potential product sales pursuant to letters of intent received from customers. As Belleli CPE is no longer a part of our continuing operations, Belleli CPE’s product sales backlog has been excluded from all periods presented. |
(2) | We expect that approximately $14.0 million of our oil and gas product sales backlog as of December 31, 2016 will be recognized after December 31, 2017. |
(3) | Prior to change in our reporting segments, our Belleli EPC product sales backlog was previously included in our production and processing equipment product sales backlog. During the first quarter of 2016, we ceased the booking of new orders for our Belleli EPC business. Changes in our Belleli EPC backlog since March 31, 2016 reflect revenue recognized and change orders booked on existing contracts. We expect that approximately $4.3 million of our Belleli EPC product sales backlog as of December 31, 2016 will be recognized after December 31, 2017. |
38
Results of Operations
The Year Ended December 31, 2016 Compared to the Year Ended December 31, 2015
Contract Operations
(dollars in thousands)
Years Ended December 31, | Increase (Decrease) | |||||||||
2016 | 2015 | |||||||||
Revenue | $ | 392,463 | $ | 469,900 | (16 | )% | ||||
Cost of sales (excluding depreciation and amortization expense) | 143,670 | 172,391 | (17 | )% | ||||||
Gross margin | $ | 248,793 | $ | 297,509 | (16 | )% | ||||
Gross margin percentage | 63 | % | 63 | % | — | % | ||||
The decrease in revenue during the year ended December 31, 2016 compared to the year ended December 31, 2015 was primarily due to a decrease in revenue of $34.3 million resulting from an early termination of a project in the Eastern Hemisphere in January 2016 that had been operating since the third quarter of 2009, a $33.0 million decrease in revenue in Mexico primarily driven by projects that terminated operations in 2015 and a reduction of recognized deferred revenue resulting from contract extensions and a $17.7 million decrease in revenue in Argentina primarily due to a devaluation of the Argentine peso since the prior year period. These decreases were partially offset by an $18.3 million increase in revenue in Brazil primarily driven by the start-up of a project during the second half of 2015. Gross margin decreased during the year ended December 31, 2016 compared to the year ended December 31, 2015 primarily due to the revenue decrease described above, excluding the devaluation of the Argentine peso as the impact on gross margin was insignificant. Gross margin percentage during the year ended December 31, 2016 compared to the year ended December 31, 2015 remained flat. The early termination of a project in the Eastern Hemisphere resulted in additional costs during the years ended December 31, 2016 and 2015 in the form of depreciation expense, which is excluded from gross margin. Additionally, excluded from cost of sales and recorded to restructuring and other charges in our statements of operations during the year ended December 31, 2015 were non-cash inventory write-downs of $4.2 million associated with the Spin-off primarily related to the decentralization of shared inventory components between Archrock’s North America contract operations business and our international contract operations business.
Aftermarket Services
(dollars in thousands)
Years Ended December 31, | Increase (Decrease) | |||||||||
2016 | 2015 | |||||||||
Revenue | $ | 120,550 | $ | 127,802 | (6 | )% | ||||
Cost of sales (excluding depreciation and amortization expense) | 87,342 | 91,233 | (4 | )% | ||||||
Gross margin | $ | 33,208 | $ | 36,569 | (9 | )% | ||||
Gross margin percentage | 28 | % | 29 | % | (1 | )% | ||||
The decrease in revenue during the year ended December 31, 2016 compared to the year ended December 31, 2015 was primarily due to a decrease in revenue of $7.1 million in Gabon driven by our cessation of activities in the Gabon market during the first quarter of 2015. Gross margin decreased during the year ended December 31, 2016 compared to the year ended December 31, 2015 primarily due to the revenue decreased discussed above. Gross margin percentage during the year ended December 31, 2016 compared to the year ended December 31, 2015 decreased primarily due to the receipt of a settlement from a customer in Gabon during the year ended December 31, 2015, which positively impacted revenue and gross margin by $3.7 million and $2.2 million, respectively.
39
Oil and Gas Product Sales
(dollars in thousands)
Years Ended December 31, | Increase (Decrease) | |||||||||
2016 | 2015 | |||||||||
Revenue | $ | 392,384 | $ | 1,089,562 | (64 | )% | ||||
Cost of sales (excluding depreciation and amortization expense) | 365,394 | 925,737 | (61 | )% | ||||||
Gross margin | $ | 26,990 | $ | 163,825 | (84 | )% | ||||
Gross margin percentage | 7 | % | 15 | % | (8 | )% | ||||
Overall, the recent declines in our oil and gas product sales bookings and backlog driven by the market downturn have resulted in revenue decreases in each of the regions where we operate. During the year ended December 31, 2016 compared to the year ended December 31, 2015, revenue decreased by $528.2 million, $101.4 million and $67.6 million in North America, the Eastern Hemisphere and Latin America, respectively. The decrease in revenue in North America was due to decreases of $270.8 million, $212.1 million and $45.3 million in production and processing equipment revenue, compression equipment revenue and installation revenue, respectively. The decrease in the Eastern Hemisphere revenue was due to decreases of $40.4 million, $31.3 million and $29.7 million in installation revenue, compression equipment revenue and production and processing equipment revenue, respectively. The decrease in Latin America revenue was due to decreases of $35.6 million, $24.2 million and $7.8 million in compression equipment revenue, installation revenue and production and processing equipment revenue, respectively. The decreases in gross margin and gross margin percentage were primarily caused by the revenue decrease explained above, continued weakening market conditions resulting in a competitive pricing environment and an increase in under-absorption caused by reduced activities and management’s decision to maintain a certain level of manufacturing capacity. Excluded from cost of sales and recorded to restructuring and other charges in our statements of operations during the year ended December 31, 2015 were non-cash inventory write-downs of $4.5 million primarily related to our decision to exit the manufacturing of cold weather packages, which had historically been performed at an oil and gas product sales facility in North America we decided to close.
Belleli EPC Product Sales
(dollars in thousands)
Years Ended December 31, | Increase (Decrease) | |||||||||
2016 | 2015 | |||||||||
Revenue | $ | 123,856 | $ | 103,221 | 20 | % | ||||
Cost of sales (excluding depreciation and amortization expense) | 126,322 | 134,846 | (6 | )% | ||||||
Gross margin | $ | (2,466 | ) | $ | (31,625 | ) | (92 | )% | ||
Gross margin percentage | (2 | )% | (31 | )% | 29 | % | ||||
The increase in revenue during the year ended December 31, 2016 compared to the year ended December 31, 2015 was primarily driven by schedule delays on significant projects during the prior year that resulted in increases to cost-to-complete estimates on each of the related projects, which adversely impacted revenue recognized under the percentage-of-completion accounting principles in the prior year. The increases in gross margin and gross margin percentage were primarily caused by estimated loss contract provisions of $30.1 million recorded on significant projects during 2015 driven by project execution delays, partially offset by additional costs charged to one project related to a warranty expense accrual of $1.5 million during 2016. See “—Exit of our Belleli Businesses” for further discussion regarding Belleli.
40
Costs and Expenses
(dollars in thousands)
Years Ended December 31, | Increase (Decrease) | |||||||||
2016 | 2015 | |||||||||
Selling, general and administrative | $ | 165,985 | $ | 220,396 | (25 | )% | ||||
Depreciation and amortization | 137,974 | 154,801 | (11 | )% | ||||||
Long-lived asset impairment | 15,146 | 20,788 | (27 | )% | ||||||
Restatement charges | 18,879 | — | N/A | |||||||
Restructuring and other charges | 27,457 | 31,315 | (12 | )% | ||||||
Interest expense | 34,181 | 7,272 | 370 | % | ||||||
Equity in income of non-consolidated affiliates | (10,403 | ) | (15,152 | ) | (31 | )% | ||||
Other (income) expense, net | (13,088 | ) | 35,438 | (137 | )% | |||||
Selling, general and administrative
The decrease in SG&A expense during the year ended December 31, 2016 compared to the year ended December 31, 2015 was driven by our cost reduction plan and included a $15.3 million decrease in compensation and benefits costs in the Eastern Hemisphere and Latin America and a $13.1 million decrease in corporate expenses. SG&A expense as a percentage of revenue was 16% and 12% during the years ended December 31, 2016 and 2015, respectively. The increase in SG&A expense as a percentage of revenue was primarily due to a significant decrease in oil and gas product sales revenue during the year ended December 31, 2016 compared to the year ended December 31, 2015. For the periods prior to the Spin-off, SG&A expense includes expense allocations for certain functions, including allocations of expenses related to executive oversight, accounting, treasury, tax, legal, human resources, procurement and information technology services performed by Archrock on a centralized basis that historically have not been recorded at the segment level. These costs were allocated to us systematically based on specific department function and revenue. Included in SG&A expense during the year ended December 31, 2015 was $46.9 million of allocated corporate expenses incurred by Archrock. The actual costs we would have incurred if we had been a stand-alone public company would depend on multiple factors, including organizational structure and strategic decisions made in various areas, including information technology and infrastructure.
Depreciation and amortization
Depreciation and amortization expense during the year ended December 31, 2016 compared to the year ended December 31, 2015 decreased primarily due to a decrease of $16.5 million in depreciation expense on certain contract operations projects in Latin America primarily related to capitalized installation costs that were fully depreciated during 2016 and 2015. Capitalized installation costs, included, among other things, civil engineering, piping, electrical instrumentation and project management costs.
Long-lived asset impairment
We regularly review the future deployment of our idle compression assets used in our contract operations segment for units that are not of the type, configuration, condition, make or model that are cost efficient to maintain and operate. During the year ended December 31, 2016, we determined that 62 idle compressor units totaling approximately 65,000 horsepower would be retired from the active fleet. The retirement of these units from the active fleet triggered a review of these assets for impairment, and as a result, we recorded a $12.7 million asset impairment to reduce the book value of each unit to its estimated fair value. During the year ended December 31, 2015, we determined that 93 idle compressor units totaling approximately 72,000 horsepower would be retired from the active fleet. The retirement of these units from the active fleet triggered a review of these assets for impairment, and as a result, we recorded a $19.4 million asset impairment to reduce the book value of each unit to its estimated fair value.
As discussed in Note 3 to the Financial Statements, in the first quarter of 2016, we began executing a plan to exit our Belleli EPC business to focus on our core oil and gas businesses. Because we ceased the booking of new orders for the manufacture of tanks for tank farms and the manufacture of evaporators and brine heaters for desalination plants, customer relationship intangible assets related to our Belleli EPC business were assessed to have no future benefit to us. As a result, we recorded a long-lived asset impairment charge of $0.7 million during the year ended December 31, 2016. In addition, the property, plant and equipment of our Belleli EPC business was reviewed for recoverability. As a result, the remaining useful lives of Belleli EPC non-oil and gas property, plant and equipment were reduced to reflect their estimated cessation date.
During the year ended December 31, 2016, we evaluated other assets for impairment and recorded long-lived asset impairments of $1.7 million on these assets.
41
During the first quarter of 2015, we evaluated a long-term note receivable from the purchaser of our Canadian Operations for impairment. This review was triggered by an offer from the purchaser of our Canadian Operations to prepay the note receivable at a discount to its then current book value. The fair value of the note receivable as of March 31, 2015 was based on the amount offered by the purchaser of our Canadian Operations to prepay the note receivable. The difference between the book value of the note receivable at March 31, 2015 and its fair value resulted in the recording of an impairment of long-lived assets of $1.4 million. In April 2015, we accepted the offer to early settle this note receivable.
Restatement charges
As discussed in Note 13 to the Financial Statements, during the first quarter of 2016, our senior management identified errors relating to the application of percentage-of-completion accounting principles to specific Belleli EPC product sales projects. As a result, the Audit Committee of the Company’s Board of Directors initiated an internal investigation, including the use of services of a forensic accounting firm. Management also engaged a consulting firm to assist in accounting analysis and compilation of restatement adjustments. During the year ended December 31, 2016, we incurred $30.1 million of costs associated with the restatement of our financial statements and current SEC investigation, of which $11.2 million of cash was recovered from Archrock in the fourth quarter of 2016 pursuant to the separation and distribution agreement.
Restructuring and other charges
In the second quarter of 2015, we announced a cost reduction plan, primarily focused on workforce reductions and the reorganization of certain facilities. These actions were in response to unfavorable market conditions in North America combined with the impact of lower international activity due to customer budget cuts driven by lower oil prices. During the year ended December 31, 2016, we incurred $23.5 million of restructuring and other charges as a result of this plan, which were primarily related to $19.9 million of employee termination benefits and a $2.9 million charge for the exit of a corporate building under an operating lease. During the year ended December 31, 2015, we incurred $15.6 million of restructuring and other charges as a result of this plan, which were primarily related to $9.6 million of employee termination benefits and $4.0 million of non-cash write-downs of inventory. The non-cash inventory write-downs were the result of our decision to exit the manufacturing of cold weather packages, which had historically been performed at an oil and gas product sales facility in North America we decided to close in 2015. Additionally, we incurred restructuring and other charges associated with the Spin-off. During the year ended December 31, 2016, we incurred $3.9 million of costs associated with the Spin-off, which were primarily related to expenses of $3.1 million for retention awards to certain employees. During the year ended December 31, 2015, we incurred $15.7 million of costs associated with the Spin-off, which were primarily related to non-cash inventory write-downs of $4.7 million, financial advisor fees of $4.6 million paid at the completion of the Spin-off, expenses of $3.1 million for retention awards to certain employees and a one-time cash signing bonus of $2.0 million paid to our new Chief Executive Officer. Non-cash inventory write-downs were primarily related to the decentralization of shared inventory components between Archrock’s North America contract operations business and our international contract operations business. The charges incurred in conjunction with the cost reduction plan and Spin-off are included in restructuring and other charges in our statements of operations. See Note 14 to the Financial Statements for further discussion of these charges.
Interest expense
The increase in interest expense during the year ended December 31, 2016 compared to the year ended December 31, 2015 was primarily due to borrowings under our revolving credit facility and term loan facility (collectively, the “Credit Facility”) that became available on November 3, 2015. During the year ended December 31, 2016, the average daily outstanding borrowings under the Credit Facility were $422.9 million. Prior to the Spin-off, third party debt of Archrock, other than debt attributable to capital leases, was not allocated to us as we were not the legal obligor of the debt and Archrock’s borrowings were not directly attributable to our business.
Equity in income of non-consolidated affiliates
In March 2012, our Venezuelan joint ventures sold their assets to PDVSA Gas. We received installment payments, including an annual charge, of $10.4 million and $15.2 million during the years ended December 31, 2016 and 2015, respectively. As of December 31, 2016, the remaining principal amount due to us was approximately $4 million. Payments we receive from the sale will be recognized as equity in income of non-consolidated affiliates in our statements of operations in the periods such payments are received.
42
Other (income) expense, net
The change in other (income) expense, net, during the year ended December 31, 2016 compared to the year ended December 31, 2015 was primarily due to foreign currency gains, net of losses on foreign currency derivatives, of $5.7 million during the year ended December 31, 2016 compared to foreign currency losses of $35.8 million during the year ended December 31, 2015. Our foreign currency gains and losses included translation gains, net of losses on foreign currency derivatives, of $8.6 million during the year ended December 31, 2016 compared to translation losses of $30.1 million during the year ended December 31, 2015 related to the currency remeasurement of our foreign subsidiaries’ non-functional currency denominated intercompany obligations. Of the foreign currency losses recognized during the year ended December 31, 2015, $29.7 million was attributable to our Brazil subsidiary’s U.S. dollar denominated intercompany obligations and were the result of a currency devaluation in Brazil and increases in our Brazil subsidiary’s intercompany payables during the prior year. The change in other (income) expense, net, was also due to a $4.9 million loss recognized during the prior year on short-term investments related to the purchase of $18.4 million of Argentine government issued U.S. dollar denominated bonds using Argentine pesos.
Income Taxes
(dollars in thousands)
Years Ended December 31, | Increase (Decrease) | |||||||||
2016 | 2015 | |||||||||
Provision for income taxes | $ | 124,760 | $ | 39,546 | 215 | % | ||||
Effective tax rate | (179.2 | )% | 346.3 | % | (525.5 | )% | ||||
For the year ended December 31, 2016, our effective tax rate of (179.2)% was adversely impacted by valuation allowances recorded against U.S. deferred tax assets and activity at our non-U.S. subsidiaries, which included valuation allowances against certain deferred tax assets, foreign currency devaluations and the settlement of a foreign audit. These negative impacts were partially offset by nontaxable Venezuelan joint venture proceeds and a net nontaxable capital contribution related to the Spin-off.
For the year ended December 31, 2015, our effective tax rate of 346.3% was adversely impacted by activity at our non-U.S. subsidiaries, which included valuation allowances recorded against certain net operating losses, foreign currency devaluations, foreign dividend withholding taxes and deemed distributions to the U.S. These negative impacts were partially offset by tax benefits related to claiming the research and development credit (the “R&D Credit”) and nontaxable Venezuelan joint venture proceeds.
Our effective tax rate is affected by recurring items, such as tax rates in foreign jurisdictions and the relative amounts of income we earn, or losses we incur, in those jurisdictions. It is also affected by discrete items that may occur in any given year but are not consistent from year to year. In addition to net state income taxes, the following items had the most significant impact on the difference between our statutory U.S. federal income tax rate of 35.0% and our effective tax rate.
For the year ended December 31, 2016:
• | A $123.9 million increase (178.0% reduction) resulting from valuation allowances primarily recorded against U.S. deferred tax assets and certain deferred tax assets of our subsidiaries in Nigeria and Italy. |
• | A $38.2 million increase (54.9% reduction) resulting primarily from foreign withholding taxes, negative impacts of foreign currency devaluations in Argentina and Mexico, settlement of a Nigeria tax audit and deemed distributions to the U.S. from certain of our non-U.S. subsidiaries. The increase includes a reduction resulting from rate differences between U.S. and foreign jurisdictions primarily related to income we earned in Oman and Mexico where the rates are 12.0% and 30.0%, respectively. |
• | A $9.5 million reduction (13.6% increase) resulting from claiming foreign taxes as credits primarily for foreign withholding taxes. The foreign tax credits are available to offset future payments of U.S. federal income taxes. |
• | A $4.1 million increase (5.8% reduction) resulting from unrecognized tax benefits primarily from additions based on tax positions related to the current year. |
• | A $3.6 million reduction (5.2% increase) due to $10.4 million of nontaxable proceeds from sale of joint venture assets in Venezuela. |
• | A $2.9 million reduction (4.1% increase) primarily due to $11.2 million of cash recovered from Archrock with respect to our restatement charges. Payments between Archrock and us are treated as nontaxable capital contributions or distributions pursuant to the tax matters agreement. |
43
For the year ended December 31, 2015:
• | A $38.1 million (333.2%) increase resulting primarily from foreign withholding taxes, negative impacts of foreign currency devaluations in Argentina and Mexico and deemed distributions to the U.S. from certain of our non-U.S. subsidiaries. The increase includes a reduction resulting from rate differences between U.S. and foreign jurisdictions primarily related to income we earned in Oman, Mexico and Thailand where the rates are 12.0%, 30.0% and 20.0%, respectively. |
• | A $38.3 million (335.2%) increase resulting from valuation allowances primarily recorded against deferred tax assets of our subsidiaries in Brazil, Italy and the Netherlands. |
• | A $24.9 million (218.4%) reduction resulting from claiming the R&D Credit for years 2009 through 2013. The R&D Credits are available to offset future payments of U.S. federal income taxes. |
• | A $17.4 million (152.3%) reduction resulting from claiming foreign taxes as credits primarily for foreign withholding taxes. The foreign tax credits are available to offset future payments of U.S. federal income taxes. |
• | A $6.2 million (54.2%) increase resulting from unrecognized tax benefits primarily related to additions based on tax positions related to 2015. |
• | A $5.3 million (46.5%) reduction due to $15.2 million of nontaxable proceeds from sale of joint venture assets in Venezuela. |
Discontinued Operations
(dollars in thousands)
Years Ended December 31, | Increase (Decrease) | |||||||||
2016 | 2015 | |||||||||
Income (loss) from discontinued operations, net of tax | $ | (33,571 | ) | $ | 54,774 | (161 | )% | |||
Income (loss) from discontinued operations, net of tax, during the years ended December 31, 2016 and 2015 includes our operations in Venezuela that were expropriated in June 2009, including compensation for expropriation and costs associated with our arbitration proceeding, and our Belleli CPE business.
As discussed in Note 3 to the Financial Statements, in August 2012, our Venezuelan subsidiary sold its previously nationalized assets to PDVSA Gas. We received installment payments, including an annual charge, totaling $38.8 million and $56.6 million during the years ended December 31, 2016 and 2015, respectively. As of December 31, 2016, the remaining principal amount due to us was approximately $33 million. We have not recognized amounts payable to us by PDVSA Gas as a receivable and will therefore recognize payments received in the future as income from discontinued operations in the periods such payments are received. The proceeds from the sale of the assets are not subject to Venezuelan national taxes due to an exemption allowed under the Venezuelan Reserve Law applicable to expropriation settlements. In addition, and in connection with the sale, we and the Venezuelan government agreed to waive rights to assert certain claims against each other.
As discussed in Note 3 to the Financial Statements, in the first quarter of 2016, we began executing a plan to exit our Belleli CPE business, which provided engineering, procurement and manufacturing services related to the manufacture of critical process equipment for refinery and petrochemical facilities. We completed the sale of Belleli CPE in August 2016. Our Belleli CPE business was previously included in our former product sales segment. In conjunction with the planned disposition, we recorded impairments of long-lived assets and current assets that totaled $68.8 million during the year ended December 31, 2016. The impairment charges are reflected in income (loss) from discontinued operations, net of tax.
44
The Year Ended December 31, 2015 Compared to the Year Ended December 31, 2014
Contract Operations
(dollars in thousands)
Years Ended December 31, | Increase (Decrease) | |||||||||
2015 | 2014 | |||||||||
Revenue | $ | 469,900 | $ | 493,853 | (5 | )% | ||||
Cost of sales (excluding depreciation and amortization expense) | 172,391 | 185,408 | (7 | )% | ||||||
Gross margin | $ | 297,509 | $ | 308,445 | (4 | )% | ||||
Gross margin percentage | 63 | % | 62 | % | 1 | % | ||||
The decrease in revenue during the year ended December 31, 2015 compared to the year ended December 31, 2014 was primarily due to a $19.9 million decrease in revenue in Brazil primarily related to a project which had little incremental costs that commenced and terminated operations in 2014 partially offset by the start-up of new projects during 2015 and a $7.4 million decrease in revenue in the Eastern Hemisphere primarily driven by a decrease in Nigeria. These decreases were partially offset by a $6.8 million increase in revenue in Mexico primarily driven by contracts that commenced or were expanded in scope in 2014 and 2015. Gross margin decreased during the year ended December 31, 2015 compared to the year ended December 31, 2014 primarily due to the revenue decrease explained above. Gross margin percentage during the year ended December 31, 2015 compared to the year ended December 31, 2014 increased primarily due to a reduction in operating expenses in Latin America driven by our cost reduction plan during 2015 and the devaluation of the Brazilian Real in 2015 which had a positive impact on gross margin percentage, partially offset by the revenue decrease explained above. While our gross margin during the year ended December 31, 2014 benefited from the start-up of a Brazilian project, our contract operations business is capital intensive, and as such, we did have additional costs in the form of depreciation expense, which is excluded from gross margin. Additionally, excluded from cost of sales and recorded to restructuring and other charges in our statements of operations during the year ended December 31, 2015 were non-cash inventory write-downs of $4.2 million associated with the Spin-off primarily related to the decentralization of shared inventory components between Archrock’s North America contract operations business and our international contract operations business.
Aftermarket Services
(dollars in thousands)
Years Ended December 31, | Increase (Decrease) | |||||||||
2015 | 2014 | |||||||||
Revenue | $ | 127,802 | $ | 162,724 | (21 | )% | ||||
Cost of sales (excluding depreciation and amortization expense) | 91,233 | 120,181 | (24 | )% | ||||||
Gross margin | $ | 36,569 | $ | 42,543 | (14 | )% | ||||
Gross margin percentage | 29 | % | 26 | % | 3 | % | ||||
The decrease in revenue during the year ended December 31, 2015 compared to the year ended December 31, 2014 was primarily due to decreases in revenue in the Eastern Hemisphere and Latin America of $24.6 million and $10.8 million, respectively. The decrease in revenue in the Eastern Hemisphere was primarily caused by a decrease in revenue of $9.3 million as a result of the sale of our Australian business in December 2014, an $8.0 million decrease in revenue in Gabon driven by our cessation of activities in the Gabon market in 2015 and a decrease of $4.4 million in part sales in China. The decrease in revenue in Latin America was primarily caused by a decrease of $8.3 million in Bolivia driven by the termination of parts, services and maintenance contracts during 2015. Gross margin decreased during the year ended December 31, 2015 compared to the year ended December 31, 2014 primarily due to decreases in gross margin in Latin America and the Eastern Hemisphere of $3.0 million and $2.7 million, respectively. Gross margin percentage during the year ended December 31, 2015 compared to the year ended December 31, 2014 increased primarily due to the receipt of a settlement from a customer in Gabon during the year ended December 31, 2015, which positively impacted revenue and gross margin by $3.7 million and $2.2 million, respectively, and a decrease of $0.8 million in expense for inventory reserves.
45
Oil and Gas Product Sales
(dollars in thousands)
Years Ended December 31, | Increase (Decrease) | |||||||||
2015 | 2014 | |||||||||
Revenue | $ | 1,089,562 | $ | 1,329,607 | (18 | )% | ||||
Cost of sales (excluding depreciation and amortization expense) | 925,737 | 1,089,418 | (15 | )% | ||||||
Gross margin | $ | 163,825 | $ | 240,189 | (32 | )% | ||||
Gross margin percentage | 15 | % | 18 | % | (3 | )% | ||||
The decrease in revenue during the year ended December 31, 2015 compared to the year ended December 31, 2014 was due to a decrease in revenue in North America and the Eastern Hemisphere of $194.0 million and $82.3 million, respectively, partially offset by higher revenue in Latin America of $36.3 million. The decrease in revenue in North America was due to decreases of $109.2 million and $92.6 million in compression equipment revenue and production and processing equipment revenue, respectively, partially offset by an increase of $7.8 million in installation revenue. The decrease in the Eastern Hemisphere revenue was due to decreases of $33.7 million, $28.6 million and $20.0 million in compression equipment revenue, installation revenue and production and processing equipment revenue, respectively. The increase in Latin America revenue was primarily due to increases of $25.9 million and $10.1 million in compression equipment revenue and installation revenue, respectively. The decreases in gross margin and gross margin percentage were primarily caused by the revenue decrease explained above, weakening market conditions resulting in lower bookings at more competitive prices in North America and an increase of $3.2 million in expense for inventory reserves in North America. These decreases were partially offset by costs charged to one project in North America related to a warranty expense accrual of approximately $7.0 million during the year ended December 31, 2014. Excluded from cost of sales and recorded to restructuring and other charges in our statements of operations during the year ended December 31, 2015 were non-cash inventory write-downs of $4.5 million primarily related to our decision to exit the manufacturing of cold weather packages, which had historically been performed at a product sales facility in North America we decided to close.
Belleli EPC Product Sales
(dollars in thousands)
Years Ended December 31, | Increase (Decrease) | |||||||||
2015 | 2014 | |||||||||
Revenue | $ | 103,221 | $ | 115,479 | (11 | )% | ||||
Cost of sales (excluding depreciation and amortization expense) | 134,846 | 148,870 | (9 | )% | ||||||
Gross margin | $ | (31,625 | ) | $ | (33,391 | ) | (5 | )% | ||
Gross margin percentage | (31 | )% | (29 | )% | (2 | )% | ||||
The decrease in revenue during the year ended December 31, 2015 compared to the year ended December 31, 2014 was primarily driven by schedule delays on significant projects during 2015 that resulted in increases to cost-to-complete estimates on each related projects, which adversely impacted revenue recognized under the percentage-of-completion accounting principles in 2015. Project execution delays on significant projects during the years ended December 31, 2015 and 2014 resulted in estimated loss contract provisions of $30.1 million and $36.6 million, respectively, which negatively impacted gross margin percentage for each period. See “—Exit of our Belleli Businesses” for further discussion regarding Belleli.
46
Costs and Expenses
(dollars in thousands)
Years Ended December 31, | Increase (Decrease) | |||||||||
2015 | 2014 | |||||||||
Selling, general and administrative | $ | 220,396 | $ | 263,170 | (16 | )% | ||||
Depreciation and amortization | 154,801 | 170,088 | (9 | )% | ||||||
Long-lived asset impairment | 20,788 | 3,851 | 440 | % | ||||||
Restructuring and other charges | 31,315 | — | N/A | |||||||
Interest expense | 7,272 | 1,878 | 287 | % | ||||||
Equity in income of non-consolidated affiliates | (15,152 | ) | (14,553 | ) | 4 | % | ||||
Other (income) expense, net | 35,438 | 6,201 | 471 | % | ||||||
Selling, general and administrative
For the periods prior to the Spin-off, SG&A expense includes expense allocations for certain functions, including allocations of expenses related to executive oversight, accounting, treasury, tax, legal, human resources, procurement and information technology services performed by Archrock on a centralized basis that historically have not been recorded at the segment level. These costs were allocated to us systematically based on specific department function and revenue. Included in SG&A expense during the years ended December 31, 2015 and 2014 were corporate expenses incurred by Archrock prior to the Spin-off. The actual costs we would have incurred if we had been a stand-alone public company would depend on multiple factors, including organizational structure and strategic decisions made in various areas, including information technology and infrastructure. The decrease in SG&A expense during the year ended December 31, 2015 compared to the year ended December 31, 2014 was attributable to an $11.2 million decrease in compensation and benefits costs in the Eastern Hemisphere and Latin America primarily driven by our cost reduction plan during 2015, a $9.8 million decrease in selling expenses relating to our product sales business in North America, a $6.2 million decrease in corporate expenses and a $3.1 million decrease in non-income-based local taxes in Brazil. SG&A expense as a percentage of revenue was 12% and 13% during the years ended December 31, 2015 and 2014, respectively.
Depreciation and amortization
Depreciation and amortization expense during the year ended December 31, 2015 compared to the year ended December 31, 2014 decreased primarily due to $26.4 million in depreciation of installation costs recognized during the year ended December 31, 2014 on a contract operations project in Brazil that commenced and terminated operations in 2014. Prior to the start-up of this project, we capitalized $1.9 million and $24.5 million of installation costs during the years ended December 31, 2014 and 2013, respectively. In late 2015, we received a customer notice of early termination on a contact operations project in the Eastern Hemisphere specifying an end date of January 2016. The project had been operating since the third quarter of 2009. As a result, we recorded additional depreciation expense of $10.8 million in the fourth quarter of 2015 primarily related to capitalized installation costs. Capitalized installation costs, included, among other things, civil engineering, piping, electrical instrumentation and project management costs.
Long-lived asset impairment
We regularly review the future deployment of our idle compression assets used in our contract operations segment for units that are not of the type, configuration, condition, make or model that are cost efficient to maintain and operate. During the year ended December 31, 2015, we determined that 93 idle compressor units totaling approximately 72,000 horsepower would be retired from the active fleet. The retirement of these units from the active fleet triggered a review of these assets for impairment, and as a result, we recorded a $19.4 million asset impairment to reduce the book value of each unit to its estimated fair value. During the year ended December 31, 2014, we determined that 20 idle compressor units totaling approximately 18,000 horsepower would be retired from the active fleet, and as a result, we performed an impairment review and recorded a $2.8 million asset impairment to reduce the book value of each unit to its estimated fair value. In connection with our fleet review during the year ended December 31, 2014, we evaluated for impairment idle units that had been culled from our fleet in prior years and were available for sale. Based upon that review, we reduced the expected proceeds from disposition for certain of the remaining units. This resulted in an additional impairment of $1.1 million to reduce the book value of each unit to its estimated fair value during the year ended December 31, 2014.
47
During the first quarter of 2015, we evaluated a long-term note receivable from the purchaser of our Canadian Operations for impairment. This review was triggered by an offer from the purchaser of our Canadian Operations to prepay the note receivable at a discount to its then current book value. The fair value of the note receivable as of March 31, 2015 was based on the amount offered by the purchaser of our Canadian Operations to prepay the note receivable. The difference between the book value of the note receivable at March 31, 2015 and its fair value resulted in the recording of an impairment of long-lived assets of $1.4 million during the year ended December 31, 2015. In April 2015, we accepted the offer to early settle this note receivable.
Restructuring and other charges
In the second quarter of 2015, we announced a cost reduction plan, primarily focused on workforce reductions and the reorganization of certain product sales facilities. These actions were in response to market conditions in North America combined with the impact of lower international activity due to customer budget cuts driven by lower oil prices. As a result of this plan, during the year ended December 31, 2015, we incurred $15.6 million of restructuring and other charges, of which $9.6 million related to termination benefits, $4.0 million related to non-cash write-downs of inventory and $1.9 million related to consulting fees. The non-cash inventory write-downs were the result of our decision to exit the manufacturing of cold weather packages, which had historically been performed at a product sales facility in North America we decided to close. Additionally, during the year ended December 31, 2015, we incurred $15.7 million of costs associated with the Spin-off which were related to non-cash inventory write-downs of $4.7 million, financial advisor fees of $4.6 million paid at the completion of the Spin-off, expenses of $3.1 million for retention awards to certain employees, a one-time cash signing bonus paid to our new Chief Executive Officer of $2.0 million and costs to start-up certain stand-alone functions of $1.3 million. Non-cash inventory write-downs were primarily related to the decentralization of shared inventory components between Archrock’s North America contract operations business and our international contract operations business. The charges incurred in conjunction with the cost reduction plan and Spin-off are included in restructuring and other charges in our statements of operations. See Note 14 to the Financial Statements for further discussion of these charges.
Interest expense
The increase in interest expense during the year ended December 31, 2015 compared to the year ended December 31, 2014 was primarily due to borrowings under our Credit Facility that became available on November 3, 2015. During the period between November 3, 2015 and December 31, 2015, the average daily outstanding borrowings under the Credit Facility were $557.0 million. Prior to the Spin-off, third party debt of Archrock, other than debt attributable to capital leases, was not allocated to us as we were not the legal obligor of the debt and Archrock’s borrowings were not directly attributable to our business.
Equity in income of non-consolidated affiliates
In March 2012, our Venezuelan joint ventures sold their assets to PDVSA Gas. We received installment payments, including an annual charge, of $15.2 million and $14.7 million during the years ended December 31, 2015 and 2014, respectively. Payments we receive from the sale will be recognized as equity in income of non-consolidated affiliates in our statements of operations in the periods such payments are received.
Other (income) expense, net
The change in other (income) expense, net, was primarily due to foreign currency losses of $35.8 million and $7.8 million during the years ended December 31, 2015 and 2014, respectively. Our foreign currency losses included translation losses of $30.1 million and $3.6 million during the years ended December 31, 2015 and 2014, respectively, related to the currency remeasurement of our foreign subsidiaries’ non-functional currency denominated intercompany obligations. Of the foreign currency losses recognized during the year ended December 31, 2015, $29.7 million was attributable to our Brazil subsidiary’s U.S. dollar denominated intercompany obligations and were the result of a currency devaluation in Brazil and increases in our Brazil subsidiary’s intercompany payables during 2015.
48
Income Taxes
(dollars in thousands)
Years Ended December 31, | Increase (Decrease) | |||||||||
2015 | 2014 | |||||||||
Provision for income taxes | $ | 39,546 | $ | 79,042 | (50 | )% | ||||
Effective tax rate | 346.3 | % | 62.2 | % | 284.1 | % | ||||
For the year ended December 31, 2015, our effective tax rate of 346.3% was adversely impacted by activity at our non-U.S. subsidiaries, which included valuation allowances recorded against certain net operating losses, foreign currency devaluations, foreign dividend withholding taxes and deemed distributions to the U.S. These negative impacts were partially offset by tax benefits related to claiming the research and development credit (the “R&D Credit”) and nontaxable Venezuelan joint venture proceeds.
Our effective tax rate is affected by recurring items, such as tax rates in foreign jurisdictions and the relative amounts of income we earn, or losses we incur, in those jurisdictions. It is also affected by discrete items that may occur in any given year but are not consistent from year to year. In addition to net state income taxes, the following items had the most significant impact on the difference between our statutory U.S. federal income tax rate of 35.0% and our effective tax rate.
For the year ended December 31, 2015:
• | A $38.1 million (333.2%) increase resulting primarily from foreign withholding taxes, negative impacts of foreign currency devaluations in Argentina and Mexico and deemed distributions to the U.S. from certain of our non-U.S. subsidiaries. The increase includes a reduction resulting from rate differences between U.S. and foreign jurisdictions primarily related to income we earned in Oman, Mexico and Thailand where the rates are 12.0%, 30.0% and 20.0%, respectively. |
• | A $38.3 million (335.2%) increase resulting from valuation allowances primarily recorded against deferred tax assets of our subsidiaries in Brazil, Italy and the Netherlands. |
• | A $24.9 million (218.4%) reduction resulting from claiming the R&D Credit for years 2009 through 2013. The R&D Credits are available to offset future payments of U.S. federal income taxes. |
• | A $17.4 million (152.3%) reduction resulting from claiming foreign taxes as credits primarily for foreign withholding taxes. The foreign tax credits are available to offset future payments of U.S. federal income taxes. |
• | A $6.2 million (54.2%) increase resulting from unrecognized tax benefits primarily related to additions based on tax positions related to 2015. |
• | A $5.3 million (46.5%) reduction due to $15.2 million of nontaxable proceeds from sale of joint venture assets in Venezuela. |
For the year ended December 31, 2014:
• | A $33.0 million (25.9%) increase resulting primarily from foreign withholding taxes, decreases in available net operating losses mostly related to our subsidiaries in the Netherlands and negative impacts of foreign currency devaluations in Argentina and Mexico. The increase includes a reduction resulting from rate differences between U.S. and foreign jurisdictions primarily related to income we earned in Oman, Mexico and Thailand where the rates are 12.0%, 30.0% and 20.0%, respectively. |
• | A $17.8 million (14.0%) increase resulting from valuation allowances primarily recorded against deferred tax assets of our subsidiaries in Brazil, Italy and the Netherlands. The increase includes a reduction in valuation allowances related to decreases in available net operating losses mostly related to our subsidiaries in the Netherlands. |
• | A $10.9 million (8.6%) reduction resulting from claiming foreign taxes as credits primarily for foreign withholding taxes. The foreign tax credits are available to offset future payments of U.S. federal income taxes. |
• | A $5.2 million (4.1%) reduction due to $14.7 million of nontaxable proceeds from sale of joint venture assets in Venezuela. |
49
Discontinued Operations
(dollars in thousands)
Years Ended December 31, | Increase (Decrease) | |||||||||
2015 | 2014 | |||||||||
Income from discontinued operations, net of tax | $ | 54,774 | $ | 67,183 | (18 | )% | ||||
Income from discontinued operations, net of tax, during the years ended December 31, 2015 and 2014 includes our operations in Venezuela that were expropriated in June 2009, including compensation for expropriation and costs associated with our arbitration proceeding, and our Belleli CPE business.
As discussed in Note 3 to the Financial Statements, in August 2012, our Venezuelan subsidiary sold its previously nationalized assets to PDVSA Gas. We received installment payments, including an annual charge, totaling $56.6 million and $72.6 million during the years ended December 31, 2015 and 2014, respectively. The proceeds from the sale of the assets are not subject to Venezuelan national taxes due to an exemption allowed under the Venezuelan Reserve Law applicable to expropriation settlements. In addition, and in connection with the sale, we and the Venezuelan government agreed to waive rights to assert certain claims against each other.
Liquidity and Capital Resources
Our unrestricted cash balance was $35.7 million at December 31, 2016 compared to $29.0 million at December 31, 2015. Working capital decreased to $177.8 million at December 31, 2016 from $408.5 million at December 31, 2015. The decrease in working capital was primarily due to a concerted effort to reduce working capital levels and a decrease in oil and gas product sales activity. The decrease in working capital included decreases in accounts receivable, inventory, costs and estimated earnings in excess of billings on uncompleted contracts and current assets associated with discontinued operations, partially offset by a decrease in current liabilities associated with discontinued operations. The decrease in accounts receivable was primarily driven by lower oil and gas product sales activity in North America and the timing of payments received from customers during the current year. The decreases in current assets and liabilities associated with discontinued operations were primarily due to the sale of Belleli CPE in August 2016. The decrease in inventory was primarily driven by a decrease in raw materials and finished goods largely resulting from lower oil and gas product sales activity in North America. The decrease in costs and estimated earnings in excess of billings on uncompleted contracts was primarily driven by lower oil and gas product sales activity in North America and the timing of billings on Belleli EPC product sales projects.
Our cash flows from operating, investing and financing activities, as reflected in the statements of cash flows, are summarized in the table below (in thousands):
Years Ended December 31, | |||||||
2016 | 2015 | ||||||
Net cash provided by (used in) continuing operations: | |||||||
Operating activities | $ | 265,702 | $ | 130,915 | |||
Investing activities | (60,998 | ) | (129,611 | ) | |||
Financing activities | (230,747 | ) | (55,002 | ) | |||
Effect of exchange rate changes on cash and cash equivalents | (1,832 | ) | (3,716 | ) | |||
Discontinued operations | 34,521 | 47,085 | |||||
Net change in cash and cash equivalents | $ | 6,646 | $ | (10,329 | ) | ||
Operating Activities. The increase in net cash provided by operating activities during the year ended December 31, 2016 compared to the year ended December 31, 2015 was primarily attributable to working capital decreases in the current year compared to working capital increases in the prior year and lower SG&A expense during the current year, partially offset by a decrease in gross margin in our oil and gas product sales and contract operations segments and an increase in interest paid. Working capital changes during the year ended December 31, 2016 included a decrease of $135.9 million in accounts receivable, a decrease of $49.7 million in inventory, a decrease of $37.6 million in costs and estimated earnings versus billings on uncompleted contracts. Working capital changes during the year ended December 31, 2015 included a decrease of $82.7 million in accounts payable and other liabilities and a decrease of $80.4 million in inventory.
50
Investing Activities. The decrease in net cash used in investing activities during the year ended December 31, 2016 compared to the year ended December 31, 2015 was primarily attributable to an $82.4 million decrease in capital expenditures, partially offset by $5.4 million of net proceeds received from the settlement of our outstanding note receivable for the sale of our Canadian Operations in the prior year, a $4.8 million decrease in cash payments received from the sale of our Venezuelan joint ventures’ previously nationalized assets and a $3.8 million decrease in proceeds from the sale of property, plant and equipment. The decrease in capital expenditures was primarily driven by installation costs incurred during the year ended December 31, 2015 on contract operations projects in Brazil and Bolivia that began operations during the second half of 2015 and first quarter of 2016, respectively, and a decrease in maintenance capital expenditures.
Financing Activities. The increase in net cash used in financing activities during the year ended December 31, 2016 compared to the year ended December 31, 2015 was primarily attributable to net repayments of $179.5 million on our Credit Facility during the current year, a transfer of cash during the current year of $49.2 million to Archrock pursuant to the separation and distribution agreement, partially offset by net distributions to parent of $39.0 million and $13.3 million in payments of debt issuance costs related to the Credit Facility during the year ended December 31, 2015. The transfer of cash to Archrock during the year ended December 31, 2016 was triggered by our receipt of payments from PDVSA Gas in respect of the sale of our and our joint ventures’ previously nationalized assets. Additionally, during the year ended December 31, 2015, we transferred $532.6 million of net proceeds from borrowings under the Credit Facility to Archrock pursuant to the separation and distribution agreement.
Discontinued Operations. The decrease in net cash provided by discontinued operations during the year ended December 31, 2016 compared to year ended December 31, 2015 was primarily attributable to $17.8 million decrease in proceeds received from the sale of our Venezuelan subsidiary’s assets to PDVSA Gas, partially offset by cash proceeds of $5.5 million received from the sale of our Belleli CPE business in August 2016.
Capital Requirements. Our contract operations business is capital intensive, requiring significant investment to maintain and upgrade existing operations. Our capital spending is primarily dependent on the demand for our contract operations services and the availability of the type of equipment required for us to render those contract operations services to our customers. Our capital requirements have consisted primarily of, and we anticipate will continue to consist of, the following:
• | growth capital expenditures, which are made to expand or to replace partially or fully depreciated assets or to expand the operating capacity or revenue generating capabilities of existing or new assets, whether through construction, acquisition or modification; and |
• | maintenance capital expenditures, which are made to maintain the existing operating capacity of our assets and related cash flows further extending the useful lives of the assets. |
The majority of our growth capital expenditures are related to the acquisition cost of new compressor units and processing and treating equipment that we add to our contract operations fleet and installation costs on integrated projects. In addition, growth capital expenditures can include the upgrading of major components on an existing compressor unit where the current configuration of the compressor unit is no longer in demand and the compressor unit is not likely to return to an operating status without the capital expenditures. These latter expenditures substantially modify the operating parameters of the compressor unit such that it can be used in applications for which it previously was not suited. Maintenance capital expenditures are related to major overhauls of significant components of a compressor unit, such as the engine, compressor and cooler, that return the components to a “like new” condition, but do not modify the applications for which the compressor unit was designed.
Growth capital expenditures were $53.0 million, $105.2 million and $97.9 million during the years ended December 31, 2016, 2015 and 2014, respectively. The decrease in growth capital expenditures during the year ended December 31, 2016 compared to the year ended December 31, 2015 was primarily due to a decrease in installation expenditures on integrated projects in Bolivia and Brazil. The increase in growth capital expenditures during the year ended December 31, 2015 compared to the year ended December 31, 2014 was primarily due to an increase in installation expenditures on integrated projects in Bolivia and Brazil during 2015, partially offset by investments in new compression equipment in Latin America in 2014 and installation expenditures on integrated projects in Brazil and Mexico during 2014.
51
Maintenance capital expenditures were $14.4 million, $27.3 million and $24.4 million during the years ended December 31, 2016, 2015 and 2014, respectively. The decrease in maintenance capital expenditures during the year ended December 31, 2016 compared to the year ended December 31, 2015 was primarily due to delayed discretionary spending as a result of the market downturn. Historically, maintenance capital expenditures have remained relatively flat from year to year primarily as a result of routine scheduled overhaul activities. We intend to grow our business both organically and through third-party acquisitions. If we are successful in growing our business in the future, we would expect our maintenance capital expenditures to increase over the long term.
We generally invest funds necessary to manufacture contract operations fleet additions when our idle equipment cannot be reconfigured to economically fulfill a project’s requirements and the new equipment expenditure is expected to generate economic returns over its expected useful life that exceeds our targeted return on capital. We currently plan to spend approximately $150 million to $180 million in capital expenditures during 2017, including (1) approximately $125 million to $145 million on contract operations growth capital expenditures and (2) approximately $15 million to $20 million on equipment maintenance capital related to our contract operations business.
Long-Term Debt. On July 10, 2015, we and our wholly owned subsidiary, EESLP, entered into a $750.0 million credit agreement (the “Credit Agreement”) with Wells Fargo, as the administrative agent, and various financial institutions as lenders. On October 5, 2015, the parties amended and restated the Credit Agreement to provide for a $925.0 million credit facility, consisting of a $680.0 million revolving credit facility and a $245.0 million term loan facility (collectively, the “Credit Facility”). The Credit Facility became available to us on November 3, 2015 (referred to as the “Initial Availability Date”). On November 3, 2015, EESLP incurred approximately $300.0 million of indebtedness under the revolving credit facility and $245.0 million of indebtedness under the term loan facility. Pursuant to the separation and distribution agreement with Archrock and certain of our and Archrock’s respective affiliates, on November 3, 2015, EESLP transferred $532.6 million of net proceeds from borrowings under the Credit Facility to Archrock to allow it to repay a portion of its indebtedness in connection with the Spin-off. In accordance with the Credit Agreement, we are required to repay borrowings outstanding under the term loan facility on each anniversary of the Initial Availability Date in an amount equal to the lesser of (i) $12.3 million and (ii) the outstanding principal balance of the term loan facility. In November 2016, we repaid $12.3 million of borrowings outstanding under the term loan facility. The principal amount of $232.8 million due in November 2017 under the term loan facility is classified as long-term in our balance sheet at December 31, 2016 because we have the intent and ability to refinance the current principal amount due with borrowings under our existing revolving credit facility. On April 22, 2016, June 17, 2016, August 24, 2016 and November 22, 2016, we and our wholly owned subsidiary, EESLP, entered into amendments to the Credit Agreement with Wells Fargo, as the administrative agent, and various financial institutions as lenders. See Note 10 to the Financial Statements for further discussion regarding these amendments.
During the year ended December 31, 2016, the average daily borrowings under the Credit Facility were $422.9 million. During the period between November 3, 2015 and December 31, 2015, the average daily borrowings under the Credit Facility were $557.0 million. The weighted average annual interest rate on outstanding borrowings under the revolving credit facility at December 31, 2016 and 2015 was 5.0% and 3.1%, respectively. The annual interest rate on the outstanding balance of the term loan facility at December 31, 2016 and 2015 was 6.8%.
As of December 31, 2016, we had $118.0 million in outstanding borrowings and $57.1 million in outstanding letters of credit under our revolving credit facility. At December 31, 2016, taking into account guarantees through letters of credit, we had undrawn capacity of $504.9 million under our revolving credit facility. Our Credit Agreement limits our Total Debt (as defined in the Credit Agreement) to EBITDA (as defined in the Credit Agreement) ratio on the last day of the fiscal quarter to not greater than 3.75 to 1.0 (which will increase to 4.50 to 1.0 following the completion of a qualified capital raise). As a result of this limitation, $226.9 million of the $504.9 million of undrawn capacity under our revolving credit facility was available for additional borrowings as of December 31, 2016. Because this limitation considers all of our outstanding debt obligations, the additional borrowings available to us are in excess of borrowings needed under our revolving credit facility to refinance the current principal amount due under the term loan facility.
We are required to prepay borrowings outstanding under the term loan facility with the net proceeds of certain asset sales, equity issuances, debt incurrences and other events (subject to, in certain circumstances, our right to reinvest the proceeds within a specified period). In addition, if the total leverage ratio (as defined in the Credit Agreement) as of the last day in any fiscal year is greater than 2.50 to 1.00, we are required to prepay borrowings outstanding under the term loan facility with a portion of Excess Cash Flow (as defined in the Credit Agreement) for that fiscal year equal to (a) 50% of Excess Cash Flow if the total leverage ratio is greater than 3.00 to 1.00 or (b) 25% of Excess Cash Flow if the total leverage ratio is greater than 2.50 to 1.00 but less than or equal to 3.00 to 1.00.
52
The Credit Agreement contains various covenants with which we, EESLP and our respective restricted subsidiaries must comply, including, but not limited to, limitations on the incurrence of indebtedness, investments, liens on assets, repurchasing equity, making distributions, transactions with affiliates, mergers, consolidations, dispositions of assets and other provisions customary in similar types of agreements. We are required to maintain, on a consolidated basis, a minimum interest coverage ratio (as defined in the Credit Agreement) of 2.25 to 1.00; a maximum total leverage ratio (as defined in the Credit Agreement) of 3.75 to 1.00 prior to the completion of a qualified capital raise and 4.50 to 1.00 thereafter; and, following the completion of a qualified capital raise, a maximum senior secured leverage ratio (as defined in the Credit Agreement) of 2.75 to 1.00. As of December 31, 2016, Exterran Corporation maintained a 5.5 to 1.0 interest coverage ratio, a 2.3 to 1.0 total leverage ratio and a 2.3 to 1.0 senior secured leverage ratio. As of December 31, 2016, we were in compliance with all financial covenants under the Credit Agreement.
We may from time to time seek to retire or purchase our outstanding debt through cash purchases and/or exchanges for equity securities, in open market purchases, privately negotiated transactions or otherwise. Such repurchases or exchanges, if any, will depend on prevailing market conditions, our liquidity requirements, contractual restrictions and other factors. The amounts involved may be material.
Historically, we have financed capital expenditures primarily with net cash provided by operating activities. Our ability to access the capital markets may be restricted at a time when we would like, or need, to do so, which could have an adverse impact on our ability to maintain our operations and to grow. If any of our lenders become unable to perform their obligations under our Credit Facility, our borrowing capacity under our revolving credit facility could be reduced. Inability to borrow additional amounts under our revolving credit facility could limit our ability to fund our future growth and operations. Based on current market conditions, we expect that net cash provided by operating activities and borrowings under our revolving credit facility will be sufficient to finance our operating expenditures, capital expenditures and scheduled interest and debt repayments through December 31, 2017; however, to the extent they are not, we may seek additional debt or equity financing. Additionally, our term loan facility matures in November 2017. At or prior to the time the term loan matures, we will be required to refinance it and may enter into one or more new facilities, which could result in higher borrowing costs, issue equity, which would dilute our existing shareholders, repay with borrowings under our revolving credit facility, issue bonds with restrictive covenants that could impact our business flexibility or otherwise raise the funds necessary to repay the outstanding principal amount under the term loan.
Contingencies to Archrock. Pursuant to the separation and distribution agreement, EESLP contributed to a subsidiary of Archrock the right to receive payments based on a notional amount corresponding to payments received by our subsidiaries from PDVSA Gas in respect of the sale of our and our joint ventures’ previously nationalized assets promptly after such amounts are collected by our subsidiaries until Archrock’s subsidiary has received an aggregate amount of such payments up to the lesser of (i) $125.8 million, plus the aggregate amount of all reimbursable expenses incurred by Archrock and its subsidiaries in connection with recovering any PDVSA Gas default installment payments following the completion of the Spin-off or (ii) $150.0 million. Our balance sheets do not reflect this contingent liability to Archrock or the amount payable to us by PDVSA Gas as a receivable. Pursuant to the separation and distribution agreement, we transferred cash of $49.2 million to Archrock during the year ended December 31, 2016. The transfer of cash was recognized as a reduction to additional paid-in capital in our financial statements. As of December 31, 2016, the remaining principal amount due to us from PDVSA Gas in respect of the sale of our and our joint ventures’ previously nationalized assets was approximately $37 million.
Pursuant to the separation and distribution agreement, EESLP (in the case of debt offerings) or Exterran Corporation (in the case of equity issuances) will use its commercially reasonable efforts to complete one or more unsecured debt offerings or equity issuances resulting in aggregate gross cash proceeds of at least $250.0 million on the terms described in the Credit Agreement (such transaction, a “qualified capital raise”) on or before the maturity date of our term loan facility. In connection with the Spin-off, EESLP contributed to a subsidiary of Archrock the right to receive, promptly following the occurrence of a qualified capital raise, a $25.0 million cash payment.
Unrestricted Cash. Of our $35.7 million unrestricted cash balance at December 31, 2016, $19.4 million was held by our non-U.S. subsidiaries. We have not provided for U.S. federal income taxes on indefinitely (or permanently) reinvested cumulative earnings of approximately $545.5 million generated by our non-U.S. subsidiaries as of December 31, 2016. In the event of a distribution of earnings to the U.S. in the form of dividends, we may be subject to both foreign withholding taxes and U.S. federal income taxes net of allowable foreign tax credits. We do not believe that the cash held by our non-U.S. subsidiaries has an adverse impact on our liquidity because we expect that the cash we generate in the U.S. and the available borrowing capacity under our revolving credit facility, as well as the repayment of intercompany liabilities from our non-U.S. subsidiaries, will be sufficient to fund the cash needs of our U.S. operations for the foreseeable future.
53
Dividends. We do not currently anticipate paying cash dividends on our common stock. We currently intend to retain our future earnings to support the growth and development of our business. The declaration of any future cash dividends and, if declared, the amount of any such dividends, will be subject to our financial condition, earnings, capital requirements, financial covenants, applicable law and other factors our board of directors deems relevant.
Contractual Obligations. The following table summarizes our cash contractual obligations as of December 31, 2016 and the effect such obligations are expected to have on our liquidity and cash flow in future periods (in thousands):
Total | 2017 | 2018-2019 | 2020-2021 | Thereafter | |||||||||||||||
Long-term debt (1): | |||||||||||||||||||
Revolving credit facility due November 2020 | $ | 118,000 | $ | — | $ | — | $ | 118,000 | $ | — | |||||||||
Term loan facility due November 2017 (2) | 232,750 | 232,750 | — | — | — | ||||||||||||||
Other | 583 | — | 506 | 77 | — | ||||||||||||||
Total long-term debt | 351,333 | 232,750 | 506 | 118,077 | — | ||||||||||||||
Interest on long-term debt (3) | 54,227 | 25,636 | 20,127 | 8,464 | — | ||||||||||||||
Purchase commitments | 119,734 | 118,990 | 744 | — | — | ||||||||||||||
Facilities and other operating leases | 27,541 | 6,176 | 5,956 | 3,465 | 11,944 | ||||||||||||||
Total contractual obligations | $ | 552,835 | $ | 383,552 | $ | 27,333 | $ | 130,006 | $ | 11,944 | |||||||||
(1) | For more information on our long-term debt, see Note 10 to the Financial Statements. |
(2) | The principal amount of $232.8 million due in November 2017 under the term loan facility is classified as long-term in our balance sheet at December 31, 2016 because we have the intent and ability to refinance the current principal amount due with borrowings under our existing revolving credit facility. Amounts represent the full face value of the term loan facility and are not reduced by the aggregate unamortized debt financing costs of $2.4 million as of December 31, 2016. |
(3) | Interest amounts were calculated using interest rates in effect as of December 31, 2016. |
At December 31, 2016, $18.2 million of unrecognized tax benefits (including discontinued operations) have been recorded as liabilities in accordance with the accounting standard for income taxes related to uncertain tax positions, and we are uncertain as to if or when such amounts may be settled. Related to these unrecognized tax benefits, we have also recorded a liability for potential penalties and interest (including discontinued operations) of $3.0 million.
Indemnifications. In conjunction with, and effective as of the completion of, the Spin-off, we entered into the separation and distribution agreement with Archrock, which governs, among other things, the treatment between Archrock and us of aspects relating to indemnification, insurance, confidentiality and cooperation. Generally, the separation and distribution agreement provides for cross-indemnities principally designed to place financial responsibility for the obligations and liabilities of our business with us and financial responsibility for the obligations and liabilities of Archrock’s business with Archrock. Pursuant to the agreement, we and Archrock will generally release the other party from all claims arising prior to the Spin-off that relate to the other party’s business, subject to certain exceptions. Additionally, in conjunction with, and effective as of the completion of, the Spin-off, we entered into the tax matters agreement with Archrock. Under the tax matters agreement and subject to certain exceptions, we are generally liable for, and indemnify Archrock against, taxes attributable to our business, and Archrock is generally liable for, and indemnify us against, all taxes attributable to its business. We are generally liable for, and indemnify Archrock against, 50% of certain taxes that are not clearly attributable to our business or Archrock’s business. Any payment made by us to Archrock, or by Archrock to us, is treated by all parties for tax purposes as a nontaxable distribution or capital contribution, respectively, made immediately prior to the Spin-off.
Off-Balance Sheet Arrangements
We have no material off-balance sheet arrangements.
Effects of Inflation
Our revenues and results of operations have not been materially impacted by inflation in the past three fiscal years.
54
Critical Accounting Policies, Practices and Estimates
This discussion and analysis of our financial condition and results of operations is based upon the Financial Statements, which have been prepared in accordance with GAAP. The preparation of these financial statements requires us to make estimates and judgments that affect the reported amounts of assets, liabilities, revenues and expenses, and related disclosure of contingent assets and liabilities. On an ongoing basis, we evaluate our estimates and accounting policies, including those related to bad debt, inventories, fixed assets, intangible assets, income taxes, revenue recognition and contingencies and litigation. We base our estimates on historical experience and on other assumptions that we believe are reasonable under the circumstances. The results of this process form the basis of our judgments about the carrying values of assets and liabilities that are not readily apparent from other sources. Actual results may differ from these estimates under different assumptions or conditions, and these differences can be material to our financial condition, results of operations and liquidity. We describe our significant accounting policies more fully in Note 2 to our Financial Statements.
Allowances and Reserves
We maintain allowances for doubtful accounts for estimated losses resulting from the inability of our customers to make required payments. The determination of the collectability of amounts due from our customers requires us to use estimates and make judgments regarding future events and trends, including monitoring our customers’ payment history and current creditworthiness to determine that collectibility is reasonably assured, as well as consideration of the overall business climate in which our customers operate. Inherently, these uncertainties require us to make judgments and estimates regarding our customers’ ability to pay amounts due to us in order to determine the appropriate amount of valuation allowances required for doubtful accounts. We review the adequacy of our allowance for doubtful accounts quarterly. We determine the allowance needed based on historical write-off experience and by evaluating significant balances aged greater than 90 days individually for collectibility. Account balances are charged off against the allowance after all means of collection have been exhausted and the potential for recovery is considered remote. During the years ended December 31, 2016, 2015 and 2014, we recorded bad debt expense of $3.0 million, $3.3 million and $0.7 million, respectively. Our allowance for doubtful accounts was approximately 2% and 1% of our gross accounts receivable balance at December 31, 2016 and 2015, respectively.
Inventory is a significant component of current assets and is stated at the lower of cost or market. This requires us to record provisions and maintain reserves for obsolete and slow moving inventory. To determine these reserve amounts, we regularly review inventory quantities on hand and compare them to estimates of future product demand, market conditions and production requirements. These estimates and forecasts inherently include uncertainties and require us to make judgments regarding potential outcomes. During 2016, 2015 and 2014, we recorded $0.8 million, $15.6 million and $3.2 million, respectively, in inventory write-downs and reserves for inventory which was obsolete or slow moving. As discussed further in Note 14 to the Financial Statements, during the year ended December 31, 2015, we recorded restructuring and other charges of $8.7 million related to inventory write-downs associated with restructuring activities. Significant or unanticipated changes to our estimates and forecasts could impact the amount and timing of any additional provisions for obsolete or slow moving inventory that may be required. Our reserve for obsolete and slow moving inventory was approximately 11% and 10% of our gross raw materials inventory balance at December 31, 2016 and 2015, respectively.
Depreciation
Property, plant and equipment are carried at cost. Depreciation for financial reporting purposes is computed on the straight-line basis using estimated useful lives and salvage values, including idle assets in our active fleet. The assumptions and judgments we use in determining the estimated useful lives and salvage values of our property, plant and equipment reflect both historical experience and expectations regarding future use of our assets. We periodically analyze our estimates of useful lives of our property, plant and equipment to determine if the depreciable periods and salvage value continue to be appropriate. The use of different estimates, assumptions and judgments in the establishment of property, plant and equipment accounting policies, especially those involving their useful lives, would likely result in significantly different net book values of our assets and results of operations. For example, if the useful lives of compressor units in our active fleet with a net book value of approximately $452.9 million were reduced by five years on January 1, 2016, our depreciation expense for the year ended December 31, 2016 would have increased by approximately $12 million.
55
Long-Lived Assets
We review long-lived assets, including property, plant and equipment and identifiable intangibles that are being amortized, for impairment whenever events or changes in circumstances, including the removal of compressor units from our active fleet, indicate that the carrying amount of an asset may not be recoverable. Compressor units in our active fleet that were idle as of December 31, 2016 comprise approximately 202,000 horsepower with a net book value of approximately $73.1 million. The determination that the carrying amount of an asset may not be recoverable requires us to make judgments regarding long-term forecasts of future revenue and costs related to the assets subject to review. Specifically for idle compression units that are removed from the active fleet and that will be sold to third parties as working compression units, significant assumptions include forecasted sale prices based on future market conditions and demand, forecasted cost to maintain the assets until sold and the forecasted length of time necessary to sell the assets. These forecasts are uncertain as they require significant assumptions about future market conditions. Significant and unanticipated changes to these assumptions could require a provision for impairment in a future period. Given the nature of these evaluations and their application to specific assets and specific times, it is not possible to reasonably quantify the impact of changes in these assumptions. An impairment loss exists when estimated undiscounted cash flows expected to result from the use of the asset and its eventual disposition are less than its carrying amount. When necessary, an impairment loss is recognized and represents the excess of the asset’s carrying value as compared to its estimated fair value and is charged to the period in which the impairment occurred.
Income Taxes
Our income tax provision, deferred tax assets and liabilities and reserves for unrecognized tax benefits reflect management’s best assessment of estimated current and future taxes to be paid. We operate in approximately 30 countries and, as a result, we and our subsidiaries file consolidated and separate income tax returns in the U.S. federal jurisdiction and in numerous state and foreign jurisdictions. In addition, certain of our operations were historically included in Archrock’s consolidated income tax returns in the U.S. federal and state jurisdictions. Our tax provision for periods prior to the Spin-off was determined on a separate return, stand-alone basis. Differences between the separate return method utilized and Archrock’s U.S. income tax returns and cash flows attributable to income taxes for our U.S. operations were recognized as distributions to, or contributions from, parent within parent equity. Significant judgments and estimates are required in determining our consolidated income tax provision.
Deferred income taxes arise from temporary differences between the financial statement carrying amounts and the tax basis of assets and liabilities. In evaluating our ability to recover our deferred tax assets within the jurisdiction from which they arise, we consider all available positive and negative evidence, including scheduled reversals of deferred tax liabilities, projected future taxable income, tax-planning strategies and results of recent operations. In projecting future taxable income, we begin with historical results adjusted for the results of discontinued operations and changes in accounting policies and incorporate assumptions including the amount of future U.S. federal, state and foreign pretax operating income, the reversal of temporary differences and the implementation of feasible and prudent tax-planning strategies. These assumptions require significant judgment about the forecasts of future taxable income and are consistent with the plans and estimates we are using to manage the underlying businesses. In evaluating the objective evidence that historical results provide, we consider three years of cumulative operating income (loss).
Changes in tax laws and rates could also affect recorded deferred tax assets and liabilities in the future. Management is not aware of any such changes that would have a material effect on the Company’s financial position, results of operations or cash flows. The calculation of our tax liabilities involves dealing with uncertainties in the application of complex tax laws and regulations in a multitude of jurisdictions across our global operations.
The accounting standard for income taxes provides that a tax benefit from an uncertain tax position is only recognized when it is more-likely-than-not that the position will be sustained upon examination, including resolutions of any related appeals or litigation processes, on the basis of the technical merits. In addition, guidance is provided on measurement, derecognition, classification, interest and penalties, accounting in interim periods, disclosure and transition. We adjust reserves for unrecognized tax benefits when our judgment changes as a result of the evaluation of new information not previously available. Because of the complexity of some of these uncertainties, the ultimate resolution may result in a payment that is materially different from our current estimate of the tax liabilities. These differences will be reflected as increases or decreases to income tax provision in the period in which new information is available.
56
We consider the earnings of our non-U.S. subsidiaries to be indefinitely invested outside the U.S. on the basis of estimates that future domestic cash generation and available borrowing capacity under our revolving credit facility, as well as the repayment of intercompany liabilities from our non-U.S. subsidiaries, will be sufficient to meet future domestic cash needs. We have not recorded a deferred tax liability related to these unremitted foreign earnings as it is not practicable to estimate the amount of unrecognized deferred tax liabilities. Should we decide to repatriate any unremitted foreign earnings, we would have to adjust the income tax provision in the period we determined that such earnings will no longer be indefinitely invested outside the U.S.
Revenue Recognition — Percentage-of-Completion Accounting
We recognize revenue and profit for our product sales operations as work progresses on long-term contracts using the percentage-of-completion method when the applicable criteria are met. During the years ended December 31, 2016, 2015 and 2014, we recognized approximately 84%, 74% and 73%, respectively, of our total product sales revenues from third parties using the percentage-of-completion method. The percentage-of-completion method depends largely on the ability to make reasonably dependable estimates related to the extent of progress toward completion of the contract, contract revenues and contract costs. Recognized revenues and profit are subject to revisions as the contract progresses to completion. Revisions in profit estimates are charged to income in the period in which the facts that give rise to the revision become known. The typical duration of these projects is three to 24 months. If we determine that a contract will result in a loss, we record a provision for the entire amount of the estimated loss in the period in which such loss is identified. Due to the long-term nature of some of our jobs, developing the estimates of cost often requires significant judgment.
We estimate percentage-of-completion for oil and gas compressor and production and processing equipment product sales on a direct labor hour to total labor hour basis. This calculation requires management to estimate the number of total labor hours required for each project and to estimate the profit expected on the project. We estimate percentage-of-completion for Belleli EPC product sales on a cost to total cost basis. The cost to total cost basis requires us to estimate the amount of total costs (labor and materials) required to complete each project. Because we have many product sales projects in process at any given time, we do not believe that materially different results would be achieved if different estimates, assumptions or conditions were used for any single project.
Factors that must be considered in estimating the work to be completed and ultimate profit include labor productivity and availability, the nature and complexity of work to be performed, the impact of change orders, availability of raw materials and the impact of delayed performance. Although we continually strive to accurately estimate our progress toward completion and profitability, adjustments to overall contract revenue and contract costs could be significant in future periods due to several factors including but not limited to, settlement of claims against customers, vendor claims against us, customer change orders, changes in cost estimates, changes in project contingencies and settlement of customer claims against us, such as liquidated damage claims. If the aggregate combined cost estimates for uncompleted contracts that are recognized using the percentage-of-completion method in our product sales businesses had been higher or lower by 5% in 2016, our income before income taxes would have decreased or increased by approximately $27.9 million. As of December 31, 2016, we had realized approximately $33.3 million in estimated earnings on uncompleted oil and gas product sales contracts and $43.7 million in estimated losses on uncompleted Belleli EPC product sales contracts. Estimated accrued loss contract provisions of $28.6 million at December 31, 2016 were recognized but not realized on uncompleted Belleli EPC product sales contracts. Accrued loss contract provisions are included in accrued liabilities in our balance sheets.
Contingencies and Litigation
We are substantially self-insured for workers’ compensation, employer’s liability, property, auto liability, general liability and employee group health claims in view of the relatively high per-incident deductibles we absorb under our insurance arrangements for these risks. Losses up to deductible amounts are estimated and accrued based upon known facts, historical trends and industry averages. We review these estimates quarterly and believe such accruals to be adequate. However, insurance liabilities are difficult to estimate due to unknown factors, including the severity of an injury, the determination of our liability in proportion to other parties, the timeliness of reporting of occurrences, ongoing treatment or loss mitigation, general trends in litigation recovery outcomes and the effectiveness of safety and risk management programs. Therefore, if our actual experience differs from the assumptions and estimates used for recording the liabilities, adjustments may be required and would be recorded in the period in which the difference becomes known. As of December 31, 2016 and 2015, we had recorded approximately $1.1 million and $1.5 million, respectively, in insurance claim reserves.
57
In the ordinary course of business, we are involved in various pending or threatened legal actions. While we are unable to predict the ultimate outcome of these actions, the accounting standard for contingencies requires management to make judgments about future events that are inherently uncertain. We are required to record (and have recorded) a loss during any period in which we believe a loss contingency is probable and can be reasonably estimated. In making determinations of likely outcomes of pending or threatened legal matters, we consider the evaluation of counsel knowledgeable about each matter.
We regularly assess and, if required, establish accruals for income tax as well as non-income-based tax contingencies pursuant to the applicable accounting standards that could result from assessments of additional tax by taxing jurisdictions in countries where we operate. Tax contingencies are subject to a significant amount of judgment and are reviewed and adjusted on a quarterly basis in light of changing facts and circumstances considering the outcome expected by management. As of December 31, 2016 and 2015, we had recorded approximately $24.3 million and $21.1 million, respectively, of accruals for tax contingencies (including penalties and interest and discontinued operations). Of these amounts, $21.2 million and $18.0 million, respectively, are accrued for income taxes as of December 31, 2016 and 2015, respectively, and $3.1 million as of both periods are accrued for non-income-based taxes. Furthermore, as of December 31, 2016 and 2015, we had an indemnification receivable from Archrock related to non-income-based taxes of $1.7 million and $1.5 million, respectively. If our actual experience differs from the assumptions and estimates used for recording the liabilities, adjustments may be required and would be recorded in the period in which the difference becomes known.
Recent Accounting Pronouncements
See Note 2 to the Financial Statements.
Item 7A. Quantitative and Qualitative Disclosures About Market Risk
We are exposed to market risks associated with changes in foreign currency exchange rates. We have significant international operations. The net assets and liabilities of these operations are exposed to changes in currency exchange rates. These operations may also have net assets and liabilities not denominated in their functional currency, which exposes us to changes in foreign currency exchange rates that impact income. We currently do not have any derivative financial instruments outstanding to mitigate foreign currency risk. In the future, we may utilize derivative instruments to manage the risk of fluctuations in foreign currency exchange rates related to the potential impact these changes could have on future earnings and forecasted cash flows. We recorded foreign currency gains of $6.4 million and foreign currency losses of $35.8 million in our statements of operations during the years ended December 31, 2016 and 2015, respectively. Our foreign currency gains and losses are primarily due to exchange rate fluctuations related to monetary asset balances denominated in currencies other than the functional currency, including foreign currency exchange rate changes recorded on intercompany obligations. Our material exchange rate exposure relates to intercompany loans to a subsidiary whose functional currency is the Brazilian Real, which loans carried balances of $41.0 million U.S. dollars as of December 31, 2016. Our foreign currency gains and losses included translation gains of $9.3 million and translation losses of $30.1 million during the years ended December 31, 2016 and 2015, respectively, related to the functional currency remeasurement of our foreign subsidiaries’ non-functional currency denominated intercompany obligations. Of the foreign currency losses recognized during the year ended December 31, 2015, $29.7 million was attributable to our Brazil subsidiary’s U.S. dollar denominated intercompany obligations and were the result of a currency devaluation in Brazil and increases in our Brazil subsidiary’s intercompany payables during 2015. Additionally, during the year ended December 31, 2016, we recognized a loss of $0.7 million on forward currency exchange contracts that offset exchange rate exposure related to intercompany loans to a subsidiary whose functional currency is the Brazilian Real. Changes in exchange rates may create gains or losses in future periods to the extent we maintain net assets and liabilities not denominated in the functional currency.
As of December 31, 2016, we had $350.8 million of outstanding borrowings that are subject to floating interest rates. Changes in economic conditions outside of our control could result in higher interest rates, thereby increasing our interest expense and reducing the funds available for capital investment, operations or other purposes. A 1% increase in the effective interest rate on our outstanding debt subject to floating interest rates at December 31, 2016 would result in an annual increase in our interest expense of approximately $3.5 million.
Item 8. Financial Statements and Supplementary Data
The consolidated and combined financial statements and supplementary information specified by this Item are presented in Part IV, Item 15 (“Exhibits and Financial Statement Schedules”) of this report.
58
Item 9. Changes in and Disagreements with Accountants on Accounting and Financial Disclosure
None.
Item 9A. Controls and Procedures
This Item 9A includes information concerning the controls and controls evaluation referred to in the certifications of our Chief Executive Officer and Chief Financial Officer required by Rule 13a-14 of the Exchange Act included in this Annual Report as Exhibits 31.1 and 31.2.
Overview
As previously announced on April 26, 2016 our Audit Committee of our Board of Directors determined that it would be necessary for us to restate our consolidated and combined financial statements. The Audit Committee made this determination following consultation with and upon the recommendation of management. Refer to Amendment No. 1 to the Company’s Annual Report on Form 10-K/A for the year ended December 31, 2015 for a more detailed description of the financial statement restatement.
Notwithstanding the existence of the material weaknesses described below, we believe that the consolidated and combined financial statements in this Annual Report on Form 10-K fairly present, in all material respects, our financial position, results of operations and cash flows as of the dates, and for the periods, presented, in conformity with GAAP.
Management’s Evaluation of Disclosure Controls and Procedures
Disclosure controls and procedures (as defined in Rules 13a-15(e) and 15d-15(e) under the Exchange Act) are designed to ensure that information required to be disclosed in reports filed or submitted under the Exchange Act is recorded, processed, summarized and reported within the time periods specified in SEC rules and forms, and that such information is accumulated and communicated to management to allow timely decisions regarding required disclosures.
In connection with the preparation of this Annual Report on Form 10-K, our management, under the supervision and with the participation of our principal executive officer and principal financial officer, evaluated the effectiveness of the design and operation of our disclosure controls and procedures as of December 31, 2016. Based on that evaluation, our principal executive officer and principal financial officer concluded that, due to the existence of the material weaknesses in internal control over financial reporting described below (which we view as an integral part of our disclosure controls and procedures), our disclosure controls and procedures were not effective as of December 31, 2016. Based on the completion of the review of the Belleli EPC product sales projects and non-income-based tax receivables in Brazil that led to the restatement and the performance of additional procedures designed to ensure the reliability of our financial reporting, we believe that the consolidated and combined financial statements included in this Annual Report on Form 10-K fairly present, in all material respects, our financial position, results of operations and cash flows as of the dates, and for the periods, presented, in conformity with GAAP.
Management’s Annual Report on Internal Control Over Financial Reporting
Management, under the supervision of our principal executive officer and principal financial officer, is responsible for establishing and maintaining adequate internal control over financial reporting (as defined in Rule 13a-15(f) and 15d(f) under the Exchange Act). Internal control over financial reporting is designed to provide reasonable assurance regarding the reliability of financial reporting and the preparation of financial statements for external reporting purposes in accordance with GAAP, and includes those policies and procedures that: (i) pertain to the maintenance of records that, in reasonable detail, accurately and fairly reflect the transactions and dispositions of the assets of the Company; (ii) provide reasonable assurance that transactions are recorded as necessary to permit preparation of financial statements in accordance with GAAP, and that receipts and expenditures of the Company are being made only in accordance with authorizations of management and directors of the Company; and (iii) provide reasonable assurance regarding the prevention or timely detection of unauthorized acquisition, use or disposition of the Company’s assets that could have a material effect on the financial statements.
59
Because of the inherent limitations, internal control over financial reporting may not prevent or detect misstatements. Also, projections of any evaluation of effectiveness to future periods are subject to the risk that controls may become inadequate because of changes in conditions, or that the degree of compliance with the policies or procedures may deteriorate. A material weakness is a deficiency, or a combination of deficiencies, in internal control over financial reporting, such that there is a reasonable possibility that a material misstatement of our annual or interim financial statements will not be prevented or detected on a timely basis.
In connection with the preparation of this Annual Report on Form 10-K, our management, under the supervision and with the participation of our principal executive officer and principal financial officer, conducted an assessment of the effectiveness of our internal control over financial reporting as of December 31, 2016 based on the criteria established in Internal Control — Integrated Framework (2013) issued by the Committee of Sponsoring Organizations of the Treadway Commission (COSO). Based on that assessment, our principal executive officer and principal financial officer concluded that, due to the material weaknesses described below (which were not remediated as of December 31, 2016), we did not maintain effective internal control over financial reporting as of December 31, 2016.
Control Environment, Risk Assessment, Control Activities, Information and Communication and Monitoring
We did not maintain effective internal control over financial reporting related to the following areas: control environment, risk assessment, control activities, information and communication and monitoring. In particular, controls related to the following were not designed or operating effectively:
• | There was not adequate integration, emphasis of local senior management accountability and management oversight of accounting and financial reporting activities in implementing and maintaining certain accounting practices at Belleli EPC to conform to the Company’s policies and GAAP. |
• | The Company did not modify its controls and testing procedures to sufficiently address its assessment of risks related to Belleli EPC that could significantly impact internal control over financial reporting by modifying its approach to how those risks should be addressed. |
• | The Company did not implement and maintain the same accounting controls at Belleli EPC, including information and communication controls, as those maintained in the Company’s other operating locations, resulting in internal controls that were not adequate to prevent or detect instances of intentional override of controls, intentional misconduct, or manipulation of cost-to-complete estimates by, or at the direction of, certain former members of Belleli EPC local senior management. |
• | The Company did not maintain a sufficient complement of personnel with appropriate levels of accounting knowledge, experience and training commensurate with the nature and complexity of Belleli EPC’s business. |
• | Corporate monitoring controls over certain foreign operations were not adequate to detect inappropriate accounting practices and were not designed to operate at a sufficient level of precision to detect material misstatements. |
The above material weaknesses contributed to material weaknesses at the control-activity level.
Revenue Recognition of Belleli EPC Percentage-of-Completion Projects
We did not design and maintain effective procedures or controls over accurate recording, presentation and disclosure of revenue and related costs in the application of percentage-of-completion accounting principles to our engineering, procurement and construction projects by Belleli EPC. Various deficiencies were identified in the process that aggregated to a material weakness. Controls relating to the following areas were not designed or operating effectively:
• | Controls over the determination of estimated cost-to-complete, including the assessment of contingencies and impact of project uncertainties; and |
• | Controls to address the accuracy and completeness of information used to estimate revenue and related costs in the application of percentage-of-completion accounting principles. |
The Company also identified material weaknesses in the control environment relating to risk assessment, control activities, information and communication and monitoring controls which contributed to this material weakness.
Existence and Recovery of Brazil Non-Income-Based Tax Receivables
The Company’s controls and procedures around the existence and recovery of Brazilian non-income-based tax receivables were not designed to review the Brazilian non-income-based tax receivables on a regular basis by personnel with appropriate expertise.
60
The Company also identified material weaknesses in the control environment and corporate monitoring controls, which contributed to this material weakness.
All of the material weaknesses identified by the Company resulted in misstatements to product sales, product sales cost of sales, accounts receivable, costs and estimated earnings in excess of billings on uncompleted contracts, billings on uncompleted contracts in excess of costs and estimated earnings, accrued liabilities, intangibles and other assets, net, and other income.
Remediation of Material Weakness in Internal Control Over Financial Reporting
Our management is committed to the planning and implementation of remediation efforts to address all material weaknesses, as well as to foster continuous improvement in the Company’s internal controls. These remediation efforts, summarized below, are implemented, in the process of being implemented or are planned for implementation, and are intended to address the identified material weaknesses and enhance our overall financial control environment.
In the first quarter of 2016, our management made a decision to exit the Belleli EPC business, which includes Belleli EPC’s engineering, procurement and construction for the manufacture of tanks for tank farms and the manufacture of evaporators and brine heaters for desalination plants. Accordingly, Belleli EPC will not enter into any new contracts or orders from any new or existing customers relating to the Belleli EPC business. This departure decision is considered in determining the nature and extent of our Belleli EPC remediation efforts. In addition, Belleli EPC’s prior local senior management responsible for the intentional override of controls and misconduct are no longer employees of Belleli EPC or its affiliates.
During 2016, we made numerous changes throughout our organization and took significant actions to reinforce the importance of a strong control environment, including training and other steps designed to strengthen and enhance our control culture.
To remediate the deficiencies identified herein, our leadership team, including the principal executive officer and current principal financial officer, has reaffirmed and reemphasized the importance of internal control, control consciousness and a strong control environment.
To date we have implemented the following remediation efforts at Belleli EPC:
• | Restructured the Company’s Executive Leadership Team (ELT), including designating responsibility of overseeing Belleli EPC projects to an ELT member who then reports directly to the Exterran Corporation principal executive officer; |
• | Appointed experienced professionals to key finance and operational leadership positions within Belleli EPC, including the hiring of a new Finance Manager and assigning a Managing Director to lead the operations organization; |
• | Integrated oversight of Belleli EPC operating, finance and manufacturing personnel by certain members of the Exterran Corporation ELT and the Exterran Corporation chief financial officer’s leadership team, including implementing regular meetings, to ensure sufficient oversight of project performance; |
• | Established a direct functional reporting structure between Belleli EPC and Exterran Corporation with more clearly defined responsibilities; |
• | Provided enhanced training on our policies and ethical requirements in English, and in Italian where necessary, including the emphasis of our hotline, the importance of reporting unethical actions and the Company’s zero tolerance for retaliation of any kind; |
• | Engaged a third-party consultant to accelerate redesigning the Belleli EPC project and contract management processes and controls; and |
• | Enhanced the accuracy and visibility of Belleli EPC financial results by improving the integrity of the monthly data interface. |
Our management believes that meaningful progress has been made against remaining remediation efforts; although timetables vary, management regards successful completion as an important priority. Remaining remediation activities include:
• | Instituting enhanced review of estimated costs at completion as part of the quarterly close process; |
• | Reviewing and redesigning internal controls, including spreadsheet controls, to ensure that the control objectives mitigate the identified risks; |
• | Assessing and redesigning, as necessary, systems and related processes at Belleli EPC to ensure information technology oversight matches the operations of the business; |
61
• | Integrating accounting, manufacturing and operations functions and revising organizational structures to enhance accurate reporting and ensure appropriate review and accountability; |
• | Assessing current staffing levels and competencies to ensure the optimal complement of personnel with appropriate backgrounds and skill sets; |
• | Enhancing our Sarbanes-Oxley (SOX) compliance procedures, including designing controls to respond to our risk assessment processes, implementing walkthroughs and performing risk responsive testing on our internal controls; and |
• | Implementing a corporate review of non-income-based tax receivables globally. |
Management believes the measures, when fully implemented and operational, will remediate the control deficiencies we have identified and strengthen our internal control over financial reporting. We are committed to improving our internal control processes and intend to continue to review and improve our financial reporting controls and procedures. As we continue to evaluate and work to improve our internal control over financial reporting, we may take additional measures to address control deficiencies or determine to modify, or in appropriate circumstances not to complete, certain of the remediation measures described above.
Changes in Internal Control over Financial Reporting
Other than those noted above, there were no changes in our internal control over financial reporting (as defined in Exchange Act Rules 13a-15(f) and 15d-15(f)) during the last fiscal quarter that materially affected, or are reasonably likely to materially affect, our internal control over financial reporting.
The effectiveness of our internal control over financial reporting as of December 31, 2016 has been audited by Deloitte & Touche, LLP, an independent registered public accounting firm, as stated in their attestation report that follows.
62
REPORT OF INDEPENDENT REGISTERED PUBLIC ACCOUNTING FIRM
To the Board of Directors and Stockholders of
Exterran Corporation
Houston, Texas
We have audited Exterran Corporation and subsidiaries (the “Company’s”) internal control over financial reporting as of December 31, 2016 based on the criteria established in Internal Control — Integrated Framework (2013) issued by the Committee of Sponsoring Organizations of the Treadway Commission. The Company’s management is responsible for maintaining effective internal control over financial reporting and for its assessment of the effectiveness of internal control over financial reporting included in the accompanying Management’s Annual Report on Internal Control over Financial Reporting. Our responsibility is to express an opinion on the Company’s internal control over financial reporting based on our audit.
We conducted our audit in accordance with the standards of the Public Company Accounting Oversight Board (United States). Those standards require that we plan and perform the audit to obtain reasonable assurance about whether effective internal control over financial reporting was maintained in all material respects. Our audit included obtaining an understanding of internal control over financial reporting, assessing the risk that a material weakness exists, testing and evaluating the design and operating effectiveness of internal control based on that risk, and performing such other procedures as we considered necessary in the circumstances. We believe that our audit provides a reasonable basis for our opinion.
A company’s internal control over financial reporting is a process designed by, or under the supervision of, the company’s principal executive and principal financial officers, or persons performing similar functions, and effected by the company’s board of directors, management, and other personnel to provide reasonable assurance regarding the reliability of financial reporting and the preparation of financial statements for external purposes in accordance with generally accepted accounting principles. A company’s internal control over financial reporting includes those policies and procedures that (1) pertain to the maintenance of records that, in reasonable detail, accurately and fairly reflect the transactions and dispositions of the assets of the company; (2) provide reasonable assurance that transactions are recorded as necessary to permit preparation of financial statements in accordance with generally accepted accounting principles, and that receipts and expenditures of the company are being made only in accordance with authorizations of management and directors of the company; and (3) provide reasonable assurance regarding prevention or timely detection of unauthorized acquisition, use, or disposition of the company’s assets that could have a material effect on the financial statements.
Because of the inherent limitations of internal control over financial reporting, including the possibility of collusion or improper management override of controls, material misstatements due to error or fraud may not be prevented or detected on a timely basis. Also, projections of any evaluation of the effectiveness of the internal control over financial reporting to future periods are subject to the risk that the controls may become inadequate because of changes in conditions, or that the degree of compliance with the policies or procedures may deteriorate.
A material weakness is a deficiency, or a combination of deficiencies, in internal control over financial reporting, such that there is a reasonable possibility that a material misstatement of the company’s annual or interim financial statements will not be prevented or detected on a timely basis. The following material weaknesses have been identified and included in management’s assessment: an ineffective control environment, risk assessment, control activities, information and communication, monitoring, ineffective design and maintaining of controls over accurate recording, presentation and disclosure of revenue and related costs in the application of percentage-of-completion accounting principles to the Company’s engineering, procurement and construction projects by Belleli EPC, and ineffective design of controls addressing the existence and recovery of Brazilian non-income-based tax receivables including the review on a regular basis by personnel with appropriate expertise. These material weaknesses were considered in determining the nature, timing, and extent of audit tests applied in our audit of the consolidated financial statements and financial statement schedule as of and for the year ended December 31, 2016, of the Company and this report does not affect our report on such financial statements and financial statement schedule.
In our opinion, because of the effect of the material weaknesses identified above on the achievement of the objectives of the control criteria, the Company has not maintained effective internal control over financial reporting as of December 31, 2016, based on the criteria established in Internal Control — Integrated Framework (2013) issued by the Committee of Sponsoring Organizations of the Treadway Commission.
We have also audited, in accordance with the standards of the Public Company Accounting Oversight Board (United States), the consolidated financial statements and financial statement schedule as of and for the year ended December 31, 2016, of the Company and our report dated March 9, 2017 expressed an unqualified opinion on those financial statements and financial statement schedule.
/s/ DELOITTE & TOUCHE LLP |
Houston, Texas |
March 9, 2017 |
63
Item 9B. Other Information
None.
PART III
Item 10. Directors, Executive Officers and Corporate Governance
The information required in Part III, Item 10 of this report is incorporated by reference to the sections entitled “Election of Directors,” “Corporate Governance,” “Executive Officers” and “Beneficial Ownership of Common Stock” in our definitive proxy statement, to be filed with the SEC within 120 days of the end of our fiscal year.
Item 11. Executive Compensation
The information required in Part III, Item 11 of this report is incorporated by reference to the sections entitled “Compensation Discussion and Analysis” and “Information Regarding Executive Compensation” in our definitive proxy statement, to be filed with the SEC within 120 days of the end of our fiscal year.
Item 12. Security Ownership of Certain Beneficial Owners and Management and Related Stockholder Matters
See the table below for securities authorized for issuance under our equity compensation plans. Other information required in Part III, Item 12 of this report are incorporated by reference to the section entitled “Beneficial Ownership of Common Stock” in our definitive proxy statement, to be filed with the SEC within 120 days of the end of our fiscal year.
Securities Authorized for Issuance under Equity Compensation Plans
The following table sets forth information as of December 31, 2016, with respect to the Exterran Corporation compensation plans under which our common stock is authorized for issuance, aggregated as follows:
(a) Number of Securities to be Issued Upon Exercise of Outstanding Options, Warrants and Rights | (b) Weighted-Average Exercise Price of Outstanding Options, Warrants and Rights | (c) Number of Securities Remaining Available for Future Issuance Under Equity Compensation Plans (Excluding Securities Reflected in Column (a)) | ||||||||
Plan Category | (#) | ($) | (#) | |||||||
Equity compensation plans approved by security holders (1) | 295,661 | $ | 17.44 | 2,233,492 | ||||||
Equity compensation plans not approved by security holders | — | — | — | |||||||
Total | 295,661 | 0 | 2,233,492 | |||||||
(1) | Comprised of (i) the Exterran Corporation 2015 Stock Incentive Plan, the (“2015 Plan”) and (ii) the Exterran Corporation 2015 Directors’ Stock and Deferral Plan. The 2015 Plan also governs awards originally granted by Archrock under the Archrock, Inc. 2013 Stock Incentive Plan, the Archrock, Inc. 2007 Amended and Restated Stock Incentive Plan and the Universal Compression Holdings, Inc. Incentive Stock Option Plan. In addition to the outstanding options, as of December 31, 2016, there were 389,085 restricted stock units outstanding, payable in common stock upon vesting, outstanding under the 2015 Plan. |
Item 13. Certain Relationships and Related Transactions and Director Independence
The information required in Part III, Item 13 of this report is incorporated by reference to the sections entitled “Certain Relationships and Related Transactions” and “Corporate Governance” in our definitive proxy statement, to be filed with the SEC within 120 days of the end of our fiscal year.
64
Item 14. Principal Accountant Fees and Services
The information required in Part III, Item 14 of this report is incorporated by reference to the section entitled “Ratification of the Appointment of Independent Registered Public Accounting Firm” in our definitive proxy statement, to be filed with the SEC within 120 days of the end of our fiscal year.
65
PART IV
Item 15. Exhibits and Financial Statement Schedules
(a) | Documents filed as a part of this report. |
1. | Financial Statements. The following financial statements are filed as a part of this report. |
2. | Financial Statement Schedule |
All other schedules have been omitted because they are not required under the relevant instructions.
3.Exhibits
66
Exhibit No. | Description | |
2.1 | Separation and Distribution Agreement, dated as of November 3, 2015, by and among Exterran Holdings, Inc., Exterran General Holdings LLC, Exterran Energy Solutions, L.P., Exterran Corporation, AROC Corp., EESLP LP LLC, AROC Services GP LLC, AROC Services LP LLC and Archrock Services, L.P., incorporated by reference to Exhibit 2.1 to the Registrant’s Current Report on Form 8-K filed on November 5, 2015 | |
2.2 | First Amendment to Separation and Distribution Agreement, dated as of December 15, 2015, by and among Archrock, Inc., Exterran General Holdings LLC, Exterran Energy Solutions, L.P., Exterran Corporation, AROC Corp., EESLP LP LLC, AROC Services GP LLC, AROC Services LP LLC and Archrock Services, L.P., incorporated by reference to Exhibit 2.2 to the Registrant’s Original Annual Report on Form 10-K for the year ended December 31, 2015 filed on February 26, 2016 | |
3.1 | Amended and Restated Certificate of Incorporation of Exterran Corporation, incorporated by reference to Exhibit 3.1 to the Registrant’s Current Report on Form 8-K filed on November 5, 2015 | |
3.2 | Amended and Restated Bylaws of Exterran Corporation, incorporated by reference to Exhibit 3.2 to the Registrant’s Current Report on Form 8-K filed on November 5, 2015 | |
10.1 | Employee Matters Agreement, dated as of November 3, 2015, by and between Exterran Holdings, Inc. and Exterran Corporation, incorporated by reference to Exhibit 10.1 to the Registrant’s Current Report on Form 8-K filed on November 5, 2015 | |
10.2 | Tax Matters Agreement, dated as of November 3, 2015, by and between Exterran Holdings, Inc. and Exterran Corporation, incorporated by reference to Exhibit 10.2 to the Registrant’s Current Report on Form 8-K filed on November 5, 2015 | |
10.3 | Transition Services Agreement, dated as of November 3, 2015, by and between Exterran Holdings, Inc. and Exterran Corporation, incorporated by reference to Exhibit 10.3 to the Registrant’s Current Report on Form 8-K filed on November 5, 2015 | |
10.4 | Supply Agreement, dated as of November 3, 2015, by and among Archrock Services, L.P., EXLP Operating LLC and Exterran Energy Solutions, L.P., incorporated by reference to Exhibit 10.4 to the Registrant’s Current Report on Form 8-K filed on November 5, 2015 | |
10.5 | Form of Indemnification Agreement, incorporated by reference to Exhibit 10.5 to the Registrant’s Current Report on Form 8-K filed on November 5, 2015 | |
10.6 | Amended and Restated Credit Agreement, dated as of October 5, 2015, by and among Exterran Holdings, Inc., Exterran Energy Solutions, L.P., the lenders signatory thereto and Wells Fargo Bank, National Association, as administrative agent, incorporated by reference to Exhibit 4.2 to Amendment No. 5 to the Company’s Registration Statement on Form 10-12B, as filed on October 6, 2015 | |
10.7† | Exterran Corporation 2015 Stock Incentive Plan, incorporated by reference to Exhibit 99.1 to the Company’s Registration Statement on Form S-8, as filed on November 2, 2015 | |
10.8† | Form of Award Notice and Agreement for Incentive Stock Options pursuant to the 2015 Stock Incentive Plan, incorporated by reference to Exhibit 10.8 to the Registrant’s Current Report on Form 8-K filed on November 5, 2015 | |
10.9† | Form of Award Notice and Agreement for Nonqualified Stock Options pursuant to the 2015 Stock Incentive Plan, incorporated by reference to Exhibit 10.9 to the Registrant’s Current Report on Form 8-K filed on November 5, 2015 | |
10.10† | Form of Award Notice and Agreement for Performance Units pursuant to the 2015 Stock Incentive Plan, incorporated by reference to Exhibit 10.10 to the Registrant’s Current Report on Form 8-K filed on November 5, 2015 | |
10.11† | Form of Award Notice and Agreement for Restricted Stock pursuant to the 2015 Stock Incentive Plan, incorporated by reference to Exhibit 10.11 to the Registrant’s Current Report on Form 8-K filed on November 5, 2015 | |
10.12† | Form of Award Notice and Agreement for Cash-Settled Restricted Stock Units pursuant to the 2015 Stock Incentive Plan, incorporated by reference to Exhibit 10.12 to the Registrant’s Current Report on Form 8-K filed on November 5, 2015 | |
10.13† | Form of Award Notice and Agreement for Stock-Settled Restricted Stock Units pursuant to the 2015 Stock Incentive Plan, incorporated by reference to Exhibit 10.13 to the Registrant’s Current Report on Form 8-K filed on November 5, 2015 | |
10.14† | Form of Award Notice and Agreement for Common Stock Award for Non-Employee Directors pursuant to the 2015 Stock Incentive Plan, incorporated by reference to Exhibit 10.14 to the Registrant’s Current Report on Form 8-K filed on November 5, 2015 | |
10.15† | Exterran Corporation Directors’ Stock and Deferral Plan, incorporated by reference to Exhibit 99.2 to the Company’s Registration Statement on Form S-8, as filed on November 2, 2015 | |
67
Exhibit No. | Description | |
10.16† | Form of Employment Letter, incorporated by reference to Exhibit 10.16 to the Registrant’s Current Report on Form 8-K filed on November 5, 2015 | |
10.17† | Form of Severance Benefit Agreement, incorporated by reference to Exhibit 10.11 to Amendment No. 4 to the Company’s Registration Statement on Form 10-12B, as filed on August 5, 2015 | |
10.18† | Form of Change of Control Agreement, incorporated by reference to Exhibit 10.11 to Amendment No. 4 to the Company’s Registration Statement on Form 10-12B, as filed on August 5, 2015 | |
10.19† | Exterran Corporation Deferred Compensation Plan, incorporated by reference to Exhibit 10.19 to the Registrant’s Current Report on Form 8-K filed on November 5, 2015 | |
10.20† | Exterran Corporation Amended and Restated Directors’ Stock and Deferral Plan, incorporated by reference to Exhibit 10.20 to the Registrant’s Original Annual Report on Form 10-K for the year ended December 31, 2015 filed on February 26, 2016 | |
10.21† | Separation Letter between the Company and Daniel K. Schlanger, dated as of March 7, 2016, incorporated by reference to Exhibit 10.1 to the Registrant’s Current Report on Form 8-K filed on March 8, 2016 | |
10.22 | First Amendment, Consent and Waiver, dated April 22, 2016, to Amended and Restated Credit Agreement by and among Exterran Energy Solutions, L.P., Exterran Corporation, Wells Fargo Bank, National Association, as administrative agent, and the lenders party thereto, incorporated by reference to Exhibit 10.1 to the Registrant’s Current Report on Form 8-K filed on April 26, 2016 | |
10.23 | Second Amendment, Consent and Waiver, dated June 17, 2016, to Amended and Restated Credit Agreement and First Amendment to Guaranty and Collateral Agreement by and among Exterran Energy Solutions, L.P., Exterran Corporation, Wells Fargo Bank, National Association, as administrative agent, and the lenders party thereto, incorporated by reference to Exhibit 10.1 to the Registrant’s Current Report on Form 8-K filed on June 23, 2016 | |
10.24 | Third Amendment, Consent and Waiver, dated August 24, 2016, to Amended and Restated Credit Agreement by and among Exterran Energy Solutions, L.P., Exterran Corporation, Wells Fargo Bank, National Association, as administrative agent, and the lenders party thereto, incorporated by reference to Exhibit 10.1 to the Registrant’s Current Report on Form 8-K filed on August 29, 2016 | |
10.25 | Fourth Amendment, Consent and Waiver, dated November 22, 2016, to Amended and Restated Credit Agreement by and among Exterran Energy Solutions, L.P., Exterran Corporation, Wells Fargo Bank, National Association, as administrative agent, and the lenders party thereto, incorporated by reference to Exhibit 10.1 to the Registrant’s Current Report on Form 8-K filed on November 22, 2016 | |
10.26† | First Amendment, Exterran Corporation Deferred Compensation Plan, incorporated by reference to Exhibit 10.3 of the Registrant’s Quarterly Report on Form 10-Q for the quarter ended September 30, 2016 filed on January 4, 2017 | |
10.27† | 2016 Form of Severance Benefit Agreement, incorporated by reference to Exhibit 10.3 of the Registrant’s Quarterly Report on Form 10-Q for the quarter ended September 30, 2016 filed on January 4, 2017 | |
10.28† | 2016 Form of Change of Control Agreement, incorporated by reference to Exhibit 10.3 of the Registrant’s Quarterly Report on Form 10-Q for the quarter ended September 30, 2016 filed on January 4, 2017 | |
10.29†* | Form of Award Notice and Agreement for Performance Units pursuant to the 2015 Stock Incentive Plan | |
10.30†* | Form of Award Notice and Agreement for Restricted Stock pursuant to the 2015 Stock Incentive Plan | |
10.31†* | Form of Award Notice and Agreement for Cash-Settled Restricted Stock Units pursuant to the 2015 Stock Incentive Plan | |
10.32†* | Form of Award Notice and Agreement for Stock-Settled Restricted Stock Units pursuant to the 2015 Stock Incentive Plan | |
10.33†* | Form of Award Notice and Agreement for Common Stock Award for Non-Employee Directors pursuant to the 2015 Stock Incentive Plan | |
21.1* | List of Subsidiaries | |
23.1* | Consent of Deloitte & Touche LLP | |
24.1* | Powers of Attorney (included on the signature page to this Report) | |
31.1* | Certification of the Principal Executive Officer pursuant to Section 302 of the Sarbanes-Oxley Act of 2002 | |
31.2* | Certification of the Principal Financial Officer pursuant to Section 302 of the Sarbanes-Oxley Act of 2002 | |
32.1** | Certification of the Chief Executive Officer pursuant to 18 U.S.C. Section 1350 as adopted pursuant to Section 906 of the Sarbanes-Oxley Act of 2002 | |
32.2** | Certification of the Chief Financial Officer pursuant to 18 U.S.C. Section 1350 as adopted pursuant to Section 906 of the Sarbanes-Oxley Act of 2002 | |
101.1* | Interactive data files pursuant to Rule 405 of Regulation S-T | |
68
† | Management contract or compensatory plan or arrangement. |
* | Filed herewith. |
** | Furnished, not filed, herewith. |
69
SIGNATURES
Pursuant to the requirements of Section 13 or 15(d) of the Securities Exchange Act of 1934, the registrant has duly caused this report to be signed on its behalf by the undersigned, thereunto duly authorized.
Exterran Corporation | |
/s/ ANDREW J. WAY | |
Name: Andrew J. Way | |
Title: President and Chief Executive Officer | |
Date: March 9, 2017 | |
70
POWER OF ATTORNEY
KNOW ALL MEN BY THESE PRESENTS, that each person whose signature appears below constitutes and appoints Andrew J. Way, David A. Barta, Valerie L. Banner and Raymond L. Carney Jr., and each of them, his or her true and lawful attorneys-in-fact and agents, with full power of substitution and resubstitution for him or her and in his or her name, place and stead, in any and all capacities, to sign any and all amendments to this Report, and to file the same, with all exhibits thereto, and other documents in connection therewith, with the Securities and Exchange Commission granting unto said attorneys-in-fact and agents full power and authority to do and perform each and every act and thing requisite and necessary to be done as fully to all said attorneys-in-fact and agents, or any of them, may lawfully do or cause to be done by virtue thereof.
Pursuant to the requirements of the Securities Exchange Act of 1934, this report has been signed below by the following persons on behalf of the registrant and in the capacities indicated on March 9, 2017.
Signature | Title | |
/s/ ANDREW J. WAY | President and Chief Executive Officer and Director | |
Andrew J. Way | (Principal Executive Officer) | |
/s/ DAVID A. BARTA | Senior Vice President and Chief Financial Officer | |
David A. Barta | (Principal Financial Officer) | |
/s/ RAYMOND L. CARNEY JR. | Vice President and Chief Accounting Officer | |
Raymond L. Carney Jr. | (Principal Accounting Officer) | |
/s/ WILLIAM M. GOODYEAR | Director | |
William M. Goodyear | ||
/s/ JOHN P. RYAN | Director | |
John P. Ryan | ||
/s/ CHRISTOPHER T. SEAVER | Director | |
Christopher T. Seaver | ||
/s/ RICHARD R. STEWART | Director | |
Richard R. Stewart | ||
/s/ IEDA GOMES YELL | Director | |
Ieda Gomes Yell | ||
/s/ JAMES C. GOUIN | Director | |
James C. Gouin | ||
/s/ MARK R. SOTIR | Director | |
Mark R. Sotir | ||
71
REPORT OF INDEPENDENT REGISTERED PUBLIC ACCOUNTING FIRM
To the Board of Directors and Stockholders of
Exterran Corporation
Houston, Texas
We have audited the accompanying consolidated balance sheets of Exterran Corporation and subsidiaries (the “Company”) as of December 31, 2016 and 2015, and the related consolidated and combined statements of operations, comprehensive income (loss), stockholders’ equity and cash flows for each of the three years in the period ended December 31, 2016. Our audits also included the financial statement schedule listed in the Index at Item 15. These financial statements and financial statement schedule are the responsibility of the Company’s management. Our responsibility is to express an opinion on the financial statements and financial statement schedule based on our audits.
We conducted our audits in accordance with the standards of the Public Company Accounting Oversight Board (United States). Those standards require that we plan and perform the audit to obtain reasonable assurance about whether the financial statements are free of material misstatement. An audit includes examining, on a test basis, evidence supporting the amounts and disclosures in the financial statements. An audit also includes assessing the accounting principles used and significant estimates made by management, as well as evaluating the overall financial statement presentation. We believe that our audits provide a reasonable basis for our opinion.
In our opinion, such consolidated and combined financial statements present fairly, in all material respects, the financial position of the Company as of December 31, 2016 and 2015, and the results of their operations and their cash flows for each of the three years in the period ended December 31, 2016, in conformity with accounting principles generally accepted in the United States of America. Also, in our opinion, such financial statement schedule when considered in relation to the basic consolidated and combined financial statements taken as a whole, presents fairly, in all material respects, the information set forth therein.
As described in Note 1, prior to November 3, 2015 the accompanying consolidated and combined financial statements were derived from the consolidated financial statements and accounting records of Archrock, Inc. The combined financial statements also include expense allocations for certain corporate functions historically provided by Archrock, Inc. These allocations may not be reflective of the actual expense which would have been incurred had the Company operated as a separate entity apart from Archrock, Inc. during the periods prior to November 3, 2015.
We have also audited, in accordance with the standards of the Public Company Accounting Oversight Board (United States), the Company’s internal control over financial reporting as of December 31, 2016, based on the criteria established in Internal Control - Integrated Framework (2013) issued by the Committee of Sponsoring Organizations of the Treadway Commission and our report dated March 9, 2017 expressed an adverse opinion on the Company’s internal control over financial reporting.
/s/ DELOITTE & TOUCHE LLP |
Houston, Texas |
March 9, 2017 |
F-1
EXTERRAN CORPORATION
CONSOLIDATED BALANCE SHEETS
(In thousands, except par value and share amounts)
December 31, | |||||||
2016 | 2015 | ||||||
ASSETS | |||||||
Current assets: | |||||||
Cash and cash equivalents | $ | 35,678 | $ | 29,032 | |||
Restricted cash | 671 | 1,490 | |||||
Accounts receivable, net of allowance of $5,383 and $2,868, respectively | 230,607 | 363,581 | |||||
Inventory, net (Note 4) | 157,516 | 208,081 | |||||
Costs and estimated earnings in excess of billings on uncompleted contracts (Note 5) | 31,956 | 65,311 | |||||
Other current assets | 55,516 | 53,866 | |||||
Current assets associated with discontinued operations (Note 3) | 14 | 32,923 | |||||
Total current assets | 511,958 | 754,284 | |||||
Property, plant and equipment, net (Note 6) | 797,809 | 858,188 | |||||
Deferred income taxes (Note 15) | 6,015 | 86,110 | |||||
Intangible and other assets, net (Note 7) | 58,996 | 51,533 | |||||
Long-term assets associated with discontinued operations (Note 3) | — | 38,281 | |||||
Total assets | $ | 1,374,778 | $ | 1,788,396 | |||
LIABILITIES AND STOCKHOLDERS’ EQUITY | |||||||
Current liabilities: | |||||||
Accounts payable, trade | $ | 95,959 | $ | 86,727 | |||
Accrued liabilities (Note 9) | 162,792 | 175,841 | |||||
Deferred revenue | 32,154 | 31,675 | |||||
Billings on uncompleted contracts in excess of costs and estimated earnings (Note 5) | 42,116 | 37,908 | |||||
Current liabilities associated with discontinued operations (Note 3) | 1,113 | 13,645 | |||||
Total current liabilities | 334,134 | 345,796 | |||||
Long-term debt (Note 10) | 348,970 | 525,593 | |||||
Deferred income taxes (Note 15) | 11,700 | 22,519 | |||||
Long-term deferred revenue | 98,964 | 59,769 | |||||
Other long-term liabilities | 24,237 | 22,708 | |||||
Long-term liabilities associated with discontinued operations (Note 3) | 2 | 6,075 | |||||
Total liabilities | 818,007 | 982,460 | |||||
Commitments and contingencies (Note 21) | |||||||
Stockholders’ equity: | |||||||
Preferred stock, $0.01 par value per share; 50,000,000 shares authorized; zero issued | — | — | |||||
Common stock, $0.01 par value per share; 250,000,000 shares authorized; 35,641,113 and 35,153,358 shares issued, respectively | 356 | 352 | |||||
Additional paid-in capital | 768,304 | 805,755 | |||||
Accumulated deficit | (257,252 | ) | (29,315 | ) | |||
Treasury stock — 202,430 and 5,776 common shares, at cost, respectively | (2,145 | ) | (54 | ) | |||
Accumulated other comprehensive income | 47,508 | 29,198 | |||||
Total stockholders’ equity (Note 17) | 556,771 | 805,936 | |||||
Total liabilities and stockholders’ equity | $ | 1,374,778 | $ | 1,788,396 | |||
The accompanying notes are an integral part of these consolidated and combined financial statements.
F-2
EXTERRAN CORPORATION
CONSOLIDATED AND COMBINED STATEMENTS OF OPERATIONS
(In thousands, except per share amounts)
Years Ended December 31, | |||||||||||
2016 | 2015 | 2014 | |||||||||
Revenues: | |||||||||||
Contract operations | $ | 392,463 | $ | 469,900 | $ | 493,853 | |||||
Aftermarket services | 120,550 | 127,802 | 162,724 | ||||||||
Oil and gas product sales—third parties | 392,384 | 935,295 | 1,096,638 | ||||||||
Oil and gas product sales—affiliates (Note 16) | — | 154,267 | 232,969 | ||||||||
Belleli EPC product sales | 123,856 | 103,221 | 115,479 | ||||||||
1,029,253 | 1,790,485 | 2,101,663 | |||||||||
Costs and expenses: | |||||||||||
Cost of sales (excluding depreciation and amortization expense): | |||||||||||
Contract operations | 143,670 | 172,391 | 185,408 | ||||||||
Aftermarket services | 87,342 | 91,233 | 120,181 | ||||||||
Oil and gas product sales | 365,394 | 925,737 | 1,089,418 | ||||||||
Belleli EPC product sales | 126,322 | 134,846 | 148,870 | ||||||||
Selling, general and administrative | 165,985 | 220,396 | 263,170 | ||||||||
Depreciation and amortization | 137,974 | 154,801 | 170,088 | ||||||||
Long-lived asset impairment (Note 12) | 15,146 | 20,788 | 3,851 | ||||||||
Restatement charges (Note 13) | 18,879 | — | — | ||||||||
Restructuring and other charges (Note 14) | 27,457 | 31,315 | — | ||||||||
Interest expense | 34,181 | 7,272 | 1,878 | ||||||||
Equity in income of non-consolidated affiliates (Note 8) | (10,403 | ) | (15,152 | ) | (14,553 | ) | |||||
Other (income) expense, net | (13,088 | ) | 35,438 | 6,201 | |||||||
1,098,859 | 1,779,065 | 1,974,512 | |||||||||
Income (loss) before income taxes | (69,606 | ) | 11,420 | 127,151 | |||||||
Provision for income taxes (Note 15) | 124,760 | 39,546 | 79,042 | ||||||||
Income (loss) from continuing operations | (194,366 | ) | (28,126 | ) | 48,109 | ||||||
Income (loss) from discontinued operations, net of tax (Note 3) | (33,571 | ) | 54,774 | 67,183 | |||||||
Net income (loss) | $ | (227,937 | ) | $ | 26,648 | $ | 115,292 | ||||
Basic net income (loss) per common share (Note 19): | |||||||||||
Income (loss) from continuing operations per common share | $ | (5.62 | ) | $ | (0.82 | ) | $ | 1.40 | |||
Income (loss) from discontinued operations per common share | (0.97 | ) | 1.60 | 1.96 | |||||||
Net income (loss) per common share | $ | (6.59 | ) | $ | 0.78 | $ | 3.36 | ||||
Diluted net income (loss) per common share (Note 19): | |||||||||||
Income (loss) from continuing operations per common share | $ | (5.62 | ) | $ | (0.82 | ) | $ | 1.40 | |||
Income (loss) from discontinued operations per common share | (0.97 | ) | 1.60 | 1.96 | |||||||
Net income (loss) per common share | $ | (6.59 | ) | $ | 0.78 | $ | 3.36 | ||||
Weighted average common shares outstanding used in net income (loss) per common share (Note 19): | |||||||||||
Basic | 34,568 | 34,288 | 34,286 | ||||||||
Diluted | 34,568 | 34,288 | 34,286 | ||||||||
The accompanying notes are an integral part of these consolidated and combined financial statements.
F-3
EXTERRAN CORPORATION
CONSOLIDATED AND COMBINED STATEMENTS OF COMPREHENSIVE INCOME (LOSS)
(In thousands)
Years Ended December 31, | |||||||||||
2016 | 2015 | 2014 | |||||||||
Net income (loss) | $ | (227,937 | ) | $ | 26,648 | $ | 115,292 | ||||
Other comprehensive income (loss): | |||||||||||
Foreign currency translation adjustment | 18,310 | 2,453 | (12,147 | ) | |||||||
Comprehensive income (loss) | $ | (209,627 | ) | $ | 29,101 | $ | 103,145 | ||||
The accompanying notes are an integral part of these consolidated and combined financial statements.
F-4
EXTERRAN CORPORATION
CONSOLIDATED AND COMBINED STATEMENTS OF STOCKHOLDERS’ EQUITY
(In thousands, except share data)
Common Stock | Additional Paid-in Capital | Accumulated Deficit | Treasury Stock | Parent Equity | Accumulated Other Comprehensive Income | Total | |||||||||||||||||||||||||||
Shares | Amount | Shares | Amount | ||||||||||||||||||||||||||||||
Balance at January 1, 2014 | — | $ | — | $ | — | $ | — | — | $ | — | $ | 1,282,268 | $ | 38,892 | $ | 1,321,160 | |||||||||||||||||
Net income | 115,292 | 115,292 | |||||||||||||||||||||||||||||||
Net distributions to parent | (59,970 | ) | (59,970 | ) | |||||||||||||||||||||||||||||
Foreign currency translation adjustment | — | (12,147 | ) | (12,147 | ) | ||||||||||||||||||||||||||||
Balance at December 31, 2014 | — | $ | — | $ | — | $ | — | — | $ | — | $ | 1,337,590 | $ | 26,745 | $ | 1,364,335 | |||||||||||||||||
Net income (loss) | (29,315 | ) | 55,963 | 26,648 | |||||||||||||||||||||||||||||
Foreign currency translation adjustment | 2,453 | 2,453 | |||||||||||||||||||||||||||||||
Net distributions to parent | (57,635 | ) | (57,635 | ) | |||||||||||||||||||||||||||||
Cash transfer to Archrock, Inc. at Spin-off (Note 17) | (532,578 | ) | (532,578 | ) | |||||||||||||||||||||||||||||
Conversion of parent equity to additional paid-in capital | 34,286,267 | 343 | 802,997 | (803,340 | ) | — | |||||||||||||||||||||||||||
Conversion of stock-based compensation awards at Spin-off | 505,512 | 5 | (5 | ) | — | ||||||||||||||||||||||||||||
Treasury stock purchased | (3,389 | ) | (54 | ) | (54 | ) | |||||||||||||||||||||||||||
Stock-based compensation, net of forfeitures | 361,579 | 4 | 2,115 | (2,387 | ) | 2,119 | |||||||||||||||||||||||||||
Income tax benefit from stock-based compensation expenses | 648 | 648 | |||||||||||||||||||||||||||||||
Balance at December 31, 2015 | 35,153,358 | $ | 352 | $ | 805,755 | $ | (29,315 | ) | (5,776 | ) | $ | (54 | ) | $ | — | $ | 29,198 | $ | 805,936 | ||||||||||||||
Net loss | (227,937 | ) | (227,937 | ) | |||||||||||||||||||||||||||||
Options exercised | 61,177 | 786 | 786 | ||||||||||||||||||||||||||||||
Foreign currency translation adjustment | 18,310 | 18,310 | |||||||||||||||||||||||||||||||
Cash transfer to Archrock, Inc. (Note 21) | (49,176 | ) | (49,176 | ) | |||||||||||||||||||||||||||||
Treasury stock purchased | (196,654 | ) | (2,091 | ) | (2,091 | ) | |||||||||||||||||||||||||||
Stock-based compensation, net of forfeitures | 426,578 | 4 | 10,962 | 10,966 | |||||||||||||||||||||||||||||
Other | (23 | ) | (23 | ) | |||||||||||||||||||||||||||||
Balance at December 31, 2016 | 35,641,113 | $ | 356 | $ | 768,304 | $ | (257,252 | ) | (202,430 | ) | $ | (2,145 | ) | $ | — | $ | 47,508 | $ | 556,771 | ||||||||||||||
The accompanying notes are an integral part of these consolidated and combined financial statements.
F-5
EXTERRAN CORPORATION
CONSOLIDATED AND COMBINED STATEMENTS OF CASH FLOWS
(In thousands)
Years Ended December 31, | |||||||||||
2016 | 2015 | 2014 | |||||||||
Cash flows from operating activities: | |||||||||||
Net income (loss) | $ | (227,937 | ) | $ | 26,648 | $ | 115,292 | ||||
Adjustments to reconcile net income (loss) to cash provided by operating activities: | |||||||||||
Depreciation and amortization | 137,974 | 154,801 | 170,088 | ||||||||
Long-lived asset impairment | 15,146 | 20,788 | 3,851 | ||||||||
Amortization of deferred financing costs | 4,584 | 702 | — | ||||||||
(Income) loss from discontinued operations, net of tax | 33,571 | (54,774 | ) | (67,183 | ) | ||||||
Provision for doubtful accounts | 2,972 | 3,326 | 679 | ||||||||
Gain on sale of property, plant and equipment | (2,986 | ) | (1,805 | ) | (1,752 | ) | |||||
Equity in income of non-consolidated affiliates | (10,403 | ) | (15,152 | ) | (14,553 | ) | |||||
(Gain) loss on remeasurement of intercompany balances | (9,268 | ) | 30,127 | 3,614 | |||||||
Loss on foreign currency derivatives | 709 | — | — | ||||||||
Loss on sale of businesses | — | — | 961 | ||||||||
Stock-based compensation expense | 10,966 | 8,184 | 5,288 | ||||||||
Deferred income tax provision (benefit) | 71,591 | (26,923 | ) | 11,338 | |||||||
Changes in assets and liabilities: | |||||||||||
Accounts receivable and notes | 135,934 | 14,211 | (51,234 | ) | |||||||
Inventory | 49,705 | 80,416 | (11,855 | ) | |||||||
Costs and estimated earnings versus billings on uncompleted contracts | 37,551 | (14,461 | ) | (21,376 | ) | ||||||
Other current assets | 1,593 | (5,474 | ) | (3,888 | ) | ||||||
Accounts payable and other liabilities | (9,684 | ) | (82,705 | ) | 24,855 | ||||||
Deferred revenue | 24,414 | (2,428 | ) | (9,913 | ) | ||||||
Other | (730 | ) | (4,566 | ) | (19,709 | ) | |||||
Net cash provided by continuing operations | 265,702 | 130,915 | 134,503 | ||||||||
Net cash provided by (used in) discontinued operations | (2,213 | ) | (412 | ) | 16,462 | ||||||
Net cash provided by operating activities | 263,489 | 130,503 | 150,965 | ||||||||
Cash flows from investing activities: | |||||||||||
Capital expenditures | (74,325 | ) | (156,745 | ) | (156,602 | ) | |||||
Proceeds from sale of property, plant and equipment | 2,814 | 6,625 | 12,219 | ||||||||
Proceeds from sale of businesses | — | — | 1,516 | ||||||||
Return of investments in non-consolidated affiliates | 10,403 | 15,185 | 14,750 | ||||||||
Proceeds received from settlement of note receivable | — | 5,357 | — | ||||||||
Settlement of foreign currency derivatives | (709 | ) | — | — | |||||||
(Increase) decrease in restricted cash | 819 | — | (221 | ) | |||||||
Cash invested in non-consolidated affiliates | — | (33 | ) | (197 | ) | ||||||
Net cash used in continuing operations | (60,998 | ) | (129,611 | ) | (128,535 | ) | |||||
Net cash provided by discontinued operations | 36,734 | 47,497 | 64,958 | ||||||||
Net cash used in investing activities | (24,264 | ) | (82,114 | ) | (63,577 | ) | |||||
Cash flows from financing activities: | |||||||||||
Proceeds from borrowings of long-term debt | 430,758 | 673,500 | — | ||||||||
Repayments of long-term debt | (610,261 | ) | (143,500 | ) | — | ||||||
Cash transfer to Archrock, Inc. | (49,176 | ) | (532,578 | ) | — | ||||||
Net distributions to parent | — | (39,025 | ) | (79,296 | ) | ||||||
Payments for debt issuance costs | (779 | ) | (13,345 | ) | — | ||||||
Proceeds from stock options exercised | 786 | — | — | ||||||||
Purchases of treasury stock | (2,091 | ) | (54 | ) | — | ||||||
Other | 16 | — | — | ||||||||
Net cash used in financing activities | (230,747 | ) | (55,002 | ) | (79,296 | ) | |||||
Effect of exchange rate changes on cash and cash equivalents | (1,832 | ) | (3,716 | ) | (3,925 | ) | |||||
Net increase (decrease) in cash and cash equivalents | 6,646 | (10,329 | ) | 4,167 | |||||||
Cash and cash equivalents at beginning of period | 29,032 | 39,361 | 35,194 | ||||||||
Cash and cash equivalents at end of period | $ | 35,678 | $ | 29,032 | $ | 39,361 | |||||
Supplemental disclosure of cash flow information: | |||||||||||
Income taxes paid, net | $ | 57,580 | $ | 64,683 | $ | 63,349 | |||||
Interest paid, net of capitalized amounts | $ | 29,046 | $ | 4,141 | $ | 1,905 | |||||
Supplemental disclosure of non-cash transactions: | |||||||||||
Net transfers of property, plant, and equipment from parent prior to the Spin-off | $ | — | $ | (7,627 | ) | $ | (17,472 | ) | |||
Transfer of net deferred tax liabilities from parent at Spin-off | $ | — | $ | 29,203 | $ | — | |||||
Accrued capital expenditures | $ | 5,985 | $ | 2,743 | $ | 15,426 | |||||
Non-cash proceeds from the sale of a plant | $ | 7,000 | $ | — | $ | — | |||||
The accompanying notes are an integral part of these consolidated and combined financial statements.
F-6
EXTERRAN CORPORATION
NOTES TO CONSOLIDATED AND COMBINED FINANCIAL STATEMENTS
1. Description of Business, Spin-Off and Basis of Presentation
Description of Business
Exterran Corporation (together with its subsidiaries, “Exterran Corporation,” “our,” “we” or “us”), a Delaware corporation formed in March 2015, is a market leader in the provision of compression, production and processing products and services that support the production and transportation of oil and natural gas throughout the world. We provide these products and services to a global customer base consisting of companies engaged in all aspects of the oil and natural gas industry, including large integrated oil and natural gas companies, national oil and natural gas companies, independent oil and natural gas producers and oil and natural gas processors, gatherers and pipeline operators. We operate in four primary business lines: contract operations, aftermarket services, oil and gas product sales and Belleli EPC product sales. In our contract operations business line, we have operations outside of the United States of America (“U.S.”) where we own and operate natural gas compression equipment and crude oil and natural gas production and processing equipment on behalf of our customers. In our aftermarket services business line, we primarily have operations outside of the U.S. where we provide operations, maintenance, overhaul and reconfiguration services to customers who own their own compression, production, processing, treating and related equipment. In our oil and gas product sales business line, we manufacture natural gas compression packages and oil and natural gas production and processing equipment for sale to our customers throughout the world and for use in our contract operations business line. In our Belleli EPC product sales business line that we are exiting, we have historically provided engineering, procurement and construction for the manufacture of tanks for tank farms and the manufacture of evaporators and brine heaters for desalination plants. We also offer our customers, on either a contract operations basis or a sale basis, the engineering, design, project management, procurement and construction services necessary to incorporate our products into production, processing and compression facilities, which we refer to as integrated projects.
Spin-off
On November 3, 2015, Archrock, Inc. (named Exterran Holdings, Inc. prior to November 3, 2015) (“Archrock”) completed the spin-off (the “Spin-off”) of its international contract operations, international aftermarket services (the international contract operations and international aftermarket services businesses combined are referred to as the “international services businesses” and include such activities conducted outside of the U.S.) and global fabrication businesses into an independent, publicly traded company named Exterran Corporation. We refer to the global fabrication business previously operated by Archrock as our product sales businesses (including our oil and gas product sales and Belleli EPC product sales segments). To effect the Spin-off, on November 3, 2015, Archrock distributed, on a pro rata basis, all of our shares of common stock to its stockholders of record as of October 27, 2015 (the “Record Date”). Archrock shareholders received one share of Exterran Corporation common stock for every two shares of Archrock common stock held at the close of business on the Record Date. Pursuant to the separation and distribution agreement with Archrock and certain of our and Archrock’s respective affiliates, on November 3, 2015, we transferred cash of $532.6 million to Archrock. Our Registration Statement on Form 10, as amended, was declared effective on October 21, 2015. On November 4, 2015, Exterran Corporation common stock began “regular-way” trading on the New York Stock Exchange under the stock symbol “EXTN.” Following the completion of the Spin-off, we and Archrock became and continue to be independent, publicly traded companies with separate boards of directors and management.
Basis of Presentation
The accompanying consolidated and combined financial statements of Exterran Corporation included herein have been prepared in accordance with accounting principles generally accepted in the U.S. (“GAAP”). All financial information presented for periods after the Spin-off represents our consolidated results of operations, financial position and cash flows (referred to as the “consolidated financial statements”) and all financial information for periods prior to the Spin-off represents our combined results of operations, financial position and cash flows (referred to as the “combined financial statements”). Accordingly:
• | Our consolidated and combined statements of operations, comprehensive income, cash flows and stockholders’ equity for the year ended December 31, 2015 consist of (i) the combined results of Archrock’s international services and product sales businesses for the period between January 1, 2015 and November 3, 2015 and (ii) the consolidated results of Exterran Corporation for periods subsequent to November 3, 2015. Our combined statements of operations, comprehensive income, cash flows and stockholders’ equity for the year ended December 31, 2014 consist entirely of the combined results of Archrock’s international services and product sales businesses. |
F-7
• | Our consolidated balance sheets at December 31, 2016 and 2015 consist entirely of our consolidated balances. |
The combined financial statements were derived from the accounting records of Archrock and reflect the combined historical results of operations, financial position and cash flows of Archrock’s international services and product sales businesses. The combined financial statements were presented as if such businesses had been combined for periods prior to November 4, 2015. All intercompany transactions and accounts within these statements have been eliminated. Affiliate transactions between the international services and product sales businesses of Archrock and the other businesses of Archrock have been included in the combined financial statements, with the exception of oil and gas product sales within our wholly owned subsidiary, Exterran Energy Solutions, L.P. (“EESLP”). Prior to the closing of the Spin-off, EESLP also had a fleet of compression units used to provide compression services in the U.S. services business of Archrock. Revenue has not been recognized in the combined statements of operations for the sale of compressor units by us that were used by EESLP to provide compression services to customers of the U.S. services business of Archrock. See Note 16 for further discussion on transactions with affiliates.
The combined statements of operations for periods prior to the Spin-off include expense allocations for certain functions historically performed by Archrock and not allocated to its operating segments, including allocations of expenses related to executive oversight, accounting, treasury, tax, legal, human resources, procurement and information technology. See Note 16 for further discussion regarding the allocation of corporate expenses. Additionally, third party debt of Archrock, other than debt attributable to capital leases, was not allocated to us for any of the periods prior to the Spin-off as we were not the legal obligor of the debt and Archrock’s borrowings were not directly attributable to our business.
We refer to the consolidated and combined financial statements collectively as “financial statements,” and individually as “balance sheets,” “statements of operations,” “statements of comprehensive income (loss),” “statements of stockholders’ equity” and “statements of cash flows” herein.
Investments in affiliated entities in which we own more than a 20% interest and do not have a controlling interest are accounted for using the equity method.
2. Significant Accounting Policies
Use of Estimates in the Financial Statements
The preparation of financial statements in conformity with GAAP requires management to make estimates and assumptions that affect the reported amount of assets, liabilities, revenue and expenses, as well as the disclosures of contingent assets and liabilities. Because of the inherent uncertainties in this process, actual future results could differ from those expected at the reporting date. Significant estimates are required for contracts within our oil and gas products sales and Belleli EPC product sales segments that are accounted for under the percentage-of-completed method. As of December 31, 2016, we have provided for our estimated costs-to-complete on all of our ongoing contracts. However, it is possible that current estimates could change due to unforeseen events, which could result in adjustments to overall contract costs. Variations from estimated contract performance could result in material adjustments to operating results. Management believes that the estimates and assumptions used are reasonable.
Cash and Cash Equivalents
We consider all highly liquid investments purchased with an original maturity of three months or less to be cash equivalents.
Restricted Cash
Restricted cash as of December 31, 2016 and 2015 consists of cash that contractually is not available for immediate use. Restricted cash is presented separately from cash and cash equivalents in our balance sheets and statements of cash flows.
Revenue Recognition
Contract operations revenue is recognized when earned, which generally occurs monthly when service is provided under our customer contracts. Aftermarket services revenue is recognized as products are delivered and title is transferred or services are performed for the customer.
F-8
Product sales revenue from third parties is recognized using the percentage-of-completion method when the applicable criteria are met. We estimate percentage-of-completion for oil and gas compressor and production and processing equipment product sales on a direct labor hour to total labor hour basis. We estimate percentage-of-completion for Belleli EPC product sales on a cost to total cost basis. The duration of these projects is typically between three and 24 months. Product sales revenue is recognized using the completed contract method when the applicable criteria of the percentage-of-completion method are not met. Product sales revenue under the completed contract method is recognized upon either delivery to the customer or achievement of substantial completion in accordance with the specifications within the underlying contract, which generally occurs when all significant attributes and components of the product are completed. Prior to the Spin-off, product sales revenue from affiliates was recognized using the completed contract method as the equipment was not guaranteed to be sold to the affiliate until the entities entered into a bill of sale for such equipment which occurred at the completion of the manufacturing process. Subsequent to November 3, 2015, sales to Archrock and Archrock Partners, L.P. (named Exterran Partners, L.P. prior to November 3, 2015) (“Archrock Partners”) are considered sales to third parties. Product sales revenue from a claim is recognized to the extent that costs related to the claim have been incurred, when collection is probable and can be reliably estimated. We estimate the future costs and gross margin on uncompleted contracts related to our product sales contracts. If we determine that a contract will result in a loss, we record a provision for the entire amount of the estimated loss in the period in which such loss is identified.
Concentrations of Credit Risk
Financial instruments that potentially subject us to concentrations of credit risk consist of cash and cash equivalents and accounts receivable. We believe that the credit risk in temporary cash investments is limited because our cash is held in accounts with multiple financial institutions. Trade accounts receivable are due from companies of varying size engaged principally in oil and natural gas activities throughout the world. We review the financial condition of customers prior to extending credit and generally do not obtain collateral for trade receivables. Payment terms are on a short-term basis and in accordance with industry practice. We consider this credit risk to be limited due to these companies’ financial resources, the nature of products and services we provide and the terms of our contract operations customer service agreements.
We maintain allowances for doubtful accounts for estimated losses resulting from our customers’ inability to make required payments. The determination of the collectibility of amounts due from our customers requires us to use estimates and make judgments regarding future events and trends, including monitoring our customers’ payment history and current creditworthiness to determine that collectibility is reasonably assured, as well as consideration of the overall business climate in which our customers operate. Inherently, these uncertainties require us to make judgments and estimates regarding our customers’ ability to pay amounts due to us in order to determine the appropriate amount of valuation allowances required for doubtful accounts. We review the adequacy of our allowance for doubtful accounts quarterly. We determine the allowance needed based on historical write-off experience and by evaluating significant balances aged greater than 90 days individually for collectibility. Account balances are charged off against the allowance after all means of collection have been exhausted and the potential for recovery is considered remote. During the years ended December 31, 2016, 2015 and 2014, we recorded bad debt expense of $3.0 million, $3.3 million and $0.6 million, respectively.
Inventory
Inventory consists of parts used for manufacturing or maintenance of natural gas compression equipment and facilities and processing and production equipment and also includes new compression units and production equipment that are held for sale. Inventory is stated at the lower of cost or market using the average-cost method. A reserve is recorded against inventory balances for estimated obsolescence and slow moving items based on specific identification and historical experience.
Property, Plant and Equipment
Property, plant and equipment are recorded at cost and depreciated using the straight-line method over their estimated useful lives as follows:
Compression equipment, facilities and other fleet assets | 3 to 30 years |
Buildings | 20 to 35 years |
Transportation, shop equipment and other | 3 to 12 years |
F-9
Installation costs capitalized on contract operations projects are generally depreciated over the life of the underlying contract. Major improvements that extend the useful life of an asset are capitalized. Repairs and maintenance are expensed as incurred. When property, plant and equipment is sold, retired or otherwise disposed of, the gain or loss is recorded in other (income) expense, net. Interest is capitalized during the construction period on equipment and facilities that are constructed for use in our operations. The capitalized interest is included as part of the cost of the asset to which it relates and is amortized over the asset’s estimated useful life.
Computer Software
Certain costs related to the development or purchase of internal-use software are capitalized and amortized over the estimated useful life of the software, which ranges from three to five years. Costs related to the preliminary project stage and the post-implementation/operation stage of an internal-use computer software development project are expensed as incurred. Capitalized software costs are included in property, plant and equipment, net, in our balance sheets.
Long-Lived Assets
We review long-lived assets, including property, plant and equipment and identifiable intangibles that are being amortized, for impairment whenever events or changes in circumstances, including the removal of compressor units from our active fleet, indicate that the carrying amount of an asset may not be recoverable. An impairment loss exists when estimated undiscounted cash flows expected to result from the use of the asset and its eventual disposition are less than its carrying amount. When necessary, an impairment loss is recognized and represents the excess of the asset’s carrying value as compared to its estimated fair value and is charged to the period in which the impairment occurred. Identifiable intangibles are amortized over the assets’ estimated useful lives.
Deferred Revenue
Deferred revenue is primarily comprised of upfront billings on contract operations jobs, milestone billings related to jobs where revenue is recognized on the completed contract method and billings related to jobs that have not begun where revenue is recognized on the percentage-of-completion method. Upfront payments received from customers on contract operations jobs are generally deferred and amortized over the life of the underlying contract.
Other (Income) Expense, Net
Other (income) expense, net, is primarily comprised of gains and losses from the remeasurement of our international subsidiaries’ net assets exposed to changes in foreign currency rates, short-term investments and the sale of used assets.
Income Taxes
Our operations are subject to U.S. federal, state and local and foreign income taxes. We and our subsidiaries file consolidated and separate income tax returns in the U.S. federal jurisdiction and in numerous state and foreign jurisdictions. In addition, certain of our operations were historically included in Archrock’s consolidated income tax returns in the U.S. federal and state jurisdictions. Our tax provision for periods prior to the Spin-off was determined on a separate return, stand-alone basis. Prior to the Spin-off, differences between the separate return method utilized and Archrock’s U.S. income tax returns and cash flows attributable to income taxes for our U.S. operations were recognized as distributions to, or contributions from, parent within parent equity.
We account for income taxes under the asset and liability method, which requires the recognition of deferred tax assets and liabilities for the expected future tax consequences of events included in the financial statements. Under this method, deferred tax assets and liabilities are determined based on the differences between the financial statement carrying amounts and the tax basis of assets and liabilities using enacted tax rates in effect for the year in which the differences are expected to reverse. The effect of a change in tax rates on deferred tax assets and liabilities is recognized in income in the period that includes the enactment date.
We record net deferred tax assets to the extent we believe these assets will more-likely-than-not be realized. In making such a determination, we consider all available positive and negative evidence, including future reversals of existing taxable temporary differences, projected future taxable income, tax-planning strategies and results of recent operations. In the event we were to determine that we would be able to realize our deferred income tax assets in the future in excess of their net recorded amount, we would make an adjustment to the deferred tax asset valuation allowance, which would reduce the provision for income taxes.
F-10
We record uncertain tax positions in accordance with the accounting standard on income taxes under a two-step process whereby (1) we determine whether it is more-likely-than-not that the tax positions will be sustained based on the technical merits of the position and (2) for those tax positions that meet the more-likely-than-not recognition threshold, we recognize the largest amount of tax benefit that is greater than 50 percent likely to be realized upon ultimate settlement with the related tax authority.
Foreign Currency Translation
The financial statements of subsidiaries outside the U.S., except those for which we have determined that the U.S. dollar is the functional currency, are measured using the local currency as the functional currency. Assets and liabilities of these subsidiaries are translated at the rates of exchange in effect at the balance sheet date. Income and expense items are translated at average monthly rates of exchange. The resulting gains and losses from the translation of accounts into U.S. dollars are included in accumulated other comprehensive income in our balance sheets. For all subsidiaries, gains and losses from remeasuring foreign currency accounts into the functional currency are included in other (income) expense, net, in our statements of operations. We recorded foreign currency gains of $6.4 million and foreign currency losses of $35.8 million and $7.8 million during the years ended December 31, 2016, 2015 and 2014, respectively. Included in our foreign currency gains and losses were non-cash gains of $9.3 million and non-cash losses of $30.1 million and $3.6 million during the years ended December 31, 2016, 2015 and 2014, respectively, from foreign currency exchange rate changes recorded on intercompany obligations. Of the foreign currency losses recognized during the year ended December 31, 2015, $29.7 million was attributable to our Brazil subsidiary’s U.S. dollar denominated intercompany obligations and were the result of a currency devaluation in Brazil and increases in our Brazil subsidiary’s intercompany payables during 2015.
During the second quarter of 2016, we entered into forward currency exchange contracts with a total notional value of $11.3 million that expired over varying dates through October 31, 2016. We entered into these foreign currency derivatives to offset exchange rate exposure related to intercompany loans to a subsidiary whose functional currency is the Brazilian Real. We did not designate these forward currency exchange contracts as hedge transactions. Changes in fair value and gains and losses on settlement on these forward currency exchange contracts were recognized in other (income) expense, net, in our statements of operations. During the year ended December 31, 2016, we recognized a loss of $0.7 million on forward currency exchange contracts. All of the forward currency exchange contracts that we entered into were settled prior to December 31, 2016.
Argentina’s regulations have at times restricted foreign exchange, including exchanging Argentine pesos for U.S. dollars, and during these periods we were unable to freely repatriate cash generated in Argentina to fund our other operations. In late 2015, following the election of a new president, some of the currency restrictions were lifted and we have been able to exchange Argentine pesos for U.S. dollars at market rates. Prior to the currency restrictions being lifted in Argentina in late 2015, we used Argentine pesos to purchase certain short-term investments in Argentine government issued U.S. dollar denominated bonds. The effective peso to U.S. dollar exchange rate embedded in the purchase price of these bonds resulted in our recognition of a loss during the years ended December 31, 2015 and 2014 of $4.9 million and $6.5 million, respectively, which is included in other (income) expense, net, in our statements of operations.
Financial Instruments
Our financial instruments consist of cash, restricted cash, receivables, payables and debt. At December 31, 2016 and 2015, the estimated fair values of these financial instruments approximated their carrying amounts as reflected in our balance sheets. See Note 11 for additional information regarding the fair value hierarchy. Due to the variable rate nature of our long-term debt, the carrying values approximate their fair values as the rates on our long-term debt are comparable to current market rates at which debt with similar terms could be obtained.
F-11
Recent Accounting Developments
In May 2014, the Financial Accounting Standards Board (“FASB”) issued Accounting Standards Update (“ASU”) 2014-09, Revenue from Contracts with Customers (Topic 606). The update outlines a single comprehensive model for companies to use in accounting for revenue arising from contracts with customers and supersedes the most current revenue recognition guidance, including industry-specific guidance. The core principle of the guidance is that an entity should recognize revenue to depict the transfer of promised goods or services to customers in an amount that reflects the consideration to which the entity expects to be entitled in exchange for those goods or services. The update also requires disclosures enabling users of financial statements to understand the nature, amount, timing and uncertainty of revenue and cash flows arising from contracts with customers. In March 2016, the FASB issued ASU 2016-08, Principal versus Agent Considerations (Reporting Revenue Gross versus Net), which clarifies the guidance in determining revenue recognition as principal versus agent. In April 2016, the FASB issued ASU 2016-10, Identifying Performance Obligations and Licensing, which provides guidance in accounting for immaterial performance obligations and shipping and handling activities. In May 2016, the FASB issued ASU 2016-12, Narrow-Scope Improvements and Practical Expedients, which provides clarification on assessing the collectibility criterion, presentation of sales taxes, measurement date for noncash consideration and completed contracts at transition. The updates will be effective for reporting periods beginning after December 15, 2017, including interim periods within the reporting period. Early adoption is permitted for reporting periods beginning after December 15, 2016. Companies may use either a full retrospective or a modified retrospective approach to adopt the updates. We intend to adopt the new guidance on January 1, 2018 using the modified retrospective approach. In preparation for our adoption of the new standard, we have obtained representative samples of contracts and other forms of agreements with our customers in the U.S. and international locations and are evaluating the provisions contained therein in light of the five-step model specified by the new guidance. This update could impact the timing and amounts of revenue recognized.
In July 2015, the FASB issued ASU No. 2015-11, Simplifying the Measurement of Inventory, which will require an entity to measure inventory at the lower of cost and net realizable value. Net realizable value is defined as the estimated selling prices in the ordinary course of business, less reasonably predictable costs of completion, disposal and transportation. This update will be effective on a prospective basis for interim and annual periods beginning after December 15, 2016, with early adoption permitted. We do not believe the adoption of this update will have a material impact on our financial statements.
In February 2016, the FASB issued ASU 2016-02, Leases (Topic 842). The update requires lessees to recognize assets and liabilities on the balance sheet for the rights and obligations created by long-term leases. Leases will be classified as either finance or operating, with classification affecting the pattern of expense recognition in the income statement. The update also requires certain qualitative and quantitative disclosures about the amount, timing and uncertainty of cash flows arising from leases. Accounting by lessors will remain largely unchanged. This update is effective for annual and interim periods beginning after December 15, 2018, with early adoption permitted. Adoption will require a modified retrospective approach beginning with the earliest period presented. We are currently evaluating the potential impact of the update on our financial statements.
In March 2016, the FASB issued ASU 2016-09, Compensation - Stock Compensation (Topic 718). The update covers such areas as the recognition of excess tax benefits and deficiencies, the classification of those excess tax benefits on the statement of cash flows, an accounting policy election for forfeitures, the amount an employer can withhold to cover income taxes and still qualify for equity classification and the classification of those taxes paid on the statement of cash flows. This update will be effective for reporting periods beginning after December 15, 2016, including interim periods within the reporting period. Early adoption is permitted. Upon adoption of this update, we currently plan to account for forfeitures as they occur rather than applying an estimated forfeiture rate. Additionally, the adoption of this update will impact our reported income taxes and cash flows from operating activities; however, the amount of such impacts is dependent upon the underlying vesting or exercise activity and related future stock prices.
In June 2016, the FASB issued ASU 2016-13, Financial Instruments—Credit Losses (Topic 326). The update changes the impairment model for most financial assets and certain other instruments, including trade and other receivables, held-to-maturity debt securities and loans, and requires entities to use a new forward-looking expected loss model that will result in the earlier recognition of allowance for losses. This update is effective for annual and interim periods beginning after December 15, 2019, with early adoption permitted. Adoption will require a modified retrospective approach beginning with the earliest period presented. We are currently evaluating the potential impact of the update on our financial statements.
In August 2016, the FASB issued ASU 2016-15, Statement of Cash Flows (Topic 230). The update addresses eight specific cash flow issues and is intended to reduce diversity in practice in how certain cash receipts and cash payments are presented and classified in the statement of cash flows. This update will be effective for reporting periods beginning after December 15, 2017, including interim periods within the reporting period. Early adoption is permitted. We are currently evaluating the potential impact of the update on our financial statements.
F-12
In October 2016, the FASB issued ASU 2016-16, Income Taxes (Topic 740): Intra-Entity Transfers of Assets Other Than Inventory. The update requires a reporting entity to recognize the tax expense from intra-entity asset transfers of assets other than inventory in the selling entity’s tax jurisdiction when the transfer occurs, even though the pre-tax effects of that transaction are eliminated in consolidation. Any deferred tax asset that arises in the buying entity’s jurisdiction would also be recognized at the time of the transfer. This update will be effective for reporting periods beginning after December 15, 2017, including interim periods within the reporting period. Early adoption is permitted. Adoption will require a modified retrospective approach beginning with the earliest period presented. We are currently evaluating the potential impact of the update on our financial statements.
In November 2016, the FASB issued ASU 2016-18, Restricted Cash. The guidance requires that a statement of cash flows explain the change during the period in the total of cash, cash equivalents and amounts generally described as restricted cash or restricted cash equivalents. This update will be effective for reporting periods beginning after December 15, 2017, including interim periods within the reporting period. Early adoption is permitted. The new guidance is effective for interim and annual periods beginning after December 15, 2017 and early adoption is permitted. The amendment should be adopted retrospectively. We have evaluated the effect that this guidance will have on our financial statement, and will result in the inclusion of our restricted cash balances with cash and cash equivalents to reflect total cash on our statements of cash flows.
3. Discontinued Operations
In June 2009, Petroleos de Venezuela S.A. (“PDVSA”) commenced taking possession of our assets and operations in a number of our locations in Venezuela, and by the end of the second quarter of 2009, PDVSA had assumed control over substantially all of our assets and operations in Venezuela. The expropriation of our business in Venezuela meets the criteria established for recognition as discontinued operations under GAAP. Therefore, our Venezuelan contract operations business is reflected as discontinued operations in our financial statements.
In March 2010, our Spanish subsidiary filed a request for the institution of an arbitration proceeding against Venezuela with the International Centre for Settlement of Investment Disputes (“ICSID”) related to the seized assets and investments under the agreement between Spain and Venezuela for the Reciprocal Promotion and Protection of Investments and under Venezuelan law. The arbitration hearing occurred in July 2012.
In August 2012, our Venezuelan subsidiary sold its previously nationalized assets to PDVSA Gas, S.A. (“PDVSA Gas”) for a purchase price of approximately $441.7 million. We received an initial payment of $176.7 million in cash at closing, of which we remitted $50.0 million to repay the amount we collected in January 2010 under the terms of an insurance policy we maintained for the risk of expropriation. We received installment payments, including an annual charge, totaling $38.8 million, $56.6 million and $72.6 million during the years ended December 31, 2016, 2015 and 2014, respectively. As of December 31, 2016, the remaining principal amount due to us was approximately $33 million. We have not recognized amounts payable to us by PDVSA Gas as a receivable and will therefore recognize payments received in the future as income from discontinued operations in the periods such payments are received. The proceeds from the sale of the assets are not subject to Venezuelan national taxes due to an exemption allowed under the Venezuelan Reserve Law applicable to expropriation settlements. In addition, and in connection with the sale, we and the Venezuelan government agreed to waive rights to assert certain claims against each other.
In connection with the sale of these assets, we have agreed to suspend the arbitration proceeding previously filed by our Spanish subsidiary against Venezuela pending payment in full by PDVSA Gas of the purchase price for these nationalized assets.
In accordance with the separation and distribution agreement, a subsidiary of Archrock has the right to receive payments from EESLP based on a notional amount corresponding to payments received by our subsidiaries from PDVSA Gas in respect of the sale of our previously nationalized assets promptly after such amounts are collected by our subsidiaries. Pursuant to the separation and distribution agreement, we transferred cash of $38.8 million to Archrock during the year ended December 31, 2016. The transfer of cash was recognized as a reduction to additional paid-in capital in our financial statements. See Note 21 for further discussion related to our contingent liability to Archrock.
F-13
In the first quarter of 2016, we began executing a plan to exit certain Belleli businesses to focus on our core oil and gas businesses. Specifically, we began marketing for sale the Belleli CPE business comprising of engineering, procurement and manufacturing services related to the manufacture of critical process equipment for refinery and petrochemical facilities (referred to as “Belleli CPE” or the “Belleli CPE business” herein). In addition, we began executing our exit of the Belleli EPC business that has historically been comprised of engineering, procurement and construction for the manufacture of tanks for tank farms and the manufacture of evaporators and brine heaters for desalination plants in the Middle East (referred to as “Belleli EPC” or the “Belleli EPC business” herein). Belleli CPE met the held for sale criteria and is reflected as discontinued operations in our financial statements for all periods presented. In August 2016, we completed the sale of our Belleli CPE business to Tosto S.r.l. for cash proceeds of $5.5 million. Belleli CPE was previously included in our former product sales segment. In conjunction with the planned disposition of Belleli CPE, we recorded impairments of long-lived assets and current assets that totaled $68.8 million during the year ended December 31, 2016. The impairment charges are reflected in income (loss) from discontinued operations, net of tax. In accordance with GAAP, Belleli EPC will be reflected as discontinued operations upon the substantial cessation of the remaining non-oil and gas business. During the first quarter of 2016, we ceased the booking of new orders for our Belleli EPC business. Our plan to exit our Belleli EPC business resulted in a reduction in the remaining useful lives of the assets that are currently used in the Belleli EPC business and a long-lived asset impairment charge of $0.7 million impacting results from continuing operations during the year ended December 31, 2016. Belleli EPC is represented by our Belleli EPC product sales segment.
The following table summarizes the operating results of discontinued operations (in thousands):
Years Ended December 31, | |||||||||||||||||||||||||||||||||||
2016 | 2015 | 2014 | |||||||||||||||||||||||||||||||||
Venezuela | Belleli CPE | Total | Venezuela | Belleli CPE | Total | Venezuela | Belleli CPE | Total | |||||||||||||||||||||||||||
Revenue | $ | — | $ | 28,469 | $ | 28,469 | $ | — | $ | 60,138 | $ | 60,138 | $ | — | $ | 42,947 | $ | 42,947 | |||||||||||||||||
Cost of sales (excluding depreciation and amortization expense) | — | 27,323 | 27,323 | — | 55,169 | 55,169 | — | 41,494 | 41,494 | ||||||||||||||||||||||||||
Selling, general and administrative | 54 | 4,229 | 4,283 | 185 | 3,396 | 3,581 | 479 | 4,323 | 4,802 | ||||||||||||||||||||||||||
Depreciation and amortization | — | 861 | 861 | — | 3,388 | 3,388 | — | 4,103 | 4,103 | ||||||||||||||||||||||||||
Long-lived asset impairment | — | 68,780 | 68,780 | — | — | — | — | — | — | ||||||||||||||||||||||||||
Recovery attributable to expropriation | (33,124 | ) | — | (33,124 | ) | (50,074 | ) | — | (50,074 | ) | (66,040 | ) | — | (66,040 | ) | ||||||||||||||||||||
Interest expense | — | 17 | 17 | — | (1 | ) | (1 | ) | — | 27 | 27 | ||||||||||||||||||||||||
Other (income) expense, net | (5,966 | ) | (134 | ) | (6,100 | ) | (6,243 | ) | (456 | ) | (6,699 | ) | (7,637 | ) | (985 | ) | (8,622 | ) | |||||||||||||||||
Income (loss) from discontinued operations, net of tax | $ | 39,036 | $ | (72,607 | ) | $ | (33,571 | ) | $ | 56,132 | $ | (1,358 | ) | $ | 54,774 | $ | 73,198 | $ | (6,015 | ) | $ | 67,183 | |||||||||||||
F-14
The following table summarizes the balance sheet data for discontinued operations (in thousands):
December 31, 2016 | December 31, 2015 | ||||||||||||||||||||||
Venezuela | Belleli CPE | Total | Venezuela | Belleli CPE | Total | ||||||||||||||||||
Cash | $ | 11 | $ | — | $ | 11 | $ | 177 | $ | — | $ | 177 | |||||||||||
Accounts receivable | — | — | — | — | 7,810 | 7,810 | |||||||||||||||||
Inventory | — | — | — | — | 431 | 431 | |||||||||||||||||
Costs and estimated earnings in excess of billings on uncompleted contracts | — | — | — | — | 17,666 | 17,666 | |||||||||||||||||
Other current assets | 3 | — | 3 | 14 | 6,825 | 6,839 | |||||||||||||||||
Total current assets associated with discontinued operations | 14 | — | 14 | 191 | 32,732 | 32,923 | |||||||||||||||||
Property, plant and equipment, net | — | — | — | — | 38,274 | 38,274 | |||||||||||||||||
Intangible and other assets, net | — | — | — | — | 7 | 7 | |||||||||||||||||
Total assets associated with discontinued operations | $ | 14 | $ | — | $ | 14 | $ | 191 | $ | 71,013 | $ | 71,204 | |||||||||||
Accounts payable | $ | — | $ | — | $ | — | $ | — | $ | 7,839 | $ | 7,839 | |||||||||||
Accrued liabilities | 906 | 207 | 1,113 | 1,249 | 2,556 | 3,805 | |||||||||||||||||
Billings on uncompleted contracts in excess of costs and estimated earnings | — | — | — | — | 2,001 | 2,001 | |||||||||||||||||
Total current liabilities associated with discontinued operations | 906 | 207 | 1,113 | 1,249 | 12,396 | 13,645 | |||||||||||||||||
Other long-term liabilities | 2 | — | 2 | 158 | 5,917 | 6,075 | |||||||||||||||||
Total liabilities associated with discontinued operations | $ | 908 | $ | 207 | $ | 1,115 | $ | 1,407 | $ | 18,313 | $ | 19,720 | |||||||||||
4. Inventory, net
Inventory, net of reserves, consisted of the following amounts (in thousands):
December 31, | |||||||
2016 | 2015 | ||||||
Parts and supplies | $ | 104,897 | $ | 133,558 | |||
Work in progress | 32,167 | 41,184 | |||||
Finished goods | 20,452 | 33,339 | |||||
Inventory, net | $ | 157,516 | $ | 208,081 | |||
During the years ended December 31, 2016, 2015 and 2014 we recorded $0.8 million, $15.6 million and $3.2 million, respectively, in inventory write-downs and reserves for inventory which was obsolete or slow moving. As of December 31, 2016 and 2015, we had inventory reserves of $12.9 million and $14.5 million, respectively. As discussed further in Note 14, during the year ended December 31, 2015, we recorded restructuring and other charges of $8.7 million related to inventory write-downs associated with restructuring activities.
F-15
5. Product Sales Contracts
Costs, estimated earnings (losses) and billings on uncompleted contracts that are recognized using the percentage-of-completion method consisted of the following (in thousands):
December 31, | |||||||
2016 | 2015 | ||||||
Costs incurred on uncompleted contracts | $ | 558,274 | $ | 664,229 | |||
Estimated earnings (losses) on uncompleted contracts (1) | (10,370 | ) | 44,915 | ||||
547,904 | 709,144 | ||||||
Less — billings to date on uncompleted contracts | (558,064 | ) | (681,741 | ) | |||
$ | (10,160 | ) | $ | 27,403 | |||
(1) | Estimated earnings (losses) on uncompleted contracts includes $56.4 million and $40.9 million of cumulative losses realized on uncompleted Belleli EPC product sales contracts as of December 31, 2016 and 2015, respectively. Estimated earnings (losses) on uncompleted contracts as of December 31, 2016 and 2015 excludes estimated accrued loss contract provisions on uncompleted Belleli EPC product sales contracts recognized but not realized of $28.6 million and $43.7 million, respectively. Accrued loss contract provisions are included in accrued liabilities in our balance sheets. |
Costs, estimated earnings and billings on uncompleted contracts are presented in the accompanying financial statements as follows (in thousands):
December 31, | |||||||
2016 | 2015 | ||||||
Costs and estimated earnings in excess of billings on uncompleted contracts | $ | 31,956 | $ | 65,311 | |||
Billings on uncompleted contracts in excess of costs and estimated earnings | (42,116 | ) | (37,908 | ) | |||
$ | (10,160 | ) | $ | 27,403 | |||
6. Property, Plant and Equipment, net
Property, plant and equipment, net, consisted of the following (in thousands):
December 31, | |||||||
2016 | 2015 | ||||||
Compression equipment, facilities and other fleet assets | $ | 1,480,568 | $ | 1,527,328 | |||
Land and buildings | 110,378 | 117,247 | |||||
Transportation and shop equipment | 140,128 | 144,413 | |||||
Other | 95,817 | 99,035 | |||||
1,826,891 | 1,888,023 | ||||||
Accumulated depreciation | (1,029,082 | ) | (1,029,835 | ) | |||
Property, plant and equipment, net | $ | 797,809 | $ | 858,188 | |||
Depreciation expense was $134.2 million, $149.5 million and $163.7 million during the years ended December 31, 2016, 2015 and 2014, respectively. During the year ended December 31, 2016, we retired $81.9 million of fully depreciated capitalized installation costs relating to a contract operations project in the Eastern Hemisphere that early terminated operations in January 2016. Assets under construction of $39.6 million and $65.6 million were primarily included in compression equipment, facilities and other fleet assets at December 31, 2016 and 2015, respectively. We capitalized $0.3 million and $0.1 million of interest related to construction in process during the years ended December 31, 2016 and 2015, respectively.
F-16
7. Intangible and Other Assets, net
Intangible and other assets, net, consisted of the following (in thousands):
December 31, | |||||||
2016 | 2015 | ||||||
Intangible assets, net | $ | 12,945 | $ | 17,809 | |||
Recoverable foreign social security tax | 8,174 | 5,086 | |||||
Deferred financing costs | 6,475 | 7,399 | |||||
Notes receivable | 4,849 | 1,279 | |||||
Other | 26,553 | 19,960 | |||||
Intangibles and other assets, net | $ | 58,996 | $ | 51,533 | |||
Intangible assets and deferred financing costs consisted of the following (in thousands):
December 31, 2016 | December 31, 2015 | ||||||||||||||
Gross Carrying Amount | Accumulated Amortization | Gross Carrying Amount | Accumulated Amortization | ||||||||||||
Deferred financing costs (1) | $ | 8,368 | $ | (1,893 | ) | $ | 7,673 | $ | (274 | ) | |||||
Marketing related (20 year life) | 582 | (541 | ) | 2,537 | (1,759 | ) | |||||||||
Customer related (17-20 year life) | 76,674 | (64,151 | ) | 78,271 | (61,888 | ) | |||||||||
Technology based (20 year life) | 3,381 | (3,155 | ) | 3,252 | (3,014 | ) | |||||||||
Contract based (2-11 year life) | 43,921 | (43,766 | ) | 43,930 | (43,520 | ) | |||||||||
Intangible assets and deferred financing costs | $ | 132,926 | $ | (113,506 | ) | $ | 135,663 | $ | (110,455 | ) | |||||
(1) | Represents debt issuance costs relating to our revolving credit facility. See Note 10 for further discussion regarding our revolving credit facility. |
Amortization of deferred financing costs related to our revolving credit facility totaled $1.6 million and $0.3 million during the years ended December 31, 2016 and 2015, respectively, and was recorded to interest expense in our statements of operations. Amortization of intangible assets totaled $3.8 million, $5.3 million and $6.4 million during the years ended December 31, 2016, 2015 and 2014, respectively.
Estimated future intangible amortization expense is as follows (in thousands):
2017 | $ | 3,058 | |
2018 | 2,331 | ||
2019 | 1,881 | ||
2020 | 1,559 | ||
2021 | 1,269 | ||
Thereafter | 2,847 | ||
Total | $ | 12,945 | |
8. Investments in Non-Consolidated Affiliates
Investments in affiliates that are not controlled by us where we have the ability to exercise significant influence over the operations are accounted for using the equity method.
F-17
We own a 30.0% interest in WilPro Energy Services (PIGAP II) Limited and 33.3% interest in WilPro Energy Services (El Furrial) Limited which are joint ventures that provided natural gas compression and injection services in Venezuela. In May 2009, PDVSA assumed control over the assets of our Venezuelan joint ventures and transitioned the operations, including the hiring of their employees, to PDVSA. In March 2011, our Venezuelan joint ventures, together with the Netherlands’ parent company of our joint venture partners, filed a request for the institution of an arbitration proceeding against Venezuela with ICSID related to the seized assets and investments.
In March 2012, our Venezuelan joint ventures sold their assets to PDVSA Gas. We received an initial payment of $37.6 million in March 2012, and received installment payments, including an annual charge, totaling $10.4 million, $15.2 million and $14.7 million during the years ended December 31, 2016, 2015 and 2014, respectively. As of December 31, 2016, the remaining principal amount due to us was approximately $4 million. We have not recognized amounts payable to us by PDVSA Gas as a receivable and will therefore recognize payments received in the future as equity in income of non-consolidated affiliates in our statements of operations in the periods such payments are received. In connection with the sale of our Venezuelan joint ventures’ assets, the joint ventures and our joint venture partners have agreed to suspend their previously filed arbitration proceeding against Venezuela pending payment in full by PDVSA Gas of the purchase price for the assets.
In accordance with the separation and distribution agreement, a subsidiary of Archrock has the right to receive payments from EESLP based on a notional amount corresponding to payments received by our subsidiaries from PDVSA Gas in respect of the sale of our joint ventures’ previously nationalized assets promptly after such amounts are collected by our subsidiaries. Pursuant to the separation and distribution agreement, we transferred cash of $10.4 million to Archrock during the year ended December 31, 2016. The transfer of cash was recognized as a reduction to additional paid-in capital in our financial statements. See Note 21 for further discussion related to our contingent liability to Archrock.
9. Accrued Liabilities
Accrued liabilities consisted of the following (in thousands):
December 31, | |||||||
2016 | 2015 | ||||||
Accrued salaries and other benefits | $ | 52,247 | $ | 48,440 | |||
Accrued income and other taxes | 43,336 | 37,046 | |||||
Accrued loss contract provisions | 31,452 | 45,422 | |||||
Accrued warranty expense | 4,412 | 7,873 | |||||
Accrued interest | 2,889 | 2,454 | |||||
Accrued start-up and commissioning expenses | 1,055 | 2,695 | |||||
Accrued other liabilities | 27,401 | 31,911 | |||||
Accrued liabilities | $ | 162,792 | $ | 175,841 | |||
Our warranty expense was $3.2 million, $3.6 million and $10.7 million during the years ended December 31, 2016, 2015 and 2014, respectively. During 2014, we accrued $7.0 million of warranty expense on one project for a single customer.
F-18
10. Long-Term Debt
Long-term debt consisted of the following (in thousands):
December 31, | |||||||
2016 | 2015 | ||||||
Revolving credit facility due November 2020 | $ | 118,000 | $ | 285,000 | |||
Term loan facility due November 2017 | 232,750 | 245,000 | |||||
Other, interest at various rates, collateralized by equipment and other assets | 583 | 836 | |||||
Unamortized deferred financing costs | (2,363 | ) | (5,243 | ) | |||
Long-term debt | $ | 348,970 | $ | 525,593 | |||
Revolving Credit Facility and Term Loan
On July 10, 2015, we and our wholly owned subsidiary, EESLP, entered into a $750.0 million credit agreement (the “Credit Agreement”) with Wells Fargo, as the administrative agent, and various financial institutions as lenders. On October 5, 2015, the parties amended and restated the Credit Agreement to provide for a $925.0 million credit facility, consisting of a $680.0 million revolving credit facility and a $245.0 million term loan facility (collectively, the “Credit Facility”). The Credit Facility became available to us on November 3, 2015 (referred to as the “Initial Availability Date”). On November 3, 2015, EESLP incurred approximately $300.0 million of indebtedness under the revolving credit facility and $245.0 million of indebtedness under the term loan facility. Pursuant to the separation and distribution agreement with Archrock and certain of our and Archrock’s respective affiliates, on November 3, 2015, EESLP transferred $532.6 million of net proceeds from borrowings under the Credit Facility to Archrock to allow it to repay a portion of its indebtedness in connection with the Spin-off. In accordance with the Credit Agreement, we are required to repay borrowings outstanding under the term loan facility on each anniversary of the Initial Availability Date in an amount equal to the lesser of (i) $12.3 million and (ii) the outstanding principal balance of the term loan facility. In November 2016, we repaid $12.3 million of borrowings outstanding under the term loan facility. The principal amount of $232.8 million due in November 2017 under the term loan facility is classified as long-term in our balance sheet at December 31, 2016 because we have the intent and ability to refinance the current principal amount due with borrowings under our existing revolving credit facility.
On April 22, 2016, June 17, 2016, August 24, 2016 and November 22, 2016, we and our wholly owned subsidiary, EESLP, entered into amendments to the Credit Agreement with Wells Fargo, as the administrative agent, and various financial institutions as lenders. These amendments to the Credit Agreement, among other things:
• | waived any potential event of default arising under the Credit Agreement as a result of the potential inaccuracy of certain representations and warranties regarding our prior period financial information and previously delivered compliance certificate for the 2015 fiscal year; |
• | provides that LIBOR loans will bear interest at LIBOR plus 2.75% and base rate loans will bear interest at the Base Rate plus 1.75% until January 4, 2017; |
• | adds a condition precedent to the borrowing of loans that, after giving effect to the application of the proceeds of each borrowing, our consolidated cash balance of group members (as defined in the amended Credit Agreement) will not exceed $30,000,000 plus certain other amounts; and |
• | amends the definition of EBITDA to allow adjustments for certain Restructuring Costs and Restatement Costs (in each case as defined in the amended Credit Agreement) to the extent such costs were incurred during the years ending December 31, 2016 and 2017. |
As of December 31, 2016, we had $118.0 million in outstanding borrowings and $57.1 million in outstanding letters of credit under our revolving credit facility. At December 31, 2016, taking into account guarantees through letters of credit, we had undrawn capacity of $504.9 million under our revolving credit facility. Our Credit Agreement limits our Total Debt (as defined in the Credit Agreement) to EBITDA (as defined in the Credit Agreement) ratio on the last day of the fiscal quarter to not greater than 3.75 to 1.0 (which will increase to 4.50 to 1.0 following the completion of a qualified capital raise). As a result of this limitation, $226.9 million of the $504.9 million of undrawn capacity under our revolving credit facility was available for additional borrowings as of December 31, 2016. Because this limitation considers all of our outstanding debt obligations, the additional borrowings available to us are in excess of borrowings needed under our revolving credit facility to refinance the current principal amount due under the term loan facility.
F-19
Revolving borrowings under the Credit Facility bear interest at a rate equal to, at our option, either the Base Rate or LIBOR (or EURIBOR, in the case of Euro-denominated borrowings) plus the applicable margin. The applicable margin for revolving borrowings varies (i) in the case of LIBOR loans, from 1.50% to 2.75% and (ii) in the case of Base Rate loans, from 0.50% to 1.75%, and will be determined based on our total leverage ratio pricing grid. “Base Rate” means the highest of the prime rate, the federal funds effective rate plus 0.50% and one-month LIBOR plus 1.00%. Until the term loan facility is refinanced in full with the proceeds of a qualified capital raise (as defined in the Credit Agreement), the applicable margin for borrowings under the revolving credit facility will be increased by 1.00% until the first anniversary of the Initial Availability Date and by 1.50% following the first anniversary of the Initial Availability Date. Term loan borrowings under the Credit Facility will bear interest at a rate equal to, at our option, either (1) the Base Rate plus 4.75%, or (2) the greater of LIBOR or 1.00%, plus 5.75%. The weighted average annual interest rate on outstanding borrowings under the revolving credit facility at December 31, 2016 and 2015 was 5.0% and 3.1%, respectively. The annual interest rate on the outstanding balance of the term loan facility at December 31, 2016 and 2015 was 6.8%.
We guarantee EESLP’s obligations under the Credit Facility. In addition, EESLP’s obligations under the Credit Facility are secured by (1) substantially all of our assets and the assets of EESLP and our Significant Domestic Subsidiaries (as defined in the Credit Agreement), including certain real property, and (2) all of the equity interests of our U.S. restricted subsidiaries (other than certain excluded subsidiaries) (as defined in the Credit Agreement) and 65% of the voting equity interests in certain of our first-tier foreign subsidiaries.
We are required to prepay borrowings outstanding under the term loan facility with the net proceeds of certain asset sales, equity issuances, debt incurrences and other events (subject to, in certain circumstances, our right to reinvest the proceeds within a specified period). In addition, if the total leverage ratio (as defined in the Credit Agreement) as of the last day in any fiscal year is greater than 2.50 to 1.00, we are required to prepay borrowings outstanding under the term loan facility with a portion of Excess Cash Flow (as defined in the Credit Agreement) for that fiscal year equal to (a) 50% of Excess Cash Flow if the total leverage ratio is greater than 3.00 to 1.00 or (b) 25% of Excess Cash Flow if the total leverage ratio is greater than 2.50 to 1.00 but less than or equal to 3.00 to 1.00.
Unamortized Debt Financing Costs
During the year ended December 31, 2015, we incurred transaction costs of $13.3 million related to our Credit Agreement, of which $7.7 million and $5.6 million related to our revolving credit facility and term loan facility, respectively. Debt issuance costs relating to our term loan facility are presented as a direct deduction from the carrying value of the facility, and are being amortized over the term of the facility. Amortization of deferred financing costs relating to the term loan facility totaled $2.9 million and $0.4 million during the years ended December 31, 2016 and 2015, respectively, and was recorded to interest expense in our statements of operations. During the year ended December 31, 2016, we incurred transaction costs of approximately $0.8 million related to our revolving credit facility. Debt issuance costs relating to our revolving credit facility are included in intangible and other assets, net, and are being amortized over the term of the facility. See Note 7 for further discussion regarding the amortization of deferred financing costs relating to our revolving credit facility.
Debt Compliance
The Credit Agreement contains various covenants with which we, EESLP and our respective restricted subsidiaries must comply, including, but not limited to, limitations on the incurrence of indebtedness, investments, liens on assets, repurchasing equity, making distributions, transactions with affiliates, mergers, consolidations, dispositions of assets and other provisions customary in similar types of agreements. We are required to maintain, on a consolidated basis, a minimum interest coverage ratio (as defined in the Credit Agreement) of 2.25 to 1.00; a maximum total leverage ratio (as defined in the Credit Agreement) of 3.75 to 1.00 prior to the completion of a qualified capital raise and 4.50 to 1.00 thereafter; and, following the completion of a qualified capital raise, a maximum senior secured leverage ratio (as defined in the Credit Agreement) of 2.75 to 1.00. As of December 31, 2016, we were in compliance with all financial covenants under the Credit Agreement.
F-20
Long-Term Debt Maturity Schedule
Contractual maturities of long-term debt (excluding interest to be accrued thereon) at December 31, 2016 are as follows (in thousands):
December 31, 2016 | |||||
2017 | $ | 232,750 | (1) | ||
2018 | 253 | ||||
2019 | 253 | ||||
2020 | 118,077 | ||||
2021 | — | ||||
Thereafter | — | ||||
Total debt | $ | 351,333 | (1) | ||
(1) | The principal amount of $232.8 million due in November 2017 under the term loan facility is classified as long-term in our balance sheet at December 31, 2016 because we have the intent and ability to refinance the current principal amount due with borrowings under our existing revolving credit facility. These amounts include the full face value of the term loan facility and have not been reduced by the aggregate unamortized debt financing costs of $2.4 million as of December 31, 2016. |
11. Fair Value Measurements
The accounting standard for fair value measurements and disclosures establishes a fair value hierarchy that prioritizes the inputs to valuation techniques used to measure fair value into the following three broad categories:
• | Level 1 — Quoted unadjusted prices for identical instruments in active markets to which we have access at the date of measurement. |
• | Level 2 — Quoted prices for similar instruments in active markets; quoted prices for identical or similar instruments in markets that are not active; and model-derived valuations in which all significant inputs and significant value drivers are observable in active markets. Level 2 inputs are those in markets for which there are few transactions, the prices are not current, little public information exists or prices vary substantially over time or among brokered market makers. |
• | Level 3 — Model derived valuations in which one or more significant inputs or significant value drivers are unobservable. Unobservable inputs are those inputs that reflect our own assumptions regarding how market participants would price the asset or liability based on the best available information. |
The following table presents our assets and liabilities measured at fair value on a nonrecurring basis during the years ended December 31, 2016 and 2015, with pricing levels as of the date of valuation (in thousands):
Year Ended December 31, 2016 | Year Ended December 31, 2015 | ||||||||||||||||||||||
(Level 1) | (Level 2) | (Level 3) | (Level 1) | (Level 2) | (Level 3) | ||||||||||||||||||
Impaired long-lived assets (1) | $ | — | $ | — | $ | 3,109 | $ | — | $ | — | $ | 995 | |||||||||||
Impaired assets—Discontinued operations (2) | — | — | 13,859 | — | — | — | |||||||||||||||||
Note receivable from the sale of a plant (3) | — | — | 7,037 | — | — | — | |||||||||||||||||
Liability to exit the use of a corporate operating lease—restructuring and other charges (4) | — | — | 3,580 | — | — | — | |||||||||||||||||
Long-term receivable from the sale of our Canadian Operations (5) | — | — | — | — | — | 5,100 | |||||||||||||||||
(1) | Our estimate of the impaired long-lived assets’ fair value during the years ended December 31, 2016 and 2015 was primarily based on either the expected net sale proceeds compared to other fleet units we recently sold and/or a review of other units recently offered for sale by third parties, or the estimated component value of the equipment we plan to use. |
(2) | Our estimate of the fair value of the impaired assets of Belleli CPE, which were classified as discontinued operations, during the year ended December 31, 2016 was based on the proceeds received from the sale of Belleli CPE, net of selling costs. |
(3) | Our estimate of the fair value of the note receivable from the sale of our plant in Argentina during the year ended December 31, 2016 was discounted based on a settlement period, with annual payments, of 2.6 years and a discount rate of 5%. |
(4) | The fair value of our liability to exit the use of a corporate operating lease relating to restructuring activities during the second quarter of 2016 was estimated based on an incremental borrowing rate of 3% and remaining lease payments, net of estimated sublease rentals, through February 2018. |
(5) | In April 2015, we accepted an offer to early settle the outstanding note receivable due to us relating to the previous sale of our Canadian contract operations and aftermarket services businesses (“Canadian Operations”) for $5.1 million. |
12. Long-Lived Asset Impairment
We review long-lived assets, including property, plant and equipment and identifiable intangibles that are being amortized, for impairment whenever events or changes in circumstances, including the removal of compressor units from our active fleet, indicate that the carrying amount of an asset may not be recoverable.
We regularly review the future deployment of our idle compression assets used in our contract operations segment for units that are not of the type, configuration, condition, make or model that are cost efficient to maintain and operate. During the year ended December 31, 2016, we determined that 62 idle compressor units totaling approximately 65,000 horsepower would be retired from the active fleet. The retirement of these units from the active fleet triggered a review of these assets for impairment. As a result, we recorded a $12.7 million asset impairment to reduce the book value of each unit to its estimated fair value during the year ended December 31, 2016. During the year ended December 31, 2015, we determined that 93 idle compressor units totaling approximately 72,000 horsepower would be retired from the active fleet. The retirement of these units from the active fleet triggered a review of these assets for impairment. As a result, we recorded a $19.4 million asset impairment to reduce the book value of each unit to its estimated fair value during the year ended December 31, 2015. During the year ended December 31, 2014, we evaluated the future deployment of our idle fleet and determined to retire approximately 20 idle compressor units, representing approximately 18,000 horsepower, previously used to provide services in our contract operations segment. As a result, we performed an impairment review and recorded a $2.8 million asset impairment to reduce the book value of each unit to its estimated fair value during the year ended December 31, 2014. In connection with our fleet review during 2014, we evaluated for impairment idle units that had been culled from our fleet in prior years and were available for sale. Based upon that review, we reduced the expected proceeds from disposition for certain of the remaining units. This resulted in an additional impairment of $1.1 million to reduce the book value of each unit to its estimated fair value during the year ended December 31, 2014. The fair value of each unit was estimated based on either the expected net sale proceeds compared to other fleet units we recently sold and/or a review of other units recently offered for sale by third parties, or the estimated component value of the equipment on each compressor unit that we plan to use.
As discussed in Note 3, in the first quarter of 2016, we began executing a plan to exit our Belleli EPC business to focus on our core oil and gas businesses. Because we ceased the booking of new orders for the manufacture of tanks for tank farms and the manufacture of evaporators and brine heaters for desalination plants, customer relationship intangible assets related to our Belleli EPC business were assessed to have no future benefit to us. As a result, we recorded a long-lived asset impairment charge of $0.7 million during the year ended December 31, 2016. In addition, the property, plant and equipment of our Belleli EPC business was reviewed for recoverability. As a result, the remaining useful lives of Belleli EPC non-oil and gas property, plant and equipment were reduced to reflect their estimated cessation date.
During the year ended December 31, 2016, we evaluated other assets for impairment and recorded long-lived asset impairments of $1.7 million on these assets.
F-21
During the first quarter of 2015, we evaluated a long-term note receivable from the purchaser of our Canadian Operations for impairment. This review was triggered by an offer from the purchaser of our Canadian Operations to prepay the note receivable at a discount to its then current book value. The fair value of the note receivable as of March 31, 2015 was based on the amount offered by the purchaser of our Canadian Operations to prepay the note receivable. The difference between the book value of the note receivable at March 31, 2015 and its fair value resulted in the recording of an impairment of long-lived assets of $1.4 million. In April 2015, we accepted the offer to early settle this note receivable.
13. Restatement Charges
During the first quarter of 2016, our senior management identified errors relating to the application of percentage-of-completion accounting principles to specific Belleli EPC product sales projects. As a result, the Audit Committee of the Company’s Board of Directors initiated an internal investigation, including the use of services of a forensic accounting firm. Management also engaged a consulting firm to assist in accounting analysis and compilation of restatement adjustments. During the year ended December 31, 2016, we incurred $30.1 million of costs associated with the restatement of our financial statements and current SEC investigation, of which $11.2 million of cash was recovered from Archrock in the fourth quarter of 2016 pursuant to the separation and distribution agreement. We expect that we will incur additional cash expenditures in subsequent periods related to external legal counsel costs associated with the current SEC investigation surrounding the restatement of our financial statements, some portion of which might be recoverable from Archrock.
The following table summarizes the changes to our accrued liability balance related to restatement charges for the year ended December 31, 2016 (in thousands):
Restatement Charges | |||
Beginning balance at January 1, 2016 | $ | — | |
Additions for costs expensed, net | 18,879 | ||
Reductions for payments, net | (16,667 | ) | |
Ending balance at December 31, 2016 | $ | 2,212 | |
The following table summarizes the components of charges included in restatement charges in our statements of operations for the year ended December 31, 2016 (in thousands):
Year Ended December 31, 2016 | |||
External accounting costs | $ | 21,073 | |
External legal costs | 7,565 | ||
Other | 1,448 | ||
Recoveries from Archrock | (11,207 | ) | |
Total restatement charges | $ | 18,879 | |
14. Restructuring and Other Charges
We incurred restructuring and other charges associated with the Spin-off of $3.9 million and $15.7 million during the years ended December 31, 2016 and 2015, respectively. Costs incurred during the year ended December 31, 2016 were primarily related to retention awards to certain employees of $3.1 million, which are being amortized over the required service period of each applicable employee. Costs incurred during the year ended December 31, 2015 were related to non-cash inventory write-downs, financial advisor fees of $4.6 million paid at the completion of the Spin-off, expenses of $3.1 million for retention awards to certain employees, a one-time cash signing bonus paid to our new Chief Executive Officer of $2.0 million and costs to start-up certain stand-alone functions of $1.3 million. Non-cash inventory write-downs primarily related to the decentralization of shared inventory components between Archrock’s North America contract operations business and our international contract operations business totaled $4.7 million during the year ended December 31, 2015, of which approximately $4.2 million related to our international contract operations segment and $0.5 million related to our oil and gas product sales segment. The charges incurred in conjunction with the Spin-off are included in restructuring and other charges in our statements of operations. We currently estimate that we will incur additional one-time expenditures of approximately $1.9 million related to retention awards to certain employees in the form of cash and stock-based compensation through November 2017.
F-22
As a result of unfavorable market conditions in North America, combined with the impact of lower international activity due to customer budget cuts driven by lower oil prices, in the second quarter of 2015, we announced a cost reduction plan primarily focused on workforce reductions and the reorganization of certain facilities. We incurred restructuring and other charges associated with the cost reduction plan of $23.5 million and $15.6 million during the years ended December 31, 2016 and 2015, respectively. Restructuring and other charges incurred during the year ended December 31, 2016 were primarily related to employee termination benefits and the exit from a leased corporate building. Costs incurred for employee termination benefits during the year ended December 31, 2016 were $19.9 million, of which $9.0 million related to our oil and gas product sales segment and $5.4 million related to our Belleli EPC product sales segment. We ceased the use of a corporate building under an operating lease in the second quarter of 2016, and as a result, recorded net charges of $2.9 million during the year ended December 31, 2016. Restructuring and other charges incurred during the year ended December 31, 2015 were primarily related to employee termination benefits, non-cash inventory write-downs and consulting fees. Costs incurred for employee termination benefits during the year ended December 31, 2015 were $9.6 million, of which $6.4 million related to our oil and gas product sales business. The non-cash inventory write-downs of $4.0 million were the result of our decision to exit the manufacturing of cold weather packages, which had historically been performed at an oil and gas product sales facility in North America we decided to close in 2015. The charges incurred in conjunction with the cost reduction plan are included in restructuring and other charges in our statements of operations. Accrued liabilities related to the cost reduction plan, which are expected to be settled within the next twelve months with cash payments, are based on estimates that may vary significantly from actual costs depending, in part, upon factors that may be beyond our control. We will continue to review the status of our restructuring obligations on a quarterly basis and, if appropriate, record changes to these obligations in current operations based on management’s most current estimates.
The following table summarizes the changes to our accrued liability balance related to restructuring and other charges for the years ended December 31, 2015 and 2016 (in thousands):
Spin-off | Cost Reduction Plan | Total | |||||||||
Beginning balance at January 1, 2015 | $ | — | $ | — | $ | — | |||||
Additions for costs expensed | 15,749 | 15,566 | 31,315 | ||||||||
Less non-cash expense | (4,843 | ) | (4,007 | ) | (8,850 | ) | |||||
Reductions for payments | (9,823 | ) | (11,334 | ) | (21,157 | ) | |||||
Ending balance at December 31, 2015 | 1,083 | 225 | 1,308 | ||||||||
Additions for costs expensed | 3,943 | 24,386 | 28,329 | ||||||||
Deductions for gains realized | — | (872 | ) | (872 | ) | ||||||
Less non-cash expense | (896 | ) | (437 | ) | (1,333 | ) | |||||
Less non-cash income | — | 872 | 872 | ||||||||
Reductions for payments | (3,196 | ) | (16,289 | ) | (19,485 | ) | |||||
Ending balance at December 31, 2016 | $ | 934 | $ | 7,885 | $ | 8,819 | |||||
The following table summarizes the components of charges included in restructuring and other charges in our statements of operations for the years ended December 31, 2016 and 2015 (in thousands):
Years Ended December 31, | |||||||
2016 | 2015 | ||||||
Financial advisor fees related to the Spin-off | $ | — | $ | 4,598 | |||
Consulting fees | 22 | 1,932 | |||||
Start-up of stand-alone functions | 887 | 1,332 | |||||
Retention awards to certain employees | 3,056 | 3,121 | |||||
Chief Executive Officer signing bonus | — | 2,000 | |||||
Non-cash inventory write-downs | — | 8,707 | |||||
Employee termination benefits | 19,892 | 9,625 | |||||
Net charges to exit the use of a corporate operating lease | 2,904 | — | |||||
Other | 696 | — | |||||
Total restructuring and other charges | $ | 27,457 | $ | 31,315 | |||
F-23
Additionally, in the first quarter of 2016, we began executing a plan to exit our Belleli EPC business to focus on our core oil and gas businesses. Our plan to exit our Belleli EPC business resulted in a reduction in the remaining useful lives of the assets that are currently used in the Belleli EPC business and a long-lived asset impairment charge of $0.7 million impacting results from continuing operations during the year ended December 31, 2016. See Note 12 for further discussion relating to this impairment charge and Note 3 for further discussion related to our plan to exit our Belleli businesses.
15. Income taxes
Prior to the Spin-off, certain of our operations in the U.S. were included in Archrock’s consolidated federal and state tax returns, and therefore our current and deferred tax provision for applicable periods was computed on a separate return basis. Subsequent to the Spin-off, we file our own consolidated federal and state tax returns in the U.S.
The components of income (loss) before income taxes were as follows (in thousands):
Years Ended December 31, | |||||||||||
2016 | 2015 | 2014 | |||||||||
United States | $ | (129,864 | ) | $ | (7,702 | ) | $ | 84,161 | |||
Foreign | 60,258 | 19,122 | 42,990 | ||||||||
Income (loss) before income taxes | $ | (69,606 | ) | $ | 11,420 | $ | 127,151 | ||||
The provision for income taxes consisted of the following (in thousands):
Years Ended December 31, | |||||||||||
2016 | 2015 | 2014 | |||||||||
Current tax provision (benefit): | |||||||||||
U.S. federal | $ | (131 | ) | $ | 383 | $ | 6,105 | ||||
State | (792 | ) | 1,201 | 2,136 | |||||||
Foreign | 54,076 | 63,692 | 56,029 | ||||||||
Total current | 53,153 | 65,276 | 64,270 | ||||||||
Deferred tax provision (benefit): | |||||||||||
U.S. federal | 62,672 | (29,962 | ) | 12,434 | |||||||
State | 2,306 | (484 | ) | (753 | ) | ||||||
Foreign | 6,629 | 4,716 | 3,091 | ||||||||
Total deferred | 71,607 | (25,730 | ) | 14,772 | |||||||
Provision for income taxes | $ | 124,760 | $ | 39,546 | $ | 79,042 | |||||
F-24
The provision for income taxes for 2016, 2015 and 2014 resulted in effective tax rates on continuing operations of (179.2)%, 346.3% and 62.2%, respectively. The reasons for the differences between these effective tax rates and the U.S. statutory rate of 35% are as follows (in thousands):
Years Ended December 31, | |||||||||||
2016 | 2015 | 2014 | |||||||||
Income taxes at U.S. federal statutory rate of 35% | $ | (24,362 | ) | $ | 3,998 | $ | 44,503 | ||||
Net state income taxes | (1,841 | ) | 466 | 976 | |||||||
Foreign taxes | 38,211 | 38,052 | 32,991 | ||||||||
Foreign tax credits | (9,492 | ) | (17,398 | ) | (10,942 | ) | |||||
Research and development credits | (1,024 | ) | (24,938 | ) | — | ||||||
Unrecognized tax benefits | 4,051 | 6,187 | 403 | ||||||||
Valuation allowances | 123,892 | 38,284 | 17,846 | ||||||||
Proceeds from sale of joint venture assets | (3,641 | ) | (5,315 | ) | (5,162 | ) | |||||
Capital contributions or distributions related to Spin-off | (2,887 | ) | (77 | ) | — | ||||||
Other | 1,853 | 287 | (1,573 | ) | |||||||
Provision for income taxes | $ | 124,760 | $ | 39,546 | $ | 79,042 | |||||
Deferred income tax balances are the direct effect of temporary differences between the financial statement carrying amounts and the tax basis of assets and liabilities using enacted tax rates in effect for the year in which the differences are expected to reverse. The tax effects of temporary differences that give rise to deferred tax assets and deferred tax liabilities are as follows (in thousands):
December 31, | |||||||
2016 | 2015 | ||||||
Deferred tax assets: | |||||||
Net operating loss carryforwards | $ | 172,851 | $ | 134,448 | |||
Foreign tax credit carryforwards | 81,510 | 72,019 | |||||
Research and development credit carryforwards | 31,251 | 31,251 | |||||
Alternative minimum tax credit carryforwards | 5,055 | 5,145 | |||||
Deferred revenue | 52,229 | 44,821 | |||||
Other | 50,797 | 46,045 | |||||
Subtotal | 393,693 | 333,729 | |||||
Valuation allowances | (318,887 | ) | (186,993 | ) | |||
Total deferred tax assets | 74,806 | 146,736 | |||||
Deferred tax liabilities: | |||||||
Property, plant and equipment | (64,876 | ) | (73,491 | ) | |||
Other | (15,615 | ) | (9,654 | ) | |||
Total deferred tax liabilities | (80,491 | ) | (83,145 | ) | |||
Net deferred tax assets (liabilities) | $ | (5,685 | ) | $ | 63,591 | ||
At December 31, 2016, we had U.S. federal net operating loss carryforwards of approximately $159.1 million that are available to offset future taxable income. If not used, the carryforwards begin to expire in 2024. We also had approximately $394.6 million of net operating loss carryforwards in certain foreign jurisdictions (excluding discontinued operations), approximately $256.4 million of which has no expiration date, $67.8 million of which is subject to expiration from 2017 to 2021, and the remainder of which expires in future years through 2036. Foreign tax credit carryforwards of $81.5 million, research and development credits carryforwards of $31.3 million and alternative minimum tax credit carryforwards of $5.1 million are available to offset future payments of U.S. federal income tax. The foreign tax credits will expire in varying amounts beginning in 2020 and research and development credits will expire in varying amounts beginning in 2028, whereas the alternative minimum tax credits may be carried forward indefinitely under current U.S. tax law.
F-25
We record valuation allowances when it is more-likely-than-not that some portion or all of our deferred tax assets will not be realized. The ultimate realization of the deferred tax assets depends on the ability to generate sufficient taxable income of the appropriate character and in the appropriate taxing jurisdictions in the future. If we do not meet our expectations with respect to taxable income, we may not realize the full benefit from our deferred tax assets which would require us to record a valuation allowance in our tax provision in future years. Management assesses all available positive and negative evidence to estimate our ability to generate sufficient future taxable income of the appropriate character, and in the appropriate taxing jurisdictions, to permit use of our existing deferred tax assets. A significant piece of objective negative evidence is a cumulative loss incurred over a three-year period in a taxing jurisdiction. Prevailing accounting practice is that such objective evidence would limit the ability to consider other subjective evidence, such as our projections for future growth.
We incurred a three-year cumulative loss in the U.S. during 2016. Due to this significant negative evidence of cumulative losses, which outweighs the positive evidence of firm sales backlog and projected future taxable income, we are no longer able to support that it is more-likely-than-not that we will have sufficient taxable income of the appropriate character in the future that will allow us to realize our U.S. deferred tax assets. During the year ended December 31, 2016, we recorded a full valuation allowance against our U.S. deferred tax assets resulting in an additional charge of $119.8 million, of which $65.5 million related to U.S. deferred tax assets that existed at December 31, 2015.
As of December 31, 2015, we had $72.0 million in foreign tax credit carryforward deferred tax assets primarily allocated to us from Archrock. Since we do not expect to generate sufficient taxable income and foreign source taxable income following the Spin-off, the foreign tax credit carryforwards will ultimately expire unused. Archrock recorded a valuation allowance to fully offset the foreign tax credit carryforward deferred tax assets they allocated to us.
Pursuant to Sections 382 and 383 of the Internal Revenue Code of 1986, as amended (the “Code”), utilization of loss carryforwards and credit carryforwards, such as foreign tax credits, will be subject to annual limitations due to the ownership changes of both Hanover Compressor Company (“Hanover”) and Universal Compression Holdings, Inc. (“Universal”). In general, an ownership change, as defined by Section 382 of the Code, results from transactions increasing the ownership of certain stockholders or public groups in the stock of a corporation by more than 50 percentage points over a three-year period. The merger of Hanover and Universal to form Archrock in August 2007 resulted in such an ownership change for both Hanover and Universal. Our ability to utilize loss carryforwards and credit carryforwards against future U.S. federal income tax may be limited. The limitations may cause us to pay U.S. federal income taxes earlier; however, we do not currently expect that any loss carryforwards or credit carryforwards will expire as a result of these limitations.
We have not provided U.S. federal income taxes on indefinitely (or permanently) reinvested cumulative earnings of approximately $545.5 million generated by our non-U.S. subsidiaries as of December 31, 2016. Such earnings are from ongoing operations which will be used to fund international growth. We have not recorded a deferred tax liability related to these unremitted foreign earnings as it is not practicable to estimate the amount of unrecognized deferred tax liabilities. In the event of a distribution of those earnings to the U.S. in the form of dividends, we may be subject to both foreign withholding taxes and U.S. federal income taxes net of allowable foreign tax credits.
A reconciliation of the beginning and ending amount of unrecognized tax benefits (including discontinued operations) is shown below (in thousands):
Years Ended December 31, | |||||||||||
2016 | 2015 | 2014 | |||||||||
Beginning balance | $ | 14,943 | $ | 8,356 | $ | 9,033 | |||||
Additions based on tax positions related to prior years | 3,140 | 6,448 | — | ||||||||
Additions based on tax positions related to current year | 256 | 261 | — | ||||||||
Reductions based on lapse of statute of limitations | (102 | ) | (122 | ) | (215 | ) | |||||
Reductions based on tax positions related to prior years | — | — | (462 | ) | |||||||
Ending balance | $ | 18,237 | $ | 14,943 | $ | 8,356 | |||||
F-26
We had $18.2 million, $14.9 million and $8.4 million of unrecognized tax benefits at December 31, 2016, 2015 and 2014, respectively, which if recognized, would affect the effective tax rate (except for amounts that would be reflected in income (loss) from discontinued operations, net of tax). We also have recorded $3.0 million, $3.0 million and $3.2 million of potential interest expense and penalties related to unrecognized tax benefits associated with uncertain tax positions (including discontinued operations) as of December 31, 2016, 2015 and 2014, respectively. To the extent interest and penalties are not assessed with respect to unrecognized tax benefits, amounts accrued will be reduced and reflected as reductions in income tax expense.
We and our subsidiaries file consolidated and separate income tax returns in the U.S. federal jurisdiction and in numerous state and foreign jurisdictions. Certain of our operations were historically included in Archrock’s consolidated income tax returns in the U.S. federal and state jurisdictions. In addition, certain of Archrock’s operations were historically included in our separate income tax returns in state jurisdictions. Under the Code and the related rules and regulations, each corporation that was a member of the Archrock consolidated U.S. federal income tax reporting group during any taxable period or portion of any taxable period ending on or before the effective time of the Spin-off is jointly and severally liable for the U.S. federal income tax liability of the entire Archrock consolidated tax reporting group for that taxable period. In connection with the Spin-off, we entered into a tax matters agreement with Archrock that allocates the responsibility for prior period taxes of the Archrock consolidated tax reporting group between us and Archrock.
State income tax returns are generally subject to examination for a period of three to five years after filing the returns. However, the state impact of any U.S. federal audit adjustments and amendments remains subject to examination by various states for up to one year after formal notification to the states. As of December 31, 2016, we did not have any state audits underway that would have a material impact on our financial position or results of operations.
We are subject to examination by taxing authorities throughout the world, including major foreign jurisdictions such as Argentina, Brazil and Mexico. With few exceptions, we and our subsidiaries are no longer subject to foreign income tax examinations for tax years before 2006. Several foreign audits are currently in progress and we do not expect any tax adjustments that would have a material impact on our financial position or results of operations.
We believe it is reasonably possible that a decrease of up to approximately $8 million in unrecognized tax benefits may be necessary on or before December 31, 2017 due to the settlement of audits and the expiration of statutes of limitations. However, due to the uncertain and complex application of tax regulations, it is possible that the ultimate resolution of these matters may result in liabilities which could materially differ from these estimates.
16. Related Party Transactions
Spin Agreements
In connection with the completion of the Spin-off, on November 3, 2015, we entered into several agreements with Archrock and certain subsidiaries of Archrock and, with respect to certain agreements, a subsidiary of Archrock Partners, that govern the Spin-off and the relationship among the parties following the Spin-off, including the following (collectively, the “Spin Agreements”):
• | The separation and distribution agreement contains the key provisions relating to the separation of our business from Archrock’s business and the distribution of our common stock to its stockholders. The separation and distribution agreement identifies the assets and rights that were transferred, liabilities that were assumed or retained and contracts and related matters that were assigned to us by Archrock or by us to Archrock in the Spin-off and describes how these transfers, assumptions and assignments occurred. Pursuant to the separation and distribution agreement, on November 3, 2015, we transferred net proceeds of $532.6 million from borrowings under the Credit Facility to Archrock to allow for its repayment of a portion of its indebtedness. In addition, the separation and distribution agreement contains certain noncompetition provisions addressing restrictions for three years after the Spin-off on our ability to provide contract operations and aftermarket services in the U.S. and on Archrock’s ability to provide contract operations and aftermarket services outside of the U.S. and to provide products for sale worldwide that compete with our current product sales business, subject to certain exceptions. The separation and distribution agreement also governs the treatment of aspects relating to indemnification, insurance, confidentiality and cooperation. Additionally, the separation and distribution agreement specifies the right of a subsidiary of Archrock to receive payments from EESLP based on a notional amount corresponding to payments received by our subsidiaries from PDVSA Gas in respect of the sale of our and our joint ventures’ previously nationalized assets promptly after such amounts are collected by our subsidiaries and a $25.0 million cash payment from EESLP promptly following the occurrence of a qualified capital raise (as defined in the Credit Agreement). See Note 21 for additional discussion on such contingent liabilities. |
F-27
• | The tax matters agreement governs the respective rights, responsibilities and obligations of Archrock and us with respect to tax liabilities and benefits, tax attributes, the preparation and filing of tax returns, the control of audits and other tax proceedings and certain other matters regarding taxes. |
• | The employee matters agreement governs the allocation of liabilities and responsibilities between Archrock and Exterran Corporation relating to employee compensation and benefit plans and programs, including the treatment of retirement, health and welfare plans and equity and other incentive plans and awards. The agreement contains provisions regarding stock-based compensation. See Note 18 for additional information relating to the Exterran Corporation Stock Incentive Plan. |
• | The transition services agreement sets forth the terms on which Archrock provides to us, and we provide to Archrock, on a temporary basis, certain services or functions that the companies historically have shared. During the year ended December 31, 2016, we recorded selling, general and administrative expense of $0.7 million and other income of $1.3 million associated with services under the transition services agreement. For the period from November 4, 2015 through December 31, 2015, we recorded selling, general and administrative expense of $0.2 million and other income of $0.2 million associated with services under the transition services agreement. |
• | The supply agreement sets forth the terms under which we provide manufactured equipment, including the design, engineering, manufacturing and sale of natural gas compression equipment, on an exclusive basis to Archrock and Archrock Partners. This supply agreement has an initial term of two years, subject to certain cancellation clauses, and is extendable for additional one year terms by mutual agreement of the parties. Pursuant to the supply agreement, each of Archrock and Archrock Partners is required to purchase their requirements of newly-manufactured compression equipment from us, subject to certain exceptions. Subsequent to November 3, 2015, sales to Archrock and Archrock Partners are considered sales to third parties. |
• | The storage agreements set forth the terms under which we provide each of Archrock and Archrock Partners with storage space for equipment purchased under the supply agreement, as well as the terms under which Archrock provides storage space to us for certain of our equipment. |
• | The services agreements set forth the terms under which we provide Archrock (or Archrock’s customers on its behalf) with engineering, preservation and installation and commissioning services and Archrock provides us (or our customers on our behalf) with make-ready, parts sales, preservation and installation and commissioning services. These services agreements will continue in effect until terminated by either party on 30 days’ written notice. |
Transactions with Affiliates
All intercompany transactions and accounts within these financial statements have been eliminated. All affiliate transactions occurring prior to the Spin-off between the international services and product sales businesses of Archrock and the other businesses of Archrock have been included in these financial statements. Prior to the Spin-off, sales of newly-manufactured compression equipment from the oil and gas product sales business of EESLP to Archrock Partners were used in the U.S. services business of Archrock and were made pursuant to an omnibus agreement between the parties and other affiliates of both entities. Through November 3, 2015, per the omnibus agreement, revenue was determined by the cost to manufacture such equipment plus a fixed margin. During the years ended December 31, 2015 and 2014, we recorded oil and gas product sales revenue from affiliates of $154.3 million and $233.0 million, respectively, and cost of sales of $141.9 million and $212.2 million, respectively, from the sale of newly-manufactured compression equipment to Archrock Partners. Subsequent to November 3, 2015, sales to Archrock Partners are considered sales to third parties.
Prior to the closing of the Spin-off, EESLP also had a fleet of compression units used to provide compression services in the U.S. services business of Archrock. Revenue prior to the Spin-off was not recognized in our statements of operations for the sale of compressor units by us that were used by EESLP to provide compression services to customers of the U.S. services business of Archrock. The costs of these units were treated as a reduction of parent equity in the balance sheets and a distribution to parent in the statements of cash flows and totaled $32.3 million and $59.1 million during the years ended December 31, 2015 and 2014, respectively. Subsequent to November 3, 2015, sales to Archrock are considered sales to third parties.
F-28
Allocation of Expenses
For the periods prior to the Spin-off, the statements of operations also includes expense allocations for certain functions performed by Archrock which have not been historically allocated to its operating segments, including allocations of expenses related to executive oversight, accounting, treasury, tax, legal, human resources, procurement and information technology. Included in our selling, general and administrative expense during the years ended December 31, 2015 and 2014 were $46.9 million and $68.3 million, respectively, of allocated corporate expenses incurred by Archrock prior to the Spin-off. These costs were allocated to us systematically based on specific department function and revenue. Management believes the assumptions underlying the financial statements, including the assumptions regarding allocating expenses from Archrock, are reasonable. Nevertheless, the financial statements may not be representative of all of the actual expenses that would have been incurred had we been a stand-alone public company during the periods presented and, consequently, may not reflect our combined results of operations, financial position and cash flows had we been a stand-alone public company during the periods presented. Actual costs that would have been incurred if we had been a stand-alone public company would depend on multiple factors, including organizational structure and strategic decisions made in various areas, including information technology and infrastructure.
Cash Management
Prior to the closing of the Spin-off, EESLP provided centralized treasury functions for Archrock’s U.S. operations, whereby EESLP regularly transferred cash both to and from U.S. subsidiaries of Archrock, as necessary. In conjunction therewith, the intercompany transactions between our U.S. subsidiaries and the other U.S. subsidiaries of Archrock were considered to be effectively settled in cash in these financial statements for the periods prior to the Spin-off. Intercompany receivables/payables from/to related parties arising from transactions with affiliates and expenses allocated from Archrock described above were included in net distributions to parent in the financial statements.
Net Distributions to Parent
Parent equity, which included retained earnings prior to the Spin-off, represents Archrock’s interest in our recorded net assets. Prior to the Spin-off, all transactions between us and Archrock were presented in the accompanying statements of stockholders’ equity as net distributions to parent. As of November 3, 2015, parent equity was converted to common stock and additional paid-in capital. A reconciliation of net distributions to parent in the statements of stockholders’ equity to the corresponding amount presented in the statements of cash flows for the years ended December 31, 2015 and 2014 is provided below (in thousands):
Years Ended December 31, | |||||||
2015 | 2014 | ||||||
Net distributions to parent per the statements of stockholders’ equity | $ | (57,635 | ) | $ | (59,970 | ) | |
Stock-based compensation expenses prior to the Spin-off | (6,066 | ) | (5,288 | ) | |||
Stock-based compensation excess tax benefit prior to the Spin-off | 1,193 | 3,434 | |||||
Net transfers of property, plant and equipment from parent prior to the Spin-off | (7,627 | ) | (17,472 | ) | |||
Transfer of net deferred tax liabilities from parent at Spin-off | 29,203 | — | |||||
Transfer of other net assets to parent at Spin-off | 1,907 | — | |||||
Net distributions to parent per the statements of cash flows | $ | (39,025 | ) | $ | (79,296 | ) | |
17. Stockholders’ Equity
The Exterran Corporation amended and restated certificate of incorporation authorizes 250.0 million shares of common stock and 50.0 million shares of preferred stock, each with a par value of $0.01 per share. To effect the Spin-off, on November 3, 2015, Archrock distributed 34,286,267 shares of our common stock to its shareholders. Archrock shareholders received one share of Exterran Corporation common stock for every two shares of Archrock common stock held at the close of business on the Record Date. Additionally, certain of Archrock’s common stock awards that were outstanding prior to the Spin-off were converted to Exterran Corporation’s common stock awards on November 3, 2015. The conversion of Archrock restricted stock into Exterran Corporation restricted stock resulted in the issuance of 505,512 shares of our common stock. See Note 18 for further discussion regarding stock-based compensation.
Pursuant to the separation and distribution agreement with Archrock and certain of our and Archrock’s respective affiliates, on November 3, 2015, EESLP transferred $532.6 million of net proceeds from borrowings under the Credit Facility to Archrock to allow it to repay a portion of its indebtedness in connection with the Spin-off.
F-29
Parent equity, which included retained earnings prior to the Spin-off, represents Archrock’s interest in our recorded net assets. Prior to the Spin-off, all transactions between us and Archrock were presented in the accompanying statements of stockholders’ equity as net distributions to parent. As of November 3, 2015, parent equity was converted to common stock and additional paid-in capital.
Comprehensive Income (Loss)
Components of comprehensive income (loss) are net income (loss) and all changes in stockholders’ equity during a period except those resulting from transactions with owners. Our accumulated other comprehensive income consists of foreign currency translation adjustments.
The following table presents the changes in accumulated other comprehensive income, net of tax, during the years ended December 31, 2014, 2015 and 2016 (in thousands):
Foreign Currency Translation Adjustment | |||
Accumulated other comprehensive income, January 1, 2014 | $ | 38,892 | |
Loss recognized in other comprehensive income (loss) | (9,370 | ) | |
Income reclassified from accumulated other comprehensive income (1) | (2,777 | ) | |
Accumulated other comprehensive income, December 31, 2014 | 26,745 | ||
Income recognized in other comprehensive income (loss) | 2,453 | ||
Accumulated other comprehensive income, December 31, 2015 | 29,198 | ||
Income recognized in other comprehensive income (loss) | 3,151 | ||
Loss reclassified from accumulated other comprehensive income (2) | 15,159 | ||
Accumulated other comprehensive income, December 31, 2016 | $ | 47,508 | |
(1) | During the year ended December 31, 2014, we reclassified a gain of $2.8 million related to foreign currency translation adjustments to other (income) expense, net, in our statements of operations. This amount represents cumulative foreign currency translation adjustments associated with our contract operations and aftermarket services businesses in Australia, which were sold in December 2014, that previously had been recognized in accumulated other comprehensive income. |
(2) | During the year ended December 31, 2016, we reclassified a loss of $15.2 million related to foreign currency translation adjustments to income (loss) from discontinued operations in our statement of operations. This amount represents cumulative foreign currency translation adjustments associated with our Belleli CPE business that previously had been recognized in accumulated other comprehensive income. See Note 3 for further discussion of the sale of our Belleli CPE business. |
18. Stock-Based Compensation and Awards
2015 Stock Incentive Plan
On October 30, 2015, our compensation committee and board of directors each approved the Exterran Corporation 2015 Stock Incentive Plan (the “2015 Plan”) to provide for the granting of stock options, stock appreciation rights, restricted stock, restricted stock units, performance awards, other stock-based awards and dividend equivalents rights to employees, directors and consultants of Exterran Corporation. The 2015 Plan became effective on November 1, 2015. The 2015 Plan also governs awards granted under the Archrock, Inc. 2013 Stock Incentive Plan and the Archrock, Inc. 2007 Amended and Restated Stock Incentive Plan which were adjusted into awards denominated in our common stock in accordance with the terms of the employee matters agreement and/or actions taken by our board of directors or the Archrock board of directors.
F-30
Awards granted by Archrock prior to the Spin-off (referred to as “Archrock awards”), which consisted of stock options, restricted stock, restricted stock units and performance units, were generally treated as follows in connection with the Spin-off:
• | Pre-2015 Awards. Immediately prior to the Spin-off, each outstanding Archrock stock option, restricted stock award, restricted stock unit award and performance unit award granted prior to January 1, 2015, whether vested or unvested, were split into two awards, consisting of an Archrock award and an Exterran Corporation award. For Archrock “incentive stock options” (within the meaning of Section 422 of the Code), the holder of the award had the option to elect, prior to the Spin-off, to convert such options into options denominated in shares of common stock of the applicable holder’s post-spin employer. |
• | 2015 Awards. Each Archrock stock option, restricted stock award, restricted stock unit award and performance unit award that was (i) granted in calendar year 2015 and (ii) held by an individual who became our employee or is engaged by us following the Spin-off were converted solely into an Exterran Corporation award. Archrock did not grant any stock options in the calendar year 2015 prior to the Spin-off. |
In accordance with the anti-dilution provisions set forth in the individual Archrock award agreements, adjustments to the awards were made to ensure, to the extent possible, that the fair value of each award immediately prior to the Spin-off equaled the fair value of each such award immediately following the Spin-off. Adjustment and substitution of awards did not result in additional compensation expense.
Equity awards that were adjusted as described above are generally subject to the same vesting, expiration, performance conditions and other terms and conditions as applied to the underlying Archrock awards immediately prior to the Spin-off.
Stock-based compensation expense prior to the Spin-off only related to employees directly involved in our operations, and therefore, excluded stock-based compensation expense related to Archrock employees that supported both the international services and product sales businesses and the other businesses of Archrock that it retained after the Spin-off. Stock-based compensation expense subsequent to the Spin-off relates to employees, directors and consultants of Exterran Corporation, and as discussed above, such awards may consist of awards for either our common stock or Archrock’s common stock. The following table presents the stock-based compensation expense included in our results of operations (in thousands):
Years Ended December 31, | |||||||||||
2016 | 2015 | 2014 | |||||||||
Stock options | $ | 115 | $ | 348 | $ | 496 | |||||
Restricted stock, restricted stock units, performance units, cash settled restricted stock units and cash settled performance units | 13,188 | 7,871 | 7,922 | ||||||||
Restructuring and other charges—stock-based compensation expense | 1,333 | 143 | — | ||||||||
Total stock-based compensation expense | $ | 14,636 | $ | 8,362 | $ | 8,418 | |||||
Stock Options
Stock options are granted at fair market value at the grant date, are exercisable according to the vesting schedule established and generally expire no later than ten years after the grant date. Stock options generally vest one-third per year on each of the first three anniversaries of the grant date.
The weighted average grant date fair value for stock options granted during the year ended 2014 was $14.47, and was estimated using the Black-Scholes option valuation model with the weighted average assumptions in the table below. There were no stock options granted during the years ended December 31, 2016 and 2015. As there were no stock option awards for Exterran Corporation’s common stock granted subsequent to the Spin-off, the significant assumptions presented below are the inputs Archrock used to calculate the grant date fair values of stock options granted prior to the Spin-off.
Years Ended December 31, | ||||||
2016 | 2015 | 2014 | ||||
Expected life in years | N/A | N/A | 4.5 | |||
Risk-free interest rate | N/A | N/A | 1.33 | % | ||
Volatility | N/A | N/A | 46.51 | % | ||
Dividend yield | N/A | N/A | 1.5 | % | ||
F-31
The risk-free interest rate was based on the U.S. Treasury yield curve in effect on the grant date for a period commensurate with the estimated expected life of the stock options. Expected volatility was based on the historical volatility of Archrock’s common stock over the period commensurate with the expected life of the stock options and other factors. The dividend yield was based on Archrock’s annualized dividend rate in effect during the quarter in which the grant was made.
The table below presents the changes in stock option awards for our common stock during the year ended December 31, 2016. Options outstanding on the Spin-off date, November 3, 2015, related to employees, directors and consultants of us and Archrock.
Stock Options (in thousands) | Weighted Average Exercise Price Per Share | Weighted Average Remaining Life (in years) | Aggregate Intrinsic Value (in thousands) | |||||||||
Options outstanding, January 1, 2016 | 434 | $ | 18.53 | |||||||||
Granted | — | — | ||||||||||
Exercised | (61 | ) | 12.88 | |||||||||
Cancelled | (77 | ) | 27.20 | |||||||||
Options outstanding, December 31, 2016 | 296 | 17.44 | 2.2 | $ | 2,572 | |||||||
Options exercisable, December 31, 2016 | 284 | 16.80 | 2.1 | 2,572 | ||||||||
Intrinsic value is the difference between the market value of our common stock and the exercise price of each stock option multiplied by the number of stock options outstanding for those stock options where the market value exceeds their exercise price. The total intrinsic value of stock options exercised to purchase our common stock during the year ended December 31, 2016 was $0.1 million. As of December 31, 2016, we expect to recognize less than $0.1 million of additional compensation cost related to unvested stock options issued to our employees, directors and consultants, related to options to purchase either our common stock or Archrock’s common stock.
Restricted Stock, Restricted Stock Units, Performance Units, Cash Settled Restricted Stock Units and Cash Settled Performance Units
For grants of restricted stock, restricted stock units and performance units, we recognize compensation expense over the vesting period equal to the fair value of our common stock at the grant date. We remeasure the fair value of cash settled restricted stock units and cash settled performance units and record a cumulative adjustment of the expense previously recognized. Our obligation related to the cash settled restricted stock units and cash settled performance units is reflected as a liability in our balance sheets. Grants of restricted stock, restricted stock units, performance units, cash settled restricted stock units and cash settled performance units generally vest one-third per year on each of the first three anniversaries of the grant date.
The table below presents the changes in restricted stock, restricted stock units, performance units, cash settled restricted stock units and cash settled performance units for our common stock during the year ended December 31, 2016. Non-vested awards relate to employees, directors and consultants of us and Archrock. Awards granted subsequent to November 3, 2015 only relate to our employees, directors and consultants.
Shares (in thousands) | Weighted Average Grant-Date Fair Value Per Share | |||||
Non-vested awards, January 1, 2016 | 1,004 | $ | 22.17 | |||
Granted | 773 | 15.46 | ||||
Vested | (526 | ) | 21.60 | |||
Change in expected vesting of performance units | 138 | 15.46 | ||||
Cancelled | (97 | ) | 22.03 | |||
Non-vested awards, December 31, 2016 (1) | 1,292 | 17.68 | ||||
(1) | Non-vested awards as of December 31, 2016 are comprised of 182,000 cash settled restricted stock units and cash settled performance units and 1,110,000 restricted shares, restricted stock units and performance units. |
F-32
As of December 31, 2016, we expect $15.5 million of unrecognized compensation cost related to unvested restricted stock, restricted stock units, performance units, cash settled restricted stock units and cash settled performance units issued to our employees, in the form of either our common stock or Archrock’s common stock, to be recognized over the weighted-average vesting period of 1.8 years.
Directors’ Stock and Deferral Plan
On October 30, 2015, our compensation committee and board of directors each approved the Exterran Corporation 2015 Directors’ Stock and Deferral Plan (the “Director Plan”). Under the Director Plan, which became effective on October 30, 2015, members of our board of directors may elect, on an annual basis, to receive 25%, 50%, 75% or 100% of their retainer and meeting fees (the “Retainer Fees”) in shares of our common stock in lieu of cash. The number of shares of our common stock issued to each director who elects to have a portion of their Retainer Fees paid in shares in lieu of cash is determined by dividing the applicable dollar amount of such portion by the closing sales price per share of our common stock on the last trading day of the quarter. Any portion of the Retainer Fees paid in cash will be paid to the director following the close of the calendar quarter for which such Retainer Fees were earned. Under the Director Plan, members of the board of directors may also elect to defer until a later date the receipt of the Retainer Fees that such director has elected to receive in the form of shares. The maximum aggregate number of shares of our common stock that may be issued under the Director Plan is 125,000 shares. The board of directors will administer the Director Plan and has the authority to make certain equitable adjustments under the Director Plan in the event of certain corporate transactions.
19. Net Income (Loss) Per Common Share
Basic net income (loss) per common share is computed using the two-class method, which is an earnings allocation formula that determines net income (loss) per share for each class of common stock and participating security according to dividends declared and participation rights in undistributed earnings. Under the two-class method, basic net income (loss) per common share is determined by dividing net income (loss) after deducting amounts allocated to participating securities, by the weighted average number of common shares outstanding for the period. Participating securities include our unvested restricted stock and certain stock settled restricted stock units that have nonforfeitable rights to receive dividends or dividend equivalents, whether paid or unpaid. During periods of net loss from continuing operations, no effect is given to participating securities because they do not have a contractual obligation to participate in our losses.
Diluted net income (loss) per common share is computed using the weighted average number of common shares outstanding adjusted for the incremental common stock equivalents attributed to outstanding options to purchase common stock and non-participating restricted stock units, unless their effect would be anti-dilutive.
To effect the Spin-off, on November 3, 2015, Archrock distributed 34,286,267 shares of our common stock to its stockholders. For the periods prior to November 3, 2015, the average number of common shares outstanding used to calculate basic and diluted net income per common share was based on the shares of our common stock that were distributed on November 3, 2015. The same number of shares was used to calculate basic and diluted net income per common share for these periods since we had no equity awards outstanding prior to November 3, 2015 and we were a wholly owned subsidiary of Archrock prior to the Spin-off date.
F-33
The following table presents a reconciliation of basic and diluted net income (loss) per common share for the years ended December 31, 2016, 2015 and 2014 (in thousands, except per share data):
Years Ended December 31, | |||||||||||
2016 | 2015 | 2014 | |||||||||
Numerator for basic and diluted net income (loss) per common share: | |||||||||||
Income (loss) from continuing operations | $ | (194,366 | ) | $ | (28,126 | ) | $ | 48,109 | |||
Income (loss) from discontinued operations, net of tax | (33,571 | ) | 54,774 | 67,183 | |||||||
Less: Net income attributable to participating securities | — | — | — | ||||||||
Net income (loss) — used in basic and diluted net income (loss) per common share | $ | (227,937 | ) | $ | 26,648 | $ | 115,292 | ||||
Weighted average common shares outstanding including participating securities | 35,489 | 34,437 | 34,286 | ||||||||
Less: Weighted average participating securities outstanding | (921 | ) | (149 | ) | — | ||||||
Weighted average common shares outstanding — used in basic net income (loss) per common share | 34,568 | 34,288 | 34,286 | ||||||||
Net dilutive potential common shares issuable: | |||||||||||
On exercise of options and vesting of restricted stock units | * | * | — | ||||||||
Weighted average common shares outstanding — used in diluted net income (loss) per common share | 34,568 | 34,288 | 34,286 | ||||||||
Net income (loss) per common share: | |||||||||||
Basic | $ | (6.59 | ) | $ | 0.78 | $ | 3.36 | ||||
Diluted | $ | (6.59 | ) | $ | 0.78 | $ | 3.36 | ||||
* | Excluded from diluted net income (loss) per common share as their inclusion would have been anti-dilutive. |
The following table shows the potential shares of common stock issuable that were excluded from computing diluted net income (loss) per common share as their inclusion would have been anti-dilutive (in thousands):
Years Ended December 31, | ||||||||
2016 | 2015 | 2014 | ||||||
Net dilutive potential common shares issuable: | ||||||||
On exercise of options where exercise price is greater than average market value for the period | 225 | 62 | * | |||||
On exercise of options and vesting of restricted stock units | 50 | 16 | * | |||||
Net dilutive potential common shares issuable | 275 | 78 | — | |||||
* | Not applicable for the period. |
20. Retirement Benefit Plan
Our 401(k) retirement plan provides for optional employee contributions for certain employees who are U.S. citizens up to the Internal Revenue Service limit and discretionary employer matching contributions. We make discretionary matching contributions to each participant’s account at a rate of (i) 100% of each participant’s first 1% of contributions plus (ii) 50% of each participant’s contributions up to the next 5% of eligible compensation. For the periods prior to the Spin-off, we were allocated costs incurred by Archrock for employer matching contributions. Costs incurred for employer matching contributions of $2.4 million, $3.6 million and $4.5 million during 2016, 2015 and 2014, respectively, are presented as selling, general and administrative expense in our statements of operations.
F-34
21. Commitments and Contingencies
Rent expense for 2016, 2015 and 2014 was approximately $9.9 million, $13.1 million and $15.4 million, respectively. Commitments for future minimum rental payments with terms in excess of one year at December 31, 2016 are as follows (in thousands):
December 31, 2016 | |||
2017 | $ | 6,176 | |
2018 | 3,825 | ||
2019 | 2,131 | ||
2020 | 1,736 | ||
2021 | 1,729 | ||
Thereafter | 11,944 | ||
Total | $ | 27,541 | |
Guarantees
We have issued the following guarantees that are not recorded on our accompanying balance sheet (dollars in thousands):
Term | Maximum Potential Undiscounted Payments as of December 31, 2016 | ||||
Performance guarantees through letters of credit (1) | 2017-2020 | $ | 121,645 | ||
Standby letters of credit | 2017 | 545 | |||
Commercial letters of credit | 2017 | 671 | |||
Bid bonds and performance bonds (1) | 2017-2023 | 42,483 | |||
Maximum potential undiscounted payments | $ | 165,344 | |||
(1) | We have issued guarantees to third parties to ensure performance of our obligations, some of which may be fulfilled by third parties. |
Contingencies
See Note 3 and Note 8 for a discussion of our gain contingencies related to assets that were expropriated in Venezuela.
Pursuant to the separation and distribution agreement, EESLP contributed to a subsidiary of Archrock the right to receive payments based on a notional amount corresponding to payments received by our subsidiaries from PDVSA Gas in respect of the sale of our and our joint ventures’ previously nationalized assets promptly after such amounts are collected by our subsidiaries until Archrock’s subsidiary has received an aggregate amount of such payments up to the lesser of (i) $125.8 million, plus the aggregate amount of all reimbursable expenses incurred by Archrock and its subsidiaries in connection with recovering any PDVSA Gas default installment payments following the completion of the Spin-off or (ii) $150.0 million. Our balance sheets do not reflect this contingent liability to Archrock or the amount payable to us by PDVSA Gas as a receivable. Pursuant to the separation and distribution agreement, we transferred cash of $49.2 million to Archrock during the year ended December 31, 2016. The transfer of cash was recognized as a reduction to additional paid-in capital in our financial statements. As of December 31, 2016, the remaining principal amount due to us from PDVSA Gas in respect of the sale of our and our joint ventures’ previously nationalized assets was approximately $37 million. In subsequent periods, the recognition of a liability, if applicable, resulting from this contingency to Archrock is expected to impact equity, and as such, is not expected to have an impact on our statements of operations.
F-35
Pursuant to the separation and distribution agreement, EESLP (in the case of debt offerings) or Exterran Corporation (in the case of equity issuances) will use its commercially reasonable efforts to complete one or more unsecured debt offerings or equity issuances resulting in aggregate gross cash proceeds of at least $250.0 million on the terms described in the Credit Agreement (such transaction, a “qualified capital raise”) on or before the maturity date of our term loan facility. In connection with the Spin-off, EESLP contributed to a subsidiary of Archrock the right to receive, promptly following the occurrence of a qualified capital raise, a $25.0 million cash payment. Our balance sheets do not reflect this contingent liability to Archrock. In subsequent periods, the recognition of a liability, if applicable, resulting from this contingency to Archrock is expected to impact equity, and as such, is not expected to have an impact on our statements of operations.
In addition to U.S. federal, state and local and foreign income taxes, we are subject to a number of taxes that are not income-based. As many of these taxes are subject to audit by the taxing authorities, it is possible that an audit could result in additional taxes due. We accrue for such additional taxes when we determine that it is probable that we have incurred a liability and we can reasonably estimate the amount of the liability. As of both December 31, 2016 and 2015, we had accrued $3.1 million for the outcomes of non-income-based tax audits and had related indemnification receivables from Archrock of $1.7 million and $1.5 million, respectively. We do not expect that the ultimate resolutions of these audits will result in a material variance from the amounts accrued. We do not accrue for unasserted claims for tax audits unless we believe the assertion of a claim is probable, it is probable that it will be determined that the claim is owed and we can reasonably estimate the claim or range of the claim. We do not have any unasserted claims from non-income-based tax audits that we have determined are probable of assertion. We also believe the likelihood is remote that the impact of potential unasserted claims from non-income-based tax audits could be material to our financial position, but it is possible that the resolution of future audits could be material to our results of operations or cash flows for the period in which the resolution occurs.
Our business can be hazardous, involving unforeseen circumstances such as uncontrollable flows of natural gas or well fluids and fires or explosions. As is customary in our industry, we review our safety equipment and procedures and carry insurance against some, but not all, risks of our business. Our insurance coverage includes property damage, general liability and commercial automobile liability and other coverage we believe is appropriate. We believe that our insurance coverage is customary for the industry and adequate for our business; however, losses and liabilities not covered by insurance would increase our costs.
Additionally, we are substantially self-insured for workers’ compensation and employee group health claims in view of the relatively high per-incident deductibles we absorb under our insurance arrangements for these risks. Losses up to the deductible amounts are estimated and accrued based upon known facts, historical trends and industry averages.
Contracts Containing Liquidated Damages Provisions
Some of our product sales contracts have schedule dates and performance obligations that if not met could subject us to penalties for liquidated damages. These generally relate to specified activities that must be completed by a set contractual date or by achievement of a specified level of output or throughput. Each contract defines the conditions under which a customer may make a claim for liquidated damages. However, in some instances, liquidated damages are not asserted by the customer, but the potential to do so is used in negotiating or settling claims and closing out the contract. As of December 31, 2016, estimated penalties for liquidated damages of $22.3 million have been recorded in our financial statements, based on our actual or projected failure to meet certain specified contractual milestone dates. We believe that we will be successful in obtaining schedule extensions or other customer-agreed changes that should resolve the potential for additional liquidated damages. Accordingly, we believe that no amounts for these potential liquidated damages in excess of the amounts currently reflected in our financial statements are probable of being incurred by us. However, we may not achieve relief on some or all of the issues involved and, as a result, could be subject to higher liquidated damages amounts. Additionally, we have asserted claims, or intend to assert claims, against certain customers that, if settled, could result in a release of such claims in exchange for release of certain liquidated damages currently recorded in our financial statements. We recognize claims for recovery of incurred cost when it is probable that the claim will result in additional contract revenue and when the amount of the claim can be reliably estimated. These requirements are satisfied when the contract or other evidence provides a legal basis for the claim, additional costs were caused by circumstances that were unforeseen at the contract date and not the result of deficiencies in our performance, claim-related costs are identifiable and considered reasonable in view of the work performed, evidence supporting the claim is objective and verifiable and collection is probable. These assessments require judgments concerning matters such as litigation developments and outcomes, the anticipated outcome of negotiations, the number of future claims and the cost of both pending and future claims.
F-36
Litigation and Claims
In the ordinary course of business, we are involved in various pending or threatened legal actions. While management is unable to predict the ultimate outcome of these actions, it believes that any ultimate liability arising from any of these actions will not have a material adverse effect on our financial position, results of operations or cash flows. However, because of the inherent uncertainty of litigation and arbitration proceedings, we cannot provide assurance that the resolution of any particular claim or proceeding to which we are a party will not have a material adverse effect on our financial position, results of operations or cash flows.
Contemporaneously with filing the Form 8-K on April 26, 2016, we self-reported the errors and possible irregularities at Belleli EPC to the SEC. Since then, we have been cooperating with the SEC in its investigation of this matter, including responding to a subpoena for documents related to the restatement and of our compliance with the U.S. Foreign Corrupt Practices Act (“FCPA”), which are also being provided to the Department of Justice at its request. The FCPA related requests in the SEC subpoena pertain to our policies and procedures, information about our third-party sales agents, and documents related to historical internal investigations completed prior to November 2015.
Indemnifications
In conjunction with, and effective as of the completion of, the Spin-off, we entered into the separation and distribution agreement with Archrock, which governs, among other things, the treatment between Archrock and us of aspects relating to indemnification, insurance, confidentiality and cooperation. Generally, the separation and distribution agreement provides for cross-indemnities principally designed to place financial responsibility for the obligations and liabilities of our business with us and financial responsibility for the obligations and liabilities of Archrock’s business with Archrock. Pursuant to the agreement, we and Archrock will generally release the other party from all claims arising prior to the Spin-off that relate to the other party’s business, subject to certain exceptions. Additionally, in conjunction with, and effective as of the completion of, the Spin-off, we entered into the tax matters agreement with Archrock. Under the tax matters agreement and subject to certain exceptions, we are generally liable for, and indemnify Archrock against, taxes attributable to our business, and Archrock is generally liable for, and indemnify us against, all taxes attributable to its business. We are generally liable for, and indemnify Archrock against, 50% of certain taxes that are not clearly attributable to our business or Archrock’s business. Any payment made by us to Archrock, or by Archrock to us, is treated by all parties for tax purposes as a nontaxable distribution or capital contribution, respectively, made immediately prior to the Spin-off.
22. Reportable Segments and Geographic Information
We manage our business segments primarily based upon the type of product or service provided. We have four reportable segments: contract operations, aftermarket services, oil and gas product sales and Belleli EPC product sales. The contract operations segment primarily provides natural gas compression services, production and processing equipment services and maintenance services to meet specific customer requirements on assets owned by us. The aftermarket services segment provides a full range of services to support the surface production, compression and processing needs of customers, from parts sales and normal maintenance services to full operation of a customer’s owned assets. The oil and gas product sales segment provides design, engineering, manufacturing, installation and sale of natural gas compression units and accessories and equipment used in the production, treating and processing of crude oil and natural gas. The Belleli EPC product sales segment, which comprises the operations of our Belleli EPC subsidiary that we are exiting, has historically provided engineering, procurement and construction for the manufacture of tanks for tank farms and the manufacture of evaporators and brine heaters for desalination plants.
In the third quarter of 2016, we changed our reporting segments to better align with the Company’s organizational structure and reflect the way in which the Chief Operating Decision Maker now reviews the Company’s operating results. The change in structure had the impact of splitting our previously disclosed product sales segment into the following two new reportable segments: “oil and gas product sales” and “Belleli EPC product sales.” The contract operations and aftermarket services segments were not impacted by this change. The changes in our reportable segments, including the reclassification of the related revenues and costs of sales (excluding depreciation and amortization) in our statements of operations, have been made to all periods presented within this Annual Report on Form 10-K.
We evaluate the performance of our segments based on gross margin for each segment. Revenue includes sales to external customers and affiliates. We do not include intersegment sales when we evaluate our segments’ performance.
F-37
During the year ended December 31, 2016, Petroleo Brasileiro S.A. accounted for approximately 10% of our total revenues. During the years ended December 31, 2015 and 2014, Archrock Partners and Archrock accounted for approximately 11% of our total revenues. See Note 16 for further discussion on transactions with affiliates. No other customer accounted for more than 10% of our total revenues in 2016, 2015 and 2014.
The following table presents revenues and other financial information by reportable segment during the years ended December 31, 2016, 2015 and 2014 (in thousands):
Contract Operations | Aftermarket Services | Oil and Gas Product Sales | Belleli EPC Product Sales | Reportable Segments Total | Other (1) | Total (2)(3) | |||||||||||||||||||||
2016: | |||||||||||||||||||||||||||
Revenue | $ | 392,463 | $ | 120,550 | $ | 392,384 | $ | 123,856 | $ | 1,029,253 | $ | — | $ | 1,029,253 | |||||||||||||
Gross margin (4) | 248,793 | 33,208 | 26,990 | (2,466 | ) | 306,525 | — | 306,525 | |||||||||||||||||||
Total assets | 745,752 | 28,421 | 159,172 | 27,928 | 961,273 | 413,491 | 1,374,764 | ||||||||||||||||||||
Capital expenditures | 69,946 | 332 | 790 | 1,236 | 72,304 | 2,021 | 74,325 | ||||||||||||||||||||
2015: | |||||||||||||||||||||||||||
Revenue | $ | 469,900 | $ | 127,802 | $ | 1,089,562 | $ | 103,221 | $ | 1,790,485 | $ | — | $ | 1,790,485 | |||||||||||||
Gross margin (4) | 297,509 | 36,569 | 163,825 | (31,625 | ) | 466,278 | — | 466,278 | |||||||||||||||||||
Total assets | 790,957 | 31,614 | 230,947 | 46,592 | 1,100,110 | 617,082 | 1,717,192 | ||||||||||||||||||||
Capital expenditures | 138,171 | 709 | 5,001 | 1,713 | 145,594 | 11,151 | 156,745 | ||||||||||||||||||||
2014: | |||||||||||||||||||||||||||
Revenue | $ | 493,853 | $ | 162,724 | $ | 1,329,607 | $ | 115,479 | $ | 2,101,663 | $ | — | $ | 2,101,663 | |||||||||||||
Gross margin (4) | 308,445 | 42,543 | 240,189 | (33,391 | ) | 557,786 | — | 557,786 | |||||||||||||||||||
Total assets | 809,122 | 37,200 | 334,401 | 63,304 | 1,244,027 | 686,083 | 1,930,110 | ||||||||||||||||||||
Capital expenditures | 130,248 | 1,095 | 10,954 | 10,462 | 152,759 | 3,843 | 156,602 | ||||||||||||||||||||
(1) | Includes corporate related items. |
(2) | Totals exclude assets, capital expenditures and the operating results of discontinued operations. |
(3) | Total gross margin, a non-GAAP financial measure, is reconciled, in total, to income (loss) before income taxes, its most directly comparable measure calculated and presented in accordance with GAAP, below. |
(4) | Gross margin is defined as total revenue less cost of sales (excluding depreciation and amortization expense). |
The following table presents assets from reportable segments to total assets as of December 31, 2016 and 2015 (in thousands):
December 31, | |||||||
2016 | 2015 | ||||||
Assets from reportable segments | $ | 961,273 | $ | 1,100,110 | |||
Other assets (1) | 413,491 | 617,082 | |||||
Assets associated with discontinued operations | 14 | 71,204 | |||||
Total assets | $ | 1,374,778 | $ | 1,788,396 | |||
(1) | Includes corporate related items. |
F-38
The following tables present geographic data as of and during the years ended December 31, 2016, 2015 and 2014 (in thousands):
Years Ended December 31, | |||||||||||
2016 | 2015 | 2014 | |||||||||
Revenue: | |||||||||||
U.S. | $ | 335,268 | $ | 858,409 | $ | 1,051,824 | |||||
United Arab Emirates | 137,247 | 135,623 | 131,392 | ||||||||
Argentina | 151,374 | 172,004 | 172,492 | ||||||||
Brazil | 85,831 | 68,578 | 91,433 | ||||||||
Mexico | 90,876 | 125,972 | 119,953 | ||||||||
Other international | 228,657 | 429,899 | 534,569 | ||||||||
Total | $ | 1,029,253 | $ | 1,790,485 | $ | 2,101,663 | |||||
December 31, | |||||||||||
2016 | 2015 | 2014 | |||||||||
Property, plant and equipment, net: | |||||||||||
U.S. | $ | 84,669 | $ | 90,976 | $ | 87,093 | |||||
Argentina | 222,548 | 239,226 | 246,410 | ||||||||
Brazil | 157,139 | 128,032 | 119,795 | ||||||||
Mexico | 167,279 | 198,641 | 238,661 | ||||||||
Other international | 166,174 | 201,313 | 216,631 | ||||||||
Total | $ | 797,809 | $ | 858,188 | $ | 908,590 | |||||
We evaluate the performance of each of our segments based on gross margin. Total gross margin is included as a supplemental disclosure because it is a primary measure used by our management to evaluate the results of revenue and cost of sales (excluding depreciation and amortization expense), which are key components of our operations. We believe gross margin is important because it focuses on the current operating performance of our operations and excludes the impact of the prior historical costs of the assets acquired or constructed that are utilized in those operations, the indirect costs associated with our selling, general and administrative activities, the impact of our financing methods and income taxes. Depreciation and amortization expense may not accurately reflect the costs required to maintain and replenish the operational usage of our assets and therefore may not portray the costs from current operating activity. As an indicator of our operating performance, total gross margin should not be considered an alternative to, or more meaningful than, income (loss) before income taxes as determined in accordance with GAAP. Our gross margin may not be comparable to a similarly titled measure of another company because other entities may not calculate gross margin in the same manner.
The following table reconciles income (loss) before income taxes to total gross margin (in thousands):
Years Ended December 31, | |||||||||||
2016 | 2015 | 2014 | |||||||||
Income (loss) before income taxes | $ | (69,606 | ) | $ | 11,420 | $ | 127,151 | ||||
Selling, general and administrative | 165,985 | 220,396 | 263,170 | ||||||||
Depreciation and amortization | 137,974 | 154,801 | 170,088 | ||||||||
Long-lived asset impairment | 15,146 | 20,788 | 3,851 | ||||||||
Restatement charges | 18,879 | — | — | ||||||||
Restructuring and other charges | 27,457 | 31,315 | — | ||||||||
Interest expense | 34,181 | 7,272 | 1,878 | ||||||||
Equity in income of non-consolidated affiliates | (10,403 | ) | (15,152 | ) | (14,553 | ) | |||||
Other (income) expense, net | (13,088 | ) | 35,438 | 6,201 | |||||||
Total gross margin | $ | 306,525 | $ | 466,278 | $ | 557,786 | |||||
F-39
23. Selected Quarterly Financial Data (Unaudited)
In management’s opinion, the summarized quarterly financial data below (in thousands, except per share amounts) contains all appropriate adjustments, all of which are normally recurring adjustments, considered necessary to present fairly our financial position and results of operations for the respective periods.
First Quarter | Second Quarter | Third Quarter | Fourth Quarter | ||||||||||||
Year Ended December 31, 2016: | |||||||||||||||
Revenue | $ | 306,630 | $ | 262,147 | $ | 229,158 | $ | 231,318 | |||||||
Gross profit (1) | 35,634 | 54,647 | 44,886 | 32,059 | |||||||||||
Loss from continuing operations | (28,830 | ) | (106,582 | ) | (32,312 | ) | (26,642 | ) | |||||||
Income (loss) from discontinued operations, net of tax | (64,127 | ) | 11,036 | 19,652 | (132 | ) | |||||||||
Net loss | (92,957 | ) | (95,546 | ) | (12,660 | ) | (26,774 | ) | |||||||
Net loss per common share: | |||||||||||||||
Basic (2) | $ | (2.70 | ) | $ | (2.76 | ) | $ | (0.37 | ) | $ | (0.77 | ) | |||
Diluted (2) | (2.70 | ) | (2.76 | ) | (0.37 | ) | (0.77 | ) | |||||||
First Quarter | Second Quarter | Third Quarter | Fourth Quarter | ||||||||||||
Year Ended December 31, 2015: | |||||||||||||||
Revenue | $ | 519,820 | $ | 460,781 | $ | 411,173 | $ | 398,711 | |||||||
Gross profit (1) | 97,839 | 45,960 | 58,578 | 47,006 | |||||||||||
Income (loss) from continuing operations | 18,545 | (14,630 | ) | (9,598 | ) | (22,443 | ) | ||||||||
Income from discontinued operations, net of tax | 17,932 | 207 | 18,275 | 18,360 | |||||||||||
Net income (loss) | 36,477 | (14,423 | ) | 8,677 | (4,083 | ) | |||||||||
Net income (loss) per common share: | |||||||||||||||
Basic (2) | $ | 1.06 | $ | (0.42 | ) | $ | 0.25 | $ | (0.12 | ) | |||||
Diluted (2) | 1.06 | (0.42 | ) | 0.25 | (0.12 | ) | |||||||||
(1) | Gross profit is defined as revenue less cost of sales, direct depreciation and amortization expense and direct long-lived asset impairment charges. |
(2) | For the periods prior to November 3, 2015, the average number of common shares outstanding used to calculate basic and diluted net income (loss) per common share was based on 34,286,267 shares of our common stock that were distributed by Archrock in the Spin-off on November 3, 2015. |
Additional Notes:
• | In conjunction with the planned disposition of Belleli CPE, we recorded impairments of long-lived assets and current assets that totaled $61.6 million and $7.1 million during the first quarter of 2016 and second quarter of 2016, respectively. We completed the sale of Belleli CPE in August 2016 for cash proceeds of $5.5 million. Belleli CPE is reflected as discontinued operations in our financial statements for all periods presented (see Note 3). |
• | Due to significant negative evidence of cumulative losses in the U.S., we are no longer able to support that it is more-likely-than-not that we will have sufficient taxable income of the appropriate character in the future that will allow us to realize our U.S. deferred tax assets. As a result, we recorded a full valuation allowance against our U.S. deferred tax assets resulting in additional charges of $88.0 million, $13.6 million and $18.2 million during the second quarter of 2016, third quarter of 2016 and fourth quarter of 2016, respectively (see Note 15). |
• | During the second quarter of 2016, third quarter of 2016 and fourth quarter of 2016, we incurred costs of $7.9 million, $12.3 million and $9.9 million, respectively, associated with the restatement of our financial statements and current SEC investigation, of which $11.2 million of cash was recovered from Archrock in the fourth quarter of 2016 pursuant to the separation and distribution agreement (see Note 13). |
F-40
• | Our Spin-off from Archrock was completed on November 3, 2015. In conjunction with the Spin-off, we incurred approximately $300.0 million of indebtedness under the revolving credit facility and $245.0 million of indebtedness under the term loan facility. Pursuant to the separation and distribution agreement with Archrock and certain of our and Archrock’s respective affiliates, on November 3, 2015, we transferred cash of $532.6 million to Archrock. Prior to the Spin-off, third party debt of Archrock, other than debt attributable to capital leases, was not allocated to us as we were not the legal obligor of the debt and Archrock’s borrowings were not directly attributable to our business (see Note 10). |
24. Subsequent Events
In January 2017, we received an additional installment payment, including an annual charge, from PDVSA Gas relating to the 2012 sale of our previously nationalized assets of $19.7 million. As we have not recognized amounts payable to us by PDVSA Gas relating to the 2012 sale of our previously nationalized assets as a receivable but rather as income in the periods such payments are received, the installment payments received in January 2017 relating to our previously nationalized assets will be recognized as income from discontinued operations in the first quarter of 2017. Pursuant to the separation and distribution agreement, a notional amount corresponding to the cash we received from the PDVSA Gas installment payment was transferred to Archrock in January 2017. The transfer of cash will be recognized as a reduction to stockholders’ equity in the first quarter of 2017.
F-41
EXTERRAN CORPORATION
SCHEDULE II
VALUATION AND QUALIFYING ACCOUNTS
(In thousands)
Description | Balance at Beginning of Period | Charged to Costs and Expenses | Deductions | Balance at End of Period | |||||||||||||
Allowance for doubtful accounts deducted from accounts receivable in the balance sheets | |||||||||||||||||
December 31, 2016 | $ | 2,868 | $ | 2,972 | $ | 457 | (1) | $ | 5,383 | ||||||||
December 31, 2015 | 2,133 | 3,292 | 2,557 | (1) | 2,868 | ||||||||||||
December 31, 2014 | 7,381 | 641 | 5,889 | (1) | 2,133 | ||||||||||||
Allowance for obsolete and slow moving inventory deducted from inventories in the balance sheets | |||||||||||||||||
December 31, 2016 | $ | 14,486 | $ | 756 | $ | 2,365 | (2) | $ | 12,877 | ||||||||
December 31, 2015 | 8,660 | 15,590 | 9,764 | (2) | 14,486 | ||||||||||||
December 31, 2014 | 8,231 | 3,186 | 2,757 | (2) | 8,660 | ||||||||||||
Allowance for deferred tax assets not expected to be realized | |||||||||||||||||
December 31, 2016 | $ | 186,993 | $ | 147,558 | $ | 15,664 | (4) | $ | 318,887 | ||||||||
December 31, 2015 | 132,021 | 94,026 | (3 | ) | 39,054 | (4) | 186,993 | ||||||||||
December 31, 2014 | 120,958 | 41,820 | 30,757 | (4) | 132,021 | ||||||||||||
(1) | Uncollectible accounts written off. |
(2) | Obsolete inventory written off at cost, net of value received. |
(3) | Includes $45.0 million in allowance against foreign tax credits transferred from Archrock pursuant to the Spin-off. |
(4) | Reflects expected realization of deferred tax assets and amounts credited to other accounts for stock-based compensation excess tax benefits, expiring net operating losses, changes in tax rates and changes in currency exchange rates. |
S-1