Attached files
| file | filename |
|---|---|
| EX-99.1 - EX-99.1 - CENTURY CASINOS INC /CO/ | c147-20170310xex99_1.htm |
| 8-K - 8-K - CENTURY CASINOS INC /CO/ | c147-20170310x8k.htm |
 CENTURY CASINOSFinancial ResultsYear End 2016
Forward-Looking Statements, Business Environment and Risk FactorsThis presentation may contain “forward-looking statements” within the meaning of Section 27A of the Securities Act of 1933, as amended, Section 21E of the Securities Exchange Act of 1934, as amended (the “Exchange Act”), and the Private Securities Litigation Reform Act of 1995. In addition, Century Casinos, Inc. (together with its subsidiaries, the “Company”) may make other written and oral communications from time to time that contain such statements. Forward- looking statements include statements as to industry trends and future expectations of the Company and other matters that do not relate strictly to historical facts and are based on certain assumptions by management at the time such statements are made. Forward-looking statements in this presentation include statements regarding future results of operations, operating efficiencies, synergies and operational performance, the prospects for new projects and projects in development, including Century Mile and the Palace Hotel restoration, the anticipated timing and costs of the Century Mile and Palace Hotel projects, debt repayment, investments in joint ventures, outcomes of legal proceedings and plans for our casinos and our Company. These statements are often identified by the use of words such as “may,” “will,” “expect,” “believe,” “anticipate,” “intend,” “could,” “estimate,” or “continue,” and similar expressions or variations. These statements are based on the beliefs and assumptions of the management of the Company based on information currently available to management. Such forward-looking statements are subject to risks, uncertainties and other factors that could cause actual results to differ materially from future results expressed or implied by such forward-looking statements. Important factors that could cause actual results to differ materially from the forward-looking statements include, among others, the risks described in the section entitled “Risk Factors” under Item 1A in our Annual Report on Form 10-K for the year ended December 31, 2016. We caution the reader to carefully consider such factors. Furthermore, such forward-looking statements speak only as of the date on which such statements are made. We undertake no obligation to update any forward-looking statements to reflect events or circumstances after the date of such statements.In this presentation the term “USD” refers to US dollars, the term “CAD” refers to Canadian dollars and the term “PLN” refers to Polish zloty.Adjusted EBITDA and Adjusted EBITDA margin are non-GAAP financial measures. See Appendix A for the definition and reconciliation of Adjusted EBITDA and Adjusted EBITDA margin.The 2015 financial statements reflect adjustments to net operating revenue, earnings from operations, net earnings attributable to Century Casinos, Inc. shareholders and Adjusted EBITDA to correct erroneously recognized pari-mutuel revenue totaling $0.7 million (CAD 0.9 million).Amounts presented are rounded. As such, rounding differences could occur in period over period changes and percentages reported throughout this presentation.
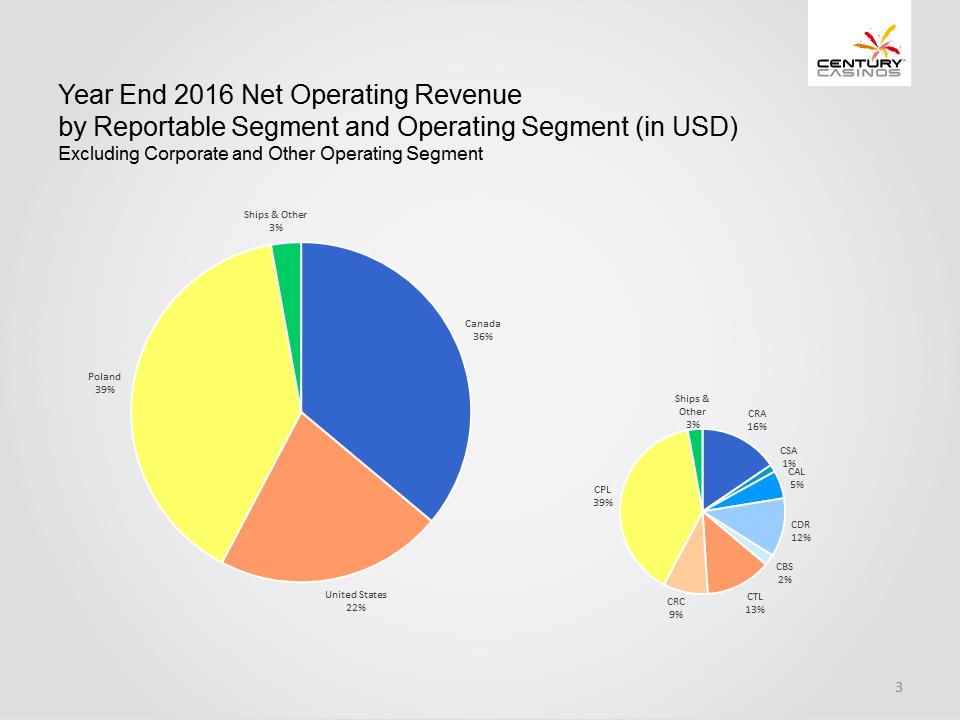
Year End 2016 Net Operating Revenue by Reportable Segment and Operating Segment (in USD)Excluding Corporate and Other Operating SegmentCanada36%United States22%Poland39%Ships & Other3%CRA16%CSA1%CAL5%CDR12%CBS2%CTL13%CRC9%CPL39%Ships & Other3%
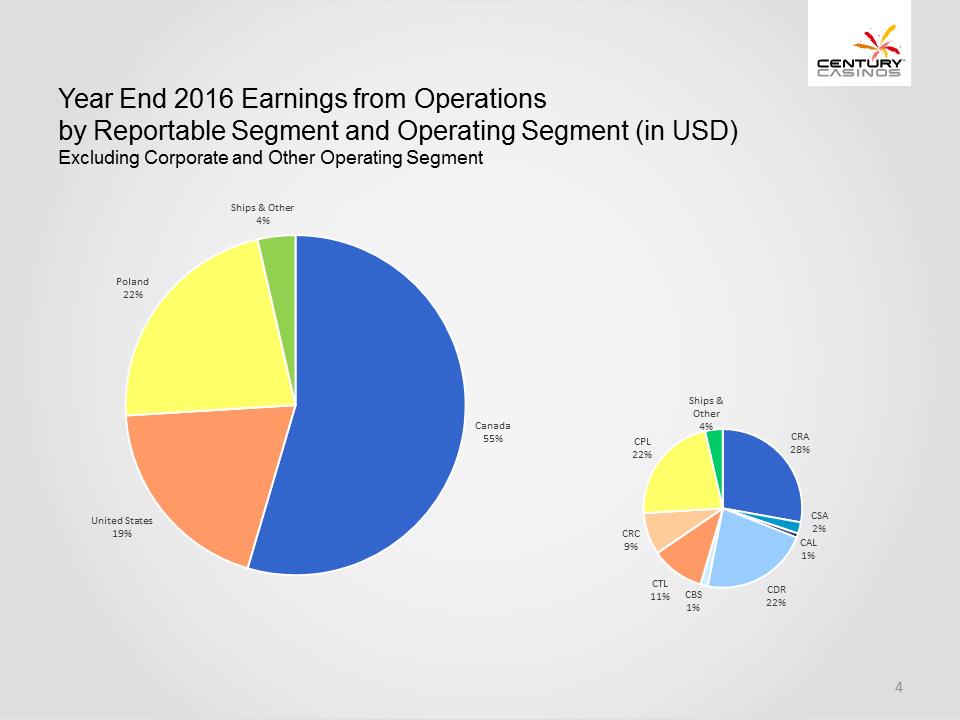
Year End 2016 Earnings from Operations by Reportable Segment and Operating Segment (in USD)Excluding Corporate and Other Operating SegmentCanada55%United States19%Poland22%Ships & Other4%CRA28%CSA2%CAL1%CDR22%CBS1%CTL11%CRC9%CPL22%Ships & Other4%
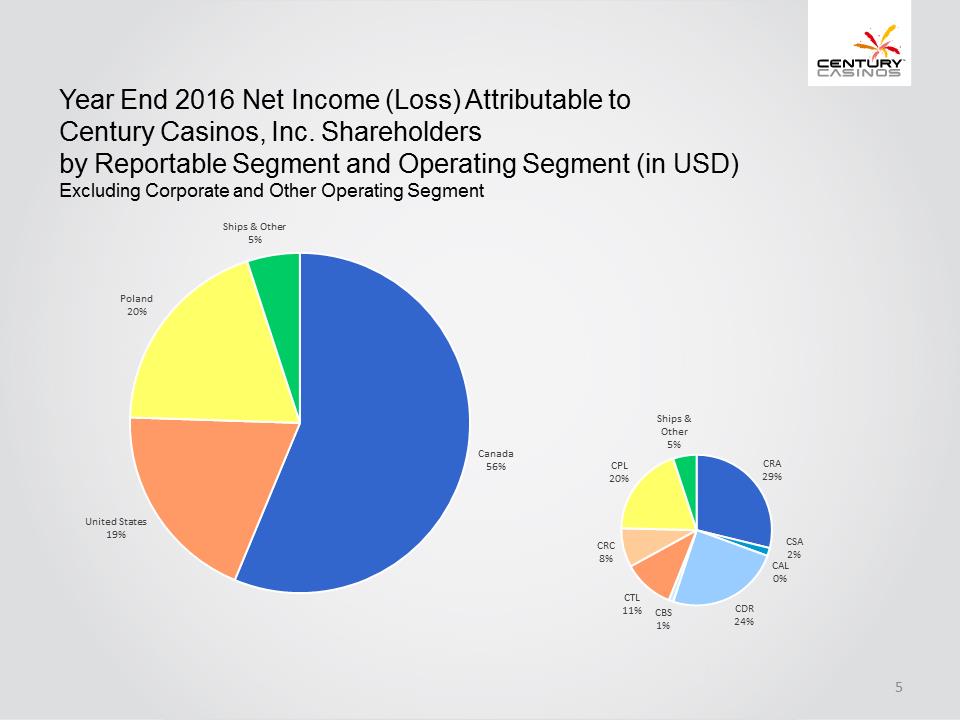
Year End 2016 Net Income (Loss) Attributable to Century Casinos, Inc. Shareholdersby Reportable Segment and Operating Segment (in USD)Excluding Corporate and Other Operating SegmentCanada56%United States19%Poland20%Ships & Other5%CRA29%CSA2%CAL0%CDR24%CBS1%CTL11%CRC8%CPL20%Ships & Other5%
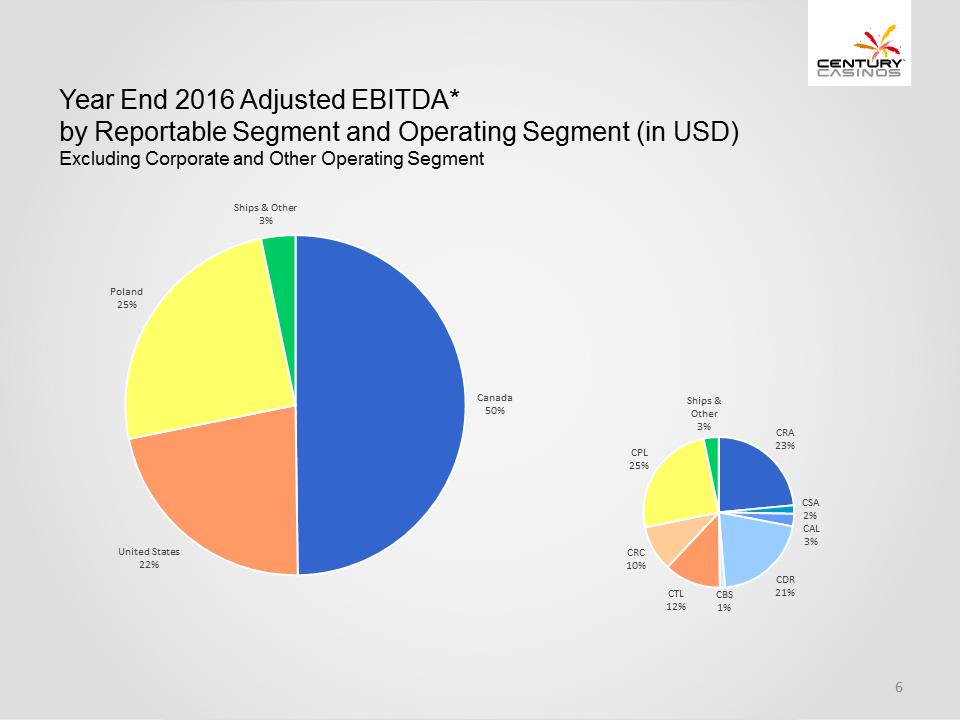
Year End 2016 Adjusted EBITDA*by Reportable Segment and Operating Segment (in USD)Excluding Corporate and Other Operating SegmentCanada50%United States22%Poland25%Ships & Other3%CRA23%CSA2%CAL3%CDR21%CBS1%CTL12%CRC10%CPL25%Ships & Other3%
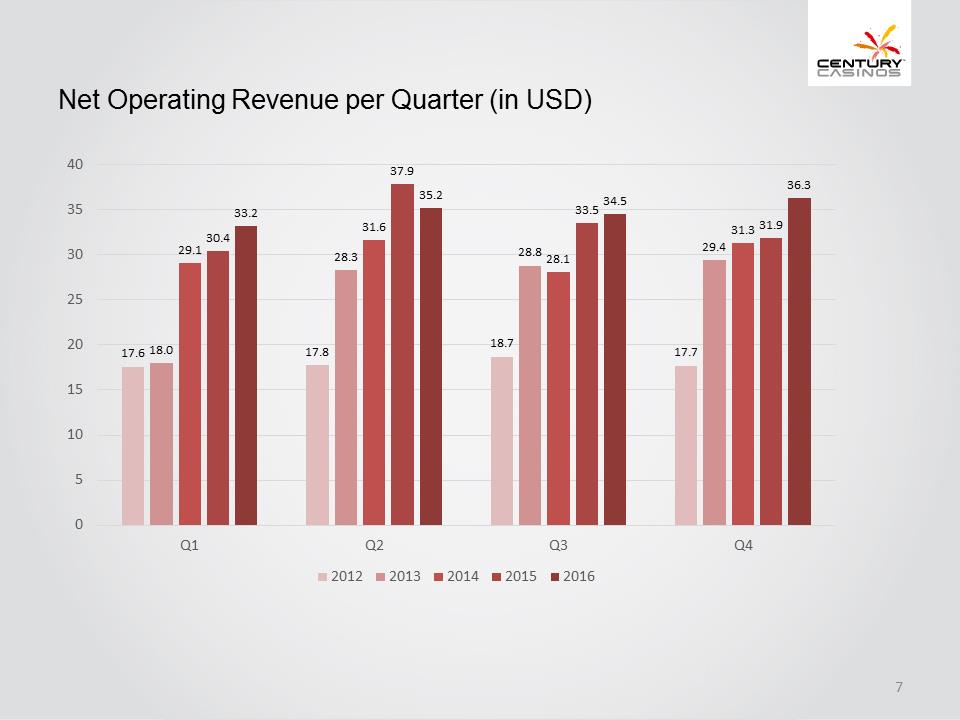
Net Operating Revenue per Quarter(in USD)17.617.818.717.718.028.328.829.429.131.628.131.330.437.933.531.933.235.234.536.30510152025303540Q1Q2Q3Q420122013201420152016
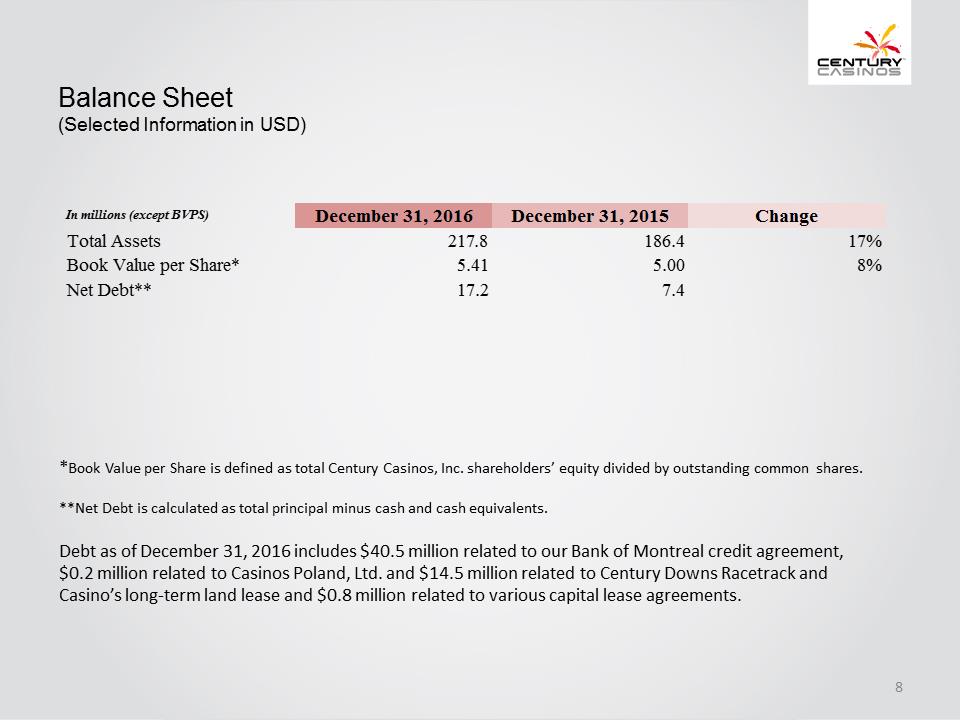
Balance Sheet(Selected Information in USD)*Book Value per Share is defined as total Century Casinos, Inc. shareholders’ equity divided by outstanding common shares.**Net Debt is calculated as total principal minus cash and cash equivalents. Debt as of December 31, 2016 includes $40.5 million related to our Bank of Montreal credit agreement, $0.2 million related to Casinos Poland, Ltd. and $14.5 million related to Century Downs Racetrack and Casino’s long-term land lease and $0.8 million related to various capital lease agreements.
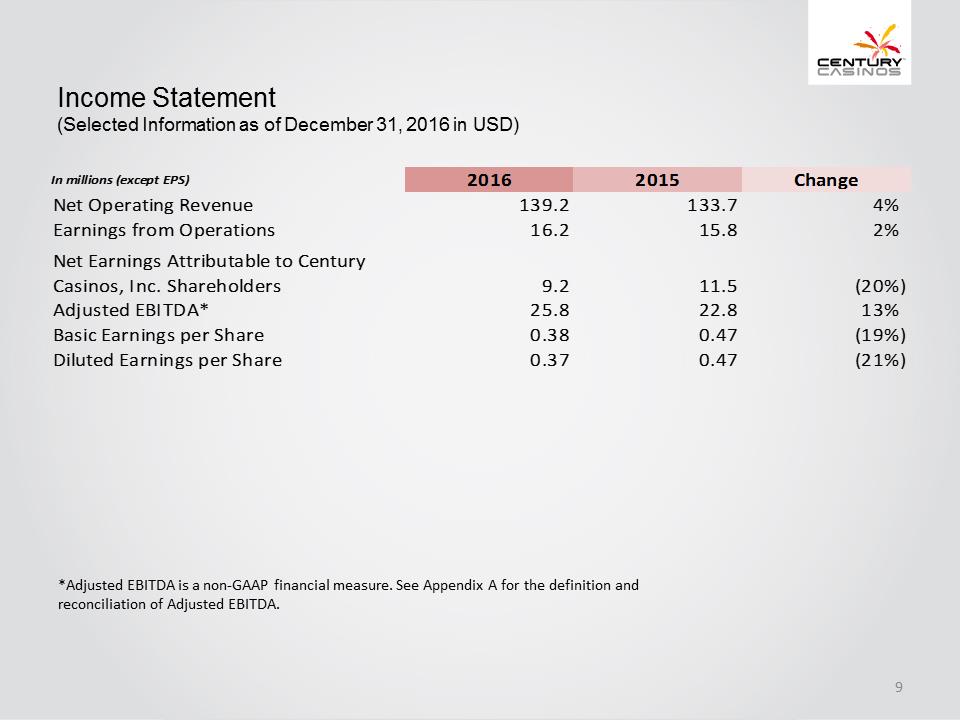
Income Statement(Selected Information as of December 31, 2016 in USD)*Adjusted EBITDA is a non-GAAP financial measure. See Appendix A for the definition and reconciliation of Adjusted EBITDA.
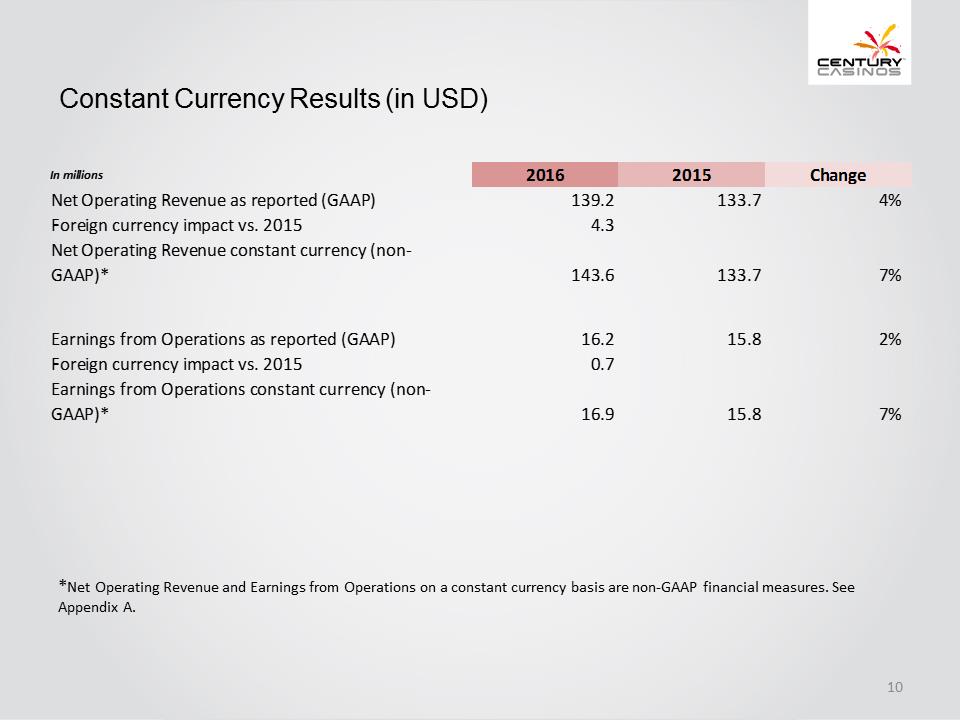
Constant Currency Results (in USD)*Net Operating Revenue and Earnings from Operations on a constant currency basis are non-GAAP financial measures. See Appendix A.
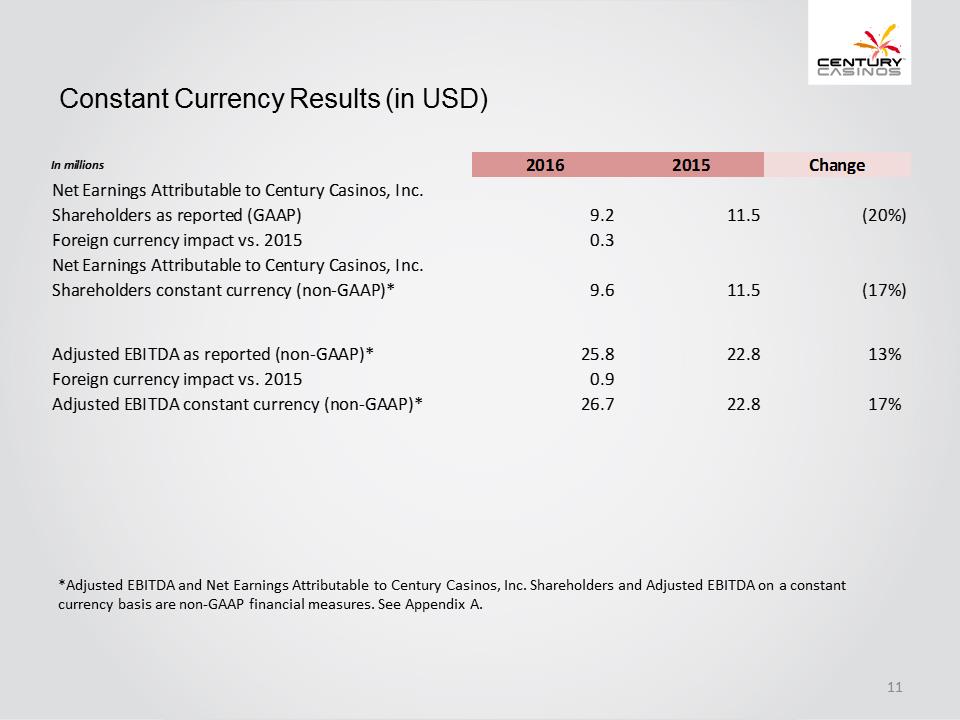
Constant Currency Results (in USD)*Adjusted EBITDA and Net Earnings Attributable to Century Casinos, Inc. Shareholders and Adjusted EBITDA on a constant currency basis are non-GAAP financial measures. See Appendix A.
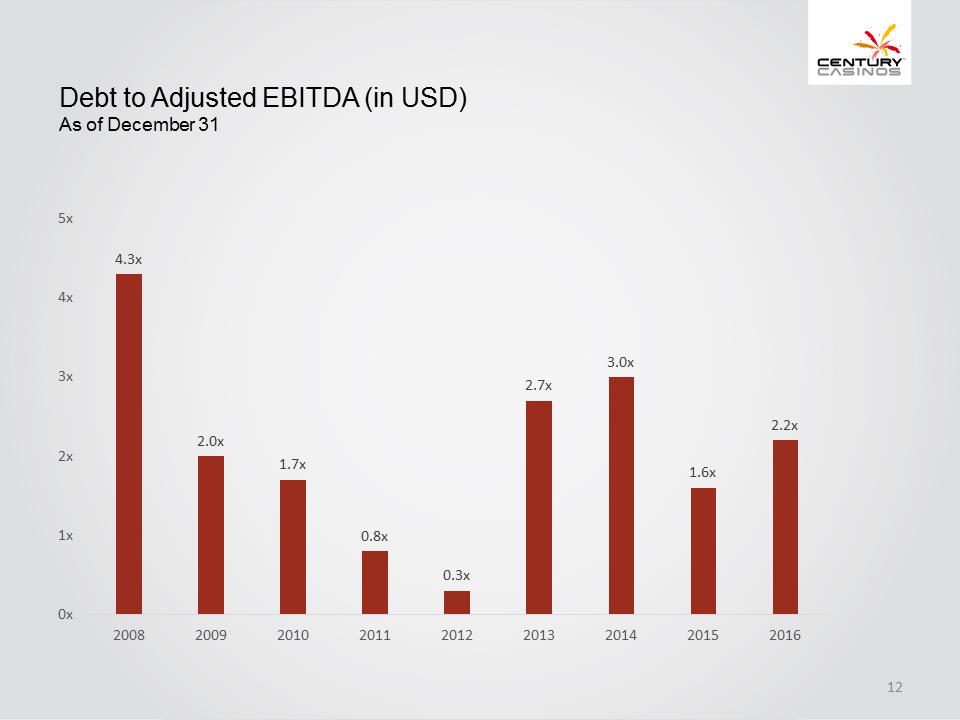
Debt to Adjusted EBITDA (in USD)As of December 314.3x2.0x1.7x0.8x0.3x2.7x3.0x1.6x2.2x0x1x2x3x4x5x200820092010201120122013201420152016
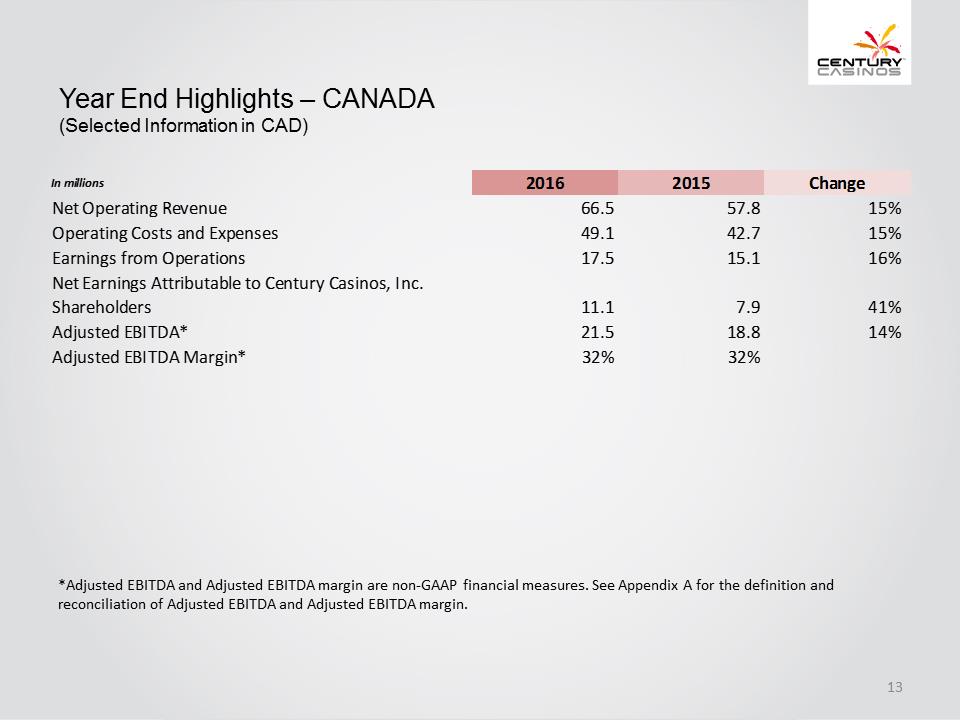
Year End Highlights –CANADA(Selected Information in CAD)*Adjusted EBITDA and Adjusted EBITDA margin are non-GAAP financial measures. See Appendix A for the definition and reconciliation of Adjusted EBITDA and Adjusted EBITDA margin.
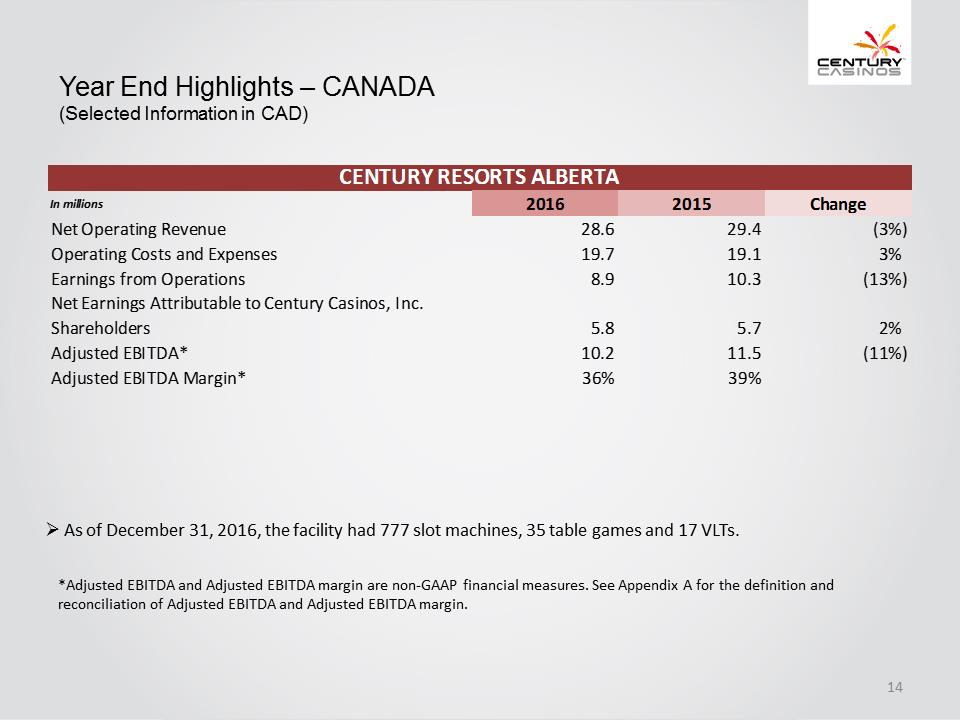
Year End Highlights –CANADA(Selected Information in CAD)*Adjusted EBITDA and Adjusted EBITDA margin are non-GAAP financial measures. See Appendix A for the definition and reconciliation of Adjusted EBITDA and Adjusted EBITDA margin..As of December 31, 2016, the facility had 777 slot machines, 35 table games and 17 VLTs.
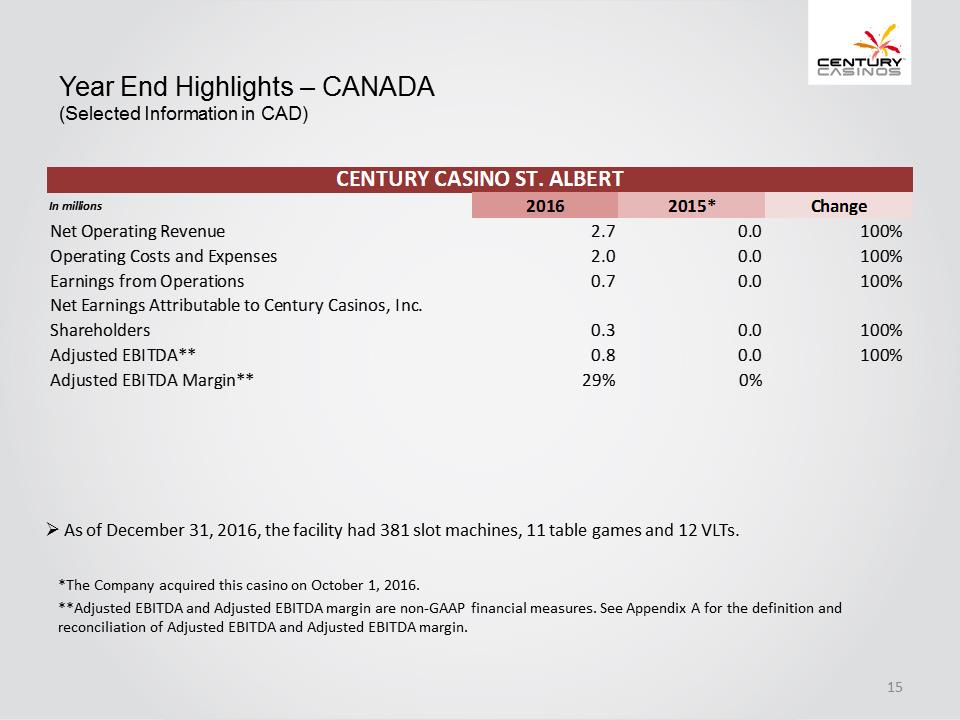
Year End Highlights –CANADA(Selected Information in CAD)*The Company acquired this casino on October 1, 2016.**Adjusted EBITDA and Adjusted EBITDA margin are non-GAAP financial measures. See Appendix A for the definition and reconciliation of Adjusted EBITDA and Adjusted EBITDA margin..As of December 31, 2016, the facility had 381 slot machines, 11 table games and 12 VLTs.
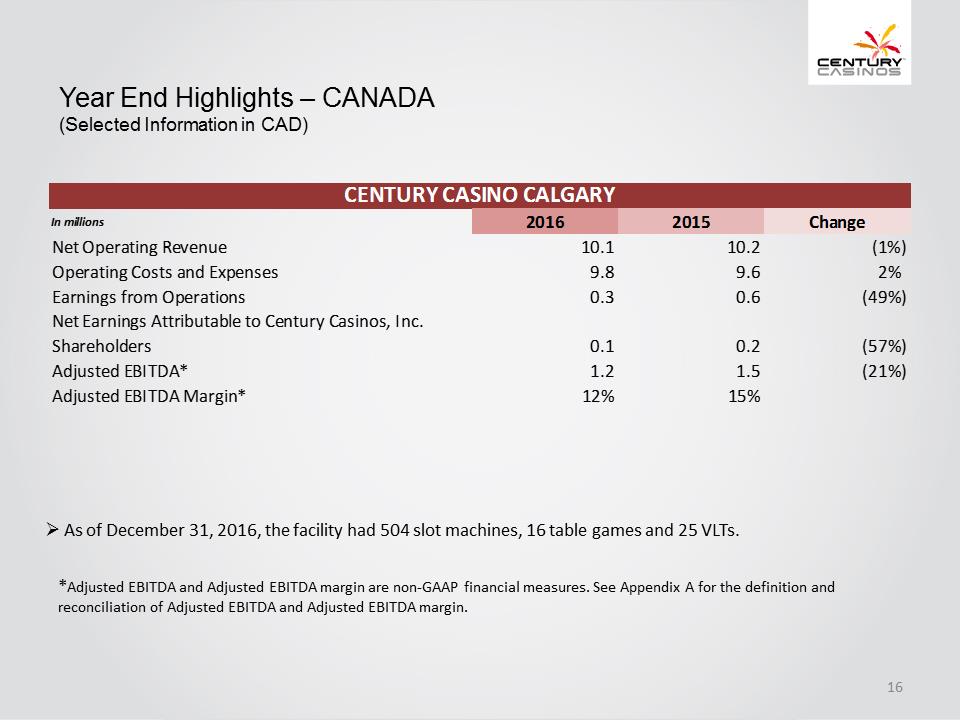
Year End Highlights –CANADA(Selected Information in CAD)*Adjusted EBITDA and Adjusted EBITDA margin are non-GAAP financial measures. See Appendix A for the definition and reconciliation of Adjusted EBITDA and Adjusted EBITDA margin..As of December 31, 2016, the facility had 504 slot machines, 16 table games and 25 VLTs.
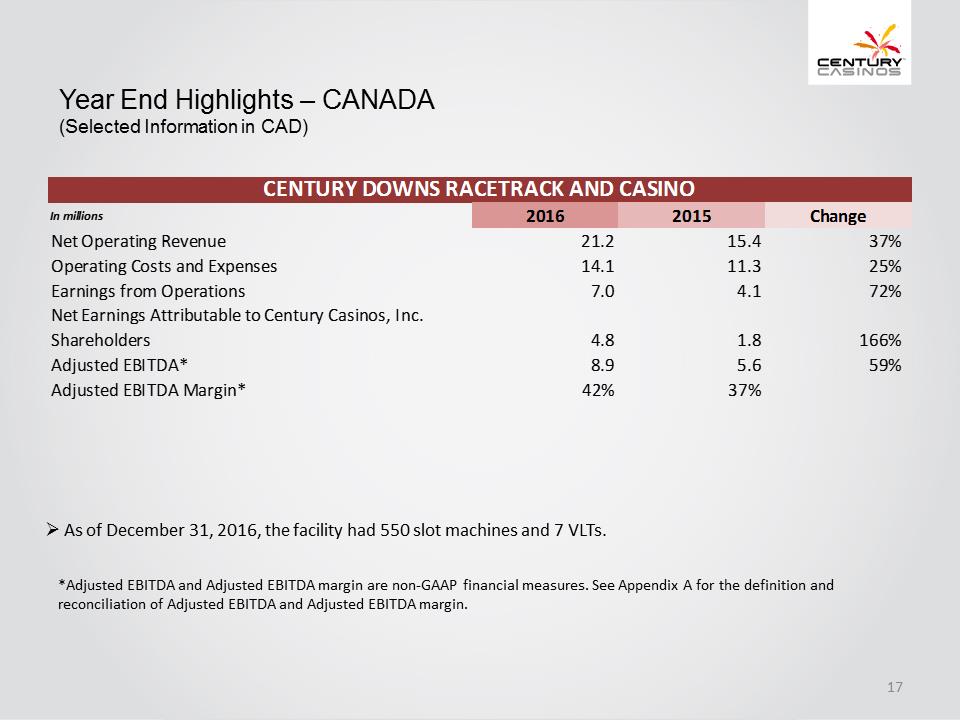
Year End Highlights –CANADA(Selected Information in CAD)*Adjusted EBITDA and Adjusted EBITDA margin are non-GAAP financial measures. See Appendix A for the definition and reconciliation of Adjusted EBITDA and Adjusted EBITDA margin..As of December 31, 2016, the facility had 550 slot machines and 7 VLTs.
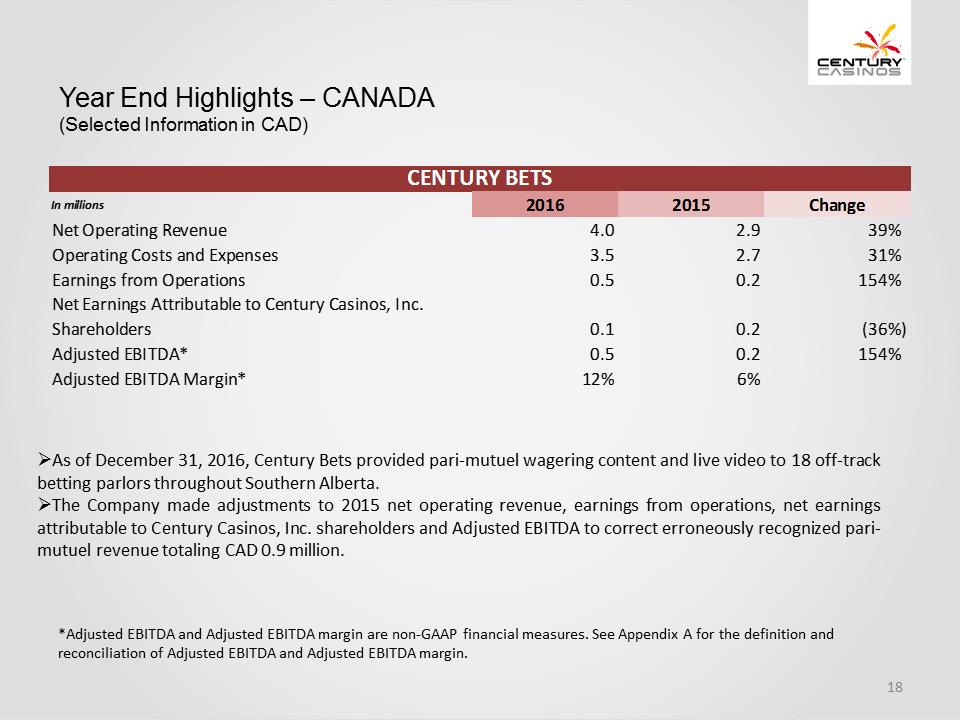
Year End Highlights –CANADA(Selected Information in CAD)*Adjusted EBITDA and Adjusted EBITDA margin are non-GAAP financial measures. See Appendix A for the definition and reconciliation of Adjusted EBITDA and Adjusted EBITDA margin..As of December 31, 2016, Century Bets provided pari-mutuel wagering content and live video to 18 off-track betting parlors throughout Southern Alberta..The Company made adjustments to 2015 net operating revenue, earnings from operations, net earnings attributable to Century Casinos, Inc. shareholders and Adjusted EBITDA to correct erroneously recognized pari-mutuel revenue totaling CAD 0.9 million.
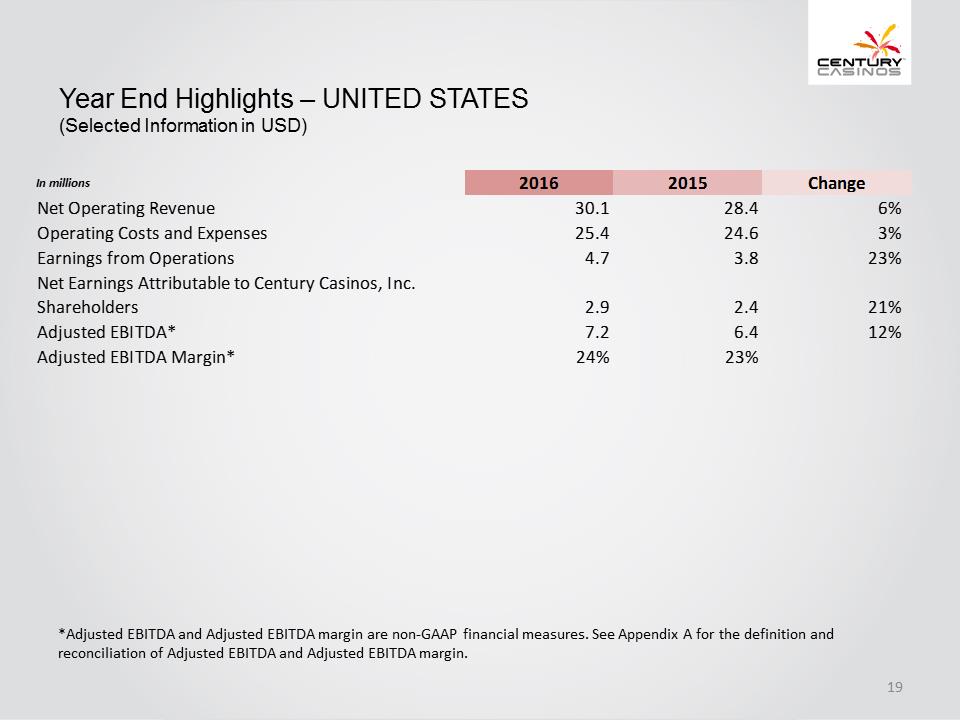
Year End Highlights –UNITED STATES(Selected Information in USD)*Adjusted EBITDA and Adjusted EBITDA margin are non-GAAP financial measures. See Appendix A for the definition and reconciliation of Adjusted EBITDA and Adjusted EBITDA margin.
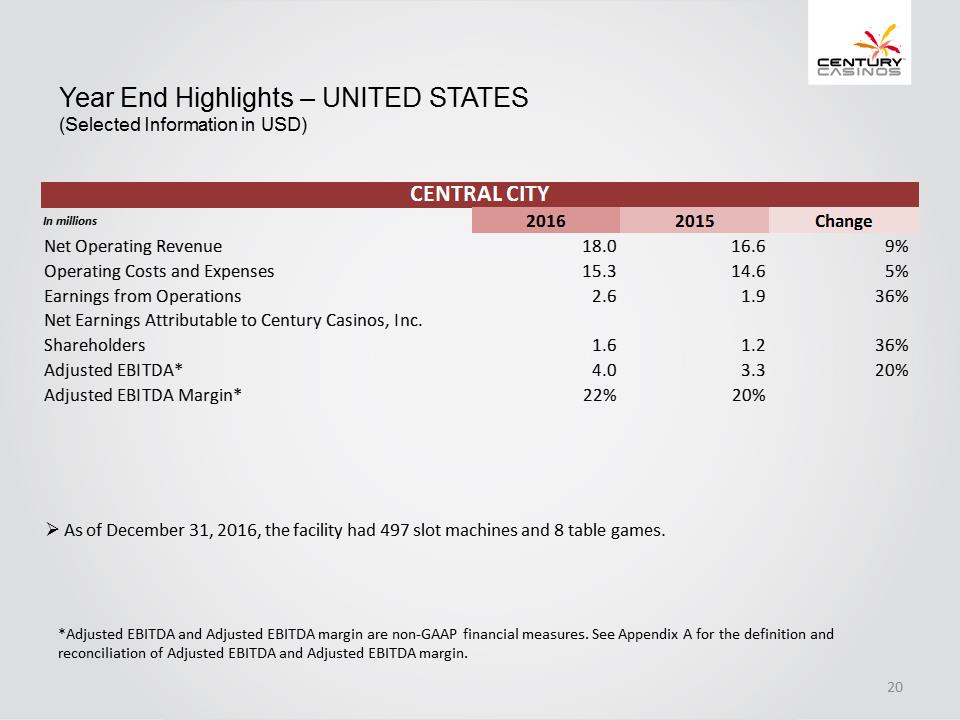
Year End Highlights –UNITED STATES(Selected Information in USD)*Adjusted EBITDA and Adjusted EBITDA margin are non-GAAP financial measures. See Appendix A for the definition and reconciliation of Adjusted EBITDA and Adjusted EBITDA margin..As of December 31, 2016, the facility had 497 slot machines and 8 table games.

Year End Highlights –UNITED STATES(Selected Information in USD)*Adjusted EBITDA and Adjusted EBITDA margin are non-GAAP financial measures. See Appendix A for the definition and reconciliation of Adjusted EBITDA and Adjusted EBITDA margin..As of December 31, 2016, the facility had 446 slot machines and 6 table games.
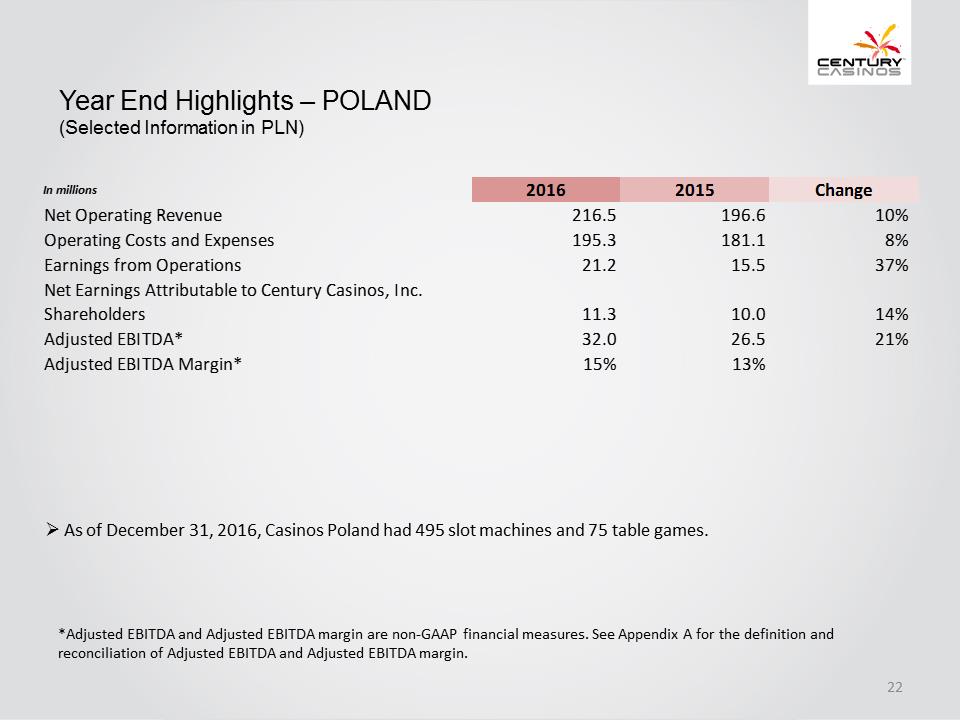
Year End Highlights –POLAND(Selected Information in PLN)*Adjusted EBITDA and Adjusted EBITDA margin are non-GAAP financial measures. See Appendix A for the definition and reconciliation of Adjusted EBITDA and Adjusted EBITDA margin..As of December 31, 2016, Casinos Poland had 495 slot machines and 75 table games.
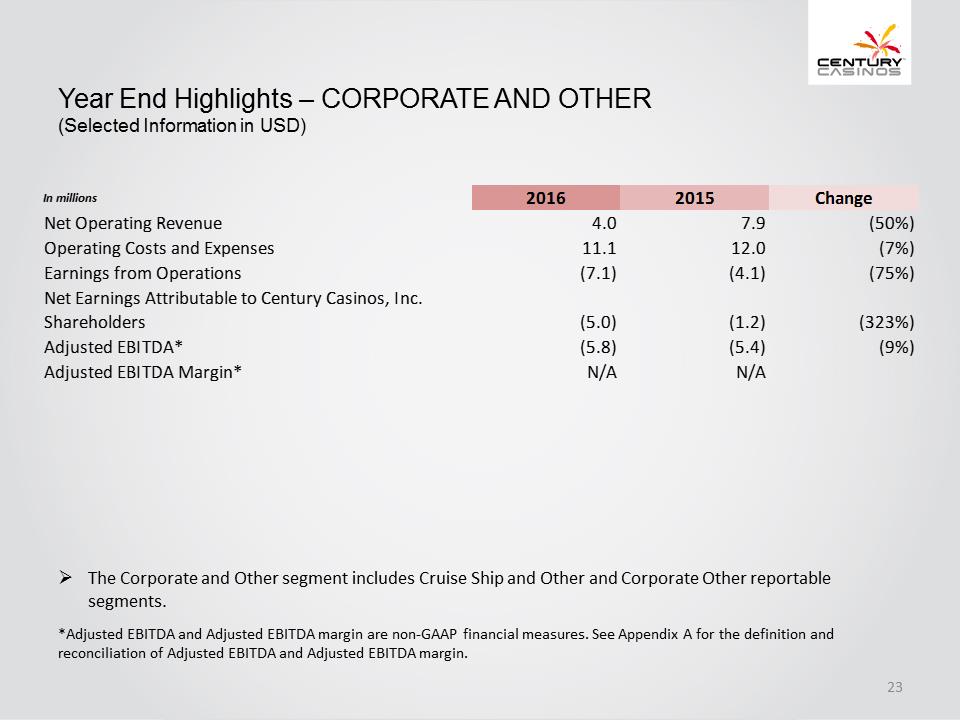
Year End Highlights –CORPORATE AND OTHER(Selected Information in USD)*Adjusted EBITDA and Adjusted EBITDA margin are non-GAAP financial measures. See Appendix A for the definition and reconciliation of Adjusted EBITDA and Adjusted EBITDA margin..The Corporate and Other segment includes Cruise Ship and Other and Corporate Other reportable segments.
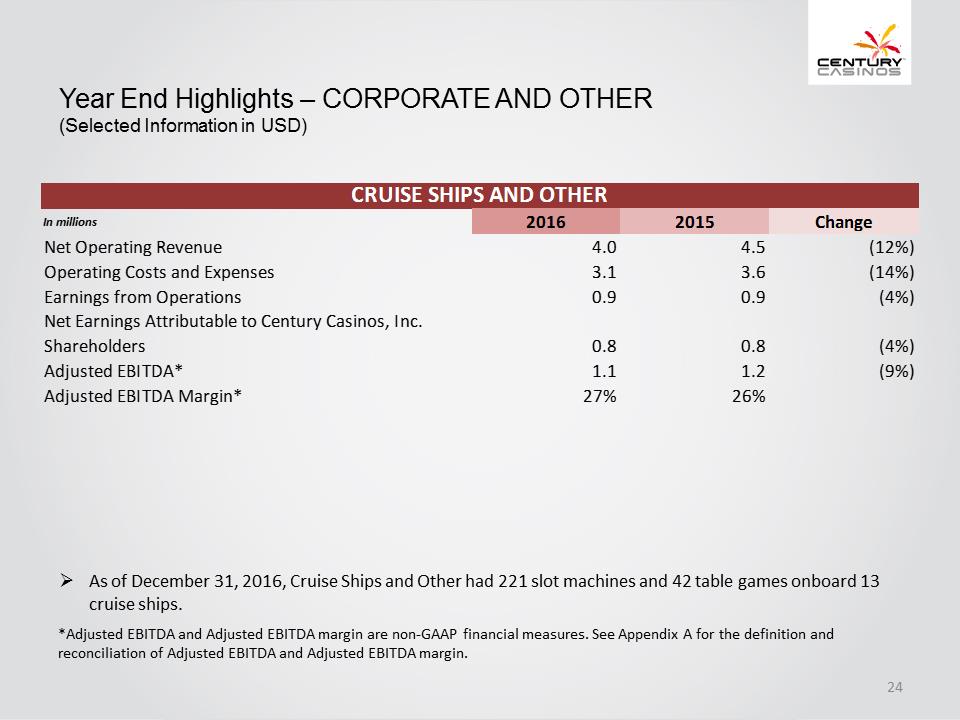
Year End Highlights –CORPORATE AND OTHER(Selected Information in USD)*Adjusted EBITDA and Adjusted EBITDA margin are non-GAAP financial measures. See Appendix A for the definition and reconciliation of Adjusted EBITDA and Adjusted EBITDA margin..As of December 31, 2016, Cruise Ships and Other had 221 slot machines and 42 table games onboard 13 cruise ships.
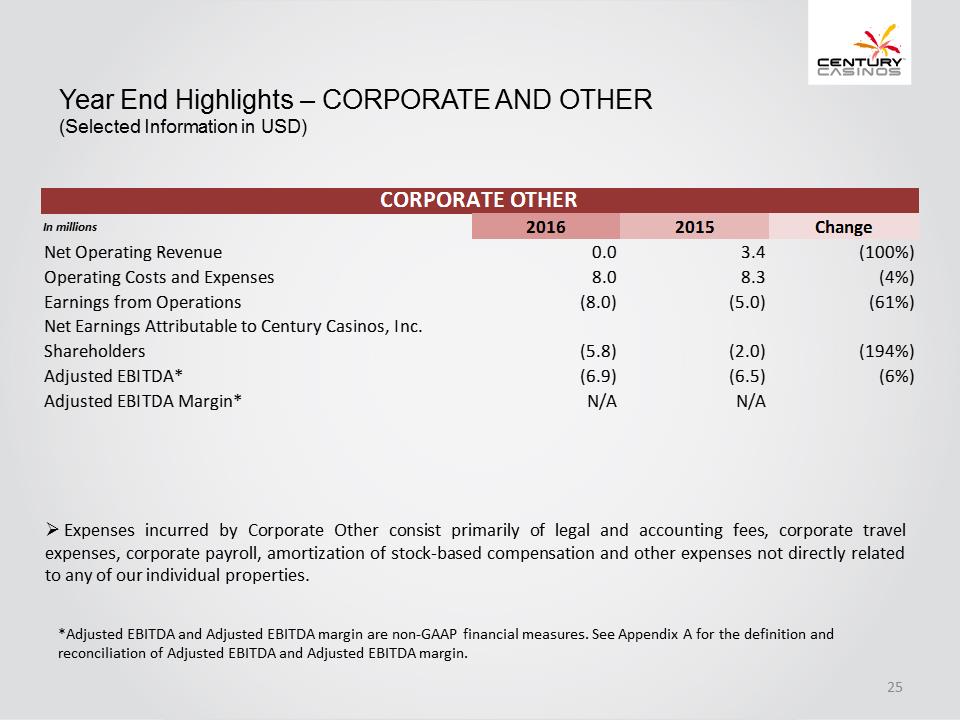
Year End Highlights –CORPORATE AND OTHER(Selected Information in USD)*Adjusted EBITDA and Adjusted EBITDA margin are non-GAAP financial measures. See Appendix A for the definition and reconciliation of Adjusted EBITDA and Adjusted EBITDA margin..Expenses incurred by Corporate Other consist primarily of legal and accounting fees, corporate travel expenses, corporate payroll, amortization of stock-based compensation and other expenses not directly related to any of our individual properties.
Year End Highlights –ADDITIONAL PROJECTS UNDER DEVELOPMENT Century Mile In September 2016, the Company was selected as the successful applicant by Horse Racing Alberta to own, build and operate a horse racing facility in the Edmonton market area, which the Company will operate as Century Mile. Century Mile will be a one-mile horse racetrack and multi-level racing and entertainment center. The proposed location is on Edmonton International Airport land and close to the city of Leduc, south of Edmonton and positioned off Queen Elizabeth II highway. The Company estimates that the project will cost approximately CAD 50.0 million and construction will take approximately 15 months to complete. Commencement and construction of the Century Mile project is subject to, among other things, our obtaining financing and the receipt of further regulatory and governmental approvals, including but not limited to approval by Alberta Gaming and Liquor Commission.Palace Hotel The Company is working to obtain financing to convert and expand the historic Palace Hotel in Cripple Creek, Colorado. The restoration will include adding 32 hotel rooms, an atrium, a coffee shop and a fitness room to the property. The Company estimates that the project will cost approximately $6.5 million and be completed in early 2018.
Appendix A –NON-GAAP FINANCIAL MEASURESThe Company supplements its condensed consolidated financial statements prepared in accordance with U.S. generally accepted accounting principles (“US GAAP”) by using the following non-GAAP financial measures, which management believes are useful in properly understanding the Company’s short-term and long-term financial trends. Management uses these non-GAAP financial measures to forecast and evaluate the operational performance of the Company as well as to compare results of current periods to prior periods on a consolidated basis.Adjusted EBITDAAdjusted EBITDA marginConstant currency resultsNet DebtManagement believes presenting the non-GAAP financial measures used in this presentation provides investors greater transparency to the information used by management for financial and operational decision-making and allows investors to see the Company’s results “through the eyes” of management. Management also believes providing this information better enables our investors to understand the Company’s operating performance and evaluate the methodology used by management to evaluate and measure such performance.The adjustments made to U.S. GAAP financial measures result from facts and circumstances that vary in frequency and impact on the Company’s results of operations. The following is an explanation of each of the adjustments that management excludes in calculating its non-GAAP financial measures.
Appendix A –NON-GAAP FINANCIAL MEASURESThe Company defines Adjusted EBITDA as net earnings (loss) attributable to Century Casinos, Inc. shareholders before interest expense (income), net, income taxes (benefit), depreciation, amortization, non-controlling interest (earnings) losses and transactions, pre-opening expenses, acquisition costs, non-cash stock-based compensation charges, asset impairment costs, (gain) loss on disposition of fixed assets, discontinued operations, (gain) loss on foreign currency transactions and other, gain on business combination and certain other one-time items. Intercompany transactions consisting primarily of management and royalty fees and interest, along with their related tax effects, are excluded from the presentation of net earnings (loss) and Adjusted EBITDA reported for each segment and property. Not all of the aforementioned items occur in each reporting period, but have been included in the definition based on historical activity. These adjustments have no effect on the consolidated results as reported under US GAAP. Adjusted EBITDA is not considered a measure of performance recognized under US GAAP. Management believes that Adjusted EBITDA is a valuable measure of the relative performance of the Company and its properties. The gaming industry commonly uses Adjusted EBITDA as a method of arriving at the economic value of a casino operation. Management uses Adjusted EBITDA to compare the relative operating performance of separate operating units by eliminating the above mentioned items associated with the varying levels of capital expenditures for infrastructure required to generate revenue, and the often high cost of acquiring existing operations. Adjusted EBITDA is used by the Company’s lending institution to gauge operating performance. The Company’s computation of Adjusted EBITDA may be different from, and therefore may not be comparable to, similar measures used by other companies within the gaming industry. Please see the reconciliation of Adjusted EBITDA to net earnings (loss) attributable to Century Casinos, Inc. shareholders below.The Company defines Adjusted EBITDA margin as Adjusted EBITDA divided by net operating revenue. Management uses this margin as one of several measures to evaluate the efficiency of the Company’s casino operations.
Appendix A –NON-GAAP FINANCIAL MEASURESThe impact of foreign exchange rates is highly variable and difficult to predict. The Company uses a Constant Currency basis to show the impact from foreign exchange rates on current period revenue compared to prior period revenue using the prior period’s foreign exchange rates. In order to properly understand the underlying business trends and performance of the Company’s ongoing operations, management believes that investors may find it useful to consider the impact of excluding changes in foreign exchange rates from the Company’s net operating revenue, net earnings (loss) attributable to Century Casinos, Inc. Shareholders and Adjusted EBITDA.The Company defines Net Debt as total long-term debt (including current portion) plus deferred financing costs minus cash and cash equivalents. Net Debt is not considered a liquidity measure recognized under US GAAP. Management believes that Net Debt is a valuable measure of our overall financial situation. Net Debt provides investors with an indication of our ability to pay off all of our long-term debt if it became due simultaneously.
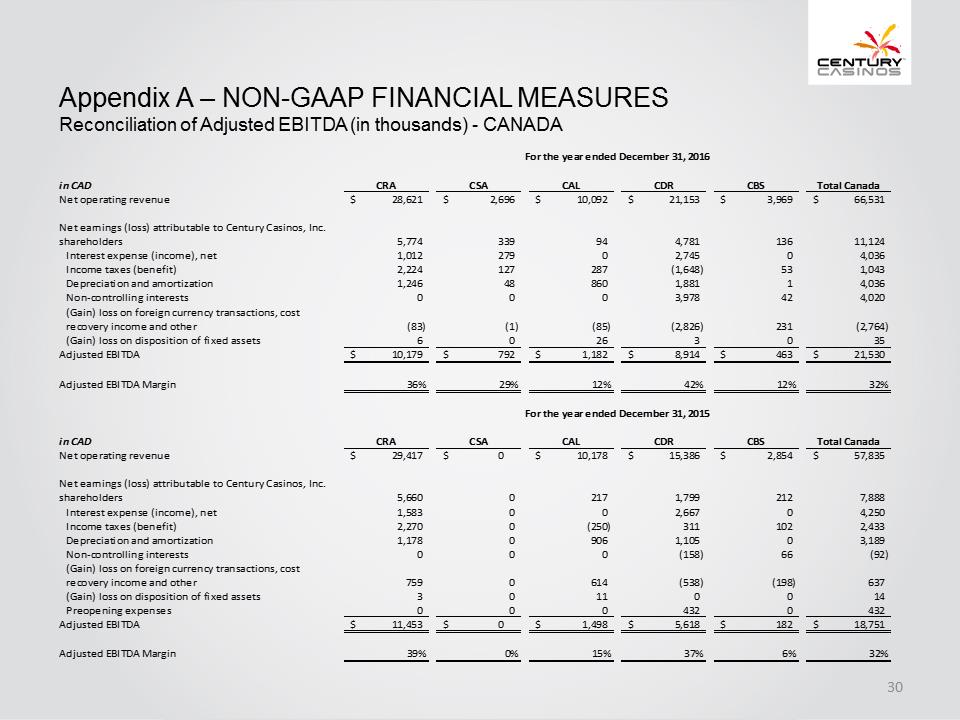
Appendix A –NON-GAAP FINANCIAL MEASURESReconciliation of Adjusted EBITDA (in thousands) -CANADA
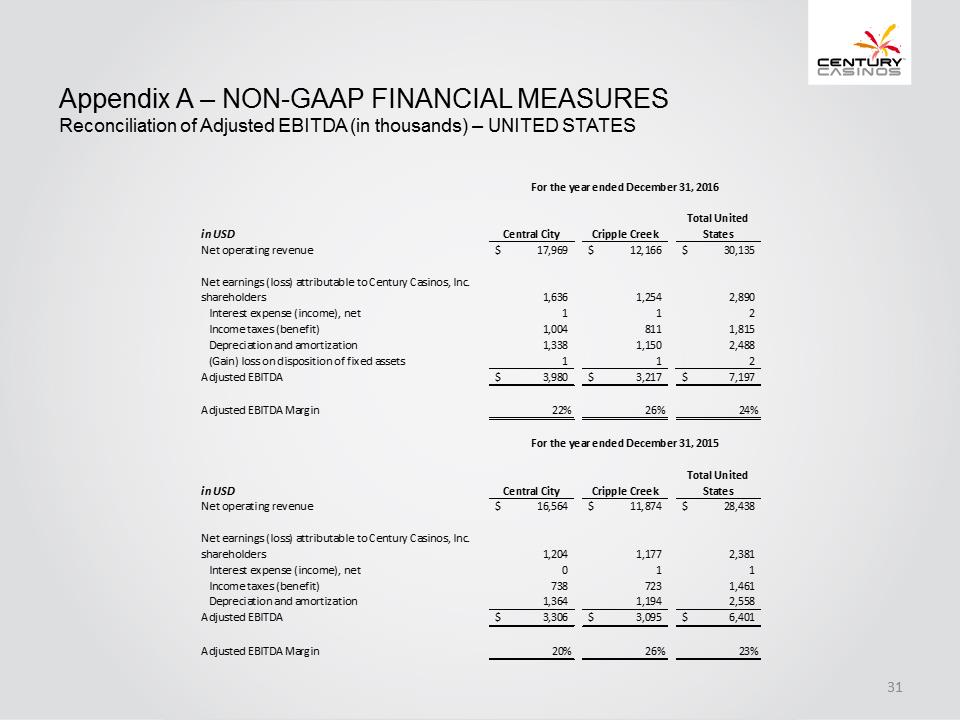
Appendix A –NON-GAAP FINANCIAL MEASURESReconciliation of Adjusted EBITDA (in thousands) –UNITED STATES
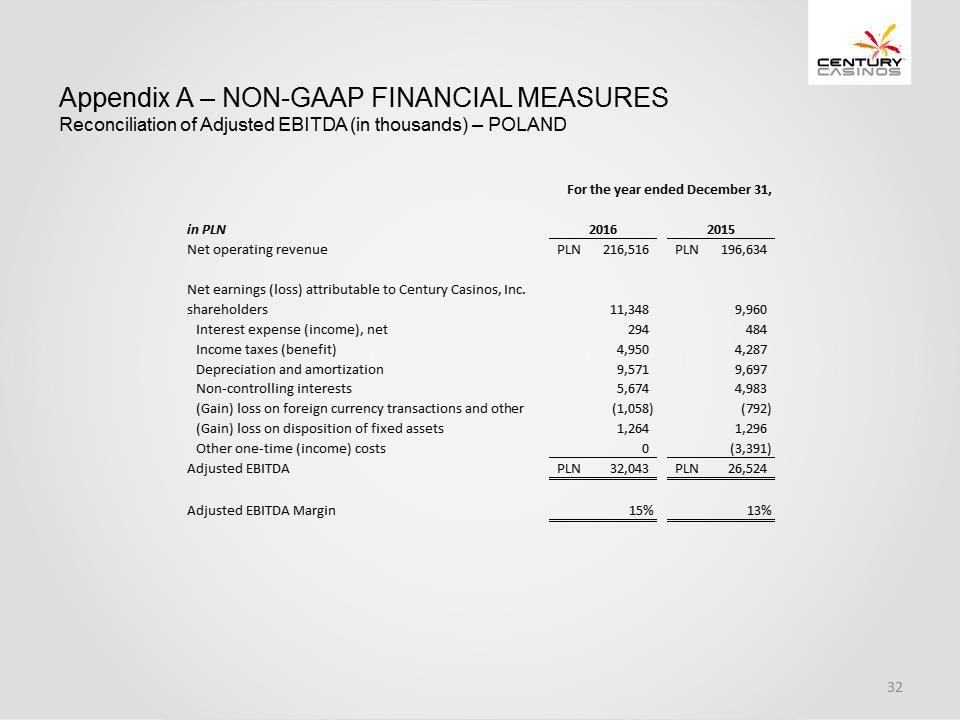
Appendix A –NON-GAAP FINANCIAL MEASURESReconciliation of Adjusted EBITDA (in thousands) –POLAND
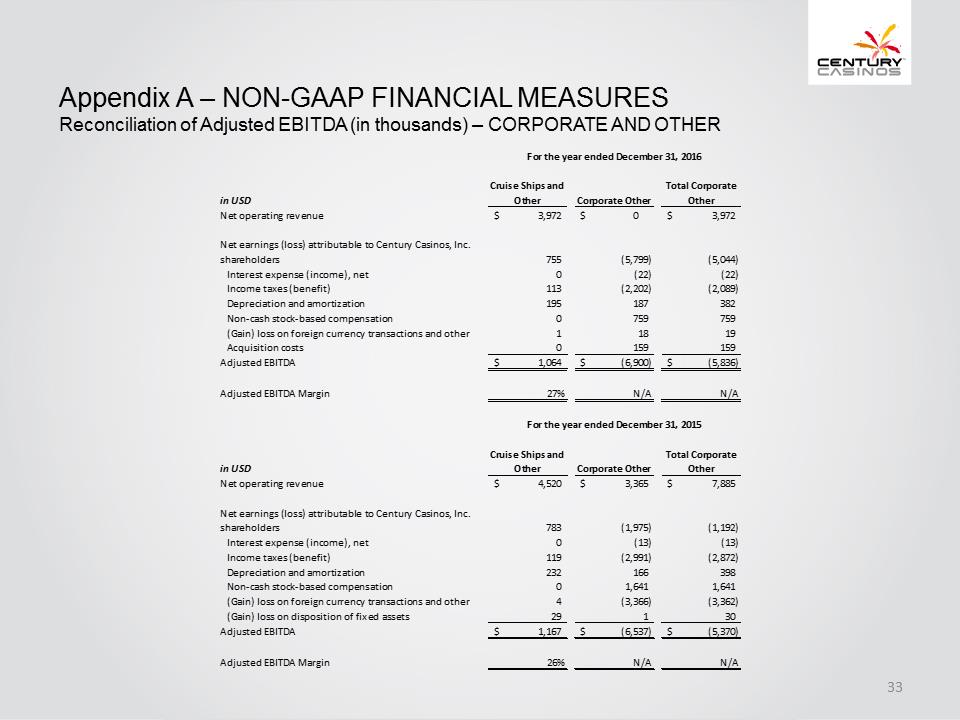
Appendix A –NON-GAAP FINANCIAL MEASURESReconciliation of Adjusted EBITDA (in thousands) –CORPORATE AND OTHER
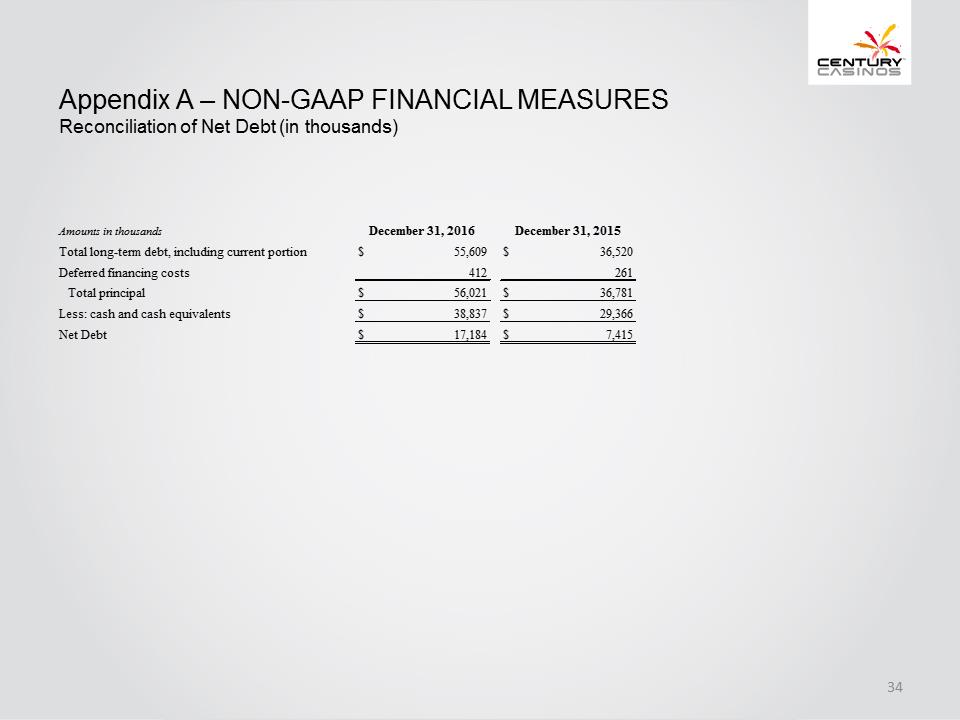
Appendix A –NON-GAAP FINANCIAL MEASURESReconciliation of Net Debt (in thousands)